Annual Report 2014 - Nordea
220
Annual Report 2014
-
Upload
khangminh22 -
Category
Documents
-
view
0 -
download
0
Transcript of Annual Report 2014 - Nordea

Annual Report 2014

In 2014 Nordea not only delivered robust results, but also took the
next steps in the transformation to meet our customers’ changing behaviour and the new regulatory requirements. CEO letter page 8’’

Contents
This Annual Report contains forward-looking statements that reflect management’s current views with respect to certain future events and potential financial performance. Although Nordea believes that the expectations reflected in such forward-looking statements are reasonable, no assurance can be given that such expectations will prove to have been correct. Accordingly, results could differ materially from those set out in the forward-looking statements as a result of various factors. Important factors that may cause such a difference for Nordea include, but are not limited to: (i) the mac-roeconomic development, (ii) change in the competitive climate, (iii) change in the regulatory environment and other government actions and (iv) change in interest rate level and foreign exchange rate levels. This report does not imply that Nordea has undertaken to revise these forward-looking statements, beyond what is required by applicable law or applicable stock exchange regulations if and when circumstances arise that will lead to changes compared to the date when these statements were provided.
The Nordea BusinessPosition and strengths 2
CEO letter 8
Strategy – the future relationship bank developing 10The Nordea share and shareholders 13Great people create great customer experience 16CSR performance counts 17
Business Areas 18
Board of Directors’ report Financial Review 2014 28Business area results 32Risk, Liquidity and Capital management 35Corporate Governance Report 48Remuneration 55Proposed distribution of earnings 59
Financial statementsFinancial statements Nordea Group 60Notes to Group financial statements 72Financial statements Parent company 163Notes to Parent company financial statements 172Signing of the Annual Report 209Auditor’s report 210
OrganisationLegal structure 211Board of Directors 212Group Executive Management 214Group Organisation 215Ratings 215Annual General Meeting 216Financial calendar 216
Lennart Jacobsen, Head of Retail Banking
Largest and most diversified retail bank in the NordicsRetail Banking “ Based upon our customers’ needs and preferences we aim to advise, serve and sell in every customer touch point.”
page 19
Casper von Koskull, Head of Wholesale Banking
Leading wholesale bank in the NordicsWholesale Banking “ We are teaming up for success.” page 22
Gunn Wærsted, Head of Wealth Management
Largest private bank, asset manager and life and pensions providerWealth Management “ The vision is to be acknowledged as the leading Wealth Manager in all Nordic markets with global reach and global capabilities” page 25

Nordea Annual Report 20142
Position and strengths
Leading platform
Key facts Leading financial services platform in the Nordic region Largest total operating income, EUR 9.8bn in 2014 Market share leader across the region in both retail and corporate markets ~29,400 employees (FTEs) Superior customer franchise
~10 million personal customers of which 3.3m Gold, Premium and Private Banking
customers ~ 590,000 corporate and institutional customers
Strong distribution power ~700 branch locations
strong multichannel offerings
Global capabilities on par with international peers
Capital Markets
#1
Life &Pensions
#1
Asset Management
#1
Private Banking
#1
Superior customer franchise
10.2
4.2
229
176
0.9 #2
2.9
1.8
#2-3
#1-2
#1
87
51
#2
#1-2
#1-2
#2
590#1 #1
Household customers
No. of relation-ships (mill)
Corporates &Institutions
No. of relationships (th)
Household customers
Market position
Corporates &Institutions
Market position
In total:
Norway
Denmark
Sweden
Finland
Nordea has the leading Nordic platform and a unique position in the Nordics

Nordea Annual Report 2014 3
2007 2008 2009 2010 2011 2012 2013 2014
Position and strengths
Income statement and balance sheet items (continuing operations),excluding non-recurring items in 2014*Income, profit and business volumes, key items 2014 2013Net interest income, EURm 5,482 5,525Net fee and commission income, EURm 2,842 2,642Net result on items at fair value, EURm 1,425 1,539Equity method and other income, EURm 97 185
Total operating income, EURm 9,847 9,891Total operating expenses, EURm –4,832 –5,040Profit before loan losses, EURm 5,015 4,851Net loan losses, EURm –534 –735Operating profit, EURm 4,481 4,116Net profit for the year**, EURm 3,371 3,107
Loans to the public, EURbn 348.1 342.5Deposits from the public, EURbn 197.3 200.7Assets under management, EURbn 262.2 232.1Total assets, EURbn 669.3 630.4Return on equity (ROE), % 11.6% 11.0%Dividend (proposed 2014/actual 2013), EUR/share 0.62 0.43
Common equity tier 1 (CET1) capital ratio, excluding Basel I floor (CRDIV/Basel III)
Dividend per share, EUR (proposed for 2014)
(up from EUR 0.43 per share last year)
0.62
Nordea is the most diversified bank in the Nordics
Stable ROE over the cycle.Not a single quarter below 8%.
Every year above 10.6%.
Return on equity, ROE, development 2007-2014, %
Geographic exposure, Nordea vs. Nordic peers, % Nordea, loans to the public by geography, %
18.0
21.5
19.118.1
15.8 16.215.0 14.4 13.9
12.0 11.7
8.1
11.39.5
12.2 12.8 12.0 11.5
8.5*
12.3 11.9 12.5
10.311.9 11.1 11.411.5 12.0*
10.8 11.2*10.511.8
Nordea Peer 1 Peer 2 Peer 3 Peer 4 Peer 5
28%
~60% ~60%
~70%
~80% ~85%
Largest exposure to a single geographical market
Total loans (excluding reverse repurchase agreements): EUR 304bn
Finland 22%
Sweden 28%
Denmark 27%
Norway 18%
Baltic countries 3%
Russia 2%
15.7 %(up 1.8 %-points from last year, compared to previously estimated Basel III ratio)
*) Excluding restructuring costs in the second quarter 2014 of EUR 190m, capital gain from the divestment of Nets Holding of EUR 378m and charge for impairment of intangible assets of EUR 344m in the third quarter 2014, and excluding restructuring costs in the third quarter 2011 of EUR 171m.
*) Excluding restructuring costs in 2014 of EUR 190m, non-recurring capital gain in 2014 of EUR 378m and charge for impairment of intangible assets in 2014 of EUR 344m.
**) Net profit including non-recurring items in 2014.
Loans, excluding reverse repurchase agreements

Nordea Annual Report 20144
Position and strengths
Business model
2015 plan
Digital transformation continues at a high pace Transactions, branches vs mobile, millions/quarterDigital transformation continues
at a high pace within the Retail Banking business
Transactions in Mobile Bank increased 90% during the year Number of active mobile banking users now increases with 1,000 new every day
Steady decrease of manual transac-tions, down 19% during the year
Continued development of solutions to our customers More than 1.8 million advisory meetings with customers
90,000 new Gold and Premium customers from outside the bank The number of active netbank users in the Nordic countries increased by more than 100,000 to over 4.2 million We met with 270,000 small and medium-sized corporate customers and were able to help many entrepreneurs adjust to both sluggish demand and effects of new banking regulation
Strong capital generation and increased pay-out ratio in 2014 and 2015
while maintaining a strong capital base
To reach a ROE of 13% at the required CET1 ratio*
taking prevailing low interest rates into account
Delivering low-volatility results based on a well diversified and resilient business model
Capital initiative to improve the CET1 ratio*
Initiatives for income generation
Efficiency initiatives of ~EUR 900m 5% lower cost base in local currencies 2015 vs. 2013
Low-risk profile and low volatility
Nordea market commitments Key initiatives and levers
* Nordea aims at operating with a common equity tier 1 (CET1) capital ratio of approx. 15% including a management buffer
3
17
8
Mobile
Q4/10 Q4/11 Q4/12 Q4/13 Q4/14
0Branches

Nordea Annual Report 2014 5
Position and strengths
Product capabilities within Wholesale Banking on par with international peers
Very strong FICC capabilities covering all major needs for Nordic customers Size and scale to support efficiency Leveraged into Retail Banking Competitive Investment Banking and Equities capabilities
Leading customer franchises and global product capabilities within Wealth Management
Largest Nordic life and pensions provider by gross written premiums and EUR 57bn of Assets under Management, AuM Largest Nordic private bank with EUR 84bn of AuM Largest Nordic international private bank, EUR 12bn of AuM, with presence in Luxembourg, Switzerland and Singapore Largest Nordic asset manager, EUR 174bn of AuM Global Fund Distribution – distributing through 21 of the 25 largest wealth man-agers globally 6th largest net fund sales in Europe 2014 In-house product offering supplemented by carefully selected external investment product offering Number of financial plans created was 750,000
Strong global capabilities
Best Bank for Cash Management 2015 in
the Nordic region Global Finance
Best Foreign Exchange Provider in the Nordic region
Global Finance
Best Investment Bank in the Nordic
Region Global Finance
Best Nordic Equity House
TNS SIFO Prospera
Leading league table rankings across the capital markets activities
Largest Nordic Wealth Manager
Nordea Peer 1 Peer 2 Peer 3 Peer 4
262
179
109 107
64
12% 11% 13% 9% 3%
Assets under Management (AuM) 2014, EURbn, and 3-year average growth (CAGR, local curr), %
2013 Q1/14 Q2/14 Q3/14 Q4/14 2014
7.0
3.84.8
3.2
6.8
18.6
Net flow into Assets under Management (AuM), EURbn
Nordic corporate bond benchmark, bookrunner 2014
Nordic mergers and acquisitions, 2014
EURm
0
1,000
2,000
3,000
4,000
5,000
6,000
Nordi
c pe
erNor
dic
peer
Nordi
c pe
erIn
t’l pe
erNor
dic
peer
Nordi
c pe
erNor
dic
peer
Norde
a
EURm
0
5,000
10,000
15,000
20,000
25,000
Nordi
c pe
er
Int’l
peer
Int’l
peer
Int’l
peer
Int’l
peer
Int’l
peer
Nordi
c pe
er
Norde
a
EURm
0
2,000
4,000
6,000
8,000
10,000
12,000
Nordi
c pe
erNor
dic
peer
Nordi
c pe
erIn
t’l pe
erIn
t’l pe
erIn
t’l pe
erNor
dic
peer
Norde
a
EURm
0
1,000
2,000
3,000
4,000
5,000
6,000
7,000
Int’l
peer
Int’l
peer
Int’l
peer
Nordi
c pe
erNor
dic
peer
Int’l
peer
Nordi
c pe
er
Norde
aNordic syndicated loans, bookrunner 2014
Nordic ECM market, bookrunner 2014
Leading customer franchises and global product capabilities
Customer support around the globe through major financial centres Strong international network of banks Competitive working capital management capabilities Balance sheet to support transactions Strong global shipping franchise and capabilities
SO
UR
CE: D
EA
LOG
IC
SO
UR
CE: D
EA
LOG
IC
SO
UR
CE: D
EA
LOG
IC
SO
UR
CE: D
EA
LOG
IC

Nordea Annual Report 20146
Position and strengths
Simplification
The rapid change in our customers’ preferences towards using online and mobile solutions, as well as the increasing operational regulation, is transforming our industry. To enable us to develop even more personalised and convenient services to our cus-tomers in the future we are currently simplifying all parts of the bank. We will build new core banking and pay-ment platforms and a Group common data warehouse and by that signifi-cantly increase our agility, scale bene-fit and resilience.
Digitalisation is one main driverDigitalisation is one of the main driv-ers for change in banking as well as in other industries. Customers prefer-ences and expectation on accessibility, easiness, and personalisation are key drivers in this development. We have seen the preferences rapidly increase for mobile solutions. In 2014, the mobile logons were 263 million and netbank logons were 352 million.
Business transformationThe simplification programme is a business transformation with several activities in all areas of the organisation and will consist of three main parts. The first one is initial simplification, which is about cleaning up our product portfolio and customer data. The sec-ond is to focus all our development activities towards supporting simplifi-cation, and the third area is to build up new core platforms for our operations.
Building up new banking platformsThe initial simplification that has been going on since spring 2014 is proceeding well. This part of the pro-gramme is about reducing the com-plexity in the bank and thereby mak-ing us ready for the next step – building up new banking platforms.
So far, we have closed around 37% of our account and transaction prod-ucts. Many of the products are old products which almost no customers have or products with many small variations that can be replaced by bet-ter or similar products.
We are also cleaning up our cus-
Simplification and new banking platforms to respond to drivers
Agility Scale
New banking platforms
Initial simpification activities
Resilience
Great customer experiencesEasy to deal with anytime and anywhere, a safe and trusted
partner offering personalised solutions.
Three transforming drivers for the banking industry
Balance sheet regulations
Mostly in place More to come
SIMPLIFICATION
Behaviour changing
Operational regulations
Digitalisation

Nordea Annual Report 2014 7
Position and strengths
tomer data, removing inactive or wrong customer data from our sys-tems, and this work continues until summer 2015.
These activities will prepare us for building the new banking platforms. The current local IT systems will be converted to the new platforms ena-bling us to strongly decrease the number of IT systems to improve resilience and agility and build a new architecture common for all Nordic countries. The new platforms will consist of:
A new Core Banking Platform, for customer information, loans and deposits for all business areas. A new Payment Platform for domes-tic, international and SEPA pay-ments for all business areas. A common data warehouse, Group
Common Data, consolidating the existing data warehouses into one.
Business Areas are the drivers of these programmes ensuring focus on the customers and relationships through-out the change. We will continue to develop our services, for instance our mobile solutions, also while the simpli-fication activities are running. The development initiatives will be focused on activities supporting simplification. The Group Simplification Unit will orchestrate the programme creating common frameworks and ensuring overall planning and follow-up.
Implemented stepwise with deliveries over the next 4-5 yearsThe programme will be implemented stepwise with ongoing deliveries over
the next 4-5 years. The new platforms will be implemented starting from 2015 with the first deliveries in the payments area, continuing to the core banking platform.
The investments in new platforms are leading to an increase in our aver-age annual IT investments of approxi-mately 30-35% over the coming 4-5 years. As a consequence of the above we will replace some of our current IT systems, leading to an impairment charge of EUR 344m.
Nordea has a strong capital base and profitability and we have the capacity and resources to invest in developing our operations for the future – Easy to deal with anytime and anywhere, a safe and trusted partner offering per-sonalised solutions.
Strengthened online channels and aligning of channels
Customers
Internet bank
Cards
Letters
Phone & IVR
Physical meeting
Mobile
Online meetings

Nordea Annual Report 20148
Dear ShareholderIn 2014 Nordea not only delivered robust results, but also took the next steps in the transformation to meet our customers’ changing behaviour and the new regulatory requirements.
Last year proved to be yet another challenging year for our societies and the European economy. Growth expectations were disappointed, infla-tion and interest rates turned towards zero, the oil price tumbled and unfore-seen geopolitical tensions rose. Mean-while, the challenges with high debt levels, budget deficits and weak com-petitiveness remained unsolved.
I’m pleased that despite this eco-nomic environment we delivered improved revenues and lower costs leading to increased profitability. We welcomed more new customers and strengthened our relations with exist-ing customers, financing their activities and facilitating growth in our societies. And we further strengthened our capi-tal position, safeguarding our position as a trusted partner and our ability to
deliver great customer experiences at any time. Achievements that were also recognised during the year as we were awarded best bank in the Nordics by Euromoney and safest bank in the Nordics by Global Finance.
More customers and continued swift transformationIn Retail Banking 90,000 new rela-tionship customers chose Nordea as their financial partner. We now have 3.16 million relationship customers, demonstrating our strong position in the Nordic retail market.
The swift transformation of our cus-tomers’ behaviour continues, as they increasingly use our online services and interact with us whenever and wherever they want to. The number of new mobile banking users increases by 1,000 each and every day, and dur-ing 2014 the number of mobile trans-actions grew by 90%, illustrating the pace of the changing behaviour.
We continue to expand our digital banking offerings, be it via mobile or
tablet, our contact centre, Netbank, remote online meetings or via Face-book. Among the new offerings launched last year were new mobile banking solutions, providing custom-ers with features like drag and drop payments and transfers, full overview of loans and credit cards and secure e-mail. New convenient digital solu-tions like instant approval of con-sumer loans in Private Netbank in Denmark and an automated mortgage loan process for our Swedish custom-ers were also introduced.
To meet the swiftly changing demands we are inviting our custom-ers to take part in the development of new solutions. In the fall we initiated Nordea Next, where we involve and engage customers in validating selected ideas for new digital services. And in November we and IBM invited developers to the Nordea Innovation Challenge competition, with the winning solution being a visualisation of the customer’s spend-ing habits.
CEO letter
Building the Future Relationship Bank

Nordea Annual Report 2014 9
CEO letter
Consolidated position as leading wholesale bankIn Wholesale Banking we further consolidated our position as market leader serving the largest corporates and institutions. During the year, the number of large transactions on the market increased significantly. Nor-dea took a leading role in many of these transactions, providing cus-tomers with access to attractive financing.
Several number one positions in league tables confirmed our strong capital market franchise, and Whole-sale Banking was ranked as the leading bank for large corporates in the Nor-dics by Greenwich as well as number one in Nordic Equities by Prospera.
Assets under management at new record highAlso in Wealth Management we took a big step in 2014 solidifying our posi-tion as the largest provider in our region. A record-high net inflow of EUR 18.6bn, coming from all client segments contributed to the increase in assets under management to an all-time high of EUR 262bn.
As in Retail Banking also Private Banking within Wealth Management attracted more customers reaching a total of 109,500. Strengthened advi-sory capabilities and solutions con-tributed to the all-time high inflow of assets under management, and in October, Nordea was awarded best private bank in the Nordics by the global financial magazine The Banker, part of the Financial Times Group.
As an important part of ensuring sustainable and strong returns to our customers, we are consistently work-ing on integrating assessments of envi-ronmental, social and governance
(ESG) issues into our investment deci-sions. Recognising our success in this field, the European magazine Capital Finance International in 2014 awarded Nordea for having the best ESG invest-ment process in Europe.
Delivering on the 2015 planAs a result of the continued inflow of new customers and strengthened relationships in all business areas, revenues increased by 2% in local currencies and excluding non-recur-ring items. At the same time we have increased our efficiency and costs were lowered by 1%. Loan losses decreased by 6 basis points to 15 basis points and are now below the 10-year average. As a consequence the operat-ing profit was up by 12%, and the return on equity was 11.6%. Since the beginning of the financial crisis, Nor-dea has never delivered a return on equity below 10.6%.
Our strong capital generation con-tinued and Nordea is now fully com-pliant with the Swedish FSA’s capital requirement.
For 2015 we are planning for another year of low growth, subdued loan demand and continued changed cus-tomer behaviour.
The conclusion of our stress tests in the credit portfolios is that no signifi-cant short term deterioration is expected in credit quality, and we will continue to increase efficiency, lead-ing to a 5% cost reduction in local currencies in 2015 versus 2013 and strengthened capital efficiency – and thus deliver on our 2015 plan.
Great customer experiences in the futureIn 2015 we will also continue adapting to the changing behaviour among our
customers and to the new regulation.Digitalisation is changing our soci-
eties as consumers go online shop-ping, use streaming or interact in new ways that have already transformed a number of industries. This is a com-plex and challenging situation, but digitalisation is first and foremost an exciting opportunity to deliver great customer experiences in new ways. To make everyday services easier and more convenient to use and to create more personalised and relevant solu-tions for each customer, whether a large international company or a young household customer.
To facilitate the development of more convenient customer solutions and systems that efficiently fulfil the increasing monitoring and reporting requirements under the new regula-tion, we are simplifying processes in all parts of the bank. As part of this process, we will increase our IT investments by 30-35% over the coming years and build new core banking and payment platforms, significantly increasing our agility, benefits of scale and resilience.
Also in the digital future the highly committed and skilled employees in every part of Nordea will make the difference. With our values and rela-tionship strategy guiding our work and our strong financial performance as foundation, we continue the jour-ney towards the Future Relationship Bank – ensuring great customer expe-riences also in the future.
Best regards

Nordea Annual Report 201410
Our relationship strategy and leading market posi-tions have created and con-tinue to create significant value for all our stakehold-ers. This has been achieved by focusing efforts on cus-tomers’ needs in a cost- efficient manner, managing our capital base and main-taining our low-risk profile and low earnings volatility. The needs of customers and our relationship strat-egy are also the starting point for our return on equity target of 13% at the required common equity tier 1 (CET1) ratio, taking prevailing low interest rates into account. Nordea aims at operating with a CET1 capital ratio of approx. 15%, including a management buffer.
Nordea is a universal bank guided by its established customer-centric and advisory-led relationship strategy. The main pillar supporting this strat-egy is our awareness that our success and the purpose of our operations start with meeting the needs of our customers. Moreover, our long-term strategic objectives reflect our convic-tion that we are an integral part of the societies we serve. Our aim is to be an enabling, positive force for customers, society and investors by focusing on creating a sustainable business model for all our stakeholders.
Our vision is to be a Great European bank, acknowledged for its people, creating superior value for customers and shareholders. Our vision and stra-tegic targets are firmly supported by our culture and values – Great cus-tomer experiences, It’s all about peo-ple and One Nordea team.
Our roadmap towards the future is primarily a result and reflection of the needs of our customers and the chal-lenging macroeconomic and regula-tory environment in which we oper-ate. Our work begins with the customer, as we strive to provide Great customer experiences and holis-tic financial solutions in a low-risk, efficient and diversified manner. In operational terms, we have during the last four years had a clear focus on constantly improving our cost and capital efficiency in order to maintain
a sustainable operating model, secure competitive offerings and remain a solid banking institution. By servicing our customers and fine-tuning our business system, we are convinced that we can continue to access funding at competitive price levels, lend to the real economy and deliver an attractive return on equity and top-tier total shareholder return among European peers.
In order for our banking model to evolve going forward, we will con-tinue to work with our main focus areas:
on a customer-centric organisa-tional design, we strive to deliver the right products in the right man-ner at the right price. In all of our business areas, we provide a full suite of advice-driven products continuously adapted to the chang-ing demand and environment. Our focus is to be close to our custom-ers’ needs, and thereby be the natu-ral choice when customers choose the advisor for their event-driven transactions – be they corporate or household related.
-ues and principles, reflected in our objectives, how we lead, listen to, develop and support our people. Our values and leadership are the
Nordea Strategy
Strategy – the future relationship bank developing

Nordea Annual Report 2014 11
strongest drivers of performance and corporate culture. We believe in put-ting people first – Nordea can reach its goals only if its employees reach theirs.
business areas’ value chains are designed to support the focused relationship strategy. Having one operating model and business area ownership of the end-to-end value chain ensures a comprehensive view, accountability and congruity. It safe-guards operational efficiency by improving the quality of customer relationships, increasing the time spent with customers and reducing the time required to bring new prod-ucts and services to market.
emphasis on implementing new rules and regulation quickly, make it possi-ble for us to capture the benefits of the compliance driven investments also in the form of a deeper under-standing of our customers and risks.
Nordea benefits from the strong com-bination of leading businesses in the Nordics, and global capabilities well on par with international peers within prioritised product segments. This enables us to reap the benefits of both relationship banking and economies of scale.
to deliver Great customer experiences in the face of digitisation, changing customer behaviour and increased operational regulations we need to become more agile and realise the full potential of our scale while ensuring continued resilience. To do so, we will continue to adopt and develop best practice and strive for transparency and reduced complexity in our prod-ucts and processes. In addition, we have launched a programme and investments to make the transition to a New Core Banking Platform, a New Payment Platform, and a Group Common Data Warehouse.
-ued focus on compliance, and
Great customer experiences It’s all about people One Nordea team
Foundation: Profit orientation and prudent cost, risk and capital management
Strong customer-oriented values and culture
A Great European bank, acknowledged for its people, creating superior value
for customers and shareholders
’’

Nordea Annual Report 201412
Household strategyHousehold customers are divided into four segments, based on their business with us. For each segment, a distinct value proposition has been developed – including contact policy, service level, pricing and product solutions. The core philosophy of this strategy is to provide the best ser-vice, advice and product solutions to customers – thus ensuring loyalty, brand value and increasing business and income. Prices are transparent and generally non-negotiable. We have a broad and competitive prod-uct range, a highly skilled product organisation and strong distribution power. Product development is geared towards reducing complexity and developing capital-efficient products, in order to meet both the demands of customers and regula-tory requirements. Our savings
offering is designed to take into account each customer’s wealth, level of involvement, stage of life and risk appetite.
We pursue a multichannel distribu-tion strategy. The aim is to improve cus-tomer satisfaction while reducing the cost of service. Customer interaction is conducted through local branches, con-tact centres, video meetings, online ser-vices and the mobile bank – the latter of which is becoming increasingly impor-tant. We proactively offer recurring advisory meetings to all existing and potential relationship customers, taking their entire finances, risk/return profiles and long-term objectives into account in order to provide a comprehensive financial solution.
Corporate strategyCorporate customers are also divided into four segments, based on their
business potential and the complex-ity of their banking needs. For each segment, we have developed a dis-tinct value proposition – including contact policy, service level and product solutions – to provide com-prehensive offerings and ensure “house bank” relationships. Rela-tionship managers take holistic views of the customers’ situations and targets, and organise the rela-tionships accordingly. Our strength and size as the foremost banking group in the Nordics enable us to offer leading solutions to the benefit of our corporate customers.
Our strategy towards our largest corporate customers has proven robust during the ongoing transforma-tion of our industry. We remain com-mitted to becoming the leading bank in the wholesale segment in all our Nordic markets.
Assets > EUR 250kThe best Nordea has to offer
Volume > EUR 30k, no. of products > 5 Named advisor – priority in access – best fixed price
Volume > EUR 6k, no. of products > 3Personal service when needed – favourable price
Active customerBasic service – fair price
Strategic partnership – sponsor, customer team and named adviser – tailored, individual solutions
Partnership – named adviser and specialists – individual solutions
Business relationship – named adviser – individual solutions – standard products
Standardised offering – basic service – efficient handling
PrivateBanking
Gold and Premium
Silver
Bronze
Wholesale Banking
Large
Medium
Small
Segmentation and value proposition– Household customers
Segmentation and value proposition– Corporate customers
SegmentCustomers,
000sCriteria and Value
proposition SegmentCustomers,
000s Value proposition
12
33
80
460
112
3,159
1,500
3,600
Nordea Strategy

Nordea Annual Report 2014 13
The Nordea share and shareholders
The Nordea share and shareholders
STOXX Europe 600 Banks index (–44%) and the Nasdaq OMXS30 index (–5%).
Nordea’s share price can be moni-tored on www.nordea.com, where it is also possible to compare the perfor-mance of the Nordea share with com-petitors and general indexes and find historical prices for the Nordea share.
Total shareholder return 2014Total shareholder return (TSR) is the market value growth per share and reinvested dividends. Total share-holder return in 2014 was 9% (45% in 2013). Nordea ranked number ten among the European peer group banks in terms of TSR in 2014 (number nine in 2013, number 14 in 2012, five in 2011, nine in 2010, seven in 2009, two in 2008 and number three in 2007 and 2006.) The average TSR for the peer group was 6%.
Turnover – the most liquid Nordic financial share The Nordea share was the most liquid Nordic financial share in 2014, with an average daily trading volume of approx. EUR 120m, corresponding to approx. 13 million shares. Turnover on all stock exchanges combined totalled EUR 31bn in 2014, corre-sponding to 3.1 billion shares.
A large part of the total trading takes place on new alternative trading and reporting venues. 25% of the total
Nordea’s return on equity (ROE) target is 13% at the required common equity tier 1 (CET1) capital ratio, taking prevailing low interest rates into account.
Nordea’s market capitalisation at the end of 2014 was EUR 38.9bn (EUR 39.7bn the year before). Ranked by market capitalisation, Nordea was the fourth largest company in the Nordic region and among the ten largest European financial groups.
The Nordea share is listed on the Nasdaq Stockholm (in SEK), Helsinki (EUR) and Copenhagen (DKK) stock exchanges.
Share price performance In 2014 the Nordea share price appre-ciated 5% on the Nasdaq Stockholm exchange from SEK 86.65 to SEK 90.90. The daily closing prices listed for the Nordea share in 2014 ranged between SEK 84.25 and SEK 100.00. In 2014, the Nasdaq OMXS30 index appreciated by 10% and the STOXX Europe 600 Banks index depreciated by 3%. Since 6 March 2000, the date of the merger between MeritaNordbanken and Unidanmark, the Nordea share has appreciated 155%, clearly out performing the
Nordea share performance compared to European banks, 2000–2014
Turnover of the Nordea share in stock exchanges, 2014
volume traded in Nordea shares takes place over other exchanges such as BATS Chi-X Europe, Burgundy and Turquoise. Out of the total number of Nordea shares traded in 2014 on Nas-daq, approx. 84% were SEK-denomi-nated, 9% EUR-denominated and 7% DKK-denominated.
Share capitalAccording to the Articles of Associa-tion, shares in Nordea may be issued in two classes, ordinary shares and C-shares. The share capital amounts to EUR 4,049,951,919, which equals to the total number of shares in the Company. All shares are ordinary shares. There was no change in share capital or in the number of shares in 2014.
All ordinary shares in Nordea carry voting rights, with each share entitling to one vote at General Meet-ings. Nordea is not entitled to vote for own shares at General Meetings.
Further to the Long Term Incentive Programmes, there are no convertible bond loans or staff/management options in Nordea.
Capital policyNordea’s current capital policy states that the Nordea Group should have a target minimum of 13% in CET 1 and 17% in total capital ratio. Nordea’s current view is that the bank should operate with a CET1 ratio of approxi-
Nordea NasdaqSTOXX Europe 600 Banks index Alternative exchanges share
0
50
100
150
200
250
19
99
20
00
20
01
20
02
20
03
20
04
20
05
20
06
20
07
20
08
20
09
20
10
20
11
20
12
20
13
20
14
SO
UR
CE
: TH
OM
SO
N R
EU
TE
RS
DA
TAS
TR
EA
M
0
10
20
30
40
50
60
70
80
Jan Feb Mar Apr May Jun Jul Aug Sep Oct Nov Dec
SO
UR
CE
: SIX
FIN
AN
CIA
L I
NF
OR
MA
TIO
N
Index %

Nordea Annual Report 201414
The Nordea share and shareholders
Largest registered* shareholders in Nordea, 31 Dec 2014
ShareholderNo of shares,
millionHoldings
%
Sampo plc 860.4 21.4Nordea-fonden 158.2 3.9Swedbank Robur Funds 138.9 3.4Alecta 97.0 2.4AMF Insurance & Funds 76.2 1.9Norwegian Petroleum Fund 60.1 1.5SHB Funds 58.6 1.5Fourth Swedish National Pension Fund 43.6 1.1SEB Funds 39.3 1.0Saudi Arabian Monetary Agency 38.6 1.0Nordea Funds 37.7 0.9AFA Insurance 34.3 0.9First Swedish National Pension Fund 34.1 0.8Fidelity Funds 29.6 0.7Varma Mutual Pension Fund 28.9 0.7Skandia Life Insurance 28.0 0.7Third Swedish National Pension Fund 26.4 0.7Didner & Gerge Funds 25.5 0.6Vanguard Funds 24.9 0.6SPP Funds 24.2 0.6Total, 20 largest shareholders 1,864.5 46.3
Source: SIS ägarservice, Nordic Central Securities Depository, VP Online.* Excluding nominee accounts.
Swedish institutions, 24%Swedish public, 3%
Norway, 3%
UK, 5%
Others, 10%
US, 16%
Danish institutions, 5%
Danish public, 3%
Finnish institutions, 26%
Finnish public, 5%
Nordic companies and institutions, 47%Nordic mutual funds, 11%Non-Nordic entities, 31%
Public, 11%
Shareholder structure, 31 Dec 2014 Type of shareholders, 31 Dec 2014
mately 15%, including a management buffer, although there is still some regulatory uncertainty.
Proposed dividend and dividend ambitionThe Board of Directors proposes a dividend of EUR 0.62 per share for 2014. The total dividend payment for 2014 would then be EUR 2,501m, cor-responding to a payout ratio of 70% of the net profit after tax excluding the net effect from the charge for impair-ment of intangible assets of EUR 344m. The dividend yield calculated on the share price at 30 December 2014 is 6.4%.
The ambition for the dividend is to increase the payout ratio in 2014 and 2015, while maintaining a strong capi-
tal base.The dividend is denominated in
EUR, Nordea’s accounting currency. The payment currency depends on the country in which the shares are registered. Owners of shares regis-tered in Sweden can choose between dividend in SEK or EUR. An official exchange rate is published. In Den-mark, dividends are paid in EUR. If the shareholder does not have a EUR account the dividend is converted into local currency. Each custody institution decides its own conver-sion rate. In Finland, the dividend is paid in EUR.
ShareholdersWith approx. 445,000 registered share holders at the end of 2014,
Nordea has one of the largest share-holder bases of all Nordic companies. The number of shareholders in Sweden is approx. 98,000, in Finland approx. 193,000 and in Denmark approx. 154,000 – largely unchanged numbers from last year.
The largest shareholder category is Finnish institutions (including Sampo plc), with a 26% holding of Nordea shares at year-end. Swedish institu-tional shareholders held 24% while non-Nordic shareholders held 31% of the capital at the end of 2014 (unchanged from last year). The larg-est individual shareholder is Sampo plc with a holding of 21.4%.
Nordea share, equity analysts’ average target price and actual share price 2014
Actual share priceTarget share price
60
70
80
90
100
110
Jan Feb Mar Apr May Jun Jul Aug Sep Oct Nov Dec
SO
UR
CE
: EU
RO
LAN
D
SOURCE: SIS ÄGARSERVICE, NORDIC CENTRAL SECURITIES DEPOSITORY, VP ONLINE
SEK

Nordea Annual Report 2014 15
The Nordea share and shareholders
Nordea weighting in the STOXX Europe 600 Banks index, %
Distribution of shares, 31 Dec 2014
Distribution of shares Number of shareholders Shareholders, % Number of shares Shares, %
1–1,000 328,022 74% 101,513,436 2%1,001–10,000 109,956 25% 267,841,992 7%
10,001–100,000 6,162 1% 149,592,851 4%100,001–1,000,000 833 0% 275,602,125 7%1,000,001– 360 0% 3,239,482,328 80%Total 445,333 4,034,032,732
Share data 5 years2014 2013 2012 2011 2010
Share price SEK 90.90 SEK 86.65 SEK 62.10 SEK 53.25 SEK 73.15High/Low (SEK) 100.00 / 84.25 86.65 / 62.10 66.90 / 51.55 79.60 / 48.30 76.00 / 60.30Market capitalisation EUR 38.9bn EUR 39.7bn EUR 29.3bn EUR 24.2bn EUR 33.0bnDividend EUR 0.622 EUR 0.43 EUR 0.34 EUR 0.26 EUR 0.29Dividend yield3 6.4% 4.2% 3.8% 3.8% 3.6%TSR 9.2% 44.6% 21.0% –24.4% 3.7%STOXX Europe 600 Banks index –2.8% 19.0% 23.1% –34.0% –27.0%P/E (actual) 11.7 12.7 9.3 9.7 12.36Price-to-book 1.31 1.35 1.03 0.92 1.34Equity per share EUR 7.40 EUR 7.27 EUR 6.96 EUR 6.47 EUR 6.07Earnings per share4 EUR 0.83 EUR 0.77 EUR 0.78 EUR 0.65 EUR 0.66Outstanding shares1 4,034,032,732 4,031,635,539 4,029,683,426 4,029,023,222 4,027,129,6751) Excluding shares held for the Long Term Incentive Programmes.2) Proposed dividend.3) Dividend yield for 2010 to 2013 calculated at starting price on payment day and for 2014 calculated at price per 30 December 2014.4) Diluted earnings per share, total operations.
Nordea share, monthly turnover on different stock exchanges 2014, %
Month NasdaqBATS
CHI-X Burgundy Turquoise
January 73.0 16.3 0.8 9.8 February 74.1 14.3 0.5 11.1
March 73.1 12.0 0.3 14.7 April 75.4 12.7 0.2 11.8 May 74.1 13.7 0.2 12.0 June 74.0 15.1 0.3 10.6 July 76.2 15.4 0.2 8.2 August 74.5 17.1 0.4 8.0 September 77.6 14.9 0.2 7.3 October 77.6 15.8 0.4 6.2 November 76.7 17.1 0.1 6.1 December 76.8 16.3 0.1 6.9
Change in share capital 1
DateQuota value per
share 2, EURNumber of shares
issuedNominal change
EURmTotal number of
sharesShare capital
EURm
11 May–06 Bonus issue 1.00 1,566 2,594,108,227 2,59408 Jun–07 New issue3 1.00 3,120,000 3 2,597,228,227 2,59715 May–08 New issue4 1.00 2,880,000 3 2,600,108,227 2,60030 Apr–09 New issue5 1.00 1,416,811,607 1,417 4,016,919,834 4,01717 May–09 New issue5 1.00 13,247,917 13 4,030,167,751 4,03018 May–09 New issue6 1.00 7,250,000 7 4,037,417,751 4,0376 May–10 New issue7 1.00 5,125,000 5 4,042,542,751 4,0435 May–11 New issue8 1.00 4,730,000 5 4,047,272,751 4,0472 May–12 New issue9 1.00 2,679,168 3 4,049,951,919 4,050
1) A presentation of changes in share capital before 2006 is presented and available at www.nordea.com.2) As of January 2006, nominal value has been replaced by quota value according to the new Swedish Companies Act. 3) C-shares issued for the Long Term Incentive Programme 2007. Converted to ordinary shares 18 June 2007. 4) C-shares issued for the Long Term Incentive Programme 2008. Converted to ordinary shares 22 May 2008. 5) Shares issued in relation to the Nordea rights offering.6) C-shares issued for the Long Term Incentive Programme 2009. Converted to ordinary shares 12 May 2009.7) C-shares issued for the Long Term Incentive Programme 2010. Converted to ordinary shares 11 May 2010.8) C-shares issued for the Long Term Incentive Programme 2011. Converted to ordinary shares 17 May 2011.9) C-shares issued for the Long Term Incentive Programme 2012. Converted to ordinary shares 3 May 2012.
0,0
0,5
1,0
1,5
2,0
2,5
3,0
3,5
4,0
20
03
-12
-31
20
05
-12
-31
20
07
-12
-31
20
09
-06
-30
20
10
-06
-30
20
11
-06
-30
20
12
-06
-30
20
13
-06
-30
20
14
-12
-31
20
04
-12
-31
20
06
-12
-31
20
08
-12
-31
20
09
-12
-31
20
10
-12
-31
20
11
-12
-31
20
12
-12
-31
20
13
-12
-31
SO
UR
CE
: STO
XX
SO
UR
CE
: SIX
FIN
AN
CIA
L I
NF
OR
MA
TIO
N

Nordea Annual Report 201416
Our people
We can only achieve our goal of ensuring a great customer experience if we employ the right people and develop them in the right way. Recruiting, developing, motivating and retaining the best people are therefore among our highest priorities.
Staying value-drivenOur values – Great customer experi-ences, It’s all about people and One Nordea team – continue to underpin our People strategy and drive every-thing we do. The values are incorpo-rated in all our processes, training and leadership, as well as forming the basis for our leadership capabilities.
Enhancing our leadershipAt Nordea, we put relationship first, striving to create superior value for every one of our customers and shareholders. We know that requires strong leadership – since great leaders are a prerequisite for great employees. Leadership is one of the most impor-tant drivers of culture, performance, motivation and job satisfaction. How our leaders perform is key to how our people perform, which in turn impacts the quality of our customer’s experience. Our leaders also have an important role in helping the staff to live the company values.
When the world changes, leaders have to change. When leaders are remote from their direct reports –per-haps even in another country – it is even more important that they are ‘present’ in the way they manage. They need to be very clear about responsibilities, what tasks need doing and how people are expected to perform. Increasingly, leaders will be held accountable for developing the talents that report to them and creat-ing the right team to lead the future relationship bank.
Managing our talentsEnsuring that our customers have a positive experience in their dealings with us is central to everything we do. It is therefore critical that we employ, develop and retain the people who are best placed to help us deliver this goal.
We have identified some of the most critical competences we think our employees need to have today and in the future. These include lead-ership capabilities, strong execution and agility and not least the ability to understand and relate to our custom-ers. Having identified those compe-tences, we target our recruitment activities to the most suitable candi-dates. While we are the leading Nor-dic bank, we also hire from outside the Nordic region to ensure we find the best people we can.
More information is available in the section about People in Nordea’s CSR Report 2014 about how we in Nordea
view Leadership, Performance and Talent Management as well as how we work to improve the gender balance.
Employees distributed by age% of employees 31 Dec 2014
0%
–24
25–34
5% 20%15%10% 30%25%
35–44
45–54
55–60
61–
Age
Great people create great customer experience
Employee satisfaction survey results
ESI, index 2014 2013 2012
Satisfaction and motivation 71 72 72
Development 73 73 73Considered a good workplace 75 77 74Proud to tell oth-ers where I work 77 79 77Recommend oth-ers to start work-ing in Nordea 71 74 72
Adjusted, excluding Polish operations
Number of employees, by area or function (continuing operations, excluding Polish operations) Full-time equivalents (FTEs) 2014 2013
Retail Banking 16,685 17,273 Banking Denmark 3,253 3,411 Banking Finland 3,717 3,949 Banking Norway 1,338 1,405 Banking Sweden 3,040 3,250 Banking Baltic
countries 730 727 Retail Banking other 4,607 4,531
Wholesale Banking 5,985 6,008 Corporate & Institu-
tional Banking 214 169 Shipping, Offshore &
Oil Services 80 87 Banking Russia 1,348 1,405 Capital Markets
Products 2,244 2,272 Wholesale Banking
other 2,099 2,075
Wealth Management 3,478 3,452 Private Banking 1,231 1,216 Asset Management 592 564 Life & Pensions 1,078 1,130 Savings 327 319 Wealth Management
other 250 223
Group Corporate Centre 2,319 1,830Group Risk Management 468 473Other units 462 393Nordea Group 29,397 29,429

Nordea Annual Report 2014 17
CSR
CSR performance countsNordea is actively committed to building trust in the finan-cial industry by increasing our transparency, improving engagement with our cus-tomers and always acting with integrity.
We want to use our capabilities and competencies not only to have a financial impact, but to have a social impact too. The two go hand in hand. Conscious of our responsibilities, we can operate in a way that makes a dif-ference to the lives of individuals and to society at large.
Focused on performance Our commitment starts with taking a more structured and integrated approach to sustainability. Over the past year we have developed group-wide CSR focus areas at the core of our business. Approved by our CSR Committee in November 2014, these focus areas are the first step in setting a new CSR ambition level and meas-uring our CSR performance. These are being implemented within the business areas, and coordinated by the CSR Committee.
CSR as part of our identity In 2014, the CSR unit, Group Identity & Communications and Group Mar-keting were brought together into a new unit, Group Marketing and Communications headed by Helena Andreas, reporting to the CEO. This structure enables us to make sustain-ability an integral part of Nordea’s brand and to fully use our strong business-driven CSR activities in our communications. Alongside this, our new CSR governance model ensures we are placing these issues at the cen-tre of what we do by driving decision-making into our business areas.
Acting with integrity Through managing risk and operat-ing with integrity, we build trust and perform better. Our Operational Risk and Compliance Awareness Pro-gramme ensures that our employees are fully aware of these policies and commitments. Our whistle-blowing system, Raise Your Concern, comple-ments this programme. It encourages employees to speak up if they have a serious concern about any misconduct or irregularities, including any action that constitutes a violation of laws or regulations, or of Nordea’s internal policies, instructions or guidelines. In 2014, three cases were reported and two are still under investigation.
Understanding our place in soci-etyAs a bank, we are a source of finance and a trusted financial partner, gen-erating financial value directly for our customers, suppliers, business part-ners, employees, shareholders, the companies in which we invest, and other investors. We generate social value through the benefits our prod-ucts bring to people, through our community programmes, and by pay-ing taxes. Moreover, since we are sig-nificant owners of the companies in which we invest, we can encourage those companies to operate more responsibly, both in our own home markets and globally.
As we further develop our CSR pro-gramme in the years ahead, we are confident we can create a positive impact through all of our roles in society and generate more value for all of our stakeholders.
“We have a responsibility to think and act in the long term. With clarity, transparency and commitment, I am sure we can do more and see Nordea have a greater positive impact on society.”
Gunn Wærsted, Head of Wealth Management
y--
o-
y,
Nordea’s CSR Report 2014, available on www.nordea.com/csr
Our approach to CSR“ We aim to create shareholder value, great customer experi-ences and be an attractive financial employer in the mar-kets where we operate. And we strive to do so in a way that benefits society in the long term.
“ To do this, we need to be clear about what kind of business we should and shouldn’t do and transparent about how we have reached our decisions. That will mean some difficult discus-sions but we have a willingness to work through those to reach the best outcome. One that is consistent with our values.
“ We will not shy away from these issues just because they are challenging. We will accept this is a complicated area and deal with it. What we must remember is that this is not about being perfect, it is about striving to become better.”
Gunn Wærsted, Head of Wealth Management, Chairman of the CSR Committee

Nordea Annual Report 201418
Business Areas
Business Areas
Market positions, 2014
Denmark Finland Norway Sweden Estonia Latvia Lithuania RussiaShipping int’l, Lux. Total
Number of customers, 000’sCorporate customers 51 176 87 229 21 10 7 3 2 587Household customersHousehold customers in customer programme 1,616 2,138 796 3,335 131 105 158 19 8,298– of which Gold and Premium customers 729 1,025 315 1,025 30 18 16 2 3,159 (change 2014/2013, %) 0% 1% 6% 3% 19% 8% 2% 2%
Private Banking 45 28 11 19 1 1 0.5 n.a. 6 112 (change 2014/2013, %) 1% –1% 4% –1% 13% 5% 24% 1%Net banking, active users 1,018 1,374 356 1,479 112 107 145 n.a. 4,591 (change 2014/2013, %) 5% 2% 8% 0% 17% 6% 0% 3%
Number of branch locations 156 183 87 231 15 13 10 18 713
Market shares, % (change 2014/2013, %–points)
Corporate lending 24 (0) 34 (–1) 13 (0) 14 (0) 22 (0) 17 (0) 11 (–2) 1 (0)Corporate deposits 29 (1) 40 (–3) 13 (1) 14 (–1) 12 (–1) 7 (0) 13 (3) <1Institutional investment funds 3 (–1) 39 (6) 8 (–1) 4 (–4)Household investment funds 18 (1) 23 (–1) 17 (1) 13 (0)Life & Pensions 15 (0) 44 (5) 18 (3) 8 (2)Household mortgage lending 17 (0) 31 (0) 11 (0) 16 (0) 16 (0) 19 (1) 12 (0) <1Consumer lending 20 (0) 31 (0) 7 (0) 7 (0) 7 (1) 2 (0) 9 (0) <1Household deposits 23 (0) 30 (-1) 8 (0) 15 (–1) 7 (1) 6 (0) 3 (1) <1
Business Areas are very well positionedWealth ManagementWholesale BankingRetail Banking
Business Area contribution, 2014
Largest and most diversified retail bank in the Nordics Successful relationship model One shared Nordic operating model with scale benefits
Leading wholesale bank in the Nordics Uniquely positioned combining strong local presence with global product capabilities Successful business model transfor-mation ongoing
Largest private bank, asset manager and life & pensions provider in the Nordics Fast growing wealth manager supported by both Nordic and international growth Strong product and advisory capabilities as demonstrated by investment outperfor-mance and solid and well diversified flow
Operating income Operating profit FTEs Economic capital
Retail Banking Wholesale Banking Wealth Management Other
54% 46% 57% 48%25% 34%
20%33%
8%12%20%17%
4% 0%
11% 11%

Nordea Annual Report 2014 19
Key figures 2013 2014
Business Area Retail Banking
Nordea has the largest customer base of any financial institution in the Nordic region. Retail Banking serves around 10 million household and 570,000 corporate customers in seven markets through a multitude of chan-nels. Household and corporate cus-tomers are served on all financial needs. The business area incorporates the whole value chain including advi-sory and service staff, channels, prod-uct units, back office and IT. Retail Banking operates under one common strategy, operating model and gov-ernance system across markets. In each of our markets, our main focus is to deliver great customer experiences.
StrategyRetail Banking’s ambition is to create a leading retail banking operation in the Nordic region in terms of cus-tomer experience, profitability and efficiency. The ambition builds on a strong commitment to relationship banking.
The banking sector and particularly the Retail part is transforming, with swiftly changing customer behaviour in the direction of using services and receiving advice online.
To cater for the changing customer needs and preferences, we strengthen our online offerings. The goal is to build broad and deep relationships with our customers also online. Rather than just providing a customer with one single product, our ambition is to create online solutions for those
personal and corporate customers who want a full-service solution. In addition, we work on simplifying and digitising our key processes and products to deliver scale, reduce costs and make it easier and more conveni-ent to bank with us.
Nordea is open for all customers. Segmentation, differentiated value propositions, emphasis on servicing the full customer wallet, capital effi-ciency and fair pricing are the tools to make all customer relations profit-able. The relationship customers have access to our advisers in order to cover their banking needs. Our household and corporate advis-ers are also proactively contacting customers with further business potential.
We witness fast changes in custom-ers’ way of using the bank these years. Customers increasingly make use of our online services and want to interact when and where they want to. We thus continuously expand the opportunities for customers to inter-act with us as they prefer, whether it be through mobiles or tablets, calling our contact centre, using the Netbank, meeting an adviser in a remote net meeting, chatting with an adviser or getting a fast answer to an inquiry via Facebook etc.
Across channels we had close to 656 million interactions with our cus-tomers throughout the year. We aim to get the customer experience right in each touch point as each of these is an opportunity to deliver good cus-
Retail Banking Business Areas
70.075.9
C/I %
5356
13 14
RaRoCaR %
REA EURbn
2014 performance and strategic direction Deliver on the 2013–2015 financial plan
Diversified franchise covering the Nordics and Baltics delivering growing income with low volatility
High customer activity and many new customers, 90,000 externally acquired relationship customers in 2014, 1.8 million customer meetings
Top line growth was to a large extent reflecting good savings and payments commission income, as well as a strong net result from items at fair value, partly driven by foreign exchange. Operating profit increased by 12%
Reduced net loan losses
Developing a true multichannel relationship bank

Nordea Annual Report 201420
tomer experiences and to advise, serve and sell to our customers.
Nordea’s branch network has been adjusted in accordance with the changes in customer behaviour where our customers conduct significantly fewer manual transactions. We have today a more efficient and customer-focused branch network with propor-tionally more of our employees focus-ing on advising customers.
We will continue to support our customers’ good projects while con-trolling and optimising scarce resources, attract new relationship customers to bank with us while expanding business with our existing customers.
Capital management is concentrated to three areas:
Allocating capital to the most profit-able business Capital-optimisation of individual customer relationships, securing less capital-intensive solutions Efficiency in models and internal processes.The main drivers for keeping costs
down derive from optimisation of processes, continued optimisation of the distribution mix, digitalisation, a continued reduction of manual cash handling combined with customers’ increased use of online banking solu-tions. In addition, manual processes are being further centralised, auto-mated and some of them off-shored to the Nordea Operation centre in Poland.
Business developmentWeak macroeconomic environment with interest rates at record-low levels continued to affect the business. Investments were subdued, resulting in weak demand for financing from corporate customers.
The number of Gold and Premium household customers amounted to 3.16 million, of whom 90,000 were new Nordea relationship customers, and 1.8 million household and corpo-
rate advisory meetings were held.The swift transformation of our
customers’ behaviour continues, as they increasingly use our online services and interact with us whenever and wherever they prefer to. In 2014 the number of mobile transactions increased by 90%, illustrating the pace of the changing behaviour.
Within the corporate business, ini-tiatives to improve capital efficiency and ancillary income were success-fully initiated. Further measures were taken to focus even more on custom-ers’ needs and our firm belief is that we by this customer centric focus, in combination with our size, can give the best customer offering.
ResultThe depreciation of the SEK and NOK has had a substantial impact on the reported financials, especially on vol-umes.
In local currencies, total income increased by 4% from the previous year. The growth came from all major income lines and was driven by all countries.
In local currencies, lending volumes increased by 3% while deposit vol-umes grew by 1%, despite the low interest rate environment. Net inter-est income improved by 3%, driven by the lending book.
Net fee and commission income showed a steady growth, driven by the development in the savings area as well as payment commissions. Net result from items at fair value increased by 9% in local currencies, partly driven by FX transactions.
Our cost efficiency programme is progressing as planned. Processes are optimised and distribution is adjusted to better reflect changed customer behaviour as manual transactions continue to decrease. The number of FTEs continued to decline and total expenses were down by 1% in local currencies.
The risk exposure amount (REA) decreased during the year following the weakening of the NOK and SEK
and a continued focus on capital effi-ciency. RAROCAR increased by 1.6 %-points.
Credit qualityNet loan losses decreased and the loan loss ratio was 19 basis points (21 basis points in 2013). This was driven by the development in Denmark and Sweden.
Banking DenmarkA continued high activity level with customers paved the way for increased business volumes, leading to higher total income despite decreasing interest rates and weak GDP development. The high level of inflow of both new corporate and household customers was maintained and the cost efficiency programme continued to be on track with lower year-over-year costs and a lower number of FTEs. Loan losses included a collective provision related to agri-culture, but continued down.
Banking FinlandOperating profit increased substan-tially, driven by improved income and flat costs. A positive development in the lending spreads was the main driver behind the good net interest income. Net fee and commission income was higher than in 2013, mainly as a result of the higher stock market values. Foreign exchange and derivatives in the fourth quarter were important factors for the high net result from items at fair value. Expenses were flat. The number of FTEs decreased by 6% from Decem-ber 2013. Net loan losses increased from 2013, but are still at a relatively low level, especially considering the weak macroeconomics.
Banking NorwayThe weakening of the NOK, due to a significant reduction in oil prices, had a substantial impact on the reported income and expense development. Customer activity was however high in 2014, which was also reflected in the business volume development with solid growth in local currencies both for household and corporate. Cross
Business Areas Retail Banking

Nordea Annual Report 2014 21
“Throughout 2014 we have attracted many new relationship customers, boosted the mobile banking usage and improved capital efficiency. We have won new customers from all parts of the countries and across all ages. The constant inflow of new relationship cus-tomers substantiates Nordea’s strong posi-
tion. So does the fact that we on average get 1,000 new mobile banking users every single day. People as well as companies increas-ingly turn to online and mobile to handle their banking needs. The rapid development in customers’ behaviour puts high demands on us, but it first and foremost provides us with a
fantastic opportunity to deliver great cus-tomer experiences on more platforms than previously. Our focus is on expanding the concept of personal banking beyond the branch providing a personalised service and customer experience also online.” says Lennart Jacobsen, Head of Retail Banking.
Lennart Jacobsen is Head of Retail Banking.
“ Based upon our customers’ needs and preferences we aim to advise, serve and sell in every customer touch point”
sales activities continued and ancillary income grew compared to 2013. Capi-tal efficiency and risk pricing was a focus area in 2014 as well and, despite the high volume inflow, REA contin-ued to decline.
Banking SwedenIn 2014 the improving trend of the Swedish economy was under pressure which by year end resulted in the Riksbank lowering the central bank rate to 0%. Corporate customers’ demand for financing remained mod-est while competition for new lending contracts remained fierce. Household business volumes however continued to grow in 2014, supported by an increasing amount of new customers. The low-interest rate environment put pressure on deposit volumes, but
transaction-driven non-interest income increased compared to 2013. Net result from items at fair value included income of EUR 27m from the sale of a debt collection portfolio.
Banking Baltic countriesThe growth in total income was driven by net interest income, which in turn was a result of a favourable direction of lending spreads espe-cially on the corporate market. Staff costs increased, but total expenses were kept at the same level as 2013. Lending volumes were down 2%, whereas the strengthening of the relationship strategy with a focus on mass-affluent customers helped to grow deposit volumes and thereby improved the deposit/lending ratio.

Nordea Annual Report 201422
Wholesale Banking provides services and financial solutions to Nordea’s largest corporate and institutional cus-tomers. The business area incorporates the entire value chain including cus-tomer and product units as well as supporting IT and infrastructure.
Wholesale Banking has a substan-tial lead-bank footprint in all Nordic markets, supported by a competitive product offering and a well-diversi-fied business mix. The leading posi-tion is leveraged to further strengthen customer relationships and drive cross-selling and income growth, and to provide customers with access to attractive financing in the capital markets.
Wholesale Banking focuses on increasing returns through continu-ous improvements and strict resource management. Effective business selection and a strengthened cus-tomer service model support income development and capital allocation.
StrategyThe business area has since 2011 undergone a large transformation developing and advancing the organi-sational platform. These endeavours have resulted in the strongest whole-sale bank in the Nordics with number one rankings and leading positions across product offerings.
Wholesale Banking’s strategic posi-tion and operating model are built on global product capabilities and strong local presence in securing the posi-tion as leading relationship bank. In view of increased regulation and a changing business environment, a repositioning of the business has taken place. With this, Nordea has successfully cemented its lead posi-tion as the number one Wholesale Bank in the Nordics.
Wholesale Banking advocates a solu-tion-oriented approach with a cus-tomer-centric and return-driven cul-ture focused on value creation. Central to this is our strong culture of business selection and discipline, at both cus-tomer and transaction level when allo-cating resources, and monitoring and managing customer profitability.
A Nordic operating model is deployed throughout Wholesale Banking to leverage our core capabili-ties and scale. These core capabilities have in turn been strengthened through focused recruitment and emphasis on talent management. Essential to this is to drive the success of customers, people and business in alignment with our values.
Core for the relationship strategy is a close interaction of units across Wholesale Banking. This is strength-ened via our integrated financing and capital markets platform. From
Business Area Wholesale Banking
Business Areas Wholesale Banking
Key figures 2013 2014
53.459.0
3534
14 14
C/I %
RaRoCaR %
REA EURbn
2014 performance and strategic direction Further cemented our position as the leading wholesale bank in the Nordics
Strengthening of the relationship strategy with intensified local interaction and value-creating solutions
Reinforced capital markets franchise with more balanced business mix
The leading Nordic equity house
The leading Nordic bond house
Launch of talent management programme to develop internal capabilities
Improved and broadened e-markets platform
FICC business adapting to regulatory requirements and challenging trading environment
The weak economy and challenging trading environment led to a declining operating income
Continued strict resource management resulting in reduced REA and a highly competitive cost/income ratio

Nordea Annual Report 2014 23
Wholesale Banking Business Areas
financing of corporates and institu-tions via lending, bond issuance and equity with associated risk manage-ment solutions, to linking issuers with our extensive investor base. We call this teaming up for success.
Business developmentWholesale Banking continued to fur-ther consolidate its leading market position throughout the year. The market sentiment and relentless com-petition for market position continued to affect customer activity.
FICC adapted well to the challeng-ing regulatory and macroeconomic environment with a business model proven relatively robust. Develop-ment of the business is well under way responding to the increased capi-tal requirements and the changing
market micro structure. The disintermediation of banks in
the loan market affecting the lending volume and re-pricing opportunities was evident through the year. This was largely offset by strong capital market activities.
A successful execution of capital market financing and focus on cross-selling supported Nordea’s leading position as preferred corporate advi-sor leading to key roles in numerous major value-adding transactions.
Wholesale Banking’s successful relationship strategy was recognised externally with a flourish of top ranks and awards. Among other, Nordea was awarded Best Bank, Best Invest-ment Bank and Best Trade Finance Bank 2014 in the Nordics by Global Finance, and was for the fifth consec-utive year given the StarMine Award. Positions as number one in league tables confirmed our strong capital market franchise throughout the year.
BankingCorporate customer activity was modest whereas the event-driven activities improved with a number of large transactions. Daily business was relatively stable with no larger fluctu-ations in margins and transaction flows at normal levels during the year.
Institutional customer activity was challenged by the macroeconomic environment with low interest rates and low volatility leading to a subdued sentiment for risk management prod-ucts.
Customer activity in Shipping, Off-shore & Oil Services was moderate for the year with improved business activity in the tanker segment. Off-shore & Oil Services experienced weaker market conditions mainly as a result of reduced oil prices and increased uncertainty related to future exploration and production spending in the oil industry.
“With a strengthening of our local profile while sustaining our global scale we have taken an additional step in seamlessly delivering WB towards the customers”, says Casper von Koskull, Head of Wholesale Banking.
“In 2014, we enriched our local footprint
ensuring alignment towards the customer with more agile and responsive business decision processes. Strong team work and coordination of activities have proven a leverage of our strategy in the local markets during challenging market conditions.”
Casper von Koskull is Head of Wholesale Banking.
“ We are teaming up for success”

Nordea Annual Report 201424
In Russia, customer activity was at a satisfactory level, despite the RUB volatility and the geopolitical turmoil, causing a slowdown in the economy and low capital investments. Monitor-ing of the development continued and Nordea is well prepared in case of further escalation.
Capital marketsFICC delivered a strong result despite 2014 being characterised by low inter-est rates, low volatility, low risk pre-miums and compressed margins. A decline in topline seemed to bottom out during the summer as customer activity generally picked up in the second half of the year, especially within asset products. Hedging activ-ity also increased during the same period as volatility picked up slightly. Throughout the year, FX volumes were strong partly offsetting the com-pressed margins.
The primary bond issuance improved. Particularly the high yield sector benefitted from investors’ search for yield further strengthening the Nordic fixed income market. Strong corporate balance sheets, liq-uid financing markets and the low interest rates fuelled M&A activity in the Nordic region in 2014 making it the most active year since 2007. The ECM market overall was down slightly from 2013, but high asset prices made it the largest IPO market in years.
Equities business improved during 2014, with both secondary and pri-mary equity contributing positively throughout the year, proving a strong result in all aspects of the business. The Nordic efforts were strongly backed by the UK client franchise established in the beginning of the year targeted towards the interna-tional clientele. By all measures Nor-dea strengthened its position as the best Nordic equity house as most recently evidenced by the Nordic Prospera 2014 review.
Credit qualityNet loan losses amounted to EUR 98m. The loan loss ratio was 10 basis
points (26 basis points in 2013). In Shipping, Offshore & Oil Services, net reversals were reported of EUR 37m compared to net loan losses of EUR 95m in 2013. The loan loss ratio in Corporate & Institutional Banking was 32 basis points (45 basis points in 2013) and in Banking Russia 24 basis points (net reversals in 2013).
ResultTotal income was EUR 2,449m, a decrease of 3% in local currencies from the previous year (-6% in EUR). The shift in income composition from items at fair value to fee and commis-sion income was underlined by the year-over-year development.
Total expenses decreased by 2% in local currencies from the previous year (-6% in EUR). Continued strict resource management resulted in lower REA and a competitive cost/income ratio, up somewhat compared to the previous year.
Operating profit increased to EUR 1,506m, up 6% in local currencies from last year (+3% in EUR). The business area RAROCAR amounted to 14%.
Corporate & Institutional BankingTotal income was down by 1% com-pared to last year, although fee and commission income increased by 7%. 2014 was characterised by intense competition, both from international and Nordic competitors affecting the market pricing. Daily business was moderate with stable transaction flows. Event-driven transaction level was strong during the year, with some local differences. The low vola-tility in capital markets and stable low interest rates challenged the business mainly in the first half of the year of 2014 affecting the demand for hedg-ing products.
Institutional customer activity was modest with a few large deals closed in the first and latter part of the year and a strong Equity activity. The income result was overall impacted by low income in the risk manage-ment activities.
Shipping, Offshore & Oil ServicesTotal income was up 5% compared to last year, mainly due to an increase in commission income on lending. Busi-ness activity was somewhat higher than in 2013, with stable lending vol-umes and the overall customer activ-ity remained at a moderate level. The dry cargo and container markets were generally weak during the year. Loan volumes at the end of the year were EUR 11.6bn, 2% up from year-end 2013. Net reversals were reported of EUR 37m, compared to net loan losses of EUR 95m in the previous year, reflecting an improvement in credit quality.
Banking RussiaTotal income increased 7% from the previous year to EUR 274m due to strong net interest income throughout the year. Average lending volumes decreased 8% in local currencies in 2014 compared to 2013, and were down by 7% in local currencies in the corpo-rate portfolio (+2% in EUR mainly due to the appreciation of the USD, which makes up ~70% of the lending portfo-lio). Expenses were decreased by 11% in EUR, primarily due to the deprecia-tion of RUB. Operating profit remained strong, up 4% in EUR from last year. This includes moderate provisions for future loan losses of EUR 15m com-pared to reversals in 2013.
Wholesale Banking other(including Capital Markets unallo-cated)Wholesale Banking other total income was down 39% from the pre-vious year, reflecting continuous low interest rates and subdued market activity. Wholesale Banking other is the residual result not allocated to customer units. This includes the unallocated income from Capital Markets, Transaction Products and International Units. It also includes the additional liquidity premium for the funding cost of long-term lending and deposits in Wholesale Banking. Optimisation of the business takes place in the relevant customer and product units.
Business Areas Wholesale Banking

Nordea Annual Report 2014 25
Wealth Management provides high quality investment, savings and risk management products. It manages customers’ assets and gives financial advice to affluent and high net worth individuals as well as institutional investors.
The area consists of the businesses: Private Banking serving customers from 80 branches in the Nordics as well as from offices in Luxembourg, Zürich and Singapore; Asset Manage-ment responsible for actively managed investment funds and mandates and for serving institutional asset manage-ment customers; Life & Pensions serv-ing customers with a full range of pen-sion, endowment and risk products. Additionally, the area consists of the service units Savings & Wealth Offer-ings and Strategy, Support & Control.
Wealth Management is the largest Nordic private bank, life & pensions provider and asset manager. Wealth Management has approximately 3,500 employees, approximately 500 of whom are employed outside the Nor-dic region, primarily in Europe.
StrategyIt is our vision to become the leading Wealth Manager in each Nordic mar-ket, with global reach and global capabilities. To reach this position we are continuously ensuring that our business model provides our custom-ers with high-quality advice, a high
standard of service and a broad and deep offering of high-quality prod-ucts through a cost and capital-effi-cient value chain. Throughout 2014 Wealth Management has continued the work focusing on the three stra-tegic priorities, communicated and presented at Nordea’s Capital Mar-kets Day in 2013:
To enhance our value propositions, we have introduced a state of the art financial planning tool for advisory sessions in Retail and Private Bank-ing. Additionally we have strength-ened our online and mobile savings value proposition for retail customers.
To capitalise on growth momen-tum, and grow at low costs, we have increased the share of highly cost- efficient and profitable bancassurance in Retail Banking through realloca-tion of resources to enable low-cost profitable growth in existing busi-ness. We have continued to focus on attracting more profitable institu-tional volumes and to attract clients with higher assets in Private Banking.
As part of our continued focused prioritisation, we have divested our Life portfolio in Luxembourg and in the Isle of Man.
responsible for 3rd-party distribution
Wealth Management Business Areas
Business Area Wealth Management
Key figures 2013 2014
262.2232.1
C/I %
465226 32
RaRoCaR %
AuM EURbn
2014 performance and strategic direction Throughout 2014 Nordea Wealth Management consolidated the position as the largest wealth manager in the Nordics
Passed the EUR 250bn milestone in Assets under Management
Solid income growth of 11% to EUR 1,693m, with a strong profit growth of 24%
Record-high net flow of EUR 18.6bn
Transformed Life & Pensions into a capital-light Life company. More than half of assets and 87% of premiums 2014, are in capital-light products
Increased share of Bancassurance utilising scale advantages through the Nordea distribution network
Focus kept on prioritised business units and divestments of non-prioritised business completed
Attractive offerings supported increasing market shares in highly competitive and prioritised markets

Nordea Annual Report 201426
of Nordea funds, primarily covering non-Nordic customers, demonstrates well the progress towards our vision to have global reach and global capa-bilities. Global Fund Distribution has throughout 2014 achieved record-high net flows of EUR 4.8bn demonstrating the high quality of our offerings.
Business developmentNordea’s Assets under Management (AuM) increased to EUR 262.2bn, up EUR 30.1bn or 13% from 2013. The increase in AuM was due to net flow of EUR 18.6bn and market apprecia-tion of EUR 11.5bn. 2014 ended with AuM at another all-time high.
All businesses contributed posi-tively to the net flow.
Customers’ interest in investing in discretionary management solutions continued to increase in 2014. In the prevailing low interest rate environ-ment, it is difficult to achieve a satis-factory investment return without taking too much risk. The discretion-ary solutions allow customers to ben-efit from Nordea’s investment process in which risk levels are closely man-aged to match future possible returns with client expectations and risk pro-files.
The number of Private Banking customers increased to 109,500 by the end of 2014. A continued strong focus is held on customer acquisition as well as aligning the Private Banking service and advisory model with the needs of the customers and the regu-latory changes in the market.
As a step towards further improving
customer satisfaction, Private Banking has during 2014 taken a focused approach to take the quality of cus-tomer meetings to the next level. Net inflow in Private Banking amounted to EUR 3.9bn, mainly due to flow from newly acquired customers.
In 2014, Nordea Private Banking was recognised for this continued work, when Nordea was awarded “Best Pri-vate Bank in the Nordics” by the global financial magazine The Banker, part of the Financial Times Group.
Throughout 2014, Asset Manage-ment has maintained its strong momentum in sales and revenues in all client segments. Net flows into the Nordic retail funds across all four Nor-dic countries were EUR 4.9bn in 2014.
Net flow from Institutional Clients and Global Fund Distribution was EUR 2.9bn and EUR 4.8bn respec-tively. The institutional segment had positive net flows with especially high value of the flow in Germany and Norway and the strong develop-ment in value of AuM continued. Global Fund Distribution too contin-ued the strong growth, and achieved record-high net flows of EUR 4.8bn in 2014. The net flow was well diver-sified in terms of products with Multi-Asset solutions continuing to attracting the highest net flows. The growth remained strong across all countries of distribution during 2014, with a noticeable strong development in continental Europe.
During 2014 Nordea has drawn benefits from new EU legislations that enable a fund company to man-age and market funds across borders and merged Nordea’s four Nordic fund companies into one Nordic fund
company, domiciled in Finland with branches in Sweden, Norway and Denmark.
Investment performance was satis-factory in 2014 with 62% of compos-ites outperforming benchmarks. The 3-year performance is strong with 72% of all composites outperforming benchmarks.
Life & Pensions’ gross written pre-miums continued to exceed the record levels reported in 2013, reach-ing EUR 7,601m in 2014 which is 14% higher than 2013.
The market return product driven sales momentum in the Nordea Bank channel continued to fuel new busi-ness sales. The Nordea distribution network continued to generate two-thirds of total sales during 2014. Mar-ket return products continued to sup-port the growth in AuM and amounted at the end of the year to 52% of total AuM in Life & Pensions.
ResultTotal income was EUR 1,693m in 2014, up 11% from last year. The increase from 2013 is mainly due to double digit increase in income in Life & Pen-sions and Asset Management.
Costs have decreased 2% compared to the previous year as a consequence of successful cost management. Due to increased income and lower costs, operating profit was EUR 903m, up 24% from 2013.
Private BankingTotal income was EUR 542m in 2014, a 3% increase compared to 2013, and the strongest year yet for the Private Banking business. The increased income level was supported by higher
Business Areas Wealth Management

Nordea Annual Report 2014 27
“ The vision is to be acknowledged as the leading Wealth Manager in all Nordic markets with global reach and global capabilities”
“The vision of Wealth Management is to be acknowledged as the leading Wealth Manager in all Nordic markets with global reach and global capabilities. When we conclude the year 2014, we can say with confidence that we are moving
closer to our vision. It has been a year where we have received record high net flows and passed the EUR 250bn mile-stone. Our Assets under Management ended at EUR 262.2bn, up 13% from last year. We welcomed new Private Banking
customers, we continued the strong growth in international sales while also improving cost and capital efficiency. To sum up, we continue to deliver on our strategy, communicated at Nordea’s Capital Markets Day in 2013.”
Gunn Wærsted is Head of Wealth Management.
recurring income on items such as investment funds and life products income. Combined with a continuous strict cost focus and simplification ini-tiatives, the operating profit was EUR 190m, up 12% compared to 2013.
Asset ManagementTotal income was EUR 598m in 2014, a 17% increase compared to 2013. The increased income level was lifted by increasing AuM, which was sup-ported by both record high net flows and positive market appreciation. In 2014, AuM has increased 19%. Com-pared to 2013, costs were up 1%. The cost/income ratio has improved by 5 %-points to 38%. Operating profit was EUR 373m, up 29% compared to 2013.
Life & PensionsTotal income was EUR 553m in 2014, a 12% increase compared to 2013. Costs were EUR 204m, down 4% compared to full-year 2013 due to efficiency improvements and active business selection. Operating profit was EUR 349m, up 24% compared to 2013.
Wealth Management otherThe area consists of the Wealth Man-agement service operations which are not directly connected to any of the business units. It includes additional liquidity premium for long-term lend-ing and deposits in Wealth Manage-ment and net interest income related thereto.

Nordea Annual Report 201428
Board of Directors’ report
Operating profit +9%1, in local currencies +12%1
Total operating income unchanged1, in local curr. +2%1
Total operating expenses –4%1, in local currencies –1%1
Loan loss ratio 15 basis points (21 basis points last year)Return on equity (ROE) 11.6%1 (last year 11.0%)Common equity tier 1 (CET1) capital ratio 15.7% (last year 13.9%, previously estimated Basel III ratio)Overall credit quality remained solidAssets under Management up 13% to EUR 262bnProposed dividend EUR 0.62 per share (actual dividend last year EUR 0.43 per share)
1 ) Compared with 2013 for continued operations excluding non-recurring items (capi-tal gain from the divestment of the shareholding in Nets Holding A/S of EUR 378m, restructuring costs of EUR 190m and charge for impairment of intangible assets of EUR 344m.
Nordea aims at continuous simplification of its legal struc-ture and as regards the Nordic banks the aim is that Nordea Bank AB (publ) will be converted into a European company. Among other things, a conversion is conditional on Nordea obtaining necessary approvals from the relevant authorities.
The final regulatory responses to the financial crisis are yet to be fully seen, and to be evaluated. Nordea is follow-ing up and analysing the changes in process, which are not expected to be finalised during 2015.
2014 was another year of low growth and low interest rates as these declined further, even reaching negative levels in some areas. The global scene was characterised by mixed developments in economic data and by increased geopolit-ical tensions. The US and UK economies showed continued strong signs with strong GDP growth and US unemploy-ment falling below 6%. In Europe, the improvements were more modest with still low GDP growth.
The Nordic economies showed some growth, and the overall picture still appeared relatively robust. In Sweden and Norway, GDP growth continued to hold up relatively well. Economic growth in Norway is however expected to slow down. The growth in Denmark has remained at lower level, but showed signs of improvement. In Finland, growth was subdued and followed the more mixed picture seen in the Euro area. Unemployment has been largely unchanged in the region.
Total income increased in 2014 by 2% in local currencies (unchanged in EUR) compared to 2013, excluding non-recurring items (capital gain from the divestment of the shareholding in Nets Holding of EUR 378m). Total expenses decreased 1% in local currencies (–4% in EUR)
excluding non-recurring items (restructuring costs of EUR 190m and charge for impairment of intangible assets of EUR 344m) and are in line with the cost-efficiency pro-gramme. Net loan losses decreased from last year to a level of 15 basis points of loans. Operating profit was up 12% in local currencies excluding non-recurring items (+9% in EUR).
The result comments relate to the continuing operations, excluding the Polish operations which, in the reporting, are separated as discontinued operations.
IncomeNet interest income increased 2% in local currencies com-pared to 2013 (–1% in EUR). Lending volumes increased 4% in local currencies excluding reverse repurchase agree-ments. Corporate and household lending margins were higher, while deposit margins overall were down from one year ago. Net interest margin, the average net interest income on lending and deposits, was 1.08%, largely unchanged from last year (1.07%).
Net fee and commission income increased 10% in local currencies (+8% in EUR), mainly due to strong commission income from savings and investments as well as higher lending commissions.
Net result from items at fair value decreased by 6% in local currencies (–7% in EUR) compared to last year, fol-lowing lower customer activity.
Income under the equity method was EUR 18m (EUR 79m) and other income was EUR 79m (EUR 106m) exclud-ing the gain from the divestment of the shareholding in Nets Holding of EUR 378m.
ExpensesTotal expenses were down 1% in local currencies (–4% in EUR) compared to 2013 excluding impairment charge and restruc-turing costs. Staff costs were up 3% in local currencies exclud-ing restructuring costs (largely unchanged in EUR). Other expenses were down 8% in local currencies excluding restruc-turing costs (–11% in EUR). Restructuring cost related to the cost efficiency programme amounted to EUR 190m (see also Note G7). Depreciations were EUR 582m including a charge for impairment of intangible assets of EUR 344m, following the decision to replace some of the current IT systems.
Net loan lossesNet loan loss provisions decreased 26% in local currencies to EUR 534m (–27% in EUR), corresponding to a loan loss ratio of 15 basis points (21 basis points last year). The loan loss ratio was somewhat below the average loan loss ratio.
TaxesThe effective tax rate in 2014 was 22.0% (including the bank tax in Finland of EUR 60m), compared to 24.5% last year. The 2014 effective tax rate was affected by the non-taxable gain from the divestment of the shareholding in Nets Holding A/S of EUR 378m.
Net profit and Return on equity (ROE)Net profit increased 9% in local currencies (+7% in EUR) to EUR 3,332m, due to somewhat higher income and lower expenses and net loan losses compared to last year.
Return on equity (ROE) was 11.6% excluding non-recur-
2013 2014
C/I %
5111.0
15549
11.6
145
ROE %
REA EURbn
*) Excluding non-recurring income and cost items in 2014, see footnote ¹) above.

Nordea Annual Report 2014 29
Board of Directors’ report
ring items and 11.5% including these (last year 11.0%).
Market Consistent Embedded Value (MCEV)The MCEV increased 1.2% to EUR 4,758m (EUR 4,700m). The value of new business was EUR 248m.
Financial structureTotal assets increased by 6% or EUR 39bn to EUR 669bn in 2014. Total liabilities increased by 6% or EUR 38bn to EUR 640bn. All balance sheet items in foreign currencies are translated to EUR at the year-end rates when consolidated into the Nordea Group. See Note G1 for more information on accounting policies and section 27 therein for cross-cur-rency rates used.
The euro strengthened against the Swedish and Norwe-gian krona and against the Russian Rubel in 2014. It was largely unchanged against the Danish krona. The effect of changes in currency exchange rates amounted to a total decrease in the Group’s assets of EUR 13bn. Liabilities decreased by EUR 12bn.
LoansThe total lending increased EUR 2bn or 1% compared with previous year.
SecuritiesInvestments in interest-bearing securities and shares increased by EUR 6bn (5%) compared with previous year.
Deposits and funding activitiesDeposits and borrowings decreased by EUR 6bn or 2% to EUR 254bn, while debt securities in issue increased by EUR 9bn or 5%. Total debt securities in issue as per the end of 2014 amounted to EUR 194bn. In 2014, long-term issu-ance under Nordea funding programmes amounted to EUR 22bn, excluding Danish covered bonds (EUR 23bn).
Life insurance activitiesNet premiums received in the Life business are invested in interest-bearing securities, shares and properties. Increases of fair values on these investments as well as higher premiums written led to an increase in “liabilities to policyholders” of EUR 5bn or 10%.
DerivativesThe balance sheet items “Derivatives” reflect the net pre-sent value of derivative contracts split on positive and neg-ative fair values. Positive market values of derivatives increased from EUR 71bn to EUR 105bn and negative mar-kets values increased from EUR 66bn to EUR 97bn. The reason for this was steep decreases in the long-term inter-est rates during 2014. The derivatives volume, in nominal terms, was largely unchanged. For more information, see Notes G1 and G17.
Financial targetNordea has return on equity (ROE) target of 13% at the required common equity tier 1 (CET1) capital ratio, taking prevailing low interest rates into account.
Capital position and capital policyThe Group’s common equity tier 1 (CET1) capital ratio,
excluding Basel I floor, increased to 15.7% at the end of 2014, a strengthening of 1.8%-points from the estimated Basel III ratio at the end of last year. The total capital ratio excluding Basel I floor increased to 20.7%. Improved capi-tal ratios were achieved by strong profit generation and a decrease in risk exposure amounts (REA). In September 2014, Nordea issued a CRDIV-compliant Additional Tier 1 instrument, which strengthened the Tier 1 ratio by 75 basis points.
The current capital policy states that Nordea Group should have a target minimum of 13% in CET1 and 17% in total capital ratio. The most recent review, performed in the fourth quarter of 2014 leaves the capital targets unchanged as there are still uncertainties with respect to the Swedish FSA’s view on standardised models to be used by the banks for calculating the size of the pillar II add-on, as well as other ongoing regulatory uncertainties such as the replacement of the current capital floor. The capital policy will be revised once the regulatory regime is further clarified. However, Nordea s current view is that the bank should operate with a CET1 ratio of approximately 15%, including a management buffer, although there is still some regulatory uncertainty.
Nordea’s dividend ambition is to increase the dividend payout ratio in 2014 and 2015, while maintaining a strong capital base.
A description of the Capital position is presented under Capital management on page 45 and in Note G38.
Credit portfolioLoans to the public excluding reverse repurchase agree-ments increased by 4% in local currencies to EUR 304bn (unchanged in EUR). The share of lending to corporate cus-tomers was 54%. Lending to shipping, offshore and oil ser-vices constituted 2.9% of the Group’s total lending and lend-ing to companies owned by private equity funds was less than 3% of total lending, of which 99% are senior loans.
The overall credit quality is solid with strongly rated customers and a positive effect from rating migration on total in the portfolio. The total effect of improved credit quality on REA was a decrease of approx. 2.0% in 2014.
Impaired loans gross in the Group were down to EUR 6,425m at the end of the year compared to last year (EUR 6,564m). 64% of impaired loans gross are performing and 36% are non-performing.
Further information about the credit portfolio is presented under Risk management on page 36, in Note G47 and in the Capital and Risk Management Report 2014 published on the web pages.
Divestment of the Polish banking, life and financing businesses completed The sale of Nordea Bank Polska S.A. was completed on 1 April 2014, following that the Polish Financial Supervision Authority (PFSA) on 3 March 2014 issued a decision stating that there were no grounds for objections to the acquisition as announced on 12 June 2013 by PKO Bank Polski S.A. of the shares of Nordea Bank Polska S.A., which satisfied the last condition precedent for the closing of the transaction. The financial effects of the transaction are as previously communicated.
The Polish operations are in the reporting separated as

Nordea Annual Report 201430
Board of Directors’ report
discontinued operations and included only as one line in net profit.
The Nordea Operations Centre in Lodz and the Polish pension fund company are not affected by the transaction.
Nordea has divested all shares in Nets Holding A/SNordea has divested its 20.7% stake in Nets Holding A/S to a consortium consisting of funds advised by Advent International, ATP and Bain Capital and the sale was com-pleted on 9 July 2014. Nordea’s total proceeds from the divestment were approx. DKK 3.5bn (approx. EUR 470m) leading to a tax-free capital gain of approx. DKK 2.8bn (EUR 378m) that was recognised in Other income.
Nordea’s funding operationsNordea issued approx. EUR 22bn of long-term debt during the year, excluding Danish covered bonds.
Liquidity management is presented on page 43. A matu-rity analysis is presented in Note G45.
Market riskA description of Market risk is presented on pages 41–42.
Hedge accountingNordea uses hedge accounting in order to have a symmet-rical accounting treatment of the changes in fair value of the hedged risks in the hedged items and of the hedging instruments and in order to hedge the exposure to varia-bility in cash flows and net investments in foreign opera-tions. More information on the hedged risks is presented in Note G1.
The Nordea shareAccording to the Articles of Association, shares in Nordea may be issued in two classes, ordinary shares and C-shares. The total number of shares in the Company is 4,049,951,919. All shares are ordinary shares, see also State-ment of changes in equity on page 64 and a table showing the change in share capital is found on page 15. The voting rights are described on page 49. C-shares are not entitled to any dividend.
In addition, there are provisions in the Articles of Asso-ciation which will ensure that the reciprocal rights and obligations between each owner and each class remain in case of any issuance of new shares, warrants or converti-bles. There are no restrictions in law or in the Articles of Association regarding the right to transfer shares and the Company is not aware of any agreements between share-holders in this respect.
However, since Nordea is a credit institution, a direct or indirect acquisition of shares in Nordea, which causes the acquirer’s total holding to comprise a qualified holding (rep-resents 10% or more of the equity capital or of the voting capital) or an increase of qualified holdings, may only take place following consent by the Swedish Financial Supervi-sory Authority according to the Swedish Banking and Financing Business Act.
On 31 December 2014, Sampo plc was the largest individ-ual shareholder with a holding of 21.4% and the only share-holder with a holding of more than 10%. A table showing the largest registered shareholders in Nordea end of 2014 is found on page 14.
On 31 December 2014, the employees had an indirect shareholding of 0.5% in the Company through the Nordea Profit-sharing Foundation and a minor indirect sharehold-
ing in the Company through the pension foundation. The voting rights are in neither case exercised directly by the employees.
Holding of own shares As of 31 December 2014, Nordea held 23,009,458 shares (0.6% of total number of shares) in Nordea, a decrease of 8,778,474 shares compared to 31 December 2013. The quota value is EUR 1 and the acquisition price amounts to EUR 83m. These shares are partly held for trading purposes and partly as hedges of conditional rights in the Long Term Incentive Programmes.
DividendThe Board of Directors proposes to the AGM a dividend of EUR 0.62 per share (EUR 0.43) and further, that the record date for dividend should be 23 March 2015. The dividend corresponds to a payout ratio of 70% of net profit excluding the net effect from the charge for impairment of intangible assets of EUR 344m. Total proposed dividend amounts to EUR 2,501m.
The ex-dividend date for the Nordea share is 20 March 2015. The dividend payments are scheduled to be made on 30 March 2015.
Mandate to acquire and convey own sharesThe Board of Directors proposes that the AGM 2015 should authorise the Board of Directors to decide on acquisition of own shares on a regulated market where the company’s shares are listed, or by means of an acquisition offer directed to all shareholders. The authorisation is limited so that Nordea’s holdings of own shares may not exceed 10% of all shares.
The purpose of acquisition of own shares is to facilitate an adjustment of the company’s capital structure to prevailing capital requirements and to facilitate the use of own shares as payment for or financing of acquisitions of companies and businesses.
The Board further proposes an authorisation to decide on conveyance of own shares, to be used as payment for or financing of acquisitions of companies or businesses. Con-veyance may be made in another way than on a regulated market and with deviation from shareholders’ pre-emptive rights.
The AGM 2014 decided on corresponding authorisations to acquire and convey own shares.
Mandate to issue convertible instrumentsThe Board of Directors proposes that the AGM 2015 should authorise the Board of Directors to decide on issu-ing of convertible instruments, with or without preferen-tial rights for existing shareholders. The authorisation means that the share capital may be increased by maxi-mum 10% of the Company’s share capital. The authorisa-tion may be used on one or several occasions up until the next AGM.
An issue of convertible instruments should be done on market conditions. The purpose of the authorisation is to facilitate a flexible and efficient adjustment of the Compa-ny’s capital structure to the capital requirements.
The AGM 2014 decided on a corresponding authorisation to decide to issue convertible instruments.
RatingRatings of the Nordea Group are presented on page 215.

Nordea Annual Report 2014 31
Board of Directors’ report
PersonnelPersonnel expenses, significant agreements with key man-agement personnel and the distribution by number of employees by country and gender are disclosed in Note G7. More information is presented on the page about Our people on page 16.
Profit sharing and share-based incentive systemsFor 2014, a total of approx. EUR 92m was expensed under Nordea’s ordinary profit-sharing scheme for all employees and the Long-Term Incentive Programmes for managers and key employees (EUR 62m last year).
For 2014, each employee could receive a maximum of EUR 3,200, of which EUR 2,600 was based on RAROCAR and EUR 600 on the level of customer satisfaction.
The Profit Sharing scheme and the share-based incen-tive systems as well as other remuneration principles are presented in the chapter Remuneration on page 55–58 and in Note G7.
Pension liabilities The total pension obligation in defined benefit plans has increased from EUR 3,130m to EUR 3,727m in 2014. The increase is mainly due to re-measurements from changes in financial assumptions, mainly the discount rates, slightly offset by translation differences. Pensions paid have had a decreasing effect offset by new pension rights earned and discounting effects. The fair value of plan assets is EUR 3,229m, fairly unchanged from 2013 (EUR 3,117m). Return on plan assets has had an increasing effect, offset by pen-sion payments and translation differences. The net pension liability amounts to EUR 498m. See Note G32 for more information.
Legal proceedingsWithin the framework of normal business operations, the Group faces a number of claims in civil lawsuits and dis-putes, most of which involve relatively limited amounts. Presently, none of the current disputes are considered likely to have any significant adverse effect on the Group or its financial position.
Further information is presented in Note G36.
Impact on the financial statements and regulatory capital from the assets quality review as of 31 December 2013An Asset Quality Review (AQR) and stress test for banks within the euro area has been performed by the European Central Bank (ECB) and includes the assessment of the Nordea Bank Finland Group. The results confirm Nordea Bank Finland’s strong position with a CET1 capital ratio of 10.4% at the end of the stress test horizon. The main find-ings in the AQR relate to:
--
ings) -
ment EUR 122m
internal transactions)After tax and Nordea Group internal risk protection the
AQR impact on available capital in the Nordea Bank Fin-land Group was negative by EUR 213m, which translated to a 40 basis points negative impact on the CET1 ratio.
Although the AQR shall be considered to be a prudential exercise, an internal assessment has been made on whether any of the findings should impact the financial statements 2014. Following this assessment Nordea has to
provisions in the financial statements in line with the ordi-nary credit process, but not as a direct consequence of the
-
increased in the capital adequacy reporting.
Environmental concerns and corporate social responsibilityNordea is committed to sustainable business and develop-ment by combining financial performance with environ-mental and social responsibility as well as sound govern-ance practices. Nordea has adopted a Nordea Sustainability policy that spells out the Group’s values and commitments to ethical business. The policy is based on the ten principles of the UN Global Compact, the UN Dec-laration of Human Rights, ILO-conventions and the OECD Guidelines for Multinational Enterprises. The Sustainabil-ity Policy has a specific section on environmental issues providing guidance on how the Group is to manage and control environmental issues in its business activities and its own operations. All employees of Nordea Group, including non-permanent staff working on behalf of Nor-
Nordea policies are supported by a number of specific and concrete policies to ensure compliance with the principles in everyday business. Examples are the human resources poli-cies, the anti-corruption policies and investment and credit policies.
Further information is presented under Corporate Social Responsibility on page 17 and in Nordea s CSR Report avail-able on the web pages.
Foreign branchesThe parent company has foreign branches in Norway, Finland, Denmark, the Baltic countries, Poland and China. On 1 January 2015, the branches in the United Kingdom and Germany were transferred from Nordea Bank Finland to the parent company.
Annual General Meeting 2015The AGM will be held on Thursday 19 March 2015 in Stockholm. Further information is presented on the last page of the Annual Report.

Nordea Annual Report 201432
Board of Directors’ report
Business area results
Retail Banking, operating profit by market
Total Banking Denmark
Banking Finland
Banking Norway
Banking Sweden
Banking Baltic
countries
Retail Banking
other
EURm 2014 2013 2014 2013 2014 2013 2014 2013 2014 2013 2014 2013 2014 2013
Net interest income 3,817 3,808 1,231 1,252 751 665 768 802 1,012 1,053 144 130 –89 –94Net fee and commission income 1,099 1,030 181 116 370 354 173 168 377 371 39 40 –41 –19
Net result on items at fair value 381 362 96 107 102 84 69 77 128 102 –10 –4 –4 –4Equity method 5 3 5 3 0 0 0 0 0 0 0 0 0 0Other operating income 30 75 –3 7 3 14 0 6 2 13 2 0 26 35Total operating income 5,332 5,278 1,510 1,485 1,226 1,117 1,010 1,053 1,519 1,539 175 166 –108 –82
Staff costs –1,345 –1,361 –298 –301 –227 –228 –147 –157 –282 –290 –24 –23 –367 –362Other expenses and depr. –1,496 –1,599 –519 –521 –418 –420 –295 –312 –526 –596 –62 –63 324 313Total operating expenses –2,841 –2,960 –817 –822 –645 –648 –442 –469 –808 –886 –86 –86 –43 –49Profit before loan losses 2,491 2318 693 663 581 469 568 584 711 653 89 80 –151 –131
Net loan losses –431 –477 –222 –310 –72 –57 –54 –22 –10 –53 –61 –22 –12 –13Operating profit 2,060 1,841 471 353 509 412 514 562 701 600 28 58 –163 –144
Cost/income ratio, % 53 56 54 55 53 58 44 45 53 58 49 52 — —RAROCAR, % 14 13 12 12 20 16 16 14 17 16 7 5 — —
Other information, EURbnLending to corporates 81.0 81.7 22.4 21.9 15.4 14.6 18.9 19.1 19.2 20.6 5.2 5.4 — —Household mortgage lending 125.6 124.6 32.0 31.6 27.4 26.9 24.0 24.4 39.7 39.1 2.6 2.6 — —Consumer lending 24.1 24.7 11.8 12.0 6.4 6.3 0.6 0.7 4.8 5.4 0.3 0.3 — —Corporate deposits 44.9 45.1 9.1 9.1 10.2 9.7 9.9 10.4 12.7 13.2 3.0 2.8 — —Household deposits 73.4 74.9 23.8 23.5 20.8 21.6 8.0 7.9 19.6 20.9 1.2 0.9 — —
Total
Corporate & Institutional
Banking (CIB)
Shipping, Off-shore & Oil
ServicesBanking Russia
Wholesale Banking other (including Capital Markets
unallocated)
EURm 2014 2013 2014 2013 2014 2013 2014 2013 2014 2013
Net interest income 1,126 1,112 682 688 266 266 254 233 –76 –75Net fee and commission income 626 568 568 533 68 53 13 12 –23 –30Net result on items at fair value 693 934 263 304 34 32 6 12 390 586Equity method 0 0 0 0 0 0 0 0 0 0Other operating income 4 4 0 0 0 0 1 0 3 4Total operating income 2,449 2,618 1,513 1,525 368 351 274 257 294 485
Staff costs –768 –783 –46 –38 –21 –24 –59 –68 –642 –653Other expenses and depr. –77 –114 –368 –386 –42 –40 –35 –38 368 350Total operating expenses –845 –897 –414 –424 –63 –64 –94 –106 –274 –303Profit before loan losses 1,604 1,721 1,099 1,101 305 287 180 151 20 182Net loan losses –98 –252 –122 –173 37 –95 –15 7 2 9Operating profit 1,506 1,469 977 928 342 192 165 158 22 191
Cost/income ratio, % 35 34 27 28 17 18 34 41 — —RAROCAR, % 14 14 18 15 18 14 28 23 — —
Other information, EURbn
Lending to corporates 100.8 96.1 38.5 38.7 11.6 11.4 5.9 5.8 44.8 40.2Lending to households 0.3 0.5 — — — — 0.3 0.5 — —Corporate deposits 66.0 66.5 36.4 33.6 4.7 4.3 0.6 1.7 24.3 26.9Household deposits 0.1 0.2 — — — — 0.1 0.2 — —
Wholesale Banking, operating profit by unit

Nordea Annual Report 2014 33
Board of Directors’ report
Group Corporate Centre, operating profitEURm 2014 2013
Net interest income 279 340Net fee and commission income –11 –8Net result on items at fair value 84 69Equity method –1 –2Other operating income 11 18Total operating income 362 417Total operating expenses –273 –276Operating profit 89 141
Wealth Management, operating profit by unit
Total Asset
Management
Private Banking Life & Pensions Wealth
Management other
EURm 2014 2013 2014 2013 2014 2013 2014 2013 2014 2013
Net interest income 142 120 0 0 141 121 0 0 1 –1Net fee and commission income 1,167 1,090 590 502 304 321 273 266 0 1Net result on items at fair value 358 293 6 0 92 81 261 212 –1 0Equity method 0 0 0 0 0 0 0 0 0 0Other operating income 26 29 2 11 5 2 19 17 0 –1Total operating income 1,693 1,532 598 513 542 525 553 495 0 –1Staff costs –492 –480 –120 –115 –172 –169 –121 –124 –79 –72Other expenses and depr. –295 –320 –105 –108 –177 –183 –83 –89 70 60Total operating expenses –787 –800 –225 –223 –349 –352 –204 –213 –9 –12Profit before loan losses 906 732 373 290 193 173 349 282 –9 –13Net loan losses –3 –3 0 0 –3 –3 0 0 0 0Operating profit 903 729 373 290 190 170 349 282 –9 –13Cost/income ratio, % 46 52 38 43 64 67 37 43 — —RAROCAR, % 32 26 — — 35 33 17 13 — —Other information, EURbn
Lending to households 9.0 8.5 — — 9.0 8.5 — — — —Deposits from the public 11.0 11.1 — — 11.0 11.1 — — — —
Life & Pensions, profit driversEURm 2014 2013
Profit driversProfit Traditional products 124 78Profit Market Return products 174 133Profit Risk products 63 64Total product result 361 275Return on shareholders’ equity, other profits and group adjustments –12 7Operating profit 349 282
MCEV composition of Nordea Life & PensionsEURm 2014 2013
Denmark 1,160 1,321Finland 1,815 1,647Norway 1,102 1,041Sweden 595 602Poland 86 89
Total 4,758 4,700
Value of new business
Traditional business (APE) 0 11
Unit–linked (APE) 242 240
Risk products 6 4
New business margin
Traditional business 0% 16%
Unit–linked 40% 40%
Risk products 21% 16%

Nordea Annual Report 201434
Board of Directors’ report
Total Nordea Group and Business Areas
Retail Banking
Wholesale Banking
Wealth Management
Group Corporate Centre
Group Functions, Other and
Eliminations Nordea Group
EURm 2014 2013 2014 2013 2014 2013 2014 2013 2014 2013 2014 2013
Net interest income 3,817 3,808 1,126 1,112 142 120 279 340 118 145 5,482 5,525Net fee and commission income 1,099 1,030 626 568 1,167 1,090 –11 –8 –39 –38 2,842 2,642
Net result on items at fair value 381 362 693 934 358 293 84 69 –91 –119 1,425 1,539
Equity method 5 3 0 0 0 0 –1 –2 14 78 18 79Other operating income 30 75 4 4 26 29 11 18 386 –20 457 106Total operating income 5,332 5,278 2,449 2,618 1,693 1,532 362 417 388 46 10,224 9,891
Staff costs –1,345 –1,361 –768 –783 –492 –480 –270 –233 –274 –121 –3,149 –2,978Other expenses –1,399 –1,496 –48 –79 –291 –313 46 –1 57 54 –1,635 –1,835Depreciations –97 –103 –29 –35 –4 –7 –49 –42 –403 –40 –582 –227Total operating expenses –2,841 –2,960 –845 –897 –787 –800 –273 –276 –620 –107 –5,366 –5,040
Net loan losses –431 –477 –98 –252 –3 –3 0 0 –2 –3 –534 –735Operating profit 2,060 1,841 1,506 1,469 903 729 89 141 –234 –64 4,324 4,116
Cost/income ratio1, % 53 56 35 34 46 52 76 66 — — 49 51RAROCAR, % 14 13 14 14 32 26 — — — — 14 14
Volumes, EURbnLending to corporates 81.0 81.7 100.8 96.1 — — — — 7.3 6.4 189.1 184.2Household mortgage lending 125.6 124.6 0.3 0.5 5.9 5.3 — — — — 131.8 130.4Consumer lending 24.1 24.7 — — 3.1 3.2 — — — — 27.2 27.9Corporate deposits 44.9 45.1 66.0 66.5 — — — — 1.9 2.9 112.8 114.5Household deposits 73.4 74.9 0.1 0.2 11.0 11.1 — — — — 84.5 86.21) Excluding non-recurring items 2014.

Nordea Annual Report 2014 35
Board of Directors’ report
Risk, Liquidity and Capital management
Management of risk, liquidity and capital is a key success factor in the financial services industry.
Maintaining risk awareness in the organisation is ingrained in the business strategies. Nordea has defined clear risk, liquidity and capital management frameworks, including policies and instructions for different risk types, capital adequacy and capital structure.
Management principles and controlBoard of Directors and Board Risk CommitteeThe Board of Directors has the ultimate responsibility for limiting and monitoring the Group’s risk exposure as well as for setting the targets for the capital ratios. Risk is meas-ured and reported according to common principles and policies approved by the Board of Directors, which also decides on policies for credit risk, counterparty credit risk, market risk, liquidity risk, business risk life insurance risk and operational risk management as well as the ICAAP. All policies are reviewed at least annually.
The Board of Directors approves the credit instructions where powers-to-act for all credit committees in the organ-isation are stated. These authorisations vary for different decision-making levels, mainly in terms of the size of lim-its but also depending on the internal risk categorisation of customers. The Board of Directors furthermore decides on the limits for market and liquidity risk in the Group.
The Board Risk Committee assists the Board of Directors in fulfilling its responsibilities in terms of overseeing man-agement and control of risk, risk frameworks as well as controls and processes associated with the Group’s opera-tions.
Responsibility of CEO and GEM The Chief Executive Officer (CEO) has the overall respon-sibility for developing and maintaining effective risk, liquidity and capital management principles and control of the Bank and the Group.
The CEO in Group Executive Management (GEM) decides on the Group’s earnings volatility measurement framework(s) and targets for these, such as the Structural Interest Income Risk (SIIR).
The CEO and GEM regularly review reports on risk exposure and have established a number of committees for risk, liquidity and capital management.
The Asset and Liability Committee (ALCO), chaired by the Chief Financial Officer (CFO), prepares issues of major importance concerning the Group’s financial operations and balance sheet risks as well as capital management either for decision by the CEO in GEM or for recommendation by the CEO in GEM and for decision by the Group Board. The Risk Committee, chaired by the Chief Risk Officer (CRO), oversees the management and control of the
Group’s risks at an aggregate level and evaluates the suf-ficiency of the risk frameworks, controls and processes associated with these risks. Furthermore, the Risk Com-mittee decides, within the scope of resolutions adopted by the Board of Directors, on the allocation of the market risk limits as well as the liquidity risk limits to the risk taking units. The limits are set in accordance with the business strategies and are reviewed at least annually. The heads of the units allocates the respective limits within the unit and may introduce more detailed limits and other risk-mitigating techniques such as stop-loss rules. The Risk Committee has established sub-commit-tees for its work and decision-making within specific risk areas.The Group Executive Management Credit Committee (GEM CC) and Executive Credit Committee (ECC) are chaired by the CRO, while the Group Credit Committee Retail Banking (GCCR) and the Group Credit Committee Wholesale Banking (GCCW) are chaired by the Chief Credit Officer (CCO). These credit committees decide on major credit risk customer limits. Credit risk limits are granted as individual limits for customers or consoli-dated customer groups and as industry limits for certain defined industries.
Responsibility of Group Risk Management and Group Corporate Centre Within the Group, two units, Group Risk Management and Group Corporate Centre, are responsible for risk, capital, liquidity and balance sheet management. Group Risk Management, headed by the CRO, is responsible for the risk management framework and processes. Group Corporate Centre, headed by the CFO, is respon-sible for the capital policy, the composition of the capital base, the capital adequacy framework and for liquidity risk management. Each business area and group func-tion is primarily responsible for managing the risks in its operations within the decided limits and framework, including identification, control and reporting.
Risk appetiteRisk appetite within Nordea is defined as the level and nature of risk that the bank is willing to take in order to pursue the articulated strategy on behalf of shareholders, and is defined by constraints reflecting the views of share-holders, debt holders, regulators and other stakeholders. The Board of Directors is ultimately responsible for the Group's overall risk appetite and for setting principles regarding how risk appetite is managed. The Board Risk Committee assists the Board of Directors in fulfilling these responsibilities by reviewing the development of the risk profile in relation to risk appetite and making recommen-dations regarding changes to the Group’s risk appetite.
Nordea’s risk appetite framework is based on explicit top-down risk appetite statements ensuring the compre-hensive coverage of key risks faced by the Group. These

Nordea Annual Report 201436
Board of Directors’ report
Risk management Credit Risk managementGroup Risk Management is responsible for the credit pro-cess framework and the credit risk management frame-work, consisting of policies, instructions and guidelines for the Group. Group Risk Management is responsible for con-trolling and monitoring the quality of the credit portfolio and the credit process. Each division/unit is primarily responsible for managing the credit risks in its operations within the applicable framework and limits, including identification, control and reporting.
Within the powers to act granted by the Board of Direc-tors, credit risk limits are approved by credit decision mak-ing authorities on different levels in the organisation. The risk categorisation and the exposure of the customer decide at what level the decision will be made. Responsi-bility for a credit risk lies with a customer responsible unit. Customers are assigned a rating or score in accordance with Nordea’s rating and scoring guidelines.
Credit risk definition and identificationCredit risk is defined as the risk of loss if customers fail to fulfil their agreed obligations and that the pledged collat-eral does not cover the existing claims. Credit risk stems mainly from various forms of lending, but also from guar-antees and documentary credits, counterparty credit risk in derivatives contracts, transfer risk attributable to the transfer of money from another country and settlement risk. For monitoring of the distribution of a portfolio, improving the risk management and defining a common strategy towards specific industries there are industry credit principles and industry credit policies in place estab-lishing requirements and caps.
Individual and collective assessment of impairmentThroughout the process of identifying and mitigating credit impairments, Nordea continuously reviews the quality of the credit exposures. Weak and impaired expo-sures are closely and continuously monitored and reviewed at least on a quarterly basis in terms of current performance, business outlook, future debt service capac-ity and the possible need for provisions.
A provision is recognised if there is objective evidence based on loss events and observable data that the custom-er’s future cash flow is weakened to the extent that full repayment is unlikely, collateral included. Exposures with provisions are considered as impaired. The size of the pro-vision is equal to the estimated loss being the difference of the book value of the outstanding exposure and the dis-counted value of the future cash flow, including the value of pledged collateral. Impaired exposures can be either performing or non-performing. Exposures that have been past due more than 90 days are by definition regarded as non-performing, and reported as impaired or not impaired depending on the deemed loss potential.
Forbearance is negotiated terms or restructuring due to borrowers’ financial stress. The intention with granting forbearance for a limited period of time is to ensure full repayment of the outstanding debt. Examples of negoti-ated terms are changes in amortisation profile, repayment schedule, customer margin as well as ease of financial cov-enants. Forbearance is undertaken on a selective and indi-vidual basis and followed by impairment testing. Loan loss
statements collectively define the boundaries for Nordea’s risk-taking activities and will also help identify areas with scope for additional risk-taking. The statements are approved by the Board of Directors, and set the basis for a new risk reporting structure. Moreover, the framework supports management decision processes such as planning and target setting.
The Risk Appetite framework considers key risks rele-vant to Nordea’s business activities and is at an aggregate level represented in terms of credit risk, market risk, oper-ational risk, solvency, compliance/non-negotiable risks and liquidity risk.
The Risk Appetite framework is further presented in the Capital and Risk Management Report.
Monitoring and reporting The “Policy for Internal Control and Risk Management in the Nordea Group” states that the management of risks includes all activities aimed at identifying, measuring, assessing, monitoring and controlling risks as well as meas-ures to limit and mitigate the consequences of the risks. Management of risk is proactive, emphasising training and risk awareness. The Nordea Group maintains a high stand-ard of risk management by means of applying available techniques and methodology to its own needs. The control environment is, among other things, based on the principles for segregation of duties and independence. Monitoring and reporting of risk is conducted on a daily basis for market and liquidity risk and on a monthly and quarterly basis for credit and operational risk.
Risk reporting, including reporting on the development of Risk exposure amount (REA), is regularly made to GEM and the Board of Directors. Group Internal Audit (GIA) makes an independent evaluation of the processes regarding risk and capital management in accordance with the annual audit plan.
Disclosure requirements of the CRR – Capital and Risk Management Report 2014Additional and more detailed information on risk and cap-ital management is presented in the Capital and Risk Man-agement Report 2014, in accordance with the Capital Requirements Regulation (CRR), which is based on the Basel III framework issued by the Basel Committee on Banking Supervision. The report is available at www.nordea.com.
Nordea's Capital and Risk Manage- ment Report 2014, available on www.nordea.com

Nordea Annual Report 2014 37
Board of Directors’ report
and in the Capital and Risk Management Report.In the following section, lending related to the divested
Polish operation is excluded.Nordea’s loans to the public increased by 2% to EUR
348bn during 2014 (EUR 342bn in 2013). It is attributable to an increase of approx. 3% in the corporate portfolio and an increase of 1% in the household portfolio. The lending to the public sector was stable. The overall credit quality is solid with strongly rated customers and a positive effect from rating migration on total in the portfolio. Out of lend-ing to the public, corporate customers accounted for 54% (53%), household customers for 44% (45%) and the public sector for 2% (2%). Lending in the Baltic countries consti-tutes 2.0% (2.4%) and the Shipping and offshore industry 2.9% (3.0%) of the Group’s total lending to the public. Lend-ing to companies owned by private equity funds constitutes less than 3% of total lending, of which 99% are senior loans. Loans to central banks and credit institutions, mainly in the form of inter-bank deposits, decreased to EUR 19bn at the end of 2014 (EUR 22bn).
Loans to corporate customers Loans to corporate customers at the end of 2014 amounted to EUR 188bn (EUR 184bn), up 3%. The sector that increased the most in 2014 was Reverse repurchase agree-ments while Energy (oil, gas, etc.) and Metals and mining materials decreased the most. The concentration of the three largest industries is approximately 20% of total lend-ing. Real estate remains the largest industry in Nordea’s lending portfolio, at EUR 42.2bn (EUR 42.5bn). The real estate portfolio predominantly consists of relatively large and financially strong companies, with 87% (84%) of the lending in rating grades 4- and higher. Approx. 40% of the lending to the real estate industry is to companies manag-ing mainly residential real estate.
Loans to shipping and offshore decreased by 2% to EUR 10.0bn in 2014 (EUR 10.2bn). The portfolio is well diversified by type of vessel, has a focus on large and financially robust industrial players and exhibits strong credit quality, with an
Credit decision-making structure for main operations
Nordea – Board of Directors / Board Risk CommitteePolicy matters/ Monitoring / Guidelines / Risk Appetite
Executive Credit Committee / Group Executive Management Credit Committee
Group Credit Risk Committee Retail Banking Group Credit Risk Committee Wholesale Banking
Local Credit Committee CIB
Credit Committee
Russia
Credit Committee
Shipping and Offshore Serv.
Group Treasury
Credit Committee
Retail Country Credit Committee Denmark, Finland, Norway, Sweden & Baltic countries
Credit Committee
CIB
Credit Com-mittee Interna-tional Banks
and Countries
Local Credit Risk Committee Retail
Local Business Unit
Four-eyes principle
Personal powers to act
provisions are taken if necessary. Forborne customers without impairment charges are fully covered by either collateral and/or the net present value of future cash flows.
In addition to individual impairment testing of all indi-vidually significant customers, collective impairment test-ing is performed for groups of customers that have not been found to be impaired on individual level. The collec-tive impairment is based on the migration of rated and scored customers in the credit portfolio as well as manage-ment judgement. The assessment of collective impairment reacts to up- and down-ratings of customers as well as new customers and customers leaving the portfolio. More-over, customers going to and from default affect the calcu-lation. Collective impairment is assessed quarterly for each legal unit. The rationale for this two-step procedure with both individual and collective assessment is to ensure that all incurred losses are accounted for up to and including each balance sheet day.
Further information on credit risk is presented in Note G47 to the Financial statements.
Credit portfolioCredit risk is measured, monitored and segmented in dif-ferent ways. On-balance lending constitutes the major part of the credit portfolio and the basis for impaired loans and loan losses. Credit risk in lending is measured and pre-sented as the principle amount of on-balance sheet claims, i.e. loans to credit institutions and to the public, and off balance sheet potential claims on customers and counter-parts, net after allowances. Credit risk exposure also includes the risk related to derivative contracts and securi-ties financing.
Including off-balance sheet exposures and exposures related to securities and Life insurance operations, the total credit risk exposure at year end was EUR 598bn (EUR 581bn last year). Total credit exposure according to the CRR defini-tion was at year end after Credit Conversion Factor EUR 488bn (EUR 480bn). See more information and breakdown of exposure according to the CRR definition in Note G47

Nordea Annual Report 201438
Board of Directors’ report
average rating of 4. Nordea is a leading bank to the global shipping and offshore industry with strong brand recogni-tion and a world leading loan syndication franchise. Reflect-ing Nordea’s global customer strategy, there is an even dis-tribution between Nordic and non-Nordic customers.
The distribution of loans to corporates by size of loans shows a high degree of diversification where approx. 73% (71%) of the corporate volume is for loans up to EUR 50m per customer.
Credit risk mitigation is an inherent part of the credit decision process. In every credit decision and review, the valuation of collaterals is considered as well as the ade-quacy of covenants and other risk mitigations.
Pledging of collateral is the main credit risk mitigation technique. In corporate exposures, the main collateral types are real estate mortgages, floating charges and leas-ing objects. Collateral coverage is higher for exposures to financially weaker customers than for those who are financially strong.
Regarding large exposures, syndication of loans is the primary tool for managing concentration risk, while credit risk mitigation by the use of credit default swaps is applied to a limited extent.
Covenants in credit agreements are an important comple-ment to both secured and unsecured exposures. Most expo-sures of substantial size and complexity include appropriate covenants. Financial covenants are designed to react to early warning signs and are carefully monitored.
Loans to household customersIn 2014 lending to household customers increased by 1% to EUR 154bn (EUR 153bn). Mortgage loans increased slightly to EUR 126bn (EUR 125bn) and consumer loans were sta-ble at EUR 28bn. The proportion of mortgage loans of total household loans was unchanged at 82%, of which the Nor-dic market accounted for 98%.
Geographical distributionLending to the public distributed by borrower domicile shows that the customers residing in the Nordic countries, Baltic countries and Russia account for 89% (89%). The portfolio is geographically well diversified with no market accounting for more than 28% of total lending. Other EU countries represent the main part of lending outside the Nordic countries.
At the end of 2014, lending to customers in the Baltic countries was EUR 8.4bn (EUR 8.2bn), and to Russian cus-tomers EUR 4.3bn (EUR 4.5bn).
Rating and scoring distributionOne way of assessing credit quality is through analysis of the distribution across rating grades, for rated corporate customers and institutions, as well as risk grades for scored household and small business customers, ie retail exposures.
The credit quality was slightly improved in the corporate credit portfolio as well as in the scoring portfolio in 2014. 28% of the number of corporate customers migrated upwards (26%) while 21% were down-rated (23%). Exposure-wise, 24% (21%) of the corporate customer exposure migrated upwards while 16% (20%) was down-rated.
84% (82%) of the corporate exposure were rated 4– or higher, with an average rating for this portfolio of 4+. Institu-tions and retail customers on the other hand exhibit a distri-bution that is biased towards the higher rating grades. 91% (92%) of the retail exposures is scored C– or higher, which indicates a probability of default of 1% or lower. Impaired
Credit risk exposure and loans
(excluding cash and balances with central banks and settlement risk exposure)
EURm31 Dec
201431 Dec
2013
To central banks and credit institutions 19,175 22,512
To the public 348,085 342,451– of which corporate 188,290 183,630– of which household 153,985 153,012– of which public sector 5,810 5,809Total loans 367,260 364,963
Off-balance credit exposure1 96,231 99,132Counterparty risk exposure 35,659 20,354Treasury bills and interest-bearing securities2 77,584 75,630
Total credit risk exposure in the banking operations 576,734 560,079Credit risk exposure in the life insurance operations 21,647 21,259Total credit risk exposure including life insurance operations 598,381 581,338
1) Of which for corporate customers approx. 90%.2) Also includes treasury bills and interest-bearing securities pledged as collateral
in repurchase agreements.
Risk grade distribution IRB Retail customersRating distribution IRB Corporate customers
%
20
15
10
4
06+ 6 6– 5+ 5 5– 4+ 4 4– 3+ 3 3– 2+ 2 2– 1+ 1 1–
20132014
%
50
40
30
20
10
0A+ A A– B+ B–B C+ C–C D+ D–D E+ E–E F+ F–F
20132014

Nordea Annual Report 2014 39
Board of Directors’ report
loans are not included in the rating/scoring distributions. The total effect on credit risk exposure amount (REA) from migra-tion was a decrease of approx. 2.0% during the full year 2014.
Impaired loansImpaired loans gross in the Group decreased to EUR 6,425m (EUR 6,564m), corresponding to 174 basis points of total loans (178 bps). 64% of impaired loans gross are per-forming and 36% are non-performing. Impaired loans net, after allowances for individually assessed impaired loans amounted to EUR 4,096m (EUR 4,167m), corresponding to 111 basis points of total loans (113 bps). Allowances for individually assessed loans decreased slightly to EUR 2,329m from EUR 2,397m. Allowances for collectively assessed loans were stable at EUR 420m from EUR 422m. The ratio of individual allowances to cover impaired loans decreased to 36% and total allowances in relation to impaired loans were unchanged at 43%.
The decrease in impaired loans was mainly related to the improved conditions in the shipping industry, where a decrease in impaired loans of EUR 341m was seen in 2014. The industries with the largest increases in impaired loans were Consumer durables in Denmark and Norway, and Paper and forest materials in Finland.
Past due loans 6 days or more to corporate customers that are not considered impaired decreased significantly to EUR
Loans to the public and to credit institutions, by country and industry
2014–12–31, EURm Denmark Finland Norway SwedenBaltic
countries RussiaGroup
2014Group
2013
Energy (oil, gas etc) 2 677 1,132 1,179 123 421 3,534 4,516Metals and mining materials 27 215 158 254 15 209 879 1,554Paper and forest materials 336 737 54 565 68 107 1,866 1,986Other materials (building materials etc.) 543 1,673 399 1,746 233 2,043 6,638 5,172Industrial capital goods 475 820 214 631 14 10 2,163 2,073Industrial commercial services, etc. 5,764 1,452 1,837 2,911 284 43 12,291 12,685Construction and engineering 1,283 781 1,690 666 233 0 4,653 4,333
Shipping and offshore 434 4,139 4,687 696 0 0 9,957 10,195Transportation 589 872 723 950 665 181 3,981 4,444Consumer durables (cars, appliances etc.) 348 470 1,257 624 73 20 2,792 3,008Media and leisure 913 517 546 744 58 3 2,782 2,803Retail trade 3,729 2,176 1,299 2,418 600 34 10,256 10,181Consumer staples (food, agriculture etc.) 8,298 1,236 1,879 456 362 4 12,235 12,333Health care and pharmaceuticals 607 300 121 568 25 0 1,621 1,496Financial institutions 2,892 1,731 591 7,640 232 0 13,085 12,384Real estate 8,670 8,086 9,130 14,340 1,339 673 42,238 42,525IT software, hardware and services 1,003 323 261 298 13 0 1,897 1,676Telecommunication equipment 5 25 0 5 1 0 37 55Telecommunication operators 230 435 116 410 3 53 1,248 1,082Utilities (distribution and productions) 1,549 1,748 847 1,244 439 197 6,023 5,595Other, public and organisations 1,251 1,846 169 98 243 0 3,607 3,820Total excl reverse repurchase agreements 38,948 30,261 27,110 38,441 5,024 3,998 143,782 143,916Reverse repurchase agreements 43,646 862 44,508 39,714Total corporate loans 38,948 73,907 27,972 38,441 5,024 3,998 188,290 183,630Household mortgage loans 29,643 28,386 25,027 39,978 2,578 318 125,931 125,027Household consumer loans 11,248 7,726 1,161 5,871 399 17 28,054 27,985Public sector 1,562 1,214 1,129 1,554 351 0 5,810 5,809
Total loans to the public 81,402 111,233 55,289 85,844 8,353 4,333 348,085 342,451Loans to central banks and credit institutions 6,609 5,337 218 6,204 292 19,175 22,512
Total loans 88,011 116,570 55,506 92,048 8,353 4,625 367,260 364,963
628m (EUR 1,209m), mainly due to improvements in Den-mark, and past due loans to household customers decreased to EUR 1,258m (EUR 1,470m) in 2014.
Impaired loans and ratiosEURm 2014 2013
Impaired loans gross, Group 6,425 6,564–of which performing 4,115 3,909–of which non-performing 2,310 2,655
Impaired loans ratio, basis points 174 178Total allowance ratio, basis points 74 77Provisioning ratio 43% 43%

Nordea Annual Report 201440
Board of Directors’ report
Impaired loans gross and allowances, by country and industry (to the public and to credit institutions)
2014–12–31, EURm Denmark Finland Norway SwedenBaltic
countries Russia Group AllowancesProvisioning
ratio
Energy (oil, gas etc.) 0 2 0 0 0 0 2 5Metals and mining materials 2 33 31 0 0 0 66 35 54%Paper and forest materials 7 100 1 34 0 0 142 48 34%Other materials (building mtrl etc.) 38 191 25 10 17 0 282 150 53%Industrial capital goods 6 88 1 15 0 0 109 63 58%Industrial commercial services etc. 175 143 53 39 0 0 411 187 46%Construction and engineering 129 49 13 8 1 0 201 89 44%Shipping and offshore 86 20 52 22 0 0 180 124 69%Transportation 34 24 4 1 6 0 69 27 39%Consumer durables (cars, appl. etc.) 92 37 48 7 1 10 194 82 42%Media and leisure 52 45 4 2 2 0 104 48 46%Retail trade 254 140 6 29 19 0 448 181 41%Consumer staples (food, agric. etc.) 809 45 5 2 0 0 861 297 35%Health care and pharmaceuticals 20 10 1 1 0 0 32 9 28%Financial institutions 229 49 5 0 0 0 284 179 63%Real estate 419 39 85 29 190 0 761 286 38%IT software, hardware, services 29 56 0 2 0 0 88 37 42%Telecommunication equipment 0 3 0 0 0 0 3 1 50%Telecommunication operators 1 2 86 0 0 0 88 83 94%Utilities (distribution, production) 6 1 2 0 1 0 9 7 85%Other, public and organisations 74 9 0 2 13 0 98 75 77%Total corporate impaired loans 2,463 1,084 421 203 249 10 4,430 2,015 45%
Household mortgage loans 616 168 36 32 108 7 1,000 164 16%Household consumer loans 626 214 21 107 27 0 995 568 57%Public sector 0 0 0 0 0 0 0 0Credit institutions 0 0 0 0 0 0 0 3Total impaired loans gross 3,705 1,467 478 342 384 17 6,425Total allowances 1,395 635 337 171 179 23 2,749Provisioning ratio 38% 43% 70% 50% 47% 134% 43%
Net loan lossesLoan losses decreased 27% to EUR 534m in 2014 from EUR 735m in 2013. This corresponded to a loan loss ratio of 15 basis points (21 basis points). EUR 364m related to corpo-rate customers (EUR 542m), EUR 194m (EUR 193m) to household customers, while loan losses net were positive, EUR 24m, in credit institutions. Within corporates the main provisions were in Consumer staples industry, to Financial companies and in Real estate management industry. The major part of the household losses occurred in Denmark. Shipping, Offshore & Oil Services reported positive net loan losses of EUR 37m in 2014 compared to loan losses of EUR 95m in 2013.
Collective provisions were EUR 4m compared to provi-sions of EUR 41m in 2013.
Net loan losses and loan loss ratiosBasis points of loans 2014 2013
Net loan losses, EURm -534 -735Loan loss ratio, Group 15 21
of which individual 15 20of which collective 0 1
Loan loss ratio, Retail Banking 19 21Loan loss ratio, Corporate & Institutional Banking 32 45Loan loss ratio, Shipping, Offshore & Oil Services pos1 83Loan loss ratio, Baltic countries 75 27Loan loss ratio, Banking Russia 24 pos1
1) Positive net loan losses, ie net reversals.
Counterparty credit riskCounterparty credit risk is the risk that Nordea’s counter-part in an FX, interest, commodity, equity or credit deriva-tive contract defaults prior to maturity of the contract and that Nordea at that time has a claim on the counterpart. Counterparty credit risk can also exist in repurchasing agreements and other securities financing transactions. The exposure at the end of December 2014 was EUR 35.7bn (EUR 20.4bn in 2013), of which the current exposure net (after close-out netting and collateral reduction) represents EUR 15.5bn. 52% of the exposure and 30% of the current

Nordea Annual Report 2014 41
Board of Directors’ report
exposure net was towards financial institutions. For information about financial instruments subject to
master netting agreement, se note G41.
Market riskMarket risk is defined as the risk of loss in Nordea’s hold-ings and transactions as a result of changes in market rates and parameters that affect the market value, for example changes to interest rates, credit spreads, FX rates, equity prices, commodity prices and option volatilities.
Nordea Markets, Group Treasury and Group Asset and Liability Management are the key contributors to market risk in the Nordea Group. Nordea Markets is responsible for the customer-driven trading activities, Group Treasury is responsible for funding activities and investments for Nordea’s own account, and Group Asset and Liability Management is responsible for asset and liability manage-ment, liquidity portfolios and pledge/collateral account portfolios. For all other banking activities, market risks are managed by Group Treasury and Group Asset and Liabil-ity Management.
Structural FX risk arises from investments in subsidiar-ies and associated enterprises denominated in foreign cur-rencies. Generally, Nordea hedges investments by matched funding, although exceptions may be made in markets where matched funding is impossible to obtain, or can be obtained only at an excessive cost.
Earnings and cost streams generated in foreign curren-cies or from foreign branches generate an FX exposure, which for the individual Nordea companies is handled in each company’s FX position. Currency translation differ-ences in the Group’s equity are generally the difference of equity and goodwill in foreign currency less net invest-ment hedges and tax.
In addition to the immediate change in the market value of Nordea’s assets and liabilities that could be caused by a change in financial market variables, a change in interest rates could also affect the net interest income over time. This is structural interest income risk (SIIR) which is dis-cussed further below.
Market risk on Nordea’s account also arises from the Nordea-sponsored defined benefit pension plans for employees (pension risk) and from the investment of poli-cyholders’ money with guaranteed minimum yields in Life & Pensions.
Measurement of market risk Nordea calculates value-at-risk (VaR) using historical sim-ulation. The current portfolio is revaluated using the daily changes in market prices and parameters observed during the last 500 trading days, thus generating a distribution of
499 returns based on empirical data. From this distribu-tion, the expected shortfall method is used to calculate a VaR figure, meaning that the VaR figure is based on the average of the worst outcomes from the distribution. The 1-day VaR figure is subsequently scaled to a 10-day figure. The 10-day VaR figure is used to limit and measure mar-ket risk both in the trading book and in the banking book.
Separate VaR figures are calculated for interest rate, credit spread, foreign exchange rate and equity risks. The total VaR includes all these risk categories and allows for diversi-fication among them. The VaR figures include both linear positions and options. The model has been calibrated to generate a 99% VaR figure. This means that the 10-day VaR figure can be interpreted as the loss that will be exceeded in one out of a hundred 10-day trading periods.
It is important to note that while every effort is made to make the VaR model as realistic as possible, all VaR models are based on assumptions and approximations that have significant effect on the risk figures produced. While his-torical simulation has the advantage of not being depend-ent on a specific assumption regarding the distribution of returns, it should be noted that the historical observations of the market variables that are used as input may not give an adequate description of the behaviour of these variables in the future. The choice of the time period used is also important. While using a longer time period may enhance the model’s predictive properties and lead to reduced cycli-cality, using a shorter time period increases the model’s responsiveness to sudden changes in the volatility of finan-cial markets. Nordea’s choice to use the last 500 days of historical data has thus been made with the aim to strike a balance between the pros and cons from using longer or shorter time series in the calculation of VaR.
Market risk analysisThe consolidated market risk for Nordea, presented in the table above, includes both the trading book and the bank-ing book. The total VaR was EUR 43m at the end of 2014 (EUR 148m at the end of 2013). The decrease in total VaR over the year is mainly related to the decrease in interest rate VaR which is a reflection of changed positions and a decreased interest rate level. Interest rate VaR was EUR 37m (EUR 153m), whereof half is driven by USD and EUR exposures. Commodity risk was at an insignificant level.
The fair value of the portfolio of illiquid alternative investments was EUR 448m at the end of 2014 (EUR 497m at the end of 2013), of which private equity funds EUR 190m, hedge funds EUR 134m, credit funds EUR 112m and seed-money investments EUR 12m. All four types of invest-ments are spread over a number of funds.
Consolidated market risk figures, VaR1
EURm Measure 31 Dec 2014 2014 high 2014 low 2014 avg 31 Dec 2013
Total risk VaR 43.0 131.9 31.1 62.4 148.0 – Interest rate risk VaR 37.1 138.8 33.1 67.0 153.3 – Equity risk VaR 10.1 11.2 3.2 6.2 5.6 – Credit spread risk VaR 13.0 30.6 4.1 12.9 17.5 – Foreign exchange risk VaR 6.8 22.9 3.4 13.5 7.4 Diversification effect VaR 36% 51% 20% 38% 20%1) For a description of Nordea’s VaR model, see ”Measurement of market risk” below.

Nordea Annual Report 201442
Board of Directors’ report
Foreign exchange rate positions in FX VaR1 EURm 2014 2013
DKK 778.8 643.5SEK 125.1 –87.0USD 100.8 80.0CHF -32.3 –60.7
LVL -31.9 -10.8LTL 21.3 26.1
Other2 -1.7 159.5
1) The disclosed FX positions relate to positions in financial instruments in the banking book and trading book. Financial derivatives are included with their delta equivalent. Structural FX risk e.g. related to investments in subsidiaries and associated companies or related to earnings and cost streams denominated in foreign currencies, are not included.
2) Aggregate net position for foreign exchange positions with an individ-ual absolute value below EUR 20m.
Structural Interest Income Risk (SIIR)SIIR is the amount by which Nordea’s accumulated net interest income would change during the next 12 months if all interest rates were to change by one percentage point.
SIIR reflects the mismatches in the balance sheet items and the off-balance sheet items when the interest rate repricing periods, volumes or the reference rates of assets, liabilities and derivatives do not correspond exactly.
Nordea’s SIIR management is based on policy statements resulting in different SIIR measures and organisational proce-dures. Policy statements focus on optimising financial struc-ture, balanced risk taking and reliable earnings growth, iden-tification of all significant sources of SIIR, measurement under stressful market conditions and adequate public information.
Group Corporate Centre has the responsibility for the operational management of SIIR.
SIIR measurement methodsNordea’s SIIR is measured through dynamic simulations by calculating several net interest income scenarios and comparing the difference between these scenarios. Several interest rate scenarios are applied, but the basic measures for SIIR are the two scenarios (increasing rates and decreasing rates). These scenarios measure the effect on Nordea’s net interest income for a 12 month period of a one percentage point change in all interest rates. The balance sheet is assumed to be constant over time, however main elements of customer behaviour and Nordea’s decision-making process concerning Nordea’s own rates are taken into account.
SIIR analysisAt the end of the year, the SIIR for increasing market rates was EUR 384m (EUR 409m) and the SIIR for decreasing market rates was EUR –160m (EUR –466m) These figures imply that net interest income would increase if interest rates rise and decrease if interest rates fall.
Operational riskOperational risk is defined as the risk of direct or indirect loss, or damaged reputation, resulting from inadequate or failed internal processes, from people and systems, or from external events. Operational risk includes legal risk and compliance risk, which is the risk of business not being conducted according to obligations pursuant to laws, stat-utes and other regulations applicable to the operations subject to authorisation, and internal rules thereby jeop-
ardizing customers’ best interest, other stakeholders trust and increasing the risk of regulatory sanctions, financial loss or damage to the reputation and confidence. Opera-tional risk is inherent in all activities within the organisa-tion, in outsourced activities and in all interactions with external parties.
Managing operational risk is part of the management’s responsibilities. The operational risks are monitored through regular risk assessment procedures and a system-atic, quality and risk focused management of changes. Development of new products, services, activities as well as processes and systems shall be risk assessed. Identified risk elements and consequences of risk events are miti-gated with, inter alia, up to date Business Continuity Plans as well as Group Crisis Management and Communication plans ensuring a good contingency preparedness in all business plans and crisis management structures. External risk transfer is used in the form of insurance, including reinsurance, to cover certain aspects of crime risk and pro-fessional liability, including the liability of directors and officers. Nordea furthermore uses insurance for travel, property and general liability purposes.
The key principle for the management of Operational risks is the three lines of defence. The first line of defence is represented by the Business Areas and Group Functions who are responsible for their own daily risk management and for operating their business within limits for risk expo-sure and in accordance with decided framework for internal control and risk management at first line of defence. The control functions Group Operational Risk, in Group Risk Management, and Group Compliance are in the second line of defence responsible for activities such as independently monitoring, controlling and reporting of issues related to key risks, including compliance with internal and external regulations. Group Internal Audit performs audits and pro-vides assurance to stakeholders on internal controls and risk management processes in third line of defence.
The key process for management of operational risks is the annual Operational Risk Assessment process. The pro-cess includes the risk and control self-assessment (RCSA) and the scenario analysis, and puts focus on both the risks on a divisional and unit level threatening its daily activi-ties and the risks which could cause extreme financial losses or other significant impacts to Nordea as well as ensuring fulfilment of requirements specified in Group directives. The risks are identified both through top-down and through bottom-up analysis of results obtained from control questions as well as existing information from pro-cesses, such as incident reporting, scenario analysis, qual-ity and risk analyses as well as product approvals. The timing of this process is synchronised with the annual planning process to be able to ensure adequate input to the Group’s overall prioritisations.
With the sanction imposed by the Swedish FSA on Nor-dea in 2013, Nordea has continued and further increased its efforts to ensure compliance in the areas of anti-money laundering, counter-terrorist financing, and sanctions management during 2014. A large part of the focus has been on obtaining full KYC information on existing cus-tomers, where major progress has been made in all Busi-ness Areas. Though, given the complexity of the issues both from a regulatory perspective and an organisational perspective, the work to complete this will continue during 2015 and 2016, primarily in Retail Banking where most of

Nordea Annual Report 2014 43
Board of Directors’ report
the customers are located. In addition, new processes for making sure the proper KYC is in place for new customers have been rolled out along with training related to KYC processes and procedures. Furthermore, Nordea has con-tinued to strengthen its automated monitoring of suspi-cious activities as well as expanded its screening of trans-actions against international sanctions lists. The AML area is in focus also from the supervisory authorities. The supervisory authorities, including the Swedish FSA, have during 2014 conducted ongoing investigations with regards to Nordea’s compliance to the AML requirements which for some investigations covers several years. The outcome of the investigations is pending and it cannot be excluded that these investigations could lead to criticism or sanctions.
Life insurance risk and market risks in the Life & Pensions operationsThe Life & Pensions business of Nordea Life & Pensions generally consists of a range of different life & health prod-ucts, from endowments with a duration of a few years to very long term pension savings contracts, with durations of more than 40 years. There is a strategic move away from traditional business, where policyholders are offered guar-anteed investment returns to market return business, where policyholders bear more of the investment risk and benefit from any upside in the return achieved. The two major risks in the life insurance business continue to be market risk and life & health insurance risks.
Market risk arises due to a mismatch between assets and liabilities and the sensitivity of the values of these assets and liabilities to change in the level or in the volatility of market prices or rates. In addition, market risk arises from the investment of the shareholders’ equity. The market risk is mitigated through liability driven investment where appropriate aiming at reducing the asset-liability mis-match, while at the same time creating an investment return enabling Nordea Life & Pensions to meet the guar-antees offered and customer’s expectations.
The life and health insurance risk is the risk of unex-pected losses due to changes in the level, trend or volatility of mortality rates, longevity rates, disability rates, surren-der/lapse risks and selection effects. These risks are primar-ily controlled using actuarial methods, i.e. through tariffs, rules for acceptance of customers, reinsurance contracts, stress tests and setting up adequate provisions for risks.
Liquidity management Key issues during 2014During 2014, Nordea continued to benefit from its focus on prudent liquidity risk management, in terms of maintain-ing a diversified and strong funding base. Nordea had access to all relevant financial markets and was able to actively use all of its funding programmes. Nordea issued approx. EUR 22bn in long-term debt, of which approx. EUR 13bn in the Swedish, Finnish and Norwegian covered bond markets. Swedish FSA introduced Liquidity Cover-age Ratio (LCR) requirement in the beginning of 2013, and Nordea is LCR compliant in all currencies combined and separately in USD and EUR.
Management principles and control Group Corporate Centre is responsible for pursuing the Nordea’s liquidity strategy, managing the liquidity and for compliance with the group-wide limits set by the Board of Directors and the Risk Committee. Furthermore, Group Asset & Liability Management develops the liquidity risk management frameworks, which consist of policies, instructions and guidelines for the Group as well as the principles for pricing liquidity risk.
The Board of Directors defines the liquidity risk appetite by setting limits for applied liquidity risk measures. The most central measure is survival horizon, which defines the risk appetite by setting the minimum survival of one month under institution-specific and market-wide stress scenarios with limited mitigation actions.
Liquidity risk managementLiquidity risk is the risk of being able to meet liquidity commitments only at increased cost or, ultimately, being unable to meet obligations as they fall due. Nordea’s liquidity management and strategy is based on policy statements resulting in various liquidity risk measures, limits and organisational procedures.
Policy statements stipulate that Nordea’s liquidity mana-gement reflects a conservative attitude towards liquidity risk. Nordea strives to diversify its sources of funding and seeks to establish and maintain relationships with investors in order to ensure market access. A broad and diversified funding structure is reflected by the strong presence in the Group’s four domestic markets in the form of a strong and stable retail customer base and the variety of funding pro-grammes. Funding programmes are both short-term (US commercial paper, European commercial paper, commercial paper, Certificates of Deposits) and long-term (covered bonds, European medium-term notes, medium term notes) and cover a range of currencies.
Nordea’s funding sources are presented in a table below. As of year-end 2014, the total volume utilised under short-term programmes was EUR 53.1bn (EUR 52.3bn) with the average maturity being 0.3 (0.2) years. The total volume under long-term programmes was EUR 141.2bn (EUR 133.3bn) with average maturity being 6.4 (5.8) years. During 2014, the volume of long-term programmes increased by EUR 7.9bn whilst the volume of short-term programmes increased by EUR 0.8bn. Trust is fundamental in the fun-ding market, therefore Nordea periodically publishes infor-mation on the liquidity situation of the Group.
Nordea’s liquidity risk management includes stress tes-ting and a business continuity plan for liquidity manage-

Nordea Annual Report 201444
Board of Directors’ report
The Liquidity Coverage Ratio (LCR) for the Nordea Group was at the end of 2014 149% (117%) with yearly average of 131%. At the end of 2014 the LCR in EUR was 307% (140%) and in USD 169% (127%), with yearly aver-ages of 194% and 136%, respectively.
Funding sources, 31 December 2014
Liability type, EURmInterest
rate base
Average maturity
(years) Amount
Deposits by credit institutions– shorter than 3 months Euribor etc 0.0 54,155– longer than 3 months Euribor etc 0.6 2,167Deposits and borrowings from the public– Deposits on demand Administrative 0.0 121,987– Other deposits Euribor etc 0.2 75,268Debt securities in issue– Certificates of deposits Euribor etc 0.3 22,927– Commercial papers Euribor etc 0.3 30,133– Mortgage covered
bond loansFixed rate,
market-based 7.8 99,244
– Other bond loansFixed rate,
market-based 3.1 41,970Derivatives n.a. 97,340Other non-interest- bearing items n.a. 34,529Subordinated debentures– Dated subordinated
debenture loansFixed rate,
market-based 4,434– Undated and other
subordinated debenture Fixed rate,
market-based 3,508Equity 29,837Total (total liabilities and equity) 617,499Liabilities to policyholders (in the Life insurance operations) 51,843Total (total liabilities and equity) including Life insurance operations 669,342
For a maturity breakdown, see Note G45.
Net balance of stable funding, 31 December 2014
Stable liabilities and equity, EURbn Amount
Tier 1 and tier 2 capital 29.1Secured/unsecured borrowing >1 year 120.5Stable retail deposits 31.7Less stable retail deposits 57.5Wholesale deposits <1 year 70.2Total stable liabilities 309.0
Stable assets, EURbn Amount
Wholesale and retail loans >1 year 233.3Long-term lending to banks and financial companies 4.6Other illiquid assets 20.1Total stable assets 258.0Off-balance-sheet items 2.2Net balance of stable funding (NBSF) 48.8
ment. Stress testing is defined as the evaluation of potential effects on a bank’s liquidity situation under a set of excep-tional but plausible events. Stress testing framework inclu-des also survival horizon metrics (see below), which repre-sents a combined liquidity risk scenario (idiosyncratic and market-wide stress).
Liquidity risk measurement methodsThe liquidity risk management focuses on both short-term liquidity risk and long-term structural liquidity risk. In order to manage short-term funding positions, Nordea measures the funding gap risk, which expresses the expected maximum accumulated need for raising liquidity in the course of the next 30 days. Cash flows from both on-balance sheet and off-balance sheet items are included. Funding gap risk is measured and limited for each cur-rency and as a total figure for all currencies combined. The total figure for all currencies combined is limited by the Board of Directors.
To ensure funding in situations where Nordea is in urgent need of cash and the normal funding sources do not suffice, Nordea holds a liquidity buffer. The buffer minimum level is set by the Board of Directors. The liquidity buffer consists of central bank eligible high-grade liquid securities held by Group Corporate Centre that can be readily sold or used as collateral in funding operations.
During 2011, the Survival horizon metric was intro-duced. It is conceptually similar to Basel Liquidity Cover-age Ratio. The metric is composed of the liquidity buffer and funding gap risk cash flows, and includes expected behavioural cash flows from contingent liquidity drivers. Survival horizon defines the short-term liquidity risk appetite of the Group and expresses the excess liquidity after a 30-day period without access to market funding.
The Board of Directors has set the limit for minimum survival without access to market funding during 30 days.
The structural liquidity risk of Nordea is measured and limited by the Board of Directors through the NBSF, which is defined as the difference between stable liabilities and stable assets. These liabilities primarily comprise retail deposits, bank deposits and bonds with a remaining term to maturity of more than 12 months, as well as sharehold-ers’ equity, while stable assets primarily comprise retail loans, other loans with a remaining term to maturity longer than 12 months and committed facilities. The CEO in GEM has set as a target that the NBSF should be posi-tive, which means that stable assets must be funded by stable liabilities.
Liquidity risk analysisThe short-term liquidity risk remained at moderate levels throughout 2014. The average funding gap risk, i.e. the average expected need for raising liquidity in the course of the next 30 days, was EUR +11.3bn (EUR +16.8bn). Nor-dea’s liquidity buffer range was EUR 59.5 – 67.3bn (EUR 58.2bn – 72.5bn) throughout 2014 with an average buffer size of EUR 62.5bn (EUR 64.4bn). Nordea’s liquidity buffer is highly liquid, consisting of only central bank eligible securities held by Group Treasury, as shown in the table below. Survival horizon was in the range EUR 42.1bn – 54.7bn (EUR 49.0bn – 68.2bn) throughout 2014 with an average of EUR 46.9bn (EUR 59.0bn). The aim of always maintaining a positive NBSF was comfortably achieved throughout 2014. The yearly average for the NBSF was EUR 51.1bn (EUR 52.8bn).

Nordea Annual Report 2014 45
Board of Directors’ report
Capital managementCapital managementNordea strives to be efficient in its use of capital and there-fore actively manages its balance sheet with respect to dif-ferent asset, liability and risk categories. The goal is to enhance returns to shareholders while maintaining a pru-dent capital structure.
The Board of Directors decides ultimately on the targets for capital ratios, capital policy and the overall framework of capital management in Nordea.
The ability to meet targets and to maintain minimum capital requirements is reviewed regularly within the Asset and Liability Committee (ALCO) and the Risk Committee.
Capital requirementsThe capital requirement and the own funds described in this section follow the CRR rules and not accounting standards, see Note G38 for details. Therefore the capital requirement and the own funds are only applicable for Nordea Bank AB (publ) on its consolidated situation, in which the insurance companies are not consolidated.
Capital requirements and REA
31 Dec 201431 Dec 2013
EURm
Minimum capital
requirement REA REA
Credit risk 9,522 119,029 129,705 – of which counterparty risk 843 10,535 6,312IRB 8,451 105,637 112,061
– of which corporate 5,743 71,792 84,844 – of which advanced 4,048 50,600 — – of which foundation 1,695 21,192 84,844– of which institutions 766 9,572 5,848– of which retail 1,755 21,940 19,848 – secured by property mortgage 878 10,982 10,772 – other retail 792 9,897 7,778 – SME 85 1,061 1,298– of which other 187 2,333 1,521Standardised 1,071 13,392 17,644– of which sovereign 74 928 428– of which institutions 27 338 611– of which corporate 154 1,921 3,768– of which retail 255 3,181 5,949– secured by property mortgage 222 2,777 4,826– of which equity 195 2,442 —– of which other 144 1,805 2,062
Credit value adjustment risk 185 2,308 —Market risk 584 7,296 8,753– of which trading book,
Internal approach 312 3,898 5,131– of which trading book,
Standardised approach 112 1,402 2,321– of which banking book, Standardised approach 160 1,996 1,301Operational risk, standardised 1,347 16,842 16,796Sub total 11,638 145,475 155,254Additional capital requirement due to Basel I floor adjustment 5,995 74,938 53,969Total 17,633 220,413 209,223
Capital policyThe current capital policy states that Nordea Group should have a target minimum of 13% in CET1 and 17% in total capital ratio. The most recent review, performed in the fourth quarter of 2014 leaves the capital targets unchanged as there are still uncertainties with respect to the Swedish FSA's view on standardised models to be used by the banks for calculating the size of the pillar II add-on, as well as other on-going regulatory uncertainties such as the replacement of the current capital floor. The capital policy will be revised once the regulatory regime is fur-ther clarified. However, Nordea’s current view is that the bank should operate with a CET1 ratio of approximately 15%, including a management buffer, although there is still some regulatory uncertainty.
Minimum capital requirementsRisk exposure amount (REA), previously referred to as risk-weighted assets or RWA, is calculated in accordance with the requirements in the CRR. Nordea had 80% of the credit risk exposure covered by internal rating based (IRB) approaches by the end of 2014. Nordea aims to implement the IRB approach for some remaining portfolios. During the first quarter of 2014 Nordea implemented the advanced IRB approach for the Group’s corporate expo-sures in the Nordic region. In the fourth quarter, Nordea was approved to use the retail IRB approach for the major-ity of the retail exposures in Finland which were not pre-viously reported in IRB.
Nordea is approved to use its own internal Value-at-Risk (VaR) models to calculate capital requirements for the major share of the market risk in the trading book. For operational risk the standardised approach is applied.
Internal capital requirementNordea bases its internal capital requirements under the Internal Capital Adequacy Assessment Process (ICAAP) on risks defined by Capital Requirements Directive (CRD) and risks internally defined under Pillar II. The following major risk types are included in the internal capital requirement: credit risk, market risk, operational risk and business risk. Additionally, interest rate risk in the bank-ing book, risk in Nordea’s sponsored defined benefit pen-sion plans, real estate risk and concentration risk are explicitly accounted for.
In addition to calculating risk capital for its various risk types, Nordea conducts a comprehensive capital adequacy stress test to analyse the effects of a series of global and local shock scenarios. The results of the stress tests are considered, along with potential management interventions, in Nordea’s internal capital requirements as buffers for economic stress. The internal capital requirement is a key component of Nor-dea’s capital ratio target setting.
The ICAAP also describes Nordea's management, mitiga-tion and measurement of material risks and assesses the adequacy of internal capital by defining internal capital requirements reflecting the risk of the institution. However, regulatory buffers are being introduced with the implemen-tation of CRD IV which might lead to higher capitalisation requirements than what is determined in the internal capital requirement.

Nordea Annual Report 201446
Board of Directors’ report
Economic Capital (EC) Economic Capital is a method for allocating the cost of holding capital, as a result of risk taking, and is a central component in the Economic Profit (EP) framework. The allocation of costs within the EC model is based on the same risk components as the ICAAP but also includes risks in the insurance businesses. EC is calculated for the legal group whereas the ICAAP, which is governed by the CRD, covers only Nordea Bank AB (publ) on its consoli-dated situation. EC has been aligned to CET1 capitalisa-tion requirements according to CRR. Additional capital items were introduced in the EC during 2014 to reduce the gap between legal equity and allocated capital.
Economic Capital (EC including Nordea Life and Pen-sions) was at the end of 2014 EUR 23.9bn (EUR 24.4bn as of 2013, restated).
Economic Profit (EP)Nordea uses EP as one of its financial performance indica-tors. EP is calculated as risk-adjusted profit less the cost of equity. Risk-adjusted profit and EP are measures to sup-port performance management and for shareholder value creation. In investment decisions and customer relation-ships, EP drives and supports the operational decision making process in Nordea. The EP model also captures both growth and return. EC and expected losses (EL) are inputs in the EP framework.
Expected losses (EL)EL reflects the normalised loss level of the individual credit exposure over a business cycle as well as various portfolios. During 2014 there were no changes to the EL framework apart from the regular update of parameters based on the latest validations.
The EL ratio used in the EP framework, calculated as EL divided by exposure at default (EAD), was 12 basis points as of year-end 2014 (13 basis points as of 2013) excluding the sovereign exposure class.
EL is a more stable measure than actual losses, but it will vary with the business cycle as a consequence of shifts in the repayment capacity (PD dimension) and col-lateral coverage (LGD dimension) distributions.
Own fundsOwn funds is the sum tier 1 and tier 2 capital. Tier 1 capi-tal consists of both common equity tier 1 (CET1) and addi-tional tier 1 capital. CET1 capital is considered to be capital of the highest quality with ultimate loss-absorbance char-acteristics and consists predominately of paid in capital and retained earnings. Profit may only be included after permission from the financial supervisory authority and after deduction of proposed dividend. Due to the imple-mentation of CRR deductions that according to previous rules were made 50 % from tier 1 and 50 % from tier 2 are now fully deducted from common equity tier 1. Further-more, CRR also changed the treatment of investments in financial sector entities and deferred tax assets that rely on future profitability and arise from temporary differences, which are now risk weighted instead of deducted from tier 1 and tier 2.
Additional tier 1 and tier 2 capital consist mostly of undated and dated subordinated loans, respectively. Hold-ings of other financial sector entities’ subordinated loans are deducted from the corresponding tier.
Summary of items included in own funds
EURm31 Dec
201431 Dec
2013
Calculation of own fundsEquity 29,063 28,429 Proposed/actual dividend –2,501 –1,734 Deferred tax assets — –68 Intangible assets –2,584 –2,987 IRB provisions excess (+)/shortfall (–) –344 –369 Deduction for investments in credit institutions (50%) — –99 Pension assets in excess of related liabilities –33 0 Other items, net –780 –841 Common equity tier 1 (CET1) capital (net after deduction) 22,821 23,112 Additional tier 1 (AT1) capital before regula-tory adjustments 2,800 1,949 Regulatory adjustments to AT1 capital –32 –616Tier 1 capital (net after deduction) 25,588 24,444 Tier 2 capital before regulatory adjustments 5,012 4,789 IRB provisions excess (+)/shortfall (–) — –369 Deduction for investments in credit institutions (50%) — –99 Deductions for investments in insurance companies –505 –616 Pension assets in excess of related liabilities — –190Other items, net –46 81 Total own funds (net after deduction) 30,049 28,040
Capital adequacy ratios
2014 2013
Common equity tier 1 (CET1) capital ratio excluding Basel I floor (%) 15.7 14.9Tier 1 ratio excluding Basel I floor (%) 17.6 15.7Capital ratio excluding Basel I floor (%) 20.7 18.1Capital adequacy quotient (Own funds/capi-tal requirement excluding Basel I floor) 2.6 2.3
Capital adequacy quotient (Own funds/capi-tal requirement including Basel I floor) 1.7 1.7
Capital situation of the financial conglomerateAs the Sampo Group has an owner share of more than 20% in Nordea Bank AB (publ), Nordea is part of the Sampo financial conglomerate in accordance with the Finnish Act on the Supervision of Financial and Insurance Conglomerates (2004/699), based on Directive 2002/87/EC.
Further information – Note G38 Capital adequacy and the Capital and Risk Management ReportFurther information on capital management and capital ade-quacy is presented in Note G38 Capital adequacy and in the Capital and Risk Management Report at www.nordea.com.

Nordea Annual Report 2014 47
Board of Directors’ report
New regulationsThe Capital Requirement Directive IV (CRD IV) and Capital Requirement Regulation (CRR) entered into force from 1 Jan-uary 2014. The CRR became applicable in all EU countries from 1 January 2014 while the CRD IV was implemented through national law within all EU member states during 2014, through national processes.
Parts of the CRD IV/CRR are still being phased-in. As com-municated by Swedish authorities already in 2011 the Com-mon Equity Tier 1(CET1) requirement for the four large Swed-ish banks will be 12% from 2015. This has been achieved by setting the capital conservation buffer to 2.5% CET1 and by activating the systemic risk buffer to 3% from 2015. In addi-tion there has been an additional systemic risk buffer require-ment of 2% CET1 within Pillar II from September 2014. On top of the 12% CET1 requirement, the Swedish FSA has decided that the countercyclical capital buffer will be set to 1% CET1 for Swedish exposures from 13 September 2015.
Updates on Basel III and the CRD IV/CRROn 22 December 2014 the Basel Committee on Banking Supervision (BCBS) published a consultation on the design of a permanent floor, replacing the current Basel I (transi-tional) floor. The proposal is that the floor shall be based on the revised standardised approaches for credit-, mar-ket- and operational risks that is currently, or has recently been, on consultation. The intention from the BCBS is to finalise the work by end-2015.
In December 2014 the Swedish FSA published a proposal for standardised methods for assessing the capital adequacy requirement within Pillar II for concentration risk, interest rate risk in the banking book (IRRBB) and pension risk. The intention is to use the methods in the SREP in 2015.
The CRR introduced a non-risk based measure, the lever-age ratio, in order to limit an excessive build-up of leverage on credit institutions’ balance sheets. The impact of the ratio is being monitored by the supervisory authorities with an aim to migrate to a binding measure in 2018. The leverage ratio will be calculated as the tier 1 capital divided by the exposure (on-balance and off-balance sheet exposures, with adjustments for certain items such as derivatives and securi-ties financing transactions). On 17 January 2015 a revised version of the calculation of the leverage ratio was published in the Official Journal entering into force the day after. The revised version is an update of the CRR to be more in line with the BCBS leverage ratio framework from January 2014.
The CRR also introduces two new quantitative liquidity standards; liquidity coverage ratio (LCR) and net stable fund-ing ratio (NSFR). LCR requires that a bank hold liquidity buff-ers which are adequate to face any possible imbalance between liquidity inflows and outflows under gravely stressed condi-tions over a period of 30 days. The EU Commission has pub-lished a delegated act on LCR specifying details for calcula-tions of inflows and outflows. The detailed LCR rules will enter into force on 1 October 2015 with phase-in of 60% in 2015, 70% in 2016, 80% in 2017 and 100% in 2018. NSFR requires that a bank shall ensure that long term obligations are adequately met with a diversity of stable funding instruments under both normal and stressed conditions. BCBS published a final recommendation on NSFR in October 2014 with the intention to introduce NSFR as a minimum standard in 2018. Within the EU, the EU Commission is expected to present a proposal by late 2016, if it is deemed appropriate.
Bank Recovery and Resolution DirectiveThe Banking Recovery and Resolution Directive (BRRD) was published in the Official Journal in June 2014 together with the Directive on Deposit Guarantee Scheme. The BRRD outlines the tools and powers available to the rele-vant authorities in the EU, which are aimed at both prevent-ing bank defaults as well as handling banks in crises, while maintaining financial stability. The DGS strengthens the protection of citizens' deposits in case of bank failures. The BRRD require banks to draw up recovery plans to describe the measures they would take in order to remain viable if their financial situation is considerably weakened. The BRRD also sets the minimum requirement for own funds and eligible liabilities (MREL) for all EU banks. In Novem-ber 2014, the EBA published a technical standard describing the calculation of the MREL requirement. The final version of the EBA technical standard will be applied for all EU banks at the latest in 2016. In November 2014 the Financial Stability Board (FSB) published a consultation on the total loss absorbing capacity (TLAC). The TLAC is intended to ensure adequate availability of loss-absorbing capacity for global systemic banks in resolution, similar to the MREL. The TLAC requirement will not be applied before 2019.
Bank structural reformIn February 2012, the EU Commission established a high-level expert group (HLEG) with the task to assess whether additional reforms on the structure of individual banks should be considered. The HLEG answer to the task was presented in a report in October 2012 and suggested man-datory separation of proprietary trading and other high-risk trading activities from the normal banking activities. The main purpose would be to separate certain particu-larly risky parts of financial activities from deposit taking activities within a banking group. The underlying objec-tive is to make deposit taking banks safer and less con-nected to trading activities. Risky financial activities are defined as proprietary trading and all securities or deriva-tives incurred in the process of market-making as well as exposures towards hedge funds, private equity invest-ments and structured investment vehicles.
Solvency IIThe Solvency II regime, which will come into force from 1 January 2016, introduces a consistent prudential frame-work for insurance regulation across Europe. The main objectives of Solvency II are to:
assessment and replace the old “volume-based” capital requirement framework
-tive management and the Board of Directors
embedded into business operations and strategic planning
AccountingNordea’s accounting policies, which follow IFRS, are under change. Nordea’s assessment is that the most important changes are related to Financial Instruments (IFRS 9) and Insurance Contracts (IFRS 4), although other changes might also have an impact on Nordea. IFRS 9 will become manda-tory from 2018 if endorsed in the EU. The finalisation dates and effective dates for the amended IFRS 4 is still pending.

Nordea Annual Report 201448
Board of Directors’ report
Strong corporate governance is about companies having clear and systematic decision-making processes, thus pro-viding clarity about responsibilities, avoiding conflicts of interest and ensuring satisfactory internal control, risk man-agement and transparency. Commitment to Nordea’s mis-sion and vision requires the integration of sound corporate governance practices into regular business activities in order to, attain – as far as possible – a company that is well gov-erned and well managed.
This Corporate Governance Report is prepared in accord-ance with the requirements in the Swedish Annual Accounts Act and the Swedish Code of Corporate Govern-ance (the Code). The main emphasis is on the Board of Directors in its role as the main decision-making body in Nordea’s corporate governance structure, and the interac-tion with the other bodies to ensure sound corporate gov-ernance. Nordea’s system for internal control and risk man-agement regarding financial reporting is also covered.
Corporate governance at NordeaNordea Bank AB (publ) is a Swedish public limited company listed on the Nasdaq stock exchanges in Stockholm, Hel-sinki and Copenhagen. Corporate governance at Nordea follows generally adopted principles of corporate govern-ance. The external framework that regulates corporate gov-ernance work includes the Swedish Companies Act, the Banking and Financing Business Act, the Annual Accounts Act, the Annual Accounts Act of Credit Institutions and Securities Companies, EU regulations for the financial industry, rules issued by relevant financial supervisory authorities, the Nasdaq's rules for each stock exchange and
the rules and principles of the Code. Nordea complies with the Code and has no deviations to report in 2014.
In 2014, the Company had neither any infringement of the applicable stock exchange rules nor any breach of good practice in the securities market reported by the relevant exchange’s disciplinary committee or the Swedish Securi-ties Council.
This Corporate Governance Report has been examined by the auditors. The Code is available at www.corporategovernanceboard.se.
Division of powers and responsibilitiesThe management and control of Nordea is divided among the shareholders (at the General Meeting), the Board of Directors and the President and CEO, pursuant to the pro-visions of the external framework, the Articles of Associa-tion and the internal instructions set forth by the Board of Directors.
General Meetings (1)The General Meeting is the Company’s highest decision-making body, at which shareholders exercise their voting rights. At the General Meeting, decisions are taken regarding matters such as the annual accounts, dividend, election of the Board of Directors and auditors, remunera-tion for Board members and auditors and guidelines for remuneration for executive officers.
General Meetings are held in Stockholm. The minutes of the Annual General Meeting (AGM) 2014, are available at www.nordea.com.
The AGM 2015 will be held on Thursday 19 March 2015.
Corporate Governance Report 2014
Corporate Governance Structure
Shareholders in General Meeting (1)
Group Internal Audit (8)
GEM
Nomination Committee (2)
Internal FrameworkArticles of Association, the Charter, Instructions for the CEO,
policies, instructions, guidelines and Nordea’s values
External FrameworkLegislation, regulation, the Code, stock exchange rules
Group Compliance*
Group Risk Management*
President and CEO (7)
Auditors (9)
Risk Committee (5) Remuneration Committee (6)Audit Committee (4)
Elected / appointed by
Reporting to / informing
The numbers in the brackets refer to text paragraphs.* Group Risk Management as well as Group Compliance are described in separate sections and information is presented on page 16 to 17 and 35 to 43.
Board of Directors (3)

Nordea Annual Report 2014 49
Board of Directors’ report
Voting rightsAccording to the Articles of Association, shares may be issued in two classes, ordinary shares and C-shares. All shares in Nordea carry voting rights, with each ordinary share entitled to one vote and each C-share entitled to one tenth of one vote at General Meetings. At General Meet-ings, each shareholder is entitled to vote for the full num-ber of shares that he or she owns or represents. Nordea is not entitled to vote for its own shares at General Meetings. More information about the Nordea share is presented in the section “The Nordea share and shareholders” on page 13 and in the “Financial Review 2014” on page 28.
Articles of AssociationThe Articles of Association are available at www.nordea.com. Amendments to the Articles of Association are resolved by the General Meeting pursuant to Swedish law and are subject to the approval of the Swedish Financial Supervisory Authority.
Mandate to acquire and convey own sharesInformation on the mandate to acquire and convey own shares is presented in the Financial Review 2014 on page 30.
Mandate to issue convertible instrumentsInformation on the mandate to issue convertible instru-ments is presented in the Financial Review 2014 on page 30.
Nomination process (2)The AGM 2014 decided to establish a Nomination Com-mittee with the task of proposing Board members, the Chairman of the Board and auditor as well as remunera-tion for the Board members and auditor to the AGM 2015.
The Nomination Committee shall comprise the Chair-man of the Board (Björn Wahlroos) and four members appointed by the four largest shareholders in terms of vot-ing rights on 31 August 2014, who wish to participate in the Committee.
The composition of the Nomination Committee was made public on 16 September 2014. Sampo plc had appointed Torbjörn Magnusson, Nordea-fonden had appointed Mogens Hugo, Alecta had appointed Per Frenn-berg and The Fourth Swedish National Pension Fund had appointed Monica Caneman. Torbjörn Magnusson had been appointed chairman of the Nomination Committee. At the date of constitution, the Nomination Committee represented 28.7% of the shareholders' votes.
The proposals of the Nomination Committee are pre-sented in the notice of the AGM 2015 and at www.nordea.com.
Nordea Board of Directors (3)Composition of the Board of DirectorsAccording to the Articles of Association, the Board of Directors consists of at least six and no more than fifteen members elected by the shareholders at the General Meet-ing. The term of office for Board members is one year. Nor-dea has neither a specific retirement age for Board mem-bers nor a time limit for how long a Board member may serve on the Board. There are no such requirements in the external framework.
According to the Articles of Association, the aim is to ensure that the Board as a whole for the purpose of its
work possesses the requisite knowledge of and experience in the social, business and cultural conditions of the regions and markets in which the main activities of the Group are carried out. Furthermore, according to the Code, the board is to have a composition appropriate to the com-pany’s operations, phase of development and other rele-vant circumstances. The board members elected by the General Meeting are collectively to exhibit diversity and breadth of qualifications, experience and background. According to the Code, the company is to strive for equal gender distribution on the board.
All board assignments in Nordea are based on merit with the prime consideration being to maintain and enhance the Board’s overall effectiveness. In order to fulfil this, a broad set of qualities and competences are sought for and it is recognised that diversity, including age, gen-der, geographical provenance and educational and profes-sional background, is an important factor to take into con-sideration.
The Board currently consists of eight members elected by the General Meeting after Svein Jacobsen’s resignation of his own accord on 31 July 2014. The resignation was made public on 17 July 2014.
In addition, three members and one deputy member are appointed by the employees. Employees are entitled under Swedish legislation to be represented on the Board. The CEO of Nordea is not a member of the Board. The compo-sition of the Board of Directors is shown in the table on page 51 and further information regarding the Board members elected by the AGM 2014 is presented in the sec-tion "Board of Directors" on page 212.
Independence of the Board of DirectorsNordea complies with applicable rules regarding the inde-pendence of the Board. The Nomination Committee con-siders all of the members elected by the shareholders to be independent of the Company and its executive manage-ment.
All Board members elected by the shareholders, apart from Björn Wahlroos and Kari Stadigh, are independent in relation to the Company’s major shareholders. Björn Wahl-roos is chairman of Sampo plc and Kari Stadigh is manag-ing director and CEO of Sampo plc, which owns more than ten per cent of all shares and votes in Nordea.
Thus, the number of Board members who are independ-ent in relation to the Company and its executive manage-ment, and independent in relation to the Company’s major shareholders, exceeds the minimum requirements.
No Board member elected by the General Meeting is employed by or works in an operative capacity at the Com-pany. All Board members and the deputy Board member appointed by the employees are employed by the Group and are therefore not independent of the Company.
The independence of the individual Board members is also shown in the table on page 51.
The work of the Board of DirectorsThe Board of Directors annually establishes its working plan, in which the management and risk reporting to the Board is also established. The statutory meeting following the AGM 2014 elected the vice Chairman and appointed the Board Committee members. The Board has adopted written work procedures governing its work and its work carried out in the Board Committees (the Charter). For example, the Charter sets forth the Board’s and the Chair-

Nordea Annual Report 201450
Board of Directors’ report
man’s areas of responsibility, documentation and quorum as well as the frequency of meetings. It also contains rules regarding conflicts of interest and confidentiality. Further-more, the Board of Directors has adopted instructions for the CEO specifying the CEO’s responsibilities as well as other charters, policies and instructions for the operations of the Group. These, together with the Articles of Associa-tion, the Charter and Nordea’s values, constitute the inter-nal framework that regulates corporate governance at Nor-dea. Further information regarding Nordea’s values is presented in the section Strategy – the future relationship bank developing, on page 10.
The Board is charged with the organisation of Nordea and the management of the Company’s operations and the overall management of the Nordea Group’s affairs in accordance with the external and internal framework. Fur-thermore, the Board shall ensure that the Company’s organisation in respect of accounting, management of funds and the Company’s financial position in general includes satisfactory controls. The Board is ultimately responsible for ensuring that an adequate and effective system of internal control is established and maintained. Group Internal Audit (GIA) annually issues to the Board an overall assurance statement on Nordea’s governance, risk management and control processes. The assurance statement for 2014 concludes that the internal control sys-tem is adequate and effective. Further information regard-ing internal control within Nordea is provided below under “Internal Control Process”.
At least once a year, the Board meets the external auditor without the CEO or any other member of Group Executive Management (GEM) being present. In addition, the auditor in charge meets separately with the Chairman of the Board and with the Chairman of the Board Audit Committee.
In 2014, the Board held ten meetings. Nine meetings were held in Stockholm, and one in Finland. For more information see the table on page 51. The Board regularly follows up on the strategy, financial position and develop-ment and risks. The financial targets and the strategy are reviewed on an annual basis. In 2014, the Board also dealt with for example reports on and issues related to the financial market and macroeconomic trends, new regula-tory initiatives, capital and liquidity, Internal Capital Ade-quacy Assessment Process (ICAAP), internal control, AML, compliance, the group simplification programme, the work of the Board Committees, HR and remuneration issues, and transactions of significance.
The Secretary of the Board of Directors is Lena Eriksson, Head of Group Legal.
The ChairmanThe Chairman of the Board is elected by the shareholders at the General Meeting. According to the Charter, the Chairman is to ensure that the Board’s work is conducted efficiently and that the Board fulfils its duties. The Chair-man is to organise and lead the Board’s work, maintain regular contact with the CEO, ensure that the Board receives sufficient information and documentation and ensure that the work of the Board is evaluated annually and that the Nomination Committee is informed of the result of the evaluation.
Evaluation of the BoardThe Board of Directors annually conducts a self-evaluation process, through which the performance and the work of
the Board is evaluated and discussed by the Board. The evaluation is based on methodology that includes ques-tionnaires to evaluate the Board as a whole, the Chairman and individual Board members. According to European regulatory requirements, an internal process has been set up for assessing the suitability of the Board of Directors as a whole as well as of the members of the Board of Direc-tors.
Board CommitteesIn accordance with the external framework and in order to increase the effectiveness of the board work, the Board of Directors has established separate working committees to assist the Board in preparing matters, belonging to the competence of the Board and to decide in matters dele-gated by the Board. The duties of the Board Committees, as well as working procedures, are defined in the Charter. Each Committee regularly reports on its work to the Board. The minutes are communicated to the Board.
The Board Audit Committee (4)The Board Audit Committee (BAC) assists the Board of Directors in fulfilling its oversight responsibilities by, for instance, monitoring the Nordea Group’s financial report-ing process, and, in relation thereto, the effectiveness of the internal control and risk management systems, estab-lished by the Board of Directors, the CEO and GEM, as well as the effectiveness of Group Internal Audit. The BAC is further accountable for keeping itself informed as to the statutory audit of the annual and consolidated accounts assisting the Nomination Committee in preparing propos-als on auditors and reviewing and monitoring the impar-tiality and independence of the external auditors and, in particular, the provision of additional services to the Nor-dea Group. In addition, the BAC is accountable for the guidance and evaluation of the GIA.
Members of the BAC are Tom Knutzen (chairman), as of AGM 2014 and as chairman as of 31 July 2014, Elisabeth Grieg and Sarah Russell. Svein Jacobsen was a member and chairman from the AGM 2014 until his resignation of his own accord from the Board on 31 July 2014. Generally, the Group Chief Audit Executive (CAE) and the Chief Financial Officer (CFO) are present at meetings and are entitled to participate in discussions, but not in decisions.
According to the Swedish Companies Act and the Code, the majority of the members of the BAC are to be inde-pendent of the Company and the executive management of the Company. At least one of the committee members who are independent of the Company and its executive management must also be independent of the Company’s major shareholders. Nordea follows the legal requirement as well as complies with the Code. For more information, see the table on page 51.
The Board Risk Committee (5)The Board Risk Committee (BRIC) assists the Board of Directors in fulfilling its oversight responsibilities con-cerning the management and control of the risks, risk frameworks, controls and processes associated with the Group’s operations, including credit, market, liquidity, business, life and operational risk.
The duties of the BRIC include reviewing the develop-ment of the Group’s overall risk management and control framework, as well as the Group’s risk profile and key risk issues. In addition, the BRIC reviews and makes recom-

Nordea Annual Report 2014 51
Board of Directors’ report
mendations regarding the Group’s risk appetite and limits for market and liquidity risks. Furthermore, the BRIC reviews resolutions made by lending entities concerning credits or limits above certain amounts, as well as strategic credit policy matters and the development of the credit portfolio.
Members of the BRIC are Kari Stadigh (chairman), Lars G Nordström and Robin Lawther, as of AGM 2014. Tom Knutzen was a member until the AGM 2014. Gener-ally, the Head of Group Risk Management and, when deemed important and to the extent possible, the CEO are present at meetings and are entitled to participate in dis-cussions, but not in decisions. Further information regard-ing the credit decision-making structure for main opera-tions and risk management within Nordea is presented in the section “Risk management”, on page 36.
There are no rules on the independence of the BRIC members in the external framework. For more informa-tion, see the table on page 51.
The Board Remuneration Committee (6)The Board Remuneration Committee (BRC) is responsible for preparing and presenting proposals to the Board of Directors on remuneration issues. This duty includes pro-posals regarding the Nordea Remuneration Policy and underlying instructions, as well as guidelines for remunera-tion for the executive officers to be decided by the AGM. The BRC is also responsible for proposals regarding remu-neration for the CEO, other members of GEM as well as the CAE and, on the proposal of the CEO, for the Group Com-
pliance Officer and the Head of Group Credit Control.At least annually, the BRC follows up on the application
of the Nordea Remuneration Policy and underlying instructions through an independent review by the GIA, and exercises an assessment of the Nordea Remuneration Policy and remuneration system with the participation of appropriate control functions. The BRC also has the duty of annually monitoring, evaluating and reporting to the Board on the programmes for variable remuneration for GEM, as well as the application of the guidelines for remu-neration for executive officers. At the request of the Board, the BRC also prepares other issues of principle for the con-sideration of the Board.
Members of the BRC are Marie Ehrling (chairman), Peter F Braunwalder (until AGM 2014) and Björn Wahlroos. Gen-erally, the CEO and the Head of Group Human Resources are present at the meetings and are entitled to participate in discussions, but not in decisions. The CEO does not par-ticipate in considerations regarding his own employment terms and conditions.
According to the Code, the members of the BRC are to be independent of the Company and the executive manage-ment of the Company. Nordea complies with this rule.
Further information regarding remuneration at Nordea is presented in the separate section “Remuneration”, on page 55 and in Note G7, on page 97.
Meetings, attendance and independenceThe table shows the number of meetings held by the Board of Directors and its Committees as well as the attendance
Board of Directors
Board Audit Committee
Board Risk Committee
Board Remuneration
Committee
Inde pendence in relation to
the Company1
Independence in relation to
the major shareholders1
Number of meetings 10 12 6 6
Meetings attended:Elected by AGM
Björn Wahlroos2 10 — — 6 Yes NoMarie Ehrling3 10 — — 6 Yes YesPeter F Braunwalder4 1 — — — Yes Yes
Elisabeth Grieg 10 12 — — Yes YesSvein Jacobsen5 7 7 — — Yes YesTom Knutzen 10 9 2 — Yes YesRobin Lawther6 7 — 4 Yes YesLars G Nordström 10 — 6 — Yes YesSarah Russell 10 12 — — Yes YesKari Stadigh 10 — 6 — Yes No
Appointed by employeesKari Ahola(deputy 1 Nov 2014–30 Apr 2015) 9 — — — No YesToni H. Madsen
(deputy 1 May 2014–31 Oct 2014) 9 — — — No YesLars Oddestad (deputy 1 Nov 2013–30 Apr 2014) 10 — — — No YesHans Christian Riise 10 — — — No Yes
1) For additional information, see Independence on page 49. 4) Board and Committee member until AGM 2014.2) Chairman from AGM 2011. 5) Board and Committee member until 31 July 2014.3) Vice Chairman from AGM 2011. 6) Board member from AGM 2014.

Nordea Annual Report 201452
Board of Directors’ report
of the individual Board members. It also shows the inde-pendence of the individual Board members in relation to the Company as well as to the major shareholders.
The CEO and Group Executive Management (7)Nordea’s President and CEO is charged with the day-to-day management of Nordea Bank and the Nordea Group’s affairs in accordance with the external and internal frame-work. The internal framework regulates the division of responsibilities and the interaction between the CEO and the Board. The CEO works closely with the Chairman of the Board with the planning of Board meetings.
The CEO is accountable to the Board for the manage-ment of the Nordea Group’s operations and he is also responsible for developing and maintaining effective sys-tems for internal control within the Group. Further infor-mation regarding the control environment for risk expo-sures is presented in the section; “Risk, Liquidity and Capital management”, on page 35. The CEO works together with executive officers within the Group in GEM. Presently, GEM consists of six members and the CEO. GEM meets regularly and whenever necessary upon request by the CEO. These meetings are chaired by the CEO, who reaches decisions after consulting with the other members of GEM. Notes of meetings, verified by the CEO, are kept. Further information regarding the CEO and GEM is presented in the section “Group Executive Management”, on page 214.
Internal control processThe Internal Control Process is carried out by the Board of Directors, management and other staff at Nordea and is designed to provide reasonable assurance regarding objec-tive fulfilment in terms of effectiveness and efficiency of operations, reliability of financial and non-financial reporting, compliance with external and internal regula-tions, safeguarding of assets as well as sufficient manage-ment of risks in the operations. The Internal Control Pro-cess is based on five main components: Control
Environment, Risk Assessment, Control Activities, Infor-mation & Communication and Monitoring.
The framework for the Internal Control Process aims to create the necessary fundamentals for the entire organisa-tion to contribute to the effectiveness and high quality of internal control through, for instance, clear definitions, assignments of roles and responsibilities and common tools and procedures.
Roles and responsibilities with respect to internal con-trol and risk management are divided into three lines of defence. In the first line of defence, the business organisa-tion and Group Functions are responsible for conducting their business within risk exposure limits and in accord-ance with the decided internal control and risk manage-ment framework. As second line of defence, the central-ised risk group functions are responsible for providing the internal control and risk management framework. Group Internal Audit performs audits and provides assurance to stakeholders on governance, risk management and inter-nal controls, which is the third line of defence.
Internal audit (8)Group Internal Audit (GIA) is an independent function commissioned by the Board of Directors. The Board Audit Committee is responsible for guidance on and evaluation of GIA within the Nordea Group. The Group Chief Audit Executive (CAE) bears overall responsibility for GIA. The CAE reports on a functional basis to the Board of Direc-tors and the Board Audit Committee and reports on an administrative basis to the CEO. The Board of Directors approves the appointment and dismissal of the CAE.
GIA does not engage in consulting activities unless the Board Audit Committee gives it special assignments. The purpose of GIA’s assurance activity is to add value to the organisation by assuring the quality of the governance, risk management and control processes, and by promot-ing continuous improvement.
All activities, including outsourced activities, and enti-ties of the Nordea Group, fall within the scope of GIA.

Nordea Annual Report 2014 53
Board of Directors’ report
GIA operates without interference in determining the scope of internal auditing, performing its audit work and communicating its results. GIA is authorised to carry out all investigations and obtain all information required to execute its duties. The work of GIA shall comply with the Standards for the International Professional Practice of Internal Auditing issued by the Institute of Internal Auditors and the Standards for Information Systems Auditing issued by ISACA. The annual audit plans are based on a comprehensive risk assessment.
External audit (9)According to the Articles of Association, one or two audi-tors must be elected by the General Meeting for a term of one year. At the AGM 2014, KPMG AB was re-elected auditor until the end of the AGM 2015. Hans Åkervall is the auditor-in-charge.
Report on internal control and risk management regarding financial reportingThe systems for internal control and risk management of financial reporting are designed to provide reasonable assurance about the reliability of financial reporting and the preparation of financial statements for external pur-poses in accordance with generally accepted accounting principles, applicable laws and regulations, and other requirements for listed companies. The internal control and risk management activities are included in Nordea’s planning and resource allocation processes. Internal con-trol and risk management of financial reporting at Nordea can be described in accordance with the COSO Frame-work as follows below.
Control EnvironmentThe control environment constitutes the basis for Nordea’s internal control and contains the culture and values estab-lished by the Board of Directors and executive manage-ment.
Further information regarding Nordea’s values is pre-
sented in the section “Strategy – the future relationship bank developing” on page 10.
A clear and transparent organisational structure is of importance for the control environment. Nordea’s business structure aims to support the overall strategy, with strong business momentum and increased requirements on capital and liquidity. The business and the organisation are under continuous development. Further information on the rela-tionship strategy is presented on page 10.
The key principle of risk management at Nordea is the three lines of defence, with the first being the business organisation and Group Functions, the second being the centralised risk group functions, which define a common set of standards, and the third being the internal audit function. The Accounting Key Control (AKC) function, implements a Nordea Group-wide system of key controls. This is done to ensure that controls essential to the financial reporting are continuously identified, monitored and assessed in the Group.
Risk AssessmentThe Board of Directors bears ultimate responsibility for limiting and monitoring the Nordea Group’s risk exposure, and risk management is considered to be an integral part of running the business. The main responsibility for perform-ing risk assessments regarding financial reporting risks lies with the business organisation. Performing risk assess-ments close to the business increases the possibility of iden-tifying the most relevant risks. In order to govern the qual-ity, central functions stipulate in governing documents when and how these assessments are to be performed. Examples of risk assessments, performed at least annually, are Quality and Risk Analysis for changes and Risk and Control Self-Assessments at divisional levels.
Control ActivitiesThe heads of the respective units are primarily responsible for managing the risks, associated with the units’ opera-tions and financial reporting processes. This responsibility
Entity Wide Controls
Transaction Level Controls
IT General Controls
Entity Wide Controls Group Accounting Manual, Financial Control Principles, Group Valuation Committee, numerous analyses in Management Reporting
Transaction Level Controls Reconciliations, approvals, financial controlling analysis, authorisation, automated controls and intra Group eliminations
IT General Controls Controls over access, systems devel-opment and deployment, data back-up & recovery and logical and physical security critical to the integrity of the financial reporting process
Control activitiesExamples of control activities in Nordea:

Nordea Annual Report 201454
Board of Directors’ report
is primarily supported by the Group Accounting Manual (GAM), the Financial Control Principles and various gov-erning bodies, such as the Group Valuation Committee. The GAM includes a standard reporting package used by all entities to ensure consistent use of Nordea’s principles and coordinated financial reporting. Fundamental internal control principles at Nordea are the segregation of duties and the four-eyes principle when approving, for instance, transactions and authorisations.
The quality assurance vested in the management report-ing process, where a detailed analysis of the financial out-come is performed, constitutes one of the most important control mechanisms associated with the reporting process. The reconciliations constitute another set of important controls in which Nordea works continuously to further strengthen the quality.
Information & CommunicationGroup Functions are responsible for ensuring that the Group Accounting Manual and the Financial Control Prin-ciples are up-to-date and that changes are communicated with the responsible units. These governing documents are broken down into instructions and standard operating procedures in the responsible units. On an annual basis, accounting specialists from Group Finance provide ses-sions for accountants and controllers in order to inform about existing and updated rules and regulations with an impact on Nordea.
Matters having impact on the fulfilment of financial reporting objectives are communicated with external par-ties, with Nordea actively participating in relevant national forums, for example forums established by the Financial Supervisory Authorities, Central Banks and associations for financial institutions.
MonitoringNordea has established a process with the purpose of ensuring proper monitoring of the quality of the financial reporting and follow-up regarding possible deficiencies.
This interactive process aims to cover all COSO-compo-nents in the Framework and is illustrated with the diagram below.
The Risk and Control Self-Assessment process includes monitoring the quality of internal control for financial reporting. The assessment is presented in the annual Operational and Compliance Risk Map, which is submit-ted to Group Executive Management, the Board Audit Committee, the Board Risk Committee and the Board of Directors.
The Board of Directors, the Board Audit Committee, the Board Risk Committee and Group Internal Audit have important roles with respect to monitoring the internal control of financial reporting at Nordea Group. For further information, see “The work of the Board of Directors (3)”, “Board Audit Committee (4)”, “Board Risk Committee (5)” and “Group Internal Audit (8)” above.
Monitoring
Monitoring
Mon
itorin
g
RiskAssessment
ControlEnvironment
ControlActivities
Information andCommunication
OrganisationalObjectives

Nordea Annual Report 2014 55
Board of Directors’ report
The Board of Directors decides on the Nordea Remunera-tion Policy, based on an analysis of the possible risks involved, and ensures that it is applied and followed-up as proposed by the Board Remuneration Committee (BRC).
The Nordea Remuneration Policy will
Support Nordea’s ability to recruit, develop and retain highly motivated, competent and performance-oriented employees and hence the People strategy. Supplement excellent leadership and challenging tasks as driving forces for creating high commitment among employees and a Great Nordea. Ensure that compensation at Nordea is aligned with efficient risk management and the Nordea values: Great customer experiences, It’s all about people and One Nordea team.
Nordea offers competitive, but not market-leading com-pensation packages.
Nordea has a total remuneration approach to compensa-tion that recognises the importance of well-balanced but varied remuneration structures based on business and local market needs, and of compensation being consistent with and promoting sound and effective risk manage-ment, and not encouraging excessive risk-taking or coun-teracting Nordea’s long-term interests.
Nordea remuneration components – purpose and eligibilityFixed Salary remunerates employees for full satisfactory performance. The individual salary is based on three cor-nerstones: Job complexity and responsibility, performance and local market conditions.
Profit Sharing aims to stimulate value creation for cus-tomers and shareholders and is offered to all employees. The performance criteria for the 2014 programme are Risk adjusted Return on Capital at Risk (RaRoCaR) and Cus-tomer Satisfaction Index (CSI).
Variable Salary Part (VSP) is offered to selected manag-ers and specialists to reward strong performance. Individ-ual performance is assessed based on a predetermined set of well-defined financial and non-financial success crite-ria, including Nordea Group criteria.
Bonus scheme is offered only to selected groups of employees in specific businesses areas or units. The aim is to ensure strong performance and to maintain cost flexi-bility for Nordea. Assessment of individual performance shall be based on a predetermined set of well-defined financial and non-financial success criteria, including Nor-dea Group criteria.
One Time Payment (OTP) can be granted to employees in the event of extraordinary performance that exceeds requirements or expectations, or in connection with tem-porary project work.
Pension and Insurance schemes aim at ensuring an appropriate standard of living after retirement and personal insurance during employment. Pension and insurance pro-visions are according to local laws, regulations and market practice and take the form either of determined public col-lective agreements, company-determined schemes or a combination thereof. Nordea aims to have defined contribu-tion pension schemes.
Benefits at Nordea are granted as a means to stimulate performance and well-being. Benefits are either linked to the employment contract or local conditions.
Executive Incentive Programme (EIP) may be offered to recruit, motivate and retain selected managers and key employees, and aims to reward strong performance and efforts. EIP contains predefined financial and non-finan-cial performance criteria at Group, BA/GF/Division and Unit/individual level. The Group performance criteria for EIP 2014 are Nordea’s internal version of ROE being Risk-Adjusted Return On Capital At Risk (RAROCAR), Operat-ing Profit, Total costs and Customer Satisfaction Index (CSI).
Further information regarding Profit Sharing, VSP, Bonus schemes and EIP is provided below in this section.
Risk analysisNordea’s remuneration components are evaluated annu-ally to ensure compliance with both international and local remuneration guidelines. In addition to the evaluation of Nordea’s remuneration components, the risk analysis addressing issues arising with respect to Nordea’s Remu-neration Policy was updated in March 2014. Key factors addressed include risks related to the governance and structure of the remuneration schemes, target-setting and measurement of results, as well as fraud and reputation. The main focus of the analysis is the variable components that potentially lead to total compensation that could be considered high.
Nordea mitigates these risks by regularly reviewing the structure of the remuneration components, including the participants and potential payout amounts, and by disclos-ing relevant information to the public. Furthermore, Nor-
Remuneration
Nordea has clear remuneration policy, instructions and processes, securing sound remuneration structures throughout the organisation.

Nordea Annual Report 201456
Board of Directors’ report
dea has established clear processes for target-setting, aligned with the Group’s strategy, and predefined growth and development initiatives. The measurement of results is aligned with Nordea’s overall performance measurement, and payout decisions are subject to separate processes and the Grandparent principle (approval by the manager’s manager). Nordea also mitigates relevant risks by means of its internal control framework, which is based on the con-trol environment and includes the following elements: Val-ues and management culture, goal orientation and follow-up, a clear and transparent organisational structure, separation of duties, the four-eye principle, quality and efficiency of internal communication and an independent evaluation process.
Performance-related compensation for 2014 for employ-ees in the risk analysis defined as Identified Staff will be partially deferred in 2015 to comply with international guidelines and national regulations. Amounts deferred and details about the deferrals will be published on nordea.com one week before the ordinary Annual General Meeting on 19 March 2015.
Audit of the remuneration policyAt least annually, the BRC follows up on the application of the Nordea Remuneration Policy and supplementary instructions with an independent review by Group Inter-nal Audit.
Remuneration for the Board of DirectorsThe AGM annually decides on remuneration for the Board of Directors. Further information is found in Note G7 on page 97.
Remuneration for the CEO and Group Executive Management (GEM)The Board of Directors prepares the proposal for guide-lines for remuneration for executive officers to be approved by the AGM annually. According to these guidelines, the Board of Directors has decided on the actual remuneration for the CEO and members of GEM following a proposal from the BRC. More information regarding the BRC is found in the separate section “Corporate Governance Report 2014”, page 48.
The external auditors presented a report to the AGM 2014 stating that, in 2013, the Board of Directors and the CEO complied with the guidelines for remuneration for executive officers as adopted by the AGM 2012 and 2013.
Further information about remuneration is found in Note G7 on page 97.
Approved guidelines for remuneration for executive officers for 2014The AGM 2014 approved the following guidelines for remuneration for executive officers.
“Nordea shall maintain remuneration levels and other employment conditions needed to recruit and retain execu-
tive officers with competence and capacity to deliver on the strategy and targets thus enabling Nordea to become a Great European bank.
The term “executive officers” shall in this context mean the CEO of Nordea Bank AB (publ) and the executives reporting directly to him, who are also members of Group Executive Management.
Remuneration for executive officers will be decided by the Board of Directors in accordance with Nordea’s inter-nal policies and procedures, which are based on the Swed-ish Financial Supervisory Authority’s (“SFSA”) regulations on remuneration systems, national implementation of the EU’s directive on capital requirements for banks as well as international sound compensation practices.
Salaries and other remuneration in line with market lev-els constitute the overriding principle for compensation for executive officers at Nordea. Compensation for the execu-tive officers shall be consistent with and promote sound and effective risk management and not encourage exces-sive risk-taking or counteract Nordea’s long term interests.
Annual remuneration consists of fixed salary and varia-ble salary.
Variable salary to the executive officers will be offered as an Executive Incentive Programme 2014 (“GEM EIP 2014”) to reward performance that meets predetermined targets at Group, business area/group function and individual level. The effect on the long term result is to be considered when determining the targets. The outcome from GEM EIP 2014 will be paid over a five-year period in cash and be subject to forfeiture clauses, Total Shareholder Return indexation and retention based on the SFSA’s regulations on remuneration systems, taking account of domestic rules and practices where relevant. GEM EIP 2014 has a one year performance period and the outcome shall not exceed the fixed salary. The executive officers were offered a similar programme year 2013 (GEM EIP 2013). In accordance with SFSA’s remuneration regulations guaranteed variable sal-ary is to be exceptional and may only occur in the context of hiring a new executive officer and then be limited to the first year of employment.
Non-monetary benefits are given as a means to facilitate executive officers’ performance. The levels of these bene-fits are determined by what is considered fair in relation to general market practice.
The executive officers shall be offered retirement bene-fits in accordance with market practice in the country of which they are permanent residents. Fixed salary during the period of notice and severance pay shall in total not exceed 24 months of fixed salary for executive officers.
The Board of Directors may deviate from these guide-lines if there are special reasons for this in a certain case.”
Proposal for guidelines for remuneration for executive officers for 2015 Nordea shall maintain remuneration levels and other employment conditions needed to recruit and retain exec-

Nordea Annual Report 2014 57
Board of Directors’ report
utive officers with competence and capacity to deliver on the strategy and targets thus enabling Nordea to become a Great European bank.
The term “executive officers” shall in this context mean the CEO of Nordea Bank AB (publ) and the executives reporting directly to him, who are also members of Group Executive Management.
Remuneration for executive officers will be decided by the Board of Directors in accordance with Nordea’s inter-nal policies and procedures, which are based on the Swed-ish Financial Supervisory Authority’s (“SFSA”) regulations on remuneration systems, national implementation of the EU’s directive on capital requirements for banks as well as international sound compensation practices.
Salaries and other remuneration in line with market lev-els constitute the overriding principle for compensation for executive officers at Nordea. Compensation for the execu-tive officers shall be consistent with and promote sound and effective risk management and not encourage excessive risk-taking or counteract Nordea’s long term interests.
Annual remuneration consists of fixed salary and varia-ble salary.
Variable salary to the executive officers will be offered as an Executive Incentive Programme 2015 (“GEM EIP 2015”) to reward performance that meets predetermined targets at Group, business area/group function and individual level. The effect on the long term result is to be considered when determining the targets. The outcome from GEM EIP 2015 will be paid over a five-year period in cash and be subject to forfeiture clauses, Total Shareholder Return indexation and retention based on the SFSA’s regulations on remuneration systems, taking account of domestic rules and practices where relevant. GEM EIP 2015 has a one year performance period and the outcome shall not exceed the fixed salary. The executive officers were offered a similar programme year 2013 and 2014 (GEM EIP 2013 and GEM EIP 2014).
In accordance with SFSA’s remuneration regulations guaranteed variable salary is to be exceptional and may only occur in the context of hiring a new executive officer and then be limited to the first year of employment.
Non-monetary benefits are given as a means to facilitate executive officers’ performance. The levels of these bene-fits are determined by what is considered fair in relation to general market practice. The executive officers shall be offered retirement benefits in accordance with market practice in the country of which they are permanent resi-dents. Fixed salary during the period of notice and sever-ance pay shall in total not exceed 24 months of fixed salary for executive officers.
The Board of Directors may deviate from these guide-lines if there are special reasons for this in a certain case.
Additional information to the Board of Directors’ proposal for guidelines for remuneration to the executive officersDeviations from approved guidelines 2014:There have been no deviations from the approved guidelines 2014.
Cost of variable remuneration for executive officers (excluding social cost):2014The actual cost for GEM EIP 2014 is EUR 5.0m to be paid over a five-year period.2015The estimated maximum cost for GEM EIP 2015 is EUR 5.8m and the estimated cost assuming 60% fulfilment of the performance criteria is EUR 3.5m.
Additional information about variable compensationProfit Sharing schemeThe Profit Sharing scheme is capped and not based on the value of the Nordea share. It is a benefit through which employees receive a share of the profit to encourage sound performance and one Nordea team which, in turn, will lead to better profitability and make working for the Nor-dea Group more attractive.
In 2014, a total of EUR 80m was provided for under Nor-dea’s Profit Sharing scheme for all employees. For 2014, each employee can receive a maximum of EUR 3,200, of which EUR 2,600 is based on a pre-determined level of Risk adjusted Return on Capital at Risk (RaRoCaR) and EUR 600 is based on the level of customer satisfaction. If all performance criteria were met, the cost of the scheme would have amounted to a maximum of approx. EUR 88m.
Variable Salary Part (VSP)VSP may be offered to selected managers and specialists to reward strong performance and as means to recruit, moti-vate and retain strongly performing employees at the Nor-dea Group. VSP must be transparent and have predefined success criteria with clear weightings. A VSP must include financial and non-financial success criteria based on Nor-dea Group KPIs decided annually by CEO. In the event of weak or negative overall results for the Nordea Group, VSP outcomes can be adjusted downwards at the discretion of the CEO.
A VSP agreement does not exceed a maximum outcome of 25% of annual fixed salary, except for few managers and key specialists within specific areas, where the amount can be a maximum of 50% of annual fixed salary. The respon-sible GEM member may, in extraordinary cases, approve a VSP agreement up to 100% of annual fixed salary.
Nordea adheres to the Grandparent principle when enrolling employees to any VSP scheme and approving the outcome. Nordea has introduced deferral programmes for the staff in the risk analysis defined as Identified Staff.

Nordea Annual Report 201458
Board of Directors’ report
Bonus schemesBonus schemes are only offered to selected groups of employees in specific business areas or units approved by the Board of Directors. Nordea pays bonuses linked to per-formance, with both divisional bonus pools and individual allocations being explicitly based on defined performance measures. Divisional financial performance is measured as risk-adjusted profits, explicitly incorporating capital and funding costs, and is adjusted for multi-period revenue effects and minimum required profit. In the event of weak or negative overall results for the Nordea Group, bonus pools can be adjusted downwards at the discretion of the Board of Directors. As such, individual compensation is determined based on detailed performance evaluations covering a range of financial and non-financial factors.
Inappropriate individual bonuses are prevented through both caps on the percentage of risk-adjusted profit that can be paid out, as well as individual caps. Nordea has intro-duced deferral programmes for the staff in the risk analy-sis defined as Identified Staff.
Care is taken to ensure that control and compliance staff employed in divisions with bonus schemes are competi-tively rewarded although not eligible for bonus.
The Board of Directors decides on new or revised bonus schemes and the outcome of divisional bonus pools by proposal from BRC. GEM is responsible for the implemen-tation of the agreed bonus schemes. Nordea also applies a stringent process to ensure that compensation for individ-uals does not encourage excessive risk-taking behaviour. To supplement the division-level assessment, there is an approval process for significant bonuses for individuals.
Executive Incentive ProgrammeIn 2013, Nordea introduced Executive Incentive Programme 2013 (“EIP 2013”) which aims to strengthen Nordea’s capabil-ity of retaining and recruiting the best talents. Furthermore, the aim is to stimulate the managers and key employees whose efforts have a direct impact on Nordea’s result, profit-ability and long-term value growth. In 2014, Nordea offered an EIP 2014 with similar aims and structure as EIP 2013.
EIP rewards performance that meets agreed predeter-mined targets at Group, business areas, group functions, divisions as well as business unit and individual level. The effect on the long-term result is to be considered when deter-mining the targets. EIP shall not exceed the fixed salary.
EIP shall be paid in the form of cash and be subject to TSR-indexation, deferral, forfeiture clauses and retention as per relevant remuneration regulations. The main part of EIP 2014 is paid no earlier than October 2018.
Participation in the programme was offered to up to 400 managers and key employees, at the Nordea Group, except GEM, who is offered a similar programme named GEM EIP 2014. Since 2013, EIP has been offered instead of Nor-dea’s LTIP and VSP for the invited employees and mem-bers of GEM.
Long-Term Incentive ProgrammesNordea offered Long-Term Incentive Programmes (LTIP) years 2007-2012, while the Board of Directors did not pro-pose a LTIP to the AGM 2013 or AGM 2014 and has decided not to propose a LTIP to the AGM 2015.
More information on Nordea’s LTIPs is presented in Note G7 and on www.nordea.com, as well as in the Annual Reports of previous years.

Nordea Annual Report 2014 59
Board of Directors’ report
Proposed distribution of earnings
According to the parent company’s balance sheet, the fol-lowing amount is available for distribution by the AnnualGeneral Meeting:
EUR
Share premium reserve 1,079,925,521
Retained earnings 10,343,770,495
Other free funds 2,762,284,828
Net profit for the year 2,425,228,406
Total 16,611,209,250
The Board of Directors proposes that these earnings are distributed as follows:
EUR
Dividends paid to shareholders, EUR 0.62 per share 2,501,100,294
To be carried forward to
– share premium reserve 1,079,925,521
– retained earnings 10,267,898,607
– other free funds 2,762,284,828
Total 16,611,209,250
Share premium reserveRetained earningsOther free funds
Net profit for the year
Dividends paid to shareholdersShare premium reserveRetained earnings
Other free funds
It is the assessment of the Board of Directors that the proposed dividend is justifiable considering the demands withrespect to the size of the Company’s and the Group’s equity, which are imposed by the nature, scope and risks, associatedwith the business, and the Company’s and the Group’s need for consolidation, liquidity and financial position in general.

Nordea Group – Financial statements
Nordea Annual Report 201460
Financial statements, Group – Contents Income statement 61Statement of comprehensive income 62Balance sheet 63Statement of changes in equity 64Cash flow statement 66Quarterly development 685 year overview 69Ratios and key figures 70Business definitions 71 Notes to the financial statements
Accounting policies G1 Accounting policies 72 Notes to the income statementG2 Segment reporting 92G3 Net interest income 95G4 Net fee and commission income 96G5 Net result from items at fair value 96G6 Other operating income 96G7 Staff costs 97G8 Other expenses 104G9 Depreciation, amortisation and impairment
charges of tangible and intangible assets 104 G10 Net loan losses 104 G11 Taxes 105 G12 Earnings per share 106 Notes to the balance sheet and memorandum itemsG13 Loans and impairment 106 G14 Interest-bearing securities 108 G15 Financial instruments pledged as collateral 108 G16 Shares 108 G17 Derivatives and Hedge accounting 109 G18 Fair value changes of the hedged items in
portfolio hedge of interest rate risk 111 G19 Investments in associated undertakings 111 G20 Intangible assets 112 G21 Leasing 114 G 22 Investment properties 115G23 Other assets 115 G24 Prepaid expenses and accrued income 115G 25 Deposits by credit institutions 115G26 Deposits and borrowings from the public 115 G27 Liabilities to policyholders 116G 28 Debt securities in issue 117 G29 Other liabilities 117G30 Accrued expenses and prepaid income 118G 31 Provisions 118G32 Retirement benefit obligations 119G33 Subordinated liabilities 122
G34 Assets pledged as security for own liabilities 123 G35 Other assets pledged 123 G36 Contingent liabilities 123G37 Commitments 123 Other notes G38 Capital adequacy 124G 39 Classification of financial instruments 135 G40 Assets and liabilities at fair value 137 G41 Financial instruments set off on balance or subject to
netting agreements 147 G42 Discontinued operations and disposal groups
held for sale 148G43 Transfered assets and obtained collaterals 149 G44 Investments, customer bearing the risk 149G45 Maturity analysis for assets and liabilities 150 G46 Related-party transactions 152 G47 Credit risk disclosures 153G48 Interests in structured entities 160G49 Country by country reporting 161

Financial statements – Nordea Group
Nordea Annual Report 2014 61
EURm Note 2014 2013
Operating incomeInterest income 9,995 10,604Interest expense –4,513 –5,079Net interest income G3 5,482 5,525
Fee and commission income 3,799 3,574Fee and commission expense –957 –932Net fee and commission income G4 2,842 2,642
Net result from items at fair value G5 1,425 1,539Profit from associated undertakings accounted for under the equity method G19 18 79Other operating income G6 457 106Total operating income 10,224 9,891
Operating expensesGeneral administrative expenses: Staff costs G7 –3,149 –2,978 Other expenses G8 –1,635 –1,835Depreciation, amortisation and impairment charges of tangible and intangible assets G9 –582 –227Total operating expenses –5,366 –5,040
Profit before loan losses 4,858 4,851
Net loan losses G10 –534 –735Operating profit 4,324 4,116
Income tax expense G11 –953 –1,009Net profit for the year from continuing operations 3,371 3,107
Net profit for the year from discontinued operations, after tax G42 –39 9Net profit for the year 3,332 3,116
Attributable to:Shareholders of Nordea Bank AB (publ) 3,332 3,116Non-controlling interests — —Total 3,332 3,116
Basic earnings per share, EUR – Total operations G12 0.83 0.77Diluted earnings per share, EUR – Total operations G12 0.83 0.77Basic earnings per share, EUR – Continuing operations G12 0.84 0.77Diluted earnings per share, EUR – Continuing operations G12 0.84 0.77
Income statement, Group

Nordea Group – Financial statements
Nordea Annual Report 201462
Statement of comprehensive income, Group
EURm 2014 2013
Net profit for the year 3,332 3,116
Items that may be reclassified subsequently to the income statementCurrency translation differences during the year –1,039 –999Hedging of net investments in foreign operations: Valuation gains/losses during the year 435 464 Tax on valuation gains/losses during the year –96 –102Available for sale investments1:
Valuation gains/losses during the year 41 25 Tax on valuation gains/losses during the year –8 –5 Transferred to the income statement during the year –1 6 Tax on transfers to the income statement during the year 0 –1Cash flow hedges: Valuation gains/losses during the year 480 497 Tax on valuation gains/losses during the year –105 –111 Transferred to the income statement during the year –449 –499 Tax on transfers to the income statement during the year 98 110Items that may not be reclassified subsequently to the income statementDefined benefit plans: Remeasurement of defined benefit plans during the year –518 155 Tax on remeasurement of defined benefit plans during the year 120 –39Other comprehensive income, net of tax2 –1,042 –499Total comprehensive income 2,290 2,617
Attributable to:Shareholders of Nordea Bank AB (publ) 2,290 2,617Non-controlling interests — —Total 2,290 2,617
1) Valuation gains/losses related to hedged risks under fair value hedge accounting are accounted for directly in the income statement.2) Of which EUR –12m (EUR –22m) related to discontinued operations.

Financial statements – Nordea Group
Nordea Annual Report 2014 63
Balance sheet, Group
EURm Note 31 Dec 2014 31 Dec 2013 1 Jan 2013
AssetsCash and balances with central banks 31,067 33,529 36,060Loans to central banks G13 6,958 11,769 8,005Loans to credit institutions G13 12,217 10,743 10,569Loans to the public G13 348,085 342,451 346,251Interest-bearing securities G14 87,110 87,314 86,626Financial instruments pledged as collateral G15 12,151 9,575 7,970Shares G16 39,749 33,271 28,128Derivatives G17 105,119 70,992 118,789Fair value changes of the hedged items in portfolio hedge of interest rate risk G18 256 203 –711Investments in associated undertakings G19 487 630 585Intangible assets G20 2,908 3,246 3,425Properties and equipment 509 431 474Investment properties G22 3,227 3,524 3,408Deferred tax assets G11 130 62 266Current tax assets 132 31 78Retirement benefit assets G32 42 321 142Other assets G23 17,581 11,064 15,554Prepaid expenses and accrued income G24 1,614 2,383 2,559Assets held for sale G42 — 8,895 —Total assets 669,342 630,434 668,178
Liabilities Deposits by credit institutions G25 56,322 59,090 55,426Deposits and borrowings from the public G26 197,254 200,743 200,678Liabilities to policyholders G27 51,843 47,226 45,320Debt securities in issue G28 194,274 185,602 183,908Derivatives G17 97,340 65,924 114,203Fair value changes of the hedged items in portfolio hedge of interest rate risk G18 3,418 1,734 1,940Current tax liabilities 368 303 391Other liabilities G29 26,973 24,737 24,773Accrued expenses and prepaid income G30 1,943 3,677 3,903Deferred tax liabilities G11 983 935 976Provisions G31 305 177 389Retirement benefit liabilities G32 540 334 469Subordinated liabilities G33 7,942 6,545 7,797Liabilities held for sale G42 — 4,198 —Total liabilities 639,505 601,225 640,173
EquityNon-controlling interests 2 2 5
Share capital 4,050 4,050 4,050Share premium reserve 1,080 1,080 1,080Other reserves –1,201 –159 340Retained earnings 25,906 24,236 22,530Total equity 29,837 29,209 28,005Total liabilities and equity 669,342 630,434 668,178
Assets pledged as security for own liabilities G34 163,041 174,418 159,924Other assets pledged G35 11,265 7,467 10,344Contingent liabilities G36 22,017 20,870 21,157Credit commitments G37 74,291 78,332 84,914Other commitments G37 1,644 1,267 1,294

Nordea Group – Financial statements
Nordea Annual Report 201464
Statement of changes in equity, Group
Attributable to shareholders of Nordea Bank AB (publ)2
Other reserves:
EURmShare
capital1
Share premium
reserve
Transla-tion
of foreign operations
Cash flow
hedges
Available for sale invest-ments
Defined benefit
plansRetained earnings Total
Non- control-
ling interests
Total equity
Balance at 1 Jan 2014 4,050 1,080 –613 –18 81 391 24,236 29,207 2 29,209
Net profit for the year — — — — — — 3,332 3,332 — 3,332Items that may be reclassified subsequently to the income statementCurrency translation differences during the year — — –1,039 — — — — –1,039 — –1,039Hedging of net investments in foreign operations: Valuation gains/losses during the year — — 435 — — — — 435 — 435 Tax on valuation gains/losses during the year — — –96 — — — — –96 — –96
Available for sale investments: Valuation gains/losses during the year — — — — 41 — — 41 — 41
Tax on valuation gains/losses during the year — — — — –8 — — –8 — –8
Transferred to the income statement during the year — — — — –1 — — –1 — –1
Tax on transfers to the income statement during the year — — — — 0 — — 0 — 0
Cash flow hedges: Valuation gains/losses during the year — — — 480 — — — 480 — 480
Tax on valuation gains/losses during the year — — — –105 — — — –105 — –105
Transferred to the income statement during the year — — — –449 — — — –449 — –449
Tax on transfers to the income statement during the year — — — 98 — — — 98 — 98
Items that may not be reclassi-fied subsequently to the income statementDefind benefit plans: Remeasurement of defined benefit plans during the year — — — — — –518 — –518 — –518
Tax on remeasurement of defined benefit plans during the year — — — — — 120 — 120 — 120
Other comprehensive income, net of tax — — –700 24 32 –398 — –1,042 — –1,042Total comprehensive income — — –700 24 32 –398 3,332 2,290 — 2,290
Share-based payments — — — — — — 16 16 — 16Dividend for 2013 — — — — — — –1,734 –1,734 — –1,734Disposal of own shares3 — — — — — — 56 56 — 56Balance at 31 Dec 2014 4,050 1,080 –1,313 6 113 –7 25,906 29,835 2 29,837
1) Total shares registered were 4,050 million.2) Restricted capital was EUR 4,050m, unrestricted capital was EUR 25,785m.3) Refers to the change in the holding of own shares related to the Long Term Incentive Programme, trading portfolio and Nordea’s shares within portfolio schemes in Denmark.
The number of own shares were 23.0 million. The total holdings of own shares related to LTIP is 15.9 million.

Financial statements – Nordea Group
Nordea Annual Report 2014 65
Attributable to shareholders of Nordea Bank AB (publ)2
Other reserves:
EURmShare
capital1
Share premium
reserve
Transla-tion
of foreign operations
Cash flow
hedges
Available for sale invest-ments
Defined benefit
plansRetained earnings Total
Non- control-
ling interests
Total equity
Balance at 1 Jan 2013 4,050 1,080 24 –15 56 275 22,530 28,000 5 28,005
Net profit for the year — — — — — — 3,116 3,116 — 3,116Items that may be reclassified subsequently to the income statementCurrency translation differences during the year — — –999 — — — — –999 — –999Hedging of net investments in foreign operations: Valuation gains/losses during the year — — 464 — — — — 464 — 464 Tax on valuation gains/losses during the year — — –102 — — — — –102 — –102
Available for sale investments: Valuation gains/losses during the year — — — — 25 — — 25 — 25
Tax on valuation gains/losses during the year — — — — –5 — — –5 — –5
Transferred to the income statement during the year — — — — 6 — — 6 — 6
Tax on transfers to the income statement during the year — — — — –1 — — –1 — –1
Cash flow hedges: Valuation gains/losses during the year — — — 497 — — — 497 — 497
Tax on valuation gains/losses during the year — — — –111 — — — –111 — –111
Transferred to the income statement during the year — — — –499 — — — –499 — –499
Tax on transfers to the income statement during the year — — — 110 — — — 110 — 110
Items that may not be reclassi-fied subsequently to the income statementDefind benefit plans: Remeasurement of defined benefit plans during the year — — — — — 155 — 155 — 155
Tax on remeasurement of defined benefit plans during the year — — — — — –39 — –39 — –39
Other comprehensive income, net of tax — — –637 –3 25 116 — –499 — –499Total comprehensive income — — –637 –3 25 116 3,116 2,617 — 2,617
Share-based payments — — — — — — 17 17 — 17Dividend for 2012 — — — — — — –1,370 –1,370 — –1,370Purchases of own shares3 — — — — — — –57 –57 — –57Other changes — — — — — — — — –3 –3Balance at 31 Dec 2013 4,050 1,080 –613 –18 81 391 24,236 29,207 2 29,209
1) Total shares registered were 4,050 million.2) Restricted capital was EUR 4,050m, unrestricted capital was EUR 25,157m.3) Refers to the change in the holding of own shares related to the Long Term Incentive Programme, trading portfolio and Nordea’s shares within portfolio schemes in Denmark.
The number of own shares were 31.8 million. The total holdings of own shares related to LTIP is 18.3 million.
Dividends per shareSee Statement of changes in equity for the parent company, page 167.

Nordea Group – Financial statements
Nordea Annual Report 201466
Cash flow statement, Group – Total operationsEURm 2014 2013
Operating activitiesOperating profit 4,324 4,116Profit for the year from discontinued operations, after tax –39 9Adjustment for items not included in cash flow 8,137 4,492Income taxes paid –966 –1,010Cash flow from operating activities before changes in operating assets and liabilities 11,456 7,607
Changes in operating assetsChange in loans to central banks 1,853 –530Change in loans to credit institutions –1,050 289Change in loans to the public –17,359 –14,511Change in interest-bearing securities –3,785 –5,045Change in financial assets pledged as collateral –2,609 –1,648
Change in shares –7,196 –5,918Change in derivatives, net 155 –2,234Change in investment properties 169 –78Change in other assets –6,843 4,351
Changes in operating liabilitiesChange in deposits by credit institutions –4,398 6,564Change in deposits and borrowings from the public 568 9,205Change in liabilities to policyholders –765 –57Change in debt securities in issue 13,040 6,585Change in other liabilities 5,940 1,735Cash flow from operating activities –10,824 6,315
Investing activitiesSale of business operations 481 —Acquisition of associated undertakings –8 –8Sale of associated undertakings 480 4Acquisition of property and equipment –197 –153Sale of property and equipment 14 33Acquisition of intangible assets –343 –229Sale of intangible assets — 1Net divestments in debt securities, held to maturity 2,822 930Purchase/sale of other financial fixed assets 5 –6Cash flow from investing activities 3,254 572
Financing activitiesIssued subordinated liabilities 1,106 —Amortised subordinated liabilities –468 –500Divestment/repurchase of own shares including change in trading portfolio 56 –57Dividend paid –1,734 –1,370Cash flow from financing activities –1,040 –1,927Cash flow for the year –8,610 4,960
Cash and cash equivalents at the beginning of year 45,670 42,808Translation difference 2,623 –2,098Cash and cash equivalents at the end of year 39,683 45,670Change –8,610 4,960

Financial statements – Nordea Group
Nordea Annual Report 2014 67
Comments on the cash flow statementThe cash flow statement has been prepared in accordance with IAS 7. The cash flow statement shows inflows and outflows of cash and cash equivalents during the year for total operations. Nordea’s cash flow has been prepared in accordance with the indirect method, whereby operating profit is adjusted for effects of non-cash transactions such as depreciation and loan losses. The cash flows are classi-fied by operating, investing and financing activities.
Operating activitiesOperating activities are the principal revenue-producing activities and cash flows are mainly derived from the operating profit for the year with adjustment for items not included in cash flow and income taxes paid. Adjustment for items not included in cash flow includes:EURm 2014 2013
Depreciation 237 220Impairment charges 350 17Loan losses 620 837Unrealised gains/losses –457 2,180
Capital gains/losses (net) –391 –18Change in accruals and provisions –788 55Translation differences 1,070 407Change in bonus potential to policyholders, Life 918 1,046Change in technical reserves, Life 3,839 1,543Change in fair value of hedged items, assets/liabilities (net) 1,749 –1,608Income tax expense, discontinued operations 2 4Other 988 –191Total 8,137 4,492
Changes in operating assets and liabilities consist of assets and liabilities that are part of normal business activities, such as loans, deposits and debt securities in issue. Changes in derivatives are reported net. Cash flow from operating activities includes interest pay-ments received and interest expenses paid with the following amounts:
EURm 2014 2013
Interest payments received 10,319 11,031Interest expenses paid 4,698 5,360
Investing activitiesInvesting activities include acquisitions and disposals of non-current assets, like property and equipment, intangi-ble and financial assets.
Financing activitiesFinancing activities are activities that result in changes in equity and subordinated liabilities, such as new issues of shares, dividends and issued/amortised subordinated lia-bilities.
Cash and cash equivalentsThe following items are included in Cash and cash equiva-lents:
EURm 31 Dec
2014 31 Dec
2013
Cash and balances with central banks 31,067 33,529Loans to central banks, payable on demand 6,454 9,313Loans to credit institutions, payable on demand 2,162 2,290Assets held for sale — 538Total 39,683 45,670
Cash comprises legal tender and bank notes in foreign currencies. Balances with central banks consist of deposits in accounts with central banks and postal giro systems under government authority, where the following condi-tions are fulfilled;– the central bank or the postal giro system is domiciled in
the country where the institution is established– the balance on the account is readily available at any time.
Loans to credit institutions, payable on demand include liquid assets not represented by bonds or other interest-bearing securities. Loans to central banks, payable on demand includes instruments where Nordea has the right to resell immediately.
Discontinued operationsThe cash flow statements include cash flow attributable to total operations i.e. both continuing and discontinued operations. The discontinued operations consist of Nordea s Polish operations, for more information see Note G1 and Note G42. The cash flows related to the discontin-ued operations, excluding the cash flows at the closing of the transaction, consist of net cash flows from operating activities of EUR –379m (EUR –15m), net cash flow from investing activities of EUR –14m (EUR –11m) and net cash flows from financing activities of EUR 1m (EUR 0m).

Nordea Group – Financial statements
Nordea Annual Report 201468
Quarterly development, Group
EURm Q4 2014 Q3 2014 Q2 2014 Q1 2014 Q4 2013 Q3 2013 Q2 2013 Q1 2013 2014 2013
Net interest income 1,356 1,396 1,368 1,362 1,390 1,386 1,391 1,358 5,482 5,525Net fee and commission income 763 667 708 704 703 652 664 623 2,842 2,642Net result from items at fair value 367 291 356 411 333 346 416 444 1,425 1,539Profit from associated undertakings accounted for under the equity method –1 7 3 9 21 14 9 35 18 79Other operating income 28 393 21 15 22 28 10 46 457 106Total operating income 2,513 2,754 2,456 2,501 2,469 2,426 2,490 2,506 10,224 9,891
General administrative expenses: Staff costs –758 –728 –907 –756 –739 –732 –753 –754 –3,149 –2,978 Other expenses –416 –378 –415 –426 –480 –441 –453 –461 –1,635 –1,835
Depreciation, amortisation and impairment charges of tangible and intangible assets –53 –410 –64 –55 –64 –61 –50 –52 –582 –227Total operating expenses –1,227 –1,516 –1,386 –1,237 –1,283 –1,234 –1,256 –1,267 –5,366 –5,040
Profit before loan losses 1,286 1,238 1,070 1,264 1,186 1,192 1,234 1,239 4,858 4,851
Net loan losses –129 –112 –135 –158 –180 –171 –186 –198 –534 –735Operating profit 1,157 1,126 935 1,106 1,006 1,021 1,048 1,041 4,324 4,116
Income tax expense –280 –188 –219 –266 –246 –257 –248 –258 –953 –1,009Net profit for the period from continuing operations 877 938 716 840 760 764 800 783 3,371 3,107
Net profit for the period from discon-tinued operations, after tax 0 0 –30 –9 13 12 –29 13 –39 9
Net profit for the year 877 938 686 831 773 776 771 796 3,332 3,116
Diluted earnings per share (DEPS), EUR – Total operations 0.22 0.23 0.17 0.21 0.19 0.19 0.19 0.20 0.83 0.77DEPS, rolling 12 months up to period end, EUR – Total operations 0.83 0.80 0.76 0.78 0.77 0.79 0.77 0.79 0.83 0.77

Financial statements – Nordea Group
Nordea Annual Report 2014 69
5 year overview, Group
Income statement1
EURm 2014 2013 2012 2011 2010
Net interest income 5,482 5,525 5,563 5,456 5,159Net fee and commission income 2,842 2,642 2,468 2,395 2,156Net result from items at fair value 1,425 1,539 1,774 1,517 1,837Profit from associated undertakings accounted for under the equity method 18 79 93 42 66Other operating income 457 106 100 91 116Total operating income 10,224 9,891 9,998 9,501 9,334
General administrative expenses: Staff costs –3,149 –2,978 –2,989 –3,113 –2,784 Other expenses –1,635 –1,835 –1,808 –1,914 –1,862Depreciation, amortisation and impairment charges of tangible and intangible assets –582 –227 –267 –192 –170Total operating expenses –5,366 –5,040 –5,064 –5,219 –4,816
Profit before loan losses 4,858 4,851 4,934 4,282 4,518
Net loan losses –534 –735 –895 –735 –879Operating profit 4,324 4,116 4,039 3,547 3,639
Income tax expense –953 –1,009 –970 –913 –976Net profit for the year from continuing operations 3,371 3,107 3,069 2,634 2,663
Net profit for the year from discontinued operations, after tax –39 9 57 — —Net profit for the year 3,332 3,116 3,126 2,634 2,663
Balance sheet2
EURm31 Dec
201431 Dec
201331 Dec
201231 Dec
201131 Dec
2010
Cash and balances with central banks 31,067 33,529 36,060 3,765 10,023Loans to central banks and credit institutions 19,175 22,512 18,574 51,865 15,788Loans to the public 348,085 342,451 346,251 337,203 314,211Interest-bearing securities and pledged instruments 99,261 96,889 94,596 92,923 91,743Derivatives 105,119 70,992 118,789 171,943 96,825
Other assets 66,635 55,166 53,908 43,432 52,249
Assets held for sale — 8,895 — — —Total assets 669,342 630,434 668,178 701,131 580,839
Deposits by credit institutions 56,322 59,090 55,426 55,316 40,736Deposits and borrowings from the public 197,254 200,743 200,678 190,092 176,390
Liabilities to policyholders 51,843 47,226 45,320 40,715 38,766Debt securities in issue 194,274 185,602 183,908 178,028 151,578Derivatives 97,340 65,924 114,203 167,390 95,887Subordinated liabilities 7,942 6,545 7,797 6,503 7,761Other liabilities 34,530 31,897 32,841 37,442 45,183Liabilities held for sale — 4,198 — — —Equity 29,837 29,209 28,005 25,645 24,538Total liabilities and equity 669,342 630,434 668,178 701,131 580,839
1) The comparative figures for 2010–2011 have not been restated in relation to discontinued operations (Nordea´s Polish operations), see Note G42 for more information.2) The comparative figures for 2010 have not been restated in relation to the amendment to IAS 19 and forward starting bonds, see Note G1 in the Annual report 2013 for more
information.

Nordea Group – Financial statements
Nordea Annual Report 201470
2014 2013 20122,3 20112,3 20102,3
Basic earnings per share, EUR – Total operations 0.83 0.77 0.78 0.65 0.66Diluted earnings per share, EUR – Total operations 0.83 0.77 0.78 0.65 0.66Share price1, EUR 9.68 9.78 7.24 5.98 8.16Total shareholders’ return, % 9.2 44.6 21.0 –24.4 3.7Proposed/actual dividend per share, EUR 0.62 0.43 0.34 0.26 0.29Equity per share1, EUR 7.40 7.27 6.96 6.47 6.07Potential shares outstanding1, million 4,050 4,050 4,050 4,047 4,043Weighted average number of diluted shares, million 4,031 4,020 4,026 4,028 4,022Return on equity, % – Continuing operations 11.5 11.0 11.6 10.6 11.5Return on assets, % – Total operations 0.50 0.49 0.47 0.38 0.46Assets under management1, EURbn 262.2 232.1 218.3 187.4 191.0Cost/income ratio7, % – Continuing operations 49 51 51 55 52Loan loss ratio, basis points 15 21 26 23 31Common Equity Tier 1 capital ratio excluding Basel I floor1,4,5 ,% 15.7 14.9 13.1 11.2 10.3
Tier 1 capital ratio, excluding Basel I floor1,4,5, % 17.6 15.7 14.3 12.2 11.4Total capital ratio, excluding Basel I floor1,4,5, % 20.7 18.1 16.2 13.4 13.4Core tier 1 capital1,4,5, EURm 22,821 23,112 21,961 20,677 19,103Tier 1 capital1,4,5, EURm 25,558 24,444 23,953 22,641 21,049Risk exposure amount, excluding Basel I floor1,6, EURbn 145 155 168 185 185Number of employees (full-time equivalents)1 – Continuing operations 29,397 29,429 29,491 33,068 33,809
Risk-adjusted profit6, EURm – Continuing operations 3,489 3,352 3,313 2,714 2,622
Economic profit6, EURm – Continuing operations 1,071 912 889 1,145 936Economic capital1,6, EURbn – Total operations 23.9 24.4 23.8 17.7 17.5Economic capital1,6, EURbn – Continuing operations 23.9 23.5 22.8 — —RAROCAR6, % – Continuing operations 14.4 13.7 13.9 15.5 15.0MCEV, EURm 4,758 4,700 3,762 2,714 3,655
Ratios and key figures, Group
1) End of the year.2) The comparative figures for 2010–2011 have not been restated due to discontinued operations (Nordea´s Polish operations), see Note G42 for more information.3) The comparative figures for 2010 have not been restated due to the amendment to IAS 19 and forward starting bonds, see Note G1 in the Annual report 2013 for more
information.4) Including result of the year.5) 2013 ratios are reported under the Basel II regulation framework and 2014 ratios are reported using the Basel III (CRR/CRDIV) framework. 6) Capital deductions and physical assest (PAS) are included in 2013 and 2014 ratios.7) Excluding non-recurring items in 2014.

Financial statements – Nordea Group
Nordea Annual Report 2014 71
Allowances in relation to impaired loans Allowances for individually assessed impaired loans divided by individually assessed impaired loans before allowances.
Basic earnings per share Net profit for the year divided by the weighted aver-age number of outstanding shares, non-controlling interests excluded.
Cost of equity (%) Required return by investors on the Nordea share, meas-ured as the long risk free euro rate plus required average risk premium to invest in equities multiplied by Beta, which reflects the Nordea share’s volatility and correlation with market volatility.
Cost of equity in EUR is defined as Cost of equity (%) times Economic capi-tal. The Cost of equity is set by manage-ment once a year as a parameter to man-age risk appetite and investment level.
Cost/income ratio Total operating expenses divided by total operating income.
Diluted earnings per share Net profit for the year divided by the weighted average number of outstanding shares after full dilution, non-controlling inter-ests excluded.
Economic capital (EC) Internal esti-mate of required capital and measures the capital required to cover unexpected losses in the course of its business with a certain probability. EC uses advanced internal models to provide a consistent measurement for Credit Risk, Market Risk, Operational Risk, Business Risk and Life Insurance Risk arising from activities in Nordea’s various business areas.
The aggregation of risks across the group gives rise to diversification effects resulting from the differences in risk drivers and the improbability that unexpected losses occur simultaneously.
Economic profit Deducting Cost of equity from Risk-adjusted profit.
Equity per share Equity as shown on the balance sheet after full dilution and non-controlling interests excluded divided by the number of shares after full dilution.
Expected losses Normalised loss level of the individual loan exposure over a busi-ness cycle as well as various portfolios.
Impairment rate, gross Individually assessed impaired loans before allow-ances divided by total loans before allowances.
Impairment rate, net Individually assessed impaired loans after allow-ances divided by total loans before allowances.
Loan loss ratio Net loan losses (annual-ised) divided by closing balance of loans to the public (lending).
MCEV (Market Consistent Embedded Value) Estimate of the value a share-holder would put on a portfolio of in-force life and pension business based on objective market return. No franchise value or other additional value is included in MCEV.
Non-performing, not impaired Past due loans, not impaired due to future cash flows (included in Loans, not impaired).
Own funds Own funds include the sum of the Tier 1 capital and the supplemen-tary capital consisting of subordinated loans, after deduction of the carrying amount of the shares in wholly owned insurance companies and the potential deduction for expected shortfall.
Price to Book Nordea’s stock market value relative to its book value of total equity.
RAROCAR, % (Risk-adjusted return on capital at risk), Risk-adjusted profit relative to Economic capital.
Return on equity Net profit for the year excluding non-controlling interests as a percentage of average equity for the year. Average equity including net profit for the year and dividend until paid, non-controlling interests excluded. Return on assets Net profit for the year as a percentage of total assets at end of the year.
Risk-adjusted profit Total income minus total operating expenses, minus Expected losses and standard tax (24 % 2014). In addition, Risk-adjusted profit excludes major non-recurring items.
Risk exposure amount Total assets and off-balance-sheet items valued on the basis of the credit and market risks, as well as operational risks of the Group’s undertakings, in accordance with regu-lations governing capital adequacy, excluding assets in insurance compa-nies, carrying amount of shares which have been deducted from the capital base and intangible assets.
Tier 1 capital Proportion of the capital base, which includes consolidated shareholders’ equity excluding invest-ments in insurance companies, pro-posed dividend, deferred tax assets, intangible assets in the banking opera-tions. Shortfall is deducted with 100% in CET1 in 2014, but 50% in 2013, – the negative difference between expected losses and provisions. Subsequent to the approval of the supervisory authori-ties, Tier 1 capital also includes quali-fied forms of subordinated loans (Tier 1 capital contributions and hybrid capital loans).
The Common equity Tier 1 capital constitutes the Tier 1 capital excluding hybrid capital loans.
Tier 1 capital ratio Tier 1 capital as a percentage of risk exposure amount. The Common equity Tier 1 capital ratio is cal-culated as Common equity Tier 1 capital as a percentage of risk exposure amount.
Total allowance rate Total allowances divided by total loans before allowances.
Total allowances in relation to impaired loans (provisioning ratio) Total allowances divided by impaired loans before allowances.
Total capital ratio Own funds as a percentage of risk exposure amount.
Total shareholders return (TSR) Total shareholders return measured as growth in the value of a shareholding during the year, assuming the divi-dends are reinvested at the time of the payment to purchase additional shares.
Business definitions

Nordea Group – Accounting policies
Nordea Annual Report 201472
Content for Note G1 1. Basis for presentation 72 2. Changed accounting policies and presentation 72 3. Changes in IFRSs not yet applied by Nordea 72 4. Critical judgements and estimation uncertainty 73 5. Principles of consolidation 76 6. Recognition of operating income and impairment 77 7. Income recognition life insurance 79 8. Recognition and derecognition of financial instruments on the balance sheet 79 9. Translation of assets and liabilities denominated in foreign currencies 8010. Hedge accounting 8011. Determination of fair value of financial instruments 8112. Cash and balances with central banks 8213. Financial instruments 8214. Loans to the public/credit institutions 8415. Leasing 8616. Intangible assets 8617. Properties and equipment 8718. Investment properties 8719. Liabilities to policyholders 8720. Taxes 88 21. Earnings per share 8922. Employee benefits 8923. Equity 9024. Financial guarantee contracts and credit commitments 9025. Share-based payment 9026. Related party transactions 9127. Exchange rates 91
1. Basis for presentationNordea’s consolidated financial statements are prepared in accordance with International Financial Reporting Stand-ards (IFRS) as endorsed by the EU Commission. In addi-tion, certain complementary rules in the Swedish Annual Accounts Act for Credit Institutions and Securities Com-panies (1995:1559) and the accounting regulations of the Swedish Financial Supervisory Authority (FFFS 2008:25, with amendments in FFFS 2009:11, 2011:54, 2013:2, 2013:24 and 2014:18) have also been applied.
The disclosures, required in the standards, recommen-dations and legislation above, have been included in the notes, the Risk, Liquidity and Capital management section or in other parts of the “Financial statements”.
On 5 February 2015 the Board of Directors approved the financial statements, subject to final approval of the Annual General Meeting on 19 March 2015.
2. Changed accounting policies and presentationThe accounting policies, basis for calculations and presen-tation are, in all material aspects, unchanged in compari-son with the 2013 Annual Report. The new accounting requirements implemented during 2014 and their effects on Nordea’s financial statements are described below.
IFRS 10 “Consolidated Financial Statements”, IFRS 11 “Joint Arrangements”, IFRS 12 “Disclosures of Interests in Other Entities”, and IAS 28 “Investments in Associates and Joint Ventures”The new standards IFRS 10 ”Consolidated Financial State-ments”, IFRS 11 ”Joint Arrangements” and IFRS 12 “Disclo-
sures of Interests in Other Entities” as well as amendments to IAS 28 “Investments in Associates and Joint Ventures” were implemented 1 January 2014 but has not had any sig-nificant impact on the financial statements of Nordea.
IFRS 10 clarifies which entities should be included in the consolidated accounts and how to perform the consolida-tion. IFRS 10 did not change the scope of consolidation for Nordea in 2014. IFRS 11 describes the accounting for investments in entities in which two or more investors have joint control, typically a 50/50 holding. Nordea has currently no such interests and IFRS 11 has not had any impact on the financial statements in 2014. IFRS 12 has added disclosures, mainly regarding unconsolidated struc-tured entities. These disclosures can be found in note G48 “Interests in structured entities”. The standard also includes guidance on disclosures for subsidiaries and asso-ciates, but these disclosure requirements are similar to the previous disclosure requirements in IAS 27 and IAS 28.
The accounting requirements in IAS 28 are unchanged apart from that the disclosure requirements have been moved to IFRS 12.
FFFS 2008:25 The Swedish Financial Supervisory Authority has amended the accounting regulation FFFS 2008:25 by issuing FFFS 2013:24 and FFFS 2014:18. Those amendments were imple-mented by Nordea 1 January 2014 except for the amend-ments in FFFS 2014:18 that were implemented in the third quarter 2014. The amendments require additional disclo-sures related to capital adequacy and specific country by country information which are presented in Note G38 “Capital adequacy” and Note G49 “Country by country reporting” respectively. Other amendments in FFFS 2013:24 and FFFS 2014:18 have not had any significant impact on Nordea’s financial statements.
Discontinued operations and disposal groups held for sale On 1 April 2014 Nordea completed its sale of the Polish bank, life and finance businesses, including Nordea Bank Polska S.A., Nordea Finance Polska S.A. and Nordea Polska Towarzystwo Ubezpieczen na Zycie S.A., to PKO Bank Pol-ski. These operations are reported as discontinued opera-tions for the period until deconsolidation on 1 April. Dis-continued operations also include the IT operations in Poland that continue to serve the sold business. Details of discontinued operations are found in Note G42 “Discon-tinued operations and disposal groups held for sale”.
3. Changes in IFRSs not yet applied by NordeaIFRS 9 ”Financial instruments”IASB has during 2014 completed the new standard for financial instruments, IFRS 9 “Financial instruments”. IFRS 9 covers classification and measurement, impairment and general hedging and replaces the current require-ments for these areas in IAS 39. IFRS 9 is effective as from annual periods beginning on or after 1 January 2018. Ear-lier application is permitted. The EU commission has not yet endorsed IFRS 9 but is expected to do so during 2015. Nordea does not currently intend to early adopt the stand-ard.
The changes in classification and measurement are not expected to have a significant impact on Nordea’s income
G1 Accounting policies

Accounting policies – Nordea Group
Nordea Annual Report 2014 73
statement or balance sheet as the mixed measurement model will be maintained. Significant reclassifications between fair value and amortised cost or impact on the capital adequacy and large exposures are not expected in the period of initial application, but this is naturally dependent on the financial instruments on Nordea’s bal-ance sheet at transition. Nordea has not yet finalised the impact assessment.
The impairment requirements in IFRS 9 are based on an expected loss model as opposed to the current incurred loss model in IAS 39. In general, it is expected that the new requirements will increase loan loss provisions, decrease equity and have a negative impact on capital adequacy, but no impact on large exposures, in the period of initial appli-cation. Nordea has not yet finalised the impact assessment.
The main change to the general hedging requirements is that the standard aligns hedge accounting more closely with the risk management activities. As Nordea generally uses macro (portfolio) hedge accounting Nordea’s assess-ment is that the new requirements will not have any signifi-cant impact on Nordea’s financial statements, capital ade-quacy, or large exposures in the period of initial application. Nordea has not yet finalised the impact assessment.
IFRS 15 “Revenue from Contracts with Customers”The IASB has published the new standard, IFRS 15 “Reve-nue from Contracts with Customers”. The new standard outlines a single comprehensive model of accounting for revenue arising from contracts with customers and super-sedes current revenue recognition standards and interpre-tations within IFRS, such as IAS 18 “Revenue”. The new standard is effective for annual periods beginning on or after 1 January 2017, with earlier application permitted. The EU-commission is expected to endorse the standard during the second quarter 2015. Nordea does not currently intend to early adopt the standard. The standard does not apply to financial instruments, insurance contracts or lease contracts. Nordea has not finalised the investigation of the impact on the financial statements but the current assessment is that the new standard will not have any sig-nificant impact on Nordea’s financial statements, capital adequacy, or large exposures in the period of initial appli-cation.
Amendments to IFRS 11 “Accounting for Acquisition of Interest in Joint Operations”The IASB has issued amendments to IFRS 11 “Joint Arrangements”, which add new guidance on how to account for the acquisition of an interest in a joint operation that constitutes a business. The amendments are effective for annual periods beginning on or after I January 2016. Earlier application is permitted. The EU commission is expected to endorse the amendment during the first quar-ter 2015. Nordea does not currently intend to early adopt the amendments. As Nordea does not have any joint ven-ture the assessment is that the amendments will not have any effects on Nordea’s financial statements, capital ade-quacy or large exposures in the period of initial application.
Amendments to IFRS 10 and IAS 28 “Sale or Contribution of Assets between an Investor and its Associate or Joint Venture”The IASB has amended the requirements in IFRS 10 and IAS 28 regarding sales and contribution of assets between an investor and its associate or joint venture due to incon-sistent treatment of gains and losses of such transactions in those standards. The amendments should be applied prospectively to transactions that occur in annual periods beginning on or after 1 January 2016. Earlier application is permitted. The EU commission is expected to endorse the amendments during the fourth quarter 2015. Nordea does not currently intend to early adopt the amendments. The new requirements are not expected to have any effect on Nordea’s financial statements, capital adequacy, or large exposures in the period of initial application as the new requirements are in line with Nordea’s current accounting policies.
IFRIC 21 “Levies”The IASB has published IFRIC 21 “Levies”. The interpreta-tion is effective for annual periods beginning on or after 1 January 2014. The EU commission endorsed this interpre-tation during 2014. In contrast to IFRS, the EU commission requires the standard to be applied for annual periods beginning on or after 17 June 2014. Nordea will apply the interpretation as from 1 January 2015. IFRIC 21 is an inter-pretation of IAS 37 “Provisions, Contingent Liabilities and Contingent Assets”. IFRIC 21 clarifies that if a levy is trig-gered by operating as a bank at the end the reporting period, the liability for the levy is not recognised prior to that date. Nordea’s assessment is that the new interpreta-tion will not have any significant impact on Nordea’s financial statements, capital adequacy, or large exposures in the period of initial application.
Other changes in IFRSThe IASB has published the following new or amended standards that are assessed to have no impact on Nordea’s financial statement, capital adequacy or large exposures in the period of initial application:
IFRS 14 “Regulatory Deferral Accounts”Amendments to IAS 16 and IAS 38: ”Clarification of Acceptable Methods of Depreciation and Amortisation”Amendments to IAS 19: “Defined Benefit Plans: Employee Contributions”“Annual Improvements to IFRSs, 2010–2012 Cycle”“Annual Improvements to IFRSs, 2011–2013 Cycle” “Annual Improvements to IFRSs, 2012–2014 Cycle”
4. Critical judgements and estimation uncertaintyThe preparation of financial statements in accordance with generally accepted accounting principles requires, in some cases, the use of judgements and estimates by manage-ment. Actual outcome can later, to some extent, differ from the estimates and the assumptions made. In this section a description is made of:
the sources of estimation uncertainty at the end of the reporting period, that have a significant risk of result-ing in a material adjustment to the carrying amount of assets and liabilities within the next financial year, and
G1 Accounting policies

Nordea Group – Accounting policies
Nordea Annual Report 201474
-
-
-
Fair value measurement of certain financial instruments
-
-
-
-
-
-
-
Impairment testing of goodwill
-
-
Impairment testing of loans to the public/credit institutions
-
-
-
-
-
-
G1 Accounting policies

Accounting policies – Nordea Group
Nordea Annual Report 2014 75
Effectiveness testing of cash flow hedgesNordea’s accounting policies for cash flow hedges are described in section 10 “Hedge accounting”.
One important judgement in connection to cash flow hedge accounting is the choice of method used for effec-tiveness testing.
Where Nordea applies cash flow hedge accounting the hedging instruments used are predominantly cross cur-rency interest rate swaps, which are always held at fair value. The currency component is designated as a cash flow hedge of currency risk and the interest component as a fair value hedge of interest rate risk. The hypothetical derivative method is used when measuring the effectiveness of these cash flow hedges, meaning that the change in a perfect hypothetical swap is used as proxy for the present value of the cumulative change in expected future cash flows on the hedged transaction (the currency component). Critical judgement has to be exercised when defining the character-istics of the perfect hypothetical swap.
Actuarial calculations of pension liabilities and plan assets related to employeesNordea’s accounting policy for post-employment benefits is described in section 22 “Employee benefits”.
The defined benefit obligation for major pension plans is calculated by external actuaries using demographic assumptions based on the current population. As a basis for these calculations a number of actuarial and financial parameters are used.
The estimation of the discount rate is subject to uncer-tainty around whether corporate bond markets are deep enough, of high quality and also in connection to the extrapolation of yield curves to relevant maturities. In Swe-den, Norway and Denmark the discount rate is determined with reference to covered bonds and in Finland with refer-ence to corporate bonds. Other parameters, like assump-tions about salary increases and inflation, are based on the expected long-term development of these parameters and also subject to estimation uncertainty. The main parameters used at year-end are disclosed in Note G32 “Retirement benefit obligations” together with a description of the sensi-tivity to changes in assumptions. The defined benefit obli-gation was EUR 3,727m (EUR 3,130m) at the end of the year.
Actuarial calculations of insurance contractsNordea’s accounting policy for insurance contracts is described in section 19 “Liabilities to policyholders”.
A valuation of insurance liabilities includes estimations and assumptions, both financial and actuarial. One of the important financial assumptions is the interest rate used for discounting future cash flows. Important actuarial assumptions are those on mortality and disability, which affect the size and timing of the future cash flows. The financial and actuarial assumptions are, to a large extent, stipulated in local legislation and therefore not under Nor-dea’s discretion. Also assumptions about future adminis-trative and tax expenses have an impact on the calculation of policyholder liabilities.
The insurance liability was EUR 35,103m (EUR 33,489m) at the end of the year. The carrying amount’s sensitivity to different assumptions is disclosed in Note G27 “Liabilities to policyholders”.
Valuation of investment propertiesNordea’s accounting policies for investment properties are described in section 18 “Investment properties”.
Investment properties are measured at fair value. As there normally are no active markets for investment prop-erties, the fair values are estimated based on discounted cash flow models. These models are based on assumptions on future rents, vacancy levels, operating and mainte-nance costs, yield requirements and interest rates.
The carrying amounts of investment properties were EUR 3,227m (EUR 3,524m) at the end of the year. See Note G22 “Investment properties” for more information on amounts and parameters used in these models.
Classification of leasesNordea’s accounting policies for leases are described in section 15 “Leasing”.
Critical judgement has to be exercised when classifying lease contracts. A lease is classified as a finance lease if it transfers substantially all the risks and rewards related to ownership. A lease is classified as an operating lease if it does not transfer substantially all the risks and rewards related to ownership.
The central district properties in Finland, Norway and Sweden that Nordea has divested are leased back. The duration of the lease agreements was initially 3–25 years with renewal options. The lease agreements include no transfers of ownerships of the assets by the end of the lease term, nor any economic benefit from appreciation in value of the leased properties. In addition, the lease term is not for the major part of the assets’ economic life. As a result, Nordea has classified these leases as operating leases. This judgement is a critical judgement that has a significant impact on the carrying amounts in the finan-cial statement. The carrying amount of these properties at the time of disposal was EUR 1.5bn.
More information on lease contracts can be found in Note G21 “Leasing”.
Classification of additional tier 1 instrumentsNordea has issued perpetual subordinated instruments where the interest payments to the holders are at the discre-tion of Nordea and non-accumulating. These instruments also include a requirement for Nordea to pay interest if the instruments are no longer allowed to be included in tier 1 capital. If there is a requirement to pay interest based on the occurrence or non-occurrence of an uncertain future event that is beyond the control of both the issuer and the holder of the instrument, the instrument shall be classified as a financial liability. The inclusion of the subordinated loan in tier 1 capital is decided by the regulators and is thus beyond the control of Nordea and the holders of the instrument. Nordea classifies the instrument as financial liabilities.
Assessing control for consolidation purposesOne decisive variable when assessing if Nordea controls another entity is whether Nordea is exposed to variability in returns from the investment. For structured entities where voting rights are not the dominant factor when determining control, critical judgement has to be exercised when defining when Nordea is exposed to significant variability in returns. Nordea’s critical judgement is that Nordea is normally
G1 Accounting policies

Nordea Group – Accounting policies
Nordea Annual Report 201476
exposed to variability in returns when Nordea receives more than 30% of the return produced by the structured entity. This is only relevant for structured entities where Nordea also is the investment manager and thus have influence over the return produced by the structured entity.Another judgement relating to control is whether Nordea acts as an agent or as a principal. For unit linked and other contracts where the policyholder/depositor decides both the amount and which assets to invest in, Nordea is considered to act as an agent and thus does not have control. Translation of assets and liabilities denominated in foreign currenciesNordea’s accounting policies covering the translation of assets and liabilities denominated in foreign currencies is described in section 9 “Translation of assets and liabilities denominated in foreign currencies”.
When reporting consolidated financial statements, the parent company Nordea Bank AB (publ) has been assessed to have two functional currencies, SEK and EUR, based on the different activities. The functional currency of the nor-mal banking operations is SEK and the functional cur-rency of the entity holding equity, shares in group under-takings and the funding of those shares is EUR. It is Nordea’s assessment that one legal entity can consist of different entities with different functional currencies.
Valuation of deferred tax assetsNordea’s accounting policy for the recognition of deferred tax assets is described in section 20 “Taxes” and Note G11 “Taxes”.
The valuation of deferred tax assets is influenced by man-agement’s assessment of Nordea’s future profitability and sufficiency of future taxable profits and future reversals of existing taxable temporary differences. These assessments are updated and reviewed at each balance sheet date, and are, if necessary, revised to reflect the current situation.
The carrying amount of deferred tax assets was EUR 130m (EUR 62m) at the end of the year.
Claims in civil lawsuitsWithin the framework of the normal business operations, Nordea faces a number of claims in civil lawsuits and dis-putes, most of which involve relatively limited amounts. Presently, none of the current disputes are considered likely to have any significant adverse effect on Nordea or its financial position. See also Note G31 “Provisions” and Note G36 “Contingent liabilities”.
5. Principles of consolidationConsolidated entitiesThe consolidated financial statements include the accounts of the parent company Nordea Bank AB (publ), and those entities that the parent company controls. Control exists when Nordea is exposed to variability in returns from its investments in another entity and has the ability to affect those returns through its power over the other entity. Control is generally achieved when the parent company owns, directly or indirectly through group undertakings, more than 50 per cent of the voting rights. For entities where voting rights does not decide control, see section “Structured entities” below.
All group undertakings are consolidated using the acquisition method, except for the forming of Nordea in 1997–98 when the holding in Nordea Bank Finland Plc was consolidated using the pooling method. Under the acqui-sition method, the acquisition is regarded as a transaction whereby the parent company indirectly acquires the group undertaking’s assets and assumes its liabilities and contin-gent liabilities. The group’s acquisition cost is established in a purchase price allocation analysis. In such analysis, the cost of the business combination is the aggregate of the fair values, at the date of exchange, of assets given, lia-bilities incurred or assumed and equity instruments issued by the acquirer, in exchange for the identifiable net assets acquired. Costs directly attributable to the business combination are expensed.
As at the acquisition date Nordea recognises the identi-fiable assets acquired and the liabilities assumed at their acquisition date fair values.
For each business combination Nordea measures the non-controlling interest in the acquired business either at fair value or at their proportionate share of the acquired identifiable net assets.
When the aggregate of the consideration transferred in a business combination and the amount recognised for non-controlling interest exceeds the net fair value of the identifi-able assets, liabilities and contingent liabilities, the excess is reported as goodwill. If the difference is negative, such dif-ference is recognised immediately in the income statement.
Equity and net income attributable to non-controlling interests are separately disclosed on the balance sheet, income statement and statement of comprehensive income.
Intra-group transactions and balances between the con-solidated group undertakings are eliminated.
The group undertakings are included in the consoli-dated accounts as from the date on which control is trans-ferred to Nordea and are no longer consolidated as from the date on which control ceases.
In the consolidation process the reporting from the group undertakings is adjusted to ensure consistency with the IFRS principles applied by Nordea.
Note P21 “Investments in group undertakings” lists the major group undertakings in the Nordea Group.
Investments in associated undertakingsThe equity method of accounting is used for associated undertakings where the share of voting rights is between 20 and 50 per cent and/or where Nordea has significant influ-ence. Significant influence is the power to participate in the financial and operating decisions of the investee but is not control over those policies. Investments within Nordea’s investment activities, which are classified as a venture capi-tal organisation within Nordea, are measured at fair value in accordance with the rules set out in IAS 28 and IAS 39. Fur-ther information on the equity method is disclosed in sec-tion 6 “Recognition of operating income and impairment”.
Profits from companies accounted for under the equity method are reported post-taxes in the income statement. Consequently, the tax expense related to these profits is not included in the income tax expense for Nordea.
Nordea does generally not have any sales or contribution of assets to or from associated undertakings. Other transac-tions between Nordea and its associates are not eliminated.
G1 Accounting policies

Accounting policies – Nordea Group
Nordea Annual Report 2014 77
Note G19 “Investments in associated undertakings” lists the major associated undertakings in the Nordea Group.
Structured entitiesA structured entity is an entity created to accomplish a narrow and well defined objective where voting rights are not the dominant factor in determining control. Often legal arrangements impose strict limits on the decision making powers of the management over the on-going activities of a structured entity. The same consolidation requirements apply to these entities, but as voting rights do not decide whether control exists, other factors are used to determine control.
Power can exist due to agreements or other types of influence over a structured entity. Nordea normally has power over entities sponsored or established by Nordea. Nordea has created a number of structured entities to allow clients to invest in assets invested in by the struc-tured entity. Some structured entities invest in tradable financial instruments, such as shares and bonds (mutual funds). Structured entities can also invest in structured credit products or acquire assets from customers of Nor-dea, although only one such structured entity currently exists. Nordea is generally the investment manager and has sole discretion about investments and other adminis-trative decisions and thus has power over these entities.
Typically, Nordea will receive service and commission fees in connection with the creation of the structured entity, or because it acts as investment manager, custodian or in some other function. Such income is normally not significant enough to expose Nordea to variability in returns and will thus not trigger consolidation. In some structured entities Nordea has also supplied substantial parts of the funding in the form of fund units, loans or credit commitments. In these structured entities Nordea is exposed to variability in returns and as the power over these entities affects the return, these structured entities are consolidated. Nordea normally con-siders a share of more than 30% of the return produced by a structured entity to give rise to variability and thus give con-trol. Variability is measured as the sum of fees received and revaluation of assets held. For unit linked and other contracts where the policyholder/depositor decide both the amount and which assets to invest in, Nordea is considered to act as an agent and does thus not have control.
Further information about consolidated and unconsoli-dated structured entities is disclosed in note G48 “Inter-ests in structured entities”.
Currency translation of foreign entitiesThe consolidated financial statements are prepared in euro (EUR), the presentation currency of the parent com-pany Nordea Bank AB (publ). The current method is used when translating the financial statements of foreign enti-ties into EUR from their functional currency. The assets and liabilities of foreign entities have been translated at the closing rates, while items in the income statement and statement of comprehensive income are translated at the average exchange rate for the year. Translation differences are accounted for in other comprehensive income and are accumulated in the translation reserve in equity.
Goodwill and fair value adjustments arising from the acquisition of group undertakings are treated as items in the
same functional currency as the cash generating unit to which they belong and are also translated at the closing rate.
Information on the most important exchange rates is disclosed in the separate section 27 “Exchange rates”.
6. Recognition of operating income and impairmentNet interest incomeInterest income and expense are calculated and recognised based on the effective interest rate method or, if considered appropriate, based on a method that results in an interest income or interest expense that is a reasonable approxima-tion of using the effective interest rate method as basis for the calculation. The effective interest includes fees consid-ered to be an integral part of the effective interest rate of a financial instrument (generally fees received as compensa-tion for risk). The effective interest rate equals the rate that discounts the contractual future cash flows to the carrying amount of the financial asset or financial liability.
Interest income and expenses from financial instru-ments are, with the exceptions described below, classified as “Net interest income”.
Interest income and interest expense related to all bal-ance sheet items held at fair value in Markets and Nordea Life & Pensions are classified as “Net result from items at fair value” in the income statement. Also the interest on the net funding of the operations in Markets is recognised on this line.
The interest component in FX swaps, and the interest paid and received in interest rate swaps plus changes in accrued interest, is classified as “Net result from items at fair value”, apart for derivatives used for hedging, includ-ing economical hedges of Nordea’s funding, where such components are classified as “Net interest income”.
Net fee and commission incomeNordea earns commission income from different services provided to its customers. The recognition of commission income depends on the purpose for which the fees are received. Fees are either recognised as revenue when ser-vices are provided or in connection to the execution of a significant act. Fees received in connection to performed services are recognised as income in the period these ser-vices are provided. A loan syndication fee received as pay-ment for arranging a loan, as well as other fees received as payments for certain acts, are recognised as revenue when the act has been completed, i.e. when the syndication has been finalised.
Commission expenses are normally transaction based and recognised in the period when the services are received.
Income from issued financial guarantees and expenses from bought financial guarantees, including fees paid to state guarantees, are amortised over the duration of the instruments and classified as “Fee and commission income” and “Fee and commission expense” respectively.
Net result from items at fair valueRealised and unrealised gains and losses on financial instruments measured at fair value through profit or loss are recognised in the item “Net result from items at fair value”. Realised and unrealised gains and losses derive from:
Shares/participations and other share-related instruments
G1 Accounting policies

Nordea Group – Accounting policies
Nordea Annual Report 201478
-
-
-
-
-
Profit from companies accounted for under the equity method
-
-
-
--
--
-
Other operating income-
Net loan losses
-
-
--
-
Impairment of securities held as financial non-current assets
G1 Accounting policies

Accounting policies – Nordea Group
Nordea Annual Report 2014 79
categories Loans and receivables and Held to maturity are disclosed in section 13 “Financial instruments” and section 14 “Loans to the public/credit institutions”.
If observable indicators (loss events) indicate that an associated undertaking is impaired, an impairment test is performed to assess whether there is objective evidence of impairment. The carrying amount of the investment in the associate is compared with the recoverable amount (higher of value in use and fair value less cost to sell) and the carrying amount is written down to the recoverable amount if required.
Impairment losses are reversed if the recoverable amount increases. The carrying amount is then increased to the recoverable amount, but cannot exceed the carrying amount that would have been determined had no impair-ment loss been recognised.
7. Income recognition life insurance Premiums received, and repayments to policyholders, related to the saving part of the life insurance contracts are reported as increases or decreases of liabilities to policy-holders. See further information in section 19 “Liabilities to policyholders”.
The total income from life insurance mainly consists of the following components:
Cost resultInsurance risk resultRisk and performance marginInvestment return on additional capital in life insur-ance
The result from these components is, except for the cost result and the risk and performance margin relating to Unit Linked and Investment contracts, included in “Net result from items at fair value”.
The cost result is the result of expense loading from poli-cyholders and is included in the item “Fee and commission income”, together with the risk and performance margin relating to Unit Linked and Investment contracts. The related expenses are included in the items “Fee and commission expense” and “Operating expenses”. The policyholder’s part of a positive or negative cost result (profit sharing) is included in the note line “Change in technical provisions, Life insurance” within Note G5 “Net result from items at fair value”.
The insurance risk result consists of income from individ-ual risk products and from unbundled life insurance con-tracts as well as Health and personal accident insurance. The risk premiums are amortised over the coverage period as the provisions are reduced when insurance risk is released. A large part of the unbundled risk result from traditional life insurance is subject to profit sharing, which means that the policyholders receive a part of a net income or a net deficit. The risk income and the risk expenses are presented gross on the lines “Insurance risk income, Life insurance” and “Insur-ance risk expense, Life insurance” in Note G5 “Net result from items at fair value”. The policyholder’s part of the result is included in the line “Change in technical provisions, Life insurance” in the note.
Gains and losses derived from investments in Nordea Life & Pensions are split on the relevant lines in Note G5 “Net result from items at fair value” as for any other
investment in Nordea. The lines include investment return on assets held to cover liabilities to policyholders and return on the additional capital allocated to Nordea Life & Pensions (Shareholders capital in the Nordea Life & Pen-sions group).
The note line “Change in technical provisions, Life insurance” in Note G5 “Net result from items at fair value” includes:
Investment returns on assets held to cover liabilities to policyholders (including liabilities from traditional life insurance, unit linked insurance and investment contracts), individually transferred to policyholders’ accounts according to the contracts. Additional bonus (discretionary participation feature) to policyholders concerning traditional life insurance contracts or any other transfers to the policyholders to cover a periodical deficit between the investment result and any agreed minimum benefit to the policy-holders.Risk and performance margin regarding traditional life insurance products according to local allocation rules in each Nordea Life & Pensions unit and accord-ing to contracts with policyholders. The recognition of a risk and performance margin in the income state-ment is mainly conditional on a positive result for tra-ditional life insurance contracts. Risk and perfor-mance margins not possible to recognise in the current period due to poor investment results can, in some countries, partly or wholly be deferred to years with higher returns.The policyholders’ part of the cost- and risk result regarding traditional life insurance contracts or unit linked contracts.
The note line “Change in collective bonus potential, Life insurance” in Note G5 “Net result from items at fair value” relates only to traditional life insurance contracts. The line includes policyholders’ share of investment returns not yet individualised. The line includes also addi-tional bonus (discretionary participation feature) and amounts needed to cover a periodical deficit between the investment result and any minimum benefits to the poli-cyholders.
8. Recognition and derecognition of financial instruments on the balance sheet
Derivative instruments, quoted securities and foreign exchange spot transactions are recognised on and derecognised (reclassified to the items “Other assets” or ”Other liabilities” on the balance sheet between trade date and settlement date) from the balance sheet on the trade date. Other financial instruments are recognised on the balance sheet on settlement date.
Financial assets, other than those for which trade date accounting is applied, are derecognised from the balance sheet when the contractual rights to the cash flows from the financial asset expire or are transferred to another party. The rights to the cash flows normally expire or are transferred when the counterpart has performed by e.g. repaying a loan to Nordea, i.e. on settlement date.
In some cases, Nordea enters into transactions where it transfers assets that are recognised on the balance sheet, but
G1 Accounting policies

Nordea Group – Accounting policies
Nordea Annual Report 201480
retains either all or a portion of risks and rewards from the transferred assets. If all or substantially all risks and rewards are retained, the transferred assets are not derecognised from the balance sheet. If Nordea’s counterpart can sell or repledge the transferred assets, the assets are reclassified to the item “Financial instruments pledged as collateral” on the balance sheet. Transfers of assets with retention of all or substantially all risks and rewards include e.g. securities lending agreements and repurchase agreements.
Financial liabilities are derecognised from the balance sheet when the liability is extinguished. Normally this occurs when Nordea performs, for example when Nordea repays a deposit to the counterpart, i.e. on settlement date. Financial liabilities under trade date accounting are gener-ally reclassified to “Other liabilities” on the balance sheet on trade date.
For further information, see sections “Securities bor-rowing and lending agreements” and “Repurchase and reverse repurchase agreements” within section 13 “Finan-cial instruments”, as well as Note G43 “Transferred assets and obtained collaterals”.
9. Translation of assets and liabilities denominated in foreign currencies
The functional currency of each entity is decided based upon the primary economic environment in which the entity operates. The parent company Nordea Bank AB (publ) uses two functional currencies, SEK and EUR for reporting in consolidated accounts, based on the different activities in the underlying business.
Foreign currency is defined as any currency other than the functional currency of the entity. Foreign currency transactions are recorded at the exchange rate on the date of the transaction. Monetary assets and liabilities denomi-nated in foreign currencies are translated at the exchange rate on the balance sheet date.
Exchange differences arising on the settlement of trans-actions at rates different from those at the date of the transaction, and unrealised translation differences on unsettled foreign currency monetary assets and liabilities, are recognised in the income statement in the item “Net result from items at fair value”.
Translation differences on financial instruments that are designated hedging instruments in a hedge of a net investment in a group undertaking are recognised in other comprehensive income, to the extent the hedge is effective. This is performed in order to offset the transla-tion differences affecting other comprehensive income when consolidating the group undertaking into Nordea. Any ineffectiveness is recognised in the income statement in the item “Net result from items at fair value”.
10. Hedge accountingNordea applies the EU carve out version of IAS 39 for port-folio hedges of both assets and liabilities. The EU carve out macro hedging enables a group of derivatives (or propor-tions thereof) to be viewed in combination and be desig-nated as the hedging instrument. It also removes some of the limitations in fair value hedge accounting relating to hedging core deposits and under-hedging strategies.
Nordea uses hedge accounting in order to have a sym-metrical accounting treatment of the changes in fair value
of the hedged item and changes in fair value of the hedg-ing instruments as well as to hedge the exposure to varia-bility in future cash flows and the exposure to net invest-ments in foreign operations.
There are three forms of hedge accounting:Fair value hedge accountingCash flow hedge accountingHedges of net investments
Fair value hedge accountingFair value hedge accounting is used when derivatives are hedging changes in fair value of a recognised asset or lia-bility attributable to a specific risk. The risk of changes in fair value of assets and liabilities in Nordea’s financial statements originates mainly from loans, securities and deposits with a fixed interest rate, causing interest rate risk. Changes in fair value from derivatives as well as changes in fair value of the hedged item attributable to the risks being hedged are recognised separately in the income statement in the item “Net result from items at fair value”. Given an effective hedge, the two changes in fair value will more or less balance, meaning the net result is close to zero. The changes in fair value of the hedged item attributable to the risks hedged with the derivative instru-ment are reflected in an adjustment to the carrying amount of the hedged item, which is also recognised in the income statement. The fair value change of the hedged items held at amortised cost in a portfolio hedge of interest rate risks is reported separately from the portfolio in the item “Fair value changes of the hedged items in portfolio hedge of interest rate risk” on the balance sheet.
Fair value hedge accounting in Nordea is performed mainly on a portfolio basis. Any ineffectiveness is recog-nised in the income statement under the item “Net result from items at fair value”.
Hedged itemsA hedged item in a fair value hedge can be a recognised single asset or liability, an unrecognised firm commit-ment, or a portion thereof. The hedged item can also be a group of assets, liabilities or firm commitments with simi-lar risk characteristics. Hedged items in Nordea consist of both individual assets or liabilities and portfolios of assets and/or liabilities.
Hedging instrumentsThe hedging instruments used in Nordea are predomi-nantly interest rate swaps and cross currency interest rate swaps, which are always held at fair value. Cash instru-ments are only used as hedging instruments when hedg-ing currency risk.
Cash flow hedge accountingCash flow hedge accounting can be used for the hedging of exposure to variations in future interest payments on instruments with variable interest rates and for the hedg-ing of currency exposures. The portion of the gain or loss on the hedging instrument, that is determined to be an effective hedge, is recognised in other comprehensive income and accumulated in the cash flow hedge reserve in equity. The ineffective portion of the gain or loss on the hedging instrument is recycled to the item “Net result
G1 Accounting policies

Accounting policies – Nordea Group
Nordea Annual Report 2014 81
from items at fair value” in the income statement. Gains or losses on hedging instruments recognised in
the cash flow hedge reserve in equity through other com-prehensive income are recycled and recognised in the income statement in the same period as the hedged item affects profit or loss, normally in the period that interest income or interest expense is recognised.
Hedged itemsA hedged item in a cash flow hedge can be highly probable floating interest rate cash flows from recognised assets or liabilities or from future assets or liabilities. Nordea uses cash flow hedges when hedging currency risk in future payments of interest and principal in foreign currency.
Hedging instrumentsThe hedging instruments used in Nordea are predomi-nantly cross currency interest rate swaps, which are always held at fair value, where the currency component is desig-nated as a cash flow hedge of currency risk and the interest component as a fair value hedge of interest rate risk.
Hedges of net investmentsSee separate section 9 “Translation of assets and liabilities denominated in foreign currencies”.
Hedge effectivenessThe application of hedge accounting requires the hedge to be highly effective. A hedge is regarded as highly effective if at inception and throughout its life it can be expected that changes in fair value of the hedged item as regards the hedged risk can be essentially offset by changes in fair value of the hedging instrument. The result should be within a range of 80–125 per cent. When assessing hedge effectiveness retrospectively Nordea measures the fair value of the hedging instruments and compares the change in fair value of the hedging instrument to the change in fair value of the hedged item. The effectiveness measurement is made on a cumulative basis. The hypothetical derivative method is used when measuring the effectiveness of cash flow hedges, meaning that the change in a perfect hypothetical swap is used as proxy for the present value of the cumula-tive change in expected future cash flows from the hedged transaction (the currency component).
If the hedge relationship does not fulfil the require-ments, hedge accounting is terminated. For fair value hedges the hedging instrument is reclassified to a trading derivative and the change in the fair value of the hedged item, up to the point when the hedge relationship is termi-nated, is amortised to the income statement on a straight-line basis over the remaining maturity of the hedged item.
In cash flow hedges, changes in the unrealised value of the hedging instrument will prospectively from the last time it was proven effective be accounted for in the income state-ment. The cumulative gain or loss on the hedging instrument that has been recognised in the cash flow hedge reserve in equity through other comprehensive income from the period when the hedge was effective is reclassified from equity to “Net result from items at fair value” in the income statement if the expected transaction no longer is expected to occur. If the expected transaction no longer is highly probable, but is still expected to occur, the cumulative gain or loss on the
hedging instrument that has been recognised in other com-prehensive income from the period when the hedge was effective remains in other comprehensive income until the transaction occurs or is no longer expected to occur.
11. Determination of fair value of financial instrumentsFinancial assets and liabilities classified into the categories Financial assets/liabilities at fair value through profit or loss (including derivative instruments) are recorded at fair value on the balance sheet with changes in fair value rec-ognised in the income statement in the item “Net result from items at fair value”.
Fair value is defined as the price that at the measure-ment date would be received to sell an asset or paid to transfer a liability in an orderly transaction between mar-ket participants under current market conditions in the principal market for the asset or liability or, in the absence of a principal market, in the most advantageous market for the asset or liability.
The existence of published price quotations in an active market is the best evidence of fair value and when they exist they are used to measure financial assets and finan-cial liabilities. An active market for the asset or liability is a market in which transactions for the asset or liability occur with sufficient frequency and volume to provide pricing information on an on-going basis. The absolute level for liquidity and volume required for a market to be considered active vary with the instrument classes. For some classes low price volatility is seen, also for those instruments within the class where the trade frequency is high. For instruments in such a class the liquidity requirements are lower and, correspondingly, the age limit for the prices used for establishing fair value is higher.
If markets are active or non-active is assessed regularly. The trade frequency and volume are monitored daily.
Nordea is predominantly using published price quota-tions to establish fair value for items disclosed under the following balance sheet items:
Interest-bearing securitiesShares (listed)Derivatives (listed)Debt securities in issue (issued mortgage bonds in Nordea Kredit Realkreditaktieselskab)
If quoted prices for a financial instrument fail to represent actual and regularly occurring market transactions or if quoted prices are not available, fair value is established by using an appropriate valuation technique. The adequacy of the valuation technique, including an assessment of whether to use quoted prices or theoretical prices, is moni-tored on a regular basis.
Valuation techniques can range from simple discounted cash flow analysis to complex option pricing models. Valu-ation models are designed to apply observable market prices and rates as input whenever possible, but can also make use of unobservable model parameters. The ade-quacy of the valuation model is assessed by measuring its capability to hit market prices. This is done by comparison of calculated prices to relevant benchmark data, e.g. quoted prices from exchanges, the counterparty s valua-tions, price data from consensus services etc.
G1 Accounting policies

Nordea Group – Accounting policies
Nordea Annual Report 201482
Nordea is predominantly using valuation techniques to establish fair value for items disclosed under the following balance sheet items:
Loans to the public (mortgage loans in Nordea Kredit Realkreditaktieselskab)Interest-bearing securities (when quoted prices in an active market are not available)Shares (when quoted prices in an active market are not available)Derivatives (OTC-derivatives)
For financial instruments, where fair value is estimated by a valuation technique, it is investigated whether the varia-bles used in the valuation model are predominantly based on data from observable markets. By data from observable markets, Nordea considers data that can be collected from generally available external sources and where this data is judged to represent realistic market prices. If non-observa-ble data has a significant impact on the valuation, the instrument cannot be recognised initially at the fair value estimated by the valuation technique and any upfront gains are thereby deferred and amortised through the income statement over the contractual life of the instru-ment. The deferred upfront gains are subsequently released to income if the non-observable data becomes observable.
Note G40 “Assets and liabilities at fair value” provides a breakdown of fair values of financial instruments meas-ured on the basis of:
quoted prices in active markets for the same instru-ment (level 1), valuation technique using observable data (level 2), and valuation technique using non-observable data (level 3).
The valuation models applied by Nordea are consistent with accepted economic methodologies for pricing finan-cial instruments and incorporate the factors that market participants consider when setting a price.
New valuation models are subject to approval by a Model Risk Management Committee and all models are reviewed on a regular basis.
For further information, see Note G40 “Assets and lia-bilities at fair value”.
12. Cash and balances with central banksCash comprises legal tender and bank notes in foreign currencies. Balances with central banks consist of deposits in accounts with central banks and postal giro systems under government authority, where the following condi-tions are fulfilled:
The central bank or the postal giro system is domiciled in the country where the institutions is establishedThe balance is readily available at any time
13. Financial instrumentsClassification of financial instrumentsEach financial instrument has been classified into one of the following categories:Financial assets:
Financial assets at fair value through profit or loss: – Held for trading
– Designated at fair value through profit or loss (fair value option)Loans and receivablesHeld to maturityAvailable for sale
Financial liabilities:Financial liabilities at fair value through profit or loss: – Held for trading – Designated at fair value through profit or loss (fair value option)Other financial liabilities
All financial assets and liabilities are initially measured at fair value. The classification of financial instruments into different categories forms the basis for how each instru-ment is subsequently measured on the balance sheet and how changes in its value are recognised. In Note G39 “Classification of financial instruments” the classification of the financial instruments on Nordea’s balance sheet into different categories is presented.
Financial assets and financial liabilities at fair value through profit or lossFinancial assets and financial liabilities at fair value through profit or loss are measured at fair value, excluding transaction costs. All changes in fair values are recognised directly in the income statement in the item “Net result from items at fair value”.
The category consists of two sub-categories; Held for trading and Designated at fair value through profit or loss (fair value option).
The sub-category Held for trading mainly contains derivative instruments that are held for trading purposes, interest-bearing securities and shares within Markets and Treasury. It also contains trading liabilities such as short-selling positions and lending in reverse repurchase agree-ments.
The major parts of the financial assets/liabilities classi-fied into the category Designated at fair value through profit or loss are mortgage loans and related issued bonds in the Danish subsidiary Nordea Kredit Realkreditaktie-selskab and interest-bearing securities, shares and invest-ment contracts in Nordea Life & Pensions.
Assets and liabilities in Nordea Kredit Realkreditaktie-selskab are classified into the category Designated at fair value through profit or loss to eliminate or significantly reduce an accounting mismatch. When Nordea grants mortgage loans to customers in accordance with the Dan-ish mortgage finance law Nordea at the same time issues bonds with matching terms, so called “match funding”. The customers can repay the loans either through repay-ments of the principal or by purchasing the issued bonds and return them to Nordea as a settlement of the loan. The bonds play an important part in the Danish money market and Nordea consequently buys and sells own bonds in the market. If the loans and bonds were measured at amor-tised cost such buy-backs of bonds would give rise to an accounting mismatch as any gains or losses would have to be recognised immediately in the income statement. If such bonds are subsequently sold in the market any pre-mium or discount would be amortised over the expected
G1 Accounting policies

Accounting policies – Nordea Group
Nordea Annual Report 2014 83
maturity, which would also create an accounting mis-match. To avoid such an accounting mismatch Nordea measures both the loans and bonds at fair value through profit or loss.
Interest-bearing securities, shares and investment con-tracts (defined in section 19 “Liabilities to policyholders”) in Nordea Life & Pensions are generally also classified into the category Designated at fair value through profit or loss to eliminate or significantly reduce an accounting mismatch. The investment contracts (unit-linked) classi-fied as “Liabilities to policyholders” on the balance sheet are managed at fair value and consequently classified into the category Designated at fair value through profit or loss. This applies also to assets held under insurance con-tracts (defined in section 19 “Liabilities to policyholders”), which are classified into the category Designated at fair value through profit or loss to reduce an accounting mis-match with the liabilities to policyholders that are gener-ally measured at current value.
Also assets held under so called “pooled schemes”, which is a product similar to unit-linked insurance, are classified into the category Designated at fair value through profit or loss to avoid an accounting mismatch with the related deposits that are managed at fair value and consequently also classified into the category Desig-nated at fair value through profit or loss.
Nordea also applies the fair value option on certain financial assets and financial liabilities related to Markets. The classification stems from that Markets is managing and measuring its financial assets and liabilities at fair value. Consequently, the majority of financial assets and financial liabilities in Markets are classified into the cate-gories Financial assets/Financial liabilities at fair value through profit or loss.
Loans and receivablesLoans and receivables are non-derivative financial assets, with fixed or determinable payments, that are not quoted in an active market. These assets and their impairment are further described in the separate section 14 “Loans to the public/credit institutions”.
Held to maturityFinancial assets that Nordea has chosen to classify into the category Held to maturity are non-derivative financial assets with fixed or determinable payments and fixed maturity that Nordea has the positive intent and ability to hold to maturity. Financial assets classified into the cate-gory Held to maturity are initially recognised on the bal-ance sheet at the acquisition price, including transaction costs. Subsequent to initial recognition, the instruments within this category are measured at amortised cost. In an amortised cost measurement, the difference between acquisition cost and redemption value is amortised in the income statement over the remaining term using the effec-tive interest rate method.
If more than an insignificant amount of the Held to maturity portfolio is sold or transferred the Held to maturity category is tainted, except for if the sale or transfer either occur close to maturity, after substantially all of the original principal is already collected, or due to an isolated non-recurring event beyond the control of
Nordea. Nordea assesses at each reporting date whether there is
any objective evidence that the asset is impaired. If there is such evidence, an impairment loss is recorded. The loss is calculated as the difference between the carrying amount and the present value of estimated future cash flows and is recognised as “Impairment of securities held as financial non-current assets” in the income statement. See section 14 “Loans to the public/credit institutions” for more information on the identification and measurement of objective evidence of impairment, which is applicable also for interest-bearings securities classified into the cate-gory Held to maturity.
Available for saleFinancial instruments classified into the category Availa-ble for sale are measured at fair value. Changes in fair val-ues, except for interest, foreign exchange effects and impairment losses, are recognised in the fair value reserve in equity through other comprehensive income. Interest is recognised in the item “Interest income” and foreign exchange effects and impairment losses in the item “Net result from items at fair value” in the income statement.
When an instrument classified into the category Availa-ble for sale is disposed of, the fair value changes that pre-viously have been accumulated in the fair value reserve (related to Available for sale investments) in other compre-hensive income are removed from equity and recognised in the income statement in the item “Net result from items at fair value”.
Financial assets classified into the category Available for sale are assessed in order to determine any need for impairment losses. If there is objective evidence of impairment, the accumulated loss that has been recog-nised in other comprehensive income is removed from equity and recognised as “Net result from items at fair value” in the income statement. The amount of the accu-mulated loss that is recycled from equity is the difference between the asset’s acquisition cost and current fair value. For equity investments a prolonged or significant decline in the fair value, compared to the acquisition cost, is considered to be objective evidence of impair-ment. Objective evidence of impairment for a debt instrument is rather connected to a loss event, such as an issuer’s financial difficulty.
Other financial liabilitiesFinancial liabilities, other than those classified into the category Financial liabilities at fair value through profit or loss, are measured at amortised cost. Interest on Other financial liabilities is recognised in the item “Interest expense” in the income statement.
Hybrid (combined) financial instrumentsHybrid (combined) financial instruments are contracts containing a host contract and an embedded derivative instrument. Such combinations arise predominantly from the issuance of structured debt instruments, such as issued index-linked bonds.
Index-linked bonds issued by Group Treasury are con-sidered to be part of the funding activities. The zero cou-pon bond, is measured at amortised cost. The embedded
G1 Accounting policies

Nordea Group – Accounting policies
Nordea Annual Report 201484
derivatives in those instruments are separated from the host contract and accounted for as stand-alone deriva-tives at fair value, if the economic characteristics and risks of the embedded derivative are not closely related to the economic characteristics and risks of the host con-tract, and the embedded derivative meets the definition of a derivative instrument. Changes in fair values, of the embedded derivatives, are recognised in the income statement in the item “Net result from items at fair value”.
Index-linked bonds issued by Markets as part of the trading portfolio are classified into the category Held for trading, and the entire combined instrument, host con-tract together with the embedded derivative, is measured at fair value through profit or loss. Changes in fair values are recognised in the income statement in the item “Net result from items at fair value”.
Securities borrowing and lending agreementsGenerally, securities borrowing and securities lending transactions are entered into on a collateralised basis. Unless the risks and rewards of ownership are transferred, the securities are not recognised on or derecognised from the balance sheet. In the cases where the counterpart is entitled to resell or repledge the securities, the securities are reclassified to the balance sheet item “Financial instru-ments pledged as collateral”.
Securities in securities lending transactions are also dis-closed in the item “Assets pledged as security for own lia-bilities”.
Cash collateral advanced (securities borrowing) to the counterparts is recognised on the balance sheet as “Loans to central banks”, “Loans to credit institutions” or as “Loans to the public”. Cash collateral received (securities lending) from the counterparts is recognised on the bal-ance sheet as “Deposits by credit institutions” or as “Deposits and borrowings from the public”.
Repurchase and reverse repurchase agreementsSecurities delivered under repurchase agreements and securities received under reverse repurchase agreements are not derecognised from or recognised on the balance sheet. In the cases where the counterpart has the right to resell or repledge the securities, the securities are reclassi-fied to the balance sheet line “Financial instruments pledged as collateral”.
Securities delivered under repurchase agreements are also disclosed in the item “Assets pledged as security for own liabilities”.
Cash received under repurchase agreements is recog-nised on the balance sheet as “Deposits by credit institu-tions” or as “Deposits and borrowings from the public”. Cash delivered under reverse repurchase agreements is rec-ognised on the balance sheet as “Loans to central banks”, “Loans to credit institutions” or as “Loans to the public”.
Additionally, the sale of securities received in reverse repurchase agreements trigger the recognition of a trading liability (short sale).
DerivativesAll derivatives are recognised on the balance sheet and measured at fair value. Derivatives with total positive fair
values, including any accrued interest, are recognised as assets in the item “Derivatives” on the asset side. Deriva-tives with total negative fair values, including any accrued interest, are recognised as liabilities in the item “Deriva-tives” on the liability side.
Realised and unrealised gains and losses from deriva-tives are recognised in the income statement in the item “Net result from items at fair value”.
Offsetting of financial assets and liabilitiesNordea offsets financial assets and liabilities on the bal-ance sheet if there is a legal right to offset, in the ordinary course of business and in case of bankruptcy, and if the intent is to settle the items net or realise the asset and set-tle the liability simultaneously. This is generally achieved through the central counterparty clearing houses that Nordea has agreements with.
Exchanged traded derivatives are generally accounted for as settled on a daily basis when cash is paid or received and the instrument is reset to market terms. Derivative assets and liabilities against central counterparty clearing houses are, as mentioned above, generally set off on the balance sheet, but net cash collateral received or paid is generally accounted for separately as cash collateral paid (asset) or received (liability), which is also the case for cash collateral paid or received in bilateral OTC derivative transactions. Cash collateral paid or received in bilateral OTC derivative transactions are consequently not offset against the fair value of the derivatives.
Issued debt and equity instrumentsA financial instrument issued by Nordea is either classi-fied as a financial liability or equity. Issued financial instruments are classified as a financial liability if the con-tractual arrangement results in Nordea having a present obligation to either deliver cash or another financial asset, or a variable number of equity instruments to the holder of the instrument. If this is not the case, the instrument is generally an equity instrument and classified as equity, net of transaction costs. Where issued financial instru-ments contain both liability and equity components, these are accounted for separately.
14. Loans to the public/credit institutionsFinancial instruments classified as “Loans to the public/credit institutions” (including loans to central banks) on the balance sheet and into the category Loans and receiva-bles are measured at amortised cost (see also the separate section 8 “Recognition and derecognition of financial instruments on the balance sheet” as well as Note G39 ”Classification of financial instruments”).
Nordea monitors loans as described in the separate sec-tion on Risk, Liquidity and Capital management. Loans attached to individual customers or groups of customers are identified as impaired if the impairment tests indicate an objective evidence of impairment.
Also interest-bearings securities classified into the cate-gories Loans and receivables and Held to maturity are held at amortised cost and the description below is valid also for the identification and measurement of impairment on these assets. Possible impairment losses on interest-bearing securities classified into the categories Loans and
G1 Accounting policies

Accounting policies – Nordea Group
Nordea Annual Report 2014 85
receivables and Held to maturity are recognised as “Impairment of securities held as non-current financial assets” in the income statement.
Impairment test of individually assessed loansNordea tests all loans for impairment on an individual basis. The purpose of the impairment tests is to find out if the loans have become impaired. As a first step in the identification process for impaired loans, Nordea monitors whether there are indicators of impairment (loss event) and whether these loss events represent objective evidence of impairment. More information on the identification of loss events can be found in the Risk, Liquidity and Capital management section.
Loans that are not individually impaired will be trans-ferred to a group of loans with similar risk characteristics for a collective impairment test.
Impairment test of collectively assessed loansLoans not impaired on an individual basis are collectively tested for impairment.
These loans are grouped on the basis of similar credit risk characteristics that are indicative of the debtors´ abil-ity to pay all amounts due according to the contractual terms. Nordea monitors its portfolio through rating migra-tions, the credit decision and annual review process sup-plemented by quarterly risk reviews. Through these pro-cesses Nordea identifies loss events indicating incurred losses in a group. A loss event is an event resulting in a deterioration of the expected future cash flows. Only loss events incurred up to the reporting date are included when performing the assessment of the group.
The objective for the group assessment process is to evaluate if there is a need to make a provision due to the fact that a loss event has occurred, which has not yet been identified on an individual basis. This period between the date when the loss event occurred and the date when it is identified on an individual basis is called “Emergence period”. The impairment remains related to the group of loans until the losses have been identified on an individ-ual basis. The identification of the loss is made through a default of the engagement or by other indicators.
For corporate customers and bank counterparts, Nordea uses the existing rating system as a basis when assessing the credit risk. Nordea uses historical data on probability of default to estimate the risk for a default in a rating class. These loans are rated and grouped mostly based on type of industry and/or sensitivity to certain macro parameters, e.g. dependency to oil prices etc.
Personal customers and small corporate customers are monitored through scoring models. These are based mostly on historical data, as default rates and loss rates given a default, and experienced judgement performed by management. Rating and scoring models are described in more detail in the separate section on Risk, Liquidity and Capital management.
The collective assessment is performed through a net-ting principle, i.e. when rated engagements are up-rated due to estimated increases in cash flows, this improve-ment will be netted against losses on loans that are down-rated due to estimated decreases in cash-flows. Netting is only performed within groups with similar risk character-
istics where Nordea assesses that the customers’ future cash flows are insufficient to serve the loans in full.
Impairment lossIf the carrying amount of the loans is higher than the sum of the net present value of estimated cash flows (dis-counted with the original effective interest rate), including the fair value of the collaterals and other credit enhance-ments, the difference is the impairment loss.
For significant loans that have been individually identi-fied as impaired the measurement of the impairment loss is made on an individual basis.
For insignificant loans that have been individually iden-tified as impaired and for loans not identified as impaired on an individual basis the measurement of the impairment loss is measured using a portfolio based expectation of the future cash flows.
If the impairment loss is not regarded as final, the impairment loss is accounted for on an allowance account representing the accumulated impairment losses. Changes in the credit risk and accumulated impairment losses are accounted for as changes in the allowance account and as ”Net loan losses” in the income statement (see also section 6 “Recognition of operating income and impairment”).
If the impairment loss is regarded as final, it is reported as a realised loss and the value of the loan and the related allowance for impairment loss are derecognised. An impairment loss is regarded as final when the obligor is filed for bankruptcy and the administrator has declared the economic outcome of the bankruptcy procedure, or when Nordea forgives its claims either through a legal based or voluntary reconstruction or when Nordea, for other rea-sons, deem it unlikely that the claim will be recovered.
Discount rateThe discount rate used to measure impairment is the orig-inal effective interest rate for loans attached to an individ-ual customer or, if applicable, to a group of loans. If con-sidered appropriate, the discount rate can be based on a method that results in an impairment that is a reasonable approximation of using the effective interest rate method as basis for the calculation.
Restructured loansIn this context a restructured loan is defined as a loan where Nordea has granted concessions to the obligor due to its deteriorated financial situation and where this con-cession has resulted in an impairment loss for Nordea. After a reconstruction the loan is normally regarded as not impaired if it performs according to the new conditions. Concessions made in reconstructions are regarded as loan losses unless Nordea retains the possibility to regain the loan losses incurred. In the event of a recovery the pay-ment is reported as a recovery of loan losses.
Assets taken over for protection of claimsIn a financial reconstruction the creditor may concede loans to the obligor and in exchange for this concession acquire an asset pledged for the conceded loans, shares issued by the obligor or other assets. Assets taken over for protection of claims are reported on the same balance sheet line as similar assets already held by Nordea. For
G1 Accounting policies

Nordea Group – Accounting policies
Nordea Annual Report 201486
example a property taken over, not held for Nordea’s own use, is reported together with other investment properties.
At initial recognition, all assets taken over for protection of claims are recognised at fair value and the possible difference between the carrying amount of the loan and the fair value of the assets taken over is recognised as “Net loan losses”. The fair value of the asset on the date of recognition becomes its cost or amortised cost value, as applicable. In subsequent periods, assets taken over for protection of claims are valued in accordance with the valuation principles for the appropri-ate type of asset. Investment properties are then measured at fair value. Financial assets that are foreclosed are generally classified into the categories Available for sale or Designated at fair value through profit or loss (fair value option) (see sec-tion 13 “Financial instruments”) and measured at fair value. Changes in fair values are recognised in other comprehen-sive income for assets classified into the category Available for sale. For assets classified into the category Designated at fair value through profit or loss, changes in fair value are rec-ognised in the income statement under the line “Net result from items at fair value”.
Any change in value, after the initial recognition of the asset taken over, is presented in the income statement in line with the Group’s presentation policies for the appropri-ate asset. ”Net loan losses” in the income statement is, after the initial recognition of the asset taken over, consequently not affected by any subsequent remeasurement of the asset.
15. LeasingNordea as lessorFinance leasesNordea’s leasing operations mainly comprise finance leases. A finance lease is reported as a receivable from the lessee in the balance sheet item “Loans to the public” at an amount equal to the net investment in the lease. The lease payment, excluding cost of services, is recorded as repayment of prin-cipal and interest income. The income allocation is based on a pattern reflecting a constant periodic return on the net investment outstanding in respect of the finance lease.
Operating leasesAssets subject to operating leases on the balance sheet are reported in accordance with the nature of the assets, in gen-eral as properties and equipment. Leasing income is recog-nised as income on a straight-line basis over the lease term and classified as “Net interest income”. The depreciation of the leased assets is calculated on the basis of Nordea’s depreciation policy for similar assets and reported as “Depreciation, amortisation and impairment charges of tangible and intangible assets” in the income statement.
Nordea as lesseeFinance leasesFinance leases are recognised as assets and liabilities on the balance sheet at the amount equal to the fair value, or if lower, the present value of the minimum lease payments of the leased assets at the inception of the lease. The assets are reported in accordance with the nature of the assets. Lease payments are apportioned between finance charge and reduction of the outstanding liability. The finance charge is allocated to periods during the lease term so as to produce a constant periodic rate of interest on the
remaining balance of the liability for each period. A finance lease also gives rise to a depreciation expense for the leased asset. The depreciation policy is consistent with that of the assets in own use. Impairment testing of leased assets is performed following the same principles as for similar owned assets.
Operating leasesOperating leases are not recognised on Nordea’s balance sheet. For operating leases the lease payments are recog-nised as expenses in the income statement on a straight-line basis over the lease term unless another systematic way better reflects the time pattern of Nordea’s benefit. The original lease terms normally range between 3 to 25 years.
Operating leasing is mainly related to office premises con-tracts and office equipment contracts normal to the business.
The central district properties in Finland, Norway and Sweden that Nordea has divested are leased back. The duration of the lease agreements was initially 3–25 years with renewal options. The lease agreements include no transfers of ownerships of the asset by the end of the lease term, nor any economic benefits from appreciation in value of the leased properties. In addition, the lease term is not for the major part of the assets’ economic life. These leases are thus classified as operating leases. The rental expense for these premises is recognised on the basis of the time-pattern of Nordea’s economic benefit which dif-fers from the straight-line basis and better resembles an ordinary rental arrangement.
Embedded leasesAgreements can contain a right to use an asset in return for a payment, or a series of payments, although the agree-ment is not in the legal form of a leasing contract. If appli-cable, these assets are separated from the contract and accounted for as leased assets.
16. Intangible assetsIntangible assets are identifiable, non-monetary assets without physical substance. The assets are under Nordea’s control, which means that Nordea has the power and rights to obtain the future economic benefits flowing from the underlying resource. The intangible assets in Nordea mainly consist of goodwill, IT-development/computer software and customer related intangible assets.
GoodwillGoodwill represents the excess of the cost of an acquisi-tion over the fair value of Nordea’s share of net identifiable assets of the acquired group undertaking/associated undertaking at the date of acquisition. Goodwill on acqui-sition of group undertakings is included in “Intangible assets”. Goodwill on acquisitions of associates is not rec-ognised as a separate asset, but included in “Investments in associated undertakings”. Goodwill is tested annually for impairment or more frequently if events or changes in circumstances indicate that it might be impaired. Good-will is carried at cost less accumulated impairment losses. Impairment losses on goodwill cannot be reversed in sub-sequent periods. Goodwill related to associated undertak-ings is not tested for impairment separately, but included in the total carrying amount of the associated undertak-
G1 Accounting policies

Accounting policies – Nordea Group
Nordea Annual Report 2014 87
ings. The policies covering impairment testing of associ-ated undertakings is disclosed in section 6 “Recognition of operating income and impairment”.
IT-development/Computer softwareCosts associated with maintaining computer software programs are expensed as incurred. Costs directly associ-ated with major software development investments, with the ability to generate future economic benefits, are recog-nised as intangible assets. These costs include software development staff costs and overhead expenditures directly attributable to preparing the asset for use. Com-puter software includes also acquired software licenses not related to the function of a tangible asset.
Amortisation is calculated on a straight-line basis over the useful life of the software, generally a period of 3 to 10 years.
Customer related intangible assetsIn business combinations a portion of the purchase price is normally allocated to a customer related intangible asset, if the asset is identifiable and under Nordea’s control. An intangible asset is identifiable if it arises from contractual or legal rights, or could be separated from the entity and sold, transferred, licenced, rented or exchanged. The asset is amortised over its useful life, generally over 10 years.
Impairment Goodwill is not amortised but tested for impairment annually irrespective of any indications of impairment. Impairment testing is also performed more frequently if required due to any indication of impairment. The impairment charge is calculated as the difference between the carrying amount and the recoverable amount.
At each balance sheet date, all intangible assets with definite useful lives are reviewed for indications of impairment. If such indications exist, an analysis is per-formed to assess whether the carrying amount of the intangible asset is fully recoverable.
The recoverable amount is the higher of fair value less costs to sell and the value in use of the asset or the cash-generating unit, which is defined as the smallest identifi-able group of assets that generates largely independent cash flows in relation to other assets. For goodwill, the cash generating units are defined as the operating seg-ments. The value in use is the present value of the cash flows expected to be realised from the asset or the cash-generating unit. The cash flows are assessed based on the asset or cash-generating unit in its current condition and discounted at a rate based on the long-term risk free interest rate plus a risk premium (post tax). If the recov-erable amount is less than the carrying amount, an impairment loss is recognised. See Note G20 “Intangible assets” for more information on the impairment testing.
17. Properties and equipmentProperties and equipment includes own-used properties, leasehold improvements, IT equipment, furniture and other equipment. Items of properties and equipment are measured at cost less accumulated depreciation and accumulated impairment losses. The cost of an item of properties and equipment comprise its purchase price,
as well as any directly attributable costs of bringing the asset to the working condition for its intended use. When parts of an item of property and equipment have different useful lives, they are accounted for as separate items.
Properties and equipment is depreciated on a straight-line basis over the estimated useful life of the assets. The estimates of the useful life of different assets are reassessed on a yearly basis. Below follows the current estimates:
Buildings 30–75 yearsEquipment 3–5 yearsLeasehold improvements Changes within buildings the
shorter of 10 years and the remaining leasing term. New construction the shorter of the principles used for owned buildings and the remaining leasing term. Fixtures installed in leased properties are depre-ciated over the shorter of 10–20 years and the remaining leas-ing term.
At each balance sheet date, Nordea assesses whether there is any indication that an item of property and equipment may be impaired. If any such indication exists, the recov-erable amount of the asset is estimated and any impair-ment loss is recognised.
Impairment losses are reversed if the recoverable amount increases. The carrying amount is then increased to the recoverable amount, but cannot exceed the carrying amount that would have been determined had no impair-ment loss been recognised.
18. Investment propertiesInvestment properties are primarily properties held to earn rent and/or capital appreciation. The majority of the properties in Nordea are attributable to Nordea Life & Pensions. Nordea applies the fair value model for subse-quent measurement of investment properties. The best evidence of a fair value is normally given by quoted prices in an active market for similar properties in the same loca-tion and condition. As these prices are rarely available dis-counted cash flow projection models based on reliable estimates of future cash flows are also used.
Net rental income, gains and losses as well as fair value adjustments are recognised directly in the income state-ment as “Net result from items at fair value”.
19. Liabilities to policyholdersLiabilities to policyholders include obligations according to insurance contracts and investment contracts with poli-cyholders.
An insurance contract is defined as “a contract under which one party (the insurer) accepts significant insurance risks from another party (the policyholder) by agreeing to compensate the policyholder if a specified uncertain future event (the insured event) adversely affects the poli-cyholder”.
Investment contracts are contracts with policyholders that have the legal form of insurance contracts but where
G1 Accounting policies

Nordea Group – Accounting policies
Nordea Annual Report 201488
the insurance risk transfer has been assessed to be insig-nificant.
The insurance risk is generally calculated as the risk sum payable as a percentage of the reserve behind the contract at the beginning of the contract period. It is Nor-dea’s assessment that a risk percentage of five or higher is a significant insurance risk.
The contracts can be divided into the following classes: Insurance contracts: – Traditional life insurance contracts with and with-out discretionary participation feature – Unit-Linked contracts with significant insurance risk – Health and personal accident Investment contracts: – Investment contracts with discretionary participa-tion feature – Investment contracts without discretionary partici-pation feature
Insurance contracts The measurement principles under local GAAP have been maintained consequently resulting in a non-uniform accounting policies method on consolidation.
Traditional life insurance provisions represent consoli-dated provisions for all the companies in Nordea Life & Pensions, including companies in Sweden, Norway, Fin-land, Denmark, Poland, Luxembourg, Isle of Man, Estonia and Lithuania.
In Denmark, Sweden and Finland the measurements are prepared by calculating the present value of future bene-fits, to which the policyholders are entitled. The calcula-tion includes assumptions about market consistent dis-counting rates as well as expenses and life risk. The discount rate is based on the liabilities’ current term. In Denmark, the provision, in addition, includes bonus potential on paid policies and on future premiums.
In Norway the provisions are mainly calculated on the basis of a prospective method. The discount rate used is equal to the original tariff rates adjusted for assumptions about expenses and risk.
The accounting policy for each company is based on the local structure of the business and is closely related to sol-vency rules and national regulation concerning profit shar-ing and other requirements about collective bonus potential.
Unit-Linked contracts represent life insurance provisions relating to Unit-Linked policies written either with or without an investment guarantee. Unit-Linked contracts classified as insurance contracts include the same insurance risk elements as traditional insurance contracts. These contracts are mainly recognised and measured at fair value on the basis of:
the fair value of the assets linked to the Unit-Linked contracts, andthe estimated present value of the insurance risk which is calculated in the same way as traditional insurance contracts considering the impact on every risk element included in the cash flows.
Health and personal accident provisions include premium reserves and claims outstanding. This item is recognised and measured on deferred basis in the same way as gen-eral insurance contracts.
Investment contracts Investment contracts are contracts with policyholders, which do not transfer sufficient insurance risk to be classi-fied as insurance contracts.
However, investment contracts with discretionary par-ticipation features are, in line with IFRS 4, accounted for as insurance contracts using local accounting principles. Nordea Life & Pension has only a small number of these contracts.
Investment contracts without discretionary participation features are recognised and measured at fair value in accordance with IAS 39 “Financial Instruments: Recogni-tion and Measurement”, equal to fair value of the assets linked to these contracts. These assets are classified into the category Designated at fair value through profit or loss to eliminate or significantly reduce an accounting mismatch.
Discretionary participating features (DPF)Some traditional life insurance contracts and investment contracts include a contractual right for the policyholder to receive significant benefits in addition to guaranteed ben-efits. Nordea has discretion to pay these additional bene-fits as bonus on risk result, expense result and interest rate. These DPF-contracts (Collective bonus potential) are classified as liabilities on the balance sheet.
Collective bonus potential includes amounts allocated but not attributed to the policyholders. In Finland, collec-tive bonus potential includes the policyholder’s part of the total unrealised investment gains and bonus potential on paid policies and future premiums (the difference between retrospective and market consistent prospective measure-ment principles of the insurance contracts). In Norway, collective bonus potential includes the policyholder’s part of both the total unrealised investment gains and addi-tional reserves. In Sweden and Denmark, the main valua-tion principle is fair value (insurance contracts). The poli-cyholder’s part of both realised and unrealised investment gains is therefore included on the balance sheet represent-ing either “Change in technical provisions, Life” and/or “Change in collective bonus potentials, Life”, depending on whether the investment result is allocated or not. Both the mentioned lines are included on the balance sheet line “Liabilities to policyholders”.
Liability adequacy testThe adequacy of insurance provisions is assessed at each reporting date to ensure that the carrying amount of the liabilities is higher than the best estimate of future cash flows discounted with current interest rates. If needed, additional provisions are accounted for and recognised in the income statement.
20. TaxesThe item “Income tax expense” in the income statement comprises current- and deferred income tax. The income tax expense is recognised in the income statement, except to the extent the tax effect relates to items recognised in other comprehensive income or directly in equity, in which case the tax effect is recognised in other compre-hensive income or in equity respectively.
Current tax is the expected tax expense on the taxable income for the year, using tax rates enacted or substan-
G1 Accounting policies

Accounting policies – Nordea Group
Nordea Annual Report 2014 89
tively enacted at the reporting date, and any adjustment to tax payable in respect of previous years.
Deferred tax assets and liabilities are recognised, using the balance sheet method, for temporary differences between the carrying amounts of assets and liabilities for financial reporting purposes and the amounts used for taxation purposes. Deferred tax assets are recognised for the carry forward of unused tax losses and unused tax credits. Deferred tax is not recognised for temporary dif-ferences arising on initial recognition of assets or liabili-ties in a transaction that is not a business combination and that affects neither accounting nor taxable profit, nor for differences relating to investments in group under-takings and associated undertakings to the extent that it is probable that they will not reverse in the foreseeable future. In addition, deferred tax is not recognised for tax-able temporary differences arising on the initial recogni-tion of goodwill.
Deferred tax is measured at the tax rates that are expected to be applied to the temporary differences when they reverse, based on the laws that have been enacted or substantively enacted at the reporting date. Deferred tax assets and liabilities are not discounted. A deferred tax asset is recognised only to the extent that it is probable that future taxable profits will be available against which the temporary differences, tax losses carry forward and unused tax credits can be utilised. Deferred tax assets are reviewed at each reporting date and are reduced to the extent that it is no longer probable that the related tax ben-efit will be realised.
Current tax assets and current tax liabilities are offset when the legal right to offset exists and Nordea intends to either settle the tax asset and the tax liability net or to recover the asset and settle the liability simultaneously. Deferred tax assets and deferred tax liabilities are gener-ally offset if there is a legally enforceable right to offset current tax assets and current tax liabilities.
21. Earnings per shareBasic earnings per share is calculated by dividing the profit or loss attributable to shareholders of Nordea Bank AB (publ) by the weighted average number of ordinary shares outstanding during the period.
Diluted earnings per share is determined by adjusting the weighted average number of ordinary shares out-standing for the effects of all dilutive potential ordinary shares, consisting of rights to performance shares in the long term incentive programmes.
The potential ordinary shares are only considered to be dilutive, on the balance sheet date, if all performance con-ditions are fulfilled and if a conversion to ordinary shares would decrease earnings per share. The rights are further-more considered dilutive only when the exercise price, with the addition of future services, is lower than the peri-od’s average share price.
22. Employee benefitsAll forms of consideration given by Nordea to its employ-ees as compensation for services performed are employee benefits. Short-term benefits are to be settled within twelve months after the reporting period when the ser-vices have been performed. Post-employment benefits are
G1 Accounting policies
benefits payable after the termination of the employment. Post-employment benefits in Nordea consist only of pen-sions. Termination benefits normally arise if an employ-ment is terminated before the normal retirement date, or if an employee accepts an offer of voluntary redundancy.
Short-term benefitsShort term benefits consist mainly of fixed and variable salary. Both fixed and variable salaries are expensed in the period when the employees have performed services to Nordea. Nordea has also issued share-based payment pro-grammes, which are further described in section 25 “Share-based payment”.
More information can be found in Note G7 “Staff costs”.
Post-employment benefitsPension plansThe companies within Nordea have various pension plans, consisting of both defined benefit pension plans and defined contribution pension plans, reflecting national practices and conditions in the countries where Nordea operates. Defined benefit pension plans are predomi-nantly sponsored in Sweden, Norway and Finland. The major defined benefit pension plans are funded schemes covered by assets in pension funds/foundations. If the fair value of plan assets, associated with a specific pension plan, is lower than the gross present value of the defined benefit obligation determined using the projected unit credit method, the net amount is recognised as a liability (“Retirement benefit liabilities”). If not, the net amount is recognised as an asset (“Retirement benefit assets”). Non-funded pension plans are recognised as “Retirement ben-efit liabilities “.
Most pensions in Denmark, but also plans in other countries, are based on defined contribution arrangements that hold no pension liability for Nordea. All defined ben-efit pension plans are closed for new employees. Nordea also contributes to public pension systems.
Pension costsObligations for defined contribution pension plans are recognised as an expense as the employee renders ser-vices to the entity and the contribution payable in exchange for that service becomes due. Nordea’s net obli-gation for defined benefit pension plans is calculated separately for each plan by estimating the amount of future benefit that employees have earned for their ser-vice in the current and prior periods. That benefit is dis-counted to determine its present value. Actuarial calcula-tions including the projected unit credit method are applied to assess the present value of defined benefit obligations and related costs, based on several actuarial and financial assumptions (as disclosed in Note G32 “Retirement benefit obligations”).
When establishing the present value of the obligation and the fair value of any plan assets, remeasurement effects may arise as a result of changes in actuarial assumptions and experience effects (actual outcome compared to assump-tions). The remeasurement effects are recognised immedi-ately in equity through other comprehensive income.
When the calculation results in a benefit the recognised asset is limited to the present value of any future refunds

Nordea Group – Accounting policies
Nordea Annual Report 201490
from the plan or reductions in future contributions to the plan.
Social security contribution is calculated and accounted for based on the net recognised surplus or deficit by plan and is included on the balance sheet as “Retirement bene-fit liabilities” or “Retirement benefit assets”.Discount rate in defined benefit pension plansThe discount rate is determined by reference to high qual-ity corporate bonds, where a deep enough market for such bonds exists. Covered bonds are in this context considered to be corporate bonds. In countries where no such market exists the discount rate is determined by reference to gov-ernment bond yields. In Sweden, Norway and Denmark the discount rate is determined with reference to covered bonds and in Finland with reference to corporate bonds.
Termination benefitsAs mentioned above termination benefits normally arise if an employment is terminated before the normal retire-ment date, or if an employee accepts an offer of voluntary redundancy. Termination benefits do not arise if the employees have to continue performing services and the termination benefits can be considered to be normal com-pensation for those services.
Termination benefits are expensed when Nordea has an obligation to make the payment. An obligation arises when there is a formal plan committed to on the appropri-ate organisational level and when Nordea is without real-istic possibility of withdrawal, which normally occurs when the plan has been communicated to the group affected or to their representatives.
Termination benefits can include both short-term bene-fits, for instance a number of months’ salary, and post-employment benefits, normally in the form of early retire-ment. Short-term benefits are classified as “Salaries and remuneration” and post-employment benefits as “Pension costs” in Note G7 “Staff costs”.
23. EquityNon-controlling interestsNon-controlling interests comprise the portion of net assets of group undertakings not owned directly or indi-rectly by Nordea Bank AB (publ).
For each business combination, Nordea measures the non-controlling interests in the acquiree either at fair value or at their proportionate share of the acquiree’s iden-tifiable net assets.
Share premium reserveThe share premium reserve consists of the difference between the subscription price and the quota value of the shares in Nordea’s rights issue. Transaction costs in con-nection to the rights issue have been deducted.
Other reservesOther reserves comprise income and expenses, net after tax effects, which are reported in equity through other comprehensive income. These reserves include fair value reserves for cash flow hedges, financial assets classified into the category Available for sale and accumulated remeasurements of defined benefit pension plans, as well as a reserve for translation differences.
G1 Accounting policies
Retained earningsApart from undistributed profits from previous years, retained earnings include the equity portion of untaxed reserves. Untaxed reserves according to national rules are accounted for as equity net of deferred tax at prevailing tax rates in the respective country.
In addition, Nordea’s share of the earnings in associated undertakings, after the acquisition date, that have not been distributed is included in retained earnings.
Treasury sharesTreasury shares are not accounted for as assets. Acquisi-tions of treasury shares are classified as deductions of “Retained earnings” on the balance sheet. Also own shares in trading portfolios are classified as treasury shares. Divested treasury shares are recognised as an increase of “Retained earnings”.
Contracts on Nordea shares that can be settled net in cash are either financial assets or financial liabilities.
24. Financial guarantee contracts and credit commitmentsUpon initial recognition, premiums received in issued financial guarantee contracts and credit commitments are recognised as prepaid income on the balance sheet. The guarantees and irrevocable credit commitments are subse-quently measured, and recognised as a provision on the balance sheet, at the higher of either the received fee less amortisation, or an amount calculated as the discounted best estimate of the expenditure required to settle the pre-sent obligation. Changes in provisions are recognised in the income statement in the item ”Net loan losses”.
Premiums received for financial guarantees are, as stated in section 6 “Recognition of operating income and impairment”, amortised over the guarantee period and recognised as ”Fee and commission income” in the income statement. Premiums received on credit commit-ments are generally amortised over the loan commitment period. The contractual amounts are recognised off-bal-ance sheet, financial guarantees in the item “Contingent liabilities” and irrevocable credit commitments in the item “Credit commitments”.
25. Share-based paymentEquity-settled programmesNordea has annually issued Long Term Incentive Pro-grammes from 2007 through 2012. Employees participat-ing in these programmes are granted share-based equity-settled rights, i.e. rights to receive shares for free or to acquire shares in Nordea at a significant discount com-pared to the share price at grant date. The value of such rights is expensed. The expense is based on the estimated fair value of each right at grant date. The total fair value of these rights is determined based on the group’s estimate of the number of rights that will eventually vest, which is reassessed at each reporting date. The fair value is expensed on a straight-line basis over the vesting period. The vesting period is the period that the employees have to remain in service in Nordea in order for their rights to vest. Market performance conditions in Performance Share II are reflected as a probability adjustment to the initial estimate of fair value at grant date. There is no adjustment (true-up) for differences between estimated

Accounting policies – Nordea Group
Nordea Annual Report 2014 91
G1 Accounting policies
and actual vesting due to market conditions. Social security costs are also allocated over the vesting
period, in accordance with statement UFR 7 issued by the Swedish Financial Reporting Board: “IFRS 2 and social security contributions for listed enterprises”. The provi-sion for social security costs is reassessed on each report-ing date to ensure that the provision is based on the rights’ fair value at the reporting date.
For more information see Note G7 “Staff costs”.
Cash-settled programmesNordea has to defer payment of variable salaries under Nordic FSA’s regulations and general guidelines, as is also the case with the Executive Incentive Programme (EIP). The deferred amounts are to some extent indexed using Nordea’s TSR (Total Shareholders’ Return) and these “pro-grammes” are cash-settled share-based programmes. These programmes are fully vested when the payments of variable salaries are initially deferred and the fair value of the obligation is remeasured on a continuous basis. The remeasurements are, together with the related social charges, recognised in the income statement in the item “Net result from items at fair value”.
For more information see Note G7 “Staff costs”.
26. Related party transactionsNordea defines related parties as:
Shareholders with significant influenceGroup undertakingsAssociated undertakingsKey management personnelOther related parties
All transactions with related parties are made on an arm’s length basis.
Shareholders with significant influenceShareholders with significant influence are shareholders that have the power to participate in the financial and operating decisions of Nordea but do not control those policies.
Group undertakingsFor the definition of group undertakings see section 5 “Principles of consolidation”. Further information on the undertakings included in the Nordea Group is found in Note P21 “Investments in group undertakings”.
Group internal transactions between legal entities are performed according to arm’s length principles in con-formity with OECD requirements on transfer pricing. These transactions are eliminated in the consolidated accounts.
Associated undertakingsFor the definition of Associated undertakings see section 5 “Principles of consolidation”.
Further information on the associated undertakings included in the Nordea Group is found in Note G19 “Investments in associated undertakings”.
Key management personnelKey management personnel includes the following positions:
The Board of DirectorsThe Chief Executive Officer (CEO)The Group Executive Management (GEM)
For information about compensation, pensions and other transactions with key management personnel, see Note G7 “Staff costs”.
Other related partiesOther related parties comprise close family members to individuals in key management personnel. Other related parties also include companies significantly influenced by key management personnel in Nordea Group as well as companies significantly influenced by close family mem-bers to these key management personnel. Other related parties also include Nordea’s pension foundations.
Information concerning transactions between Nordea and other related parties is found in Note G46 “Related-party transactions”.
27. Exchange rates
EUR 1 = SEKJan–Dec
2014Jan–Dec
2013
Income statement (average) 9.1012 8.6524Balance sheet (at end of period) 9.3930 8.8591
EUR 1 = DKKIncome statement (average) 7.4548 7.4579Balance sheet (at end of period) 7.4453 7.4593
EUR 1 = NOKIncome statement (average) 8.3597 7.8091Balance sheet (at end of period) 9.0420 8.3630
EUR 1 = PLNIncome statement (average) 4.1859 4.1969Balance sheet (at end of period) 4.2732 4.1543
EUR 1 = RUBIncome statement (average) 50.9996 42.3269Balance sheet (at end of period) 72.3370 45.3246

Nordea Group – Notes to the income statement
Nordea Annual Report 201492
G2 Segment reporting
Operating segments
Measurement of Operating segments’ performanceThe measurement principles and allocation between operating segments follow the information reported to the Chief Operat-ing Decision Maker (CODM), as required by IFRS 8. In Nordea the CODM has been defined as Group Executive Management. The main differences compared to the section “Business area results” in this report are that the information for CODM is pre-pared using plan exchange rates and to that different allocation principles between operating segments have been applied.
Basis of segmentationFinancial results are presented for the three main business areas Retail Banking, Wholesale Banking and Wealth Man-agement, with further breakdown on operating segments, and for the operating segment Group Corporate Centre. Other operating segments below the quantitative thresholds in IFRS 8 are included in Other operating segments. Group functions and eliminations as well as the result that is not fully allocated to any of the operating segments, are shown separately as reconciling items.
There have not been any changes to the basis of segmenta-tion compared with the Annual Report 2013.
Reportable Operating segmentsRetail Banking conducts a full service banking operation and offers a wide range of products. It is Nordea’s largest customer area and serves household customers and corporate customers in the Nordic markets (Retail Banking Nordic) as well as the Baltic countries (Retail Banking Baltic). Wholesale Banking pro-vides banking and other financial solutions to large Nordic and international corporate, institutional and public companies. The
division Corporate & Institutional Banking is a customer ori-ented organisation serving the largest globally operating corpo-rates. This division is also responsible for Nordea’s customers within the financial sector, and offers single products such as funds and equity products as well as consulting services within asset allocation and fund sales. The division Shipping, Offshore & Oil Services is responsible for Nordea’s customers within the shipping, offshore and oil services industries and provides tai-lor made solutions and syndicated loan transactions. Nordea Bank Russia offers a full range of bank services to corporate and private customers in Russia. Capital Markets unallocated includes the result in Capital Markets which is not allocated to the main business areas. Wealth management provides high quality investment, savings and risk management products. It also manages customers’ assets and gives financial advice to affluent and high net worth individuals as well as to institu-tional investors. The division Private Banking provides wealth planning, full-scale investment advice, credit, and estate plan-ning services to wealthy individuals, businesses and their own-ers, trusts and foundations. The division Asset Management is responsible for all actively managed investment products including internally managed investment funds and mandates as well as selected externally managed funds, and for serving the institutional asset management customers. Life & Pensions serves Nordea’s Retail Private Banking and corporate customers with a full range of pension, endowment and risk products as well as tailor-made advice for bank distribution. Life & Pen-sions unallocated includes the result in Life & Pensions which is not allocated to the main business areas. Group Corporate Cen-tre’s main objective is to manage the Group’s funding and to support the management and control of the Nordea Group. The main income in Group Corporate Centre originates from Group Treasury.
Income statement 2014, EURmRetail
BankingWholesale
Banking
Wealth Manage-
ment
Group Corporate
Centre
Other Operating
segments
Total operating segments
Recon-ciliation
Total Group
Net interest income 3,839 1,153 142 279 –15 5,398 84 5,482Net fee and commission income 1,580 632 1,170 –13 –1 3,368 –526 2,842Net result from items at fair value 385 695 369 91 6 1,546 –121 1,425Profit from associated undertakings accounted for under the equity method 10 — — 0 0 10 8 18Other income 26 4 15 12 0 57 400 457Total operating income 5,840 2,484 1,696 369 –10 10,379 –155 10,224– of which internal transactions1 –1,547 –221 16 1,694 58 0 — —Staff costs –1,355 –780 –494 –276 –7 –2,912 –237 –3,149Other expenses –1,569 –51 –286 46 –2 –1,862 227 –1,635Depreciation, amortisation and impairment charges of tangible and intangible assets –100 –30 –11 –49 — –190 –392 –582
Total operating expenses –3,024 –861 –791 –279 –9 –4,964 –402 –5,366Profit before loan losses 2,816 1,623 905 90 –19 5,415 –557 4,858Net loan losses –433 –100 –3 0 0 –536 2 –534Operating profit 2,383 1,523 902 90 –19 4,879 –555 4,324Income tax expense –606 –365 –199 –19 –17 –1,206 253 –953Net profit for the year from continuing operations 1,777 1,158 703 71 –36 3,673 –302 3,371Balance sheet 31 Dec 2014, EURbn Loans to the public2 224 57 9 — — 290 58 348Deposits and borrowings from the public2 110 41 11 — — 162 35 197

Notes to the income statement – Nordea Group
Nordea Annual Report 2014 93
Break-down of Retail Banking
Retail Banking Nordic1 Retail Banking Baltic2 Retail Banking Other3 Total Retail Banking
Income statement, EURm 2014 2013 2014 2013 2014 2013 2014 2013
Net interest income 3,789 3,693 143 128 –93 –88 3,839 3,733Net fee and commission income 1,581 1,419 39 40 –40 –20 1,580 1,439Net result from items at fair value 398 378 –10 –3 –3 –4 385 371Profit from associated undertakings accounted for under the equity method 6 9 0 0 4 3 10 12Other income 1 33 3 1 22 29 26 63Total operating income 5,775 5,532 175 166 –110 –80 5,840 5,618– of which internal transactions –1,335 –1,448 –41 –46 –171 –128 –1,547 –1,622Staff costs –961 –956 –23 –24 –371 –356 –1,355 –1,336Other expenses –1,885 –1,922 –62 –61 378 363 –1,569 –1,620
Depreciation, amortisation and impairment charges of tangible and intangible assets –45 –45 –1 –1 –54 –55 –100 –101Total operating expenses –2,891 –2,923 –86 –86 –47 –48 –3,024 –3,057Profit before loan losses 2,884 2,609 89 80 –157 –128 2,816 2,561Net loan losses –358 –443 –63 –40 –12 –10 –433 –493Operating profit 2,526 2,166 26 40 –169 –138 2,383 2,068Income tax expense –626 –561 –17 –14 37 31 –606 –544Net profit for the year from continuing operations 1,900 1,605 9 26 –132 –107 1,777 1,524Balance sheet, EURbnLoans to the public 216 209 8 8 — — 224 217
Deposits and borrowings from the public 106 104 4 3 — — 110 107
1) Retail Banking Nordic includes banking operations in Denmark, Finland, Norway and Sweden.2) Retail Banking Baltic includes banking operations in Estonia, Latvia and Lithuania. 3) Retail Banking Other includes the support areas Development & Projects, Distribution, Segments, Products and IT.
Income statement, 2013 EURmRetail
BankingWholesale
Banking
Wealth Manage-
ment
Group Corporate
Centre
Other Operating segments
Total operating segments
Recon-ciliation
Total Group
Net interest income 3,733 1,078 121 319 40 5,291 234 5,525Net fee and commission income 1,439 551 1,077 –9 –1 3,057 –415 2,642Net result from items at fair value 371 918 294 82 –6 1,659 –120 1,539Profit from associated undertakings accounted for under the equity method 12 — — 0 0 12 67 79Other income 63 3 22 8 –1 95 11 106Total operating income 5,618 2,550 1,514 400 32 10,114 –223 9,891– of which internal transactions1 –1,622 –283 22 1,816 67 0 — —Staff costs –1,336 –765 –474 –231 –7 –2,813 –165 –2,978Other expenses –1,620 –76 –290 10 –2 –1,978 143 –1,835Depreciation, amortisation and impairment charges of tangible and intangible assets –101 –35 –19 –41 0 –196 –31 –227
Total operating expenses –3,057 –876 –783 –262 –9 –4,987 –53 –5,040Profit before loan losses 2,561 1,674 731 138 23 5,127 –276 4,851Net loan losses –493 –242 –3 0 0 –738 3 –735Operating profit 2,068 1,432 728 138 23 4,389 –273 4,116Income tax expense –544 –374 –160 –31 –13 –1,122 113 –1,009Net profit for the year from continuing operations 1,524 1,058 568 107 10 3,267 –160 3,107Balance sheet 31 Dec 2013, EURbn Loans to the public2 217 57 9 — — 283 59 342Deposits and borrowings from the public2 107 41 11 — — 159 42 201
1) IFRS 8 requires information on revenues from transactions between operating segments. Nordea has defined inter-segment revenues as internal interest income and expense related to the funding of the operating segments by the internal bank in Group Corporate Centre.
2) The volumes are only disclosed separate for operating segments if separately reported to the Chief Operating Decision Maker.
G2 Segment reporting, cont.

Nordea Group – Notes to the income statement
Nordea Annual Report 201494
Break-down of Wholesale BankingCorporate
& Institutional Banking
Shipping, Offshore
& Oil ServicesNordea Bank
RussiaCapital Markets
unallocatedWholesale
Banking Other1Total Wholesale
Banking
Income statement, EURm 2014 2013 2014 2013 2014 2013 2014 2013 2014 2013 2014 2013
Net interest income 688 673 263 257 280 221 –1 4 –77 –77 1,153 1,078Net fee and commission income 572 524 68 51 13 12 –72 –88 51 52 632 551Net result from items at fair value 265 302 34 31 9 11 350 524 37 50 695 918Other income 0 0 0 0 1 0 3 2 0 1 4 3Total operating income 1,525 1,499 365 339 303 244 280 442 11 26 2,484 2,550– of which internal transactions –146 –215 –62 –77 –32 –42 100 134 –81 –83 –221 –283Staff costs –46 –37 –20 –24 –68 –64 –452 –452 –194 –188 –780 –765Other expenses –370 –379 –42 –38 –32 –29 264 257 129 113 –51 –76Depreciation, amortisation and impairment charges of tangible and intangible assets 0 0 0 0 –8 –6 –15 –18 –7 –11 –30 –35Total operating expenses –416 –416 –62 –62 –108 –99 –203 –213 –72 –86 –861 –876Profit before loan losses 1,109 1,083 303 277 195 145 77 229 –61 –60 1,623 1,674Net loan losses –122 –165 37 –92 –16 7 0 0 1 8 –100 –242Operating profit 987 918 340 185 179 152 77 229 –60 –52 1,523 1,432Income tax expense –249 –242 –67 –59 –46 –33 –18 –55 15 15 –365 –374Net profit for the year from continuing operations 738 676 273 126 133 119 59 174 –45 –37 1,158 1,058Balance sheet, EURbnLoans to the public 39 39 11 12 7 6 — — — — 57 57Deposits and borrowings from the public 36 36 4 4 1 1 — — — — 41 41
1) Wholesale Banking Other includes the area International Units and the support areas Transaction Products, Segment CIB and IT.
G2 Segment reporting, cont.
Break-down of Wealth Management
Private Banking Asset ManagementLife & Pensions
unallocatedWealth Management
Other1Total Wealth Management
Income statement, EURm 2014 2013 2014 2013 2014 2013 2014 2013 2014 2013
Net interest income 141 120 1 1 0 0 0 0 142 121Net fee and commission income 575 524 591 494 275 262 –271 –203 1,170 1,077Net result from items at fair value 93 80 5 0 271 215 0 –1 369 294Other income 5 2 2 8 8 9 0 3 15 22Total operating income 814 726 599 503 554 486 –271 –201 1,696 1,514– of which internal transactions 12 15 0 0 0 1 4 6 16 22Staff costs –173 –168 –121 –113 –124 –126 –76 –67 –494 –474
Other expenses –231 –233 –104 –107 –78 –73 127 123 –286 –290Depreciation, amortisation and impairment –4 –6 –1 0 –4 –10 –2 –3 –11 –19Total operating expenses –408 –407 –226 –220 –206 –209 49 53 –791 –783Profit before loan losses 406 319 373 283 348 277 –222 –148 905 731Net loan losses –3 –3 0 0 0 0 0 0 –3 –3Operating profit 403 316 373 283 348 277 –222 –148 902 728Income tax expense –89 –70 –82 –62 –77 –61 49 33 –199 –160Net profit for the year from continuing operations 314 246 291 221 271 216 –173 –115 703 568Balance sheet, EURbnLoans to the public 9 9 — — — — — — 9 9Deposits and borrowings from the public 11 11 — — — — — — 11 11
1) Wealth Management Other includes the area Savings and support areas, such as IT.

Notes to the income statement – Nordea Group
Nordea Annual Report 2014 95
G2 Segment reporting, cont.
Reconciliation between total operating segments and financial statements
Total operating income, EURm
Operating profit, EURm
Loans to the public, EURbn
Deposits and borrowings from the public, EURbn
2014 2013 2014 2013 31 Dec 2014 31 Dec 2013 31 Dec 2014 31 Dec 2013
Total Operating segments 10,379 10,114 4,879 4,389 290 283 162 159Group functions1 –2 3 –129 –116 — — — —Unallocated items2 443 224 –81 47 69 53 39 39Eliminations –31 –186 — — — — — —Differences in accounting policies3 –565 –264 –345 –204 –11 6 –4 3Total 10,224 9,891 4,324 4,116 348 342 197 201
1) Consists of Group Risk Management, Group Internal Audit, Group Identity & Communications, Group Human Resources, Board of Directors and Group Executive Management. 2) Including non-recurring items 2014. Total operating income EUR 378m and Operating profit EUR –157m. 3) Impact from plan rates used in the segment reporting and from that comparative figures for lending/deposits in Banking Poland are restated in operating segments but not in
financial statements.
G3 Net interest income
EURm 2014 2013
Interest incomeLoans to credit institutions 52 60Loans to the public 8,555 9,102Interest-bearing securities 728 751Other interest income 660 691Interest income1 9,995 10,604
1) Of which contingent leasing income amounts to EUR 116m (EUR 114m). Contingent leasing income in Nordea consists of variable interest rates, excluding the fixed margin. If the contingent leasing income decreases there will be an offsetting impact from lower funding expenses.
Total operating income split on product groups, EURm 2014 2013
Banking products 6,188 6,131Capital Markets products 1,968 2,193Savings products & Asset management 1,038 875Life & Pensions 553 476Other 477 216Total 10,224 9,891
Banking products consists of three different product types. Account products includes account based products such as lending, deposits, cards and Netbank services. Transaction products consist of cash management as well as trade and project finance services. Financing products includes asset based financing through leasing, hire purchase and factoring as well as sales to finance partners such as dealers, vendors and retailers. Capital Markets products contains financial instruments, or arrangements for financial instruments, that are available in the financial marketplace, including currencies, commodities, stocks and bonds. Savings products & Asset management includes Investment funds, Discretionary Management, Portfolio Advice, Equity Trading and Pension Accounts. Investment Funds is a bun-dled product where the fund company invest in stocks, bonds, derivatives or other standardised products on behalf of the fund’s shareholders. Discretionary Management is a service providing the management of an investment portfolio on behalf of the customer and Portfolio Advise is a service provided to support the customers’ investment decisions.
Life & Pensions includes life insurance and pension prod-ucts and services.
Geographical information
Total operating income, EURm Assets, EURbn
2014 201331 Dec
201431 Dec
2013
Sweden 2,421 2,125 162 147Finland 1,831 1,604 83 72Norway 1,772 1,993 85 82Denmark 3,183 3,218 277 242Baltic countries 203 178 22 10Russia 203 193 6 5Other 611 580 34 72Total 10,224 9,891 669 630
Nordea’s main geographical markets comprise the Nordic countries, the Baltic countries and Russia. Revenues and assets are distributed to geographical areas based on the loca-tion of the customers’ operations. Goodwill is allocated to different countries based on the location of the business activities of the acquired entities.

Nordea Group – Notes to the income statement
Nordea Annual Report 201496
EURm 2014 2013
Interest expenseDeposits by credit institutions –103 –122Deposits and borrowings from the public –1,145 –1,439Debt securities in issue –3,545 –3,705Subordinated liabilities –331 –340Other interest expenses1 611 527Interest expense –4,513 –5,079Net interest income 5,482 5,525
1) The net interest income from derivatives, measured at fair value, related to Nordea´s funding. This can have both a positive and negative impact on other interest expense, for further information see Note G1.
Interest income from financial instruments not measured at fair value through profit or loss amounts to EUR 7,725m (EUR 8,347m). Interest expenses from financial instruments not measured at fair value through profit or loss amounts to EUR –3,925m (EUR –4,376m). Interest on impaired loans amounted to an insignificant portion of interest income.
G4 Net fee and commission income
EURm 2014 2013
Asset management commissions 1,189 1,000Life insurance 367 350Brokerage, securities issues and corporate finance 281 296Custody and issuers services 128 124Deposits 39 50Total savings and investments 2,004 1,820Payments 406 417Cards 529 508Total payments and cards 935 925Lending 541 510
Guarantees and documentary payment 181 187Total lending related commissions 722 697Other commission income 138 132Fee and commission income 3,799 3,574Savings and investments –363 –322Payments –85 –90Cards –253 –259State guarantee fees –132 –132Other commission expenses –124 –129Fee and commission expense –957 –932Net fee and commission income 2,842 2,642
Fee income, not included in determining the effective interest rate, from financial assets and liabilities not measured at fair value through profit or loss amounts to EUR 557m (EUR 543m).
Fee income, not included in determining the effective inter-est rate, from fiduciary activities that result in the holding or investing of assets on behalf of customers amounts to EUR 1,837m (EUR 1,646m). The corresponding amounts for fee expenses is EUR –96m (EUR –72m).
G5 Net result from items at fair value
EURm 2014 2013
Shares/participations and other share-related instruments 2,829 2,630Interest-bearing securities and other interest-related instruments 3,119 238Other financial instruments 409 90Foreign exchange gains/losses –564 876Investment properties 246 145Change in technical provisions, Life insurance1 –3,835 –1,519Change in collective bonus potential, Life insurance –871 –978Insurance risk income, Life insurance 212 202Insurance risk expense, Life insurance –120 –145Total 1,425 1,539
Net result from categories of financial instruments2
EURm 2014 2013
Available for sale assets, realised 1 –6Financial instruments designated at fair value through profit or loss 184 40Financial instruments held for trading3 1,522 318Financial instruments under fair value hedge accounting 33 73– of which net gains/losses on hedging
instruments 1,248 –1,404– of which net gains/losses on hedged items –1,215 1,477Financial assets measured at amortised cost4 49 13Financial liabilities measured at amortised cost –28 –26Foreign exchange gains/losses excluding currency hedges –588 914Other –20 –5Financial risk income, net Life insurance1 180 161Insurance risk income, net Life insurance 92 57Total 1,425 1,539
1) Premium income amounts to EUR 2,270m (EUR 2,278m).2) The figures disclosed for Life (financial risk income and insurance risk income) are
disclosed on gross basis, i.e. before eliminations of intra-group transactions.3) Of which amortised deferred day one profits amounts to EUR 11m (EUR 12m).4) Of which EUR 49m (EUR 13m) related to instruments classified into the category
“Loans and receivables” and EUR 0m (EUR 0m) related to instruments classified into the category “Held to maturity”.
G6 Other operating income
EURm 2014 2013
Divestment of shares1 378 1
Income from real estate 9 5
Sale of tangible assets 12 18Other 58 82Total 457 1061) Gain from divestment of Nets Holding A/S amounts to EUR 378m.
G3 Net interest income, cont.

Notes to the income statement – Nordea Group
Nordea Annual Report 2014 97
1) Of which allocation to profit-sharing 2014 EUR 80m (EUR 45m) consisting of a new allocation of EUR 76m (EUR 46m) and an adjustment related to prior years of EUR 4m (EUR –1m).
2) Of which EUR 103m in salaries and EUR 44m in pension costs, including social security contributions, regards termination benefits in connection to the cost effi-ciency programme launched in the second quarter.
3) Executives include the Board of Directors (including deputies), CEO, deputy CEO, executive vice presidents and Group Executive Management in the parent company as well as the Board of Directors (including deputies), managing directors and exe-cutive vice presidents in operating group undertakings. Former board members (including deputies), CEOs, deputy CEOs, managing directors and executive vice presidents, in the parent company and operating group undertakings, are included. Executives amount to 182 (181) individuals.
EURm 2014 2013
Pension costs1
Defined benefits plans (Note G32)2 –80 –50Defined contribution plans –209 –172Total –289 –222
1) Pension cost for executives as defined in footnote 3 above, amounts to EUR 5m (EUR 5m) and pension obligations to EUR 39m (EUR 45m). 2) Excluding social security contributions. Including social security contributions
EUR 99m (EUR 61m).
Additional disclosures on remuneration under Nordic FSAs’ regulations and general guidelinesThe qualitative disclosures under these regulations can be found in the separate section on remuneration in the Board of Directors’ Report, while the quantitative disclosures will be published in a separate report on Nordea’s homepage (www.nordea.com) no later than one week before the Annual General Meeting on 19 March 2015.
EURm 2014 2013
Salaries and remuneration (specification below)1 –2,366 –2,287Pension costs (specification below) –289 –222Social security contributions –427 –387Other staff costs –67 –82Total2 –3,149 –2,978
Salaries and remunerationTo executives3
– Fixed compensation and benefits –16 –18
– Performance-related compensation –12 –12– Allocation to profit-sharing 0 0Total –28 –30To other employees –2,338 –2,257Total –2,366 –2,287
G7 Staff costs
Remuneration to the Board of Directors 1
EUR 2014 2013
Chairman of the Board:Björn Wahlroos 273,160 267,264
Vice Chairman of the Board:Marie Ehrling 140,996 125,765
Other Board members2:Stine Bosse3 — 21,655Peter F Braunwalder4 22,435 91,945Elisabeth Grieg 94,862 70,291Svein Jacobsen5 57,767 97,445Tom Knutzen 97,502 91,945Robin Lawther6 72,426 —Lars G Nordström 94,862 91,945Sarah Russell 94,862 91,945Kari Stadigh 101,035 97,445Total 1,049,907 1,047,645
1) The Board remuneration consists of a fixed annual fee and a fixed annual fee for committee work. These are paid out on a quarterly basis in SEK and translated into EUR based on the average exchange rate each year for accounting purposes.Exhange rate effects have had a decreasing impact on the remuneration to the Board.
2) Employee representatives excluded.3) Resigned as member of the Board as from the AGM 2013.4) Resigned as member of the Board as from the AGM 2014.5) Resigned as member of the Board as from 31 July 2014.6) New member of the Board as from the AGM 2014.
Salary and benefitsChief Executive Officer (CEO)For 2014 the remuneration to the CEO consists of three com-ponents: Fixed salary, GEM Executive Incentive Program (GEM EIP) and benefits.
The fixed salary amounted to SEK 11,252,193 (EUR 1,236,337), an increase with 2.0% compared to 2013 as announced at the AGM 2014.
GEM EIP 2014 is based on agreed, specific targets and can amount to a maximum of 100% of the fixed salary. For 2014 the outcome of the GEM EIP amounted to EUR 1,084,267, and the outcome in 2013 was EUR 831,280. The reason behind the increase in 2014 is a higher outcome on the tar-gets on Group level.
In accordance with remuneration regulations from the Swedish FSA 40% of GEM EIP 2014 will be paid out in 2015, 30% will be deferred to 2018 and 30% to 2020.
The benefits for 2014 amounted to EUR 78,342 and include primarily car and housing. For 2013 the benefits amounted to EUR 81,645.
The total earned remuneration for 2014 based on the three components amounted to EUR 2,398,946 and in 2013 to EUR 2,187,895.
The CEO took part in the previous share-based Long Term Incentive Programmes (LTIP) that was terminated in 2012. The expense from the LTIP programmes is accounted for over three years starting in the year in which they were part of the total remuneration (the year of issuance). The expense 2014 thus includes expense from LTIP 2011 and LTIP 2012 and the expense for 2013 includes expense from LTIP 2010, LTIP 2011 and LTIP 2012.
For 2014 the expense for the CEO related to the LTIP pro-grammes amounted to EUR 398,081, and for 2013 the expense amounted to EUR 349,817.
For more information on the LTIP programmes see the sep-arate section on remuneration in the Board of Directors’ report and below.
Remuneration to the Board of Directors, CEO and Group Executive Management Board remunerationThe Annual General Meeting (AGM) 2014 decided to increase the remuneration to the Board of Directors (the Board) by 3% for all members, apart from the remuneration to the vice chairman which was raised by 14%. The remuneration was EUR 259,550 for the chairman, EUR 123,250 for the vice chair-man and EUR 80,250 for other members. The annual remu-neration for committee work was EUR 21,350 for the chair-man of the committee and EUR 15,150 for other members. Board members employed by Nordea do not receive separate remuneration for their Board membership. There are no com-mitments for severance pay, pension or other remuneration to the members of the Board, except for pension commitments to one Board member previously employed by Nordea.

Nordea Group – Notes to the income statement
Nordea Annual Report 201498
G7 Staff costs, cont.
Remuneration to the Chief Executive Officer and Group Executive Management 1
Fixed salaryGEM Executive
Incentive Programme2 BenefitsTotal
remuneration
EUR 2014 2013 2014 2013 2014 2013 2014 2013
Chief Executive Officer (CEO):Christian Clausen3 1,236,337 1,274,970 1,084,267 831,280 78,342 81,645 2,398,946 2,187,895
Group Executive Management (GEM):6 (6) individuals excluding CEO4 4,359,064 4,450,178 3,912,561 2,748,761 267,992 290,739 8,539,617 7,489,678Total 5,595,401 5,725,148 4,996,828 3,580,041 346,334 372,384 10,938,563 9,677,573
1) The CEO and members of GEM were until 2012 offered a Variable Salary Part (VSP) and a share-based Long Term Incentive Programme (LTIP). Instead of these two pro-grammes the Board in 2013 decided, in order to reduce complexity, to offer a GEM Executive Incentive Programme (GEM EIP).
2) The outcome from GEM Executive Incentive Programme (GEM EIP) 2014 has been expensed in full in 2014 but will be paid out over a five year deferral period with forfeiture clauses in order to comply with the remuneration regulations from the Swedish FSA. The reason behind the increase in 2014 is a higher outcome on the targets on Group level. The GEM EIP is indexed with Nordea’s total shareholder return (TSR) during the deferral period. The GEM EIP is further described in the separate section on remuneration in the Board of Directors’ report and below.
3) The CEO’s salary is paid in SEK and converted to EUR based on the average exchange rate each year. The fixed salary increased with 2% to SEK 11,252,193 (EUR 1,236,337) as communicated at the AGM 2014. The decrease in fixed salary 2014 expressed in EUR is due to exchange rates effects. Benefits are included at taxable values.
4) GEM members are included for the period they have been appointed. Benefits are included at taxable values. One new GEM member was appointed in June 2014 and one mem-ber resigned in June 2014. The reasons behind the increase in GEM EIP 2014 are a higher outcome on the targets on Group level and that GEM only had five members part of 2013. Termination benefits amounted to EUR 1.6m (EUR 1.5m) and are excluded from the table above.
Long Term Incentive Programmes (LTIP) 2010–2012
Expense1 (EUR) Number of outstanding shares2
2014 2013 LTIP 20123 LTIP 20114 LTIP 20104 Total
Chief Executive Officer (CEO):Christian Clausen 398,081 349,817 150,025 45,311 13,536 208,872
Group Executive Management (GEM):6 (6) Individuals excluding CEO 1,062,253 1,021,443 371,185 118,392 38,774 528,351Total 1,460,334 1,371,260 521,210 163,703 52,310 737,223
1) The expense from the LTIP programmes is recognised as the vesting requirements are fulfilled over the three years vesting period starting the year of issuance. The expense 2013 includes expense from LTIP 2010, LTIP 2011 and LTIP 2012. The expense 2014 includes expense from LTIP 2011 and LTIP 2012. LTIP 2012 will be fully expensed in May 2015. The main reason behind the increase 2014 is that the expectation on the outcome from the vesting requirements in LTIP 2012 has changed. GEM members are included for the period they have been appointed and the expense is calculated in accordance with IFRS 2 “Share-based Payment”.
2) 60% of the vested shares are deferred with forfeiture clauses due to remuneration regulations from the Swedish FSA and allotted over a five year period, for LTIP 2010 starting May 2013, for LTIP 2011 starting May 2014 and for LTIP 2012 starting May 2015. See also the separate Remuneration section on page 55 and below for more details.
3) The CEO and members of GEM have a conditional right to a maximum 104,242 matching shares, 312,726 performance shares I and 104,242 performance shares II in LTIP 2012, in total 521,210 shares. The value of the outcome from LTIP 2012 on the day of allotment in May 2015 cannot exceed the annual fixed salary year end 2011.
4) Shares in LTIP 2010 and LTIP 2011 are fully vested and consequently not conditional.
The fixed salary, GEM Executive Incentive Programme and contract terms for the CEO are proposed by the Board Remu-neration Committee (BRC) and approved by the Board in accordance with Nordea’s remuneration guidelines approved by AGM 2014.
Group Executive Management (GEM) The BRC prepares alterations in salary levels and outcome of GEM EIP as well as other changes in the remuneration pack-age for members of GEM, for resolution by the Board. GEM EIP 2014, which is based on agreed, specific targets, can be a maximum of 100% of the fixed salary.
Benefits include primarily car and/or housing. As for the CEO, GEM members took part of the previous LTIPs.
PensionChief Executive Officer (CEO) The CEO is covered by a defined benefit plan up to the age of 60. The pension amounts to 50% of the pensionable income, defined as the fixed salary, for life. The maximum pensiona-ble income is 200 Swedish Income Base Amounts. The pen-sion obligation is funded by plan assets. At age 60 the pension risk is transferred to the CEO. Pension payments are to be made in accordance with local legislations and pension insur-ance conditions and start no earlier than at retirement. From age 60 the CEO will have a defined contribution plan. The pension contribution is 30% of the fixed salary.
The total expense related to the remuneration of the CEO in 2014, including the three components of the remuneration earned in 2014 and the LTIP programmes that were part of the remuneration for previous years, amounted to EUR 2,797,027. For 2013 the total expense was EUR 2,537,712.
In accordance with the remuneration regulation from the Swedish FSA, the variable salary components and outcome from LTIPs are deferred and paid out over a period of five years. The below table specifies the paid fixed and variable salary (GEM EIP and VSP), benefits given and shares allotted in the Long Term Incentive Programmes (LTIP) to the CEO in 2014 and 2013.
Paid salary, benefits given and shares allotted to the CEO
EUR 2014 2013
Fixed salary 1,236,337 1,274,970Benefits 78,342 81,645VSP/GEM EIP (earned previous years)1 444,116 215,744LTIP (earned previous years)2 325,548 91,008Total 2,084,343 1,663,367
1) Payment in 2014 relate to 40% of outcome from GEM EIP 2013 and deferrals from VSP 2012 and VSP 2011. Payment in 2013 relates to 40% of outcome from VSP 2012 and deferral from VSP 2011.
2) Taxable benefit in 2014 relates to allotment of 33,592 shares from LTIP 2011 and LTIP 2010. Taxable benefit in 2013 relates to allotment of 11,280 shares from LTIP 2010.

Notes to the income statement – Nordea Group
Nordea Annual Report 2014 99
G7 Staff costs, cont.
Group Executive Management (GEM) The pension agreements vary due to local country practices. GEM members are entitled to retire with pension at the age of 62, 65 or 70. Pension agreements are defined benefit plans, defined contribution plans or a combination of such plans.
Two members have defined benefit plans not based on col-lective agreements. One of these defined benefit plans pro-vides retirement pension amounting to 50% of pensionable income for life from age 62, including national pension bene-fits. The second defined benefit plan not based on a collective agreement provides a retirement pension, including both national pension benefits and previously earned pension. The
retirement pension benefit in this plan decreased from 70% to 66% of pensionable income for future earnings as from 1 Jan-uary 2011. The second defined benefit plan will be closed by end of March 2015 and substituted by a defined contribution plan. Two members have pensions in accordance with the Swedish collective agreement, one in BTP1 (defined contribu-tion plan) and one in BTP2 (defined benefit plan), with com-plementing defined contribution plans on top of the collective agreement. Finally two members have defined contribution plans. Fixed salary is pensionable income for all GEM-mem-bers. Part of GEM EIP is included in the pensionable income for one member.
Pension expense and pension obligation2014 2013
EUR Pension expense1 Pension obligation2 Pension expense1 Pension obligation2
Board members3:Lars G Nordström — 367,851 — 363,280
Chief executive officer (CEO):Christian Clausen4 760,804 15,341,148 807,988 12,440,440
Group Executive Management (GEM):6 (6) individuals excluding CEO5 2,122,898 8,585,591 1,799,215 5,502,372
Former Chairman of the Board and CEOs:Vesa Vainio and Thorleif Krarup6 –339,377 5,773,806 — 16,916,203Total 2,544,325 30,068,396 2,607,203 35,222,295
1) The pension expense is related to pension premiums paid in defined contribution agreements and pension rights earned during the year in defined benefit agreements (Current service cost and Past service cost and settlements as defined in IAS 19). Of the total pension expense EUR 945,583 (EUR 853,782) relates to defined contribution agreements.
2) The pension obligation is calculated in accordance with IAS 19. The obligation is dependent on changes in actuarial assumptions and inter annual variations can therefore be significant. IAS 19 includes an assumption about future increases in salary, which leads to that the pension obligations disclosed are the earned pension rights calculated using the expected salary levels at retirement. The pension plans are funded, meaning that these obligations are backed with plan assets with fair value generally on a similar level as the obligations.
3) Employee representatives excluded. The pension obligation is in accordance with the collective pension agreement BTP2 and earned during the employment period.4) The CEO’s pension agreement is unchanged. The main reasons behind the increase in pension obligation are changes in discount rates and new pension rights earned in 2014.
Exchange rate effects have had a decreasing impact on both the pension expense and the pension obligation.5) Members of GEM included for the period they are appointed. The pension obligation is the obligation towards the members of GEM as of 31 December. The main reasons
behind the increase in pension obligation are changes in discount rates and new pension rights earned in 2014. The main reasons behind the increase in pension expense are that six members have been included for the whole year and changes in accumulated paid up policies. Exchange rate effects have had a decreasing impact on both the pension expense and the pension obligation. Termination benefits amounted to EUR 0.2m (EUR 0.4m) and are excluded from the table above.
6) The pension obligation for Vesa Vainio and Thorleif Krarup is mainly due to pension rights earned in, and funded by, banks forming Nordea. The decrease in the pension obli-gation is mainly due to that the pension obligation/pension risk was transferred to Thorleif Krarup end of August 2014 and the pension obligation for Thorleif Krarup is hence accounted for as settled. The settlement led to a gain of EUR 339,377.
Notice period and severance payIn accordance with their employment contracts CEO and four GEM members have a notice period of 12 months and a sever-ance pay equal to 12 months’ salary to be reduced by the sal-ary the executive receives as a result of any other employment during these 12 months. The CEO is not entitled to severance pay if leaving Nordea after the age of 60.
Two GEM members are entitled to 6 months’ salary dur-ing the notice period, and with regard to severance pay 18 months’ salary to be reduced by the salary they receive as a result of any other employment during these 18 months.
Loans to key management personnelLoans to key management personnel, as defined in Note G1 section 26, amount to EUR 3m (EUR 3m). Interest income on these loans amounts to EUR 0m (EUR 0m).
For key management personnel who are employed by Nor-dea the same credit terms apply as for other employees,
except for key management personnel in Denmark whose loans are granted on terms based on market conditions. In Norway the employee interest rate for loans is variable and was at 31 December 2014 2.8% for loans up to NOK 5m and 3.15% for loans above NOK 5m. In Finland the employee interest rate for loans corresponds to Nordea’s funding cost with a margin of 40 basis points up to EUR 0.4m, and 60 basis points on the part that exceeds EUR 0.4m. In Sweden the employee interest rate on fixed- and variable interest rate loans is 215 basis points lower than the corresponding inter-est rate for external customers (with a lower limit of 50 basis points, a decrease from 150 basis points as from 1 December 2014). There is currently a cap of 57 Swedish price base amounts both on fixed- and variable interest rate loans. Inter-est on loans above the defined caps is set on market terms. Loans to family members of key management personnel are granted on normal market terms, as well as loans to key man-agement personnel who are not employed by Nordea.
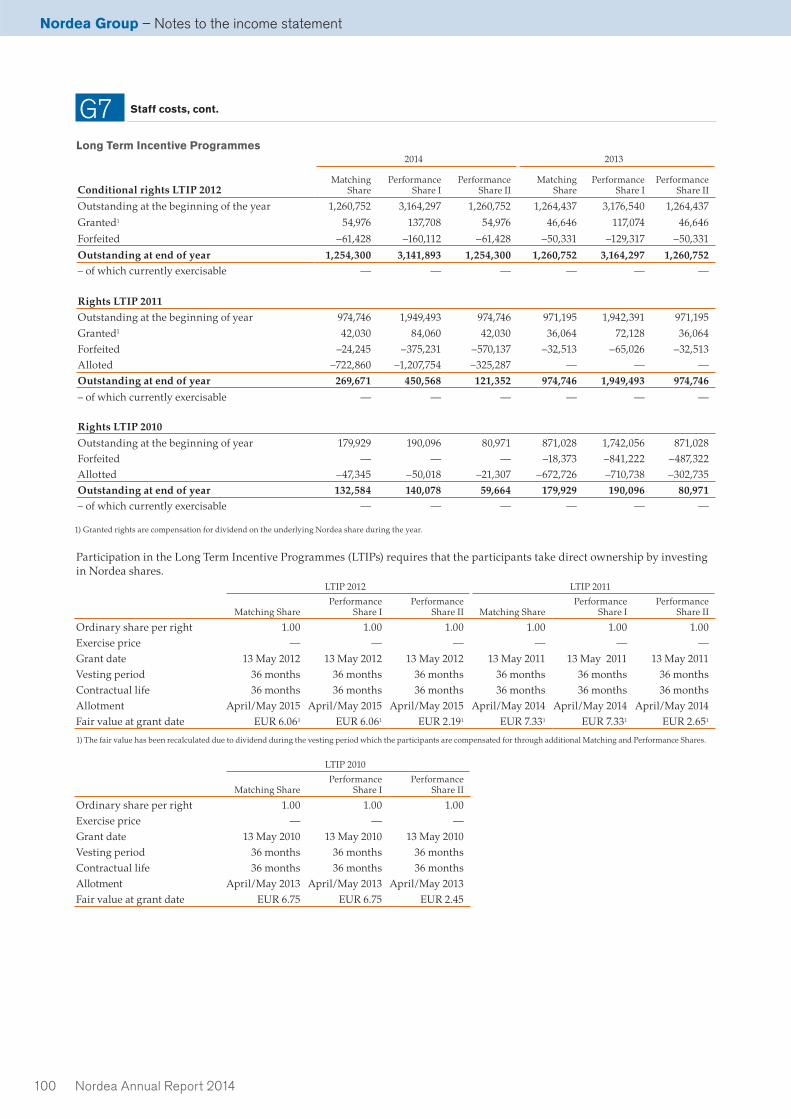
Nordea Group – Notes to the income statement
Nordea Annual Report 2014100
G7 Staff costs, cont.
Long Term Incentive Programmes2014 2013
Conditional rights LTIP 2012Matching
SharePerformance
Share IPerformance
Share IIMatching
SharePerformance
Share IPerformance
Share II
Outstanding at the beginning of the year 1,260,752 3,164,297 1,260,752 1,264,437 3,176,540 1,264,437
Granted1 54,976 137,708 54,976 46,646 117,074 46,646
Forfeited –61,428 –160,112 –61,428 –50,331 –129,317 –50,331
Outstanding at end of year 1,254,300 3,141,893 1,254,300 1,260,752 3,164,297 1,260,752– of which currently exercisable — — — — — —
Rights LTIP 2011Outstanding at the beginning of year 974,746 1,949,493 974,746 971,195 1,942,391 971,195
Granted1 42,030 84,060 42,030 36,064 72,128 36,064Forfeited –24,245 –375,231 –570,137 –32,513 –65,026 –32,513Alloted –722,860 –1,207,754 –325,287 — — —Outstanding at end of year 269,671 450,568 121,352 974,746 1,949,493 974,746
– of which currently exercisable — — — — — —
Rights LTIP 2010
Outstanding at the beginning of year 179,929 190,096 80,971 871,028 1,742,056 871,028Forfeited — — — –18,373 –841,222 –487,322Allotted –47,345 –50,018 –21,307 –672,726 –710,738 –302,735Outstanding at end of year 132,584 140,078 59,664 179,929 190,096 80,971– of which currently exercisable — — — — — —
1) Granted rights are compensation for dividend on the underlying Nordea share during the year.
Participation in the Long Term Incentive Programmes (LTIPs) requires that the participants take direct ownership by investing in Nordea shares.
LTIP 2012 LTIP 2011
Matching SharePerformance
Share IPerformance
Share II Matching SharePerformance
Share IPerformance
Share II
Ordinary share per right 1.00 1.00 1.00 1.00 1.00 1.00Exercise price — — — — — —Grant date 13 May 2012 13 May 2012 13 May 2012 13 May 2011 13 May 2011 13 May 2011Vesting period 36 months 36 months 36 months 36 months 36 months 36 monthsContractual life 36 months 36 months 36 months 36 months 36 months 36 monthsAllotment April/May 2015 April/May 2015 April/May 2015 April/May 2014 April/May 2014 April/May 2014Fair value at grant date EUR 6.061 EUR 6.061 EUR 2.191 EUR 7.331 EUR 7.331 EUR 2.651
1) The fair value has been recalculated due to dividend during the vesting period which the participants are compensated for through additional Matching and Performance Shares.
LTIP 2010
Matching SharePerformance
Share IPerformance
Share II
Ordinary share per right 1.00 1.00 1.00Exercise price — — —Grant date 13 May 2010 13 May 2010 13 May 2010Vesting period 36 months 36 months 36 monthsContractual life 36 months 36 months 36 monthsAllotment April/May 2013 April/May 2013 April/May 2013Fair value at grant date EUR 6.75 EUR 6.75 EUR 2.45

Notes to the income statement – Nordea Group
Nordea Annual Report 2014 101
G7 Staff costs, cont.
LTIP 2012 LTIP 2011 LTIP 2010
Service condition, Matching Share/Performance Share I and II
Employed, with certain exemptions, within the Nordea Group during the three year vesting period.
Employed, with certain exemptions, within the Nordea Group during the three year vesting period.
Employed, with certain exemptions, within the Nordea Group during the three year vesting period.
Performance condition, Performance Share I
Average RAROCAR during the period 2012 up to and including 2014. Full allotment will be obtained if the RARO-CAR amounts to 17%.
Compound Annual Growth Rate in RAPPS from year 2010 (base year) to and including year 2013. Full allotment will be obtained if the Compound Annual Growth Rate amounts to or exceeds 10%.
Compound Annual Growth Rate in RAPPS from year 2009 (base year) to and including year 2012. Full allotment was obtained if the Compound Annual Growth Rate amounted to or exceeded 9%.
EPS knock out, Performance Share I
— Average reported EPS for 2011–2013 lower than EUR 0.26.
Average reported EPS for 2010–2012 lower than EUR 0.26.
Performance condition, Performance Share II
RAROCAR during the period 2012 up to and including 2014 and P/B-ranking year-end 2014 compared to a peer group. Full allotment will be obtained if the RAROCAR amounts to 14% and if Nor-dea’s P/B-ranking is 1–5.
TSR during 2011–2013 in com-parison with a peer group. Full allotment will be obtained if Nordea is ranked number 1–5.
TSR during 2010–2012 in com-parison with a peer group. Full allotment was obtained if Nor-dea was ranked number 1–5.
Cap The market value of the allot-ted shares is capped to the participants’ annual salary for year-end 2011.
The market value of the allot-ted shares is capped to the participants’ annual salary for year-end 2010.
The market value of the allotted shares is capped to the partici- pants’ annual salary for year-end 2009.
Dividend compensation
The number of Matching Shares and Performance Shares will be adjusted for dividends on the underlying Nordea share during the vest-ing period, as if assuming that each dividend was used to immediately invest in addi-tional Nordea shares.
The number of Matching Shares and Performance Shares will be adjusted for dividends on the underlying Nordea share during the vest-ing period, as if assuming that each dividend was used to immediately invest in addi-tional Nordea shares.
—
Conditions and requirements For each ordinary share the participants lock in to the LTIPs, they are granted a conditional Matching Share to receive ordi-nary shares based on continued employment, with certain exemptions, and the conditional Performance Share I and II to receive additional ordinary shares also based on fulfillment of certain performance conditions. The performance conditions for Performance Share I comprise a target growth in risk adjusted profit per share (RAPPS) or a target in risk-adjusted return on capital at risk (RAROCAR). Should the reported earnings per share (EPS) be lower then a predetermined level the participants are not entitled to exercise any Performance Share I. The performance conditions for Performance Share II
are market related and comprise growth in total shareholder return (TSR) in comparison with a peer group’s TSR or a target in RAROCAR and in P/B-ranking compared to a peer group. Furthermore the profit for each right is capped.
When the performance conditions are not fulfilled in full, the rights that are no longer exercisable are shown as forfeited in the previous tables, together with shares forfeited due to participants leaving the Nordea Group.
LTIP 2011/2010 are not alloted in full due to deferral and retention requirements by Nordic FSAs.

Nordea Group – Notes to the income statement
Nordea Annual Report 2014102
Fair value calculationsThe fair value is measured through the use of generally accepted valuation models with the following input factors:
LTIP 2012 LTIP 2011 LTIP 2010
Weighted average share price EUR 6.70 EUR 8.39 EUR 6.88Right life 3.0 years 3.0 years 3.0 yearsDeduction of expected dividends No No NoRisk free rate Not applicable Not applicable Not applicableExpected volatility Not applicable Not applicable Not applicable
As the exercise price (zero for LTIP 2012, LTIP 2011 and LITP 2010) is significantly below the share price at grant date, the value has a limited sensitivity to expected volatility and risk-free interest.
The value of the Performance Share II are based on market related conditions and fulfilment of the TSR, RAROCAR and P/B targets have been taken into consideration when calculat-
ing the rights’ fair value at grant date. When calculating the impact from the market conditions it has been assumed that all possible outcomes have equal possibilities. Also the caps in each programme have been taken into consideration when calculating the rights’ fair value at grant. The adjustment to fair value is approximately 2–3% of the weighted average share price.
Expenses for equity-settled share-based payment programmes1
EURm LTIP 2012 LTIP 2011 LTIP 2010
Expected expense for the whole programme –29 –21 –14Maximum expense for the whole programme –29 –21 –14Total expense during 2014 –14 –2 —Total expense during 2013 –6 –7 –3
1) All amounts excluding social security contribution.
When calculating the expected expense an expected annual employee turnover of 5% has been used. The expected expense is recognised over the vesting period of 36 months.
G7 Staff costs, cont.
Cash-settled share-based payment transactionsNordea operates share-linked deferrals on parts of variable compensation for certain employee categories, indexed with Nordea Total Shareholder Returns (TSR) and either transferred after three years or transferred in equal instalments over a three to five year period. Since 2011 Nordea also operates TSR-linked retention on part of variable compensation for certain employee categories. Due to that the allocation of variable compensation is not finally decided during the current year, the deferred amount during the year in the table below relates to variable compensation earned the previous year.
In addition Nordea in 2013 introduced the Executive Incen-tive Programme (“EIP”) which aims to strengthen Nordea’s capability to retain and recruit the best talents. The aim is fur-ther to stimulate the managers and key employees whose efforts have direct impact on Nordea’s result, profitability and long term value growth. EIP reward performance meeting agreed predetermined targets on Group, business unit and individual level. The effect on the long term result is to be con-
Share linked deferrals
EURm 2014 2013
Opening balance 28 21Deferred/earned during the year 17 15TSR indexation during the year 4 9Payments during the year1 –17 –15Translation differences 0 –2Closing balance 32 28
1) There have been no adjustments due to forfeitures in 2014.
sidered when determining the targets. The EIP shall not exceed the fixed salary. EIP shall be paid in the form of cash and be subject to TSR-indexation, deferral, forfeiture clauses and retention as per relevant remuneration regulations. The main part of EIP 2014 is paid no earlier than autumn 2018. Participa-tion in the programme is offered to up to 400 managers and key employees, except GEM who are instead offered a GEM EIP (further information about the GEM EIP can be found in the Remuneration section in the Board of Director’s Report), within the Nordea Group. EIP is offered instead of Nordea’s LTIP and VSP for the invited employees. The allocation of the EIP 2014 is decided during spring 2015, and a reservation of EUR 43m excl. social costs is made 2014. 80% of the allocated amount will be subject to TSR-indexation.
The below table only includes deferred amounts indexed with Nordea TSR. EIP has been included as from 2014, when deferred. Further information regarding all deferred amounts can be found in the separate report on remuneration published on Nordea’s homepage (www.nordea.com).

Notes to the income statement – Nordea Group
Nordea Annual Report 2014 103
Average number of employees – Continuing operationsTotal Men Women
2014 2013 2014 2013 2014 2013
Full-time equivalentsDenmark 8,255 8,251 4,328 4,512 3,927 3,739Finland 6,971 7,116 1,990 1,863 4,981 5,253Sweden 6,963 6,881 3,212 3,083 3,751 3,798Norway 3,238 3,280 1,748 1,767 1,490 1,513Russia 1,418 1,454 454 469 964 985Poland 692 503 242 114 450 389Estonia 486 468 104 102 382 366Latvia 431 443 132 132 299 311Luxembourg 373 376 245 240 128 136Lithuania 351 340 110 101 241 239United States 118 113 61 56 57 57United Kingdom 75 69 46 45 29 24Singapore 85 77 29 23 56 54Germany 57 55 31 23 26 32Switzerland 30 29 13 12 17 17China 28 24 12 9 16 15Brazil 4 4 3 2 1 2Total average 29,575 29,483 12,760 12,553 16,815 16,930Total number of employees (FTEs), end of period 29,397 29,429
G7 Staff costs, cont.
Gender distributionIn the parent company s Board of Directors 50% (67%) were men and 50% (33%) were women. In the Board of Directors of the Nordea Group companies, 75% (78%) were men and 25%
(22%) were women. The corresponding numbers for Other executives were 65% (69%) men and 35% (31%) women. Inter-nal Boards consist mainly of management in Nordea.

Nordea Group – Notes to the income statement
Nordea Annual Report 2014104
G10 Net loan losses
EURm 2014 2013
Loan losses divided by class
Realised loan losses –2 0Allowances to cover realised loan losses 2 —Reversals of previous provisions 23 1Loans to credit institutions1 23 1
Realised loan losses –633 –709Allowances to cover realised loan losses 450 508Recoveries on previous realised loan losses 81 76Provisions –998 –1,131Reversals of previous provisions 557 508Loans to the public1 –543 –748
Realised loan losses –3 0Allowances to cover realised loan losses 3 —Recoveries on previous realised loan losses — 0Provisions –107 –25Reversals of previous provisions 93 37Off-balance sheet items2 –14 12Net loan losses –534 –735
1) See Note G13 “Loans and impairment”. 2) Included in Note G31 “Provisons” as “Transfer risk, off-balance” and “Individually
assessed guarantees and other commitments”.
G9 Depreciation, amortisation and impairment
charges of tangible and intangible assets
EURm 2014 2013
Depreciation/amortisation
Properties and equipment –122 –91Intangible assets –110 –119Total –232 –210
Impairment charges/reversed impairment charges
Intangible assets –350 –17Total –350 –17Total –582 –227
G8 Other expenses
EURm 2014 2013
Information technology –558 –671Marketing and representation –103 –116Postage, transportation, telephone and office expenses –177 –192Rents, premises and real estate –387 –373Other –410 –483Total –1,635 –1,835
Auditors’ fees – Total operationsEURm 2014 2013
KPMG Auditing assignments –5 –7Audit-related services –1 –1Tax advisory services 0 0Other assignments –1 –5Total –7 –13
Ernst & YoungAuditing assignments –1 —Audit-related services 0 —Tax advisory services 0 —Other assignments 0 —Total –1 —Total Auditors’ fees –8 –13

Notes to the income statement – Nordea Group
Nordea Annual Report 2014 105
G11 Taxes
Income tax expense
EURm 2014 2013
Current tax –887 –927Deferred tax –6 –31Bank tax in Finland1 –60 –51Total –953 –1,009
1) The Finnish bank tax was introduced in 2013 and is based on risk exposure amount rather than income.
For current and deferred tax recognised in Other comprehensive income, see Statement of comprehensive income. The tax on the Group’s operating profit differs from the theoretical amount that would arise using the tax rate in Sweden (excluding bank tax in Finland) as follows:
EURm 2014 2013
Profit before tax 4,324 4,116Tax calculated at a tax rate of 22.0% –951 –906Effect of different tax rates in other countries –55 –123
Income from associated undertakings 2 17Tax-exempt income 131 38Non-deductible expenses –25 –32Adjustments relating to prior years 9 35Utilization of non-capitalized tax losses carry-forwards from previous periods 1 2Change of tax rate 3 33Not creditable foreign taxes –8 –22Tax charge –893 –958Average effective tax rate 21% 23%
Deferred taxDeferred tax
assetsDeferred tax
liabilities
EURm 2014 2013 2014 2013
Deferred tax related to:Tax losses carry-forward 283 50 — —Loans to the public 20 19 410 430Derivatives 10 10 459 155Intangible assets 0 0 44 72Investment properties 0 0 150 155Retirement benefit assets/obligations 156 25 60 52Hedge of net investments in foreign operations — 3 94 —Liabilities/provisions 54 52 127 169Other 7 7 39 6Netting between deferred tax assets and liabilities –400 –104 –400 –104Total 130 62 983 935
EURm 2014 2013
Unrecognised deferred tax assetsUnused tax losses carry-forward with no expire date 44 45Total 44 45

Nordea Annual Report 2014106
G13 Loans and impairment
Central banks and credit institutions The public1 Total
EURm 31 Dec 2014 31 Dec 2013 31 Dec 2014 31 Dec 2013 31 Dec 2014 31 Dec 2013
Loans, not impaired 19,177 22,515 344,407 338,703 363,584 361,218Impaired loans — 24 6,425 6,540 6,425 6,564– Performing — — 4,115 3,909 4,115 3,909– Non-performing — 24 2,310 2,631 2,310 2,655Loans before allowances 19,177 22,539 350,832 345,243 370,009 367,782
Allowances for individually assessed impaired loans — –24 –2,329 –2,373 –2,329 –2,397– Performing — — –1,432 –1,372 –1,432 –1,372– Non-performing — –24 –897 –1,001 –897 –1,025Allowances for collectively assessed impaired loans –2 –3 –418 –419 –420 –422Allowances –2 –27 –2,747 –2,792 –2,749 –2,819Loans, carrying amount 19,175 22,512 348,085 342,451 367,260 364,963 1) Finance leases, where Nordea Group is a lessor, are included in Loans to the public, see Note G21 Leasing.
Nordea Group – Notes to the income statement
G12 Earnings per share
Total operationsContinuing operations
Discontinued operations
2014 2013 2014 2013 2014 2013
Earnings:Profit attributable to shareholders of Nordea Bank AB (publ) (EURm) 3,332 3,116 3,371 3,107 –39 9
Number of shares (in millions):Number of shares outstanding at beginning of year 4,050 4,050 4,050 4,050 4,050 4,050Average number of own shares –26 –31 –26 –31 –26 –31Weighted average number of basic shares outstanding 4,024 4,019 4,024 4,019 4,024 4,019Adjustment for diluted weighted average number of additionalordinary shares outstanding1 7 1 7 1 7 1Weighted average number of diluted shares outstanding 4,031 4,020 4,031 4,020 4,031 4,020
Basic earnings per share, EUR–Total operations 0.83 0.77 0.84 0.77 –0.01 0.00Diluted earnings per share, EUR–Total operations 0.83 0.77 0.84 0.77 –0.01 0.00
1) Relates to the Long Term Incentive Programmes (LTIP). For further information on these programmes, see Note G1 section 21.

Notes to the balance sheet – Nordea Group
Nordea Annual Report 2014 107
Movements of allowance accounts for impaired loansCentral banks and credit institutions The public Total
EURm
Indi-vidually assessed
Collec-tively
assessed Total
Indi- vidually assessed
Collec-tively
assessed Total
Indi- vidually assessed
Collec-tively
assessed Total
Opening balance at 1 Jan 2014 –24 –3 –27 –2,373 –419 –2,792 –2,397 –422 –2,819Provisions 1 0 1 –877 –121 –998 –876 –121 –997Reversals of previous provisions 22 0 22 442 115 557 464 115 579Changes through the income statement 23 0 23 –435 –6 –441 –412 –6 –418Allowances used to cover realised loan losses 2 — 2 450 — 450 452 — 452Translation differences –1 1 — 29 7 36 28 8 36Closing balance at 31 Dec 2014 0 –2 –2 –2,329 –418 –2,747 –2,329 –420 –2,749
Opening balance at 1 Jan 2013 –24 –4 –28 –2,376 –444 –2,820 –2,400 –448 –2,848Provisions 0 0 0 –957 –174 –1,131 –957 –174 –1,131Reversals of previous provisions 0 1 1 383 125 508 383 126 509Changes through the income statement 0 1 1 –574 –49 –623 –574 –48 –622Reclassified to assets held for sale — — — 60 14 74 60 14 74Allowances used to cover realised loan losses — — — 508 — 508 508 — 508Reclassification — — — –42 42 0 –42 42 0Translation differences 0 0 0 51 18 69 51 18 69Closing balance at 31 Dec 2013 –24 –3 –27 –2,373 –419 –2,792 –2,397 –422 –2,819
Allowances and provisions1
Central banks and credit institutions The public Total
EURm 31 Dec 2014 31 Dec 2013 31 Dec 2014 31 Dec 2013 31 Dec 2014 31 Dec 2013
Allowances for items on the balance sheet –2 –27 –2,747 –2,792 –2,749 –2,819Provisions for off balance sheet items –9 –10 –63 –51 –72 –61Total allowances and provisions –11 –37 –2,810 –2,843 –2,821 –2,880
1) Included in Note G31 "Provisions" as "Transfer risk, off-balance" and "individually assessed guarantees and other commitments".
G13 Loans and impairment, cont.
Key ratios1
31 Dec2014
31 Dec2013
Impairment rate, gross, basis points 174 178
Impairment rate, net, basis points 111 113
Total allowance rate, basis points 74 77
Allowances in relation to impaired loans, % 36 37
Total allowances in relation to impaired loans, % 43 43
Non-performing loans, not impaired, EURm 289 418
1) For definitions, see "Business definitions" on page 71.

Nordea Group – Notes to the balance sheet
Nordea Annual Report 2014108
G14 Interest-bearing securities
EURm31 Dec
201431 Dec
2013
State and sovereigns 26,107 21,422Municipalities and other public bodies 2,385 2,490Mortgage institutions 28,742 32,481Other credit institutions 23,730 23,931Corporates 5,175 6,095Corporates sub-investment grade 758 445Other 213 450Total 87,110 87,314
G15 Financial instruments pledged as collateral
Financial instruments pledged as collateralIn repurchase transactions and in securities lending transac-tions, non-cash assets are transferred as collateral. When the counterpart receiving the collateral has the right to sell or repledge the assets, the assets are reclassified on the balance sheet to the item Financial instruments pledged as collateral.
EURm31 Dec
201431 Dec
2013
Interest-bearing securities 12,121 9,544Shares 30 31Total 12,151 9,575
For information on transferred assets and reverse repos, see Note G43.
G16 Shares
EURm31 Dec
201431 Dec
2013
Shares 15,505 12,164Fund units, equity related 16,529 11,329Fund units, interest related 7,745 9,809Total 39,779 33,302
– of which Financial instruments pledged as collateral (Note G15) 30 31Total 39,749 33,271

Notes to the balance sheet – Nordea Group
Nordea Annual Report 2014 109
G17 Derivatives and Hedge accounting
Fair value Total nom amount31 Dec 2014, EURm Positive Negative
Derivatives held for tradingInterest rate derivativesInterest rate swaps 62,562 56,949 4,187,058FRAs 55 62 61,419Futures and forwards 360 392 1,294,054Options 15,447 12,815 456,865Total 78,424 70,218 5,999,396
Equity derivativesEquity swaps 105 275 7,372Futures and forwards 13 22 981Options 549 780 20,132Total 667 1,077 28,485
Foreign exchange derivativesCurrency and interest rate swaps 17,526 19,612 723,861
Currency forwards 2,224 994 84,666Options 467 329 29,654Other 1 1 99Total 20,218 20,936 838,280
Credit derivativesCredit Default Swaps (CDS) 2,864 2,853 91,827Total 2,864 2,853 91,827Commodity derivatives 71 19 787Other derivatives 35 15 2,359
Total derivatives held for trading 102,279 95,118 6,961,134
Derivatives used for hedge accountingInterest rate derivatives 2,044 1,064 95,925Equity derivatives — 4 55Foreign exchange derivatives 796 1,154 28,094Total derivatives used for hedge accounting 2,840 2,222 124,074 – of which cash flow hedges 816 850 36,0911
– of which fair value hedges 1,672 1,370 100,5981
– of which net investment hedges 352 2 12,674
Total derivatives 105,119 97,340 7,085,208
1) Some cross currency interest rate swaps and interest rate swaps are used both as fair value hedges and cash flow hedges and the nominal amounts are then reported on both lines.
Periods when hedged cashflows are expected to occur and when they are expected to affect the income statement
31 Dec 2014, EURm <1 year 1–3 years 3–5 years 5–10 years 10 yearsCash inflows (assets) — — — — —Cash outflows (liabilities) 3,626 10,022 3,989 3,628 1,191Net cash outflows 3,626 10,022 3,989 3,628 1,191

Nordea Group – Notes to the balance sheet
Nordea Annual Report 2014110
G17 Derivatives and Hedge accounting, cont.
Fair value Total nom amount31 Dec 2013, EURm Positive Negative
Derivatives held for tradingInterest rate derivativesInterest rate swaps 48,038 43,270 3,943,615FRAs 16 18 50,590Futures and forwards 206 210 1,155,477Options 8,397 7,904 567,809Total 56,657 51,402 5,717,491
Equity derivativesEquity swaps 86 151 5,381Futures and forwards 3 5 733Options 618 645 16,189Total 707 801 22,303
Foreign exchange derivativesCurrency and interest rate swaps 9,467 10,203 749,352Currency forwards 472 510 84,848Options 185 149 21,116Total 10,124 10,862 855,316
Credit derivativesCredit Default Swaps (CDS) 1,337 1,361 60,888Total 1,337 1,361 60,888Commodity derivatives 144 113 3,925Other derivatives 34 27 2,378Total derivatives held for trading 69,003 64,566 6,662,301
Derivatives used for hedge accountingInterest rate derivatives 1,573 588 97,594Foreign exchange derivatives 416 770 18,563Total derivatives used for hedge accounting 1,989 1,358 116,157
– of which cash flow hedges 530 843 21,8991
– of which fair value hedges 1,417 493 105,5021
– of which net investment hedges 42 22 9,455
Total derivatives 70,992 65,924 6,778,458
1) Some cross currency interest rate swaps and interest rate swaps are used both as fair value hedges and cash flow hedges and the nominal amounts are reported on both lines.
Periods when hedged cashflows are expected to occur and when they are expected to affect the income statement
31 Dec 2013, EURm <1 year 1–3 years 3–5 years 5–10 years 10 yearsCash inflows (assets) 67 — — — 65Cash outflows (liabilities) 6,013 9,399 14,943 10,736 1,623Net cash outflows 5,946 9,399 14,943 10,736 1,558

Notes to the balance sheet – Nordea Group
Nordea Annual Report 2014 111
EURm 31 Dec
201431 Dec
2013
Assets
Carrying amount at beginning of year 203 –711Changes during the year Revaluation of hedged items 63 926 Translation differences –10 –12Carrying amount at end of year 256 203
Liabilities
Carrying amount at beginning of year 1,734 1,940Changes during the year Revaluation of hedged items 1,812 –169 Translation differences –128 –37Carrying amount at end of year 3,418 1,734
The carrying amount at end of year represents accumulated changes in the fair value for those repricing time periods in which the hedged item is an asset respectively a liability. When the hedged item is an asset, the change in the fair value of the hedged item is presented within assets and when the hedged item is a liability, the change is presented as a liability.
G18 Fair value changes of the hedged items in portfolio hedge of interest rate risk
G19 Investments in associated undertakings
EURm31 Dec
201431 Dec
2013
Acquisition value at beginning of year 641 596Acquisitions during the year 8 8Sales during the year –102 –4Share in earnings1 22 86Dividend received –55 –62Reclassification –8 —Translation differences –18 17Acquisition value at end of year 488 641
Accumulated impairment charges at beginning of year –11 –11Reversed impairment charges during the year 1 1Reclassifications 8 –1Translation differences 1 0Accumulated impairment charges at end of year –1 –11Total 487 630
1) Share in earnings
EURm 2014 2013
Profit from companies accounted for under the equity method 18 79Portfolio hedge, Eksportfinans ASA –10 –7Associated undertakings in Life insurance, reported as Net result from items at fair value 14 14
Share in earnings 22 86
Nordea's share of the associated undertakings’ aggregated balance sheets and income statements can be summarised as follows:
EURm31 Dec
201431 Dec
2013
Total assets 4,068 5,069Net profit or loss from continuing operations –141 41Other comprehensive income — —Total comprehensive income –141 41
Nordea has issued contingent liabilities of EUR 358m (EUR 1,052m) on behalf of associated undertakings.

Nordea Group – Notes to the balance sheet
Nordea Annual Report 2014112
31 Dec 2014 Registration number DomicileCarrying amount
2014, EURmCarrying amount
2013, EURmVoting power of
holding %
Eksportfinans ASA 816521432 Oslo 164 184 23Ejendomspartnerskabet af 1/7 2003 27134971 Ballerup 194 197 49Suomen Luotto-osuuskunta 0201646–0 Helsinki 3 25 27LR Realkredit A/S 26045304 Copenhagen 10 10 39Realia Holding Oy 2106796-8 Helsinki 20 20 25Samajet Nymøllevej 59–91 24247961 Ballerup 21 21 25E-nettet Holding A/S 28308019 Copenhagen 2 2 20Hovedbanens Forretningscenter K/S 16301671 Ballerup 16 15 50Ejendomsselskabet Axelborg I/S 79334413 Copenhagen 9 9 33Automatia Pankkiautomaatit Oy 0974651–1 Helsinki 8 8 33SWIPP Holding APS 36439696 Copenhagen 3 — 30Bankernas Kontantservice A/S 33077599 Copenhagen 5 1 20Bluegarden A/S 27226027 Ballerup 3 3 29Samejet Lautruphøj I/S 50857859 Ballerup 6 6 50Nets Holding A/S1 27225993 Ballerup — 108 21NF Techfleet AB 556967–5423 Ballerup 1 — 20NF Fleet Oy 2006935–5 Espoo 5 3 20Upplysningscentralen UC AB 556137–5113 Stockholm 2 3 26Bankomat AB 556817–9716 Stockholm 5 5 20Other 10 10Total 487 630
1) Sold in July 2014.
G19 Investments in associated undertakings, cont.
G20 Intangible assets
EURm31 Dec
201431 Dec
2013
Goodwill allocated to cash generating units1 Retail Banking Norway 787 847Retail Banking Denmark 591 590Retail Banking Sweden 221 231Life & Pensions 296 309Banking Russia 154 247Shipping, Offshore & Oil services 185 197Total goodwill 2,234 2,421
Computer software 580 757Other intangible assets 94 68Total intangible assets 2,908 3,2461) Excluding goodwill in associated undertakings.
Movements in goodwill
Acquisition value at beginning of year 2,422 2,657Reclassification to assets held for sale — –65Translation differences –187 –170
Acquisition value at end of year 2,235 2,422
Accumulated impairment charges at beginning of year –1 –1Accumulated impairment charges at end of year –1 –1Total 2,234 2,421

Notes to the balance sheet – Nordea Group
Nordea Annual Report 2014 113
An increase in the discount rate of 1 percentage point or a reduc-tion in the future growth rate of 1 percentage points are considered to be reasonably possible changes in key assumptions. Such a change would not result in an impairment in any of the cash gener-ating units, except for the Life business in Poland. An increase in the discount rate by 1 percentage point would result in an impairment loss of EUR 8m and a decrease in the growth rate by 1 percentage point would result in an impairment loss of EUR 6m in Life Poland. The goodwill allocated to Poland amounts to EUR 40m.
The impairment test for Russia did not indicate any impairment loss based on the estimated cash flows and abovementioned assumptions. Reasonable possible changes to the discount rate and the growth rate do not trigger any impairment loss, but the current turmoil in Russia does however create uncertainty also around esti-mated cash flows. It is however Nordea’s assessment that even a sig-nificant decrease in future cash flows would, all other assumptions unchanged, not lead to an impairment loss.
Impairment testing of IT development projectsThe main driver behind the impairment is the decision to build new core banking and payment platforms, but to some extent also cur-rent decisions following reassessments of useful lives of other sys-tems. Reassessments of useful lives follow the recently observed increase in the pace at which the regulatory and technological devel-opment is moving. The impairment has been included in “Group Functions, Other and Eliminations” in the business area reporting and as a reconciling item in Note G2 “Segment reporting”. The recoverable amount of relevant systems is estimated based on their value in use. The impairment of capitalised IT development amount-ing to EUR 350m is recognised on the line “Depreciation, amortisa-tion and impairment charges of tangible and intangible assets”.
Impairment testing of goodwillA cash generating unit, defined as the operating segment, is the basis for the goodwill impairment test.
The impairment test is performed for each cash generating unit by comparing the carrying amount of the net assets, including goodwill, with the recoverable amount. The recoverable amount is the value in use and is estimated based on discounted cash flows. Due to the long-term nature of the investments, cash flows are expected to continue indefinitely.
Cash flows in the near future (generally between 3–5 years) are based on financial forecasts, derived from forecasted margins, vol-umes and cost development. These input variables are based on historical data adjusted to reflect Nordea's assumptions about the future. Cash flows for the period beyond the forecasting period are based on estimated sector growth rates. For impairment testing, a growth rate of 2.0% (2.5%) has been used for all Nordic cash gener-ating units. For cash generating units in Poland and Russia, 2.5% (4.0%) and 2.5% (4.5%) have been used. Growth rates are based on historical data, updated to reflect the current situation.
Cash flows include normalised loan losses. The derived cash flows are discounted at a rate based on the
market’s long-term risk-free rate of interest and yield require-ments. The post-tax discount rate used for the impairment test 2014 is 7.5% (8.5%), which equals a pre-tax rate of 9.9% (11.3%). For operations in Poland, an additional risk premium of 130 (170) basis points has been applied and for Russia an additional risk premium of 580 (250) basis points has been applied.
The impairment tests conducted in 2014 did not indicate any need for goodwill impairment. See Note G1 section 4 for more information.
EURm31 Dec
201431 Dec
2013
Movements in computer software
Acquisition value at beginning of year 1,184 1,041Acquisitions during the year 279 191Disposals during the year –10 –4Reclassifications 4 –12Translation differences –42 –32Acquisition value at end of year 1,415 1,184
Accumulated amortisation at beginning of year –380 –305Amortisation according to plan for the year –85 –89Accumulated amortisation on disposals during the year 10 3Reclassifications — 2Translation differences 7 9Accumulated amortisation at end of year –448 –380
Accumulated impairment charges at beginning of year –47 –42Impairment charges during the year –350 –17Reclassifications — 9Translation differences 10 3Accumulated impairment charges at end of year –387 –47Total 580 757
G20 Intangible assets, cont.

Nordea Group – Notes to the balance sheet
Nordea Annual Report 2014114
Nordea as a lessorFinance leasesNordea owns assets leased to customers under finance lease agreements. Finance lease agreements are reported as receiv-ables from the lessee included in “Loans to the public” (see Note G13) at an amount equal to the net investment in the lease. The leased assets mainly comprise vehicles, machinery and other equipment.
Reconciliation of gross investments and present value of future minimum lease payments:
EURm31 Dec
201431 Dec
2013
Gross investments 7,480 7,751Less unearned finance income –356 –343Net investments in finance leases 7,124 7,408
Less unguaranteed residual values accruing to the benefit of the lessor –22 –73Present value of future minimum lease pay-ments receivable 7,102 7,335Accumulated allowance for uncollectible minimum lease payments receivable 8 10
As of 31 December 2014 the gross investment and the net investment by remaining maturity was distributed as follows:
31 Dec 2014
EURmGross
InvestmentNet
Investment
2015 2,085 1,965
2016 1,651 1,568
2017 1,559 1,509
2018 778 746
2019 709 681
Later years 698 655
Total 7,480 7,124
Operating leases Assets subject to operating leases mainly comprise real estate, vehicles, aeroplanes and other equipment. On the balance sheet they are reported as tangible assets.
Under non-cancellable operating leases, the future minimum lease payments receivable are distributed as follows:
EURm 31 Dec 2014
2015 102016 82017 122018 42019 4Later years 1Total 39
Nordea as a lessee Finance leasesNordea has only to a minor extent entered into finance lease agreements.
Operating leases Nordea has entered into operating lease agreements for premises and office equipment.
Leasing expenses during the year, EURm
31 Dec2014
31 Dec2013
Leasing expenses during the year –236 –250– of which minimum lease payments –233 –227– of which contingent rents –3 –23Leasing income during the year regarding sublease payments 6 8
Future minimum lease payments under non-cancellable operating leases amounted to and are distributed as follows:
EURm 31 Dec 2014
2015 1752016 1402017 1102018 922019 64Later years 272Total 853
Total sublease payments expected to be received under non-cancellable subleases amounts to EUR 15m.
G21 Leasing

Notes to the balance sheet – Nordea Group
Nordea Annual Report 2014 115
G22 Investment properties
EURm31 Dec
201431 Dec
2013
Carrying amount at beginning of year 3,524 3,408Acquisitions during the year 172 504Sales during the year –423 –219Fair value adjustments 50 –40Transfers/reclassifications during the year –35 –5Translation differences –61 –124Carrying amount at end of year 3,227 3,524
Amounts recognised in the income statement1
EURm 2014 2013
Fair value adjustments 50 –40Rental income 220 236Direct operating expenses that generate rental income –43 –45Direct operating expenses that did not generate rental income –9 –8Total 218 143 1) Included in Net result from items at fair value.
The method applied when calculating fair value is a rate of return calculation, based on internal models. As a supplement to these values, appraisals were obtained from independent external valuers for parts of the investment properties. Approximately 75% of the investment properties are valued using internal models based on a rate of return calculation. For the remaining 25% of the investment properties, apprai-sals were obtained from independent external valuers.
For further information regarding investment properties, see note G40.
G24 Prepaid expenses and accrued income
EURm31 Dec
201431 Dec
2013
Accrued interest income 404 1,123Other accrued income 487 477Prepaid expenses 723 783Total 1,614 2,383
G23 Other assets
EURm31 Dec
201431 Dec
2013
Claims on securities settlement proceeds 3,339 2,977Cash/margin receivables 11,176 6,122Other 3,066 1,965Total 17,581 11,064
G26 Deposits and borrowings from the public
EURm31 Dec
201431 Dec
2013
Deposits1 168,682 168,029Contracts where the return is based on separate assets 4,287 4,302Repurchase agreements 24,285 28,412Total 197,254 200,743
1) Deposits related to individual pension savings (IPS) are also included.
G25 Deposits by credit institutions
EURm31 Dec
201431 Dec
2013
Central banks 13,601 12,632Banks 28,940 30,699Other credit institutions 13,781 15,759Total 56,322 59,090

Nordea Group – Notes to the balance sheet
Nordea Annual Report 2014116
31 Dec 2014, EURm
Traditional life insurance
provisions
Collective bonus
potentials
Unit–linked insurance
provisions
Insurance claims
provisions
Provisions, Health & per-sonal accident
Investment contracts
provisions Total
Provisions/bonus potentials, beginning of year 20,613 2,897 9,321 420 238 13,737 47,226Gross premiums written 878 — 1,797 — — 4,473 7,148Transfers –822 — 152 — — –749 –1,419Addition of interest/ investment return 454 — 468 — — 1,345 2,267Claims and benefits –2,004 — –990 –29 5 –1,539 –4,557Expense loading including addition of expense bonus –110 — –79 — — –89 –278Change in provisions/ bonus potential 0 915 0 — 13 — 928Other 1,042 0 373 — — 18 1,433Translation differences –346 –80 –16 –4 –3 –456 –905Provisions/bonus potentials, end of year 19,705 3,732 11,026 387 253 16,740 51,843Provision relating to bonus schemes/discretionary participation feature: 95% 17%
31 Dec 2013, EURm
Traditional life insurance
provisions
Collective bonus
potentials
Unit–linked insurance
provisions
Insurance claims
provisions
Provisions, Health & per-sonal accident
Investment contracts
provisions Total
Provisions/bonus potentials, beginning of year 23,399 1,924 7,169 463 259 12,106 45,320Gross premiums written 1,090 — 1,571 — — 3,615 6,276Reclassification to liabilities held for sale –6 — –188 –13 –4 –305 –516Transfers –729 — 748 — — –484 –466
Addition of interest/investment return 523 — 413 — — 1,119 2,055Claims and benefits –2,377 — –641 –24 –4 –1,866 –4,912Expense loading including addition of expense bonus –113 — –64 — — –83 –260Change in provisions/bonus potential 0 1,027 0 — –9 — 1,018Other –501 –12 352 — — 7 –153Translation differences –673 –42 –39 –6 –4 –372 –1,136Provisions/bonus potentials, end of year 20,613 2,897 9,321 420 238 13,737 47,226Provision relating to bonus schemes/discretionary participation feature: 94% 20%
EURm31 Dec
201431 Dec
2013
Traditional life insurance provisions 19,705 20,613 – of which guaranteed provisions 19,612 20,520 – of which non-guaranteed provisions 93 93Collective bonus potential 3,732 2,897Unit-linked insurance provisions 11,026 9,321 – of which guaranteed provisions 0 290 – of which non-guaranteed provisions 11,026 9,031Insurance claims provision 387 420Provisions, Health & personal accident 253 238Total insurance contracts 35,103 33,489
Investment contracts 16,740 13,737 – of which guaranteed provisions 3,666 3,431 – of which non-guaranteed provisions 13,074 10,306Total 51,843 47,226
Liabilities to policyholders are obligations related to insur-ance contracts. These contracts are divided into contracts con-taining insurance risk and contracts without insurance risk. The latter are pure investments contracts. Insurance contracts consists of Life insurance provisions and other insurance related items. Life insurance contracts are measured and recognised in accordance with IFRS 4, i.e. the measurement and recognition principle under previous GAAP has been maintained conse-quently resulting in non-uniform accounting policies method on consolidation. Each market represented by Nordic and European entities measures and recognises insurance con-tracts using local accounting policies.
G27 Liabilities to policyholders

Notes to the balance sheet – Nordea Group
Nordea Annual Report 2014 117
G27 Liabilities to policyholders, cont.
Life insurance risk and market risks in the Life insurance operations
31 Dec 2014 31 Dec 20133
Sensitivites EURm
Effect on policyholders
liabilities1Effect on Nordeas
Equity2
Effect on policyholders
liabilities1Effect on Nordeas
Equity2
Mortality – increased living with 1 year 68.3 –52.6 74.6 –57.4Mortality – decreased living with 1 year –1.3 0.9 –6.6 5.1Disability – 10% increase 27.7 –21.3 28.1 –21.6Disability – 10% decrease –16.1 12.4 –13.8 10.650 bp increase in interest rates –915.0 –7.6 –794.2 –20.450 bp decrease in interest rates 1,001.7 4.7 851.6 13.312% decrease in all share prices –1,684.3 –1.8 –1,587.1 –1.58% decrease in property value –240.3 –0.7 –275.2 –0.68% loss on counterparts –31.7 0.0 –7.1 0.0
1) + (plus) indicates that policyholders liabilities increase.2) + (minus) indicates that equity decrease.3) The methodology for calculating the sensitivites and the effects has been changed. The figures for 2013 have been restated.
Liabilities to policyholders divided in guarantee levels (technical interest rate)
31 Dec 2014, EURm Non 0 pct. 0 to 2 pct. 2 to 3 pct. 3 to 4pct. Over 4 pct. Total liabilities
Technical provision 24,194 2,236 7,854 5,391 3,966 3,830 47,471
31 Dec 2013, EURm Non 0 pct. 0 to 2 pct. 2 to 3pct. 3 to 4pct Over 5 pct. Total liabilities
Technical provision 19,429 3,885 6,896 5,339 4,015 4,107 43,671
Insurance risksInsurance risk is described in the “Risk, Liquidity and Capital management“ section of the Board of Directors’ Report. Additional quantitative information is found below.
Risk profiles on insurance
Product Risk types Material effect
Traditional – Mortality Yes– Disability Yes– Return guaranties Yes
Unit-Link – Mortality Yes– Disability Yes– Return guaranties No
Health and personal accident – Mortality No– Disability Yes– Return guaranties No
Financial contract – Mortality No– Disability No– Return guaranties No
For investments where the customer is bearing the risk, see Note G44.
G28 Debt securities in issue
EURm31 Dec
201431 Dec
2013
Certificates of deposit 22,926 16,329Commercial papers 30,133 35,975Covered bonds 98,986 92,188Other bonds 42,155 41,020Other 74 90Total 194,274 185,602
G29 Other liabilities
EURm31 Dec
201431 Dec
2013
Liabilities on securities settlement proceeds 3,085 2,458Sold, not held, securities 6,903 10,995Accounts payable 174 186Cash/margin payables 10,061 5,867Other 6,750 5,231Total 26,973 24,737

Nordea Group – Notes to the balance sheet
Nordea Annual Report 2014118
G30 Accrued expenses and prepaid income
EURm31 Dec
201431 Dec
2013
Accrued interest 45 1,999Other accrued expenses 1,589 1,331Prepaid income 309 347Total 1,943 3,677
G31 Provisions
EURm31 Dec
201431 Dec
2013
Reserve for restructuring costs 167 89Transfer risk, off-balance 10 12Individually assessed guarantees and other commitments 62 49Tax 1 2Other 65 25
Total 305 177
EURm Restructuring Transfer riskGuarantees/
commitments Tax Other Total
At beginning of year 89 12 49 2 25 177New provisions made 183 4 103 1 17 308Provisions utilised –51 — –5 –1 –4 –61Reversals –34 –6 –87 –1 –4 –132Reclassifications –17 — 0 — 31 14Translation differences –3 0 2 0 0 –1At end of year 167 10 62 1 65 305
Provisions for restructuring costs amounts to EUR 167m and covers termination benefit (EUR 144m) and other provisions mainly related to redundant premises (EUR 23m). The restructuring activities have mainly been launched to reach the anticipated cost efficiency and profitability, and as a part of this Nordea plans to reduce the number of employees, partly through close down of branches. The majority of the provision is expected to be used during 2015–2016. As with any other provision there is an uncertainty around timing and amount, which is expected to decrease as the plan is being executed.
Provision for Transfer risk of EUR 10m is related to off- balance sheet items. Transfer risk relating to loans is included in the item Allowances for collectively assessed impaired loans in Note G13. Provision for transfer risk is depending on the volume of business with different countries.
Loan loss provisions for individually assessed guarantees and other commitments amounted to EUR 62m.
Provision for legal disputes amounts to EUR 4m (EUR 4m expected to be settled 2015) and other provisions to EUR 61m (EUR 59m expected to be settled 2015).

Notes to the balance sheet – Nordea Group
Nordea Annual Report 2014 119
EURm31 Dec
201431 Dec
2013
Defined benefit plans, net 498 13Total 498 13
Nordea sponsors both defined contribution plans (DCP) and defined benefit plans (DBP). IAS 19 secures that the pension obligations net of plan assets backing these obligations are reflected on the Group's balance sheet. The major plans in each country are funded schemes covered by assets in pen-sion funds/foundations.
The plans are structured in accordance with local regula-tions and legislations, local practice and, where applicable, collective agreements. Nordea's main DBPs in Sweden, Nor-way and Finland are all employer financed final salary and service based pension plans providing pension benefits on top of the statutory systems. All DBPs are closed for new entrants, new employees are offered DCPs. DBPs in Sweden are mainly offered in accordance with collective agreements and follows the regulations in the Pension Obligations Vest-ing Act (Tryggandelagen). Plan assets are held in a separate pension foundation. In Norway the DBPs are in accordance with the Nordea Norway occupational pension plan and fol-lows the Occupational Pension Act (Foretakspensjonloven). In Norway plan assets are also held by a separate pension fund. In Finland Nordea is providing additional pension ben-efits on top of the statutory system in accordance with the Nordea Finland occupational pension plan and follows the regulations in the Employees' Pension Act (TyEL). Plan assets are generally held in a separate pension foundation. Mini-mum funding requirements differ between plans but where such requirements are based on collective agreements or internal policies the funding requirement is generally that the pension obligations measured using local requirements shall be covered in full or with a predefined surplus. Some pension plans are not covered by funding requirements and are gen-erally unfunded. Quarterly assessments are made to secure the level of future contributions.
Defined benefit plans may impact Nordea via changes in the net present value of obligations and/or changes in the market value of plan assets. Changes in the obligation are most importantly driven by changes in assumptions on dis-count rates (interest rates and credit spreads), salary increases, turnover and mortality as well as relevant experi-ence adjustments where the actual outcome differs from the assumption. Assets are invested in diversified portfolios as further disclosed below, with bond exposures mitigating the interest rate risk in the obligations and a fair amount of real assets (inflation protected) to reduce the long term inflation-ary risk in liabilities.
No significant plan amendments, curtailments and settle-ments have been made during the year.
IAS 19 pension calculations and assumptionsCalculations on major plans are performed by external liabil-ity calculators and are based on different actuarial assump-tions.
Assumptions1 Swe Nor Fin Den
2014Discount rate2 2.50% 2.50% 2.00% 2.25%Salary increase 2.50% 3.00% 2.00% 2.50%Inflation 1.50% 1.75% 1.50% 1.50%Mortality DUS06 GAP07/173 Gompertz FSA
2013Discount rate2 3.75% 4.00% 3.50% 3.50%Salary increase 2.50% 3.00% 2.50% 2.50%Inflation 1.50% 2.00% 1.50% 2.00%Mortality DUS06 GAP07/173 Gompertz FSA
1) The assumptions disclosed for 2014 have an impact on the liability calculation by year-end 2014, while the assumptions disclosed for 2013 are used for calculating the pension expense in 2014.
2) More information on the discount rate can be found in Note G1, section 22. The sensitivities to changes in the discount rate can be found below.
Sensitivities – Impact on Defined Benefit Obligation (DBO) % Swe Nor Fin Den
Discount rate – Increase 50bps –8.0% –7.2% –7.2% –5.2%Discount rate – Decrease 50bps 9.2% 8.1% 8.1% 5.7%Salary increase – Increase 50bps 2.8% 2.7% 0.4% 5.6%Salary increase – Decrease 50bps –1.8% –2.5% –0.4% –5.2%Inflation – Increase 50bps 8.1% 6.6% 4.7% —Inflation – Decrease 50bps –7.0% –6.0% –4.3% —Mortality – Increase 1 year 3.5% 3.3% 2.9% 5.1%Mortality – Decrease 1 year –3.5% –3.2% –2.8% –4.9%
The sensitivity analyses are prepared by changing one actu-arial assumption while keeping the other assumptions unchanged. This is a simplified approach since the actuarial assumptions usually are correlated. However, it enables the reader to isolate one effect from another. The method used for calculating the impact on the obligation is the same as when calculating the obligation accounted for in the financial state-ments. Compared with the 2013 Annual Report there have been no changes in the methods used when preparing the sensitivity analyses. As all pensions in Denmark are salary indexed, the inflation has no impact on the DBO in Denmark.
G32 Retirement benefit obligations

Nordea Group – Notes to the balance sheet
Nordea Annual Report 2014120
G32 Retirement benefit obligations, cont.
Net retirement benefit liabilities/assets
EURmSwe 2014
Nor 2014
Fin 2014
Den 2014
Total 2014
Total 2013
Obligations 1,663 968 985 111 3,727 3,130Plan assets 1,497 636 972 124 3,229 3,117Net liability( –)/asset(+) –166 –332 –13 13 –498 –13– of which retirement benefit liabilities 166 332 33 9 540 334– of which retirement benefit assets — — 20 22 42 321
Movements in the obligation
EURmSwe 2014
Nor 2014
Fin 2014
Den 2014
Total 2014
Total 2013
Opening balance 1,368 829 818 115 3,130 3,452Current service cost 23 17 3 0 43 49Interest cost 50 31 29 4 114 118Pensions paid –68 –32 –43 –9 –152 –162Past service cost and settlements 22 25 0 –15 32 –6Remeasurement from changes in demographic assumptions — — — 1 1 4Remeasurement from changes in financial assumptions 300 165 181 14 660 –102Remeasurement from experience adjustments 15 –9 –10 1 –3 –26Translation differences –91 –81 7 0 –165 –162Change in provision for SWT/SSC1 44 23 — — 67 –35Closing balance 1,663 968 985 111 3,727 3,130– of which relates to the active population 34% 47% 10% — 30%
1) Change in provision for special wage tax (SWT) and social security contribution (SSC) in Sweden and Norway.
The average duration of the obligation is 16 years in Sweden, 15 years in Norway, 14 years in Finland and 10 years in Denmark based on discounted cash flows. The fact that all DBPs are closed for new entrants and that there are no active members in Den-mark, and to some extent also in Finland, leads to lower duration.
Movements in the fair value of plan assets
EURmSwe 2014
Nor 2014
Fin 2014
Den 2014
Total 2014
Total 2013
Opening balance 1,412 650 927 128 3,117 3,125Interest income (calculated using the discount rate) 52 26 32 5 115 111Pensions paid — –17 –43 –7 –67 –69Settlements — 8 — –13 –5 0Contributions by employer 0 5 7 2 14 67Refund to employer — — –21 — –21 —Remeasurement (actual return less interest income) 118 18 62 9 207 16Translation differences –85 –54 8 0 –131 –133Closing balance 1,497 636 972 124 3,229 3,117
Asset compositionThe combined return on assets in 2014 was 10.3% (4.1%). The assets return was driven particularly by strong return on long dated sovereign bonds. Other assets including equity investments, real estate and credit investments also contributed positively. At the end of the year the equity exposure in pension funds/foundations represented 26% (25%) of total assets.

Notes to the balance sheet – Nordea Group
Nordea Annual Report 2014 121
G32 Retirement benefit obligations, cont.
Asset composition in funded schemesSwe 2014
Nor 2014
Fin 2014
Den 2014
Total 2014
Total 2013
Bonds 72% 55% 60% 82% 66% 65%– sovereign 35% 44% 42% 48% 39% 38%– covered bonds 26% 11% 4% 34% 18% 17%– corporate bonds 11% 0% 14% 0% 9% 10%– issued by Nordea entities — — — — — 3%– with quoted market price in an active market 72% 55% 60% 82% 66% 65%
Equity 26% 28% 27% 14% 26% 25%– domestic 8% 7% 9% 14% 8% 8%– european 7% 9% 7% — 7% 7%
– US 7% 8% 7% — 7% 6%– emerging 4% 4% 4% — 4% 4%– Nordea share 1% — — — 0% —– with quoted market price in an active market 26% 28% 27% 14% 26% 25%
Real estate1 — 12% 10% — 5% 7%– occupied by Nordea — — 3% — 1% 1%
Cash and cash equivalents 2% 5% 3% 4% 3% 3%
1) The geographical location of the real estate follows the geographical location of the relevant pension plan.
The Group expects to contribute EUR 34m to its defined benefit plans in 2015.
Defined benefit pension costThe total net pension cost related to defined benefit plans recognised in the Group's income statement (as staff costs) for the year is EUR 99m (EUR 61m). Total pension costs comprise defined benefit pension costs as well as costs related to defined contribu-tion plans (see specification in Note G7).
Recognised in the income statement, EURmSwe 2014
Nor 2014
Fin 2014
Den 2014
Total 2014
Total 2013
Current service cost 23 17 3 0 43 49Net interest –2 5 –3 –1 –1 7Past service cost and settlements1 22 18 0 –2 38 –6SWT/SSC2 13 6 — — 19 11Pension cost on defined benefit plans (expense+/income–) 56 46 0 –3 99 61
1) The past service cost 2014 mainly regards termination benefits in connection to the cost efficiency programme launched in the second quarter.2) Cost related to special wage tax (SWT) in Sweden and social security contribution (SSC) in Norway.
Compared with the pension cost 2013, excluding past service cost and related SWT and SSC, the pension cost has decreased in 2014. Mainly as a consequence of the change of actuarial assumptions at the end of 2013.
Recognised in other comprehensive income, EURmSwe 2014
Nor 2014
Fin 2014
Den 2014
Total 2014
Total 2013
Remeasurement from changes in demographic assumptions — — — 1 1 4Remeasurement from changes in financial assumptions 300 165 181 14 660 –102Remeasurement from experience adjustments 15 –9 –10 1 –3 –26Remeasurement of plan assets (actual return less interest income) –118 –18 –62 –9 –207 –16SWT/SSC1 48 19 0 0 67 –15Pension cost on defined benefit plans (expense+/income–) 245 157 109 7 518 –155
1) Cost related to special wage tax (SWT) in Sweden and social security contribution (SSC) in Norway.

Nordea Group – Notes to the balance sheet
Nordea Annual Report 2014122
G32 Retirement benefit obligations, cont.
G33 Subordinated liabilities
EURm31 Dec
201431 Dec
2013
Dated subordinated debenture loans 4,434 4,107Undated subordinated debenture loans 1,557 574Hybrid capital loans 1,951 1,864Total 7,942 6,545
These debenture loans are subordinated to other liabilities. Dated debenture loans entitle the lender to payment before undated subordinated loans and hybrid capital loans. Within each respective category, the loans entitle lenders to equal payment rights.
Multiemployer plansIn 2010 the Norwegian Parliament decided to change the AFP (Avtalefestet Pensjon) plan in Norway as from 2011. The change gave rise to a new multiemployer defined benefit plan that cannot be calculated as such, as information on Nordea's share of the liabilities and pension costs in the plan is not available from Fellesordningen (the administrator). Conse-quently the new AFP plan has to be accounted for as a defined contribution plan in accordance with IAS 19. Informa-tion on the funded status in the plan is not available.
The new AFP plan gives the entitled employees a lifelong addition to regular pensions from the age of 62. Further, the new scheme allows the employees to continue working while receiving AFP without this affecting the pension rights. The plan is founded on the basis of a three party cooperation between employer organisations, employee organisations and the Norwegian government. The government covers one third of the pension expense to the AFP plan while the member companies collectively cover the remaining two thirds of the pension expense. The premium the member firms are paying to the plan is determined to be sufficient to cover on-going pension expenses as well as provide a basis for building up a pension fund. The purpose of the pension fund is to ensure sufficient ability to cover expected future pension obligations.
The premium rate for 2014 is 2.2% of the employees’ wages between 1 and 7.1 times the average base amount according to
the Norwegian National Insurance Act. The premium is cal-culated based on the average wages and base amounts from the previous year, excluding employees over the age of 61. Total premiums paid in 2014 amount to EUR 3m. Payments to the plan during 2014 covered 2,975 employees. The premium rate for 2015 will be 2.4% of the employees' wages between 1 and 7.1 times the average base amount according to the Nor-wegian National Insurance Act. The expected premium in 2015 amounts to EUR 3m.
The employees that meet the requirements for AFP are guaranteed AFP payments regardless of the solvency of their employers. As a result the employer members have joint responsibility for two thirds of the payable pensions to the employees that at any given time meet the requirements for AFP. Any deficit or surplus on windup of the plan or entities’ withdrawal from the plan will not have any impact on Nordea.
Key management personnelThe Group’s total pension obligations regarding key manage-ment personnel amounted to EUR 30m (EUR 35m) at the end of the year. These obligations are to a high degree covered by plan assets. Defined benefit pension costs (Current service cost as well as Past service cost and settlements as defined in IAS 19) related to key management personnel in 2014 were EUR 2m (EUR 2m). Complete information concerning key management personnel is disclosed in Note G7.

Notes to the balance sheet – Nordea Group
Nordea Annual Report 2014 123
G34 Assets pledged as security for own liabilities
EURm31 Dec
201431 Dec
2013
Assets pledged for own liabilities Securities etc1 19,571 19,944Loans to the public 130,539 128,766Other assets pledged 12,931 25,708Total 163,041 174,418
The above pledges pertain to the following liabilitiesDeposits by credit institutions 8,620 9,892Deposits and borrowings from the public 8,618 11,681Derivatives 10,667 5,990Debt securities in issue 98,547 92,176Other liabilities and commitments 19,971 20,203Total 146,423 139,942
1) Relates only to securities recognised on the balance sheet. Securities borrowed or bought under reverse repurchase agreements are not recognised on the balance sheet and thus not included in the amount. Such transactions are disclosed in Note G43, Transferred assets and obtained collaterals.
Assets pledged for own liabilities contain securities pledged as security in repurchase agreement and in securities lending. The transactions are conducted under standard agreements employed by financial markets participants. Counterparts in those transactions are credit institutions and the public. The transactions are typically short term with maturity within three months.
Securities in the Life operations are also pledged as secu-rity for the corresponding insurance liabilities.
Loans to the public have been registered as collateral for issued covered bonds and mortgage bonds in line with local legislation. In the event of the company s insolvency, the holders of these bonds have priority to the assets registered as collateral.
Other assets pledged relates to certificate of deposits pledged by Nordea to comply with authority requirements.
G35 Other assets pledged
Other assets pledged are mainly related to securities which includes interest-bearing securities pledged as securities for payment settlements within the central banks and clearing institutions (EUR 11,247m (EUR 7,412m)). The terms and con-ditions require day to day securities and relate to liquidity intraday/over night. Collateral pledged on behalf of other items other than the company s own liabilities, e.g. on behalf of a third party or on behalf of the company s own contingent liabilities are also accounted for under this item.
G36 Contingent liabilities
EURm31 Dec
201431 Dec
2013
Guarantees– Loan guarantees 4,811 3,560– Other guarantees 15,027 15,409Documentary credits 2,102 1,831Other contingent liabilities 77 70Total 22,017 20,870
In the normal business Nordea issues various forms of guar-antees in favour of the bank's customers. Loan guarantees are given for customers to guarantee obligations in other credit- and pension institutions. Other guarantees consist mainly of commercial guarantees such as bid guarantees, advance pay-ment guarantees, warranty guarantees and export related guarantees. Contingent liabilities also include unutilised irrevocable import documentary credits and confirmed export documentary credits. These transactions are part of the bank services and support the bank's customers. Guaran-tees and documentary credits are off-balance sheet items, unless there is a need for a provision to cover a probable loan loss that arises from the judgement that reimbursement will not be received.
Nordea Bank AB (publ) has undertaken, in relation to cer-tain individuals and on certain conditions, to be responsible for the potential payment liability against them in their capacity as managing directors or board member in group undertakings to Nordea Bank AB (publ).
A limited number of employees are entitled to severance pay if they are dismissed before reaching their normal retire-ment age. For further disclosures, see Note G7.
Legal proceedingsWithin the framework of the normal business operations, Nordea faces a number of claims in civil lawsuits and disputes, most of which involve relatively limited amounts. Presently, none of the current disputes are considered likely to have any significant adverse effect on the Group or its financial position.
G37 Commitments
EURm31 Dec
201431 Dec
2013
Unutilised overdraft facilities 38,234 44,053Loan commitments 36,057 34,279Future payment obligations 722 422Other commitments 922 845Total 75,935 79,599
Reverse repurchase agreements are recognised on and derecog-nised from the balance sheet on settlement date. Nordea has as per 31 December 2014 signed reverse repurchase agreements that have not yet been settled and consequently are not recog-nised on the balance sheet. On settlement date these reverse repurchase agreements will, to the utmost extent, replace exist-ing reverse repurchase agreements not yet derecognised as per 31 December 2014. The net impact on the balance sheet is minor. These instruments have not been disclosed as commitments.
For information about credit commitments, see Note G1, section 24, about derivatives, see Note G17 and about reverse repos, see Note G43.

Nordea Group – Other notes
Nordea Annual Report 2014124
G38 Capital adequacy
Capital adequacy is a measure of the financial strength of a bank, usually expressed as a ratio of capital to assets. There is a worldwide capital adequacy standard (Basel III) drawn up by the Basel Committee on Banking Supervision. Within the EU, the capital adequacy requirements are outlined in the Capital Requirements Directive IV (CRD IV) and Capital Requirements Regulation (CRR).
CRD IV/CRR require higher capitalisation levels and better quality of capital, better risk coverage, the introduction of a lev-erage ratio as a backstop to the risk based requirement, meas-ures to promote the build-up of capital that can be drawn in periods of stress and the introduction of liquidity standards. CRD IV was implemented through national law within all EU countries during 2014, while the CRR entered into force in all EU countries on the first of January 2014.
The Basel III framework is built on three Pillars:
-
-agement, including capital adequacy
management, mitigation and measurement of material risks within the business environment in order to assess the ade-quacy of capitalisation and to determine an internal capital requirements reflecting the risks of the institution.
-ness of capital requirements and exposure to material risks throughout the organisation, both in the business area and legal entity dimensions. Stress tests are important drivers of risk awareness, looking at capital and risk from a firm-wide perspective on a regular basis and on an ad-hoc basis for spe-cific areas or segments. The process includes a regular dia-logue with supervisory authorities, rating agencies and other external stakeholders with respect to capital management, measurement and mitigation techniques used.
Nordea’s capital levels continue to be adequate to support the risks taken, both from an internal perspective as well as from the perspective of supervisors. Heading into 2015, Nor-dea will continue to closely follow the development of the new capital requirement regime as well as maintain its open dialogue with the supervisory authorities.
The disclosures in this note cover the Nordea Group as defined on page 133.
Own fundsOwn funds is the sum of Tier 1 and Tier 2 capital. Tier 1 capital consists of both common equity Tier 1 (CET1) and additional Tier 1 capital.
Tier 1 capitalTier 1 capital is the sum of common equity tier 1 capital and additional Tier 1 capital. CET1 capital is considered to be capital of the highest quality with ultimate loss-absorb-ing characteristics and consists predominately of paid in capital and retained earnings. Profit may only be included after permission from the financial supervisory authority and after deduction of proposed dividend. Due to the implementation of CRR, deduction that according to pre-vious rules were made 50 % from Tier 1 and 50 % from tier 2 are now fully deducted from common equity tier 1. Fur-
thermore, CRR also changes the treatment of investments in financial sector entities and deferred tax assets that rely on future profitability and arise from temporary differ-ences, which are now risk weighted instead of deducted from Tier 1 and Tier 2.
1 instruments and the related share premium. Additional Tier 1 instruments
-ments that rank senior only to share capital. CRR specifies the necessary characteristics required for inclusion in additional Tier 1 capital. The instruments are loss-absorbing from a going concern perspective as coupons can be cancelled at any time at the full discretion of the issuer and the principal will be writ-ten down if the Common Equity Tier 1 capital ratio would fall below a pre-defined trigger level. The instruments may only be
-lier than five years after original issuance of the instrument.
are fully included whereas remaining instruments are phased out according to transitional rules.
Tier 2 capitalTier 2 capital must be subordinated to depositors and general creditors of the bank. It cannot be secured or covered by a guarantee of the issuer or related entity or include any other arrangement that legally or economically enhances the senior-ity of the claim vis-a -vis depositors and other bank creditors.
Tier 2 instrumentsTier 2 instruments are subordinated instruments. The basic principle for subordinated instruments in own funds is the order of priority in case of a default or bankruptcy situation.Under such conditions, the holder of the subordinated instru-ment would be repaid after other creditors, but before share-holders. Tier 2 instruments can be dated or undated
that fulfil the CRD IV requirements are fully included whereas remaining instruments are phased out according to transitional rules.
The inclusion of outstanding Tier 2 instruments in the Tier 2 capital is reduced if the remaining maturity is less than five years. During 2014, Nordea redeemed one Tier 2 instrument
dated subordinated instruments and EUR 3.5bn in undated subordinated instruments.
The tables below shows the main features of outstanding -
ments.

Other notes – Nordea Group
Nordea Annual Report 2014 125
G38 Capital adequacy, cont.
Table A2 Transitional own funds
Common Equity Tier 1 capital: instruments and reserves
(A) amount at disclosure date,
EURm
(C) amounts subject to pre- regulation (eu) no 575/2013 treatment or
prescribed residual amount of regulation
(eu) no 575/2013
1 Capital instruments and the related share premium accounts 5,130 —of which: Share capital 4,050 —
2 Retained earnings 21,198 —3 Accumulated other comprehensive income (and other reserves, to include unrealised
gains and losses under the applicable accounting standards) –318 —5 Minority interests (amount allowed in consolidated CET1) 0 05a Independently reviewed interim profits net of any foreseeable charge or dividend 558 —6 Common Equity Tier 1 (CET1) capital before regulatory adjustments 26,567 —Common Equity Tier 1 (CET1) capital: regulatory adjustments
7 Additional value adjustments (negative amount) –272 —8 Intangible assets (net of related tax liability) (negative amount) –2,584 —10 Deferred tax assets that rely on future profitability excluding those arising from
temporary differences (net of related tax liability where conditions in Article 38 (3) are met) (negative amount) 0 —
11 Fair value reserves related to gains or losses on cash flow hedges –5 —12 Negative amounts resulting from the calculation of expected loss amounts –344 014 Gains or losses on liabilities valued at fair value resulting from changes in own
credit standing –49 —15 Defined-benefit pension fund assets (negative amount) –33 016 Direct and indirect holdings by an institution of own CET1 instruments
(negative amount) –6 —25 of which: deferred tax assets arising from temporary differences 0 —25b Foreseeable tax charges relating to CET1 items (negative amount) 0 —26a Regulatory adjustments relating to unrealised gains and losses pursuant to Articles
467 and 468 –453 5Of which: … filter for unrealised loss 1 0 —Of which: … filter for unrealised gain 1 –453 —
28 Total regulatory adjustments to Common equity Tier 1 (CET1) –3,747 —29 Common Equity Tier 1 (CET1) capital 22,821 —Additional Tier 1 (AT1) capital: instruments
30 Capital instruments and the related share premium accounts 1,224 —33 Amount of qualifying items referred to in Article 484 (4) and the related share
premium accounts subject to phase out from AT1 1,576 44736 Additional Tier 1 (AT1) capital before regulatory adjustments 2,800 —Additional Tier 1 (AT1) capital: regulatory adjustments
37 Direct and indirect holdings by an institution of own AT1 Instruments (negative amount) –32 —
41a Residual amounts deducted from Additional Tier 1 capital with regard to deduction from Common Equity Tier 1 capital during the transitional period pursuant to article 472 of Regulation (EU) No 575/2013 0 0
43 Total regulatory adjustments to Additional Tier 1 (AT1) capital –32 —44 Additional Tier 1 (AT1) capital 2,768 —45 Tier 1 capital (T1 = CET1 + AT1) 25,588 —Tier 2 (T2) capital: instruments and provisions
46 Capital instruments and the related share premium accounts 4,496 —47 Amount of qualifying items referred to in Article 484 (5) and the related share
premium accounts subject to phase out from T2 516 048 Qualifying own funds instruments included in consolidated T2 capital (including
minority interests and AT1 instruments not included in rows 5 or 34) issued by sub-sidiaries and held by third parties 0 0
49 of which: instruments issued by subsidiaries subject to phase out 0 —51 Tier 2 (T2) capital before regulatory adjustments 5,012 —

Nordea Group – Other notes
Nordea Annual Report 2014126
G38 Capital adequacy, cont.
Tier 2 (T2) capital: regulatory adjustments
52 Direct and indirect holdings by an institution of own T2 instruments and subordi-nated loans (negative amount) –46 —
55 Direct and indirect holdings by the institution of the T2 instruments and subordi-nated loans of financial sector entities where the institution has a significant invest-ment in those entities (net of eligible short positions) (negative amount) –505 —
56a Residual amounts deducted from Tier 2 capital with regard to deduction from Com-mon Equity Tier 1 capital during the transitional period pursuant to article 472 of Regulation (EU) No 575/2013 0 —
57 Total regulatory adjustments to Tier 2 (T2) capital –551 —58 Tier 2 (T2) capital 4,461 —59 Total capital (TC = T1 + T2) 30,049 —60 Total risk weighted assets 145,475 —Capital ratios and buffers
61 Common Equity Tier 1 (as a percentage of risk exposure amount) 15.7% —62 Tier 1 (as a percentage of risk exposure amount) 17.6% —63 Total capital (as a percentage of risk exposure amount) 20.7% —64 Institution specific buffer requirement (CET1 requirement in accordance with article
92 (1) (a) plus capital conservation and countercyclical buffer requirements, plus sys-temic risk buffer, plus the systemically important institution buffer (G–SII or O–SII buffer), expressed as a percentage of risk exposure amount) 2.5% —
65 of which: capital conservation buffer requirement 2.5% —66 of which: countercyclical buffer requirement 0.0% —67 of which: systemic risk buffer requirement 0.0% —67a of which: Global Systemically Important Institution (G–SII) or Other Systemically
Important Institution (O–SII) buffer 0.0% —68 Common Equity Tier 1 available to meet buffers (as a percentage of risk exposure
amount) 11.2% —Amounts below the threshold for deduction (before risk weighting)
72 Direct and indirect holdings of the capital of financial sector entities where the insti-tution does not have a significant investment in those entities (amount below 10% threshold and net of eligible short positions) 233 —
73 Direct and indirect holdings by the institution of the CET 1 instruments of financial sector entities where the institution has a significant investment in those entities (amount below 10% threshold and net of eligible short positions) 926 —
75 Deferred tax assets arising from temporary differences (amount below 10% thresh-old, net of related tax liability where the conditions in Article 38 (3) are met) 0 —
Applicable caps to the inclusion of provisions in Tier 2
78 Credit risk adjustments included in T2 in respect of exposures subject to internal rat-ings-based approach (prior to the application of the cap) 105,637 —
79 Cap for inclusion of credit risk adjustments in T2 under internal ratings-based approach 634 —
Capital instruments subject to phase-out arrangements (only applicable between 1 Jan 2013 and 1 Jan 2022)
82 Current cap on AT1 instruments subject to phase out arrangements 1,576 —83 Amount excluded from AT1 due to cap (excess over cap after redemptions and
maturities) –447 —84 Current cap on T2 instruments subject to phase out arrangements 764 —85 Amount excluded from T2 due to cap (excess over cap after redemptions and maturities) 0 —

Other notes – Nordea Group
Nordea Annual Report 2014 127
Minimum capital requirement and REA31 Dec 2014 31 Dec 2013
EURm
Minimum Capital
requirement REA
Minimum Capital
requirement REA
Credit risk 9,522 119,029 10,376 129,705– of which counterparty credit risk 843 10,535 505 6,312IRB 8,451 105,637 8,965 112,061– of which corporate 5,743 71,792 6,787 84,844
– of which advanced 4,048 50,600 — —
– of which foundation 1,695 21,192 6,787 84,844– of which institutions 766 9,572 468 5,848– of which retail 1,755 21,940 1,588 19,848
– of which secured by immovable property collateral 878 10,982 862 10,772
– of which other retail 792 9,897 622 7,778 – of which SME 85 1,061 104 1,298– of which other 187 2,333 122 1,521
Standardised 1,071 13,392 1,411 17,644
– of which central governments or central banks 57 717 20 258– of which regional governments or local authorities 17 211 14 170– of which public sector entities 2 20 3 32– of which multilateral development banks — — — —– of which international organisations — — — —– of which institutions 27 338 49 611– of which corporate 154 1,921 301 3,768– of which retail 255 3,181 476 5,949– of which secured by mortgages on immovable properties 222 2,777 386 4,826– of which in default 12 155 35 449– of which associated with particularly high risk 53 666 — —– of which covered bonds — — — —– of which institutions and corporates with a short-term credit assessment — — — —– of which collective investments undertakings (CIU) — — 2 21– of which equity 195 2,442 — —– of which other items 77 964 125 1,560
Credit Value Adjustment Risk 185 2,308 — —
Market risk 584 7,296 700 8,753
– of which trading book, Internal Approach 312 3,898 410 5,131 – of which trading book, Standardised Approach 112 1,402 186 2,321
– of which banking book, Standardised Approach 160 1,996 104 1,301
Operational risk 1,347 16,842 1,344 16,796
Standardised 1,347 16,842 1,344 16,796
Sub total 11,638 145,475 12,420 155,254
Adjustment for Basel I floor
Additional capital requirement according to Basel I floor 5,995 74,938 4,318 53,969Total 17,633 220,413 16,738 209,223
Leverage ratio131 Dec
2014
Tier 1 capital, transitional definition, EURm2 25,382
Leverage ratio exposure, EURm 590,759
Leverage ratio, percentage 4.3
1) Leverage ratio and volumnes presented is based on three month average according to local FSA reporting process. 2) Including profit of the period.
G38 Capital adequacy, cont.

Nordea Group – Other notes
Nordea Annual Report 2014128
Capital requirements for market riskTrading book, IM Trading book, SA Banking book, SA Total
EURm REACapital
requirement REACapital
requirement REACapital
requirement REACapital
requirement
Interest rate risk & other1 958 77 1,114 89 — — 2,072 166Equity risk 285 23 277 22 — — 562 45
Foreign exchange risk 333 27 — — 1,996 160 2,329 187Commodity risk — — 12 1 — — 12 1Settlement risk — — 0 0 0 0 0 0Diversification effect –633 –51 — — — — –633 –51Stressed Value-at-Risk 1,850 148 — — — — 1,850 148Incremental Risk Measure 636 51 — — — — 636 51Comprehensive Risk Measure 468 37 — — — — 468 37Total 3,897 312 1,403 112 1,996 160 7,296 584
1) Interest rate risk column Trading book IA includes both general and specific interest rate risk which is elsewhere referred to as interest rate VaR and credit spread VaR.
G38 Capital adequacy, cont.
Table A3 – Capital main features template – CET1
Common equity Tier 1 capital
1 Issuer Nordea Bank AB (publ)
2 Unique identifier (eg CUSIP, ISIN or Bloomberg identifier for private placement SE00004273613 Governing law(s) of the instrument Swedish
Regulatory treatment4 Transitional CRR rules Common Equity Tier 15 Post-transitional CRR rules Common Equity Tier 16 Eligible at solo/(sub-)consolidated/solo & (sub-)consolidated Solo & consolidated7 Instrument type (types to be specified by each jurisdiction) Share capital as published in Regulation
(EU) No 575/2013 article 288 Amount recognised in regulatory capital (currency in million,
as of most recent reporting date)EUR 4,050m
9 Nominal amount of instrument EUR 4,049,951,91910 Accounting classification Shareholders’ equity12 Perpeptual or dated Perpetual13 Original maturity date No maturity14 Issuer call subject to prior supervisory approval No
Coupons / dividends20a Fully discretionary, partially discretionary or mandatory (in terms of timing) Fully discretionary20b Fully discretionary, partially discretionary or mandatory (in terms of amount) Fully discretionary35 Position in subordination hierachy in liquidation (specify instrument type
immediately senior to instrument)Additional Tier 1
36 Non-compliant transitioned features No
The Nordea Group may transfer capital within its legal entities without material restrictions. International transfers of capital between legal entities are normally possible after approval by the local regulator and are of importance in governing the capital position of the Group. The guarantee schemes introduced within the EU in 2008 limit the transferability of capital under certain circumstances, which serves to impact cross-border financial groups. No such restrictions were however directly affecting Nordea as per end of 2014. More Capital Adequacy information for the Group can be found in the Capital management section page 63 and in the Pillar III report.
Table A3–A5 include disclosure of capital instruments’ main features in accordance with §6.4 in FFFS 2014:18 and using the template in Annex II in article 3 in Commission implementing regulation (EU) No 1423/2013. Template items are excluded if not applicable.

Other notes – Nordea Group
Nordea Annual Report 2014 129
G38 Capital adequacy, cont.
Table A4 – Capital main features template – AT1
Additional Tier 1 instrument1 Issuer Nordea Bank AB
(publ)Nordea Bank AB
(publ)Nordea Bank AB
(publ)Nordea Bank AB
(publ)Nordea Bank AB
(publ)Nordea Bank AB
(publ)Nordea Bank AB
(publ)
2 Unique identifier (eg CUSIP, ISIN or Bloomberg identifier for private placement)
XS0200688256 W5795#AA7 US65557AAB35/USW5816FCM42
W5795#AB5 XS0453319039 US65557CAM55/US65557DAM39
US65557CAN39/US65557DAL55
3 Governing law(s) of the instrument
Governed by English law,
except for the subordination
provisions which are
governed by Swedish law
Governed by English law,
except for the subordination
provisions which are
governed by Swedish law
Governed by the laws of the State
of New York, except for the subordination
provisions which are
governed by Swedish law
Governed by English law,
except for the subordination
provisions which are
governed by Swedish law
Governed by English law,
except for the subordination
provisions which are
governed by Swedish law
Governed by English law,
except for the subordination
provisions which are
governed by Swedish law
Governed by English law,
except for the subordination
provisions which are
governed by Swedish law
Regulatory treatment
4 Transitional CRR rules
Additional Tier 1 Additional Tier 1 Additional Tier 1 Additional Tier 1 Additional Tier 1 Additional Tier 1 Additional Tier 1
5 Post-transi-tional CRR rules
Tier 2 Ineligible Ineligible Ineligible Ineligible Additional Tier 1 Additional Tier 1
6 Eligible at solo/ (sub-)consoli-dated/ solo & (sub-)con-solidated
Solo & consolidated
Solo & consolidated
Solo & consolidated
Solo & consolidated
Solo & consolidated
Solo & consolidated
Solo & consolidated
7 Instrument type (types to be speci-fied by each jurisdiction)
Additional Tier 1 (grandfathered) as published in
Regulation (EU) No 575/2013
article 484.4
Additional Tier 1 (grandfathered) as published in
Regulation (EU) No 575/2013
article 484.4
Additional Tier 1 (grandfathered) as published in
Regulation (EU) No 575/2013
article 484.4
Additional Tier 1 (grandfathered) as published in
Regulation (EU) No 575/2013
article 484.4
Additional Tier 1 (grandfathered) as published in
Regulation (EU) No 575/2013
article 484.4
Additional Tier 1as published in
Regulation (EU) No 575/2013
article 484.4
Additional Tier 1as published in
Regulation (EU) No 575/2013
article 484.4
8 Amount rec-ognised in regulatory capital (currency in million, as of most recent reporting date)
EUR 500m EUR 138m EUR 494m EUR 69m EUR 823m EUR 816m EUR 408m
9 Nominal amount of instrument
EUR 500m JPY 20,000m USD 600m JPY 10,000m USD 1,000m USD 1,000m USD 500m
9a Issue price 100 per cent 100 per cent 100 per cent 100 per cent 100 per cent 100 per cent 100 per cent
9b Redemption price
100 per cent of Nominal amount
100 per cent of Nominal amount
100 per cent of Nominal amount
100 per cent of Nominal amount
100 per cent of Nominal amount
100 per cent of Nominal amount
100 per cent of Nominal amount
10 Accounting classifica-tion
Liability - amortised cost
Liability - amortised cost
Liability - amortised cost
Liability - amortised cost
Liability - amortised cost
Liability - amortised cost
Liability - amortised cost
11 Original date of issuance
17–Sep–04 4–Mar–05 20–Apr–05 12–Oct–05 25–Sep–09 23–Sep–14 23–Sep–14
12 Perpeptual or dated
Perpetual Perpetual Perpetual Perpetual Perpetual Perpetual Perpetual
13 Original maturity date
No maturity No maturity No maturity No maturity No maturity No maturity No maturity
14 Issuer call subject to prior super-visory approval
Yes Yes Yes Yes Yes Yes Yes

Nordea Group – Other notes
Nordea Annual Report 2014130
G38 Capital adequacy, cont.
15 Optional call date, contingent call dates, and redemption amount
17-Sep-09In addition tax/regulatory call100 per cent of
nominal amount
4-Mar-35In addition tax/regulatory call100 per cent of
nominal amount
20-Apr-15In addition tax/regulatory call100 per cent of
nominal amount
12-Oct-35In addition tax/regulatory call100 per cent of
nominal amount
25-Mar-15In addition tax/regulatory call100 per cent of
nominal amount
23-Sep-19In addition tax/regulatory call100 per cent of
nominal amount
23-Sep-24In addition tax/regulatory call100 per cent of
nominal amount
16 Subsequent call dates, if applicable
17-Mar and 17-Sep each year
after first call date
4-Mar and 4-Sep each year
after first call date
20-Jan, 20-Apr, 20-Jul and 20-Oct
each year after first call date
12-Apr and 12-Oct each year
after first call date
25-Mar and 25-Sep each year
after first call date
23-Mar and 23-Sep each year
after first call date
23-Mar and 23-Sep each year
after first call date
Coupons/dividends
17 Fixed or floating dividend/coupon
Floating Fixed to floating Fixed to floating Fixed to floating Fixed Fixed Fixed
18 Coupon rate and any related index
Floating 10-year CMS +0.05 per cent per annum subject to 8 per
cent cap
Fixed USD 3.75 per cent per
annum, until first call date, thereaf-
ter floating 6-month JPY
deposit +1.22 per cent per annum
Fixed 5.424 per cent per annum,
until first call date, thereafter
floating 3-month LIBOR +1.5875
per cent per annum
Fixed USD 3.84 per cent per
annum, until first call date, thereaf-
ter floating 6-month JPY
deposit +1.40 per cent per annum
Fixed 8.375 per cent per annum until first call
date, thereafter 5-year US Treas-
ury +5.985 per cent per annum, until 25 March 2020, thereafter 5-year US Treas-ury +8.9775 per cent per annum
Fixed 5.50 per cent per annum,
until first call date, thereafter
fixed 5-year mid swap +3.563 per cent per annum
Fixed 6.125 per cent per annum,
until first call date, thereafter
fixed 5-year mid swap +3.388 per cent per annum
19 Existence of a dividend stopper
Yes Yes Yes Yes No No No
20a Fully discre-tionary, par-tially discre-tionary or mandatory (in terms of timing)
Partially discretionary
Dividend stopper
Partially discretionary
Dividend stopper
Partially discretionary
Dividend stopper
Partially discretionary
Dividend stopper
Partially discretionary
Dividend pusher
Fully discretionary
Fully discretionary
20b Fully discre-tionary, par-tially discre-tionary or mandatory (in terms of amount)
Partially discretionary
Partially discretionary
Partially discretionary
Partially discretionary
Partially discretionary
Fully discretionary
Fully discretionary
21 Existence of step up or other incen-tive to redeem
No Yes Yes Yes Yes No No
22 Noncumula-tive or cumulative
Non-cumulative Non-cumulative Non-cumulative Non-cumulative Non-cumulative Non-cumulative Non-cumulative
23 Convertible or non-con-vertible
Non-convertible Non-convertible Non-convertible Non-convertible Non-convertible Non-convertible Non-convertible
30 Write-down features
Yes Yes Yes Yes Yes Yes Yes
31 If write-down, write-down trigger (s)
To avoid liquidation
To avoid liquidation
To avoid liquidation
To avoid liquidation
To avoid or rem-edy any breach of
Applicable Banking
Regulations, shareholders
resolution
Group CET1 ratio <8 per cent
Issuer CET1 ratio <5.125 per cent
Group CET1 ratio <8 per cent
Issuer CET1 ratio <5.125 per cent
32 If write-down, full or partial
Full or Partially Full or Partially Full or Partially Full or Partially Full or Partially Full or Partially Full or Partially
33 If write-down, per-manent or temporary
Temporary Temporary Temporary Temporary Temporary Temporary Temporary
34 If temporary write-down, description of write-up mechanism
Shareholders res-olution regarding reconversion and
reinstatement made out of avail-able distribution
funds
Shareholders res-olution regarding reconversion and
reinstatement, made out of avail-able distribution
funds
Shareholders res-olution regarding Reconversion and
Reinstatement made out of avail-able distribution
funds
Shareholders res-olution regarding reconversion and
reinstatement, made out of avail-able distribution
funds
Shareholders res-olution regarding reconversion and
reinstatement, made out of avail-able distribution
funds
Fully discretion-ary, if a positive
net profit of both Issuer and Group
Fully discretion-ary, if a positive
net profit of both Issuer and Group

Other notes – Nordea Group
Nordea Annual Report 2014 131
35 Position in subordina-tion hier-achy in liquidation (specify instrument type imme-diately senior to instrument)
Tier 2 Tier 2 Tier 2 Tier 2 Tier 2 Tier 2 Tier 2
36 Non-com-pliant tran-sitioned features
Yes Yes Yes Yes Yes No No
37 If yes, speci-fiy non-compliant features
No specified trigger level,
dividend stopper
No specified trigger level,
step-up, dividend stopper
No specified trigger level,
step-up, dividend stopper
No specified trigger level,
step-up dividend stopper
No specified trigger level,
step-up dividend pusher
N/A N/A
G38 Capital adequacy, cont.
Table A5 – Capital main features template – T2Tier 2 instruments1 Issuer Nordea Bank
Norge ASANordea Bank Finland PLC
Nordea Bank AB (publ)
Nordea Bank AB (publ)
Nordea Bank AB (publ)
Nordea Bank AB (publ)
Nordea Bank AB (publ)
2 Unique identifier (eg CUSIP, ISIN or Bloomberg identifier for private placement)
GB0001961928 N/A XS0497179035 XS0544654162 US65557FAA49/US65557HAA05
XS0743689993 US65557FAD87/US65557HAD44
3 Governing law(s) of the instrument
Governed by English law,
except for the subordination
provisions which are
governed by Norwegian law
Governed by English law,
except for the subordination
provisions which are
governed by Finnish law
Governed by English law,
except for the subordination
provisions which are
governed by Swedish law
Governed by English law,
except for the subordination
provisions which are
governed by Swedish law
Governed by the laws of the State
of New York, except for the subordination
provisions which are
governed by Swedish law
Governed by English law,
except for the subordination
provisions which are
governed by Swedish law
Governed by the laws of the State
of New York, except for the subordination
provisions which are
governed by Swedish law
Regulatory treatment
4 Transitional CRR rules
Tier 2 Tier 2 Tier 2 Tier 2 Tier 2 Tier 2 Tier 2
5 Post-transi-tional CRR rules
Tier 2 Ineligible Tier 2 Tier 2 Tier 2 Tier 2 Tier 2
6 Eligible at solo/ (sub-)consoli-dated/ solo & (sub-)con-solidated
Solo, sub-consolidated & consolidated
Solo, sub-consolidated & consolidated
Solo & consolidated
Solo & consolidated
Solo & consolidated
Solo & consolidated
Solo & consolidated
7 Instrument type (types to be speci-fied by each jurisdiction)
Tier 2 as published in
Regulation (EU) No 575/2013
article 63
Tier 2 (grandfathered) as published in
Regulation (EU) No 575/2013
article 63
Tier 2 as published in
Regulation (EU) No 575/2013
article 63
Tier 2 as published in
Regulation (EU) No 575/2013
article 63
Tier 2 as published in
Regulation (EU) No 575/2013
article 63
Tier 2 as published in
Regulation (EU) No 575/2013
article 63
Tier 2 as published in
Regulation (EU) No 575/2013
article 63
8 Amount rec-ognised in regulatory capital (currency in million, as of most recent reporting date)
EUR 165m EUR 69m EUR 997m EUR 747m EUR 1,023m EUR 748m EUR 816m
9 Nominal amount of instrument
USD 200m JPY 10,000m EUR 1,000m EUR 750m USD 1,250m EUR 750m USD 1,000m
9a Issue price 100 per cent 100 per cent 99.810 per cent 99.699 per cent 99.508 per cent 99.803 per cent 99.364 per cent
9b Redemption price
100 per cent of Nominal amount
100 per cent of Nominal amount
100 per cent of Nominal amount
100 per cent of Nominal amount
100 per cent of Nominal amount
100 per cent of Nominal amount
100 per cent of Nominal amount

Nordea Group – Other notes
Nordea Annual Report 2014132
G38 Capital adequacy, cont.
10 Accounting classifica-tion
Liability - amortised cost
Liability - amortised cost
Liability - amortised cost
Liability - amortised cost
Liability - amortised cost
Liability - amortised cost
Liability - amortised cost
11 Original date of issuance
04-Nov-86 22-Aug-01 26-Mar-10 29-Sep-10 13-May-11 15-Feb-12 21-Sep-12
12 Perpeptual or dated
Perpetual Perpetual Dated Dated Dated Dated Dated
13 Original maturity date
No maturity No maturity 26-Mar-20 29-Mar-21 13-May-21 15-Feb-22 21-Sep-22
14 Issuer call subject to prior supervisory approval
Yes Yes Yes Yes Yes Yes Yes
15 Optional call date, contingent call dates, and redemption amount
18-Nov-91In addition tax
call100 per cent of
nominal amount
26-Feb-29In addition tax
call100 per cent of
nominal amount
Tax/regulatory call
100 per cent of nominal amount
Tax call100 per cent of
nominal amount
Tax call100 per cent of
nominal amount
15-Feb-17In addition tax
call100 per cent of
nominal amount
Tax call/regula-tory call,
100 per cent of nominal amount
16 Subsequent call dates, if applicable
18-May and 18-Nov each year after first call date
26-Feb and 26-Aug each year after first call date
N/A N/A N/A N/A N/A
Coupons/dividends
17 Fixed or floating dividend/coupon
Floating Fixed to floating Fixed Fixed Fixed Fixed Fixed
18 Coupon rate and any related index
Floating 6-month USD +0.1875 per cent per annum
Fixed USD 4.51 per cent per
annum to call date, thereafter
floating rate equivalent to 6-month JPY
Deposit +2.00 per cent per annum
4.50% 4.00% 4.875% Fixed 4.625 per cent per annum (equivalent to
Euro Swap Rate +3.15 per cent per
annum) to call date, thereafter
reset fixed rate to Euro Swap Rate
+3.15 per cent per annum
4.25%
19 Existence of a dividend stopper
No No No No No No No
20a Fully discre-tionary, par-tially discre-tionary or mandatory (in terms of timing)
Partially discretionary
Dividend pusher
Partially discretionary
Dividend pusher
Mandatory Mandatory Mandatory Mandatory Mandatory
20b Fully discre-tionary, par-tially discre-tionary or mandatory (in terms of amount)
Partially discretionary
Partially discretionary
Mandatory Mandatory Mandatory Mandatory Mandatory
21 Existence of step up or other incentive to redeem
No Yes No No No No No
22 Noncumula-tive or cumulative
Cumulative Cumulative Non-cumulative Non-cumulative Non-cumulative Non-cumulative Non-cumulative
23 Convertible or non-con-vertible
Non-convertible Non-convertible Non-convertible Non-convertible Non-convertible Non-convertible Non-convertible
30 Write-down features
No No No No No No No

Other notes – Nordea Group
Nordea Annual Report 2014 133
G38 Capital adequacy, cont.
35 Position in subordina-tion hier-achy in liq-uidation (specify instrument type imme-diately sen-ior to instru-ment)
Senior debt Senior debt Senior debt Senior debt Senior debt Senior debt Senior debt
36 Non-com-pliant tran-sitioned fea-tures
No Yes No No No No No
37 If yes, speci-fiy non-compliant features
N/A Step-up N/A N/A N/A N/A N/A
Specification of group undertakings 31 December 2014
Owner Company name
Voting power
of hold-ing, % Domicile
Consolidation method
Nordea Bank AB (publ) Nordea Bank Finland Plc 100 Finland Purchase method
Nordea Bank Finland Plc Nordea Finance Finland Ltd 100 Finland Purchase method
Realia Holding Oy 25 Finland Equity method
Nordea Finance Finland Ltd Tukirahoitus Oy 100 Finland Purchase method
Nordea Finance Estonia Ltd 100 Estonia Purchase method
Nordea Finance Latvia Ltd 100 Latvia Purchase method
Nordea Finance Lithuania Ltd 100 Lithuania Purchase method
NF Fleet Oy 20 Finland Equity method
Nordea Finance Estonia Ltd ALD Automotive Eesti AS 25 Estonia Equity method
Nordea Finance Latvia Ltd ALD Automotive SIA 25 Latvia Equity method
Nordea Finance Lithuania Ltd UAB ALD Automotive 25 Lithuania Equity method
Nordea Bank Finland Plc Ancillary service undertakings
Nordea Bank AB (publ) Nordea Bank Norge ASA 100 Norway Purchase method
Nordea Bank Norge ASA Nordea Eiendomskreditt AS 100 Norway Purchase method
Nordea Finans Norge AS 100 Norway Purchase method
Eksportfinans ASA 23 Norway Purchase method
Nordea Finans Norge AS NF Fleet AS 20 Norway Equity method
Nordea Bank Norge ASA Ancillary service undertakings
Nordea Bank AB (publ) Nordea Bank Danmark A/S 100 Denmark Purchase method
Nordea Bank Danmark A/S LR-Realkredit A/S 39 Denmark Equity method
Nordea Finans Danmark A/S 100 Denmark Purchase method
Nordea Kredit Realkreditaktieselskab 100 Denmark Purchase method
NJK1 ApS 100 Denmark Purchase method
Swipp Holding ApS 30 Denmark Equity method
Bankernas Kontantservice A/S 20 Denmark Equity method
Fiona Asset Company A/S 100 Denmark Purchase method
Nordea Finans Danmark A/S Fleggaard Busleasing 39 Germany Equity method
NF Fleet A/S 20 Denmark Equity method
K/S UL 676 100 Denmark Purchase method
K/S UL 677 100 Denmark Purchase method
K/S UL 678 100 Denmark Purchase method
UL Transfer Aps 100 Denmark Purchase method

Nordea Group – Other notes
Nordea Annual Report 2014134
G38 Capital adequacy, cont.
Specification over group undertakings 31 December 2014, cont.
Owner Company name
Voting power
of hold-ing, % Domicile
Consolidation method
Nordea Finans Danmark A/S UL International ApS 100 Denmark Purchase method
DT Finance K/S 100 Denmark Purchase method
BH Finance K/S 100 Denmark Purchase method
NAMIT 10 K/S 100 Denmark Purchase method
City 10 K/S 100 Denmark Purchase method
Tide Leasing 2012 K/S 100 Denmark Purchase method
LB12 K/S 100 Denmark Purchase method
BAAS 2012 K/S 100 Denmark Purchase method
Nordea Bank Danmark A/S Ancillary service undertakings
Nordea Bank AB (publ)OOO Promyshlennaya Companiya Vestkon 100 Russia Purchase method
OOO Promyshlennaya Companiya Vestkon / Nordea Bank AB (publ)
Join Stock Company Nordea Bank 100 Russia Purchase method
Join Stock Company Nordea Bank Nordea Leasing LLC 100 Russia Purchase method
Join Stock Company Nordea Bank Ancillary service undertakings
Nordea Bank AB (publ) Nordea Hypotek AB (publ) 100 Sweden Purchase method
Nordea Finans Sverige AB (publ) 100 Sweden Purchase method
Nordea Investment Management AB 100 Sweden Purchase method
Bankomatcentralen AB 48 Sweden Equity method
Svenska e-fakturabolaget AB 50 Sweden Equity method
BDB Bankernas Depå AB 20 Sweden Equity method
BAB Bankernas Automatbolag AB 20 Sweden Equity method
Getswish AB (former Goldcup 8289) 20 Sweden Equity method
PK Properties Int'l Corp 100 USA Purchase method
Nordea Funds Ltd 100 Finland Purchase method
Nordea Finans Sverige AB (publ) NF Fleet AB 20 Sweden Purchase method
Nordea Investment Management AB Nordea Investment Management North America Inc 100 USA Purchase method
Nordea Investment Management AG 100 Germany Purchase method
Nordea Private Equity Holding A/S 100 Denmark Purchase method
Nordea Private Equity Holding A/S Nordea Private Equity I A/S 100 Denmark Purchase method
Nordea Private Equity II - Global A/S 100 Denmark Purchase method
Nordea Private Equity III - GLOBAL A/S 100 Denmark Purchase method
Nordea Private Equity II - EU Mezz A/S 100 Denmark Purchase method
Nordea Private Equity II - EU MM Buyout A/S 100 Denmark Purchase method
PWM Global PE III ApS 100 Denmark Purchase method
Nordea Finans Sweden, Finland, Norway and Denmark
NF Techfleet AB 20 Sweden Equity method
Nordea Bank AB (publ) Ancillary service undertakings
Nordea Bank AB (publ) / Nordea Investment Management AB
Nordea Bank S.A. 100 Luxembourg Purchase method
Nordea Bank S.A. Nordea Investment Funds S.A. 100 Luxembourg Purchase method

Other notes – Nordea Group
Nordea Annual Report 2014 135
G39 Classification of financial instruments
Financial assets at fair value through profit or loss
31 Dec 2014, EURm Loans and receivables
Held to maturity
Held for trading
Designated at fair value
through profit or loss
Derivatives used for hedging
Available for sale
Non-financial assets and associates Total
Assets
Cash and balances with central banks 31,067 — — — — — — 31,067Loans to central banks 6,676 — 282 — — — — 6,958Loans to credit institutions 7,657 — 4,547 13 — — — 12,217Loans to the public 246,862 — 49,517 51,706 — — — 348,085Interest-bearing securities — 2,630 34,418 18,541 — 31,521 — 87,110Financial instruments pledged as collateral — — 12,151 — — — — 12,151Shares — — 8,445 31,300 — 4 — 39,749Derivatives — — 102,279 — 2,840 — — 105,119Fair value changes of the hedged items in portfolio hedge of interest rate risk 256 — — — — — — 256Investments in associated undertakings — — — — — — 487 487
Intangible assets — — — — — — 2,908 2,908
Properties and equipment — — — — — — 509 509Investment properties — — — — — — 3,227 3,227Deferred tax assets — — — — — — 130 130Current tax assets — — — — — — 132 132Retirement benefit assets — — — — — — 42 42
Other assets 4,590 — — 11,176 — — 1,815 17,581Prepaid expenses and accrued income 1,123 — 4 — — — 487 1,614Total 298,231 2,630 211,643 112,736 2,840 31,525 9,737 669,342
Financial liabilities at fair value through profit or loss
31 Dec 2014, EURm Held for trading
Designated at fair value
through profit or loss
Derivatives used for hedging
Other financial liabilities
Non-financial liabilities Total
Liabilities
Deposits by credit institutions 23,806 3,220 — 29,296 — 56,322Deposits and borrowings from the public 24,577 8,343 — 164,334 — 197,254Liabilities to policyholders — 16,741 — — 35,102 51,843Debt securities in issue 8,001 42,619 — 143,654 — 194,274
Derivatives 95,118 — 2,222 — — 97,340Fair value changes of the hedged items in portfolio hedge of interest rate risk — — — 3,418 — 3,418Current tax liabilities — — — — 368 368Other liabilities 6,903 10,061 — 6,377 3,632 26,973Accrued expenses and prepaid income 9 — — 345 1,589 1,943Deferred tax liabilities — — — — 983 983Provisions — — — — 305 305Retirement benefit liabilities — — — — 540 540
Subordinated liabilities — — — 7,942 — 7,942Total 158,414 80,984 2,222 355,366 42,519 639,505

Nordea Group – Other notes
Nordea Annual Report 2014136
Financial assets at fair value through profit or loss
31 Dec 2013, EURm Loans and receivables
Held to maturity
Held for trading
Designated at fair value
through profit or loss
Derivatives used for hedging
Available for sale
Non-financial assets and associates
Assets held for
sale Total
AssetsCash and balances with central banks 33,529 — — — — — — — 33,529Loans to central banks 11,014 — 755 — — — — — 11,769Loans to credit institutions 4,281 — 5,851 611 — — — — 10,743Loans to the public 250,026 — 39,159 53,266 — — — — 342,451Interest-bearing securities — 5,359 33,985 19,968 — 28,002 — — 87,314Financial instruments pledged as collateral — — 9,575 — — — — — 9,575Shares — — 7,683 25,584 — 4 — — 33,271Derivatives — — 69,003 — 1,989 — — — 70,992Fair value changes of the hedged items in portfolio hedge of interest rate risk 203 — — — — — — — 203Investments in associated undertakings — — — — — — 630 — 630Intangible assets — — — — — — 3,246 — 3,246
Properties and equipment — — — — — — 431 — 431Investment properties — — — — — — 3,524 — 3,524Deferred tax assets — — — — — — 62 — 62Current tax assets — — — — — — 31 — 31Retirement benefit assets — — — — — — 321 — 321
Other assets 4,057 — — 6,122 — — 885 — 11,064Prepaid expenses and accrued income 1,886 — 20 — — — 477 — 2,383Assets held for sale — — — — — — — 8,895 8,895Total 304,996 5,359 166,031 105,551 1,989 28,006 9,607 8,895 630,434
Financial liabilities at fair value through profit or loss
31 Dec 2013, EURm Held for trading
Designated at fair value
through profit or loss
Derivatives used for hedging
Other financial liabilities
Non-financial liabilities
Liabili-ties held
for sale Total
LiabilitiesDeposits by credit institutions 23,064 2,743 — 33,283 — — 59,090Deposits and borrowings from the public 26,743 10,106 — 163,894 — — 200,743Liabilities to policyholders — 13,737 — — 33,489 — 47,226Debt securities in issue 6,955 35,121 — 143,526 — — 185,602Derivatives 64,566 — 1,358 — — — 65,924Fair value changes of the hedged items in portfolio hedge of interest rate risk — — — 1,734 — — 1,734Current tax liabilities — — — — 303 — 303Other liabilities 10,996 5,867 — 5,747 2,127 — 24,737Accrued expenses and prepaid income 29 427 — 1,890 1,331 — 3,677Deferred tax liabilities — — — — 935 — 935Provisions — — — — 177 — 177Retirement benefit liabilities — — — — 334 — 334
Subordinated liabilities — — — 6,545 — — 6,545
Liabilities held for sale — — — — — 4,198 4,198Total 132,353 68,001 1,358 356,619 38,696 4,198 601,225
G39 Classification of financial instruments, cont.

Other notes – Nordea Group
Nordea Annual Report 2014 137
Financial assets and liabilities designated at fair value through profit or lossChanges in fair values of financial liabilities attributable to changes in credit riskThe financial liabilities designated at fair value through profit or loss exposed to changes in credit risk are issued bonds in the Danish group undertaking Nordea Kredit Realkreditak-tieselskab, EUR 42,619m (EUR 35,121m), the funding of the Markets operation, EUR 17,337m (EUR 14,841m) deposits linked to the investment return of separate assets, EUR 4,287m (EUR 4,302m) and investment contracts in Life, EUR 16,741m (EUR 13,737m). The funding of Markets is generally of such a short term nature that the effect of changes in own credit risk is not significant. The value of the investment con-tracts in Life and assetslinked deposits is directly linked to the assets in the contracts and there is consequently no effect from changes in own credit risk in these contracts.
The fair value of bonds issued by Nordea Kredit Realkredit-aktieselskab decreased by EUR 6m (increased EUR 16m) in 2014 due to changes in own credit risk. The cumulative change since designation is a decrease of EUR 592m (decrease EUR 596m). The method used to estimate the amount of changes in fair value attributable to changes in market conditions is based on relevant benchmark interest rates, which are the average yields on Danish and German (EUR) government bonds.
For the issued mortgage bonds a change in the liability’s credit risk and price will have a corresponding effect on the value of the loans. The reason is that a change in the price of the bonds will be offset by the opposite change in the value of the prepayment option of the loan.
Changes in fair values of financial assets attributable to changes in credit riskLending designated at fair value through profit or loss exposed to changes in credit risk consist of lending in the Danish group undertaking Nordea Kredit Realkreditaktieselskab, EUR 51,244m (EUR 48,829m) and lending in the Markets operation, EUR 475m (EUR 5,048m). The fair value of lending in Nordea Kredit Realkreditaktieselskab decreased by EUR 7m (increased EUR 9m) in 2014 due to changes in credit risk. The cumulative change since designation is a decrease of EUR 153m (decrease EUR 160m). The method used to estimate the amount of change in the fair value attributable to changes in credit risk is similar to the incurred loss impairment model for amortised cost assets under IAS 39. The lending in Markets is generally of such a short term nature (mainly overnight deposits) that the effect of changes in credit risk is not significant. Also instru-ments classified as “Other assets” and “Prepaid expenses and accrued income” are of such a short-term nature that the impact from changes in credit risk is not significant.
G40 Assets and liabilities at fair value
31 Dec 2014 31 Dec 2013
EURmCarrying
amountFair
valueCarrying
amountFair
value
Financial assetsCash and balances with central banks 31,067 31,067 33,529 33,529Loans 367,516 368,872 365,166 365,166Interest-bearing securities 87,110 87,421 87,314 87,439Financial instruments pledged as collateral 12,151 12,151 9,575 9,575Shares 39,749 39,749 33,271 33,271Derivatives 105,119 105,119 70,992 70,992Other assets 15,766 15,766 10,179 10,179Prepaid expenses and accrued income 1,127 1,127 1,906 1,906Total 659,605 661,272 611,932 612,057
Financial liabilitiesDeposits and debt instruments 459,210 460,653 453,714 455,368Liabilities to policy-holders 16,741 16,741 13,737 13,737Derivatives 97,340 97,340 65,924 65,924
Other liabilities 23,341 23,341 22,610 22,610Accrued expenses and prepaid income 354 354 2,346 2,346Total 596,986 598,429 558,331 559,985
For information about valuation of items measured at fair value on the balance sheet, see Note G1 and the section “Determina-tion of fair values for items measured at fair value on the bal-ance sheet” below. For information about valuation of items not measured at fair value on the balance sheet, see the section “Financial assets and liabilities not held at fair value on the bal-ance sheet” below.
Fair value of financial assets and liabilities
Comparison of carrying amount and contractual amount to be paid at maturity
2014, EURmCarrying
amountAmount to be
paid at maturity
Financial liabilities designated at fair value through profit or loss 80,984 79,198
2013, EURmCarrying
amountAmount to be
paid at maturity
Financial liabilities designated at fair value through profit or loss 68,001 67,339
Liabilities to policyholders have no fixed maturities and there is no fixed amount to be paid. The amount disclosed to be paid at maturity has been set to the carrying amount.
G39 Classification of financial instruments, cont.
Loans designated at fair value through profit or loss
EURm 31 Dec 2014 31 Dec 2013
Carrying amount 51,719 53,877Maximum exposure to credit risk 51,719 53,877Carrying amount of credit derivatives used to mitigate the credit risk — —

Nordea Group – Other notes
Nordea Annual Report 2014138
G40 Assets and liabilities at fair value, cont.
Categorisation into the fair value hierarchy
31 Dec 2014, EURm
Quoted prices in active markets for
the same instru-ment (Level 1)
– of which
Life
Valuation technique using observable data
(Level 2)
– of which
Life
Valuation technique using
non-observable data (Level 3)
– of which
Life Total
Assets at fair value on the balance sheet1
Loans to central banks — — 282 — — — 282Loans to credit institutions — — 4,560 7 — — 4,560Loans to the public — — 101,223 — — — 101,223Interest-bearing securities2 54,724 12,805 41,598 6,936 279 53 96,601Shares3 32,724 22,739 1,597 1,596 5,458 4,486 39,779Derivatives 102 — 103,551 119 1,466 — 105,119Investment properties — — — — 3,227 3,127 3,227Other assets — — 11,176 — — — 11,176Prepaid expenses and accrued income — — 4 — — — 4Total 87,550 35,544 263,991 8,658 10,430 7,666 361,971
Liabilities at fair value on the balance sheet1
Deposits by credit institutions — — 27,026 1,541 — — 27,026Deposits and borrowings from the public — — 32,920 — — — 32,920Liabilities to policyholders — — 16,741 16,741 — — 16,741Debt securities in issue 42,619 — 8,001 — — — 50,620Derivatives 91 — 95,623 56 1,626 — 97,340Other liabilities 4,667 — 12,297 — — — 16,964Accrued expenses and prepaid income — — 9 — — — 9Total 47,377 — 192,617 18,338 1,626 — 241,620
1) All items are measured at fair value on a recurring basis at the end of each reporting period.2) Of which EUR 12,121m relates to the balance sheet item Financial instruments pledged as collateral.3 Of which EUR 30m relates to the balance sheet item Financial instruments pledged as collateral.
31 Dec 2013, EURm
Quoted prices in active markets for
the same instru-ment (Level 1)
– of which
Life
Valuation technique using observable data
(Level 2)
– of which
Life
Valuation technique using
non-observable data (Level 3)
– of which
Life Total
Assets at fair value on the balance sheet1
Loans to central banks — — 755 — — — 755Loans to credit institutions — — 6,462 — — — 6,462Loans to the public — — 92,425 — — — 92,425Interest-bearing securities2 59,276 11,641 31,745 6,882 478 104 91,499Shares3 28,004 18,995 1,457 1,454 3,841 2,842 33,302Derivatives 195 128 69,361 26 1,436 — 70,992Investment properties — — — — 3,524 3,367 3,524Other assets — — 6,122 — — — 6,122Prepaid expenses and accrued income — — 20 — — — 20Total 87,475 30,764 208,347 8,362 9,279 6,313 305,101
Liabilities at fair value on the balance sheet1
Deposits by credit institutions — — 25,807 1,168 — — 25,807Deposits and borrowings from the public — — 32,547 — — — 32,547Liabilities to policyholders — — 13,737 13,737 — — 13,737Debt securities in issue 35,121 — 6,955 — — — 42,076Derivatives 35 — 64,490 — 1,399 — 65,924Other liabilities 8,939 — 7,923 — 1 — 16,863Accrued expenses and prepaid income — — 456 — — — 456Total 44,095 — 151,915 14,905 1,400 — 197,410
1) All items are measured at fair value on a recurring basis at the end of each reporting period. 2) Of which EUR 9,544m relates to the balance sheet item Financial instruments pledged as collateral.3) Of which EUR 31m relates to the balance sheet item Financial instruments pledged as collateral.
Financial assets and liabilities held at fair value on the balance sheet

Other notes – Nordea Group
Nordea Annual Report 2014 139
G40 Assets and liabilities at fair value, cont.
Determination of fair value for items measured at fair value on the balance sheetFair value measurements of assets and liabilities carried at fair value have been categorised under the three levels of the IFRS fair value hierarchy. The fair value hierarchy gives the highest priority to quoted prices (unadjusted) in active mar-kets for identical assets or liabilities (Level 1) and the lowest priority to unobservable inputs (Level 3). The categorisation of these instruments is based on the lowest level input that is significant to the fair value measurement in its entirety.
Level 1 in the fair value hierarchy consists of assets and lia-bilities valued using unadjusted quoted prices in active mar-kets for identical assets or liabilities. An active market for the asset or liability is a market in which transactions for the asset or liability occur with sufficient frequency and volume to pro-vide pricing information on an on-going basis. This category includes listed derivatives, listed equities, government bonds in developed countries, and most liquid mortgage bonds and corporate bonds where direct tradable price quotes exist.
Level 2 in the fair value hierarchy consists of assets and lia-bilities that do not have directly quoted market prices availa-ble from active markets. The fair values are estimated using valuation techniques or valuation models based on market prices or rates prevailing at the balance sheet date and any unobservable inputs have had an insignificant impact on the fair values. This is the case for the majority of Nordea’s OTC derivatives, securities purchased/sold under resale/repur-chase agreements, securities borrowed/lent and other instru-ments where active markets supply the input to the valuation techniques or models.
Level 3 in the fair value hierarchy consists of those types of assets and liabilities which fair values cannot be obtained directly from quoted market prices or indirectly using valua-tion techniques or models supported by observable market prices or rates. This is generally the case for investments in unlisted securities, private equity funds, hedge funds and investment properties. This is generally also the case for more complex OTC derivatives, including OTC derivatives where less active markets supply input to the valuation techniques or models, certain complex or structured financial instruments such as CLNs and CDOs, and illiquid interest bearing securi-ties. Complex valuation models are generally characterised by the use of unobservable and model specific parameters.
All valuation models, both complex and simple models, make use of market parameters. These parameters comprise interest rates, volatilities, correlations etc. Some of these parameters are observable while others are not. For non-exotic currencies the interest rates are all observable, and the volatilities and the correlations of the interest rates and FX rates are observable up to a certain maturity. Volatilities and correlations are also observable for the most liquid equity instruments in the short end. For less liquid equity instru-ments the option market is fairly illiquid, and hence the vola-tilities and correlations are unobservable. For each instru-ment the sensitivity towards unobservable parameters is measured. If the impact from unobservable parameters on the valuation is significant the instrument is categorised as Level 3 in the fair value hierarchy.
For interest-bearing securities the categorisation into the three levels are based on the internal pricing methodology. These instruments can either be directly quoted in active markets (Level 1) or measured using a methodology giving a quote based on observable inputs (Level 2). Level 3 bonds are characterised by illiquidity.
For OTC derivatives valuation models are used for establish-ing fair value. For collateralised contracts OIS interest rates are used for discounting. These rates are observable in the market. The valuation is in addition based on several other market parameters, depending on the nature of the contract. Complex valuation models are used for more exotic OTC derivatives. The models are usually in-house developed, and based on assumptions about the behaviour of the underlying asset and statistical scenario analysis. As mentioned above OTC deriva-tives are generally categorised as Level 2 in the fair value hier-archy and all significant model parameters are thus observable in active markets. For vanilla derivatives standard models like e.g. Black-Scholes are used for valuation.
Valuations of Private Equity Funds (PEF) and unlisted equity instruments are by nature more uncertain than valua-tions of more actively traded equity instruments. Emphasis is put on using a consistent approach across all assets and over time. The methods used are consistent with the guideline “International Private Equity and Venture Capital Valuation Guidelines” issued by EVCA (European Venture Capital Association). The EVCA guidelines are considered as best practice in the PEF industry. For US based funds, similar methods are applied.
Nordea furthermore holds loans and issued debt securities in the subsidiary Nordea Kredit Realkreditaktieselskab at fair value. When Nordea grants mortgage loans to borrowers, in accordance with the Danish mortgage finance law, Nordea at the same time issues debt securities with matching terms, so called “match funding”. Fair value of the issued debt securi-ties is based on quoted prices and thus categorised as Level 1 in the fair value hierarchy. As the borrowers have the right to purchase debt securities issued by Nordea in the market and return these as repayment for their loans, the fair value of the loans is the same as the fair value of the issued bonds (due to the revaluation of the repayment option embedded in the loan) adjusted for changes in the credit risk of the borrower. The credit risk adjustment is calculated based on an incurred loss model.
Fair value of financial assets and liabilities are generally calculated as the theoretical net present value of the individ-ual instruments, based on independently sourced market parameters as described above, and assuming no risks and uncertainties. This calculation is supplemented by a portfolio adjustment.
An important part of the portfolio adjustment relates to counterparty risk in OTC-derivaives. The adjustment is based on the current exposure towards each counterpart, the esti-mated potential future exposure as well as an estimate of the cost of hedging the counterparty risk. This cost of hedging is either based directly on market prices (where available) or on a theoretical calculation based on the internal credit rating of the counterpart. Nordea also takes into account Nordea s credit spread in the valuation of derivatives (DVA).
Another important part of the portfolio adjustment serves to adjust the net open market risk exposures from mid-prices to ask or bid prices (depending on the net position). For dif-ferent risk categories, exposures are aggregated and netted according to internal guidelines and aggregated market price information on bid-ask spreads are applied in the calculation. Spreads are updated on a regular basis.
The fair value measurement of the investment properties takes into account a market participant s ability to generate economic benefits by using the investment properties in its highest and best use, i.e. taking into account the use of the

Nordea Group – Other notes
Nordea Annual Report 2014140
G40 Assets and liabilities at fair value, cont.
investment properties that is physically possible, legally per-missible and financially feasible. The current use of the investment properties in Nordea is in accordance with the highest and best use. The valuation of the investment proper-ties is carried out taking into account the purpose and the nature of the property by using the most appropriate valua-tion methods. The primary valuation approach is a dis-counted cash flow model using current cash flows, market interest rates and the current yield requirements.
Transfers between Level 1 and 2 During the year, Nordea transferred interest-bearing securities (including such financial instruments pledged as collateral) of
EUR 149m (EUR 2,893m) from Level 1 to Level 2 and EUR 1,290m (EUR 1,092m) from Level 2 to Level 1 of the fair value hierarchy. Nordea also transfered other liabilities of EUR 55m from Level 2 to Level 1. During 2013 Nordea transfered shares of EUR 966m and other liabilities of EUR 1,054m from Level 1 to Level 2. The reason for the transfers from Level 1 to Level 2 was that the instruments ceased to be actively traded during the year and fair values have now been obtained using valua-tion techniques with observable market inputs. The reason for the transfer from Level 2 to Level 1 was that the instruments have been actively traded during the year and reliable qouted prices are obtained in the market. Transfers between levels are considered to have occurred at the end of the year.
Unrealised gains and losses relate to those assets and liabili-ties held at the end of the year. During the year Nordea trans-ferred shares of EUR 22m from Level 3 to Level 2. The reason for the transfer from Level 3 to Level 2 was that observable market data became available. Transfers between levels are
considered to have occurred at the end of the year. Fair value gains and losses in the income statement during the year are included in “Net result from items at fair value” (see Note G5). Assets and liabilities related to derivatives are presented net.
Movements in Level 3 Fair value gains/losses
recognised in the income statement during the year
2014, EURm 1 Jan 2014 Realised Unrealised
Recog-nised in
OCIPurchases/
Issues SalesSettle-ments
Transfers out of level 3
Transla-tion differ-
ences31 Dec
2014
Interest-bearing securities 478 8 10 –2 163 –373 –3 — –2 279– of which Life 104 5 5 — 19 –78 — — –2 53Shares 3,841 388 313 — 2,417 –1,441 –22 –22 –16 5,458– of which Life 2,842 324 238 — 2,332 –1,196 –15 –22 –17 4,486Derivatives (net) 37 –488 –197 — — — 488 — — –160Investment properties 3,524 –1 –3 — 267 –462 — –33 –65 3,227– of which Life 3,367 7 –3 — 241 –390 — –33 –62 3,127Other liabilities 1 — — — — –1 — — — —

Other notes – Nordea Group
Nordea Annual Report 2014 141
G40 Assets and liabilities at fair value, cont.
The valuation processes for fair value measurements in Level 3Financial instrumentsValuation principles in Nordea are determined in and approved by the Group Valuation Committee (GVC). GVC issues guiding policies to the business units on how to estab-lish a robust valuation process and minimise the valuation uncertainty. The GVC also serves as escalation point.
The valuation process in Nordea consists of several steps. The first step is the initial end of day (EOD) marking of mid-prices. The mid-prices are either fixed by front office or received from external sources. The second step is the control part, which is performed by independent control units. The cornerstone in the control is the independent price verifica-tion (IPV). The IPV test comprises verification of the correct-ness of prices and other parameters used in the net present value (NPV) calculation, the adequacy of the valuation mod-els, including an assessment of whether to use quoted prices or valuation models, and the reliability of the assumptions and parameters used in the valuation adjustments at portfolio level covering mainly liquidity (bid/offer spread) and credit risk adjustments.
The verification of the correctness of prices and other parameters is carried out daily. Third-party information, such as broker quotes and pricing services, is used as benchmark data in the verification. The quality of the benchmark data is assessed on a regular basis. This quality assessment is used in the measurement of the valuation uncertainty.
Valuation adjustment at portfolio level and the deferrals of day 1 P/L on Level 3 trades are calculated and reported on a
Movements in Level 3, cont.
Fair value gains/losses recognised in the income statement during the year
2013, EURm 1 Jan 2013
Reclas-sifica-
tion Realised Unrealised Purchases/
Issues SalesSettle-ments
Transfers into level 3
Transfers out of level 3
Translation differences
31 Dec
2013
Interest-bearing securities 1,118 –498 –10 65 105 –277 –12 — — –13 478– of which Life 719 –498 –14 –2 10 –97 –1 — — –13 104Shares 3,374 498 299 62 967 –1,125 –72 2 –137 –27 3,841– of which Life 2,210 498 251 52 808 –752 –69 2 –137 –21 2,842Derivatives (net) 332 — 287 –300 — — –287 5 — 0 37Investment properties 3,408 — 1 –41 502 –223 — — — –123 3,524– of which Life 3,261 — 1 –41 445 –179 — — — –120 3,367Other liabilities — — –20 0 608 — –608 21 — — 1
monthly basis. The actual assessment of instruments in the fair value hierarchy is performed on a continuous basis.
Investment propertiesThe main part of the investment properties in Nordea is held by Nordea Life and Pension (NLP). The valuation of the investment properties in NLP is performed quarterly by the real estate departments in each entity within NLP with full or partial assistance from external valuers. For the departments that use their own methodologies the changes in price levels of the properties are compared with valuations of similar properties assessed by external valuers. The result of the val-uation is presented to, and approved by, the local manage-ment in each entity. The CFO in each enitity within NLP is responsible for the approval of the concepts and for the values used. The principles used in all entities are in accordance with regulations provided by the local Financial Supervisory Authorities (FSA) which are in accordance with international valuation principles and in accordance with IFRS.
In addition there is an Investment Operation Committee (IOC) which is a joint forum focusing on valuation and accounting of investment operations issues within NLP. The entities within NLP report regularly to IOC and IOC report quarterly to the Nordea Group Valuation Committee.
Investment properties in NLP are backing the liabilities to policyholders in life insurance contracts, unit-linked contracts and investment contracts, which means that the impact on Nordea’s income statement and on shareholders’ equity depends on the financial buffers and the profit sharing agree-ments in the actual unit that owns the property.
Unrealised gains and losses relate to those assets and liabili-ties held at the end of the year. During the year Nordea trans-ferred shares of EUR 137m from Level 3 to Level 2 and EUR 2m from Level 2 to Level 3. Nordea also transferred other lia-bilities of EUR 21m from Level 2 to Level 3. The reason for the transfer from Level 3 to Level 2 was that observable market data became available. The reason for the transfer from Level 2 to Level 3 was that observable market data was no longer available. Transfers between levels are considered to have occurred at the end of the year. Fair value gains and losses in the income statement during the year are included in “Net result from items at fair value” (see Note G5). Assets and lia-bilities related to derivatives are presented net.

Nordea Group – Other notes
Nordea Annual Report 2014142
G40 Assets and liabilities at fair value, cont.
Valuation techniques and inputs used in the fair value measurements in Level 3
31 Dec 2014, EURm Fair value Of which Life1 Valuation techniques Unobservable input Range of fair value
Interest-bearing securities Mortgage and other credit institutions2 235 9 Discounted cash flows Credit spread –8/8Corporates 44 44 Discounted cash flows Credit spread –3/3Total 279 53 –11/11
SharesPrivate equity funds 2,328 1,820 Net asset value3
Hedge funds 443 181 Net asset value3
Credit Funds 487 377 Net asset value/market consensus3
Other funds 1,970 1,950 Net asset value/Fund prices3
Other 230 158 —Total 5,458 4,486 –542/575
DerivativesInterest rate derivatives 191 — Option model Correlations –13/9
VolatilitiesEquity derivatives –220 — Option model Correlations –18/12
Volatilities
DividendForeign exchange derivatives –31 — Option model Correlations +/–0
VolatilitiesCredit derivatives –129 — Credit derivat model Correlations –10/9
Recovery ratesOther 29 — Option model Correlations +/–0
VolatilitiesTotal –160 — –41/30
1) Investment in financial instruments is a major part of the life insurance business, aquired to fulfill the obligations behind the insurance- and investment contracts. The gains or losses on these instruments are almost exclusively allocated to policyholders and do consequently not affect Nordea’s equity.
2) Of which EUR 155m is priced at a credit spread (the difference between the discount rate and LIBOR) of 1.45% and a resonable change of this credit spread would not affect the fair value due to callability features.
3) The fair values are based on prices and net assets values delivered by external suppliers/custodians. The prices are fixed by the suppliers/custodians on the basis of the develop-ment in assets behind the investments. For private equity funds the dominant measurement methodology used by the suppliers/custodians, is consistent with the International Private Equity and Venture Capital Valuation (IPEV) guidelines issued by the EVCA (European Venture Capital Association). Less than 15% of the private equity fund investment are internally adjusted/valued based the IPEV guidelines. These carrying amounts are in a range of 0% to 95% compared to the values received from suppliers/custodians.
The table above shows, for each class of assets and liabilities cat-egorised in Level 3, the fair value, the valuation techniques used to estimate the fair value, significant unobservable inputs used in the valuation techniques and for financial assets and liabili-ties the fair value sensitivity to changes in key assumptions.
The column “range of fair value” in the tables above shows the sensitivity of the fair values of Level 3 financial instru-ments to changes in key assumptions. Where the exposure to an unobservable parameter is offset across different instru-ments then only the net impact is disclosed in the table. The ranges disclosed are likely to be greater than the true uncer-tainty in fair value of these instruments, as it is unlikely in practice that all unobservable parameters would be simulta-neously at the extremes of their ranges of reasonably possible alternatives. The disclosure is neither predictive nor indica-tive of future movements in fair value.
In order to calculate the sensitivity (range) in fair value of derivatives a range of different modelling approaches are applied to determine an uncertainty interval around the
reported fair value. The different approaches applied target various aspects of derivatives pricing. Two common compo-nents of derivative valuation models are volatility of underly-ing risk factors and correlation between the relevant risk fac-tors. Each of these is addressed by applying different assumptions to input and/or the choice of modelling approach. Besides these common factors a number of asset class specific factors are addressed. These include equity divi-dend expectations, recovery assumptions for credit deriva-tives and inflation expectations. The fair values of derivatives are presented as the net of assets and liabilities.
In order to calculate the sensitivity (range) in fair value of shares and interest-bearing securities the fair value was increased and decreased within a total range of 2–10 percent-age units depending of the valuation uncertainty and under-lying assumptions. Higher ranges are applied to instruments with more uncertain valuations relative to actively traded instruments and underlying uncertainties in individual assumptions.

Other notes – Nordea Group
Nordea Annual Report 2014 143
G40 Assets and liabilities at fair value, cont.
Valuation techniques and inputs used in the fair value measurements in Level 3
31 Dec 2013, EURm Fair value Of which Life1 Valuation techniques Unobservable input Range of fair value
Interest-bearing securities Municipalities and other public bodies 29 29 Discounted cash flows Credit spread +/–0Mortgage and other credit institutions2 359 8 Discounted cash flows Credit spread –20/20Corporates 82 67 Discounted cash flows Credit spread –4/4Other 8 — — — –1/1Total 478 104 –25/25
SharesPrivate equity funds 2,298 1,770 Net asset value3
Hedge funds 458 178 Net asset value3
Credit Funds 460 362 Net asset value/market consensus3
Other funds 431 403 Net asset value/Fund prices3
Other 194 129 —Total 3,841 2,842 –381/381
DerivativesInterest rate derivatives 141 — Option model Correlations –7/5
VolatilitiesEquity derivatives –93 — Option model Correlations –17/11
Volatilities
DividendForeign exchange derivatives 103 — Option model Correlations +/–0
VolatilitiesCredit derivatives –129 — Credit derivat model Correlations –7/9
Recovery ratesOther 15 — Option model Correlations +/–0
VolatilitiesTotal 37 — –31/25
1) Investment in financial instruments is a major part of the life insurance business, aquired to fulfill the obligations behind the insurance- and investment contracts. The gains or losses on these instruments are almost exclusively allocated to policyholders and do consequently not affect Nordea’s equity.
2) Of which EUR 155m is priced at a credit spread (the difference between the discount rate and LIBOR) of 1.45% and a reasonable change of this credit spread would not affect the fair value due to callability features.
3) The fair values are based on prices and net assets values delivered by external suppliers/custodians. The prices are fixed by the suppliers/custodians on the basis of the develop-ment in assets behind the investments. For private equity funds the dominant measurement methodology used by the suppliers/custodians, is consistent with the International Private Equity and Venture Capital Valuation (IPEV) guidelines issued by the EVCA (European Venture Capital Association). Less than 15% of the private equity fund invest-ment are internally adjusted/valued based the IPEV guidelines. These carrying amounts are in a range of 0% to 100% compared to the values received from suppliers/custodi-ans.

Nordea Group – Other notes
Nordea Annual Report 2014144
G40 Assets and liabilities at fair value, cont.
31 Dec 2014, EURm Fair
value1
Of which
Life Valuation techniques Unobservable inputRange of
unobservable inputWeighted average of unobservable input
Investment properties
Denmark 1,656 1,645 Discounted cash flows Market rent 26–377 EUR/m2/year 110 EUR/m2/yearYield requirement
Commercial 6.1%–9.0% 7.5%Office 4.6%–9.5% 6.0%Apartment 3.5%–6.0% 5.0%
Norway 774 767 Discounted cash flows Market rent 25–1,166 EUR/m2/year 216 EUR/m2/year
Yield requirement
Commercial 5.3%–8.5% 5.9%Office 5.0%–8.8% 6.3%Apartment 5.5%–5.5% 5.5%Other 7.3%–8.5% 7.8%
Finland 642 640 Discounted cash flows2 Market rent 89–327 EUR/m2/year 170 EUR/m2/yearYield requirement
Commercial 5.0%–7.0% 6.0%Office 5.0%–8.0% 6.5%Apartment 4.5%–6.0% 5.3%Other 6.5%–9.0% 7.8%
Sweden 75 75 Discounted cash flows2 Market rent 64–191 EUR/m2/year 126 EUR/m2/year
Yield requirementCommercial 6.3%–7.0% 6.7%Apartment 4.0%–4.5% 4.1%Other 7.0%–7.0% 7.0%
Other 80 — Discounted cash flows — — —Total 3,227 3,127
1) Split based on the valuation methodologies used in different countries. 2) The fair value is calculated by external valuers.

Other notes – Nordea Group
Nordea Annual Report 2014 145
G40 Assets and liabilities at fair value, cont.
Movements in deferred Da y 1 profitThe transaction price for financial instruments in some cases differs from the fair value at initial recognition measured using a valuation model, mainly due to that the transaction price is not established in an active market. If there are signif-icant unobservable inputs used in the valuation technique (Level 3), the financial instrument is recognised at the trans-action price and any difference between the transaction price and fair value at initial recognition measured using a valua-tion model (Day 1 profit) is deferred. For more information see, Note G1 “Accounting policies”. The table below shows the aggregate difference yet to be recognised in the income statement at the beginning and end of the period and a recon-ciliation of how this aggregated difference has changed dur-ing the year (movements in deferred Day 1 profit).
Deferred day 1 profit – derivatives EURm
31 Dec2014
31 Dec2013
Amount at beginning of year 38 24Deferred profit/loss on new transactions 9 26Recognised in the income statement during the year –11 –12Amount at end of year 36 38
31 Dec 2013, EURm Fair
value1
Of which
Life Valuation techniques Unobservable inputRange of
unobservable inputWeighted average of unobservable input
Investment properties
Denmark 1,752 1,735 Discounted cash flows Market rent 54–350 EUR/m2/year 107 EUR/m2/yearYield requirement
Commercial 6.0%–9.0% 7.6%Office 4.6%–9.5% 6.1%Apartment 3.5%–6.3% 5.8%
Norway 899 875 Discounted cash flows Market rent 85–850 EUR/m2/year 203 EUR/m2/year
Yield requirement
Commercial 5.3%–8.5% 6.4%Office 5.7%–8.5% 6.5%Apartment 5.8%–6.5% 6.1%Other 6.0%–8.0% 7.3%
Finland 793 681 Discounted cash flows2 Market rent 88–324 EUR/m2/year 148 EUR/m2/yearYield requirement
Commercial 5.0%–7.0% 6.0%Office 5.0%–8.0% 6.5%Apartment 4.5%–6.0% 5.3%Other 6.5%–9.0% 7.8%
Sweden 76 76 Discounted cash flows2 Market rent — —Yield requirement
Commercial 6.8%–7.0% 6.8%Apartment 4.3%–4.3% 4.3%Other 5.0%–8.3% 6.5%
Other 4 — Discounted cash flows — — —Total 3,524 3,367
1) Split based on the valuation methodologies used in different countries. 2) The fair value is calculated by external valuers.

Nordea Group – Other notes
Nordea Annual Report 2014146
G40 Assets and liabilities at fair value, cont.
Cash and balances with central banks The fair value of “Cash and balances with central banks” is, due to its short term nature, assumed to equal the carrying amount and is thus categorised into Level 3 in the fair value hierarchy.
LoansThe fair value of “Loans to central banks”, “Loans to credit institutions” and “Loans to the public” have been estimated by discounting the expected future cash flows with an assumed customer interest rate that would have been used on the mar-ket if the loans had been issued at the time of the measure-ment. The assumed customer interest rate is calculated as the benchmark interest rate plus the average margin on new lend-ing in Retail Banking and Wholesale Banking respectively.
The fair value adjustment on amortised cost loans calcu-lated for disclosure purposes is negative by EUR 1,904m. The fair value adjustment calculated for disclosure purposes on all loans on the balance sheet (see page 137), including loans held at fair value mainly in the Danish group undertaking Nordea Kredit Realkreditaktieselskab (designated at fair value through profit or loss), is positive by EUR 1,356m. The disclosed fair value on loans designated at fair value through profit or loss differs from the carrying amount as the fair value disclosure disregards prepayment options in the lend-ing in Nordea Kredit Realkreditaktieselskab. The correct car-rying amount on the balance sheet includes also the fair value adjustment of the prepayment options embedded in the loans.
For the comparative figures 2013 the fair value has been calculated as the carrying amount adjusted for fair value changes in interest rate risk. The fair value changes related to interest rate risk is based on changes in relevant interest rates compared with corresponding nominal interest rates in the portfolios. No adjustment has been made for changes in fair value of credit risk in the comparative figures.
The fair value measurement is categorised into Level 3 in the fair value hierarchy.
Interest bearing-securitiesThe fair value is EUR 2,941m (EUR 5,484m), of which EUR 27m (EUR 234m) is categorised in Level 1 and EUR 2,914m (EUR 5,250m) in Level 2. The measurement principles follow those for similar instruments that are held at fair value on the bal-ance sheet.
Other assets and prepaid expenses and accrued incomeThe balance sheet items “Other assets” and “Prepaid expenses and accrued income” consist of short receivables, mainly accrued interest receivables. The fair value is therefore consid-ered to equal the carrying amount and is categorised into Level 3 in the fair value hierarchy.
Deposits and debt instrumentsThe fair value of ”Deposits by credit institutions”, “Deposits and borrowings from the public”, “Debt securities in issue” and “Subordinated liabilities” has been calculated as the carry-ing amount adjusted for fair value changes in interest rate risk and in own credit risk. The fair value is categorised into Level 3 in the fair value hierarchy. The fair value changes related to interest rate risk is based on changes in relevant interest rates compared with corresponding nominal interest rate in the portfolios. The fair value changes in the credit risk is calculated as the difference between the credit spread in the nominal interest rate compared with the current spread that is observed in the market. This calculation is performed on an aggregated level for all long term issuances recognised in the balance sheet items “Debt securities in issue” and “Subordinated liabilities”. As the contractual maturity is short for “Deposits by credit institutions” and “Deposits and borrowing from the public” the changes in Nordea s own credit risk related to these items is assumed not to be significant. This is also the case for short term issuances recognised in the balance sheet items “Debt securities in issue” and “Subordinated liabilities”.
Other liabilities and accrued expenses and prepaid incomeThe balance sheet items “Other liabilities” and “Accrued expenses and prepaid income” consist of short-term liabilities, mainly liabilities on securities settlement. The fair value is therefore considered to be equal to the carrying amount and is categorised into Level 3 in the fair value hierarchy.
Financial assets and liabilities not held at fair value on the balance sheet
31 Dec 2014 31 Dec 2013
EURmCarrying
amount Fair valueCarrying
amount Fair valueLevel in fair
value hierarchy
Assets not held at fair value on the balance sheetCash and balances with central banks 31,067 31,067 33,529 33,529 3Loans 261,451 259,547 265,524 265,524 3Interest-bearing securities 2,630 2,941 5,359 5,484 1, 2Other assets 4,590 4,590 4,057 4,057 3Prepaid expenses and accrued income 1,123 1,123 1,886 1,886 3Total 300,861 299,268 310,355 310,480
Liabilities not held at fair value on the balance sheet
Deposits and debt instruments 348,644 350,087 353,284 354,938 3Other liabilities 6,377 6,377 5,747 5,747 3Accrued expenses and prepaid income 345 345 1,890 1,890 3Total 355,366 356,809 360,921 362,575

Other notes – Nordea Group
Nordea Annual Report 2014 147
Amounts not set off but subject to master netting agreements and similar agreements
31 Dec 2014, EURm
Gross recog-nised finan-
cial assets1
Gross recog-nised finan-
cial liabilities set off on the balance sheet
Net carrying amount on the balance
sheet2Financial
instruments
Financial collateral received
Cash collat-eral received Net amount
AssetsDerivatives 245,959 –141,572 104,387 –79,016 — –11,994 13,377Reverse repurchase agreements 49,352 — 49,352 –19,299 –29,605 — 448Securities borrowing agreements 5,272 — 5,272 — –5,272 — 0Total 300,583 –141,572 159,011 –98,315 –34,877 –11,994 13,825
Amounts not set off but subject to master netting agreements and similar agreements
31 Dec 2014, EURm
Gross recognised
financial liabilities1
Gross recog-nised finan-
cial assets set off on the bal-
ance sheet
Net carrying amount on the balance
sheet2Financial
instruments
Financial collateral
pledged Cash collat-eral pledged Net amount
LiabilitiesDerivatives 237,562 –141,572 95,990 –79,016 — –10,360 6,614Repurchase agreements 44,488 — 44,488 –19,299 –23,559 — 1,630Securities lending agreements 2,778 — 2,778 — –2,778 — 0Total 284,828 –141,572 143,256 –98,315 –26,337 –10,360 8,244
1) All amounts are measured at fair value.2) Reverse repurchase agreements and Securities borrowing agreements are on the balance sheet classified as Loans to central banks, Loans to credit institutions or Loans to the
public. Repurchase agreements and Securities lending agreements are on the balance sheet classified as Deposits by credit institution or as Deposits and borrowings from the public.
Amounts not set off but subject to master netting agreements and similar agreements
31 Dec 2013, EURm
Gross recog-nised finan-
cial assets1
Gross recog-nised finan-
cial liabilities set off on the balance sheet
Net carrying amount on the balance
sheet2Financial
instruments
Financial collateral received
Cash collat-eral received Net amount
AssetsDerivatives 128,855 –58,132 70,723 –56,104 –1 –5,739 8,879Reverse repurchase agreements 45,704 — 45,704 –24,267 –21,053 — 384Securities borrowing agreements 4,397 — 4,397 — –4,397 — 0Total 178,956 –58,132 120,824 –80,371 –25,451 –5,739 9,263
Amounts not set off but subject to master netting agreements and similar agreements
31 Dec 2013, EURm
Gross recognised
financial liabilities1
Gross recog-nised finan-
cial assets set off on the
balance sheet
Net carrying amount on the balance
sheet2Financial
instruments
Financial collateral
pledged Cash collat-eral pledged Net amount
LiabilitiesDerivatives 122,388 –58,132 64,256 –56,104 — –4,586 3,566Repurchase agreements 49,744 — 49,744 –24,267 –21,821 — 3,656Securities lending agreements 3,063 — 3,063 — –3,063 — 0Total 175,195 –58,132 117,063 –80,371 –24,884 –4,586 7,222
1) All amounts are measured at fair value.2) Reverse repurchase agreements and Securities borrowing agreements are on the balance sheet classified as Loans to central banks, Loans to credit institutions or Loans to the
public. Repurchase agreements and Securities lending agreements are on the balance sheet classified as Deposits by credit institution or as Deposits and borrowings from the public.
Enforceable master netting arrangements and similar agreementsThe fact that financial instruments are being accounted for on a gross basis on the balance sheet, would not imply that the financial instruments are not subject to master netting agree-ments or similar arrangements. Generally financial instru-ments (derivatives, repos and securities lending transactions),
would be subject to master netting agreements, and as a con-sequence Nordea would be allowed to benefit from netting in the case of default by its counter parties, in any calculations involving counterparty credit risk.
For a description of counterparty risk see section Risk, Liquidity and Capital management, in the Board of Directors’ report.
G41 Financial instruments set off on balance or subject to netting agreements

Nordea Group – Other notes
Nordea Annual Report 2014148
G42 Discontinued operations and disposal groups held for sale
EURm 2014 2013
Net interest income 28 154Net fee and commission income 0 38Other operating income 21 7Total operating income 49 199
Total operating expenses –53 –118Net loan losses –5 –26Operating profit –9 55Income tax expense –1 –13Net profit for the period from dis-continued operations –10 42Net result for the period recognised on the measurement at fair value –19 1Transaction and transition cost (including cost to sell)1 –10 –34
Net profit for the period from dis-continued operations after measure-ment at fair value less cost to sell –39 9
1) 2013: Income tax of EUR 9m deducted.
Balance sheet – Condensed1
EURm 31 Dec 2014 31 Dec 2013
AssetsLoans to the public — 6,144Interest-bearing securities — 1,534Shares — 385Total other assets — 832Total assets held for sale — 8,895
Liabilities Deposits by credit institutions — 78Deposits and borrowings from the public — 3,384Liabilities to policyholders — 625Total other liabilities — 111Total liabilities held for sale — 4,198
1) Includes the external assets and liabilities held for sale. The external funding of the Polish operations that will remain subsequent to the transaction is not included.
The impact from discontinued operations on other compre-hensive income and cash flows can be found in the statement of comprehensive income and the cash flow statement for the Group. The EPS for discontinued operations can be found in Note G12.
Discontinued operations and assets/liabilities held for sale relate to Nordea’s divestment of its Polish banking, financing and life insurance operations, including Nordea Bank Polska S.A., Nordea Finance Polska S.A. and Nordea Polska Towar-
zystwo Ubezpieczen na Zycie S.A., to PKO Bank Polski. All reg-ulatory approvals were received and the transaction closed dur-ing 2014. The operations have consequently been derecognised. The disposal group is excluded from Note 2 “Segment report-ing” as this is not part of the reporting to the Chief Operating Decision Maker (CODM). The majority of the business was pre-viously reported in the Retail Banking Poland segment. The impact from discontinued operations on other comprehensive income can be found in the statement of comprehensive income.

Other notes – Nordea Group
Nordea Annual Report 2014 149
The Life Group and Nordea Bank Danmark A/S have assets and liabilities included on their balance sheet where customers are bearing the risk. Since the assets and liabilities legally belong to the entities, these assets and liabilities are included on the Group’s balance sheet.
EURm 31 Dec 2014 31 Dec 2013
AssetsInterest-bearing securities 9,971 3,417Shares 18,294 19,994Other assets 860 1,501Total assets 29,125 24,912
LiabilitiesDeposits and borrowings from the public 4,287 4,302Insurance contracts 11,025 9,508Investment contracts 13,813 11,102Total liabilities 29,125 24,912
G44 Investments, customer bearing the risk
EURm31 Dec
201431 Dec
2013
Repurchase agreementsInterest-bearing securities 12,121 9,544
Securities lending agreementsShares 30 31Total 12,151 9,575
Liabilities associated with the assets
EURm31 Dec
201431 Dec
2013
Repurchase agreementsDeposits by credit institutions 7,291 3,154Deposits and borrowings from the public 4,659 6,654
Securities lending agreementsDeposits by credit institutions 31 84Total 11,981 9,892Net 170 –317
Transferred assets that are not derecognised in their entirety and associated liabilitiesAll assets transferred continue to be recognised on the bal-ance sheet if Nordea is still exposed to changes in the fair value of the assets. This is the case for repurchase agreements and securities lending transactions.
Repurchase agreements are a form of collateralised bor-rowing where Nordea sells securities with an agreemement to repurchase them at a later date at a fixed price. The cash received is recognised as a deposit (liability). Securities deliv-ered under repurchase agreements are not derecognised from the balance sheet.
Securities lending transactions are transactions where Nor-dea lends securities it holds to a counterpart and receives a fee.
As both repurchase agreements and securities lending transactions result in that securities are returned to Nordea, all risks and rewards of the instruments transferred are retained by Nordea, although they are not available for Nor-dea during the period during which they are transferred. The counterparts in the transactions hold the securities as collat-eral, but have no recourse to other assets in Nordea.
The securities still reported on the balance sheet and the corresponding liabilities are measured at fair value.
G43 Transferred assets and obtained collaterals
Nordea obtains collaterals under reverse repurchase and securities borrowing agreements which, under the terms of the agreements, can be sold or repledged. The transactions are conducted under standard agreements employed by financial markets participants. Generally, the agreements require additional collateral to be provided if the value of the securities falls below a predetermined level. Under standard terms for most repurchase transactions, the recipient of col-lateral has an unrestricted right to sell or repledge it, subject to returning equivalent securities on settlement of the trans-actions. The fair value of the securities obtained as collateral under reverse repurchase and securities borrowing agree-ments are disclosed below.
EURm31 Dec
201431 Dec
2013
Reverse repurchase agreementsReceived collaterals which can be repledged or sold 47,165 44,908– of which repledged or sold 36,676 38,503
Securities borrowing agreementsReceived collaterals which can be repledged or sold 5,469 3,341– of which repledged or sold 2,969 3,341Total 52,634 48,249
Obtained collaterals which are permitted to be sold or repledged

Nordea Group – Other notes
Nordea Annual Report 2014150
G45 Maturity analysis for assets and liabilities
Expected maturity 31 Dec 2014 31 Dec 2013
Expected to be recovered or settled: Expected to be recovered or settled:
EURm NoteWithin 12
monthsAfter 12 months Total
Within 12 months
After 12 months Total
Cash and balances with central banks 31,067 — 31,067 33,529 — 33,529Loans to central banks G13 6,958 — 6,958 11,769 — 11,769Loans to credit institutions G13 10,608 1,609 12,217 9,782 961 10,743Loans to the public G13 119,462 228,623 348,085 147,611 194,840 342,451Interest-bearing securities G14 20,095 67,015 87,110 18,736 68,578 87,314Financial instruments pledged as collateral G15 3,603 8,548 12,151 6,905 2,670 9,575Shares G16 10,823 28,926 39,749 10,162 23,109 33,271Derivatives G17 14,966 90,153 105,119 7,854 63,138 70,992Fair value changes of the hedged items in portfolio hedge of interest rate risk G18 13 243 256 17 186 203Investments in associated undertakings G19 2 485 487 — 630 630Intangible assets G20 78 2,830 2,908 — 3,246 3,246Properties and equipment 13 496 509 11 420 431Investment properties G22 12 3,215 3,227 74 3,450 3,524Deferred tax assets G11 57 73 130 35 27 62Current tax assets 132 — 132 31 — 31Retirement benefit assets G32 0 42 42 1 320 321Other assets G23 17,553 28 17,581 11,046 18 11,064Prepaid expenses and accrued income G24 1,198 416 1,614 1,862 521 2,383Assets held for sale G42 — — — 8,895 — 8,895Total assets 236,640 432,702 669,342 268,320 362,114 630,434
Deposits by credit institutions G25 53,226 3,096 56,322 57,023 2,067 59,090Deposits and borrowings from the public G26 190,044 7,210 197,254 192,107 8,636 200,743Liabilities to policyholders G27 4,073 47,770 51,843 4,032 43,194 47,226Debt securities in issue G28 77,152 117,122 194,274 77,165 108,437 185,602Derivatives G17 13,557 83,783 97,340 8,457 57,467 65,924Fair value changes of the hedged items in portfolio hedge of interest rate risk G18 351 3,067 3,418 117 1,617 1,734Current tax liabilities 341 27 368 276 27 303Other liabilities G29 26,828 145 26,973 24,697 40 24,737Accrued expenses and prepaid income G30 1,909 34 1,943 3,616 61 3,677Deferred tax liabilities G11 145 838 983 134 801 935Provisions G31 215 90 305 60 117 177Retirement benefit liabilities G32 11 529 540 6 328 334Subordinated liabilities G33 — 7,942 7,942 360 6,185 6,545Liabilities held for sale G42 — — — 4,198 — 4,198Total liabilities 367,852 271,653 639,505 372,248 228,977 601,225

Other notes – Nordea Group
Nordea Annual Report 2014 151
G45 Maturity analysis for assets and liabilities, cont.
Contractual undiscounted cash flows
31 Dec 2014, EURmPayable on
demandMaximum
3 months 3–12 months 1–5 yearsMore than
5 years Total
Interest-bearing financial assets 21,618 117,658 52,743 154,129 245,499 591,647Non interest-bearing financial assets — — — — 162,746 162,746Non-financial assets — — — — 9,737 9,737Total assets 21,618 117,658 52,743 154,129 417,982 764,130
Interest-bearing financial liabilities 128,160 139,785 63,412 98,666 49,086 479,109Non interest-bearing financial liabilities — — — — 141,184 141,184Non-financial liabilities and equity — — — — 72,356 72,356Total liabilities and equity 128,160 139,785 63,412 98,666 262,626 692,649
Derivatives, cash inflow — 416,856 127,842 228,299 75,117 848,114Derivatives, cash outflow — 435,736 126,093 217,485 75,285 854,599Net exposure — –18,880 1,749 10,814 –168 –6,485
Exposure –106,542 –41,007 –8,920 66,277 155,188 64,996Cumulative exposure –106,542 –147,549 –156,469 –90,192 64,996 —
31 Dec 2013, EURmPayable on
demandMaximum
3 months 3–12 months 1–5 yearsMore than
5 years Total
Interest-bearing financial assets 25,973 119,862 44,907 163,641 277,298 631,681Non interest-bearing financial assets — — — — 117,167 117,167Non-financial assets — — — — 9,607 9,607Total assets 25,973 119,862 44,907 163,641 404,072 758,455
Interest-bearing financial liabilities 127,522 156,843 54,318 99,313 42,088 480,084Non interest-bearing financial liabilities — — — — 107,086 107,086Non-financial liabilities and equity — — — — 67,905 67,905Total liabilities and equity 127,522 156,843 54,318 99,313 217,079 655,075
Derivatives, cash inflow — 429,194 124,755 220,495 73,590 848,034Derivatives, cash outflow — 429,971 124,404 218,650 74,574 847,599Net exposure — –777 351 1,845 –984 435
Exposure –101,549 –37,758 –9,060 66,173 186,009 103,815Cumulative exposure –101,549 –139,307 –148,367 –82,194 103,815 —
The table is based on contractual maturities for the balance sheet items. For derivatives, the expected cash inflows and outflows are disclosed for both derivative assets and deriva-tive liabilities, as derivatives are managed on a net basis. In addition to the instruments on the balance sheet items, Nor-dea has credit commitments amounting to EUR 74,291m
(EUR 78,332m), which could be drawn on at any time. Nordea has also issued guarantees of EUR 19,838m (EUR 18,969m) which may lead to future cash outflows if certain events occur.
For further information about remaining maturity, see also the section “Risk, Liquidity and Capital management”.

Nordea Group – Other notes
Nordea Annual Report 2014152
Compensation and loans to key management personnelCompensation and loans to key management personnel are specified in Note G7.
Other related-party transactions Starting in March 2008 Nordea takes part in a guarantee con-sortium to support Norwegian Eksportfinans ASA in relation to its securities portfolio. Nordea owns 23% of the company with other owners being the Norwegian state and other Nordic banks. Nordea’s share of the negative fair value of the contract as of the balance sheet date amounts to approx. EUR 22m. The agreement’s expiring date corresponds with the maturity dates of the bonds included in the guarantee. The latest maturity is on 31 December 2023.
In 2009 Nordea entered into one transaction with a company under significant influence by a member of key management personnel, which is disclosed separately in this note due to the transaction’s significance for the related company. The related company has a credit limit of EUR 17m, of which EUR 4m was utilised as of 31 December 2014. The latest maturity is 31 December 2015, with the possibility of yearly prolongation after a new credit review. The transaction is made on the same criteria and terms as those for comparable transactions with companies of similar standing.
In addition, Nordea has issued an equity guarantee limited to SEK 610m in favor of a related party. The equity guarantee is time limited up to the sooner of the Annual General Meeting of the related party for calendar year 2015, and Nordea no longer holding an equity interest in the party.
Associated undertakings
Other related parties1
EURm31 Dec
201431 Dec
201331 Dec
201431 Dec
2013
AssetsLoans 594 464 — 0Interest-bearing securities 59 120 — —Derivatives 224 147 — —Investments in associ-ated undertakings 487 630 — —Total assets 1,364 1,361 — 0
LiabilitiesDeposits 215 142 36 109Debt securities in issue 0 11 — —Derivatives 154 34 — —Total liabilities 369 187 36 109Off balance2 6,212 8,086 — —
Associated undertakings
Other related parties1
EURm 2014 2013 2014 2013
Net interest income 9 9 — 0Net fee and commission income 5 6 1 1Net result from items at fair value –90 18 — —Other operating income — 0 — —Total operating expenses — 0 — —Profit before loan losses –76 33 1 1
G46 Related-party transactions
The information below is presented from a Nordea perspec-tive, meaning that the information shows the effect from related party transactions on the Nordea figures.
1) Shareholders with significant influence and close family members to key manage-ment personell in Nordea Group as well as companies significantly influenced by key management personnel or by close family members to key management per-sonnel in Nordea Group are considered to be related parties to Nordea. Included in this group of related parties are Sampo Oyj and Aegon Asset Management. If trans-actions with related companies are made in Nordea’s and the related companies’ ordinary course of business and on the same criteria and terms as those for compa-rable transactions with companies of similar standing, and if they did not involve more than normal risktaking, the transactions are not included in the table.
2) Including nominal values on derivatives.

Other notes – Nordea Group
Nordea Annual Report 2014 153
Credit risk management and credit risk analysis is described in the Risk, Liquidity and Capital management section of the Board of Directors´ Report. Additional information on credit risk is also disclosed in the Capital and Risk management Report (Pillar III) 2014, which is available on www.nordea.com. Much of the information in this note is collected from the Pillar III report in order to fulfil the disclosure require-ment regarding credit risk in the Annual report.
The Pillar III report contains the disclosures required by the Capital Requirements Regulation (CRR). The Pillar III dis-closure is aligned to how Nordea manages credit risk and is believed to be the best way to explain the credit risk expo-sures in Nordea. Credit risk exposures occur in different forms and are divided into the following types:
Exposure types, EURm31 Dec
201431 Dec
2013
On-balance sheet items 404,720 412,850Off-balance sheet items 47,191 46,351Securities financing 4,667 2,196Derivatives 30,992 18,158Exposure At Default (EAD) 487,570 479,555
Tables presented in this note, containing exposure, are pre-sented as Exposure At Default (EAD). EAD is the exposure after applying credit conversion factors (CCF).
Link between credit risk exposure and the balance sheetThis section discloses the link between the loan portfolio as defined by accounting standards and exposure as defined in CRR. The main differences are outlined in this section to illustrate the link between the different reporting methods. Original exposure is the exposure before taking into account substitution effects stemming from credit risk mitigation, credit conversion factors (CCFs) for off-balance sheet expo-sure and allowances within the standardised approach. In this note, however, exposure is defined as exposure at default (EAD) for IRB exposure and exposure value for standardised exposure, unless otherwise stated. In accordance with the CRR, credit risk exposure presented in this note is divided between exposure classes where each exposure class is divided into exposure types as follows:
amounts of credit facilities).
and securities lending).
G47 Credit risk disclosures
Items presented in other parts of the Annual Report, are divided as follows (in accordance with the accounting standards):
credit institutions, loans to the public, reversed repurchase agreements, positive fair value for derivatives and interest-bearing securities).
lines of credit).
The table below shows the link between the CRR credit risk exposure and items presented in the Annual Report.
On-balance sheet itemsThe following items have been excluded from the balance sheet, when calculating on-balance exposure in accordance with the CRD:
-tain interest-bearing securities and pledged instruments.
-tions are either included in the calculation of market risk in the trading book or reported as separate exposure types (derivatives or securities financing).
Off-balance sheet itemsThe following off-balance sheet items specified in the Annual Report are excluded when off-balance exposure is calculated in accordance with the CRR:
assets pledged” (apart from leasing). These transactions are reported as securities financing (i.e. a separate exposure type).
Derivatives and securities financingThe fair values of derivatives are recognised on the balance sheet, while nominal amounts on derivatives are reported off-balance in accordance with accounting standards. However, in the CRR, the derivatives and securities financing are reported as separate exposure types. Also, repurchase agree-ments and securities lending/borrowing transactions are on the balance sheet calculated based on nominal value. In the CRR calculations these exposure types are determined net of the collateral.

Nordea Group – Other notes
Nordea Annual Report 2014154
G47 Credit risk disclosures
31 Dec 2014, EURmOriginal
exposure
Items related to
market risk
Repos, derivatives,
securities lending
Life insurance
operations OtherBalance
sheet
Cash and balances with central banks 31,067 — — — — 31,067
Loans to credit institutions and central banks 14,030 — 4,822 326 –3 19,175Loans to the public 300,926 — 49,515 — –2,356 348,085Interest-bearing securities and pledged instruments 53,432 24,181 — 21,648 — 99,261Derivatives1 — — 104,999 120 — 105,119Intangible assets — — — 324 2,584 2,908Other assets and prepaid expenses 6,301 25,144 91 32,896 –705 63,727Total assets 405,756 49,325 159,427 55,314 –480 669,342Exposure at default2 404,720
1) Derivatives are included in banking and trading books, but not at book values. Counterparty risk in trading derivatives are included in the credit risk. 2) The on-balance exposure have a CCF of 100% but can still have a lower EAD due to provisions in the standardised approach, that are deducted from the original
exposure when calculating EAD.
31 Dec 2013, EURmOriginal
exposure
Items related to
market risk
Repos, derivatives,
securities lending
Life insurance
operations Other
Balance sheet
restate-ment3
Balance sheet
Cash and balances with central banks 34,082 — — 1 — –554 33,529Loans to credit institutions and central banks 15,421 — 6,605 546 17 –77 22,512
Loans to the public 307,207 4,388 39,159 — –2,159 –6,144 342,451Interest-bearing securities and pledged instruments 52,042 25,523 — 20,858 — –1,534 96,889Derivatives1 — — 70,840 154 — –2 70,992Intangible assets — — — 324 2,987 –65 3,246Other assets and prepaid expenses 5,347 18,632 65 28,009 386 8,376 60,815Total assets 414,099 48,543 116,669 49,892 1,231 0 630,434Exposure at default2 412,850
1) Derivatives are included in banking and trading books, but not at book values. Counterparty risk in trading derivatives are included in the credit risk. 2) The on-balance exposure have a CCF of 100% but can still have a lower EAD due to provisions in the standardised approach, that are deducted from the original exposure when
calculating EAD.3) Assets held for sale are disclosed separately in the balance sheet but are included line by line in original exposure.
On-balance sheet items
Off-balance sheet items
31 Dec 2014, EURm
Credit risk in Basel II
calculation
Life insurance
operations
Included in derivatives
and securities financing
Off- balance
sheet
Contingent liabilities 21,985 32 — 22,017Commitments 75,032 875 28 75,935
Total 97,017 907 28 97,952
31 Dec 2014, EURm
Credit risk in Basel II
calculation
Items not included in
accountsOriginal
exposure
Average conversion
factor
Exposure at default
EAD
Credit facilities 50,777 437 51,214 48% 24,626Checking accounts 18,161 3,960 22,121 50% 11,065Loan commitments 6,091 7,246 13,337 36% 4,858Guarantees 20,760 1 20,761 31% 6,335Other 1,228 32 1,260 24% 307Total 97,017 11,676 108,693 47,191

Other notes – Nordea Group
Nordea Annual Report 2014 155
G47 Credit risk disclosures
31 Dec 2013, EURm
Credit risk in Basel II
calculation
Life insurance
operations
Included in derivatives
and securities financing
Off- balance
sheet
Contingent liabilities 20,824 46 — 20,870Commitments 79,012 547 40 79,599Total 99,836 593 40 100,469
31 Dec 2013, EURm
Credit risk in Basel II
calculation
Items not included in
accountsOriginal
exposure
Average conversion
factor
Exposure at default
EAD
Credit facilities 51,607 68 51,675 47% 24,146Checking accounts 18,975 4,400 23,375 23% 5,346Loan commitments 8,294 7,129 15,423 31% 4,843Guarantees 19,681 2 19,683 59% 11,669Other 1,279 34 1,313 26% 347Total 99,836 11,633 111,469 46,351
31 Dec 2014, EURmOn-balance sheet items
Off-balance sheet items
Securities financing Derivatives
Total exposure
Government, local authorities and central banks 67,781 1,502 932 5,338 75,553Institutions 37,940 968 2,751 9,994 51,653Corporate 126,683 31,251 751 15,078 173,763Retail 163,051 13,263 — 141 176,455Other 9,265 207 233 441 10,146Total exposure 404,720 47,191 4,667 30,992 487,570
31 Dec 2013, EURmOn-balance sheet items
Off-balance sheet items
Securities financing Derivatives
Total exposure
Government, local authorities and central banks 78,719 1,951 147 3,232 84,049Institutions 34,694 1,255 1,218 5,667 42,834Corporate 127,638 34,044 739 8,234 170,655Retail 158,228 9,077 1 96 167,402Other 13,571 24 91 929 14,615Total exposure 412,850 46,351 2,196 18,158 479,555
Exposure classes split by exposure type As of year-end 2014, 80% of the total credit risk exposure was calculated using the IRB approach. The main part of the exposure is within the IRB corporate and IRB retail portfolios.
During 2014, total exposures increased primarily due to higher exposures in the retail and institutions portfolios. Derivative exposures, especially within the corporate portfolio, signifi-cantly increased during the year due to market movements.
Exposure split by geography and exposure classes Nordea is geographically well diversified and as of end 2014, no market accounts for more than 26% of the total exposure. The exposure in Sweden and Finland represents 23% and 17% of the total exposure in the Group respectively, while Denmark accounts for 26% and Norway 14%. Exposures in the US con-stitute 7% of the total portfolio, whereas Russia’s impact remains at 1% of the total exposures.

Nordea Group – Other notes
Nordea Annual Report 2014156
EURm 31 Dec 2014 31 Dec 2013
Construction and engineering 5,179 5,805Consumer durables (cars, appliances etc) 4,713 4,803Consumer staples (food, agriculture etc) 14,447 13,735Energy (oil, gas etc) 4,745 4,879Health care and pharmaceuticals 2,141 2,070Industrial capital goods 4,250 5,242Industrial commercial services 14,413 15,389IT software, hardware and services 2,226 1,881Media and leisure 2,861 3,188Metals and mining materials 1,098 1,038Other financial institutions 68,383 54,964Other materials (chemical, building materials etc) 8,180 8,491Other, public and organisations 264,218 268,296Paper and forest material 2,718 3,056Real estate management and investment 47,149 44,526Retail trade 13,378 12,657Shipping and offshore 12,160 12,790Telecommunication equipment 261 468Telecommunication operators 1,742 2,019Transportation 4,566 5,121Utilities distribution and production 8,742 9,137Total exposure 487,570 479,555
G47 Credit risk disclosures
Exposure split by industry group In the table below, the total exposure is split by industry. The industry breakdown mainly follows the Global Industries Classification Standard (GICS) and is based on NACE codes (i.e. statistical classification codes of economic activities in the European community).
The Other, public and organisations is the largest industry which together with Other financial institutions and Real estate management and investment industries are the only ones that
account for more than 3% of the total exposure of EUR 488bn. During the year, exposures to Other, public and organisations decreased the most in nominal terms, while Telecommunication equipment saw the largest relative decrease. The largest nominal and relative increase occurred in Other financial institutions industry.
1) Including exposures secured by real estate.
31 Dec 2013, EURmNordic
countries– of which Denmark
– of which Finland
– of which Norway
– of which Sweden
Baltic countries Poland Russia Other Total
Government, local authorities and central banks 55,891 15,252 19,862 6,161 14,616 729 1,118 207 26,104 84,049Institutions 38,759 6,306 14,862 5,957 11,634 148 971 299 2,657 42,834Corporate 148,606 37,447 37,839 33,619 39,701 5,568 1,903 4,324 10,254 170,655Retail 166,080 52,002 36,040 28,719 49,319 963 211 64 84 167,402Other1 7,272 1,438 2,830 765 2,239 2,384 4,005 464 490 14,615Total exposure 416,608 112,445 111,433 75,221 117,509 9,792 8,208 5,358 39,589 479,555
31 Dec 2014, EURmNordic
countries– of which Denmark
– of which Finland
– of which Norway
– of which Sweden
Baltic countries Russia US Other Total
Government, local authorities and central banks 36,204 11,294 13,261 3,222 8,427 1,254 498 28,514 9,083 75,553Institutions 33,668 16,557 2,853 4,693 9,565 179 404 1,406 15,996 51,653Corporate 140,586 44,457 26,265 30,940 38,924 5,501 4,505 1,970 21,201 173,763Retail 170,596 53,023 38,982 27,986 50,605 3,237 343 4 2,275 176,455Other1 6,283 1,059 1,402 979 2,843 252 111 145 3,355 10,146Total exposure 387,337 126,390 82,763 67,820 110,364 10,423 5,861 32,039 51,910 487,570

Other notes – Nordea Group
Nordea Annual Report 2014 157
Exposure secured by collaterals, guarantees and credit derivatives The guarantees used as credit risk mitigation are to a large extent issued by central and regional governments in the Nordic countries. Banks and insurance companies are also important guarantors of credit risk. Only eligible providers of guarantees and credit derivatives can be recognised in the standardised and IRB approach for credit risk. All cen-tral governments, regional governments and institutions are eligible as well as some multinational development banks and international organisations. Corporate guarantees that have a credit assessment by an ECAI or in the case of insti-
tutions calculating risk wighted exposure amounts and expected loss amount under the IRB approach and are inter-nally rated by the institutions are also eligible.
Central governments and municipalities guarantee approximately 53% of the total guaranteed exposure. Expo-sure guarantee by these guarantors has an average risk weight of 0%. 2% of the total guaranteed exposure is guar-anteed by IRB institutions. The remainder is guaranteed by IRB corporate guarantors. Credit derivatives are only used as credit risk protection to a very limited extent since the credit portfolio is considered to be well diversified.
G47 Credit risk disclosures
31 Dec 2014, EURmOriginal
exposure EAD
– of which secured by guarantees and credit
derivatives
– of which secured by
collateral
Government, local authorities and central banks 73,966 75,553 501 —Institutions 54,139 51,653 524 543Corporate 224,415 173,763 12,050 63,637Retail 187,169 176,455 1,706 136,550Other1 10,640 10,146 16 42Total exposure 550,329 487,570 14,797 200,772
31 Dec 2013, EURmOriginal
exposure EAD
– of which secured by guarantees and credit
derivatives
– of which secured by
collateral
Government, local authorities and central banks 81,444 84,049 477 1Institutions 45,067 42,834 703 350Corporate 225,782 170,655 8,482 65,176Retail 178,595 167,402 2,786 132,753Other1 15,247 14,615 4 7,360Total exposure 546,135 479,555 12,452 205,640
31 Dec2014
31 Dec2013
Financial Collateral 1.4% 1.4%Receivables 0.9% 1.1%Residential Real Estate 71.9% 72.6%Commercial Real Estate 17.5% 18.5%Other Physical Collateral 8.3% 6.4%Total 100.0% 100.0%
Collateral distribution The table below presents the distribution of collateral used in the capital adequacy calculation process. The table shows real estate to constitute a major share of eligible collateral items in relative terms; real estate is commonly used as collateral for credit risk mitigation purposes. The relative share of other
physical collateral increased during the year while real estate collaterals decreased in relative terms. There is no certain concentration of real estate collateral to any particular region within the Nordic and Baltic countries. Other physical collat-eral consist mainly of ships.
1) Including exposures secured by real estate.

Nordea Group – Other notes
Nordea Annual Report 2014158
31 Dec 2014 31 Dec 2013
Nominal, EURmBought
protectionSold
protectionBought
protectionSold
protection
CDOs, gross 1,204 2,155 1,266 1,985Hedged exposures 1,005 1,005 965 966
CDOs, net2 1993 1,1504 3013 1,0194
– of which Equity 20 355 57 328– of which Mezzanine 98 512 108 440– of which Senior 81 283 136 251
1) First-to-Default swaps are not classified as CDOs and are therefore not included in the table. Net bought protection amounts to EUR 47m (EUR 47m) and net sold protection to EUR 46m (EUR 18m). Both bought and sold protection are, to the predominant part, investment grade.
2) Net exposure disregards exposure where tranches are completely identical in terms of reference pool attachment, detachment, maturity and currency.3) Of which investment grade EUR 54m (EUR 150m) and sub investment grade EUR 145m (EUR 151m).4) Of which investment grade EUR 457m (EUR 401m) and sub investment grade EUR 600m (EUR 302m) and not rated EUR 93m (EUR 316m).
EURm 31 Dec 2014 31 Dec 2013
Current assets, carrying amount:Land and buildings 90 123Shares and other participations 26 25Other assets 2 3Total 118 151
1) In accordance with Nordea’s policy for taking over assets for protection of claims, which is in compliance with the local Banking Business Acts, wherever Nordea is located. Assets, used as collateral for the loan, are generally taken over when the customer is not able to fulfil its obligations to Nordea. The assets taken over are at the latest, disposed when full recovery is reached.
G47 Credit risk disclosures
31 Dec 2014 31 Dec 2013
Retail mortgage exposure EURbn % EURbn %
<50% 98.2 77 99.2 7750–70% 20.8 16 20.9 1670–80% 5.4 4 5.5 480–90% 2.1 2 2.1 2>90% 1.1 1 1.2 1Total 127.6 100 128.9 100
Collateralised Debt Obligations (CDO) – Exposure1
Nordea acts as an intermediary in the credit derivatives mar-ket, especially in Nordic names. Nordea also uses credit derivatives to hedge positions in corporate bonds and synte-hetic CDOs. When Nordea sells protection in a CDO transac-tion, it carries the risk of losses in the reference portfolio if a credit event occurs. When Nordea buys protection in a CDO transaction, any losses in the reference portfolio triggered by
a credit event are carried by the seller of protection.Credit derivatives transactions create counterparty credit
risk in similar manner to other derivative transactions. Coun-terparties in these transactions are typically subject to a financial collateral agreement, where the exposure is covered daily by collateral placements. CDO valuations are subject to fair value adjustments for model risk. These fair value adjust-ments are recognised in the income statement.
Loan-to-value distribution A common way to analyse the value of the collateral is to meas-ure the loan to value (LTV) ratio, i.e. the credit extended divided by the market value of the collateral pledged. In the
table below, the retail mortgage exposures are distributed by LTV range up to the top LTV bucket based on the LTV ratio. In 2014, the retail mortgage exposure decreased in the LTV buck-ets, with relative share of each LTV bucket remaining stable.
Assets taken over for protection of claims1

Other notes – Nordea Group
Nordea Annual Report 2014 159
G47 Credit risk disclosures
31 Dec 2014 31 Dec 2013
EURmCorporate customers
Household customers
Corporate customers
Household customers
6–30 days 375 838 675 92231–60 days 125 222 317 30561–90 days 70 99 66 123>90 days 58 99 150 119Total 628 1,258 1,209 1,470Past due not impaired loans divided by loans to the public after allowances, % 0.33 0.82 0.66 0.96
31 Dec 2014 31 Dec 2013
Size in EURmLoans
EURbn %Loans
EURbn %
0–10 89.5 48 83.2 4510–50 47.7 25 46.6 2550–100 19.2 10 18.2 10100–250 20.7 11 23.0 13250–500 7.1 4 9.8 5500– 4.1 2 2.9 2Total 188.3 100 183.6 100
Past due loans, excluding impaired loans The table below shows loans past due 6 days or more that are not considered impaired split by corporate and household customers. Past due loans to corporate customers that are not
Loans to corporate customers, by size of loan The distribution of loans to corporate by size of loans, seen in the table below, shows a high degree of diversification where
considered impaired were at end of 2014 EUR 628m down from EUR 1,209m one year ago, while past due loans for household customers decreased to EUR 1,258m (EUR 1,470m).
approximately 73% (71%) of the corporate volume represents loans up to EUR 50m per customer.
Interest-bearing securities For more information about credit risk related to interest-bearing securities, see Note G14 where the carrying amount of interest-bearing securities is split on different types of counterparties.

Nordea Group – Other notes
Nordea Annual Report 2014160
Structured entities are entities designed so that voting or simi-lar rights are not the dominant factor in deciding who controls the entity. It normally has restricted activities with a narrow and well defined objective. If Nordea controls such an entity, it is consolidated.
Consolidated structured entitiesThe Viking ABCP Conduit (Viking) has been established with the purpose of supporting trade receivable or accounts payable securitisations to core Nordic customers. The SPEs purchase trade receivables from the approved sellers and fund the pur-chases either by issuing Commercial Papers (CP) via the estab-lished Asset Backed Commercial Papers programme or by drawing funds on the liquidity facilities available. Nordea has provided liquidity facilities of maximum EUR 1,430m (EUR 1,646m) and at year-end EUR 1,103m (EUR 1,369) where uti-lised. Total assets in the conduit were EUR 1,177m (EUR 1,428m) as per year-end. The SPE is consolidated as it is closely linked to the activities within Nordea. Also, Nordea is exposed to credit risk through the liquidity facility. There are no signifi-cant restrictions on repayment of loans from Viking apart from that the payments are dependent on the pace in which Viking realises its assets.
Kalmar Structured Finance A/S was established to allow customers to invest instructured products in the global credit markets. The SPE enters into Credit Default Swaps (CDS) and hereby acquires a credit risk on an underlying portfolio of names (like corporate names) and at the same time the SPE issues Credit Linked Notes (CLN) with a similar credit risk that reflects the terms in the CDSs. Nordea is the counterpart in the derivative transactions. The total notional of outstand-ing CLNs in this category was EUR 1m (EUR 1m) at year-end. Nordea holds CLNs issued by the SPE as part of offering a secondary market for the notes. The investment amounted to EUR 1m (EUR 1m) at year-end. Nordea has during 2014 established a new structured entity, AR Finance. The entity invests in notes backed by trade receivables. Nordea has provided liquidity facilities of maximum EUR 90m and at year-end 2014 EUR 75m were uti-lised. The entity holds assets of EUR 80m as per year-end.
Unconsolidated structured entitiesFor structured entities in which Nordea has an interest but do not control it, disclosures are provided. To be considered to have an interest in such an entity, Nordea must be exposed to variability in returns on the investment in the structured entity. Investment funds are the only interest in unconsoli-dated structured entities Nordea currently holds. Variability in returns is assessed based on both fees received and revaluation of holdings in the funds.
There are several different products where Nordea invests in investment funds:
a) on behalf of policyholders in Nordea Life & Pensionsb) on behalf of depositors where the return is based the
investmentc) to hedge exposures in structured products issued to cus-
tomers.d) illiquid investments in private equity and credit funds
As Nordea is exposed to variability in returns on a gross basis, information about these funds are disclosed although the net exposure is considerably less. Any change in value on investment funds acquired on behalf of policyholders and depositors where the policyholder/depositor stands the
G48 Interests in structured entities
investment risk are reflected in the value of the related liabil-ity and the maximum net exposure to losses are zero. The change in value on investment funds held on behalf of other policyholders are to a large extent passed on to the policy-holders, but as Nordea has issued guarantees in some of these products, Nordea is exposed to the changes in value.
Investment funds acquired to hedge exposures in struc-tured products reduce the exposures and to the extent hedges are effective, Nordea is not exposed to changes in value. The maximum loss on these funds is estimated to EUR 6m, net of hedges.
Investments in illiquid private equity and credit funds are an integrated part of managing balance sheet risks in Nordea. The maximum loss on these funds is estimated to EUR 84m, equal to the investment in the funds.
Nordea’s interests in unconsolidated structured entities and any related liability are disclosed in the table below.
EURm 31 Dec 2014
Assets, carrying amount:Shares 27,740Total assets 27,740
Liabilities, carrying amount:Deposits and borrowings from the public 1,386Liabilities to policy holders 25,287Derivatives 105Total liabilities 26,778
Off balance, nominal amount: Loan commitments 29
Nordea holds approximately 2,500 different funds which are classified as unconsolidated structured entities, of which approximately 400 are managed by Nordea. These have dif-ferent investment mandates and risk appetites, ranging from low risk government bond funds to high risk leveraged equity funds. Total assets in funds managed by Nordea amount to EUR 114bn. All funds are financed by deposits from the hold-ers of fund units. The total assets investment funds not man-aged by Nordea are not considered meaningful for the pur-pose of understanding the related risks and is thus not disclosed.
Nordea has not sponsored any unconsolidated structured entity in which Nordea do not currently have an interest.

Other notes – Nordea Group
Nordea Annual Report 2014 161
G49 Country by country reporting
In accordance with the requirements under FFFS 2008:25, the table below presents for each country where Nordea is estab-lished, i.e. where Nordea has a physical presence, information about the businesses, the geografical area, averages number of employees, total operating income, operating profit and income tax expense. Nordea is considered to have physical
presence in a country if Nordea has a subsidiary, associated undertaking or branch in that country. The amounts pre-sented in the table below relate to continuing operations, for discontinuing operations see Note G42. Nordea has not received any significant government subsidies.
2014 2013
Country Business1Geographi-cal area
Average number of
employees4
Total operating
income2, EURm
Operating profit, EURm
Income tax
expense, EURm
Average number of
employees4
Total operating
income2, EURm
Operating profit, EURm
Income tax
expense, EURm
Denmark RB, WB, AM, LP Denmark 8,255 2,974 1,130 –161 8,251 2,621 742 –165
Finland RB, WB, AM, LP Finland 6,971 2,197 1,136 –222 7,116 2,011 1,048 –277
Sweden RB, WB, AM, LP Sweden 6,963 2,963 706 –205 6,881 3,099 924 –210
Norway RB, WB, AM, LP Norway 3,238 1,732 900 –238 3,280 1,781 924 –251
Russia WB Russia 1,418 203 92 –20 1,454 193 92 –19
Poland Other Poland 692 –2 –23 4 503 32 13 –3
Estonia RB, WB, LP Estonia 486 61 27 –3 468 48 24 –7
Latvia RB, WB Latvia 431 64 –49 –3 443 68 14 –1
Luxembourg AM, LP Luxembourg 373 252 143 –42 376 228 122 –33
Lithuania RB, WB, LP Lithuania 351 52 21 –4 340 42 12 –2
United States RB, WB, AM, LP New York 118 134 94 –45 113 129 90 –32
United Kingdom RB, WB, AM, LP London 75 103 71 0 69 84 67 0
Singapore WB Singapore 85 51 50 –8 77 53 19 –1
Germany WB, AM Frankfurt 57 37 23 –5 55 35 21 –7
Switzerland AM Zürich 30 13 2 0 29 14 1 0
China WB Shanghai 28 6 1 –1 24 6 3 –1
Brazil WB Sao Paolo 4 1 0 0 4 1 0 0
Elimina-tions3 — –617 — — — –554 — —
Total 29,575 10,224 4,324 –953 29,483 9,891 4,116 –1,009
1) RB=Retail banking, WB=Wholesale banking, AM=Asset management, LP= Life and pension.2) Total operating income presented in this table is split on countries based on where Nordea has a physical presence, i.e. where Nordea has a subsidiary, associated undertaking
or branch, while total operating profit presented in Note G2 is split on countries based on the location of the customers´ operations.3) Eliminations of transactions consist mainly of intra-group IT-services.4) The average number of employees in discontinued operations is 644 (1,951).

Nordea Group – Other notes
Nordea Annual Report 2014162
G49 Country by country reporting, cont.
In accordance with the requirements under FFFS 2008:25 Nordea also discloses the names of the subsidiaries, associated undertak-ings and branches for each country where Nordea is established. These disclosures are presented in the table below, in the table “Specification of group undertakings 31 December 2014” in Note G38 and in the last table in Note G19.
Denmark Nordea Liv & Pension, Livforsikringsselskab A/S
Finland Nordea Life Assurance Finland Ltd
Sweden Nordea Life Holding AB Nordea Livförsäkring Sverige AB (publ)
Norway Nordea Liv Holding Norge ASLivforsikringsselskapet Nordea Liv Norge AS
Estonia Nordea Bank AB Eesti filiaal Latvia Nordea Bank AB Latvijas filiale
Lithuania Nordea Bank AB Lietuvos skyrius

Financial statements – Parent company
Nordea Annual Report 2014 163
Financial statements, Parent company – Contents Income statement 164Statement of comprehensive income 164Balance sheet 165Statement of changes in equity 166Cash flow statement 1685 year overview 170Ratios and key figures 171
Notes to the financial statements Accounting policiesP1 Accounting policies 172 Notes to the income statementP2 Segment reporting 173P3 Net interest income 173P4 Net fee and commission income 174P5 Net result from items at fair value 174P6 Dividends 174P7 Other operating income 174 P8 Staff costs 175 P9 Other expenses 176 P10 Depreciation, amortisation and impairment
charges of tangible and intangible assets 176 P11 Net loan losses 176 P12 Appropriations 177P 13 Taxes 177 Notes to the balance sheet and memorandum items P14 Treasury bills 178 P15 Loans and impairment 178 P16 Interest-bearing securities 179 P17 Financial instruments pledged as collateral 179 P18 Shares 179P19 Derivatives and hedge accounting 180 P20 Fair value changes of the hedged items in
portfolio hedge of interest rate risk 182 P21 Investments in group undertakings 182 P22 Investments in associated undertakings 183 P23 Intangible assets 184 P24 Properties and equipment 185 P25 Other assets 185P 26 Prepaid expenses and accrued income 186 P27 Deposits by credit institutions 186P28 Deposits and borrowings from the public 186P29 Debt securities in issue 186 P30 Other liabilities 186 P31 Accrued expenses and prepaid income 186 P32 Provisions 186 P33 Retirement benefit obligations 187 P34 Subordinated liabilities 187 P35 Untaxed reserves 187P36 Assets pledged as security for own liabilities 188P 37 Other assets pledged 188 P38 Contingent liabilities 188 P39 Commitments 188
Other notes P40 Capital adequacy 189 P41 Classification of financial instruments 197 P42 Assets and liabilities at fair value 199P43 Financial instruments set off on balance or subject to netting agreements 204 P44 Assets and liabilities in foreign currencies 205 P45 Transferred assets and obtained collaterals 205 P46 Maturity analyses for assets and liabilities 206 P47 Related-party transactions 208

Parent company – Financial statements
Nordea Annual Report 2014164
EURm Note 2014 2013
Operating incomeInterest income 1,942 2,140Interest expense –1,293 – 1,499Net interest income P3 649 641
Fee and commission income 1,093 1,259Fee and commission expense –273 –250Net fee and commission income P4 820 1,009
Net result from items at fair value P5 186 131Dividends P6 2,333 1,827Other operating income P7 975 674Total operating income 4,963 4,282
Operating expensesGeneral administrative expenses: Staff costs P8 –1,070 –982 Other expenses P9 –904 –1,018Depreciation, amortisation and impairment charges of tangible and intangible assets P10, P23, P24 –261 –109Total operating expenses –2,235 –2,109
Profit before loan losses 2,728 2,173
Net loan losses P11 –98 –124Impairment of securities held as financial non-current assets P21 –15 –4Operating profit 2,615 2,045
Appropriations P12 –1 102Income tax expense P13 –189 –192Net profit for the year 2,425 1,955
Income statement, Parent company
Statement of comprehensive incomeEURm 2014 2013
Net profit for the year 2,425 1,955
Items that may be reclassified subsequently to the income statementAvailable for sale investments:1
Valuation gains/losses during the year 6 4 Tax on valuation gains/losses during the year –1 –1 Transferred to the income statement during the year 0 2 Tax on transfers to the income statement during the year 0 0Cash flow hedges: Valuation gains/losses during the year 140 562 Tax on valuation gains/losses during the year –31 –124 Transferred to the income statement during the year –139 –586 Tax on transfers to the income statement during the year 31 129Items that may be not reclassified subsequently to the income statementDefined benefit plans: Remeasurement of benefit plans during the year -11 — Tax on remeasurement of benefit plans during the year 2 —Other comprehensive income, net of tax -3 –14Total comprehensive income 2,422 1,941
1) Valuation gains/losses related to hedged risks under fair value hedge accounting are accounted for directly in the income statement.

Financial statements – Parent company
Nordea Annual Report 2014 165
Balance sheet, Parent companyEURm Note
31 Dec 2014
31 Dec 2013
Assets
Cash and balances with central banks 931 45Treasury bills P14 5,035 4,952Loans to credit institutions P15 86,704 80,918Loans to the public P15 39,809 34,155Interest-bearing securities P16 11,321 11,128Financial instruments pledged as collateral P17 43 737Shares P18 6,061 5,351Derivatives P19 5,981 4,219Fair value changes of the hedged items in portfolio hedge of interest rate risk P20 1 –11Investments in group undertakings P21 16,986 17,723Investments in associated undertakings P22 7 7Intangible assets P23 758 729Properties and equipment P24 119 118Deferred tax assets P13 14 28Current tax assets 50 0Other assets P25 3,727 2,533Prepaid expenses and accrued income P26 884 1,291Total assets 178,431 163,923 Liabilities Deposits by credit institutions P27 27,452 17,500Deposits and borrowings from the public P28 49,367 47,531Debt securities in issue P29 63,280 62,961Derivatives P19 4,653 3,627Fair value changes of the hedged items in portfolio hedge of interest rate risk P20 1,368 715Current tax liabilities 4 11Other liabilities P30 2,895 4,173Accrued expenses and prepaid income P31 642 1,150Deferred tax liabilities P13 0 10Provisions P32 206 184Retirement benefit liabilities P33 171 166Subordinated liabilities P34 7,728 5,971Total liabilities 157,766 143,999
Untaxed reserves P35 4 3
Equity
Share capital 4,050 4,050Share premium reserve 1,080 1,080Other reserves –5 –2Retained earnings 15,536 14,793Total equity 20,661 19,921Total liabilities and equity 178,431 163,923
Assets pledged as security for own liabilities P36 3,946 2,454Other assets pledged P37 9,238 7,033Contingent liabilities P38 71,103 70,385Commitments P39 23,824 26,713

Parent company – Financial statements
Nordea Annual Report 2014166
Statement of changes in equity, Parent company
Restricted equity Unrestricted equity1
Other reserves:
EURmShare
capital
Share premium
reserveCash flow
hedges
Available for sale invest-ments
Defined benefit
plansRetained earnings
Total equity
Balance at 1 Jan 2014 4,050 1,080 –38 36 — 14,793 19,921Net profit for the year — — — — — 2,425 2,425
Items that may be reclassified subsequently to the income statementAvailable for sale investments: Valuation gains/losses during the year — — — 6 — — 6 Tax on valuation gains/losses during the year — — — –1 — — –1 Transferred to the income statement during the year — — — 0 — — 0 Tax on transfers to the income statement during the year — — — 0 — — 0Cash flow hedges: Valuation gains/losses during the year — — 140 — — — 140 Tax on valuation gains/losses during the year — — –31 — — — –31 Transferred to the income statement during the year — — –139 — — — –139 Tax on transfers to the income statement during the year — — 31 — — — 31
Items that may be not reclassified subsequently to the income statementDefined benefit plans Remeasurement of benefit plans during thee year — — — — –11 — –11 Tax on remeasurement of benefit plans during the year — — — — 2 — 2
Other comprehensive income, net of tax — — 1 5 –9 — –3Total comprehensive income — — 1 5 –9 2,425 2,422
Share-based payments — — — — — 15 15
Dividend for 2013 — — — — — –1,733 –1,733
Divestment of own shares2 — — — — — 34 34 Other changes in equity — — — — — 2 2Balance at 31 Dec 2014 4,050 1,080 –37 41 –9 15,536 20,661
1) Apart from retained earnings, unrestricted equity consists of a free fund to the amount of EUR 2,762m.2) Refers to the change in the holding of own shares related to Long tem Incentive Programme and trading portfolio. The number of own shares were 17.6 million.

Financial statements – Parent company
Nordea Annual Report 2014 167
Share capitalQuota value per share, EUR Total number of shares Share capital, EUR
Balance at 31 Dec 2013 1.0 4,049,951,919 4,049,951,919Balance at 31 Dec 2014 1.0 4,049,951,919 4,049,951,919
Dividends per shareFinal dividends are not accounted for until they have been ratified at the Annual General Meeting (AGM). At the AGM on 19 March 2015, a dividend in respect of 2014 of EUR 0.62 per share (2013 actual dividend EUR 0.43 per share) amount-
ing to a total of EUR 2,501,100,294 (2013 actual: EUR 1,733,603,282) is to be proposed. The financial statements for the year ended 31 December 2014 do not reflect this resolution, which will be accounted for in equity as an appropriation of retained earnings in the year ending 31 December 2015.
Restricted equity Unrestricted equity1
Other reserves:
EURmShare
capital
Share premium
reserveCash flow
hedges
Available for sale invest-ments
Defined benefit
plansRetained earnings
Total equity
Balance at 1 Jan 2013 4,050 1,080 –19 31 — 14,233 19,375Net profit for the year — — — — — 1,955 1,955
Items that may be reclassified subsequently to the income statementAvailable for sale investments: Valuation gains/losses during the year — — — 4 — — 4 Tax on valuation gains/losses during the year — — — –1 — — –1 Transferred to the income statement during the year — — — 2 — — 2 Tax on transfers to the income statement during the year — — — 0 — — 0Cash flow hedges: Valuation gains/losses during the year — — 562 — — — 562 Tax on valuation gains/losses during the year — — –124 — — — –124 Transferred to the income statement during the year — — –586 — — — –586 Tax on transfers to the income statement during the year — — 129 — — — 129
Items that may be not reclassified subsequently to the income statementDefined benefit plans: Remeasurement of benefit plans during the year — — — — — — — Tax on remeasurement of benifit plans during the year — — — — — — —Other comprehensive income, net of tax — — –19 5 — — –14Total comprehensive income — — –19 5 — 1,955 1,941Share-based payments — — — — — 15 15 Dividend for 2012 — — — — — –1,370 –1,370 Repurchases of own shares2 — — — — — –40 –40Balance at 31 Dec 2013 4,050 1,080 –38 36 — 14,793 19,921
1) Apart from retained earnings, unrestricted equity consists of a free fund to the amount of EUR 2,762m.2) Refers to the change in the holding of own shares related to Long tem Incentive Programme and trading portfolio. The number of own shares were 23.8 million.
Description of items in equity is included in Note G1 “Accounting policies”.

Parent company – Financial statements
Nordea Annual Report 2014168
Cash flow statement, Parent company
EURm 2014 2013
Operating activitiesOperating profit 2,615 2,045Adjustment for items not included in cash flow –655 –1,771Income taxes paid –232 –142Cash flow from operating activities before changes in operating assets and liabilities 1,728 132
Changes in operating assetsChange in treasury bills –58 9Change in loans to credit institutions –239 –19,476Change in loans to the public –5,809 1,915Change in interest-bearing securities –217 –78Change in financial assets pledged as collateral 694 –634Change in shares –704 –610Change in derivatives, net –63 297Change in other assets 561 –820
Changes in operating liabilitiesChange in deposits by credit institutions 9,941 –1,842Change in deposits and borrowings from the public 1,817 –2,732Change in debt securities in issue –10 14,676Change in other liabilities –1,279 4,025Cash flow from operating activities 6,362 –5,138
Investing activitiesShareholder’s contributions to group undertakings — –47Sale of business operations 626 17Sale of associated undertakings — 1Acquisition of properties and equipment –30 –28Sale of property and equipment 1 3Acquisition of intangible assets –258 –143Net divestments in debt securities, held to maturity 209 544Cash flow from investing activities 548 347
Financing activitiesIssued subordinated liabilities 1,224 —Amortised subordinated liabilities — –500Repurchase/divestment of own shares incl change in trading portfolio 34 –40Dividend paid –1,734 –1,370Cash flow from financing activities –476 –1,910Cash flow for the year 6,434 –6,701
Cash and cash equivalents at the beginning of year 1,599 8,300Cash and cash equivalents at the end of year 8,033 1,599Change 6,434 –6,701

Financial statements – Parent company
Nordea Annual Report 2014 169
Comments on the cash flow statementThe cash flow statement shows inflows and outflows of cash and cash equivalents during the year. Nordea’s cash flow has been prepared in accordance with the indirect method, whereby operating profit is adjusted for effects of non-cash transactions such as depreciation and loan losses. The cash flows are classified by operating, invest-ing and financing activities.
Operating activitiesOperating activities are the principal revenue-producing activities and cash flows are mainly derived from the operating profit for the year with adjustment for items not included in cash flow and income taxes paid. Adjustment for items not included in cash flow includes:
EURm 2014 2013
Depreciation 118 100Impairment charges 158 9Loan losses 122 144Unrealised gains/losses –281 914
Capital gains/losses (net) –280 –16Change in accruals and provisions 236 –307Anticipated dividends –645 –1,042Group contributions –1,109 –459Translation differences 386 –173Change in fair value of the hedged items, assets/liabilities (net) 641 –932Other –1 –9Total –655 –1,771
Changes in operating assets and liabilities consists of assets and liabilities that are part of normal business activities, such as loans, deposits and debt securities in issue. Changes in derivatives are reported net. Cash flow from operating activities includes interest pay-ments received and interest expenses paid with the following amounts:
EURm 2014 2013
Interest payments received 2,039 2,202Interest expenses paid 1,315 1,517
Investing activitiesInvesting activities include acquisitions and disposals of non-current assets, like property and equipment, intangi-ble and financial assets.
Financing activitiesFinancing activities are activities that result in changes in equity and subordinated liabilities, such as new issues of shares, dividends and issued/amortised subordinated liabilities.
Cash and cash equivalentsThe following items are included in Cash and cash equivalents:
EURm 31 Dec
2014 31 Dec
2013
Cash and balances with central banks 931 45Loans to credit institutions, payable on demand 7,102 1,554Total 8,033 1,599
Cash comprises legal tender and bank notes in foreign currencies. Balances with central banks consists of depos-its in accounts with central banks and postal giro systems under government authority, where the following condi-tions are fulfilled;– the central bank or the postal giro system is domiciled in
the country where the institution is established– the balance on the account is readily available any time.
Loans to credit institutions, payable on demand include liquid assets not represented by bonds or other interest-bearing securities.

Parent company – Financial statements
Nordea Annual Report 2014170
5 year overview, Parent company
Income statementEURm 2014 2013 2012 2011 2010
Net interest income 649 641 724 680 584Net fee and commission income 820 1,009 623 560 571Net result from items at fair value 186 131 189 234 157Dividends 2,333 1,827 3,554 1,534 2,203Other income 975 674 501 122 123Total operating income 4,963 4,282 5,591 3,130 3,638
General administrative expenses: Staff costs –1,070 –982 –938 –823 –745 Other expenses –904 –1,018 –842 –561 –526Depreciation, amortisation and impairment charges of tangible and intangible assets –261 –109 –105 –112 –112Total operating expenses –2,235 –2,109 –1,885 –1,496 –1,383
Profit before loan losses 2,728 2,173 3,706 1,634 2,255
Net loan losses –98 –124 –19 –20 –33Impairment of securities held as financial non-current assets –15 –4 –15 –9 –105Operating profit 2,615 2,045 3,672 1,605 2,117
Appropriations –1 102 –103 1 0Income tax expense –189 –192 –95 –114 –115Net profit for the year 2,425 1,955 3,474 1,492 2,002
Balance sheet
EURm31 Dec
201431 Dec
201331 Dec
201231 Dec
201131 Dec
2010
Treasury bills and interest-bearing securities 16,356 16,080 16,686 18,314 20,706Loans to credit institutions 86,704 80,918 68,006 59,379 48,151Loans to the public 39,809 34,155 36,214 36,421 33,800Investments in group undertakings 16,986 17,723 17,659 16,713 16,690Other assets 18,576 15,047 13,565 10,554 14,458Total assets 178,431 163,923 152,130 141,381 133,805
Deposits by credit institutions 27,452 17,500 19,342 22,441 28,644Deposits and borrowings from the public 49,367 47,531 50,263 44,389 39,620Debt securities in issue 63,280 62,961 48,285 45,367 33,424Subordinated liabilities 7,728 5,971 7,131 6,154 7,135Other liabilities/untaxed reserves 9,943 10,039 7,734 6,109 8,402Equity 20,661 19,921 19,375 16,921 16,580Total liabilities and equity 178,431 163,923 152,130 141,381 133,805

Financial statements – Parent company
Nordea Annual Report 2014 171
2014 2013 2012 2011 2010
Return on equity, % 12.6 10.5 20.5 9.4 13.4Return on assets, % 1.4 1.2 2.3 1.1 1.5Cost/income ratio, % 45.0 49.3 33.9 47.8 38.0Loan loss ratio, basis points 25 36 5 5 10Common Equity Tier 1 capital ratio excluding transition rules1,2, % 21.8 20.8 17.6 24.9 23.8Tier 1 capital ratio, excluding transition rules1, % 25.3 23.1 19.6 28.1 27.0Total capital ratio, excluding transition rules1, % 30.6 28.0 24.4 33.3 34.5Tier 1 capital1,2,3 EURm 19,932 19,300 19,244 17,134 16,578Risk-exposure amount, including transition rules1 EURbn 79 83 98 61 61 1) End of the year.2) Including result of the year.3) The 2013 ratios are reported under the Basel II regulation framework and the 2014 ratios are reported using the Basel III (CRR/CRDIV) framework.
Ratios and key figures, Parent company

Nordea Annual Report 2014172
Parent company – Accounting policies
Basis for presentation The financial statements for the parent company, Nordea Bank AB (publ), are prepared in accordance with the Swedish Annual Accounts Act for Credit Institutions and Securities Companies (1995:1559) and the accounting regulations of the Swedish Financial Supervisory Authority, FFFS 2008:25, with amendments in FFFS 2009:11, 2011:54, 2013:2, 2013:24 and 2014:18. This means that the parent company applies Interna-tional Financial Reporting Standards (IFRS) as endorsed by the EU Commission to the extent possible within the frame-work of Swedish accounting legislation and considering the close tie between financial reporting and taxation.
The Group’s accounting policies described in Note G1 “Accounting policies” are applicable also for the parent com-pany, considering also the information provided below.
Changed accounting policies and presentationThe accounting policies, basis for calculations and presenta-tion are, in all material aspects, unchanged in comparison with the 2013 Annual Report.
The new standard IFRS 12 “Disclosure of Interests in Other Entities” was implemented 1 January 2014 but has not had any significant impact on the financial statements of the par-ent company.
The Swedish Financial Supervisory Authority has amended the accounting regulation FFFS 2008:25 by issuing FFFS 2013:24 and FFFS 2014:18. FFFS 2013:24 was implemented by the parent company on 1 January 2014, except for the new requirements to disclose maturity information which were early adopted as from 1 January 2013. FFFS 2014:18 was implemented during the third quarter 2014. The amendments require additional disclosures related to capital adequacy which are presented in Note P40 “Capital adequacy”. Other amendments in FFFS 2013:24 and FFFS 2014:18 have not had any significant impact on the parent company s financial statements.
The Swedish Financial Reporting Board has amended the accounting recommendation for legal entities RFR 2 by issu-ing “RFR 2 Accounting for Legal Entities - January 2014”. Those amendments were implemented by the parent com-pany 1 January 2014, as a consequence of applying FFFS 2008:25, but have not had any significant impact on the parent company’s financial statement.
Forthcoming changes in IFRSs not yet implemented by the parent company can be found in section 3 “Changes in IFRSs not yet applied by Nordea” in Note G1 “Accounting policies”. The conclusions within this section are also, where applica-ble, relevant for the parent company.
Accounting policies applicable for the parent company onlyInvestments in group undertakings and associated undertakingsThe parent company’s investments in group undertakings and associated undertakings are recognised under the cost model. Impairment tests are performed according to IAS 36 “Impairment of Assets”. At each balance sheet date, all shares in group undertakings and associated undertakings are reviewed for indications of impairment. If such indication exists, an analysis is performed to assess whether the carry-ing amount of each holding of shares is fully recoverable. The recoverable amount is the higher of fair value less costs to sell
and the value in use. Any impairment charge is calculated as the difference between the carrying amount and the recover-able amount and is classified as “Impairment of securities held as financial non-current assets” in the income statement.
The parent company applies fair value hedge accounting for the foreign exchange risk in investments in subsidiaries. The shares in subsidiaries are remeasured with regards to the hedged risk with a corresponding entry in “Net result from items at fair value”. The change in fair value of the hedging instruments is also recognised in the income statement in “Net result from items at fair value”.
DividendsDividends paid to the shareholders of Nordea Bank AB (publ) are recorded as a liability following the approval of the Annual General Meeting.
Dividends paid by group undertakings to the parent com-pany are anticipated if the parent alone can decide on the size of the dividend and if the formal decision has been made before the financial report is published. Dividends from group- and associated undertakings are recognised on the separate income line “Dividends”.
Amortisation of goodwillUnder IAS 38, goodwill and other intangible assets with indefinite useful lives are not amortised in the consolidated financial statements. In the parent company financial state-ments goodwill is amortised as any other intangible asset in accordance with the rules set out in the Swedish Annual Accounts Act for Credit Institutions and Securities Compa-nies (1995:1559), i.e. normally over a period of five years unless, under exceptional circumstances, a longer amortisa-tion period is justified.
Functional currencyThe functional and presentation currency of the parent com-pany is EUR. All transactions in other currencies are con-verted to EUR in accordance with the policies disclosed in section 9 “Translation of assets and liabilities denominated in foreign currencies” in Note G1 “Accounting policies”.
PensionsThe accounting principle for defined benefit obligations fol-lows the Swedish rules (“Tryggandelagen”) and the regula-tions of the Swedish Financial Supervisory Authority as this is the condition for tax deductibility. The significant differ-ences compared with IAS 19 consists of how the discount rate is determined, that the calculation of the defined benefit obli-gation is based on current salary level without assumptions about future salary increases.
In Sweden, actuarial pension commitments are guaranteed by a pension foundation or recognised as a liability. No net defined benefit assets are recognised. The pension cost in the parent company, classified as “Staff cost” in the income state-ment, consists of changes in recognised pension provisions (including special wage tax) for active employees, pension benefits paid, contributions made to or received from the pen-sion foundation and related special wage tax.
The pension obligations in the foreign branches are calcu-lated in accordance with local accounting requirements.
P1 Accounting policies

Notes to the income statement – Parent company
Nordea Annual Report 2014 173
EURm
Sweden Finland Norway Denmark Others Total
2014 2013 2014 2013 2014 2013 2014 2013 2014 2013 2014 2013
Net interest income 649 641 — — — — — — — — 649 641Net fee and commission income 820 1,009 — — — — — — — — 820 1,009Net result from items at fair value 186 131 — — — — — — — — 186 131Dividends1 949 838 604 700 — — 750 244 30 45 2,333 1,827
Other operating income 327 106 214 195 94 88 340 285 — — 975 674Total operating income 2,931 2,725 818 895 94 88 1,090 529 30 45 4,963 4,282
1) Regards dividends from group undertakings.
P3 Net interest income
EURm 2014 2013
Interest incomeLoans to credit institutions 651 713Loans to the public 928 973Interest-bearing securities 295 366Other interest income 68 88Interest income 1,942 2,140
Interest expenseDeposits by credit institutions –127 –148Deposits and borrowings from the public –193 –333Debt securities in issue –958 –935
Subordinated liabilities –313 –314Other interest expenses1 298 231Interest expense –1,293 –1,499Net interest income 649 641
1) The net interest income from derivatives, measured at fair value and related to Nordea´s funding. This can have both a positive and negative impact on other interest expense, for further information see Note G1 "Accounting policies".
P2 Segment reporting
P1 Accounting policies, cont.
Geographical information
Group contributionsGroup contributions paid to group undertakings are recog-nised as an increase in the value of investments in group undertakings, net of tax. Group contributions received from group undertakings are recognised as dividends. The possi-ble tax effects on group contributions received are classified as “Income tax expense” in the income statement.
Untaxed reservesThe parent company reports untaxed reserves, related to accelerated depreciation and tax allocation reserve under tax regulations. In the consolidated financial statements, untaxed reserves are split on the items “Retained earnings” and “Deferred tax liabilities” on the balance sheet.
Interest income from financial instruments not measured at fair value through profit and loss amounts to EUR 1,655m (EUR 1,804m). Interest expenses from financial instruments
not measured at fair value through profit and loss amounts to EUR –1,617m (EUR –1,756m). Interest on impaired loans amounted to an insignificant portion of interest income.

Parent company – Notes to the income statement
Nordea Annual Report 2014174
P4 Net fee and commission income
EURm 2014 2013
Asset management commissions 129 115Life insurance 1 2Brokerage, securities issues and corporatefinance 168 165Custody and issuers services 24 22Deposits 23 26Total savings related commissions 345 330Payments 105 109Cards 238 219Total payment commissions 343 328Lending 157 164Guarantees and documentary payment 215 402Total lending related commissions 372 566Other commission income 33 35Fee and commission income 1,093 1,259
Savings and investments –30 –28
Payments –22 –26Cards –136 –126State guarantee fees –55 –50Other commission expenses –30 –20Fee and commission expense –273 –250Net fee and commission income 820 1,009
Fee income, not included in determining the effective interest rate, from financial assets and liabilities not measured at fair value through profit or loss amounts to EUR 180m (EUR 191m).
Fee income, not included in determining the effective inter-est rate, from fiduciary activities that result in the holding or investing of assets on behalf of customers amount to EUR 298m (EUR 282m). The corresponding amount for fee expenses is EUR –30m (EUR –28m).
EURm 2014 2013
Shares/participations and other share-related instruments 47 35Interest-bearing securities and otherinterest-related instruments –95 165
Other financial instruments 14 8Foreign exchange gains/losses 220 –77Total1 186 131
1) Of which EUR 41m (EUR 53m) is dividends from shares.
P5 Net result from items at fair value
P6 Dividends
EURm 2014 2013
Dividends from group undertakingsNordea Bank Finland Plc 550 700Nordea Bank Denmark A/S 739 235Nordea Life Holding AB 220 310Nordea Investment Management AB 75 68Nordea Bank S.A. 30 45Nordea Funds Ltd 54 —Nordea Ejendomsinvestering A/S 11 9Barkman Elektronik AB in liquidation 8 —Dividends from associated undertakingsUpplysningscentralen (UC) AB 1 1Group ContributionsNordea Hypotek AB 494 245Nordea Nordic Baltic 1 AB 8 28Nordea Investment Management AB 14 —Nordea Finans AB 129 186Total 2,333 1,827
P7 Other operating income
EURm 2014 2013
Divestment of shares 278 17Remuneration from group undertakings 691 644Other 6 13Total 975 674
Net result from categories of financial instrumentsEURm 2014 2013
Available for sale assets, realised 0 –2Financial instruments designated at fair value through profit or loss 21 19Financial instruments held for trading 53 80Financial instruments under fair value hedge accounting 6 –6– of which net losses on hedging instruments –487 –929– of which net gains on hedged items 493 923Financial assets measured at amortised cost 27 0Foreign exchange gains/losses excluding currency hedges 83 40Other –4 0Total 186 131
P5 Net result from items at fair value, cont.

Notes to the income statement – Parent company
Nordea Annual Report 2014 175
EURm 2014 2013
Salaries and remuneration (specification below)1 –716 –650Pension costs (specification below) –134 –126Social security contributions –213 –200Other staff costs –7 –6Total2 –1,070 –982
Salaries and remunerationTo executives3
– Fixed compensation and benefits –6 –6– Performance-related compensation –6 –5– Allocation to profitsharing 0 0Total –12 –11To other employees –704 –639Total –716 –650
1) Allocation to profit-sharing foundation 2014 EUR 25m (EUR 13m) consists of a new allocation of EUR 24m (EUR 13m) and an allocation related to prior year of EUR 1m (EUR 0m).
2) Of which EUR 48m regards termination benefits in connection to the cost efficiency programme launched in the second quarter.
3) Executives include the Board of Directors (including deputies), CEO, deputy CEO, executive vice presidents and Group Executive Management in the parent company. Former board members (including deputies), CEOs, deputy CEOs, managing directors and executive vice presidents, are included. Executives amounts to 15 (16) positions.
EURm 2014 2013
Pension costs1
Defined benefit plans –73 –67Defined contribution plans –61 –59Total –134 –126
1) Pension costs for executives, see Note G7 "Staff costs".
Additional disclosures on remuneration under Swedish FSA regulations and general guidelinesThe qualitative disclosures under these regulations can be found in the separate section on remuneration in the Board of Directors' Report, while the quantitative disclosures will be published in a separate report on Nordea's homepage (www.nordea.com) no later than one week before the Annual Gen-eral Meeting on 19 March 2015.
Compensation to key management personnelSalaries and renumeration to the Board of Directors, CEO and Group Executive Management, see Note G7 "Staff costs".
Loans to key management personnelLoans to key management personnel amounts to EUR 0m (EUR 0m). Interest income on these loans amounts to EUR 0m (EUR 0m). For information about loan conditions, see Note G7 "Staff costs".
Long Term Incentive ProgrammesParticipation in the Long Term Incentive Programmes (LTIPs) requires that the participants take direct ownership by invest-ing in Nordea shares. For more information about conditions and requirements, see Note G7 "Staff costs".
For information on number of outstanding conditional rights in the LTIPs, see Note G7 "Staff costs". All rights in the LTIPs, both to employees in the parent company as well as to employees in group undertakings, are issued by Nordea Bank AB (publ).
The expenses in below table regards only employees in Nordea Bank AB (publ).
P8 Staff costs
Expenses for equity-settled share-based payment programmes1
EURmLTIP 2012
LTIP 2011
LTIP 2010
Expected expense for the whole programme –12 –8 –5Maximum expense for the whole programme –12 –8 –5Total expense during 2014 –5 –1 —
Total expense during 2013 –2 –3 –1
1) All amounts excluding social security contribution.
When calculating the expected expense an expected annual employee turnover of 5% has been used. The expected expense is recognised over the vesting period of 36 months.
Cash-settled share-based payment transactionsNordea operates share-linked deferrals on parts of varia-ble compensation for certain employee categories, indexed with Nordea Total Shareholder Returns (TSR) and either transferred after three years or in equal instalments over a three to five year period. Since 2011 Nordea also operates TSR-linked retention on part of variable compensation for certain employee categories. Due to that the allocation of variable compensation is not finally decided during the current year, the deferred amount during the year in the table below relates to variable compensation earned the previous year.
In addition Nordea in 2013 introduced the Executive Incentive Programme (EIP) which aims to strengthen Nordea’s capability to retain and recruit the best talents. The aim is further to stimulate the managers and key employees whose efforts have direct impact on Nordea’s result, profitability and long term value growth. EIP reward performance meeting agreed predetermined tar-gets on Group, business unit and individual level. The effect on the long term result is to be considered when determining the targets. The EIP shall not exceed the fixed salary. EIP shall be paid in the form of cash and be subject to TSR-indexation, deferral, forfeiture clauses and reten-tion as per relevant remuneration regulations. The main part of EIP 2014 is paid no earlier than autumn 2018. Par-ticipation in the programme is offered to up to 400 manag-ers and key employees, except GEM who are instead offered a GEM EIP (further information about the GEM EIP can be found in the Remuneration section in the Board of Director’s Report), within the Nordea Group. EIP is offered instead of Nordea’s LTIP and VSP for the invited employees. The allocation of the EIP 2014 is decided dur-ing spring 2015, and a reservation of EUR 16m excl. social costs is made 2014. 80% of the allocated amount will be subject to TSR-indexation.
The below table only includes deferred amounts indexed with Nordea TSR. EIP has been included as from 2014, when deferred. Further information regarding all deferred amounts can be found in the separate report on remunera-tion published on Nordea’s homepage (www.nordea.com).

Parent company – Notes to the income statement
Nordea Annual Report 2014176
Average number of employees
Total Men Women
2014 2013 2014 2013 2014 2013
Full-time equivalentsSweden 6,485 6,395 2,983 2,852 3,502 3,543Other countries 3,613 1,842 1,854 1,156 1,759 686Total average 10,098 8,237 4,837 4,008 5,261 4,229
Gender distribution, executivesPer cent 31 Dec 2014 31 Dec 2013
Nordea Bank AB (publ)Board of Directors – Men 50 67Board of Directors – Women 50 33Other executives – Men 86 86Other executives – Women 14 14
P9 Other expenses
EURm 2014 2013
Information technology –538 –622Marketing and representation –34 –35Postage, transportation, telephone and office expenses –55 –61Rents, premises and real estate –133 –125Other1 –144 –175Total –904 –1,0181) Including fees and remuneration to auditors distributed as follows.
Auditors’ feeEURm 2014 2013
KPMG Auditing assignments –2 –2Audit-related services 0 –1Tax advisory services 0 0Other assignments –1 –3Total –3 –6
Impairment charges
Intangible assets (Note P23)Computer software –142 –9Other intangible assets –1 —Total –143 –9Total –261 –109
P10 Depreciation, amortisation and impairment charges of tangible and intangible assets
Intangible assets (Note P23)Goodwill –49 –49Computer software –31 –23Other intangible assets –11 –4Total –118 –100
P8 Staff costs, cont.
Share linked deferrals
EURm 2014 2013
Opening balance 3 2Deferred/earned during the year 5 1TSR indexation during the year 1 1Payments during the year1 –1 –1Translation differences –1 0Closing balance 7 3
1) There have been no adjustments due to forfeitures in 2014.
P11 Net loan losses
EURm 2014 2013
Divided by classLoans to credit institutions1 0 1– of which reversals 0 1Loans to the public1 –34 –45– of which provisions –77 –57– of which write-offs –68 –72– of which allowances used
for covering write-offs 24 34– of which reversals 64 29– of which recoveries 23 21
Off-balance sheet items2 –64 –80– of which provisions –77 –70
– of which reversals 50 38– of which directly recognised
in income statement –37 –48Total –98 –124
1) Included in Note P15 "Loans and impairment". 2) Included in Note P32 "Provisions" as ”Transfer risk, off-balance” and ”Guarantees”.
Key ratios2014 2013
Loan loss ratio, basis points 25 36– of which individual 9 15– of which collective 16 21
EURm 2014 2013
Depreciation/amortisation
Property and equipment (Note P24)Equipment –27 –24

Notes to the income statement – Parent company
Nordea Annual Report 2014 177
P13 Taxes
Income tax expense
EURm 2014 2013
Current tax –176 –194Deferred tax –13 2Total –189 –192
The tax on the operating profit differs from the theoretical amount that would arise using the tax rate in Sweden as follows:
EURm 2014 2013
Profit before tax 2,614 2,147Tax calculated at a tax rate of 22.0% –575 –472Tax-exempt income 431 307Non-deductible expenses –16 –20Adjustments relating to prior years –29 –7Tax charge –189 –192Average effective tax rate 7% 9%
Deferred tax
Deferred tax assets
Deferred tax liabilities
EURm 2014 2013 2014 2013
Deferred tax related to:Derivatives 10 11 — 10Properties and equipment — — 9 —Retirement benefit obligations 3 9 — —Liabilities/provisions 10 8 0 —Netting between deferred tax assets and liabilities –9 — –9 —Total 14 28 0 10
P12 Appropriations
EURm 2014 2013
Change in tax allocation reserve — 100Change in depreciation in excess of plan, equipment –1 2Total –1 102

Parent company – Notes to the balance sheet
Nordea Annual Report 2014178
P14 Treasury bills
31 Dec 2014
31 Dec 2013EURm
State and sovereigns1 4,328 5,235Municipalities and other public bodies 750 454
Total 5,078 5,689
– of which Financial instruments pledged as collateral (Note P17) 43 737Total 5,035 4,952
1) Of which EUR 0m (EUR 17m) held at amortised cost with a nominal amount of EUR 0m (EUR 17m).
P15 Loans and impairment
Credit institutions The public Total
EURm 31 Dec 2014 31 Dec 2013 31 Dec 2014 31 Dec 2013 31 Dec 2014 31 Dec 2013
Loans, not impaired 86,706 80,920 39,501 34,015 126,207 114,935Impaired loans — — 636 312 636 312– Performing — — 312 180 312 180– Non-performing — — 324 132 324 132Loans before allowances 86,706 80,920 40,137 34,327 126,843 115,247
Allowances for individually assessed impaired loans — — –254 –118 –254 –118– Performing — — –127 –79 –127 –79– Non-performing — — –127 –39 –127 –39Allowances for collectively assessed impaired loans –2 –2 –74 –54 –76 –56
Allowances –2 –2 –328 –172 –330 –174Loans, carrying amount 86,704 80,918 39,809 34,155 126,513 115,073
Movements in allowance accounts for impaired loans
Credit institutions The public Total
EURm
Indi-vidually assessed
Collec-tively
assessed Total
Indi-vidually assessed
Collec-tively
assessed Total
Indi-vidually assessed
Collec-tively
assessed Total
Opening balance at 1 Jan 2014 0 –2 –2 –118 –54 –172 –118 –56 –174Provisions — 0 0 –75 –2 –77 –75 –2 –77Reversals of previous provisions — 0 0 58 6 64 58 6 64Changes through the income statement — 0 0 –17 4 –13 –17 4 –13Allowances in acquired loan portfolios — — — –150 –26 –176 –150 –26 –176Allowances used to cover write-offs — — — 24 — 24 24 — 24
Translation differences — 0 0 7 2 9 7 2 9Closing balance at 31 Dec 2014 — –2 –2 –254 –74 –328 –254 –76 –330
Opening balance at 1 Jan 2013 –1 –4 –5 –132 –61 –193 –133 –65 –198Provisions — 1 1 –55 –3 –58 –55 –2 –57Reversals of previous provisions — 1 1 22 6 28 22 7 29Changes through the income statement — 2 2 –33 3 –30 –33 5 –28Allowances used to cover write-offs — — — 34 — 34 34 — 34Translation differences 1 — 1 13 4 17 14 4 18Closing balance at 31 Dec 2013 0 –2 –2 –118 –54 –172 –118 –56 –174

Notes to the balance sheet – Parent company
Nordea Annual Report 2014 179
P15 Loans and impairment, cont.
Allowances and provisions1
Credit institutions The public Total
EURm 31 Dec 2014 31 Dec 2013 31 Dec 2014 31 Dec 2013 31 Dec 2014 31 Dec 2013
Allowances for items on the balance sheet –2 –2 –328 –172 –330 –174Provisions for off balance sheet items –162 –138 –1 –3 –163 –141Total allowances and provisions –164 –140 –329 –175 –493 –315
1) Included in Note P32 "Provisions" as "Transferrisk, off-balance" and "Individually assessed guarantees and other commitments".
Key ratios 31 Dec2014
31 Dec2013
Impairment rate, gross, basis points 50 27
Impairment rate, net, basis points 30 17
Total allowance rate, basis points 26 15
Allowances in relation to impaired loans, % 40 38
Total allowances in relation to impaired loans, % 52 56
P16 Interest-bearing securities
EURm31 Dec
201431 Dec
2013
Issued by public bodies 43 —Issued by other borrowers1 11,278 11,128Total 11,321 11,128
Listed securities 11,166 10,969Unlisted securities 155 159Total 11,321 11,128
1) Of which EUR 111m (EUR 321m) held at amortised cost with a nominal amount of EUR 112m (EUR 322m).
Financial instruments pledged as collateral In repurchase transactions and in securities lending transac-tions, non-cash assets are transferred as collateral. When the counterpart receiving the collateral has the right to sell or repledge the assets, the assets are reclassified on the balance sheet to the item Financial instruments pledged as collateral.
EURm31 Dec
201431 Dec
2013
Treasury bills 43 737Total 43 737
For more information on transferred assets, see Note P45 "Transferred assets and obtained collaterals".
P18 Shares
EURm31 Dec
201431 Dec
2013
Shares 6,060 5,350Shares taken over for protection of claims 1 1Total 6,061 5,351
Listed shares 6,029 5,322Unlisted shares 32 29Total 6,061 5,351
P17 Financial instruments pledged as collateral

Parent company – Notes to the balance sheet
Nordea Annual Report 2014180
P19 Derivatives and hedge accounting
Fair value Total nom. amount31 Dec 2014, EURm Positive Negative
Derivatives held for tradingInterest rate derivativesInterest rate swaps 2,315 2,423 138,982FRAs 57 66 63,168
Futures and forwards 0 0 1,866Options — 5 11,097Other 5 0 4,258Total 2,377 2,494 219,371
Equity derivativesEquity swaps 57 215 272Futures and forwards 0 5 97Options 277 230 2,648Total 334 450 3,017
Foreign exchange derivativesCurrency and interest rate swaps 534 477 17,745Currency forwards 424 22 17,581Total 958 499 35,326
Credit derivatives 8 — 256Other derivatives 5 — 1,772Total derivatives held for trading 3,682 3,443 259,742
Derivatives used for hedge accountingInterest rate derivatives 1,764 404 42,020Equity derivatives — 5 55Foreign exchange derivatives 535 801 9,872Total derivatives used for hedge accounting 2,299 1,210 51,947– of which fair value hedges1 1,747 360 46,635– of which cash flow hedges1 552 850 32,130Total derivatives 5,981 4,653 311,689 1) Some cross currency interest rate swaps and interest rate swaps are used both as fair value hedges and cash flow hedges and the nominal amounts are then reported on both
lines.

Notes to the balance sheet – Parent company
Nordea Annual Report 2014 181
Fair value Total nom. amount31 Dec 2013, EURm Positive Negative
Derivatives held for tradingInterest rate derivativesInterest rate swaps 1,656 1,735 140,226FRAs 14 18 50,444
Futures and forwards 1 0 2,586Options 6 6 4,282Other 1 0 1,129Total 1,678 1,759 198,667
Equity derivativesEquity swaps 82 142 224Futures and forwards 2 1 14Options 151 123 2,796Total 235 266 3,034
Foreign exchange derivativesCurrency and interest rate swaps 530 549 12,617Currency forwards 82 40 15,064Total 612 589 27,681
Credit derivatives 0 — 1Other derivatives 6 0 1,916Total derivatives held for trading 2,531 2,614 231,299
Derivatives used for hedge accountingInterest rate derivatives 1,311 319 39,161Foreign exchange derivatives 377 694 17,880Total derivatives used for hedge accounting 1,688 1,013 57,041– of which fair value hedges1 1,288 291 47,587 – of which cash flow hedges1 358 700 24,316– of which net investment hedges 42 22 9,455Total derivatives 4,219 3,627 288,340 1) Some cross currency interest rate swaps and interst rate swaps are used both as fair value hedges and cash flow hedges and the nominal amounts are then reported on both
lines.
P19 Derivatives and Hedge accounting, cont.

Parent company – Notes to the balance sheet
Nordea Annual Report 2014182
P20 Fair value changes of the hedged items in
portfolio hedge of interest rate risk
The carrying amount at end of year represents accumulated changes in the fair value for those repricing time periods in which the hedged item is an asset respectively a liability. When the hedged item is an asset, the change in the fair value of the hedged item is presented within assets and when the hedged item is a liability, the change is presented as a liability.
P21 Investments in group undertakings
EURm31 Dec
201431 Dec
2013
Acquisition value at beginning of year 18,347 18,279Acquisitions/capital contributions during the year 56 58Revaluations under hedge accounting –425 —IFRS 2 expenses1 9 10Sales during the year –376 —Acquisition value at end of year 17,611 18,347
Accumulated impairment charges at beginning of year –624 –620Accumulated impairment charges on group undertakings sold during the year 14 —Impairment charges during the year –15 –4Accumulated impairment charges at end of year –625 –624Total 16,986 17,723– of which listed shares — —
1) Allocation of IFRS 2 expenses for LTIP 2011 and 2012 related to the group undertakings.
P21 Investments in group undertakings, cont.
SpecificationThis specification includes all directly owned group undertakings and major group undertakings to the directly owned companies.
31 Dec 2014Number of
shares
Carrying amount
2014, EURm
Carrying amount
2013, EURm
Voting power of
holding % Domicile
Registration number
Nordea Bank Finland Plc 1,030,800,000 5,962 5,959 100.0 Helsinki 1680235–8 Nordea Finance Finland Ltd 100.0 Helsinki 0112305–3
Nordea Bank Danmark A/S 50,000,000 4,024 4,010 100.0 Copenhagen 13522197 Nordea Finans Danmark A/S 100.0 Høje Taastrup 89805910 Nordea Kredit Realkreditaktieselskab 100.0 Copenhagen 15134275 Fionia Asset Company A/S 100.0 Copenhagen 31934745
Nordea Bank Norge ASA 551,358,576 2,428 2,733 100.0 Oslo 911044110 Nordea Eiendomskreditt AS 100.0 Oslo 971227222 Nordea Finans Norge AS 100.0 Oslo 924507500 Privatmegleren AS 100.0 Oslo 986386661
Nordea Bank Polska S.A1 55,061,403 — 343 99.2 Gdynia KRS0000021828
OOO Promyshlennaya Companiya Vestkon 4,601,942,6802 659 659 100.0 Moscow 1027700034185 JSC Nordea Bank 100.03 Moscow 1027739436955
Nordea Life Holding AB 1,000 719 719 100.0 Stockholm 556742–3305 Nordea Liv & Pension, Livforsikringsselskab A/S 100.0 Ballerup 24260577
Nordea Liv Holding Norge AS 100.0 Bergen 984739303
Livforsikringsselskapet Nordea Liv Norge AS 100.0 Bergen 959922659
Nordea Livförsäkring Sverige AB (publ) 100.0 Stockholm 516401–8508 Nordea Life Assurance Finland Ltd 100.0 Helsinki 0927072–8

Notes to the balance sheet – Parent company
Nordea Annual Report 2014 183
P22 Investments in associated undertakings
EURm31 Dec
201431 Dec
2013
Acquisition value at beginning of year 7 8Acquisitions during the year — 0Sales during the year — –1Acquisition value at end of year 7 7– of which listed shares — —
31 Dec 2014Number of
shares
Carrying amount
2014, EURm
Carrying amount
2013, EURm
Voting power of
holding % Domicile
Registration number
Nordea Funds Ltd 3,350 174 174 100.0 Helsinki 1737785–9Nordea Bank S.A. 999,999 455 455 100.0 Luxembourg B–14157
Nordea Hypotek AB (publ)4 100,000 1,874 1,998 100.0 Stockholm 556091–5448Nordea Nordic Baltic 1 AB 15,000 242 242 100.0 Stockholm 556020–4694Nordea Finans Sverige AB (publ)4 1,000,000 104 124 100.0 Stockholm 556021–1475Nordea Investment Management AB 12,600 231 237 100.0 Stockholm 556060–2301Nordea Ejendomsinvestering A/S 1,000 29 29 100.0 Glostrup 26640172Nordea IT Polska S.p. z.o.o. 100 30 40 100.0 Warsaw 0000429783PK Properties Int'l Corp 100,000 0 0 100.0 Atlanta, USA 601624718Nordea Hästen Fastighetsförvaltning AB 1,000 0 0 100.0 Stockholm 556653–6800Nordea Putten Fastighetsförvaltning AB 1,000 0 0 100.0 Stockholm 556653–5257Nordea do Brasil Representações Ltda 1,162,149 0 0 100.0 Sao Paulo, Brasil 51.696.268/0001–40Nordic Baltic Holding (NBH) AB5 1,000 0 0 100.0 Stockholm 556592–7950Nordea Fastigheter AB5 3,380,000 1 1 100.0 Stockholm 556021–4917Promano Est OÜ 1 10 — 100.0 Tallinn, Estonia 11681888Uus-Sadama 11 OÜ 1 0 — 100.0 Tallinn, Estonia 11954914SIA Promano Lat 21,096 14 — 100.0 Riga, Latvia 40103235197SIA Realm 7,034 7 — 100.0 Riga, Latvia 50103278681
SIA Lidosta RE 765 1 — 100.0 Riga, Latvia 40103424424SIA Trioleta 2,786 4 — 99.9 Riga, Latvia 40103565264Promano Lit UAB 34,528 11 — 100.0 Vilnius, Lithuania 302423219UAB Recurso 15,000 5 — 100.0 Vilnius, Lithuania 302784511UAB Inrec 6,900 2 — 100.0 Vilnius, Lithuania 302996806Total 16,986 17,723
1) Sold in April 2014.2) Nominal value expressed in RUB, representing Nordea's participation in Vestkon.3) Combined ownership, Nordea Bank AB (publ) directly 7.2% and indirectly 92.8% through OOO Promyshlennaya Companiya Vestkon. 4) Credit institutions as defined in the Swedish Annual Account Act for Credit Instituions and Securities Companies (1995:1559).5) Dormant.
P21 Investments in group undertakings, cont.
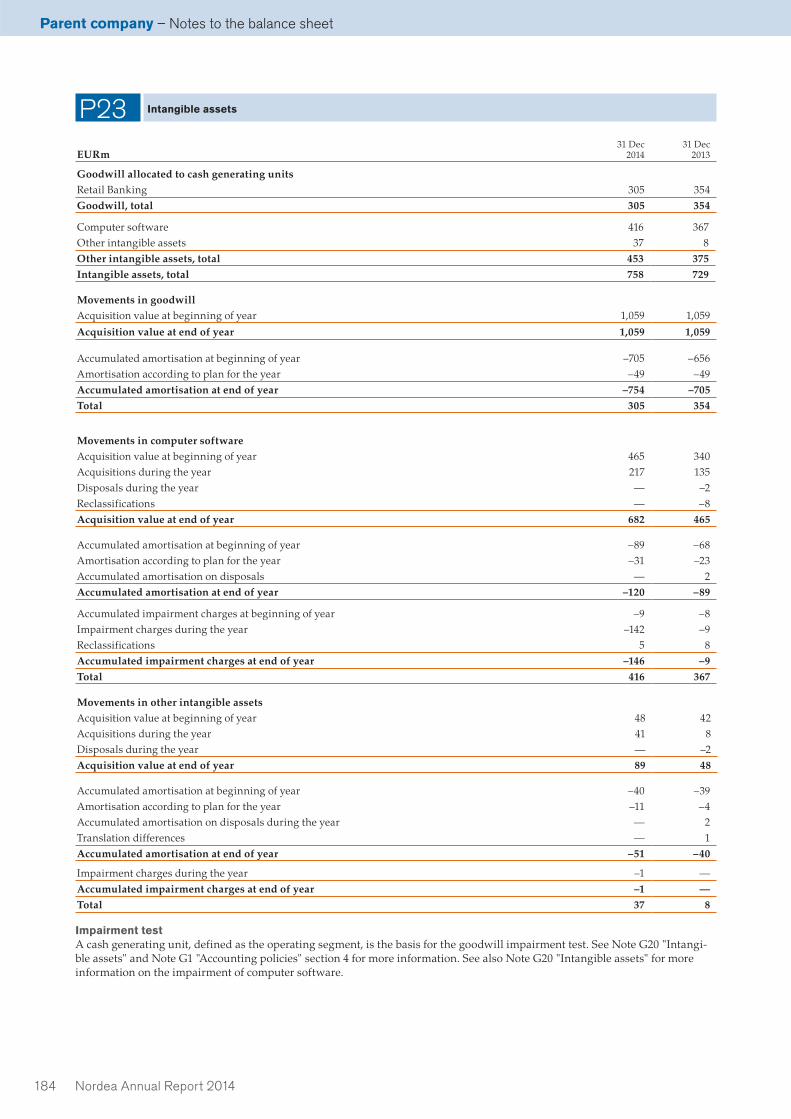
Parent company – Notes to the balance sheet
Nordea Annual Report 2014184
P23 Intangible assets
EURm31 Dec
201431 Dec
2013
Goodwill allocated to cash generating unitsRetail Banking 305 354Goodwill, total 305 354
Computer software 416 367Other intangible assets 37 8Other intangible assets, total 453 375Intangible assets, total 758 729
Movements in goodwillAcquisition value at beginning of year 1,059 1,059
Acquisition value at end of year 1,059 1,059
Accumulated amortisation at beginning of year –705 –656Amortisation according to plan for the year –49 –49Accumulated amortisation at end of year –754 –705Total 305 354
Movements in computer softwareAcquisition value at beginning of year 465 340Acquisitions during the year 217 135Disposals during the year — –2Reclassifications — –8Acquisition value at end of year 682 465
Accumulated amortisation at beginning of year –89 –68Amortisation according to plan for the year –31 –23Accumulated amortisation on disposals — 2Accumulated amortisation at end of year –120 –89
Accumulated impairment charges at beginning of year –9 –8Impairment charges during the year –142 –9Reclassifications 5 8Accumulated impairment charges at end of year –146 –9Total 416 367
Movements in other intangible assetsAcquisition value at beginning of year 48 42Acquisitions during the year 41 8Disposals during the year — –2Acquisition value at end of year 89 48
Accumulated amortisation at beginning of year –40 –39Amortisation according to plan for the year –11 –4Accumulated amortisation on disposals during the year — 2Translation differences — 1Accumulated amortisation at end of year –51 –40
Impairment charges during the year –1 —Accumulated impairment charges at end of year –1 —Total 37 8
Impairment test A cash generating unit, defined as the operating segment, is the basis for the goodwill impairment test. See Note G20 "Intangi-ble assets" and Note G1 "Accounting policies" section 4 for more information. See also Note G20 "Intangible assets" for more information on the impairment of computer software.

Notes to the balance sheet – Parent company
Nordea Annual Report 2014 185
P24 Properties and equipment
EURm 31 Dec 2014 31 Dec 2013
Properties and equipment 119 118– of which buildings for own use 0 0Total 119 118
Movements in equipmentAcquisition value at beginning of year 268 270Acquisitions during the year 30 28Sales/disposals during the year –32 –30Acquisition value at end of year 266 268
Accumulated depreciation at beginning of year –150 –149Accumulated depreciation on sales/disposals during the year 30 23Depreciations according to plan for the year –27 –24Accumulated depreciation at end of year –147 –150Total 119 118
Operating leasesNordea has entered into operating lease agreements for premises and office equipment. See also Note G1 "Accounting policies", section 15.
Leasing expenses during the year, EURm 31 Dec 2014 31 Dec 2013
Leasing expenses during the year –117 –113– of which minimum lease payments –117 –113Leasing income during the year regarding sublease payments 35 39
Future minimum lease payments under non-cancellable operating leases amounted to and are distributed as follows:
EURm 31 Dec 2014
2015 742016 622017 482018 382019 30Later years 253Total 505
Total sublease payments expected to be received under non-cancellable subleases amounts to EUR 252m. EUR 237m of the subleases are towards group undertakings.
P25 Other assets
EURm31 Dec
201431 Dec
2013
Claims on securities settlement proceeds 276 484Anticipated dividends from group undertak-ings 1,109 742Group contributions 644 459Other 1,698 848Total 3,727 2,533

Parent company – Notes to the balance sheet
Nordea Annual Report 2014186
P26 Prepaid expenses and accrued income
EURm31 Dec
201431 Dec
2013
Accrued interest income 115 396Other accrued income 81 170Prepaid expenses 688 725Total 884 1,291
P28 Deposits and borrowings from the public
EURm31 Dec
201431 Dec
2013
Deposits 48,176 46,150Borrowings 1,191 1,381Total 49,367 47,531
Deposits are defined as funds in deposit accounts covered by the government deposit guarantee but also including amounts in excess of the individual amount limits. Individual pension savings (IPS) are also included.
P27 Deposits by credit institutions
EURm31 Dec
201431 Dec
2013
Central banks 2,418 3,707Banks 24,258 13,095Other credit institutions 776 698Total 27,452 17,500
P29 Debt securities in issue
EURm31 Dec
201431 Dec
2013
Certificates of deposit 55 —Commercial papers 29,246 28,853Bond loans 33,908 34,029Other 71 79Total 63,280 62,961
P30 Other liabilities
EURm31 Dec
201431 Dec
2013
Liabilities on securities settlement proceeds 215 202Sold, not held, securities 285 244Accounts payable 22 29Other 2,373 3,698
Total 2,895 4,173
P31 Accrued expenses and prepaid income
EURm31 Dec
201431 Dec
2013
Accrued interest 13 544Other accrued expenses 443 391Prepaid income 186 215Total 642 1,150
P32 Provisions
EURm31 Dec
201431 Dec
2013
Provision for restructuring costs 42 36Transfer risk, off-balance 1 2Guarantees 162 139Other 1 7
Total 206 184
Restructuring Transfer risk Guarantees Other Total
At beginning of year 36 2 139 7 184New provisions made 60 — 77 — 137Provisions utilised –18 –1 –4 –6 –29Reversals –18 — –50 — –68Reclassifications –16 — — — –16Translation differences –2 0 0 0 –2At end of year 42 1 162 1 206
Provision for restructuring costs amounts to EUR 42m and cov-ers termination benefits (EUR 34m) and other provisions mainly related to redundant premises (EUR 8m). Provision for transfer risk is related to off-balance sheet items. Transfer risk relating to loans is included in the item Allowances for collectively assessed
impaired loans in Note P15 "Loans and impairment". Provision for transfer risk is depending on the volume of business with different countries. Loan loss provisions for guarantees amounts to EUR 162m, of which EUR 161m covers the guarantee in favour of Nordea Bank Finland Plc.

Notes to the balance sheet – Parent company
Nordea Annual Report 2014 187
Pension provisionsThe pension liabilities of Nordea Bank AB (publ) are mainly covered by allocations to its pension foundation.
The provisions on the balance sheet pertain to former employees of Postgirot Bank and pension obligations in for-eign branches. EUR 124m (EUR 133m) of the provisions are covered by "Tryggandelagen".
A small percentage of the pension obligations are covered by insurance policies.
The following figures are mainly based on calculations in accordance with Swedish rules ("Tryggandelagen").
The pension obligations in the foreign branches are calcu-lated in accordance with local accounting requirements.
Specification of amounts recognised on the balance sheet
EURm31 Dec
201431 Dec
2013
Present value of commitments relating to in whole or in part funded pension plans –1,155 –1,202Fair value at the end of the period relating to specifically separated assets 1,384 1,303Surplus in the pension foundation 229 101Present value of commitments relating to unfunded pension plans –171 –166Unrecognised surplus in the pension foundation –229 –101
Reported liability net on the balance sheet –171 –166
Movements in the liability recognised on balance sheet as pension
EURm31 Dec
201431 Dec
2013
Balance at 1 Jan recognised as pension commitments 166 182Pensions paid related to former employees of Postgirot Bank –7 –7Actuarial pension calculations 12 0Effect of exchange rate changes 0 –9Balance at 31 Dec 171 166
Specification of cost and income in respect of pensions
EURm 2014 2013Pensions paid related to former employees of Postgirot Bank –7 –7
Pensions paid covered by the pension foundation –61 –67Actuarial pension calculation –5 7Defined benefit plans –73 –67
Defined contribution plans –61 –59
Pension costs1 –134 –126
Return on specifically separated assets, % 12.4 3.01) See Note P8 "Staff costs".
Actual value of holdings in pension foundations
EURm31 Dec
201431 Dec
2013
Shares 353 326Interest-bearing securities 1,004 955Other assets 27 22Total 1,384 1,303
P34 Subordinated liabilities
EURm31 Dec
201431 Dec
2013
Dated subordinated debenture loans 4,435 4,107Hybrid capital loans 3,293 1,864Total 7,728 5,971
These debenture loans are subordinated to other liabilities. Dated debenture loans entitle the lender to payment before undated subordinated loans and hybrid capital loans. Within each respective category, the loans entitle lenders to equal payment rights.
At 31 December 2014 five loans – with terms specified below – exceeded 10% of the total outstanding volume dated subordinated loans.
EURm
Nominalvalue
Carrying amount
Interest rate (coupon)
Dated loan1 1,000 997 FixedDated loan2 750 747 FixedDated loan3 750 748 FixedDated loan4 1,030 1,023 FixedDated loan5 824 816 Fixed
1) Maturity date 26 March 2020.2) Maturity date 29 March 2021.3) Call date 15 February 2017, maturity date 15 February 2022.4) Maturity date 13 May 2021.5) Maturity date 21 September 2022.
P35 Untaxed reserves
EURm31 Dec
201431 Dec
2013
Accumulated excess depreciation, equipment 4 3
Main assumptions for defined benefit obligations
2014 2013
Discount rate 2.2% 2.2%The calculation is based on pay and pension levels on the accounting date Yes Yes
Next year's expected payment regarding defined benefit plans amounts to EUR 66m.
P33 Retirement benefit obligations, cont.P33 Retirement benefit obligations

Parent company – Notes to the balance sheet
Nordea Annual Report 2014188
P37 Other assets pledged
Other assets pledged are mainly related to securities which included interest-bearing securities pledged as securities for payment settlements within the central banks and clearing institutions EUR 9,238m (EUR 7,033m). The terms and condi-tions require day to day securities and relate to liquidity intraday/overnight. Collateral pledged on behalf of other items other than the company s own liabilities, e.g. on behalf of a third party or on behalf of the company s own contingent liabilities are also accounted for under this item.
P36 Assets pledged as security for own liabilities
EURm31 Dec
201431 Dec
2013
Assets pledged for own liabilities Securities etc1 3,946 2,454Total 3,946 2,454
The above pledges pertain to the follow-ing liabilitiesDeposits by credit institutions 2,508 1,788Deposits and borrowings from the public 268 2,380Total 2,776 4,168
1) Relates only to securities recognised on the balance sheet. Securities borrowed or bought under reverse repurchase agreements are not recognised on the balance sheet and thus not included in the amount. Such transactions are disclosed in Note P45 "Transferred assets and obtained collaterals" which are permitted to be sold or repledged.
Assets pledged for own liabilities contain securities pledged as security in repurchase agreement and in securities lending. The transactions are conducted under standard agreements employed by financial markets participants. Counterparts in those transactions are credit institutions and the public. The transactions are typically short term with maturity within three months.
P38 Contingent liabilities
EURm31 Dec
201431 Dec
2013
Guarantees– Loan guarantees 70,024 69,815
– Other guarantees 918 570Other contingent liabilities 161 0Total 71,103 70,385
In the normal business Nordea issues various forms of guaran-tees in favour of the bank's customers. Loan guarantees are given for customers to guarantee obligations in other credit- and pension institutions. Other guarantees consist mainly of com-mercial guarantees such as bid guarantees, advance payment guarantees, warranty guarantees and export related guarantees.
Nordea Bank AB (publ) has issued a guarantee in favour of its Russian subsidery JSC Nordea Bank where Nordea Bank AB (publ) guarantees specified exposures in JSC Nordea Bank. At 31 December 2014 the guarantees cover exposures amounting to EUR 4bn. The guarantees are priced at arm's length. All internal transactions under the guarantees are eliminated in the consolidated accounts.
Nordea Bank AB (publ) has issued a guarantee of maxi-mum EUR 60bn in favour of Nordea Bank Finland Plc where Nordea Bank AB (publ) guarantees the majority of the expo-sures in the exposure class IRB corporate in Nordea Bank Finland Plc. The guarantee covers EUR 11bn of corporate loans, guarantees, documentary credits and loan commit-ments. In addition, EUR 6bn of derivatives are covered by the guarantee as of 31 December 2014. The maximum amount of derivatives guaranteed is EUR 10bn. The guarantee increased the REA by EUR 11bn. The guarantee will generate commis-sion income, while the losses recognised on the guaranteed exposures will be transferred to Nordea Bank AB (publ). The guarantee is priced at arm's length, including expected credit losses and the cost of capital required by the guarantee. All internal transactions in the guarantee are eliminated in the consolidated accounts.
Nordea Bank AB (publ) has undertaken, in relation to cer-tain individuals and on certain conditions, to be responsible for the potential payment liability against them in their capacity as managing directors or board member in group undertakings to Nordea Bank AB (publ).
A limited number of employees are entitled to severance pay if they are dismissed before reaching their normal retirement age.
Legal proceedingsWithin the framework of the normal business operations, the company faces a number of claims in civil lawsuits and disputes, most of which involve relatively limited amounts. Presently, none of the current disputes are considered likely to have any significant adverse effect on the company or its financial position.
P39 Commitments
EURm31 Dec
201431 Dec
2013
Credit commitments 9,710 13,868Unutilised portion of approved overdraft facilities 14,114 12,845Total 23,824 26,713
For information about derivatives see Note P19 "Derivatives and hedge accounting".

Other notes – Parent company
Nordea Annual Report 2014 189
Table A2 Transitional own funds
For information of the capital adequacy regulations see Note G38 "Capital adequacy".
Common Equity Tier 1 capital: instruments and reserves
(A) amount at disclosure date,
EURm
(C) amounts subject to pre- regulation (eu) no 575/2013 treatment or
prescribed residual amount of regulation
(eu) no 575/2013
1 Capital instruments and the related share premium accounts 5,130 —of which: Share capital 4,050 —
2 Retained earnings 13,111 —3 Accumulated other comprehensive income (and other reserves, to include unrealised
gains and losses under the applicable accounting standards) –5 —5a Independently reviewed interim profits net of any foreseeable charge or dividend –76 —6 Common Equity Tier 1 (CET1) capital before regulatory adjustments 18,160 —Common Equity Tier 1 (CET1) capital: regulatory adjustments
7 Additional value adjustments (negative amount) –7 —8 Intangible assets (net of related tax liability) (negative amount) –758 —10 Deferred tax assets that rely on future profitability excluding those arising
from temporary differences (net of related tax liability where the conditions in Article 38 (3) are met) (negative amount) 0 —
11 Fair value reserves related to gains or losses on cash flow hedges 36 —12 Negative amounts resulting from the calculation of expected loss amounts 0 —14 Gains or losses on liabilities valued at fair value resulting from changes in own credit
standing –58 —15 Defined-benefit pension fund assets (negative amount) 0 —16 Direct and indirect holdings by an institution of own CET1 instruments (negative
amount) –1 —25 of which: deferred tax assets arising from temporary differences 0 —25b Foreseeable tax charges relating to CET1 items (negative amount) 0 —26a Regulatory adjustments relating to unrealised gains and losses pursuant to
Articles 467 and 468 –208 —Of which: …filter for unrealised loss 1 0 3Of which: …filter for unrealised gain 1 –208 0
28 Total regulatory adjustments to Common equity Tier 1 (CET1) –996 —29 Common Equity Tier 1 (CET1) capital 17,164 —Additional Tier 1 (AT1) capital: instruments
30 Capital instruments and the related share premium accounts 1,224 —33 Amount of qualifying items referred to in Article 484 (4) and the related share
premium accounts subject to phase out from AT1 1,576 44736 Additional Tier 1 (AT1) capital before regulatory adjustments 2,800 —Additional Tier 1 (AT1) capital: regulatory adjustments
37 Direct and indirect holdings by an institution of own AT1 Instruments (negative amount) –32 —
43 Total regulatory adjustments to Additional Tier 1 (AT1) capital –32 —44 Additional Tier 1 (AT1) capital 2,768 —45 Tier 1 capital (T1 = CET1 + AT1) 19,932 —Tier 2 (T2) capital: instruments and provisions
46 Capital instruments and the related share premium accounts 4,331 —47 Amount of qualifying items referred to in Article 484 (5) and the related share
premium accounts subject to phase out from T2 400 –40050 Credit risk adjustments 55 —51 Tier 2 (T2) capital before regulatory adjustments 4,785 0Tier 2 (T2) capital: regulatory adjustments
52 Direct and indirect holdings by an institution of own T2 instruments and subordi-nated loans (negative amount) –43 —
55 Direct and indirect holdings by the institution of the T2 instruments and subordi-nated loans of financial sector entities where the institution has a significant invest-ment in those entities (net of eligible short positions) (negative amount) –505 —
P40 Capital adequacy

Parent company – Other notes
Nordea Annual Report 2014190
57 Total regulatory adjustments to Tier 2 (T2) capital –549 —58 Tier 2 (T2) capital 4,236 —59 Total capital (TC = T1 + T2) 24,168 —60 Total risk weighted assets 78,910 —Capital ratios and buffers
61 Common Equity Tier 1 (as a percentage of risk exposure amount) 21.8% —62 Tier 1 (as a percentage of risk exposure amount) 25.3% —63 Total capital (as a percentage of risk exposure amount) 30.6% —64 Institution specific buffer requirement (CET1 requirement in accordance with article
92 (1) (a) plus capital conservation and countercyclical buffer requirements, plus systemic risk buffer, plus the systemically important institution buffer (G-SII or O-SII buffer), expressed as a percentage of risk exposure amount) 2.5% —
65 of which: capital conservation buffer requirement 2.5% —66 of which: countercyclical buffer requirement 0.0% —67 of which: systemic risk buffer requirement 0.0% —67a of which: Global Systemically Important Institution (G-SII) or Other Systemically
Important Institution (O-SII) buffer 0.0% —68 Common Equity Tier 1 available to meet buffers (as a percentage of risk exposure
amount) 17.3% —Amounts below the thresholds for deduction (before risk weighting)
72 Direct and indirect holdings of the capital of financial sector entities where the institution does not have a significant investment in those entities (amount below 10% threshold and net of eligible short positions) 41 —
73 Direct and indirect holdings by the institution of the CET 1 instruments of financial sector entities where the institution has a significant investment in those entities (amount below 10% threshold and net of eligible short positions) 742 —
75 Deferred tax assets arising from temporary differences (amount below 10% threshold, net of related tax liability where the conditions in Article 38 (3) are met) 64 —
Applicable caps on the inclusion of provisions in Tier 2
78 Credit risk adjustments included in T2 in respect of exposures subject to internal ratings-based approach (prior to the application of the cap) 33,429 —
79 Cap for inclusion of credit risk adjustments in T2 under internal ratings-based approach 201 —
Capital instruments subject to phase-out arrangements (only applicable between 1 Jan 2013 and 1 Jan 2022)
80 Current cap on CET1 instruments subject to phase out arrangements 0 —
81 Amount excluded from CET1 due to cap (excess over cap after redemptions and maturities) 0 —
82 Current cap on AT1 instruments subject to phase out arrangements 1,576 —83 Amount excluded from AT1 due to cap (excess over cap after redemptions and
maturities) –447 —84 Current cap on T2 instruments subject to phase out arrangements 400 —85 Amount excluded from T2 due to cap (excess over cap after redemptions and
maturities) –47 —
P40 Capital adequacy, cont.

Other notes – Parent company
Nordea Annual Report 2014 191
P40 Capital adequacy, cont.
Leverage ratio1 31 Dec 2014
Tier 1 capital, transitional definition, EURm2 20,047
Leverage ratio exposure, EURm 225,148
Leverage ratio, percentage 8.9
1) Leverage ratio and volumnes presented is based on three month average according to local FSA reporting process. 2) Including profit of the period.
Minimum capital requirement and REA 31 Dec 2014 31 Dec 2013
EURm
Minimum capital
requirement REA
Minimum capital
requirement REA
Credit risk 5,759 71,986 6,296 78,700– of which counterparty credit risk 100 1,249 65 809IRB 2,674 33,429 3,428 42,854– of which corporate 2,130 26,622 3,100 38,749 – of which advanced 1,461 18,257 — — – of which foundation 669 8,365 3,100 38,749– of which institutions 302 3,777 105 1,318– of which retail 148 1,854 180 2,254 – of which secured by immovable property collateral 6 78 11 140 – of which other retail 132 1,647 156 1,953 – of which SME 10 129 13 161– of which other 94 1,176 43 533
Standardised 3,085 38,557 2,868 35,846– of which central governments or central banks 14 174 2 26– of which regional governments or local authorities 1 8 — —– of which public sector entities — — — —– of which multilateral development banks — — — —– of which international organisations — — — —– of which institutions 1,319 16,481 1,291 16,126– of which corporate 57 718 53 664– of which retail 28 345 0 1– of which secured by mortgages on immovable property 202 2,530 101 1,258– of which in default 5 60 0 1– of which associated with particularly high risk — — — —– of which covered bonds 0 0 0 6– of which institutions and corporates with a short-term credit assessment — — — —– of which collective investments undertakings (CIU) — — — —– of which equity 1,451 18,139 — —– of which other items 8 102 1,421 17,764
Credit Value Adjustment Risk 14 172 — —
Market risk 218 2,724 128 1,596– of which trading book, Internal Approach 42 524 34 429– of which trading book, Standardised Approach 2 26 5 59– of which banking book, Standardised Approach 174 2,174 89 1,108
Operational risk 322 4,028 250 3,121Standardised 322 4,028 250 3,121Sub total 6,313 78,910 6,674 83,417
Adjustment for Basel I floorAdditional capital requirement according to Basel I floor 0 0 0 0Total 6,313 78,910 6,674 83,417
More Capital Adequacy information can be found in the section "Risk, Liquidity and Capital Management".

Parent company – Other notes
Nordea Annual Report 2014192
Table A3 - Capital main features template — CET 1
Common equity Tier 1 capital
1 Issuer Nordea Bank AB (publ)2 Unique identifier (eg CUSIP, ISIN or Bloomberg identifier for private placement) SE00004273613 Governing law(s) of the instrument Swedish
Regulatory treatment4 Transitional CRR rules Common Equity Tier 15 Post-transitional CRR rules Common Equity Tier 16 Eligible at solo/(sub-)consolidated/solo & (sub-)consolidated Solo & Consolidated7 Instrument type (types to be specified by each jurisdiction) Share capital
as published in Regulation (EU) No 575/2013 article 28
8 Amount recognised in regulatory capital (currency in million, as of most recent reporting date)
EUR 4,050m
9 Nominal amount of instrument EUR 4,049,951,91910 Accounting classification Shareholders' equity12 Perpeptual or dated Perpetual13 Original maturity date No maturity14 Issuer call subject to prior supervisory approval No
Coupons / dividends20a Fully discretionary, partially discretionary or mandatory (in terms of timing) Fully discretionary20b Fully discretionary, partially discretionary or mandatory (in terms of amount) Fully discretionary35 Position in subordination hierachy in liquidation (specify instrument type
immediately senior to instrument)Additional Tier 1
36 Non-compliant transitioned features No
P40 Capital adequacy, cont.
Capital requirements for market risk, 31 December 2014Trading book, IM Trading book, SA Banking book, SA Total
EURm REACapital
requirement REACapital
requirement REACapital
requirement REACapital
requirement
Interest rate risk & other1 2 0 — — — — 2 0Equity risk 130 10 26 2 — — 156 12
Foreign exchange risk 25 2 — — 2,174 174 2,199 176Commodity risk — — — — — — — —Settlement risk — — 0 0 — — 0 0Diversification effect –2 0 — — — — –2 0Stressed Value-at-Risk 369 30 — — — — 369 30Incremental Risk Measure 0 0 — — — — 0 0Comprehensive Risk Measure — — — — — — — —Total 524 42 26 2 2,174 174 2,724 218
1) Interest rate risk column Trading book IA includes both general and specific interest rate risk which is elsewhere referred to as interest rate VaR and credit spread VaR.
Table A3-A5 include disclosure of capital instruments’ main features in accordance with §6.4 in FFFS 2014:18 and using the template in Annex II in article 3 in Commission implementing regulation (EU) No 1423/2013. Template items are excluded if not applicable.

Other notes – Parent company
Nordea Annual Report 2014 193
P40 Capital adequacy, cont.
Table A4 - Capital instruments’ main features — AT1
Additional Tier 1 instrument
1 Issuer Nordea Bank AB (publ)
Nordea Bank AB (publ)
Nordea Bank AB (publ)
Nordea Bank AB (publ)
Nordea Bank AB (publ)
Nordea Bank AB (publ)
Nordea Bank AB (publ)
2 Unique identifier (eg CUSIP, ISIN or Bloomberg identifier for private placement)
XS0200688256 W5795#AA7 US65557AAB35/USW5816FCM42
W5795#AB5 XS0453319039 US65557CAM55/US65557DAM39
US65557CAN39/US65557DAL55
3 Governing law(s) of the instrument
Governed by English law,
except for the subordination
provisions which are
governed by Swedish law
Governed by English law,
except for the subordination
provisions which are
governed by Swedish law
Governed by laws of the State
of New York, except for the subordination
provisions which are
governed by Swedish law
Governed by English law,
except for the subordination
provisions which are
governed by Swedish law
Governed by English law,
except for the subordination
provisions which are
governed by Swedish law
Governed by English law,
except for the subordination
provisions which are
governed by Swedish law
Governed by English law,
except for the subordination
provisions which are
governed by Swedish law
Regulatory treatment
4 Transitional CRR rules
Additional Tier 1 Additional Tier 1 Additional Tier 1 Additional Tier 1 Additional Tier 1 Additional Tier 1 Additional Tier 1
5 Post-transi-tional CRR rules
Tier 2 Ineligible Ineligible Ineligible Ineligible Additional Tier 1 Additional Tier 1
6 Eligible at solo/(sub-)consoli-dated/solo & (sub-)con-solidated
Solo & consolidated
Solo & consolidated
Solo & consolidated
Solo & consolidated
Solo & consolidated
Solo & consolidated
Solo & consolidated
7 Instrument type (types to be speci-fied by each jurisdiction)
Additional Tier 1 (grandfathered) as published in
Regulation (EU) No 575/2013
article 484.4
Additional Tier 1 (grandfathered) as published in
Regulation (EU) No 575/2013
article 484.4
Additional Tier 1 (grandfathered) as published in
Regulation (EU) No 575/2013
article 484.4
Additional Tier 1 (grandfathered) as published in
Regulation (EU) No 575/2013
article 484.4
Additional Tier 1 (grandfathered) as published in
Regulation (EU) No 575/2013
article 484.4
Additional Tier 1as published in
Regulation (EU) No 575/2013
article 484.4
Additional Tier 1as published in
Regulation (EU) No 575/2013
article 484.4
8 Amount rec-ognised in regulatory capital (cur-rency in million, as of most recent reporting date)
EUR 500m EUR 138m EUR 494m EUR 69m EUR 823m EUR 816m EUR 408m
9 Nominal amount of instrument
EUR 500m JPY 20,000m USD 600m JPY 10,000m USD 1,000m USD 1,000m USD 500m
9a Issue price 100 per cent 100 per cent 100 per cent 100 per cent 100 per cent 100 per cent 100 per cent
9b Redemption price
100 per cent of Nominal amount
100 per cent of Nominal amount
100 per cent of Nominal amount
100 per cent of Nominal amount
100 per cent of Nominal amount
100 per cent of Nominal amount
100 per cent of Nominal amount
10 Accounting classifica-tion
Liability - amortised cost
Liability - amortised cost
Liability - amortised cost
Liability - amortised cost
Liability - amortised cost
Liability - amortised cost
Liability - amortised cost
11 Original date of issu-ance
17-Sep-04 4-Mar-05 20-Apr-05 12-Oct-05 25-Sep-09 23-Sep-14 23-Sep-14
12 Perpeptual or dated
Perpetual Perpetual Perpetual Perpetual Perpetual Perpetual Perpetual
13 Original maturity date
No maturity No maturity No maturity No maturity No maturity No maturity No maturity
14 Issuer call subject to prior super-visory approval
Yes Yes Yes Yes Yes Yes Yes

Parent company – Other notes
Nordea Annual Report 2014194
15 Optional call date, contingent call dates, and redemption amount
17-Sep-09In addition tax/regulatory call100 per cent of
nominal amount
4-Mar-35In addition tax/regulatory call100 per cent of
nominal amount
20-Apr-15In addition tax/regulatory call100 per cent of
nominal amount
12-Oct-35In addition tax/regulatory call100 per cent of
nominal amount
25-Mar-15In addition tax/regulatory call100 per cent of
nominal amount
23-Sep-19In addition tax/regulatory call100 per cent of
nominal amount
23-Sep-24In addition tax/regulatory call100 per cent of
nominal amount
16 Subsequent call dates, if applicable
17-Mar and 17-Sep each year
after first call date
4-Mar and 4-Sep each year
after first call date
20-Jan, 20-Apr, 20-Jul and 20-Oct
each year after first call date
12-Apr and 12-Oct each year
after first call date
25-Mar and 25-Sep each year
after first call date
23-Mar and 23-Sep each year
after first call date
23-Mar and 23-Sep each year
after first call date
Coupons / dividends
17 Fixed or floating div-idend/cou-pon
Floating Fixed to floating Fixed to floating Fixed to floating Fixed Fixed Fixed
18 Coupon rate and any related index
Floating 10-year CMS +0.05 per cent per annum subject to 8 per
cent cap
Fixed USD 3.75 per cent per
annum, until first call date, thereaf-
ter floating 6-month JPY
deposit +1.22 per cent per annum
Fixed 5.424 per cent per annum,
until first call date, thereafter
floating 3-month LIBOR +1.5875
per cent per annum
Fixed USD 3.84 per cent per
annum, until first call date, thereaf-
ter floating 6-month JPY
deposit +1.40 per cent per annum
Fixed 8.375 per cent per annum until first call
date, thereafter 5-year US Treas-
ury +5.985 per cent per annum, until 25 March 2020, thereafter 5-year US Treas-ury +8.9775 per cent per annum
Fixed 5.50 per cent per annum,
until first call date, thereafter
fixed 5-year mid swap +3.563 per cent per annum
Fixed 6.125 per cent per annum,
until first call date, thereafter
fixed 5-year mid swap +3.388 per cent per annum
19 Existence of a dividend stopper
Yes Yes Yes Yes No No No
20a Fully discre-tionary, par-tially discre-tionary or mandatory (in terms of timing)
Partially discretionary
Dividend stopper
Partially discretionary
Dividend stopper
Partially discretionary
Dividend stopper
Partially discretionary
Dividend stopper
Partially discretionary
Dividend stopper
Fully discretionary
Fully discretionary
20b Fully discre-tionary, par-tially discre-tionary or mandatory (in terms of amount)
Partially discretionary
Partially discretionary
Partially discretionary
Partially discretionary
Partially discretionary
Fully discretionary
Fully discretionary
21 Existence of step up or other incen-tive to redeem
No Yes Yes Yes Yes No No
22 Non-cumu-lative or cumulative
Non-cumulative Non-cumulative Non-cumulative Non-cumulative Non-cumulative Non-cumulative Non-cumulative
23 Convertible or non-con-vertible
Non-convertible Non-convertible Non-convertible Non-convertible Non-convertible Non-convertible Non-convertible
30 Write-down features
Yes Yes Yes Yes Yes Yes Yes
31 If write-down, write-down trigger (s)
To avoid liquidation
To avoid liquidation
To avoid liquidation
To avoid liquidation
To avoid or rem-edy any breach of
Applicable Banking
Regulations, shareholders resolution
Group CET1 ratio <8 per cent
Issuer CET1 ratio <5.125 per cent
Group CET1 ratio <8 per cent
Issuer CET1 ratio <5.125 per cent
32 If write-down, full or partial
Full or Partially Full or Partially Full or Partially Full or Partially Full or Partially Full or Partially Full or Partially
33 If write-down, per-manent or temporary
Temporary Temporary Temporary Temporary Temporary Temporary Temporary
P40 Capital adequacy, cont.

Other notes – Parent company
Nordea Annual Report 2014 195
34 If temporary write-down, description of write-up mechanism
Shareholders res-olution regarding reconversion and
reinstatement made out of avail-able distributable
funds
Shareholders res-olution regarding reconversion and
reinstatement, made out of avail-able distribution
funds
Shareholders res-olution regarding reconversion and
reinstatement made out of avail-able distributable
funds
Shareholders res-olution regarding reconversion and
reinstatement, made out of avail-able distribution
funds
Shareholders res-olution regarding reconversion and
reinstatement, made out of avail-able distribution
funds
Fully discretion-ary, if a positive
net profit of both Issuer and Group
Fully discretion-ary, if a positive
net profit of both Issuer and Group
35 Position in subordina-tion hier-achy in liq-uidation (specify instrument type imme-diately sen-ior to instru-ment)
Tier 2 Tier 2 Tier 2 Tier 2 Tier 2 Tier 2 Tier 2
36 Non-com-pliant tran-sitioned fea-tures
Yes Yes Yes Yes Yes No No
37 If yes, speci-fiy non-compliant features
No specified trigger level,
dividend stopper
No specified trigger level,
step-up, dividend stopper
No specified trigger level,
step-up, dividend stopper
No specified trigger level,
step-up, dividend stopper
No specified trigger level,
step-up, dividend pusher
N/A N/A
P40 Capital adequacy, cont.
Table A5- Capital instruments’ main features - T2
Tier 2 instrument
1 Issuer Nordea Bank AB (publ) Nordea Bank AB (publ) Nordea Bank AB (publ) Nordea Bank AB (publ) Nordea Bank AB (publ)
2 Unique identifier (eg CUSIP, ISIN or Bloomberg identifier for pri-vate placement)
XS0497179035 XS0544654162 US65557FAA49/US65557HAA05
XS0743689993 US65557FAD87/US65557HAD44
3 Governing law(s) of the instrument
Governed by English law, except for the sub-ordination provisions
which are governed by Swedish law
Governed by English law, except for the sub-ordination provisions
which are governed by Swedish law
Governed by the laws of the State of New York, except for the
subordination provi-sions which are gov-
erned by Swedish law
Governed by English law, except for the sub-ordination provisions
which are governed by Swedish law
Governed by the laws of the State of New York, except for the
subordination provi-sions which are gov-
erned by Swedish law
Regulatory treatment
4 Transitional CRR rules
Tier 2 Tier 2 Tier 2 Tier 2 Tier 2
5 Post-transitional CRR rules
Tier 2 Tier 2 Tier 2 Tier 2 Tier 2
6 Eligible at solo/(sub-)consoli-dated/solo & (sub-)consoli-dated
Solo & consolidated
Solo & consolidated
Solo & consolidated
Solo & consolidated
Solo & consolidated
7 Instrument type (types to be spec-ified by each jurisdiction)
Tier 2 as published in
Regulation (EU) No 575/2013
article 63
Tier 2 as published in
Regulation (EU) No 575/2013
article 63
Tier 2 as published in
Regulation (EU) No 575/2013
article 63
Tier 2 as published in
Regulation (EU) No 575/2013
article 63
Tier 2 as published in
Regulation (EU) No 575/2013
article 63
8 Amount recog-nised in regula-tory capital (cur-rency in million, as of most recent reporting date)
EUR 997m EUR 747m EUR 1,023m EUR 748m EUR 816m
9 Nominal amount of instrument
EUR 1,000m EUR 750m USD 1,250m EUR 750m USD 1,000m
9a Issue price 99.810 per cent 99.699 per cent 99.508 per cent 99.803 per cent 99.364 per cent
9b Redemption price 100 per cent of Nominal amount
100 per cent of Nominal amount
100 per cent of Nominal amount
100 per cent of Nominal amount
100 per cent of Nominal amount
10 Accounting clas-sification
Liability - amortised cost
Liability - amortised cost
Liability - amortised cost
Liability - amortised cost
Liability - amortised cost
11 Original date of issuance
26-Mar-10 29-Sep-10 13-May-11 15-Feb-12 21-Sep-12

Parent company – Other notes
Nordea Annual Report 2014196
12 Perpeptual or dated
Dated Dated Dated Dated Dated
13 Original maturity date
26-Mar-20 29-Mar-21 13-May-21 15-Feb-22 21-Sep-22
14 Issuer call subject to prior supervi-sory approval
Yes Yes Yes Yes Yes
15 Optional call date, contingent call dates, and redemption amount
Tax/regulatory call100 per cent of nominal
amount
Tax call100 per cent of nominal
amount
Tax call100 per cent of nominal
amount
15-Feb-17In addition tax call 100
per cent of nominal amount
Tax call/regulatory call,100 per cent of nominal
amount
Coupons / dividends
17 Fixed or floating dividend/coupon
Fixed Fixed Fixed Fixed Fixed
18 Coupon rate and any related index
4.50 % 4.00 % 4.875 % Fixed 4.625 per cent per annum (equivalent to
Euro Swap Rate +3.15 per cent per annum) to call
date, thereafter reset fixed rate to Euro Swap Rate +3.15 per cent per
annum
4.25 %
19 Existence of a dividend stopper
No No No No No
20a Fully discretion-ary, partially dis-cretionary or mandatory (in terms of timing)
Mandatory Mandatory Mandatory Mandatory Mandatory
20b Fully discretion-ary, partially dis-cretionary or mandatory (in terms of amount)
Mandatory Mandatory Mandatory Mandatory Mandatory
21 Existence of step up or other incen-tive to redeem
No No No No No
22 Non-cumulative or cumulative
Non-cumulative Non-cumulative Non-cumulative Non-cumulative Non-cumulative
23 Convertible or non-convertible
Non-convertible Non-convertible Non-convertible Non-convertible Non-convertible
35 Position in subor-dination hierachy in liquidation (specify instru-ment type imme-diately senior to instrument)
Senior debt Senior debt Senior debt Senior debt Senior debt
36 Non-compliant transitioned fea-tures
No No No No No
P40 Capital adequacy, cont.

Other notes – Parent company
Nordea Annual Report 2014 197
P41 Classification of financial instruments
Financial assets at fair value
through profit or loss
31 Dec 2014, EURm Loans and receivables
Held to maturity
Held for trading
Designated at fair value
through profit or loss
Derivatives used for hedging
Available for sale
Other financial
assets
Non-financial
assets Total
AssetsCash and balances with cen-tral banks 931 — — — — — — — 931Treasury bills — — 2,427 — — 2,608 — — 5,035Loans to credit institutions 86,259 — 445 0 — — — — 86,704Loans to the public 34,804 — 5,005 — — — — — 39,809Interest-bearing securities 10 112 3,687 — — 7,512 — — 11,321Financial instruments pledged as collateral — — 43 — — — — — 43Shares — — 6,028 33 — — — — 6,061Derivatives — — 3,682 — 2,299 — — — 5,981
Fair value changes of the hedged items in portfolio hedge of interest rate risk 1 — — — — — — — 1Investments in group undertakings — — — — — — 16,986 — 16,986
Investments in associated undertakings — — — — — — 7 — 7Intangible assets — — — — — — — 758 758Property and equipment — — — — — — — 119 119Deferred tax assets — — — — — — — 14 14
Current tax assets — — — — — — — 50 50Other assets 786 — — 10 — — — 2,931 3,727Prepaid expenses and accrued income 803 — — — — — — 81 884Total 123,594 112 21,317 43 2,299 10,120 16,993 3,953 178,431
Financial liabilities at fair value
through profit or loss
31 Dec 2014, EURm Held for trading
Designated at fair value
through profit or loss
Derivatives used for hedging
Other financial liabilities
Non-financial liabilities Total
LiabilitiesDeposits by credit institutions 2,508 2,026 — 22,918 — 27,452Deposits and borrowings from the public 268 466 — 48,633 — 49,367Debt securities in issue — — — 63,280 — 63,280Derivatives 3,443 — 1,210 — — 4,653Fair value changes of the hedged items in portfolio hedge of interest rate risk — — — 1,368 — 1,368Current tax liabilities — — — — 4 4Other liabilities 285 — — 443 2,167 2,895Accrued expenses and prepaid income — — — 198 444 642Deferred tax liabilities — — — — 0 0Provisions — — — — 206 206Retirement benefit liabilities — — — — 171 171
Subordinated liabilities — — — 7,728 — 7,728Total 6,504 2,492 1,210 144,568 2,992 157,766

Parent company – Other notes
Nordea Annual Report 2014198
Financial assets at fair value
through profit or loss
31 Dec 2013, EURm Loans and receivables
Held to maturity
Held for trading
Designated at fair value
through profit or loss
Derivatives used for hedging
Available for sale
Other financial
assets
Non-financial
assets Total
AssetsCash and balances with central banks 45 — — — — — — — 45Treasury bills — 17 4,935 — — — — — 4,952Loans to credit institutions 80,104 — 271 543 — — — 80,918Loans to the public 30,337 — — 3,818 — — — — 34,155Interest-bearing securities — 321 1,981 — — 8,826 — — 11,128Financial instruments pledged as collateral — — 737 — — — — — 737Shares — — 5,321 30 — — — — 5,351Derivatives — — 2,531 — 1,688 — — — 4,219Fair value changes of the hedged items in portfolio hedge of interest rate risk –11 — — — — — — — –11Investments in group undertakings — — — — — — 17,723 — 17,723
Investments in associated undertakings — — — — — — 7 — 7Intangible assets — — — — — — — 729 729Property and equipment — — — — — — — 118 118Deferred tax assets — — — — — — — 28 28
Current tax assets — — — — — — — 0 0Other assets 780 — — — — — — 1,753 2,533Prepaid expenses and accrued income 1,121 — — — — — — 170 1,291Total 112,376 338 15,776 4,391 1,688 8,826 17,730 2,798 163,923
Financial liabilities at fair value
through profit or loss
31 Dec 2013, EURm Held for trading
Designated at fair value
through profit or loss
Derivatives used for hedging
Other financial liabilities
Non-financial liabilities Total
LiabilitiesDeposits by credit institutions 753 2,071 — 14,676 — 17,500Deposits and borrowings from the public — 908 — 46,623 — 47,531Debt securities in issue 0 0 — 62,961 — 62,961Derivatives 2,614 — 1,013 — — 3,627Fair value changes of the hedged items in portfolio hedge of interest rate risk — — — 715 — 715Current tax liabilities — — — — 11 11Other liabilities 244 0 — 2,925 1,004 4,173Accrued expenses and prepaid income — — — 759 391 1,150Deferred tax liabilities — — — — 10 10Provisions — — — — 184 184Retirement benefit liabilities — — — — 166 166
Subordinated liabilities — — — 5,971 — 5,971Total 3,611 2,979 1,013 134,630 1,766 143,999
P41 Classification of financial instruments, cont.

Other notes – Parent company
Nordea Annual Report 2014 199
Loans designated at fair value through profit or loss
EURm31 Dec
201431 Dec
2013
Carrying amount 0 4,361Maximum exposure to credit risk 0 4,361
Financial assets and liabilities designated at fair value through profit or lossChanges in fair values of financial liabilities attributable to changes in credit riskThe funding of Markets operations is measured at fair value and classified into the category “Fair value through profit or loss”. The funding of Markets is generally of such a short term nature that the effect of changes in own credit risk is not sig-nificant.
Comparison of carrying amount and contractual amount to be paid at maturity
2014, EURmCarrying
amount
Amount to be
paid at maturity
Financial liabilities designated at fair value through profit or loss 2,492 2,492
2013, EURmCarrying
amount
Amount to be
paid at maturity
Financial liabilities designated at fair value through profit or loss 2,979 2,979
P42 Assets and liabilities at fair value
31 Dec 2014 31 Dec 2013
EURmCarrying
amountFair
valueCarrying
amountFair
value
Financial assetsCash and balances with central banks 931 931 45 45Treasury bills 5,035 5,035 4,952 4,952Loans 126,514 126,518 115,062 115,062Interest-bearing securities 11,321 11,322 11,128 11,135Financial instruments pledged as collateral 43 43 737 737Shares 6,061 6,061 5,351 5,351Derivatives 5,981 5,981 4,219 4,219Other assets 796 796 780 780Prepaid expenses and accrued income 803 803 1,121 1,121Total financial assets 157,485 157,490 143,395 143,402
Financial liabilitiesDeposits and debt instruments 149,195 149,792 134,678 135,333Derivatives 4,653 4,653 3,627 3,627Other liabilities 728 728 3,169 3,169Accrued expenses and prepaid income 198 198 759 759Total financial liabilities 154,774 155,371 142,233 142,888
For information about valutation of items measured at fair value on the balance sheet, see Note G1 "Accounting poli-cies" and the section "Determination of fair value for items measured at fair value on the balance sheet" in Note G40 "Assets and liabilities at fair value". For information about valuation of items not measured at fair value on the balance sheet, see the section "Financial assets and liabilities not held at fair value on balance sheet", in Note G40.
P41 Classification of financial instruments, cont.
Fair value of financial assets and liabilities

Parent company – Other notes
Nordea Annual Report 2014200
P42 Assets and liabilities at fair value, cont.
Assets and liabilities held at fair value on the balance sheetCategorisation into the fair value hierarchy
31 Dec 2014, EURm
Quoted prices in active markets for the
same instrument (Level 1)
Valuation technique using observable data
(Level 2)
Valuation technique using non-observable data
(Level 3) Total
Assets at fair value on the balance sheet1
Treasury bills 2,814 2,221 — 5,035Loans to credit institutions — 445 — 445
Loans to the public — 5,005 — 5,005Interest-bearing securities2 7,229 3,858 155 11,242
Shares 6,032 — 29 6,061Derivatives 50 5,911 20 5,981Other assets — 10 — 10Total 16,125 17,450 204 33,779
Liabilities at fair value on the balance sheet1
Deposits by credit institutions — 4,534 — 4,534Deposits and borrowings from the public — 734 — 734Derivatives 51 4,590 12 4,653Other liabilities 185 100 — 285Total 236 9,958 12 10,206
1) All items are measured at fair value on a recurring basis at the end of each reporting period.2) Of which EUR 43m relates to the balance sheet item Financial instruments pledged as collateral.
31 Dec 2013, EURm
Quoted prices in active markets for the
same instrument (Level 1)
Valuation technique using observable data
(Level 2)
Valuation technique using non-observable data
(Level 3) Total
Assets at fair value on the balance sheet1
Treasury bills 542 4,393 — 4,935Loans to credit institutions — 814 — 814
Loans to the public — 3,818 — 3,818
Interest-bearing securities2 11,055 330 159 11,544
Shares 5,326 — 25 5,351Derivatives 14 4,183 22 4,219Total 16,937 13,538 206 30,681
Liabilities at fair value on the balance sheet1
Deposits by credit institutions — 2,824 — 2,824Deposits and borrowings from the public — 908 — 908Derivatives 17 3,606 4 3,627Other liabilities 95 149 — 244Total 112 7,487 4 7,603
1) All items are measured at fair value on a recurring basis at the end of each reporting period.2) Of which EUR 737m relates to the balance sheet item Financial instruments pledged as collateral.
For determination of fair values for items measured at fair value on the balance sheet, see Note G40 "Assets and liabilities at fair value".
Transfers between level 1 and 2During the year, the parent company transferred interest-bearing securities (including such financial instruments pledged as collateral) of EUR 570m (EUR 223m) from Level 2 to Level 1 of the fair value hierarchy. During 2013 Nordea transferred interest-bearing securities (including such financial instruments pledged as collateral) of EUR 253m from Level 1 to Level 2. The reason for the transfers from Level 2 to Level 1 was that the instruments have again been
actively traded during the year and reliable quoted prices are obtained in the markets. The reason for the transfers from Level 1 to Level 2 was that the instruments ceased to be actively traded during the year and fair values have now been obtained using valuation techniques with observable market inputs. Transfers between levels are considered to have occurred at the end of the year.

Other notes – Parent company
Nordea Annual Report 2014 201
P42 Assets and liabilities at fair value, cont.
Movements in Level 3
Fair value gains/losses recognised in the income statement during the year
2014, EURm 1 Jan 2014 Reclassification Realised Unrealised Sales31 Dec
2014
Interest-bearing securities 159 — — — –4 155Shares 25 — 4 — — 29Derivatives (net) 18 –3 — –7 — 8
Unrealised gains and losses relates to those assets and liabilities held at the end of the year. No transfers have been made into or out of level 3. Assets and liabilities related to derivatives are presented net.
Unrealised gains and losses relates to those assets and lia-bilities held at the end of the year. The parent company has transferred derivatives of EUR 22m from Level 2 into Level 3 during the year. The reason for the transfer from Level 2 to Level 3 was that observable market data was no longer availa-ble. Transfers between levels are considered to have occurred at the end of the year. Fair value gains and losses in the income statement during the year are included in "Net result
from items at fair value" (see Note P5). Assets and liabilities related to derivatives are presented net.
The valuation processes for fair value measurements in Level 3Financial instrumentsFor information about the valuation processes, see Note G40 "Assets and liabilities at fair value".
2013, EURm 1 Jan 2013 Unrealised SettlementsNet transfers into/
out of level 3Translation differences
31 Dec 2013
Interest-bearing securities 163 — –4 — — 159Shares 30 — — — –5 25Derivatives (net) 0 –4 — 22 — 18
Valuation techniques and inputs used in the fair value measurements in Level 3
31 Dec 2014, EURm Fair value Valuation techniques Unobservable input Range of fair value
Interest-bearing securities Credit institutions1 155 Discounted cash flows Credit spread +/–0Total 155 +/–0
SharesUnlisted shares 29 Net asset value +/–2Total 29 +/–2
DerivativesInterest rate derivatives 8 Option model Corrections volatilies +/–0Total 8 +/–0
1) Of which EUR 155m is priced at a credit spread (the difference between the discount rate and LIBOR) of 1.45% and a reasonable change of this credit spread would not affect the fair value due to callability features.

Parent company – Other notes
Nordea Annual Report 2014202
The tables above shows, for each class of assets and liabilities categorised in Level 3, the fair value, the valuation techniques used to estimate the fair value, significant unobservable inputs used in the valuation techniques and for financial assets and lia-bilites the fair value sensitivity to changes in key assumptions.
The column “range of fair value” in the tables above shows the sensitivity of the fair values of Level 3 financial instru-ments to changes in key assumptions. Where the exposure to an unobservable parameter is offset across different instru-ments then only the net impact is disclosed in the table. The range disclosed are likely to be greater than the true uncer-tainty in fair value of these instruments, as it is unlikely in practice that all unobservable parameters would be simulta-neously at the extremes of their ranges of reasonably possible alternatives. The disclosure is neither predictive nor indica-tive of future movements in fair value.
In order to calculate the sensitivity (range) in fair value of derivatives a range of different modelling approaches are
applied to determine an uncertainty interval around the reported fair value. The different approaches applied target various aspects of derivatives pricing. Two common compo-nents of derivative valuation models are volatility of underly-ing risk factors and correlation between the relevant risk fac-tors. Each of these is addressed by applying different assumptions to input and/or the choice of modelling approach. Besides these common factors a number of asset class specific factors are addressed. These include equity divi-dend expectations, recovery assumptions for credit deriva-tives and inflation expectations. The fair values of derivatives are presented as the net of assets and liabilities.
In order to calculate the sensitivity (range) in fair value of shares and interest-bearing securities the fair value was increased and decreased within a range of 10 percentage units which are assessed to be reasonable changes in market movements.
Valuation techniques and inputs used in the fair value measurements in Level 3
31 Dec 2013, EURm Fair value Valuation techniques Unobservable input Range of fair value
Interest-bearing securities Credit institutions1 159 Discounted cash flows Credit spread +/–0Total 159 +/–0
SharesUnlisted shares 25 Net asset value +/–2Total 25 +/–2
DerivativesInterest rate derivatives 18 Option model Correlations Volatilies +/–0Total 18 +/–0
1) Of which EUR 155m is priced at a credit spread (the difference between the discount rate and LIBOR) of 1.45% and a reasonable change of this credit spread would not affect the fair value due to callability features.
P42 Assets and liabilities at fair value, cont.

Other notes – Parent company
Nordea Annual Report 2014 203
P42 Assets and liabilities at fair value, cont.
Financial assets and liabilities not held at fair value on the balance sheet
31 Dec 2014 31 Dec 2013
31 Dec 2014, EURmCarrying
amount Fair valueCarrying
amount Fair value
Level in fair value hierarchy
Assets not held at fair value on the balance sheetCash and balances with central banks 931 931 45 45 3Treasury bills1,2 0 0 17 17 2Loans 121,063 121,068 110,430 110,430 3Interest-bearing securities2 122 123 321 328 1,2Other assets 786 786 780 780 3Prepaid expenses and accrued income 803 803 1,121 1,121 3Total 123,705 123,711 112,714 112,721
Liabilities not held at fair value on the balance sheetDeposits and debt instruments 143,927 144,524 130,946 131,601 3Other liabilities 443 443 2,925 2,925 3Accrued expenses and prepaid income 198 198 759 759 3Total 144,568 145,165 134,630 135,285
1) The measurement principles follow those for similar instruments that are held at fair value on the balance sheet.2) The fair value of Treasury bills and Interest-bearing securities is EUR 123m (345m), of which EUR 54m (207m) is categorised in Level 1 and EUR 69m (138m) in Level 2 of the fair
value hierarchy.
For more information about measurement of the fair values in the table above, see section "Financial assets and liabilities not held at fair value on the balance sheet" in Note G40 "Assets and liabilities at fair value".

Parent company – Other notes
Nordea Annual Report 2014204
Amounts not set off but subject to master netting agreements and similar agreements
31 Dec 2014, EURm
Gross recognised
financial liabilities1
Gross recog-nised finan-
cial liabilities set off on the balance sheet
Net carrying amount on the balance
sheet2Financial
instruments
Financial collateral received
Cash collat-eral received Net amount
AssetsDerivatives 5,558 –70 5,488 –1,286 — –2,157 2,045
Reverse repurchase agreements 218 — 218 — — — 218Securities borrowing agreements 5,232 — 5,232 — –5,232 — 0Total 11,008 –70 10,938 –1,286 –5,232 –2,157 2,263
Amounts not set off but subject to master netting agreements and similar agreements
31 Dec 2014, EURm
Gross recognised
financial liabilities1
Gross recog-nised finan-
cial assets set off on the
balance sheet
Net carrying amount on the balance
sheet2Financial
instruments
Financial collateral
pledged Cash collat-eral pledged Net amount
LiabilitiesDerivatives 4,189 –70 4,119 –1,286 — –363 2,470Repurchase agreements 43 — 43 — — — 43
Securities lending agreements 2,732 — 2,732 — –2,732 — 0
Total 6,964 –70 6,894 –1,286 –2,732 –363 2,513
1) All amounts are measured at fair value.2) Reverse repurchase agreements and Securities borrowing agreements are on the balance sheet classified as "Loans to credit institutions" or "Loans to the public". Repur-
chase agreements and Securities lending agreements are on the balance sheet classified as "Deposits by credit institution" or as "Deposits and borrowings from the public".
Amounts not set off but subject to master netting agreements and similar agreements
31 Dec 2013, EURm
Gross recognised
financial liabilities1
Gross recog-nised finan-
cial liabilities set off on the balance sheet
Net carrying amount on the balance
sheet2Financial
instruments
Financial collateral received
Cash collat-eral received Net amount
AssetsDerivatives 3,693 –102 3,591 –1,886 –1 –1,228 476Reverse repurchase agreements 211 — 211 –211 — — 0Securities borrowing agreements 4,354 — 4,354 — –4,354 — 0Total 8,258 –102 8,156 –2,097 –4,355 –1,228 476
Amounts not set off but subject to master netting agreements and similar agreements
31 Dec 2013, EURm
Gross recognised
financial liabilities1
Gross recog-nised finan-
cial assets set off on the
balance sheet
Net carrying amount on the balance
sheet2Financial
instruments
Financial collateral
pledged Cash collat-eral pledged Net amount
LiabilitiesDerivatives 3,074 –102 2,972 –1,886 — –123 963Repurchase agreements 693 — 693 –211 –482 — 0Securities lending agreements 2,979 — 2,979 — –2,979 — 0Total 6,746 –102 6,644 –2,097 –3,461 –123 963
1) All amounts are measured at fair value.2) Reverse repurchase agreements and Securities borrowing agreements are on the balance sheet classified as "Loans to credit institutions" or "Loans to the public". Repurchase
agreements and Securities lending agreements are on the balance sheet classified as "Deposits by credit institution" or as "Deposits and borrowings from the public".
For more information about the master netting arrangements and similar agreements see section "Enforcable master netting arrangements and similar agreements" in Note G41 "Financial instruments set off on balance or subject to netting agreements".
P43 Financial instruments set off on balance or subject to netting agreements

Other notes – Parent company
Nordea Annual Report 2014 205
P44 Assets and liabilities in foreign currencies
31 Dec 2014, EURbn EUR SEK DKK NOK USD Other Total
Total assets 57.2 57.5 2.4 4.5 35.8 21.0 178.4Total liabilities 36.2 57.9 2.4 4.5 35.8 21.0 157.8
31 Dec 2013, EURbn EUR SEK DKK NOK USD Other Total
Total assets 47.2 58.1 4.6 4.7 34.6 14.7 163.9Total liabilities 27.1 58.3 4.6 4.7 34.6 14.7 144.0
Obtained collaterals which are permitted to be sold or repledged Nordea obtains collaterals under reverse repurchase and securities borrowing agreements which, under the terms of the agreements, can be sold or repledged. The transactions are conducted under standard agreements employed by financial markets participants. Generally, the agreements require additional collateral to be provided if the value of the securities falls below a predetermined level. Under standard terms for most repurchase transactions, the recipient of col-lateral has an unrestricted right to sell or repledge it, subject to returning equivalent securities on settlement of the trans-actions. The fair value of the securities obtained as collateral under reverse repurchase and securities borrowing agree-ments are disclosed below.
EURm31 Dec
201431 Dec
2013
Reverse repurchase agreementsReceived collaterals which can be repledged or sold 214 268– of which repledged or sold — 268
Securities borrowing agreementsReceived collaterals which can be repledged or sold 5,232 2,077– of which repledged or sold 5,232 2,077Total 5,446 2,345
P45 Transferred assets and obtained collaterals
Transferred assets that are still recognised on the balance sheet and associated liabilities All assets transferred and the liabilities associated with these transactions are specified in the following tables. The assets continue to be recognised on the balance sheet since Nordea is still exposed to changes in the fair value of the assets. Therefore, these assets and its associated liabilities are included in the tables below.
EURm31 Dec
201431 Dec
2013
Repurchase agreementsTreasury bills 43 737Total 43 737
Liabilities associated with the assets
EURm31 Dec
201431 Dec
2013
Repurchase agreementsDeposits by credit institutions 43 753Total 43 753

Parent company – Other notes
Nordea Annual Report 2014206
P46 Maturity analysis for assets and liabilities
Expected maturity31 Dec 2014, EURm 31 Dec 2013, EURm
Expected to be recovered or settled: Expected to be recovered or settled:
NoteWithin 12
monthsAfter 12 months Total
Within 12 months
After 12 months Total
Cash and balances with central banks 931 — 931 45 — 45Treasury bills P14 — 5,035 5,035 — 4,952 4,952Loans to credit institutions P15 62,067 24,637 86,704 64,337 16,581 80,918Loans to the public P15 34,829 4,980 39,809 30,308 3,847 34,155Interest-bearing securities P16 3,849 7,472 11,321 2,237 8,891 11,128Financial instruments pledged as collateral P17 43 — 43 737 — 737Shares P18 6,028 33 6,061 5,321 30 5,351Derivatives P19 1,520 4,461 5,981 744 3,475 4,219Fair value changes of the hedged items in portfolio hedge of interest rate risk P20 — 1 1 –2 –9 –11Investments in group undertakings P21 30 16,956 16,986 — 17,723 17,723Investments in associated undertakings P22 — 7 7 — 7 7Intangible assets P23 — 758 758 — 729 729Property and equipment P24 0 119 119 — 118 118Deferred tax assets P13 11 3 14 19 9 28Current tax assets 50 — 50 0 — 0Other assets P25 3,727 — 3,727 2,533 — 2,533Prepaid expenses and accrued income P26 496 388 884 850 441 1,291Total assets 113,581 64,850 178,431 107,129 56,794 163,923
Deposits by credit institutions P27 15,595 11,857 27,452 13,356 4,144 17,500Deposits and borrowings from the public P28 48,948 419 49,367 47,412 119 47,531Debt securities in issue P29 33,755 29,525 63,280 35,606 27,355 62,961Derivatives P19 1,023 3,630 4,653 763 2,864 3,627Fair value changes of the hedged items in portfolio hedge of interest rate risk P20 178 1,190 1,368 52 663 715Current tax liabilities 4 — 4 11 — 11Other liabilities P30 2,895 — 2,895 4,173 — 4,173Accrued expenses and prepaid income P31 642 — 642 1,150 — 1,150
Deferred tax liabilities P13 0 — 0 10 — 10Provisions P32 43 163 206 42 142 184Retirement benefit liabilities P33 — 171 171 — 166 166Subordinated liabilities P34 — 7,728 7,728 — 5,971 5,971Total liabilities 103,083 54,683 157,766 102,575 41,424 143,999

Other notes – Parent company
P46 Maturity analysis for assets and liabilities, cont.
Contractual undiscounted cash flows
31 Dec 2014, EURmPayable on
demandMaximum
3 months 3–12 months 1–5 yearsMore than
5 years Total
Treasury bills — 78 681 4,020 639 5,418Loans to credit institutions 8,033 38,555 18,687 16,661 8,881 90,817Loans to the public 727 13,870 6,802 15,941 6,437 43,777Interest bearing securities — 1,095 1,926 8,333 797 12,151Other — 13,606 — — — 13,606Total financial assets 8,760 67,204 28,096 44,955 16,754 165,769
Deposits by credit institutions 3,344 15,023 1,698 7,484 293 27,842Deposits and borrowings from the public 38,699 7,658 2,410 432 — 49,199– of which Deposits 38,699 7,658 2,410 432 — 49,199Debt securities in issue — 19,491 19,093 23,767 16,989 79,340– of which Debt securities in issue — 18,574 17,884 22,723 10,129 69,310– of which Other — 917 1,209 1,044 6,860 10,030Other — 6,939 — — — 6,939Total financial liabilities 42,043 49,111 23,201 31,683 17,282 163,320
Derivatives, cash inflow — 28,770 5,394 17,159 5,759 57,082Derivatives, cash outflow — 27,963 5,282 16,281 5,152 54,678Net exposure — 807 112 878 607 2,404
Exposure –33,283 18,900 5,007 14,150 79 4,853Cumulative exposure –33,283 –14,383 –9,376 4,774 4,853 —
31 Dec 2013, EURmPayable on
demandMaximum
3 months 3–12 months 1–5 yearsMore than
5 years Total
Treasury bills — 202 482 4,687 814 6,185Loans to credit institutions 35 47,340 16,639 13,358 6,021 83,393Loans to the public — 11,085 4,586 16,991 4,304 36,966Interest bearing securities — 327 2,845 7,450 1,965 12,587Other — — — — 11,519 11,519Total financial assets 35 58,954 24,552 42,486 24,623 150,650
Deposits by credit institutions 1,855 10,808 1,468 3,515 184 17,830Deposits and borrowings from the public 36,191 8,361 1,634 1,171 294 47,651– of which Deposits 36,191 8,361 1,634 1,171 294 47,651Debt securities in issue — 23,414 13,230 25,119 12,631 74,394– of which Debt securities in issue — 23,253 13,110 22,377 7,630 66,370– of which Other — 161 120 2,742 5,001 8,024Other — — — — 28,209 28,209
Total financial liabilities 38,046 42,583 16,332 29,805 41,318 168,084
Derivatives, cash inflow — 22,486 21,415 32,842 6,480 83,223Derivatives, cash outflow — 22,123 20,049 33,955 5,809 81,936Net exposure — 363 1,366 –1,113 671 1,287
Exposure –38,011 16,734 9,586 11,568 –16,024 –16,147Cumulative exposure –38,011 –21,277 –11,691 –123 –16,147 —
The table is based on contractual maturities for on balance sheet financial instruments. For derivatives, the expected cash inflows and outflows are disclosed for both derivative assets and deriva-tive liabilities, as derivatives are managed on a net basis. In addi-tion to the instruments on the balance sheet and derivative instruments, Nordea has credit commitments amounting to
EUR 23,824m (EUR 26,713m), which could be drawn on at any time. Nordea has also issued guarantees of EUR 71,103m (EUR 70,385m) which may lead to future cash outflows if certain events occur.
For further information about remaining maturity, see also the section "Risk, Liquidity and Capital management".
207Nordea Annual Report 2014

Parent company – Other notes
Compensation and loans to key management personnelCompensation and loans to key management personnel are specified in Note G7 "Staff costs".
Other related-party transactionsNordea Bank AB (publ) takes part in a guarantee consortium to support Norwegian Eksportfinans ASA. For further infor-mation, see Note G46 "Related-party transactions".
P47 Related-party transactions
The information below is presented from a Nordea perspective, meaning that the information shows the effect from related party transactions on the Nordea figures. For more information on definitions, see Note G1 "Accounting policies", section 26 and Note G46 "Related-party transactions".
Group undertakings Associated undertakings Other related parties
EURm31 Dec
201431 Dec
201331 Dec
201431 Dec
201331 Dec
201431 Dec
2013
AssetsLoans and receivables 82,711 80,672 369 141 — —Interest-bearing securities 64 117 — — — —
Derivatives 2,495 1,766 5 6 — —Investments in associated undertakings — — 7 7 — —Investments in group undertakings 16,986 17,723 — — — —Other assets 857 847 — — — —Prepaid expenses and accrued income 638 768 — — — —Total assets 103,751 101,893 381 154 — —
Group undertakings Associated undertakings Other related parties
EURm31 Dec
201431 Dec
201331 Dec
201431 Dec
201331 Dec
201431 Dec
2013
LiabilitiesDeposits 15,240 6,688 2 2 20 21Debt securities in issue 260 340 — — —Derivatives 3,246 2,252 — — — —Other liabilities 4 267 — — — —Accrued expenses and deferred income 240 172 — — — —Subordinated liabilities 20 — — — — —Total liabilities 19,010 9,719 2 2 20 21Off balance1 72,836 77,684 1,809 1,931 — —
1) Including guarantees to Nordea Bank Finland Plc and Nordea Bank Polska S.A., see Note P38 "Contingent liabilities" as well as nominal values on derivatives in associated undertakings.
Group undertakings Associated undertakings Other related parties
EURm 2014 2013 2014 2013 2014 2013
Net interest income and expenses 108 209 3 1 0 0Net fee and commission income 406 612 0 — — —Net result from items at fair value –309 525 12 9 — —
Other operating income 687 637 — — — —Total operating expenses –137 –133 0 — — —Profit before loan losses 755 1,850 15 10 0 0
Nordea Annual Report 2014208

Signing of the Annual Report
209Nordea Annual Report 2014
The Board of Directors and the President and CEO certify that the annual report has been prepared in accordance with generally accepted accounting principles in Sweden and the consolidated financial statements have been
prepared in accordance with the International Reporting Standards (IFRS/IAS) referred to in the European parliament and councils’ regulation (EC) 1606/2002, from 19 July 2002, on application of International Accounting Standards.
They give a true and fair view of the Group’s and the Company’s financial position and result. The Board of Directors’ Report for the Group and the Company gives a true and fair overview of the development of the operations, financial
position and result of the Group and the Company and describes the material risks and uncertainties that the Company and the Group companies are facing.
5 February 2015
Björn WahlroosChairman
Marie Ehrling Elisabeth Grieg Tom Knutzen Vice Chairman Board member Board member
Robin Lawther Toni H. Madsen Lars G Nordström Board member Board member1 Board member
Lars Oddestad Hans Christian Riise Board member 1 Board member1
Sarah Russel l Kari Stadigh Board member Board member
Christian Clausen President and CEO
Our audit report was submitted on 6 February 2015
KPMG AB
Hans ÅkervallAuthorised Public Accountant
1) Employee representative.
Signing of the Annual Report

Nordea Annual Report 2014210
Auditor’s report
Report on the annual accounts and the consolidated accountsWe have audited the annual accounts and the consolidated accounts of Nordea Bank AB (publ) for the year 2014. The annual accounts and the consolidated accounts of the company are included in the printed version of this docu-ment on pages 28–209.
Responsibilities of the Board of Directors and the Managing Director for the annual accounts and the consolidated accountsThe Board of Directors and the Managing Director are responsible for the preparation and fair presentation of the annual accounts in accordance with the Annual Accounts Act of Credit Institutions and Security Companies and for the fair presentation of the consolidated accounts in accordance with the International Financial Reporting Standards, as adopted by the EU, and the Annual Accounts Act of Credit Institutions and Securities Companies, and for such internal control as the Board of Directors and the Managing Director determine is necessary to enable the preparation of annual accounts and the consolidated accounts that are free from material misstatement, whether due to fraud or error.
Auditor’s responsibilityOur responsibility is to express an opinion on these annual accounts and consolidated accounts based on our audit. We conducted our audit in accordance with Interna-tional Standards on Auditing and generally accepted auditing standards in Sweden. Those standards require that we comply with ethical requirements and plan and perform the audit to obtain reasonable assurance about whether the annual accounts and the consolidated accounts are free from material misstatements. An audit involves performing procedures to obtain audit evidence about the amounts and disclosures in the annual accounts and the consolidated accounts. The procedures selected depend on the auditor’s judgment, including the assess-ment of the risks of material misstatement of the annual accounts and the consolidated accounts, whether due to fraud or error. In making those risk assessments, the audi-tor considers internal control relevant to the company’s preparation and fair presentation of the annual accounts and the consolidated accounts in order to design audit procedures that are appropriate in the circumstances, but not for the purpose of expressing an opinion on the effec-tiveness of the company’s internal control. An audit also includes evaluating the appropriateness of accounting pol-icies used and the reasonableness of accounting estimates made by the Board of Directors and the Managing Direc-tor, as well as evaluating the overall presentation of the annual accounts and the consolidated accounts.We believe that the audit evidence we have obtained is sufficient and appropriate to provide a basis for our audit opinions.
OpinionsIn our opinion, the annual accounts have been prepared in accordance with the Annual Accounts Act of Credit Insti-tutions and Securities Companies, and present fairly, in all material respects, the financial position of the parent com-pany as of 31 December 2014 and of its financial perfor-mance and cash flows for the year then ended in accord-ance with the Annual Accounts Act of Credit Institutions and Securities Companies. The consolidated accounts have been prepared in accordance with the Annual Accounts Act of Credit Institutions and Securities Compa-nies, and present fairly, in all material respects, the finan-cial position of the group as of 31 December 2014 and of its financial performance and cash flows for the year then ended in accordance with the International Financial Reporting Standards, as adopted by the EU, and the Annual Accounts Act of Credit Institutions and Securities Companies. A Corporate Governance Report has been prepared. The Board of Director’s report and the Corpo-rate Governance Report are consistent with the other parts of the annual accounts and the consolidated accounts.
We therefore recommend that the annual meeting of shareholders adopt the income statement and balance sheet of the parent company and the group.
Report on other legal and regulatory requirementsIn addition to our audit of the annual accounts and the consolidated accounts, we have also audited the proposed appropriations of the company’s profit or loss and the administration of the Board of Directors and the Manag-ing Director of Nordea Bank AB (publ) for the year 2014.
Responsibilities of the Board of Directors and the Managing DirectorThe Board of Directors is responsible for the proposal for appropriations of the company’s profit or loss, and the Board of Directors and the Managing Director are respon-sible for administration under the Companies Act and the Banking and Financing Business Act.
Auditor’s responsibilityOur responsibility is to express an opinion with reasona-ble assurance on the proposed appropriations of the com-pany’s profit or loss and on the administration based on our audit. We conducted the audit in accordance with gen-erally accepted auditing standards in Sweden.
As a basis for our opinion on the Board of Directors’ proposed appropriations of the company’s profit or loss, we examined the Board of Directors’ reasoned statement and a selection of supporting evidence in order to be able to assess whether the proposal is in accordance with the Companies Act.
As a basis for our opinion concerning discharge from liability, in addition to our audit of the annual accounts and the consolidated accounts, we examined significant
To the annual meeting of the shareholders of Nordea Bank AB (publ)Corporate identity number 516406-0120

Nordea Annual Report 2014 211
decisions, actions taken and circumstances of the company in order to determine whether any member of the Board of Directors or the Managing Director is liable to the com-pany. We also examined whether any member of the Board of Directors or the Managing Director has, in any other way, acted in contravention of the Companies Act, the Banking and Financing Business Act, the Annual Accounts Act of Credit Institutions and Securities Companies, or the Articles of Association.
Stockholm, 6 February 2015
KPMG AB
Hans ÅkervallAuthorised Public Accountant
We believe that the audit evidence we have obtained is sufficient and appropriate to provide a basis for our opinions.
OpinionsWe recommend to the annual meeting of shareholders that the profit be appropriated in accordance with the proposal in the Board of Director’s report and that the members of the Board of Directors and the Managing Director be dis-charged from liability for the financial year.
Legal structureMain legal structure*, as of 31 December 2014
Nordea Bank AB (publ)Sweden
Nordea Life Holding AB Sweden
Holdingcompany
JSC Nordea Bank
Russia
Nordea BankNorge ASA
Norway
Nordea BankDanmark A/S
Denmark
Nordea Hypotek AB (publ)
Sweden
Nordea Pensions
Estonia ASEstonia
IPAS Nordea Pensions
LatviaLatvia
Nordea Liv Holding
Norge ASNorway
Varioussubsidiaries
Nordea Life AssuranceFinland Ltd
Finland
Nordea Life &Pension S.A.Luxembourg
Nordea PowszechneTowarzystwo
Emerytalne S.A.Poland
Nordea Livförsäkring Sverige AB
(publ)Sweden
Nordea Liv & Pension
livsforsikrings- selskab A/S
Denmark
Varioussubsidiaries
Nordea BankFinland Plc
Finland
Fund companiesInvestment manage-
ment companiesVarious subsidiaries
Varioussubsidiaries
Nordea Kredit Realkredit-
aktieselskab Denmark
Nordea Eiendoms-kreditt AS
Norway
Varioussubsidiaries
Varioussubsidiaries
* Further information is presented in Note P21. Nordea’s banking business in the Baltic countries is operated as branches of Nordea Bank AB (publ).

Organisation
Board of Directors
Björn WahlroosChairman Ph.D (Economics), 1979. Board member since 2008 and Chairman since 2011. Born 1952. Nationality Finnish.Board Chairman of Sampo plc and UPM-Kymmene Corporation. Other assignments: Board Chairman of Hanken School of Economics. Board member of several charities, including the Finnish Business and Policy Forum EVA/ETLA and the Mannerheim Foundation.
Previous positions:2001–2009 Group CEO and President of Sampo plc 2005–2007 Chairman of Sampo Bank plc 1998–2000 Chairman and CEO of Mandatum Bank plc1992–1997 President of Mandatum & Co Ltd1985–1992 Various positions with Union Bank of Finland including executive vice president and member of the executive committee 1989–19921983–1984 Visiting associate professor in Managerial Economics and Decision Sciences at Kellogg Graduate School of Management, Northwestern University1980–1981 Visiting assistant professor in Economics at Brown University1979–1985 Professor of Economics at Hanken School of Economics1974–1979 Assistant professor and lecturer in Finance at Hanken School of Economics
Shareholding in Nordea: 100,000*
Marie EhrlingVice ChairmanBSc (Economics). Board member since 2007 and Vice Chairman since 2011. Born 1955. Nationality Swedish.Board Chairman of the TeliaSonera AB (publ) Board member of Securitas AB and Axel Johnson AB.Other assignments: Board member of Centre for Advanced Studies of Leadership at Stockholm School of Economics and the Advisory Board Stockholm School of Economics. Member of the Royal Swedish Acad-emy of Engineering Sciences (IVA).
Previous positions:2003–2006 CEO TeliaSonera Sverige AB1982–2002 Deputy CEO SAS Group, Head of SAS Airline and other executive positions within the SAS group1980–1982 Information officer at the Ministry of Finance1979–1980 Information officer at the Ministry of Education1977–1979 Financial analyst at Fourth Swedish National Pension Fund
Shareholding in Nordea: 3,075*
Elisabeth GriegBachelor (Economics) and Master (Human resources management). Board member since 2013. Born 1959. Nationality: Norwegian.Board Chair of Snøhetta Design AS. Board member of Grieg Maturitas AS and Board chair/Board member of several other companies within the Grieg Group. Vice chair of Salthavn AS and board member of a group company. Other assignments: Board member of the Grieg Foundation and the SOS Children’s Villages Norway. Member of the Nordic Committee of Det Norske Veritas (DNV). Advisory board member of Bellona (Sahara Forest Project).
Previous positions:2011–2013 Board Chair of Norwegian Guarantee Institute for Export Credits (GIEK)2002–2010 President (2008-2010), Vice president (2004-2008) and Board member (2002-2004) of Norwegian Shipowners’ Association2007–2010 Board member of Statoil ASA2001–2007 Board member of Norsk Hydro ASA including deputy chair (2006-2007) and acting chair (2007)1985–1987 Analyst in Shipping Division of Bergen Bank1982–1985 Chartering assistant of Star Shipping, San Francisco and New York
Shareholding in Nordea: 5,400*
Tom KnutzenMSc (Economics). Board member since 2007. Born 1962. Nationality Danish.CEO Jungbunzlauer Suisse AG and Board chairman of group compa-nies.Board member of FLSmidth & Co A/S.
Previous positions:2006–2011 CEO Danisco A/S2000–2006 CEO NKT Holding A/S1996–2000 CFO NKT Holding A/S1988–1996 Various positions within Niro A/S1985–1988 Various positions within Fællesbanken
Shareholding in Nordea: 47,750*
Marie Ehrling
Lars G Nordström
Elisabeth Grieg
Kari StadighSarah Russell
Tom Knutzen
Robin Lawther
Björn Wahlroos
Nordea Annual Report 2014212

Nordea Annual Report 2014 213
Organisation
Robin LawtherBA Honours (Economics) and MSc (Accounting & Finance). Board member since 2014. Born 1961. Nationality American and British.Board member of UK Government’s Shareholder Executive.
Previous positions:1985–2012 Various positions within J.P. Morgan:2011–2012 Head, Wealth Management for Southeast, USA2007–2011 Head, Nordic Investment Bank, UK2005–2007 Head, Mergers & Acquisitions Execution, European Financial Institutions, UK2003–2005 Head, Commercial Banking Group, UK 1994–2005 Managing Director, Financial Institutions Investment Banking, UK 1990–1994 Vice President, Mergers & Acquisitions, UK 1985–1990 International Capital Markets, USA
Shareholding in Nordea: 50,000*
Lars G NordströmLaw studies at Uppsala University. Board member since 2003. Born 1943. Nationality Swedish.Board Chairman of Vattenfall AB. Board member of Viking Line Abp. Other assignments: Board Chairman of the Finnish-Swedish Chamber of Commerce. Board member of the Swedish-American Chamber of Commerce. Member of the Royal Swedish Academy of Engineering Sciences (IVA).Honorary Consul of Finland in Sweden.
Previous positions:2008–2011 President and Group CEO of Posten Norden AB2006–2010 Board member of TeliaSonera AB2005–2009 Board Chairman of the Royal Swedish Opera2002–2007 President and Group CEO of Nordea Bank AB1993–2002 Various executive management positions within Nordea Group1970–1993 Various positions within Skandinaviska Enskilda Banken (Executive Vice President from 1989)
Shareholding in Nordea: 23,250*
Sarah RussellMaster of Applied Finance. Board member since 2010. Born 1962.Nationality Australian.CEO Aegon Asset Management Holdings NV and Board member of a group company.
Previous positions:1994–2008 Various executive management positions within ABN AMRO, including Senior Executive Vice President and CEO of ABN AMRO Asset Management 2006-20081981–1994 Various management and other positions in Finan- cial Markets within Toronto Dominion Australia Ltd
Shareholding in Nordea: 0*
Kari StadighMaster of Science (Engineering) and Bachelor of Business Administration. Board member since 2010. Born 1955. Nationality Finnish.Group CEO and President of Sampo plc. Board Chairman of If P&C Insurance Holding Ltd and Mandatum Life Insurance Company Limited. Board member of Nokia Corporation and Oy Forcit AB.Other assignments: Vice chairman of The Federation of Finnish Financial Services. Board member of Finland Chamber of Commerce and of Niilo Helander Foundation.
Previous positions:2001–2009 Deputy CEO of Sampo plc1999–2000 President of Sampo Life Insurance Company Ltd1996–1998 President of Nova Life Insurance Company Ltd1991–1996 President of Jaakko Pöyry Group1985–1991 President of JP Finance Oy
Shareholding in Nordea: 100,000*
Employee representatives:Kari AholaBoard member since 2006. Born 1960. Shareholding in Nordea: 0*
Toni H. MadsenBoard member since 2013. Born 1959. Shareholding in Nordea: 3,299*
Lars OddestadBoard member since 2009. Born 1950. Shareholding in Nordea: 0*
Hans Christian RiiseBoard member since 2013. Born 1961. Shareholding in Nordea: 0*
* Shareholdings, as of 31 December 2014, also include shares held by family members and closely affiliated legal entities.
Kari Ahola Toni H. Madsen Lars Oddestad Hans Christian Riise

Nordea Annual Report 2014214
Organisation
Group Executive Management
Torsten Hagen JørgensenExecutive Vice President, Group CFO, Head of Group Corporate Centre.Born 1965.Appointed member 2011.Shareholding: 63,988 Nordea1
Ari Kaperi2
Executive Vice President, Group CRO, Head of Group Risk Management.Born 1960.Appointed member 2008.Shareholding: 67,279 Nordea1
Casper von KoskullExecutive Vice President, Head of Wholesale Banking.Born 1960.Appointed member 2010.Shareholding: 86,026 Nordea1
Gunn Wærsted2
Executive Vice President, Head of Wealth Management.Born 1955.Appointed member 2007.Shareholding: 96,539 Nordea1
1) Shareholdings, as of 31 December 2014, also include shares held by family mem-bers and closely affiliated legal entities.
2) Country Senior Executive.
Christian ClausenPresident and Group CEO since 2007. Master of Science (Economics). Appointed member of GEM 2001. Born 1955.Board member of the Swedish Bankers’ Association
Previous positions:2011–2014 President of the European Banking Federation2000–2007 Executive Vice President, Head of Asset Management
& Life, Member of Group Management; Nordea1998–2000 Member of Executive Board, Unibank1996–1998 Managing Director and Chief Executive,
Unibank Markets1990–1996 Managing Director and Chief Executive of
Unibørs Securities1988–1990 Managing Director of PrivatbørsenShareholding: 187,971 Nordea1
Lennart Jacobsen2
Executive Vice President, Head of Retail Banking.Born 1966.Appointed member 2013.Shareholding: 3,000 Nordea1
Mads G. Jakobsen2
Executive Vice President, Deputy Head of Retail Banking.Born 1966.Appointed member 2014.Shareholding: 25,145 Nordea1
Group Executive Management, from left to right: Mads G. Jakobsen, Lennart Jacobsen, Gunn Wærsted, Christian Clausen, Casper von Koskull, Ari Kaperi, Torsten Hagen Jørgensen.

Nordea Annual Report 2014 215
Organisation
Moody's Investors Service
Standard & Poor's Fitch DBRS
Short Long Short Long Short Long Short Long
Nordea Bank AB (publ) P–1 Aa32 A–1+ AA–2 F1+ AA– R–1 (high) AANordea Bank Danmark A/S P–1 A1 A–1+ AA–2 F1+ AA– R–1 (high) AANordea Bank Finland Plc P–1 Aa32 A–1+ AA–2 F1+ AA– R–1 (high) AA
Nordea Bank Finland Plc, covered bonds Aaa1
Nordea Bank Norge ASA P–1 Aa32 A–1+ AA–2 F1+ AA– R–1 (high) AANordea Hypotek AB (publ) Aaa1 AAA1
Nordea Kredit Realkreditaktieselskab Aaa1 AAA1 Nordea Eiendomskreditt AS Aaa1
1) Covered bond rating.2) Negative outlook.
Group Organisation As of February 2015
Ratings
Retail Banking
Wholesale Banking
Group Compliance
Group Marketingand
Communications
President and
Group CEO
Wealth Management
Group Simplification
Group Human Resources
Group Corporate
Centre
Group Internal Audit
Group Risk Management

Annual General Meeting 19 March 2015
Financial calendar
Nordea’s Annual General Meeting (AGM) 2015 will be held on Thursday 19 March at 13.00 CET at Vinter-trädgården, Grand Hôtel, entrance Royal, Stallgatan 4, Stockholm.
Notification of participation etcShareholders who wish to participate in the AGM shall be entered in the share register maintained by the Swedish Securities Register Center (Euroclear Sweden AB) not later than 13 March 2015 and notify Nordea. Shareholders whose shares are held in custody therefore must temporarily re-register their shares in their own names with Euroclear Sweden AB in order to be able to participate. This applies for example to holders of Finnish Depositary Receipts in Finland and holders of shares registered in VP Securities in Denmark. Such re-registration must be effected in Euroclear Sweden AB in Sweden on 13 March 2015. This means that the shareholder in good time prior to this date must inform the trustee about this.
Shareholders registered in Euroclear Sweden AB in SwedenNotification of participation in the AGM must be made to Nordea Bank AB (publ) at the latest on 13 March 2015 preferably before 13.00 Swedish time at the following address: Nordea Bank AB (publ), c/o Euroclear Sweden AB, Box 191, SE-101 23 Stockholm, Sweden, or by tele-phone +46 8 402 90 64, or on Nordea’s web page www.nordea.com.
Financial calendar 2015Annual General Meeting 19 March Ex-dividend date 20 March Record date 23 March Dividend payments 30 March 1st quarter results 29 April 2nd quarter results 16 July 3rd quarter results 21 October
ContactsTorsten Hagen Jørgensen, Group CFO/EVP Phone: +46 8 614 78 00
Investor RelationsRodney Alfvén, Head of Investor RelationsAndreas LarssonEmma Nilsson Ylva AnderssonCarolina Brikho
SE-105 71 Stockholm, Sweden Phone: +46 10 156 2962
Holders of Finnish Depositary Receipts (FDR) in FinlandNotification of participation in the AGM and re-registra-tion of shares to Euroclear Sweden AB must be made at the latest on 12 March 2015 at 12.00 noon Finnish time to Nordea Bank AB (publ), c/o Euroclear Sweden AB, Box 191, SE-101 23 Stockholm, Sweden, or by telephone +46 8 402 90 64, or on Nordea’s web page www.nordea.com.
Shareholders registered in VP Securities in DenmarkNotification of participation in the AGM and re-registra-tion of shares to Euroclear Sweden AB must be made at the latest on 12 March 2015 at 12.00 noon Danish time to Nordea Bank AB (publ), c/o Euroclear Sweden AB, Box 191, SE-101 23 Stockholm, Sweden, or by telephone +46 8 402 90 64, or on Nordea’s web page www.nordea.com.
WebsiteAll reports and press releases are available on the Internet at: www.nordea.com. Financial reports published by the Nordea Group may be ordered on the website and via Investor Relations.
The annual reports of Nordea Bank Danmark A/S, Nordea Bank Norge ASA and Nordea Bank Finland Plc can be downloaded from www.nordea.com
Nordea’s report on Capital and risk management, in accordance with the Pillar III disclosure requirements according to the EU Capital Requirements Directive, is presented on www.nordea.com.
The Annual Report 2014This Annual Report covers Nordea Bank AB (publ) and pertains to the operations of the Nordea Group, whose main legal structure is presented on page 211. The original annual report is in Swedish. This is an English version thereof. A Swedish version may be obtained upon request.
In this Annual Report, the Nordea Group presents income statements and other financial data quoted in euro (EUR).
Layout and production Appelberg | Photo Ida Schmidt, Paulina Westerlind, Tobias Ohls, Dan Coleman, Per Myrehed | Print Åtta.45
Nordea Bank AB (publ) | Corporate registration no. 516406-0120 | Smålandsgatan 17 | SE-105 71 Stockholm | Tel +46 8 614 78 00 | Fax +46 8 614 87 70 | www.nordea.com