Annual Report 2006 - KU Leuven Bibliotheken
88
Annual Report 2006
-
Upload
khangminh22 -
Category
Documents
-
view
0 -
download
0
Transcript of Annual Report 2006 - KU Leuven Bibliotheken

Annual Report 2006SSAB Svenskt Stål AB Box 26208, SE-100 40 Stockholm, SwedenTelephone int. +46 8-45 45 700. Telefax int. +46 8-45 45 725Visiting address: Birger Jarlsgatan 58, StockholmEmail: [email protected]
Distinguishing features of the Domex 500 MC high-strength steelinclude its good bending characteristics, which are exploited byScania in the manufacture of the frame beams in the P and R series,as here in Scania R-420. Thanks to the strength and the bending characteristics, savings are made as regards weight and several costly elements in the manufacture of the chassis frame beams.
951 69 SSAB_omslag-Engelsk 07-03-05 08.45 Sida 1

SSAB Svenskt Stål AB (publ) Company no. 556016–3429
Joe Brig Art AB, Gothenburg.Photo: Göran Wink, Dag Sundberg, Bo Björkdahl.Print: Edita Västra Aros, Västerås 2007.
General MeetingThe Annual General Meeting will be held in Borlänge on Friday, March 30,2007 at 1 p.m.
To be entitled to participate at the Annual General Meeting, shareholders
must be included in the share register that is printed out as of, March 24,2007, and
must notify SSAB of their intention to participate at the meeting notlater than 12 noon on Monday, March 26, 2007.
Nominee-registered sharesShareholders whose shares are registered in the name of a nominee mustregister their shares in their own names in order to be entitled to parti-cipate at the Annual General Meeting. Temporary owner-registration (votingregistration) should be effected in due time prior to March 23, 2007.
NoticeNotice in respect of participation at the Annual General Meeting shall be given by telephone on +46 8 45 45 760. The name, personal identification number (company registration number),address and telephone number of the shareholder must be provided inthe notice.
Notices must be received by SSAB not later than 12 noon on Monday,March 26, 2007, at which time the notice period will expire.
ProxiesPowers of attorney in original and, as regards legal persons, certificatesof registration, should be submitted in due time prior to the AnnualGeneral Meeting to:
SSAB Svenskt Stål AB, Annual General Meeting, Box 26208, SE-100 40 Stockholm, Sweden.
Nomination committeeCarl-Olof By, Industrivärden, Chairman Thomas Halvorsen, 4th National Pension Fund Sverker Martin-Löf, Chairman of the Board of SSABPer-Erik Mohlin, SEB FundsPeter Rudman, Nordea Funds
The nomination committee presents, among other things, proposals tothe Annual General Meeting concerning the election of members of theBoard of Directors, fees for the Board of Directors, and election of auditors.
Dividends and repurchase of sharesApril 4, 2007 is proposed as the record date for the right to receive dividends. It is anticipated that payment of dividends will be effectedthrough VPC on April 11, 2007.
The Board of Directors and the President propose that the AnnualGeneral Meeting resolve upon the payment of a dividend for 2006 in the amount of SEK 4.50 per share.
It is proposed that the Board of Directors be authorised to repurchasea maximum of 10% of the Company’s shares.
Financial informationSSAB will present the following information for the 2007 financial year:
Report for the first quarter, April 20, 2007.
Half-year report, July 17, 2007.
Report for the first three quarters, October 23, 2007.
Results for 2007, February 6, 2008.
Annual report, March 2008.
The Annual Report is published in Swedish and English. In the event of differences between the English translation and the Swedish original,the Swedish Annual Report shall prevail.
| SSAB ANNUAL REPORT 2006

SSAB ANNUAL REPORT 2006 | 1
Table of contents
2 Comments by the Chief Executive Officer
4 Operations and production flow
5 Five-year summary
6 Strategy and targets
7 Corporate governance report
11 Group Management and auditors
12 Board of Directors
16 The SSAB share
Report of the Directors
19 Group review
28 SSAB and the environment
32 Sheet Division
35 Plate Division
38 Plannja
40 Tibnor
42 Other companies
Consolidated andParent Company Accounts
43 Consolidated profit and loss account
44 Consolidated balance sheet
45 The Group’s changes in equity
46 Consolidated cash flow statement
47 Parent company’s profit and loss account
48 Parent company’s balance sheet
49 Parent company’s changes in equity
50 Parent company’s cash flow statement
51 Table of contents: Notes
51 Accounting and valuation principles
81 Definitions
82 Disposition of profit
83 Auditors’ report
84 Addresses
Sales increased by 12% to SEK 31,054 (27,804) million.
Profit after tax amounted to SEK 4,341 (4,068) million,equal to earnings per share
of SEK 16.02 (14.07).
Operating cash flow was up SEK 741 million
on last year and amounted to SEK 3,546 (2,805) million.
Deliveries of extra and ultra high-strength sheet
and quenched steel increased by 24%.
It is proposed that the dividend be increased to SEK 4.50 (3.00) per share, equal to
SEK 1,166 (818) million.It is proposed that the Board
of Directors be authorised to repurchase not more than 10%
of the company’s shares.

2 | SSAB ANNUAL REPORT 2006
Record results and strong niche products form the basis for futuregrowth and development
In many ways, 2006 was a record year for SSABwith the best results ever and a volume of nicheproducts that reached a new record level. Duringthe year, decisions were taken on several importantinvestments which will further strengthen SSAB in the future. In 2006, the basis was also laid for a new strategic plan of action, called SSAB 2010,which is aimed at better meeting future challenges.
As a mining engineer and someone who has been in the steel industry for many years, I have come to knowSSAB as a very fine company with some of the world’sstrongest steel brands. It was thus with great gladnessand enthusiasm that I assumed the position of Presidentand CEO in the spring of 2006. Today, SSAB is financiallystronger than ever, in large part due to a favourablebusiness cycle and a successful focus on specialised nicheproducts. We are in a good position to take advantageof future opportunities and meet future challenges.Together with the Board of Directors, we in managementhave developed, secured support for, and initiated astrategic plan of action, SSAB 2010, which will makeSSAB one of the most efficient and profitable companiesin the industry.
A strong 2006The very positive trend in 2006, with the best results ever,demonstrates that our strategy involving an increasedfocus on niche products has been well chosen and shouldbe developed further. During the year, we increased by24% the share represented by niche products, viz.quenched steels and extra and ultra high-strength sheet.These products now account for 39% of our deliveries.We have continued to invest in order to be able tointensify this development. In the spring, a decision was taken to convert the entire plate production inOxelösund to quenched steels over the next few years.Within the Sheet Division, we also took additional stepsto expand the product range and volumes within extraand ultra high-strength sheet. This has taken placeprimarily through an investment in a new coiler at thehot-rolling line in Borlänge.
The subsidiaries, Tibnor and Plannja, reported excellentresults in 2006. During the year, Tibnor was able totake advantage of the strong Swedish steel market anddeliver very good results for 2006. Plannja’s good resultsare due to stronger demand on the domestic marketfrom sheet plate workshops and projects as well as animproved market trend in Norway and Poland.
Global situationGrowth is strong on the global steel market, includingfor our most important customer segments. The steelmarket grew by approx. 9% in 2006. This is a veryhigh rate of growth; in 2006 it was distributed moreevenly throughout the world than in recent years.Europe and North America demonstrated very stronggrowth but China still accounts for the highest rate ofgrowth. 2006 was significant in the sense that China
COMMENTS BY THE CH IEF EXECUT IVE OFF ICER

SSAB ANNUAL REPORT 2006 | 3
moved from being a net importer to a net exporter ofsheet and plate products. Exports of standard productsfrom China to North America and Europe increasedsignificantly and this constitutes a potential threat tothe price trend for such products in the future.
In planning for the future, the Board of Directors andmanagement perceive several important trends in the steelindustry: a strong growth in demand within our niches,a shift in demand to developing countries, the risk offuture over-capacity within standard products with pres-sure on margins as a consequence, global consolidation,and upgrading of product portfolios of leading steelcompanies to include more specialised products.
A plan of action for the futureSSAB enjoys a strong starting position. Highly specialisedproducts combined with far-reaching customer adaptationand genuine knowledge of the customer’s needs andapplications have formed the basis for our success. Theplan of action that has been produced is based on thisand focuses on three areas: to increase profitability atcurrent plants, to focus even more clearly on growthwithin our niches, and to strengthen and increase theefficiency of the Group’s organisation and expertise.
The strong increase in sales of niche products andgeographic changes in demand mean that we have customers located further away from our traditionalmarkets. Thus, in 2006 SSAB began the construction of a distribution centre in China, which is one of our mostimportant growth markets. Through a local presence inAsia we are able to increase our service level and cut ourdelivery times to local customers. SSAB is one of the steelproducers that has invested a great deal in building upbrands for its products. Now that China has become thedominant single market for steel, it is important to create,also there, knowledge and awareness of our brands andthus we are engaging in very active marketing in China.
Ongoing training of our managers and employeesrepresents a further prerequisite for success in achievingthe goals we have established. These issues constitute animportant part of the plan of action. The company nowhas a Human Resources Director for the Group, whichis a step in this direction. Work is actively taking placein order to best exploit the strength and the synergiesthat we enjoy as a Group. One element in this is that wehave changed from core operations being operated assubsidiaries to being operated as divisions. By simplifyingcommunication paths and developing the Company’scontrol and follow-up systems, Group Management’sfocus on core operations has been strengthened.
Repurchase of shares and higher return targetThe good results have strengthened SSAB’s balancesheet and, at the end of 2006, the Company is free ofdebt. The company’s financial targets are to maintain a debt/equity ratio of 30% in the long term. Thus, theBoard of Directors has recommended that the dividendbe increased to SEK 4.50 per share and that the Boardof Directors be authorised to repurchase up to 10% ofthe Company’s shares. The authorisation provides theBoard of Directors with greater flexibility to adapt theamount of repurchased shares to the Company’s capitalneeds for its strategy.
The plan of action aims at strengthening the condi-tions for continued positive growth in value for ourshareholders in a more challenging world. In connectionwith this, the Board of Directors has also established ahigher profitability target for the Group whereby returnon capital employed over a business cycle shall exceed15 percent. The new profitability target entails anincrease of some 3 percentage points compared with the previous target.
We have achieved a great deal at SSAB in 2006. The most important factor in this success has been thecommitment and the professionalism shown by SSAB’semployees. Thus, I wish to thank everyone in the Groupfor a fantastic effort during the year. With the drive thatcharacterises the Company, we can face the future withconfidence.
Olof Faxander

4 | SSAB ANNUAL REPORT 2006
Operations and production flow
The Sheet Division is the largest manufacturer of sheet in theNordic region and one of the leading companies in Europe withinthe area of extra and ultra high-strength sheet. The high-strengthsheet is used, among other things, for heavy and light vehicles andby crane manufacturers. Ordinary sheet is used primarily within theengineering and construction industries.
Sheet Division
The Plate Division is the world’s leading producer of quenchedsteels, i.e. abrasion-resistant steels and extremely high-strengthconstruction steels. These are used, among other things, in con-struction machinery, mining equipment, and cranes. Ordinary plateis used within shipbuilding and general engineering as well aswithin the wind power industry.
Plate Division
Plannja is one of Europe’s leading building sheet companies.Plannja processes sheet into roofing tiles and rainwater run-offproducts, etc. Sandwich-type prefabricated building sections arealso being manufactured to an increasing extent.
Plannja
Tibnor is the leading Swedish commercial steels company with a range of commercial steels, special steels, pipes, and stainlesssteels. Non-ferrous metals and building-related products supplementthe product range.
Tibnor
SSAB was formed in 1978 through a merger of the steelworks, Domnarvets Järnverk in Borlänge, Oxelösunds Järnverk and Norrbottens Järnverk in Luleå. Since then, the Group has successfully pursueda niche-orientation strategy focusing on high-strength steels. In addition to the Parent Company, the Groupcomprises two major divisions, the Sheet Division and the Plate Division, as well as the subsidiaries, Plannja and Tibnor. SSAB has subsidiaries or offices in some 40 countries with sales throughout the world.For the organisation, see page 11.

SSAB ANNUAL REPORT 2006 | 5
Five-year summary
2006 2005 20041) 20031) 20021)
Sales (SEK millions) 31,054 27,804 24,631 19,806 19,271
Profit after financial items (SEK millions) 2) 6,052 5,671 4,788 1,343 816
Profit after tax (SEK millions) 2) 4,253 4,021 3,593 899 577
Capital expenditures (SEK millions) 1,407 853 727 1,041 902
Cash flow (SEK millions) 3) 3,794 4,230 1,992 765 1,208
Net debt (SEK millions) – 176 407 1,718 3,032 3,120
Capital employed, at year-end (SEK millions) 17,285 16,658 16,637 13,974 13,941
Total assets (SEK millions) 22,795 21,820 21,618 18,611 18,476
Return on capital employed before taxes (%) 36 34 34 12 8
Return on equity after taxes (%) 29 30 33 9 6
Equity ratio (%) 68 66 60 54 53
Net debt/equity ratio (%) – 1 3 13 30 32
Dividend per share (SEK) – 2006 proposal 4) 4.50 3.00 2.50 2.00 2.00
Earnings per share (SEK) 4) 16.02 14.07 11.87 2.97 1.90
Average number of employees 8,737 8,832 9,412 9,570 9,592
Sales per average employee (SEK millions) 3.6 3.1 2.6 2.1 2.0
Production of crude steel (thousands tonnes) 3,737 3,966 4,142 3,911 3,881
2004 has been adjusted in accordance with IFRS, however not 2002 and 2003. An adjustment for those years would, though, have yielded only a marginal effect.The capital gain upon the sale of SSAB HardTech affected the result for 2004 by SEK+825 million. The purchase price received upon the sale of Cogent affected the cash flow for 2006 by SEK +248 million and SSAB HardTech affected the cash flow for 2005 by SEK +1,425 million.Data per share has been recalculated to take into account the 3:1 split carried out in 2006.
Definitions are set forth in Note 28.
1)2)3)4)
The diagram shows the increase in value of one share in SSAB subscribed for at aprice of SEK 12 when the SSAB share waslisted in 1989. It has been assumed thatdividend and redemption rights receivedhave been reinvested in SSAB shares. Since 1989, this has resulted in an averageincrease in value of just over 21% per year.
89 90 91 92 93 94 95 96 97 98 99 00 01 02 03 04 05 06

6 | SSAB ANNUAL REPORT 2006
Strategy and targets
StrategySSAB shall be one of the most profitable steel companiesin the world. The Group’s steel operations have beensuccessfully developed through a deliberate niche ori-entation. This strategic focus will be maintained through a strong focus on several selected product segments inwhich a strong market position and high profitabilitycan be achieved.
In the plate area, investments are taking place withinquenched steels, i.e. abrasion-resistant steels and extremelyhigh-strength construction steels, in which the Group is already a world leader. Investments within the sheetarea are taking place within extra and ultra high-strengthsheet, in which the Group is one of the leaders in Europe.
Growth in these niche areas has been stronger thanfor the steel market in general and deliveries of theseproducts have increased substantially during the mostrecent five-year period, as is evident from the diagrambelow. Past and present investments within the Group’ssteel operations render possible a continued stronggrowth within these niche areas.
By using quenched steels or extra and ultra high-strength sheet, customers are able to improve theirproducts and thereby their profitability. This creation of added value is a process that often takes place in closeco-operation with the customer. The added value that iscreated benefits both the customer and SSAB and therebyensures continued good profitability for the Group.
A complete range of sheet products is supplied onneighbouring markets on which significant situational
advantages and favourable conditions for profitabilityexist. Plannja and Tibnor shall be utilised actively onneighbouring markets so that the steel operations’already strong position can be maintained.
Financial targetsCapital Structure The Group’s operations are very sensitive to the businesscycle. Individual investment projects within the steeloperations may, in addition, be extremely large and thusthe equity ratio should be relatively high.
The target is that the net debt/equity ratio shall amountto approx. 30% and the equity ratio to approx. 50%
DividendsDividends shall be adapted to the average profit levelover a business cycle and, in the long-term, constituteapprox. 50% of profit after tax. It shall also be possibleto use dividends to adjust the capital structure.
Profitability In order to ensure long-term development and takinginto consideration the equity ratio requirement and thedividend policy, the target is that the return on capitalemployed after tax over a business cycle shall exceed 15 percent.
Profitability and net debt/equity ratio during the past five years, compared to targets, are shown in thediagram below.

SSAB ANNUAL REPORT 2006 | 7
IntroductionSSAB Svenskt Stål AB was formed in 1978 and has,through a successful and deliberate niche focus, developedinto one of the world’s most profitable steel companies.
SSAB’s organisation is characterised by a decentralisedwork method in which responsibility and powers aredelegated to the respective division and subsidiary. TheGroup’s steel operations consist of the two divisions, Sheetand Plate, while the trading and processing operationsconsist of the subsidiaries, Tibnor and Plannja.
SSAB applies the Swedish Code on CorporateGovernance (the “Corporate Code”), which constitutesa part of the rules and regulations of Stockholmsbörsen(Stockholm Stock Exchange). SSAB has no derogationsfrom the Corporate Code. In accordance with the ap-plication instructions issued by the Swedish CorporateGovernance Council, this corporate governance reportcontains a separate section on the organisation of theinternal control regarding the financial reporting. Thereport does not constitute a part of the formal annualreport documents and has not been reviewed by theCompany’s auditors.
SSAB’s Corporate Governance Model
Shareholders SSAB’s shares have been listed on Stockholmsbörsen since 1989. A trading unit consists of 200 shares. SSAB’s share capital consists of Class A and Class B shares, withClass A shares carrying one vote and Class B sharescarrying one-tenth of one vote. Both classes of sharescarry the same rights to participate in the Company’sassets, profits and dividends.
On December 31, 2006, there were 40,259 share-holders. In terms of votes, Industrivärden was the largestshareholder, followed by LKAB and Nordea Fonder.Shareholders with 1,000 shares or fewer constituted 58%of the shareholders while the ten largest institutionalowners together owned 34% of the share capital. Thepercentage of foreign shareholders was 34%. For furtherinformation regarding the ownership structure, see page 18 of the Annual Report.
The General Meeting The General Meeting is the Company’s highest decision-making body; it is there that shareholder influence inthe Company is exercised. Shareholders who wish toparticipate at General Meetings, personally or througha proxy, must be entered in the share register five daysprior to the Meeting and must register with the Companyin accordance with the notice to attend. Notice to attendGeneral Meetings is given through announcements andon the Company’s website (www.ssab.se).
An Annual General Meeting must be held within sixmonths of the expiry of the financial year. At the AnnualGeneral Meeting, the shareholders decide, among otherthings, on the following: election of the Board of Directorsand, where appropriate, the auditors; the manner inwhich the Nomination Committee is to be appointed;and discharge from liability for the Board of Directorsand President for the past year. Decisions are also takenregarding adoption of the accounts, disposition of profits,fees for the Board of Directors and the auditors, as wellas guidelines for compensation to the President andother senior executives.
2006 Annual General Meeting The Board of Directors presented to the General Meetinga description of its work during the year and concerningcorporate governance issues in general. The Presidentinformed the General Meeting regarding the Group’sdevelopment and financial position as well as the resultsfor the first quarter of 2006. The General Meetingadopted the Annual Report and the consolidated financialstatements for 2005 as presented by the Board of Directorsand the President, decided upon the disposition of theCompany’s profits, and granted the Board members and the President discharge from liability.
In addition, the Chairman of the Nomination Com-mittee described its work during the year and presentedreasons for submitted proposals. The General Meetingdecided on compensation for the Board of Directorsand auditors in accordance with proposals from theNomination Committee. Carl Bennet, Anders G Carlberg,Sverker Martin-Löf (Chairman), Marianne Nivert, AndersNyrén and Matti Sundberg were re-elected to serve on theBoard of Directors. Olof Faxander (President and CEO)and Lars Westerberg were elected as new members.
Corporate governance report
NOMINATION COMMITTEE
EXTERNALAUDITORS
SHAREHOLDERS’/GENERAL MEETING
COMPENSATION COMMITTEE
AUDITCOMMITTEE
BOARD OF DIRECTORS
INTERNALAUDIT
PRESIDENT AND GROUP MANAGEMENT
DIVISIONS AND SUBSIDIARIES
SHEETDIVISION
STEEL OPERATIONS
PLATE DIVISION
PLANNJA TIBNOR
TRADINGOPERATIONS
PROCESSINGOPERATIONS
Important internal policies and regulations that affect corporate governance
Important internal policies• The Board’s rules of procedure• Accounting manual• Finance policy• Credit policy• Information policy
Important external regulations • Swedish Companies Act• Stockholmsbörsen’s listing agreement • Swedish Code on Corporate Governance

8 | SSAB ANNUAL REPORT 2006
The General Meeting resolved unanimously on a repay-ment to the shareholders by means of a reduction in theCompany’s share capital through the redemption of notmore than 4,546,453 shares. The General Meeting alsoresolved on a bonus issue without the issuance of newshares and on a 3:1 share split. The General Meetingfurther decided on the criteria for the appointment of theNomination Committee as well as the principles for com-pensation and other employment terms and conditionsfor senior executives.
All Board members and the auditor-in-charge werepresent at the Annual General Meeting.
Nomination Committee The Nomination Committee represents the shareholdersand, at the 2006 Annual General Meeting, the Chairmanof the Board was charged with requesting not less thanthree and not more than five of the largest shareholdersto appoint one member each to form a NominationCommittee together with the Chairman of the Board.The Chairman of the Nomination Committee should bethe representative of the largest shareholder. The Nom-ination Committee for the 2007 Annual General Meetingconsists of Carl-Olof By (Industrivärden, Chairman),Thomas Halvorsen (4th National Pension Fund), SverkerMartin-Löf (Chairman of the Board of Directors), Per-ErikMohlin (SEB Funds) and Peter Rudman (Nordea Funds).
The duties of the Nomination Committee include,among other things, presentation of proposals as regardsthe nomination of, and fees for, Board members and theChairman of the Board. The Nomination Committee shallalso submit proposals to the Annual General Meetingregarding any compensation for the work of standingcommittees as well as the selection of, and fees for,external auditors. Proposals which shareholders wish to submit to the Nomination Committee may be sent by e-mail to [email protected]. The NominationCommittee’s proposals are published not later than in connection with the notice to attend the AnnualGeneral Meeting.
The Nomination Committee’s work since the 2006 Annual General Meeting Since being appointed in the autumn of 2006, theNomination Committee has held three meetings, atwhich all members were present.
As a consequence of an impending election of auditors,an evaluation has been carried out regarding the currentauditor and discussions have been held regarding theelection of an auditor for the coming mandate period.The Nomination Committee has also produced a proposalfor the procedure how to appoint the next NominationCommittee.
As a basis for the Nomination Committee’s evaluationof the work of the Board of Directors, the Chairman of
the Board has described its work and composition duringthe year. The Board is considered well-composed andcompetent; the members have possessed great combinedexperience from different industries as well as soundeconomic and financial skills. In addition, many of themembers possess great experience from Board work inother listed companies. The Board of Directors andPresident have been evaluated through an open dialoguebased on a formal self-evaluation.
The Nomination Committee shall also submit proposalsregarding fees for the Board of Directors and, in orderto form an opinion regarding reasonable fee levels,analyses and comparisons have been conducted withsimilar companies.
The Nomination Committee proposes to the 2007Annual General Meeting the re-election of Board membersSverker Martin-Löf (Chairman), Carl Bennet, Anders G.Carlberg, Olof Faxander, Marianne Nivert, Anders Nyrén,Matti Sundberg and Lars Westerberg. The NominationCommittee’s other proposals will be provided in connec-tion with the notice to attend the Annual General Meeting.
External auditors According to the Articles of Association, SSAB shallhave one or two external auditors. At the 2003 GeneralMeeting, PricewaterhouseCoopers was appointed asauditor for the period up to and including the 2007Annual General Meeting. The auditor-in-charge since2005 is the authorised public accountant Claes Dahlén,who is also the auditor-in-charge of the listed company,Karo Bio. In total, PricewaterhouseCoopers is the chosenauditor in 26 of the companies in Stockholmsbörsen’s“Large cap” segment.
The external audit of the accounts of the ParentCompany and the Group as well as management by the Board of Directors and President is conducted inaccordance with generally accepted auditing standardsin Sweden. The company’s auditor-in-charge participatesat all meetings of the Audit Committee. The auditorattends at least one Board meeting per year at which hegoes through the audit for the year. He also discussesthe audit with the Board members without the Presidentbeing present.
For information regarding fees to the auditors, seeNote 2 in the Annual Report.
The Board of Directors The overall task of the Board of Directors is to managethe Company’s affairs on behalf of the shareholders inthe best possible manner. The Board of Directors shallregularly assess the Group’s financial position and evaluatethe operational management. The Board of Directorsdecides, among other things, on questions concerning theGroup’s strategic focus and organisation, and decides onimportant investments and undertakings. Each year, the
CORPORATE GOVERNANCE REPORT

SSAB ANNUAL REPORT 2006 | 9
Board adopts rules of procedure which, together withinstructions to the President, govern the allocation ofwork between the Board and the President. The rules ofprocedure also regulate the manner in which Board workis allocated between members of the Board, how oftenthe Board is to meet and the manner in which work shallbe allocated to various Board committees. Pending eachBoard meeting, the Board members receive a writtenagenda and full documentation to serve as a basis fordecisions. At each Board meeting, a review is conductedregarding the current state of the business, the Group’sresults and financial position, and prospects for theremainder of the year. Other issues addressed includecompetition and the market situation.
The Board conducts an annual visit to one of the plantswithin the steel operations.
The Chairman of the Board presides over the Board’swork, represents the Company on ownership issues andis responsible for the evaluation of the work of the Board.In addition, the Chairman is responsible for regularcontacts with Group Management and for ensuring thatthe Board performs it obligations.
According to the Articles of Association, the Boardshall consist of not less than five and not more than tenmembers elected by the General Meeting. The Board isquorate when more than half of the members are present.
Board members shall possess broad expertise, be versatile,and possess a suitable background for SSAB’s organisation,industry and operations. New Board members undergoan introduction course to rapidly acquire the knowledgewhich is expected in order to best promote the interestsof the Company and the shareholders.
The Board of Directors for 2006 has comprised thefollowing persons:
■ Carl Bennet ■ Anders G Carlberg■ Olof Faxander ■ Sverker Martin-Löf
(CEO) (Chairman)■ Marianne Nivert ■ Anders Nyrén■ Matti Sundberg ■ Lars Westerberg
In addition to the above members elected by the GeneralMeeting, the Board has three members and three alternatemembers representing the employees. For further in-formation regarding the Board members, see the sectionentitled “Presentation of the Board” in this report.
The Board’s independenceThe table above shows the Board’s independence inrelation to the Company and its major shareholders aswell as attendance statistics.
Attendance Statistics 2006 Independence
Name of Elected to Total Board Com- Audit Independence in Independence inBoard Member the Board Annual Meetings pensation Committee relation to the relation to the
Fee, SEK Committee Company and Company’s major company management shareholders
Elected at General Meeting
Sverker Martin-Löf 2003 1,050,000 9 9 6 Yes No, member of the Chairman of the Board (1943) Chairman since 2003 Board of Industrivärden
Carl Bennet (1951) 2004 350,000 9 – – Yes Yes
Anders G Carlberg (1943) 1986 400,000 9 – 6 No, member for Yesmore than 12 years
Olof Faxander, President 2006 – 6 – – No, President Yesand CEO (1970)*) of the Company
Marianne Nivert (1940) 2002 400,000 8 – 6 Yes Yes
Anders Nyrén (1954) 2003 400,000 8 9 – Yes No, president andCEO of Industrivärden
Matti Sundberg (1942) 2004 350,000 9 – – Yes Yes
Lars Westerberg (1948)*) 2006 350,000 5 – – Yes Yes
Employee Representatives
Owe Jansson (1945) 1990 – 9 – – – –
Bert Johansson (1952) 1998 – 9 – – – –
Ola Parten (1953) 2005 – 9 – – – –
Alternates
Sture Bergvall (1948) 2005 – 9 – – – –
Bo Jerräng (1947) 2004 – 8 – – – –
Claes Ström (1945) 2003 – 9 – – – –
*) Appointed in connection with the 2006 Annual General Meeting, after which six Board meetings have been held.

10 | SSAB ANNUAL REPORT 2006
The Board’s work in 2006During 2006, nine meetings were held at which minuteswere taken and the Board has at all times been quorate.SSAB’s General Counsel, who is not a member of theBoard, serves as Secretary to the Board.
During the year, the Board of SSAB has workedintensively on the Company’s strategy and organisation.Among other things, a new operational structure andcontrol model have been introduced. In this new opera-tional structure, the steel operations comprise two divi-sions under the parent company: the Sheet Division andPlate Division. The Board of Directors has also discussedpossible divestments and acquisitions of businesses; amongother things, in July 2006 it was decided to sell the 25per cent stake in the affiliated company, Cogent Power.
During 2006, the Board appointed a new President,Olof Faxander. In connection with the Group’s newoperational structure, a partially new Group Manage-ment was appointed. For a further description of Group Management, see the section entitled “GroupManagement” in this report.
Major capital expenditure decisions taken in 2006included investments in continued expansion of quenchedsteels, a distribution centre in China, increased capacityfor after-treatment of crude steel in Oxelösund, and anew coiler at the hot-rolling mill in Borlänge.
There are two preparatory committees within the Board:the Compensation Committee and the Audit Committee.
Compensation Committee The Compensation Committee presents proposals to the Board regarding the President’s salary and otheremployment conditions, establishes salaries andemployment conditions for Group Management andestablishes salary limits and employment conditions for other senior executives. During the year, the Com-pensation Committee held nine meetings at whichminutes were taken. The Compensation Committeecomprises Sverker Martin-Löf (Chairman) and AndersNyrén. The President is co-opted to the Committee butdoes not participate in discussions concerning his ownsalary and employment conditions.
At the Annual General Meeting, the Board presentsproposals regarding principles for compensation and otheremployment conditions for senior executives, for approvalby the shareholders. At the 2006 Annual General Meeting,it was decided that compensation for the President andGroup Management shall consist of fixed salary, possiblevariable compensation, other benefits as well as pensions.The total compensation package shall be on market termsand competitive and related to the executive’s respons-ibilities and powers. Any variable compensation shall be based on results relative to defined and measurablefinancial targets and shall be subject to a ceiling relative
to the fixed compensation and shall not constitute a basis for pension rights. No share-related incentiveprogrammes have been issued by the Company. For a further description of the employment conditions of the Board and the Group’s senior executives, seeNote 2 in the Annual Report.
Audit Committee The Audit Committee complies with established rules ofprocedure which are adopted annually at the constituentmeeting of the Board of Directors. The Chairman of theAudit Committee is responsible for ensuring that theentire Board as is regularly informed as to the work of the Committee and, where necessary, shall submitmatters to the Board for a decision. The main duties ofthe Audit Committee are to support the Board in thework of ensuring the quality of the financial reporting.The Committee regularly meets the Company’s auditors,evaluates the audit work and approves the additionalservices that the Company may procure from externalauditors. There is an established risk management processin the Company which is based on processes and pro-duction flows. In this process, the Audit Committeereviews the risks that have arisen (both commercial risksand risks of errors in the financial reporting) and takesthem into account. Based on the result of the internaland external risk assessment, the Committee regularlydiscusses the focus and scope of the audit with theCompany’s internal and external auditors.
Each year, the Audit Committee adopts an internalaudit plan which, among other things, is based on therisks that have arisen in the risk management processdescribed above. The Committee also discusses significantaccounting issues which affect the Group and assists theNomination Committee in producing proposals as regardsauditors and their fees.
In 2006, the Audit Committee worked on developingand improving the presentation of the external financialreporting. The Audit Committee has, together with the external auditors, reviewed and discussed the riskanalysis and audit plan prepared by the auditors as a basis for the statutory audit. Other activities haveincluded assisting the Nomination Committee in pro-posals for the election of auditors at the 2007 AnnualGeneral Meeting.
The Audit Committee’s members have been Anders GCarlberg (Chairman), Sverker Martin-Löf and MarianneNivert. Two of the Committee’s members are independentin relation to the Company’s major shareholders.
In 2006, the Audit Committee held six meetings atwhich minutes were taken, at which all members werepresent.
Internal auditIn 2006, the Board appointed an internal audit function.
CORPORATE GOVERNANCE REPORT

SSAB ANNUAL REPORT 2006 | 11
CHIEF FINANCIAL OFFICER
HEAD OF PUBLIC AFFAIRS
CEO
HR DIRECTOR GENERALCOUNSEL
HEAD OF SHEET DIVISION
HEAD OF PLATE DIVISION
PRESIDENTPLANNJA
PRESIDENTTIBNOR
■ MEMBER OF GROUP MANAGEMENT
GROUP MANAGEMENT
Olof Faxander (1970)President and CEO as well as protem. Head of Plate Division. Mem-ber of Group Management since2006. Shareholding 1,200 shares.
M.Sc in Process Metallurgy and B.Sc in economics. Employed at SSAB since 2006.Formerly, among other things, Deputy President of Outokumpu.
Göran Carlsson (1954)Head of Sheet Division. Memberof Group Management since2002. Shareholding 5,859 sharesand call options corresponding to7,722 shares..
M.Sc in Process Metallurgy. Employed at SSAB since 1989.Formerly, among other things,Technical Director of SSAB.
Martin Lindqvist (1962)Chief Financial Officer. Member of Group Management since2001. Shareholding 17,109 shares.
M.Sc in Economics. Employedat SSAB since 1998. Formerly,among other things, CFO at SSAB Tunnplåt and Chief Controller at NCC.
Jonas Bergstrand (1965)General Counsel. Member ofGroup Management since 2006.
LLB. Employed at SSAB since2006. Formerly, among otherthings, corporate counsel at ABB, OM Gruppen and EricssonRadio Systems.
Anna Vikström Persson (1970)HR Director. Member of GroupManagement since 2006.
LLB. Employed at SSAB since2006. Formerly Head of HR atEricsson’s Swedish Division.
■
■
■ ■
■ ■
The internal auditor reports directly to the Audit Com-mittee but is subordinate to the Chief Financial Officer.
In 2006, the internal audit work focused primarily onsurveying the internal control. The internal auditor hasalso worked on an in-depth risk analysis in order toimprove SSAB’s risk management model. For a furtherdescription of the work of the internal audit in 2006, seethe section entitled “Description of the organisation ofthe internal control with respect to financial reporting”.
Group Management Group Management is responsible for the formulationand implementation of the Group’s overall strategies
and addresses issues such as acquisitions and divestments.These issues as well as major investments (>SEK 10 mil-lion) are prepared by Group Management for decisionby the Board of the Parent Company.
The President is responsible for the day-to-day management of the Company in accordance with theBoard of Directors’ instructions and guidelines. Followingthe reorganisation, Group Management consists, inaddition to the President, of the Heads of the SheetDivision and Plate Division, the Chief Financial Officer,the General Counsel, and the HR Director.
Group Management holds monthly meetings in orderto discuss the results and financial position of the Groupas well as divisions/subsidiaries. Other issues addressedat Group Management meetings include strategic issuesand follow-up on budget and forecasts.
The Head of each division and subsidiary is responsiblefor the respective profit and loss account and balancesheet. Overall operational control of the divisions takesplace through monthly performance reviews and, inPlannja and Tibnor, through the respective Boards ofDirectors. The President of the Parent Company is theChairman of the Boards of the directly-owned subsidiariesand these Boards also include other members from GroupManagement as well as employee representatives. TheBoards of the subsidiaries monitor the ongoing operationsand determine respective strategies and budgets.
Recruitment of a Head of the Plate Division is underway.
AUDITORS
PricewaterhouseCoopers AB Elected at the 2003 Annual General Meeting for a term up to and including the 2007 Annual General Meeting. Auditor in charge: Claes Dahlén, authorised public accountant.
Shareholdings include shareholdings of closely-related persons. Call optionshave been acquired on the market for a part of disbursed variable salary.

12 | SSAB ANNUAL REPORT 2006
CORPORATE GOVERNANCE REPORT
Carl Bennet (1951)Elected to the Board 2004.Shareholding 16,200 shares.
M.Sc. in Economics, Tech. dr.hc. Chairman of theBoard of Elanders, Getingeand Lifco. Deputy Chairmanof the Board of Boliden. Formerly, among otherthings, President and CEO of Getinge.
Anders G Carlberg (1943)Elected to the Board 1986.Shareholding 4,800 shares.
M.Sc. in Economics. CEO of Axel Johnson International. Member ofthe Board of, among others,Axel Johnson, Beijer Alma,Sapa and SäkI. Formerly,among other things, President and CEO of Nobel Industrier and J.S. Saba as well as DeputyPresident of SSAB.
Marianne Nivert (1940)Elected to the Board 2002.Shareholding 6,000 shares.
B.A. Chairman of theBoard of Posten. Member of the Board of Beijer Alma, 4th National PensionFund, Systembolaget and Wallenstam. Formerly,among other things, President and CEO of Telia.
Anders Nyrén (1954)Elected to the Board 2003.Shareholding 2,250 shares.
M.Sc. in Economics, MBA.President and CEO of Industri-värden. Deputy Chairman ofthe Board of Handelsbanken.Member of the Board ofEricsson, Ernström-gruppen,Industrivärden, Sandvik, SCA and Skanska. Formerly, among other things, DeputyPresident of Skanska.
Matti Sundberg (1942)Elected to the Board 2004.Shareholding 6,000 shares.
M.Sc. in Business andEconomics; ekon.dr.hc.,Mining Counsellor. RegionalDirector of Scania Nordeuropa.Chairman of the Board ofScania Sverige and Oy Scan-Auto. Member of the Boardof Boliden. Formerly, amongother things, President ofValmet and Ovako Steel.
Lars Westerberg (1948)Elected to the Board 2006.Shareholding 5,000 shares.
M.Sc in Engineering andMBA. President and CEO of Autoliv. Chairman of the Board of Husqvarna.Member of the Board ofAutoliv, Haldex and Plastal.
Sverker Martin-Löf (1943)Chairman. Elected to theBoard, Chairman since 2003.Shareholding 17,250 shares.
Doctor of Technology,dr.hc. Chairman of the Boardof SCA and Skanska. DeputyChairman of the Board ofIndustrivärden. Member ofthe Board of Ericsson andHandelsbanken. Formerly,among other things, President and CEO of SCA.
Olof Faxander (1970)Elected to the Board 2006.Shareholding 1,200 shares.
M.Sc in Process Metallurgyand B.Sc. in Economics.Chairman of the Council ofthe Swedish Steel Producers’Association.
Formerly, among otherthings, Deputy President ofOutokumpu.
BOARD OF DIRECTORS / APPOINTED BY THE EMPLOYEES
Owe Jansson (1945)Employee representativesince 1990. Steel Worker,Plate Division.
Bert Johansson (1952)Employee representativesince 1998. Electrician,Sheet Division.
Ola Parten (1953)Employee representativesince 2005. Engineer, Sheet Division.
Sture Bergvall (1956)Employee representativesince 2005. Electrician,Sheet Division.
Bo Järräng (1947)Employee representativesince 2004. Personnel, Plate Division.
Claes Ström (1945)Employee representativesince 2003. Accounts, SheetDivision.
Alternate members
BOARD OF DIRECTORS / APPOINTED BY THE ANNUAL GENERAL MEETING
Björn Wahlström has been Honorary Chairman of the Companysince 1991.
Secretary of the Board of Directors:Jonas Bergstrand, General Counsel.
The shareholdings include shares held by closely-related persons.

Internal control and risk management The overall objective of the internal control is to ensure,to a reasonable degree, that the Company’s operationalstrategies and goals are followed up and that the owners’investments are protected. In addition, the internal controlshall ensure that the external financial reporting is, withreasonable certainty, reliable and prepared in accordancewith generally accepted accounting principles, thatapplicable laws and regulations are complied with, andthat the requirements imposed on listed companies arecomplied with.
In order to improve the internal control, during 2006work was commenced in improving the risk managementmodel, which will be implemented in 2007. The objectiveof this work is to create a uniform process within theGroup and to integrate it as a natural part of the controland decision processes in the operations.
For a description of the organisation of the internalcontrol with respect to financial reporting, see below.
Description of the organisation of the internal controlwith respect to financial reporting – report for the2006 financial year
According to the Swedish Companies Act and the SwedishCode on Corporate Governance, the Board of Directorsof SSAB is responsible for the internal control. Thissection has been prepared in accordance with section3.7.2 of the Swedish Code on Corporate Governance,and supplementary instructions issued by the SwedishCorporate Governance Council.
Framework for internal control SSAB complies with the internationally establishedframework, Internal Control – Integrated Framework,which is issued by the Committee of SponsoringOrganizations of the Treadway Commission (“COSO”).In accordance with COSO, SSAB’s internal control processis based on the organisation’s control environment andincludes primarily the following components: risk assess-ment, control activities, information and communicationas well as follow-up.
SSAB’s internal control process is structured in order toensure, to a reasonable degree, the quality and accuracy ofthe financial reporting. In addition, the process shallensure that the reporting is prepared in accordance withapplicable laws and regulations as well as requirementsimposed on listed companies in Sweden. Prerequisites forthis being achieved are that a sound control environmentis in place, that reliable risk assessments are carried out,that established control activities exist and that infor-mation and communication as well as follow-up functionis in a satisfactory manner.
Control environment The control environment is characterised by the organ-isation structure, management’s work method andphilosophy as well as other roles and responsibilitieswithin the organisation. The Audit Committee assiststhe Board with respect to important accounting issueswhich the Group applies and follows up the internalcontrol with respect to financial reporting. In order tomaintain an efficient control environment and soundinternal control, the Board of Directors has delegatedthe practical responsibility to the CEO who, in turn, has delegated responsibility to other members of GroupManagement and Heads of Divisions/subsidiaries.
A number of projects are being conducted to ensurethat the Group’s internal control meets the requirementsimposed by various interested parties. Based on a currentstatus analysis, the projects have proposed improvementswith respect to work methods, routines and documenta-tion in order to ensure a sound internal control. As apart thereof, updating and, in certain cases, formulationof written routine descriptions has taken place in orderto better define responsibilities and powers. To ensure thequality of the financial reporting, work is taking place onfurther developing common Group policies and manuals;among other things, an accounting manual has beenproduced. The project work will continue during 2007.The most important, overall common Group controldocuments and policies are an accounting manual, financepolicy, information policy and ethics policy. In additionto these common Group policies, there are local controldocuments and policies, e.g. credit policy and policy fordissemination of economic information.
All divisions and subsidiaries have adopted guidelineswith respect to ethical issues. Decisions regarding eachsubsidiary’s ethical guidelines have been preceded byextensive reviews conducted by various project groupswithin the Group. The work of clarifying the Group’sCode of Conduct will continue during 2007. This rep-resents a stage in further strengthening the communicationof the Group’s values and philosophy. For additionalinformation regarding SSAB’s Code of Conduct, seepage 25 of the Annual Report.
SSAB ANNUAL REPORT 2006 | 13
CONTROL ACTIVITIES
INFORMATION AND COMMUNICATION
RISK ASSESSMENT
FOLLOW-UP
CONTROL ENVIRONMENT
INTERNAL CONTROL PROCESS

14 | SSAB ANNUAL REPORT 2006
CORPORATE GOVERNANCE REPORT
Risk assessment SSAB is an organisation which is exposed to variousrisks, both internally and externally. In order to ensurea sound internal control to a reasonable degree, the riskswhich may affect the financial reporting are identified,gauged and measures are taken. SSAB’s operations arecharacterised by processes involving well-establishedroutines and systems. The risk assessment thus takesplace largely within these processes and only general riskassessments take place on a Group level. Responsiblepersons in the Group identify, monitor and follow-upopportunities and risks. This creates conditions forwell-founded and correct commercial decisions on alllevels. Financial risks such as currency, financing andliquidity risks as well as interest rate and credit risks are handled primarily by the Parent Company’s financeand accounting function in accordance with the Group’sfinance policy (see Note 26 of the Annual Report). TheGroup’s system for identifying, reporting and takingmeasures as regards risks is integrated in the ongoingreporting to Group Management and the Board andalso constitutes the basis for the assessment of risks of error in the financial reporting.
During 2006, an in-depth risk analysis was carriedout and a new, improved risk management model willbe implemented in 2007. See also page 26 of the AnnualReport for an overview of the Group’s commercial riskexposure.
Control activities The primary purpose of control activities is to preventand, at an early stage, discover errors in the financialreporting so that these can be addressed and rectified.Control activities, both manual and automated, take placeon both overall and more detailed levels within the Group.Routines and activities have been designed in order tohandle and rectify significant risks associated with thefinancial reporting as identified in the risk analysis.Depending on the nature and affiliation of the controlactivity, corrective measures, implementation, docu-mentation and quality assurance take place on a Group,subsidiary or process level. Similarly as with regard toother processes, the relevant Head is responsible for thecompleteness and accuracy of the control activities.
In 2006, new business systems and accounting systemswere implemented in some of the divisions/subsidiaries.This has further strengthened the internal control, amongother things through more controls and processes beingautomated and authorisations in IT systems being limitedaccording to powers and areas of responsibility. The workof implementing new accounting and business systemswill continue in 2007.
Control activities are carried out on all levels in theGroup. For example, there are established Controllingfunctions which analyse and follow-up deviations and

SSAB ANNUAL REPORT 2006 | 15
Internal information and communicationEach division and subsidiary has a Chief Financial Officer who is responsible for maintaining high qualityand precision of delivery with respect to the financialreporting.
The local intranet constitutes an important com-munication channel in the Group on which information is published regularly. The divisions/subsidiaries alsohold regular accounting meetings. At these meetings,relevant personnel are updated regarding news andchanges within the accounting area and within the internalcontrol with respect, among other things, to the financialreporting. In addition, the Parent Company holds annualaccounting days at which new accounting principles andother relevant issues are discussed. At these meetings,the divisions/subsidiaries are also instructed in theapplication of common Group accounting principlesand procedures for preparing the financial reporting.
Follow-up The Board of Directors’ follow-up of the internal controlwith respect to financial reporting takes place primarilythrough the Audit Committee, among other thingsthrough follow-up of the work and reports of the internaland external auditors.
During the year, the internal audit has carried outoverall reviews of the internal control with respect tothe projects carried out in the Group regarding workmethods, routines and documentation. In 2006, theinternal auditor, with the assistance of a project teamfrom the Group, has also conducted process reviews inwhich the work is documented and reported to the AuditCommittee. These internal audits will continue in 2007.
The external auditors review each year selected partsof the internal control within the scope of the statutoryaudit. The external auditors report the results of theirreview to the Audit Committee and Group Management.Important observations are also reported directly to the Board of Directors. In 2006, the external auditorsreviewed the internal control in selected key processesand reported thereon to the Audit Committee andGroup Management.
report further in the Company. Follow-up by GroupManagement takes place, among other things, throughregular meetings with Heads of Divisions and subsidiarieswith regard to the operations, their financial positionand results as well as financial and operational key ratios.The Board of Directors analyses, among other things,monthly business reports in which Group Managementdescribes the period that has passed and comments onthe Group’s financial position and results. In these ways,important fluctuations and deviations are followed up,a factor which minimises the risks of errors in the financialreporting.
The work on the closing accounts and the annualreport involves processes in which there exist additionalrisks of error in the financial reporting. This work isless repetitive in nature and contains several elements inthe nature of an assessment. Important control activitiesinclude ensuring the existence of a well-functioningreporting structure in which the divisions/subsidiariesreport in accordance with standardised reporting models,as well as important profit and loss account and balancesheet items being specified and commented on.
Information and communicationSSAB’s information paths are concise, a factor whichallows for a rapid and flexible processing of informa-tion. The Group has a common information policy governing the flow of information, both externally and internally.
External information and communicationThe aim of the Group’s financial reporting to shareholders and the financial market is to provide the best possible conditions for a comprehensive assessment of the Company. Information is provided in accordance with the rules set forth in the listingagreement with Stockholmsbörsen. Following a review by the Audit Committee and the Board of Directors, all external financial reports are published on the website (www.ssab.se) after having first been submitted to Stockholmsbörsen.
The Chairman of the Board is responsible for owner-related issues. Financial information regardingthe Group is provided only by the CEO, the CFO, the Head of Public Affairs or the Head of Investor Relations. The Head of Public Affairs handles primarilycontacts with the mass media, while the Head of InvestorRelations handles contacts with the financial market. In addition to the above communications, annual capitalmarket days are arranged and presentations given toparties in the capital market in connection with pub-lication of interim and full-year reports.
SSAB applies a so-called closed period policywhereby no financial information is presented threeweeks prior to publication of financial reports.

RedemptionDuring the second quarter, the shareholders wereinvited to submit every twentieth share for redemptionfor SEK 485 (almost SEK 162 after the share split). Intotal, almost 4.5 million shares were surrendered forredemption and SEK 2,205 million was paid out to theshareholders on June 19. This corresponded to just overSEK 24 per outstanding share prior to redemption.
Share capitalFollowing the redemption, bonus issue and 3:1 sharesplit, the share capital amounts to SEK 2,280 milliondivided into 259,147,821 shares, of which 192,612,666are Class A shares and 66,535,155 are Class B shares.The quotient value per share equals SEK 8.80. All sharesare unrestricted. Each Class A share entitles the holderto one vote and each Class B share entitles the holder toone tenth of one vote.
Dividends and repurchase of sharesDividends shall be adjusted to the average profit levelover a business cycle and, in the long-term, constituteapprox. 50% of profit after tax. It shall also be possibleto use dividends to adjust the capital structure.
For the 2006 financial year, a dividend of SEK 4.50per share is proposed, i.e. 27% of earnings. Since theshare was listed on the stock exchange in 1989, thedividend has thus averaged 33% of earnings. Includingredemptions and repurchases, 66% of earnings havebeen distributed to the shareholders.
The Board will request authorisation from the 2007General Meeting entitling the Board to repurchase theCompany’s own shares. Pursuant to such authorisation,the Board shall be entitled, should it deem appropriate,to decide upon the repurchase of a maximum of 10% of the Company’s shares during the period until thenext Annual General Meeting. Any repurchase will takeplace on the stock market or through an offer to allshareholders. It is proposed that the Board’s authorisationwill also include the possibility to transfer repurchasedshares, however only in connection with payment for anacquisition.
16 | SSAB ANNUAL REPORT 2006
60
65
70
75
80
85
90
Share price development since listing.
The SSAB Share
SSAB on the stock exchangeThe shares have been listed on Stockholmsbörsen since1989. The share has been listed on the Exchange’s A-Listand, since 1994, among the most actively traded shares.Commencing 2006, the share has been listed on OMXThe Nordic Exchange, on the Large cap list. A tradingunit consists of 200 shares. OMX The Nordic Exchangeissues call and put options on the shares.
During the year, shares were traded at a value of justover SEK 62,300 million. Trading in SSAB shares tookplace on all exchange days and, on average, amountedto approx. SEK 250 million per day. Traded sharescorresponded to 182% of outstanding shares andconstituted 1.1% of the total turnover on the OMXStockholm Stock Exchange. Trading per month duringthe past five years is shown in the adjacent diagram.
During the year, the lowest trading price for the Class A share was SEK 93.20 and the highest price was SEK 166.67. At the end of the year, SSAB’s marketcapitalization was SEK 41,579 (25,805) million. TheClass-A share price increased by almost 70% in 2006,compared with an increase of just over 24% for Affärs-världen’s General Index.
Ownership structureAt the end of the year, Industrivärden was the largestshareholder measured in terms of share capital and votingcapital, followed by LKAB. AMF Pension and SwedbankRobur are among the financial institutions that havereduced their holdings in SSAB during the year, whileIndustrivärden and the 4th National Pension Fund haveincreased their holdings. Swedish shareholders have, intotal, reduced their stake in SSAB from 73% of sharecapital on December 31, 2005 to 66% of share capitalon December 31, 2006.

SSAB ANNUAL REPORT 2006 | 17
Since 1989, the number of shares and the share capital have changed as set forth below:Change in number Number Change in share Share capital
Year of shares of shares capital (SEK millions) (SEK millions)
1989 Conversion + 1,500,000 26,500,000 + 150 2,650
1994 Conversion + 5,500,000 32,000,000 + 550 3,200
1995 Split 4:1 + 96,000,000 128,000,000 0 3,200
1998 Redemption – 15,891,199 112,108,801 – 397 2,803
2001 Reduction in share capital – 11,210,880 100,897,921 – 281 2,522
2005 Redemption – 9,968,861 90,929,060 – 249 2,273
2006 Redemption – 4,546,453 86,382,607 – 114 2,159
2006 Bonus issue 0 0 + 121 2,280
2006 Split 3:1 + 172,765,214 259,147,821 0 2,280
Data per share2006 2005 2004 2003 2002
Trading price Dec. 31, class A, SEK 162.50 96.33 53.33 42.83 34.33
Earnings, SEK 16.02 14.07 11.87 2.97 1.90
Cash flow, SEK 14.29 14.81 6.58 2.53 3.99
Equity, SEK 59.18 52.01 42.96 33.14 32.36
Dividend 1), SEK 4.50 3.00 2.50 2.00 2.00
Average no. of shares, million 265.5 285.6 302.7 302.7 302.7
No. of shares at year-end, million 259.1 272.8 302.7 302.7 302.7
Market capitalization, MSEK 41,579 25,805 15,659 12,520 9,997
Valuation Yield, % 2.8 3.1 4.7 4.7 5.8
P/E ratio 10.1 6.8 4.5 14.4 18.1
Price/equity, % 275 185 124 129 106
EV/EBIT 2), 6.4 4.5 3.6 10.4 13.1
EV/EBITDA 2), 5.6 3.9 2.9 6.2 6.2
Pursuant to the Board of Directors’ proposal for the 2006 financial year.EV/EBIT and EV/EBITDA: Enterprise value (EV) relative to Earnings Before Interest and Taxes (EBIT) or Earnings Before Interest, Taxes, Depreciation and Amortization (EBITDA). Enterprise value isthe total of the Company’s market capitalization, net debt and minority interests. The gauge expresses the market value of the business as a debt-free company relative to the earnings levelsbefore financing items.
1)2)
Number of shares traded per monthShare price development

18 | SSAB ANNUAL REPORT 2006
Largest shareholdersShareholding as % of capital votes
Industrivärden 16.2 21.0
LKAB 4.8 6.2
Swedbank Robur 3.4 1.8
AFA Insurance 2.4 0.3
4th National Pension Fund 2.1 1.8
Nordea Funds 1.8 2.4
SEB Funds 1.6 2.0
Handelsbanken 1.5 1.9
Skandia Liv 1.5 0.5
Handelsbanken Funds 1.2 0.8
2nd National Pension Fund 1.1 1.2
1st National Pension Fund 1.0 1.1
Catella 1.0 0.2
AMF Pension 0.9 1.2
Foreign shareholders 34.0 34.7
Other shareholders 25.5 22.9
100.0 100.0
Distribution of sharesShareholding Number as % of all as % of
shareholders share capital
1-500 14,696 36.5 1.1
501-1 000 8,804 21.8 2.5
1 001-5 000 15,095 37.5 9.5
5 001-10 000 731 1.8 1.9
10 001-50 000 596 1.5 4.7
50 001-100 000 111 0.3 3.0
100 001- 226 0.6 77.3
Total 40,259 100.0 100.0
The tables above showing the largest shareholders and distribution of shares are basedupon information obtained from VPC as per December 31, 2006.
At year-end, there were 40,259 shareholders in theCompany, an increase of 9% during the year. 23,500shareholders owned 1,000 shares or fewer, while the tenlargest institutional shareholders owned just over 34%of the share capital and almost 41% of the voting capital.
Foreign ownership in SSAB at the end of December2006 was at the highest level since the Company waslisted in 1989, viz. 34 (27)% of share capital, brokendown as follows: USA (12%), Great Britain (11%), therest of Europe (9%) and the rest of the world (2%).
Investor RelationsDuring 2006, a large number of meetings took placewith representatives of financial institutions. The meetingswere held in Stockholm, London, Edinburgh and Paris.In addition, regular presentations were arranged inconnection with the publication of interim reports andthe results for the year.
Investment banks and stockbrokers that monitored SSAB in 2006:ABG Sundal Collier *)CarnegieCheuvreuxCredit Suisse (based in England) *)Deutsche Bank (based in England) *)SEB Enskilda SecuritiesExane BNP Paribas (based in France) *)Goldman Sachs International (based in England) *)HandelsbankenHagströmer & Qviberg JP Morgan (based in England) *)KaupthingSwedbankUBSÖhman
*) For the first time in 2006.
THE SSAB SHARE

International review The growth in global steel consumption accelerated in2006 and reached approx. 9%. Compared with previousyears, growth was more balanced between emergingeconomies and mature economies and a new record levelin global steel consumption was reached at just over 1.1billion tonnes. Chinese demand grew by approx. 10%,which was a lower rate of growth than in recent years.Chinese demand for steel now accounts for approx.32% of global consumption. Chinese steel productiondemonstrated, however, a higher rate of growth approx.19% as a consequence of which the country is now asignificant net exporter after having been in balance in2005. In Japan, the market was stable but the Japanesesteel industry significantly increased its exports to therest of Asia and the United States. In the United States,there was a growth in demand of approx. 15% after a7% fall in 2005. Imports to the United States increasedby some 45% during the year.
The European marketSteel consumption in Europe increased by approx. 9%in 2006 after a weaker 2005. Imports to Europe increasedsubstantially and, during the year, the region was a netimporter.
The Swedish market The market for sheet and plate demonstrated a solidrate of growth in 2006 after having declined somewhatin 2005. The total Swedish steel market is believed tohave grown by just over 6% in 2006.
SalesDemand for sheet in Europe was strong during most ofthe year. However, pending the first quarter it was neces-sary to accept price reductions of 3% in local currenciesas a consequence of the weak inflow of orders duringthe fourth quarter of 2005. During the remainder of theyear, it was subsequently possible to increase pricesgradually, totalling approx. 10% in local currencies.
Demand for quenched steels was strong throughout theyear and it was possible to increase prices gradually.
For the year as a whole, the steel operations’ prices inSwedish kronor were 5% higher than in 2005. The pricetrend is shown in the diagram on next page.
Deliveries of sheet and plate from the steel operationsincreased by 4% during the year to 3,096 (2,972)thousand tonnes. Of these deliveries, sheet accountedfor 2,474 (2,311) thousand tonnes while plate accountedfor 622 (661) thousand tonnes.
The year’s deliveries of extra and ultra high-strengthsheet amounted to 699 (507) thousand tonnes, an increaseof 38%. The increased deliveries took place primarily to the heavy transport vehicle/container and automotivesegments. Deliveries of quenched steels remained restrictedby available production capacity. However, throughvarious measures it was possible to increase capacitygradually and, therefore, deliveries during the year were8% higher than last year and reached 510 (471) thousandtonnes. The increase was primarily attributable to existingcustomers within most segments in Europe.
In total, deliveries during the year of core niche prod-ucts, extra and ultra high-strength sheet and quenchedsteels, amounted to 1,209 (978) thousand tonnes andaccounted for 39 (33)% of deliveries from the steeloperations.
During the year, there was strong demand for steel onthe Swedish market. Deliveries to the Swedish marketfrom Tibnor and the steel operations were 11% and 10%higher respectively than last year, while Plannja’s deliveriesincreased by 9%. The Group’s market share in respectof sheet and plate in Sweden increased somewhat.
Sales increased by 12% to SEK 31,054 (27,804)million. Higher prices and an improved product mixaccounted for 7 percentage points, while increasedvolumes accounted for 5 percentage points. External salesper business area are set forth in the table on next page.
Measured in terms of volume, exports from the steeloperations amounted to 70 (71)% of sales. For the Groupas a whole, sales outside Sweden accounted for 64 (64)%
Group ReviewREPORT OF THE D IRECTORS
SSAB ANNUAL REPORT 2006 | 19

REPORT OF THE D IRECTORS / GROUP REV I EW
of volume, as is shown in the following table of sales pergeographic region.
Production Crude steel production in Oxlösund was severely hit bythe explosion at AGA’s oxygen plant, with its attendantproblems, while production in Luleå remained stable.During the year, a relining was carried out of the smallerblast furnace in Oxlösund. The blast furnace in Luleåwas also stopped due to maintenance of the oxygen plant.
For the year as a whole, crude steel production thus fellby 6% and amounted to 3,737 (3,966) thousand tonnes.
Deliveries of slabs to outside the Group declined to42 (222) thousand tonnes, while purchases of slabsamounted to 71 (0) thousand tonnes.
In total, sheet and plate production was 6% higherthan in 2005 and amounted to 3,246 (3,072) thousandtonnes. At the end of 2005, however, production wascurtailed in order to off-set a weaker inflow of ordersfor ordinary sheet.
Cost trends Costs in the operations increased by 14% comparedwith last year and amounted to SEK 25,618 (22,515)million. Of this amount, SEK 6,403 (4,964) millionconsisted of purchases of products for the processingand trading operations.
Remaining costs of SEK 19,215 (17,551) millionconsisted primarily of processing costs, depreciation,and costs for input materials and energy.
Processing costs comprised primarily costs for theGroup’s own personnel and purchased services. For theyear as a whole, processing costs were 3% higher thanin 2005 and amounted to SEK 5,959 (5,778) million.The cost increase was primarily due to extra costsoccasioned by the explosion at the oxygen plant andcosts for rationalisation measures within both the steeloperations and the trading operations.
Depreciation increased somewhat and amounted toSEK 963 (951) million.
Prices of raw materials are set on the world marketand the prices, which are primarily quoted in USD, areheavily dependent on the steel business cycle. Iron oreand coal are the dominant raw materials and price anddelivery agreements are entered into annually at thebeginning of the year.
The annual iron ore agreements entailed a pricereduction in USD of just over 4%. The deliveries werehedged and a stronger dollar compared with 2005 resultedin a price increase in Swedish kronor of 3%. The agree-
20 | SSAB ANNUAL REPORT 2006
Sales per geographic regionSEK millions 2006 % 2005 %Sweden 11,289 36 9,988 36Germany 2,507 8 2,446 9Denmark 2,093 7 1,767 6Italy 1,968 6 1,962 7Finland 1,960 6 1,608 6Benelux 1,143 4 1,132 4Great Britain 1,076 4 1,072 4Poland 901 3 744 3France 653 2 657 2Other EU countries 2,003 7 1,669 6Norway 979 3 886 3Rest of Europe 529 2 418 1North America 1,810 6 1,598 6China 771 2 468 2Rest of Asia 728 2 791 3Other markets 644 2 598 2Total 31,054 100 27,804 100
External sales per business areaSEK millions 2006 % 2005 %Sheet Division 12,560 40 11,604 42Plate Division 7,026 23 6,675 24Plannja 1,480 5 1,373 5Tibnor 9,162 29 7,386 26Other 826 3 766 3Total 31,054 100 27,804 100

shares of earnings are reported in the profit and lossaccount under “Affiliated companies”, while the capitalgain is reported under “Other operating revenues”. Thesale contributed SEK 248 million to liquidity.
Thus, profit includes non-recurring items totallingSEK 77 (0) million.
Profit
Operating profit increased by SEK 319 million comparedwith last year and amounted to SEK 6,054 (5,735)million. As shown in the table below, increased deliveriesof core niche products and higher volumes/better mix in the trading and processing operations contributed animprovement of SEK 1,110 million, while weaker grossmargins in the steel operations, a reduced share of ordinaryplate and reduced sales of slabs had a negative impacton earnings of just over SEK 800 million.
SEK millions 2006 2005Sales 31,054 27,804Expenses – 24,276 – 21,213Depreciation – 963 – 951Affiliated companies 239 95Operating profit 6,054 5,735Financial items – 2 – 64Profit 6,052 5,671
Change in operating profit between 2006 and 2005 (SEK millions)Steel operations– Weaker gross margins – 365– Increased volumes of core niche products + 820– Decreased volumes of ordinary plate – 280– Lower volumes of slabs – 250Trading and processing operations– Higher volumes/improved mix + 290Higher processing costs – 180Improved profit, affiliated companies, incl. capital gains + 218Other + 66Change in operating profit + 319
ments entered into force at the beginning of the year andthus the full impact on costs was largely felt in 2006.
The 2006 coal agreements entered into force on April1 and entailed a price reduction in USD of just over 10%compared with the agreements that were signed in 2005and a price increase of approx. 20% compared with thetwo-year agreements that were signed in 2004. In total inSwedish kronor, this resulted in a price increase of 15%.The full impact of the agreements was felt during the thirdquarter and, since coal costs during the first half of theyear related to the 2005 agreements, coal costs for theyear were 17% higher than in 2005.
The Group’s cost structure is shown in the diagrambelow.
Energy Coal is an essential reduction agent in order to removeoxygen from the iron ore and constitutes one of themost important raw materials in the manufacture ofiron ore-based steel. Coal also accounts for approx.85% of the energy provided for the steel operations.
Energy is otherwise provided by electricity, oil, andLPG. In total, the steel operations consumed 1,750(1,600) GWh of electric power and 1,610 (1,600) GWhof oil and LPG during the year. Through the utilisationof the energy-rich gases that are formed during steelproduction, electricity is produced, among other things,at the OK3 heat and power plant in Oxelösund and in thehalf-owned energy company, Lulekraft. During the year,these plants produced 791 (845) GWh of electricity.
In total, energy costs (excluding coal) amounted toSEK 1,500 (1,170) million. The costs included varioustaxes amounting to SEK 137 (142) million.
Non-recurring Items The sale of the 25% stake in the affiliated company,Cogent Power, yielded a tax-exempt capital gain of SEK77 million. Last year, the share in Cogent’s pre-tax earn-ings was SEK – 1 million, while the share in the profitfor the period up to the sale was SEK 83 million. These
SSAB ANNUAL REPORT 2006 | 21

Consolidated balance sheetDec. 31 Dec. 31
SEK millions 2006 2005AssetsIntangible fixed assets 10 12Tangible fixed assets 7,962 7,651Participations in affiliated companies 283 381Financial fixed assets 15 41Deferred tax claims 70 83Inventories 6,951 6,788Accounts receivable 4,926 4,327Current tax claims 37 24Other current interest-bearing receivables 495 946Other current receivables 673 683Liquid assets 1,373 884Total assets 22,795 21,820
Equity and liabilitiesEquity for shareholders in the Company 15,335 14,184Minority shares 216 180Total equity 15,551 14,364Deferred tax liabilities 1,302 1,361Other long-term provisions 154 207Long-term interest-bearing liabilities 850 1,139Current interest-bearing liabilities 306 616Current tax liabilities 448 403Accounts payable 2,362 2,023Other current liabilities 1,822 1,707Total equity and liabilities 22,795 21,820
REPORT OF THE D IRECTORS / GROUP REV I EW
The equity ratio was 68 (66)% and the net debt/equityratio was – 1 (3)%. Profitability and net debt/equityratio compared with targets are shown in diagrams inthe section entitled Strategy and Targets on page 6.
Dividend and repurchase of sharesThe Board of Directors will propose to the AnnualGeneral Meeting that the dividend be increased to SEK4.50 (3.00) per share, equal to SEK 1,166 (818) million.
At the end of 2006, the net debt/equity ratio was – 1%.The Board believes that such a strong balance sheet is
Changed exchange rates compared with last year had anegative impact on earnings of approx. SEK 200 million,primarily due to the effect of the stronger dollar on rawmaterials costs.
The accident at AGA’s oxygen plant in SSAB’s area inOxelösund in the middle of October led to a brief stopat the entire steel mill, but first and foremost an extendedstop at the blast furnaces. Start up of the blast furnacesafter the accident proved to be more difficult thanexpected and resulted in one of the blast furnaces stoppingin a so-called chilled hearth. Production did not recoverto a normal level until the end of December. Thus, in totalthe stop and the start up resulted in a drop in productionof approx. 145 thousand tonnes.
Although part of the drop in production can bereplaced with purchased slabs, the total effect on profitof the explosion and the subsequent chilled hearth isestimated at approx. SEK 350 million. Profit for 2006has been negatively affected by some SEK 250 million,while the remaining SEK 100 million will affect the firstquarter of 2007.
As a result of lower net debt, financial items improvedto SEK – 2 (– 64) million. Profit after financial items thusamounted to SEK 6,052 (5,671) million.
TaxesTax for the year of SEK 1,711 (1,603) million consists ofcurrent tax in the amount of SEK 1,653 (1,719) million,deferred tax of SEK – 46 (– 139) million, and a share inthe taxes of affiliated companies of SEK 103 (23) million.The effective tax rate for the Group was 28 (28)%. The higher tax rate in foreign companies was offset bytax-exempt capital gains upon divested operations.
Profitability and equity ratioNet profit after tax and minority interests increased bySEK 232 million to SEK 4,253 (4,021) million, equal toearnings per share of SEK 16.02 (14.07).
Return on capital employed before tax amounted to36 (34)% and return on equity after tax to 29 (30)%.
22 | SSAB ANNUAL REPORT 2006

SSAB ANNUAL REPORT 2006 | 23
Sales Operating Profit after Return on capitalprofit/loss financial items employed, %
Mkr 2006 2005 2006 2005 2006 2005 2006 2005Business areas:Sheet Division 15,316 14,219 2,856 3,175 2,785 3,128 34 40Plate Division 9,941 9,135 2,234 1,994 2,193 1,957 40 39Plannja 1,482 1,377 114 80 110 76 30 20Tibnor 9,202 7,423 776 426 783 428 50 27Other subsidiaries 949 868 63 47 64 48
Parent company units:Parent company 1) 0 0 – 109 – 74 – 5 – 53Affiliated companies – – 144 87 144 87
Group adjustments – 5,836 – 5,218 – 24 0 – 22 0Total 31,054 27,804 6,054 5,735 6,052 5,671 36 34
Business areas’ sales, profit/loss and return on capital employed
Excluding dividends from subsidiaries and affiliated companies and excluding capital gains on sales of subsidiaries. The profit in the Parent Company units consists primarily of administrativecosts and a positive figure for financial items.
1)
to decide upon the repurchase of a maximum of 10% ofthe Company’s shares during the period until the nextAnnual General Meeting. Any repurchase will take placeon the stock market or through an offer to all shareholders.It is proposed that the Board’s authorisation will alsoinclude the possibility to transfer repurchased shares, how-ever only in connection with payment for an acquisition.
The proposed dividend and exercise of the authorisa-tion to repurchase shares are aimed at increasing the netdebt/equity ratio to approx. 30%, in line with the Group’sfinancial target.
Financing and liquidityDuring the year, working capital increased by SEK 265million, of which accounts receivable increased by just overSEK 600 million due to higher steel prices. In total, cashflow was SEK 3,794 (4,230) million, of which divestedoperations accounted for SEK 248 (1,425) million.
Capital expendituresDuring the year, decisions were taken regarding newinvestments totalling SEK 2,050 (836) million. Of these,SEK 770 million relate to investments for continuedexpansion within quenched steels. Among other things,a line is being constructed for the quenching of thick platein Oxelösund as well as a distribution centre with cuttingcapacity in China. Implementation, which will take placegradually during 2007-09, will increase quenched steelproduction capacity by an additional approx. 20%, i.e.to 700 thousand tonnes. Production of ordinary platewill thereupon be switched entirely to the production of quenched steels.
An additional SEK 225 million relates to investmentsin increased capacity for after-treatment of crude steelin Oxelösund. The plant will be brought into operationin the autumn of 2007.
The Groups Cash flowSEK millions 2006 2005Profit after financial items
(excl. affiliated companies) 5,813 5,576Reversal of depreciation/amortisation 963 951Current tax – 1,654 – 1,720Other reversals – 54 +57Change in working capital – 265 – 1,281Ongoing operations 4,803 3,583Investing activities – 1,257 – 778Divested operations + 248 + 1,425Total, investing activities – 1,009 647Cash flow 3,794 4,230
Cash flow in the different business areasSEK millions 2006 2005Sheet Division + 1,857 + 1,571Plate Division + 1,079 + 595Plannja + 150 + 95Tibnor + 409 + 426Other subsidiaries + 20 + 16Parent company + 31 + 102Total, remaining operations + 3,546 + 2,805Divested operations + 248 + 1,425Total + 3,794 + 4,230
Cash flow from ongoing operations differs from a presentation in accordance with IFRSinsofar as cash flow is affected by current tax costs, i.e. the tax which is to be paid. The difference between this tax and the tax which has actually been paid is therebyregarded as a financial debt/claim.
normally not required in order to secure the developmentof the business in the medium term; at the same time,though, the Board wishes to retain a certain degree offlexibility for possible acquisitions or strategic investments.Thus, the Board will request authorisation from the 2007Annual General Meeting entitling the Board to repurchasethe Company’s own shares. Pursuant to such authorisation,the Board shall be entitled, should it deem appropriate,

24 | SSAB ANNUAL REPORT 2006
REPORT OF THE D IRECTORS / GROUP REV I EW
In addition, SEK 265 million relates to investments in anew coiler at the hot-rolling line in Borlänge. The newcoiler will enable expansion of the product range withinextra and ultra high-strength sheet. The coiler is expectedto be brought into operation in the summer of 2008.
Major ongoing projects decided upon before 2006include an investment of SEK 500 million in increasedquenched steel capacity. The project will continue untilthe summer of 2007.
Capital expenditure payments amounted to SEK 1,407(853) million.
Research and development The Group’s focus on the core niche products, extra andultra high-strength sheet and quenched steels, requires acombination of advanced material development, pro-duction development and market development. The goalof the development work is to create the best possibleconditions for profitable transactions, based on thecustomers’ needs.
Added value for the customers is created through activeco-operation with customers, based on knowledge of theunique qualities of the core niche products and how theycan be exploited to create competitive products. Animportant success factor for fruitful co-operation is thatit is commenced at an early stage so that design solutionsand production methods can be adapted for a cost-effi-cient use of these steels. Thus, the development of the coreniche products often takes place in cooperation with thecustomers. New, improved steels are also tested in espe-cially demanding applications at selected customers.
Materials development is focused on the core nicheproducts with respect to greater strength and hardness,improved formability, and adaptation to selected nichemarkets. This is combined with development of applica-tion know-how.
The overriding goal of the process development is toreduce manufacturing costs for the entire productionrange simultaneously with improvements in productqualities. During the production of steel, the conditionsare established for uniformity in the qualities of a typeof steel. In conjunction with rolling and quenching, for example, the hardness, toughness, flatness and finesurface of the manufactured sheet are determined. Atthe Group’s metallurgy plants, rolling mills and after-treatment lines, improvement work is constantly takingplace in order to imbue the finished steel with theintended qualities.
Skills-enhancement work is taking place constantly toenable the customers to utilise the advantages offeredby the core niche products. Today, the Group has at itsdisposal extensive material which describes the best waysin which these steels can be used and exploited in variousapplications. Examples include manuals on design anddimensioning, jointing and forming, as well as calculation
programs such as WeldCalc™ (welding) and WearCalc™(wear and tear) and simulation programs regardingloading and manufacturing operations.
Through courses and seminars conducted by expertsfrom the steel operations, customers are offered educationand training within various application areas, and therebybecome better acquainted with the possibilities affordedby the core niche products. Together with the customers,new design solutions have been developed in variousgroups, such as the Knowledge Service Center, ConceptualDesign Group and Wear Technology Group.
With respect to hot-rolled sheet, Domex, developmentwork is focused on producing ultra high-strength steelsfor applications within heavy transports, lifting andload handling. A new series of cold-rolled sheet intendedespecially for roll forming is under development, as areextreme high-strength products, such as Docol 1500M.
The hot dip galvanised ultra high-strength product rangeis developing towards higher strengths and more products.These steels are intended primarily for passenger vehicleapplications. A new group of ultra high-strength hot dipgalvanised sheet with extremely good formability, Dogal1000 DPX, is now becoming commercially available.
Among quenched steels, the HARDOX abrasion-resistant steels are being constantly upgraded and theproduct range expanded with new, improved products.Over the past few years, several new products have beenintroduced that are especially intended for a specific areaof use, e.g. HARDOX 550 for applications within therecycling and mining industries and HARDOX HiTuffor buckets and demolition tools. HARDOX Extreme,with a hardness of up to 700 Brinell, is currently beingevaluated at selected customers around the world. The world’s strongest high-strength construction steel,WELDOX 1300, allows for the design of even strongerand lighter mobile cranes and truck cranes.
Development of applications for the building industrytakes place within the processing operations. The Group’sleading position within roof, wall and rainwater run-offproducts in steel is a result of an effective process andproduct development work in close co-operation withboth users and architects.
R&D costs in the steel operations amount to approx.SEK 150 million. Various national and internationalnetworks play an important role in both long-term andfundamental R&D. Important partners in the Group’sR&D network include the Swerea (Swedish research)institutions, MEFOS and KIMAB, the industry organ-isations, Jernkontoret (the Swedish Steel Producers’Association), Eurofer (European Confederation of Iron and Steel Industries) and the International Iron and Steel Institute, as well as various universities andcolleges. The Group takes part in a number of develop-ment projects financed jointly with other steel companiesand the EU’s Research Fund for Coal and Steel.

Subsidiaries possess, among other things, ISO 9000:2000and ISO/TS 16949 certification for deliveries and therebymeet the customers’ demands that the operations shallhave approved quality assurance systems.
Ethical issuesThe Group’s work methods must at all times be charac-terised by respect for the countries and environments in which the Group operates, and respect for employeesand co-operation partners. The Group has the followingguiding principles for responsible business practice:
• On all markets and in all operations where SSABacts, we shall comply with laws, fulfil agreements and adhere to generally accepted business practices.
• We comply with the United Nations’ Global Compact’sadvisory principles for companies. These principlesrelate to human rights, working conditions, theenvironment, as well as corruption and bribery.
All divisions/subsidiaries have established guidelineswith respect to ethical issues. Decisions regarding eachsubsidiary’s ethical guidelines have been preceded byextensive reviews by various management groups andwork groups. In this way, solid support has been createdfor responsible business practices prior to introductionof the guidelines.
PersonnelAt year-end, there were 8,412 (8,391) employees, anincrease of 21.
Due to the age structure for white-collar employees, inthe coming years the Group will lose through retirementa large number of employees who possess great experienceand skills; see diagram. Thus, planning work for gradualreplacement by new employees has commenced. Theidentification of key skills among employees who areapproaching retirement and the transfer of those skillsare important factors for a successful replacement ofone generation of employees with another.
Skills development has been conducted on a broad frontduring the year. The target groups are many, as are theanticipated development effects. The increased ability ofemployees to utilise new technology and new methods, aswell as constantly improving work methods and co-opera-tion, are examples of this. An area which can be men-tioned in particular is the improved cooperation betweenproduction and maintenance. During the year, the pro-gramme for further training of technicians has continued.
The common Group development programmes for man-agers on different levels have continued during the year. Inaddition, for some time development activities have beenconducted for younger persons with management potentialand for managers who have newly assumed their positions.The work of replacing retiring managers with new ones hasbegun and many new managers were appointed duringthe year. It is pleasing to note that in 2006 more femalemanagers were appointed than in previous years. Seminars,among other things on continued personal development,have been held for established managers, as well as varioustypes of skills enhancement training programmes. Trainingprogrammes also commenced during the year for new andexperienced project managers.
An annual assessment has been carried out regardingthe performance and development potential of all man-agers. Work has commenced on further improving thesupply of managers and the Group’s management criteriahave been made clearer.
It is of central importance that we be able to attractstudents at colleges and universities and thus recruitment
Number of employees at year-end
2006 2005 Change %
Sheet Division 4,148 4,207 – 1
Plate Division 2,690 2,596 + 4
Plannja 500 465 + 8
Tibnor 935 990 – 6
Other 139 133 + 5
Total 8,412 8,391 + 0
SSAB ANNUAL REPORT 2006 | 25

26 | SSAB ANNUAL REPORT 2006
REPORT OF THE D IRECTORS / GROUP REV I EW
activities have intensified. The result of this can be seenin the form of an improved ranking among the mostattractive employers for technologists, with SSAB nowbeing ranked among the top 50.
Rehabilitation work has continued during the year, ashave preventative measures within ergonomy and keep-fitprogrammes. Such measures shall contribute to a reductionof sick leave in the long term. Sick leave during the yearamounted to 7.2 (7.3)% for blue-collar employee, and3.6 (3.7)% for white-collar employees. Sick leave brokendown by gender and age group is shown in Note 19.
Turnover of personnel remained at a low level butincreased to 4.5 (3.9)%.
The number of accidents decreased somewhat. Focuson the working environment has continued throughsafety training and other preventative measures. Properreporting of accidents and near accidents is also a pre-requisite so that experiences gained can be utilised toavoid repetition of mistakes and minimise risks.
The partial retirement scheme for employees coveredby agreements with the Swedish Metalworkers’ Union hascontinued. The purpose of the scheme is to enable suchemployees to remain in work until ordinary retirement ageand to facilitate a transfer of skills. The pension, whichis conditional on at least half-time employment, is paidin the amount of approx. 65% of the lost earnings fromwork. Thus far, almost 250 employees have takenadvantage of the possibility of partial retirement.
All permanent employees participate in a profit-sharingscheme. In 2006, the Board of Directors decided thatprofit-shares will be paid out directly after publicationof the results for the year. This is to enable employees tofeel a clearer connection between the Company’s resultsand the payment, compared with the situation previouslywhen the profit shares were managed in funds and paidout only after three years.
Thanks to the excellent results for the year, the profit-sharing ceiling was reached. Thus, a full-time employeewill receive a profit-share of just over SEK 24,100(19,300) before tax.
In total, compensation paid to employees amountedto SEK 4,223 (4,085) million, equal to 14 (15)% of sales.
Compensation for senior executivesIn Note 2 the guidelines for the compensation of thePresident and other senior executives for 2006 arepresented.
For 2007 the Board proposes that the compensation tothe President and other senior executives shall consist of fixed salary, any variable compensation, other benefitsand pension. “Other senior executives” means membersof Group Management, currently four persons other thanthe President. The total compensation package shall beon market terms and conditions and competitive on theemployment market on which the executive operates.
Fixed salary and variable compensation shall be relatedto the executive’s responsibilities and powers. The vari-able compensation shall be based on results comparedwith defined and measurable targets and shall not exceedan established percentage of fixed salary. Variable com-pensation shall not be included in the basis for pensioncalculation. The period of notice of termination ofemployment shall be six months in the event of termina-tion by the executive. In the event of termination by thecompany, the total of the period of notice of terminationand the period during which severance compensation is payable shall not exceed 24 months. Pension benefitsshall be either benefit-based or contribution-based or a combination thereof, with individual retirement ages,however in no case earlier than the age of 60. Benefit-based pension benefits are conditional on the benefitsbeing earned during a pre-determined period of employ-ment. In the event the employment terminates prior tothe retirement age, the executive shall receive a paid-uppolicy in respect of earned pension. The Board shall beentitled to deviate from the guidelines where specialcause exists in a particular case.
Significant risks and uncertainty factorsThe Group’s results and financial position are affectedby a large number of factors, several of which are beyondthe Group’s control. These include, for example, politicaland economic conditions that affect the markets for steel.
The work of identifying and analysing risks as well asdecisions on how, and to what extent, the risks are to beaddressed constitutes a prioritised area in the Group.
Risks and uncertainty in the Group’s operationsSteel production takes place in a chain involving differentprocesses in which disruptions in any part of the chaincan rapidly have serious repercussions on the entireprocess. Accordingly, a disruption in the operations due,for example, to transport obstacles and damage to assetsresulting from, e.g. fire, explosions and other types ofaccidents can be costly. The risk that disruptions in onepart of the process will have repercussions in other partsof the process can be minimised by keeping stocks ofraw materials, work in progress, inventories of finishedgoods, as well as other types of inventory on as optimala level as possible. Both property insurance and businessdisruption insurance are held in order to minimise thecosts resulting from this type of problem.
The possibility to attract and retain skilled personnelrepresents a key factor in being able to conduct theoperations with good profitability in the long term. Thus,skills development and, not least, management trainingare prioritised areas. The niche strategy is contingentalso on a continued strong process and product devel-opment, and thus skills development in these areas is ofparticular importance.

SSAB ANNUAL REPORT 2006 | 27
Prospects for 2007Continued strong global demand for steel is anticipatedin 2007. In Europe, steel consumption is expected to beessentially unchanged, while demand in the United Stateswill level off. Steel consumption in China is expected togrow by almost 10%.
The steel operations’ volumes of the core niche prod-ucts, quenched steels as well as extra and ultra high-strength sheet, are expected to continue to grow in2007. During 2007, additional quenched steel capacitywill be brought into operation.
Based on the agreements which have been entered into,the steel operations’ prices in local currencies during thefirst quarter will be somewhat higher than during thefourth quarter.
The price of iron ore is expected to increase by justover 5% in USD. For coal, on the other hand, the worldmarket price in USD is expected to decline somewhatcompared with the agreements signed in 2006. The ironore agreements will impact on earnings from the begin-ning of the year, while the impact of the coal agreementswill not be felt until the end of the second quarter.
Processing costs will be affected by costs for plannedrationalisation and an ongoing skills replacement pro-gramme entailing that approx. 400 employees areexpected to leave SSAB in 2007. Commencing 2008,these measures – which are primarily based on a volun-tary approach – will generate an annual cost saving ofjust over SEK 200 million.
The table below shows the approximate effect in 2007on profit after financial items, as well as on earnings pershare, as a consequence of changes in significant factors.
The Group’s reputation can be eroded quickly if safety,environmental responsibility and ethics are called intoquestion, and thus priority is given to these issues in theday-to-day work as well as in long-term training andwork on influencing attitudes.
In an international business such as SSAB’s, a numberof financial risks can arise in the form of currency risks,financing risks, liquidity risks, interest rate risks and creditrisks. The management of these risks is regulated in theGroup’s finance policy which is described in greaterdetail in Note 26.
Risks and uncertainty in the steel industryThe steel industry is strongly affected by the businesscycle as regards steel and as regards the most importantraw materials. The high proportion of fixed costs result-ing from the large investments that characterise the steelindustry also increases sensitivity to business cycle fluc-tuations. It is difficult to protect oneself against this, buta focus on niche products and long-term raw materialsagreements are examples of ways in which SSAB haschosen to minimise the cyclical nature of its earningscapability. In order to withstand financially downturnsin the business cycle, SSAB employs a relatively highequity ratio.
Competitors’ development is something that cannot beinfluenced; however, the major acquisitions and mergerswithin the steel industry in recent times is a positive factorfor a niche company such as SSAB. In other respects, itis only through a continued focus on the development ofniche products that SSAB will be able to maintain and,preferably, strengthen its position vis-à-vis its competitors.
The system of carbon dioxide emission rights hasresulted in new rules of the game for players in the steel industry. As it functions today, the system leads to distortion of competition due to the fact that a largeproportion of the world’s steel producing countries areoutside the system.
External risks and uncertainty There are a large number of extraneous factors that affectthe entire steel industry and, thereby, SSAB. Examplesof this include the introduction of various obstacles totrade, energy price trends and increased environmentalrequirements. (The work of managing environmental risksand increased environmental requirements is addressedin greater detail under the section entitled “SSAB andthe environment”.)
Over the past few years, growth in China has acted asa strong motor for the world economy, not least for thesteel industry. A reduction in Chinese demand for steelwould have a major impact on the global steel market.
Prices – steel operations 10 2,050 5.70Volumes – steel operations 10 1,080 3.00Volumes – trading
operations 10 140 0.40
Margins – trading operations 2%-pts 180 0.50
Wage costs 2 80 0.20Prices – coal, coke and
iron ore 10 540 1.50Krona index 10 690 1.90
Sensitivity analysis
Effect on Change Effect on profit, earnings per
% SEK millions share, SEK

SSAB and the environment
The Group’s operations shall be conducted efficiently withrespect to the use of natural resources and energy. Thisbasic approach is well known in the Company throughthe Group’s environmental policy. The head of eachdivision and subsidiary is responsible for the impact ofthe Group’s operations on the environment. Productionand environmental responsibility are integrated into theday-to-day work and there are environmental experts ateach major production plant.
Steel in societySteel meets society’s demands for husbanding of resourcesthrough recycled steel being capable of being melted downand formed into new steel, time after time. In recent years,the percentage of steel which is manufactured fromrecycled steel has declined somewhat due to the strongincrease in global steel consumption. Recycled steelconstitutes a raw material for just over 35% of globalproduction. The remaining share is produced using ironore as a raw material.
The Group’s primary raw material in the productionof steel is iron ore. Recycled steel accounts for approx.20% of production. Accordingly, the Group’s steel opera-tions are the largest consumer of recycled steel in Sweden.
The Group’s production of steel focuses on the coreniche products, extra and ultra high-strength sheet aswell as quenched steels. The environmental impact perproduced tonne from the production of these core nicheproducts is marginally higher than from the productionof traditional steel. The environmental value of thesesteels comes to the fore when they are used in variousdesigns in which a lower volume can be used comparedwith traditional steel.
The containers manufactured by CMT, Cargo ModuleTrading, are an example of this. CMT has exploited thequalities of the high-strength steels and the result has beencontainers with low weight and high abrasion resistance.The choice of material, the well thought-out design andefficient production methods have resulted in majoreconomic and environmental advantages for the manu-facturer, owners and transporters. Docol 1400 DP is
used in the lightest containers for chippings. The totalweight reduction compared with the original design isalmost 30%. Thus, transports using these containershave become more efficient, resulting in a reduction infuel consumption and reduced discharges of, amongother things, carbon dioxide.
Environmental conditions for the operationsSweden’s environmental legislation is greatly affected bydecisions taken by the EU Parliament and Council ofMinisters. Through harmonisation of the environmentallegislation within the EU, the risks of distortion of com-petition between the EU’s steel producers are reduced.
The activities conducted at the steel operations’ majorplants are examined and subject to conditions imposed bythe National Licensing Board for Environmental Protec-tion or the Environment Court following a public exami-nation. Each production unit submits an annual publicenvironmental report to the relevant supervisory authorityregarding the environmental impact of the operations.
The activities of the steel operations are subject toapprox. 200 environmental conditions governing emis-sions into the air and water, noise levels, regulationsregarding deposits, etc. The environmental conditionswith respect to Plannja and Tibnor are established bythe relevant County Administrative Board, which grantspermits in accordance with the Environmental Code. Inmost cases, actual emissions are significantly lower thanthe levels established by the authorities. During the year,no environmental limits have been exceeded and no dis-putes relating to the environment have arisen. The divi-sions’ foreign production units comply with all relevantlocal environmental requirements.
The maximum permitted production levels are shownin the table on next page:
The Group’s operations are constantly changing, afactor which makes necessary new environmental permits.In connection with these examinations, the supervisoryauthorities have imposed more stringent environmentalconditions.
The Group possesses mandatory environmental damageinsurance as well as liability insurance covering damageto third parties.
REPORT OF THE D IRECTORS / S SAB AND THE ENV IRONMENT
28 | SSAB ANNUAL REPORT 2006

SSAB ANNUAL REPORT 2006 | 29
AirThe Group’s steel production generates discharges intothe air, primarily of carbon dioxide, nitrogen oxides,sulphur oxides and particulates.
Iron ore constitutes the Group’s main raw material forthe production of steel. It is purchased in the form of cen-timetre-sized pellets consisting of enriched iron ore andslag formers. The pellets are added to the blast furnacetogether with coke and coal. In the blast furnace, the coalcombines with the oxygen which is bound to the iron in theiron ore. This takes place at high temperatures and thereleased iron can be drawn off in liquid form from the blastfurnace. When the oxygen combines with the coal, carbondioxide is formed. Thus, carbon dioxide is an unavoidableby-product in all iron-ore based steel production.
The Group has long been engaged in constant endeav-ours to reduce consumption of coke and coal per producedtonne of steel. Through this work, both production costsand carbon dioxide emissions have been reduced. In inter-national comparisons, the Group’s iron-ore based steelproduction has been shown to have among the lowestemissions of carbon dioxide per tonne of crude steel.Carbon dioxide emissions from the Group’s steel pro-duction for the past ten years are shown below.
Within the framework of the Kyoto Protocol, the EU
Member States have jointly undertaken to reduce carbondioxide emissions by 8% during the period 1990–2012.As a method for restricting emissions, the EU Parliamentand Council of Ministers have decided on the introductionof a system of emission rights. The EU makes an alloca-tion between the Member States and each State thenmakes a national allocation of emission rights to oper-ators. The Group’s operations in Borlänge, Luleå andOxelösund are covered by the system. The trading systemand the allocation of rights have been divided into twotrading periods, 2005–2007 and 2008–2012. The Group’sallocation with respect to metallurgy and the combinedheat and power plants is expected to suffice for forecastproduction during the current trading period. In 2006,SSAB submitted an allocation application for the nexttrading period, 2008-2012. During the second tradingperiod, the rolling mills’ preheat furnaces will be includedamong the activities that require emission rights.
The Group’s emissions of nitrogen oxides and sulphuroxides derive from different types of incineration. Thelarger sources consist of under firing of coke batteries,firing of heating apparatus for the blast furnaces andpreheating of slabs prior to rolling. Fuel consists of fur-nace gases, coke gas, LPG and oil. By continually workingon adjusting the burners and the flow of fuel and com-bustion air, it has been possible to reduce emissions ofnitrogen oxides. A transition to coal and oil with lowsulphur content has made possible a reduction in sulphuroxide emissions. In recent years, the Group’s coke pro-duction has increased, entailing increased emissions ofnitrogen oxides and sulphur oxides. Emissions of nitrogenoxides over the past ten years are shown below.
Emissions of particulates from the Group’s operationshave fallen significantly since 1997. This positive devel-opment is mainly due to investments in new plant andimproved maintenance of particulate separators. Emissionsof particulates over the past decade are shown below.
WaterThe steel operations’ consumption of process water isapprox. 13,500 m3 per hour. It is used as process waterin purification plants, for cooling furnaces and cooling coke, slabs, band, sheet and plate. Most water use takes
Permitted Production Thousand tonnes Locality production 2006Coke Luleå 800 741
Oxelösund 530 441Hot metal Luleå 2,300 2,256
Oxelösund 1,900 1,325Crude steel Luleå 2,500 2,207
Oxelösund 1,700 1,530Hot-rolled sheet Borlänge 3,200 2,660
Oxelösund 820 586Pickled sheet Borlänge 2,500 1,792Cold-rolled sheet Borlänge 1,400 1,152Annealed sheet Borlänge 650 521Metal-coated sheet Borlänge 680 543Organic-coated Borlänge 140 129products Luleå 85 76
Köping 30 15Malmö 10 7Finspång (million m2) 40 33

30 | SSAB ANNUAL REPORT 2006
place in closed systems and, before used water leaves theindustrial area, samples are regularly taken, often on acontinuous basis.
The presence of organic components in water is measuredindirectly by determining their COD (Chemical OxygenDemand). The Group’s emissions of organic componentsderive primarily from the coke plants’ activities.
The Group’s emissions of oils and grease derive primar-ily from the rolling mills. For a long time, work has beentaking place regularly to reduce the need for oils in con-junction with rolling and to improve separation of oils andfats from water used by the Group prior to discharge. TheGroup’s emissions into water with respect to the mostimportant emissions per produced tonne of finished productare shown in the diagram on the preceding page regardingmaterial and energy balance.
Energy and materialsThe Group’s energy sources are coal, coke, oil, LPG andelectrical power. The consumption of coal and coke isapprox. 745 kilos per tonne of finished steel, equal toapprox. 5,660 kWh. The consumption of oil, LPG andelectrical power is 785 kWh per tonne finished product.Total energy consumption is thus approx. 6,400 kWh pertonne. Energy husbandry constitutes an important areafor the Group. Thus, the energy-rich gases that are formedin conjunction with steel production are used in order toreplace oil and LP-gas.
These gases are used primarily for underfiring the cokebatteries, preheating blast air for the furnaces and for heat-ing slabs, etc. The gas that cannot be utilised in the Group’sprocesses is used in heat and power plants for producingelectricity and hot water. In Luleå and Oxelösund muni-cipalities, the hot water produced in the heat and powerplants meets more than 90% of the heating needs in therespective district heating network. In total, 864 GWh ofhot water were supplied from the heat and power plants.This corresponds to approx. 290,000 m3 of wood pelletsor similar fuel. A comparison with typical emissions for afossil fuel boiler demonstrates that emissions of nitrogenoxides and particulates are more than three times greaterthan when gases from the steel operations are used.
Production of crude steel during the financial yeartotalled 3,737 (3,966) thousand tonnes. Crude steel wasprocessed into 3,237 (3,394) thousand tonnes of finishedproducts. The materials and energy balance for the steeloperations is shown in the diagram on the preceding page.International comparisons demonstrate that, comparedwith other iron ore-based steel producers, the Group hasa low level of resource and energy use as well as a lowimpact on the environment.
By-productsIn addition to energy-rich gases, a number of other by-products are formed during the Group’s steel production,for example slag, tar, crude benzene, sulphur and ammo-
nium sulphate. The work of handling the by-products isbased primarily on recycling them in the Group’s ownprocesses. In this way, iron can be recovered or slag formerssuch as lime can be used once more. Alternatively, the by-products are sold, preferably in processed form asproducts with specific qualities. In most cases, the environ-mental performance of these products is superior to thatof traditional materials, especially when seen from a lifecycle perspective. The by-products and waste which cannotor should not be used are deposited.
Depositing takes place in such a manner that it will bepossible to make use of these resources in the future. Atpresent, 90% of by-products are processed and recycled.As a result of the very exact process control in steel pro-duction, the by-products are also very well defined, a factorwhich facilitates continued use of them. SSAB Meroxspecialises in developing products based on by-productsfrom the steel operations. Among other things, slag fromblast furnaces is used to produce the cement and concretematerials, Merit 5000 and Merolit, crushed aggregate forstabilisation of, e.g. clay, gravel roads and riding tracks,as well as M-kalk, an organic plant fertiliser. Iron oxide is sold for the manufacture of ferrite magnets and is alsoused in matchsticks.
TransportationThe Group’s aim of conducting all operations in as resource-efficient a manner as possible applies also to transportation.The raw materials for steel production are transported toLuleå and Oxelösund by train or boat. Transports of slabsbetween the production plants take place by rail. The returnjourneys are utilised for transporting sheet to the exportport in Oxelösund and for transports from Borlänge toPlannja and other customers in the north. The products fromthe steel operations are transported mainly by rail or boat.
Some time ago, new railway wagons for coils wereintroduced which use high-strength sheet at strategic points,e.g. load securing arms, endwalls and cradles. This providesa lower wagon weight and greater payload.
Tibnor’s deliveries to customers take place largely bytruck, while Plannja uses truck and rail to an equal degree.
SSAB Tunnplåt has been awarded Green Cargo’s GoodEnvironmental Choice Certificate (Bra Miljöval) for thefourth year in a row, while SSAB Öxelösund received theaward for the first time. The award is recognition of thefact that the Companies meet the criteria established bythe Swedish Society for Nature Conservation as regardsGood Environmental Choice for transports.
Day-to-day environmental workWithin the steel operations, there are special environmen-tal departments which are responsible for ensuring com-pliance with laws and contracts, administering permitapplications, and measuring and reporting emissions. TheGroup has a common body – the Environmental Council– which coordinates environmental work. All subsidiaries
REPORT OF THE D IRECTORS / S SAB AND THE ENV IRONMENT

SSAB ANNUAL REPORT 2006 | 31
have ISO 14 001 certified environmental managementsystems.
Environmental management systems are included as an integral part of the divisions’/subsidiaries’ operationalsystems. In this way, the external environment, productquality and work environment are coordinated in commonwork descriptions, rules regarding conditions to be imposedin conjunction with purchasing, and development of pro-duction technology. Training in environmental matters takesplace as required within the various organisational units.
Within the systematic work of reducing the impact onthe environment, the most significant environmentalaspects have been identified for each locality at whichproduction plants are located. The most important aspectsare the impact on climate through emissions into the airand water and consumption of raw materials and energy.In order to achieve improvements, focused activities takeplace within these areas.
Control of the immediate environment at each produc-tion plant takes place in accordance with established con-trol programmes and is reported to the relevant authority.Environmental studies are conducted by taking water andair samples. In addition, fishery-biological studies andstudies of bio-indicators such as mosses or sea bed faunaare carried out.
The provision of information to, and dialogue with,different groups in the community are an important aspectof the Group’s external communications. The environmentalreports submitted by the divisions/subsidiaries to the relev-ant authorities convey a broad and in-depth picture of theenvironmental situation in each locality. The environ-mental reports can be ordered from the environmentaldepartments in each locality. Information regarding the en-vironment is also available on the Group’s and divisions’/subsidiaries’ websites.
Group representatives often participate in meetingswith different interest groups in order to discuss environ-mental issues. Such interest groups include governmentministries and public authorities, representatives of polit-ical parties, the EU Commission, environmental organisa-tions and environmental journalists. The customers haveincreasing demands for information regarding the environ-mental qualities of the Group’s products. Thus, environ-mental declarations are affixed to many of the Group’sproducts, which enables customers to evaluate the steelfrom an environmental perspective. The Group’s coreniche products contribute to environmental savings inboth the manufacture and use of the products in whichthese steels are included.
DevelopmentWithin the environmental area, the Group engages inextensive know-how development. This takes place to acertain extent through development work conducted withinthe Group. Where appropriate, representatives from thesteel operations participate in joint environmental research
projects together with other steel producers. This takesplace, among other things, within the scope of Nordicjoint research or within research projects financed by the EU. The Swera institutes, MEFOS and KIMAB, thePRISMA skills centre, and the industry organisations,Jernkontoret (the Swedish Steel Producers’ Association),Eurofer, and the International Iron and Steel Institute, are important bodies within the area of environmentalresearch. Expertise available at various institutes, univer-sities and colleges is utilised in more basic research.
An important project in which the Group is participat-ing is ULCOS - Ultra Low CO2 Steelmaking, the goal ofwhich is to develop new steel production technologyspecifically in order to reduce carbon dioxide emissions inconjunction with steel production. The project representsa cooperation between all European ore-based steel pro-ducers and is included as a part of International Iron andSteel’s global “CO2 Breakthrough Programme”.
The Group is also participating in the Stålkretsloppet(Steel Cycle) programme jointly financed by the steelindustry and Mistra (The Foundation for Strategic Envir-onmental Research), with the aim of improving the hus-banding of steel and alloys, and achieving reductions inemissions of carbon dioxide and the use of energy. Theprogramme includes projects that cover both the produc-tion of steel and the design of products and methods thatsimplify the recycling of steel. An important aspect of theprogramme is the development of tools that enable envir-onmental evaluations to be carried out at an early stage in the development of new processes and products.
Environmental events during 2006A granulation plant for hot metal is under construction at the plant in Oxlösund and a decision has been takenregarding a new secondary metallurgy equipment. Both of these are important for the environment since the newplants will result in reduced emissions of particulates andmetals into the air as well as metals into water.
The operations in Oxlösund have submitted an appli-cation to the County Administrative Board for a new permit in accordance with the Environmental Code. Apartial permit has been granted for a new organic coatingplant and intermediate storage for finished products.
In 2006, equipment for monitoring the percentage offine particulates (PM10) was installed in three residentialareas around SSAB’s plant in Luleå. A number of measureswere also taken in order to reduce noise from the industrialarea and several measures are to be carried out.
At the plant in Borlänge, “Low-NOX burners” have beeninstalled in the gas-fired slab furnace. The new burnersreplace approx. 50% of the power in the furnace and areaimed at reducing nitrogen oxide emissions into the air.
In order to reduce disturbances to neighbouring resid-ential areas, a continuous noise monitoring system hasbeen brought into use as regards the processing of scrapin Borlänge.

32 | SSAB ANNUAL REPORT 2006
The metallurgy capacity in Luleå is not sufficient to supplyall sheet manufacturing needs. The remaining slabsrequired are, therefore, purchased from the Plate Division.
Further processing through organic coating is alsocarried out in Finspång and through cutting to size atsubsidiaries in Italy, Denmark, Sweden, Great Britainand Holland.
During the year, the 25% stake in the electric steelscompany, Cogent Power, was sold to the majorityowner, Corus.
The marketSheet is the largest product group within the commercialsteels sector and accounts for approx. one half of theEuropean market for commercial steels. The pricestructure for sheet is relatively uniform on the largermarkets in Europe.
Demand for sheet in Europe was strong during most ofthe year. However, pending the first quarter it was neces-sary to accept price reductions of 3% in local currenciesas a consequence of the weak inflow of orders duringthe fourth quarter of 2005. During the remainder of theyear, it was subsequently possible to carry out gradualprice increases totalling approx. 10% in local currencies.
Deliveries for the year of extra and ultra high-strengthsheet increased to 699 (507) thousand tonnes, an increaseof 38%. The increase took place to both new as well asexisting customers on essentially all markets. The largestgrowth was within the heavy transport vehicles andpassenger car sectors.
Thanks to the strong market during the year, totaldeliveries increased to 2,474 (2,311) tonnes.
Sheet consumption in Sweden increased somewhatcompared with the previous year, primarily due toincreased demand within the automotive sector. Deliveriesto Swedish customers increased to 860 thousand tonnes.The market share is believed thereby to have increasedsomewhat.
Sheet DivisionGöran Carlsson, Head of Division
The Sheet Division is the largest manufacturer of steelsheet in the Nordic region and one of the leaders inEurope within the area of high-strength sheet. Productioncapacity currently amounts to almost 3 million tonnesper year.
The product range includes sheet in thicknessesranging from 0.1 mm to 16 mm with a maximum widthof 1,600 mm. The products are marketed under theDomex, Docol, Dogal, Dobel and Prelaq trade marks.
The Sheet Division’s strategy is based on growthwithin the area of extra and ultra high-strength sheetand on becoming the leading company in Europe in that area, while at the same time maintaining a leadingposition for the entire sheet range on the domesticmarket in Scandinavia.
Extra and ultra high-strength sheet can be exploitedto reduce weight in a design or to increase the strengthof a design without any change in weight. Hot-rolledextra and ultra high-strength sheet are used, among otherthings, in the automotive industry, primarily in heavyvehicles and for containers. Cold-rolled extra and ultrahigh-strength sheet are used primarily for safety com-ponents in the automotive industry. Galvanised extra andultra high-strength sheet are used in applications thatrequire a high level of anti-corrosion protection. Themain competitors within extra and ultra high-strengthsheet are Thyssen Krupp and Arcelor Mittal.
Ordinary sheet is used primarily within the engineering,construction, and automotive industries. Competitorswithin these sectors consist of most Western Europeansteel companies.
The heavy production takes place in two localities.An ore-based metallurgy comprising coking plant, blastfurnace, and steel mill for the production of slabs islocated in Luleå, while rolling mills as well as coatingand after-treatment lines are situated in Borlänge.
1)2)
REPORT OF THE D IRECTORS
SEK millions 2006 2005 2004
Sales 15,316 14,219 12,693
Profit after financial items 2,785 3,128 2,502
Cash flow 1) 2,105 1,571 1,465
Capital expenditures 586 464 341
Capital employed at year-end 8,549 8,283 7,968
Return on capital employed (%) 2) 34 40 37
Average number of employees 4,331 4,411 4,507For 2006, includes the purchase price received for Cogent in the amount of SEK 248 million.Refers to return on average capital employed.

SSAB ANNUAL REPORT 2006 | 33
Extra and ultra high-strength sheet are used in applications in which high-strength is sought in combination with low weight. The high-strength steels areused, among other things, within the automotive industry, for heavy vehicles, by crane manufacturers and for load-bearing parts in containers. The productrange includes both hot and cold rolled sheet as well as metal-coated and organic-coated sheet. Almost 30% of the sheet is extra and ultra high-strength.
The Spanish company, Reycoma, is developing a new cement mixer built of Domex 700 MC, an ultra high-strength sheet; SSAB’s area manager, SergioMoyano Ludeña, together with Reycoma’s President, Matias Pedraza Aguilar,notes that this has substantially reduced the weight while at the same timeabrasion resistance has increased.
Capital expendituresDuring the year, a decision was taken on a new coiler at the rolling mill for SEK 265 million. The new coilerwill provide improved possibilities for development andproduction of extra and ultra high-strength steel. Duringthe year, a decision was also taken regarding an SEK 82 million investment in inventory automation at theorganic coating lines in Borlänge.
Continued fine-tuning of the new cutter lines for theformatting of high-strength sheet will, during 2007, alsoallow for increased volumes of formatted extra andultra high-strength sheet.
The upgrading of the tandem mill which was carriedout during three holiday breaks was completed duringthe summer.
Product and process developmentThe focus on the core niche products, extra and ultrahigh-strength steel, has increased the demand for efficientproduct and process development. This requires acoherent chain from metallurgy to the testing of newmaterials at customers. In order to bring the strategy to fruition, long-term coordination and close coopera-tion have commenced to direct product and processdevelopment, as well as the investments necessary forthe production of new products.
A number of investments have been carried out in the production chain in order to improve the qualitiesand characteristics of the products. Among other things,a new alloy system and a new laboratory have been builtin metallurgy so that slabs can be manufactured forcontinued development of extra and ultra high-strengthsheet. In addition, a new control system has been installedin the tandem mill which renders possible narrowerthickness tolerances for cold-rolled extra and ultra high-strength sheet.
As regards hot-rolled steel, the product and processdevelopment work is focused on producing ultra high-
The manufacturing process is described at www.ssab.se
Exports accounted for a reduced share of sales 65 (66)%.The shares of the deliveries to the largest markets areshown in the table below:
ProductionA shortage of slabs resulting from the explosion at AGA’soxygen plant in Oxelösund led to a slow down in pro-duction at the rolling mill during the fourth quarter. In total, however, production at the rolling mill increasedto 2,660 (2,440) thousand tonnes. Slab production fellsomewhat to 2,019 (2,058) thousand tonnes.
ProfitProfit after financial items declined by SEK 343 millionto SEK 2,785 (3,128) million.
Increased volumes of extra and ultra high-strengthsheet were unable to compensate in full for increasedraw materials costs.
Production, kt 2006 2005 Change in %Coke 741 741 0Slabs 2,019 2,058 – 2Sheet 2,660 2,440 +9
Share of deliveries (%) 2006 2005 2004Sweden 35 34 35Italy 11 11 12Germany 9 9 11Denmark 7 6 7Great Britain 5 4 6Norway 4 4 4Finland 4 4 4France 3 3 5Spain 3 3 3Netherlands 3 3 3USA 3 5 2China 3 2 1Others 10 12 7Total 100 100 100

34 | SSAB ANNUAL REPORT 2006
strength steel for use within the heavy transport, lifting,and load handling sectors. Domex 900 and a modifiedDomex 700 W are in the process of being introduced onthe market and development is focused on even higherstrengths as early as 2007.
As regards the cold-rolled products, development isfocused on improving the material characteristics of thecore niche products in the existing product range. Inaddition, development is taking place of new productsadapted for special areas of use, e.g. roll forming andadaptation to car industry norms as well as extreme high-strength products, e.g. DOCOL 1500 M.
As a result the development of extra high-strengthhot dip galvanised steel, the product Dogal 1000 DPXwhich was introduced in 2005 is now commercially avail-able. Continuous work is also taking place on adaptingthe extra and ultra high-strength steels to special areasof use such as roll forming and to various standards.During the year, DP steels were supplemented withDogal 500 DP, which is adapted to the new Europeanmaterials standard.
The development of new Prelaq products focuses on thepossibilities for using more high-strength base materialand to develop more abrasion-resistant coatings. Devel-opment is also taking place of dirt-repellent and thermalsurface coatings, so-called functional coatings.
Through participation in the national and Europeanresearch cooperation, possibilities are provided for co-financing of research and development. In 2006, theState, through VINNOVA, assigned the Swedish SteelProducers’ Association the task of carrying out a researchprogramme, the Steel Research Programme, during theperiod 2007–2012. The programme covers four mainareas which include the development of new materialsand production methods as well as environmental aspects.
Within the Triple Steelix regional project, a cooperationis taking place which is financed by VINNOVA togetherwith the EU and the participating parties from the busi-ness community, society and research in order to createa profitable and long-term development in Bergslagen.In this cooperation, a demonstration facility for 3-D rollforming will be brought into operation at the ProcessingCentre at Dalarna University. High-strength steel isparticularly suitable for roll forming since no othercharacteristics of the steel are thereupon changed.
A seminar series entitled Open Your Mind was heldwith over 1,200 participants from throughout the world.The aim of the seminars has been to disseminate infor-mation and knowledge regarding our cold and metal-coated extra and ultra high-strength steels and their areasof application. The seminars will continue in 2007, whenseminars aimed at trailer manufacturers will also be held.
Through the focusing on core niche products, newmarkets are opened up, which entails an increased needfor technical support. Advanced know-how and resourcesmust be communicated throughout the world. Thistechnical business development takes place throughSSAB Tunnplåt’s Knowledge Service Center, which is theplatform for support, service and skills support.
The Swedish Steel Prize was awarded for the eighthyear. The prize, which is awarded to a party which hasutilised high-strength sheet in an innovative manner, wasawarded to the two Italian companies, Fiat and WagonAutomotive, which designed and developed an advancedsafety component for the front doors for the new FiatGrande Punto. Wagon Automotive is specialists in rollforming and the design is light, thin and strong while atthe same time being space-efficient. The “Swedish SteelPrize Inspiration Seminars 2006” were held in connectionwith the awarding of the prize. The seminars covered,among other things, leadership, entrepreneurship andpersonal motivating factors.
Sheet Division
REPORT OF THE D IRECTORS

SSAB ANNUAL REPORT 2006 | 35
The marketDuring the past decade, market and distribution capacityhave been gradually expanded through, among otherthings, the establishment of almost 30 sales companiesaround the world. During the year, companies wereestablished in Taiwan and China.
Investments in infrastructure have remained at a high level during the year and, as a consequence, demandfor quenched steels was strong throughout the year andit was possible to gradually increase prices. Deliveriescontinued to be restricted by available production capacity.However, through various measures it was possible toincrease capacity gradually and thus deliveries for thefull year increased by 8% to 510 (471) thousand tonnes.The increase has primarily taken place to existing cus-tomers in Europe.
As a consequence of the gradual transition to quenchedsteels, deliveries of ordinary plate fell by 20%. Pricesfor ordinary plate increased at the beginning of the yearbut levelled off during the fourth quarter. The entirevolume was sold in northern Europe.
Exports accounted for 90% of sales. The largestmarkets are shown in the following table:
SEK millions 2006 2005 2004
Sales 9,941 9,135 6,947
Profit after financial items 2,193 1,957 702
Cash flow 1,079 595 309
Capital expenditures 729 303 234
Capital employed at year-end 6,179 5,487 4,784
Return on capital employed (%) 1) 40 39 17
Average number of employees 2,818 2,785 2,696
Refers to return on average capital employed.
Plate DivisionOla Hägglund, Pro tem. Site Manager.
The Plate Division is the world’s leading manufacturerof quenched steels, i.e. plate with extra high strengthand good weldability in combination with high abrasion-resistance and good formability. These qualities providethe users with the possibility to design and manufacturelight, strong products with good total economy. The mainproducts within quenched steels are abrasion-resistantsteels, HARDOX, and construction steels, WELDOX.
The HARDOX products are used in applications in which there are stringent requirements as regardshardness, high strength, and toughness, in combinationwith good welding and bending characteristics. Importantareas of use include construction machinery and miningequipment.
The most prominent characteristics of the WELDOXproducts are good weldability and formability in com-bination with high strength, as well as flatness and finesurfaces. Construction steel is used, among other things,in the manufacture of cranes, bridges, and offshoreequipment.
Competitors within the quenched steels sector areprimarily Thyssen Krupp and Dillingen in Europe, aswell as Arcelor Mittal and Algoma in North America.
Ordinary plate is used in the general engineeringindustry, shipbuilding industry and the wind powerindustry. The majority of large Western European plateproducers are competitors within the ordinary platesector. As a consequence of the major expansion inquenched steels, a decision has been taken to graduallyphase out ordinary plate.
Manufacturing in Oxelösund is carried out in an in-tegrated process from iron ore to finished plate in thick-nesses of 3 to 155 mm and widths of up to 3,500 mm.Thanks to the production equipment, it is possible todeliver plate with characteristics that are tailor-made forthe needs of different customers.
Share of deliveries (%) 2006 2005 2004
Germany 20 20 19
Sweden 10 10 13
Denmark 6 10 10
Italy 6 5 5
Great Britain 4 4 4
Finland 3 3 3
Other EU countries 20 18 19
USA 8 7 7
Canada 4 4 3
South Africa 3 3 3
Asia 9 6 7
Others 7 10 7
Total 100 100 100
1)

steel mill capacity in order to make continuous operationof the blast furnaces possible and to increase capacity inthe steel mill for production of slabs for quenched steels.In addition, a line for the quenching of thick plate isunder construction. This will continue until the springof 2008 and allow for a gradual increase in volumes ofquenched steels by a total of 35% compared with 2006.
In China, the construction has begun of a distributioncentre with cutting capacity.
DevelopmentProduct development resources are concentrated onquenched steels. The use of quenched steels provides anumber of advantages for users, e.g. the possibility tobuild lighter and stronger designs or to extend the lifespanof produced components that are subject to wear andtear. Together with lower production costs and downtime costs, increased payload and lower fuel costs formobile applications, quenched steels provide benefitsboth for the customers and their customers.
In order to meet increasing demand for lightweightsteel structures, development and investments are takingplace in improved methods in conjunction with steelproduction and with rolling, quenching and annealing.The focus on thin and wide plate is continuing.
Investments within ladle metallurgy provide possibilitiesto increase the volumes of the most advanced steel grades,and also provide the possibility to manufacture an evenpurer steel. The qualities of existing products can therebybe improved and new products can be developed.
The development of quenched steels takes place inclose cooperation with the customers. New, improvedsteels are often tested in especially demanding applicationsat selected customers. The development work involvesapplications engineers and experts within both develop-ment and production.
ProductionA gradually thinner mix together with a number of minordisruptions resulted in a 7% fall in plate production to586 (632) thousand tonnes.
Production of slabs decreased by 12% to 1,394 (1,584)thousand tonnes. The decrease was in part attributableto the relining of a blast furnace in the summer and inpart to an explosion at AGA’s oxygen plant in the autumn.As a consequence of the oxygen plant explosion, justover 50 thousand tonnes of slabs were purchased on theexternal market.
Just over 40% of produced slab volume was deliveredto the Sheet Division while just over 40 thousand tonneswas sold to other steel companies. The remaining slabvolumes were processed into plate.
ProfitProfit after financial items increased by SEK 236 millionto SEK 2,193 (1,957) million.
As a consequence of increased volumes of quenchedsteels and price increases, it was possible to increaseprofits notwithstanding lower total volumes.
Capital expendituresFor several years, investments have been carried out tofacilitate continued growth within quenched steels. Inaddition to investments in quenching lines, resources havealso been invested within marketing and distribution.
During the year, investments were commenced of just over SEK 1,000 million to increase production ofquenched steels. The investments relate to increased
Tonnes 2006 2005 Change in %
Coke 441 447 – 1
Slabs 1,394 1,584 – 12
Plate 586 632 – 7
36 | SSAB ANNUAL REPORT 2006
Plate Division
REPORT OF THE D IRECTORS

SSAB ANNUAL REPORT 2006 | 37
Maria Hövling, R&D Oxelösund discusses with marketing managerThomas Algren Lyckvall the field measurements that she and TorbjörnNarström, Conceptual Design Group, have carried out on wheel loaderbuckets at Ljungby Maskin AB.
Quenched steels, i.e. the abrasion-resistant HARDOX steels and WELDOXconstruction steels, are used in applications in which extreme high-strength is required in combination with good weldability or high abrasionresistance. The quenched steels are sold throughout the world and used,among other things, in construction machinery, mining equipment andmobile cranes. Quenched steels account for just over 80% of deliveries.
In order to further increase knowledge about the cost-effective solutions that can be attained, The ConceptualDesign and the Wear Technology groups assist customerswith, for example, design and lifespan calculations.
The HARDOX abrasion-resistant steels are beingregularly upgraded and the product range expanded withnew, improved products. In recent years, several newproducts have been introduced that are especially intendedfor a given area of application, e.g. HARDOX 550 forapplications within the recycling and mining industriesand HARDOX HiTuf for thick buckets and demolitiontools. The most abrasion-resistant variant thus far in theproduct range, HARDOX Extreme, with a hardness ofup to 700 Brinell, is currently undergoing evaluation atsome twenty customers around the world.
The WELDOX construction steels are also being con-stantly developed. WELDOX 1300 is the world’s mosthigh-strength construction steel and renders possible theconstruction of extremely advanced designs. Similarlyto WELDOX 1100, the product will be used for mobileand truck cranes.
The pre-hardened tool steels, TOOLOX, has beendeveloped in two hardness variants, TOOLOX 44 andTOOLOX 33. As distinct from conventional tool steels,TOOLOX requires no further heat treatment after atool has been produced and the customer thereby savesboth time and money.
The manufacturing process is described at www.ssab.se

38 | SSAB ANNUAL REPORT 2006
SEK millions 2006 2005 2004
Sales 1,482 1,377 1,218
Profit after financial items 110 76 68
Cash flow 150 95 – 34
Capital expenditures 41 25 23
Capital employed at year-end 362 345 385
Return on capital employed (%) 1) 30 20 21
Number of employees 517 469 460
Refers to return on average capital employed.
PlannjaThomas Björk, President
manufacture of wall sections is concentrated in Luleå,while rainwater run-off products are manufactured by the subsidiary, Plannja Siba, in Järnforsen.
Most of the operations are based on the use of metal-coated sheet. However, a small part of the production is based on aluminium. Plannja’s annual consumptionof sheet amounts to approx. 93 thousand tonnes. Mostof the material is supplied by the Sheet Division.
Plannja has a market share of just over 30% of thecontractor and consumer markets in Sweden. Competitorsinclude Lindab and Ruukki.
The marketAfter an unusually late sales start, seasonal demandincreased markedly during the second quarter and con-tinued to strengthen during the second half of the year,resulting in an increase in the Group’s delivery volumes.
The 9% increase in volume was due primarily tostronger demand from sheet metal work and projectcustomers on the domestic market, and also due tostronger markets in Norway and Poland.
In total, sales during the year increased by 8% to SEK 1,482 (1.377) million. The sales increase is explainedby increased volumes.
The Swedish market accounted for an increased shareof sales, viz. 48 (47)%. The largest markets are shownin the following table.
Processing is of great strategic importance for the Group’spossibility to maintain its strong domestic market positionwithin the sheet sector.
Through many years of investment in product andmarket development and through strategic corporateacquisitions, Plannja has become one of the leadingEuropean producers of building sheet, with a geographicalfocus on the Nordic and Baltic regions, as well as Centraland Eastern Europe.
Based on the vision “Plannja shall be the buildingmarket’s first choice as co-operation partner for sheetproducts and systems within our business concept”, astrategy has been developed which is focused on profitablegrowth. This strategy emphasises, among other things,new markets, improved logistics and shorter lead timesas important constituent elements.
The product range consists of a comprehensive range of flat and profiled building sheet, sheet roofingtiles, rainwater run-off goods, and sandwich-type wallpanels. The products are used as load-bearing structuresand as roofing and wall cladding for both residentialand industrial premises. Plannja’s marketing and salesare aimed at the contractor, sheet metal work, and consumer markets.
Most organic-coating of sheet is carried out at theCompany’s own organic-coating line in Luleå. Theprofiling of building sheet takes place in Luleå and atsubsidiaries in Denmark, Finland, and Poland. The
1)
Share of sales (%) 2006 2005 2004
Sweden 48 47 44
Other Nordic countries 37 38 36
EU excl. Nordic countries 12 11 16
Others 3 4 4
Total 100 100 100
REPORT OF THE D IRECTORS

SSAB ANNUAL REPORT 2006 | 39
Skanska’s project planning manager, Camilla Sahlén, agrees with Plannja’ssales engineer, Martin Eriksson, on the advantages of prefabricated wallsections.
Building sections in metal-coated, organic-coated and profiled sheet areused both as load-bearing structures as well as roofing and wall sectionsfor residential and industrial premises, offices, schools, etc. The PlannjaPanel wall sections, the Plannja Combideck floor structure system andPlannja Siba’s rainwater run-off goods are examples of Plannja’s focus oncomplete and well planned systems solutions for both small and majorbuilding projects.
ProfitProfit after financial items increased by SEK 34 millionand amounted to SEK 110 (76) million. The increase inprofit was due primarily to increased volumes.
Capital expendituresDuring the year, a decision was taken to expandproduction capacity for rainwater run-off products inJärnforsen and expansion of the production facility isnow underway.
Construction of Plannja’s new production plant inWarsaw commenced in the autumn and entry into occu-pancy is expected to take place in the spring of 2007.
A decision was taken during the year on an investmentin new supplementary profiling equipment as well astrucks and stands for the new plant in Poland.
During the year, Plannja sold its office building inLuleå and moved into new offices directly adjacent tothe operations area.
DevelopmentA new Plannja roofing tile, intended for the Polishmarket, was launched and production started up asplanned at the existing plant in Warsaw.
During the year, Plannja commenced the introductionof a new production model, WCOM (World ClassOperations Management) aimed at increasing the avail-ability of machinery and thereby increasing productivityand short lead times to customers.

40 | SSAB ANNUAL REPORT 2006
SEK millions 2006 2005 2004
Sales 9,202 7,423 6,641
Profit after financial items 783 428 484
Cash flow 409 426 74
Capital expenditures 44 54 40
Capital employed at year-end 1,601 1,471 1,635
Return on capital employed (%) 1) 50 27 36
Average number of employees 949 1,035 1,080
Refers to return on average capital employed.
TibnorMikael Nyquist, President
Tibnor’s traditional core business lies within the areasof steel and stainless steel in which a complete range ofcommercial steels – sheet, plate, special steels, pipes andstainless steel – is supplied to industry. In addition, thebusiness operations include the sale of non-ferrous metalsand building-related steel products. Tibnor’s foreignsubsidiaries supply customers in the respective countrieswith a selection of steel and non-ferrous metal productsbased on market conditions.
As a consequence of customer demand for tailor-madelogistics solutions, steel and non-ferrous metal productsare nowadays being delivered pre-treated for immediateuse in the customer’s production. Resources for materialpre-treatment, such as slitting and cutting to size of sheet,are provided in cooperation with the Sheet Division’ssubsidiary, Dickson PSC. Tibnor also has its own pro-duction centres for pre-treatment of other materials inthe form of cutting in lengths, blasting, organic coating,figure cutting, etc. In addition, Tibnor is able to supplyproduction resources through a large network of partnersin various areas of expertise.
Within the non-ferrous metals area, specialisation hastaken place towards trading in non-ferrous metals forindustrial use. Within the non-ferrous metals area, Tibnoris one of the major distributors of semi-finished goodsand raw materials of aluminium, copper, brass and zinc,not only in Sweden but also in Finland and Denmark.
Tibnor is one of Sweden’s leading suppliers of rein-forcement products, with major construction companiesin the country constituting its most important customergroup. Through two plants for the manufacture ofinsertion-ready rebar products, the Company is alsoable to provide tailor-made reinforcement solutions, in addition to standard materials. Tibnor is also one of Sweden’s leading suppliers of sheet piling, which isused in the laying of foundations.
Tibnor is the leading company within Swedish steeldistribution and constitutes an important sales channelfor SSAB’s steel operations, primarily on the Swedishmarket. Tibnor is owned by SSAB (85%) and OutokompuStainless (15%).
The supply of steel to the Swedish market takes placethrough steel trading companies or directly from Swedishand foreign steel mills. Other companies include variousSteel Service Centres and companies specialising withina limited product sector.
Tibnor enjoys a leading position within steel and metaltrading in the Nordic region, with its own subsidiariesin the Nordic countries and in Poland and Latvia. Themost important customer sectors are companies withinthe engineering, processing, and building industries. Asignificant portion of Tibnor’s customers within the engin-eering industry are suppliers to Swedish export industry.
The largest competitors among distribution companiesin Sweden are BE-Group and Ruukki, as well as a numberof companies with a narrow product focus, which areeither independent or owned by foreign manufacturers.
Within the scope of Tibnor’s business concept, theCompany endeavours, through strong and cost-efficientsales, warehouse and distribution functions, to be animportant partner in the supply of various types of steeland metal products to industry. This is achieved byoffering a wide range of products combined with a widerange of services, with the objective that Tibnor shall beused as a first stage in the customer’s own production.
1)
REPORT OF THE D IRECTORS

SSAB ANNUAL REPORT 2006 | 41
Finnveden, which manufactures sheet components for the automotiveindustry, uses Tibnor as supplier of, among other things, production-adapted Docol 1400, which is used for tow rings. Tibnor’s Leif Mårtenssonand Finnveden’s purchasing manager, Arne Klein, seen here in conversationwith production technician, Lukasz Anderson.
With the widest range of commercial steels, special steels, pipes andstainless steels on the market and with nationwide logistics functions,Tibnor has become a natural part of the customers’ production flows.The steel is delivered, blasted, primed, cut into lengths, sheared or splitfor immediate use in the customer’s production process. The productrange is completed with non-ferrous metals and building-related products.
The market Tibnor’s sales during the year amounted to SEK 9,202(7,423) million, up 24% from the preceding year.Increased volumes accounted for 11 percentage pointsand higher prices for 13 percentage points.
Sales were strong on all markets and within mostcustomer segments. The increase in volume covered allproducts. Non-ferrous metals developed very positivelywith increased sales figures due primarily to a significantincrease in market prices.
ProfitProfit after financial items increased by SEK 355 millionto SEK 783 (428) million. Increased volumes and thevery substantial price increase accounted for most of the increase in profit. During the year, two propertycompanies have been sold, generating a capital gain of SEK 87 million.
SEK millions 2006 2005 Change in %
Steel 1,690 1,465 + 15
Sheet and plate 3,156 2,841 + 11
Special steels 1,129 1,011 + 12
Stainless steel 907 636 + 43
Metals 1,877 1,038 + 81
Construction 409 385 + 6
Other 34 47 – 28
Total 9,202 7,423 + 24

42 | SSAB ANNUAL REPORT 2006
Other companies
Norsk StålNorsk Stål is owned by SSAB (50%) and Corus (50%)and is Norway’s largest steel wholesaler with a marketshare of approx. 45%. There were 289 (265) employees.
Demand for steel in Norway increased within bothshipbuilding and offshore drilling and sales increased toSEK 2,938 (2,413) million. As a consequence of highervolumes and higher margins, profit after financial itemswas SEK 247 (145) million.
Norsk Stål TynnplaterNorsk Stål Tynnplater is owned by SSAB (50%) andCorus (50%) and is Norway’s largest steel service centrewith a market share of just over 60%. There were 55(58) employees.
Demand for processed sheet increased both in Norwayand Sweden. Thanks to higher volumes and highermargins, sales increased to SEK 712 (640) million. Profitafter financial items increased to SEK 43 (30) million.
LulekraftLulekraft operates a combined heat and power plant inLuleå and is owned by SSAB (50%) and the municipalityof Luleå (50%). The combined heat and power plantutilises energy-rich gases from the Sheet Division’s steelproduction and produced 769 GWh of district heat and612 GWh of electricity. The district heat is sold to LuleåEnergi, which distributes it to approx. 20,000 householdsin the municipality of Luleå. The electricity is sold tothe Sheet Division. There were 33 (33) employees.
Sales increased to SEK 357 (312) million. Profit afterfinancial items amounted to SEK 0 (0) million.
Oxelösunds HamnThe port operations in Oxelösund are among the largestin Sweden. The port has excellent draught conditionsand plays an important role in the Group’s extensiveimports of raw materials and exports of sheet and plate.
Oxelösunds Hamn is owned by SSAB (50%) and themunicipality of Oxelösund (50%). There were 215(213) employees.
Sales increased somewhat to SEK 218 (210) million.Profit after financial items increased to SEK 23 (18)million.
SEK millions 2006 2005 2004
Norsk Stål 247 145 142
Norsk Stål Tynnplater 43 30 38
Lulekraft 0 0 0
Oxelösunds Hamn 23 18 12
REPORT OF THE D IRECTORS
More than one million tonnes of the Group’s sheet and platedeliveries take place annually via the port in Oxelösund.
Profit after financial items per company

SSAB ANNUAL REPORT 2006 | 43
SEK millions 2006 2005
Sales (Note 1) 31,054 27,804
Cost of goods sold (Note 2) – 23,591 – 20,642
Gross profit 7,463 7,162
Selling expenses (Note 2) – 1,600 – 1,489
Administrative expenses (Note 2) – 237 – 199
Other operating revenue (Note 1) 379 351
Other operating expenses (Note 2) – 190 – 185
Shares in earnings of affiliated companies before tax (Note 3) 239 95
Operating profit 6,054 5,735
Financial revenue (Note 4) 96 77
Financial expenses (Note 4) – 98 – 141
Profit after financial items 6,052 5,671
Tax (Note 5) –1,711 – 1,603
Net profit for the year 4,341 4,068
Of which attributable to:
– the Parent Company’s shareholders 4,253 4,021
– minority interests 88 47
Earnings per share, SEK (Notes 12, 28) *) 16.02 14.07
Dividend per share – 2006 proposal 4.50 3.00
*) There are no outstanding share instruments and, consequently, there is no dilution.
Consolidated Profit and Loss AccountF INANC IAL REPOR TS

SEK millions 2006 2005
ASSETSFixed assetsIntangible assets (Note 6) 10 12
Tangible assets (Note 7) 7,962 7,651
Participations in affiliated companies (Notes 3, 8) 283 381
Financial assets (Note 8) 15 41
Deferred tax claims (Note 14) 70 83
Total fixed assets 8,340 8,168
Current assets Inventories (Note 9) 6,951 6,788
Accounts receivable (Note 3) 4,926 4,327
Prepaid expenses and accrued revenue (Note 10) 260 218
Current tax claims 37 24
Other current interest-bearing receivables (Note 11) 495 946
Other current receivables 413 465
Liquid assets (Note 11) 1,373 884
Total current assets 14,455 13,652
Total assets 22,795 21,820
EQUITY AND LIABILITIES EquityShare capital 2,280 2,273
Other contributed funds 553 560
Translation reserve – 49 30
Retained earnings 12,551 11,321
Total equity for shareholders in the Company 15,335 14,184
Minority shares incl. minority’s share of earnings 216 180
Total equity 15,551 14,364
Long-term liabilitiesLong-term interest-bearing liabilities (Note 16) 850 1,139
Pensions provisions (Note 13) 131 136
Deferred tax liabilities (Note 14) 1,302 1,361
Other long-term provisions (Note 15) 23 71
Total long-term liabilities 2,306 2,707
Current liabilities Current interest-bearing liabilities (Note 16) 306 616
Accounts payable (Note 3) 2,362 2,023
Accrued expenses and deferred revenue (Note 17) 1,432 1,377
Current tax liabilities 448 403
Other current liabilities 350 330
Current provisions (Note 15) 40 –
Total current liabilities 4,938 4,749
Total equity and liabilities 22,795 21,820
Pledged assets (Note 21) 59 61
Contingent liabilities (Note 22) 88 78
44 | SSAB ANNUAL REPORT 2006
Consolidated Balance SheetF INANC IAL REPOR TS

SSAB ANNUAL REPORT 2006 | 45
The Group’s changes in Equity
OtherContri- Trans-
Share buted lation Retained Minority Total SEK millions capital funds reserve earnings Total interest equity
Equity, January 1, 2005 2,522 560 – 27 9,901 12,956 186 13,142
Translation difference (Note 12) – – 51 – 51 1 52
Change in affiliated companies’ equity – – 6 – 6 – 6
Profit for the year – – – 4,021 4,021 47 4,068
Total changes, excluding trans-actions with the Company’s owners – – 57 4,021 4,078 48 4,126
Redemption (Note 12) – 249 – – – 1,844 – 2,093 – –2,093
Dividend (Note 12) – – – – 757 – 757 – 54 – 811
Equity, December 31, 2005 2,273 560 30 11,321 14,184 180 14,364
Equity, January 1, 2006 2,273 560 30 11,321 14,184 180 14,364
Translation difference (Note 12) – – – 79 – – 79 – 1 – 80
Change in affiliated companies’equity – – – – – – –
Profit for the year – – – 4,253 4,253 88 4,341
Total changes, excluding trans-actions with the Company’s owners – – – 79 4,253 4,174 87 4,261
Redemption (Note 12) – 114 – – – 2,091 – 2,205 – – 2,205
Bonus Issue (Note 12) 121 – 7 – – 114 – – –
Dividend (Note 12) – – – – 818 – 818 – 51 – 869
Equity, December 31, 2006 2,280 553 – 49 12,551 15,335 216 15,551
F INANC IAL REPOR TS

SEK millions 2006 2005
BUSINESS OPERATIONS Profit from operating activitiesProfit after financial items (Note 23) + 6,052 + 5,671
Reversal of non-cash items
Non-distributed share in affiliated company's earnings – 185 – 45
Depreciation and write-downs + 963 + 951
Profit upon sale of fixed assets 0 + 6
Profit upon sale of subsidiaries and affiliated companies – 162 –
Other reversals + 54 + 1
Tax paid – 1,622 – 2,478
+ 5,100 + 4,106
Working capital Inventories (+decrease) – 164 – 1,123
Accounts receivable (+decrease) – 601 – 352
Accounts payable (+increase) + 341 + 156
Other current receivables (+decrease) + 60 – 20
Other current liabilities (+increase) + 99 + 58
– 265 – 1,281
Cash flow from operating activities + 4,835 + 2,825
INVESTING ACTIVITIES Investments in plants – 1,407 – 853
Sale of plants + 21 + 14
Sale of companies (Note 24) + 102 –
Other long-term receivables (+decrease) + 27 + 61
Divested operations (Note 24) + 248 + 1,425
Cash flow from investing activities – 1,009 + 647
FINANCING ACTIVITIES Redemption of shares – 2,205 – 2,093
Dividend to shareholders – 818 – 757
New loans – –
Repayment/amortisation of loans – 600 – 501
New financial investments – 495 – 895
Repayment, financial investments + 895 –
Other financing (+increase) (Note 23) – 114 + 82
Cash flow from financing activities – 3,337 – 4,164
CHANGE IN LIQUID ASSETS + 489 – 692
LIQUID ASSETSBalance on January 1 + 884 + 1,576
Change in liquid assets + 489 – 692
Balance on December 31 + 1,373 + 884
Contracted, non utilised overdraft facilities + 1,852 + 1,876
Disposable liquid assets + 3,225 + 2,760
46 | SSAB ANNUAL REPORT 2006
Consolidated Cash Flow Statement F INANC IAL REPOR TS

SSAB ANNUAL REPORT 2006 | 47
SEK millions 2006 2005
Gross profit 0 0
Administrative expenses (Note 2) – 111 – 82
Other operating revenue (Note 1) 2 8
Operating profit – 109 – 74
Dividends from subsidiaries (Note 4) 6,665 2,621
Financial items (Note 4) 153 69
Profit after financial items 6,709 2,616
Tax allocation reserve – 30
Profit before tax 6,709 2,646
Tax (Note 5) 3 7
Net profit for the year 6,712 2,653
Parent Company’s Profit and Loss AccountF INANC IAL REPOR TS

48 | SSAB ANNUAL REPORT 2006
Parent Company’s Balance Sheet
SEK millions 2006 2005
ASSETSFixed assets Tangible assets (Note 7) 1 1
Financial assets (Note 8) 2,307 2,307
Deferred tax claims (Note 14) 1 1
Total fixed assets 2,309 2,309
Current assets Receivables from subsidiaries 8,854 5,703
Prepaid expenses and accrued revenue (Note 10) 5 12
Current tax claims – –
Other current interest-bearing receivables (Note 11) 495 927
Other current receivables 176 193
Liquid assets (Note 11) 974 641
Total current assets 10,504 7,476
Total assets 12,813 9,785
EQUITY AND LIABILITIES EquityRestricted equity:
Share capital 2,280 2,273
Statutory reserve 902 909
Unrestricted equity:
Profit brought forward 458 822
Net profit for the year 6,712 2,653
Total equity 10,352 6,657
Provisions Provisions for pensions 6 5
Total provisions 6 5
Long-term liabilities Liabilities to subsidiaries 1 1
Other long-term interest-bearing liabilities (Note 16) 800 1,050
Total long-term liabilities 801 1,051
Current liabilities Accounts payable 4 12
Liabilities to subsidiaries 1,216 1,170
Current interest-bearing liabilities (Note 16) 275 581
Accrued expenses and deferred revenue (Note 17) 32 83
Current tax liabilities 1 142
Other current liabilities 126 84
Total current liabilities 1,654 2,072
Total equity and liabilities 12,813 9,785
Pledged assets (Note 21) 0 0
Contingent liabilities (Note 22) 163 178
F INANC IAL REPOR TS

SSAB ANNUAL REPORT 2006 | 49
The Parent Company’s Changes in Equity
Restricted Equity Unrestricted Equity
Share Premium Statutory Profit Carried Profit forSEK millions Capital Reserve Reserve Forward the Year
Equity, December 31, 2003 2,522 20 640 1,245 2,045
Retained earnings from previous year – – – 2,045 – 2,045
Group contributions received – – – 530 –
Tax on Group contributions – – – – 148 –
Reclassification of premium reserve – – 20 20 – –
Redemption (Note 12) – 249 – 249 – 2,093 –
Dividend (Note 12) – – – – 757 –
Profit for year – – – – 2,653
Equity, December 31, 2005 2,273 – 909 822 2,653
Equity, January 1, 2006 2,273 – 909 822 2,653
Retained earnings from previous year – – – 2,653 – 2,653
Group contributions received – – – 10 –
Tax on Group contributions – – – – 3 –
Bonus issue 121 – – 7 – 114 –
Redemption (Note 12) – 114 – – – 2,091 –
Dividend (Note 12) – – – – 818 –
Profit for the year – – – – 6,712
Equity, December 31, 2006 2,280 – 902 458 6,712
F INANC IAL REPOR TS

50 | SSAB ANNUAL REPORT 2006
Parent Company’s Cash Flow Statement
SEK millions 2006 2005
BUSINESS OPERATIONS Profit from operating activitiesProfit after financial items (excl. dividends from subsidiaries) (Note 23) + 44 – 5
Reversal of non-cash items
Depreciation + 0 + 0
Other reversals + 1 – 5
Paid tax – 142 – 31
– 97 – 41
Working capital (Note 23)
Current receivables (+ decrease) + 56 – 51
Current liabilities (+ increase) – 17 – 7
Commercial intra-Group transactions – 55 + 102
– 16 + 44
Cash flow from operating activities – 113 + 3
INVESTING ACTIVITIES Investments in plants – 1 0
Sold plants 0 + 6
Sale of subsidiaries – + 1,425
Other long-term receivables (+ decrease) 0 + 55
Cash flow from investing activities – 1 + 1,486
FINANCING ACTIVITIES Dividend to shareholders – 818 – 757
Redemption – 2,205 – 2,093
Dividends from subsidiaries + 3,195 + 2,621
Repayment/amortisation of loans – 555 – 381
Financial intra-Group transactions + 430 – 782
New financial investments – 495 – 895
Repaid financial investments + 895 –
Other financing (+ increase) 0 + 1
Cash flow from financing activities + 447 – 2,286
CHANGES IN LIQUID ASSETS + 333 – 797
LIQUID ASSETS Balance on January 1 + 641 + 1,438
Changes in liquid assets + 333 – 797
Balance on December 31 + 974 + 641
Contracted, non-utilised overdraft facilities + 1,852 + 1,876
Disposable liquid assets + 2,826 + 2,517
F INANC IAL REPOR TS

SSAB ANNUAL REPORT 2006 | 51
Notes
Table of contents, Notes
51 Accounting and valuation principles
59 Note 1 Sales and other operating revenue
59 Note 2 Operating expenses(including compensation to employees)
62 Note 3 Affiliated companies
63 Note 4 Financial items
64 Note 5 Taxes
64 Note 6 Intangible assets
65 Note 7 Tangible assets
67 Note 8 Financial assets and participations in affiliated companies
68 Note 9 Inventories
68 Note 10 Pre-paid expenses and accrued revenue
69 Note 11 Other current interest-bearingreceivables/Liquid assets
69 Note 12 Equity
70 Note 13 Pensions provisions
71 Note 14 Deferred tax liabilities and tax claims
72 Note 15 Other provisions
72 Note 16 Interest-bearing liabilities
73 Note 17 Accrued expenses and deferred revenue
73 Note 18 Net debt
74 Note 19 Average number of employees, gender breakdown and sick leave
75 Note 20 Leasing
75 Note 21 Pledged assets
75 Note 22 Contingent liabilities
76 Note 23 Cash flow statement
76 Note 24 Acquisition/sale of operations
77 Note 25 Segments
79 Note 26 Financial risk management
81 Note 27 Critical estimations and assessments
81 Note 28 Definitions
81 Note 29 Considerations in conjunction withproposed disposition of profit
Accounting and valuation principles
The most important accounting principles applied inthe preparation of these consolidated financial state-ments are set forth below. Unless otherwise stated,these principles have been applied consistently withrespect to all presented years.
Principles for preparation of the reportThe consolidated financial statements have been pre-pared in accordance with the Swedish Annual Reports Actas well as International Financial Reporting Standards(IFRS) issued by the International Accounting StandardsBoard (IASB) with interpretation statements issued bythe International Financial Reporting InterpretationsCommittee (IFRIC), as such have been adopted by the EU.In addition, the Swedish Financial Accounting StandardsCouncil’s Recommendation RR 30:05, SupplementaryReporting Rules for Groups, has been applied.
The consolidated financial statements have beenprepared in accordance with the acquisition method,other than with respect to certain financial assets andliabilities (including derivative instruments) which arevalued at fair value via the profit and loss account.
The preparation of reports in accordance with IFRSrequires the use of a number of important estimationsfor accounting purposes. In addition, managementmust make certain assessments in conjunction withthe application of the Group’s accounting principles.Those areas that include a high degree of assessment,which are complex or in which assumptions andestimations are of material significance for the con-solidated financial statements are indicated in Note 27.
The Parent Company applies the same accountingprinciples as the Group, except where stated below ina particular section. The differences that exist betweenthe principles applied by the Parent Company and theGroup are due to limitations on the possibilities to applyIFRS to the Parent Company as a consequence of theprovisions of the Swedish Annual Reports Act and theSwedish Pension Obligations (Security) Act and also, incertain cases, for tax reasons. In addition, the SwedishFinancial Account Standards Council’s RecommendationRR32:05, Reporting by Legal Entities, has been applied.
i. Changes in published standards which entered intoforce in 2006 and which are relevant to the Group.
● IAS 19 (Amendment), Employee benefits. Thischange introduces a possibility for an alternativereporting method with regard to actuarial profitsand losses. It also entails additional informationrequirements. The Group does not intend tochange the accounting principles with respect toactuarial profits and losses.

52 | SSAB ANNUAL REPORT 2006
N O T E S
● IAS 21 (Amendment), Net investment in anindependent foreign operation.
● IAS 39 (Amendment) Hedge accounting for cashflow hedging of forecast transactions betweenGroup companies.
● IAS 39 (Amendment), Fair value option.
● IAS 39 and IFRS 4 (Amendment), Financialguarantee contracts.
● IFRIC 4 Determining whether an agreementcontains a lease.
None of these new standards and interpretations hashad any impact on the Group’s accounts; rather, theyhave affected only the formulation and scope of thesupplementary information presented in the reports.
ii. Standards applied by the Group prematurelyThe Group applies no standards prematurely.
iii. Standards that have not yet entered into forceThe following standards and interpretations of existingstandards have been published and are obligatory asregards the consolidated financial statements for thefinancial year commencing January 1, 2007 or later.
● IFRS 7, Financial instruments: Disclosures. IFRS 7essentially replaces the disclosure requirements setforth in IAS 32, but also entails a certain expansionof the disclosure requirement.
● IFRIC 10, Interim financial reporting and impair-ment. IFRIC 10 does not allow for reversal on asubsequent balance sheet date of write-downsreported during an interim period with respect togoodwill, investments in equity instruments andinvestments in financial assets which are reportedat acquisition value.
The Group will apply IFRS 7 commencing January 1,2007 and IFRIC 10 as soon as it is adopted by the EU;however, neither of them is expected to have anyimpact on the Group’s accounts.
Consolidated financial statementsThe consolidated financial statements cover SSABSvenskt Stål AB and the companies in which the Groupis entitled to formulate financial and operationalstrategies in a manner which is normally associatedwith a shareholding in excess of 50% of the votingcapital. Companies in which the Group exercises asignificant but not controlling influence are reportedas affiliated companies; this is normally the casewhere shares are held equal to between 20% and50% of the voting capital.
SubsidiariesThe Group’s annual accounts are prepared in accord-ance with the acquisition method, entailing that theequity of a subsidiary at the time of acquisition – defined as the difference between the fair value ofidentifiable assets, liabilities and possible obligations – is eliminated in its entirety against the acquisitionprice. Any outstanding, non-eliminated part of theacquisition price is reported as goodwill. If the acquisi-tion price is below the fair value for the net assets ofthe acquired subsidiary, the difference is reporteddirectly in the profit and loss account.
Acquired companies are included in the consolid-ated financial statements commencing the day onwhich a controlling influence is obtained, while soldcompanies are reported up to the day on which thecontrolling influence ceases.
Intra-Group transactions, dealings and unrealisedprofits are eliminated in the consolidated financialstatements. Unrealised losses are also eliminatedunless the transaction constitutes evidence of the needto write-down the transferred asset. The accountingprinciples for subsidiaries have, where appropriate, beenchanged in order to ensure a consistent application of the Group’s principles.
In the consolidated cash flow statement, the purchaseprice with respect to acquired or sold operations isreported under the heading “Acquisition/sale of opera-tions”. The assets and liabilities of the acquired/soldcompanies at the time of the acquisition/sale are,therefore, not included in the cash flow statement.
Affiliated companiesAffiliated companies are reported in accordance withthe equity method and valued initially at acquisitionvalue. The equity method entails that the value of theshares in affiliated companies as booked in the Groupcorresponds to the Group’s share in the equity of theaffiliated companies and, where appropriate, the re-sidual value of surplus values or under-values from aGroup perspective. The Group’s share in the results ofaffiliated companies or acquisitions is reported in theprofit and loss account. In the consolidated profit andloss account, “Shares in earnings of affiliated companiesbefore tax” comprises the Group’s share in the pre-taxearnings of affiliated companies. Shares in the earningsof affiliated companies are reported in the operatingprofit since operations in affiliated companies arerelated to SSAB’s operations and considered to be ofan operational nature. Taxes are included in the item“Tax”. Any intra-Group profits are eliminated in relationto the owned share of equity.
In the Parent Company, affiliated companies arereported in accordance with the acquisition valuemethod.

SSAB ANNUAL REPORT 2006 | 53
N O T E S
Transactions in foreign currenciesItems included in the financial reports for the variousunits in the Group are valued in the currency used inthe economic environment in which the company inquestion primarily operates (functional currency).Swedish kronor are used in the consolidated financialstatements; this is the functional currency and reportingcurrency of the Parent Company.
Transactions in foreign currency are reported at theexchange rate on the transaction date. In certain cases,the actual rate is approximated to the average rateduring a month. At the end of the month, receivablesand liabilities in foreign currency are translated inaccordance with the closing day rate at that time.Exchange rate differences relating to the operationsare reported in the operating profit, while differencesattributable to financial assets and liabilities are reportedas a net sum among financial items.
The profit and loss accounts of foreign subsidiariesare translated into Swedish kronor at the averageexchange rates for the year, while their balance sheetsare translated into Swedish kronor at the closing dayrates. Any translation differences that arise are trans-ferred directly to the Group’s equity and reported inthe item “Translation reserve”.
Loans or other financial instruments taken up inorder to hedge net assets in foreign subsidiaries arereported in the consolidated financial statements atthe closing day rate. Any exchange rate differencesless deferred taxes are transferred directly to equityand thereby set off against the translation differenceswhich arise in conjunction with the translation of thesesubsidiaries’ balance sheets into Swedish kronor.
Upon sales of foreign subsidiaries, the total trans-lation differences that relate to the foreign subsidiaryare reported as a part of capital gains/losses in theconsolidated profit and loss account.
Goodwill and adjustments of assets and liabilitiesto fair value in connection with the acquisition offoreign subsidiaries are treated as assets and liabilitiesin the foreign operations and thus translated inaccordance with the same principles as the foreignsubsidiaries.
Revenue recognitionSales are reported after the crucial risks and benefitassociated with title are transferred to the buyer and no right of disposition or possibility of actualcontrol of the goods remains. In most cases, thismeans that sales are reported upon delivery of thegoods to the customer in accordance with agreeddelivery terms and conditions. The sale is reported less value added tax, discounts, returns and freight.Intra-Group sales are eliminated in the consolidatedfinancial statements.
With respect to other revenue, interest revenue isreported in accordance with the effective yield anddividends are reported when the entitlement to thedividend is believed to be certain. Regarding dividendsfrom subsidiaries, see the section entitled “Dividends”.
Pricing between Group companiesPricing of deliveries of goods and services betweencompanies in the Group takes place at comparablemarket levels. However, deliveries of slabs from SSABOxelösund to SSAB Tunnplåt take place at cost price.
State aidState aid and grants are reported at fair value whenthere is reasonable certainty that the grant will bereceived and that the Group will fulfil the conditionsattached to the grant.
State aid and grants are allocated over the sameperiod as the expenses which the grants are intendedto reimburse. Grants provided as compensation forexpenses are recognised in the profit and loss accountas an expense reduction. Grants related to assets arerecognised in the balance sheet through a reductionin the reported value of the assets.
Research and development expensesResearch expenses are booked as they are incurred.Development expenses may be capitalised under cer-tain strict conditions. However this requires, amongother things, that future economic benefits can bedemonstrated at the time the expenses are incurred.At present there are no such projects and thus devel-opment expenditures are also booked as expenses.
Expenses for development of softwareExpenses for development and acquisition of newsoftware are capitalised and reported as an intangibleasset provided they have a significant value for theCompany in the future and where they can be deemedto have a useful life in excess of three years. Expensesfor training and software maintenance are, however,booked directly as expenses.
Tangible and intangible assetsFixed assets are reported at acquisition value less de-ductions for accumulated depreciation and any accu-mulated write-downs. Depreciation is based on theacquisition value of the assets and estimated usefullife. The acquisition value includes expenses directlyattributable to the acquisition of the asset. Any loanexpenses in conjunction with the construction anddesign of fixed assets are not added to the acquisitionexpenses but, rather, booked as expenses when in-curred. Restoration expenses in connection with dis-posals of fixed assets are included in the acquisition

54 | SSAB ANNUAL REPORT 2006
value only where the criteria for a provision for suchrestoration expenses may be deemed fulfilled. Addi-tional expenses are added to the reported value of thefixed assets or reported as a separate asset only whereit is likely that the Group will enjoy the future economicbenefits associated with the asset and the acquisitionvalue of the asset can be measured in a reliable manner.All other forms of repairs and maintenance are reportedas expenses in the profit and loss account during theperiod in which they occur.
Land is assumed to have a perpetual period of useand thus is not depreciated. Other tangible assets areclassified into groups for calculation of depreciation,based on their estimated useful life in accordance withthe following table.
EstimatedExamples of items use, years
Vehicles, office equipment and computers 3–5Light machinery 5–12Heavy machinery
Relining of blast furnaces 12–15Steel furnaces, rolling mills and cranes 15–20Blast furnaces and coke ovens 15–20
Land improvements 20Buildings 25–50
The useful life of the assets is assessed annually andadjusted where required. The assets are normally de-preciated to zero without any remaining residual value.
Intangible assets are classified in the same mannerinto two groups, whereby assets with a limited usefullife are deemed to have a depreciation period of 3–5years while assets with an unlimited useful life are notdepreciated at all.
The linear depreciation method is used for all typesof fixed assets with a limited useful life. Where thebook value of an asset exceeds the expected recoveryvalue, the asset is written down to such value.
Capital gains and capital losses upon the sale offixed assets are reported in the profit and loss accountas “Other operating revenue” or “Other operatingexpenses”.
Write downsAssets with an unlimited useful life (including goodwill)are not depreciated but, rather, reviewed annually forany impairment or otherwise where signs indicateimpairment. Assets which are depreciated are assessedwith respect to impairment where signs indicate impair-ment. Where the estimated recovery value is less thanthe reported value, the asset is written down to therecovery value. Review of the value of an asset withan unlimited useful life may also result in the assetbeing re-classified as an asset with a limited usefullife. The asset’s useful life is then calculated anddepreciation commences.
Leased Fixed AssetsExpenses for fixed assets that are leased instead ofowned are reported primarily as lease expenses linearlyover the leasing period (operational leasing). Where alease agreement contains terms and conditions pursuantto which the Group enjoys the economic advantagesand incurs the economic risks that are associated withownership of the property (financial leasing), they arereported in the consolidated balance sheet under ‘FixedAssets’ and depreciated over the useful life (the shorterof the economic life and the outstanding leasing period).At the beginning of the leasing period, financial leasingin reported in the balance sheet at the lower of theleased object’s fair value and the present value of theminimum leasing charges. Each lease payment is alloc-ated between interest and repayment of the debt;interest is allocated over the leasing period. Correspond-ing payment obligations, less deduction for financialexpenses, are included in the balanced sheet items,“Current interest-bearing liabilities” and “Long-terminterest-bearing liabilities”.
In the Parent Company, all lease agreements arereported as operational.
Financial assetsFinancial assets include liquid assets, accounts receiv-able, shares and participations, loan claims and derivativeinstruments. They are reported initially at acquisitionvalue corresponding to the fair value of the asset plus asupplement for transaction costs, with the exception ofassets that are valued at fair value. Reporting thereaftertakes place depending on the classification of the asset.Financial assets are removed from the balance sheetwhen the debt/instrument is finally paid or ceases toapply or is transferred through all risks and benefitsbeing assigned to an external party.
Spot purchases and sales of financial assets arereported on the settlement day, i.e. the day on whichthe asset is delivered. Accounts receivable are reportedin the balance sheet when an invoice has been sent.
The fair value of listed financial assets correspondsto the asset’s listed transaction price on the balancesheet date. The fair value of unlisted financial assets is determined through use of valuation techniques,for example, recently conducted transactions, pricesof similar instruments and discounted cash flows.
Financial assets are classified in four categories:“holdings valued at fair value via the profit and lossaccount”, “holdings to maturity”, “loan claims andaccounts receivable” and “assets for sale”.
● Assets that are acquired primarily in order to enjoyprofits upon short-term price fluctuations, holdingsfor trading, are classified as “Holdings valued at fairvalue via the profit and loss account” and reportedas short-term investments if the term to maturityon the acquisition date is less than three months
N O T E S

SSAB ANNUAL REPORT 2006 | 55
N O T E S
and as “Other interest-bearing current receivables”if the term to maturity is between three and twelvemonths. Derivative instruments are classified asholdings for trading except where used for hedgeaccounting. Assets in this category are valuedregularly at fair value and changes in value arereported in the profit and loss account.
● Assets with a fixed maturity date and which areintended to be held until maturity are classified as“holdings to maturity” and reported as financialassets, except for those parts that mature withintwelve months; these are reported as “Other interest-bearing current receivables”. Assets in this categoryare valued at the accrued acquisition value. Theaccrued acquisition value is determined based onthe effective rate of interest which is calculated onthe acquisition date. During the year, the Groupheld no instruments in this category.
● Loan claims and current receivables are financialassets that are not derivatives, which have fixed ordeterminable payments and which are not listed onan active market. The claims arise when cash, goodsor services are provided directly to the borrowerwithout an intention of trading in the receivables.Just as with the preceding category, assets in thiscategory are valued at the accrued acquisition value.They are included in “Current assets”, with theexception of items with a maturity date which fallsmore than twelve months after the balance sheetdate, which are classified as “Fixed assets”.
● Assets without a fixed term to maturity but whichcan be sold should liquidity needs arise or uponchanges in interest rates are classified as “Assets forsale” and reported as “Financial assets”. Assets inthis category are valued regularly at the fair valuewith changes in value against equity. Upon removalof the investments from the balance sheet, anypreviously reported accumulated profit or loss inequity is transferred to the profit and loss account.They are included in “Current assets”, with theexception of items with a maturity date which fallsmore than twelve months after the balance sheetdate; these are classified as “Fixed assets”.
Other shares and participationsConsist primarily of unlisted holdings and belong tothe category of financial assets valued at fair value viathe profit and loss account.
Long-term receivables Long-term receivables are receivables held withoutany intention of trading in the claim. Parts where theoutstanding holding period is less than one year arereported among “Other current interest-bearing re-ceivables”. The receivables are classified in the cate-gory, “Loan claims and accounts receivable”.
Accounts receivable Accounts receivable are classified in the category,“Loan claims and accounts receivable”. Accountsreceivable are reported initially at fair value andaccounts receivable in excess of twelve months arereported at the accrued acquisition value applying the effective rate of interest, less any provisions forreduction in value. Provisions are made based on anindividual assessment of uncertain claims. The amountof the provision comprises the difference between the reported value of the asset and the present valueof the assessed future cash flows, discounted by theeffective rate of interest. The remaining amount isreported in the profit and loss account. In 2006, theCompany had no accounts receivable with a due datein excess of twelve months.
Liquid assetsLiquid assets include cash, immediately accessiblebank balances as well as other money market instru-ments with an original term to maturity of less thanthree months (short-term investments). Investmentswith an original term to maturity of between threeand twelve months are reported under “Other currentinterest-bearing receivables” and classified as assetsvalued at the fair value via the profit and loss account.Overdraft facilities are reported in the balance sheet asborrowing among “Current interest-bearing liabilities”.
InventoriesInventories are valued at the lower of acquisition costand net realizable value, where the acquisition value iscalculated in accordance with the FIFO method (firstin, first out). The net realizable value is normally cal-culated as the sales price less production and sellingexpenses. With respect to raw materials and productsin the trading operations, the replacement cost isused as the best gauge of the net realizable value.However, raw materials are not depreciated below theacquisition value where the end product in which theyare included is expected to be sold at a price whichexceeds the manufacturing cost. Work in progress andfinished inventories are valued at the lower of themanufacturing cost and the net realizable value.Necessary provisions are made for obsolescence.
The acquisition value of inventories includes allcosts for purchasing, production and other expensesincurred in bringing the goods to their current loca-tion and condition.
Employees’ benefits
PensionsWithin the Group there are both contribution-basedand benefit-based pension plans. Generally, the plansare financed through payments to insurance companiesor manager-administered funds.

56 | SSAB ANNUAL REPORT 2006
N O T E S
In the contribution-based plans, fixed fees are paid toa separate legal entity and there is no obligation, legalor informal, to pay any additional fees. In the contri-bution-based plans, payments are recognised as anexpense during the period when the employees haveperformed the services to which the fees relate. Theblue collar employees in Sweden are covered by sucha contribution-based plan.
In the benefit-based plans, compensation is payableto employees and former employees based on salary atthe time of retirement and number of years in service.The Group bears the risk that the costs for the promisedpayments will be higher than estimated.
In the consolidated balance sheet, the net of theestimated present value of the obligations and fair valueof the managed assets is reported either as a provisionor as a long-term financial claim. In those cases wherea surplus in a plan cannot be utilized in full, only thatpart of the surplus which can be recovered throughreduced future fees or refunds is reported. Set-off of asurplus in one plan against a deficit in another plantakes place only where a right of set-off exists.
Pension expenses and pension obligations for bene-fit-based plans are calculated in accordance with theProjected Unit Credit Method. The method allocatespension expenses as the employees perform the servicesthat increase their entitlement to future compensation.The obligation is calculated by independent actuariesand constitutes the present value of the anticipatedfuture disbursements. The discount rate that is appliedcorresponds to the rate of interest on top-rated corpor-ate bonds or government bonds with a term to maturitywhich corresponds to the average term for the obliga-tions. The most important actuarial assumptions arestated in Note 13.
Actuarial profits or losses may arise upon determina-tion of the present value of the obligations and thefair value of the managed assets. These arise either as a consequence of the actual result differing frompreviously-made assumptions, or due to changes inthe assumptions. Such actuarial profits and losses arerecognised in their entirety in the Group’s resultswhen they arise.
White collar employees in Sweden are covered by a collective benefit-based plan, the ITP (supplementarypensions for salaried employees) plan. The ITP planhas been financed through the purchase of pensioninsurance with the mutual insurance company, Alecta.However, at present no information is available whichmakes it possible to report this plan as a benefit-basedplan. Accordingly, the plan is reported as a contributions-based plan, and thus premiums paid to Alecta duringthe year are reported as pension expenses.
The Parent Company and other legal entities withinthe Group report benefit-based pension plans in accord-ance with the local rules in the respective country.
Profit shares and variable salaryAll employees are covered by a profit-sharing systemwhich entitles them to a share in the profit above aminimum level. Group Management and a number of other senior executives also have salaries whichcontain a variable element related to the profit level.The costs for these systems are booked as accruedexpenses regularly during the year as soon as it is likelythat the profit level will exceed the profit thresholdrequirement.
Share-related compensationNo share-related compensation is paid within the Group.
Compensation upon termination of employmentCompensation upon termination of employment ispaid when employment is terminated prior to thenormal retirement age or where an employee acceptsvoluntary retirement in exchange for such compensa-tion. The Group reports severance compensationwhen the Group is demonstrably obliged either toterminate an employee in accordance with a detailedformal plan without the possibility of recall, or toprovide compensation upon termination as a result of an offer made in order to encourage voluntaryretirement. Benefits which fall due more than twelvemonths from the balance sheet date are discounted to present value.
ProvisionsProvisions are reported when the Group has an obliga-tion as a result of an event that has occurred andwhere it is likely that payments will be demanded forfulfilment of the obligation. A further requirement isthat it is possible to make a reliable estimation of theamount to be paid out.
Provisions for restructuring measures are made whena detailed, formal plan for the measures is in place andwell-founded expectations have been created amongthe parties that will be affected by the measures.
Emission rights SSAB participates in the EU’s system for trading inemission rights. The emission rights are valued initiallyat acquisition value. Provision is made if a shortfall inemission rights is identified between owned rights andthose rights which will have to be delivered due toemissions having taken place. The value of any surplusemission rights is reported only when it is realised asan external sale.
Environmental restoration expensesExpenses for environmental restoration measures associated with previous operations and which do notcontribute to current or future revenue are booked asa cost when incurred. The environmental undertaking

SSAB ANNUAL REPORT 2006 | 57
N O T E S
is calculated based on interpretations of applicableenvironmental legislation and regulations and is reportedwhen it is likely that payment liability will be incurredand a reasonable estimation can be made of suchamount. Provisions have not been made for land clean-up to prepare the industrial areas for other use in thefuture since it is not possible to make a reasonableestimation of when such clean-up will take place.
Financial liabilities Financial liabilities include loan debts, accounts pay-able and derivatives. They are reported initially at anacquisition value corresponding to the net fair valueafter deductions for transaction costs. Reporting thereafter takes place depending on the manner inwhich the liabilities are classified. Financial liabilitiesare removed from the balance sheet when the debt/instrument is paid in full or ceases to apply or is trans-ferred through all risks and benefits being assigned to an external party.
Loan debts Loan debts are valued initially at fair value, net aftertransaction costs, and thereafter at accrued acquisitionvalue. The accrued acquisition value is determinedbased on the effective rate of interest calculated whenthe loan was taken up. Accordingly, surplus valuesand under-values as well as direct issuance costs areallocated over the loan period. Long-term loan debtshave an anticipated term to maturity in excess of oneyear while current loan debts have a term to maturityof less than one year.
Derivative instrumentsCurrency derivatives in the form of forward contractsand swaps are used to hedge the exchange rates on sales orders and purchasing orders and to hedgeSwedish kronor payment flows on foreign loans.Derivatives in the form of interest swaps are used tohedge interest rate risks.
All derivative instruments are reported in the balancesheet at fair value. The method for reporting accruedprofit/loss differs, however, depending on the purposeof the derivative instrument. When a derivative contractis entered into, it is characterised as hedging of thefair value of a reported asset/liability or of a signeddelivery order (“fair value hedging”), hedging of aplanned transaction (“cash flow hedging”), hedgingof a net investment in a foreign company, or as a de-rivative instrument which does not meet the require-ments for hedging transactions.
Changes in the fair value of derivative instrumentswhich are categorised as, and meet the requirementsfor, “fair value hedging” are reported in the profitand loss account together with changes in the fairvalue of the asset/liability or the delivery order to whichthe hedging relates.
Changes in fair value of derivative instruments whichare characterised as, and meet the requirements for,cash flow hedging are reported in equity as hedgingreserves until such time as the hedged interest isentered in the books. When the hedged interest isentered in the books, the result from the derivativeinstrument is also reported in the profit and lossaccount. However, where a planned transaction is no longer expected to occur or where a part or all of the hedging fails to meet the criteria for effectivehedging, the profit or loss attributed thus far to thehedging reserve is transferred immediately to theprofit and loss account. No cash flow hedging hasbeen applied during the year.
Hedging of net investments in foreign companies isreported in the same manner as cash flow hedging.Changes in value of derivative instruments are reportedin the translation reserve in equity.
Certain derivative transactions do not meet theformal criteria for hedge accounting. Changes in fairvalue with respect to such derivatives are reported in the profit and loss account.
Derivative instruments with respect to items relatedto the operations are reported among “Other oper-ating revenues”/ “Other operating expenses”, where-as derivative instruments of a financial nature arereported in “Financial items”.
The fair value of currency forward contracts andcurrency swaps is calculated based on prevailing for-ward contract prices on the balance sheet day, whileinterest rate swaps are valued calculated on the basisof future discounted cash flows.
TaxesThe Group’s reported tax expenses consist of tax on the taxable earnings of Group companies for the period as well as any adjustments with respect to tax for previous periods, shares in the tax of affiliatedcompanies and changes in deferred tax.
Deferred tax is calculated in order to correspond to the tax consequence which arises when final tax is triggered. It corresponds to the net effect of tax on all differences between the tax value of assets and liabilities and the value for accounting purposes(temporary differences), applying the future tax rates already decided upon or announced which will apply at the time it is expected that the tax will be realised.
Temporary differences arise primarily through accelerated depreciation of fixed assets, profits fromintra-Group inventory transactions, untaxed reservesin the form of tax allocation reserves and non-utilisedlosses carried forward. A deferred tax claim due tolosses carried forward is, however, recognised as anasset only to the extent that it is likely that deductionscan be made against future surpluses.

58 | SSAB ANNUAL REPORT 2006
N O T E S
In the Parent Company’s balance sheet, the accumu-lated values of accelerated depreciation and otheruntaxed reserves are reported in the item “Untaxedreserves” without deduction of the deferred tax. In the Parent Company’s profit and loss account,changes in the untaxed reserves are reported on a separate line.
DividendsDividends proposed by the Board of Directors do notreduce equity until the Annual General Meeting hasadopted a resolution on payment of the dividend.
Anticipated dividends are reported in those caseswhere the Parent Company is entitled exclusively todecide on the amount of the dividend and the ParentCompany, prior to the date on which financial reportsare published, has decided on the amount of thedividend and ascertained that the dividend will notexceed the dividend capacity of the subsidiary.
Group contributions in the Parent Company Group contributions and the tax consequences thereof are reported directly against equity and thus do not affect the result.
Cash flow statementThe cash flow statement is prepared in accordancewith the indirect method. Liquid assets in the cashflow statement consist of cash and bank balances aswell as short-term investments with a term to maturityof less than three months from the acquisition datewhich are exposed to only an insignificant risk ofchange in value.
Segment reporting Business areasThe Group is organized into separate divisions and sub-groups: the Sheet Division (formerly SSABTunnplåt), the Plate Division (formerly SSAB Oxelösund),Plannja and Tibnor. In addition, there are a number of foreign sales companies that are owned directly by the Parent Company. The business areas constitutethe primary basis for subdivision and, since they areseparate legal entities, the presentations in Note 25are based on their complete financial reports. A detailed description of the business areas and their operations is presented on pages 32–42.

Type of cost Group Parent CompanySEK millions 2006 2005 2006 2005
Raw materials in the steel operations 7,156 7,137 – –Purchased products and other input materials in the steel operations 1,935 1,104 – –Purchased products in the processing and trading operations 6,403 4,964 – –Materials and services 3,856 3,443 33 12Energy 1,500 1,170 – –Compensation to employees 4,223 4,085 56 50Depreciation 963 951 0 0Other, incl inventory change – 418 – 339 22 20
Total 25,618 22,515 111 82
Services’ includes fees and compensation to accounting firms in the following amounts:
Auditing feesPricewaterhouseCoopers 4 3 2 1KPMG 1 1 – –Others 1 1 – –
Total auditing fees 6 5 2 1
2 OPERATING EXPENSES
Other operating revenue Group Parent CompanySEK millions 2006 2005 2006 2005
Sales of purchased energy and media 88 84 – –Net exchange profit 41 137 – –Profit upon sale of companies and operations *) 164 – – –Profit upon sale of fixed assets 4 12 0 6Other 82 118 2 2
Total 379 351 2 8
Relates primarily to a capital gain of SEK 77 million on the sale of the affiliated company, Cogent Power, and capital gains ofSEK 85 million on the sale of two property companies.
SSAB ANNUAL REPORT 2006 | 59
N O T E S
Sales per product area GroupSEK millions 2006 2005
Hot-rolled sheet 7,694 7,233Cold-rolled and metal-coated sheet 4,746 4,338Organic-coated and profiled sheet 3,766 3,416Heavy plate 7,492 6,676Trading operations 6,162 4,600Slabs 138 660By-products 1,056 874Other – 7
Total 31,054 27,804
Sales broken down by business area and geographic market are set forth in the Group Review on page 20 and in Note 25.
1 SALES AND OTHER OPERATING REVENUE
Continuation of note 2 on next page.
*)

Other compensation to accounting firms Group Parent CompanySEK millions 2006 2005 2006 2005
PricewaterhouseCoopers *) 2 3 1 1KPMG 0 0 – 0Others 1 2 0 –
Total other compensation 3 5 1 1
In 2004, other compensation paid to PricewaterhouseCoopers, in addition to the audit, amounted to SEK 5 million.
2 OPERATING EXPENSES, CONTINUATION
Continuation of note 2 on next page.
Directors, Presidents, and OtherCompensation to employees Executive Vice Presidents employeesSEK millions 2006 2005 2006 2005
Parent Company 1) 17 12 13 14Subsidiaries in Sweden 18 18 2,394 2,338Subsidiaries outside Sweden
Canada 1 1 22 21Denmark 4 4 64 61Finland 3 3 42 38France 0 0 9 9Germany 0 0 23 25Italy 3 3 20 16Netherlands 1 0 10 9Norway 3 2 14 15Poland 4 4 13 13South Africa 0 1 22 19UK 1 1 20 22USA 1 1 20 19Other countries 2 2 33 30
Total wages and salaries 2) 58 52 2,719 2,649
Social security expenses 34 29 1,168 1,164(of which, pension expenses) (21) (16) (331) (303)Profit-sharing scheme 1 1 224 171Other expenses for benefits to employees 1 1 18 18
Total compensation to employees 94 83 4,129 4,002
Relates only to personnel employed and working within the Parent Company. Personnel in certain major subsidiaries are formallyemployed in the Parent Company but are reported in terms of number (Note 18) and expense in the respective subsidiaries.Total wages and salaries include profit-based salaries to Presidents and Executive Vice Presidents in the amount of SEK 7 (7) million, of which SEK 5 (5) million are included in the Parent Company.
Operating expenses have been reduced by the following state aid:
60 | SSAB ANNUAL REPORT 2006
N O T E S
*)
1)
2)
Group Parent CompanySEK millions 2006 2005 2006 2005
Freight support 14 11 – –Other 3 4 – –
Total 17 15 – –

SSAB ANNUAL REPORT 2006 | 61
2 OPERATING EXPENSES, CONTINUATION
Terms of employment for the Group's Senior Executives
N O T E S
Board of DirectorsThe General Meeting decides upon fees to the Chairman of the Board and the members of the Board who are elected by theGeneral Meeting. The fee to the Chairman amounted to SEK 950,000 (800,000) and, to Board members (excluding the CEO),to SEK 350,000 (350,000). In addition, members of Board committees received SEK 50,000 for each committee in which themember was included. In total, SEK 3,330,000 (2,850,000) was paid in fees to the Board of Directors.
Salaries and compensation for the Chief ExecutiveOfficer and other senior executivesAccording to a decision by the General Meeting, the CEO andother senior executives receive compensation comprising fixedsalary, possible variable compensation, other benefits andpension. The total compensation shall be on market termsand competitive on the employment market on which theexecutive works. Fixed salary and variable compensation shallbe related to the executive’s responsibilities and powers.
Within the Board of Directors there is a CompensationCommittee which issues proposals regarding the salary andother employment terms and conditions for the CEO, deter-mines the salary and other employment terms and conditionsfor Group Management and, based on a decision by theGeneral Meeting, also establishes salary limits and employ-ment terms and conditions for other senior executives. Thecommittee consists of Sverker Martin-Löf (chairman) andAnders Nyrén. The CEO is a co-opted member of the com-mittee but does not participate in discussions concerning his own salary and employment terms and conditions.
Compensation to the CEO and other members of GroupManagement consists of a fixed and a variable salary element.The variable salary is related to the Group’s return on equityand may not exceed a given percentage of fixed salary which,with respect to Group Management, varies between 25–50%.There is no share-related compensation. However, membersof Group Management have undertaken to acquire SSABshares through the market for a portion of the variable salary.
President and Chief Executive OfficerIn 2006, Anders Ullberg went into retirement upon reachingthe age of 60. Salary was paid according to agreement up to and including July 31 and total compensation amounted to SEK 4.3 (6.6) million, of which SEK 1.3 (2.0) million com-prised the profit-related variable salary element, which will be paid out in 2007 (2006).
The pension between the ages of 60 and 65 is determinedas a benefit and amounts to 65% of fixed salary. Thereafter,the pension is based on contributions and the premiumamounted to approx. 20% of fixed salary. The pension com-
mitments are covered by insurance. The cost amounted to144 (145)% of fixed salary.
Olof Faxander was employed on March 1 and assumed officeas President and CEO in conjunction with the Annual GeneralMeeting in April 2006. Total compensation to him amountedto SEK 5.6 million, of which SEK 1.8 million comprised theprofit-related variable element, which will be paid out in 2007.
The minimum retirement age is 60. The pension is based oncontributions and covered by insurance. The cost amountedto 20% of fixed salary. Earned pension is inviolable, but pre-mium payments cease upon termination of the employment.
There is a 24-month period of notice in the event of dis-missal by the Company, while the CEO must give 6 months’notice of termination.
Other Group ManagementApart from the CEO, Group Management at the beginning of the year comprised four persons. Anders Werme and BengtNilsson resigned during the year, while Jonas Bergstrand andAnna Vikström Persson joined Group Management. GroupManagement is presented on page 11.
Apart from the CEO, members of Group Managementreceived total compensation and benefits (excluding severancecompensation and pension agreements with respect to re-signing members) amounting to SEK 13.3 (12.0) million, ofwhich SEK 4.4 (3.9) million consisted of profit-related salary,which will be paid out in 2007 (2006).
The retirement age is 65. Pensions are determined partly as benefits and partly based on contributions and the com-mitments are covered by insurance. Pension premium costsamounted to 30 (26)% of total fixed salary.
Apart from the CEO, severance compensation and pensionagreements with respect to resigning members of GroupManagement amounted to SEK 1.8 million in salary and SEK 6.3 million pension expenses.
There is a 12-month period of notice in the event of dismissal by the Company. In addition, severance paymentsare thereupon payable equivalent to 0–12 months’ salary.Members of Group Management must give 6 months’ noticeof termination, whereupon there is no entitlement to severancecompensation.
Board Member Fees
Elected Position Board fees Committee fees
Elected by General MeetingSverker Martin-Löf 2003 Chairman 950,000 100,000Carl Bennet 2004 Member 350,000 –Anders G Carlberg 1986 Member 350,000 50,000Olof Faxander 2006 Member, CEO – –Marianne Nivert 2002 Member 350,000 50,000Anders Nyrén 2003 Member 350,000 50,000Matti Sundberg 2004 Member 350,000 –Lars Westerberg 2006 Member 350,000 –

N O T E S
62 | SSAB ANNUAL REPORT 2006
Share of earnings and share of equity Share in earnings Share of equitySEK millions 2006 2005 2006 2005
Cogent Power Ltd1) 83 – 1 – 143Lulekraft AB 0 0 10 10Norsk Stål A/S 123 72 175 140Norsk Stål Tynnplater A/S 21 15 43 38Oxelösunds Hamn AB 12 9 55 50
Total 239 95 283 381
Share of sales and assets Share of sales Share of assetsSEK millions 2006 2005 2006 2005
Cogent Power Ltd 1) 657 1,059 – 596Lulekraft AB 179 156 91 83Norsk Stål A/S 1,469 1,207 428 391Norsk Stål Tynnplater A/S 356 320 148 123Oxelösunds Hamn AB 109 105 93 94
Total 2,770 2,847 760 1,287
The 25% stake in Cogent Power Ltd was sold in 2006.Affiliated companies are presented in detail in the Report of the Directors on page 42.
Receivables from affiliated companies Group Parent CompanySEK millions 2006 2005 2006 2005
Included in balance sheet items:Financial assets – 26 – –Accounts receivable 85 137 – –
Total 85 163 – –
Liabilities to affiliated companies Group Parent CompanySEK millions 2006 2005 2006 2005
Included in balance sheet items:Accounts payable 53 35 – –Accrued expenses and deferred revenue 60 29 – –
Total 113 64 – –
The following transactions with affiliated companies occurred during the year.
Cogent Power purchased steel from SSAB Tunnplåt for SEK 202 (495) million. Lulekraft purchased gas from SSAB Tunnplåt for SEK 312 (270) million and resold electricity for SEK 147 (147) million. Norsk Stål and Norsk Stål Tynnplater purchased steel from the steel operations for SEK 308 (325) million. Oxelösunds Hamn sold port services to SSAB Oxelösund for SEK 158 (189) million and purchased other services for SEK 11 (10) million. The transactions took place at market prices.
3 AFFILIATED COMPANIES
1)

SSAB ANNUAL REPORT 2006 | 63
N O T E S
The GroupSEK millions 2006 2005
Financial revenueInterest revenue 70 75Dividends 2 1Net profit upon sale of disposable financial assets 0 0Net revaluation of financial assets/liabilities – –Net exchange rate differences 19 –Other 5 1
Total financial revenue 96 77
Financial expensesInterest expenses 88 117Estimated financial expenses, pension liabilities 4 7Net exchange rate differences – 10Other 6 7
Total financial expenses 98 141
Financial revenue and expenses – 2 – 64
Parent CompanySEK millions 2006 2005
Financial RevenueDividends from subsidiaries 1) 6,665 2,621Dividends from affiliated companies 49 48Profit from other securities and claims which constitute fixed assetsDividends – –Other interest revenue 0 14Capital gains on sales 0 –Other interest revenue and similar revenueInterest revenue from subsidiaries 145 112Other interest revenue 43 38Exchange rate differences 16 –
Total financial revenue 6,918 2,833
Financial expensesInterest expenses to subsidiaries 25 18Other interest expenses 75 105Estimated financial expenses, pension liabilities 0 0Exchange rate differences – 20Other 0 0
Total financial expenses 100 143
Financial revenue and expenses 6,818 2,690
For 2006, includes an anticipated dividend of SEK 3,470 million.
4 FINANCIAL ITEMS
1)

64 | SSAB ANNUAL REPORT 2006
N O T E S
Reconciliation of tax rates Group Parent Company% 2006 2005 2006 2005
Applicable tax rate in Sweden 28 28 28 28Tax effect of:
non-deductible expenses 0 0 0 0non-taxable capital gain – 1 – – –other non-taxable revenue *) 0 0 – 28 – 28other tax rates applicable to foreign subsidiaries and affiliated companies 1 0 – –taxes relating to an earlier period 0 0 0 0losses carried forward which it is believed cannot be utilised 0 0 – –previous non-booked tax claims for losses carried forward 0 0 – –
Effective tax rate 28 28 0 0
Tax expenses Group Parent CompanySEK millions 2006 2005 2006 2005
Swedish corporate income taxes 1,527 1,602 – 2 – 7Foreign corporate income taxes 127 117 – –
Total current tax expenses 1,654 1,719 – 2 – 7Deferred taxes – 46 – 139 – 1 0Share in taxes of affiliated companies 103 23 – –
Reported tax expenses 1,711 1,603 – 3 – 7
5 TAXES
Patents, Tenancy Total Group licences, and rights and intangible SEK millions similar rights similar rights Goodwill assets
Acquisition value, Jan. 1, 2005 102 3 111 216Acquisitions 0 0 – 0Sales and disposals – 36 – 3 – 111 – 150Translation differences 1 – – 1
Acquisition value, Dec. 31, 2005 67 0 0 67
Acquisition value, Jan. 1, 2006 67 0 – 67Acquisitions 0 – – 0Sales and disposals – 3 – – – 3Translation differences – 1 – – – 1
Acquisition value, Dec. 31, 2006 63 0 – 63
6 INTANGIBLE ASSETS
Continuation of note 6 on next page.
*) The Parent Company’s other non-taxable revenue consists primarily of dividends from subsidiaries.

SSAB ANNUAL REPORT 2006 | 65
N O T E S
Continuation of note 7 on next page.
6 INTANGIBLE ASSETS, CONTINUATION
Patents, Tenancy Total Group licences, and rights and intangible SEK millions similar rights similar rights Goodwill assets
Accumulated depreciation, Jan. 1, 2005 88 3 111 202Sales and disposals – 36 – 3 – 111 – 150Depreciation/write-downs for the year 3 – – 3Translation differences 0 – – 0
Accumulated depreciation, Dec. 31, 2005 55 0 0 55
Accumulated depreciation, Jan. 1, 2006 55 – – 55Sales and disposals – 3 – – – 3Depreciation for the year 1 – – 1Translation differences 0 – – 0
Accumulated depreciation, Dec. 31, 2006 53 – – 53
Residual value, Dec. 31, 2005 12 0 0 12Residual value, Dec. 31, 2006 10 – – 10
Depreciation for the year is included in the profit and loss account in the amount of SEK 1 (1) million for costs of goods soldand SEK 0 (2) million for selling expenses.
As a method for limiting emissions of carbon dioxide, in 2005 the EU introduced a system of emission rights. The Group wasallocated emission rights of 19.9 million tonnes for the period 2005-2007, of which 5.7 million tonnes were used during theyear and 5.9 million tonnes in 2005. No rights have been bought or sold during the year. The emission rights are reported asintangible fixed assets booked at an acquisition value of zero.
There are no internally processed assets.
7 TANGIBLE ASSETSAssets under
Land and Equipment, construction TotalGroup land improve- tools and and advances tangible SEK millions ments Buildings Machinery installations to suppliers assets
Acquisition value, Jan. 1, 2005 330 2,568 16,217 724 278 20,117Acquisitions 16 20 516 44 256 852Sales and disposals 0 – 1 – 200 – 56 – – 257Reclassifications 6 2 – 148 162 – 21 1Translation differences 0 6 14 6 0 26
Acquisition value, Dec. 31, 2005 352 2,595 16,399 880 513 20,739
Acquisition value, Jan. 1, 2006 352 2,595 16,399 880 513 20,739Acquisitions 7 59 843 50 448 1,407Sales and disposals – 5 – 75 – 335 – 49 – 1 – 465Reclassifications 1 0 – 14 24 – 11 0Translation differences – 1 – 4 – 16 – 6 0 – 27
Acquisition value, Dec. 31, 2006 354 2,575 16,877 899 949 21,654

Parent Company Equipment, tools TotalSEK millions and installations tangible assets
Acquisition value, Jan. 1, 2005 4 4Acquisitions – –Sales and disposals – 1 – 1
Acquisition value, Dec. 31, 2005 3 3
Acquisition value, Jan. 1, 2006 3 3Acquisitions 1 1Sales and disposals – 1 – 1
Acquisition value, Dec. 31, 2006 3 3
Accum. depreciation, Jan. 1, 2005 3 3Sales and disposal – 1 – 1Depreciation for the year 0 0
Accum. depreciation, Dec. 31, 2005 2 2
Accum. depreciation, Jan. 1, 2006 2 2Sales and disposal 0 0Depreciation for the year 0 0
Accum. depreciation, Dec. 31, 2006 2 2
Residual value, Dec. 31, 2005 1 1Residual value, Dec. 31, 2006 1 1
Assets underLand and Equipment, construction Total
Group land improve- tools and and advances tangible SEK millions ments Buildings Machinery installations to suppliers assets
Accum. depreciation, Jan. 1, 2005 53 1,518 10,238 549 – 12,358Sales and disposals 0 – 1 – 190 – 47 – – 238Reclassifications 0 – – 90 90 – 0Depreciation for the year 7 88 773 80 – 948Translation differences 0 3 12 5 – 20
Accum. depreciation, Dec. 31, 2005 60 1,608 10,743 677 – 13,088
Accum. depreciation, Jan.1, 2006 60 1,608 10,743 677 – 13,088Sales and disposals – 1 – 28 – 262 – 43 – – 334Reclassifications 0 – 0 0 – 0Depreciation for the year 8 88 787 78 – 961Translation differences 0 – 3 – 16 – 5 – – 24
Accum. depreciation, Dec. 31, 2006 67 1,665 11,252 707 – 13,691
Accum. write-downs, Jan. 1, 2006 – – – – – –Write-downs for the year 1 – – – – 1
Accum. write-downs, Dec. 31, 2006 1 – – – – 1
Residual value, Dec. 31, 2005 292 987 5,656 203 513 7,651Residual value, Dec. 31, 2006 286 910 5,625 192 949 7,962
Depreciation for the year is included in the profit and loss account in the amount of SEK 882 (877) million in costs of goods sold,SEK 50 (46) million in selling expenses, SEK 9 (6) million in administrative expenses and SEK 20 (19) million in other expenses.The item ‘Machinery’ includes financial leasing agreements amounting to SEK 92 (92) million in acquisition value and SEK 55 (62)million in residual value according to plan.The tax assessment value of real property in Sweden amounts to SEK 2,083 (2,627) million, while the corresponding property’sresidual value according to plan amounts to SEK 1,022 (1,062) million.As per the balance sheet date, there were contracted investments in fixed assets valued at SEK 977 (375) million which were notreported in the financial statements.
66 | SSAB ANNUAL REPORT 2006
N O T E S
7 TANGIBLE ASSETS, CONTINUATION

SSAB ANNUAL REPORT 2006 | 67
N O T E S
Long-termOther receivables, Other Total Participations
Group shares and affiliated long-term financial in affiliated SEK millions participations companies receivables assets companies
Book value at beginning of year 6 26 9 41 381Investments – – 0 0 –Sales/amortisation – – 26 0 – 26 – 168Shares in profits after tax – – – – 136Dividends – – – – – 54Translation differences 0 – 0 0 – 12
Book value at year-end 6 – 9 15 283
Other shares and participations consist primarily of unlisted holdings and are included in the category of financial assetsvalued at fair value via the profit and loss account. The book value is assumed to correspond to the fair value.
Long-term receivables from affiliated companies and other long-term receivables are receivables which are not intended to be traded, valued at accrued acquisition value.
All of the affiliated companies are unlisted. The year’s sale of affiliated companies relates to the 25% stake in Cogent Power.
Shares Shares in Other shares Total Parent Company in sub- affiliated shares and financial SEK millions sidiaries companies participations assets
Acquisition value at beginning of year 2,253 51 3 2,307Investments – – – –Sales/amortisation – – – –
Residual value according to plan, Dec. 31, 2006 2,253 51 3 2,307
BookCompany Registered Holdings, value, SEK
Shares and Participations reg. number office number %2) millions
Parent Company’s shares and participations in subsidiariesSwedish operating subsidiaries:Plannja AB 556121-1417 Luleå 80,000 100 16SSAB Oxelösund AB 556313-7933 Oxelösund 1,000 100 450SSAB Tunnplåt AB 556313-7941 Borlänge 1,000 100 1,500Tibnor AB 556004-4447 Stockholm 850,000 85 283
Foreign operating subsidiaries 1) 3
Dormant subsidiaries 1
Total 2,253
A complete specification of other shares and participations is available from SSAB’s Group headquarters in Stockholm.The percentages indicate the equity share which, in all cases, also corresponds to the share of the voting capital.
8 FINANCIAL ASSETS
1)2)
Continuation of note 8 on next page.

BookCompany Registered Holdings, value, SEK
Shares and Participations reg. number office number %2) millions
Parent Company’s shares in affiliated companiesLulekraft AB Luleå 100,000 50 10Norsk Stål A/S Norway 31,750 50 29Norsk Stål Tynnplater A/S Norway 13,250 50 12
Total, Parent Company’s shares in affiliated companies 51
Subsidiaries’ shares and participations in affiliated companiesOxelösunds Hamn AB Oxelösund 50,000 50 55
Equity shares in affiliated companies’ equity in excess of the book value in the Parent Company 177
Total, Group participations in affiliated companies 283
Parent Company’s other shares and participationsTenant-owner apartments 3
Total 3
Subsidiaries' other shares and participations 1) 3
Total, Group’s other shares and participations 6
A complete specification of other shares and participations is available from SSAB’s Group headquarters in Stockholm.
The percentages indicate the equity share which, in all cases, also corresponds to the share of the voting capital.
8 FINANCIAL ASSETS, CONTINUATION
1)2)
68 | SSAB ANNUAL REPORT 2006
N O T E S
Group Parent CompanySEK millions 2006 2005 2006 2005
Raw materials, consumables, and semi-finished goods 2,401 3,019 – –Work in progress 313 234 – –Stocks of finished goods 4,237 3,533 – –Advances to suppliers 0 2 – –
Total 6,951 6,788 – –
SEK 733 (789) million of the inventory value is valued at net realizable value.
The share of inventories which is booked as an expense is included in the item “Cost of goods sold” and amounts to
SEK 22,468 million.
9 INVENTORIES
10 PRE-PAID EXPENSES AND ACCRUED REVENUEGroup Parent Company
SEK millions 2006 2005 2006 2005
Delivered, non-invoiced goods and services 22 29 1 –Bonuses, discounts, licences, and suchlike 36 28 – –Pre-paid rents 24 28 1 1Accrued interest revenue 2 10 2 10Hedged purchase orders, coal and iron ore 54 – – –Freight support 8 6 – –Unsettled insurance indemnification, etc. 114 117 1 1
Total 260 218 5 12

SSAB ANNUAL REPORT 2006 | 69
N O T E S
Other current interest-bearing receivables Group Parent CompanySEK millions 2006 2005 2006 2005
Short-term investments (terms to maturity in excess of three months) 495 895 495 895Current part of receivables from SPP/Alecta funds – 50 – 32Other – 1 – –
Total current interest-bearing receivables 495 946 495 927
Liquid assets Group Parent CompanySEK millions 2006 2005 2006 2005
Cash and bank balances 773 494 374 251Short-term investments (terms to maturity of less than three months) 600 390 600 390
Total liquid assets 1,373 884 974 641
All short-term investments are included in the category of holdings for trading and are valued at fair value via the profit andloss account. Short-term investments with terms to maturity of less than three months consist of day deposits at banks, whilethose with terms to maturity in excess of three months mature in April 2007 and carry a rate of interest of 3.153%.
11 OTHER CURRENT INTEREST-BEARING RECEIVABLES/LIQUID ASSETS
The share capital amounts to SEK 2,280 (2,273) million, divided into 259.1 (90.9) million shares, with a quotient value of SEK 8.80 (25) per share. 192.6 (67.2) million of the shares are Class A shares while 66.5 (23.7) million are Class B shares. All shares are unrestricted shares. Each Class A share entitles the holder to one vote, while each Class B share entitles theholder to one-tenth of one vote. No shares are owned by the Company itself or its subsidiaries.
Change in shares/share capital 2006 2005Number Share Number Share
of shares capital, of shares capital,(millions) SEK millions (millions) SEK millions
Opening balance, January 1 90.9 2,273 100.9 2,522Redemption of shares *) – 4,5 – 114 – 10.0 – 249Bonus issue – 121 – –3:1 split 172.7 – – –
Closing balance, December 31 259.1 2,280 90.9 2,273
During 2006, the shareholders were invited to submit every twentieth share for redemption at a price of SEK 485. In total, justover 4.5 million shares were submitted for redemption. The redemption amount of SEK 2,205 million was paid out on June 19.
The average number of shares amounted to 265.5 (285.7) million.
Other contributed funds amount to SEK 553 (560) million and consist of funds paid in by the shareholders in connection withnew issues, in excess of the nominal value of the shares.
Exchange rate differences which arise upon translation of the balance sheets of foreign subsidiaries into Swedish kronor aretransferred to the translation reserve. Exchange rate differences in conjunction with the translation of loans or other financialinstruments taken up in order to hedge the exchange rate of net assets of foreign subsidiaries are also transferred to thetranslation reserve.
The accumulated translation differences amount to SEK –49 (30) million.
Changes in the translation reserve GroupSEK millions 2006 2005
Opening balance, January 1 30 – 27Translation of foreign subsidiaries and affiliated companies – 79 57
Closing balance, December 31 – 49 30
The proposed but as yet not resolved upon dividend for 2006 amounts to SEK 1,166 (818) million, equal to SEK 4.50 (3.00)per share. The amount has not been reported as a liability.
12 EQUITY
*)
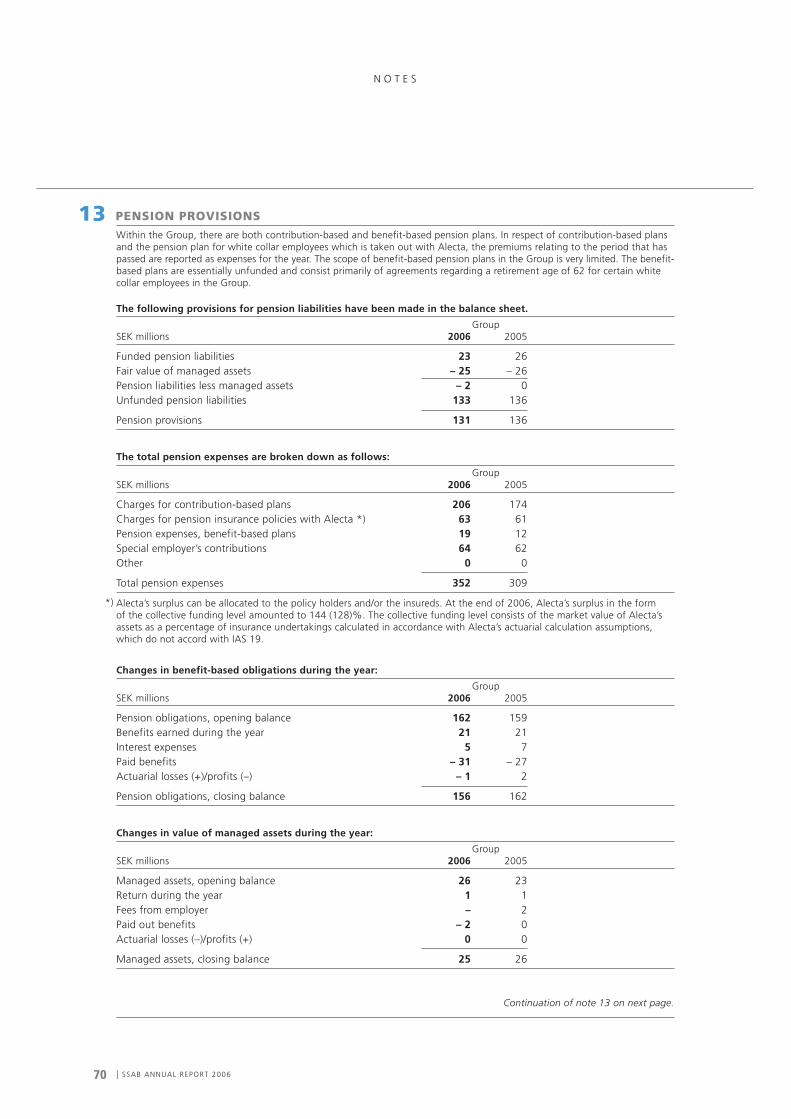
70 | SSAB ANNUAL REPORT 2006
13 PENSION PROVISIONS
Within the Group, there are both contribution-based and benefit-based pension plans. In respect of contribution-based plansand the pension plan for white collar employees which is taken out with Alecta, the premiums relating to the period that haspassed are reported as expenses for the year. The scope of benefit-based pension plans in the Group is very limited. The benefit-based plans are essentially unfunded and consist primarily of agreements regarding a retirement age of 62 for certain whitecollar employees in the Group.
The following provisions for pension liabilities have been made in the balance sheet.
GroupSEK millions 2006 2005
Funded pension liabilities 23 26Fair value of managed assets – 25 – 26Pension liabilities less managed assets – 2 0Unfunded pension liabilities 133 136
Pension provisions 131 136
The total pension expenses are broken down as follows:
GroupSEK millions 2006 2005
Charges for contribution-based plans 206 174Charges for pension insurance policies with Alecta *) 63 61Pension expenses, benefit-based plans 19 12Special employer’s contributions 64 62Other 0 0
Total pension expenses 352 309
Alecta’s surplus can be allocated to the policy holders and/or the insureds. At the end of 2006, Alecta’s surplus in the form of the collective funding level amounted to 144 (128)%. The collective funding level consists of the market value of Alecta’sassets as a percentage of insurance undertakings calculated in accordance with Alecta’s actuarial calculation assumptions,which do not accord with IAS 19.
Changes in benefit-based obligations during the year:
GroupSEK millions 2006 2005
Pension obligations, opening balance 162 159Benefits earned during the year 21 21Interest expenses 5 7Paid benefits – 31 – 27Actuarial losses (+)/profits (–) – 1 2
Pension obligations, closing balance 156 162
Changes in value of managed assets during the year:
GroupSEK millions 2006 2005
Managed assets, opening balance 26 23Return during the year 1 1Fees from employer – 2Paid out benefits – 2 0Actuarial losses (–)/profits (+) 0 0
Managed assets, closing balance 25 26
*)
N O T E S
Continuation of note 13 on next page.

SSAB ANNUAL REPORT 2006 | 71
14 DEFERRED TAX LIABILITIES AND TAX CLAIMSDeferred tax liabilities and tax claims Group Parent CompanySEK millions 2006 2005 2006 2005
Deferred tax liabilities have arisenthrough accelerated depreciation of fixed assets 1,303 1,361 – –through other temporary differences – 1 0 – –
Total deferred tax liabilities 1,302 1,361 – –
Deferred tax claims have arisenthrough pension provisions 44 44 1 1through non-utilised losses carried forward 3 9 – –through other temporary differences 23 30 – –
Total deferred tax claims 70 83 1 1
Deferred tax on retained earnings in subsidiaries and affiliated companies is not taken into consideration. To the extent profitsare transferred to the Parent Company, such transfer is normally exempt from taxation. To the extent such a transfer is notexempt from taxation, the Parent Company determines the date of such a transfer and such a transfer will not take placewithin the foreseeable future.
Changes in deferred tax liabilities Group Parent CompanySEK millions 2006 2005 2006 2005
Opening balance 1,361 1,505 – –Changes against result – 58 – 124 – –Changes against equity 0 – 19 – –Change through sale of subsidiary 0 0 – –Translation difference – 1 – 1 – –
Closing balance 1,302 1,361 – –
Changes in deferred tax claims Group Parent CompanySEK millions 2006 2005 2006 2005
Opening balance 83 67 1 0Changes against result – 12 15 0 0Changes against equity 0 0 – –Change through sale of subsidiary 0 0 – –Translation difference – 1 1 – –
Closing balance 70 83 1 1
N O T E S
Actuarial calculation assumptionsThe actuarial calculation of pension obligations and pension expenses is based on the following assumptions.
% 2006 2005
Discount rate 4.0 4.0Inflation 2.0 2.0Anticipated increase in salaries 2.5 2.5Personnel turnover 1.0 1.0Increase in income-base amount 2.5 2.5Return on managed assets 5.5 5.5
13 PENSION PROVISIONS, CONTINUATION

72 | SSAB ANNUAL REPORT 2006
N O T E S
Continuation of note 16 on next page.
Long-term interesting-bearing liabilities Group Parent CompanySEK millions 2006 2005 2006 2005
Foreign loans 0 1 – –Bonds (Euroloan) (effective interest rate 3.85%) 144 291 144 291MTN programme 1) 900 1,250 900 1,250Financial leasing agreements 56 62 – –Other 1 32 – –
Total 1,101 1,636 1,044 1,541
Less amortisation, 2007 and 2006 – 251 – 497 – 244 – 491
Total long-term interesting-bearing liabilities 850 1,139 800 1,050
Specification of MTN programme:
Issued/ Interest rate Interest rate Outstanding, MSEKmatures Loan (nominal) % (effective) % 2006 2005
Fixed interest2000-2007 No. 109 6.50 6.50 100 1002001-2006 No. 112 6.00 6.00 – 2002001-2008 No. 113 6.40 6.40 150 1502001-2006 No. 114 6.05 6.05 – 1502003-2008 No. 117 4.30 4.30 50 502003-2008 No. 118 4.345 4.345 100 1002003-2008 No. 119 4.312 4.312 100 1002003-2009 No. 120 5.30 5.30 100 100
Variable interest2002-2008 No. 115 Stibor +0.625 3.05 150 1502002-2010 No. 116 Stibor +0.75 3.21 150 150Total MTN-programme 900 1,250
16 INTEREST-BEARING LIABILITIES
1)
Other provisions Group Parent CompanySEK millions 2006 2005 2006 2005
Opening balance 71 70 – –Reported in the profit and loss account – – – –Additional provisions 4 6 – –Utilised during the year – 12 – 5 –Translation difference 0 – – –
Closing balance 63 71 – –of which reported as
Other long-term provisions 23 71 – –Current provisions 40 – – –
“Other provisions” consist primarily of provisions for guarantee commitments and complaints as well as estimated loss contracts.
15 OTHER PROVISIONS

SSAB ANNUAL REPORT 2006 | 73
N O T E S
18 NET DEBTGroup Parent Company
SEK millions 2006 2005 2006 2005
Cash and bank balances 773 494 374 251Short-term investments 600 390 600 390Short-term investments > 3 months 495 895 495 895Receivables from subsidiaries – – 8,828 5,703Current tax claims 37 24 – –Other receivables 6 84 3 32Interest-bearing assets 1,911 1,887 10,300 7,271
16 INTEREST-BEARING LIABILITIES, CONTINUATION
Continuation of note 18 on next page.
Repayment of Long-term Interest-Bearing LiabilitiesSEK millions 2007 2008 2009 2010 2011 Later
Group 251 556 106 156 6 26Parent Company 244 550 100 150 – –
Amounts falling due for interest rate renegotiationSEK millions 2007 2008 2009 2010 2011 Later
Group 551 406 106 6 6 26Parent Company 544 400 100 – – –
Current interest-bearing liabilities Group Parent CompanySEK millions 2006 2005 2006 2005
Current part of long-term liabilities 251 497 244 491Overdraft facilities 55 119 31 90
Total current interest-bearing liabilities 306 616 275 581
Loan debts are valued at the accrued acquisition value. Currency risks associated with foreign loans and bonds (which areissued in Euro) are hedged through currency swaps. Both the currency part of the loan and the currency swaps are regularlyvalued at fair value and changes in value are reported in the profit and loss account.
In order to reduce the total average fixed interest rate period of the loans, the fixed interest for one of the MTN loans, no. 117,has been converted into variable interest through an interest rate swap. Both the interest rate swap and the MTN loan are valuedat fair value and changes in value are reported in the profit and loss account.
17 ACCRUED EXPENSES AND DEFERRED REVENUE
Group Parent CompanySEK millions 2006 2005 2006 2005
Accrued personnel expenses 1,001 905 14 17Non-invoiced goods and services received 181 181 – –Accrued interest expenses 15 41 15 40Accrued discounts, bonuses, and complaints 50 34 – –Hedge-accounted purchasing orders, coal and iron ore – 31 – –Expenses accrued vis-à-vis affiliated companies 60 29 – –Energy taxes 12 15 – –Accrued insurance expenses 20 – – –Other items 93 141 3 26
Total 1,432 1,377 32 83

Group Parent CompanySEK millions 2006 2005 2006 2005
Current interest-bearing liabilities 306 616 275 581Long-term interest-bearing liabilities 850 1,139 800 1,051Pension provisions 131 136 6 5Liabilities to subsidiaries – – 1,145 1,067Current tax liabilities 448 403 1 142Interest-bearing liabilities 1,735 2,294 2,227 2,846
Net debt – 176 407 – 8,073 – 4,425
74 | SSAB ANNUAL REPORT 2006
19 AVERAGE NUMBER OF EMPLOYEES, GENDER BREAKDOWN, AND SICK LEAVE
N O T E S
1)2)
No. of employees Women, %2006 2005 2006 2005
Parent companySweden 20 18 42 32
Total Parent Company 20 18 42 32
SubsidiariesSweden 7,860 7,985 17 17Canada 41 45 10 9Denmark 140 138 24 25Finland 131 125 25 25Germany 39 40 39 33Great Britain 47 47 33 34Italy 57 57 23 27Norway 32 33 22 20Poland 110 92 24 27South Africa 106 103 17 17USA 33 32 21 22Other countries < 20 employees 121 117 36 28
Total, subsidiaries 8,717 8,814 18 18
Total, Group 8,737 8,832 18 18
The figures are based on a normal number of working hours per year in different production areas. Consideration has been given,among other things, to different forms of shift work. The percentage of women relates to the number of employees on December 31.
Women accounted for 4 (3)% of the members of all Boards of Directors in the Group, while the figure for the Parent Company’sBoard of Directors was 9 (9)%. The percentage of women in management groups (including Presidents) in the Group amountedto 9 (6)%. Group Management comprises four men and one woman.
Personnel sick leave Group 1) Parent Company 2)(% of ordinary work time) 2006 2005 2006 2005
Total sick leave absence 6.5 6.5 0.8 1.2of which 60 days or more 62.2% 63.3% 0% 0%
Sick leave absence per groupwomen 9.9 9.4 0.9 2.4men 5.8 6.0 0.7 0.8aged 29 and younger 3.5 3.2aged 30–49 5.8 5.8aged 50 and older 8.2 8.4
Relates to the Group’s employees in Sweden.Sickness in the Parent Company is reported only as a total and by gender since there are only 26 employees..
18 NET DEBT, CONTINUATION

SSAB ANNUAL REPORT 2006 | 75
N O T E S
Operational leasing Group Parent CompanySEK millions 2006 2005 2006 2005
Minimum leasing charges during the year 45 45 4 4
The agreed minimum leasing charges relating to operational leasing agreements that cannot be terminated amount to SEK 48 million for 2007; a total of SEK 115 million for 2008–2011; and to SEK 53 million for the years after 2011. Operational leasing includes leases for property, premises, and rolling stock for transportation in the steel operations.
Financial leasing Group Parent CompanyMkr 2006 2005 2006 2005
Minimum leasing charges for the year 12 12 – –
Agreed minimum leasing charges amount to SEK 12 million for 2007; a total of SEK 31 million for 2008–2011; and to SEK 49 million for the years after 2011. The present value of financial leasing liabilities amounts to SEK 48 (62) million.Financial leasing includes a switchgear and rolling stock for transportation in the steel operations.
20 LEASING
Group Parent CompanySEK millions 2006 2005 2006 2005
For own long-term liabilities Real property mortgages 9 9 – –Floating charges 20 22 – –
Total for own long-term liabilities 29 31 – –
Other pledged assetsReal property mortgages 30 30 – –
Total other pledged assets 30 30 – –
Total pledged assets 59 61 – –
21 PLEDGED ASSETS
Group Parent CompanySEK millions 2006 2005 2006 2005
Guarantees 0 1 0 0Guarantees for subsidiaries’ obligations – – 105 107Other contingent liabilities 88 77 58 71
Total contingent liabilities 88 78 163 178
SSAB Tunnplåt is involved in a dispute with an insurance company concerning a blast furnace breakdown in 1997. In 2006,judgment was given in a first instance in favour of SSAB Tunnplåts. However, the opposing party will pursue the matter further.According to the judgment, SSAB Tunnplåts’ claim against the insurance company amounts to just over SEK 170 million plusinterest, in addition to the sum of SEK 110 million that has already been paid out. The insurance company’s counterclaim is forrepayment of the SEK 110 million. In the balance sheet, consideration has been given to the assessed outcome of the dispute.The claim corresponding to the assessed outcome of the dispute is reported among “Prepaid expenses and accrued revenue”.(See Note 10, the item “Unsettled insurance indemnification, etc.”). No contingent liabilities have been reported.
The Group is otherwise involved in a very limited number of legal disputes concerning bankruptcy matters, warranties andcomplaints. The anticipated outcome of these cases has been taken into consideration in the accounting.
22 CONTINGENT LIABILITIES

Financial itemsThe cash flow statement is based on the financial items included in the profit and loss account. The adjustment from bookedinterest to paid interest takes place through the change in accrued interest being represented by changes in working capital.The interest payments amount to:
Paid interest Group Parent CompanySEK millions 2006 2005 2006 2005
Interest received during the period 78 80 196 168Interest paid during the period – 118 – 141 – 125 – 139
Exchange rate differences regarding liquid assetsExchange rate differences on opening liquid assets in foreign subsidiaries are included in the item ‘Other Financing’ in the amount of – 8 12 – –
76 | SSAB ANNUAL REPORT 2006
N O T E S
23 CASH FLOW STATEMENT
During the year, no operations were acquired or sold. Two property-owning subsidiaries, Tibnor Dalarna and A. Nicklasson, were sold during the year,. The value of assets and liabilities sold in 2006 amounted to:
SalesSEK millions 2006 2005
Fixed assets 50 –Accounts receivable 3 –Pre-paid expenses and accrued revenue 0 –Other receivables 2 –Liquid assets – –Deferred tax 0 –Accounts payable – 36 –Accrued expenses and deferred revenue – 3 –Other liabilities – 1 –Booked profit on the sale 87 –
Received purchase price *) 102 1,425
Liquid assets in the sold companies 0 –
Affect on the Group’s liquid assets 102 1,425
In 2005, the purchase price for the sale of SAB HardTech was received.
In 2006, the 25% stake in the affiliated company, Cogent Power, was also sold, thereby contributing SEK 248 million to liquidity.
24 ACQUISITION/SALE OF OPERATIONS AND SUBSIDIARIES
*)

SSAB ANNUAL REPORT 2006 | 77
Business Areas
Sales and results per business area
Total of which Operating Profit after Return onSales internal Profit 3) financial Capital
sales Items 3) Employed, %SEK millions 2006 2005 2006 2005 2006 2005 2006 2005 2006 2005
Business Areas:Sheet Division 15,316 14,219 2,756 2,615 2,856 3,175 2,785 3,128 34 40Plate Division 9,941 9,135 2,915 2,460 2,234 1,994 2,193 1,957 40 39Plannja 1,482 1,377 2 4 114 80 110 76 30 20Tibnor 9,202 7,423 40 37 776 426 783 428 50 27Other 949 868 0 0 63 47 64 48
Parent Company units:Parent Company 1) – – – – – 109 – 74 – 5 – 53Affiliated Companies 2) – – – – 144 87 144 87
Group adjustment – 5,836 – 5,218 – 5,713 – 5,116 – 24 0 – 22 0
Total 31,054 27,804 – – 6,054 5,735 6,052 5,671 36 34
Excluding dividends from subsidiaries and excluding capital gains on sales of subsidiaries. The profit in the Parent Companyconsists primarily of administration expenses and a positive figure for financial items.Relates to the participations owned by the Parent Company in the affiliated companies, Lulekraft, Norsk Stål and Norsk Stål Tynnplater.Operating profit and profit after financial items includes shares in the results of affiliated companies in the amount of SEK 83 (–1) million for the Sheet Division and SEK 12(9) million for the Plate Division.
Balance sheet and cash flow information per business area
Assets Liabilities Depreciation Investments Cash flowSEK millions 2006 2005 2006 2005 2006 2005 2006 2005 2006 2005
Business Areas:Sheet Division 1) 11,382 10,631 6,089 5,109 504 499 586 463 + 2,105 + 1,571Plate Division 7,807 7,235 4,064 4,377 362 348 729 303 + 1,079 + 595Plannja 687 502 435 270 30 31 41 26 + 150 + 95Tibnor 2,967 2,540 1,525 1,338 62 66 44 54 + 409 + 426Other 256 420 169 354 5 4 6 7 + 20 + 16
Parent Company:Parent Company 9,344 9,785 2,461 3,128 0 0 1 0 + 31 + 102Sold operations 2) – – – – – – – – – + 1,425
Group adjustment – 9,648 – 9,293 – 7,499 – 7,120 – 3 – – – –
Total 22,795 21,820 7,244 7,456 963 951 1,407 853 + 3,794 + 4,230
The cash flow for 2006 includes the purchase price received for Cogent Power in the amount of SEK 248 million.“Sold operations” refers to the purchase price received for SSAB HardTech.
N O T E S
25 SEGMENTS
1)
2)
3)
1)2)
Continuation of note 25 on next page.

78 | SSAB ANNUAL REPORT 2006
Geographic areasThe Group’s export sales are focused primarily on Europe. However, as a consequence of growth in the Group’s nicheproducts, sales on more distant markets are increasing. Only a small portion of the Group’s steel products are manufacturedoutside Sweden and thus investments abroad are small.
The table below shows the breakdown of the Group’s sales per country/region, irrespective of where the products aremanufactured.
SEK millions 2006 % 2005 %
Sweden 11,289 36 9,988 36Germany 2,507 8 2,446 9Denmark 2,093 7 1,767 6Italy 1,968 6 1,962 7Finland 1,960 6 1,608 6Benelux countries 1,143 4 1,132 4Great Britain 1,076 4 1,072 4Poland 901 3 744 3France 653 2 657 2Other EU countries 2,003 7 1,669 6Norway 979 3 886 3Other European countries 529 2 418 1North America 1,810 6 1,598 6China 771 2 468 2Other Asian countries 728 2 791 3Other markets 644 2 598 2
Total 31,054 100 27,804 100
The table below shows the reported value of assets and investments broken down by geographic areas according to thelocation of the assets.
Assets InvestmentsSEK millions 2006 % 2005 % 2006 % 2005 %
Sweden 20,191 89 19,371 89 1,367 97 800 94EU-25 (excl. Sweden) 1,825 8 1,734 8 30 3 38 4Other European countries 92 0 20 0 3 0 0 0North America 371 2 488 2 6 0 5 1Asia 235 1 109 1 1 0 2 0Rest of the world 81 0 98 0 0 0 8 1
Total 22,795 100 21,820 100 1,407 100 853 100
N O T E S
25 SEGMENTS, CONTINUATION

SSAB ANNUAL REPORT 2006 | 79
Financial risk management is governed by the Group’s financepolicy. Most financial transactions take place through theParent Company's finance division.
Currency risksThe Group’s currency risks are handled by the Parent Com-pany. The aim of the management of transaction exposure is to reduce the effects on contracted flows of changes inexchange rates. Thus, subsidiaries hedge their sales and pur-chases in foreign currency with the Parent Company whenthe currency risk arises. In most cases, this occurs upon thesigning of the order. To the extent the Parent Company isunable to match the flows, the remaining currency risks arecovered through futures contracts. Since orders in hand inthe steel operations normally correspond only to six-sevenweeks’ production, the Group’s currency policy means thatchanges in exchange rates affect the Group’s results relativelyquickly. On the purchasing side, however, currency futuresare, on average, for a longer term. The sensitivity analysis onpage 27 shows the amount by which changes in exchangerates affect the Group’s profits and earnings per share.
Sales on export markets take place primarily in localcurrencies. Export sales create currency inflows, primarily inEUR but also in USD and other European currencies. Inflowsof other currencies are relatively limited.
Purchases of, primarily, iron ore and coal, take place inUSD. In addition, there are currency outflows as a con-sequence of major investments, which partly take place in foreign currencies, primarily EUR.
All in all, this means that the Group has a net outflow of USD and a net inflow of other currencies. The net inflowof foreign currencies amounted to SEK 6,900 (6,400) million.The Group’s most important currency flows are shown in the diagram on page 20.
Net investments in the form of equity in foreign subsidi-aries and affiliated companies amount to almost 8% of theGroup’s total equity and thus the translation exposure isrelatively limited. In addition, the exposure is limited due tothe fact that major net investments in foreign subsidiariesand affiliated companies are hedged, primarily throughborrowing in the same currency.
Currency risks that arise in conjunction with borrowing inforeign currency are hedged up to the principal amount.
Financing risk and liquidity riskBorrowing is focused on securing the Group’s needs for loanfinancing and takes place primarily in the Parent Company.Of the total borrowing of SEK 1,156 (1,755) million, only 7 (7)% consists of financing which takes place directlybetween subsidiaries and an external lender. These casesprimarily involve the assumption of liabilities in acquiredcompanies and financial leasing.
A Swedish MTN (Medium Term Note) Programme is usedfor borrowing for terms of up to ten years, whilst a SwedishCommercial Paper Programme is used for borrowing forshorter terms. In each of these programmes there is a limitof SEK 2,000 million. In addition, there is a Euro CommercialPaper Programme of MUSD 100 which, however, was notutilised during the year. The Swedish Commercial Paper Programme is rated by Standard & Poor’s at K-1 and theMTN programme at BBB+. At year-end, borrowing within the MTN Programmes amounted to SEK 900 (1,250) million.The Swedish Commercial Paper Programme was not utilisedduring the year.
At year-end, long-term borrowing amounted to SEK 1,101(1,636) million and had an average term to maturity of 2.0
(2.2) years. The maturity structure in the coming years ispresented in Note 16.
Liquidity in the subsidiaries is handled through a centralGroup account system or in local cash pools. Excess liquidityis used primarily to reduce debts. At year-end, liquid assetsincluding short-term investments amounted to SEK 1,868(1,779) million, of which SEK 495 (895) million consisted ofshort-term investments with a term to maturity in excess ofthree months on the date of acquisition, which are thus notincluded among liquid assets in the balance sheet.
Binding credit facilities are in place to minimise the riskthat the raising of capital in the future will become difficultor expensive. The Group’s liquidity reserves consisting ofliquid assets, short-term investments and non-utilised bindingcredit facilities amounted at year-end to SEK 3,720 (3,655)million, corresponding to 12 (13)% of sales.
Interest rate risks The Group’s interest rate risks relate to changes in marketinterest rates and their impact on debts and investments.Long-term borrowing via the MTN Programme or on theprivate investment market takes place primarily at fixedinterest rates during the loan term. The fixed interest periodson borrowing may be varied within established risk limitsthrough use of interest rate swaps.
At year-end, the Group’s total loan debts amounted to SEK 1,156 (1,755) million with an average fixed interestperiod of 3.3 (3.2) years. Loans that fall due for interest raterenegotiation in the coming years are set forth in Note 16.
The Group’s interest-bearing assets amounted to SEK1,911 (1,887) million and consisted almost entirely of short-term investments at variable rates of interest.
Credit risksCredit risks arise in conjunction with the investment of liquid assets and as counterparty risks in conjunction withderivative transactions. In order to limit the credit risks, maximum permitted counterparty risks are established withrespect to approved counterparties. An approved counter-party must have a credit rating of not less than A- fromStandard & Poor’s or A3 from Moody’s. When calculating the counterparty risk, exchange rate profits are set offagainst exchange rate losses if agreements in accordancewith the International Swaps and Derivatives Association are involved. The total counterparty risks in derivatives atyear-end amounted to SEK 157 (131) million.
The excess liquidity is invested in treasury bills or certificatesof deposit with short terms to maturity.
In addition to the above, there are credit risks associatedwith accounts receivable; these do not fall under financialrisk management but, rather, are handled in the respectivesubsidiaries. The risks are, however, spread out over a largenumber of customers. In addition, individual credit ratingtests are conducted and limits imposed for each customer.
InsuranceAll industrial operations are associated with risks that mustbe taken into consideration, managed, and prevented. Themost prominent risks are personal injury, damage to property,and risks of financial losses as a consequence of the occur-rence of insured events. The Group purchases insurance tocover these types of risks. The Group’s financial position issuch that insurance shall primarily consist of catastrophecover. This entails insurance solutions with reasonably highlevels of excess.
N O T E S
26 FINANCIAL RISK MANAGEMENT
Continuation of note 26 on next page.

80 | SSAB ANNUAL REPORT 2006
N O T E S
Valuation of Financial InstrumentsCurrency derivatives and interest rate swaps According to the financing policy, currency hedging is alwaysused in connection with the signing of purchase and salesorders and in conjunction with hedging of foreign loans toSwedish kronor. Currency derivatives are used solely to hedgecurrency risks and all currency derivatives are valued at fairvalue in the balance sheet.
In order for currency hedging to meet the requirementsfor hedge accounting in accordance with IAS 39, changes in value of currency derivatives may not affect earnings but,rather, are set off against corresponding changes in value of the hedged order. Such accounting is currently appliedonly with respect to currency derivatives relating to coal andiron ore contracts.
With respect to other currency hedging, changes in thefair value of the currency derivative may affect earnings on a regular basis until the order is delivered.
At year-end, purchase and sales orders in respect of whichcurrency futures had been executed totalled SEK 10.1 (13.0)billion. Currency futures had an average outstanding termuntil expiry of 4.3 (4.3) months and, at year-end, had a bookedfair value of SEK +50 (+74) million, while hedge accountedpurchase orders were booked at SEK +54 ( 31) million,resulting in a net profit of SEK +104 (+43) million.
In addition to currency derivatives to hedge commercialflows, there is a currency swap to hedge the payment flowin Swedish kronor in respect of a bond issued in Euro. Thecurrency derivative is valued at fair value and, in accordancewith the rules relating to hedge accounting, the loan is alsovalued at fair value. Changes in value of currency derivativesand loans are reported net in the profit and loss account.
At present, cash flow hedging is not applied, nor is thereany hedging of net investments in foreign companies sincethese are of only a limited scope.
In order to reduce the fixed interest rate period on thetotal debt portfolio, one loan under the MTN programmewith fixed interest rate has been swapped to variable interestrate. According to IAS 39, changes in value of the swap maynot affect earnings but may be set off against correspondingchanges in value of the loan.
The conditions for a “fair value hedging” are fulfilled,entailing that changes in value of both the interest rateswaps and the two loans are reported in the profit and loss account.
Derivative values, December 31, 2006
SEK millions Assets Liabilities
Currency derivatives not subject to hedge accounting 174 70
Currency derivative for“fair value hedging” of flows – 54
Currency derivatives for “fair value hedging” of loans 1 –
Interest rate swaps forfor “fair value hedging” 0 –
Total derivatives reported in “Other current assets/liabilities” 175 124
Change in value of hedged assets (purchase orders) 54 –
Change in value of hedged debt (Euro loan) – 1
Change in value of hedged debt(MTN loan) – 0
Net 229 125
The net unrealised derivative values which affected earningsfor the year thus amounted to SEK +104 million. The change in value of hedged assets is reported among “Pre-paidexpenses and accrued revenue”.
Valuation of other financial assets and liabilities The table below shows the reported value compared withthe assessed fair value per type of financial asset and liability.
SEK millions Reported Fair value value
Financial assets1. Short-term investments 600 6002. Short-term investments (term to 495 495
maturity in excess of 3 months)3. Accounts receivable 4,926 4,926
Financial liabilities 4. Other short-term loans – 55 – 555. MTN programme – 900 – 9055. Bonds – 144 – 1446. Other financial liabilities – 57 – 577. Accounts payable – 2,362 – 2,362
1. Short-term investments consist of day deposits at bankswith short terms to maturity and the fair value is the same as the acquisition value.
2. Short-term investments with terms to maturity in excessof 3 months are classified as holdings for trading and arevalued at fair value with changes in value via the profit andloss account.
3. Accounts receivable are reported at the amount which isexpected to be received following an individual assessmentof bad debts. The net value of the accounts receivable beforewrite down for bad debts amounted to SEK 4,940 million.There is no concentration of credit risks since the Group hasa large number of customers spread throughout the world.
4. Other short-term loans consist primarily of overdraftfacilities, the acquisition value of which constitutes a fairapproximation of the fair value.
5.The MTN programme and bonds are reported at the acquisition value. Fair value has been calculated based onthe applicable rate of interest at the end of the year for the remaining terms to maturity.
6. Other financial liabilities consist of financial leasing debts,SEK 56 million, where the reported value is deemed to cor-respond to fair value.
In 2006, net exchange rate differences have been booked in the amount of SEK +111 (+200) million in “Operatingprofit” and in the amount of SEK +19 (–10) million in“Financial items”.
Changes in exchange rates between 2005 and 2006 haveaffected profit in the amount of approx. SEK –200 (300)million, primarily due to the fact that raw materials costs arelargely dollar based; however, this effect on profit is primarilyfelt as higher raw materials costs.
26 FINANCIAL RISK MANAGEMENT, CONTINUATION

Important assessments upon application of the accounting principles In the steel operations’ industrial areas, there is a need forfuture land clean up. In accordance with applicable rules, suchclean up will become relevant only when SSAB ceases toconduct operations in the area. At present, it is not possibleto assess if and when operations will cease and, accordingly,no provision has been made for such land clean up.
Important sources of uncertainty in estimationsEstimations regarding the outcome of a dispute with aninsurance company concerning a blast furnace breakdown
in 1997 and a dispute against a bankruptcy estate are basedon assessments of future outcome.
A large portion of the Group’s pension obligations withrespect to white collar employees is benefit based and in-sured on a collective basis with Alecta. Since it is not possibleat present to obtain information from Alecta regarding theGroup’s share of the obligations and managed assets, thepension plan signed with Alecta is reported as a contribu-tions based plan. The funding level reported by Alecta at theend of the year does not indicate the existence of a deficit;however, it is not possible to obtain any detailed informationfrom Alecta regarding the amount of the pension liabilities.
SSAB ANNUAL REPORT 2006 | 81
N O T E S
27 CRITICAL ESTIMATIONS AND ASSESSMENTS
28 DEFINITIONS
SalesSales less deduction for value added tax, discounts, returns,and freight.
EquityTotal equity according to the consolidated balance sheet.
Capital employedTotal assets less non-interest-bearing current and long-termliabilities.
Liquid assetsCash and bank balances, as well as short-term investmentswith a term to maturity of less than three months on thedate of acquisition.
Net debtInterest-bearing liabilities less interest-bearing assets.
Return on equity after taxProfit for the year after taxes as a percentage of averageequity during the year.
Return on capital employed before taxOperating profit before participations in affiliated companiesplus financial revenue as a percentage of average capitalemployed during the year.
Equity ratioEquity as a percentage of total assets.
Net debt/equity ratioNet debt as a percentage of equity.
Cash flowFunds generated from ongoing operations including changein working capital and cash flow from investing activities. (In the cash flow statement, however, paid tax is adjustedinstead to the actual tax which will be paid, based on theprofit generated by the operations.)
Value addedSales and other operating revenue less depreciation andexpenses for purchased goods and services.
Earnings per shareProfit after taxes attributable to the Parent Company’s shareholders divided by the average number of shares.
P/E ratioShare price at year-end divided by earnings per share.
Equity per shareEquity, excluding minority interests, divided by number of shares at year-end.
Direct yieldDividend as a percentage of the share price at year-end.
29 CONSIDERATIONS IN CONJUNCTION WITH PROPOSED DISPOSITION OF PROFIT
At the 2007 Annual General Meeting, the shareholders must take a decision as regards the dividend proposed bythe Board of Directors.
At the end of 2006, the financial position is extremelystrong and there is a net indebtedness of SEK – 176 million.The Group’s retained earnings amount to SEK 12,551 millionand the Parent’s Company’s unrestricted equity amounts toSEK 7,170 million. Unrealised profits on the sale of financialinstruments reported at market value account for only SEK104 million of equity. Since the end of the year, nothing hasoccurred which has a material negative impact on theGroup’s financial position.
The Board of Directors believes that such a strong balancesheet is not required in order to secure the development of the operations in the medium term and will, therefore,propose to the Annual General Meeting that a dividend bepaid out of SEK 4.50 (3.00) per share, equal to SEK 1,166(818) million.
In the opinion of the Board of Directors, the proposedtransfer of value to the shareholders is thus defensible inlight of the demands placed by the operations with respectto the financial position.

Proposed disposition of profit
The amount at the disposal of the Annual General Meeting is as follows:
Retained earnings 458Net profit for the year 6,712
SEK million 7,170
The Board of Directors and the President recommend that the profit be allocated in the following manner:
Dividend to the shareholdersSEK 4.50 per share 1,166To be carried forward 6,004
SEK million 7,170
As reported in the consolidated balance sheet, the Group’s retained earnings amounted to SEK 12,551 (11,321) million.
The annual report has been prepared in accordance with generally accepted practice for stock market companies. As far as is known, the information provided corresponds with actual
circumstances and nothing of material significance has been excluded which might affect the impression of the Company as created by the annual report.
Stockholm, February 7, 2007
Sverker Martin-Löf Carl Bennet Anders G Carlberg Owe Jansson
Bert Johansson Marianne Nivert Anders Nyrén Ola Parten
Matti Sundberg Lars Westerberg Olof FaxanderPresident
Our Auditors’ Report was submitted on February 12, 2007PricewaterhouseCoopers AB
Claes DahlénAuthorised Public Accountant
82 | SSAB ANNUAL REPORT 2006
Proposed disposition of profit REPOR T OF THE D IRECTORS

SSAB ANNUAL REPORT 2006 | 83
To the general meeting of the shareholders of SSAB Svenskt Stål Aktiebolag (publ)Company no. 556016-3429.
We have audited the annual report, consolidated financial statements, accounting recordsand the administration by the Board of Directors and President of SSAB
Svenskt Stål Aktiebolag (publ) for 2006. The Company’s annual report includes the printed version of this document on pages 19–82. The Board of Directors and President
are responsible for the accounts and administration of the Company and for ensuring that the annual report is prepared in accordance with the Swedish Annual
Reports Act and that the international accounting standards, IFRS, as adoptedby the EU, are applied in conjunction with the preparation of the consolidated financial
statements. Our responsibility is to express an opinion on the annual report, the consolidated financial statements and administration based on our audit.
The audit has been conducted in accordance with Generally Accepted Auditing Standardsin Sweden. This entails that we have planned and performed the audit in order to
ensure with a high degree of certainty, however not absolutely, that the annual report and consolidated financial statements contain no material error. An audit includes examining, on a test basis, evidence supporting the amounts and disclosures in the
accounting documents. An audit also includes assessing the accounting principles used andtheir application by the Board of Directors and the President, as well as evaluating the
significant estimations made by the Board of Directors and President in the preparation ofthe annual report and the consolidated financial statements and an assessment of
the information compiled in the annual report and consolidated financial statements. As a basis for our opinion concerning discharge from liability, we have examined significant
decisions, actions taken, and circumstances in the Company in order to be able to determinethe liability to the Company, if any, of any Board Member or the President. We have alsoexamined whether any Board Member or the President has, in some other way, acted in
contravention of the Companies Act, the Annual Reports Act, or the Articles of Association.We believe that our audit provides a reasonable basis for our opinions set out below.
The annual report has been prepared in accordance with the Annual Reports Act and provides a true and fair view of the results and financial position of the Company in
accordance with Generally Accepted Accounting Principles in Sweden. The consolidatedfinancial statements have been prepared in accordance with the international accountingstandards, IFRS, as adopted by the EU and in accordance with the Annual Reports Act
and thereby provide a true and fair view of the results and financial position of the Group.The Report of the Directors is compatible with other parts of the annual report and the
consolidated financial statements.We recommend that the General Meeting adopt the profit and loss accounts and balancesheets for the Parent Company and the Group, allocate the profit of the Parent Company
in accordance with the proposal set forth in the Report of the Directors, and grant theBoard Members and President discharge from liability for the financial year.
Stockholm, February 12, 2007PricewaterhouseCoopers AB
Claes DahlénAuthorised Public Accountant
Auditor’s Report

84 | SSAB ANNUAL REPORT 2006
Group Headquarters
SSAB Svenskt StålBox 26208SE-100 40 StockholmPhone: Int. +46 8 45 45 700Fax: Int. +46 45 8 45 725Visiting address:Birger Jarlsgatan 58www.ssab.se
Swedish divisions and companies
PlannjaSE-971 88 LuleåPhone: Int. +46 920 929 00Fax: Int. +46 920 929 12www.plannja.com
Plannja SibaBox 143SE-570 81 JärnforsenPhone: Int. +46 495 175 00Fax: Int. +46 495 505 25www.plannja.com
SSAB MeroxSE-613 80 OxelösundPhone: Int. +46 155 25 44 00Fax: Int. +46 155 25 52 21www.merox.se
SSAB OxelösundSE-613 80 OxelösundPhone: Int. +46 155 25 40 00Fax: Int. + 46 155 25 40 73www.ssabox.com
SSAB TunnplåtHead Office:SE-781 84 BorlängePhone: Int.+46 243 700 00Fax: Int. +46 243 720 00Metallurgy:S-971 88 LuleåPhone: Int. +46 920 920 00Fax: Int. +46 920 927 14www.ssabtunnplat.com
TibnorBox 4260SE-102 66 StockholmPhone: Int. +46 8 702 40 00Fax: Int. +46 8 702 23 55www.tibnor.se
Foreign Subsidiaries
Australia
SSAB Swedish SteelP O Box 1443AU-Booragoon,WA 6954 (Perth)Phone: Int. +61 8 9315 5450Fax: Int. +61 8 9315 5451www.ssab.com.au
Austria
SSAB Swedish SteelLinke Bahnzeile 24AT-2483 EbreichsdorfPhone: Int. +43 2254 752 17Fax: Int. +43 2254 752 174www.ssab.at
Brazil
SSAB Swedish SteelRua Commendador de Araújo 565-cj. 704CEP 80420-000 Centro Curitiba-ParanáPhone: Int. +55 41 3014 9070Fax: Int. +55 41 3014 7733www.ssab.com.br
SSAB Swedish SteelRua Padre Garcia Velho 73-cj. 13CEP 05421-030 PinheirosSao Paolo-SPPhone: Int. +55 11 3032 0393Fax: Int. +55 11 3032 0393www.ssab.com.br
Canada
SSAB Swedish Steel1031 Cliveden AvenueCA-Delta, BCCanada V3M 5V1Phone: Int. +1 604 526 37 00Fax: Int. +1 604 526 01 77www.ssab.ca
Chile
SSAB Swedish SteelSanto Domingo 1160piso 11, Oficina 1101, SantiagoPhone: Int. +56 981882059Fax: Int. +56 28530271www.ssab.nu/cl
China
SSAB OxelösundRepresentative Office BeijingRoom BA1902, Vantone New World PlazaFuchengmenwaiCN-100037 BeijingPhone: Int. +86 10 6858 79 61/62Fax: Int. +86 10 6858 79 96www.ssab.cn
SSAB Swedish SteelBeijing Representative Office Room 330, Radisson SAS HotelNo. 6A East Beisanhuan RoadCN-10028 BeijingPhone: Int. +86 10 6466 34 41Fax: Int. +86 10 6466 34 42www.ssab.cn
SSAB Swedish SteelC.C. Wu Building, Room 2312302-308 Hennessy RoadWan ChaiHK-HongkongPhone: Int. +852 2564 07 82Fax: Int. +852 2563 21 02www.ssab.cn
Czech Republic
SSAB Swedish SteelSpartakovcu 3CZ-708 15 Ostrava-Poruba Phone: Int. +420 596 939 487Fax: Int. +420 596 939 486www.ssab.cz
SSAB Swedish SteelTr. Kapitane Jaarose 37aCZ-60200 BrnoPhone: Int. +420 545 422550/552/553Fax: Int. +420 545 210 550www.ssab.cz
Denmark
PlannjaPostboks 727DK-9100 AalborgPhone: Int. +45 98 10 11 11Fax: Int. +45 98 10 10 01www.plannja.com
SSAB Svensk StålPostboks 130DK-2605 BröndbyPhone: Int. +45 43 20 50 00Fax: Int. +45 43 20 15 18www.ssab.dk
Estonia
SSAB Swedish SteelTule 22EE-76505 SauePhone: Int. +372 6 709 007Fax: Int. +372 6 709 007www.ssab.ee
Finland
SSAB Svenskt StålFredriksgatan 63 A 11FI-00 100 HelsinkiPhone: Int. +358 9 686 60 30Fax: Int. +358 9 693 21 20www.ssab.fi
PlannjaTerästie 8FI-54 100 JoutsenoPhone: Int. +358 5 610 55 00Fax: Int. +358 5 610 56 00www.plannja.com
France
SSAB Swedish Steel114, Avenue Charles de GaulleFR-92522 Neuilly sur Seine CedexPhone: Int. +33 1 5561 91 00Fax: Int. +33 1 5561 91 09www.ssab.fr
Germany
SSAB Swedish SteelGrafenberger Allee 87DE-40237 DüsseldorfPhone: Int. +49 211 91250Fax: Int. +49 211 9125 129www.ssab.de
SSAB Swedish SteelImmenhoferstrasse 19-21DE-70180 StuttgartPhone: Int. +49 711 68 78 40Fax: Int. +49 711 68 78 413www.ssab.de
Greece
SSAB Swedish Steel 18, Kaitezdistr.PanoramaGR-552 36 ThessalonikiPhone: Int. +30 2310 347 273Fax: Int. +30 2310 347 271www.ssab.gr
Hungary
SSAB Swedish Steel TradingLövér Krt. 31/AHU-9400 SopronPhone: Int. +36 99 51 05 10Fax: Int. +36 99 51 05 11www.ssab.hu
Indonesia
SSAB Swedish SteelGraha Family P 110Surabaya-60227East JavaPhone: Int. +62 31 297 5207Fax: Int. +62 31 297 5207www.ssab.com.id
Addresses

SSAB ANNUAL REPORT 2006 |
Italy
SSAB HARDOX LamierePiazza EuropaInterporto di ParmaIT-43010Loc.Bianconese-Fontevivo (PR)Phone: Int. +39 0521 61 88 23/24Fax: Int. +39 0521 61 88 16www.ssab.it
SSAB Swedish Steel Via G. Di Vittorio No 6IT-250 16 GhediPhone: Int. +39 030 905 88 11Fax: Int. +39 030 905 89 30www.ssab.it
Japan
SSAB Swedish SteelKenchiku Kaikan 5 Fl5-26-20 Shiba, Minato-KuJP-Tokyo 108-0014Phone: Int. +81 3 3456 34 47Fax: Int. +81 3 3456 34 49www.ssab.jp
Korea, Republic
SSAB Swedish Steel2F, Koami New bld.13-6 Yoido-dongYoungdeungpo-kuKR-SoeulPhone: Int. +82 2 761 61 72Fax: Int. +82 2 761 61 73www.ssab.co.kr
SSAB TunnplåtKorea Branch8F, Koami New Building13-6 Yoido-dongYoungdeungpo-kuKR-SeoulPhone: Int. +82 2 369 7272Fax: Int. +82 2 3369 7279www.ssab.co.kr
Malaysia
SSAB Swedish Steel23, Jalan SB Indah 1/19DTaman Sungai Besi Indah433300 Seri KembanganSelangor, D.E. Phone: Int. +60 19334 1551Fax: Int. +60 38948 6962www.ssabox.com
Mexico
SSAB Swedish SteelAve Jose Vasconcelos 1507Officina 204, Col CentroMX-66231 San Pedro Garza GarciaNuevo LeónPhone: Int. +52 81 8192 9130Fax: Int. +52 81 8192 2120www.ssab.com.mx
The Netherlands
SSAB PrelaqP.O. Box 2NL-6640 AA BeuningenPhone: Int. +31 24 679 07 00Fax: Int. +31 24 679 07 07www.ssabprelaq.com
SSAB Swedish SteelP.O. Box 131NL-6640 AC BeuningenPhone: Int. +31 24 679 05 50Fax: Int. +31 24 679 05 55www.ssab.nl
Norway
PlannjaPostboks 8 LeirdalNO-1008 OsloPhone: Int. +47 23 28 85 00Fax: Int. +47 23 28 85 10www.plannja.com
SSAB Svensk StålPostboks 47N-1313 VøyenengaPhone: Int. +47 23 11 85 80Fax: Int. +47 67 15 35 90www.ssab.no
Poland
SSAB Swedish SteelUl. Bernardynska 17/44PL-02904 WarsawPhone: Int. +48 22 643 59 28Fax: Int. +48 22 643 59 28www.ssab.pl
SSAB Swedish SteelOpacz, ul. Centralna 24PL-0505816 MichalowicePhone: Int. +48 22 353 13 14Fax: Int. +48 22 723 04 86www.ssab.pl
PlannjaUl.Bialolecka 233PL-03-253 WarsawPhone: Int. +48 22 814 10 60Fax: Int. +48 22 814 08 60www.plannja.com
Portugal
SSAB PortugalSitio das Pratas, Aparto 201P-2071 Cataxo CedexPhone: Int. +351 243 704 272/273Fax: Int. +351 243 704 262www.ssab.pt
SSAB Swedish SteelRua Sao Nicolau N.2Edificio Sao Nicolau, Sala 407PT-4520 Santa Maria da FeiraPhone: Int. +351 256 371 610Fax: Int. +351 256 371 619www.ssab.pt
Russia
SSAB Swedish SteelMoskovskaya 21RU-141400 KhimkiPhone: Int. +7 095 74 52 097Fax: Int. +7 095 57 777 2682www.ssab.ru
Singapore
SSAB Swedish Steel 11 Joo Koon CrescentSingapore 629022Phone: Int. +65 863 16 22Fax: Int. +65 863 06 22www.ssab.sg
Slovenia
SSAB HARDOX Steel TradingBlejska Dobrava 17ASI-4273 Blejska DobravaPhone: Int. +386 4586 62 30Fax: Int. +386 4587 42 72www.ssab.si
South Africa
SSAB HARDOXP O Box 1391ZA-Alberton 1450Phone: Int. +27 11 908 1346/47Fax: Int. +27 11 908 1373www.ssab.co.za
SSAB Swedish SteelPrivate Bag X1Postnet Suite 107East Rand 1462Phone: Int. +27 11 822 2570Fax: Int. +27 11 822 2584www.swedishsteel.co.za
Spain
SSAB Swedish SteelC/Manuel Uribe 13-15ES-28033 MadridPhone: Int. +34 91 300 54 22Fax: Int. +34 91 388 96 97www.ssab.es
SSAB Swedish SteelAlmacen No 4Zona Portuaria, S/NES-20110 PasajesPhone: Int. +34 943 350 272Fax: Int. +34 943 350 273www.ssab.es
Turkey
SSAB Swedish SteelPerdemsac Plaza, Bayar CaddesiGülbahar SokakNo:17, Kat:4/4281090 KozyatayiTR-IstanbulPhone: Int. +90 216 445 59 54Fax: Int. +90 216 445 59 56www.ssab.com.tr
UK
SSAB Dobel Coated SteelNarrowboat Way,Hurst Business ParkGB-Brierley Hill, West MidlandsDY5 1UFPhone: Int. +44 1384 746 60Fax: Int. +44 1384 775 75www.swedishsteel.co.uk
SSAB Swedish SteelDe Salis Court, De Salis DriveHampton LovettGB-Droitwich, Worcestershire WR9 OQEPhone: Int. +44 1905 791 800Fax: Int. +44 1905 794 736www.swedishsteel.co.uk
USA
SSAB HARDOX4700 Grand AvenueUS-Pittsburgh, PA 15225Phone: Int. +1 412 269 32 31Fax: Int. +1 412 269 32 51www.swedishsteel.com
SSAB Swedish Steel4700 Grand AvenueUS-Pittsburgh, PA 15225Phone: Int. +1 412 269 21 20Fax: Int. +1 412 269 21 24www.swedishsteel.com

Annual Report 2006SSAB Svenskt Stål AB Box 26208, SE-100 40 Stockholm, SwedenTelephone int. +46 8-45 45 700. Telefax int. +46 8-45 45 725Visiting address: Birger Jarlsgatan 58, StockholmEmail: [email protected]
Distinguishing features of the Domex 500 MC high-strength steelinclude its good bending characteristics, which are exploited byScania in the manufacture of the frame beams in the P and R series,as here in Scania R-420. Thanks to the strength and the bending characteristics, savings are made as regards weight and several costly elements in the manufacture of the chassis frame beams.
951 69 SSAB_omslag-Engelsk 07-03-05 08.45 Sida 1