annual report 2001 tuberculosis & chest service of the ...
106
ANNUAL REPORT 2001 TUBERCULOSIS & CHEST SERVICE OF THE DEPARTMENT OF HEALTH
-
Upload
khangminh22 -
Category
Documents
-
view
0 -
download
0
Transcript of annual report 2001 tuberculosis & chest service of the ...

ANNUAL REPORT 2001
TUBERCULOSIS & CHEST SERVICE
OF THE
DEPARTMENT OF HEALTH

ANNUAL REPORT 2001
TUBERCULOSIS & CHEST SERVICE
OF THE
DEPARTMENT OF HEALTH

1
PREFACE Today, tuberculosis (TB) continues to be an infectious disease of high public health importance.
In various parts of the world, TB has become resurgent alongside rampant drug resistance and HIV
co-infection. In April 1993, the World Health Organization (WHO) declared TB as a global
emergency. In May 1998, a resolution in the 51st World Health Assembly urged all member states to
turn their policies into action and to make strong political commitment on TB control. In September
1999, “TB crisis” was declared in the Western Pacific Region and the project of “Stop TB in the
Western Pacific Region” was initiated.
TB has been a notifiable disease in Hong Kong since 1939. After reaching a record high of
around 700 cases per 100,000 population in 1952, the TB notification rate declined significantly in the
next 40 years. However, in the past decade, the downward trend has apparently halted, and the rate
has fluctuated around 110 per 100,000. In 2001, there were 7,262 notified cases at a rate of 108 per
100,000, accounting for 28% of the total notifiable infectious diseases, second only to chickenpox.
The phenomenon of a slow-down or reversal of the annual decline of the crude notification rate has
been defined as stagnation. A stagnated decline has also been observed in the past decade in some
neighbouring countries such as Singapore, Malaysia, Japan, and Brunei, which are classified together
with Hong Kong as “places with intermediate TB burden and a good health infrastructure”.
More effective surveillance system has probably confounded the TB trend as observed in Hong
Kong. A closer look at our surveillance statistics shows that the number of notifications from the chest
clinics and the chest hospitals changed little, while the figures from the general public hospitals and
the private sector increased drastically from 553 cases in 1995 to 1,938 cases in 1999. The change
approximated the increase in the total number of notifications from 6,212 to 7,512 over the same
period. This increase is largely attributable to improvement in notification from the public hospitals,
where a very substantial degree of under-notification had been documented by an audit of medical
records. Wider publicity, continuous medical education, and active retrieval of TB information from
laboratories and death certificates may have contributed to the improvement in the local TB
surveillance system.
Ageing of the TB epidemic in an ageing population may be a more fundamental factor that
underlies the recently observed stagnant trend. The discovery of effective anti-TB drugs in the 1950s
and the advent of the short course chemotherapy in the 1970s have hastened the “ageing of the TB
epidemic” in the intermediate TB burden countries. Chemotherapy, particularly directly observed
treatment (DOT), is highly effective in curing patients of the disease. Removal of the infectious
sources rapidly contains the transmission of TB. Fewer cases therefore develop from recent
infection (either progressive primary infection or exogenous reinfection). However, endogenous

2
reactivation of the disease will continue from the large pool of infected individuals accumulated in the
past. Ageing also increases the risk of progression from latent infection to disease and this is
reflected by the age-specific TB notification rates. In 2001, the age-specific rate of elderly aged 65
and above was 349 per 100,000, which was about three times the crude rate of the general population.
The proportion of elderly aged 65 and above in the TB patient population was 36%, while the
proportion of the same age group in the general population was only 11%. As the local population is
ageing fairly rapidly, TB will continue to be an important infectious disease in the foreseeable future.
The TB services in Hong Kong were under periodic review in the past few decades and a
number of reports with recommendations had been prepared by experts in the field. The
development of TB services largely tied in with the recommendations. A brief account of TB control
in Hong Kong has been presented in Annex 4 of the Annual Report for the year 2000. To tie in with
the recent actions of WHO, an “Ad Hoc Working Group on Control of TB” (the Working Group) was
formed in June 2000. The tasks of the Working Group were to critically review the epidemiology,
examine the various contributing factors to the changes which had taken place, re-examine areas of
concern and the actions taken, and to formulate strategies for TB control for the coming decade.
The Working Group produced its Report in December 2000, which was submitted to the
Secretary for Health and Welfare in January 2001 for formulation of the action plan for TB control in
the coming years. The Working Group reconfirmed the crucial importance of collaboration between
the Department of Health (DH), the Hospital Authority, and the private sector in the control of
tuberculosis in Hong Kong. A good information system was also considered essential in
epidemiological surveillance, monitoring of patients’ progress and evaluation of outcome. The issue
of treatment defaulters has been an area of much concern as they pose persistent hazard in the
community owing to their potentially prolonged duration of infectiousness. While there has been little
question on the need to explore further means to promote treatment adherence, there are much
controversies within the local community in the use of drastic negative measures like quarantine and
legal sanction in the management of treatment defaulters. Social stigma, further barrier to care with
disturbance of the doctor-patient relationship, and negative impact on the overall control programme,
are issues of genuine concern. Socially more acceptable positive measures, like the use of enablers
and incentives, are probably preferred options that should be exhausted before any of these drastic
negative actions.
In January 2001, Dr. Takashi Yoshiyama and Dr. Maarten R.A. Van Cleefe, WHO consultants
(Western Pacific Regional Office, WPRO), visited Hong Kong to discuss about the TB situation in the
Region and the strategies for TB control. In December 2001, Dr. Takeshi Kasai and Dr. Dongil Ahn
from WHO WPRO visited Hong Kong again to review the TB situation and make arrangement for
preparation of the third TAG (Technical Advisory Group) Meeting which was planned to be held in
Osaka, Japan in February 2002.

3
During the year, 110,516 patients attended the TB&CS as compared to 112,903 in 2000, and the
total attendance was 961,475 in comparison with 990,513 in 2000. Among the 110,516 patients,
41,109 patients were new attendants, of whom 21.5% were found free of any chest diseases. The
diagnoses among other new patients included active pulmonary tuberculosis (10.1%), active
tuberculosis of other forms (2.2%), inactive tuberculosis (10.2%), bronchitis not specified as acute or
chronic (21.0%), acute respiratory infection (10.2%), pneumonia (5.6%), malignant neoplasm of
trachea and bronchus (1.4%), bronchiectasis (1.3%), asthma (0.7%) and emphysema (0.2%).
Among all the attendance, 5,317 hospital admissions were arranged.
In this Annual Report, there are a number of new/ modified items and points to note:
(i) The drug resistance rates for ofloxacin among some culture isolates done in the TB Reference
Laboratory of the Department of Health for the years 1999 and 2000 are presented in
Appendices 19(c).
(ii) A detail analysis of the treatment outcomes at 2 year of the cohort of patients seen at chest
clinics in 1998 are presented in Annex 1.
(iii) The notified numbers and estimated rates of TB among Chinese new immigrants are
presented in Annex 2.
(iv) The results of tuberculin tests among children aged under 5 who are TB contacts in
kindergartens/ nurseries are shown at Annex 3.
(v) The results of tuberculin tests among certain groups of university entrants are shown at Annex
4.
(vi) The updated TB treatment guidelines “Chemotherapy of Tuberuclosis – Update in 2001” is
attached as a Supplement in this Annual Report.
Part 1: Tuberculosis
The number of tuberculosis notification in 2001 was 7,262, making a notification rate of 108.0 per
100,000 population. The corresponding figures in 2000 were 7,578 and 113.7 respectively.
The number of tuberculosis deaths was 311 in 2001 compared with 299 in 2000, with the
mortality rate for both years being 4.6 and 4.5 per 100,000 respectively.
Deaths of tuberculosis in 2001 stayed outside the top ten causes of death. Tuberculosis deaths
accounted for 0.9% of the total registered deaths in Hong Kong. The average age of tuberculosis
deaths was 74.3.
In 2001, 99.0% of the newborns were given direct BCG vaccination at birth. The BCG
revaccination pogramme for primary school children was stopped since the school year starting from

4
September 2000.
HIV testing was done among tuberculosis patients of the TB&CS on a voluntary basis after
counselling and obtaining their consent. The positive rate remained low. Besides, unlinked
anonymous screening (UAS) continued to be done among a consecutive sample of TB patients
attending the TB&CS at yearly intervals.
Part 2: Pneumoconiosis
The Pneumoconiosis Compensation Ordinance was first introduced in 1980 for compensation of
workers who acquired pneumoconiosis as a result of occupational exposure to silica and asbestos
dusts. Compensation was paid out in the form of a lump sum according to the assessed degree of
incapacity and the expected degree of further deterioration. The Ordinance was amended in 1993 to
replace the lump sum payment with monthly payment. Reassessment at 2-yearly interval was also
introduced at the same time to update the degree of incapacity for adjustment of the monthly
compensation. Previously compensated post-1981 pneumoconiotics could apply for reassessment
for compensation for additional incapacity. Further amendments were made in 1996. A flat-rate
compensation for pain, suffering, and loss of amenities was payable to all post-1981 pneumoconiotics
who had applied for reassessment under the revised scheme, irrespective of whether there was
additional degree of incapacity over previous lump-sum compensation. The 1996 amendment also
allowed the Pneumoconiosis Medical Board to take other tests into consideration in adjusting the
degree of incapacity as determined by FVC test by a maximum of 5%. The ex-gratia payment
scheme for pre-1981 pneumoconiotics was also reviewed. On top of a flat-rate of monthly payment,
additional payments were introduced for those in need of constant care, oxygen and medical
appliances.
The Pneumoconiosis Clinic continued to provide a full range of outpatient services to patients
with suspected or confirmed pneumoconiosis. These services covered not only the assessment
aspect, but also addressed the patients’ diversified needs in terms of treatment, prevention and
rehabilitation. The attendance at the clinic was 10,889 in 2001 compared with 11,023 in 2000. In
2001, 236 new cases of pneumoconiosis were registered in the TB&CS, and 132 new cases
(including 9 cases of asbestos-related lung diseases) were confirmed by the Pneumoconiosis Medical
Board. Up to the end of 2001, a total of 5,245 patients had been compensated.

Part 1
TUBERCULOSIS

Contents Appendix
No.
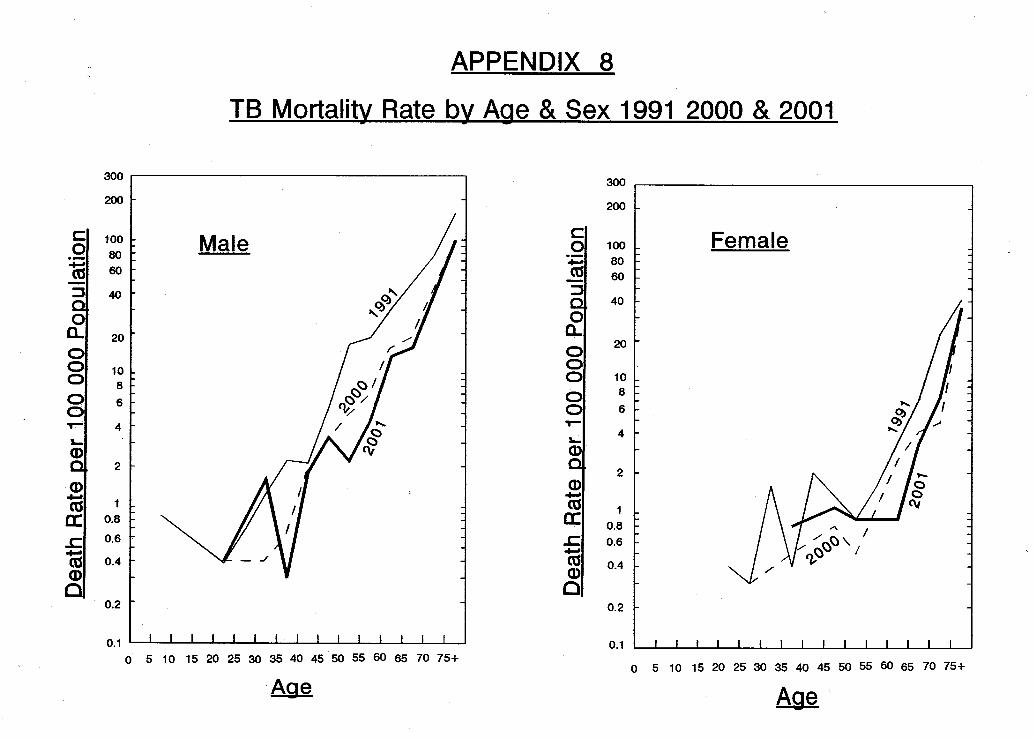
1 Notification & Death Rate of Tuberculosis (All Forms), 1947-20012 TB Notification Rate (All Forms), 1952-2001 (Graph)3 Crude Death Rate due to Tuberculosis (All Forms), 1910-2001 (Graph)4 (a) Tuberculosis Notifications (All Forms) & Rate by Age & Sex 20014 (b) Pulmonary TB Notifications by Age & Sex 20014 (c) Rate of Pulmonary TB Notification by Age & Sex 20015 TB Notification Rate by Age & Sex 1991, 2000 & 2001 (Graph)6 Notifications of Tuberculosis by Type by Age & Sex 20017 TB Death (All Forms) & Death Rate by Age & Sex 20018 TB Mortality Rate by Age & Sex 1991, 2000 & 2001 (Graph)9 TB Deaths by Type by Age & Sex 2001
10 Tuberculosis Mortality, 1950-200111 Top Ten Causes of Death 200112 (a) Origin of Tuberculosis Notifications, 1991-200112 (b) Breakdown of Origin of TB Notifications for "Other H.A. Hospitals" 200113 Tuberculosis Notifications & Notification Rates by Epidemiological Districts14 Establishment & Strength of TB & Chest Service as at 31.12.200115 Total Attendances at Chest Clinics, 1991-200116 No. of Doctor Sessions, Cases seen by Doctor and Patient/Doctor Session 200117 Flow Chart of Patients Attending Chest Clinics 200118 Classification of Patients of First Attendance with New Case Card Completed by
Clinics According to International Classification of Diseases Code 200119 (a) Extent of Active Respiratory TB in First Attenders at Chest Clinics, 1999-200119 (b) Rate of Drug-resistant Tuberculosis January to June 200119 (c) Rate of Drug-resistant Tuberculosis 200019 (d) Rate of Resistance to Ofloxacin 20 (a),(b) Treatment Return 200120 (c),(d) Explanatory Notes for Appendices 20 (a) & 20 (b)21 Examination of Contacts in the Chest Clinics 200122 (a) Scheme for Tuberculin Testing and BCG Administration in Hong Kong 200122 (b) Household Contacts Below 5 (with history of previous BCG vaccination)23 BCG Vaccinations at Birth 200124 Tuberculin Tests and BCG Vaccination of School Children, 1962-200025 Beds for Treatment of Tuberculosis 200126 Annual Admissions to Hospitals from Government Chest Clinics, 1991-200127 Unlinked Anonymous Screening (UAS) for HIV in TB & Chest Service 200128 Number of "Confirmed" Cases of TB in Health Care Staff Notified to
Labour Department 1993-200129 (a),(b) Cohort of TB Patients Seen at Chest Clinics with DOS in 2000

APPENDIX 1
TB Notifications & Death Rate of Tuberculosis (All Forms) 1947 - 2001
Notification Death Ratio DeathsYear TB Notifications Rate per TB Deaths Rate per (Notifications/ ------------- x 100%
100,000 Pop 100,000 Pop Deaths) Notifications1947 4855 277.4 1861 106.3 2.61 38.331948 6279 348.8 1961 108.9 3.20 31.231949 7510 404.4 2611 140.6 2.88 34.771950 9067 405.3 3263 145.9 2.78 35.991951 13886 689.0 4190 207.9 3.31 30.171952 14821 697.2 3573 168.1 4.15 24.111953 11900 530.7 2939 131.1 4.05 24.701954 12508 528.9 2876 121.6 4.35 22.991955 14148 568.1 2810 112.8 5.03 19.861956 12155 464.9 2629 100.6 4.62 21.631957 13665 499.4 2675 97.8 5.11 19.581958 13485 472.5 2302 80.7 5.86 17.071959 14302 482.0 2178 73.4 6.57 15.231960 12425 405.5 2085 68.0 5.96 16.781961 12584 397.2 1907 60.2 6.60 15.151962 14263 431.5 1881 56.9 7.58 13.191963 13031 380.9 1762 51.5 7.40 13.521964 12557 358.3 1441 41.1 8.71 11.481965 9927 275.9 1278 35.5 7.77 12.871966 11427 314.8 1515 41.7 7.54 13.261967 15253 409.7 1493 40.1 10.22 9.791968 9792 257.5 1483 39.0 6.60 15.151969 11072 286.5 1470 38.0 7.53 13.281970 10077 254.5 1436 36.3 7.02 14.251971 9028 223.2 1250 30.9 7.22 13.851972 8420 204.2 1312 31.8 6.42 15.581973 8152 192.2 1154 27.2 7.06 14.161974 8320 190.0 974 22.2 8.54 11.711975 8192 183.6 646 14.5 12.68 7.891976 7928 175.5 568 12.6 13.96 7.161977 7191 156.9 532 11.6 13.52 7.401978 6623 141.9 420 9.0 15.77 6.341979 7907 (498) * 160.4 523 10.6 15.12 6.611980 8065 (712) 159.3 551 10.9 14.64 6.831981 7729 (254) 149.1 489 9.4 15.81 6.331982 7527 (112) 143.0 454 8.6 16.58 6.031983 7301 (73) 136.6 446 8.3 16.37 6.111984 7843 (69) 145.3 420 7.8 18.67 5.361985 7545 (59) 580 # 138.3 409 7.5 18.45 5.421986 7432 (46) 544 134.5 407 7.4 18.26 5.481987 7269 (41) 495 130.3 405 7.3 17.95 5.571988 7021 (121) 433 124.8 388 6.9 18.10 5.531989 6704 (226) 387 117.9 403 7.1 16.64 6.011990 6510 (288) 341 114.1 382 6.7 17.04 5.871991 6283 (281) 293 109.2 409 7.1 15.36 6.511992 6534 (309) 264 112.6 410 7.1 15.94 6.271993 6537 (264) 89 110.8 396 6.7 16.51 6.061994 6319 (230) 87 104.7 409 6.8 15.45 6.471995 6212 (175) 102 100.9 418 6.8 14.86 6.731996 6501 ( 88) 162 101.0 292 4.5 22.26 4.491997 7072 ( 34) 156 109.0 252 3.9 28.06 3.561998 7673 ( 7) 169 117.3 270 4.1 28.42 3.521999 7512 ( 5) 166 113.7 312 4.7 24.08 4.152000 7578 ( 7) 152 113.7 299 4.5 25.34 3.952001 7262 ( 1) 192 108.0 311 4.6 23.35 4.28
* Figures in brackets denote the number of Vietnamese refugees included.# Figures in this column denote the number of Chinese immigrants staying in Hong Kong for less than 7 years.
NB The rates from the year 1996 onwards have been updated to reflect the adoption of the "Resident Population" approach by the Census & Statistics Department in August 2000 and the revision based on the latest results of the 2001 Population Census.


APPENDIX 4 (a)
Tuberculosis Notifications (All Forms) & Rate by Age & Sex 2001
Tuberculosis Notifications Tuberculosis Notification RateAge Group (All Forms) (per 100,000 population)
Male Female Total Male Female Total
Under 1 1 0 11 2 0 22 5 2 7 6.9 3.8 5.43 0 2 24 2 1 3
5-9 8 6 14 3.9 3.1 3.5 10-14 18 40 58 8.1 19.2 13.5 15-19 114 120 234 49.7 55.4 52.5 20-24 214 219 433 95.1 90.6 92.8 25-29 230 285 515 95.6 100.3 98.1 30-34 235 264 499 91.7 80.6 85.5 35-39 271 215 486 86.6 57.8 71.0 40-44 320 188 508 95.3 54.6 74.7 45-49 318 177 495 117.6 65.7 91.7 50-54 351 121 472 154.6 57.4 107.8 55-59 314 117 431 230.9 100.2 170.5 60-64 389 80 469 290.7 68.4 187.0 65-69 483 130 613 376.5 106.6 244.9 70-74 482 162 644 470.2 150.1 306.1 75-79 433 156 589 80-84 266 123 389 779.6 262.3 469.8
85 & over 217 181 398Total 4673 2589 7262 142.2 75.3 108.0

APPENDIX 4 (b)
Pulmonary TB Notifications by Age & Sex 2001 **
Bacteriologically * SmearAge Group Pulmonary TB Positive Pulmonary TB Positive Pulmonary TB
M F T M F T M F T
Under 1
1 2 0 2 1 0 1 1 0 1
2 2 2 4 0 0 0 0 0 0
3 0 2 2 0 0 0 0 0 0
4 2 1 3 1 0 1 0 0 0
5 - 9 5 4 9 2 2 4 1 2 3
10 - 14 13 34 47 7 16 23 4 11 15
15 - 19 106 101 207 56 57 113 32 36 68
20 - 24 200 177 377 98 88 186 49 54 103
25 - 29 200 224 424 88 111 199 49 66 115
30 - 34 205 205 410 106 107 213 58 59 117
35 - 39 243 166 409 126 81 207 71 45 116
40 - 44 293 138 431 154 84 238 103 44 147
45 - 49 287 121 408 171 77 248 109 35 144
50 - 54 326 91 417 193 51 244 110 26 136
55 - 59 292 82 374 188 50 238 104 23 127
60 - 64 368 65 433 228 46 274 131 19 150
65 - 69 453 109 562 307 76 383 164 43 207
70 - 74 465 130 595 339 102 441 177 45 222
75 - 79 408 140 548 309 102 411 160 42 202
80 - 84 254 101 355 189 75 264 76 41 117
85 & over 210 163 373 158 116 274 51 49 100
Total 4334 2056 6390 2721 1241 3962 1450 640 2090
** Pulmonary TB with or without extrapulmonary TB* Either smear or culture positive

APPENDIX 4 (c)
Rate of Pulmonary TB Notification by Age & Sex 2001 **
(Rate per 100,000 Population)
Bacteriologically * SmearAge Group Pulmonary TB Positive Pulmonary TB Positive Pulmonary TB
M F T M F T M F T
0-4 4.2 3.8 4.0 1.4 - 0.7 0.7 - 0.4
5 - 9 2.4 2.1 2.3 1.0 1.0 1.0 0.5 1.0 0.8
10 - 14 5.9 16.3 10.9 3.2 7.7 5.3 1.8 5.3 3.5
15 - 19 46.2 46.7 46.4 24.4 26.3 25.3 13.9 16.6 15.2
20 - 24 88.8 73.3 80.8 43.5 36.4 39.9 21.8 22.4 22.1
25 - 29 83.1 78.8 80.8 36.6 39.1 37.9 20.4 23.2 21.9
30 - 34 80.0 62.6 70.2 41.4 32.7 36.5 22.6 18.0 20.0
35 - 39 77.7 44.7 59.7 40.3 21.8 30.2 22.7 12.1 16.9
40 - 44 87.3 40.1 63.4 45.9 24.4 35.0 30.7 12.8 21.6
45 - 49 106.1 44.9 75.6 63.2 28.6 45.9 40.3 13.0 26.7
50 - 54 143.6 43.2 95.2 85.0 24.2 55.7 48.5 12.3 31.1
55 - 59 214.7 70.2 147.9 138.2 42.8 94.1 76.5 19.7 50.2
60 - 64 275.0 55.6 172.6 170.4 39.3 109.3 97.9 16.2 59.8
65 - 69 353.1 89.3 224.5 239.3 62.3 153.0 127.8 35.2 82.7
70 - 74 453.7 120.5 282.8 330.7 94.5 209.6 172.7 41.7 105.5
75+ 742.1 230.3 435.6 558.3 167.0 324.0 244.3 75.3 143.1
Total 131.9 59.8 95.0 82.8 36.1 58.9 44.1 18.6 31.1
** Pulmonary TB with or without extrapulmonary TB* Either smear or culture positive


` APPENDIX 6
Notifications of Tuberculosis by Type by Age & Sex 2001
Pulmonary only # Miliary Meninges Bones & Joints Others Age Group
M F T M F T M F T M F T M F T
Under 1 - - - - - - - - - - - - 1 - 1
1 1 - 1 1 - 1 - - - - - - - - -
2 2 1 3 - - - 1 - 1 1 - 1 1 1 2
3 - 2 2 - - - - - - - - - - - -
4 2 1 3 - - - - - - - - - - - -
5 - 9 5 3 8 - - - - - - 1 1 2 2 2 4
10 - 14 11 34 45 2 - 2 - - - 1 - 1 4 6 10
15 - 19 100 95 195 1 1 2 1 - 1 1 1 2 11 23 34
20 - 24 195 168 363 1 - 1 - 2 2 1 2 3 17 47 64
25 - 29 191 213 404 1 3 4 - 2 2 3 1 4 35 66 101
30 - 34 194 196 390 - - - 4 1 5 2 4 6 35 63 98
35 - 39 237 150 387 2 2 4 3 2 5 - 2 2 29 59 88
40 - 44 286 137 423 2 1 3 1 - 1 3 3 6 28 47 75
45 - 49 279 118 397 5 - 5 2 2 4 4 3 7 28 54 82
50 - 54 319 88 407 2 1 3 1 2 3 4 2 6 25 28 53
55 - 59 283 78 361 2 2 4 3 - 3 - 4 4 26 33 59
60 - 64 362 61 423 1 2 3 1 - 1 5 2 7 20 15 35
65 - 69 445 105 550 - - - 1 2 3 6 6 12 31 17 48
70 - 74 459 125 584 2 - 2 - 2 2 - 5 5 21 30 51
75 - 79 401 136 537 2 1 3 1 - 1 3 6 9 26 13 39
80 - 84 245 98 343 3 1 4 1 2 3 - 5 5 17 17 34
85 & over 203 155 358 2 5 7 1 3 4 2 4 6 9 14 23
Total 4220 1964 6184 29 19 48 (a) 21 20 41 (b) 37 51 88 (c) 366 535 901 (d)
* Including: TB Lymph Node 434TB Kidney/Urinary System 49TB Peritonitis 22 TB Pleural Effusion 99TB Laryngitis 4TB Skin 23Others 41Unspecified 229
(a) All Miliary TB cases has coexisting Pulmonary TB; also include 8 cases with coexisting TB of other extrapulmonary sites.
(b) Including 9 cases wih coexisting Pulmonary TB and 1 case with coexisting TB of other extrapulmonary site.
(c) Including 12 cases with coexisting Pulmonary TB and 7 cases with coexisting TB of other extrapulmonary sites. (d) Including 137 cases with coexisting Pulmonary TB and 1 cases with coexisting TB of other extrapulmonary site.
# Pulmonary TB only, without extrapulmonary site involvement
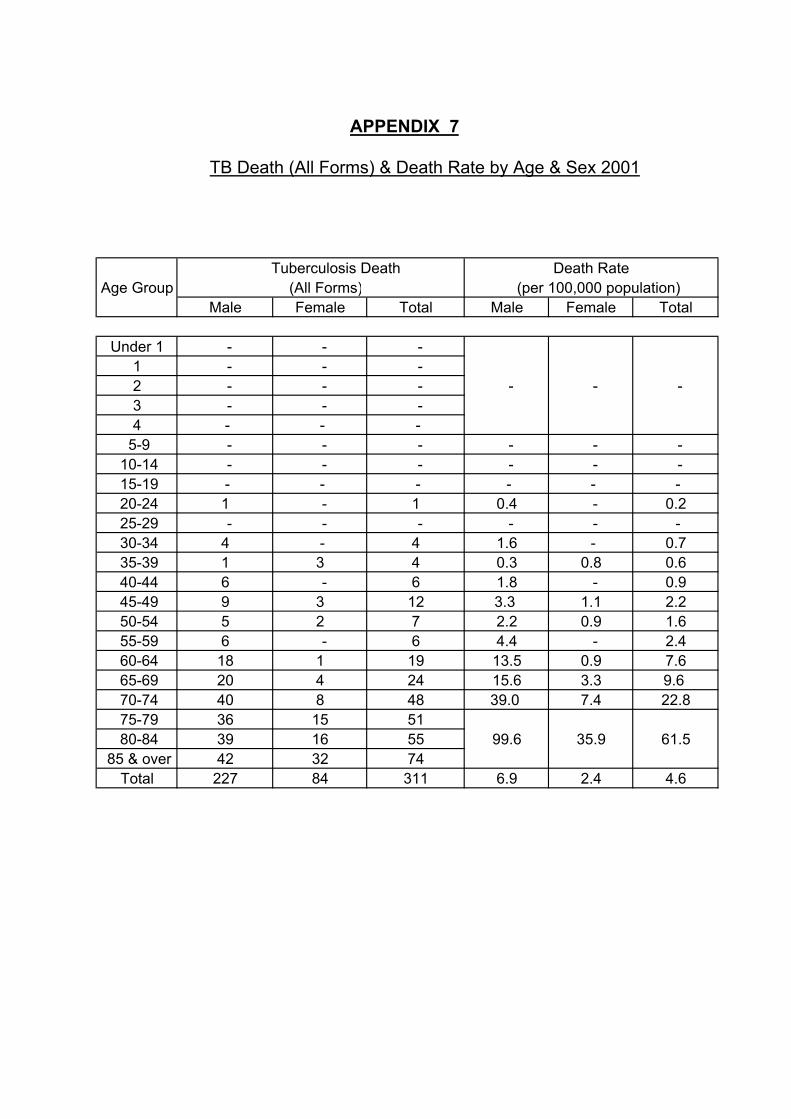
APPENDIX 7
TB Death (All Forms) & Death Rate by Age & Sex 2001
Tuberculosis Death Death RateAge Group (All Forms) (per 100,000 population)
Male Female Total Male Female Total
Under 1 - - - 1 - - - 2 - - - - - -3 - - - 4 - - -
5-9 - - - - - - 10-14 - - - - - - 15-19 - - - - - - 20-24 1 - 1 0.4 - 0.2 25-29 - - - - - - 30-34 4 - 4 1.6 - 0.7 35-39 1 3 4 0.3 0.8 0.6 40-44 6 - 6 1.8 - 0.9 45-49 9 3 12 3.3 1.1 2.2 50-54 5 2 7 2.2 0.9 1.6 55-59 6 - 6 4.4 - 2.4 60-64 18 1 19 13.5 0.9 7.6 65-69 20 4 24 15.6 3.3 9.6 70-74 40 8 48 39.0 7.4 22.8 75-79 36 15 51 80-84 39 16 55 99.6 35.9 61.5
85 & over 42 32 74Total 227 84 311 6.9 2.4 4.6
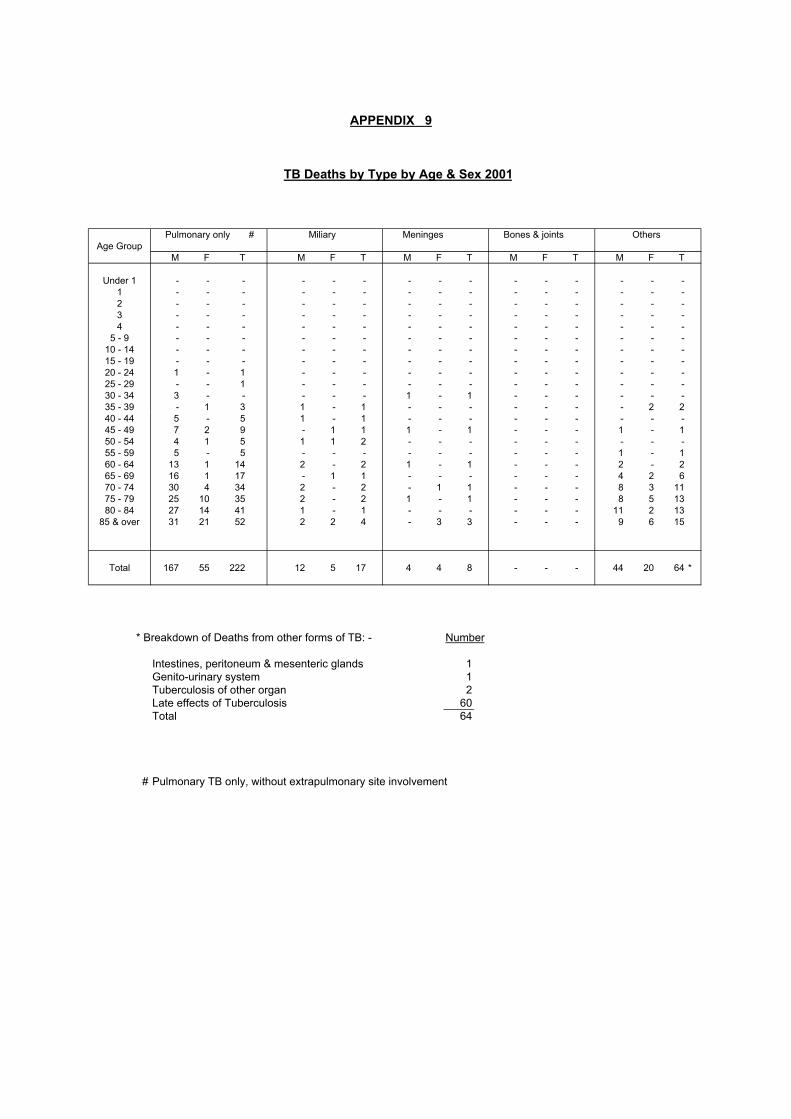
APPENDIX 9
TB Deaths by Type by Age & Sex 2001
Pulmonary only # Miliary Meninges Bones & joints OthersAge Group
M F T M F T M F T M F T M F T
Under 1 - - - - - - - - - - - - - - -1 - - - - - - - - - - - - - - -2 - - - - - - - - - - - - - - -3 - - - - - - - - - - - - - - -4 - - - - - - - - - - - - - - -
5 - 9 - - - - - - - - - - - - - - -10 - 14 - - - - - - - - - - - - - - -15 - 19 - - - - - - - - - - - - - - -20 - 24 1 - 1 - - - - - - - - - - - -25 - 29 - - 1 - - - - - - - - - - - -30 - 34 3 - - - - - 1 - 1 - - - - - -35 - 39 - 1 3 1 - 1 - - - - - - - 2 240 - 44 5 - 5 1 - 1 - - - - - - - - -45 - 49 7 2 9 - 1 1 1 - 1 - - - 1 - 150 - 54 4 1 5 1 1 2 - - - - - - - - -55 - 59 5 - 5 - - - - - - - - - 1 - 160 - 64 13 1 14 2 - 2 1 - 1 - - - 2 - 265 - 69 16 1 17 - 1 1 - - - - - - 4 2 670 - 74 30 4 34 2 - 2 - 1 1 - - - 8 3 1175 - 79 25 10 35 2 - 2 1 - 1 - - - 8 5 1380 - 84 27 14 41 1 - 1 - - - - - - 11 2 13
85 & over 31 21 52 2 2 4 - 3 3 - - - 9 6 15
Total 167 55 222 12 5 17 4 4 8 - - - 44 20 64 *
* Breakdown of Deaths from other forms of TB: - Number
Intestines, peritoneum & mesenteric glands 1Genito-urinary system 1Tuberculosis of other organ 2Late effects of Tuberculosis 60Total 64
# Pulmonary TB only, without extrapulmonary site involvement

APPENDIX 10
Tuberculosis Mortality 1950 - 2001
Infant Mort. % of TB % of TB % of TB Rate from TB Deaths among Average
Year Deaths below Deaths below per 1,000 Total Age of 5 years 1 year Registered Registered TB
Live Births Deaths Deaths1950 38.34 9.81 5.28 17.7 24.01951 34.22 7.73 4.73 20.0 25.01952 34.28 7.05 3.50 18.4 25.01953 36.27 9.02 3.51 16.1 26.01954 31.26 8.17 2.82 14.9 29.01955 28.51 8.61 2.67 14.7 31.01956 25.22 7.34 1.99 13.6 32.01957 21.20 5.76 1.57 13.8 36.01958 19.64 7.04 1.52 11.2 36.51959 18.92 5.56 1.16 10.8 37.01960 10.55 2.21 0.42 10.9 43.01961 11.48 2.62 0.46 10.2 43.01962 5.74 1.44 0.24 9.3 46.01963 5.51 1.08 0.16 8.9 47.01964 4.09 0.90 0.12 8.0 48.01965 3.36 0.70 0.09 7.3 49.01966 2.71 0.73 0.12 8.1 53.01967 2.01 0.33 0.06 7.6 54.51968 1.15 0.20 0.04 7.7 56.51969 0.95 0.27 0.05 7.8 56.01970 0.63 0.00 0.00 6.9 57.51971 0.64 0.08 0.01 6.2 57.51972 0.30 0.15 0.02 6.2 59.01973 0.35 0.09 0.01 5.4 58.01974 0.82 0.21 0.02 4.4 58.51975 1.39 0.31 0.03 3.0 58.51976 0.70 0.00 0.00 2.4 59.51977 0.38 0.00 0.00 2.3 61.01978 0.48 0.24 0.01 1.8 61.01979 0.96 0.19 0.01 2.0 61.01980 0.73 0.18 0.01 2.1 62.01981 0.41 0.00 0.00 2.0 63.01982 0.22 0.00 0.00 1.8 63.01983 0.45 0.00 0.00 1.7 63.01984 0.24 0.24 0.01 1.6 64.51985 0.00 0.00 0.00 1.6 65.51986 0.00 0.00 0.00 1.6 68.01987 0.00 0.00 0.00 1.5 68.51988 0.52 0.26 0.01 1.4 69.01989 0.25 0.25 0.01 1.4 69.01990 0.52 0.52 0.03 1.3 69.01991 0.00 0.00 0.00 1.4 69.01992 0.00 0.00 0.00 1.3 68.01993 0.25 0.25 0.01 1.3 69.01994 0.00 0.00 0.00 1.4 71.01995 0.00 0.00 0.00 1.4 71.11996 0.00 0.00 0.00 0.9 70.61997 0.00 0.00 0.00 0.8 72.11998 0.37 0.00 0.00 0.8 72.6 1999 0.00 0.00 0.00 0.9 72.92000 0.00 0.00 0.00 0.9 73.42001 0.00 0.00 0.00 0.9 74.3

APPENDIX 11
Top Ten Causes of Death 2001
Detailed 2001 Rank Causes of Death List No.
ICD 10th Revision Male Female TotalAll Causes 19,007 14,294 33,305 (4)
1 Malignant neoplasms C00-C97 7,100 4,306 11,406
2 Diseases of heart I00-I09, I11 2,438 2,265 4,703I13, I20-I51
3 Cerebrovascular diseases I60-I69 1,504 1,626 3,130
4 Pneumonia J12-J18 1,526 1,500 3,026
5 Chronic lower respiratory diseases * J40-J47 1,495 619 2,114
6 External causes of morbidity and mortality # V01-Y89 1204 640 1,844
7 Nephritis, nephrotic syndrome and nephrosis N00-N07, 527 526 1,053N17-N19, N25-N27
8 Diabetes mellitus E10-E14 303 373 676
9 Septicaemia A40-A41 199 225 424
10 Chronic liver disease and cirrhosis K70, K73-K74 268 110 378 Tuberculosis (including late effects of tuberculosis) 227 84 311 All other causes Residues of 2,216 2,020 4,240 (4)
all causes
Notes : 1. Figures in brackets denote number of deaths of unknown sex included. 2. Classification of diseases and causes of death is based on the International Statistical Classification of Diseases and Related Health
Problems (ICD) 10th Revision from 2001 onwards. The disease groups for the purpose of ranking causes of death have also been redefined based on the ICD 10th Revision, and new disease groups have been added. Figures for 2001 may not be comparable with figures for previous years which were compiled based on the ICD 9th Revision.
* Chronic lower respiratory diseases has been included as a disease group for the purpose of ranking the causes of death since 2001.# According to the ICD 10th Revision, when the morbid condition is classifiable under Chapter XIX as "injury, poisoning and certain other
consequences of external causes", the codes under Chapter XX for "external causes of morbidity and mortality" should be used as theprimary cause.

APPENDIX 12 (a)
Origin of Tuberculosis Notifications 1991 - 2001
Origin 1991 1992 1993 1994 1995 1996 1997 1998 1999 2000 2001 OriginEast Kowloon Chest Clinic 269 280 298 280 158 190 175 225 118 192 173 East Kowloon Chest ClinicKowloon Chest Clinic 1117 950 894 823 788 742 667 529 608 477 413 Kowloon Chest ClinicKwai Chung Chest Clinic 515 556 583 552 554 581 547 531 439 342 339 Kwai Chung Chest ClinicSai Ying Pun Chest Clinic (a) 245 262 288 271 261 254 180 216 198 196 194 Sai Ying Pun Chest Clinic (a)Shaukiwan Chest Clinic 141 188 180 176 189 195 181 199 158 169 158 Shaukiwan Chest Clinic
31 31 50 29 25 23 Shaukiwan PneumoconiosisShek Kip Mei Chest Clinic 352 392 290 272 256 243 302 282 266 232 208 Shek Kip Mei Chest ClinicWanchai Chest Clinic 580 729 717 603 593 590 502 461 365 375 384 Wanchai Chest ClinicYaumati Chest Clinic 264 343 296 349 181 325 280 389 344 339 373 Yaumati Chest ClinicYan Oi Chest Clinic 330 291 313 303 363 170 428 419 440 425 396 Yan Oi Chest Clinic Yung Fung Shee Chest Clinic 238 281 276 296 301 300 240 285 331 222 213 Yung Fung Shee Chest Clinic NT Chest Clinic 402 422 511 706 650 630 561 NT Chest Clinic (e)
6 13 26 24 Tung Chung Chest Clinic420 395 308 288 Yuen Chau Kok Chest Clinic102 97 103 81 Sheung Shui Chest Clinic98 92 88 84 Tai Po Chest Clinic94 94 111 96 Yuen Long Chest Clinic13 8 4 4 Sai Kung Chest Clinic
Sub-total 4453 4694 4646 4631 4294 4251 4094 4319 3995 3634 3451 Sub-total
274 322 335 384 339 426 443 322 Kowloon HospitalTung Wah Group (b) 238 238 338 418 372 330 442 458 431 352 330 Wong Tai Sin HospitalRuttonjee Hospital 493 305 346 290 229 235 333 275 324 326 305 Ruttonjee HospitalGrantham Hospital 423 273 269 208 338 285 360 316 296 358 259 Grantham HospitalHaven of Hope Hospital 51 91 117 80 88 97 72 117 105 141 116 Haven of Hope HospitalOther Govt Institutions (c) 463 593 612 18 16 3 5 7 42 43 113 Other Govt. Institutions (f)
327 277 287 740 1244 1682 2081 2176 Other H.A. HospitalsMaryknoll Hospital 50 55 48 United Christian Hospital 24 32 36 Caritas Medical Centre 8 11 29 Others (d) 80 219 89 53 253 589 413 343 157 121 125 Private PractitionersPrivate Hospitals N.A. 23 7 20 23 89 229 255 54 79 65 Private Hospitals
Total 6283 6534 6537 6319 6212 6501 7072 7673 7512 7578 7262 Total% of cases from Chest Clinics 70.9 71.8 71.1 73.3 69.1 65.4 57.9 56.3 53.2 48.0 47.5 % of cases from Chest Clinicsamong the total among the total
20.1 21.7 19.7 22.5 19.6 21.1 21.4 18.3 % from Chest Hospitals (g)5.5 4.7 4.5 10.5 16.3 22.9 28.0 31.5 % from Other Public Hospitals1.2 4.4 10.4 9.1 7.8 2.8 2.6 2.6 % from Private Sector
Note : (a) Including Notifications from Cheung Chau Chest Clinic.(b) Most of the notifications are from Wong Tai Sin Hospital.
(c) Sources are from former Government Hospitals, Public Mortuaries, Prison Hospitals, Army Hospitals.(d) Sources are mainly from Private Practitioners.(e) Including Yuen Chau Kok Chest Clinic.(f) Sources are from Public Mortuaries, Prison Hospitals, & Army Hospitals.(g) Chest Hospitals include Kowloon Hospital, Wong Tai Sin Hospital, Ruttonjee Hospital, Grantham Hospital and Haven of Hope Hospital.

APPENDIX 12 (b)
Breakdown of Origin of TBNotifications for "Other H.A. Hospitals" 2001
Name of Hospital No. of TB Notification
Alice Ho Miu Ling Nethersole Hospital 123
Caritas Medical Centre 139
Castle Peak Hospital 3
Hong Kong Buddhist Hospital 1
Kwong Wah Hospital 144
North District Hospital 166
Our Lady of Maryknoll Hospital 16
Pamela Youde Nethersole Eastern Hospital 163
Pok Oi Hospital 4
Prince of Wales Hospital 228
Princess Margaret Hospital 182
Queen Elizabeth Hospital 239
Queen Mary Hospital 127
Sha Tin Hospital 11
Tai Po Hospital 18
Tseung Kwan O Hospital 75
Tuen Mun Hospital 177
Tung Wah Hospital 22
United Christian Hospital 239
Yan Chai Hospital 99
Total 2176

APPENDIX 13
Tuberculosis Notifications & Notification Ratesby Epidemiological Districts
2001 Epidemiological Districts Notification Rate Notification (per 100,000 pop.)
Hong Kong Island 1418 107.6
Central & Western 257 98.0Wanchai 332 189.5Eastern 490 81.1Southern 339 122.7
Kowloon 2739 135.5 Yau Tsim Mong 535 188.0Sham Shui Po 538 150.6Kowloon City 416 105.2Wong Tai Sin 692 162.3Kwun Tong 558 100.1
New Territories (East) 1515 94.0
North 293 101.8Tai Po 274 86.5Shatin 592 97.2Sai Kung 244 77.8Islands 112 132.1
New Territories (West) 1552 93.7
Tsuen Wan 211 75.4Kwai Chung & Tsing Yi 533 114.9Tuen Mun 418 88.2Yuen Long 390 89.0
Others 38
Imported 4Vietnamese Refugees 0Unknown 34
Total 7262 108.0

APPENDIX 14
Establishment & Strength of TB & Chest ServiceAs at 31.12.2001
Post Establishment StrengthConsultant Chest Physician i/c 1 1Consultant Chest Physician 1 1Senior Medical & Health Officer 8 (a) 3 Medical & Health Officer 22 24 (b)Senior Nursing Officer - 1Nursing Officer 15 11Registered Nurse 55 61Enrolled Nurse 126 107Senior Dispenser 4 4Dispenser 8 10Senior Inoculator 2 2Inoculator 12 7Executive Officer I 1 1Statistical Officer II 2 2Personal Secretary I 1 1Clerical Officer 16 16Assistant Clerical Officer 19 16Clerical Assistant 50 52 Office Assistant 15 10Workman II 60 57Genaral Worker (NSC) - 1Watchman 2 2Medical Social Worker - 12 (c)Senior Radiographer 1 1Radiographer II 14 20Senior Radiographic Technician 5 1Radiographic Technician 6 6Darkroom Technician 12 15
(a) Including 1 SMO (Radiologist) in Chest Service.(b) Including 1 MO as Medical staff exchange programme with Ruttonjee Hospital.(c) Seconded from Social Welfare Department and some of them are part-time only.

APPENDIX 15
Total Attendances at Chest Clinics 1991 - 2001
Clinic/Hospital 1991 1992 1993 1994 1995 1996 1997 1998 1999 2000 2001
East Kowloon Chest Clinic 58667 64659 64473 64845 54430 54921 58862 65220 56317 64102 64820Kowloon Chest Clinic 88930 77817 80576 83223 95667 104572 120663 117678 112291 119624 106321Sai Ying Pun Chest Clinic 51161 52478 51036 47995 48537 55967 50875 56233 58380 57916 53854Shaukiwan Chest Clinic 47614 46348 45250 43128 48215 55737 54639 54732 52446 53011 57215Shaukiwan Pneumoconiosis - - - - 9944 9664 9185 10821 12182 11023 10889Shek Kip Mei Chest Clinic 60032 67636 59342 65676 56871 63462 72274 75610 68971 70941 71134South Kwai Chung Chest Clinic 80144 84721 86912 91095 94000 101041 111683 113185 108654 99012 90448Tung Chung - - - - - - 101 3730 4687 4601 6241Wanchai Chest Clinic 89769 89945 88826 85106 79964 89391 92697 91331 85109 84960 79212Yan Oi Chest Clinic 51660 52075 51077 59698 64091 70741 69581 70979 78840 79188 72982Yaumati Chest Clinic 78008 74709 78565 83555 79224 80341 89759 103198 108226 111959 114499Yuen Chau Kok Chest Clinic - - 10944 51089 54642 55615 61160 76626 71273 66192 65190Yung Fung Shee Chest Clinic 53925 53042 53726 55740 56908 58139 58841 66567 74735 73255 73663Castle Peak Hospital 2695 4850 3736 2442 1932 1773 1169 1283 1151 868 1010Cheung Chau Chest Clinic 3114 1903 1927 1781 2414 2490 2808 2943 2706 2611 1640Sai Kung Chest Clinic 1902 1529 1504 1446 1412 1451 1444 1682 1905 2141 1945Sheung Shui Chest Clinic 6274 6770 7217 7644 7710 10151 15330 18756 21256 22383 24271Tai Po Chest Clinic 8504 9385 10852 9620 8083 8773 15760 20350 20758 24688 25636Yuen Long Chest Clinic 10967 11149 11618 8963 9822 11687 18742 21677 24075 27603 27208Shatin Chest Clinic 14989 16567 12974 - - - - - - - -Hei Ling Chau ATC 877 1636 1335 1232 1550 3187 2600 2664 1855 3726 2474Pik Uk Prison 110 112 46 1 87 - - - - - -Shek Pik Prison Hospital 179 584 882 594 1239 943 725 173 266 241 291Stanley Prison Hospital 9430 9166 7745 9991 5925 7751 6053 7380 9062 10468 10532Tai O 7 - - - - - - - - - -
Total 718958 727081 730563 774864 782667 847797 914951 982818 975145 990513 961475
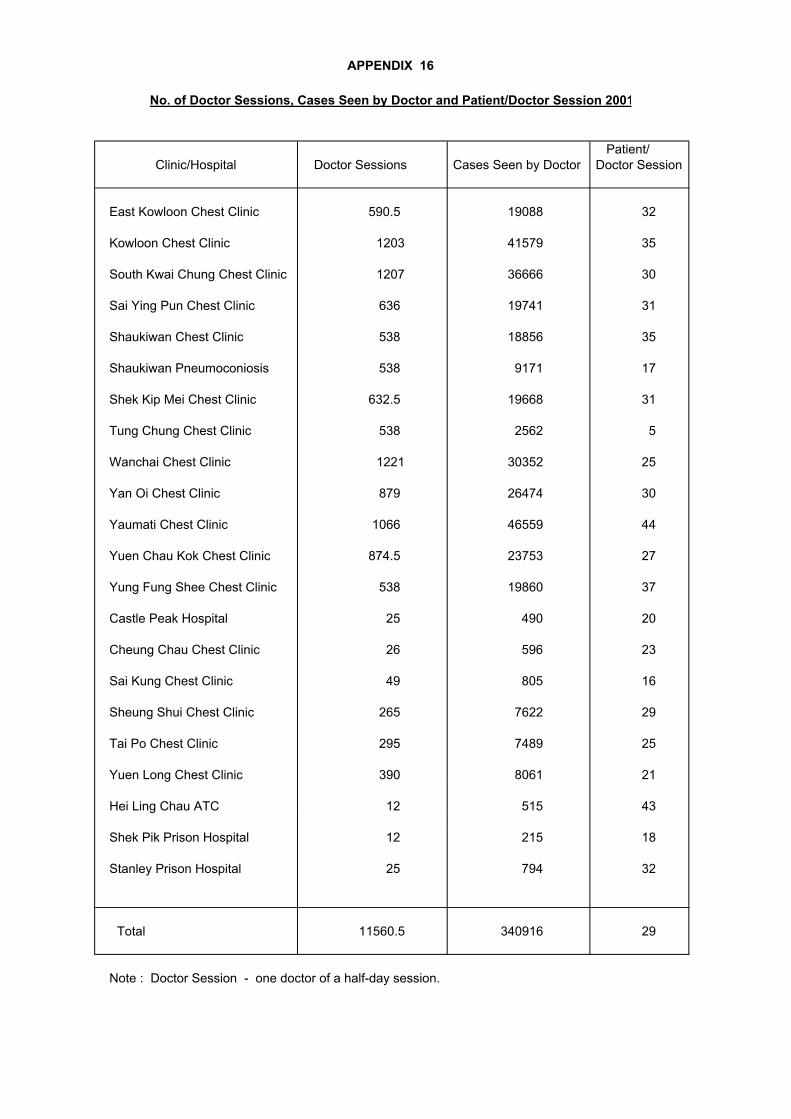
APPENDIX 16
No. of Doctor Sessions, Cases Seen by Doctor and Patient/Doctor Session 2001
Patient/ Clinic/Hospital Doctor Sessions Cases Seen by Doctor Doctor Session
East Kowloon Chest Clinic 590.5 19088 32
Kowloon Chest Clinic 1203 41579 35
South Kwai Chung Chest Clinic 1207 36666 30
Sai Ying Pun Chest Clinic 636 19741 31
Shaukiwan Chest Clinic 538 18856 35
Shaukiwan Pneumoconiosis 538 9171 17
Shek Kip Mei Chest Clinic 632.5 19668 31
Tung Chung Chest Clinic 538 2562 5
Wanchai Chest Clinic 1221 30352 25
Yan Oi Chest Clinic 879 26474 30
Yaumati Chest Clinic 1066 46559 44
Yuen Chau Kok Chest Clinic 874.5 23753 27
Yung Fung Shee Chest Clinic 538 19860 37
Castle Peak Hospital 25 490 20
Cheung Chau Chest Clinic 26 596 23
Sai Kung Chest Clinic 49 805 16
Sheung Shui Chest Clinic 265 7622 29
Tai Po Chest Clinic 295 7489 25
Yuen Long Chest Clinic 390 8061 21
Hei Ling Chau ATC 12 515 43
Shek Pik Prison Hospital 12 215 18
Stanley Prison Hospital 25 794 32
Total 11560.5 340916 29
Note : Doctor Session - one doctor of a half-day session.

APPENDIX 17
Flow Chart of Patients Attending Chest Clinics 2001
Total patients attending during 2001 110,516
Total New Patients Total Old Patients 41,109 69,407
NSD Unknown & Disease other Non-resp TB Resp TB Resp TB # Others 8,854 Incomplete than TB 641 8,685 30,566 38,841 (Incl 3,120 684 22,245 NSD cases on first attendances) Active Other
4,475 (Not active+ Unknown)4,210
(a) Miliary 27(b) Meninges 25(c) Bones & Joints 58(d) Others 531
Bacteriology Extent Number Bacteriology Cavity Number Previous Previous 1 1274 History Treatment Number
Negative 2 198 Negative Yes 84 of TB for TB3 36 No 1424 No No 41021 1459 Yes No 143
Positive 2 956 Positive Yes 598 Yes Yes 2223 402 No 2219 Unknown Unknown 81 126
Incomplete 2 20 Incomplete Yes 93 4 No 141
# Refer to cases with pulmonary TB only, without coexisting TB of extrapulmonary sites.

APPENDIX 18
Classification of Patients of First Attendance with New Case Card Completed By Clinics According to International Classification of Diseases Code 2001
Code Classification Total
010 Primary Tuberculosis Infection 3011 Pulmonary Tuberculosis 4199012 Other Respiratory Tuberculosis 273013 Tuberculosis of Meninges 25014 Tuberculosis of Intestines 22015 Tuberculosis of Bones & Joints 58016 Tuberculosis of Genito-urinary System 64017 Tuberculosis of Other Organs 445018 Miliary Tuberculosis 27137 Late effects of Tuberculosis 4210
160-165 Malignant Neoplasm of Respiratory System 585212 Benign Neoplasm of Respiratory System 1
460-466 Acute Respiratory Infection 4241470-478 Other Diseases of Upper Resp Tract 177480-486 Pneumonia 2320
487 Influenza 0490-491 Bronchitis, (not specified as acute or 8722
chronic) & chronic brochitis492 Emphysema 87493 Asthma 280494 Bronchiectasis 536
495-496 Others 438501 Asbestosis 1502 Silicosis 8505 Pneumoconiosis, unspecified 12
506-508 Others 1510 Empyema 6511 Pleurisy 75512 Pneumothorax 49
513-519 Other Diseases of Respiratory System 517786 Unknown 2922V71 N.S.D. 3449
Diseases Other than TB & Resp System 4189
Total 37942
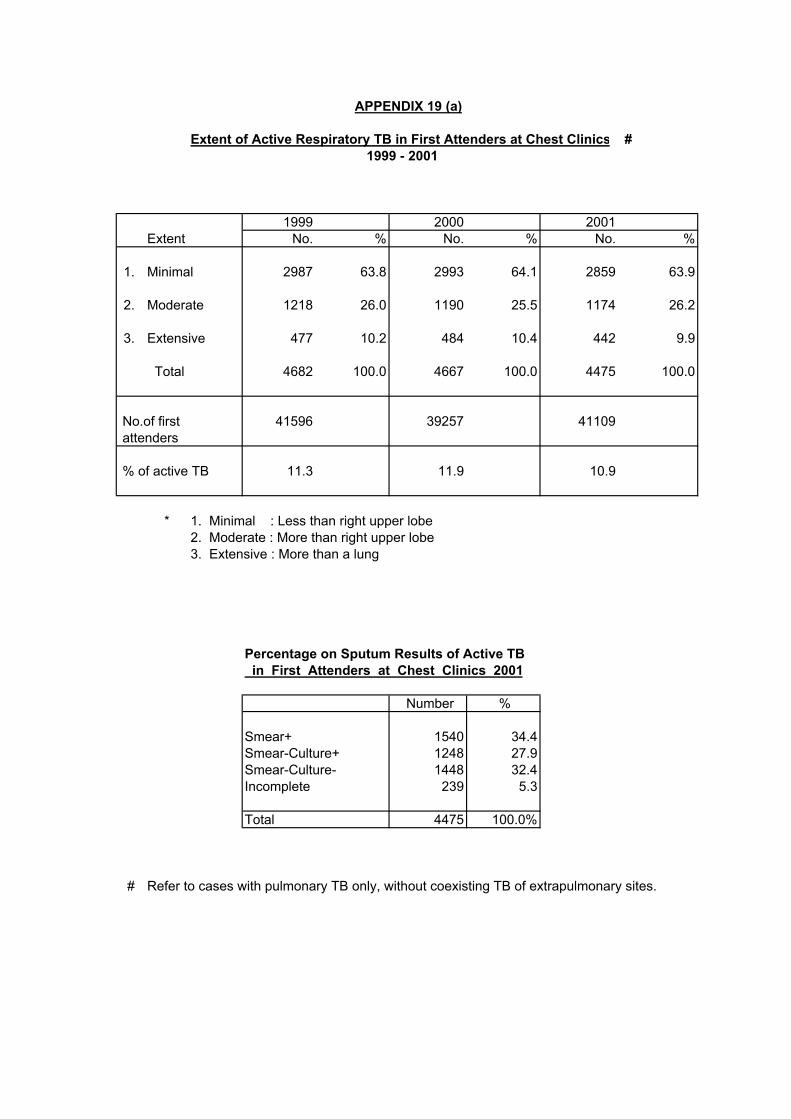
APPENDIX 19 (a)
Extent of Active Respiratory TB in First Attenders at Chest Clinics # 1999 - 2001
1999 2000 2001Extent No. % No. % No. %
1. Minimal 2987 63.8 2993 64.1 2859 63.9
2. Moderate 1218 26.0 1190 25.5 1174 26.2
3. Extensive 477 10.2 484 10.4 442 9.9
Total 4682 100.0 4667 100.0 4475 100.0
No.of first 41596 39257 41109 attenders
% of active TB 11.3 11.9 10.9
* 1. Minimal : Less than right upper lobe2. Moderate : More than right upper lobe3. Extensive : More than a lung
Percentage on Sputum Results of Active TB in First Attenders at Chest Clinics 2001
Number %
Smear+ 1540 34.4Smear-Culture+ 1248 27.9Smear-Culture- 1448 32.4Incomplete 239 5.3
Total 4475 100.0%
# Refer to cases with pulmonary TB only, without coexisting TB of extrapulmonary sites.
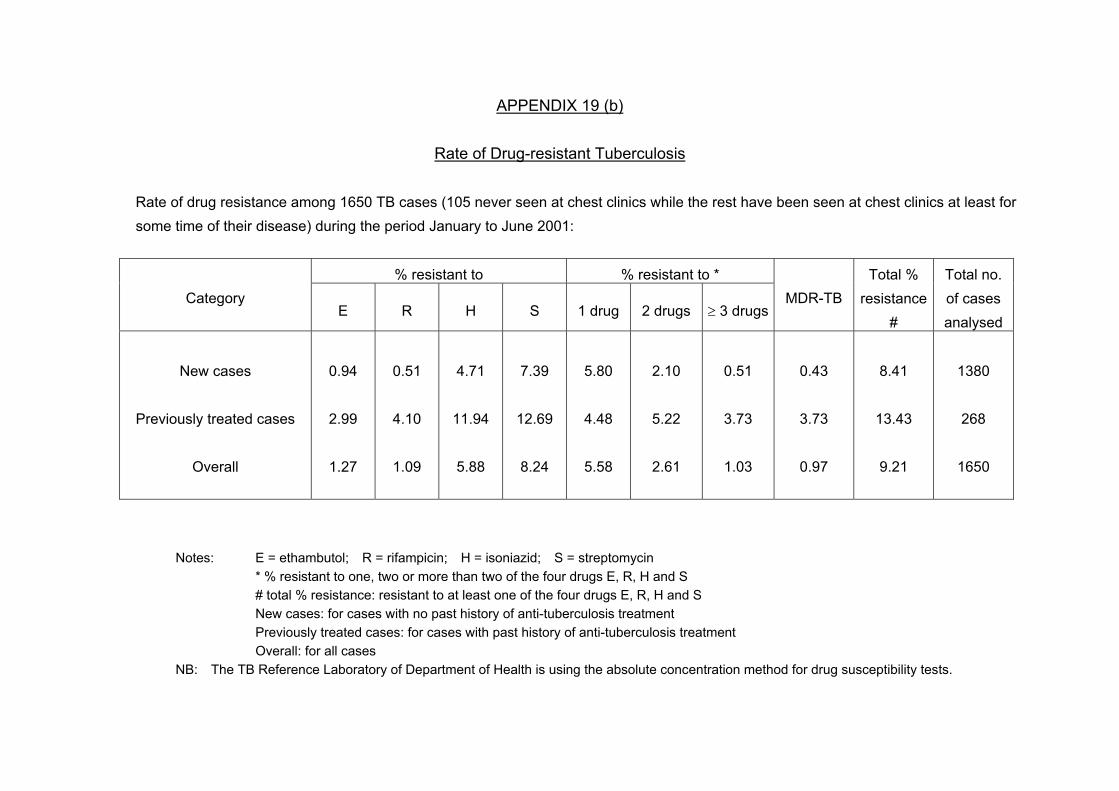
APPENDIX 19 (b)
Rate of Drug-resistant Tuberculosis
Rate of drug resistance among 1650 TB cases (105 never seen at chest clinics while the rest have been seen at chest clinics at least for some time of their disease) during the period January to June 2001:
% resistant to % resistant to *
Category E R H S 1 drug 2 drugs ≥ 3 drugs
MDR-TB Total %
resistance#
Total no. of cases analysed
New cases
Previously treated cases
Overall
0.94
2.99
1.27
0.51
4.10
1.09
4.71
11.94
5.88
7.39
12.69
8.24
5.80
4.48
5.58
2.10
5.22
2.61
0.51
3.73
1.03
0.43
3.73
0.97
8.41
13.43
9.21
1380
268
1650
Notes: E = ethambutol; R = rifampicin; H = isoniazid; S = streptomycin * % resistant to one, two or more than two of the four drugs E, R, H and S # total % resistance: resistant to at least one of the four drugs E, R, H and S New cases: for cases with no past history of anti-tuberculosis treatment Previously treated cases: for cases with past history of anti-tuberculosis treatment Overall: for all cases NB: The TB Reference Laboratory of Department of Health is using the absolute concentration method for drug susceptibility tests.

APPENDIX 19 (c)
Rate of Drug-resistant Tuberculosis
Among cases seen at chest clinics with date of starting treatment during the period January to December 2000
% resistant to % resistant to Age
group
Category
E R H S 1 drug 2 drugs ≥ 3 drugs MDR-TB
Total %
resistance
Total no. of
cases
analysed
0-19
New cases
Retreatment cases
Overall
0.00
0.00
0.00
0.00
0.00
0.00
3.08
33.33
4.41
8.46
16.67
8.82
5.38
0.00
5.15
3.08
16.67
3.68
0.00
0.00
0.00
0.00
0.00
0.00
8.46
16.67
8.82
130
6
136
20-39
New cases
Retreatment cases
Overall
0.95
5.36
1.26
1.49
14.29
2.52
4.88
19.64
6.04
8.27
16.07
8.93
6.10
5.36
6.04
2.17
8.93
2.64
0.95
8.93
1.64
1.08
14.29
2.14
9.21
23.21
10.31
738
56
795
40-59
New cases
Retreatment cases
Overall
0.51
4.73
1.17
0.38
10.14
1.92
5.70
19.59
7.88
8.99
15.54
10.01
5.82
5.41
5.75
3.16
7.43
3.83
0.38
6.76
1.38
0.25
8.11
1.49
9.37
19.59
10.97
790
148
939
60up
New cases
Retreatment cases
Overall
0.38
1.09
0.51
0.31
2.18
0.63
5.31
11.64
6.41
6.70
12.36
7.75
4.23
4.73
4.38
2.46
5.45
2.98
0.38
2.55
0.76
0.31
2.18
0.63
7.08
12.73
8.13
1299
275
1575
All
New cases
Retreatment cases
Overall
0.54
2.68
0.84
0.61
5.98
1.39
5.21
15.26
6.65
7.78
13.81
8.68
5.17
4.95
5.17
2.60
6.60
3.16
0.51
4.54
1.10
0.47
5.36
1.19
8.29
16.08
9.43
2957
485
3445
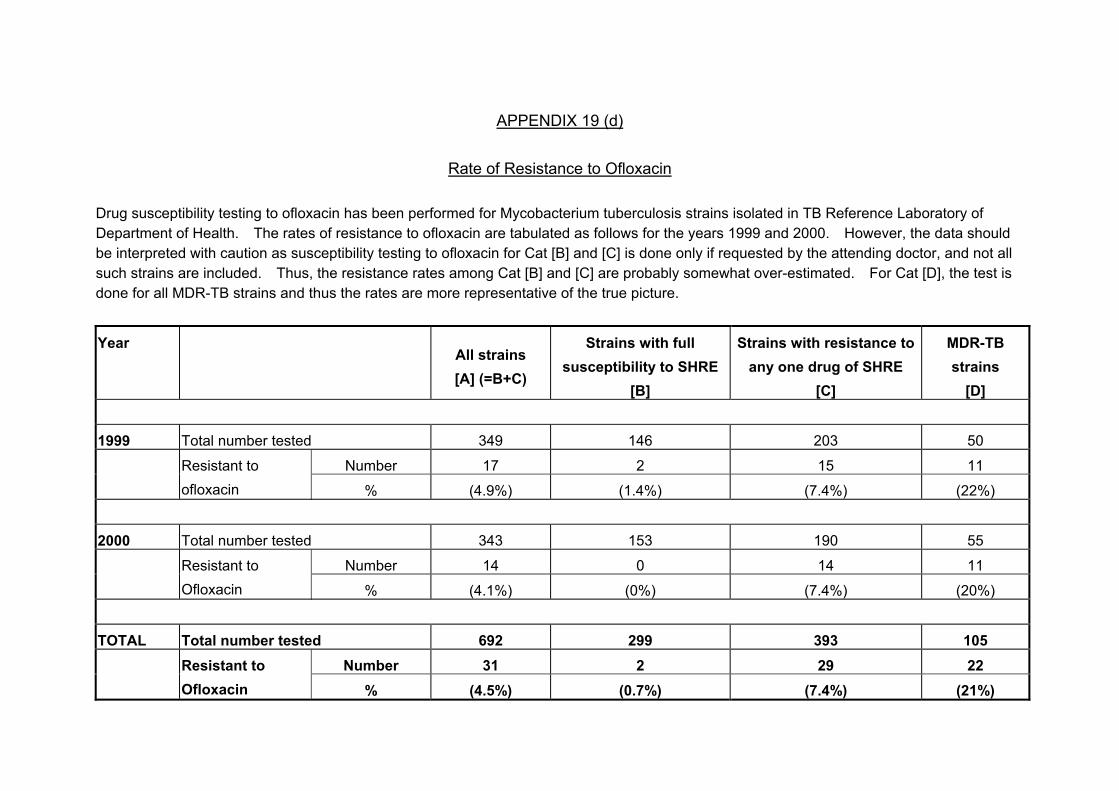
APPENDIX 19 (d)
Rate of Resistance to Ofloxacin Drug susceptibility testing to ofloxacin has been performed for Mycobacterium tuberculosis strains isolated in TB Reference Laboratory of Department of Health. The rates of resistance to ofloxacin are tabulated as follows for the years 1999 and 2000. However, the data should be interpreted with caution as susceptibility testing to ofloxacin for Cat [B] and [C] is done only if requested by the attending doctor, and not all such strains are included. Thus, the resistance rates among Cat [B] and [C] are probably somewhat over-estimated. For Cat [D], the test is done for all MDR-TB strains and thus the rates are more representative of the true picture. Year
All strains [A] (=B+C)
Strains with full susceptibility to SHRE
[B]
Strains with resistance to any one drug of SHRE
[C]
MDR-TB strains
[D] 1999 Total number tested 349 146 203 50
Number 17 2 15 11 Resistant to ofloxacin % (4.9%) (1.4%) (7.4%) (22%)
2000 Total number tested 343 153 190 55
Number 14 0 14 11 Resistant to Ofloxacin % (4.1%) (0%) (7.4%) (20%)
TOTAL Total number tested 692 299 393 105 Number 31 2 29 22 Resistant to
Ofloxacin % (4.5%) (0.7%) (7.4%) (21%)

` APPENDIX 20 (a)
Treatment Return 2001
Service regimenN p N s u u Transfer u t m t out to Drop out Complete defaulter m i
Name of b Interrup. b l clinic/hospital e o Brought in Treatment completed Rx Died e l Unsup. Incomp. No.def.
r n temp. r Rx hosp other Rx by Leave Def. AMA <2M >2M, >3M % o Rx super. >2m, cc GP HK >1x <3M n
b/f Rx Rx <3m 1 2 3 4 5 <6M at6m >6m % c/f
A B C D E F G H I J K L M N O P Q R S T U V W X Y ZFULL TIME CLINICSEast Kowloon 225 152 6 14 146 191 6 120 177 86.8 85 80 0 10 1 6 1 5 5 14 4 6.7 220 17 50 14Kowloon 235 368 17 20 264 205 99 153 275 85.1 166 185 0 26 3 14 1 8 12 7 5 4.8 155 2 176 0South Kwai Chung 378 333 21 28 207 130 11 220 343 91.2 97 44 0 16 3 9 2 13 8 1 4 2.1 326 0 134 4Sai Ying Pun 220 172 12 9 133 126 6 118 191 90.9 118 27 0 12 1 10 0 2 2 1 3 1.8 181 0 74 1Shaukiwan 212 149 2 16 164 165 5 102 183 89.1 98 51 3 7 0 12 0 11 1 3 1 1.6 231 1 89 5Shek Kip mei 219 211 9 6 147 119 6 129 189 86.9 108 46 0 10 2 9 0 14 2 1 10 3.6 185 0 85 2Wanchai 333 303 7 21 233 185 15 219 232 87.7 176 50 0 3 5 31 1 9 5 4 6 2.9 326 3 174 19Yan Oi 317 365 6 22 166 176 15 202 269 87.9 131 42 1 24 1 21 2 4 4 2 9 2.8 325 1 93 12Yaumatei 330 325 20 28 170 206 24 205 264 85.4 102 79 3 10 5 30 4 11 5 8 11 4.4 318 0 89 16Yuen Chau Kok 297 308 5 11 182 119 12 179 227 88.8 90 43 0 20 6 12 4 5 3 0 5 1.8 316 3 137 0Yung Fung Shee 290 201 37 11 176 113 4 165 208 87.4 54 90 0 12 5 11 1 15 0 1 10 2.6 252 0 103 0Tung Chung 22 18 1 1 16 36 1 19 15 89.5 14 6 0 0 1 0 0 3 0 0 0 0.0 35 0 17 0
sub-total 3078 2905 143 187 2004 1771 204 1831 2573 87.9 1239 743 7 150 33 165 16 100 47 42 68 3.1 2870 27 1221 73HOSPITALDISCHARGECLINICSEast Kowloon 5 0 0 0 1 2 0 0 7 100.0 1 0 0 0 0 0 0 0 0 0 0 0.0 0 0 0 0Kowloon 0 0 0 0 0 0 0 0 0 0.0 0 0 0 0 0 0 0 0 0 0 0 0.0 0 0 0 0
sub-total 5 0 0 0 1 2 0 0 7 100.0 1 0 0 0 0 0 0 0 0 0 0 0.0 0 0 0 0PART TIMECLINICSCastle Peak 13 11 0 0 2 4 0 0 17 81.0 0 1 2 0 0 0 0 0 0 0 4 19.0 6 0 0 0Cheung Chau 6 4 0 0 4 2 0 0 4 80.0 1 1 0 1 0 0 0 0 0 0 0 0.0 9 0 0 0Sai Kung 14 2 0 1 7 10 0 4 11 100.0 4 2 0 0 0 0 0 0 0 0 0 0.0 13 0 3 0Sheung Shui 110 92 4 1 87 48 2 49 88 86.2 26 18 0 8 0 7 1 3 1 0 3 2.5 136 0 103 1Tai Po 144 99 4 0 94 47 3 73 100 94.5 27 25 0 4 0 4 0 0 0 0 2 1.1 150 2 105 8Yuen long 107 98 2 3 48 49 1 57 88 91.2 14 16 0 5 1 4 1 2 0 0 2 1.3 116 0 93 7
sub-total 394 306 10 5 242 160 6 183 308 90.6 72 63 2 18 1 15 2 5 1 0 11 2.2 430 2 304 16INSTITUTIONSCORRECTIONALSERVICE DEPT.Hei Ling Chau 0 0 0 0 0 0 0 0 0 0.0 0 0 0 0 0 0 0 0 0 0 0 0.0 0 0 0 0Stanley Prison 19 34 0 0 0 0 9 0 28 100.0 0 0 0 0 0 0 0 0 0 0 0 0.0 16 0 0 0Shek Pik Prison 7 5 0 0 0 0 0 0 0 0.0 0 0 6 0 0 0 0 0 0 0 0 0.0 6 0 0 0
sub-total 26 39 0 0 0 0 9 0 28 100.0 0 0 6 0 0 0 0 0 0 0 0 0.0 22 0 0 0
TOTAL 3503 3250 153 192 2247 1933 219 2014 2916 88.3 1312 806 15 168 34 180 18 105 48 42 79 3.0 3322 29 1525 89

APPENDIX 20 (b)
Treatment Treturn 2001 (Cont'd)
Other regimensN p N s u u Transfer u t m t out to Drop out Complete defaulter m i
Name of b Brought in Treatment Interrup. b l clinic/hospital e o completed Rx Died e l Unsup. Incomp. No.def.
r n temp. r Rx hosp other Rx by Leave Def. AMA <2M >2M, >3M % o Rx super. >2m, cc GP HK >1x <3M n
b/f Rx Rx <3m1 2 3 4 5 <6M at6m >6m % c/f
A B C D E F G H I J K L M N O P Q R S T U V W X Y ZFULL TIME CLINICSEast Kowloon 35 3 3 0 57 24 2 8 31 86.7 22 18 0 3 0 0 0 1 0 2 0 4.4 35 8 23 3Kowloon 157 9 6 10 65 41 12 2 39 70.7 31 13 0 11 1 1 0 3 1 0 0 1.7 174 1 30 0South Kwai Chung 52 6 11 7 39 11 3 11 24 87.5 18 2 1 2 0 0 0 2 0 0 1 2.5 62 0 18 0Sai Ying Pun 19 2 1 3 18 3 0 0 16 94.1 5 2 0 0 0 1 0 0 0 0 0 0.0 22 0 7 0Shaukiwan 23 2 0 2 13 12 0 2 17 100.0 15 2 1 0 0 0 0 0 0 0 0 0.0 15 0 5 0Shek Kip mei 45 2 4 3 47 9 0 3 14 77.3 12 3 0 1 0 0 0 3 0 1 0 4.5 73 0 25 1Wanchai 31 5 0 15 16 16 2 0 24 82.8 18 1 0 1 0 2 0 1 0 0 1 3.4 33 0 18 0Yan Oi 30 0 1 3 12 15 3 1 8 90.0 10 3 2 0 0 0 1 0 0 0 1 10.0 32 0 1 0Yaumatei 26 12 8 6 38 21 3 9 26 71.4 16 3 0 3 0 0 0 4 4 1 2 14.3 40 0 20 1Yuen Chau Kok 33 10 2 9 23 18 1 1 40 97.6 17 2 1 1 0 0 0 0 0 0 0 0.0 32 0 38 0Yung Fung Shee 22 7 7 2 32 7 1 1 19 83.3 9 11 0 0 0 0 0 3 0 0 1 4.2 32 0 12 0Tung Chung 1 0 0 1 2 0 0 0 0 0.0 1 0 0 0 0 0 0 0 0 0 0 0.0 3 0 0 0
sub-total 474 58 43 61 362 177 27 38 258 83.4 174 60 5 22 1 4 1 17 5 4 6 4.2 553 9 197 5HOSPITAL DISCHARGE CLINICS East Kowloon 6 1 0 2 4 7 2 1 5 100.0 8 0 0 0 0 0 0 0 0 0 0 0.0 4 1 0 0Kowloon 0 0 0 0 0 0 0 0 0 0.0 0 0 0 0 0 0 0 0 0 0 0 0.0 0 0 0 0
sub-total 6 1 0 2 4 7 2 1 5 100.0 8 0 0 0 0 0 0 0 0 0 0 0.0 4 1 0 0PART TIMECLINICSCastle Peak 0 0 0 0 0 0 0 0 0 0.0 0 0 0 0 0 0 0 0 0 0 0 0.0 0 0 0 0Cheung Chau 0 0 0 0 0 0 0 0 0 0.0 0 0 0 0 0 0 0 0 0 0 0 0.0 0 0 0 0Sai Kung 1 0 0 0 0 0 0 0 0 0.0 0 0 0 0 0 0 0 0 0 0 0 0.0 1 0 0 0Sheung Shui 2 3 0 1 1 1 0 0 1 50.0 2 0 0 0 0 0 0 0 0 1 0 50.0 4 0 11 0Tai Po 10 1 0 1 4 1 0 0 8 100.0 1 1 0 0 0 0 0 0 0 0 0 0.0 7 0 7 0Yuen long 7 2 0 0 4 1 0 0 6 100.0 1 0 0 0 0 0 0 0 0 0 0 0.0 7 0 13 0
sub-total 20 6 0 2 9 3 0 0 15 93.8 4 1 0 0 0 0 0 0 0 1 0 6.3 19 0 31 0INSTITUTIONSCORRECTIONALSERVICE DEPT.Hei Ling Chau 19 15 63 47 29 0 2 0 0 0.0 0 4 0 0 0 0 0 0 0 0 0 0.0 167 0 0 0Stanley Prison 0 0 0 0 0 0 0 0 0 0.0 0 0 0 0 0 0 0 0 0 0 0 0.0 0 0 0 0Shek Pik Prison 0 0 0 0 0 0 0 0 0 0.0 0 0 0 0 0 0 0 0 0 0 0 0.0 0 0 0 0
sub-total 19 15 63 47 29 0 2 0 0 0.0 0 4 0 0 0 0 0 0 0 0 0 0.0 167 0 0 0
TOTAL 519 80 106 112 404 187 31 39 278 84.1 186 65 5 22 1 4 1 17 5 5 6 4.2 743 10 228 5

APPENDIX 20 (c)
Explanatory Notes for Appendices 20(a) & 20(b)
Service regimen / Other regimens *
Transfer out toDrop out Complete defaulter Number Unsup. Incomp. No. Def.
Name of Interrup. clinic/hospital Brought in Treatment completed Rx Died still Rx Super. >2m,
temp. hospi- other Rx by Leave Def. AMA <2M >2M, >3M % on Rx Rx <3m
tal cc GP HK >1x <3M
c/fb/f
<6M at 6M >6M % A B * C * D * E * F * G H I J K L M N O P Q R S T U V W X Y Z
H + I A + B + C + D + E + F - G - K - L - M - Q - W
S + T + U A + B + C + D + E + F - G - K - L - M - Q - W
(A+B+C+D+E+F) - (G+H+I+K+L+M+N+O+P+Q+R+S+T+U)
* Explanatory Notes :
Service regimen Upon starting treatment, the regimen contains any combination of drugs including H (isoniazid), R (rifampicin),Z (pyrazinamide), E (ethambutol), and S (streptomycin).
Other regimens Upon starting treatment, the regimen contains second line drugs apart from H, R, Z, E or S.
Item B New cases with treatment started in chest clinics.Item C Retreatment cases, with treatment newly started. Previous treatment either not completed, or even if claimed to be completed,
without documentation in the available clinic record.Item D Relapse cases, with treatment newly started. Previous treatment is completed with documentation in the available clinic record.Item E Treatment cases transferred in from hospitals, private doctors, etc. without treatment started previously at any chest
clinics for this episode of tuberculosis.Item F Other transferred in treatment cases, with treatment given previously in any chest clinics for this episode of tuberculosis.
V =
J =
W =

APPENDIX 20 (d)
Explanatory Notes For Appendices 20(a) and 20(b) Appendix 20 (a) : Service regimen: For treatment cases who, upon starting anti-TB drugs, were
given any combination of drugs including H (isoniazid), R (rifampicin), Z (pyrazinamide), E (ethambutol), and S (streptomycin).
Appendix 20 (b) : Other regimens: For treatment cases who, upon starting anti-TB drugs, were given also second line drugs apart from H, R, Z, E or S.
Number put on treatment b/f: (A) - No. put on Rx b/f: Total number of treatment cases c/f from last month’s balance. Brought in: - Items (B), (C), (D) & (E) will be using a new treatment number, while item (F) will
be using the same previous treatment number, as follows: (B) (1) Newly started treatment in your chest clinic. (C) (2) Retreatment cases, with treatment newly started, including: Cases previously classified under items(O), (P), (Q), (R), (S), (T) or (U) in
the most recent episode of treatment, with treatment restarted now after treatment has been interrupted for over 2 months;
Cases claiming to have anti-TB treatment completed previously in chest clinic or chest hospital, but the clinic record is not available, e.g., because it has been destroyed;
Cases claiming to have anti-TB treatment completed previously from sources other than chest clinic or chest hospital.
(D) (3) Relapse case: Cases having treatment completed previously (even if this is completed
less than 2 months ago) in either chest clinic or chest hospital as indicated in the clinic record which is still available, e.g., cases classified under items (H) or (I) in the most recent episode.
(E) (4) Transfer in from hospitals, general practitioners (GPs), or prison: Cases previously unknown to any one chest clinic for this episode of
treatment. (F) (5) Cases using the same previous treatment number: Cases previously known to chest clinic for this episode of treatment, and
now being transferred in from other chest clinics, hospitals, GPs, or prison, e.g., cases previously classified under items (K) or (L);
Cases previously classified under items (O), (P), (Q), (R), or (S) in the most recent episode of treatment, with treatment restarted now after treatment has been interrupted for less than 2 months;
Cases previously classified under item (M), and resuming treatment now.
Treatment completed: (G) < 6m: Treatment stopped permanently by doctor prematurely, e.g., revised diagnosis. (H) at 6m: Treatment stopped permanently by doctor at or within 2 weeks of 6 month from
DOS. (I) > 6m: Treatment stopped permanently by doctor at 7 month or more. (J) % = (H + I)/(A + B + C + D + E + F – G – K – L – M – Q – W) Transfer out to: (K) hosp: Admission to hospital. (L) other cc: Transfer out to other chest clinics.
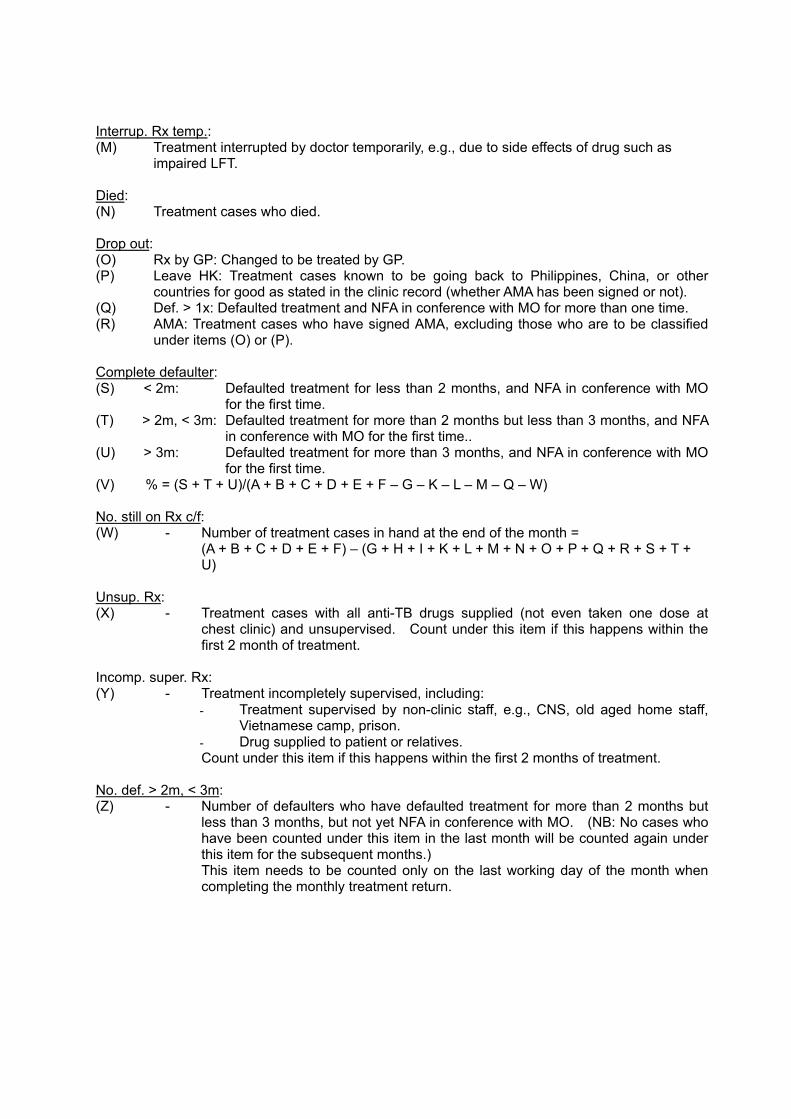
Interrup. Rx temp.: (M) Treatment interrupted by doctor temporarily, e.g., due to side effects of drug such as
impaired LFT. Died: (N) Treatment cases who died. Drop out: (O) Rx by GP: Changed to be treated by GP. (P) Leave HK: Treatment cases known to be going back to Philippines, China, or other
countries for good as stated in the clinic record (whether AMA has been signed or not). (Q) Def. > 1x: Defaulted treatment and NFA in conference with MO for more than one time. (R) AMA: Treatment cases who have signed AMA, excluding those who are to be classified
under items (O) or (P). Complete defaulter: (S) < 2m: Defaulted treatment for less than 2 months, and NFA in conference with MO
for the first time. (T) > 2m, < 3m: Defaulted treatment for more than 2 months but less than 3 months, and NFA
in conference with MO for the first time.. (U) > 3m: Defaulted treatment for more than 3 months, and NFA in conference with MO
for the first time. (V) % = (S + T + U)/(A + B + C + D + E + F – G – K – L – M – Q – W) No. still on Rx c/f: (W) - Number of treatment cases in hand at the end of the month =
(A + B + C + D + E + F) – (G + H + I + K + L + M + N + O + P + Q + R + S + T + U)
Unsup. Rx: (X) - Treatment cases with all anti-TB drugs supplied (not even taken one dose at
chest clinic) and unsupervised. Count under this item if this happens within the first 2 month of treatment.
Incomp. super. Rx: (Y) - Treatment incompletely supervised, including: Treatment supervised by non-clinic staff, e.g., CNS, old aged home staff,
Vietnamese camp, prison. Drug supplied to patient or relatives. Count under this item if this happens within the first 2 months of treatment.
No. def. > 2m, < 3m: (Z) - Number of defaulters who have defaulted treatment for more than 2 months but
less than 3 months, but not yet NFA in conference with MO. (NB: No cases who have been counted under this item in the last month will be counted again under this item for the subsequent months.) This item needs to be counted only on the last working day of the month when completing the monthly treatment return.
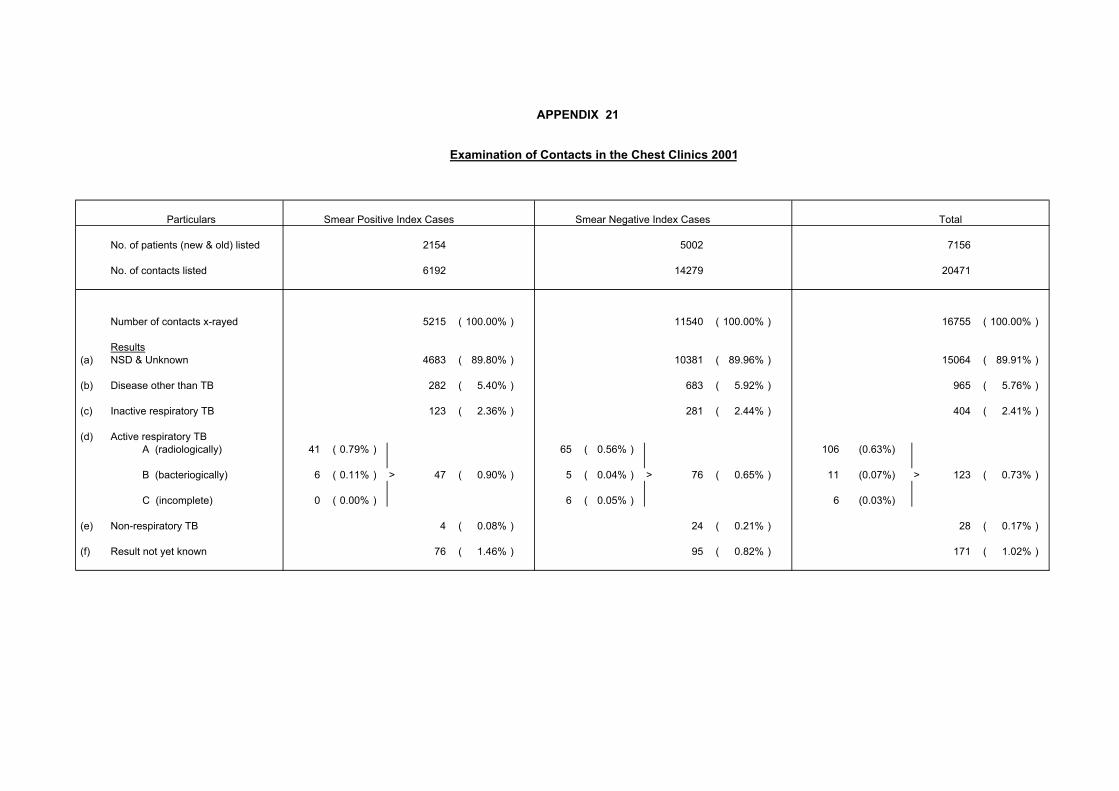
APPENDIX 21
Examination of Contacts in the Chest Clinics 2001
Particulars Smear Positive Index Cases Smear Negative Index Cases Total
No. of patients (new & old) listed 2154 5002 7156
No. of contacts listed 6192 14279 20471
Number of contacts x-rayed 5215 ( 100.00% ) 11540 ( 100.00% ) 16755 ( 100.00% )
Results (a) NSD & Unknown 4683 ( 89.80% ) 10381 ( 89.96% ) 15064 ( 89.91% )
(b) Disease other than TB 282 ( 5.40% ) 683 ( 5.92% ) 965 ( 5.76% )
(c) Inactive respiratory TB 123 ( 2.36% ) 281 ( 2.44% ) 404 ( 2.41% )
(d) Active respiratory TB A (radiologically) 41 ( 0.79% ) 65 ( 0.56% ) 106 (0.63%)
B (bacteriogically) 6 ( 0.11% ) > 47 ( 0.90% ) 5 ( 0.04% ) > 76 ( 0.65% ) 11 (0.07%) > 123 ( 0.73% )
C (incomplete) 0 ( 0.00% ) 6 ( 0.05% ) 6 (0.03%)
(e) Non-respiratory TB 4 ( 0.08% ) 24 ( 0.21% ) 28 ( 0.17% ) (f) Result not yet known 76 ( 1.46% ) 95 ( 0.82% ) 171 ( 1.02% )

APPENDIX 22 (a)
Scheme for Tuberculin Testing and BCG Administration in Hong Kong, 2001
Population Group Procedure
Newborns
Direct BCG • Government and most other inoculators
using intradermal method • A small proportion of other inoculators
using percutaneous method Negative BCG history and/or negative BCG scar
Direct BCG with intradermal method (since September 2000)
Children under the age of 15 (excluding close contacts)
BCG history and BCG scar No action
Primary School Children (aged 6-10) BCG revaccination programme stopped since September 2000
Under 5 See Appendix 22 (b) Close contacts
5 years and over Chest X-ray
Notes: (1) Freeze dried BCG from Statens Serum Institut of Denmark being used (2) Any child with symptoms and/or BCG complications should be seen by a doctor

APPENDIX 22 (b)
Household Contacts below 5 (with history of previous BCG vaccination)
Index case with TB Smear +ve pulm TB Smear –ve TB
CXR + Clinical TT + Clinical (If age < 3 m and well, perform TT after 3 month old)
TT≧10mm Normal Abnormal
TT≦9mm Investigate
Age < 1 Age 1 to 5
TTa
TTa≧15mm
TTa≦14mm Discuss for treatment of LTBI using INAH (5mg/kg qd for 6 months) after exclusion of active TB.
Recheck TTb at 3 month
TTb-TTa≧10mm or
TTb≧15mm
TTb-TTa<10mm and TTb≦14mm
Health education. FU at 1 year with telephone interview & outcome at 1 yr recorded.
Discuss for treatment of LTBI using INAH (5mg/kg qd for 3 months) after exclusion of active TB.
Check TT at 3 month
TT≧5mm TT≦4mm
Complete treatment of LTBI for a total of 6 months.
Stop INAH. Give BCG if previously given within 2 months of starting INAH treatment.
Observe CXR
Health education
If refuses preventive treatment, just observe
Note: Tuberculin test (TT) is done by intradermal method using 2 TU (in 0.1 ml) of PPD-RT23. In general, the criteria for a positive TT is a reaction at 48-72 hour with diameter of induration at 10 mm or above. However, special criteria for TT is being used in the above flow chart for the special groups under consideration. [5 TU of PPD-S, which is widely used in the United States, is equivalent to 2 TU of PPD-RT23.]

APPENDIX 23
BCG Vaccinations at Birth 2001
No. of BCG Institution Live-births Vaccination % VaccinatedHospital P.Y. Nethersole 3730 3717 99.7under HA Queen Mary 1163 1185 101.9 *management Tsan Yuk 2901 2686 92.6Private Hospital Canossa 688 685 99.6
H.K. Adventist 666 629 94.4HK Sanatorium 677 662 97.8 Matilda 861 797 92.6St. Paul's 1308 1294 98.9
Total (HK Island) 11994 11655 97.2
Hospital Kwong Wah 5626 5596 99.5under HA Queen Elizabeth 4165 4186 100.5 *management United Christian 3546 3561 100.4Private Hospital Baptist 3544 3492 98.5
St. Teresa's 2575 2530 98.3
Total (Kowloon) 19456 19365 99.5
Hospital Prince of Wales 5536 5534 100.0 under HA Princess Margaret 3916 3913 99.9 management Tuen Mun 5500 5489 99.8Private Hospital Adventist 658 651 98.9
Union 1174 1160 98.8Government Maternity Home - - -
Total (NT Areas) 16784 16747 99.8
GRAND TOTAL 48234 47767 99.0
Note : * Including vaccinations of live births transferred from other maternityinstitutions and vaccinations of live births at end of 2001
Vaccination Method 2000 Percentage
Intradermal 71.3Percutaneous 28.7

APPENDIX 24
Tuberculin Tests and BCG Vaccination of School Children 1962 - 2000
Number % of TT Number (a) % Agree Number TT Number Tested
Year Eligible for TT TT Negative Given Given Tested (TT<=9mm) BCG BCG
1962 49567 22903 46.21963 34793 10706 30.81964 38871 9764 25.11965 76407 10845 14.21966 77447 10911 14.11967 224666 56.1 125975 25794 25766 20.51968 208029 68.2 141922 30328 30314 21.41969 126906 70.4 89306 16831 16821 18.81970 194298 65.7 127680 49655 49547 38.81971 213457 68.0 145205 50115 50020 34.41972 201537 61.7 124385 54340 54100 43.51973 120797 69.4 83882 29713 29554 35.21974 295287 60.7 179169 47591 47378 26.41975 136175 65.3 88987 38334 (b) 39120 44.01976 230861 63.7 147057 77085 76790 52.21977 137465 55.4 76143 43752 43502 57.11978 134218 66.9 89732 52504 54137 60.31979 133697 66.1 88375 49555 49355 55.81980 101215 66.8 67633 42419 43830 64.81981 111121 68.7 76342 47093 47089 61.71982 115042 71.9 82675 52654 52455 63.41983 121392 77.9 94578 65487 65627 69.41984 71950 85.3 61359 47086 47705 77.71985 90771 82.4 74802 56646 56625 75.71986 100116 82.0 82057 65251 64985 79.21987 84610 79.2 67038 53695 53419 79.71988 78806 89.2 70318 58796 59237 84.21989 68367 91.3 62390 50747 50794 81.41990 121280 86.0 104263 78244 78540 75.31991 120705 91.3 110193 75343 75107 68.21992 102580 91.2 93533 63550 (c) 63234 67.61993 100895 96.3 97189 69723 68598 70.61994 91593 94.8 86817 65075 66372 76.51995 94614 93.4 88378 65044 64005 72.41996 73265 92.3 67625 49619 49113 72.61997 61445 97.2 59746 49824 49336 82.61998 91523 95.4 87271 74199 74008 84.81999 106483 92.1 98069 80322 80103 81.72000 (d) 16542 99.0 16377 13603 13209 80.72001 Programme Stopped
Note : (a) By "number eligible" is meant the total population in the specified age group whichit was intended to test and/or vaccinate, i.e. the number of persons in each area who could have been tested and/or vaccinated during the period of reporting according to the prevailing policy, by the staff assigned to that area.
(b) Direct BCG was introduced in remote areas w.e.f. 27.10.1975 andnumber of BCG given includes direct BCG without TT.
(c) No direct BCG was given in 1992 and number of direct BCG givenin previous years were not recorded separately.
(d) The BCG revaccination programme was stopped since September 2000.

APPENDIX 25
Beds for Treatment of Tuberculosis, 2001
No. of Hospital TB Beds
Grantham Hospital 196
Kowloon Hospital 122 *HospitalAuthority Ruttonjee Hospital 157
Haven of Hope Hospital 133
Wong Tai Sin Hospital 165
Total (Hospital Authority) 773
St. Paul's Hospital -Private
Hong Kong Sanatorium -
Total (Private) 0
Victoria Prison Hospital -
Custody Stanley Prison Hospital 20
Tai Lam Correctional Institution -
Total (Custody) 20
Grand Total (2001) 793
Grand Total (2000) 795
Grand Total (1999) 799
* Including two beds in the Intensive Care Unit
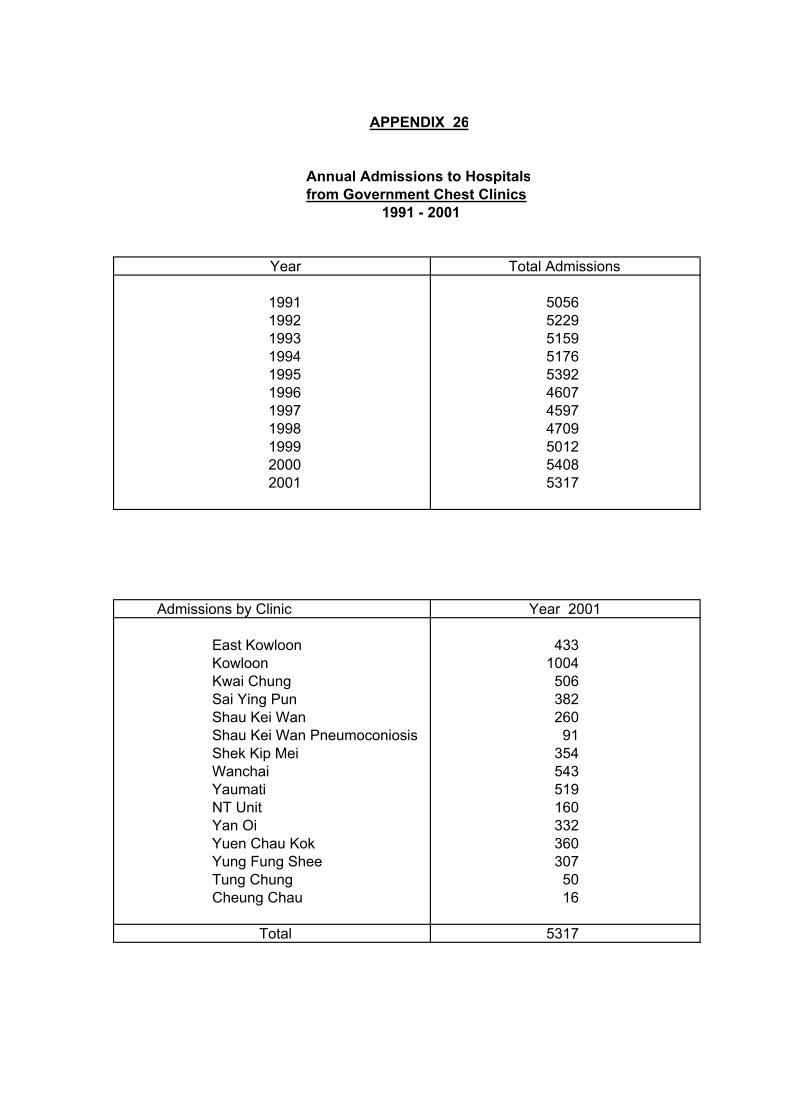
APPENDIX 26
Annual Admissions to Hospitalsfrom Government Chest Clinics
1991 - 2001
Year Total Admissions
1991 50561992 52291993 51591994 51761995 53921996 46071997 45971998 47091999 50122000 54082001 5317
Admissions by Clinic Year 2001
East Kowloon 433Kowloon 1004Kwai Chung 506Sai Ying Pun 382Shau Kei Wan 260Shau Kei Wan Pneumoconiosis 91Shek Kip Mei 354Wanchai 543Yaumati 519NT Unit 160Yan Oi 332Yuen Chau Kok 360Yung Fung Shee 307Tung Chung 50Cheung Chau 16
Total 5317
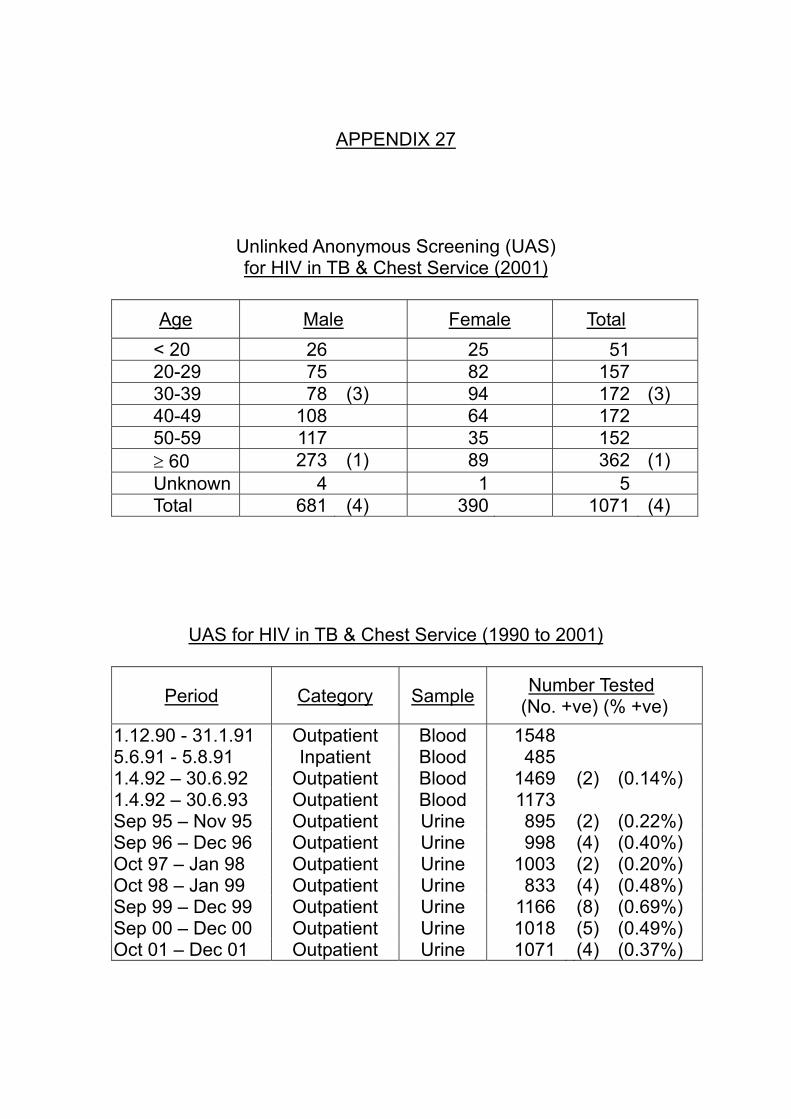
APPENDIX 27
Unlinked Anonymous Screening (UAS) for HIV in TB & Chest Service (2001)
Age Male Female Total
< 20 26 25 51 20-29 75 82 157 30-39 78 (3) 94 172 (3) 40-49 108 64 172 50-59 117 35 152 ≥ 60 273 (1) 89 362 (1) Unknown 4 1 5 Total 681 (4) 390 1071 (4)
UAS for HIV in TB & Chest Service (1990 to 2001)
Period Category Sample Number Tested (No. +ve) (% +ve)
1.12.90 - 31.1.91 Outpatient Blood 1548 5.6.91 - 5.8.91 Inpatient Blood 485 1.4.92 – 30.6.92 Outpatient Blood 1469 (2) (0.14%) 1.4.92 – 30.6.93 Outpatient Blood 1173 Sep 95 – Nov 95 Outpatient Urine 895 (2) (0.22%) Sep 96 – Dec 96 Outpatient Urine 998 (4) (0.40%) Oct 97 – Jan 98 Outpatient Urine 1003 (2) (0.20%) Oct 98 – Jan 99 Outpatient Urine 833 (4) (0.48%) Sep 99 – Dec 99 Outpatient Urine 1166 (8) (0.69%) Sep 00 – Dec 00 Outpatient Urine 1018 (5) (0.49%) Oct 01 – Dec 01 Outpatient Urine 1071 (4) (0.37%)

APPENDIX 28
Number of ‘Confirmed’ cases of TB in health care staff Notified to Labour Department (1993 – 2001)
Year Number 1993 1994 1995 1996 1997 1998 1999 2000 2001
0 1 2 2
10 39 57 39 41
‘Confirmed’ Cases of TB in Health Care Staff Notified to Labour Department (2001) by Age and Job Title
Age Group
Doctor Nurse (a) Other Allied
Health Professional
Other Supporting
Staff (b) Total
20 – 24 6 1 7 25 – 29 4 10 14 30 – 34 4 1 5 35 – 39 3 1 1 5 40 – 44 2 1 2 5 45 – 49 1 1 50 – 54 2 2 55 – 59 1 (c) 1 60 – 64 1 1
Total 5 26 2 8 41 Note:
(a) Nurse – include student nurses (b) Other supporting staff – includes service assistants and health care assistants (c) The ‘doctor’ was a herbalist

APPENDIX 29 (a)
Cohort of TB Patients Seen at Chest Clinics with DOS in 2000 ‘Programme Forms’ have been completed for a total of 6259 TB patients who were seen at chest clinics with DOS (date of starting treatment) from 1.1.2000 to 31.12.2000. They are categorised as follows:
(I) New pulmonary, smear positive 1517 24.24% (II) New pulmonary, smear negative 2908 46.46% (III) New pulmonary, smear not done/ unknown 207 3.31% (IV) New extra-pulmonary 772 12.33% (V) Relapse pulmonary, smear positive 188 3.00% (VI) Pulmonary smear-positive re-treatment after failure or default 23 0.37% (VII) All other re-treatment cases (not included in E and F) [i.e., including
relapses (pulmonary, smear negative or unknown or not done; and extrapulmonary) and re-treatment after failure or default (pulmonary, smear negative or unknown or not done; and extrapulmonary)]
571 9.12%
(VIII) Others 73 1.17% (IX) Total 6259 100%
NB. ‘Pulmonary TB’ includes cases with both pulmonary and extrapulmonary involvement. ‘Extrapulmonary TB’ refers to those
with extrapulmonary but without pulmonary involvement.

APPENDIX 29 (b)
Cohort of TB Patients Seen at Chest Clinics with DOS in 2000 Among the cohort of 6259 patients in 2000, 1517 (24.24%) were new smear positive pulmonary TB cases, and 188 (3.00%) were relapse smear positive pulmonary TB cases. Among these smear positive pulmonary TB cases, the outcomes at 12 month (from DOS) are shown in columns (A) and (B) in the table below respectively. In addition, there were 248 (3.96%) retreatment cases, including retreatment after failure, default, and retreatment after retreatment (smear positive, negative, or unknown). Among these, 218 were pulmonary cases. Their outcomes at 12 month are shown in columns (C) and (D) below respectively.
Category of outcomes New cases
(A) Relapse cases
(B)
Retreatment (All) (C)
Retreatment (Pulmonary)
(D)
(I) Treatment completed with sputum converted 1066 70.27% 126 67.02% 58 23.39% 58 26.61%
(II) Treatment completed (sputum conversion unknown) 81 5.34% 17 9.04% 76 30.65% 57 26.15%
(III) Still on treatment, but sputum smear –ve since 5 m 96 6.33% 18 9.57% 38 15.32% 34 15.60%
(IV) Still on treatment, sputum smear +ve between 5 m to 1 y 6 0.40% 2 1.06% 0 0.00% 0 0.00%
(V) Still on treatment, sputum smear unknown between 5 m to 1 y 20 1.32% 1 0.53% 7 2.82% 4 1.83%
(VI) Died from TB-related causes 3 0.20% 0 0.00% 4 1.61% 4 1.83%
(VII) Died from non-TB related causes 37 2.44% 5 2.66% 2 0.81% 2 0.92%
(VIII) Died from unknown causes 19 1.25% 2 1.06% 3 1.21% 2 0.92%
(IX) Defaulted 65 4.28% 6 3.19% 41 16.53% 40 18.35%
(X) Transferred 124 8.17% 11 5.85% 19 7.66% 17 7.80%
(XI) Total 1517 100% 188 100% 248 100% 218 100% From the above table, the treatment success rates for Categories (A), (B), (C) and (D) are 75.61%, 76.06%, 54.03% and 52.75% respectively. If cases who are still on treatment at 12 month are regarded as failure cases, then the treatment failure rates for Categories (A), (B), (C) and (D) will be 8.04%, 11.17%, 18.15% and 17.43% respectively.

Part 2
PNEUMOCONIOSIS

Contents Appendix
No.
1 New Cases of Suspected Pneumoconiosis attending the Pneumoconiosis Clinic in Hong Kong 1956-2001
2 Age Distribution of Pneumoconiosis Cases 20013 Occupation Distribution of Confirmed Pneumoconiosis 20014 Pneumoconiosis Patients by Duration of Exposure to Dust 20015 Pneumoconiosis Patients by Degree of Incapacity 200167 Pneumoconiosis Patients with Tuberculosis 20018 Confirmed Pneumoconiosis Patients by Other Particulars 2001
Confirmed Pneumoconiosis Patients Classified by Radiological Appearance 2001

APPENDIX 1
New Cases of Suspected Pneumoconiosis attending the Pneumoconiosis Clinic in Hong Kong 1956 - 2001
Number of New Cases Undergoing Assessment Cumulative
Year Government Non-government Cumulative Total Workers Workers Total Total Compensated
R1 R2
1956 1 - 1 11957 4 4 8 91958 9 13 22 311959 5 7 12 431960 9 6 15 581961 8 - 8 661962 3 1 4 701963 9 5 14 841964 21 17 38 1221965 9 4 13 1351966 7 9 16 1511967 3 6 9 1601968 4 2 6 1661969 4 10 14 1801970 22 36 58 2381971 9 18 27 2651972 9 29 38 3031973 3 39 42 3451974 - 97 97 4421975 5 84 89 5311976 15 252 267 7981977 3 216 219 10171978 12 207 219 12361979 2 210 212 14481980 12 532 (a) 544 1992 386 (a) -1981 8 608 616 2608 1332 1621982 4 511 515 3123 1434 6341983 2 292 294 3417 1469 9451984 1 231 232 3649 1477 11401985 1 179 180 (b) 3829 1479 13221986 3 176 179 (3) 4008 1485 15131987 4 166 170 (2) 4178 1485 16791988 6 172 178 (4) 4356 1488 18771989 - 156 156 (1) 4512 1488 20231990 2 147 149 (1) 4661 1489 21421991 - 171 171 (1) 4832 1489 21511992 2 171 173 (3) 5005 1490 23401993 2 247 249 (4) 5254 1492 24921994 - 327 327 (7) 5581 1493 27701995 9 245 254 (9) 5835 1494 30001996 4 193 197 (9) 6032 1494 31191997 4 154 158 (7) 6190 1494 32421998 2 197 199 (5) 6389 1494 33511999 - 291 291 (15) 6680 1494 35052000 3 235 238 (11) 6918 1494 36192001 6 230 236 (c) (9) 7154 1494 (d) 3751
Note : (a) The Pneumoconiosis Compensation Scheme was initiated in 1980, before that reporting were voluntary.(b) The figures in this column denote the number of patient with asbestos-related lung disease.(c) Up to the moment that this report is being compiled, only 132 of the 236 cases in 2001 had been
assesed and confirmed pneumoconiosis by the Pneumoconiosis Medical Board. And the following tables (Appendix 2 to Appendix 8) are compiled basing on the data of these 132 cases.
(d) Under Revised Ordinance 1993 : 583 out of 1494 pneumoconiotics had joined the pneumoconiosisex-gratia scheme up to the year 2001. 330 living pneumoconiotics were each receiving a monthlyex-gratia payment of $4710.00 in 2001.

APPENDIX 2
Age Distribution of Pneumoconiosis Cases 2001
Age Number of Cases %
25 - 29 - -
30 - 34 - -
35 - 39 - -
40 - 44 9 7
45 - 49 20 15
50 - 54 16 12
55 - 59 23 17
60 - 64 13 10
65 - 69 10 8
70 - 74 18 14
75+ 23 17
Total 132 100

APPENDIX 3
Occupation Distribution of Confirmed Pneumoconiosis 2001
Type of Occupation Number of Cases %
Construction 86 65 Construction/Quarry 28 21 Others 18 14
Total 132 100
APPENDIX 4
Pneumoconiosis Patients by Duration of Exposure to Dust 2001
Duration Number of Cases %
< 5 years 1 1
5 - 9 5 4
10 - 14 10 8
15 - 19 27 20
20 - 24 28 21
25 - 29 27 20
30+ 31 24
Unknown 3 * 2
Total 132 100
* Fatal cases, no reliable information available.
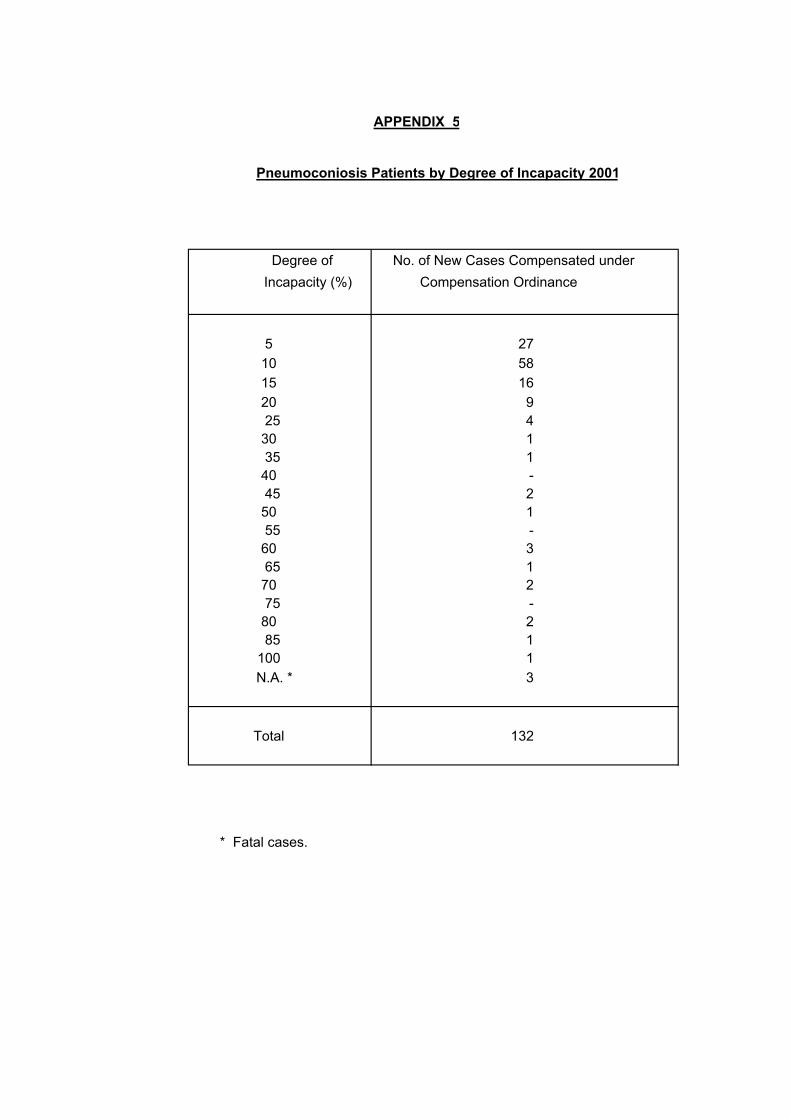
APPENDIX 5
Pneumoconiosis Patients by Degree of Incapacity 2001
Degree of No. of New Cases Compensated under Incapacity (%) Compensation Ordinance
5 2710 58 15 1620 925 430 135 140 - 45 250 155 -60 365 170 275 -80 285 1
100 1N.A. * 3
Total 132
* Fatal cases.

APPENDIX 6
Confirmed Pneumoconiosis PatientsClassified by Radiological Appearance 2001
ProfusionType of Opacity 1 2 3 Sub-Total
Small opacities
Rounded
p (up to 1.5 mm diameter) 6 - - 6
q (1.5 to 3.0 mm diameter) 61 14 - 75
r (3.0 to 10.0 mm diameter) 1 4 1 6
Irregular
s (fine irregular or linear) 6 - - 6
t (medium irregular) 4 1 - 5
u (coarse irregular) 4 2 - 6
Sub-total 82 21 1 104
Combined opacities 16 7 2 25
N.A. - - - 3
Total 132
33 out of the 132 patients have large opacities as follows :
Large opacities
A (Single opacity 1 - 5 cm or multiple opacities > 1 cm 23each but sum of diameter < 5 cm)
B (Single or multiple opacities with combined area 9< the equivalent of right upper zone)
C (Single or multiple opacities with combined area 1> the equivalent of right upper zone)
Total 33

APPENDIX 7
Pneumoconiosis Patients with Tuberculosis 2001
Type of T.B. Number of Cases %
Bacteriological Positive 28 21 Bacteriological Negative 25 19 No T.B. 76 58 N.A. 3 2
Total 132 100
APPENDIX 8
Confirmed Pneumoconiosis Patients by Other Particulars 2001
Characteristics Number of Cases %
Smoker/Ex-smoker 119 90
Non-smoker 10 8Smoking
Unknown 3 2
Total 132 100
Yes 31 24Still exposedto dust when No 98 74seen by thePneumoconiosis Unknown 3 2Clinic
Total 132 100
Good 116 88
General Fair 13 10Condition
Poor - -
Died 3 2
Total 132 100

Part 3
ANNEX

Contents
Annex No. 1(a) Treatment Outcomes at 2 year of the 1998 Cohort of TB Patients 1(b) Analysis for Various Age Groups 1(c) Analysis for Pulmonary Retreatment Smear Positive, Pretreatment
Culture Positive, and MDR-TB Cases 1(d) Analysis for New Pulmonary Smear Positive and Retreatment Pulmonary
Smear Positive Cases 1(e) Analysis for Treatment Defaulters 1(f) Sample of “Programme Form” used in 1998 2(a) TB among Chinese New Immigrants 2(b) TB Notification and Estimated Rates among Chinese New Immigrants by
Age & Sex (1997-2001) 2(c) TB Notification and Rates (All Cases) by Age & Sex (1997-2001) 3 Tuberculin Testing among Institutional TB Contacts Aged under 5 4 Tuberculin Testing among University New Entrants

N %(A) New pulmonary, smear positive 1551 24.6(B) New pulmonary, smear negartive 2966 47.1(C) New pulmonary, smear not done/ unknown 300 4.8(D) New extra-pulmonary 646 10.3(E) Relapse pulmonary, smear positive 221 3.5(F) Pulmonary smear-positive retreatment after failure or default 16 0.3
(G)
Other retreatment cases (not included in E and F) [i.e., including relapses (pulmonary, smear negative or unknown or not done; and extrapulmonary) and retreatment after failure or default (pulmonary, smear negative or unknown or not done; and extrapulmonary)]
598 9.5
6298 100.0
Annex 1 (b)Annex 1 (c)Annex 1 (d)Annex 1 (e)
Annex 1 (f)
Annex 1 (a)
"Programme Forms" have been completed for a total of 6298 TB patients who were seen at chest clinics with DOS (date of starting treatment) from 1.1.1998 to 31.12.1998. They are categorised as follows:
Analysis has been done on this cohort of patients and the results are shown in the following Annexes:
Various age groups (0-19), (20-39), (40-59), (60+), and all age groups
Treatment Outcomes at 2 year of the 1998 Cohort of TB Patients
Sample of the set of "Programme Form" used for the cohort of patients in 1998
Treatment defaulters (outcome at 2 year = defaulting)
Categories
Total
Pulmonary retreatment smear positive, pretreatment culture positive, and MDR-TB casesNew pulmonary smear positive and retreatment pulmonary smear positive cases

Age groupN % N % N % N % N %
Female 162 52.1 909 48.1 422 24.8 557 23.2 2050 32.6Male 149 47.9 982 51.9 1277 75.2 1840 76.8 4248 67.4Total 311 100.0 1891 100.0 1699 100.0 2397 100.0 6298 100.0
Residential statusPermanent resident 279 89.7 1609 85.1 1628 95.8 2374 99.0 5890 93.5Chinese immigrant 13 4.2 62 3.3 26 1.5 9 0.4 110 1.7Illegal immigrant 4 1.3 16 0.8 4 0.2 1 0.0 25 0.4Chinese (other types) 1 0.3 6 0.3 1 0.1 0 0.0 8 0.1Vietnamese migrants 0 0.0 9 0.5 1 0.1 0 0.0 10 0.2Others 12 3.9 180 9.5 32 1.9 9 0.4 233 3.7Unknown 2 0.6 9 0.5 7 0.4 4 0.2 22 0.3Total 311 100.0 1891 100.0 1699 100.0 2397 100.0 6298 100.0
EthnicityChinese 292 93.9 1652 87.4 1644 96.8 2378 99.2 5966 94.7Non-Chinese 17 5.5 234 12.4 51 3.0 14 0.6 316 5.0Unknown 2 0.6 5 0.3 4 0.2 5 0.2 16 0.3Total 311 100.0 1891 100.0 1699 100.0 2397 100.0 6298 100.0
OccupationMedical 1 0.3 14 0.7 2 0.1 0 0.0 17 0.3Paramedical 0 0.0 17 0.9 6 0.4 0 0.0 23 0.4Domestic helper 2 0.6 102 5.4 23 1.4 14 0.6 141 2.2Not employed 20 6.4 167 8.8 213 12.5 89 3.7 489 7.8Retired 0 0.0 7 0.4 104 6.1 1396 58.2 1507 23.9Others 277 89.1 1550 82.0 1318 77.6 827 34.5 3972 63.1Unknown 11 3.5 34 1.8 33 1.9 71 3.0 149 2.4Total 311 100.0 1891 100.0 1699 100.0 2397 100.0 6298 100.0
PresentationSymptoms 241 77.5 1504 79.5 1372 80.8 1898 79.2 5015 79.6Post-Rx FU 7 2.3 35 1.9 49 2.9 57 2.4 148 2.3Self check up 4 1.3 44 2.3 14 0.8 15 0.6 77 1.2Other check up 18 5.8 126 6.7 107 6.3 152 6.3 403 6.4Contact examination 19 6.1 38 2.0 24 1.4 25 1.0 106 1.7High risk screening 0 0.0 5 0.3 5 0.3 1 0.0 11 0.2Coincidental 2 0.6 23 1.2 41 2.4 95 4.0 161 2.6Others 19 6.1 91 4.8 73 4.3 129 5.4 312 5.0Unknown 1 0.3 25 1.3 14 0.8 25 1.0 65 1.0Total 311 100.0 1891 100.0 1699 100.0 2397 100.0 6298 100.0
Disease ClassificationPulmonary TB only 233 74.9 1361 72.0 1398 82.3 2090 87.2 5082 80.7Extrapulmonary TB only 48 15.4 309 16.3 184 10.8 155 6.5 696 11.1Both 30 9.6 221 11.7 117 6.9 152 6.3 520 8.3Total 311 100.0 1891 100.0 1699 100.0 2397 100.0 6298 100.0
All0 to 19 20 to 39 40 to 59 60+
Annex 1 (b1)

Age groupN % N % N % N % N %
Extrapulmonary TB1. Pleura 31 10.0 185 9.8 92 5.4 150 6.3 458 7.32. Lymph node 39 12.5 240 12.7 103 6.1 58 2.4 440 7.03. Meninges 0 0.0 13 0.7 11 0.6 1 0.0 25 0.44. Miliary 1 0.3 7 0.4 7 0.4 5 0.2 20 0.35. Bones & joint 2 0.6 24 1.3 19 1.1 28 1.2 73 1.26. Genitourinary 2 0.6 10 0.5 32 1.9 22 0.9 66 1.07. Abdomen 0 0.0 22 1.2 11 0.6 12 0.5 45 0.78. Skin 2 0.6 5 0.3 5 0.3 6 0.3 18 0.39. Others 5 1.6 33 1.7 18 1.1 26 1.1 82 1.3
Case category1. New case 293 94.2 1778 94.0 1453 85.5 1939 80.9 5463 86.72. Relapse < 5 years 12 3.9 50 2.6 71 4.2 81 3.4 214 3.43. Relapse > 5 years 1 0.3 49 2.6 157 9.2 353 14.7 560 8.94. Rx defaulter < 5 month 4 1.3 11 0.6 12 0.7 19 0.8 46 0.75. Rx defaulter > 5 month 1 0.3 3 0.2 6 0.4 5 0.2 15 0.26. Previous failure 0 0.0 0 0.0 0 0.0 0 0.0 0 0.07. Others 0 0.0 0 0.0 0 0.0 0 0.0 0 0.0Total 311 100.0 1891 100.0 1699 100.0 2397 100.0 6298 100.0
Disease characteristics (pulmonary cases)Pretreatment smear +ve 71 27.0 450 28.4 502 33.1 765 34.1 1788 31.9Pretreatment culture +ve 143 54.4 798 50.4 886 58.5 1375 61.3 3202 57.2Extent = 1 169 64.3 995 62.9 819 54.1 1053 47.0 3036 54.2 Extent=1 & cavity=N 158 60.1 927 58.6 745 49.2 978 43.6 2808 50.1 Extent=1 & cavity=Y 11 4.2 68 4.3 74 4.9 75 3.3 228 4.1Extent = 2 74 28.1 429 27.1 506 33.4 879 39.2 1888 33.7 Extent=2 & cavity=N 58 22.1 339 21.4 417 27.5 781 34.8 1595 28.5 Extent=2 & cavity=Y 16 6.1 90 5.7 89 5.9 98 4.4 293 5.2Extent=3 19 7.2 116 7.3 160 10.6 274 12.2 569 10.2 Extent=3 & cavity=N 13 4.9 93 5.9 105 6.9 207 9.2 418 7.5 Extent=3 & cavity=Y 6 2.3 23 1.5 55 3.6 67 3.0 151 2.7Extent=not specified 1 0.4 42 2.7 30 2.0 36 1.6 109 1.9 Extent=ns & cavity=N 1 0.4 41 2.6 27 1.8 35 1.6 104 1.9 Extent=ns & cavity=Y 0 0.0 1 0.1 3 0.2 1 0.0 5 0.1Cavity=N 230 87.5 1400 88.5 1294 85.4 2001 89.3 4925 87.9Cavity=Y 33 12.5 182 11.5 221 14.6 241 10.7 677 12.1
Condition at 6 month1. Rx completed 173 55.6 896 47.4 578 34.0 657 27.4 2304 36.62. Still on Rx 116 37.3 786 41.6 972 57.2 1385 57.8 3259 51.73. Changed Rx to others 5 1.6 97 5.1 44 2.6 58 2.4 204 3.24. Defaulted 15 4.8 106 5.6 86 5.1 126 5.3 333 5.35. Died from TB 0 0.0 0 0.0 0 0.0 18 0.8 18 0.36. Died from non-TB 0 0.0 1 0.1 6 0.4 63 2.6 70 1.17. Died from unknown 0 0.0 1 0.1 5 0.3 64 2.7 70 1.18. Others 1 0.3 0 0.0 0 0.0 3 0.1 4 0.19. Admitted & not yet back 1 0.3 4 0.2 8 0.5 23 1.0 36 0.6Total 311 100.0 1891 100.0 1699 100.0 2397 100.0 6298 100.0
0 to 19 20 to 39 40 to 59 60+ All
Annex 1 (b2)
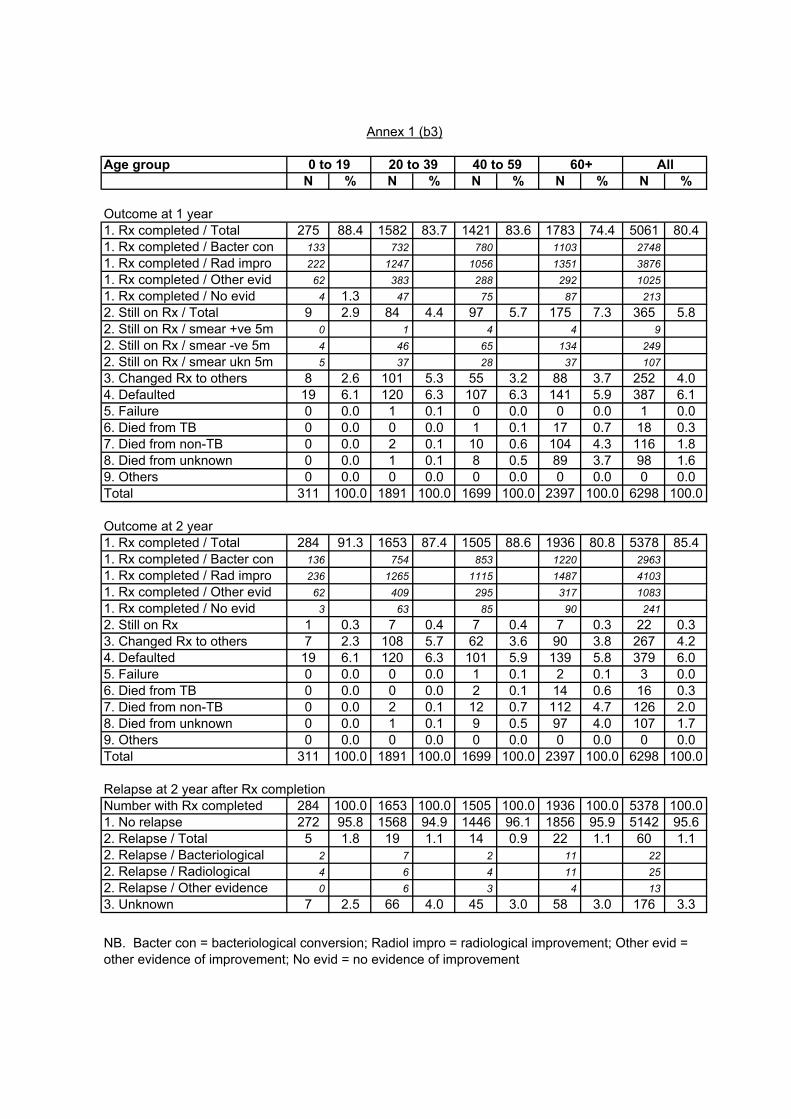
Age groupN % N % N % N % N %
Outcome at 1 year1. Rx completed / Total 275 88.4 1582 83.7 1421 83.6 1783 74.4 5061 80.41. Rx completed / Bacter con 133 732 780 1103 27481. Rx completed / Rad impro 222 1247 1056 1351 38761. Rx completed / Other evid 62 383 288 292 10251. Rx completed / No evid 4 1.3 47 75 87 2132. Still on Rx / Total 9 2.9 84 4.4 97 5.7 175 7.3 365 5.82. Still on Rx / smear +ve 5m 0 1 4 4 92. Still on Rx / smear -ve 5m 4 46 65 134 2492. Still on Rx / smear ukn 5m 5 37 28 37 1073. Changed Rx to others 8 2.6 101 5.3 55 3.2 88 3.7 252 4.04. Defaulted 19 6.1 120 6.3 107 6.3 141 5.9 387 6.15. Failure 0 0.0 1 0.1 0 0.0 0 0.0 1 0.06. Died from TB 0 0.0 0 0.0 1 0.1 17 0.7 18 0.37. Died from non-TB 0 0.0 2 0.1 10 0.6 104 4.3 116 1.88. Died from unknown 0 0.0 1 0.1 8 0.5 89 3.7 98 1.69. Others 0 0.0 0 0.0 0 0.0 0 0.0 0 0.0Total 311 100.0 1891 100.0 1699 100.0 2397 100.0 6298 100.0
Outcome at 2 year1. Rx completed / Total 284 91.3 1653 87.4 1505 88.6 1936 80.8 5378 85.41. Rx completed / Bacter con 136 754 853 1220 29631. Rx completed / Rad impro 236 1265 1115 1487 41031. Rx completed / Other evid 62 409 295 317 10831. Rx completed / No evid 3 63 85 90 2412. Still on Rx 1 0.3 7 0.4 7 0.4 7 0.3 22 0.33. Changed Rx to others 7 2.3 108 5.7 62 3.6 90 3.8 267 4.24. Defaulted 19 6.1 120 6.3 101 5.9 139 5.8 379 6.05. Failure 0 0.0 0 0.0 1 0.1 2 0.1 3 0.06. Died from TB 0 0.0 0 0.0 2 0.1 14 0.6 16 0.37. Died from non-TB 0 0.0 2 0.1 12 0.7 112 4.7 126 2.08. Died from unknown 0 0.0 1 0.1 9 0.5 97 4.0 107 1.79. Others 0 0.0 0 0.0 0 0.0 0 0.0 0 0.0Total 311 100.0 1891 100.0 1699 100.0 2397 100.0 6298 100.0
Relapse at 2 year after Rx completionNumber with Rx completed 284 100.0 1653 100.0 1505 100.0 1936 100.0 5378 100.01. No relapse 272 95.8 1568 94.9 1446 96.1 1856 95.9 5142 95.62. Relapse / Total 5 1.8 19 1.1 14 0.9 22 1.1 60 1.12. Relapse / Bacteriological 2 7 2 11 222. Relapse / Radiological 4 6 4 11 252. Relapse / Other evidence 0 6 3 4 133. Unknown 7 2.5 66 4.0 45 3.0 58 3.0 176 3.3
NB. Bacter con = bacteriological conversion; Radiol impro = radiological improvement; Other evid = other evidence of improvement; No evid = no evidence of improvement
0 to 19 20 to 39 40 to 59 60+ All
Annex 1 (b3)

GroupN % N % N %
Age group0 to 19 71 4.0 143 4.5 0 0.0 Female 37 73 0 Male 34 70 020 to 39 450 25.2 798 24.9 11 22.9 Female 199 348 7 Male 251 450 440 to 59 502 28.1 886 27.7 14 29.2 Female 91 153 2 Male 411 733 1260+ 765 42.8 1375 42.9 23 47.9 Female 175 285 4 Male 590 1090 19Total 1788 100.0 3202 100.0 48 100.0 Female 502 28.1 859 26.8 13 27.1 Male 1286 71.9 2343 73.2 35 72.9Residential statusPermanent resident 1697 94.9 3056 95.4 43 89.6Chinese immigrant 18 1.0 35 1.1 0 0.0Illegal immigrant 4 0.2 9 0.3 0 0.0Chinese (other types) 2 0.1 3 0.1 0 0.0Vietnamese migrants 2 0.1 4 0.1 1 2.1Others 56 3.1 82 2.6 4 8.3Unknown 9 0.5 13 0.4 0 0.0Total 1788 100.0 3202 100.0 48 100.0EthnicityChinese 1706 95.4 3075 96.0 43 89.6Non-Chinese 74 4.1 115 3.6 5 10.4Unknown 8 0.4 12 0.4 0 0.0Total 1788 100.0 3202 100.0 48 100.0OccupationMedical 2 0.1 6 0.2 0 0.0Paramedical 1 0.1 8 0.2 0 0.0Domestic helper 26 1.5 41 1.3 1 2.1Not employed 162 9.1 223 7.0 10 20.8Retired 495 27.7 876 27.4 16 33.3Others 1065 59.6 1965 61.4 19 39.6Unknown 37 2.1 83 2.6 2 4.2Total 1788 100.0 3202 100.0 48 100.0PresentationSymptoms 1522 85.1 2634 82.3 38 79.2Post-Rx FU 28 1.6 65 2.0 3 6.3Self check up 1 0.1 16 0.5 0 0.0Other check up 78 4.4 188 5.9 4 8.3Contact examination 6 0.3 26 0.8 0 0.0High risk screening 1 0.1 2 0.1 0 0.0Coincidental 43 2.4 74 2.3 1 2.1Others 87 4.9 161 5.0 1 2.1Unknown 22 1.2 36 1.1 1 2.1Total 1788 100.0 3202 100.0 48 100.0
Annex 1 (c1)
PreRx smear +ve PreRx culture +ve MDR-TB

GroupN % N % N %
Disease classificationPulmonary TB only 1705 95.4 3019 94.3 46 95.8Both pulm & extrapulm 83 4.6 183 5.7 2 4.2Total 1788 100.0 3202 100.0 48 100.0
Case Category1. New case 1551 86.7 2743 85.7 29 60.42. Relapse < 5 years 54 3.0 94 2.9 10 20.83. Relapse > 5 years 167 9.3 334 10.4 8 16.74. Rx defaulter < 5 month 14 0.8 25 0.8 1 2.15. Rx defaulter > 5 month 2 0.1 6 0.2 0 0.06. Previous failure 0 0.0 0 0.0 0 0.07. Others 0 0.0 0 0.0 0 0.0Total 1788 100.0 3202 100.0 48 100.0
Disease characteristics (pulmonary cases)Extent = 1 638 35.7 1464 45.7 23 47.9 Extent=1 & cavity=N 508 28.4 1281 40.0 18 37.5 Extent=1 & cavity=Y 130 7.3 183 5.7 5 10.4Extent = 2 771 43.1 1263 39.4 17 35.4 Extent=2 & cavity=N 564 31.5 1018 31.8 12 25.0 Extent=2 & cavity=Y 207 11.6 245 7.7 5 10.4Extent=3 354 19.8 437 13.6 8 16.7 Extent=3 & cavity=N 241 13.5 310 9.7 6 12.5 Extent=3 & cavity=Y 113 6.3 127 4.0 2 4.2Extent=not specified 25 1.4 38 1.2 0 0.0 Extent=ns & cavity=N 24 1.3 36 1.1 0 0.0 Extent=ns & cavity=Y 1 0.1 2 0.1 0 0.0Cavity=N 1337 74.8 2645 82.6 36 75.0Cavity=Y 451 25.2 557 17.4 12 25.0
Condition at 6 months1. Rx completed 514 28.7 1084 33.9 3 6.32. Still on Rx 1106 61.9 1819 56.8 34 70.83. Changed Rx to others 38 2.1 68 2.1 2 4.24. Defaulted 68 3.8 148 4.6 7 14.65. Died from TB 7 0.4 9 0.3 0 0.06. Died from non-TB 26 1.5 32 1.0 1 2.17. Died from unknown 20 1.1 24 0.7 0 0.08. Others 0 0.0 0 0.0 0 0.09. Admitted & not yet back 9 0.5 18 0.6 1 2.1Total 1788 100.0 3202 100.0 48 100.0
Annex 1 (c2)
PreRx smear +ve PreRx culture +ve MDR-TB

GroupN % N % N %
Outcome at 1 year1. Rx completed / Total 1445 80.8 2610 81.5 10 20.81. Rx completed / Bacter con 1309 2408 91. Rx completed / Rad impro 1276 2244 101. Rx completed / Other evid 197 321 21. Rx completed / No evid 11 9 02. Still on Rx / Total 128 7.2 210 6.6 19 39.62. Still on Rx / smear +ve 5m 8 7 32. Still on Rx / smear -ve 5m 101 168 162. Still on Rx / smear ukn 5m 19 35 03. Changed Rx to others 51 2.9 91 2.8 5 10.44. Defaulted 89 5.0 183 5.7 11 22.95. Failure 0 0.0 0 0.0 0 0.06. Died from TB 5 0.3 10 0.3 0 0.07. Died from non-TB 38 2.1 55 1.7 3 6.38. Died from unknown 32 1.8 43 1.3 0 0.09. Others 0 0.0 0 0.0 0 0.0Total 1788 100.0 3202 100.0 48 100.0
Outcome at 2 year1. Rx completed / Total 1550 86.7 2791 87.2 27 56.31. Rx completed / Bacter con 1432 2635 221. Rx completed / Rad impro 1339 2357 241. Rx completed / Other evid 201 335 21. Rx completed / No evid 22 18 12. Still on Rx 13 0.7 17 0.5 3 6.33. Changed Rx to others 47 2.6 94 2.9 6 12.54. Defaulted 89 5.0 179 5.6 9 18.85. Failure 0 0.0 1 0.0 0 0.06. Died from TB 6 0.3 8 0.2 0 0.07. Died from non-TB 45 2.5 61 1.9 3 6.38. Died from unknown 38 2.1 51 1.6 0 0.09. Others 0 0.0 0 0.0 0 0.0Total 1788 100.0 3202 100.0 48 100.0
Relapse at 2 year after Rx completionNumber with Rx completed 1550 100.0 2791 100.0 27 100.01. No relapse 1472 95.0 2666 95.5 22 81.52. Relapse / Total 21 1.4 38 1.4 2 7.42. Relapse / Bacteriological 9 16 22. Relapse / Radiological 8 18 22. Relapse / Other evidence 5 7 03. Unknown 57 3.7 87 3.1 3 11.1
PreRx smear +ve PreRx culture +ve MDR-TB
Annex 1 (c3)

GroupN % N % N %
Sensitivity patternStreptomycin - R 124 8.2 239 7.9 35 72.9Streptomycin - S 1386 91.8 2776 92.1 13 27.1
Isoniazid - R 99 6.6 208 6.9 48 100.0Isoniazid - S 1411 93.4 2805 93.1 0 0.0
Rifampicin - R 31 2.1 46 1.5 48 100.0Rifampicin - S 1479 97.9 2969 98.5 0 0.0
Ethambutol - R 25 1.7 40 1.3 31 64.6Ethambutol - S 1485 98.3 2976 98.7 17 35.4
Pyrazinamide - R 14 12.7 20 9.5 13 44.8Pyrazinamide - S 96 87.3 191 90.5 16 55.2
Ofloxacin - R 9 10.2 12 6.2 9 23.7Ofloxacin - S 79 89.8 181 93.8 29 76.3
Smear conversion rates1. Smear at 2 month = N (a) 1172 132. Smear at 2 month = P (b) 105 42. Sm 2m (P); Sm 3m (N) (c) 63 02. Sm 2m (P); Sm 3m (P) (d) 24 42. Sm 2m (P); Sm 3m (U) (e) 18 03. Smear at 2 month = U (f) 511 113. Sm 2m (U); Sm 3m (N) (g) 194 33. Sm 2m (U); Sm 3m (P) (h) 9 13. Sm 2m (U); Sm 3m (U) (i) 308 7Overall percentage of smear conversion at 2m = (a)/ [(a)+(b)]
91.8 - 76.5Overall percentage of smear conversion at 3m = [(a)+(c)+(g)]/ [(a)+(c)+(d)+(g)+(h)]
97.7 - 76.2
Culture conversion rates1. Culture at 2 month = N (a) 1830 82. Culture at 2 month = P (b) 288 132. Cu 2m (P); Cu 3m (N) (c) 158 22. Cu 2m (P); Cu 3m (P) (d) 38 72. Cu 2m (P); Cu 3m (U) (e) 92 43. Culture at 2 month = U (f) 1084 203. Cu 2m (U); Cu 3m (N) (g) 374 43. Cu 2m (U); Cu 3m (P) (h) 25 23. Cu 2m (U); Cu 3m (U) (i) 685 14Overall percentage of culture conversion at 2m = (a)/ [(a)+(b)]
- 86.4 38.1Overall percentage of culture conversion at 3m = [(a)+(c)+(g)]/ [(a)+(c)+(d)+(g)+(h)]
- 97.4 60.9
PreRx smear +ve PreRx culture +ve MDR-TB
Annex 1 (c4)

N % N %
Age group0 to 19 68 4.4 3 1.3 Female 35 2 Male 33 120 to 39 424 27.3 26 11.0 Female 192 7 Male 232 1940 to 59 425 27.4 77 32.5 Female 81 10 Male 344 6760+ 634 40.9 131 55.3 Female 156 19 Male 478 112Total 1551 100.0 237 100.0 Female 464 29.9 38 2.5 Male 1087 70.1 199 12.8Residential statusPermanent resident 1470 94.8 227 95.8Chinese immigrant 15 1.0 3 1.3Illegal immigrant 4 0.3 0 0.0Chinese (other types) 2 0.1 0 0.0Vietnamese migrants 1 0.1 1 0.4Others 51 3.3 5 2.1Unknown 8 0.5 1 0.4Total 1551 100.0 237 100.0EthnicityChinese 1477 95.2 229 96.6Non-Chinese 67 4.3 7 3.0Unknown 7 0.5 1 0.4Total 1551 100.0 237 100.0OccupationMedical 2 0.1 0 0.0Paramedical 1 0.1 0 0.0Domestic helper 25 1.6 1 0.4Not employed 130 8.4 32 13.5Retired 413 26.6 82 34.6Others 947 61.1 118 49.8Unknown 33 2.1 4 1.7Total 1551 100.0 237 100.0PresentationSymptoms 1326 85.5 196 82.7Post-Rx FU 15 1.0 13 5.5Self check up 1 0.1 0 0.0Other check up 68 4.4 10 4.2Contact examination 6 0.4 0 0.0High risk screening 1 0.1 0 0.0Coincidental 39 2.5 4 1.7Others 75 4.8 12 5.1Unknown 20 1.3 2 0.8Total 1551 100.0 237 100.0
Annex 1 (d1)
New pulmonary smear +ve ReRx pulmonary smear +ve

N % N %
Disease classificationPulmonary TB only 1477 95.2 228 96.2Both pulm & extrapulm 74 4.8 9 3.8Total 1551 100.0 237 100.0
Disease characteristics (pulmonary cases)Extent = 1 554 35.7 84 35.4 Extent=1 & cavity=N 440 28.4 68 28.7 Extent=1 & cavity=Y 114 7.4 16 6.8Extent = 2 670 43.2 101 42.6 Extent=2 & cavity=N 490 31.6 74 31.2 Extent=2 & cavity=Y 180 11.6 27 11.4Extent=3 304 19.6 50 21.1 Extent=3 & cavity=N 207 13.3 34 14.3 Extent=3 & cavity=Y 97 6.3 16 6.8Extent=not specified 23 1.5 2 0.8 Extent=ns & cavity=N 22 1.4 2 0.8 Extent=ns & cavity=Y 1 0.1 0 0.0Cavity=N 1159 74.7 178 75.1Cavity=Y 392 25.3 59 24.9
Condition at 6 months1. Rx completed 497 32.0 17 7.22. Still on Rx 913 58.9 193 81.43. Changed Rx to others 34 2.2 4 1.74. Defaulted 53 3.4 15 6.35. Died from TB 6 0.4 1 0.46. Died from non-TB 22 1.4 4 1.77. Died from unknown 17 1.1 3 1.38. Others 0 0.0 0 0.09. Admitted & not yet back 9 0.6 0 0.0Total 1551 100.0 237 100.0
Outcome at 1 year1. Rx completed / Total 1273 82.1 172 72.61. Rx completed / Bacter con 1170 1391. Rx completed / Rad impro 1138 1381. Rx completed / Other evid 2 11. Rx completed / No evid 7 42. Still on Rx / Total 104 6.7 24 10.12. Still on Rx / smear +ve 5m 7 12. Still on Rx / smear -ve 5m 79 222. Still on Rx / smear ukn 5m 18 13. Changed Rx to others 47 3.0 4 1.74. Defaulted 67 4.3 22 9.35. Failure 0 0.0 0 0.06. Died from TB 5 0.3 0 0.07. Died from non-TB 32 2.1 6 2.58. Died from unknown 23 1.5 9 3.89. Others 0 0.0 0 0.0Total 1551 100.0 237 100.0
Annex 1 (d2)
New pulmonary smear +ve ReRx pulmonary smear +ve

N % N %
Outcome at 2 year1. Rx completed / Total 1360 87.7 190 80.21. Rx completed / Bacter con 1268 1641. Rx completed / Rad impro 1182 1571. Rx completed / Other evid 170 311. Rx completed / No evid 16 62. Still on Rx 9 0.6 4 1.73. Changed Rx to others 44 2.8 3 1.34. Defaulted 65 4.2 24 10.15. Failure 0 0.0 0 0.06. Died from TB 6 0.4 0 0.07. Died from non-TB 38 2.5 7 3.08. Died from unknown 29 1.9 9 3.89. Others 0 0.0 0 0.0Total 1551 100.0 237 100.0
Relapse at 2 year after Rx completionNumber with Rx completed 1360 100 190 1001. No relapse 1304 95.9 184 96.82. Relapse / Total 22 1.6 2 1.12. Relapse / Bacteriological 8 12. Relapse / Radiological 8 02. Relapse / Other evidence 4 13. Unknown 34 2.5 4 2.1
Smear conversion rates1. Smear at 2 month = N (a) 1022 1502. Smear at 2 month = P (b) 89 162. Sm 2m (P); Sm 3m (N) (c) 55 82. Sm 2m (P); Sm 3m (P) (d) 21 32. Sm 2m (P); Sm 3m (U) (e) 13 53. Smear at 2 month = U (f) 351 583. Sm 2m (U); Sm 3m (N) (g) 142 233. Sm 2m (U); Sm 3m (P) (h) 7 03. Sm 2m (U); Sm 3m (U) (i) 202 35Overall percentage of smear conversion at 2m = (a)/ [(a)+(b)]
92.0 90.4Overall percentage of smear conversion at 3m = [(a)+(c)+(g)]/ [(a)+(c)+(d)+(g)+(h)]
97.8 98.4
Annex 1 (d3)
New pulmonary smear +ve ReRx pulmonary smear +ve

Age group N % N % N %0 to 19 11 11.5 8 2.8 19 5.020 to 39 47 49.0 73 25.8 120 31.740 to 59 13 13.5 88 31.1 101 26.660+ 25 26.0 114 40.3 139 36.7Total 96 100.0 283 100.0 379 100.0
Residential status N %Permanent resident 321 84.7 Month N %Chinese immigrant 13 3.4 0 8 2.1Illegal immigrant 4 1.1 1 99 26.1Chinese (other types) 1 0.3 2 61 16.1Vietnamese migrants 4 1.1 3 46 12.1Others 35 9.2 4 30 7.9Unknown 1 0.3 5 22 5.8Total 379 100.0 6 15 4.0
7 18 4.7Ethnicity N % 8 15 4.0Chinese 333 87.9 9 13 3.4Non-Chinese 46 12.1 10 11 2.9
11 1 0.3Occupation N % 12 5 1.3Medical 0 0.0 13 2 0.5Paramedical 0 0.0 14 2 0.5Domestic helper 16 4.2 15 2 0.5Not employed 37 9.8 16 0 0.0Retired 93 24.5 17 1 0.3Others 222 58.6 18 0 0.0Unknown 11 2.9 19 1 0.3Total 379 100.0 20 1 0.3
Unknown 26 6.9Presentation N % Total 379 100.0Symptoms 296 78.1Post-Rx FU 5 1.3Self check up 10 2.6Other check up 19 5.0 Rx restarted N %Contact examination 8 2.1 Yes 49 12.9High risk screening 3 0.8 No 300 79.2Coincidental 16 4.2 Unknown 30 7.9Others 18 4.7 Total 379 100.0Unknown 4 1.1Total 379 100.0
N %318 83.934 9.027 7.1379 100.0
New course of treatment started
Female Male Total
Defaulting at month
Pulmonary TB onlyDisease Classification
BothTotal
Extrapulmonary TB only
Annex 1 (e1)
Analysis for defaulters

N %300 79.230 7.926 6.918 4.75 1.30 0.00 0.0
379 100.0
N %89 25.8179 51.9187 54.2175 50.712 3.5117 33.995 27.522 6.433 9.625 7.28 2.38 2.37 2.01 0.3
302 87.543 12.5
Case category1. New case2. Relapse < 5 years3. Relapse > 5 years4. Rx defaulter < 5 month5. Rx defaulter > 5 month6. Previous failure7. OthersTotal
Disease characteristics (pulmonary cases)Pretreatment smear +vePretreatment culture +veExtent = 1 Extent=1 & cavity=N Extent=1 & cavity=YExtent = 2 Extent=2 & cavity=N Extent=2 & cavity=YExtent=3 Extent=3 & cavity=N
Cavity=NCavity=Y
Annex 1 (e2)
Analysis for defaulters
Extent=3 & cavity=YExtent=not specified Extent=ns & cavity=N Extent=ns & cavity=Y

Annex 1 (f)
PRF FORM 1/2 (To be completed at 6 mo from DOS) PRF1/2-1-1-97(Rev) Name: ________________________________________ Sex: M / F * Age: __ __ DOS: __ __ / __ __ / 19 __ __ Clinic No.: _________________ HKID No.: _______________-( __ ) or Passport / Birth Cert * No.: _________________ Resident status: PResidents / CImmigrants / IImmigrants / cHOther / VMigrants / OThers / UNknown / NOne of above * Ethnicity: CHinese / NOn-Chinese * Occupation (in the past 6 months): MEdical / PAramedical / DOmestiche / NOtemployed / REtired / OThers / UNknown * Last follow-up date: __ __ / __ __ / 19 __ __ ( ≡ __________ month from DOS )
Part A: Presented this time mainly because of (choose 1 item only): Symptoms (1) Post-Rx FU (2) Self check-up (3) Other check-up (4) Contact exam. (5) H-risk screening (6) Coincidental finding during investigation of other diseases (7) Others (8)
_______________ Part B: Disease classification (choose ≥ 1 item) • Pulmonary Tuberculosis (P) • Extra-pulmonary Tuberculosis (E) miliary (4) skin (8)
pleura (1) bone & joint (5) others (9) lymph node (2) genito-urinary (6) meninges (3) abdomen (7) ____________________
Diagnosis based on (choose ≥ 1 item): Clinical (CL) / Radiological (RA) / Bacteriological (BA) / Histological (HI) * Part C: Extent of disease (for pulmonary tuberculosis only) Minimal Disease (<RUL) (1)
Cavity: Y / N * Moderate Disease (>RUL) (2) Extensive Disease (> a lung) (3)
Part D: Case category (choose 1 item only) • New case (previous treatment < 1 month) (1) • Retreatment case (previous treatment > 1 month): DOS for last episode: __ __ / __ __ / 19 __ __
(a) Relapse (previously considered cured): - within 5 years from last dose of last course of treatment (2) - more than 5 years from last dose of last course of treatment (3)
(b) Previous treatment defaulter (treatment interval ≤ 5 months for the last episode) (4) (c) Previous treatment defaulter (treatment interval > 5 months for the last episode) (5) (d) Previous failure (6)
• Others (please specify)____________________________________________________ (7) Part E: Condition at 6 month (from DOS) (choose only 1 of the items from (1) to (7)) • Treatment completed, or to be completed in ≤ 2 weeks (1) • Still on treatment (beyond 6 month) (2) • Changed to be treated by GP/other doctors at __________ month from DOS (3) • Defaulted/refused treatment for ≥ 2 months since __________ month from DOS (4) • Died at __________ month: from TB-related causes (5)
from non-TB causes: ___________________ (6) from unknown cause (7)
• Others (please specify) ________________________________________________ (8) • Admitted to chest hospital and not yet referred back (with unknown status) (9) Part F: Sputum results Pre-Rx At 2 month At 3 month
smear P N U | P N U | P N U culture (MTB) P N U | P N U | P N U culture (NTM) P | P | P
Part G: Pre-Rx sensitivity test results ( YFS (1) S S R | Z S R | Cyclo S R | ( TGH (2) H S R | Ofl S R | Others: | Source of ST ( RH (3) R S R | Ethi S R | S R | ( HOH (4) E S R | Kana S R | _______ S R | ( Others (5) Completed by Dr ____________________ on __ __ / __ __ / 19 __ __ ____________________ Chest Clinic

Annex 1 (f) PRF FORM 3 (To be completed at 1 year from DOS) PRF3-1-1-97(Rev)
Clinic No.: __ __ - __ - __ __ __ __ __ - __ DOS: __ __ / __ __ / 19 __ __ HKID No.: __ - __ __ __ __ __ __ - ( __ ) or Passport / Birth Certificate * No.: ____________________________ Last follow-up date: __ __ / __ __ / 19 __ __ ( ≡ __________ month from DOS )
Part H: Outcome at 1 year (from DOS) (I) Sputum results between 5 month and 1 year from DOS
smear P N U ) culture (MTB) P N U ) (report as positive if any one month is positive) culture (NTM) P ) (excluding false positives)
(II) Outcome at around the time of the last dose of treatment (ignore events afterwards)(choose 1 item only):
- Cured / treatment completed (1) - bacteriological conversion (a) - radiological improvement (b) - other evidence of clinical response (c) - no available evidence of response (d)
- Still on treatment (beyond 1 year) (2) - Changed to be treated by GP/other doctors at __________ month (3)
- Defaulted treatment at ___________ month (4) - Failure (5) - Died: from TB-related causes (6)
from non-TB causes: ____________________________ (7) from unknown cause (8)
- Others (e.g. incorrect diagnosis)
____________________________________________________ (9) Part I: Total interval of treatment (from DOS to date of last dose of treatment)(including those who defaluted, died, etc.) = __________ months / still on treatment * (fill in an integer for the number of months, which can be less than 6) Completed by Dr ____________________ on __ __ / __ __ / 19 __ __ ____________________ Chest Clinic

Annex 1 (f) PRF FORM 4 (To be completed at 2 year from DOS) PRF4-1-1-97(Rev)
Clinic No.: __ __ - __ - __ __ __ __ __ - __ DOS: __ __ / __ __ / 19 __ __ HKID No.: __ - __ __ __ __ __ __ - ( __ ) or Passport / Birth Certificate * No.: ____________________________ Last follow-up date: __ __ / __ __ / 19 __ __ ( ≡ __________ month from DOS )
Part J: Total interval of treatment (from DOS to date of last dose of treatment)(including those who defaluted, died, etc.): • ≤ 12 months / __________ months * (1)
(Date of last dose of treatment = __ __ / __ __ / 19 __ __ ) • Still on treatment (beyond 2 year) (2) Part K: Outcome at 2 year (from DOS): (I) Outcome at around the time of the last dose of treatment (ignore events afterwards)(choose 1 item only):
- Cured / treatment completed (1) - bacteriological conversion (a) - radiological improvement (b) - other evidence of clinical response (c) - no available evidence of response (d)
- Still on treatment (beyond 2 year) (2) - Changed to be treated by GP/other doctors __________ month (3)
- Defaulted treatment at __________ month (4) - Failure (5) - Died: from TB-related causes (6)
from non-TB causes: ____________________________ (7) from unknown cause (8)
- Others (e.g. incorrect diagnosis)
____________________________________________________ (9) (II) Status at 2 year: (a) Loss to follow up at __________ month from DOS (LO) / Still being followed up (FU) * (b) • Still alive (AL)
• Died at __________ month from DOS: (DI) - from TB-related causes (1) - from non-TB causes: _________________ (2) - from unknown cause (3)
• Unknown survival status (UN) (III) For those "Cured / treatment completed" cases (see item (1) of Part K(I)), the status at last FU date:
• No relapse (NR) • Relapse at __________ month from DOS: (RE)
- Bacteriological relapse (1) - Radiological relapse (2) - Other evidence of relapse (3)
______________________________
(IV) Has a new course of treatment been restarted after the outcome in Part K(I) or (III): Y / N * If yes, the new DOS is __ __ / __ __ / __ __. Completed by Dr ____________________ on __ __ / __ __ / 19 __ __ ____________________ Chest Clinic

Annex 2 (a)
TB Among Chinese New Immigrants
Number of all notified TB cases and TB cases who are Chinese new immigrants (with years of arrival in Hong Kong)
Years of arrival 1997 1998 1999 2000 2001
≤1 year 54 59 47 36 42
≤2 year 20 28 32 20 36
≤3 year 16 23 26 18 26
≤4 year 17 11 13 26 25
≤5 year 16 20 18 15 28
≤6 year 17 12 12 17 12
≤7 year 16 16 18 20 23
Notified TB cases
who are Chinese
New Immigrants
(with years of arrival
in Hong Kong)
Total 156 169 166 152 192
Overall notified TB cases 7072 7673 7512 7578 7262
The above table shows the number of all notified TB cases in Hong Kong from 1997 to 2001 and the number of TB cases among the Chinese new immigrants (staying in Hong Kong less than 7 years) according to the number of years they have arrived in Hong Kong. The numbers are in general higher in the first year of arrival. This phenomenon has also been observed in the immigrants of some other countries. The exact reason is unknown although some postulate that the stress experienced by the new immigrants upon arrival may be a factor. In Annex 2 (b), the tables show the number of notified TB cases among the Chinese new immigrants by age and sex, and the estimated rates. In Annex 2 (c), the table shows the number of all notified TB cases in Hong Kong by age and sex, and the rates. As shown from Annex 2 (c), the rates of TB among males are in general higher than that among females, and higher in the older age groups. The overall rates (per 100,000) from 1997 to 2001 are 109.0, 117.3, 113.7, 113.7 and 108.0 respectively. From Annex 2 (b), the overall estimated rates (per 100,000) among the new immigrants from 1997 to 2001 are 55.0, 54.0, 48.9, 41.8, and 50.6 respectively. The rates are lower than those of the general Hong Kong population. Although Mainland China has been classified by the World Health Organisation as among one of the high TB burden countries in the world, the new immigrants coming to Hong Kong are likely to be a “selected” group. Their demographics and health condition may be quite different from and not representative of the whole population in China. For example, they may be more ‘fit’, or with better socioeconomic condition. Hence, the rate of TB among this group may be lower.

Annex 2 (b)
TB Notification and Estimated Rates Among Chinese New Immigrants By Age & Sex (1997-2001)
Notified TB cases who are Chinese new immigrants (coming to HK < 7 years), by age and sex
1997 1997 1997 1998 1998 1998 1999 1999 1999 2000 2000 2000 2001 2001 2001
Age group Male Female Total Male Female Total Male Female Total Male Female Total Male Female Total
0-19 11 7 18 12 9 21 10 8 18 7 8 15 10 20 30
20-39 16 70 86 23 54 77 16 76 92 14 69 83 26 77 103
40-59 14 23 37 14 33 47 5 34 39 6 31 37 14 32 46
60+ 6 9 15 14 10 24 11 6 17 10 7 17 7 6 13
Total 47 109 156 63 106 169 42 124 166 37 115 152 57 135 192
Estimated rate of TB (per 100,000) among Chinese new immigrants (coming to HK < 7 years)
1997 1997 1997 1998 1998 1998 1999 1999 1999 2000 2000 2000 2001 2001 2001
Age group Male Female Total Male Female Total Male Female Total Male Female Total Male Female Total
0-19 18.4 13.7 16.2 16.8 14.3 15.6 12.7 11.1 11.9 8.3 10.2 9.2 11.6 24.4 17.9
20-39 58.3 81.5 75.8 90.4 61.5 68.0 66.0 78.2 75.8 59.8 64.6 63.7 102.5 67.0 73.4
40-59 163.4 54.5 72.9 168.3 70.5 85.2 62.6 70.2 69.1 76.5 62.1 64.1 172.6 65.6 80.9
60+ 241.2 152.2 178.5 555.1 130.3 235.3 445.9 73.4 159.7 375.2 64.5 125.8 256.9 52.0 91.2
Total 47.8 58.8 55.0 58.5 51.6 54.0 37.0 54.9 48.9 31.4 46.7 41.8 46.7 52.5 50.6
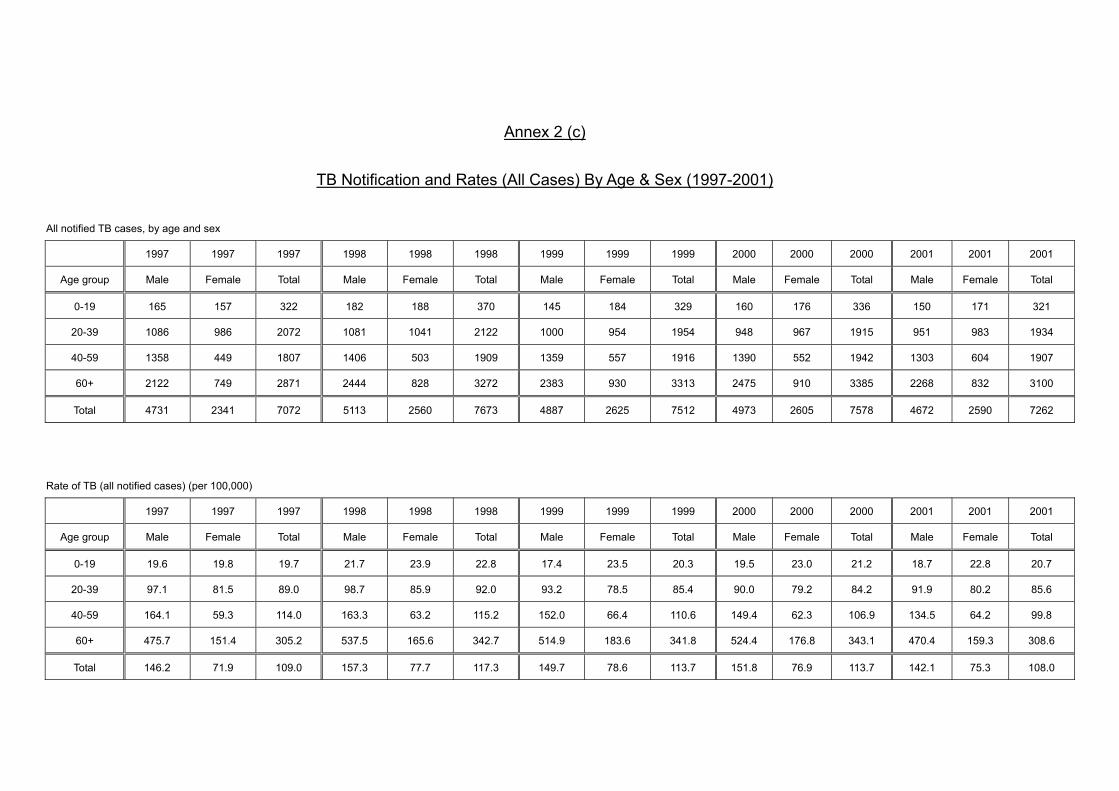
Annex 2 (c)
TB Notification and Rates (All Cases) By Age & Sex (1997-2001)
All notified TB cases, by age and sex
1997 1997 1997 1998 1998 1998 1999 1999 1999 2000 2000 2000 2001 2001 2001
Age group Male Female Total Male Female Total Male Female Total Male Female Total Male Female Total
0-19 165 157 322 182 188 370 145 184 329 160 176 336 150 171 321
20-39 1086 986 2072 1081 1041 2122 1000 954 1954 948 967 1915 951 983 1934
40-59 1358 449 1807 1406 503 1909 1359 557 1916 1390 552 1942 1303 604 1907
60+ 2122 749 2871 2444 828 3272 2383 930 3313 2475 910 3385 2268 832 3100
Total 4731 2341 7072 5113 2560 7673 4887 2625 7512 4973 2605 7578 4672 2590 7262
Rate of TB (all notified cases) (per 100,000)
1997 1997 1997 1998 1998 1998 1999 1999 1999 2000 2000 2000 2001 2001 2001
Age group Male Female Total Male Female Total Male Female Total Male Female Total Male Female Total
0-19 19.6 19.8 19.7 21.7 23.9 22.8 17.4 23.5 20.3 19.5 23.0 21.2 18.7 22.8 20.7
20-39 97.1 81.5 89.0 98.7 85.9 92.0 93.2 78.5 85.4 90.0 79.2 84.2 91.9 80.2 85.6
40-59 164.1 59.3 114.0 163.3 63.2 115.2 152.0 66.4 110.6 149.4 62.3 106.9 134.5 64.2 99.8
60+ 475.7 151.4 305.2 537.5 165.6 342.7 514.9 183.6 341.8 524.4 176.8 343.1 470.4 159.3 308.6
Total 146.2 71.9 109.0 157.3 77.7 117.3 149.7 78.6 113.7 151.8 76.9 113.7 142.1 75.3 108.0

Annex 3
Tuberculin Testing Among Institutional TB Contacts Aged Under 5
Percentage distribution of TT sizes among children in kindergartens/ nurseries (age mainly 3 to 5) who are TB contacts
63.2
51.5
7077 76
70.6
83.3
65.7
14.5
21.2
10
6.6 10.813.7
11.8
16.2
22.427.3
20 16.4 13.2 15.7
4.9
18.2
0%
10%
20%
30%
40%
50%
60%
70%
80%
90%
100%
1994 1995 1996 1997 1998 1999 2000 2001 Year
Perc
enta
ge d
istri
butio
n ≥ 10mm
5-9mm
0-4mm
Year 1994 1995 1996 1997 1998 1999 2000 2001 Number of students tuberculin tested
76 66 10 604 167 51 102 99
Number of institutions 2 2 1 7 3 2 2 2
Over the years, for institutional contacts aged under 5 with exposure to infectious TB, they are examined with tuberculin test (TT) (using 1 TU PPD-RT23 before the year 2000 and 2 TU PPD-RT23 since 2001). The percentage and frequency distribution of the sizes of TT from 1994 to 2001 are presented in the above graph and the graphs in the next few pages. The number of students tested in 1997 was significantly higher because of an incident of clustering of TB cases in a kindergarten.

1994 (2 institutions; N=76)
01020304050607080
0--1
2--3
4--5
6--7
8--9
10--1
1
12--1
3
14--1
5
16--1
7
18--1
9
20--2
1
22--2
3
24--2
5
Size of TT (mm)
Perc
enta
ge
1995 (2 institutions; N=66)
01020304050607080
0--1
2--3
4--5
6--7
8--9
10--1
1
12--1
3
14--1
5
16--1
7
18--1
9
20--2
1
22--2
3
24--2
5
Size of TT (mm)
Per
cent
age

1996 (1 institution; N=10)
01020304050607080
0--1
2--3
4--5
6--7
8--9
10--1
1
12--1
3
14--1
5
16--1
7
18--1
9
20--2
1
22--2
3
24--2
5
Size of TT (mm)
Per
cent
age
1997 (7 institutions; N=604)
01020304050607080
0--1
2--3
4--5
6--7
8--9
10--1
1
12--1
3
14--1
5
16--1
7
18--1
9
20--2
1
22--2
3
24--2
5
Size of TT (mm)
Perc
enta
ge

1998 (3 institutions; N=167)
01020304050607080
0--1
2--3
4--5
6--7
8--9
10--1
1
12--1
3
14--1
5
16--1
7
18--1
9
20--2
1
22--2
3
24--2
5
Size of TT (mm)
Per
cent
age
1999 (2 institutions; N=51)
01020304050607080
0--1
2--3
4--5
6--7
8--9
10--1
1
12--1
3
14--1
5
16--1
7
18--1
9
20--2
1
22--2
3
24--2
5
Size of TT (mm)
Perc
enta
ge

2000 (2 institutions; N=102)
01020304050607080
0--1
2--3
4--5
6--7
8--9
10--1
1
12--1
3
14--1
5
16--1
7
18--1
9
20--2
1
22--2
3
24--2
5
Size of TT (mm)
Perc
enta
ge
2001 (2 institutions; N=99)
01020304050607080
0--1
2--3
4--5
6--7
8--9
10--1
1
12--1
3
14--1
5
16--1
7
18--1
9
20--2
1
22--2
3
24--2
5
Size of TT (mm)
Perc
enta
ge

Annex 4
Tuberculin Testing Among University New Entrants
University A (1990-2001) (record of age not available except for 2001) Tuberculin Test (mm) Year
0-9 10-14 15-19 ≥20 Total TT≥10mm Not read
1990 134 99 105 26 364 230 (63.19%) 1 1991 94 164 85 24 367 273 (74.39%) 4 1992 105 116 94 5 320 215 (67.19%) 0 1993 63 174 81 16 334 271 (81.14%) 4 1994 112 177 39 4 332 220 (66.27%) 4 1995 65 137 100 17 319 254 (79.62%) 3 1996 86 198 79 11 374 288 (77.01%) 4 1997 178 128 50 7 363 185 (50.96%) 12 1998 373 130 47 1 551 178 (32.30%) 7
1999 * 152 140 51 8 351 199 (56.70%) 23 2000 * 101 140 37 6 284 183 (64.44%) 18
2001 *# 68 61 18 0 147 79 (53.74%) 4
# For the year 2001, the figures were for those aged 18-20.
University B (1990-2000) (for those aged ≤20, with great majority aged 18-20) Tuberculin Test (mm) Year
0-9 10-14 15-19 ≥20 Total TT≥10mm Not read
1990 70 92 58 10 230 160 (69.57%) 17 1991 88 80 34 16 218 130 (59.63%) 20 1992 87 79 57 5 228 141 (61.84%) 2 1993 80 145 41 10 276 196 (71.01%) 3 1994 83 126 57 12 278 195 (70.14%) 7 1995 111 152 58 14 335 224 (66.87%) 2 1996 131 167 33 23 354 223 (62.99%) 3 1997 188 167 33 7 395 207 (52.41%) 1 1998 221 101 46 5 373 152 (40.75%) 3
1999 * 12 10 2 0 24 12 (50%) 0 2000 * 6 4 2 0 12 6 (50%) 0 2001 * 2 0 0 0 2 0 0
* NB: The university new entrants were going to study in medical/paramedical schools. They were tuberculin
tested (TT) and if negative (≤ 9mm), were given BCG vaccination irrespective of whether they had BCG or BCG revaccination in the past. However, since 1999, those who had known history of BCG in the past were advised not to have TT/BCG. Hence, this would probably decrease the TT positive rate since then.

Part 4
SUPPLEMENT

Contents
Supplement 1 Chemotherapy of Tuberculosis in Hong Kong – Update in 2001 2 Notification forms (a) DH1A(s)(Rev.99) (for notification of TB to Department of Health) (b) LD483(Rev.11.6.1999) (for notification of occupational TB and other notifiable occupational diseases to Labour Department)

CHEMOTHERAPY OF TUBERCULOSIS
IN HONG KONG
UPDATE IN 2001
A consensus statement of the Tuberculosis Control Coordinating Committee of
the Hong Kong Department of Health and the Tuberculosis Subcommittee of
the Coordinating Committee in Internal Medicine of the Hospital Authority, Hong Kong

1
AUTHORS TAM Cheuk-ming * FRCP(EDIN), FHKAM YEW Wing-wai # FRCP(EDIN), FHKAM LEUNG Chi-chiu * MRCP(UK), FHKAM CHAN Hok-sum @ FRCP(EDIN), FHKAM
* TB & Chest Service, Department of Health, Hong Kong SAR, China # Department of Respiratory Medicine, Grantham Hospital, Hong Kong SAR, China @ Department of Medicine, Alice Ho Miu Ling Nethersole Hospital, Hong Kong SAR, China Corresponding Author: TAM Cheuk-ming Address: Wanchai Chest Clinic, 99 Kennedy Road, Hong Kong November 2001
ACKNOWLEDGEMENT This statement is prepared by a Working Group consisting of the above authors on behalf of the Tuberculosis Control Coordinating Committee of the Hong Kong Department of Health and the Tuberculosis Subcommittee of the Coordinating Committee in Internal Medicine of the Hong Kong Hospital Authority. The authors would like to thank the members of the two Committee/ Subcommittee. The members are: Dr. William Chen, Dr. YC Chan, Dr. CW Lam, Dr. KS Chan, Prof. WK Lam, Dr. Loretta Yam, Dr. WC Yu, Dr. CY Tam, Dr. David Dai, Dr. David Hui, Dr. SS Ho, Dr. KM Kam, Dr. Raymond Yung, Dr. CM Chu, Dr. ML Wong, Dr. CK Chan, and Dr. Kenneth Tsang.

2
ABSTRACT This is an update of the previous consensus statement on chemotherapy of tuberculosis published in 1998. More detailed recommendations have been provided to facilitate management of patients in a number of special settings like HIV infection, liver and renal dysfunction. A new section on geriatric tuberculosis has also been added to take into account of the increasing number of elderly tuberculosis patients within the local community. The usual dosages of second-line anti-tuberculosis drugs are incorporated, as are the common adverse reactions of both first and second-line drugs. It is hoped that this enriched statement may serve as a concise reference for chemotherapy of tuberculosis in Hong Kong. Overall, directly observed treatment remains the mainstay of anti-tuberculosis chemotherapy. A 6-month standard combination regimen with four drugs in the initial phase is recommended for uncomplicated new cases of pulmonary tuberculosis, while a 9-month standard regimen starting with 5 drugs is recommended for retreatment cases. Multidrug-resistant tuberculosis requires individually tailored treatment regimens as guided by drug susceptibility testing. Recommendations for extrapulmonary tuberculosis are based on relatively limited data. Shorter regimens may be acceptable in some situations when better evidences accrue. A longer duration of treatment is generally required for patients with diabetes mellitus, silicosis and immunocompromization. During pregnancy, streptomycin should be avoided and the safety of most second-line agents has not yet been ascertained. Potentially hepatotoxic agents should be used with caution in patients with liver dysfunction. The renal route of elimination of streptomycin, ethambutol and some second-line agents necessitates caution and dosage reduction in case of renal impairment. Key words: Antituberculosis agents; Pulmonary tuberculosis; Extra-pulmonary tuberculosis; Hong Kong INTRODUCTION Tuberculosis (TB) remains a very important infectious disease in Hong Kong. In 2000, there were 7,578 notifications of TB and 299 deaths, which corresponded to crude notification and death rates of 111.7 per 100,000 and 4.4 per 100,000, respectively. As TB can affect organ systems other than the lungs, doctors practising in various specialties may sometimes need to manage patients with this disease. This is an update of the previous consensus statement on chemotherapy of TB published in 19981. This updated statement has been prepared on behalf of the Tuberculosis Control Coordinating Committee of the Hong Kong Department of Health and the Tuberculosis Subcommittee of the Coordinating Committee in Internal Medicine of the Hong Kong Hospital Authority. The multitude of possible situations involving TB precludes an in-depth discussion of each in this concise statement2-8. Though not exhaustive, it may still serve as a primary reference in antituberculosis chemotherapy. The clinical situations are broadly classified into several categories. In each category, recommendations on the treatment regimens are made. As accrual of new scientific data is always ongoing, periodic updating of such information will inevitably be required. It is desirable for TB patients to be managed by or in consultation with doctors

3
experienced in this field. Proper pretreatment assessment and careful monitoring during treatment are necessary. While a treatment protocol is mandatory for programme purpose, flexibility as tailored to individual patient's clinical status is often needed. Drug adherence is crucial for treatment success and prevention of drug resistance. As far as possible, all antituberculosis drugs should be administered using "directly observed treatment" to meet the purpose6-8. Apart from giving antituberculosis drugs, adjunctive measures such as short courses of corticosteroids can be useful in managing TB pericarditis, advanced stages of TB meningitis, certain cases of TB lymphadenitis, TB pleural effusion, TB pyrexia, genitourinary TB, and some other extrapulmonary forms of TB9,10. These can also be used to suppress severe hypersensitivity reactions to antituberculosis drugs. Public health measures should also be taken. All cases of TB must be notified to the Department of Health using notification form DH1A(s)(Rev.99). Proper completion of all items in the form is essential to provide comprehensive data on the surveillance of the disease. Section I: pulmonary tuberculosis Category A: uncomplicated tuberculosis Category A1: new cases Recommendation* 2HRZ+(E or S) / 4 HR __________________________________________________________________________________________ * Notations used for TB treatment regimens in this consensus statement:
Drugs: E, ethambutol; H, isoniazid; R, rifampicin; S, streptomycin; Z, pyrazinamide Duration: this is shown by the figures (in months) in front of the drug combinations; the slash "/" is
used to separate different phases of treatment Frequency: this is shown by the subscripts attached to the individual drugs (i.e. subscript "3" indicates
thrice weekly administration) and absence of subscript indicates daily administration __________________________________________________________________________________________
Four drugs — isoniazid, rifampicin, pyrazinamide, and either ethambutol or streptomycin — are recommended for the initial 2-month phase of treatment6-8, as the rate of initial resistance to isoniazid is more than 4% in Hong Kong. Two drugs — isoniazid and rifampicin — are recommended for the 4-month continuation phase6-8, which makes a total treatment duration of 6 months. The drugs may be given on a daily or thrice-weekly basis in both the initial and the continuation phase7. Studies have shown that daily administration for 2 months followed by thrice-weekly treatment for 4 months can be equally efficacious3,6,7. The recommended dosages are listed in Table 1. The existing service programme in the chest clinics is intermittently administered chemotherapy throughout the 6 months5,11 and is suitable for patients who are receiving ambulatory treatment right from the start of therapy. This regimen can also be considered for those in-patients who have uncomplicated TB and are soon ready for discharge to chest clinics for continuation of ambulatory chemotherapy. For patients with extensive disease, the 2-month initial phase may be extended to 3 or 4 months, depending on clinical, bacteriological, and radiological responses, while the total duration of treatment may still remain at 6 months. An occasional patient may need prolongation of therapy to beyond 6 months. If there is a suspicion of drug-resistant TB (e.g. in contacts of patients with drug-resistant TB), the initial phase of treatment may be similarly

4
extended, pending the conventional drug susceptibility test (ST) results, if rapid susceptibility studies are not available. Category A2: retreatment cases Recommendation 3(4)HRZES / 6(5)HR±E
Five drugs — isoniazid, rifampicin, pyrazinamide, ethambutol, and streptomycin — are recommended for the initial 3 to 4 months7, depending on the timing of the availability of ST results, the rate of smear conversion, extent of disease, and probability of drug resistance. Isoniazid and rifampicin (also with ethambutol if the disease is extensive or the ST pattern is unknown) are recommended for the continuation phase; the total treatment duration is 9 months. If the ST results that are available subsequently are unfavourable, the above regimen may need to be modified (see Category B). Category B: drug-resistant tuberculosis Comparative less supporting data are available for categorical recommendation of regimens for the treatment of drug-resistant TB12. It is important to avoid the "addition phenomenon"13 — namely, adding a single drug to a failing regimen. Otherwise, acquired resistance to the newly added drug may develop. Instead, add at least 2, 3, or more drugs to which the organisms are known to be susceptible, or which have not already been taken by the patient. To assist in the management of drug-resistant TB, the following regimens are suggested for reference. Category B1: resistance to isoniazid alone Recommendations2-4,14,15
(1) If the ST pattern is known before starting treatment:
(a) 2 SRZE / 7 RZE or (b) 12 RZE
(2) If ST results are reported during treatment of new cases (as in category A1): During treatment, the ST results may become available during the continuation phase when using the drug combination of isoniazid with rifampicin. If resistance to isoniazid is noted, the treatment regimen should be changed to the daily administration of rifampicin, pyrazinamide, and ethambutol as follows: 2HRZ + (E or S) / (1-2) HR ± E / (9-8) RZE Apart from these regimens, clinical trials have also shown that other regimens, such as 6HRZ + (E or S) are useful in isoniazid-resistant disease. Regimens such as 2HRZS / 4H3R3 and 2H3R3Z3S3 / 2H3R3S3 / 2H3R3 are also acceptable regimens and have a relapse rate of ≤10%.
(3) If ST results are reported during retreatment, the following regimen is recommended: (3-4) HRZES / (9-8) RZE
Category B2: resistance to rifampicin alone Recommendations16

5
(1) If the ST pattern is known before starting treatment, the following regimen can be given
for a total duration of 18 months, or 12 months after sputum culture conversion to negative: (a) (3-4) HZES / (15-14) HZE or (b) 18 HZE
(2) If ST results are reported during treatment for new cases, the following can be given for a total duration of 18 months, or 12 months after negative culture: 2HRZ + (E or S) / (1-2) HR ± E / (15-14) HZE However, if before changing to a combination of isoniazid, pyrazinamide, and ethambutol, additional acquired resistance to isoniazid is also suspected or the treatment response is unsatisfactory (e.g. if the sputum remains positive for acid-fast bacilli), isoniazid, pyrazinamide, and ethambutol with streptomycin (or other drugs) can be given in the third phase, until the new ST results are available.
(3) If the ST results are reported during retreatment, the following can be given for a total duration of 18 months, or 12 months after negative culture: (3-4) HRZES / (15-14) HZE
Category C: multidrug-resistant tuberculosis For the treatment of multidrug-resistant TB (MDR-TB) — that is, TB caused by
bacilli that are resistant to at least isoniazid and rifampicin in vitro, a combination of drugs to which the organism is, or is likely to be, susceptible should be used. This usually comprises 5 or 6 drugs for the initial 6 months and then 3 or 4 drugs subsequently13. Apart from the first-line anti-TB drugs (ethambutol and pyrazinamide), other drugs available include the fluoroquinolones (e.g. ofloxacin, levofloxacin, ciprofloxacin), aminoglycosides (kanamycin or amikacin), capreomycin, prothionamide / ethionamide, cycloserine, para-aminosalicylic acid, and clofazimine. The dosages of such drugs are shown in Table 2. The optimum duration of therapy for MDR-TB has not yet been clearly identified. Some authorities recommend a total duration of at least 18 months after culture negativity13. However, local experience suggests that, with adequate multidrug-treatment regimens, and the inclusion of fluoroquinolones to which the bacilli are still susceptible, the total duration may be shortened to 12 to 15 months17. A longer duration may be required for patients with diabetes mellitus, silicosis, slow sputum culture conversion, or extensive disease. Treatment should be conducted in specialized centres13. It is essential to monitor the clinical, radiological, and most importantly bacteriological progress17. Caution is to be exercised in the use of second-line drugs, as they are often associated with significant side effects13,17. Section II: extrapulmonary tuberculosis As there have been few large-scale studies on the treatment of extrapulmonary TB, consensus is often lacking, especially in relation to the duration of treatment. The following

6
regimens are recommended as reference to assist in the management of extrapulmonary TB. These recommendations are based on limited current evidence and local experience, and may have to be further modified as better evidence for shorter regimens emerge, or as experience accumulates. Generally speaking, the initial phase should be advisably given on a daily basis. Adjunctive corticosteroid therapy can be useful as previously alluded. Category A: tuberculous meningitis (including central nervous system tuberculoma) Recommendation6,8,18,19 3 HRZE ± S / 9 HR ± E Depending on computed tomography findings and treatment response, some authorities may further prolong the total duration of treatment for central nervous system tuberculoma. Extended treatment may also be considered for those presenting at an advanced stage (e.g. stage III) of TB meningitis. On pharmacokinetic consideration in relation to cerebrospinal fluid penetration, there may be a role of giving pyrazinamide for more than 3 months, especially in those cases where the earlier response is not entirely satisfactory. Category B: miliary tuberculosis 6,8 Recommendation 3 HRZ + (E or S) / 9 HR ± E Category C: tuberculosis of bone and joint 6,8
Recommendation 2 HRZ + (E or S) / 10 HR The total duration of treatment may be reduced to 6 or 9 months in the case of TB of the spine or in other settings with mild disease. Category D: tuberculous lymphadenitis 6,8,20
Recommendations (1) For peripheral disease which commonly involves the cervical region and where there are
only solitary / few affected lymph nodes together with normal chest X-ray, the same treatment as stipulated in Section I, Category A1 should be given for a total duration of 6 months.
(2) Other situations are treated using the same regimen as in Section I, Category A1, but
with the continuation phase extended such that the total duration of treatment is 9 months. One such situation is peripheral cervical lymphadenopathy with the same setting as (1) above but involving many, enlarged lymph nodes, or supraclavicular lymph nodes (with or without the chest X-ray showing active TB). Another such situation is mediastinal lymphadenopathy as detected by computed tomography or plain chest X-ray, and confirmed histologically.
It has to be noted that the clinical response of TB lymph nodes during treatment
may be quite unpredictable, sometimes with paradoxical increases in size probably due to immunological reactions. Residual nodes may still be palpable after completing the full course of treatment
Category E: tuberculous pericarditis, tuberculous peritonitis, and genitourinary

7
tuberculosis The recommendation is the same as in Section I, Category A16,8,21,22, but the continuation phase is extended such that the total duration of treatment becomes 9 months. For some cases that involve limited gut and genitourinary disease, 6 months of treatment may be adequate. One study on tuberculous pericarditis has shown that 3 SHRZ / 3 HR is highly effective21.
Section III: pulmonary tuberculosis associated with medical diseases or special settings Category A: diabetes mellitus The recommendation is the same as in Section I, Category A1, but the continuation phase is extended such that the total duration of treatment becomes 9 months. Category B: immunocompromised patients The recommendation is the same as in Section I, Category A1, but the continuation phase is extended such that the total duration of treatment becomes 9 months. For patients infected with the human immunodeficiency virus, the total duration of treatment should be 9 months23,24, or at least 4 months after culture conversion to negative. Rifampicin should generally not be used when patient is receiving a HIV-protease inhibitor and/or a non-nucleoside reverse transcriptase inhibitor. Rifabutin can be substituted for use together with some HIV-protease inhibitors. Efavirenz can be used with rifampicin or rifabutin, though the latter requires some increase in dosage. Alternatively, non-rifampicin regimens (such as isoniazid + pyrazinamide + streptomycin ± ethambutol), albeit less potent, can be used for extended durations to avoid clinically significant drug interactions. For retreatment and drug-resistant cases in immunocompromised subjects, the regimens are essentially similar to those immunocompetent patients except that a longer duration of treatment is required. Universal precaution and infection control measures should be strictly observed if drugs are to be given by injection. Category C: pregnancy Basically, rifampicin, isoniazid, ethambutol, and pyrazinamide can still be used, although the manufacturers of rifampicin advise caution during pregnancy. Pyridoxine is sometimes recommended for pregnant women receiving isoniazid. Streptomycin should be avoided because of ototoxicity to the foetus. The safety profiles of the second-line drugs and ofloxacin have not been ascertained and thus these drugs should also be avoided. The taking of antituberculous drugs is by itself not an absolute contra-indication to breast feeding6-8,25.The infectiousness of the mother, however, must be considered. The interested reader can refer to the new detailed guidelines from World Health Organization26. Category D: children The treatment regimens are essentially similar to those for adults6,8,25, except that

8
ethambutol should be avoided in children until they are at least 6 years old8,25 and capable of reporting symptomatic visual changes accurately. The drug dosages need to be calculated according to the body weight and may have to be adjusted, especially during the period of adolescent growth spurt. Category E: silico-tuberculosis A longer duration of treatment is required for patients with silico-tuberculosis. The recommendations27,28 are as follows: (1) new cases
(a) 8 H3R3Z3 + (E3 or S3) or (b) 2 HRZ + (E or S) / 7 HR
(2) retreatment cases
(a) 3 H3R3Z3E3S3 / 5 H3R3Z3 + (E3 or S3) or (b) 3 HRZES / 6 HR±E
The former regimen, (a) is likely associated with a higher success rate but the tolerance is questionable (≥20% intolerance especially to streptomycin and / or pyrazinamide). Category F: geriatric tuberculosis Basically, the treatment of tuberculosis in the elderly should not markedly differ from that in the younger population. However, due regard must be paid to the physiological, psychological and social changes as well as the increased prevalence of co-morbidity that may be associated with aging. As the risk of hepatotoxicity is much higher29 especially in those with malnourishment, some individual tailoring of dosage, say by using isoniazid 200 mg instead of 300 mg once daily and pyrazinamide 1 gm instead of 1.5 gm once daily may appear warranted. Pyridoxine supplement should also be considered for those with poor nutritional intake or at increased risk of neuropathy. When the drug susceptibility pattern of the cultured bacilli is known to be favourable, use of rifampicin and isoniazid together may prove sufficient30 for diseases with limited bacillary load. A total duration of 9 months is required for co-administration of these 2 drugs. Use of ethambutol can be problematic in many old patients with poor baseline visual function and / or difficulty in assessing visual acuity. Category G: liver dysfunction Transient changes in bilirubin and alanine transaminase levels are relatively common during antituberculosis chemotherapy and do not signify true hepatotoxicity. Drug-induced hepatitis which occurs more commonly in patients with compromised liver reserve such as in chronic hepatitis B and C infection and alcoholic liver disease6,31,32 necessitates cessation of therapy. Although it is somewhat controversial whether routine monitoring of liver function tests is required in patients receiving antituberculosis drugs, those at risk should be managed with vigilance both clinically and biochemically.

9
When the tuberculous disease is mild or has improved markedly, one can wait until the liver chemistry has normalized before retrial of the conventional antituberculosis drugs, by gradual re-institution. Whenever possible, isoniazid and rifampicin should be included in the regimen, so that treatment duration will not be unduly prolonged. In the face of extensive disease when delay in therapy might be detrimental to the patient's health, ofloxacin can be used together with streptomycin and ethambutol as an interim regimen for treatment33. This has been found to be safe and efficacious for the majority of such patients. Incorporation of ofloxacin as a component of a definitive regimen should only be considered when the patient cannot tolerate the co-administration of rifampicin and isoniazid. The optimum dosage of ofloxacin is unknown. Current experience shows that 400 - 600 mg once daily can be tolerated by most patients in this setting. For levofloxacin, the dosage of 400 mg once daily may be employed, pending accumulation of more experience. The fluoroquinolones’ dosages should be tailored to age, body weight, renal function, extent of disease, and the number of accompanying drugs. The optimum duration of ofloxacin plus either rifampicin or isoniazid together with ethambutol as a definitive therapeutic regimen is unknown, and appears to be at least 1 year. Category H: renal impairment The development of antituberculosis drug-related renal impairment necessitates the withdrawal of the drug(s). Examples include streptomycin and rifampicin. In general, isoniazid, rifampicin and pyrazinamide can be used in normal dosages in the face of renal impairment.7,8,25 In severe renal impairment, the dosage of isoniazid should be reduced to 200 mg once daily and pyridoxine supplementation is needed to prevent the development of peripheral neuropathy. Streptomycin and aminoglycosides should be avoided7,8,25 or must have dosages adjusted in the presence of renal impairment. Ethambutol is also predominantly removed by the kidney. Dosage reduction is also mandatory7,8,25. In patients with creatinine clearances of 50 - 100 ml/min, ethambutol at 25 mg/kg thrice-weekly can be given; for patients with creatinine clearances of 30 - 50 ml/min, the same dose should be given twice a week. With lower creatinine clearance (10 - 30 ml/min), a dosage of 15 mg/kg at 48 - 36 hour intervals has been suggested. Therapeutic drug monitoring of streptomycin and ethambutol concentrations in serum may help to optimize therapy and minimize toxicity. Ofloxacin and ciprofloxacin are also dependent on renal clearance and dosage reduction in the presence of renal impairment must be made accordingly.
Isoniazid has previously been shown to be significantly removed by haemodialysis34, but a recent study showed that the median isoniazid recovery in the dialysate was only 9.2%, suggesting that hepatic metabolism remains the primary mechanism of clearing isoniazid35. Rifampicin is not significantly removed by haemodialysis34-36. Both of them may be given in their usual daily dosage35,37. Haemodialysis removal of pyrazinamide is significant35. Its primary metabolite, pyrazinoic acid, has been shown to accumulate in patients with renal failure. It is still not clear whether dosage reduction or spacing is required for patients on haemodialysis and receiving pyrazinamide35,36. A dosage of 25-30 mg/kg thrice per week has been recommended by some authorities35, whereas 40 mg/kg thrice per week has been recommended by others37. Ethambutol can still be given at a dosage of 15-25 mg/kg

10
thrice per week25,35,37. Regarding the timing of administration of drugs, some authorities have recommended dosing 6 to 24 hours prior to haemodialysis37, while others have recommended post-dialysis treatment35. Section IV: use of fixed-dose combination tablets Use of fixed-dose combination tablets (FDC) can provide a number of advantages. These include reduced chance of development of acquired drug resistance, simplification in prescribing effective regimens by physicians, improvement in patient adherence and lessened risk of inappropriate use of rifampicin6-8,25. However, there are also possible disadvantages such as compromised efficacy due to preparations with suboptimum bioavailability, higher cost and lack of flexibility in dosing7. More experience is required to recommend widespread use of FDC under programme setting25. Current and future preparations include combinations of rifampicin, isoniazid, pyrazinamide and ethambutol in various ways. However, the presently available combinations in Hong Kong include only rifater (R + H + Z) and rifinah (R + H).

11
Appendix I Adverse reactions to antituberculosis drugs
Reactions Drug
Common Uncommon Rare
Isoniazid Hepatitis
Cutaneous hypersensitivity Peripheral neuropathy
Giddiness Convulsion Optic neuritis Mental symptoms Haemolytic anaemia Aplastic anaemia Lupoid reactions Arthralgia Gynaecomastia
Rifampicin Hepatitis Cutaneous hypersensitivity Gastrointestinal reactions Thrombocytopenic purpura Febrile reactions “Flu syndrome”
Shortness of breath Shock Haemolytic anaemia Acute renal failure
Pyrazinamide Anorexia Nausea Flushing
Hepatitis Vomiting Arthralgia Cutaneous reaction
Sideroblastic anaemia
Ethambutol Retrobulbar neuritis Arthralgia
Hepatitis Cutaneous reaction Peripheral neuropathy
Streptomycin Cutaneous hypersensitivity Giddiness Numbness Tinnitus
Vertigo Ataxia Deafness
Renal damage Aplastic anaemia
Thiacetazone Gastrointestinal reactions Cutaneous hypersensitivity Vertigo Conjunctivitis
Hepatitis Erythema multiforme Exfoliative dermatitis Haemolytic anaemia
Agranulocytosis

12
Amikacin Kanamycin Capreomycin
Ototoxicity: hearing damage, vestibular disturbance
Nephrotoxicity: deranged renal function test
Clinical renal failure
Ofloxacin Ciprofloxacin
Gastrointestinal reactions Insomnia
Anxiety Dizziness Headache Tremor
Convulsion
Ethionamide Prothionamide
Gastrointestinal reactions
Hepatitis Cutaneous reactions Peripheral neuropathy
Convulsion Mental symptoms Impotence Gynaecomastia
Cycloserine Dizziness Headache Depression Memory loss
Psychosis Convulsion
Sideroblastic anaemia
Para-aminosalicylic acid
Gastrointestinal reactions Hepatitis Drug fever
Hypothyroidism Haematological
reactions

13
Table 1 Usual dosages of conventional antituberculosis drugs
Daily dosage Intermittent dosage
Adults Adults
Drug Adults and children (mg/kg) Weight
(kg) Dose
Adults and children (mg/kg)
Weight (kg)
Dose
Isoniazid * @ 5 – 300 mg # 10-15 three times/week
– –
10 <50
450 mg
10-12 three times/week
– 600 mg Rifampicin *
≥50 600 mg
Streptomycin * 12-15 <50 ≥50
500-750 mg 750 mg
12-15 <50 ≥50
500-750 mg 750-1000mg
Pyrazinamide 25-30 <50 ≥50
1.0-1.5 g 1.5-2.0 g
30-40 three times/week
<50 ≥50
2.0 g 2.5 g
Ethambutol 15 – 30 three times/week
– –
Thiacetazone * 2.5 – 150 mg – – –
Rifater per 10 kg 1 tablet
>50 kg 5 tablets
* Some authorities recommend higher dosages of isoniazid, rifampicin, streptomycin, and thiacetazone for children.
# Some elderly and/or malnourished patients can only tolerate isoniazid 200 mg daily. @ Pyridoxine supplement should be considered for those with malnutrition or at risk of neuropathy, e.g.
pregnancy, diabetes mellitus, alcoholism, chronic renal failure, and HIV infection.

14
Table 2 Usual dosages of second-line antituberculosis drugs in the treatment of MDR-TB
Daily dosage
Adults
Drug Adults and children (mg/kg)
Weight (kg) Dosage
Amikacin 15 750 mg
Kanamycin 15 750 mg
Capreomycin 15 750 mg
three to five times/week
Ofloxacin 600-800 mg
Levofloxacin 500-600 mg
Ciprofloxacin 750-1500 mg
Ethionamide 15 <50 500-750 mg
Prothionamide (adults) ≥50 750-1000 mg
Cycloserine 15 (adults)
<50 ≥50
500-750 mg 750-1000 mg
Para-aminosalicylic acid
2 g/10 kg 10-12 g

15
REFERENCES 1. The Tuberculosis Control Coordinating Committee of the Hong Kong Department of Health
and the Tuberculosis Subcommittee of the Coordinating Committee in Internal Medicine of the Hospital Authority, Hong Kong. Chemotherapy of tuberculosis in Hong Kong: a consensus statement. Hong Kong Med J 1998;4:315-20.
2. Hong Kong Chest Service / British Medical Research Council. Five-year follow-up of a controlled trial of five 6-month regimens of chemotherapy for pulmonary tuberculosis. Am Rev Respir Dis 1987;136:1339-42.
3. Singapore Tuberculosis Service / British Medical Research Council. Five-year follow-up of a clinical trial of three 6-month regimens of chemotherapy given intermittently in the continuation phase in the treatment of pulmonary tuberculosis. Am Rev Respir Dis 1988;137:1147-50.
4. Hong Kong Chest Service / British Medical Research Council. Controlled trial of 2, 4, and 6 months of pyrazinamide in 6-month, three-times-weekly regimens for smear-positive pulmonary tuberculosis, including an assessment of a combined preparation of isoniazid, rifampin, and pyrazinamide - results at 30 months. Am Rev Respir Dis 1991;143:700-6.
5. Chan SL, Wong PC, Tam CM. 4-, 5- and 6-month regimens containing isoniazid, rifampicin, pyrazinamide and streptomycin for treatment of pulmonary tuberculosis under programme conditions in Hong Kong. Tuber Lung Dis 1994;75:245-50.
6. Bass JB Jr, Farer LS, Hopewell PC, et al. Treatment of tuberculosis and tuberculosis infection in adults and children. American Thoracic Society and The Centers for Disease Control and Prevention. Am J Respir Crit Care Med 1994;149:1359-74.
7. World Health Organization. Treatment of tuberculosis - guidelines for national programmes 1997. WHO, Geneva, 1997.
8. Joint Tuberculosis Committee of the British Thoracic Society. Chemotherapy and management of tuberculosis in the United Kingdom: recommendations 1998. Thorax 1998;53:536-48.
9. Alzeer AH, FitzGerald JM. Corticosteroids and tuberculosis: risks and use as adjunct therapy. Tuber Lung Dis 1993;74:6-11.
10. Dooley DP, Carpenter JL, Rademacher S. Adjunctive corticosteroid therapy for tuberculosis: A critical reappraisal of the literature. Clin Infect Dis 1997;25:872-87.
11. Tam CM, Chan SL, Lam CW et al. Rifapentine and isoniazid in the continuation phase of treating pulmonary tuberculosis. Initial report. Am J Respir Crit Care Med 1998;157:1726-33.
12. Mitchison DA, Nunn AJ. Influence of initial drug resistance on the response to short-course chemotherapy of pulmonary tuberculosis. Am Rev Respir Dis 1986;133:423-30.
13. Crofton J, Chaulet P, Maher D. Guidelines for the management of drug-resistant tuberculosis WHO/TB/96.210 (Rev 1) World Health Organization, Geneva 1997.
14. Davidson PT. Drug resistance and the selection of therapy for tuberculosis. Am Rev Respir Dis 1987;136:255-7.
15. Babu Swai O, Aluoch JA, Githui WA et al. Controlled clinical trial of a regimen of two durations for the treatment of isoniazid resistant pulmonary tuberculosis. Tubercle 1988;69:5-14.
16. Barnes PF, Bloch AB, Davidson PT, Snider DE Jr. Tuberculosis in patients with human immunodeficiency virus infection. N Engl J Med 1991;324:1644-50.
17. Yew WW, Chan CK, Chau CH et al. Outcomes of patients with multidrug-resistant pulmonary tuberculosis treated with ofloxacin / levofloxacin-containing regimens. Chest 2000;117:744-51.
18. Humphries M. The management of tuberculous meningitis [editorial]. Thorax 1992;47:577-81. 19. Ellard GA, Humphries MJ, Allen BW. Cerebrospinal fluid drug concentration and the treatment
of tuberculous meningitis. Am Rev Respir Dis 1993;148:650-5. 20. Yuen AP, Wong SH, Tam CM, Chan SL, Wei WI, Lau SK. Prospective randomized study of
thrice weekly six-month and nine-month chemotherapy for cervical tuberculous lymphadenopathy. Otolaryngol Head Neck Surg 1997;116:189-92.
21. Strang JI, Kakaza HH, Gibson DG, Girling DJ, Nunn AJ, Fox W. Controlled trial of prednisolone as an adjuvant in treatment of tuberculous constrictive pericarditis in Tvanskei.

16
Lancet 1987, ii:1418-22. 22. Balasubramanian R, Nagarajan M, Balambal R et al. Randomized controlled clinical trial of
short course chemotherapy in abdominal tuberculosis: a five-year report. Int J Tuberc Lung Dis 1997;1:44-51.
23. Scientific Committee of the Advisory Council on AIDS, Hong Kong. Prevention and management of tuberculosis in HIV infected patients in Hong Kong - an information paper. April 1995. Hong Kong: Scientific Committee of the Advisory Council on AIDS, 1995.
24. Havlir DV, Barnes PF. Tuberculosis in patients with human immunodeficiency virus infection. N Engl J Med 1999;340:367-73.
25. ERS, WHO, IUATLD (Europe Region) Task Force. Tuberculosis management in Europe: Recommendations of a task force of the European Respiratory Society, the World Health Organization and the International Union against Tuberculosis and Lung Disease (Europe Region). Eur Respir J 1999;14:978-92.
26. WHO (Division of Child Health Development). Breastfeeding and maternal tuberculosis. 1998;23:1-4.
27. Lin TP, Suo J, Lee CN, Lee JJ, Yang SP. Short-course chemotherapy of pulmonary tuberculosis in pneumoconiotic patients. Am Rev Respir Dis 1987;136:808-10.
28. Hong Kong Chest Service / Tuberculosis Research Centre, Madras / British Medical Research Council. A controlled clinical comparison of 6 and 8 months of antituberculosis chemotherapy in the treatment of patients with silicotuberculosis in Hong Kong. Am Rev Respir Dis 1991;143:262-7.
29. Gronhagen-Riska C, Hellstrom PE, Froseth B. Predisposing factors in hepatitis induced by isoniazid-rifampin treatment of tuberculosis. Am Rev Respir Dis 1978;118:461-6.
30. Stead WW. Tuberculosis among elderly persons, as observed among nursing home residents. Int J Tuberc Lung Dis 1998;2:S64-S70.
31. Ungo JR, Jones D, Ashkin D et al. Antituberculosis drug-induced hepatotoxicity: The role of Hepatitis C and the human immunodeficiency virus. Am J Respir Crit Care Med 1998;157:1871-6.
32. Wong WM, Wu PC, Yuen MF et al. Antituberculosis drug-related liver dysfunction in chronic hepatitis B infection. Hepatology 2000;31:201-6.
33. Yew WW, Lee J, Wong PC, Kwan SYL. Tolerance of ofloxacin in treatment of pulmonary tuberculosis in presence of hepatic dysfunction. Int J Clin Pharm Res 1992;XII:173-8.
34. Andrew OT, Schoenfeld PY, Hopewell PC, Humphreys MH. Tuberculosis in patients with end-stage renal disease. Am J Med 1980;68:59-65.
35. Malone RS, Fish DN, Spiegel DM, Childs JM, Peloquin CA. The effect of hemodialysis on isoniazid, rifampin, pyrazinamide and ethambutol. Am J Respir Crit Care Med 1999;159: 1580-4.
36. Swan SK, Bennett WM. Use of drugs in patients with renal failure in Schrier RW, Gottschalk CW (eds). Diseases of the kidney 6th Edition, Volume 3, 1997, New York Little Brown pp2968-3011.
37. Ellard GA. Chemotherapy of tuberculosis for patients with renal impairment. Nephron 1993;64:169-181

FORM 1
QUARANTINE AND PREVENTION OF DISEASE ORDINANCE
(Cap. 141)
TUBERCULOSIS NOTIFICATION
Particulars of Infected Person
Name in English Name in Chinese Age/Sex: I.D. Card/Passport No.
Address: Telephone Number:
Place of Work/ School Attended:
Telephone Number:
Site of TB Sputum Disposal Hospital/Clinic sent to (if any):
Resp. System Smear Culture On Treatment
Meninges Positive On Observation
Bone & Joint Negative Referred Hospital No.:
Other(s) Unknown Died
Duration of stay in Hong Kong: __________ Years
Does patient have a history of past treatment for tuberculosis? __Yes __No
If yes, please state the YEAR in which he first received treatment: ________
Notified under the Prevention of the Spread of Infectious Diseases Regulations by
Dr. _______________________________ on
(Full Name in BLOCK Letters)
___________ / _________ / __________ (Date)
Telephone Number: _________________
________________________________ (Signature)
(Please DELETE whichever is not applicable)
"I will arrange for examination of contacts myself."
"Please arrange for examination of contacts to be done by the Government Chest Service."
Further Remarks:
DH 1A(s)(Rev.99)

LD483 (Rev. 11.6.1999) VIII
OCCUPATIONAL SAFETY AND HEALTH ORDINANCENOTIFICATION OF OCCUPATIONAL DISEASES
To : Commissioner for Labour
PARTICULARS OF PATIENTName: HKID/Passport no.: Male/Female* Date of birth: / / Occupation: Home address: Telephone no. (Home) (Office) (Pager/Mobile) Name and address of employer: Telephone no. of employer:
NOTIFIABLE OCCUPATIONAL DISEASES (Please put a tick in �)�1 Radiation Illness �18 Lead Poisoning �35 Chrome Ulceration�2 Heat Cataract �19 Manganese Poisoning �36 Urinary Tract Cancer�3 Compressed Air Illness �20 Phosphorus Poisoning �37 Peripheral Polyneuropathy�4 Cramp of Hand or Forearm �21 Arsenic Poisoning �38 Localised Papillomatous or
Keratotic New Skin Growth�5 Beat Hand �22 Mercury Poisoning �39 Occupational Vitiligo�6 Beat Knee �23 Carbon Bisulphide Poisoning �40 Occupational Dermatitis�7 Beat Elbow �24 Benzene Poisoning �41 Chemical Induced Upper
Respiratory Tract Inflammation�8 Tenosynovitis of Hand or
Forearm�25 Poisoning by Nitro-, Amino-, or
Chloro- Derivatives of Benzene�42 Nasal or Paranasal Sinus Cancer
�9 Anthrax �26 Dinitrophenol Poisoning �43 Byssinosis�10 Glanders �27 Poisoning by Halogen
Derivatives of Hydrocarbons�44 Occupational Asthma
�11 Leptospirosis �28 Diethylene Dioxide Poisoning �45 Silicosis�12 Extrinsic Allergic Alveolitis �29 Chlorinated Naphthalene
Poisoning�46 Asbestos-Related Diseases
�13 Brucellosis �30 Poisoning by Oxides of Nitrogen �47 Occupational Deafness�14 Tuberculosis in health care
workers�31 Beryllium Poisoning �48 Carpal Tunnel Syndrome
�15 Parenterally Contracted ViralHepatitis in health care workers
�32 Cadmium Poisoning �49 Legionnaires’ Disease
�16 Streptococcus suis Infection �33 Dystrophy of the Cornea�17 Avian Chlamydiosis �34 Skin Cancer
Diagnosis: Confirm/Suspect* Date of onset of illness: / / Follow-up of patient: Treated/Referred to hospital/Others(specify)*: Other relevant information: Name of notifying medical practitioner: Address of notifying medical practitioner: Telephone no. of notifying medical practitioner:
Date: Signature:
*Delete whichever is inapplicablePlease return this form by fax (no. 25812049) or by mail to Occupational Health Service, Labour Department, 15/F HarbourBuilding, 38 Pier Road, Central, Hong Kong.For details of Notifiable Occupational Diseases and their related occupations, please refer to Schedule 2 of the OccupationalSafety & Health Ordinance and to the Labour Department publication “Guidance Notes on the Diagnosis of NotifiableOccupational Diseases”. Enquiry telephone no. : 2852 4041.
For Internaluse:
Code:
Code:
Code:
Code:

LD483 (Rev. 11.6.1999) 9
Please affix stamp
Occupational Health ServiceLabour Department
15/F, Habour Building38, Pier Road
CentralHong Kong