Annual Performance Plan 2021/22 - Wesgro
114
Annual Performance Plan 2021/22 Submission date: 9 March 2021 An inspiring place to do business
-
Upload
khangminh22 -
Category
Documents
-
view
2 -
download
0
Transcript of Annual Performance Plan 2021/22 - Wesgro

Annual Performance Plan 2021/22
Submission date: 9 March 2021
An inspiring place to do business


3
Contents
1. Part A: Our mandate ......................................................................................................................... 11
1.1 Vision .......................................................................................................................................................................... 11
1.2 Mission ...................................................................................................................................................................... 11
1.3 Values ......................................................................................................................................................................... 11
1.4 Constitutional, legislative and other mandates ...................................................................................................... 111.4.1 Constitutional mandate ................................................................................................................................111.4.2 Legislative mandates .................................................................................................................................. 121.4.3 Policy mandates ......................................................................................................................................... 131.4.3.1 National policy framework .......................................................................................................................... 131.4.3.2 Provincial policy framework ........................................................................................................................ 14
2. Part B: Our strategic focus ............................................................................................................. 19
2.1 Updated situational analysis .................................................................................................................................... 19
2.2 Organisational environment..................................................................................................................................... 272.2.1 External Environmental Analysis ................................................................................................................ 272.2.2 Internal Environmental Analysis ................................................................................................................. 29
2.3 Wesgro’s Strategic Outcomes ................................................................................................................................. 34
2.4 Overview of 2021/22 budget and MTEF estimates ................................................................................................ 35
2.5 Relating expenditure trends to strategic goals ...................................................................................................... 38
3. Part C: Measuring our performance .............................................................................................. 41
3.1 Programme 1: Corporate Services .......................................................................................................................... 413.1.1 Programme structure .................................................................................................................................. 413.1.2 Strategic outcome ....................................................................................................................................... 423.1.3 Outcomes, outputs, performance indicators and targets 2021/22 .............................................................. 433.1.4 Explanation of planned performance over the medium-term period ........................................................... 453.1.5 Reconciling performance targets with the budget and MTEF ..................................................................... 453.1.6 Performance and expenditure trends ......................................................................................................... 473.1.7 Key risks ..................................................................................................................................................... 48
3.2 Programme 2: Investment Promotion ..................................................................................................................... 493.2.1 Programme structure .................................................................................................................................. 493.2.2 Strategic outcomes ..................................................................................................................................... 523.2.3 Outcomes, Outputs, Performance Indicators and Targets 2021/22 ............................................................ 533.2.4 Explanation of planned performance .......................................................................................................... 543.2.5 Programme resource considerations .......................................................................................................... 543.2.6 Performance and expenditure trends ......................................................................................................... 553.2.7 Key risks ..................................................................................................................................................... 56

4
3.3 Programme 3: Export Promotion ............................................................................................................................. 573.3.1 Programme structure .................................................................................................................................. 573.3.2 Strategic outcomes ..................................................................................................................................... 593.3.3 Outcomes, Outputs, Performance Indicators and Targets 2021/22 ............................................................ 603.3.4 Explanation of planned performance over the medium-term period ........................................................... 613.3.5 Reconciling performance targets with budget and the MTEF ..................................................................... 613.3.6 Performance and expenditure trends ......................................................................................................... 623.3.7 Key risks ..................................................................................................................................................... 63
3.4 Programme 4: Wesgro Research ............................................................................................................................. 643.4.1 Programme structure .................................................................................................................................. 643.4.2 Strategic outcome ....................................................................................................................................... 653.4.4 Explanation of planned performance over the medium-term period ........................................................... 673.4.5 Reconciling performance targets with the budget and MTEF .................................................................... 673.4.6 Performance and expenditure trends ......................................................................................................... 683.4.7 Key risks ..................................................................................................................................................... 69
3.5 Programme 5: Marketing and Communication ....................................................................................................... 703.5.1 Programme structure ................................................................................................................................. 703.5.2 Strategic objectives .................................................................................................................................... 723.5.3 Outcomes, Performance Indicators and Targets 2021/22 .......................................................................... 733.5.4 Explanation of planned performance over the medium-term period ........................................................... 743.5.5 Reconciling performance targets with the budget and MTEF ..................................................................... 743.5.6 Performance and expenditure trends ......................................................................................................... 753.5.7 Key risks ..................................................................................................................................................... 76
3.6 Programme 6: Destination Marketing Organisation (DMO) ................................................................................... 773.6.1 Programme structure .................................................................................................................................. 773.6.2 Strategic outcomes ..................................................................................................................................... 813.6.4 Explanation of planned performance over the medium-term period ........................................................... 833.6.5 Reconciling performance targets with the budget and MTEF ..................................................................... 833.6.6 Performance and expenditure trends ......................................................................................................... 853.6.7 Key risks ..................................................................................................................................................... 85
3.7 Programme 7: Film and Media Promotion ............................................................................................................. 863.7.1 Programme structure .................................................................................................................................. 863.7.2 Strategic objectives .................................................................................................................................... 873.7.3 Outcomes, Outputs, Performance Indicators and Targets 2021/22 ............................................................ 883.7.4 Explanation of planned performance over the medium-term period ........................................................... 893.7.5 Key risks ..................................................................................................................................................... 90
4. Part D: Technical performance indicator descriptions ................................................................ 93
4.1 Programme 1: Corporate Services .......................................................................................................................... 93
4.2 Programme 2: Investment Promotion ................................................................................................................... 104
4.3 Programme 3: Export Promotion ........................................................................................................................... 105
4.4 Programme 4: Research ......................................................................................................................................... 107
4.5 Programme 5: Marketing and Communication ..................................................................................................... 108
4.6 Programme 6: Destination Marketing.................................................................................................................... 110
4.7 Programme 7: Film and Media Promotion ............................................................................................................ 113

5
Executive Authority StatementThe 2021/22 Annual Performance Plan (APP) is aligned to Wesgro’s 5-year Strategic Plan for the period 2020/21 to 2024/25.
In the development of the 5-year Strategic Plan, there was no knowing that 2020 would bring disruption to economies and livelihoods on a global scale. Developing this APP has therefore been a somewhat extraordinary experience.
Almost every aspect of Wesgro’s mandate involves international economic activity, and the Covid-19 pandemic therefore left no part of the Agency’s operations untouched. The events of 2020 would have seen a lesser institution fumble and panic, but Wesgro did the opposite. This small agency reacted with great speed and agility to adapt to the rapidly unfolding new realities. Not only was Wesgro able to adapt its own operations, but the Agency was able to provide guidance and support to an entire business community trying to keep afloat in a sea of uncertainty.
Wesgro’s unique role, on the one hand as an interface between government and business, and on the other as an international-facing agency, allowed the Agency the agility to roll out the Western Cape’s response plan of containment, adaptation and recovery in a highly effective way.
Wesgro’s mandate is to connect its clients to opportunity, and the Agency adapted to do this in virtual spaces to contain lost opportunities. By adapting to the virtual world, Wesgro has seen a dramatic increase in reach, and has helped clients adapt and thrive. Our greatest challenge is economic recovery, and here Wesgro is working relentlessly to position Cape Town and the Western Cape at the top of the consideration list during our current economic constraints.
2020 presented unprecedented challenges and unexpected opportunities. Looking ahead, this APP tries to make sense of our still uncertain new reality. This is a plan that tries to harness as many of those unexpected opportunities as possible to help the Western Cape economy navigate the uncertainties and challenges that we now know lie ahead.
The APP outlines the outputs that will be delivered for the financial year under review. The plan sets out a set of targets for the financial year, which is calculated against the achievements of previous years and takes into account the impact of COVID-19. The outcomes are aligned to the Agency’s objectives and mandate, and to Government’s priorities. The targets take into consideration the current context of the South African economy and the international economic climate.
Despite an extremely constrained environment, we present ambitious outcome targets as a sign of our commitment to achieve economic growth for our region.
As the Board, we are proud to have provided direction on the development and implementation of the delivery targets, and whole-heartedly endorse this Annual Performance Plan. It is indeed a plan that will contribute significantly to economic recovery and job creation in the Western Cape.
I am confident that the Board, Management and Staff of Wesgro will give every effort to ensure effective implementation of the Agency’s priorities. It is this commitment to excellence that makes Wesgro excel in times of crisis.
Mike Spicer
Chairperson of the Wesgro Board
6
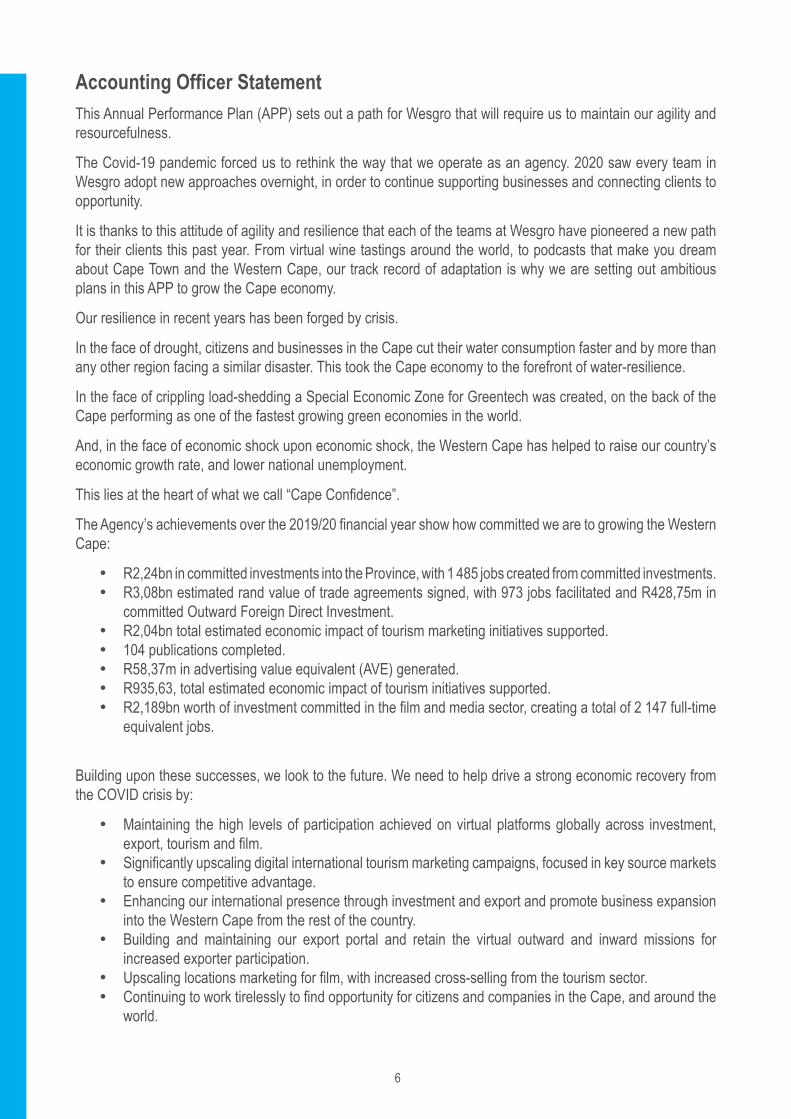
Accounting Officer StatementThis Annual Performance Plan (APP) sets out a path for Wesgro that will require us to maintain our agility and resourcefulness.
The Covid-19 pandemic forced us to rethink the way that we operate as an agency. 2020 saw every team in Wesgro adopt new approaches overnight, in order to continue supporting businesses and connecting clients to opportunity.
It is thanks to this attitude of agility and resilience that each of the teams at Wesgro have pioneered a new path for their clients this past year. From virtual wine tastings around the world, to podcasts that make you dream about Cape Town and the Western Cape, our track record of adaptation is why we are setting out ambitious plans in this APP to grow the Cape economy.
Our resilience in recent years has been forged by crisis.
In the face of drought, citizens and businesses in the Cape cut their water consumption faster and by more than any other region facing a similar disaster. This took the Cape economy to the forefront of water-resilience.
In the face of crippling load-shedding a Special Economic Zone for Greentech was created, on the back of the Cape performing as one of the fastest growing green economies in the world.
And, in the face of economic shock upon economic shock, the Western Cape has helped to raise our country’s economic growth rate, and lower national unemployment.
This lies at the heart of what we call “Cape Confidence”.
The Agency’s achievements over the 2019/20 financial year show how committed we are to growing the Western Cape:
• R2,24bn in committed investments into the Province, with 1 485 jobs created from committed investments.• R3,08bn estimated rand value of trade agreements signed, with 973 jobs facilitated and R428,75m in
committed Outward Foreign Direct Investment.• R2,04bn total estimated economic impact of tourism marketing initiatives supported.• 104 publications completed. • R58,37m in advertising value equivalent (AVE) generated. • R935,63, total estimated economic impact of tourism initiatives supported.• R2,189bn worth of investment committed in the film and media sector, creating a total of 2 147 full-time
equivalent jobs.
Building upon these successes, we look to the future. We need to help drive a strong economic recovery from the COVID crisis by:
• Maintaining the high levels of participation achieved on virtual platforms globally across investment, export, tourism and film.
• Significantly upscaling digital international tourism marketing campaigns, focused in key source markets to ensure competitive advantage.
• Enhancing our international presence through investment and export and promote business expansion into the Western Cape from the rest of the country.
• Building and maintaining our export portal and retain the virtual outward and inward missions for increased exporter participation.
• Upscaling locations marketing for film, with increased cross-selling from the tourism sector.• Continuing to work tirelessly to find opportunity for citizens and companies in the Cape, and around the
world.

7
I would like to thank our stakeholders for their support, particularly the Western Cape Government led by the Premier of the Western Cape, Alan Winde and the Western Cape Minister of Finance and Economic Opportunities, David Maynier; the Mayor of the City of Cape Town, Dan Plato, and Alderman James Vos, Mayoral Committee Member for Economic Opportunities and Assets Management. Economic recovery will be built upon the Western Cape’s strong sense of collaboration and partnerships.
I am exceptionally grateful for the support and guidance of our committed Board of Directors, and in particular Chairperson Michael Spicer. On behalf of the remarkable team at Wesgro, I thank you.
Timothy Harris
Chief Executive Officer

8
Official Sign-OffIt is hereby certified that the Annual Performance Plan for 2021/22:
• was developed by the Management of Wesgro under the guidance of the Board of Directors and Minister David Maynier, MEC of Finance and Economic Opportunities; and
• accurately reflects the impacts, outcomes and outputs which Wesgro will endeavour to achieve during the 2021/22 financial year, subject to the resources being made available.
Kholeka Zama Signature: __________________________________
Chief Financial Officer
Timothy Harris Signature: __________________________________
Chief Executive Officer
Approved by:
Mike Spicer Signature: __________________________________
Chairperson of the Wesgro Board
Minister David Maynier Signature: __________________________________
Executive Authority

9
Part A: Our mandate
Saldanha Bay

10
Hopefield wind farm

11
1. Part A: Our mandate
1.1 VisionTo help the Western Cape become one of the world’s leading regional economies.
1.2 Mission The Agency’s purpose is to help facilitate the growth of the economy of the Western Cape on a sustainable basis and in so doing create employment opportunities for a broad range of skilled, semi-skilled and un-skilled workers.
The mission of the Agency is:
• To facilitate the attraction and retention of direct investment in the Western Cape.• To facilitate the growth of exports.• To position and market the Province as a competitive and sustainable tourism and film destination
globally.• To facilitate the link between business and government decision-makers.• To provide service excellence in all our business support functions.
1.3 ValuesWesgro’s Management and Staff will strive to uphold the following values in all its business activities:
• Professionalism and commitment to excellence• Efficient and outcomes-driven• Accountability• Innovation• Enabling• Passionate• Courage• Integrity and trust
1.4 Constitutional, legislative and other mandates
1.4.1 Constitutional mandate
Constitution of the Republic of South Africa, 1996Schedule 4 of the Constitution of the Republic of South Africa lists functional areas of concurrent national and provincial legislative competencies. Those areas which are relevant for Economic Development and Tourism are:
• Consumer Protection• Industrial Promotion• Tourism• Trade
Schedule 4B of the Constitution identifies Local Tourism as a local government matter of concurrent National and Provincial legislative competence, to the extent set out in sections 155(6)(a) and (7) of the Constitution.

12
1.4.2 Legislative mandates
While Wesgro is governed by a number of Acts, this section provides an overview of the Acts that significantly impact the work of the Agency.
Western Cape Investment and Trade Promotion Agency Amendment Act, 2013 (Act 6 of 2013)To provide for the establishment, appointment, powers and functions of the Western Cape Tourism, Trade and Investment Promotion Agency in order to promote and support the economic growth and development of the Province, and to provide for matters incidental thereto. [Long title amended by section 14 of Act 6 of 2013, wef 28 August 2013.]
Wesgro is a Schedule 3C Public Entity. Its legislative mandate, as provided for in the Objects of the Western Cape Investment and Trade Promotion Agency Amendment Act, 2013 (Act 6 of 2013), include:
(f) “to furnish tourism, trade and investment marketing assistance and expert and specialised advice, information and guidance to any business, company or association of persons who so request it from the Agency or would assist the Agency in achieving its objects;
(h) to act as a tourism, trade and investment promotion agent on behalf of the Province and to facilitate co-ordinated destination marketing activities for the Western Cape;
(l) to develop, implement and promote a provincial tourism, trade and marketing strategy and implement any project that realises growth in the economy of the Western Cape;
(n) to exercise such other powers which, in the opinion of the Minister are necessary for the achievement of its objects and which the Minister, in consultation with the Board, may confer upon the Agency by notice in the Provincial Gazette;
(o) to promote the Province as a tourism destination;
(p) to promote leisure and business tourism and events; and
(q) to promote the alignment of provincial marketing activities in all tourism sectors in the Province in collaboration with private and public entities.”
Broad-Based Black Economic Empowerment Act, 2003 (Act 53 of 2003), as amended by the B-BBEE Amendment Act, 2013 (Act 45 of 2013)The B-BBEE Act establishes a legislative framework for the promotion of black economic empowerment; empowers the Minister to issue codes of good practice, and to publish transformation charters; establishes the Black Economic Empowerment Advisory Council; and provides for matters connected therewith. The B-BBEE Amendment Act introduced a number of changes, of which the following are deemed to be the most significant:
• The establishment of a B-BBEE Commission that provides an oversight and advocacy role.• The definition of “fronting practices” and the criminalisation of such practices.• All organs of state to report on compliance with B-BBEE regulations in their annual reports.
The amendments to the B-BBEE Codes of Good Practice came into effect on 1 May 2015.
The Special Economic Zones Act, 2014 (Act 16 of 2014)The purpose of the Act is to provide for the designation, promotion, development, operation and management of Special Economic Zones (SEZ), which includes the establishment of a business enterprise (either provincial or municipal) to manage each SEZ. The Act provides for the establishment and functioning of the national Special Economic Zones Advisory Board and the establishment of the Special Economic Zones Fund. The Act seeks to

13
regulate the process of applying for and issuing of Special Economic Zones operator permits and to provide for functions of the Special Economic Zones operator.
Tourism Act, 2014 (Act 3 of 2014)This Act makes provision for the development and promotion of sustainable tourism for the social, economic and environmental benefit of South African citizens. Its objectives include the promotion of responsible tourism practices; the effective marketing of South Africa both domestically and internationally through South African Tourism (SAT); the promotion of quality tourism products and services; the promotion of economic growth and development of the sector; and the establishment of concrete intergovernmental relations to develop and manage tourism. It specifically makes provision for further training and registration of tourist guides, a code of conduct and ethics for tourist guides, procedures to lodging complaints and disciplinary measures.
1.4.3 Policy mandates
1.4.3.1 National policy framework
State of the Nation Address (SONA)In the State of the Nation Address (SONA), held on 11 February 2021, the President highlighted the following four key areas of focus:
1. Overcoming COVID-19.
2. Accelerating economic recovery.
3. Implementing economic reforms to drive inclusive growth.
4. Fight corruption and strengthen the state.
Medium Term Strategic FrameworkThe Medium-Term Strategic Framework (MTSF) is the Government’s Strategic Plan for the 2020-2024 electoral term. The MTSF sets out the actions that Government will take, and the targets to be achieved. It also provides a framework for the other plans of National, Provincial and Local Government.
National Development Plan (NDP)The National Development Plan (NDP) represents a vision for the South Africa of 2030. It aims to enable faster economic growth, higher investment and greater labour absorption. The NDP contains detailed plans and interventions across all sectors of the economy to enable the achievement of this vision.
Industrial Policy Action Plan (IPAP)The Industrial Policy Action Plan (IPAP) is firmly entrenched in Government’s overall policy and plans to address the key challenges of economic and industrial growth and race-based poverty, inequality and unemployment. IPAP 2018 is a product of the Economic Sectors, Employment and Infrastructure Development (ESEID) cluster. The responsibility for its implementation lies with Government as a whole, and a wide range of entities, including State Owned Companies. IPAP 2018 focusses on the following ten key themes that inform the work of the DTI and serve as a roadmap for the wider industrial effort:
1. Grow the economy.2. Strengthen efforts to raise aggregate domestic demand – mainly through localisation of public procurement
and intensified efforts to persuade the private sector to support localisation and local supplier development.3. Step up South Africa’s export effort.4. Create and reinforce policy certainty and programme alignment.

14
5. Strengthen ongoing efforts to build a less concentrated, more competitive economic and manufacturing environment in which barriers to entry for new entrants are lowered.
6. Build a stronger system of industrial finance and incentives to support and secure higher levels of private sector investment in the productive sectors of the economy and grow exports.
7. Press ahead with technology-intensive, value-adding beneficiation projects which fully leverage SA’s comparative resource endowment advantage into a global competitive advantage.
8. Optimise technology transfer and diffusion and, working closely with the Department of Science and Technology, further ramp up the effort to commercialise “home-grown” R&D in key sectors.
9. Support the further strengthening of energy-efficient production and carbon mitigation efforts and measures in a manner that allows for sustainable adaptation by all the energy-intensive sectors of the economy.
10. Understand, grasp and prepare for the foreseeable effects of the Digital Industrial Revolution and emergent disruptive technologies, collaboratively adapting SA’s production and services sectors to meet the challenges, including those related to employment displacement.
National Tourism Sector Strategy (NTSS)The National Tourism Sector Strategy (NTSS) aims to inspire and accelerate the responsible growth of the tourism industry. It has the following three core themes, with specific focus areas which has a national, provincial and local perspective:
• THEME 1: Tourism growth and the economy• THEME 2: An enhanced visitor experience• THEME 3: Sustainability and good governance
1.4.3.2 Provincial policy framework
State of the Province Address (SOPA)During the State of the Province Address (SOPA), delivered on 18 February 2021, the Premier outlined the Western Cape Government’s main focus areas for the next year as:
• COVID-19 response• Johnson and Johnson trials• Jobs and the economy• Safety• Dignity and well-being
Provincial Strategic Plan (PSP)Aimed at creating an enabling environment that facilitates opportunities, and encourages responsible citizenship, the Western Cape Government has developed five Vison Inspired Priorities (VIPs). These are:
• VIP 1 – Safe and cohesive communities• VIP 2 – Growth and Jobs• VIP 3 – Empowering people• VIP 4 – Mobility, spatial transformation and human settlements• VIP 5 – Innovation and culture
The Department of Economic Development and Tourism (DEDAT), through its programmes and activities, contributes to the achievement of VIP 2: Growth and Jobs.
The focus areas for VIP 2 are:
• Increasing Investment• Building and maintaining Infrastructure

15
• Growing the economy through export growth• Creating opportunities for job creation through skills development• Creating an enabling environment for economic growth through resource resilience
Wesgro contributes to the achievement of VIP2: Growth and Jobs, and has developed its 5-year strategy and the achievement thereof to the creation of an enabling environment that fosters economic growth and job creation. In terms of the current COVID environment and economic climate, Wesgro has doubled down on its effort to economic and export growth.
Western Cape Recovery PlanThe Recovery Plan is built on four themes:
• COVID Recovery: The pandemic will be with us for the foreseeable future; existing measures must continue and new ones put in place to deal with disruptors to the economy and service delivery.
• Jobs: The economic impact of COVID-19 has been severe. We can only recover if our economy grows and our citizens generate income.
• Well-being: Government must ensure that the basic human needs of our citizens are realised, as guaranteed in the Constitution.
• Safety: This is the over-arching theme for the Provincial Strategic Plan, and it is equally relevant going forward. It is inextricably linked with Wellbeing, as Safety cannot be achieved if basic human needs are not met.
Dignity is central to these themes. The citizen is the centre of everything that we do as government, and what we deliver and how we deliver, must be upheld in the dignity of every individual, household and community.
Wesgro’s legislative mandate and response to the Western Cape’s Recovery Plan:

16
Western Cape Recovery Plan – Wesgro’s economic growth and job creation targets:
Strategic Context Aligned Intervention Implications (Strategic, budgetary and or targets)
Prioritised interventions linked to Western Cape Recovery Plan
Boost investment To recruit and facilitate between R1,96bn and R2,85bn committed investment into the Province, resulting in between 698 and 1 490 jobs.To recruit and facilitate between R1,97bn and R2,91bn film and media productions brought into the Province, resulting in between 2 964 and 3 591 FTE jobs.
Boost exports To recruit and facilitate between R2,97bn and R4,25bn trade agreements, resulting in between 551 and 721 jobs, and R265m and R590m Outward Foreign Direct Investment (OFDI).To market Cape Town and the Western Cape and support tourism destination marketing initiatives with an estimated economic value of R515m and R824m.
Key areas of focus, which are delivery items across the programmes in Wesgro, are:
Investments
• Improve international positioning of the Western Cape region.• Improve positioning of the Western Cape locally – i.e. to companies currently based in Gauteng and
KZN.• Improve ease of doing business and the investment ecosystem.• Improve investment facilitation.• Improve retention strategy.• Optimise resourcing within the investment ecosystem.
Exports
• Stimulate the growth of key sectors such as Business Process Outsourcing, tourism, agriculture and agri-processing.
• Assist firms in moving up the product and services complexity continuum.• Improve productivity in key tradeable sectors through all the instruments at the government’s disposal.• Deepen existing destination markets and seek out new markets with local firms through trade promotion.• Promote trade in key destination markets (i.e. rest of Africa).• Support tourism – air access.

17
Call Centre
Part B: Our strategic focus

18
Cape Town Film Studios

19
2. Part B: Our strategic focus
2.1 Updated situational analysis
Economic Environment2020 will be remembered as a year of extremes and for this it makes it particularly difficult to compare it with any preceding period or with upcoming years. As a result, it probably makes more sense to look at the year in isolation and compare 2019 with 2021. The reality of course is that South Africa’s economy was struggling in 2019 with GDP growth in the region of 0,6%. This is way below the required rate to address the serious challenge of unemployment that at the time of writing this stands on just over 40% of the working population. In fact, the South African economy shed 2,2 million jobs in the second quarter of 2020 as a direct result of the hard lockdown the South African government implemented to gear up the medical response to COVID-19. SA’s GDP suffered a record quarterly contraction of 16.4% (51% annualised) in the same quarter.
At the same time, government implemented large scale recovery programmes (valued at R500bn and equating to around 10% of GDP) to support the unemployed, the poor and struggling companies. Such a large-scale intervention is clearly not sustainable and hence there is an immediate and ongoing need for the economy to recover. It is estimated that South Africa’s economy will contract by 8,3% in 2020. However, it seems that in many cases the market crash was less severe than originally anticipated and that the recovery for 2021 will be more robust, with an anticipated increase of 3,5% GDP. Recovery depends to a large extent on how we manage the impact of the second wave of infections. The significant decrease in interest rates by 300 base points in 2020 to date, is a further stimulus to consumption, although it will no doubt also entice more appetite for consumer debt. The repo rate is expected to remain unchanged in 2021. The rand depreciated from R14,72 in Q4 2019 to R17,95 in Q2 2020 against the US dollar, but is expected to maintain a rate of around R17,20 in 2021.
Inflationary DevelopmentsSouth Africa’s headline inflation averaged 4.1% in 2019, marginally higher than the mid-point of the Central Bank’s target band of 3% to 6%. Year-to-date headline inflation has dropped to 2,4% and it is expected to remain below 4% in 2021.
The oil price has decreased from $63 per barrel in Q4 2019 to $34 in Q2 2020. It is expected that oil prices will increase in 2021, adding to inflation pressure. However, demand for products and services is expected to remain subdued in 2021, which will limit the expectations for significant inflation increases.

20
External PositionNot since the global financial crisis of 2008, has the world seen international trade volumes slow to current levels. Initial projections from a number of multilateral organisations for the contraction of the annual volume for world trade in 2020 range from -10% to -32%, as indicated in the graph below.
According to the World Trade Organisation’s (WTOs) latest October projections, global merchandise trade volumes are forecast to fall by a better-than-initially-expected 9.2% in 2020; modestly less severe than their April projection of 12.9%. The marginally better forecast is underpinned by better-than-expected trade flows in June and July as various lockdowns were eased and economic activity gained modest upward momentum. This in turn has facilitated a resurgence in container port throughput, an increase in global air traffic, and by inference, international air cargo.
Still, the WTO notes that global merchandise trade recorded its sharpest ever one-period decline in the second quarter of 2020, falling by 14.2% compared to the previous quarter, and by differing degrees across regions. Europe and North America recorded the steepest declines, with exports plummeting by 24.5% and 21.8% respectively. The cause and consequences of which ranged from widespread lockdowns, to disrupted industrial production and output, to transport disruptions and ultimately, depressed consumer demand.

21
Looking ahead, the WTO predicts that global trade volume growth should recover to 7.2% in 2021, with the rider that downside risks dominate, with the greatest concern being risks posed by a resurgence in COVID-19 infections. This is fast becoming a potential reality, especially with the fast-rising surge of the second wave of COVID-19 infections in a number of key economies. This in turn could translate (again) into weaker-than-expected demand growth, and the possibility of a reintroduction and expansion of various degrees of travel and trade restrictions.
Recent research, by the Centre for Economic Policy Research, shows that while the initial fall in trade was exceptionally strong, recovery has set in relatively early in comparison to two major historical episodes of trade collapse, notably the Great Recession and the Great Depression. This suggests that world trade is more strongly resilient than first anticipated by the various international organisations. Furthermore, the takings from the study purport that the drop in international merchandise trade – which is often considered a leading indicator – appears to follow a sharp “V-shaped” pattern, with a much faster recovery predicted than seen post previous episodes of world trade contractions.
In a similar vein, COVID-19 has strengthened South Africa’s footing as a springboard into Africa as global economies retract, with the continent presenting a myriad of opportunities as local companies seek to grow their global footprint beyond the traditionally lucrative and now-expensive US and European markets. Notwithstanding the complexities and intricacies often faced when doing business on the African continent, lucrative opportunities undoubtedly exist. Progress on the African Continental Free Trade Area (AfCFTA) front stands to provide further support and opportunities.
This is in addition to new opportunities presented for both South Africa and particularly the Western Cape by the changes being shaped by the Brexit/European Union (EU) exit. The United Kingdom (UK) is the top source of foreign direct investment and tourism for the Western Cape, and the second largest export market, second only to Namibia. Accordingly, the province’s relationship with the UK is more important now more than ever, as the Western Cape and greater South Africa commences the journey to economic recovery post the devastation of COVID-19 with both the EU and UK.

22
While there is no denying that the impact that COVID-19 has had on the local economy has been severe, manifest in job losses, to depressed consumer demand, to reduced exports and trade facilitation, to a virtual stalling of the key local tourism sector, opportunities undoubtedly abound in a number of sectors – both old and new – despite the crisis, both Cape Town and the Western Cape are open for business.
The current global drive to get people vaccinated will have a positive impact on investment, export, tourism and film. Once the majority of the population is vaccinated, it is anticipated that there will be a significant increase in the movement of people between countries for both business and leisure purpose. For this reason, it is to the benefit of all countries to see universal vaccinations in the shortest time possible.
Trade source and destination marketsThe province’s exports totalled ZAR128.70bn in 2019, modestly lower than the ZAR130bn earned in 2018. Imports in turn continued an upward trend, rising to an accumulated cost of ZAR228.04bn in 2019, from ZAR218.56bn incurred in 2018. The region’s trade balance remained firmly in deficit as a result, widening to a shortfall of ZAR99.35bn in 2019, from ZAR88.56bn recorded in 2018.
All told, when excluding petroleum activities, the value of the province’s total exports eased to ZAR110.79bn (from ZAR128.70 when including petroleum related exports), while imports eased to a cost of ZAR115.80bn (from ZAR228.04bn when including petroleum related imports) in 2019. The net effect being a notable improvement in the overall trade balance, which totaled a significantly improved shortfall of ZAR5.01bn in 2019 compared to the ZAR99.35bn (shortfall) when petroleum activities where included. Of interest is that the province’s trade balance (excl. petroleum activities) recorded a surplus in both 2017 and 2018.
From a regional trading perspective, Africa is still the lead export destination for the province’s exports, with local exports to the (African) continent worth an estimated ZAR46.75bn in 2019. This was equivalent to 36.33% of the province’s total exports in 2019. Europe placed second at a value of ZAR36.49bn (28.35% of total exports), with Asia in third position at a value of ZAR22.48bn (17.47%). Of interest is the fact that the US was the province’s fastest growing export market for the period 2016 to 2019.
Exchange rate developmentsThe local currency has come under significant pressure in 2020, with both global and domestic factors weighing heavily on the currency. From the apparent lack of movement on key growth-enhancing policy reforms, to the significant and increasing burden of the power utility, the outlook for the rand continues to deteriorate. The downward credit rating by Moody’s Investors Services further applies downward pressure, as does the country’s deteriorating fiscal position. Ongoing global trade uncertainty is a further factor, especially the China-US trade war, which along with rising risk aversion, continues to weigh heavily on emerging market currencies.
However, it is anticipated that there will be a commodity boom in 2021 as the global economy recovers and as people start to travel again once vaccinated. This in turn could boost the value of the Rand and bring much needed capital to the JSE.
Foreign Direct Investment (FDI)Between January 2018 and December 2019, 8,748 FDI projects were recorded globally. These projects represented a total capital investment of $422 billion. During the period, over 1,2m jobs were created through FDI. The USA was the dominant source market for global FDI in 2019, accounting for 20.37% of all projects, followed by Germany (9.14%) and the UK (8.02%). The USA and China were the largest source markets in terms of global capex in 2019, investing 15.77% and 9.38% of total capex.

23
From a regional perspective, 20 FDI projects were brought into the Western Cape over the period January 2019 to December 2019. These projects represented a total capital investment of USD281.7m, which is an average investment of USD14.1m per project. During this period 1 021 jobs were created. Twelve of these investment projects originated from Western Europe (60.0% projects and 38.0% capex), followed by North America (20.0% projects and 22.3% capex). A fifth of all investment projects into the Western Cape in 2019 were from the UK (20.0% projects and 7.0% of capex). The top three markets (including the UK, Ireland and the USA) collectively commanded more than 50.0% of all investment projects into the Province over the said period. Dublin and London clinched first and second place as top source cities for FDI projects into the Western Cape in 2019. Shenzhen was the dominant city in terms of capex into the Western Cape in 2019, at an investment value of USD94.0m.
In terms of outward FDI by the Western Cape, between January 2019 and December 2019, 35 outward FDI projects were recorded. These projects represented a total capital investment of USD386 million, which equates to an average investment of USD11.0 million per project. During the period, 2 323 jobs were created. As seen in previous years, Africa was the largest destination for Western Cape outward FDI (OFDI) in 2019, accounting for 13 projects (equivalent to 37.1% of all outward FDI projects and 55.3% of capex in 2019) followed by Latin America and the Caribbean in terms of projects (28.6%) and Western Europe in terms of capex (22.9%). The Province’s largest destination markets in terms of projects were Brazil and the UK, which accounted for 40% of all projects in 2019. The software and IT services continued to dominate outward FDI, accounting for 40.0% of all projects in 2019, followed by business services (31.0%) and food and beverages (18.6%).
Update on Brexit Another key consideration is that of Brexit and what this means for South Africa and for the Western Cape, given the Province’s strong historical trade ties with the UK. The UK is the second largest export destination for Western Cape goods, the number one tourism source market, and the number one source of FDI.
The UK officially left the EU on 31 January 2020, subject to a transition period until the end of December 2020. During the transition period, the UK will remain part of the EU Customs Union and Single Market. During this time, the EU and UK need to negotiate a new trade agreement between themselves. Depending on the results of the negotiations, Brexit will have various implications for South African exporters to the UK. The Western Cape economy is intricately linked to that of the UK, as the UK is the number one source of FDI and tourism and the second largest export market for Western Cape exports after Namibia. Exports are one of the areas where Brexit has already had the most tangible effects and is therefore an area that Wesgro has focussed on.
South Africa currently enjoys preferential trade with the UK under the Southern African Development Community-European Union Economic Partnership Agreement (SADC-EU EPA). When the UK leaves the European Union (EU), they will no longer be a party to the trade agreements that the EU has with third party countries like South Africa. The UK has therefore negotiated an agreement with South Africa, Botswana, Lesotho, eSwatini, Namibia and Mozambique, which largely replicates the terms of the SADC-EU EPA. These are all the countries that are party to the SADC-EU EPA, and are referred to as the Southern African Customs Union and Mozambique (SACUM) countries.
The new trade agreement is called the SACUM-UK EPA and it will take effect once the UK has left the EU. The new agreement with the UK replicates the terms of trade between the UK and South Africa currently in place under the EU-SADC EPA. Under the SACD-EU EPA, South African goods to the EU (and currently the UK) are almost entirely duty free. For certain goods there are tariff-rate-quotas, which allow for a certain volume of goods to be exported duty free (after which an import tariff is charged).

24
Trade WarsTrade wars do not produce winners. Both China and the USA are such big global markets, with a trade war between the two impacting global trade in general and having a harrowing effect on emerging markets such as South Africa. While there has been some easing in trade tensions with a phase one agreement signed, harder choices remain ahead and it is difficult to predict the outcomes. South African exports to China mostly consists of raw materials destined for further beneficiation. A slowdown in Chinese trade will mean a decrease in the demand for the materials of production and therefore a decline in demand for products from South Africa. Slower trade growth, protectionism and technology pose challenges to an export-led growth strategy. With South Africa being a very small open economy, economic events across the world will adversely affect South Africa.
At the time of writing this, China and Australia have also developed tensions about the latter’s request for an inquest into the facts around the source of COVID-19. The Chinese government has responded very aggressively with the announcement of the immediate end of certain imports from Australia. This opens the door for South African companies to benefit and establish themselves as suppliers to the growing affluent Chinese market.
Provincial Tourism PerformanceTourism has been an important growth driver of the Western Cape economy over the last 20 years. However, COVID-19 has all but destroyed the outlook for tourism in 2020 and 2021 with minimal international arrivals and a depressed domestic travel industry. As a result, the players in the industry will have to double down to make sure safe and sensible tourism is allowed and encouraged.
The data below is provided in order to show the importance of the industry based on the performance in 2019.
Of all nine provinces, the Western Cape ranked:
• TOP in Total Foreign Direct Spend: R24.2 billion• TOP in the average length of stay: 13.4 nights• 2nd Highest in total bed nights: 25.7 million• 3rd Highest in tourist arrivals: 2.0 million
Provincial Tourism Performance, 2019
Province International Tourist Arrivals (millions)
Total Foreign Direct Spend (billions)
Bed nights(millions)
Length of stay (nights)
Gauteng 3.5 R23.7 34.5 11.0Limpopo 2.3 R7.5 7.7 3.6Western Cape 2.0 R24.2 25.7 13.4Mpumalanga 1.7 R7.4 16.7 10.2Free State 1.1 R3.1 11.4 11.4KwaZulu-Natal 0.8 R6.4 7.5 9.7North West 0.6 R2.9 3.7 6.3Eastern Cape 0.4 R5.2 4.2 10.5Northern Cape 0.1 R0.8 0.8 7.0
Source: SA Tourism, 2020

25
Western Cape Tourism PerformanceThe Western Cape accounted for 19.6% of all international tourist arrivals to South Africa and received 22.9% of South Africa’s tourists spend. In addition, the Western Cape held 22.9% of South Africa’s bed nights recorded during the period.
The Western Cape held the following share of South African tourists during 2019:
• Western Cape’s share of Africa tourists visiting South Africa 3.7%• Western Cape’s share of Middle East tourists visiting South Africa 3 9.3%• Western Cape’s share of South America tourists visiting South Africa 32.8%• Western Cape’s share of North America tourists visiting South Africa 36.1%• Western Cape’s share of Asia tourists visiting South Africa 32.7%• Western Cape’s share of Australasia tourists visiting South Africa 32.8%• Western Cape’s share of European tourists visiting South Africa 40.4%
Western Cape Performance Indicators 2016 2017 2018 2019 18/19 % Change
InternationalTotal number of tourist arrivals 1,6 million 1,7 million 1.7 million 2.0 million 16.0%% Share of South Africa’s arrivals 15.6% 16.8% 16.5% 19.6% -Total foreign direct spend (excluding capital expenditure) R18.1 billion R23.1 billion R16.3 billion R18.6 billion 14.1%
% Share of South Africa’s spend 23.9% 28.6% 19.8% 22.9% -Total number of bed nights spent by tourists 16,7 million 23,3 million 23.3 million 25.7 million 10.2%% Share of South Africa’s bed nights 18.9% 19.3% 19.7% 22.9% -Length of stay 11.1 nights 14.1 nights 13.9 nights 13.4 nights 3.9%
DomesticTotal domestic trips 2,139,000 1,587,000 1,288,000 4,431,140 244%Total direct domestic spend R2.5 billion R1.6 billion R1.9 billion R7.7 billion 315%Total annual domestic bed nights 10,160,600 5,270,516 4,885,441 16,647,773 241%Length of stay 4.9 nights 3.4 nights 3.8 nights 3.8 nights -
Source: SA Tourism, 2020
Tourist Arrivals• Europe maintained its position as the Western Cape’s top region with respect to tourism volume,
accounting for nearly 50% of tourists to the region in 2019. Four out of the top ten source markets to the Western Cape originated from Europe. The United Kingdom and Germany consecutively ranked as the top European source markets across the last three years.
• The rest of Africa (22%) ranked as the second largest contributor to tourism volume in the Western Cape. Namibia led as the top source market from the African region, recording over 70,000 tourists in 2019.
• The United States led travel from North America and accounted for 84.6% of tourists from the region. The largest (65.4%) proportion of South American tourists originated from Brazil.
• In 2019, China (incl. Hong Kong) ranked as the Western Cape’s seventh largest source market and recorded the highest (47.3%) year-on-year growth in tourist arrivals. The Western Cape welcomed a share of 46.8% of South Africa’s Chinese travellers, ranking as the most popular province amongst the Chinese.

26
Source: SA Tourism, 2020
Top 10 Source MarketsAccording to South African Tourism latest annual 2019 data, all source markets to the Western Cape increased in 2019, with the exception of Germany (-0.3%), Namibia (-17.0%), and France (-2.9%).
Top 10 Source Markets to the Western Cape, 2017-2019Ranking Markets 2017 2018 2019 18/19 % Change1 United Kingdom 259 188 173,847 194,900 12.1%2 United States 192 465 122,579 134,561 9.8%3 Germany 210 699 129,630 129,248 -0.3%4 Namibia 120 477 90,070 74,734 -17.0%5 France 98 978 64,258 62,404 -2.9%6 Netherlands 86,527 50,401 51,480 2.1%
7 China (Including Hong Kong) 36 710 29,729 43,778 47.3%
8 Zimbabwe 44 945 33,705 39,166 16.2%9 Australia 54 791 34,233 36,490 6.6%10 Lesotho 23 876 28,987 32,077 10.7%
Source: SA Tourism, 2020

27
2.2 Organisational environment
2.2.1 External Environmental Analysis
COVID-19 related risksIn the preceding segment a substantial volume of information was provided on the impact of Covid-19 and the expected bounce back. This segment will therefore not focus on the pandemic per se. However, it must be noted that it will have a significant and long-lasting impact on all aspects of life as we know it.
Political risksThere has been a massive shift in public opinion on the negative impact of corruption, with increased outrage at the way the Government purse has been robbed. It is anticipated that this national discourse will help to align public sector spending into the areas where development is most required. Spending correctly will be a big boost for local businesses, increase international confidence (and investment). The Western Cape has demonstrated exemplary performance in recent municipal audits, which helps to create confidence and stimulate private sector investment. The dire unemployment position can only be turned around with significant private sector investment.
Ongoing socio-economic issues also remain of concern, including labour reform and property/land ownership issues. There is a significant need for greater transparency and policy certainty if South Africa is to successfully regain business confidence and investors’ interest.
Economic risks
Macroeconomic risksOne of the greatest challenges posed by the prevailing macroeconomic conditions has been the downturn in both consumer and investor confidence on the back of the global developments as described earlier. Wesgro has been impacted by this too, particularly in terms of investment promotion. Notwithstanding the country’s fragile economic outlook, recent political developments are positive for the country. This is largely dependent on President Cyril Ramaphosa building and maintaining investor and consumer confidence at a national level. The Western Cape will benefit from both investment and trade, as it remains a well-run province with above average economic growth and below average unemployment.
Global growth has crashed in 2020. Subdued investment in Emerging Market and Developing Economies (EMDEs) is dampening potential growth prospects. Risks to the outlook remain firmly on the downside, including the possibility of escalating trade tensions. Another concern is rising debt, which may make it difficult for EMDEs to respond to adverse developments and to finance growth-enhancing investments. Reforms to boost private investment and productivity growth are needed, particularly in low-income countries which face more significant challenges today than they did in the early 2000s.
Risks in international tradeThe World Trade Organisation (WTO) continues to be inundated with international transaction disputes and many countries are raising the red flag on questionable barriers to trade imposed by partner countries. Unresolved trade disputes can adversely affect international trade as traditional partners seek markets for products elsewhere.
Notwithstanding the success achieved under various trade pacts and agreements, non-tariff and tariff barriers to
28
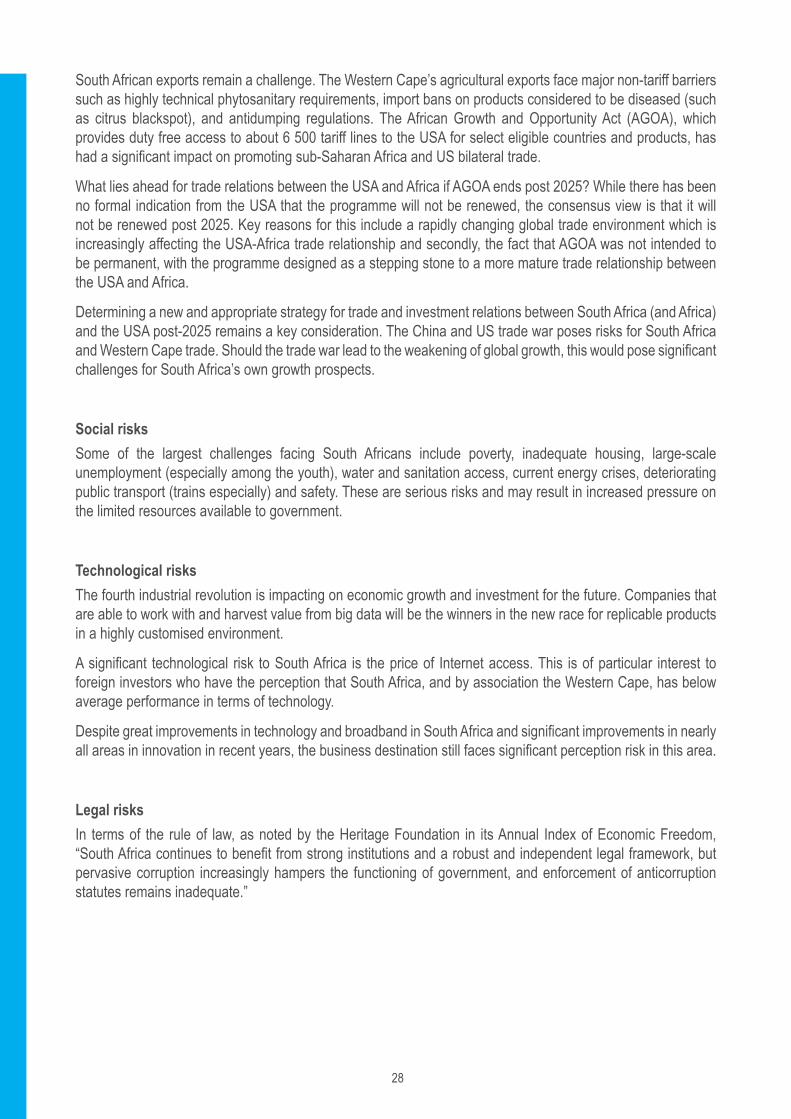
South African exports remain a challenge. The Western Cape’s agricultural exports face major non-tariff barriers such as highly technical phytosanitary requirements, import bans on products considered to be diseased (such as citrus blackspot), and antidumping regulations. The African Growth and Opportunity Act (AGOA), which provides duty free access to about 6 500 tariff lines to the USA for select eligible countries and products, has had a significant impact on promoting sub-Saharan Africa and US bilateral trade.
What lies ahead for trade relations between the USA and Africa if AGOA ends post 2025? While there has been no formal indication from the USA that the programme will not be renewed, the consensus view is that it will not be renewed post 2025. Key reasons for this include a rapidly changing global trade environment which is increasingly affecting the USA-Africa trade relationship and secondly, the fact that AGOA was not intended to be permanent, with the programme designed as a stepping stone to a more mature trade relationship between the USA and Africa.
Determining a new and appropriate strategy for trade and investment relations between South Africa (and Africa) and the USA post-2025 remains a key consideration. The China and US trade war poses risks for South Africa and Western Cape trade. Should the trade war lead to the weakening of global growth, this would pose significant challenges for South Africa’s own growth prospects.
Social risksSome of the largest challenges facing South Africans include poverty, inadequate housing, large-scale unemployment (especially among the youth), water and sanitation access, current energy crises, deteriorating public transport (trains especially) and safety. These are serious risks and may result in increased pressure on the limited resources available to government.
Technological risksThe fourth industrial revolution is impacting on economic growth and investment for the future. Companies that are able to work with and harvest value from big data will be the winners in the new race for replicable products in a highly customised environment.
A significant technological risk to South Africa is the price of Internet access. This is of particular interest to foreign investors who have the perception that South Africa, and by association the Western Cape, has below average performance in terms of technology.
Despite great improvements in technology and broadband in South Africa and significant improvements in nearly all areas in innovation in recent years, the business destination still faces significant perception risk in this area.
Legal risksIn terms of the rule of law, as noted by the Heritage Foundation in its Annual Index of Economic Freedom, “South Africa continues to benefit from strong institutions and a robust and independent legal framework, but pervasive corruption increasingly hampers the functioning of government, and enforcement of anticorruption statutes remains inadequate.”

29
Environmental risksThe greatest environmental risk at present is the scarcity of water, which is greatly affecting farmers across South Africa and the Western Cape in particular. The last rainy season was a good one and has brought much relief to the Province. Cape Town dams have reached a significant milestone in their battle against the drought, as recent downpours in the area carried the figures above the 80% mark. This is the first time in over two years that all dams servicing the drought-stricken Mother City have reached this combined landmark.
2.2.2 Internal Environmental Analysis
SWOT AnalysisAn analysis of Wesgro’s key strengths, weaknesses, opportunities and threats was conducted to assist the Agency in developing its priorities for the five-year period from 2020/21 to 2024/25.
Strengths Weaknesses• Over 35 years’ proven track record and an established global
brand in economic diplomacy• Sector and market specialists in the investment, trade, film,
leisure and business tourism teams• Established and strong investment pipeline• Strong capability in creating market access through effective
trade missions• Excellent track record in promoting outward investment into
the rest of Africa• Responsive research and thought leadership capability• Strong relationships with Local, Provincial, National and
Global Partners• Highly responsive to stakeholder needs• Primary bridge between business and government within the
context of our mandate• Collaborative approach to realising opportunity and reputation
management• Solid governance and financial controls
• Co-ordination with the Department of Trade Industry and Competition
• The Agency needs to be co-funded optimally by the Provincial Government of the Western Cape and the City of Cape Town in order to deliver on its legislative mandate
• Onerous compliance requirements and reporting• Low salaries in relation to other Agencies and the private
sector
Opportunities Threats• Establish a better destination and economic brand hierarchy
for global marketing efforts• Shifting global economic trends presenting new opportunities
for innovation, investment, trade, tourism and film• Sectors geared for growth in the future are strongest in the
Western Cape• Inter- and intra-Agency collaboration to drive the nation’s
growth agenda• Enhancement of thought leadership capability• Strengthening relationships with stakeholders and the private
sector• Increase revenue generation sources
• The COVID-19 pandemic impacting on all activities of the Agency
• Lack of collaboration between role-players and duplication in effort
• Negative perceptions of SA that affect confidence in the destination
• The impact of climate change on the economy• Increasing pressure on economic infrastructure• Exchange rate fluctuations• Safety and security issues (perceived and real)• High level of youth unemployment• Skills development not in line with changing industry needs

30
Strategic focus for the 2020/21 to 2024/25 financial years on the following value propositions:• Economic diplomacy role-player, as part of a “whole of province” approach to driving investment, export,
tourism and film.• Integrated economic diplomacy value chain (image building and province branding, advocacy,
facilitation, lead generation and matchmaking, information, access to international networks, aftercare, and capacity building and skills training of partners and suppliers) approach to investment, export, tourism and film promotion.
• Demand-led approach to sectors and markets, underpinned by innovation and technology.• Enhance the Cape Town and Western Cape brand in association with Wesgro’s global footprint and
brand equity of 35 years.• Provide thought leadership on issues that may affect investment, export, tourism and film.• Provide insights and analytics on issues that affect businesses, through communication of research.
Wesgro’s response delivery to COVID-19:
• Containment: Wesgro’s mandate is to connect our clients to opportunity and we have continued to do this in virtual spaces, as we ease out of lockdown, we will do so in a responsible manner.
• Adaptation: We are working to help our clients adapt to and cope with the crises. We have also repurposed our activities to operate in our current environment. Our clients are now more prepared to work virtually, which has allowed for a dramatic increase in our reach.
• Recovery: We will work relentlessly to position Cape Town and the Western Cape at the top of the consideration list during our current economic constraints.
Our first strategic imperative is to rebuild internally, by focussing on local businesses and tourism.
• Investment – 80% of effort to supporting local businesses in Cape Town and the Western Cape and developing a business support pipeline that focuses on local business expansion in the first instance.
• Exports – virtual, hybrid and physical inward and outward missions with the key focus on export rand value and providing assistance to exporters.
• Tourism – destination reputation management and stabilising the tourism value chain, by rebuilding domestic tourism first followed by regional and then international. We are fortunate that our offering in the Cape is well positioned through our wide-open spaces and we will focus on building experiences best suited to the traveller.
Our second strategic imperative is Cape Town Air Access, which includes:
• route development;• leveraging the impact of air access across investment, export and tourism;• a hard lobby stance for improved airlift; and• aligning effort and crowding-in funding.

31
Based on the aggressive approach needed for economic recovery and growth, we will:
• Maintain and grow the high levels of participation achieved on the global virtual platforms across investment, export, tourism and film.
• Significantly upscale digital international tourism marketing campaigns focused in key source markets to ensure competitive advantage.
• Enhance our international presence through investment and export and promote business expansion into the Western Cape from Gauteng and KZN.
• Build and maintain our Export Portal and retain the virtual outward and inward missions for increased audience participation.
• Upscale locations marketing for film, with increased cross-sell leverage from the tourism sector.
Our value-add is realised through the following strengths:
• Putting our clients first to effect business adaptation and resilience.• Managing stakeholder relationships to the benefit of Cape Town and the Western Cape.• Establishing and maintaining partnerships for the benefit of all.• Firming up internal and external cross-sell effort that achieves maximum impact.• Harnessing technology and digital capabilities that drive the new economy.
The Wesgro BoardWesgro is a Schedule 3C public entity as stipulated in the PFMA and is managed by a Board of Directors appointed by the Executive Authority. The table below provides a list of the Board members:
Wesgro Board Members
Name Title
Mr. Michael Spicer Chairperson
Mr. Ian Bartes Director/Chairperson of the Audit, IT and Risk Committee
Ms. Andrea Böhmert Director
Mr. David Green Director
Mr. Paul Bannister Director
Mr John Copelyn Director
Mr. John van Rooyen Director
Ms Mpumi Dwebe-Kwetana Director
Ald. Marius Koen Director
Ald. (Dr.) Helena von Schlicht Director
Mr. Solly Fourie Ex-Officio Member of the Board representing the Provincial Government of the Western Cape
Mr. Lance GreylingEx-Officio Member of the Board representing the City of Cape Town/Chairperson of the Human Resource and Remuneration Committee
Mr. Tim Harris Chief Executive Officer

32
Wesgro’s Organogram
The current organisational structure is adequate to deliver on the current mandate. Any new additional priorities would require temporary technical resources, where applicable.
HR ManagerCeleste Dickinson
(Acting)
Chief Financial OfficerKholeka Zama
Snr IT SupportSinazo Gacula
IT Support Officer Zahir Domingo
ICT Manager Shaheed Abrahams
CURRENT VACANT ACTING CRITICAL
Senior HR OfficerNombongo Manana
Ashleigh OctiberOffice & Travel Co-
ordinator
HR AdministratorRirhandzu Simelane
Ibtishaam DamonReceptionist
Support Logistics Administrator/Driver
Ghalied Christian
Office AssistantAbigail Jordaan
Office AssistantPortia Solontsi
LEGEND
AccountantSaadiqa Dangor
Creditors ClerkAbongile Mbawu
BookkeeperMornay Gallant
Supply Chain ManagerGysbert Verwey
Compliance OfficerBongiwe Ndyumbu
Supply Chain Practitioner
Sonwabile Gudla
Supply Chain Management Officer
Nogqili Nondumo
Financial Controller Anthony Bere
CIC AssistantEunice Masamba
Manager: District UnitAnton Van Teylingen
Project Manager:Film & Media
Lisa Mini
Administrator:Film & Media
Nadia Jagwanth
Office AssistantMeagan Meyer
Intern-CICYaseen Johaar
Head: Cape Investor Centre Salman Kajie
Senior Manager: District Unit
Towfiq Hendricks
Head: FilmMonica Rorvik
Chief Business OfficerYaw Peprah

33
Wesgro’s Organogram
The current organisational structure is adequate to deliver on the current mandate. Any new additional priorities would require temporary technical resources, where applicable.
AdministratorWilanda Swartz
Chief Marketing OfficerMonika Iuel
Chief Strategy OfficerLabeeqah Schuurman
(Acting)
Strategy, Monitoring and Evaluation
Manager(Vacant)
Strategy & Governance Coordinator
GIselle Naidoo
Organogram8 March 2021
Content ManagerRobert Peters
Campaign MangerSarah Brownlee
Events & Stakeholder Relations Manager
Carmen Taylor
Strategic Research & Public Affairs Officer
Karen Bosman
Snr Graphic DesignerGrant Carelse
Jnr Graphic DesignerAneez Abrahams
PR & Social MediaNokubongwa Gwala
Event Co ordinatorRayhaanah Begg
Junior Digital Content Editor
Raphaella Joannou
Marketing Specialist: Strategic Projects
(Vacant)
Senior EconomistEmmanuel Baidoo
Research Analyst Tourism
Gadijah Darries
Research Analyst Tourism
Laticia Phillips
Research Analyst Tourism
Nwabisa Thiso
EconomistJanine Botha
Research AnalystLona Tshongweni
Research AnalystMorne Hoffman
Data AdministratorSimphiwe Twala
Research InternAndiphe Ndlebe
Head: ResearchJanine Botha (Acting)
Project Manager: Air AccessDavid King
InternJoeferry Tugwete
Special Project InternZizipho Dyakopu
Cape Health Tech Ecosystem ManagerMandi Swanepoel
Project Manager: Revenue Generation
(Vacant)
BD: Cruise Cape Town(Vacant)
Projects Admin Assistant(Vacant)
Aviation LiaisonPaul van der Brink
Project Coordinator: Air Access
Fiona Luanda
Air Cargo Logistics Specialist(Vacant)
Market Researcher: Air Access
Danyaal Samuels
Convention Service Administrator
Lerisha Mudaliar
Convention Service Administrator
Lauren Neumann
Marketing & Trade Admin
(Vacant)
Niche Marketing & Trade Media Co-
ordinatorLana Curran
Events Tourism Co-ordinator(Vacant)
Comms & Special Projects Co-ordinator
(Vacant)
Research CoordinatorChevonne Reid
Association Sales Executive(Vacant)
Exhibition Sales Executive(Vacant)
Social Media Co-ordinator
(Vacant)General Manager: Knysna
Colleen Durant
Catering Co ordinatorDorah Manewil
Social Media Co-ordinatorNadine Kidd
Website & Market-ing Ass
Keagon Borchards
Tourism Information Officer
Thozeka Sikali
Finance Office Administrator
Hanlie De Villiers
Bus Dev Manager (Association Sales)
Adriaan Fourie
Bus Dev Manager (I&E))
(Vacant)
Event Management & Sponsorship Manager
(Vacant)
Experience & Product SpecialistZintle Mtsi
Head: InvestmentJames Milne
Head: Trade PromotionErica Joubert (Acting)
Head: AgribusinessAmanda Tshaya
Personal Assistant:Investment Promotion
Francis Greenwood
Executive Personal Assistant acting as PA
to Head: ExportKamiela Domingo
Senior Trade Manager: Middle East
Thirumerni Naidoo
Export Manager: Americas
Ruby Swigelaar
International Trade Manager: Europe
Erica Joubert
International Trade Manager: Asia
Benjamin Jourdan
Advancement & Promotion Manager Nadine Smith-Clarke
Assistant Trade Manager
Lubabalo Dyantyi
Assistant Trade Manager
Joshua Palm
Export Manager: Africa & East EuropeTatiana Dos Santos
Export Advancement Programme Coordinator
Nomandla Mene
Head: AfricaMichael Tiam Gamwo
Portfolio Manager: Agribusiness
(Vacant)
Head: FilmMonica Rorvik
Snr Portfolio ManagerDinesh Harry
Greenfield Portfolio Manager:
Manufacturing(Vacant)
Greenfield Portfolio Manager: Tech
(Vacant)
Greenfield Portfolio:Hotel & Real Estate &
InfrastructureRehana Boolay
Brownfield Portfolio Manager: Real
Estate & Infrastructure Zaheer Hendricks
Brownfield Portfolio Manager: TechSebekedi Koloi
Brownfield Portfolio Manager: Real
Estate & Infrastructure Nonela Mtwana
Brownfield Portfolio Manager: Green
Economy Belvana Abeli
Head: Convention Bureau
Corne Koch
Head: Lesiure TourismInge Dykman
Head: Marketing & Brand
Jean Scheltema
Personal Assistant: CMO
Marshia Meniers
Administrator: Agribusiness
Germaine Habiyaremye
Chief Executive OfficerTim Harris
Strategic ProjectsJacyntha Twynam
Manager: Strategic Projects
Kendra Stoffberg

34
2.3 Wesgro’s Strategic Outcomes
Strategic Outcomes
Strategic Outcome To grow the Western Cape Economy through investment, trade, tourism and film promotion.
Outcome Statements
It is envisaged that the Agency will achieve the following deliverables for the period 2020/21 to 2024/25:• To recruit and facilitate between R10,11bn and R14,71bn committed investments into the Province, resulting
in between 3 705 and 7 691 jobs.• To recruit and facilitate between R16,70bn and R25,04bn trade agreements, resulting in between 2 840 and
3 716 jobs, and R1,36bn and R3,09bn Outward Foreign Direct Investment (OFDI).• To market Cape Town and the Western Cape and support tourism destination marketing initiatives with an
estimated economic value of R2,65bn and R4,24bn.• To recruit and facilitate between R10,13bn and R17,82bn film and media productions brought into the
Province, resulting in between 15 246 FTE jobs and 18 472 FTE jobs.• To build a strong regional economic brand with an estimated rand value of R398,1m AVE.
Over the next five-years, the Agency will generate between R39,61bn and R61,82bn, resulting in the facilitation of between 21 791 and 29 879 jobs, as follows:
Programme Estimated economic impact (R) JobsLower band Upper band Lower band Upper band
Investment promotion 10 116 558 285 14 710 022 588 3 705 7 691
Export promotion (including OFDI) 16 707 850 394 25 040 781 957 2 840 3 716
Destination Marketing 2 654 567 905 4 247 308 648
Film and media promotion 10 131 489 646 17 823 207 056 15 246 18 472
Total 39 610 466 231 61 821 320 250 21 791 29 879*The 5-Year Achievement targets are cumulative and take into consideration the current context of the South African economy and the international trade climate.
Baseline
During the 2019/20 financial year, the Agency achieved a total of 113 investment declarations, film and media declarations, business agreements and tourism initiatives, with an estimated economic impact of over R9bn and over 5 000 jobs created. A total of 18 investment projects with an investment value of R2,24bn was committed, resulting in the creation of 1 485 jobs. In addition, six investment projects were committed in the agri-business sector, with an investment value of R557m, resulting in 635 jobs. A total of 37 export promotion business agreements were signed, with an estimated economic impact of R3,08bn, resulting in 973 jobs. Also, seven OFDI projects were committed to the value of R428,75m. A total of 46 tourism destination marketing initiatives were supported, with an estimated economic impact of R935,63m and R138,54m of AVE was generated for corporate communication and tourism.
Links Wesgro plays a pivotal role in investment and trade promotion, and marketing Cape Town and the Western Cape as a tourism and film destination.

35
2.4 Overview of 2021/22 budget and MTEF estimates Budget overview
High Level Budget
DescriptionBudget Adjustment
Budget 2020/21Outer MTEF Years
2020/21 2021/22 2022/23 2023/24 2024/25
R’000 R’000 R’000 R’000 R’000 R’000
STAFF REMUNERATION 56 448 56 448 54 266 59 241 60 227 63 539
DEPARTMENTAL EXPENSES (A+B) 99 196 96 199 78 489 70 471 75 843 74 787
Overheads (A) 29 234 27 237 19 451 15 557 16 251 16 079
Programmes (B) 69 962 68 962 59 038 54 914 59 592 58 708
Capital Expenditure 2028 0 2 028 2139 2257 0
TOTAL EXPENSES 157 672 152 647 134 783 131 851 138 327 138 326
Staff Complement 106 106 122 122 122 122
High level budget: Trade and Investment PromotionHigh Level Budget
DescriptionBudget Adjustment
Budget 2020/21Outer MTEF Years
2020/21 2021/22 2022/23 2023/24 2024/25
R’000 R’000 R’000 R’000 R’000 R’000
STAFF REMUNERATION 31 007 31 007 30 678 33 284 34 004 35 874
DEPARTMENTAL EXPENSES (A+B) 28 754 25 757 33 889 31 927 33 965 34 352
Overheads (A) 12 702 10 705 10 069 10 559 12 103 12 103
Programmes (B) 16 052 15 052 23 820 21 368 21 862 22 249
Capital Expenditure 2 028 0 2 028 2139 2257
TOTAL EXPENSES 61 789 56 764 66 595 67 350 70 226 70 226
Staff Complement 92 92 103 103 103 103
High Level Budget for Tourism Destination MarketingHigh Level Budget
DescriptionBudget Adjustment
Budget 2020/21Outer MTEF Years
2020/21 2021/22 2022/23 2023/24 2024/25
R’000 R’000 R’000 R’000 R’000 R’000
STAFF REMUNERATION 20 621 20 621 20 784 22 999 23 102 24 373
DEPARTMENTAL EXPENSES (A+B) 31 477 31 477 37 614 35 396 39 898 38 627
Overheads (A) 1 042 1 042 2 396 1 850 2 168 2 168
Programmes (B) 30 435 30 435 35 218 33 546 37 730 36 459
Capital Expenditure 0 0
TOTAL EXPENSES 52 098 52 098 58 398 58 395 63 000 63 000
Staff Complement 14 14 19 19 19 19

36
High Level Budget for Other ProjectsHigh Level Budget
DescriptionBudget Adjustment
Budget 2020/21Outer MTEF Years
2020/21 2021/22 2022/23 2023/24 2024/25
R’000 R’000 R’000 R’000 R’000 R’000
STAFF REMUNERATION 4 820 4 820 2 804 2 958 3 121 3 293DEPARTMENTAL EXPENSES (A+B) 22 470 22 470 6 986 3 148 1 980 1 808
Trade and Investment 15 490 15 490 6 986 3 148 1 980 1 808DMO 6 980 6 980 0 0 0
Capital Expenditure 0 0 0 0 0TOTAL EXPENSES 27 290 27 290 9 790 6 106 5 101 5 101Staff Complement 14 10 10 14 14 14
Summary of payments and estimates
Summary of payments and estimates: Western Cape Tourism, Trade and Investment Promotion Agency
Programme R’000
Outcome Estimated outcome
Medium-term estimate
Audited Audited Audited
2017/18 2018/19 2019/20 2020/21 2021/22 2022/23 2023/24
1, Administration 4 231 3 990 4 379 4 139 2 892 2 863 2 988
2, Corporate Services 10 859 11 826 13 402 19 110 18 048 18 679 20 223
3, Investment 5 439 5 601 6 115 10 110 19 405 17 266 18 593
4, Trade 8 749 8 027 8 810 21 614 21 455 23 101 21 403
5, Wesgro Research 3 257 3 394 4 055 4 725 4 002 3 786 3 916
6, Marketing and Communication 5 354 5 823 6 036 9 124 10 583 7 761 8 204
7. DMO: Integrated Marketing 17 781 17 781 19 026 62 312 58 398 58 395 63 000
Total payments and estimates 55 670 56 442 61 823 131 134 134 783 131 851 138 327
Summary of provincial payments and estimates by economic classification
Economic classification R’000
Outcome Estimated outcome
Medium-term estimate
Audited Audited Audited
2017/18 2018/19 2019/20 2020/21 2021/22 2022/23 2023/24
ExpensesCurrent expense 55 670 56 442 61 823 131 134 134 783 130 602 137 078
Compensation of employees 33 640 34 914 38 002 52 282 54 266 59 241 60 227 Salary & Wages 31 896 33 153 33 792 45 869 45 177 51 179 52 284
Basic salary 30 301 31 338 32 054 43 954 45 177 51 179 52 284 Performance rewards 1 595 1 815 1 738 1 915 Other non-pensionable allowances Social Contributions (employer
contributions only) 1 744 1 761 4 210 6 413 9 089 8 062 7 943
Pension 1 283 1 265 3 564 5 492 7 906 6 738 6 619 Medical 340 374 515 761 1 017 1 164 1 164 UIF 121 122 131 160 166 160 160

37
Salary related expenses Use of goods and services 21 724 20 137 22 818 76 824 79 022 70 112 75 602
Advertising 2 171 1 764 2 062 18 458 21 907 18 343 19 231 Advertising of posts 180 59 171 292 71 171 171 Gifts and Promotional items 200 200 200 150 50 47 47 Advertising (marketing) 1 791 1 505 1 691 18 016 21 786 18 125 19 013
Audit Fees 1 590 1 947 2 069 1 788 3 472 2 566 2 566 Internal 561 1 024 1 034 278 967 765 765 External 1 029 923 1 035 1 510 2 505 1 801 1 801
Bank charges 79 85 134 161 147 161 161 Board Costs 410 443 440 562 546 369 366
Board - Remuneration 410 443 440 562 546 369 366 Board - Subsistence
Bursaries (employees) Catering services 125 87 263 310 68 50 50 Communication 643 728 1 165 1 112 609 961 1 027
Telephone 634 720 1 157 979 495 520 586 Cellphones 8 7 7 132 114 440 440 Postage & Courier 1 1 1 1 1 1 Other
Computer services 766 742 463 614 274 244 244 SITA services External service providers 766 742 463 614 274 244 244
Consultants, contractors and special services 4 934 3 969 4 146 34 328 32 252 31 813 34 353 Consultants 2 130 1 972 2 113 12 198 11 240 11 197 10 547 Contractors and special services 2 804 1 997 2 033 22 130 21 012 20 616 23 806
General Expenses 1 568 1 218 562 839 383 555 825 Conference Expenditure 512 400 612 8 561 10 693 9 061 10 658 Photographic services 44 60 44 15 153 50 50 Venues and facilities 680 319 815 6 004 5 971 6 572 6 880 Agency Administrative and Support Staff 6 711 3 812 4 378 5 393 Other special services Entertainment Equipment less than Capitalisation
threshold 6 6 10 10 10 25 23
Inventory 2 022 2 144 2 484 3 960 4 475 3 065 3 590 Consumables Fuel, oil and gas 48 56 53 107 98 90 90
Stationery and printing 90 154 121 204 63 60 125 Subscriptions 1 884 1 934 2 310 3 649 4 314 2 915 3 375 Other Legal fees 196 127 98 104 54 54 54 Losses / (Profits) 2 1 2 2 2 2 2 Losses due to Fraud
On Sale of Assets 1 Forex 1 1 2 2 2 2 2
Other Maintenance and repairs 542 66 78 229 240 235 235 Buildings 515 44 56 104 116 110 110 Equipment 27 22 22 125 124 125 125
Operating leases 3 804 3 361 4 386 6 039 7 269 5 687 7 800 Rent-buildings 3 207 2 758 3 899 5 554 7 011 5 021 7 134 Rent-equipment 597 603 487 485 258 666 666 Other Printing and publication 200 190 184 287 587 210 210

38
Professional bodies and membership fees Travel and Subsistence 3 815 4 043 4 356 8 128 6 665 6 077 5 112 Air Travel - Air Tickets ( Domestic) 215 337 296 540 607 535 435 Air Travel - Air Tickets ( International) 2 115 2 585 2 386 4 059 3 410 3 660 2 948
Accommodation - Domestic 551 486 607 106 103 436 383 Accommodation - International 792 531 922 2 666 2 153 1 076 976 Other 142 104 145 757 392 370 370
Training and staff development 419 434 478 732 356 250 578 Depreciation and amortisation 306 1 391 1 003 2 028 1 794 1 249 1 249 Land Leasehold Improvements 490 400 823 723 420 420 Computer equipment 75 152 176 600 466 344 344
Furniture and Office equipment 90 310 157 305 305 185 185 Other Machinery and equipment 55 124 75 96 96 96 96 Transport Assets 23 157 79 79 79 79 79 Computer Software 63 158 116 125 125 125 125
Total expenses 55 670 56 442 61 823 131 134 134 783 131 851 138 327
2.5 Relating expenditure trends to strategic goalsWith the ever decreasing fiscus, Management has embarked on a process of robust consultation with the Shareholders to ensure baseline funding to that it is able to deliver on its mandate and embark on new initiatives to bring about impactful change. The Agency has been successful in its endeavours to secure additional funding and is committed to implementing its COVID responsive strategy to create an enabling environment for economic growth and job facilitation.

39
Airport Engineering Warehouse
Part C: Measuring our perform
ance

40
De Grendel wine farm

41
3. Part C: Measuring our performance
3.1 Programme 1: Corporate Services
PurposeThe purpose of the Programme is to provide efficient, cost effective, transparent and responsive corporate services to the Agency and ensure that principles of good corporate governance are implemented.
3.1.1 Programme structure
Sub-programme 1.1: Financial managementEffective financial management is aimed at ensuring the upholding of the legislative requirements of the Agency. It also ensures that the necessary resources to efficiently run core operations are provided.
Sub-programme 1.2: IT and administrative servicesAs a provincial public entity, the Agency has to comply with the Public Finance Management Act 1 of 1999 and the Public Service Act. The IT sub-programme focusses on maintaining sound IT and administrative systems and infrastructure. Effective systems and processes are a necessary component to maintain credibility, ensure accountability, improve operating efficiencies and generate institutional memory.
Sub-programme 1.3: Human Resource ManagementThe Human Resources sub-programme ensures that the Agency becomes the employer of choice and maintains an excellent, talented and skilled workforce. A priority is to attract, recruit and retain staff by creating a culture and climate conducive to sustaining a motivated workforce. The sub-programme also ensures that all legislative compliance with regard to human resource management is adhered to.
Sub-programme 1.4: Governance and Compliance The Governance and Compliance sub-programme is responsible for the implementation of an integrated approach, which takes into account results-based implementation and direct alignment to Wesgro strategic direction, monitoring and evaluation, corporate governance, board compliance and the requisite support to the CEO.
Situational analysisAs a legislatively enacted Agency, Wesgro is bound to adhere to the principles derived from Chapters 10 and 13 of the Constitution of the Republic of South Africa, 1996. Wesgro is bound to follow the principles of these Acts in ensuring that modernisation of systems of management within the public sector is achieved, and that transparency and accountability are maintained and visible. The Agency is compelled to ensure that the principles of high standards of ethics is promoted and maintained, resources are efficiently utilised, and transparency and accountability are present within the Agency at all times.

42
3.1.2 Strategic outcome
Strategic outcome
Strategic outcome Enhance good governance practices through compliance with prescribed financial and non-financial regulations and guidelines.
Outcome statement An unqualified Audit report with no material findings. Baseline The Agency achieved a clean audit for the 2019/20 financial year.
JustificationThe concept of value for money is an integral part of the strategic and operational activities. Corporate Services identifies and implements interventions to achieve value for money that will improve service delivery, eliminate wasteful allocation of resources, enhance public confidence and ensure compliance.
LinksThis objective is linked to the Public Finance Management Act (PFMA), National Treasury Regulations, Provincial Treasury Instructions, King IV in terms of good governance and integrated service delivery through partnerships and spatial alignment.

43
3.1.3
Ou
tcom
es, o
utpu
ts, p
erfo
rman
ce in
dica
tors
and
targ
ets 2
021/2
2
No.
Outc
ome
Outp
uts
Outp
ut In
dica
tors
Annu
al Ta
rget
s
Audi
ted
/Act
ual P
erfo
rman
ceEs
timat
ed
Perfo
rman
ce20
20/21
MTEF
Per
iod
2017
/1820
18/19
2019
/2020
21/22
2022
/2320
23/24
1.1Un
quali
fied A
udit
repo
rt wi
th no
ma
terial
findin
gs
Finan
cial, S
CM,
IT, H
R an
d M&E
ou
tputs
Posit
ive fin
ancia
l viab
ility r
ating
--
-4
45
5
Perce
ntage
achie
veme
nt of
annu
al bu
dgete
d op
erati
onal
expe
nditu
re-
--
98%
98%
98%
98%
Achie
ve m
axim
um
Broa
d-Ba
sed B
lack E
cono
mic E
mpow
erme
nt (B
-BBE
E) sp
end
--
-70
%70
%75
%75
%
Perce
ntage
B-B
BEE
spen
d on b
lack o
wned
su
pplie
rs60
%60
%65
%65
%
Perce
ntage
paym
ent d
eviat
ion fr
om aw
arde
d co
ntrac
ts-
--
10%
10%
10%
10%
Subm
ission
of th
e ann
ual P
rocu
reme
nt Pl
an1
11
1
Numb
er of
repo
rts ev
idenc
ing th
e ma
inten
ance
of th
e Age
ncy’s
ICT
envir
onme
nt-
--
44
44
Perce
ntage
of em
ploye
e sati
sfacti
on-
-80
%80
%80
%90
%90
%
Perce
ntage
of an
nual
total
salar
y cos
t sp
ent o
n tra
ining
of st
aff an
d inte
rnsh
ip op
portu
nities
--
-1%
1%2%
2%
Perce
ntage
of pe
ople
from
the em
ploym
ent
equit
y tar
get g
roup
s emp
loyed
in co
mplia
nce
with
the en
tity’s
appr
oved
EE
plan
--
-79
%79
%80
%80
%
Numb
er of
M an
d E pe
rform
ance
repo
rts
subm
itted
55
58
88
8

44
Indi
cato
rs, A
nnua
l and
Qua
rterly
Targ
ets 2
021/2
2 (Ou
tput
indi
cato
rs)
No.
Outp
ut In
dica
tors
Annu
al Ta
rget
Q1Q2
Q3Q4
1.1Po
sitive
finan
cial v
iabilit
y rati
ng4
--
-4
1.2Pe
rcenta
ge ac
hieve
ment
of an
nual
budg
eted o
pera
tiona
l exp
endit
ure
98%
--
-98
%
1.3Ac
hieve
max
imum
B-B
BEE
spen
d 70
%-
--
70%
1.4Pe
rcenta
ge B
-BBE
E sp
end o
n blac
k own
ed su
pplie
rs60
%-
--
60%
1.5Pe
rcenta
ge pa
ymen
t dev
iation
from
awar
ded c
ontra
cts10
%-
--
10%
1.6Su
bmiss
ion of
the a
nnua
l Pro
cure
ment
Plan
11
--
-
1.7Nu
mber
of re
ports
evide
ncing
the m
ainten
ance
of th
e Age
ncy’s
ICT
envir
onme
nt4
11
11
1.8Pe
rcenta
ge of
emplo
yee s
atisfa
ction
80%
--
-80
%
1.9Pe
rcenta
ge of
annu
al tot
al sa
lary c
ost s
pent
on tr
aining
of st
aff an
d inte
rnsh
ip op
portu
nities
1%-
--
1%
1.10
Perce
ntage
of pe
ople
from
the em
ploym
ent e
quity
targ
et gr
oups
emplo
yed i
n com
plian
ce w
ith th
e en
tity’s
appr
oved
EE
plan
79%
--
-79
%
1.11
Numb
er of
M an
d E pe
rform
ance
repo
rts su
bmitte
d8
13
22

45
3.1.4 Explanation of planned performance over the medium-term period
The Unit undertakes a range of outputs to ensure that good governance practices are implemented and that it is able to meet the required legislative deadlines. Management ensures that the required internal controls and mitigations are in place to ensure that it meets its fiduciary obligations and achieves a clean external audit opinion.
3.1.5 Reconciling performance targets with the budget and MTEF
Summary of payments and estimates: Programme 2: Corporate Services
Programme R’000
Outcome Estimated outcome
Medium-term estimate
Audited Audited Audited
2017/18 2018/19 2019/20 2020/21 2021/22 2022/23 2023/24
1, Corporate Services 10 859 11 826 13 402 19 110 18 048 18 679 20 223
Total payments and estimates 10 859 11 826 13 402 19 110 18 048 18 679 20 223
Summary of provincial payments and estimates by economic classification: Programme 2: Corporate Services
Economic classification R’000
Outcome Estimated outcome
Medium-term estimate
Audited Audited Audited
2017/18 2018/19 2019/20 2020/21 2021/22 2022/23 2023/24
ExpensesCurrent expense 10 859 11 826 13 402 19 110 18 048 17 430 18 974
Compensation of employees 2 805 3 436 4 094 6 202 5 700 6 622 5 622 Salary & Wages 2 693 3 277 3 592 5 383 4 699 5 775 4 775
Basic salary 2 560 3 068 3 434 5 149 4 699 5 775 4 775 Performance rewards 133 209 158 234 Other non-pensionable allowances
Social Contributions (employer contributions only) 112 159 502 819 1 001 847 847
Pension 70 90 420 711 868 739 739 Medical 30 56 66 85 110 85 85 UIF 12 13 16 23 23 23 23 Salary related expenses
Use of goods and services 7 748 7 411 8 305 10 880 10 554 9 559 12 103 Advertising 55 59 71 171 71 171 171
Advertising of posts 55 59 71 171 71 171 171 Gifts and Promotional items
Advertising (marketing)Audit Fees 1 466 1 427 1 035 1 788 2 422 2 566 2 566
Internal 561 624 338 278 565 765 765 External 905 803 697 1 510 1 857 1 801 1 801
Bank charges 28 85 134 161 147 161 161 Board Costs
Board - Remuneration
Board - Subsistence
Bursaries (employees)

46
Catering services 25 30 188 240 68 50 50 Communication 326 728 678 1 112 609 961 1 027
Telephone 318 720 670 979 495 520 586 Cellphones 7 7 7 132 114 440 440 Postage & Courier 1 1 1 1 1 1 Other
Computer services 382 742 463 614 274 244 244 SITA servicesExternal service providers 382 742 463 614 274 244 244
Consultants, contractors and special services 2 337 1 835 2 348 1 122 628 738 1 108
Consultants 1 386 917 1 786 283 245 183 283 Contractors and special services 951 918 562 839 383 555 825
General Expenses 951 918 562 839 383 555 825 Conference Expenditure
Photographic services
Venues and facilities
Agency Administrative and Support Staff
Other special services
EntertainmentEquipment less than Capitalisation
threshold 6 6 10 10 10 25 23
Inventory 93 336 252 398 214 237 302 ConsumablesFuel, oil and gas 24 56 53 107 98 90 90
Stationery and printing 50 154 121 204 63 60 125 Subscriptions 19 126 78 87 53 87 87 OtherLegal fees 98 127 98 104 54 54 54 Losses / (Profits) 1 1 2 2 2 2 2 Losses due to Fraud
On Sale of Assets Forex 1 1 2 2 2 2 2
OtherMaintenance and repairs 428 66 78 229 240 235 235 Buildings 414 44 56 104 116 110 110

47
Equipment 14 22 22 125 124 125 125 Operating leases 2 187 1 553 2 508 4 193 5 713 3 837 5 632 Rent-buildings 1 590 950 2 021 3 708 5 455 3 171 4 966
Rent-equipment 597 603 487 485 258 666 666 Travel and Subsistence 14 33 29 28 28 28 Air Travel - Air Tickets ( Domestic) 7 26 19 25 25 25 Accommodation - Domestic 5 5 5 1 1 1
Other 2 2 5 2 2 2 Training and staff development 302 383 411 708 102 250 500 Depreciation and amortisation 306 979 1 003 2 028 1 794 1 249 1 249
LandLeasehold Improvements 490 400 823 723 420 420 Computer equipment 75 76 176 600 466 344 344 Furniture and Office equipment 90 219 157 305 305 185 185 Other Machinery and equipment 55 75 75 96 96 96 96
Transport Assets 23 56 79 79 79 79 79 Computer Software 63 63 116 125 125 125 125
Total expenses 10 859 11 826 13 402 19 110 18 048 18 679 20 223
3.1.6 Performance and expenditure trends
Budget allocations for the previous financial year enabled the Unit to perform at a high level against its targets, details of which are available in the Annual Report. All indications are that the Unit will again perform at a high level against its targets for the financial year.
During the 2020/21 financial year, the entity costs included the Atlantis SEZ (ASEZ) incubation once off cost which are not expected to be repeated as the ASEZ is now a separately registered entity. No modifications have been made to our rental obligations regardless of the COVID-19 reduced space utilisation, as the lease re-negotiation engagements have not been concluded. Annual inflationary increase is applied in line with the fixed cost support services required. Conclusion of the organisational design action plans are also required in order support effective staff retention while additional economic recovery plans are implemented by the entity.
Measures that are in place, include regular staff feedback meetings and regular reporting on performance against targets to relevant stakeholders. In addition, strategic objectives are directly linked to the performance agreements with staff.

48
3.1.7
Ke
y risk
s
Proje
ct ob
jectiv
e:To
prom
ote an
d fac
ilitate
glob
al ex
ports
of go
ods a
nd se
rvice
s fro
m qu
alifie
d com
panie
s in t
he W
ester
n Cap
e.
To fa
cilita
te an
d sup
port
oper
ation
s and
the e
xpan
sion o
f Wes
tern C
ape c
ompa
nies i
nto th
e res
t of A
frica.
Proje
ct ris
k stat
emen
tInh
eren
t risk
Proje
ct ris
k mitig
ation
Resid
ual R
isk R
ating
Impa
ctLik
eliho
odIm
pact
Likeli
hood
Perce
ption
of C
ape T
own a
s a de
stina
tion f
or
Tour
ism an
d Inv
estm
ent.
43
•En
hanc
e web
site a
nd co
llater
al ab
ility
•Re
giona
l Afric
a Stra
tegy f
or to
urism
•Re
confi
gure
for d
omes
tic as
best
poss
ible
•Re
store
Inter
natio
nal tr
avel
32
The s
ustai
nable
fund
ing of
Wes
gro
43
•Re
view
the po
ssibi
lity of
rece
iving
priva
te se
ctor f
undin
g inc
luding
inter
natio
nal d
onor
s•
Rece
iving
othe
r pub
lic se
ctor f
undin
g (div
ersif
y fun
ding)
•Ot
her g
over
nmen
t pro
ject m
anag
emen
t inco
me ar
ound
infra
struc
ture
•Co
ntinu
e to I
ncre
ase f
undin
g sou
rces –
addin
g con
tracts
with
new
funde
rs
43
Ineffe
ctive
know
ledge
reten
tion a
nd cr
oss
sellin
g3
3
•En
hanc
e cro
ss-se
lling a
nd kn
owled
ge re
tentio
n•
Deter
mine
whic
h info
rmati
on te
chno
logy t
asks
run a
utoma
ticall
y and
whic
h req
uire a
perso
n to
oper
ate an
d ens
ure a
dditio
nal p
erso
nnel
are a
vaila
ble to
cove
r tha
t pos
ition
•Im
pleme
nt eff
ectiv
e suc
cess
ion pl
annin
g thr
ough
inter
nal s
taff d
evelo
pmen
t pro
jects
•Ma
inten
ance
of in
stitut
ional
know
ledge
•
Effec
tive d
ocum
entat
ion of
clien
t eng
agem
ents
32
Maint
enan
ce of
relat
ionsh
ip wi
th sta
keho
lders
/ fund
ers
32
•Re
vise
the W
esgr
o 5
year
stra
tegy
deve
loped
, in
cons
ultati
on w
ith th
e W
esgr
o ke
y fun
ders
incor
pora
ting t
he C
OVID
-19 r
espo
nse
•Cl
early
defin
ed de
tail b
ilater
al en
gage
ments
•Ad
dition
al me
chan
isms t
o be p
ut in
place
to ge
nera
te re
venu
e•
Proto
col d
ocum
ent c
urre
ntly b
eing c
reate
d and
to be
finali
sed
•Ma
nage
ment
shou
ld cle
arly
defin
e res
pons
ibiliti
es•
Conti
nued
wor
k on t
he m
anda
tes•
A re
spon
se st
rateg
y per
stak
ehold
er to
be de
velop
ed
32
Pand
emic
relat
ed ris
ks4
2
•Co
vid-1
9 sup
port
comm
unica
tion c
entre
estab
lishe
d and
main
taine
d•
Finali
se th
e re
vision
of t
he B
udge
t in
conju
nctio
n wi
th the
revis
ed a
vaila
ble fu
nding
due
to
COVI
D-19
prior
ities
•Re
vise
the W
esgr
o 5-
year
stra
tegy
deve
loped
, in
cons
ultati
on w
ith th
e W
esgr
o ke
y fun
ders
incor
pora
ting t
he C
OVID
-19 r
espo
nse
32
Digit
al Tr
ansfo
rmati
on3
3•
Incor
pora
tion o
f the I
T ris
ks in
to the
IT S
teerin
g Com
mitte
e rep
ort
Enha
nced
IT se
curity
in lin
e with
the d
igital
tran
sform
ation
21

49
3.2 Programme 2: Investment Promotion
PurposeThe purpose of the Programme is to attract and facilitate foreign and domestic direct investment into the Western Cape and the City of Cape Town.
3.2.1 Programme structure
Wesgro attracts direct investment to the Western Cape from international, national and local sources by providing the following services:
Investment recruitmentWesgro proactively markets the Province and priority sectors in order to attract investment. The Agency’s investment promotion activities include:
• Investor research• Investor targeting• Hosting inward business delegations• Undertaking outward investment promotion missions• Business facilitation services
The Unit offers a range of strategic services designed to enhance the experience of both foreign and domestic businesses and investors, including:
• Guidance regarding governmental incentives and grants• Site location• Facilitation of access to finance (‘best-effort’ basis)• Professional referral service• Policy advocacy, leveraging the support of the InvestSA One Stop Shop Western Cape• Strategic matchmaking• Sector-specific research via the Wesgro IQ Unit• Intergovernmental linkages
Business Growth Services UnitThrough the Business Growth Unit, Wesgro aims to source increased investments from businesses already invested in the Western Cape. The commitment to business retention and expansion also implies a dedication to current investors in the ambit of facilitation and advocacy, with support from the InvestSA One Stop Shop.
The Unit will encourage local business located outside of the Western Cape to expand into the region. Gauteng and KZN are the prioritised targeted key economic hubs. Focus areas will include:
• development of a strategic pipeline of potential brownfield expansion projects into the following Western Cape’s sectors: hotel & retail estate, green economy, technology, manufacturing;
• regular engagement with potential investors in the pipeline to support the commercialisation of investments; and
• host sector events to present our services and to understand and identify any common sectoral pain points or areas of concern.

50
AdvocacyThe aim of policy advocacy is to identify constraints to investment and alert decision-makers to the negative effects that these policies have on the business environment. The lobbying initiatives are driven to enhance the attractiveness of the Western Cape as an investment location.
Special projectsThe aim of the special projects programme is to manage the following key projects on behalf of our stakeholders:
Agribusiness Investment Unit (AIU)The Investment Promotion Unit manages the AIU as a project on behalf of the Western Cape Department of Agriculture and the Western Cape Department of Economic Development and Tourism. The Unit is responsible for landing new direct investments into the Western Cape’s agri-business sector, and retaining existing investments and supporting their expansions.
One Stop Shop (OSS) – Investor CentreGiven its legislative mandate to execute on provincial trade and investment promotion activities, the implementing agent of the One Stop Shop programme, InvestSA, has appointed Wesgro as the official managing partner of the Centre located in the Western Cape Province. The One Stop Shop supports local and foreign investors by coordinating the following activities:
• creating an entry point for investors in need of regulatory compliance; • provision of pre-approval information to investors (market data, costs, incentives, project approval,
visits, local partners, etc); • provision of facilitation services to investors (i.e. permits, approvals, import equipment & raw materials,
works permits, etc.); • access to incentives;• participation in regulatory reform; and• collaborative interface between senior-level government agents and investors.
In order to ensure that these services are readily available to businesses invested in or interested in investing in the Western Cape, a virtual OSS has been launched.
District UnitWesgro occupies a unique space between the private and government sectors. The insight that comes with this position makes the Agency better equipped to facilitate collaboration between these two sectors. The District Unit promotes the Western Cape Districts as business destinations in order to create employment and stimulate economic growth. It provides economic promotion support to all rural municipalities aligned to investment, export and film and media promotion. Key activities include:
• market businesses; • increase awareness of investment opportunities; • increase FDI and DDI; • increase market access of WC District companies into key export markets; • assist companies to invest into the rest of Africa; • link to the Export Advancement Programme (EAP) in order to bolster the capacity of companies to
export;

51
• assist the Districts with becoming ‘film-friendly’; promote the Western Cape Districts as ‘film-friendly’ destinations; and
• create awareness of the export and investment performance of the WC Districts to better understand challenges and opportunities.
Situational analysisThe team works to attract and facilitate foreign and domestic direct investment into the Western Cape and the City of the Cape Town. This includes:
• Positioning Wesgro as the “first port of call” for investors – providing essential knowledge, access and expertise.
• Proactively recruiting investors by assigning sector-specific “relationship managers” and carefully managing customer relationships before, during, and after an investment.
• Leveraging relationships with the Sector Development Agencies.• Taking part in outward and inward investment missions to promote the region.• Facilitating and securing investment into the region and providing business retention and expansion
services (aftercare) to existing investors.• Hosting journalists – identify and host key journalists to assist in telling the Western Cape’s investment
proposition.• Infrastructure investments – portfolio managers to become familiar with municipal and provincial tender
portals.• Review value proposition – investigate new sectors like healthcare and pharmaceuticals, more effort in
the tech sector.• Sustainable Development Goals (SDGs)– Understand the 17 SDGs and look to attract investments that
assist the province and country to achieve these.• Mergers and acquisitions – look to play a more active role in identifying M&A opportunities.• Disinvesting companies – prepare a proposal for companies disinvesting from China.
The COVID-19 pandemic has resulted in the Agency adapting to the new environment. The work Wesgro has done to strengthen and increase focus on the Business Growth Services team has equipped the Agency well in addressing the immediate expansion and retention requirements of existing Western Cape businesses. The virtual resources developed over this period will be enhanced for continued use to assist the Agency in providing the required services.
SectorsIn line with the Industrial Policy Action Plan (IPAP), Wesgro’s investment promotion activities are focussed in the following sectors:
• Agri-processing• Oil and Gas• Manufacturing• Green economy (renewable energy, cleantech, water resilience)• Hotel and real estate development (tourism)• Technology• Healthcare (pharmaceuticals and medical devices)• Financial services

52
The Western Cape is home to one Special Economic Zone focussed on oil & gas and marine fabrication, and another focussed on the green economy. Both are strong growth sectors for the Cape. The emergency energy procurement (Risk Mitigation Independent Power Producer Procurement Programme (RMIPPPP), and the extensive renewable build out planned, the South African Renewable energy masterplan (an industrialisation strategy for Energy), and the €700bn Green Deal, as well as continued offshore drilling work off the coast of the African continent, and the recent gas finds in the Southern Cape oceans, all further enhance this.
MarketsA detailed methodology was applied and the following markets were selected:
• United Kingdom• United States of America• China• Hong Kong• France• The Netherlands• Germany• United Arab Emirates• Singapore• India• South Korea• Saudi Arabia• Canada• Thailand• Malaysia
The markets mentioned above may seem copious, but certain markets are targeted for specific sectors that are relevant to the Western Cape over the 5-year period. In addition, not all markets may be visited in a calendar year as these missions are informed by factors such as opportunity, budget and operational plans.
3.2.2 Strategic outcomes
Strategic outcomes
Strategic outcomes Facilitate investment and jobs into the Western Cape.
Outcome statements To recruit and facilitate between R10,11 billion and R14,71 billion committed investments into the Province, resulting in between 3 705 and 7 691 jobs.
Baseline A total of R2,24 billion investments was committed, resulting in 1 485 jobs during the 2019/20 financial year.
Justification The facilitation of investment projects into the Western Cape is a core function of Wesgro and it is imperative that the Agency remain consistent and a leader in investment generation.
Links The objective is aligned to VIP 2: Economy and jobs, the National Development Plan and Vision 2030 in relation to economic growth and industry development.

53
3.2.3
Ou
tcom
es, O
utpu
ts, P
erfo
rman
ce In
dica
tors
and
Targ
ets 2
021/2
2
NoOu
tcom
eOu
tput
sOu
tput
In
dica
tors
Annu
al Ta
rget
s
Audi
ted
/Act
ual P
erfo
rman
ceEs
timat
ed
Perfo
rman
ceMT
EF P
erio
d
2017
/1820
18/19
2019
/2020
20/21
2021
/2220
22/23
2023
/24
2.1Ra
nd va
lue of
comm
itted
inves
tmen
ts int
o the
Pro
vince
Inves
tmen
t pr
ojects
reali
sed
Numb
er of
inv
estm
ent
proje
cts re
alise
d12
1518
14-1
814
-18
15-2
015
-20
2.2No
. of jo
bs fa
cilita
ted fr
om
comm
itted i
nves
tmen
ts int
o the
Pr
ovinc
e
Indi
cato
rs, A
nnua
l and
Qua
rterly
Targ
ets 2
021/2
2 (Ou
tput
indi
cato
rs)
No.
Outp
ut In
dica
tors
Annu
al Ta
rget
Q1Q2
Q3Q4
2.1.1
Numb
er of
inve
stmen
t pro
jects
reali
sed
14-1
83-
44-
63-
44-
4

54
3.2.4 Explanation of planned performance
The Investment Promotion Unit undertakes a range of outputs to ensure that it meets outcomes in terms of investment attraction and job creation. These include promoting the Western Cape internationally through undertaking outward missions, hosting inbound business delegations and having meetings with investors in the pipeline. The devaluation of the ZAR currency against major foreign currencies place additional pressure on limited funds available in the budget resulting in the minimised reprioritisation impact being realised.
Furthermore, it maintains a robust pipeline of investment projects that are weighted in accordance with the probability of the investment commercialising within a certain timeframe.
3.2.5 Programme resource considerations
Summary of payments and estimates: Programme 2: Investment Promotion
Programme R’000
Outcome Estimated outcome
Medium-term estimate
Audited Audited Audited
2017/18 2018/19 2019/20 2020/21 2021/22 2022/23 2023/24
1, Investment 5 439 5 601 6 115 10 110 19 405 17 266 18 593
Total payments and estimates 5 439 5 601 6 115 10 110 19 405 17 266 17 266
Summary of provincial payments and estimates by economic classification: Programme 2: Investment Promotion
Economic classification R’000
Outcome Estimated outcome
Medium-term estimate
Audited Audited Audited
2017/18 2018/19 2019/20 2020/21 2021/22 2022/23 2023/24
Expenses Current expense 5 439 5 601 6 115 10 110 19 405 17 266 18 593
Compensation of employees 3 902 4 177 3 798 6 934 8 287 10 333 10 095 Salary & Wages 3 529 3 786 3 271 6 039 7 180 8 808 8 570
Basic salary 3 354 3 601 3 106 5 789 7 180 8 808 8 570 Performance rewards 175 185 165 250 Other non-pensionable allowances
Social Contributions (employer contributions only) 373 391 527 895 1 107 1 525 1 525
Pension 298 316 438 783 966 1 113 1 113 Medical 60 60 72 96 120 396 396 UIF 15 15 17 16 21 16 16 Salary related expenses
Use of goods and services 1 537 1 424 2 317 3 176 11 118 6 933 8 498 Advertising 190 190 311 1 718 1 696 1 340
Advertising of postsAdvertising (marketing) 190 190 311 1 718 1 696 1 340 Consultants, contractors and special services 337 383 412 1 363 5 257 3 089 4 985
Consultants 383 896 2 070 1 080 1 480 Contractors and special services 337 412 467 3 187 2 009 3 505 General Expenses
Conference Expenditure 162 202 425 976 971 1 570 Venues and facilities 175 210 42 2 211 1 038 1 935 Inventory 352 1 680 324 549

55
ConsumablesSubscriptions 352 1 680 324 549 Other
Legal feesTravel and Subsistence 1 010 1 041 1 715 1 150 2 233 1 824 1 624
Air Travel - Air Tickets ( Domestic) 68 101 117 30 51 150 50 Air Travel - Air Tickets ( International) 454 645 924 563 1 162 971 1 024
Accommodation - Domestic 195 132 251 30 30 315 262 Accommodation - International 260 118 390 527 892 360 260 Other 33 45 33 98 28 28 Training and staff development 230
Total expenses 5 439 5 601 6 115 10 110 19 405 17 266 18 593
3.2.6 Performance and expenditure trends
The current economic climate and budget restrictions have placed tremendous pressure on the Unit to achieve its targets, however, the Unit remains committed to achieving the targets set out in the plan. A number of mitigation strategies have been put in place to ensure that itis able to deliver on its targets. Further to this, a number of new initiatives have been implemented to ensure that the Unit contributes to the Agency’s objective of creating a stimulating environment for increased economic growth and job creation during the current challenges experienced by the impact of COVID-19.

56
3.2.7
Ke
y risk
s
Proje
ct ob
jectiv
e:To
prom
ote an
d fac
ilitate
glob
al ex
ports
of go
ods a
nd se
rvice
s fro
m qu
alifie
d com
panie
s in t
he W
ester
n Cap
e.
To fa
cilita
te an
d sup
port
oper
ation
s and
the e
xpan
sion o
f Wes
tern C
ape c
ompa
nies i
nto th
e res
t of A
frica.
Proje
ct ris
k stat
emen
tInh
eren
t risk
Proje
ct ris
k mitig
ation
Resid
ual R
isk R
ating
Impa
ctLik
eliho
odIm
pact
Likeli
hood
Perce
ption
of C
ape T
own a
s a de
stina
tion f
or
Tour
ism an
d Inv
estm
ent.
43
•En
hanc
e web
site a
nd co
llater
al ab
ility
•Re
giona
l Afric
a Stra
tegy f
or to
urism
•Re
confi
gure
for d
omes
tic as
best
poss
ible
•Re
store
Inter
natio
nal tr
avel
32
The s
ustai
nable
fund
ing of
Wes
gro
43
•Re
view
the po
ssibi
lity of
rece
iving
priva
te se
ctor f
undin
g inc
luding
inter
natio
nal d
onor
s•
Rece
iving
othe
r pub
lic se
ctor f
undin
g (div
ersif
y fun
ding)
•Ot
her g
over
nmen
t pro
ject m
anag
emen
t inco
me ar
ound
infra
struc
ture
•Co
ntinu
e to I
ncre
ase f
undin
g sou
rces –
addin
g con
tracts
with
new
funde
rs
43
Ineffe
ctive
know
ledge
reten
tion a
nd cr
oss
sellin
g3
3
•En
hanc
e cro
ss-se
lling a
nd kn
owled
ge re
tentio
n•
Deter
mine
whic
h inf
orma
tion
techn
ology
task
s run
auto
matic
ally a
nd w
hich
requ
ire a
per
son
to op
erate
and e
nsur
e add
itiona
l per
sonn
el ar
e ava
ilable
to co
ver t
hat p
ositio
n•
Imple
ment
effec
tive s
ucce
ssion
plan
ning t
hrou
gh in
terna
l staf
f dev
elopm
ent p
rojec
ts•
Maint
enan
ce of
insti
tution
al kn
owled
ge
•Ef
fectiv
e doc
umen
tation
of cl
ient e
ngag
emen
ts
32
Maint
enan
ce of
relat
ionsh
ip wi
th sta
keho
lders
/ fund
ers
32
•Re
vise
the W
esgr
o 5
year
stra
tegy
deve
loped
, in
cons
ultati
on w
ith th
e W
esgr
o ke
y fun
ders
incor
pora
ting t
he C
OVID
-19 r
espo
nse
•Cl
early
defin
ed de
tail b
ilater
al en
gage
ments
•Ad
dition
al me
chan
isms t
o be p
ut in
place
to ge
nera
te re
venu
e•
Proto
col d
ocum
ent c
urre
ntly b
eing c
reate
d and
to be
finali
sed
•Ma
nage
ment
shou
ld cle
arly
defin
e res
pons
ibiliti
es•
Conti
nued
wor
k on t
he m
anda
tes•
A re
spon
se st
rateg
y per
stak
ehold
er to
be de
velop
ed
32
Pand
emic
relat
ed ris
ks4
2
•Co
vid-1
9 sup
port
comm
unica
tion c
entre
estab
lishe
d and
main
taine
d•
Finali
se th
e re
vision
of t
he B
udge
t in
conju
nctio
n wi
th the
revis
ed a
vaila
ble fu
nding
due
to
COVI
D-19
prior
ities
•Re
vise
the W
esgr
o 5-
year
stra
tegy
deve
loped
, in
cons
ultati
on w
ith th
e W
esgr
o ke
y fun
ders
incor
pora
ting t
he C
OVID
-19 r
espo
nse
32
Digit
al Tr
ansfo
rmati
on3
3•
Incor
pora
tion o
f the I
T ris
ks in
to the
IT S
teerin
g Com
mitte
e rep
ort
Enha
nced
IT se
curity
in lin
e with
the d
igital
tran
sform
ation
21

57
3.3 Programme 3: Export Promotion
PurposeThe purpose of this Programme is to promote and facilitate exports of goods and services from qualified companies in the Western Cape and to facilitate and support operations and expansion of qualified Western Cape companies into the rest of Africa through investment.
3.3.1 Programme structure
The Programme is divided into two sub-programmes, namely:
Sub-programme 3.1 Trade Promotion, focussing on companies that have export experience and capacity to supply a demand for goods or services in global markets.
Sub-programme 3.2African Expansion (Outward Foreign Direct Investment – OFDI), focussing on Western Cape companies that have export or outward investment experience and have the capacity to expand their operations into the rest of the African market.
The following services are offered:
Business facilitationThe Agency’s facilitation activities include:
• Business agreements and operating business agreement facilitation• Accessing finance • Investor and company matching• Market research and information• Forging strategic collaboration and partnerships
PromotionWesgro offers several promotional services including:
• Buying and selling missions• Advocacy and specialised advisory services • Access to strategic networks • Marketing of value-added goods and services
In the prior 5 years, the Export Unit was tasked to also focus on the following key areas which are still being incorporated in the general export promotion activities as follows:

58
Halal Export PromotionThe Unit will continue to advance the provincial halal strategy, aimed at increasing the Province’s share of the global halal market. The Unit will build on the gains and learnings of the past 5 years in order to further impact Western Cape halal exports by gathering marketing intelligence, leading trade delegations and providing assistance through in-house export programmes.
Cape Export WeekThe 2021/2022 financial year will birth the inaugural Cape Export Week, previously referred to as Africa Halal Week. The Western Cape Government has committed to growing the Western Cape’s halal global market share to at least 2%. It is intended that the traction and growth in the event once titled Africa Halal week is built upon, however, an expansion of this agricultural expo is to provide a platform to promote halal and other agricultural products available in the Western Cape to international markets.
Wine PromotionThrough a partnership with Wines of South Africa (WOSA), a private sector funded SA wine promotion specialist, wine sales and awareness of South African wines was promoted in China and Angola. Wine promotion will continue in Angola as it has been in prior years, but this will be done alongside other African countries that have shown some partiality to South African wines. Promotion efforts in China are set to continue. There is no formal agreement with WOSA, but we continue to collaborate for the benefit of the wine sector.
Situational analysisThe Western Cape Government is driving an export-led economic growth strategy. Based on the opening of international markets in 2021 and the need for Wesgro’s Export Unit to double up efforts in terms of international missions, the following key focus areas:
• Maintenance and improvement to the Western Cape Portal and E-Market Place, which is a platform for Western Cape export-ready and exporting companies that need to be vetted and on-boarded in addition to a multitude of international buyers, importers and distributors that need to be recruited. The project will significantly boost exports from the Western Cape, as international buyers will be able to source products 24/7/365 days a year. The project will run in conjunction to the increased international (physical) missions that the Unit would undertake. Eventually, linkages will be made to other provinces (ECDC, TIKZN, Northern Cape and GGDA) and to the DTIC.
• Business Seminar Events (AGOA, AfCTA, SADC, SACU, SADC-EU EPA etc.) – information sharing/business information seminars, are crucial to Western Cape export-ready and exporting companies as they keep companies abreast of the latest developments in international trade, especially with regard to the trade agreements that SA has with other countries. These information seminars create opportunities for WC exporters from a product and sector development perspective.
• Inward buying is a way more effective trade mechanism in influencing international buyers to source from the Western Cape. There is calculated experience from a Wesgro perspective that when a buyer visits Cape Town and the Western Cape, the company is more likely to source given the natural beauty, people, tourism and investment opportunities that come to fruition during a physical visit to the Province. Alternatively, there are now options to host virtual inward buying missions where Wesgro can demonstrate the beauty and multiple offerings of the Western Cape through various technological platforms, including Zoom. In this way we target buyers looking for specific products and also develop key sectors in the Western Cape.
• Research and exporter support – additional research efforts to identify export growth opportunities for Western Cape companies.
• Provide red tape reduction interventions for our exporters along with the DTIC and any other national departments.
• The Unit operates in a manner that leaves room for flexibility in order to investigate opportunities for Western Cape companies that may arise from trade wars or geopolitical disputes that affect trade.

59
SectorsThe following sectors have been identified with regard to trade promotion:
• Agriculture, agri-processing, agribusiness, furniture• Manufacturing and value-added products• Green industries• Cosmetics, natural ingredients, organic products• Services (ICT, BPO, construction)• Wholesale and retail• Clothing, textiles, leather, footwear• Boatbuilding and auxiliary services• Aerospace • Infrastructure development (OFDI in Africa)
The abovementioned sectors are varied and show the wide range of competencies in the Western Cape. These sectors are at different levels of maturity in terms of export capability and as such our involvement may vary.
MarketsThe following markets have been identified with regard to trade promotion:
• Africa: Angola, Botswana, Namibia, Mozambique, Zambia, Nigeria, Ghana, Senegal, Cameroon, Ghana, Ivory Coast, Kenya, Tanzania, Ethiopia
• Asia: China, India, Malaysia, Japan, Singapore, Thailand, Vietnam, Indonesia, South Korea• Australasia: Australia, New Zealand• Middle East: UAE, Saudi Arabia, Qatar• Americas: USA, Canada, Brazil, Chile• Europe: United Kingdom, Germany, Belgium, Sweden, Austria, France, Russia, Poland, Czech Republic
These markets vary from markets that are targeted for specific goods and sectors, well established markets, growing markets and markets with potential that Wesgro wishes to explore for the benefit of Western Cape companies. The nature and the level of work in these markets will thus vary.
3.3.2 Strategic outcomes
Strategic outcome
Strategic outcome To promote and facilitate global exports of goods and services from qualified companies in the Western Cape.
Outcome statementsTo recruit and facilitate between R16,70 billion and R25,04 billion trade agreements, resulting in between 2 840 and 3 716 jobs, and R1,36 billion and R3,09 billion Outward Foreign Direct Investment (OFDI).
Baseline A total value of R3,08 billion trade agreements were committed, resulting in 973 jobs. A total value of R428,75 million foreign direct investment was committed for the 2019/20 financial year.
Justification By promoting and facilitating exports, the economy of the Western Cape will grow and continuous job creation will be sustained. In addition, exposure to markets will increase demand for brands.
Links The objective is linked to VIP 2: Economy and jobs, the National Development Plan and Vision 2030 in relation to economic growth and industry development.

60
3.3.3
Ou
tcom
es, O
utpu
ts, P
erfo
rman
ce In
dica
tors
and
Targ
ets 2
021/2
2
Sub-
prog
ram
me 3
.1: E
xpor
t Pro
mot
ion
NoOu
tcom
eOu
tput
sOu
tput
Indi
cato
rsAn
nual
Targ
ets
Audi
ted
/Act
ual P
erfo
rman
ceEs
timat
ed
Perfo
rman
ce20
20/21
MTEF
Per
iod
2017
/1820
18/19
2019
/2020
21/22
2022
/2320
23/24
3.1.1
Estim
ated R
and v
alue t
rade
ag
reem
ents
signe
dTr
ade a
gree
ments
sig
ned
Numb
er of
trad
e ag
reem
ents
signe
d53
7940
45-6
545
-65
50-7
050
-70
3.1.2
Numb
er of
jobs
facil
itated
from
tra
de ag
reem
ents
signe
d
Sub-
prog
ram
me 3
.2: A
frica
n Ex
pans
ion
(OFD
I)
NoOu
tcom
eOu
tput
sOu
tput
Indi
cato
rsAn
nual
Targ
ets
Audi
ted
/Act
ual P
erfo
rman
ceEs
timat
ed
Perfo
rman
ce20
20/21
MTEF
Per
iod
2017
/1820
18/19
2019
/2020
21/22
2022
/2320
23/24
3.2.1
Rand
value
of co
mmitte
d ou
twar
d for
eign d
irect
inves
tmen
t (OF
DI
decla
ratio
ns si
gned
Outw
ard f
oreig
n dire
ct inv
estm
ents
(OFD
I sig
ned
Numb
er of
outw
ard
foreig
n dire
ct inv
estm
ent
decla
ratio
ns (O
FDI s
igned
69
77
78
9
Indi
cato
rs, A
nnua
l and
Qua
rterly
Targ
ets 2
021/2
2 (Ou
tput
indi
cato
rs)
No.
Outp
ut In
dica
tors
Annu
al Ta
rget
Q1Q2
Q3Q4
3.1.1.
1Nu
mber
of tr
ade a
gree
ments
sign
ed
45-6
58-
1413
-18
10-1
514
-18
3.2.1.
1Nu
mber
of ou
twar
d for
eign d
irect
inves
tmen
t (OF
DI de
clara
tions
sign
ed7
-2
32

61
3.3.4 Explanation of planned performance over the medium-term period
Opportunities for Western Cape companies to market their products in international markets and meet buyers, distributors, and importers are created through outward missions. If an export deal is signed, the companies sign a Declaration Form with the Unit, which measures the potential for export to a particular market over a five-year period. Once these values in the declaration form are tallied, then the Unit is able to report on the rand value of exports facilitated, the rand value of OFDI created and the number of jobs maintained and created. This information is sourced from the companies themselves.
3.3.5 Reconciling performance targets with budget and the MTEF
Summary of payments and estimates: Programme 3: Trade Promotion
Programme R’000
Outcome Estimated outcome
Medium-term estimate
Audited Audited Audited
2017/18 2018/19 2019/20 2020/21 2021/22 2022/23 2023/24
1, International Trade Promotion 8 749 8 027 8 810 21 614 21 455 23 101 21 403
Total payments and estimates 8 749 8 027 8 810 21 614 21 455 23 101 21 403
Summary of provincial payments and estimates by economic classification: Programme 3: Trade Promotion
Economic classification R’000
Outcome Estimated outcome
Medium-term estimate
Audited Audited Audited
2017/18 2018/19 2019/20 2020/21 2021/22 2022/23 2023/24
Expenses Current expense 8 749 8 027 8 810 21 614 21 455 23 101 21 403
Compensation of employees 6 194 5 440 6 585 8 286 8 595 9 203 10 203 Salary & Wages 5 809 5 122 5 948 7 475 7 356 8 014 9 014
Basic salary 5 513 4 834 5 629 7 192 7 356 8 014 9 014 Performance rewards 296 288 319 283 Other non-pensionable allowances
Social Contributions (employer contributions only) 385 318 637 811 1 239 1 189 1 189
Pension 304 254 558 692 1 074 1 070 1 070 Medical 60 48 59 96 144 96 96 UIF 21 16 20 23 21 23 23 Salary related expenses
Use of goods and services 2 555 2 587 2 225 13 328 12 860 13 898 11 200 Advertising 50 86 446 201 200
Advertising of postsAdvertising (marketing) 50 86 446 201 200 Consultants, contractors and special services 480 240 480 9 296 10 459 11 665 9 733
Consultants 200 180 200 1 043 1 400 2 420 2 420 Contractors and special services 280 60 280 8 253 9 059 9 245 7 313
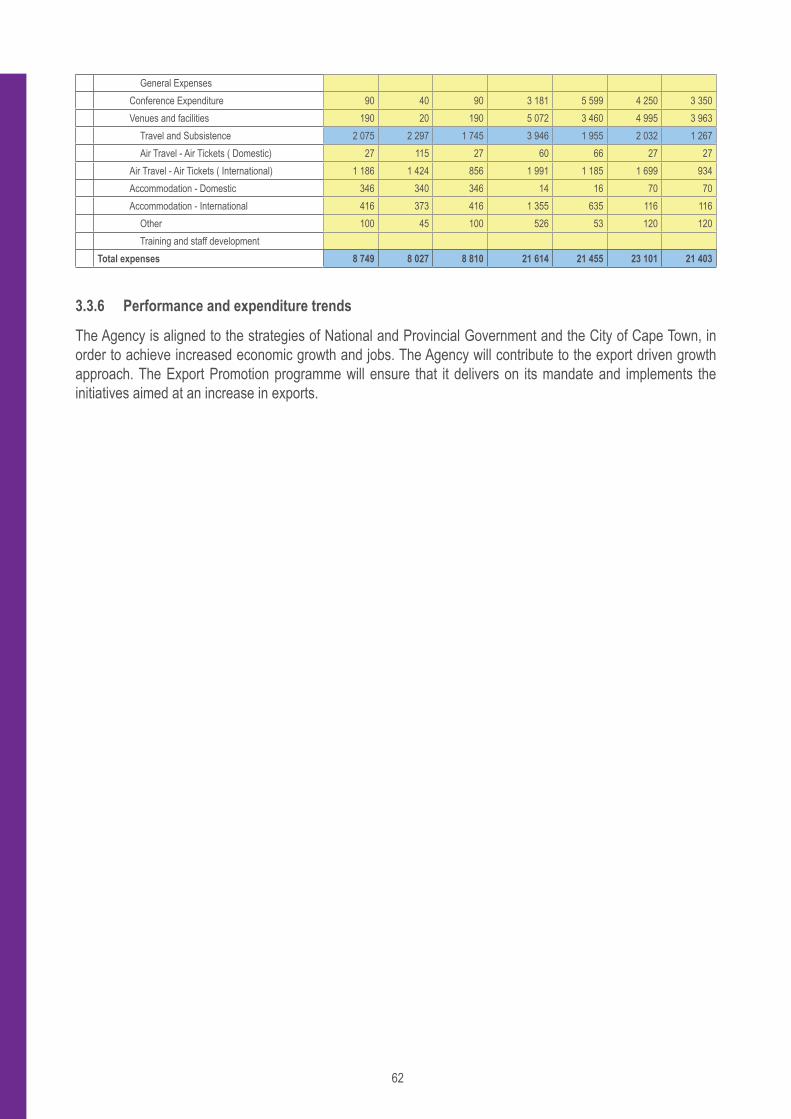
62
General ExpensesConference Expenditure 90 40 90 3 181 5 599 4 250 3 350 Venues and facilities 190 20 190 5 072 3 460 4 995 3 963
Travel and Subsistence 2 075 2 297 1 745 3 946 1 955 2 032 1 267 Air Travel - Air Tickets ( Domestic) 27 115 27 60 66 27 27
Air Travel - Air Tickets ( International) 1 186 1 424 856 1 991 1 185 1 699 934 Accommodation - Domestic 346 340 346 14 16 70 70 Accommodation - International 416 373 416 1 355 635 116 116
Other 100 45 100 526 53 120 120 Training and staff development
Total expenses 8 749 8 027 8 810 21 614 21 455 23 101 21 403
3.3.6 Performance and expenditure trends
The Agency is aligned to the strategies of National and Provincial Government and the City of Cape Town, in order to achieve increased economic growth and jobs. The Agency will contribute to the export driven growth approach. The Export Promotion programme will ensure that it delivers on its mandate and implements the initiatives aimed at an increase in exports.

63
3.3.7
Key r
isks
Proje
ct ob
jectiv
e:To
prom
ote an
d fac
ilitate
glob
al ex
ports
of go
ods a
nd se
rvice
s fro
m qu
alifie
d com
panie
s in t
he W
ester
n Cap
e.To
facil
itate
and s
uppo
rt op
erati
ons a
nd th
e exp
ansio
n of W
ester
n Cap
e com
panie
s into
the r
est o
f Afric
a.
Proje
ct ris
k stat
emen
tInh
eren
t risk
Proje
ct ris
k mitig
ation
Resid
ual R
isk R
ating
Impa
ctLik
eliho
odIm
pact
Likeli
hood
Perce
ption
of C
ape T
own a
s a
desti
natio
n for
Tour
ism an
d Inv
estm
ent.
43
•En
hanc
e web
site a
nd co
llater
al ab
ility
•Re
giona
l Afric
a Stra
tegy f
or to
urism
•Re
confi
gure
for d
omes
tic as
best
poss
ible
•Re
store
Inter
natio
nal tr
avel
32
The s
ustai
nable
fund
ing of
Wes
gro
43
•Re
view
the po
ssibi
lity of
rece
iving
priva
te se
ctor f
undin
g inc
luding
inter
natio
nal d
onor
s•
Rece
iving
othe
r pub
lic se
ctor f
undin
g (div
ersif
y fun
ding)
•Ot
her g
over
nmen
t pro
ject m
anag
emen
t inco
me ar
ound
infra
struc
ture
•Co
ntinu
e to I
ncre
ase f
undin
g sou
rces –
addin
g con
tracts
with
new
funde
rs
43
Ineffe
ctive
know
ledge
reten
tion a
nd
cross
sellin
g3
3
•En
hanc
e cro
ss-se
lling a
nd kn
owled
ge re
tentio
n•
Deter
mine
whic
h info
rmati
on te
chno
logy t
asks
run a
utoma
ticall
y and
whic
h req
uire a
perso
n to
oper
ate an
d ens
ure a
dditio
nal p
erso
nnel
are a
vaila
ble to
cove
r tha
t pos
ition
•Im
pleme
nt eff
ectiv
e suc
cess
ion pl
annin
g thr
ough
inter
nal s
taff d
evelo
pmen
t pro
jects
•Ma
inten
ance
of in
stitut
ional
know
ledge
•
Effec
tive d
ocum
entat
ion of
clien
t eng
agem
ents
32
Maint
enan
ce of
relat
ionsh
ip wi
th sta
keho
lders
/ fund
ers
32
•Re
vise
the W
esgr
o 5
year
stra
tegy
deve
loped
, in
cons
ultati
on w
ith th
e W
esgr
o ke
y fun
ders
incor
pora
ting t
he C
OVID
-19 r
espo
nse
•Cl
early
defin
ed de
tail b
ilater
al en
gage
ments
•Ad
dition
al me
chan
isms t
o be p
ut in
place
to ge
nera
te re
venu
e•
Proto
col d
ocum
ent c
urre
ntly b
eing c
reate
d and
to be
finali
sed
•Ma
nage
ment
shou
ld cle
arly
defin
e res
pons
ibiliti
es•
Conti
nued
wor
k on t
he m
anda
tes•
A re
spon
se st
rateg
y per
stak
ehold
er to
be de
velop
ed
32
Pand
emic
relat
ed ris
ks4
2
•Co
vid-1
9 sup
port
comm
unica
tion c
entre
estab
lishe
d and
main
taine
d•
Finali
se th
e re
vision
of t
he B
udge
t in
conju
nctio
n wi
th the
revis
ed a
vaila
ble fu
nding
due
to
COVI
D-19
prior
ities
•Re
vise
the W
esgr
o 5-
year
stra
tegy
deve
loped
, in
cons
ultati
on w
ith th
e W
esgr
o ke
y fun
ders
incor
pora
ting t
he C
OVID
-19 r
espo
nse
32
Digit
al Tr
ansfo
rmati
on3
3•
Incor
pora
tion o
f the I
T ris
ks in
to the
IT S
teerin
g Com
mitte
e rep
ort
Enha
nced
IT se
curity
in lin
e with
the d
igital
tran
sform
ation
21

64
3.4 Programme 4: Wesgro Research
PurposeThe purpose of the Programme is to provide investment, trade, tourism and film research and to provide evidence-based research in order to augment the Agency’s strategic direction and promotional activities.
3.4.1 Programme structure
The Wesgro Research Unit is the custodian of intelligence related to the Agency’s core business. The Unit provides relevant, evidence-based and strategic information to the Agency. It also provides a supportive programme to ensure that market and sector knowledge is presented to potential exporters and prospective investors and that tourism research is provided on the Western Cape’s tourism sector.
The Unit executes two main functions:
• Informing the strategy of the Agency.• Augmenting the promotional activities of the Agency through evidence-based research.
Driving the strategy of the AgencyThe Unit analyses global trends to inform the Agency’s strategy. This is done through the provision of strategic intelligence to assist the Agency in making informed business decisions with regard to its activities. Opportunities significant to the Agency are identified and disseminated during internal workshops with the relevant Wesgro Units.
The Wesgro Research Unit aims to provide an enabling environment for the development of the strategy of the Agency by providing the necessary research to meet the goals and support the vision of the Agency. The research of the Unit also informs the Annual Performance Plans of the Agency as strategic publications are created to provide a sound base for the identification of key sectors and markets for investment, trade, tourism and film promotional activities.
Enhancing the promotion activities of WesgroThe Unit supports the Agency’s trade, investment, tourism and film promoting activities by providing intelligence on key sectors and foreign markets, focussing on these areas and the underlying objective of promoting Cape Town and the Western Cape as a business destination.
The research prepared for the purpose of enhancing the promotion activities of Wesgro is revised on a quarterly basis to ensure that the Unit remains responsive to the changing needs of the Agency. It is also important that the research products of the Unit are positively received by Wesgro clients and that they benefit from the research products provided. To this end, a survey is conducted to determine the effectiveness of the research.

65
3.4.2 Strategic outcome
Strategic outcome
Strategic Outcome Develop relevant tourism, trade and investment publications and provide customised research to support the core functions of the Agency.
Outcome statementDevelop content for publications relevant to the sectors and markets of Wesgro, the Province and the City, and produce customised research, aimed at strengthening the Agency’s position as a though leader.
Baseline 104 publications were produced during the 2019/20 financial year.Justification Publications inform and guide the Agency, exporters and investors.Links The objective is linked to the Agency’s 5-year Strategic Plan.

66
3.4.3
Ou
tcom
es, O
utpu
ts, P
erfo
rman
ce In
dica
tors
and
Targ
ets 2
021/2
2
NoOu
tcom
eOu
tput
sOu
tput
Indi
cato
rsAn
nual
Targ
ets
Audi
ted
/Act
ual P
erfo
rman
ceEs
timat
ed
Perfo
rman
ce20
20/21
MTEF
Per
iod
2017
/1820
18/19
2019
/2020
21/22
2022
/2320
23/24
4.1Nu
mber
of re
sear
ch
repo
rts do
wnloa
ded
and d
istrib
uted
Rese
arch
repo
rts
prod
uced
Nu
mber
of re
sear
ch
repo
rts de
velop
ed11
910
510
410
010
010
010
0
Indi
cato
rs, A
nnua
l and
Qua
rterly
Targ
ets 2
021/2
2 (Ou
tput
indi
cato
rs)
NoOu
tput
Indi
cato
rsAn
nual
Targ
etQ1
Q2Q3
Q44.1
.1Nu
mber
of re
sear
ch re
ports
deve
loped
10
0-
50-
50

67
3.4.4 Explanation of planned performance over the medium-term period
As a key support function, the Unit supports the Agency’s core functions through the provision of intelligence on sectors and markets. The Unit also provides the Agency with the intelligence that forms the foundation of its strategy aimed at achieving its mandatory requirements.
3.4.5 Reconciling performance targets with the budget and MTEF
Summary of payments and estimates: Programme 4: Wesgro Research
Programme R’000
Outcome Estimated outcome
Medium-term estimate
Audited Audited Audited
2017/18 2018/19 2019/20 2020/21 2021/22 2022/23 2023/24
1, Intelligence 3 257 3 394 4 055 4 725 4 002 3 786 3 916
Total payments and estimates 3 257 3 394 4 055 4 725 4 002 3 786 3 916
Summary of provincial payments and estimates by economic classification: Programme 4: Wesgro Research
Economic classification R’000
Outcome Estimated outcome
Medium-term estimate
Audited Audited Audited
2017/18 2018/19 2019/20 2020/21 2021/22 2022/23 2023/24
Expenses
Current expense 3 257 3 394 4 055 4 725 4 002 3 786 3 916 Compensation of employees 1 468 1 672 1 883 2 202 2 202 1 934 1 934 Salary & Wages 1 301 1 495 1 757 2 061 1 843 1 781 1 781 Basic salary 1 235 1 414 1 661 1 962 1 843 1 684 1 684 Performance rewards 66 81 96 99 - 97 97 Other non-pensionable allowances
Social Contributions (employer contributions only) 167 177 126 141 359 153 153
Pension 123 130 101 116 296 128 128 Medical 38 39 18 17 54 17 17 UIF 6 8 7 8 9 8 8 Salary related expenses Use of goods and services 1 789 1 722 2 172 2 523 1 800 1 852 1 982 Advertising Advertising of posts Gifts and Promotional items Advertising (marketing) Consultants, contractors and special services 5 5 Consultants 5 5 Inventory 1 749 1 668 2 122 2 479 1 800 1 852 1 982 Subscriptions 1 749 1 668 2 122 2 479 1 800 1 852 1 982 Other Legal fees Travel and Subsistence 35 54 45 44 Air Travel - Air Tickets ( Domestic) 25 48 35 28

68
Air Travel - Air Tickets ( International) Accommodation - Domestic 4 4 4 8 Accommodation - International Other 6 2 6 8
Total expenses 3 257 3 394 4 055 4 725 4 002 3 786 3 916
3.4.6 Performance and expenditure trends
The Unit faces enormous strain particularly due to the depreciating exchange rate significantly increasing the cost of international databases. These databases are at the epicentre of investment intelligence and global sector intelligence in particular.
Wesgro, through the tourism offices, is responsible for the Western Cape’s tourism research. This is a costly exercise and budget constraints impact on this function. As a result, the Research Unit relies on the goodwill of the reciprocal relationships it has with the tourism offices and various tourism establishments of the Province in order to deliver.
In light of this, the Agency has implemented mitigation strategies to ensure that the Unit is able to deliver on its targets.
The Unit relies heavily on the sourcing of information for their research in supporting the Agency through subscriptions based outside South Africa, which is impacted on due to the fluctuations of the South African Rand to major currencies.

69
3.4.7
Key r
isks
Proj
ect o
bjec
tive:
To p
rom
ote a
nd fa
cilita
te g
loba
l exp
orts
of g
oods
and
serv
ices f
rom
qua
lified
com
pani
es in
the W
este
rn C
ape.
To fa
cilita
te an
d su
ppor
t ope
ratio
ns an
d th
e exp
ansio
n of
Wes
tern
Cap
e com
pani
es in
to th
e res
t of A
frica
.
Proj
ect r
isk st
atem
ent
Inhe
rent
risk
Proj
ect r
isk m
itiga
tion
Resid
ual R
isk R
atin
gIm
pact
Like
lihoo
dIm
pact
Like
lihoo
d
Perce
ption
of C
ape T
own a
s a de
stina
tion f
or
Tour
ism an
d Inv
estm
ent.
43
•En
hanc
e web
site a
nd co
llater
al ab
ility
•Re
giona
l Afric
a Stra
tegy f
or to
urism
•Re
confi
gure
for d
omes
tic as
best
poss
ible
•Re
store
Inter
natio
nal tr
avel
32
The s
ustai
nable
fund
ing of
Wes
gro
43
•Re
view
the po
ssibi
lity of
rece
iving
priva
te se
ctor f
undin
g inc
luding
inter
natio
nal d
onor
s•
Rece
iving
othe
r pub
lic se
ctor f
undin
g (div
ersif
y fun
ding)
•Ot
her g
over
nmen
t pro
ject m
anag
emen
t inco
me ar
ound
infra
struc
ture
•Co
ntinu
e to I
ncre
ase f
undin
g sou
rces –
addin
g con
tracts
with
new
funde
rs
43
Ineffe
ctive
know
ledge
reten
tion a
nd cr
oss
sellin
g3
3
•En
hanc
e cro
ss-se
lling a
nd kn
owled
ge re
tentio
n•
Deter
mine
whic
h inf
orma
tion
techn
ology
task
s run
auto
matic
ally a
nd w
hich
requ
ire a
per
son
to op
erate
and e
nsur
e add
itiona
l per
sonn
el ar
e ava
ilable
to co
ver t
hat p
ositio
n•
Imple
ment
effec
tive s
ucce
ssion
plan
ning t
hrou
gh in
terna
l staf
f dev
elopm
ent p
rojec
ts•
Maint
enan
ce of
insti
tution
al kn
owled
ge
•Ef
fectiv
e doc
umen
tation
of cl
ient e
ngag
emen
ts
32
Maint
enan
ce of
relat
ionsh
ip wi
th sta
keho
lders
/ fund
ers
32
•Re
vise
the W
esgr
o 5
year
stra
tegy
deve
loped
, in
cons
ultati
on w
ith th
e W
esgr
o ke
y fun
ders
incor
pora
ting t
he C
OVID
-19 r
espo
nse
•Cl
early
defin
ed de
tail b
ilater
al en
gage
ments
•Ad
dition
al me
chan
isms t
o be p
ut in
place
to ge
nera
te re
venu
e•
Proto
col d
ocum
ent c
urre
ntly b
eing c
reate
d and
to be
finali
sed
•Ma
nage
ment
shou
ld cle
arly
defin
e res
pons
ibiliti
es•
Conti
nued
wor
k on t
he m
anda
tes•
A re
spon
se st
rateg
y per
stak
ehold
er to
be de
velop
ed
32
Pand
emic
relat
ed ris
ks4
2
•Co
vid-1
9 sup
port
comm
unica
tion c
entre
estab
lishe
d and
main
taine
d•
Finali
se th
e re
vision
of t
he B
udge
t in
conju
nctio
n wi
th the
revis
ed a
vaila
ble fu
nding
due
to
COVI
D-19
prior
ities
•Re
vise
the W
esgr
o 5-
year
stra
tegy
deve
loped
, in
cons
ultati
on w
ith th
e W
esgr
o ke
y fun
ders
incor
pora
ting t
he C
OVID
-19 r
espo
nse
32
Digit
al Tr
ansfo
rmati
on3
3•
Incor
pora
tion o
f the I
T ris
ks in
to the
IT S
teerin
g Com
mitte
e rep
ort
Enha
nced
IT se
curity
in lin
e with
the d
igital
tran
sform
ation
21

70
3.5 Programme 5: Marketing and Communication
PurposeTo conduct the marketing and communication for Wesgro corporate and investment, export, tourism and film.
3.5.1 Programme structure The programme is divided into two sub-programmes, namely:
Sub-programme 5.1: Positioning the Agency and the destination. To improve the position of the Agency and the destination with shareholders, citizens, and domestic and international businesses, as follows:
• Assistance with hosting of and/or the logistical management of strategic corporate and external events with partners.
• Marketing campaigns via social media, digital and traditional media channels.• Creation of bespoke content (audio, visual and print) for Wesgro and the destination to be used in
marketing campaigns.• Customer relationship marketing.
Sub-programme 5.2: Management of the reputation of the Agency and the destination. To manage the reputation of the Agency and destination through media opportunities:
• Writing and distribution of op-ed pieces.• Writing and distribution of media releases.• Website management.• Hosting of strategic media engagements.• Distribution of research publications via media opportunities.• Monthly tracking of Advertising Value Equivalent (AVE) generated.
We aim to embark on more sophisticated virtual events/webinar platforms and joint virtual events, as well as website updates and functionality to support stakeholders strategically as and when needed during the recovery period.
Special projectsThe aim of the special projects programme is to manage key projects on behalf of our stakeholders.
Project Good Hope – Cape Town and Western Cape Remote Work Campaign
The aim of the campaign is to build confidence in Cape Town and the Western Cape as the destination of choice to do business remotely. Targeting both international and local audiences, the objective is to position the region as the top choice in Africa for remote work. In the short term, these audiences put money back into the economy, and in the long term they immerse themselves in the region, which fosters opportunities to bring future business here.
International missions have shown that those who set foot in Cape Town are more likely to invest, community co-working can be catalyst for this investment. The campaign will showcase the region’s proof points and
71
capabilities. To deepen confidence building efforts, we will also land high level accolades of how successful Cape Town and the Western Cape has been in dealing with COVID-19 at all levels, as the system needs to be shown as capable.
The campaign will have two components:
• Local positioning: targeting predominately JHB-based business stakeholders to come to Cape Town and the Western Cape for longer stays.
• International positioning: targeting audience sets who are showing interest across business and tourism landscapes to come to Cape Town and the Western Cape for longer stays, with the possibility of relocating here.
By using online reputation management tools, and online listening tools, we will identify niche groups for targeting, including sentiment tracking along with personal development.
Campaign measurements:
• Primary objective: awareness – to promote the benefits and proof points of the destination as a top remote work hub in Africa.
• Local: continued partnerships with trade partners as well as industry to educate on the benefits of the destination as a remote work “long stay” option. Visits to site and engagement with trade collateral measured.
• International: website development. Reach, unique users attracted and visits to the webpage – also including time spent on site, database development and newsletter sign ups.
• Attendance of ‘leading tech cities’ webinars and B2B meetings.
Project Good Hope – Exports Campaign
The objective of the Export Campaign “Why Buy” is to package and promote the export offering of Cape Town & the Western Cape. This is done through digital marketing in key source markets, aligned to the strategic goals of the Wesgro Export team and taking into account the COVID-19 trading landscape. It will also see the development of designed, digital collateral that can be used by government and economic agencies in promoting the destination to buyers, importers and distributors for exports.
In packaging the export offering, the dedicated team will work to position the Cape Town and Western Cape export brand, with special consideration for the intrinsic qualities that the region has on offer and taking into account the COVID-19 trading landscape, focussing on new sectors for development, and those that give us a unique positioning in the market. By positioning the region, we subsequently influence the profile of the entire destination export brand, which could impact positively on other sectors.
Through the digital campaign, targeted buyers, importers and distributors will be driven to the virtual trade portal being developed by the Trade Unit, where data on them can be collected for CRM purposes. This trade portal is an important asset that can be leveraged in future campaigns, and in generating awareness of the destinations export brand. The site will not be built on a zero base, and will take its lead from the already developed “Cape Export Network” portal, which has begun the work of connecting wine exporters and buyers.
In line with the Western Cape Government’s greater emphasis on ‘tradeables’, the Project Good Hope Exports Campaign aims to achieve a single brand for Western Cape exports, with targeted campaigns in pre-identified markets to develop the brand identity for Western Cape exports. Detailed reports will be provided at the end of each boost, including data on:
Campaign measurements:
• Reach (How many opportunities to see the campaign, including source markets demographic data).• Collateral Views (Portal Views, AV views).

72
• Clicks (Clicks leading to trade portal and clicks to subscribe – contact investment/trade team).• In addition, and insofar as the export brand component is concerned, the adoption and use of this brand
by key exporters will also be measured by gauging industry uptake.
Situational analysisIn Wesgro’s role to manage and drive the reputation of both the Agency and the business brand for Cape Town and the Western Cape, there are various internal and external factors that influence the Unit.
The “traditional” media environment continues to fragment and has been further negatively impacted by the COVID-19 landscape, resulting in a lower reach. Online and digital platforms provide new and exciting opportunities for communication and brand positioning. The PR landscape is evolving and the Unit’s operations are evolving with it. The Marketing and Communication Unit examines content holistically and adopts a multimedia approach to content marketing across social media and PR, while still having a presence in strategic traditional media.
The rand depreciation can also place pressure on the marketing budget with regard to international media spend. In terms of digital marketing, we are bidding for online space against other international investment, export tourism and film place brands and so we need to be able to compete in a global space. This requires dedicated spend that can cut through global budgets in key source markets.
The overall perception of the country has a direct impact on the business brand of Cape Town and the Western Cape. This can have both a positive and negative effect, depending on the issue at hand. Other regional factors, such as the drought, concerns over tourism safety and political developments can also shape how the destination is viewed at home and abroad. Crucially, how the destination has handled COVID-19, the systemic capabilities of the public and private sector response impact perception. It is vital that we show how resilient we are and that the future still holds opportunities for business stakeholders, locally and globally. Our role as the Agency for the destination is to counteract these perceptions with the positive economic stories that exist, underpinned by our research. This is done under the #CapeConfidence banner on our digital platforms. The Cape Confidence Campaign will increase the amount of stakeholders we could reach with our ‘future Cape Town AV’ through a targeted media buy extension on LinkedIn and allow us to shoot more expat testimonial videos, which aim to increase confidence in order to retain businesses in the Cape.
3.5.2 Strategic objectives
Strategic outcomeStrategic outcome Profile and position the Agency through its core mandates of investment, export, tourism and film.Outcome statement To build a strong regional economic brand with an estimated rand value of R398,1 million AVE.Baseline A total of R58,37 million in AVE was generated during the 2019/20 financial year.
Justification By positively managing the reputation of the Agency and the destination, we will attract more interest in the Cape and help improve economic growth and job creation.
Links This objective is linked to the Agency’s 5-year Strategic Plan.

73
3.5.3
Out
com
es, P
erfo
rman
ce In
dica
tors
and
Targ
ets 2
021/2
2
NoOu
tcom
eOu
tput
sOu
tput
Indi
cato
rsAn
nual
Targ
ets
Audi
ted
/Act
ual P
erfo
rman
ceEs
timat
ed
Perfo
rman
ce20
20/21
MTEF
Per
iod
2017
/1820
18/19
2019
/2020
21/22
2022
/2320
23/24
5.1
Rand
value
of th
e ad
vertis
ing va
lue
equiv
alent
(AVE
) ge
nera
ted fo
r the
Age
ncy
Corp
orate
even
ts su
ppor
ted
Numb
er of
corp
orate
ev
ents
supp
orted
3151
5720
-45
20-4
520
-45
20-4
5
Conte
nt ma
nage
ment
Quar
terly
repo
rts
evide
ncing
conte
nt ma
nage
ment
of Ag
ency
co
llater
al
--
-4
44
4
Indi
cato
rs, A
nnua
l and
Qua
rterly
Targ
ets 2
021/2
2 (Ou
tput
indi
cato
rs)
No.
Outp
ut In
dica
tors
Annu
al Ta
rget
Q1Q2
Q3Q4
5.1.1
Numb
er of
stra
tegic
corp
orate
Age
ncy e
vents
supp
orted
20-4
55-
85-
105-
125-
155.1
.2Qu
arter
ly re
ports
evide
ncing
conte
nt ma
nage
ment
of Ag
ency
colla
teral
41
11
1

74
3.5.4 Explanation of planned performance over the medium-term period
Wesgro’s Marketing and Communication Unit’s objective is to build the brand of Cape Town and the Western Cape. In order to do this, Wesgro makes use of earned media communication (resulting in print, broadcast and digital coverage) and social media (such as Facebook, Twitter, Instagram and LinkedIn) to promote stories that create a positive perception of the destination. This is measured in AVE and campaign-specific digital metrics.
The Unit builds the brand of the destination through direct marketing efforts, by creating collateral for the various Units and partners to use when they promote the destination. Collateral such as online brochures, banners and designed research collateral are disseminated at events, exhibitions, conferences and on missions. This content is presented in quarterly reports.
The Unit builds the brand of the destination through corporate events (physical and virtual). These events, which include key stakeholders and the business community, allows the Agency to directly communicate the offer of the Province, promote success stories, share research and engage with concerns raised. It is a highly effective form of business-to-business marketing, which also allows for networking between businesses and the building of a vibrant ecosystem. This will be reflected in the number of corporate events supported.
3.5.5 Reconciling performance targets with the budget and MTEF
Summary of payments and estimates: Programme 5: Marketing and Communication
Programme R’000
Outcome Estimated outcome
Medium-term estimate
Audited Audited Audited
2017/18 2018/19 2019/20 2020/21 2021/22 2022/23 2023/24
1, Marketing and Communication 5 354 5 823 6 036 9 124 10 583 7 761 8 204
Total payments and estimates 5 354 5 823 6 036 9 124 10 583 7 761 8 204
Summary of provincial payments and estimates by economic classification: Programme 5: Marketing and Communication
Economic classification R’000
Outcome Estimated outcome
Medium-term estimate
Audited Audited Audited
2017/18 2018/19 2019/20 2020/21 2021/22 2022/23 2023/24
Expenses
Current expense 5 354 5 823 6 036 9 124 10 583 7 761 8 204 Compensation of employees 2 926 3 457 3 724 5 094 5 583 5 656 5 656 Salary & Wages 2 773 3 298 3 278 4 226 4 479 4 705 4 705 Basic salary 2 619 3 134 3 095 4 099 4 479 4 563 4 563 Performance rewards 154 164 183 127 - 142 142 Other non-pensionable allowances
Social Contributions (employer contributions only) 153 159 446 868 1 104 951 951
Pension 106 112 397 740 938 823 823 Medical 36 36 36 108 145 108 108 UIF 11 11 13 20 21 20 20 Salary related expenses Use of goods and services 2 428 2 366 2 312 4 030 5 000 2 105 2 548 Advertising 1 746 1 651 1 646 2 025 2 897 223 223 Advertising of posts Gifts and Promotional items 200 200 200 150 50 47 47
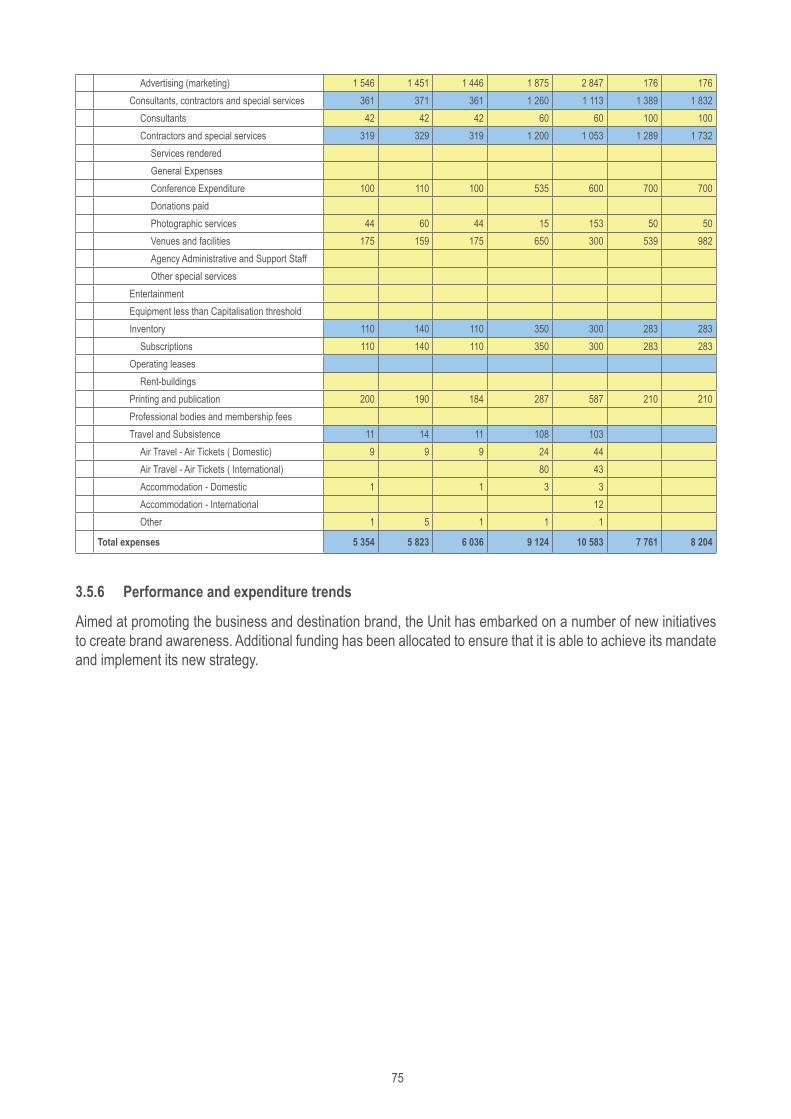
75
Advertising (marketing) 1 546 1 451 1 446 1 875 2 847 176 176 Consultants, contractors and special services 361 371 361 1 260 1 113 1 389 1 832 Consultants 42 42 42 60 60 100 100 Contractors and special services 319 329 319 1 200 1 053 1 289 1 732 Services rendered General Expenses Conference Expenditure 100 110 100 535 600 700 700 Donations paid Photographic services 44 60 44 15 153 50 50 Venues and facilities 175 159 175 650 300 539 982 Agency Administrative and Support Staff Other special services Entertainment Equipment less than Capitalisation threshold Inventory 110 140 110 350 300 283 283 Subscriptions 110 140 110 350 300 283 283 Operating leases Rent-buildings Printing and publication 200 190 184 287 587 210 210 Professional bodies and membership fees Travel and Subsistence 11 14 11 108 103 Air Travel - Air Tickets ( Domestic) 9 9 9 24 44 Air Travel - Air Tickets ( International) 80 43 Accommodation - Domestic 1 1 3 3 Accommodation - International 12 Other 1 5 1 1 1
Total expenses 5 354 5 823 6 036 9 124 10 583 7 761 8 204
3.5.6 Performance and expenditure trends
Aimed at promoting the business and destination brand, the Unit has embarked on a number of new initiatives to create brand awareness. Additional funding has been allocated to ensure that it is able to achieve its mandate and implement its new strategy.

76
3.5.7
Ke
y risk
s
Proj
ect o
bjec
tive:
To p
rom
ote a
nd fa
cilita
te g
loba
l exp
orts
of g
oods
and
serv
ices f
rom
qua
lified
com
pani
es in
the W
este
rn C
ape.
To fa
cilita
te an
d su
ppor
t ope
ratio
ns an
d th
e exp
ansio
n of
Wes
tern
Cap
e com
pani
es in
to th
e res
t of A
frica
.
Proj
ect r
isk st
atem
ent
Inhe
rent
risk
Proj
ect r
isk m
itiga
tion
Resid
ual R
isk R
atin
gIm
pact
Like
lihoo
dIm
pact
Like
lihoo
d
Perce
ption
of C
ape T
own a
s a de
stina
tion f
or
Tour
ism an
d Inv
estm
ent.
43
•En
hanc
e web
site a
nd co
llater
al ab
ility
•Re
giona
l Afric
a Stra
tegy f
or to
urism
•Re
confi
gure
for d
omes
tic as
best
poss
ible
•Re
store
Inter
natio
nal tr
avel
32
The s
ustai
nable
fund
ing of
Wes
gro
43
•Re
view
the po
ssibi
lity of
rece
iving
priva
te se
ctor f
undin
g inc
luding
inter
natio
nal d
onor
s•
Rece
iving
othe
r pub
lic se
ctor f
undin
g (div
ersif
y fun
ding)
•Ot
her g
over
nmen
t pro
ject m
anag
emen
t inco
me ar
ound
infra
struc
ture
•Co
ntinu
e to I
ncre
ase f
undin
g sou
rces –
addin
g con
tracts
with
new
funde
rs
43
Ineffe
ctive
know
ledge
reten
tion a
nd cr
oss
sellin
g3
3
•En
hanc
e cro
ss-se
lling a
nd kn
owled
ge re
tentio
n•
Deter
mine
whic
h inf
orma
tion
techn
ology
task
s run
auto
matic
ally a
nd w
hich
requ
ire a
per
son
to op
erate
and e
nsur
e add
itiona
l per
sonn
el ar
e ava
ilable
to co
ver t
hat p
ositio
n•
Imple
ment
effec
tive s
ucce
ssion
plan
ning t
hrou
gh in
terna
l staf
f dev
elopm
ent p
rojec
ts•
Maint
enan
ce of
insti
tution
al kn
owled
ge
•Ef
fectiv
e doc
umen
tation
of cl
ient e
ngag
emen
ts
32
Maint
enan
ce of
relat
ionsh
ip wi
th sta
keho
lders
/ fund
ers
32
•Re
vise
the W
esgr
o 5
year
stra
tegy
deve
loped
, in
cons
ultati
on w
ith th
e W
esgr
o ke
y fun
ders
incor
pora
ting t
he C
OVID
-19 r
espo
nse
•Cl
early
defin
ed de
tail b
ilater
al en
gage
ments
•Ad
dition
al me
chan
isms t
o be p
ut in
place
to ge
nera
te re
venu
e•
Proto
col d
ocum
ent c
urre
ntly b
eing c
reate
d and
to be
finali
sed
•Ma
nage
ment
shou
ld cle
arly
defin
e res
pons
ibiliti
es•
Conti
nued
wor
k on t
he m
anda
tes•
A re
spon
se st
rateg
y per
stak
ehold
er to
be de
velop
ed
32
Pand
emic
relat
ed ris
ks4
2
•Co
vid-1
9 sup
port
comm
unica
tion c
entre
estab
lishe
d and
main
taine
d•
Finali
se th
e re
vision
of t
he B
udge
t in
conju
nctio
n wi
th the
revis
ed a
vaila
ble fu
nding
due
to
COVI
D-19
prior
ities
•Re
vise
the W
esgr
o 5-
year
stra
tegy
deve
loped
, in
cons
ultati
on w
ith th
e W
esgr
o ke
y fun
ders
incor
pora
ting t
he C
OVID
-19 r
espo
nse
32
Digit
al Tr
ansfo
rmati
on3
3•
Incor
pora
tion o
f the I
T ris
ks in
to the
IT S
teerin
g Com
mitte
e rep
ort
Enha
nced
IT se
curity
in lin
e with
the d
igital
tran
sform
ation
21

77
3.6 Programme 6: Destination Marketing Organisation (DMO)
PurposeThe purpose of the DMO is to promote the Western Cape internationally and domestically in order to increase the number of visitors. The DMO markets the destination by focussing on business tourism (through its Convention Bureau team), tourism trade, media, influencers and marketing campaigns. By increasing the visitor numbers of leisure and business tourists to the Province, direct, indirect and induced revenue is generated for the Western Cape.
3.6.1 Programme structure
The Programme also aligns the Provincial Tourism Master Plan and the National Department of Tourism’s five-year strategy. The Programme is structured to create demand and awareness of the Western Cape as a tourism destination.
The Programme is divided into three sub-programmes:
Sub-programme 6.1: Heighten awareness of the Western Cape in key markets and sectors
• Marketing and trade promotions through partnerships in key markets.• Digital maintenance and content creation for website and social media platforms.• Business events.• Stakeholder management and engagements.
Sub-programme 6.2: Improve accessibility to Cape Town and the regions
• Air Access, through the Cape Town Air Access initiative.
Sub-programme 6.3: Enhance the attractiveness of the Cape through a competitive offering
• Sport and Adventure Tourism promotion • Culture and Heritage promotion• Food and Wine Tourism promotion• Cape of Great Events promotion• Domestic Tourism promotion
The Leisure Unit places emphasis on:• The creation of demand through marketing activities, with a key focus on domestic and international
tourism marketing campaigns.• The acquisition and generation of data and intelligence.• Collaboration with various provincial (e.g. regional and local tourism offices), national (e.g. South African
Tourism) and international (e.g. UNWTO) organisations.• Joint marketing opportunities with private sector (e.g. trade and media).

78
In growing Business Events, the Unit places emphasis on:• A well-defined and successful methodology to bidding.• Creation of demand through promotional activities such as attending trade shows (locally and
internationally).• Leveraging of international association memberships (e.g. BestCities Global Alliance and International
Congress and Convention Association).• Unique programmes and value-added offerings (e.g. Delegate boosting, networking and legacy
programme).• Focussed sector approach and cross-selling with other Wesgro Units (e.g. trade team).
The Cape Town Air Access Partnership places emphasis on:
• Airline support for route re-establishment and retention, includes various joint activities with airlines of which some will be aligned with and leveraging the DMO’s tourism marketing campaigns and activities.
• International engagements with route planners of airlines for routes at risk.• Attendance at World Routes, Routes Africa and other conferences to engage with route planners globally.• Development of air cargo to unlock air cargo services to Cape Town, including assisting freighters to
land into Cape Town International Airport (CTIA). • Unlocking barriers with regard to air cargo handling at CTIA and assisting with a business case for
necessary cargo infrastructure.
Situational analysis Tourism has been a key competitive advantage for Cape Town and the Western Cape, providing significant growth opportunities. The tourism sector is both an economic driver and a large employment generator, thus unlocking opportunities in this sector is critical for overall economic growth and job creation.
COVID-19 has seen the travel and tourism industry hardest hit, and as yet there is no understanding of the extent of the full impact on global, regional and domestic tourism. It is essential for Wesgro’s DMO to respond to the crisis in a strategic manner that will ensure that planning for recovery is underway. This will require:
• Managing the crisis though sharing reputable information timeously, while lobbying for early, safe reopening.
• Unlocking stimuli for recovery.• Preparing for a collaborative approach between government and the tourism industry for recovery.
To ensure that tourism destination marketing efforts are most impactful, there will be a focus on domestic and international marketing campaigns. These, in turn, are based on quality market research and a clearly defined competitive identity that distinguishes Cape Town and the Western Cape as a brand among so many other similar brands internationally.
The strategic positioning of the domestic and international marketing campaigns take into consideration the following:
• Implement campaigns that will position the depth and breadth of experiences available throughout Cape Town and the Western to ensure that geographic spread and seasonality issues are addressed. The campaigns will put Cape Town and the Western Cape back onto the consideration list, and inspire travel to the destination. The creative will include the destination proposition and a unique reason to believe, differentiating the destination in a cluttered marketing space.
• During this time, place campaign drive on building familiarity and awareness, which will lead to conversion as travel opens up.

79
• Given the competitive landscape and the budget, prioritise our efforts in order to get maximum ROI and impact as the online bidding space is extremely competitive.
• We will sweat the content by using the white label mechanism to enable Municipalities use the campaign collateral.
• We are strengthening partnerships and collaboration with both the private and public sector so that we can maximise our effort and spend.
• We are emphasising Trade and the Joint Marketing Agreements, so that we can account for tangible conversion with the airlines, tour operators, etc.
• We are emphasising Business Events, although it is a brief on its own, so that it can be built into the domestic and international leisure marketing efforts for added leverage and conversion from leisure to business.
International Online Digital Platforms for Tourism MarketingOur tourism promotion strategy is based on the reality that different markets and travellers in general are currently at varied stages of their travelling cycles with some markets open and some not.
Based on this, our digital strategy needs to take on a three-phased approach which is agile in nature. Firstly, we need to create and maintain awareness, by ensuring that Cape Town and the Western Cape is top of mind as the perfect antidote for a post-locked down 2020. Secondly, we will then drive consideration to those who are open and able to travel, Thirdly, this will ultimately lead to generating conversion out of this engaged audience.
Digital channel selection will be market dependent, and it will be geared mainly towards the preferred channels of the targeted countries; this may include Facebook and YouTube, with inclusion of IG for awareness in particular. This will be supported by in-market partnerships, including strategic media, print and radio. Conversion is market-dependent, but the platform will include incremental demand and direct bookings. Due to uncertainty with regard to travel and the opening up of markets, we have positioned the familiarity and awareness build components over a longer timeframe, however, still leading to conversion in the targeted key source markets.

80
To promote the Western Cape as the leading business events destination on the African continent, the following key activities take place:
• Promoting local knowledge economy, by encouraging academics, scientists and thought leaders of the Western Cape to bid for business events aligned to priority economic growth sectors – aligned to LEAD programme. Focus on legacy impacts of events.
• Creating demand, by implementing joint lead development projects with key private sector, public sector and internal stakeholders, to drive forward bookings and regional spread of meetings.
• Driving marketing campaigns to strengthen the destination position as being leaders within the business events sector on the continent (editorial positioning, online marketing, content development).
• Promoting bureau services (pre and post bid assistance, marketing support and delegate boosting).• Alignment to international and domestic industry associations (BestCities Global Alliance, ICCE, SITE,
SAACI etc.) to drive thought leadership and provide a platform for education within the business events sector.
• Leveraging available research and data collection tools to increase market competitiveness.
To drive and promote Air Access, the following key activities take place:
• Leverage partnerships with airlines that are able to fly and have connectivity to Cape Town, including strategic collateral building in partnership with airlines and dependent on airline distribution channels that exist.
• Route Support is necessary to support airlines through international marketing initiatives, all of which will be jointly executed or in partnership with the relevant airline. The support will be provided by the aviation liaison to bolster the position of Cape Town and the Western Cape as a destination of choice for returning airlines (or even new airlines wishing to take over a route). It will provide the necessary marketing support to assist Wesgro to undertake bespoke international marketing activities with the airline(s) in order to boost awareness and achieve higher load factors and in so doing secure the route for the coming years. The value chain from awareness through to conversation is critical for the recovery of tourism and the airlines play an invaluable role in this value chain.

81
• The marketing initiatives can vary greatly and can also be very targeted to the specific traveller or market flying with the particular airline. Thus, leveraging partnerships with the airlines are likely to be even more targeted and focused with a higher rate of conversation. Furthermore, the support is intended to sweat the funds that the airlines are already spending on marketing and in so doing have an even deeper impact collectively than simply undertaking individual marketing initiatives.
• The marketing initiatives, in partnership with the airlines, will also allow Wesgro to bring in other partners in the local tourism economy, from hotels through to attractions, to make the value proposition even more compelling whilst at the same time supporting the local tourism economy.
SectorsPriority is given to business events (e.g. corporate meetings, conferences and exhibitions), which focus on sectors that align with the Western Cape Government and Wesgro’s strategic approach:
• Manufacturing• Agri-processing• Tourism• Oceans Economy• BPO and ICT• Creative Industries
Markets
Priority is given to markets that focus on the Province’s key source markets (these drive volume), emerging markets (these show potential to grow during our low season of April-September) and our tactical markets (high value tourists). Emphasis is placed on markets where South African Tourism has a presence and provides on-the-ground marketing support to Wesgro through joint marketing initiatives and hosting opportunities.
3.6.2 Strategic outcomes
Strategic outcomeStrategic Outcome Enhance the attractiveness, awareness and accessibility of the of region and drive conversion.
Outcome statement To market Cape Town and the Western Cape and support tourism destination marketing initiatives with an estimated economic value of R2,65 billion – R4,24billion.
Baseline An estimated value of R935,63 million was generated from tourism initiatives supported for the 2019/20 financial year.
Justification Wesgro’s strategic mandate is to conduct tourism marketing and promotion for Cape Town and the Western Cape.
Links The objective is linked to VIP 2: Economy and jobs, and the strategic plan of the Department of Economic Development and Tourism.

82
3.6.3
Ou
tcom
es, P
erfo
rman
ce In
dica
tors
and
Targ
ets 2
021/2
2
NoOu
tcom
eOu
tput
sOu
tput
Indi
cato
rs
Annu
al Ta
rget
sAu
dite
d/Ac
tual
Perfo
rman
ceEs
timat
ed
Perfo
rman
ce20
20/21
MTEF
Per
iod
2017
/1820
18/19
2019
/2020
21/22
2022
/2320
23/24
6.1To
tal es
timate
d eco
nomi
c va
lue of
tour
ism
desti
natio
n mar
ketin
g ini
tiativ
es su
ppor
ted
Tour
ism m
arke
ting
initia
tives
supp
orted
Numb
er of
tour
ism
desti
natio
n mar
ketin
g ini
tiativ
es su
ppor
ted
3234
4634
1536
38
Joint
mar
ketin
g ag
reem
ents
secu
red
Numb
er of
joint
mar
ketin
g ag
reem
ents
secu
red
1519
2625
1527
29
Leisu
re ev
ents
supp
orted
Numb
er of
leisu
re ev
ents
supp
orted
5150
4952
3554
56
Bids
secu
red
Numb
er of
bids
secu
red
3330
5232
1534
35
Indi
cato
rs, A
nnua
l and
Qua
rterly
Targ
ets 2
021/2
2 (Ou
tput
indi
cato
rs)
No.
Outp
ut In
dica
tors
Annu
al Ta
rget
Q1Q2
Q3Q4
6.1.1
Numb
er of
tour
ism de
stina
tion m
arke
ting i
nitiat
ives s
uppo
rted
15-
--
156.1
.2Nu
mber
of jo
int m
arke
ting a
gree
ments
secu
red
15-
---
156.1
.3Nu
mber
of le
isure
even
ts su
ppor
ted35
510
1010
6.1.4
Numb
er of
bids
secu
red
154
54
2

83
3.6.4 Explanation of planned performance over the medium-term period
The planned performance of the Programme is to develop future demand for the destination by delivering on:
• Tourism destination marketing initiatives supported.• Air access initiatives supported.• Joint marketing agreements.• Leisure events supported.• Bids secured.
The outcome of the planned performance is the total estimated economic value of tourism destination marketing initiatives supported.
3.6.5 Reconciling performance targets with the budget and MTEF
Summary of payments and estimates: Programme 6: Destination Marketing
Sub-programme R’000
Outcome Estimated outcome
Medium-term estimate
Audited Audited Audited
2017/18 2018/19 2019/20 2020/21 2021/22 2022/23 2023/241. Organisational Support 10 657 10 987 11 667 12 632 12 915 13 656 13 8532. Integrated Marketing 7 124 6 794 7 359 49 680 10 047 9 307 9 812
DMO Programme 35 436 35 432 39 335
Total payments and estimates 17 781 17 781 19 026 62 312 58 398 58 395 63 000
Summary of provincial payments and estimates by economic classification: Programme 6: Destination Marketing Organisation
Economic classification R’000
Outcome Estimated outcome
Medium-term estimate
Audited Audited Audited
2017/18 2018/19 2019/20 2020/21 2021/22 2022/23 2023/24
Expenses
Current expense 17 781 17 369 19 026 62 312 58 398 58 395 63 000 Compensation of employees 13 871 14 317 15 627 21 182 21 784 22 999 24 223
Salary & Wages 13 378 13 812 13 790 18 500 17 777 19 792 21 135 Basic salary 12 729 13 079 13 081 17 709 17 777 19 792 21 135 Performance rewards 649 733 709 791 Other non-pensionable allowances
Social Contributions (employer contributions only) 493 505 1 837 2 682 4 007 3 207 3 088 Pension 339 334 1 538 2 281 3 513 2 703 2 584 Medical 104 117 246 335 426 438 438 UIF 50 54 53 66 68 66 66 Salary related expenses
Use of goods and services 3 910 3 052 3 399 41 130 36 614 35 396 38 777 Advertising 25 15 744 16 535 16 052 17 297
Advertising of posts 25 Gifts and Promotional items Advertising (marketing) 15 744 16 745 16 052 17 297
Audit Fees 124 520 1 034 1 050 Internal 400 696 402 External 124 120 338 648
Bank charges 51 Board Costs
Board - Remuneration Board - Subsistence Bursaries (employees) Catering services 25

84
Communication 317 487 Telephone 316 487 Cellphones 1
Postage & Courier Other Computer services 384
SITA services External service providers 384
Consultants, contractors and special services 1 034 700 20 966 14 697 14 932 16 645 Consultants 417 400 9 835 7 465 7 414 6 214 Contractors and special services 617 300 11 131 7 232 7 518 10 431 General Expenses 617 300 Conference Expenditure 4 420 3 420 3 140 5 038 Photographic services
Venues and facilities Agency Administrative and Support Staff 6 711 3 812 4 378 5 393 Other special services
Entertainment Equipment less than Capitalisation threshold
Inventory 70 381 481 369 474 Consumables Fuel, oil and gas 24
Stationery and printing 40 Subscriptions 6 381 481 369 474
Other Legal fees 98
Losses / (Profits) 1 Losses due to Fraud On Sale of Assets 1 Forex
Other Maintenance and repairs 114
Buildings 101 Equipment 13 Operating leases 1 617 1 808 1 878 1 846 1 556 1 850 2 168 Rent-buildings 1 617 1 808 1 878 1 846 1 556 1 850 2 168 Rent-equipment Other
Printing and publication Professional bodies and membership fees
Travel and Subsistence 2 193 2 295 2 193 2 193 Air Travel - Air Tickets ( Domestic) 333 433 333 333 Air Travel - Air Tickets ( International) 990 990 990 990 Accommodation - Domestic 50 52 50 50 Accommodation - International 600 600 600 600 Other 220 220 220 220 Training and staff development 50 24
Depreciation and amortisation 412
Computer equipment 76
Furniture and Office equipment 91
Other Machinery and equipment 49
Transport Assets 101
Computer Software 95
Total expenses 17 781 17 781 19 026 62 312 58 398 58 395 63 000

85
3.6.6
Pe
rform
ance
and
expe
nditu
re tr
ends
With
the a
dopti
on of
the n
ew N
ation
al an
d Pro
vincia
l Tou
rism
Stra
tegy,
the Ag
ency
has a
ligne
d itse
lf to t
he ov
erall
outco
mes t
here
of. Ad
dition
al inc
ome h
as be
en al
locate
d to
ensu
re th
at the
Unit
is ab
le to
achie
ve its
man
date
and s
ucce
ssful
ly dr
ive th
e new
stra
tegy.
3.6.7
Ke
y risk
s
Proj
ect o
bjec
tive:
To p
rom
ote a
nd fa
cilita
te g
loba
l exp
orts
of g
oods
and
serv
ices f
rom
qua
lified
com
pani
es in
the W
este
rn C
ape.
To fa
cilita
te an
d su
ppor
t ope
ratio
ns an
d th
e exp
ansio
n of
Wes
tern
Cap
e com
pani
es in
to th
e res
t of A
frica
.
Proj
ect r
isk st
atem
ent
Inhe
rent
risk
Proj
ect r
isk m
itiga
tion
Resid
ual R
isk R
atin
gIm
pact
Like
lihoo
dIm
pact
Like
lihoo
d
Perce
ption
of C
ape T
own a
s a de
stina
tion f
or
Tour
ism an
d Inv
estm
ent.
43
•En
hanc
e web
site a
nd co
llater
al ab
ility
•Re
giona
l Afric
a Stra
tegy f
or to
urism
•Re
confi
gure
for d
omes
tic as
best
poss
ible
•Re
store
Inter
natio
nal tr
avel
32
The s
ustai
nable
fund
ing of
Wes
gro
43
•Re
view
the po
ssibi
lity of
rece
iving
priva
te se
ctor f
undin
g inc
luding
inter
natio
nal d
onor
s•
Rece
iving
othe
r pub
lic se
ctor f
undin
g (div
ersif
y fun
ding)
•Ot
her g
over
nmen
t pro
ject m
anag
emen
t inco
me ar
ound
infra
struc
ture
•Co
ntinu
e to I
ncre
ase f
undin
g sou
rces –
addin
g con
tracts
with
new
funde
rs
43
Ineffe
ctive
know
ledge
reten
tion a
nd cr
oss
sellin
g3
3
•En
hanc
e cro
ss-se
lling a
nd kn
owled
ge re
tentio
n•
Deter
mine
whic
h inf
orma
tion
techn
ology
task
s run
auto
matic
ally a
nd w
hich
requ
ire a
per
son
to op
erate
and e
nsur
e add
itiona
l per
sonn
el ar
e ava
ilable
to co
ver t
hat p
ositio
n•
Imple
ment
effec
tive s
ucce
ssion
plan
ning t
hrou
gh in
terna
l staf
f dev
elopm
ent p
rojec
ts•
Maint
enan
ce of
insti
tution
al kn
owled
ge
•Ef
fectiv
e doc
umen
tation
of cl
ient e
ngag
emen
ts
32
Maint
enan
ce of
relat
ionsh
ip wi
th sta
keho
lders
/ fund
ers
32
•Re
vise
the W
esgr
o 5
year
stra
tegy
deve
loped
, in
cons
ultati
on w
ith th
e W
esgr
o ke
y fun
ders
incor
pora
ting t
he C
OVID
-19 r
espo
nse
•Cl
early
defin
ed de
tail b
ilater
al en
gage
ments
•Ad
dition
al me
chan
isms t
o be p
ut in
place
to ge
nera
te re
venu
e•
Proto
col d
ocum
ent c
urre
ntly b
eing c
reate
d and
to be
finali
sed
•Ma
nage
ment
shou
ld cle
arly
defin
e res
pons
ibiliti
es•
Conti
nued
wor
k on t
he m
anda
tes•
A re
spon
se st
rateg
y per
stak
ehold
er to
be de
velop
ed
32
Pand
emic
relat
ed ris
ks4
2
•Co
vid-1
9 sup
port
comm
unica
tion c
entre
estab
lishe
d and
main
taine
d•
Finali
se th
e re
vision
of t
he B
udge
t in
conju
nctio
n wi
th the
revis
ed a
vaila
ble fu
nding
due
to
COVI
D-19
prior
ities
•Re
vise
the W
esgr
o 5-
year
stra
tegy
deve
loped
, in
cons
ultati
on w
ith th
e W
esgr
o ke
y fun
ders
incor
pora
ting t
he C
OVID
-19 r
espo
nse
32
Digit
al Tr
ansfo
rmati
on3
3•
Incor
pora
tion o
f the I
T ris
ks in
to the
IT S
teerin
g Com
mitte
e rep
ort
Enha
nced
IT se
curity
in lin
e with
the d
igital
tran
sform
ation
21

86
3.7 Programme 7: Film and Media Promotion
PurposeEstablish a globally competitive film sector in Cape Town and the Western Cape.
3.7.1 Programme structure
The Film and Media Promotion Unit represents the City of Cape Town and Western Cape region as a film location at annual film and media markets such as the established major market events attached to festivals at Annecy, Berlin, Cannes, South By South West (SXSW) and Toronto, and for the emerging BRICS areas at the Rio Content Market, Beijing and Hong Kong markets.
Supporting outward missions in collaboration with partners to activate the exporter growth of companies in the Western Cape has been identified as an important intervention for the next five years. The support of the businesses going on these outward-led missions is combined from a number of sources, including the National Film and Video Foundation (NFVF), the DTI and its EMIA and SAAS schemes, and/or from the foreign markets, festivals and governments that invite the Cape Town and Western Cape film industry to participate in their festivals and markets as experts and participants.
Programmes for film and media are run in collaboration with national and regional partners. These programmes assist participants to be more internationally competitive and facilitate new business opportunities and qualified leads in markets outside of South Africa and the Western Cape. These include NFVF, the DTI and national partners from industry such as the Independent Producers Organisation, Writers Guild of South Africa, Animation South Africa, Make Games South Africa, Interactive Entertainment South Africa, Documentary Filmmaker Association, Writers Guild of South Africa, Commercials Producers Association and South African Association of Stills Producers.
Inward missions activate film and media companies through business-to-business meetings and hosting familiarisation tours. The inbound missions lead to new contracts, the expansion of prospects for company growth and help the development of markets. Business-to-business activations are included around film, animation and new media – areas that should bring job growth.
Situational analysisIn order to develop a competitive film sector within the Province, there is a need to focus on:
• drive locations marketing;• specific markets attached to festivals such as Annecy, Berlin, and Cannes and emerging BRICS
countries; • host inward missions to activate film and medial companies; • host the exporter advancement programme; • continuation of the expansion of the Western Cape E-asset register to all five regions; • conduct strategic research; and• running ad hoc training opportunities as required, such as the EG Locations Summit.
A number of inward missions could possibly be in person, but this may continue to be virtual such as the virtual attendance of the countries producers at the 2020 Encounters International Documentary Film Festival and Silwerskermfes. The Unit will participate in the physical film festivals, however, virtual participation on international platforms will most likely continue and includes virtual stands. There is also an expansion plan to the E-register booklet and locations manual website.
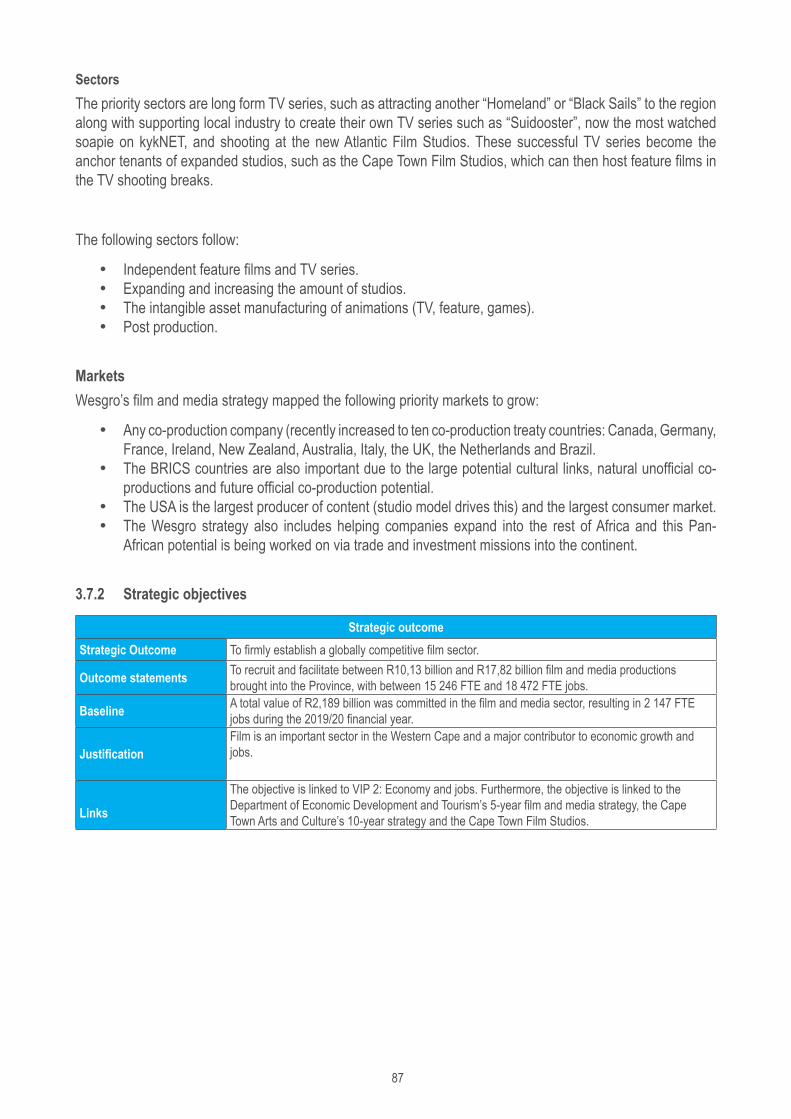
87
SectorsThe priority sectors are long form TV series, such as attracting another “Homeland” or “Black Sails” to the region along with supporting local industry to create their own TV series such as “Suidooster”, now the most watched soapie on kykNET, and shooting at the new Atlantic Film Studios. These successful TV series become the anchor tenants of expanded studios, such as the Cape Town Film Studios, which can then host feature films in the TV shooting breaks.
The following sectors follow:
• Independent feature films and TV series.• Expanding and increasing the amount of studios.• The intangible asset manufacturing of animations (TV, feature, games).• Post production.
MarketsWesgro’s film and media strategy mapped the following priority markets to grow:
• Any co-production company (recently increased to ten co-production treaty countries: Canada, Germany, France, Ireland, New Zealand, Australia, Italy, the UK, the Netherlands and Brazil.
• The BRICS countries are also important due to the large potential cultural links, natural unofficial co-productions and future official co-production potential.
• The USA is the largest producer of content (studio model drives this) and the largest consumer market. • The Wesgro strategy also includes helping companies expand into the rest of Africa and this Pan-
African potential is being worked on via trade and investment missions into the continent.
3.7.2 Strategic objectives
Strategic outcomeStrategic Outcome To firmly establish a globally competitive film sector.
Outcome statements To recruit and facilitate between R10,13 billion and R17,82 billion film and media productions brought into the Province, with between 15 246 FTE and 18 472 FTE jobs.
Baseline A total value of R2,189 billion was committed in the film and media sector, resulting in 2 147 FTE jobs during the 2019/20 financial year.
JustificationFilm is an important sector in the Western Cape and a major contributor to economic growth and jobs.
Links
The objective is linked to VIP 2: Economy and jobs. Furthermore, the objective is linked to the Department of Economic Development and Tourism’s 5-year film and media strategy, the Cape Town Arts and Culture’s 10-year strategy and the Cape Town Film Studios.

88
3.7.3
Ou
tcom
es, O
utpu
ts, P
erfo
rman
ce In
dica
tors
and
Targ
ets 2
021/2
2
NoOu
tcom
eOu
tput
sOu
tput
Indi
cato
rs
Annu
al Ta
rget
sAu
dite
d /A
ctua
l Per
form
ance
Estim
ated
Pe
rform
ance
2020
/21
MTEF
Per
iod
2017
/1820
18/19
2019
/2020
21/22
2022
/2320
23/24
7.1Ra
nd va
lue of
film
and m
edia
prod
uctio
ns br
ough
t into
the
Prov
ince
Film
and m
edia
decla
ratio
ns si
gned
Numb
er of
film
and
media
decla
ratio
ns
signe
d 9
55
5-7
2-5
5-7
5-7
7.2Nu
mber
of jo
bs fa
cilita
ted
throu
gh th
e pro
ducti
ons b
roug
ht int
o the
Pro
vince
Indi
cato
rs, A
nnua
l and
Qua
rterly
Targ
ets 2
021/2
2 (Ou
tput
indi
cato
rs):
No.
Outp
ut In
dica
tors
Annu
al Ta
rget
Q1Q2
Q3Q4
7.1Nu
mber
of fil
m an
d med
ia de
clara
tions
sign
ed
2-5
--
-2-
5

89
3.7.4 Explanation of planned performance over the medium-term period
Through attending international events – physical or virtual – at overseas festivals and markets such as Cannes or Annecy in France, Berlinale in Germany, Toronto in Canada, and SXSW in Austin, USA, Wesgro helps grow recognition for Cape Town and the Western Cape as having viable service offerings for international productions. These are major events which all 10 co-production countries’ producers attend, including the BRICS and African producers. Wesgro’s Film and Media promotion support for local Export Advancement Programmes and Business-to-Business events in the Western Cape adds to that attraction, and helps strengthen the relationships between industry producers and international partners. Together these helps to bring production spend to the Western Cape. Having an office staffed with two certified African Film Commissioners helps to resolve issues of red tape and manage expectations of industry.

90
3.7.5
Ke
y risk
s
Proj
ect o
bjec
tive:
To p
rom
ote a
nd fa
cilita
te g
loba
l exp
orts
of g
oods
and
serv
ices f
rom
qua
lified
com
pani
es in
the W
este
rn C
ape.
To fa
cilita
te an
d su
ppor
t ope
ratio
ns an
d th
e exp
ansio
n of
Wes
tern
Cap
e com
pani
es in
to th
e res
t of A
frica
.
Proj
ect r
isk st
atem
ent
Inhe
rent
risk
Proj
ect r
isk m
itiga
tion
Resid
ual R
isk R
atin
gIm
pact
Like
lihoo
dIm
pact
Like
lihoo
d
Perce
ption
of C
ape T
own a
s a de
stina
tion f
or
Tour
ism an
d Inv
estm
ent.
43
•En
hanc
e web
site a
nd co
llater
al ab
ility
•Re
giona
l Afric
a Stra
tegy f
or to
urism
•Re
confi
gure
for d
omes
tic as
best
poss
ible
•Re
store
Inter
natio
nal tr
avel
32
The s
ustai
nable
fund
ing of
Wes
gro
43
•Re
view
the po
ssibi
lity of
rece
iving
priva
te se
ctor f
undin
g inc
luding
inter
natio
nal d
onor
s•
Rece
iving
othe
r pub
lic se
ctor f
undin
g (div
ersif
y fun
ding)
•Ot
her g
over
nmen
t pro
ject m
anag
emen
t inco
me ar
ound
infra
struc
ture
•Co
ntinu
e to I
ncre
ase f
undin
g sou
rces –
addin
g con
tracts
with
new
funde
rs
43
Ineffe
ctive
know
ledge
reten
tion a
nd cr
oss
sellin
g3
3
•En
hanc
e cro
ss-se
lling a
nd kn
owled
ge re
tentio
n•
Deter
mine
whic
h inf
orma
tion
techn
ology
task
s run
auto
matic
ally a
nd w
hich
requ
ire a
per
son
to op
erate
and e
nsur
e add
itiona
l per
sonn
el ar
e ava
ilable
to co
ver t
hat p
ositio
n•
Imple
ment
effec
tive s
ucce
ssion
plan
ning t
hrou
gh in
terna
l staf
f dev
elopm
ent p
rojec
ts•
Maint
enan
ce of
insti
tution
al kn
owled
ge
•Ef
fectiv
e doc
umen
tation
of cl
ient e
ngag
emen
ts
32
Maint
enan
ce of
relat
ionsh
ip wi
th sta
keho
lders
/ fund
ers
32
•Re
vise
the W
esgr
o 5
year
stra
tegy
deve
loped
, in
cons
ultati
on w
ith th
e W
esgr
o ke
y fun
ders
incor
pora
ting t
he C
OVID
-19 r
espo
nse
•Cl
early
defin
ed de
tail b
ilater
al en
gage
ments
•Ad
dition
al me
chan
isms t
o be p
ut in
place
to ge
nera
te re
venu
e•
Proto
col d
ocum
ent c
urre
ntly b
eing c
reate
d and
to be
finali
sed
•Ma
nage
ment
shou
ld cle
arly
defin
e res
pons
ibiliti
es•
Conti
nued
wor
k on t
he m
anda
tes•
A re
spon
se st
rateg
y per
stak
ehold
er to
be de
velop
ed
32
Pand
emic
relat
ed ris
ks4
2
•Co
vid-1
9 sup
port
comm
unica
tion c
entre
estab
lishe
d and
main
taine
d•
Finali
se th
e re
vision
of t
he B
udge
t in
conju
nctio
n wi
th the
revis
ed a
vaila
ble fu
nding
due
to
COVI
D-19
prior
ities
•Re
vise
the W
esgr
o 5-
year
stra
tegy
deve
loped
, in
cons
ultati
on w
ith th
e W
esgr
o ke
y fun
ders
incor
pora
ting t
he C
OVID
-19 r
espo
nse
32
Digit
al Tr
ansfo
rmati
on3
3•
Incor
pora
tion o
f the I
T ris
ks in
to the
IT S
teerin
g Com
mitte
e rep
ort
Enha
nced
IT se
curity
in lin
e with
the d
igital
tran
sform
ation
21

91
Val de Vie
Part D: Technical performance
indicator descriptions

92
Paarden Eiland Engineering

93
Part D: Technical performance
indicator descriptions
4. Part D: Technical performance indicator descriptions
4.1 Programme 1: Corporate ServicesStrategic outcome: Enhance financial accountability through compliance with all prescribed financial and non-financial regulations and guidelines
Indicator number 1.1Indicator title Positive financial viability assessment results.
Short definition To determine the viability of the Agency’s financial systems, and the efficacy of the internal controls.
Purpose To ensure compliance with the relevant financial legislation.
Strategic link VIP #5Focus Area(s): Good governance transformation
Output(s):Strengthening and maintaining governance and accountability.Strengthening and maintaining oversight.
Intervention(s):
Source of data Financial discipline report provided by internal auditors.
Method of calculation The financial viability rating is determined by a financial discipline assessment conducted by the internal auditors.
Data limitations N/A
Type of indicator
Input: Activities: Output: x Outcome:
Service Delivery Indicator:Direct Service Delivery:Indirect Service Delivery: x
Demand Driven Indicator:Yes, demand driven: No, not demand driven: x
Calculation type Cumulative Year-end: Cumulative Year-to-date: Non-cumulative: x
Reporting cycle Quarterly: Bi-annually: Annually: x Biennially:Desired performance Higher than target: On target: x Lower than target:Indicator responsibility Financial controllerSpatial transformation (where applicable) N/A
Disaggregation of beneficiaries (where applicable)
Target for women: N/ATarget for youth: N/ATarget for people with disabilities: N/A
Assumptions N/AMeans of verification Financial discipline report provided by internal auditors.

94
Sub-programme 1.1: Financial managementIndicator number 1.2Indicator title Percentage achievement of annual budgeted operational expenditure.
Short definition To demonstrate the percentage of budget spent by the Agency in relation to the appropriated amount.
Purpose To enhance effective expenditure management.
Strategic link VIP #5Focus Area(s): Good governance transformation
Output(s):Strengthening and maintaining governance and accountability.Strengthening and maintaining oversight.
Intervention(s):
Source of data Expenditure reports from the accounting system. Method of calculation Total actual expenditure over the total budget divided by the total budget. Data limitations N/A
Type of indicator
Input: Activities: Output: x Outcome:
Service Delivery Indicator:Direct Service Delivery:Indirect Service Delivery: x
Demand Driven Indicator:Yes, demand driven: No, not demand driven: x
Calculation type Cumulative Year-end: Cumulative Year-to-date: Non-cumulative: x
Reporting cycle Quarterly: Bi-annually: Annually: x Biennially:Desired performance Higher than target: On target: x Lower than target:Indicator responsibility Financial controllerSpatial transformation (where applicable) N/A
Disaggregation of beneficiaries (where applicable)
Target for women: N/ATarget for youth: N/ATarget for people with disabilities: N/A
Assumptions N/AMeans of verification Expenditure reports from the accounting system used.

95
Sub-programme 1.2: Supply Chain ManagementIndicator number 1.3Indicator title Achieve maximum B-BBEE spend.
Short definition To demonstrate the percentage of budget spent by the Agency in relation to the appropriated amount.
Purpose
Strategic link VIP #5Focus Area(s): Good governance transformation
Output(s):Strengthening and maintaining governance and accountability.Strengthening and maintaining oversight.
Intervention(s):
Source of data Expenditure reports from the accounting system. Method of calculation Total actual expenditure over the total budget divided by the total budget. Data limitations N/A
Type of indicator
Input: Activities: Output: x Outcome:
Service Delivery Indicator:Direct Service Delivery:Indirect Service Delivery: x
Demand Driven Indicator:Yes, demand driven: No, not demand driven: x
Calculation type Cumulative Year-end: Cumulative Year-to-date: Non-cumulative: x
Reporting cycle Quarterly: Bi-annually: Annually: x Biennially:Desired performance Higher than target: On target: x Lower than target:Indicator responsibility SCM ManagerSpatial transformation (where applicable) N/A
Disaggregation of beneficiaries (where applicable)
Target for women: YesTarget for youth: YesTarget for people with disabilities: Yes
AssumptionsMeans of verification Expenditure reports from the accounting system used.

96
Sub-programme 1.2: Supply Chain ManagementIndicator number 1.4Indicator title Percentage B-BBEE spend on black owned suppliers.
Short definition To support PDIs, black woman and black men by means of procurement through EMEs and QSEs in conjunction with the B-BBEE Act.
Purpose
Economically supporting the PDIs will improve the Wesgro rating according to the B-BBEE act and official reporting lines. Wesgro as a governmental public entity needs to lead by example in implementing the B-BBEE act. This forms part of the improvement and upliftment of lives of citizens in the community.
Strategic link VIP #5Focus Area(s): Good governance transformation
Output(s):Strengthening and maintaining governance and accountability.Strengthening and maintaining oversight.
Intervention(s):
Source of data Comprehensive supplier scheduleMethod of calculation Total actual spend over total budget divided by the total budget.Data limitations Limited supplier information
Type of indicator
Input: Activities: Output: x Outcome:
Service Delivery Indicator:Direct Service Delivery:Indirect Service Delivery: x
Demand Driven Indicator:Yes, demand driven: No, not demand driven: x
Calculation type Cumulative Year-end: Cumulative Year-to-date: Non-cumulative: x
Reporting cycle Quarterly: Biannually: Annually: x Biennially:Desired performance Higher than target: On target: x Lower than target:Indicator responsibility SCM ManagerSpatial transformation (where applicable) N/A
Disaggregation of beneficiaries (where applicable)
Target for women: YesTarget for youth: YesTarget for people with disabilities: Yes
Assumptions N/AMeans of verification Comprehensive supplier schedule.

97
Sub-programme 1.2: Supply Chain ManagementIndicator number 1.5Indicator title Percentage payment deviation from awarded contracts.Short definition To monitor the adherence to contractual obligations of awarded contracts. Purpose To ensure the effective management of awarded contracts.
Strategic link VIP #5Focus Area(s): Good governance transformation
Output(s):Strengthening and maintaining governance and accountability.Strengthening and maintaining oversight.
Intervention(s):
Source of data Comprehensive SCM payment scheduleMethod of calculation The percentage is generated by the accounting system. Data limitations N/A
Type of indicator
Input: Activities: Output: Outcome:
Service Delivery Indicator:Direct Service Delivery:Indirect Service Delivery: x
Demand Driven Indicator:Yes, demand driven: No, not demand driven: x
Calculation type Cumulative Year-end: Cumulative Year-to-date: Non-cumulative: x
Reporting cycle Quarterly: Bi-annually: Annually: x Biennially:Desired performance Higher than target: On target: x Lower than target:Indicator responsibility SCM ManagerSpatial transformation (where applicable) N/A
Disaggregation of beneficiaries (where applicable)
Target for women: YesTarget for youth: YesTarget for people with disabilities: Yes
Assumptions NAMeans of verification Comprehensive SCM payment schedule

98
Sub-programme 1.2: Supply Chain ManagementIndicator number 1.6Indicator title Submission of the annual procurement plan.Short definition The submission of the annual procurement plan as legislatively required.Purpose To ensure compliance to all legislation pertaining to SCM.
Strategic link VIP #5Focus Area(s): Good governance transformation
Output(s):Strengthening and maintaining governance and accountability.Strengthening and maintaining oversight.
Intervention(s): N/A
Source of data Acknowledgement of receipt for submission of procurement plan.
Method of calculation NA
Data limitations N/A
Type of indicator
Input: Activities: Output: x Outcome:
Service Delivery Indicator:Direct Service Delivery:Indirect Service Delivery: x
Demand Driven Indicator:Yes, demand driven: No, not demand driven: x
Calculation type Cumulative Year-end: Cumulative Year-to-date: Non-cumulative: x
Reporting cycle Quarterly: Bi-annually: Annually: x Biennially:Desired performance Higher than target: On target: x Lower than target:Indicator responsibility SCM ManagerSpatial transformation (where applicable) N/A
Disaggregation of beneficiaries (where applicable)
Target for women: YesTarget for youth: YesTarget for people with disabilities: Yes
Assumptions NAMeans of verification Acknowledgement of receipt for submission of procurement plan.

99
Sub-programme 1.3: IT and Administration ServicesIndicator number 1.7Indicator title Number of reports evidencing the maintenance of the Agency’s ICT environment.
Short definition To ensure that the network, internet and shared drive is stable to avoid downtime on the network.
Purpose To ensure a high level of productivity and performance is maintained.
Strategic link VIP #5Focus Area(s): Good governance transformation
Output(s):Strengthening and maintaining governance and accountability.Strengthening and maintaining oversight.
Intervention(s): N/A
Source of data Comprehensive signed quarterly report providing an overview of the status of the Agency’s ICT environment.
Method of calculation The number of ICT reports submitted each quarter is added to determine the total number of reports submitted for the year.
Data limitations N/A
Type of indicator
Input: Activities: Output:x Outcome:
Service Delivery Indicator:Direct Service Delivery:Indirect Service Delivery: x
Demand Driven Indicator:Yes, demand driven: No, not demand driven: x
Calculation type Cumulative Year-end: Cumulative Year-to-date: Non-cumulative: x
Reporting cycle Quarterly: Bi-annually: Annually: x Biennially:Desired performance Higher than target: On target: x Lower than target:Indicator responsibility Senior manager ITSpatial transformation (where applicable) N/A
Disaggregation of beneficiaries (where applicable)
Target for women: YesTarget for youth: YesTarget for people with disabilities: Yes
Assumptions NA
Means of verification Comprehensive signed quarterly report providing an overview of the status of the Agency’s ICT environment.

100
Sub-programme 1.4: Human Resource ManagementIndicator number 1.8Indicator title Percentage employee satisfaction
Short definition To monitor staff morale and implement the necessary strategies to ensure that employees remain motivated and performance driven.
Purpose To enhance employee satisfaction.
Strategic link VIP #5Focus Area(s): Citizen-centric culture
Output(s):Integrated employee engagement, organisation culture and citizen satisfaction index
Intervention(s): N/A
Source of data Internal climate survey report, signed by the Chief Executive Officer.Method of calculation The results are derived from the surveys conducted.Data limitations Staff not completing surveys as requested.
Type of indicator
Input: Activities: Output: x Outcome:
Service Delivery Indicator:Direct Service Delivery:Indirect Service Delivery: x
Demand Driven Indicator:Yes, demand driven: No, not demand driven: x
Calculation type Cumulative Year-end: Cumulative Year-to-date: Non-cumulative: x
Reporting cycle Quarterly: Bi-annually: Annually: x Biennially:Desired performance Higher than target: On target: x Lower than target:Indicator responsibility HR ManagerSpatial transformation (where applicable) N/A
Disaggregation of beneficiaries (where applicable)
Target for women: N/ATarget for youth: N/ATarget for people with disabilities: N/A
Assumptions N/AMeans of verification Internal climate survey report, signed by the Chief Executive Officer.

101
Sub-programme 1.4: Human Resource ManagementIndicator number 1.9
Indicator title Percentage of annual total salary cost spent on staff training and internship opportunities.
Short definition To monitor training and development of staff.
Purpose To ensure the work-skills plan is being implemented.
Strategic link
VIP #5 Focus Area(s): Citizen-centric culture
Output(s):Integrated employee engagement, organisation culture and citizen satisfaction index
Intervention(s): N/A
Source of data Comprehensive training schedule
Method of calculation The total expenditure over the total budget allocated.
Data limitations Budgetary constraints
Type of indicator
Input: Activities: Output: x Outcome:Service Delivery Indicator: Direct Service Delivery:
Indirect Service Delivery: xDemand Driven Indicator: Yes, demand driven:
No, not demand driven: x
Calculation type Cumulative Year-end:
Cumulative Year-to-date: Non-cumulative: x
Reporting cycle Quarterly: Bi-annually: Annually: x Biennially:
Desired performance Higher than target: On target: x Lower than target:
Indicator responsibility HR ManagerSpatial transformation (where applicable) N/A
Disaggregation of beneficiaries (where applicable)
Target for women: N/ATarget for youth: N/ATarget for people with disabilities: N/A
Assumptions N/AMeans of verification Comprehensive training schedule

102
Sub-programme 1.4: Human Resource ManagementIndicator number 1.10
Indicator title Percentage of people from the employment equity target groups employed in compliance with the entity’s approved EE plan.
Short definition To ensure that the Agency reflects the demographic framework of the Province.
Purpose To monitor the implementation of the EE plan to ensure that we meet the required legislative standards.
Strategic link
VIP #5 Focus Area(s): Citizen-centric culture
Output(s):Integrated employee engagement, organisation culture and citizen satisfaction index
Intervention(s): N/A
Source of data Employment Equity report generated from the employee self-service system.
Method of calculation Percentage generated from the employee satisfaction system.
Data limitations N\A
Type of indicator
Input: Activities: Output:x Outcome:Service Delivery Indicator: Direct Service Delivery:
Indirect Service Delivery: xDemand Driven Indicator: Yes, demand driven:
No, not demand driven: x
Calculation type Cumulative Year-end:
Cumulative Year-to-date: Non-cumulative: x
Reporting cycle Quarterly: Bi-annually: Annually: x Biennially:
Desired performance Higher than target: On target: x Lower than target:
Indicator responsibility HR ManagerSpatial transformation (where applicable) N/A
Disaggregation of beneficiaries (where applicable)
Target for women: YesTarget for youth: YesTarget for people with disabilities: Yes
Assumptions N/AMeans of verification Comprehensive training schedule

103
Sub-programme 1.5: Monitoring and Evaluation Indicator number 1.11Indicator title Number of M&E performance reports submitted.
Short definition The delivery of quarterly reports, annual reports and corporate plans to stakeholders.
Purpose To ensure compliance to all legislature pertaining to performance management.
Strategic link
VIP # 5 Focus Area(s): Good governance transformation
Output(s): Strengthening and maintaining governance and accountability.Strengthening and maintaining oversight.
Intervention(s)
Source of data Acknowledgements of receipt/email of the submission of the performance report as per the legislative deadlines.
Method of calculation The number of reports submitted will be calculated to determine the total.
Data limitations None
Type of indicator
Input: Activities: Output:x Outcome:Service Delivery Indicator: Direct Service Delivery:
Indirect Service Delivery: xDemand Driven Indicator: Yes, demand driven:
No, not demand driven: x
Calculation type Cumulative Year-end:
Cumulative Year-to-date: Non-cumulative: x
Reporting cycle Quarterly:x Bi-annually: Annually: x Biennially:
Desired performance Higher than target: On target: x Lower than target:
Indicator responsibility Manager: M and ESpatial transformation (where applicable) N/A
Disaggregation of beneficiaries (where applicable)
Target for women: N/ATarget for youth: N/ATarget for people with disabilities: N/A
Assumptions N/A
Means of verification Acknowledgements of receipt/email of the submission of the performance report as per the legislative deadlines.

104
4.2 Programme 2: Investment PromotionStrategic outcome: Facilitate investment and jobs into the Western Cape
Indicator number 2.1
Indicator title Number of investment projects realised.
Short definition
Refers to the number of confirmed direct international investment projects in productive assets by a foreign or local company, as opposed to investments in shares. The point of realisation is the point of first flow of funds and/or the point at which physical activity on the project commences.
PurposeFor a host country or the firm which receives the investment, it can provide a source of new technologies, capital, processes, products, organisational technologies and management skills, and, as such, can provide a strong impetus to economic development.
Strategic link
VIP # 2 Focus Area(s): Increase investment
Output(s): Number of investment projects realised
Intervention(s):Investment promotion Attracting investment
Source of data1. Signed investor declaration.2. Signed and verified database.
Method of calculation The number of signed investor declarations is calculated to determine the number of projects realised.
Data limitations None
Type of indicator
Input: Activities: Output:x Outcome:Service Delivery Indicator: Direct Service Delivery:
Indirect Service Delivery: xDemand Driven Indicator: Yes, demand driven:
No, not demand driven: x
Calculation type Cumulative Year-end: Cumulative Year-to-date: x Non-cumulative:
Reporting cycle Quarterly: x Bi-annually: Annually: Biennially:
Desired performance Higher than target: On target: x Lower than target:
Indicator responsibility Head: Investment PromotionSpatial transformation (where ap-plicable) N/A
Disaggregation of beneficiaries (where applicable)
Target for women: N/ATarget for youth: N/ATarget for people with disabilities: N/A
Assumptions N/A
Means of verification1. Signed investor declaration2. Signed and verified database

105
4.3 Programme 3: Export PromotionStrategic outcome: To promote and facilitate global exports of goods and services from qualified companies in the Western Cape and to facilitate the expansion of qualifying companies into the rest of Africa.
Sub-programme 3.1: Trade PromotionIndicator number 3.1Indicator title Number of trade agreements signed.Short definition Refers to the number of confirmed trade transactions facilitated.
PurposeFor the business that receives revenue from sales, it can provide a source of new technologies, capital, processes, products, organisational technologies and management skills, and as such can provide a strong impetus to economic development.
Strategic link VIP # 2Focus Area(s): Growing the economy through export
Output(s):Rand value of Western Cape exports
Intervention(s): N/A
Source of data1. Signed trade declarations.2. Signed and verified database.
Method of calculation The number of signed trade agreements is calculated to determine the number of projects realised.
Data limitations Non-disclosure of third-party information
Type of indicator
Input: Activities: Output: Outcome:
Service Delivery Indicator:Direct Service Delivery:Indirect Service Delivery: x
Demand Driven Indicator:Yes, demand driven: No, not demand driven: x
Calculation type Cumulative Year-end: Cumulative Year-to-date: Non-cumulative: xReporting cycle Quarterly: x Bi-annually: Annually: Biennially:Desired performance Higher than target: On target: x Lower than target:Indicator responsibility Head: Trade PromotionSpatial transformation (where applicable) N/A
Disaggregation of beneficiar-ies (where applicable)
Target for women: N/ATarget for youth: N/ATarget for people with disabilities: N/A
Assumptions N/A
Means of verification1. Signed trade declarations 2. Signed and verified database

106
Sub-programme 3.2: African ExpansionIndicator number 3.2Indicator title Number of Outward Foreign Direct Investment (OFDI) declarations signed.
Short definition Refers to the number of confirmed direct outward investments facilitated on the African continent.
PurposeFor a host country or the firm which receives the investment, it can provide a source of new technologies, capital, processes, products, organisational technologies and management skills, and as such can provide a strong impetus to economic development.
Strategic link VIP # 2Focus Area(s): Growing the economy through export
Output(s):Rand value of Western Cape exports
Intervention(s): N/A
Source of data1. Signed OFDI declarations signed.2. Signed and verified database.
Method of calculation The number of signed trade agreements is calculated to determine the number of projects realised.
Data limitations Non-disclosure of third-party information
Type of indicator
Input: Activities: Output:x Outcome:
Service Delivery Indicator:Direct Service Delivery:Indirect Service Delivery: x
Demand Driven Indicator:Yes, demand driven: No, not demand driven: x
Calculation type Cumulative Year-end: Cumulative Year-to-date: Non-cumulative: x
Reporting cycle Quarterly: Bi-annually: Annually: x Biennially:Desired performance Higher than target: On target: x Lower than target:Indicator responsibility Head: Trade PromotionSpatial transformation (where applicable) N/A
Disaggregation of beneficiaries (where applicable)
Target for women: N/ATarget for youth: N/ATarget for people with disabilities: N/A
Assumptions N/A
Means of verification1. Signed OFDI declarations signed 2. Signed and verified database

107
4.4 Programme 4: ResearchStrategic outcome: Develop relevant tourism, trade and investment publications and provide customised research to support the core functions of the Agency.
Indicator number 4.1Indicator title Number of research reports developed.
Short definition Publications refer to research and information products, which are developed both internally and externally.
Purpose To make specific information available to the public.
Strategic link VIP # 2
Focus Area(s):Increase investment.Grow the economy through export.
Output(s):N/A
Intervention(s):N/A
Source of data Publication control sheet signed by the researcher and approved by the Chief Research Officer.
Method of calculation The number of publications is used to determine the number produced.Data limitations Information requested may not be freely available.
Type of indicator
Input: Activities: Output:x Outcome:
Service Delivery Indicator:Direct Service Delivery:Indirect Service Delivery: x
Demand Driven Indicator:Yes, demand driven: No, not demand driven: x
Calculation type Cumulative Year-end: Cumulative Year-to-date: Non-cumulative: x
Reporting cycle Quarterly: Bi-annually: x Annually: Biennially:Desired performance Higher than target: On target: x Lower than target:Indicator responsibility Chief Research OfficerSpatial transformation (where ap-plicable) N/A
Disaggregation of beneficiaries (where applicable)
Target for women: N/ATarget for youth: N/ATarget for people with disabilities: N/A
Assumptions N/A
Means of verification Publication control sheet signed by the researcher and approved by the Head: Wesgro Research.
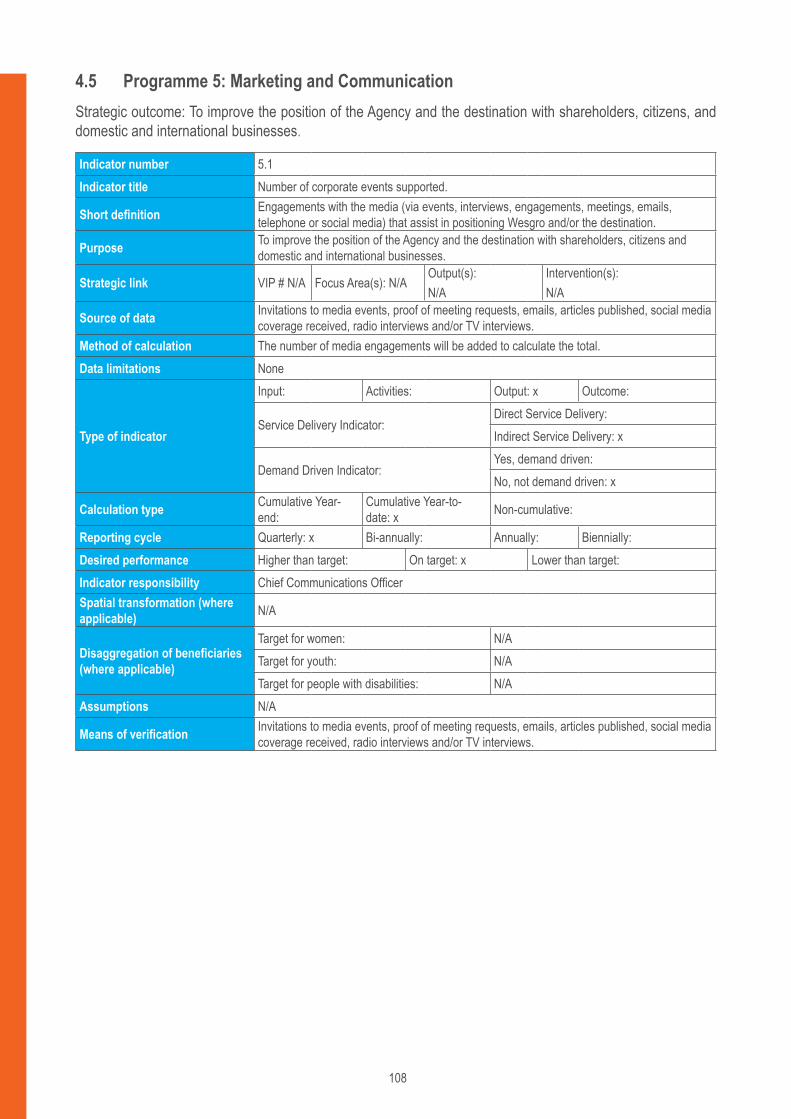
108
4.5 Programme 5: Marketing and CommunicationStrategic outcome: To improve the position of the Agency and the destination with shareholders, citizens, and domestic and international businesses.
Indicator number 5.1Indicator title Number of corporate events supported.
Short definition Engagements with the media (via events, interviews, engagements, meetings, emails, telephone or social media) that assist in positioning Wesgro and/or the destination.
Purpose To improve the position of the Agency and the destination with shareholders, citizens and domestic and international businesses.
Strategic link VIP # N/A Focus Area(s): N/AOutput(s): N/A
Intervention(s): N/A
Source of data Invitations to media events, proof of meeting requests, emails, articles published, social media coverage received, radio interviews and/or TV interviews.
Method of calculation The number of media engagements will be added to calculate the total.Data limitations None
Type of indicator
Input: Activities: Output: x Outcome:
Service Delivery Indicator:Direct Service Delivery:Indirect Service Delivery: x
Demand Driven Indicator:Yes, demand driven: No, not demand driven: x
Calculation type Cumulative Year-end:
Cumulative Year-to-date: x Non-cumulative:
Reporting cycle Quarterly: x Bi-annually: Annually: Biennially:Desired performance Higher than target: On target: x Lower than target:Indicator responsibility Chief Communications OfficerSpatial transformation (where applicable) N/A
Disaggregation of beneficiaries (where applicable)
Target for women: N/ATarget for youth: N/ATarget for people with disabilities: N/A
Assumptions N/A
Means of verification Invitations to media events, proof of meeting requests, emails, articles published, social media coverage received, radio interviews and/or TV interviews.

109
Programme 5: Marketing and CommunicationStrategic outcome: To improve the position of the Agency and the destination with shareholders, citizens, domestic and international businesses.
Indicator number 5.2Indicator title Quarterly reports evidencing content management of Agency collateral.Short definition Content creation for the Units within Wesgro.
Purpose To promote the brand of the Agency and the destination into key source markets, manage the destination reputation and deliver on industry-led support marketing.
Strategic link VIP # 5
Focus Area(s): Increase investment.Grow the economy through export.
Output(s): N/A
Intervention(s): N/A
Source of data Quarterly report to highlight the marketing initiatives embarked upon.
Method of calculation The number of quarterly reports submitted is added to determine the amount of reports submitted for the year.
Data limitations None
Type of indicator
Input: Activities: Output: x Outcome:
Service Delivery Indicator:Direct Service Delivery:Indirect Service Delivery: x
Demand Driven Indicator:Yes, demand driven: No, not demand driven: x
Calculation type Cumulative Year-end:
Cumulative Year-to-date: x Non-cumulative:
Reporting cycle Quarterly: x Bi-annually: Annually: Biennially:Desired performance Higher than target: On target: x Lower than target:Indicator responsibility Chief Communications OfficerSpatial transformation (where applicable) N/A
Disaggregation of beneficiaries (where applicable)
Target for women: N/ATarget for youth: N/ATarget for people with disabilities: N/A
Assumptions N/AMeans of verification Quarterly report to highlight the marketing initiatives embarked upon.

110
4.6 Programme 6: Destination MarketingStrategic objective: Enhance the attractiveness and awareness of the region and drive conversion
Indicator number 6.1Indicator title Number of tourism destination marketing initiatives supported.Short definition To measure the number of tourism destination marketing initiatives supported.
Purpose To drive geographic spread, improve seasonality, job creation and the stimulation of economic growth.
Strategic link VIP #:2Focus area(s)Growing the economy through export
Output(s)N/A
Intervention(s)N/A
Source of data
1. Signed progress report for the initiatives supported and estimated economic value of initiatives supported.2. Evidence substantiating the initiatives supported, which may include:• Signed joint marketing agreements; and/or• Signed service-level agreement; and/or• Bid communique confirming that the bids have been secured; and/or• Signed events-marketing agreements.
Method of calculation The number of tourism destination marketing initiatives supported will be calculated to determine the total.
Data limitations None
Type of indicator
Input: Activities: Output: x Outcome:
Service Delivery Indicator:Direct Service Delivery:Indirect Service Delivery: x
Demand Driven Indicator:Yes, demand driven: No, not demand driven: x
Calculation type Cumulative Year-end: Cumulative Year-to-date: Non-cumulative: x
Reporting cycle Quarterly: Bi-annually: Annually: x Biennially:Desired performance Higher than target: On target: x Lower than target:Indicator responsibility Chief Tourism OfficerSpatial transformation (where applicable) N/A
Disaggregation of beneficiaries (where applicable)
Target for women: N/ATarget for youth: N/ATarget for people with disabilities: N/A
Assumptions N/A
Means of verification
1. Signed progress report for the initiatives supported and estimated economic value of initiatives supported.2. Evidence substantiating the initiatives supported, which may include:• Signed joint marketing agreements; and/or• Signed service-level agreement; and/or• Bid communique confirming that the bids have been secured; and/or• Signed events-marketing agreements.

111
Indicator number 6.2Indicator title Number of Joint Marketing Agreements (JMAs) secured.
Short definition Collaborating with various stakeholders (including tour operators, media or airlines) to market Cape Town and the Western Cape.
Purpose To minimise the cost of marketing and allow Wesgro to gain maximum access to potential clients.
Strategic link VIP #2Focus Area(s): Grow the economy through export
Output(s):N/A
Intervention(s): N/A
Source of data Signed JMA.Method of calculation The number of JMAs will be added to get the total.Data limitations Dependency on partnerships
Type of indicator
Input: Activities: Output: Outcome:
Service Delivery Indicator:Direct Service Delivery:Indirect Service Delivery: x
Demand Driven Indicator:Yes, demand driven: No, not demand driven: x
Calculation type Cumulative Year-end: Cumulative Year-to-date: Non-cumulative: x
Reporting cycle Quarterly: Bi-annually: Annually: x Biennially:Desired performance Higher than target: On target: x Lower than target:Indicator responsibility Chief Marketing OfficerSpatial transformation (where applicable) N/A
Disaggregation of beneficiaries (where applicable)
Target for women: N/ATarget for youth: N/ATarget for people with disabilities: N/A
Assumptions N/AMeans of verification A signed JMA.
Indicator number 6.3Indicator title Number of leisure events supported.
Short definition Supporting leisure events with the aim of increasing awareness of and the number of visitor arrivals to the destination.
Purpose To drive geographic spread and reduce the impact of seasonality.
Strategic link VIP# 2Focus Area(s): Growing the economy through export
Output(s):N/A
Intervention(s): N/A
Source of data A copy of the signed Events Marketing Agreement (EMA). Method of calculation The number of events supported is added to calculate the total. Data limitations Lack of funding to support events.
Type of indicator
Input: Activities: Output: x Outcome:
Service Delivery Indicator:Direct Service Delivery:Indirect Service Delivery: x
Demand Driven Indicator:Yes, demand driven: No, not demand driven: x

112
Calculation type Cumulative Year-end: Cumulative Year-to-date: Non-cumulative: x
Reporting cycle Quarterly: x Bi-annually: Annually: Bi-annually:Desired performance Higher than target: On target: x Lower than target:Indicator responsibility Chief Marketing OfficerSpatial transformation (where applicable) N/A
Disaggregation of beneficiaries (where applicable)
Target for women: N/ATarget for youth: N/ATarget for people with disabilities: N/A
Assumptions N/AMeans of verification A copy of the signed Events Marketing Agreement (EMA).
Indicator number 6.4Indicator title Number of bids secured.
Short definition Number of bids secured by the Agency from businesses or organisations or association bodies to host meetings, incentives, conferences or exhibitions at the destination.
Purpose To attract international and domestic business tourism delegates who contribute towards the economic impact and the profiling of the destination.
Strategic link VIP # 2Focus Area(s): Grow the economy through export
Output(s):N/A
Intervention(s): N/A
Source of data Copy of signed letter from the organisation or business or an email confirming the decision and first two pages of the bid book or presentation.
Method of calculation The total number of conference bids secured will be calculated.Data limitations Dependency on partnerships
Type of indicator
Input: Activities: Output: x Outcome:
Service Delivery Indicator:Direct Service Delivery:Indirect Service Delivery: x
Demand Driven Indicator:Yes, demand driven: No, not demand driven: x
Calculation type Cumulative Year-end:
Cumulative Year-to-date: x Non-cumulative:
Reporting cycle Quarterly: x Bi-annually: Annually: x Biennially:Desired performance Higher than target: On target: x Lower than target:Indicator responsibility Head: Convention BureauSpatial transformation (where applicable) N/A
Disaggregation of beneficiaries (where applicable)
Target for women: N/ATarget for youth: N/ATarget for people with disabilities: N/A
Assumptions N/A
Means of verification Copy of signed letter from the organisation or business or an email confirming the decision and first two pages of the bid book or presentation.

113
4.7 Programme 7: Film and Media PromotionStrategic objective: Firmly establish a globally competitive film sector by 2025.
Indicator number 7.1Indicator title Number of film and media declarations signed.
Short definition
Refers to the number of confirmed direct international investment in film and media productions by a company, as opposed to investments in shares. The point of realisation is the point of first flow of funds and/or the point at which physical activity on the production begins.
Purpose
For a host country or the firm which receives the investment, it can provide a source of new technologies, capital, processes, products, organisational technologies and management skills, and thereby contribute to economic development. The transfer of skills and (for co-production or local production) the ownership of Intellectual Property, can give a long-tail return on investment for the creative firms working regionally.
Strategic link VIP # 2Focus Area(s): Increase Investment
Output(s):Number of investment projects realised
Intervention(s): N/A
Source of data Signed film and media declarations.
Method of calculation The total number of signed investor declarations is calculated to determine the number of projects realised.
Data limitations None
Type of indicator
Input: Activities: Output: x Outcome:
Service Delivery Indicator: Direct Service Delivery:Indirect Service Delivery: x
Demand Driven Indicator: Yes, demand driven: No, not demand driven: x
Calculation type Cumulative Year-end: Cumulative Year-to-date: Non-cumulative: x
Reporting cycle Quarterly: Bi-annually: Annually: x Biennially:Desired performance Higher than target: On target: x Lower than target:Indicator responsibility Head: Film and Media PromotionSpatial transformation (where applicable) N/A
Disaggregation of beneficiaries (where applicable)
Target for women: N/ATarget for youth: N/ATarget for people with disabilities: N/A
Assumptions N/AMeans of verification Signed film and media declarations.