AND STI GOVERNANCE - Форсайт
92
2016 Vol.10 No 3 FORESIGHT AND STI GOVERNANCE JOURNAL OF THE NATIONAL RESEARCH UNIVERSITY HIGHER SCHOOL OF ECONOMICS ISSN 1995-459X eISSN 2312-9972 Innovation in Retail China-2025: Research and Innovation Landscape TOPIC OF THE ISSUE SPATIAL DEVELOPMENT AND INNOVATION: RUSSIAN PRACTICE
-
Upload
khangminh22 -
Category
Documents
-
view
1 -
download
0
Transcript of AND STI GOVERNANCE - Форсайт

2016 Vol.10 No 3FORESIGHT
AND STI GOVERNANCEJOURNAL OF THE NATIONAL RESEARCH UNIVERSITY HIGHER SCHOOL OF ECONOMICS
ISSN 1995-459XeISSN 2312-9972
Innovation in Retail
China-2025: Research and Innovation Landscape
TOPIC OF THE ISSUESPATIAL DEVELOPMENT AND INNOVATION: RUSSIAN PRACTICE

StrategiesStrategiesInnovation and Economy
Publisher: National Research University Higher School of Economics
© National Research University Higher School of Economics, 2016
FORESIGHT AND STI GOVERNANCE
http://foresight-journal.hse.ru/en/
Address: National Research University Higher School of Economics 20, Myasnitskaya str., Moscow, 101000, RussiaTel: +7 (495) 621-40-38 E-mail: [email protected]
Editor-in-Chief — Leonid Gokhberg, First Vice-Rector, HSE, and Director, ISSEK, HSE, Russian Federation
EDITORIAL BOARD
EDITORIAL COUNCIL
Тatiana Kuznetsova, HSE, Russian FederationDirk Meissner, HSE, Russian FederationYury Simachev, Russian Science FoundationThomas Thurner, HSE, Russian Federation, and University of Cape Town, South Africa
Institute for Statistical Studies and Economics of Knowledge
National Research University Higher School of Economics
Executive Editor — Marina BoykovaDevelopment Manager — Nataliya GavrilichevaLiterary Editors — Yakov Okhonko, Imogen WadeProofreaders — Ekaterina Malevannaya, Caitlin MontgomeryDesigner — Mariya SalzmannLayout — Mikhail Salazkin
Deputy Editor-in-Chief — Alexander Sokolov, HSE, Russian Federation
Periodicity — quarterly
ISSN 1995-459XeISSN 2312-9972
Igor Agamirzyan, Russian Venture CompanyАndrey Belousov, Administration of the President of the Russian FederationCristiano Cagnin, Center for Strategic Studies and Management (CGEE), BrasilElias Carayannis, George Washington University, United StatesMario Cervantes, Directorate for Science, Technology and Industry, OECDCharles Edquist, Lund University, SwedenTed Fuller, University of Lincoln, UKLuke Georghiou, University of Manchester, United KingdomKarel Haegeman, EU Joint Research Centre (JRC)Attila Havas, Institute of Economics, Hungarian Academy of SciencesМichael Keenan, Directorate for Science, Technology and Industry, OECDАlexander Khlunov, Russian Science FoundationAndrey Klepach, Bank for Development and Foreign Economic Affairs, Russian FederationМikhail Kovalchuk, National Research Centre «Kurchatov Institute», Russian FederationYaroslav Kuzminov, HSE, Russian FederationCarol S. Leonard, HSE, Russian Federation, and University of Oxford, United KingdomJonathan Linton, HSE, Russian Federation, and University of Ottawa, CanadaIan Miles, HSE, Russian Federation, and University of Manchester, United KingdomRongping Mu, Institute of Policy and Management, Chinese Academy of SciencesFred Phillips, Yuan Ze University, Taoyuan, TaiwanWolfgang Polt, Joanneum Research, AustriaSergey Polyakov, Foundation for Assistance to Small Innovative Enterprises, Russian FederationOzcan Saritas, HSE, Russian Federation, and University of Manchester, United KingdomKlaus Schuch, Centre for Social Innovation, AustriaNicholas Vonortas, HSE, Russian Federation, and George Washington University, United StatesAngela Wilkinson, OECD

2016 Т. 10 № 1 ФОРСАЙТ 3
StrategiesStrategiesInnovation and EconomyСтратегииImages of the FutureИнновации и экономика
Foresight and STI Governance (formerly Foresight-Russia) — a research journal established by the National Research University Higher School of Economics (HSE) and administered by the HSE Institute for Statistical Studies and Economics of Knowledge (ISSEK), located in Moscow, Russia. The mission of the journal is to support the creation of Foresight culture through dissemination of the best national and international practices of future-oriented innovation development. It also provides a framework for discussing S&T trends and policies.
• Foresight methodologies
• Results of Foresight studies
• Long-term priorities for social, economic and S&T development
• S&T and innovation trends and indicators
• S&T and innovation policies
• Strategic programmes of innovation development at national, regional, sectoral and corporate levels
• State-of-the-art methods and best practices of S&T analysis and Foresight.
The topical coverage of the journal makes it a unique Russian language title in its field. Foresight and STI Governance is published quarterly and distributed in Russia and abroad.
Research scholars, university professors, policy-makers, businessmen, expert community, post-graduates, undergraduates and others who are interested in S&T and innovation analyses, Foresight and policy issues.
INDEXING AND ABSTRACTING
Journal’s rankings in E-Library.RU Citation Index (impact factor for 2015)
1st — Studies of Science1st — Management
TOPICAL COVERAGE:
TARGET AUDIENCE:
ABOUT THE JOURNAL

StrategiesStrategies
NOTES FOR AUTHORS
Before submitting your article, please prepare your manuscript using the following guidelines:
Аrticles should be topical and original, should outline tasks (issues), describe the key results of the author’s research and his/her conclusions;
Manuscripts are to be submitted via e-mail: [email protected]
References References to other publications must be in Harvard style and carefully checked for completeness, accuracy and consistency.
Figures All figures should be of high quality, legible, and numbered consecutively with arabic numerals. All figures (charts, diagrams, line drawings, web pages/screenshots, and photographic images) should be submitted in electronic form preferably in color as separate files, that match the following parameters:Photo images – JPEG or TIFF format. Minimum resolution 300 dpi, image size not less than 1000x1000 pixCharts, diagrams, line drawings- EXCEL or EPS format
Headings Headings must be concise, with a clear indication of the distinction between the hierarchy of headings.
KeywordsPlease provide up to 10 keywords on the Article Title Page, which encapsulate the principal topics of the paper.
AbstractАn abstract should be: informative (no general words), original, relevant (reflects your paper’s key content and research findings); structured (follows the logics of the results presented in the paper), concise (between 250 and 300 words).• Purpose (mandatory)• Design/methodology/approach (mandatory)• Findings (mandatory)• Research limitations/implications (if applicable)• Practical implications (if applicable)• Social implications (if applicable)• Originality/value (mandatory)
It is appropriate to describe the research methods/methodology if they are original or of interest for this particular research. For papers concerned with experimental work describe your data sources and data processing techniques.Describe your results as precisely and informatively as possible. Include your key theoretical and experimental results, factual information, and any interconnections and patterns shown. Give special priority in your abstract to new results and data with long-term impact, important discoveries and verified findings that contradict previous theories as well as data that you think have practical value.Conclusions could be associated with recommendations, estimates, suggestions, and hypotheses described in the paper.Information contained in the title should not be dublicated in the abstract . Try to avoid unnecessary introductory phrases (e.g. ‘the author of the paper considers…’).Use language typical of research and technical documents to compile your abstract and avoid complex grammatical constructions.The text of the abstract should include the key words of the paper.
Author Details (in English and native language) Details should be supplied on the Article Title Page, including:• Full name of each author• Position, rank, academic degree• Affiliation of each author, at the time the research was completed• Full postal address of the affiliation• E-mail address of each author
Article Title To be submitted in native language and English. A title of not more than eight words should be provided.
Article Length Articles should be between 20000 and 60000 characters (incl. spaces). Optimal size is 40 000 characters.
Format All files should be submitted as a Word document.The text should be in Times New Roman 14 pt, 1.5 spaced and fit to the width, all margins should be 20 mm.

2016 Vol. 10 No 1 FORESIGHT AND STI GOVERNANCE 5
StrategiesStrategies
INNOVATION
Single-Industry Towns of Russia: Lock-In and Drivers of Innovative Search
Nadezhda Zamyatina, Alexander Pilyasov
53
Vol. 10 No 3 2016
CONTENTS
STRATEGIES
Spatial Development and Innovation in RussiaCarol Leonard
30
China-2025: Research and Innovation Landscape
Epaminondas Christofilopoulos, Stavros Mantzanakis
7
Towards Future Customer Experience: Trends and Innovation in Retail
Marisela Rodriguez, Francisco Paredes, Gaofeng Yi
18
Modeling the Development of Regional Economy and an Innovation Space Efficiency
Valery Makarov, Sergey Ayvazyan, Mikhail Afanasyev, Albert Bakhtizin, Ashkhen Nanavyan
76
SPATIAL DEVELOPMENT AND INNOVATION: RUSSIAN PRACTICE
Potential High-Tech Сlusters in Russian Regions: From Current Policy to New Growth Areas
Stepan Zemtsov, Vera Barinova, Alexey Pankratov, Evgeniy Kutsenko
34
The Smart City Approach as a Response to Emerging Challenges for Urban Development
Marina Boykova, Irina Ilina, Mikhail Salazkin
65
StrategiesStrategies
CONTENTS
7
34

STRATEGIES
2016 Vol. 10 No 3 FORESIGHT AND STI GOVERNANCE 7
China-2025: Research and Innovation Landscape
Head of International Cooperation, PRAXI Network/ Foundation for Research and Technology Hellas; Co-Chair, Millennium Node Greece / Phemonoe Lab. Address: 1 Morihovou Sq., 54625 Thessaloniki,
Greece. E-mail: [email protected]
Epaminondas Christofilopoulos
Abstract
As the second largest economy globally, China today is one of the drivers for changing the balance of forces
worldwide. The country aims to become a global player on the high-tech product market, to make the transition from an investment-based to a knowledge-based economy, and become the largest consumer market that is attractive to other major international players, including the European Union. Aware of this trend, the European Commission initiated a foresight study to assess the future of science and innovation in China until 2025, the results of which we present in this paper.
The foresight study’s objective was to identify Research and Innovation (R&I) priority areas and their development by 2025, aiming to contribute to the bilateral dialogue
Keywords: China; science; research and development (R&D); technology; innovation; trends; scenarios
between the EU and China with the ultimate goal developing of a long-term cooperation strategy.
Through a combination of desk-study analysis, a Delphi study, media scanning, crowd-sourcing platform, and a cross impact analysis, we analysed 16 critical drivers that play a substantial role in transforming China’s R&I landscape. The study showed a correlation between the different factors, and highlighted the strong impact of governance and the national economy on future developments. Taking into account these drivers and some critical uncertainties, we developed four plausible scenarios up to the year 2025. Being aware of these possible scenarios allows us to prepare in advance and establish a successful strategy for the future.
DOI: 10.17323/1995-459X.2016.3.7.16
CEO, EMETRIS SA; Head, Phemonoe Lab. Аddress: 9th Km. Thessaloniki — Thermi, THERMI Building Α’ Entrance, 60224 Thessaloniki, Greece. E-mail: [email protected]
Stavros Mantzanakis
Citation: Christofilopoulos E., Mantzanakis S. (2016) China 2025: Research & Innovation Landscape. Foresight and STI Governance, vol. 10, no 3, pp. 7–16. DOI: 10.17323/1995-459X.2016.3.7.16
2016 Vol. 10 No 3 FORESIGHT AND STI GOVERNANCE 7

8 FORESIGHT AND STI GOVERNANCE Vol. 10 No 3 2016
Strategies
Introduction: China on the brink of substantive changesFifteen years ago, this report would have been written on American laptops, probably designed and engineered by IBM. However, the company that revolutionized the PC market sold its manufacturing division to Lenovo in 2004 [Vielmetter, Sell, 2014]. Instead, today we are typing using ‘Made in China’ computers, another signal of the rapid changes taking place globally and of China becoming a rising star.The post-war era has witnessed the economic miracles of Japan and South Korea, which managed to become substantial actors in the global high-technology market. However, both countries lacked the dynamism and size to transform the global economy and to control the rules of the game. Today, at the start of the 21st century, two new countries, China and India (especially China) have the potential to shift the balance of global economy [Economist, 2014; Wolf et al., 2011].Today China is the second largest economy after the United States and is expected to become the largest economy by 2050 [Hawksworth, Chan, 2013; Franklin, Andrews, 2012; Fan et al., 2014; Stephens, 2013; Hu, 2011]. In addition, China became the world’s largest trading nation in 2013, overtaking the US in what Beijing described as ‘a landmark milestone’ for the country [Anderlini et al, 2014]. What is however more interesting, especially in China, is the on-going structural change of the national economy based on a shift from low-labour manufacturing to an increase in the service sector, internal consumption, and the production of high tech products [Fulin, 2013; Phemone Lab, 2013; Ansfield, 2012; Cyranosk, 2014]. This transformation of the Chinese economy is ongoing and it remain to be seen whether China will manage to become a global actor in added-value high tech products.Will China lead or will it follow? During much of human history, China led the world in science and technology. However, recent Western stereotypes of a backward and unchanging China have negatively characterized the country. Indeed, during and after the industrial revolution China lagged far behind. It is only in the last few decades that it has once again caught up. Today, change is happening rapidly and according to recent OECD data, today China is ahead of the EU for the first time in terms of the share of GDP spending on Research and Development [SPI et al., 2014]. Nonetheless, the picture is complex.It is true that China has primarily excelled at adopting technologies from elsewhere, as a ‘fast follower’ [Global Times, 2013; Fu et al., 2013; Kostarelos, 2014; Springut et al., 2011]. However, in some fields it is on the frontier of technological knowledge, and the growth of published research is extraordinary. As for the commercialization of high tech innovative products, with its large growth and excess liquidity. China is eager to invest in new technologies to upgrade its production systems [Cyranosk, 2014; Casey, Koleski, 2011]. China (and other emerging markets) are now completing the innovation cycle by rapidly signing deals with innovative start-ups to quickly commercialize their new technologies at a rapid tempo and to scale.Another important initiative, China’s Foreign Experts Program, the 1000 talents program administered by the State Administration of Foreign Experts Affairs is expected to play a major role in transforming China into an innovative powerhouse in the future. The plan provides lucrative incentives to Chinese nationals who are living abroad to return to China to carry out research within their respective fields, especially in STEM disciplines.1 Nevertheless, several questions remain. Will Chinese research ever become a competitive world leader? Are financial growth, financial resources, and central planning sufficient to ensure growth? Are there any unforeseen risks? Some of these aspects will be covered by the current study.
MethodologyThe overall work is structured around the following main research question: ‘What are the main factors that will affect the Research (R) & Innovation (I) Environment in China up to 2025?’ The methodology is based on the TAIDA approach developed by KAIROS Future [Lindgren, 2013, Lindgren, Bandfold, 2003]. However, a tailor-made approach to this study also included several other research tools (e.g. crowd sourcing). We used a combination of a desk-study analysis, media scanning, a Delphi study, as well as a crowd-sourcing tool in different steps of the work to identify, define, and analyse 16 critical drivers that play a substantial role in transforming China’s R&I landscape, and construct four plausible scenarios of the future.The overall work was structured as follows. The main task was to produce plausible scenarios about the Future of Research in China in 2025. Having that in mind, the trends scanning was limited to identifying the main factors that will shape the research environment in China during the next 15 years. The European Commission was the client of the study. Thus, the main interest is to provide scenarios and visualize some plausible futures to help make better strategic decisions today.For our study, we developed a definition of the Inner World, the Near World, and the contextual Environment. The main actors of the system (internal and external) were identified and analysed by the project team.
1 For more information, see: http://www.1000plan.org/en/, accessed 19.02.2016.

2016 Vol. 10 No 3 FORESIGHT AND STI GOVERNANCE 9
Then, we reviewed the historical development of the System (see step 2) affecting research in China to better understand current and future trends and identify unexpected developments. We also identified a relatively large list of ‘strong’ trends affecting (directly or indirectly) research in China. We identified the trends through different tools: secondary research, media scanning, media watch, guruing (interviews with experts), and online questionnaires.In addition, we also utilized a crowd sourcing platform (Co:tunity) throughout the study.2
Evaluation of the trends identified (in terms of importance and plausibility) happened through a mini-delphi study, with input provided by a selected group of experts globally (China, Europe and elsewhere) through an online questionnaire. The 41 experts were evenly distributed across the world and had different backgrounds (research, business, consultancy, etc.). Yet, all shared considerable experience either on China or on Foresight methodology. We monitored the selected trends throughout the study (development pattern, saturation level, speeds, etc.)We then analysed the driving forces behind the selected trends and their main consequences. In addition, tailor-made input on the current technological and innovation trends in China was provided by KAIROS Future [Lindgren, 2013]. This information was essential for identifying specific technological areas of high importance and for composing the final scenarios. Next, we carried out an in-depth analysis of the impact of the main selected trends on the Focal Question. Further, we analysed the influence of the different trends. The outcome of this analysis fed into the scenario-making process. The final report was validated by three independent experts, who provided comments and corrections on the suggested scenarios and trends.
Trends analysis and evaluationAfter the initial analysis of the research environment and during the initial scoping phase, the project team agreed to focus on 16 drivers that will affect the quality and characteristics of the research environment in China by 2025. Some of these drivers are global in character but the majority are related to specific national developments.It should be noted, however, that during this scanning process, the project team looked for drivers that will either obviously affect (or already have affected) the research environment. At the same time, the project team looked for weak signals to identify some less obvious factors that could potentially have a significant or even dramatic direct or indirect effect. It should be also noted that some of the trends, studied in the context of this work, have a broader importance and affect the global system in varying ways. These megatrends (e.g. global communications) are long-term, transformational processes with global reach, broad scope, and a fundamental and dramatic impact. Table 1 shows the 16 selected trends.The evaluation results of the 16 drivers are presented in the following graphs on a scale of one to ten in terms of their importance and their probability of occurring. Although most of the drivers got a high mark both in terms of their importance and probability (this is natural as we had pre-selected the important drivers), there were still several interesting results extracted by the evaluation process.In terms of the importance of the drivers, we found the following to be most influential: the increasing need for energy and resource efficiency; structure and operation of the education system; environmental implications; framework conditions (the national regulatory framework for research); stability of the government and societal peace; and language skills (Figure 1).Further, we analysed some of the aspects pertaining to trends evaluation. First, a very low importance rating was given to population growth and urbanization, despite their major impact on transforming society [Miller, 2012; Mingqi, 2013; Mai, 2013]. However, it seems that the serious indirect effects of these processes on research are far from obvious.Second, very little importance was attributed to ‘human rights’ and the possibility of a serious military conflict in the region. The ‘Economy’ and ‘Private R&D investment’ were also considered relatively unimportant possibly because the experts took them for granted.Figure 2 schematically presents the probability ratings given by the experts (10 representing a higher probability). The highest probability is naturally attributed to ongoing distinct trends such as the rise of ‘Global Communication’, ‘Connectivity’, and ‘Urbanization’. Moreover, it is broadly expected that issues like the ‘Environment’, ‘Space and Defence’, as well as ‘Need for Resources’ will continue to play an increasing role in the future. On the other hand, the experts had very low expectations for positive changes on issues like ‘Human Rights’, ‘Governance’, and the ‘Education System’ as well as on ‘Intellectual Property Rights’ (IPR). Finally, it is also important to underline that the risks are expected to affect both the Chinese and global economy.Figure 3 summarizes the evaluation results of the trends, demonstrating the critical importance of ‘Governance’ and the ‘National Economy’ in shaping and catalyzing the research environment in
Christofilopoulos E., Mantzanakis S., pp. 7–16
2 ‘Co:tunity’ is a multi-functional smartphone and web application for collaborative trends potting and innovation developed by Kairos Future. Available at: www.cotunity.com, accessed 12.12.2015.

10 FORESIGHT AND STI GOVERNANCE Vol. 10 No 3 2016
Strategies
China, followed by ‘Energy & Materials’, ‘R&D Framework Conditions’, the ‘Education System’, the ‘Environmental Situation’, and ‘Language Skills’.Tackling the need to prioritize trends, we carried out a Trend Impact Analysis (TIA) to identify the most important trends that will be central in formulating the scenarios. The following graph (Figure 4) summarizes the outcomes of the evaluation process, indicating the specific drivers that are of high importance and have a high probability of occurring.The trends in the upper right corner were evaluated by the experts as certain and important. The trends in the top left corner were evaluated as uncertain (or less certain) but still highly important. These two sets of trends are, according to the scenario methodology, deemed of high importance and are studied in more detail as they play an important role in formulating the four scenarios. The Cross-Impact Analysis (CIA) is an essential part of the scenario methodology that reveals how different trends affect each other and help analyse the interrelationships between them [Lindgren, Bandfold, 2003]. In the first step of the CIA analysis, we evaluated the influence of every factor or trend on the other factors, highlighting several important findings such as the strong role of the ‘National
Таble 1. 16 trends that will shape Chinese research by 2025
Drivers4. Energy & Materials 16. Education System
11. Environment 2. Framework Conditions
5. Governance 15. Language Skills
1. Economy 3. Private R&D Investment 14. Global Communication
10. Space & Defence 13. IPR
8. Global Economy 6. Urbanization
7. Human Rights 9. Peace & Conflict
12. PopulationSum of importance for each driver
Level of importance (scoring)
Figure 1. Trends evaluation by importance
Source: compiled by the authors.
5.0 5.5 6.0 6.5 7.0 7.5 8.0
Object of the analysis Predicted state1. Economy China will enjoy strong GDP growth until 20252. Framework Conditions The government will provide sufficient financial support and will implement an efficient regulatory
framework for research3. Private R&D investment The private sector in China will invest more in R&D by 20254. Energy & Materials The need for more energy from other sources beyond coal (e.g. from renewables and nuclear) and the
need for resources (e.g. alternative raw materials) will strongly increase in China by 20255. Governance China will enjoy stable governance and a peaceful society by 20256. Urbanization The urbanization process in China will continue until 20257. Human Rights In the years to come, China will see a greater openness and improvement of human rights8. Global Economy The global economy is expected to grow steadily until 20259. Peace & Conflict Peaceful regional cooperation will support the growth of Chinese Research by 2025?10. Space & Defence Space exploration efforts and the development of defence technologies will increase by 202511. Environment The intensity of local environmental problems (e.g. atmospheric pollution, contaminated water) and
global environmental implications (e.g. climate change) will increase by 202512. Population The Chinese population will continue to increase by 202513. IPR Intellectual Property Rights (IPR) regulations will be further modernized and IPR
enforcement will continuously improve in China by 202514. Global Communication The world will become more interconnected and new communication technologies will allow stronger
global interactions and cooperation of Chinese researchers by 202515. Language Skills The language skills of Chinese researchers will substantially improve by 202516. Education System The Chinese education system (primary/ secondary/ higher) will be radically modernized and upgraded
by 2025Source: compiled by the authors.

2016 Vol. 10 No 3 FORESIGHT AND STI GOVERNANCE 11
Economy’ and ‘Private R&D Investment’ in transforming the R&D environment, as well as the overall strong role of ‘Governance’. The graphical visualization of the CIA (Figure 5) sheds light on several other issues such as the highly interdependent role of ‘IPR’.The main outcomes of the CIA analysis graphically presented above are as follows.Governance is the major clear driving force and quite independent of other drivers. ‘Urbanization’, ‘Global Communications’ and ‘R&D Framework Conditions’ are also important and quite independent driving forces.The ‘National Economy’ is naturally a major driver as well and has the strongest interconnections with other drivers. ‘Energy and Resources’ is another important driver highly interconnected with several other factors such as the ‘Economy’ and ‘Environment’.‘Private R&D Investment’ and ‘IPR’ are both highly dependent on other drivers. Several factors that have a strong effect on the R&I environment in China up to 2025 are strongly dependent on ‘Governance’: ‘Human Rights’, ‘IPR’ issues, ‘Education’, and ‘Peace & Conflict’.‘Environmental’ issues, the ‘Education’ system, ‘Language’ Skills, ‘Peace & Conflict’, and ‘Human Rights’ are strongly dependent on other factors (‘Governance’ in most cases).
Драйверы
14. Global Communication 6. Urbanization
11. Environment 10. Space & Defence
4. Energy & Materials 12. Population
3. Private R&D Investment 15. Language Skills
1. Economy 2. Framework Conditions
13. IPR 5. Governance
9. Peace & Conflict 16. Education System
8. Global Economy 7. Human Rights
Sum of probability for each driver
Level of probability (scoring)
Figure 2. Trends Evaluation, Probability
Source: compiled by the authors.
Importance
low high
1. Economy2. Framework Conditions3. Private R&D Investment4. Energy & Materials5. Governance6. Urbanization7. Human Rights8. Global Economy9. Peace & Conflict10. Space & Defence11. Environment12. Population13. IPR14. Global Communication15. Language Skills16. Education System
Figure 3. Trends in China*
Source: compiled by the authors.
* Colour shows the sum of importance, while size shows the sum of influencing.
5.0 5.5 6.0 6.5 7.0 7.5 8.0 8.5 9.0
Christofilopoulos E., Mantzanakis S., pp. 7–16

12 FORESIGHT AND STI GOVERNANCE Vol. 10 No 3 2016
Strategies
Impo
rtan
ce
Probability
High Importance, Less Probability
High Importance & Probability
Less Important and/or Less Probable
1. Economy2. Framework Conditions3. Private R&D investment4. Energy & Materials5. Governance6. Urbanization7. Human Rights8. Global Economy9. Peace & Conflict10. Space & Defence11. Environment12. Population13. IPR14. Global Communication15. Language Skills16. Education System
Drivers
Figure 4. Trend Impact Analysis
Source: compiled by the authors.
Notes: The X axis represents the probability (rank-ing marks from 1 to 10), while the Y axis represents the importance of the same drivers on affecting the research environment (ranking marks from 1 to 10). Color shows details about driver.
The first phase of the study also included identifying wild cards. Wild cards are events that could cause a sudden and rapid radical change. These wild cards are very improbable because if they occur they will change the world as we know it. Such wild card events can substantially change the evolution of the future and should be taken into account during strategic planning [Mendonça et al., 2004; van Rij, 2013]. During the analysis, several wild cards appeared in the discussions of lesser or greater probability. Some of them are included in the developed scenarios. Some of the most likely wild card events that might radically affect China’s research environment and the whole country are listed below:•A brief military conflict in the South–East Chinese Sea could stop foreign investment, shift research
funding and the focus on defence technologies, and stop bilateral cooperation;•A nuclear accident could change the current government plans for several new nuclear plants in the
near future;• Massive ‘domino effect’ social unrest in the country fuelled by poor economic performance and poor
civil rights could radically change the governance model in China;• A collapse of the booming property market could cause a financial crisis and anger within the middle class.
This non-exhaustive list of wild cards is indicative of the various diverse unlikely incidents that may occur to suddenly alter the direction of the future. Some of the wild cards have been described in scenario narratives as they could dramatically change the linear development of the future trends.
Key factors that impact the scenariosThe trend scoping process was crucial not only to identify and study a large set of factors but also to initiate a discussion with a broader group of experts that provided feedback throughout the study.After finalizing the trend analysis, we made some initial assumptions for the Future of Research in China at 2025.First, we assumed that strong state policy and investment will continue to guide research but will also limit it unless important framework changes occur [Sass, 2014; Orlik, 2013]. In the case of social unrest, research will also be affected. Moreover the state in areas such as Foreign Relations and the Space Race are expected to place some focus on defence/space related research.Second, we assumed that the expected growth of the national and global economy will also benefit research. However, more financial risks are expected to slow down the development of the research environment.

2016 Vol. 10 No 3 FORESIGHT AND STI GOVERNANCE 13
Dep
ende
nt
Driving Force
Dependent Links
National Economy
Independent Driving Force
Governance
Figure 5. Trends Cross Impact Analysis
Source: compiled by the authors.
Third, we assumed that the quest for resources and environmental problems (local and global) will continue to be important drivers. We expect new technologies on alternative materials, next-generation nuclear plants, as well as on renewable energy to be developed.Moreover, the Cross Impact Analysis and Causal Loop Analysis of the 16 identified trends showed that Governance and National Economy are the two key uncertain strategic trends affecting the development of the research environment. The research team ultimately selected these two strategic trends and used them as a basis for building the four scenarios.
Governance and social peaceOver the last few decades, the performance of the Chinese government has been widely considered successful given the country’s impressive development [EIU, 2012; USPTO, 2014; Naisbitt, Naisbitt, 2010; Hu, 2011; Fan et al., 2014]. There is, however, great uncertainty about the future prospects for greater transparency, fair justice, and better protection of civil rights [NYT, 2014; World Bank, China State Council, 2013]. In recent years, there have been several cases of small-scale social uprisings in rural areas mainly due to pressure on ethnic minorities or corruption in local governance [NYT, 2013; Hoyos, 2014]. However, the main catalyst of change is expected to be the rising Chinese urban middle class. In China, the relationship between the middle class and state corruption is underpinned by an implicit social contract based on prosperity and social stability. During the last few decades, the Chinese Communist Party (CCP) has supported, in the context of a broader urbanization process, the development of a middle class to drive consumption and serve as a buffer against other relatively deprived groups [Deng, 2012]. Nevertheless, at the same time middle class citizens participate more in ‘rights-upholding’ activities and are more likely to pursue legal action to resolve disputes. Given their superior resources too, including personal connections, internet access, and financial stability, the rising middle class is expected to become the catalyst of change in governing practices.In the years to come, the Chinese governance system under the current president, Xi Jinping, will have to make decisions about greater transparency and justice or risk moving backwards towards a more despotic state [Zhang, 2012; Johnson, 2013] (Figure 6).Each direction will dramatically affect the development of China’s society, economy, and education, and thus will shape Chinese research in 2025.
National EconomyBoth the global and national economy are considered important factors shaping research in China by 2025. However, the national economy was chosen as the second strategic trend upon which to build
1. Economy2. Framework Conditions3. Private R&D investment4. Energy & Materials5. Governance6. Urbanization7. Human Rights8. Global Economy9. Peace & Conflict10. Space & Defence11. Environment12. Population13. IPR14. Global Communication15. Language Skills16. Education System
Drivers
Christofilopoulos E., Mantzanakis S., pp. 7–16

14 FORESIGHT AND STI GOVERNANCE Vol. 10 No 3 2016
Strategies
Despotic Transparent Slow growth Double GDP
Figure 6. Scenario axis 1 – Governance and Societal Peace
Figure 7. Scenario axis 2 – State of the National Economy
Source: compiled by the authors. Source: compiled by the authors.
the scenarios because there are many ongoing structural changes in the national system, the success or failure of which will have dramatic effects upon the growth of the Chinese economy and research.During the last few years, the Chinese economy has appeared to be quite durable, managing to deal successfully with the side effects of the global economic crisis.The Chinese economy is undergoing a heavy transformation process to sustain growth and address the worsening environmental and social problems [NYT, 2014; Phemone Lab, 2013; Vltchek, 2012; Gong, 2012; Orlik, Davis, 2013]. The transformation includes the creation of a knowledge-based economy, moving from a ‘made in China’ to a ‘designed in China’ strategy, and from an investment-based to consumption-based economy. It also involves encouraging the creation of an urban middle-class, supporting the development of the services sector, facilitating changes in the banking system and interest rates, as well as changes in the ownership rights of agricultural land [Cyranosk, 2014; Fu et al., 2013; Global Times, 2013; Yang, 2013; Hansakul, 2013].The General Secretary of the CCP’s Central Committee, Hu Jintao, stated in his report to the 18th National Congress of 2012 that by 2020, GDP income should be double that of 2010 on the basis of a more balanced, coordinated, and sustainable development path (meaning an annual GDP growth of 7.2%) [Monan, 2012] (Figure 7).By encouraging cleaner industries and the service sector, the government hopes to generate relatively more jobs, as well as clearer skies and waterways. However, this transition will require more bank loans, opportunities and policy support to SMEs, and less cheap loans to State Owned Enterprises (SOEs). It will also require innovative Chinese technologies to be created, successful urbanization, and unhindered cooperation with international business partners [Orlik, Davis, 2013; Sass, 2014; Global Times, 2013; Vltchek, 2012].It should be also emphasized that the expected emergence of the Chinese consumer could be the greatest global growth engine of the 21st century, benefiting European manufacturing and service enterprises alike.
Scenarios: China 2025Based on the strategic uncertainties described above, we constructed four different scenarios for the future of Chinese research (Figure 8). The four scenarios are all set in 2025. For each, we give a short overview of the status and focal areas of Chinese research.Yin & Yang Scenarios – Under this scenario, the Chinese government under president Xi Jinping started substantial reforms in the transparency of governance and the judicial system in 2015, involving greater public participation in local governance. The economy is flourishing and is now based more on internal consumption, services, and high tech exports. Chinese research is a top global player, leading in terms of volume of public and private R&D investment and producing two Nobel Prize winners in Chemistry and Medicine.Blue Jasmine scenario – Here, the Chinese government under president Xi Jinping started substantial reforms in the transparency of governance and the judicial system in 2015, further enforced with the support of a dynamic urban middle class. Mr. Jinping has great popular support from the CCP and the public and was re-elected in 2018. However, the huge public debt of central and regional governments and the global ‘Rare Earth Metals Crisis’ of 2022 have stagnated the Chinese economy. Nevertheless, Chinese research is thriving driven by the substantial reforms in the national research system initiated in 2017 and by the many international research collaborations, especially in the fields of alternative materials, biotechnology, and health.Dungeons & Dragons scenario – Following these developments, the Chinese government under president, Xi Jinping, begun substantial reforms towards greater transparency and social balance in 2015. However, it proved impossible to overcome the hurdles set by a large group within the CCP and a new president was elected in 2018, leading the country in the opposite direction. The new authoritarian governance style
Governance and Societal Peace
National Economy

2016 Vol. 10 No 3 FORESIGHT AND STI GOVERNANCE 15
High Financial Growth
Financial Slowdown
Despotic Governance
Transparent Governance
Dungeons and Dragons Yin & Yang
Breathless Queen Blue Jasmine
Figure 8. Four scenarios for China
Source: compiled by the authors.
has managed to maintain high growth rates based not only on cost innovations but also on innovations in ICT, defence, space, and transport technologies.The Breathless Queen scenario – This assumes that China is still a global power but with feet of clay, similar in many ways to the Soviet Union of the 1980s. The short-sighted and insufficient financial reforms have kept the growth rate below 3%, fuelling several social side effects. Social unrest led by the middle class and ethnic minorities are creating an explosive mixture in Chinese society. The old-fashioned research system has limited funds and cannot keep up with advances in space, energy, and biotechnology.
ConclusionsOur study provided a general insight into the future of research and innovation activities in China up to 2025. With sufficient capacities in several scientific and technical areas, the country has sound prerequisites for improving its international status by shifting away from the ‘world factory’ image to becoming a global player in the market of innovative technologies with high-added value. It has excellent chances to move from an economy based on investment to one based on knowledge and become the largest consumer market that is attractive to other major international players, including the European Union. At the same time, reservations about social reforms aimed at improving, for example, human rights, the quality of education, as well as the country’s possible participation in hostilities could hinder scientific and technological development.Our analyses of the major trends likely to affect China’s research and innovation, as well as the interrelationships between these trends, enable us to define the priorities of scientific and technological development of the country and identify their likely future development. We placed the two most influential factors – governance and the national economy – as matrices to develop four plausible scenarios of the innovative development of China by 2025. In drafting the scenarios, we took into account several wild cards – low-probability extreme events that could radically change the socioeconomic situation in the country and the selected strategic vector. The four scenarios we produced help to reduce disbelief in all the likely futures for China and allow us consider that any of them are plausible and prepare strategies to achieve them. However, scenarios are not predictions; it is simply impossible to predict the future with certainty. Thus, we should consider them powerful tools that can help us today in perceiving the likely future and prepare a successful strategy to get there.
The study was performed by the Phemonoe Lab and PRAXI/FORTH in the context of the ‘Dragon-Star’ project funded by the European Commission. The authors would like to thank the independent experts who contributed to the study: Assistant Professor Anthony Howell, School of Economics at Peking University, Beijing, China; Mr Rikard Wallin, Managing Director at NCAB Group Sweden AB, Stockholm, Sweden; and Professor Daoliang Lee, China Agricultural University, Beijing, China.
Christofilopoulos E., Mantzanakis S., pp. 7–16

16 FORESIGHT AND STI GOVERNANCE Vol. 10 No 3 2016
Strategies
Anderlini J., Hornby L. (2014) China overtakes US as world’s largest goods trader. Financial Time, 10.01.2014. Available at: http://www.ft .com/intl/cms/s/0/7c2dbd70-79a6-11e3-b381-00144feabdc0.html#axzz3xQyvGRHu, accessed 15.02.2015.
Ansfi eld J. (2012) China’s cyber police enlist foreign fi rms. International Herald Tribune, 15.11.2012.Casey J., Koleski K. (2011) Backgrounder: China’s 12th Five-Year Plan, Washington, D.C.: U.S. China Economic & Security Review
Commission.Cyranosk D. (2014) Chinese science gets mass transformation. Nature, vol. 513, no 7519. Available at: http://www.nature.com/news/
chinese-science-gets-mass-transformation-1.15984, accessed 28.03.2015.Deng Y. (2012) Amendments refl ect CPC’s resolve. China Daily, 15.11.2012.Economist (2014) Asian worries about China’s rise — Th e people concerned. Economist, 15.07.2014. Available at: http://www.economist.
com/blogs/banyan/2014/07/asian-worries-about-china-s-rise?fsrc=scn/fb /wl/bl/thepeopleconcerned, accessed 23.04.2015.EIU (2012) China’s leadership handover: Th e changing of the guard, London, New York, Hong Kong, Geneva: Economist Intelligence Unit.Fan C., Christmann-Budian S., Seus S. (2014) Research and Innovation Cooperation between the EU and China, Brussels, Karlsruhe:
European Commission, Fraunhofer Institute for Systems and Innovation Research.Franklin D., Andrews J. (2012) Megachange: Th e World in 2050, Hoboken, NJ: Wiley. Fu J., Frietsch R., Tagscherer U. (2013) Publication activity in the Science Citation Index Expanded (SCIE) database in the context of
Chinese science and technology policy from 1977 to 2012, Karlsruhe: Fraunhofer Institute for Systems and Innovation Research.Fulin C. (2013) Blueprint and timetable for the future. China Daily, 28.02.2015.Global Times (2013) Government call for growth driven by innovation. Global Times, 23.10.2013. Available at: http://www.globaltimes.cn/
content/817254.shtml, accessed 12.05.2014.Gong P. (2012) Cultural history holds back Chinese research. Nature, vol. 481, no 7382, p. 411. Hansakul S. (2013) Property market so far so good. China Daily, 28.02.2013.Hawksworth J., Chan D. (2013) World in 2050 Th e BRICs and beyond: Prospects, challenges, and opportunities, London:
PricewaterhouseCoopers LLP.Hoyos C. (2014) Tensions in Asia help keep sales buoyant. Financial Times, 11.02.2014.Hu A. (2011) China in 2020: A New Type of Superpower, Washington, D.C.: Brookings Institution Press.Johnson C. (2013) China’s Th ird Plenum: Go BiG or Go home?, Washington, D.C.: Centre for Strategic & International Studies.Kostarelos K. (2014) We face being buried under an avalanche of Chinese science. Th e Guardian, 24.01.2014.Lindgren M. (2013) 21st Century Management: Leadership and Innovation in the Th ought Economy, London: Palgrave
Macmillan.Lindgren M., Bandfold H. (2003) Scenario Planning: Th e Link between Future and Industry, London: Palgrave Macmillan.Mai L. (2013) Th e urbanization solution. Global Times, 25.02.2013.Mendonça S., Cunha M.P., Kaivo-oja J., Ruff F. (2004) Wild Cards, Weak Signals and Organisational Improvisation. Futures, vol. 36, no 2,
pp. 201–218.Miller T. (2012) China’s Urban Billion: Th e Story behind the Biggest Migration in Human History (Asian Arguments), London: Zed Books.Mingqi X. (2013) Social, fi nancial woes loom for China’s expanding cities. Global Times, 25.02.2013.Monan Z. (2012) Turning point for growth. China Daily, 14.11.2012.Naisbitt J., Naisbitt D. (2010) China’s Megatrends: Th e 8 Pillars of a New Society, New York: Harper Business.NYT (2013) Desperation in Tibet. New York Times, 02.12.2013. Available at: http://www.nytimes.com/2013/11/30/opinion/desperation-
in-tibet.html, accessed 15.08.2015.NYT (2014) China Rethinks its judicial system. New York Times, 18.03.2014. Available at: http://www.nytimes.com/2014/03/18/opinion/
china-rethinks-its-judicial-system.html, accessed 15.08.2015.Orlik T. (2013) China faces big budget for needed reforms. Th e Wall Street Journal Asia, 01.03.2013.Orlik T., Davis B. (2013) Relief on China Growth Delivered with Caveats. Th e Wall Street Journal, 21.01.2013.Phemonoe Lab (2013) China: Hungry for Energy. Phemonoe Lab, 23.12 2013. Available at: http://phemonoe.eu/el/china-hungry-energy/,
accessed 12.06.2015. Sass S.L. (2014) Can China innovate without dissent? New York Times, 22.01.2014. Available at: http://www.nytimes.com/2014/01/22/
opinion/can-china-innovate-without-dissent.html, accessed 15.08.2015.Springut M., Schlaikjer St., Chen D. (2011) China’s Program for Science and Technology Modernization: Implications for American
Competitiveness, Arlington, VA: Centra Technology Inc.Stephens P. (2013) China has thrown down a gauntlet to America. Financial Times, 29.11.2013.SPI, UNU-MERIT, AIT (2014) STI China: Science Technology and Innovation Performance of China (D9: Final Report), Sociedade
Portuguesa de Inovação, United Nations University – Maastricht Economic and Social Research Institute on Innovation and Technology, Austrian Institute of Technology GmbH.
USPTO (2014) Report on Patent Enforcement in China, Alexandria, VA: U.S. Patent and Trademark Offi ce.van Rij V. (2013) New Emerging Issues and Wild Cards as Future Shakers and Shapers. Recent Developments in Foresight Studies
(eds. M. Giaoutzi, B. Sapio), New York: Springer Science & Business Media, pp. 67–92.Vielmetter Gr., Sell Y. (2014) Leadership 2030: Th e Six Megatrends You Need to Understand to Lead Your Company into the
Future, New York: AMACOM.Vltchek A. (2012) China dares to evolve diff erently. China Daily, 15.11.2012.Wolf Ch., Dalal S., DaVanzo J., Larson E.V., Akhmedjonov A., Dogo H., Huang M., Montoya S. (2011) China and India, 2025:
A Comparative Assessment, Pittsburgh: RAND Corporation.World Bank, China State Council (2013) China 2030: Building a Modern, Harmonious, and Creative Society, Washington, D.C.: World
Bank, Development Research Center of the State Council of the People’s Republic of China. DOI: 10.1596/978-0-8213-9545-5.Yang C. (2013) Price controls urged as property market soars. Global Times, 21.02.2013.Zhang W. (2012) Meritocracy versus Democracy. International Herald Tribune, 11.11.2012.
References

INNOVATION

18 FORESIGHT AND STI GOVERNANCE Vol. 10 No 3 2016
Innovation
Towards Future Customer Experience: Trends and Innovation in Retail
Professor. E-mail: [email protected] Rodríguez
Abstract
Retail companies today face new challenges with more intensified competition due to the accelerated pace
of technological change, more sophisticated management practices, and industry consolidation. Hence, retail companies have shifted their focus from not only boosting sales but also to ways of attracting and retaining customers. This paper offers a new perspective on how to improve the performance of retail organizations by enhancing the customer experience. It suggests that customer experience and the use of technology are fundamental drivers of consumer loyalty. We propose a new shopping experience model based on a synergic combination of design thinking and marketing intelligence methodologies. The role of technology in customer satisfaction is also integrated into
Keywords: customer experience; shopping experience design; retailing trends; innovation; design thinking; marketing intelligence; user-centered design; store loyalty
this novel approach. Based on this model, we developed a smartphone app and then applied it to a supermarket located in Monterrey, the third largest city in Mexico.
We conclude that technology-based resources can contribute to improving interactions between the store and customers, supporting the latter to make decisions about purchases. However, regardless of how advanced the technology is, these solutions cannot guarantee adding high value to organizations unless an integrated context analysis is used and managers implement appropriate design strategies that enhance customer experiences.
The current research has important implications for decision makers in business strategy, marketing intelligence, and strategic foresight, as well as retail practitioners.
DOI: 10.17323/1995-459X.2016.3.18.28
Researcher. E-mail: [email protected]
Francisco Paredes
Tecnológico de Monterrey, Escuela de Ingeniería y Ciencias Address: Avenida Eugenio Garza Sada 2501 Sur, Colonia Tecnológico, Monterrey, Nuevo León, 64849, México
Citation: Rodriguez M., Paredes F., Yi G. (2016) Towards Future Customer Experience: Trends and Innovation in Retail. Foresight and STI Governance, vol. 10, no 3, pp. 18–28. DOI: 10.17323/1995-459X.2016.3.18.28
Researcher, Higher Education Research Institute,Yancheng Teachers University. Address: Xiwang Avenue, Yancheng City 224051, Jiangsu Province, P. R. China. E-mail: [email protected]
Gaofeng Yi
2016 Vol. 10 No 3 FORESIGHT AND STI GOVERNANCE 19
In recent years, retailers have recognized the importance of improving customer experience as a key factor in business success [Verhoef et al., 2009; Levy and Weitz, 2012; Petermans et al., 2013], especially
with the emergence of online competitors that have created new markets and attracted customers through personalized services [Herring et al., 2014]. Future retailing will focus on engaging with customers at a personal level. This irreversible trend is based on enhancing satisfactory customer experiences at different levels — rational, emotional, sensorial, physical, and spiritual. To achieve this, retailers should consider a mindful balance between the deployment of progressive technology systems and the creation of new business models [Manyika et al., 2015]. Customer experience involves peoples’ cognitive and emotional assessments when making purchases [Klaus, Maklan, 2013]. From the perspective of Meyer and Schwager [Meyer, Schwager, 2007], it can be defined as a customer’s internal and subjective response to any direct or indirect contact with a company. Direct contact generally occurs during the purchase, use and service, and usually begins with the customer. Indirect contact often involves unplanned approaches to representations of a company’s products or services, including advertising, news reports, or reviews. Current service design theory is guided by technology and globalized consumer empowerment. Designing new customer experience strategies is considered an important aspect of service improvement. Unquestionably, they offer a valuable guide for improving the interactions between people and stores. Retail organizations offer a mix of products and services, for which numerous activities (e.g. the shopping process itself, interactions with store personnel, claims, and devolutions) directly influence the customer’s perceptions and experiences [Nadiri, 2011]. Retailers devote significant effort to understanding and satisfying their markets’ more sophisticated and challenging expectations [Gerritsen et al., 2014]. They are conscious that an effective service design strategy requires a new user-centered approach focused on improving points of interaction at the store [Clatworthy, 2011]. This new approach requires a market-driven analysis that recognizes the customer’s latent needs and desires, and determines gaps for improving current offers and developing new ones. Within this context, marketing intelligence emerges as an important alternative to understand users and their competitive environments [Jenster, Solberg, 2009]. Marketing intelligence can help quantify intuitions, contextualize markets, and scale opportunities. Combined with design, marketing intelligence can be used to integrate key trends into experience prototyping.Building on this, this study integrates features from two methodologies: design thinking and marketing intelligence. We propose a strategic model to understand and respond to customers’ desires by analysing their expectations and actions in a competitive environment. In the model, the use of emerging technology-based resources is championed to support customer experience during the shopping process.This paper starts by establishing the importance of retail businesses and the relevance of attaining close connections with customers. It also argues why value co-creation with customers should be the central focus of the design process. Furthermore, the paper illustrates the role of innovation and technology in satisfying customers and the accompanying store loyalty. Next, it analyses a broad literature related to design thinking and marketing intelligence methodologies, on the basis of which we develop our model. We then apply our model to a Mexican retail business (a supermarket) with the aim of proposing an innovative solution for improving customer experience. Subsequently, the paper makes policy recommendations and concludes. Finally, it discusses some limitations of the present study and possible avenues for future research.
Literature reviewThe retail businessResearch on the retail sector is considered one of the mainstays of the marketing field. It has become progressively wider and more global in scope. Retailers find themselves in a mature and competitive environment, in which clients’ expectations are continuously increasing and evolving [Grewal et al., 2009]. Customer satisfaction derived from their subjective fulfilment of their expectations will determine their continued store choice [Paul et al., 2016].Initially, retail theory focused on boosting sales in supermarkets, shopping centres, and convenience stores. Attention was mainly paid to the last stage of the supply chain, while fewer studies looked at the experiences produced during shopping [Berman, Evans, 2003]. However, now companies face new challenges with more intensified competition due to the accelerated pace of technological change, more sophisticated management practices, and industry consolidation [Sirohi et al., 1998]. This explains why their focus has expanded from sales and growth towards customer loyalty [Lewrick et al., 2015].Adopting new ideas related to customer experience has encouraged the retail industry to develop new strategies to increase customer satisfaction [Nadiri, 2011]. The shopping experience and ambience are the two main factors determining customer satisfaction in the large retail outlets [Paul et al., 2016].Creating a superior customer experience is the primary objective in today’s retailing environment [Verhoef et al., 2009]. Retailers have introduced a diversity of programmes to persuade and retain customers, including customer cards, discount coupons, special offers, and promotions [Bustos-Reyes, González-
Rodriguez M., Paredes F., Yi G., pp. 18–28

20 FORESIGHT AND STI GOVERNANCE Vol. 10 No 3 2016
Innovation
Benito, 2006]. However, current intensive competition among retailers demands that firms establish new strategies to generate better interactions between customers and stores; many of these strategies are based on technology-based resources. For example, the technology applications of the American retailer, Wal-Mart, are developed through two groups: one in Bentonville, which is more oriented to stores, and another in Silicon Valley, which handles the company’s global e-commerce [Miller, 2014].Store environments constitute a fundamental element to retail positioning and enhance shopping experiences [Levy, Weitz, 2012] regarding merchandise, service quality, and enjoyment [Zeithaml, 1988]. Technology-based resources can contribute to better interactions between the store and customers, supporting decisions about purchase or use, and creating a favourable online or physical environment. However, regardless of how advanced the technology, these solutions could also go unnoticed if managers do not establish appropriate design strategies that consider customer-generated experiences. Highly sophisticated technology solutions cannot guarantee adding high value to organizations if an integrated context analysis is not present. The use of technology intelligence methods such as scientific publications, patents, scenarios, portfolios, S-curves, benchmarking, Delphi or roadmapping can provide with sufficient evidence for an appropriate technological approach [Safdari Ranjbar, Tavakoli, 2015]. Moreover, retail managers should be aware of four aspects of technology: e-commerce, data analytics, inter-firm technology functions, and software platforms [Lewrick et al., 2015].In 1994, Kotler and Armstrong presented their ‘Triangle model’ for analysing company-customer, company-employee, and employee–customer relations throughout the deployment of interactive marketing activities [Kotler, Armstrong, 1994]. Two years later, Parasuraman presented the ‘Pyramid model’ to demonstrate that interactions among companies, employees, and customers are increasingly likely to be mediated by some form of technology [Parasuraman, 1996; Parasuraman, Grewal, 2000]. However, despite the accelerated pace of technology-based systems in retail, scholarly research on the impact of such systems on customers’ experiences is still in its nascent stage [Verhoef et al., 2009].
The role of innovation and technology in customer satisfaction and store loyaltyInnovation and the use of technology represent core elements to develop more satisfying shopping experiences; both enable ambiances that strongly impact customer persuasion [Sharma, Stafford, 2000].Technology’s potential has never changed as rapidly as now [Foley, Ferry, 2012]. Retailers are shifting to self-service technologies because they relieve the customer from having to queue up. These technologies include self-scanning, researching items online before buying them in the physical store, or looking through the products in store prior to purchasing them online (also known as showrooming) [Lewrick et al., 2015]. Table 1 depicts emergent technologies that foster customer experience.Retail organizations, especially large retail stores (supermarkets and malls), are expected to provide unique shopping experiences that could lead to customer satisfaction and store loyalty [Paul et al., 2016]. Hence, loyalty resulting from customer satisfaction is essential for any business to survive, succeed, and develop [Davis, 2013; Paul et al., 2016]. For loyal customers, the introduction of technology applications could be more relevant when making shopping decisions compared to price. This is because they are usually less sensitive to price variability and they play a key role in verbal publicity [Martos-Partal, González-Benito, 2013].As summarized in Table 2, the literature covers different approaches to clarify the importance of technology in customer satisfaction.Technology’s impact can be seen from customers’ perspectives, as well as from organizational performance metrics (e.g. market share, productivity, revenues) [Verhoef et al., 2009]. Unquestionably, technology plays a vital role in enhancing fruitful interactions that increase customer satisfaction.
Design thinkingIn recent years, important efforts have focused on the development of customer-centred design for a better understanding of customer behaviour. It is precisely an approach from the design field that we use in this study. Designers’ sensibility has helped them get a better understanding of people’s needs during their creative activity using different methodologies. The model presented here encompasses a design thinking methodology, a user-centred tool to develop new concepts, products, and services [Brown, 2008].Design thinking involves a strategic process to identify people’s desires, unsatisfied needs, and feelings resulting from interactions with a product or service. The main purpose is to improve the quality of life by positioning customers at the axis of design [Vianna et al., 2011]. During the design process, the designer undergoes a process of thinking, during which internal mental ideas and the external expressions of these ideas are combined and sketched to create a concept [Cross, 1999].According to Tim Brown’s approach [Brown, 2008], design thinking involves three basic steps, developed through a cyclical process with continuous feedback between stages:
1. Inspiration. This stage is focused on identifying and understanding a problem that could be transformed into an offering, whether a product or service. For this purpose, customer actions,

2016 Vol. 10 No 3 FORESIGHT AND STI GOVERNANCE 21
behaviours, and attitudes are observed involving the participation of experts from different areas (e.g. engineers, sociologists, and psychologists).
2. Ideation. In this step, brainstorming and sketching are conducted to produce possible solutions to the identified problem. Furthermore, prototyping is carried out and testing is performed to evaluate potential success and recognize possible adjustments. Market, technical, and economical feasibility are determined to find optimal solutions.
3. Implementation. This is the stage when the offering is brought to market. The global vision of the offering is accomplished on-site. Ensuring positive customer experiences is essential to success.
According to the approach of the Institute of Design at Stanford [IDS, 2010], the design thinking process is comprised of five stages:
1. Empathize. People’s physical and emotional needs are defined to understand the ways in which they conceive the world. Systematic observation is essential in this phase.
Technology DescriptionOmni-channel ‘Customers interact with a company using several different channels before making a purchase.
Differs from the traditional multi-channel concept because there is no longer channel A and channel B consumers. Instead, there is a single consumer base that interacts with retailers across all available channels’ [Dorman, 2013].
Electronic retailing (e-tailing)
‘Selling of retail goods electronically over the Internet’ [DMS retail, 2016].
Mobile commerce (m-commerce)
‘Internet retailing platforms using mobile phones, tablets, etc.’ [Euromonitor, 2016a].
Facebook commerce (F-commerce)
It allows to ‘present products, information and offers to consumers, as well as allow consumers to complete transactions within Facebook’ [Gartner, 2016].
Cloud computing ‘A model for enabling ubiquitous, convenient, on-demand network access to a shared pool of configurable computing resources (e.g., networks, servers, storage, applications, and services) that can be rapidly provisioned and released with minimal management effort or service provider interaction’ [Mell, Grance, 2011].
Augmented reality ‘Virtual objects appear to coexist in the same space as the real world’ [Azuma et. al., 2001]. This, for example, ‘enables customers to decide on a garment color without having to visit the change room.’ [Ramanan, Ramanakumar, 2014].
Drones Amazon is pioneering a drone-carrying system that intends to deliver products in under 30 minutes. It is capable of carrying packages weighing less than 55 pounds to locations within a 10-mile range [Amazon, 2016].
Internet of Things (IoT) Sensors and actuators connected by networks to computing systems. Examples in retail are unlimited, some of the most anticipated are automated checkout as clients walk out of the store, layout optimization based on a comprehensive analysis of in-store customer behaviour, or real-time personalized promotions [Manyika et al., 2015].
Source: compiled by the authors based on a review of the literature.
Таble 1. Emergent retail technologies
Description AuthorsTechnology is a major way to boost sales by means of contact with customers. [Berman, Evans, 2003; Meyer,
Schwager, 2007; Sharma, Chaubey, 2014]
Technology improves client satisfaction by creating a superior customer experience. In a retail environment, it is important to focus on the ‘right’ customers given the highly competitive markets.
[Sirohi et al., 1998; Verhoef et al., 2009]
Technology provides customers with more control over their access to and use of information than ever before. Technology-related developments, such as search engines, mobile devices, mobile interfaces, peer-to-peer communication vehicles, and social networks, have enhanced marketers’ ability to reach customers through new touch points.
[Shankar et al., 2011]
Technology has a significant impact on customer perceptions, including those determining customers’ lifestyles.
[Acosta et al., 2013]
Ethnographic analyses and field observations demonstrate that technology enhances interactions between people and social structures.
[Verganti, 2008; Jacobs, 2013]
Design activities — including those that involve the use of technologies — are important parts of the innovation process, particularly for identifying customer needs.
[Moon et al., 2013]
Deep customer understanding significantly aids in the design process and increases customer satisfaction. This process is enriched with technology-based resources.
[Brown, 2008; Vianna et al., 2011; Schneider, Stickdorn, 2011]
Web experience systems can be used for in-depth analyses of customer experiences in retail environments, enabling deeper insights into different experiential aspects.
[Petermans et al., 2013]
Technology enhances the quality of data analysis, identification of trends, customer needs, and strategies adopted by other firms.
[Pere et al., 1999]
Efficiency- and novelty-centred business model designs indirectly influence technological innovation performance.
[Hu, 2014]
Source: compiled by the authors based on a review of the literature.
Таble 2. Technology’s role in customer satisfaction
Rodriguez M., Paredes F., Yi G., pp. 18–28

22 FORESIGHT AND STI GOVERNANCE Vol. 10 No 3 2016
Innovation
2. Define. Analysis of information is made to discover connections and patterns of customer behaviour.3. Ideate. Concepts are generated according to the previous steps; techniques such as: prototyping,
brainstorming, bodystorming, mindmapping, and sketching are applied.4. Prototype. Iterative generation of solutions, where prototypes are built trying to accomplish the
previously generated insights.5. Test. Exhibition and testing with potential customers to gain knowledge about possible acceptability.
The generated insights are considered for feedback and proper adjustments.
Marketing intelligenceCustomer experience is influenced not only by internal but also by external factors. For a more complete understanding, it is important to consider the external environment of the company [Petermans et al., 2013]. In this context, a marketing intelligence (MI) methodology can provide a market-driven perspective, producing valuable insights regarding competition, technology, and social trends in specific market spaces. This is a future-oriented activity that adds value to the development of a business environment, providing reliable, timely, and objective business knowledge [Aaker et al., 2003; Jenster, Solberg, 2009].MI helps to understand, investigate, and assess the external environment in relation to events for a company, its customers, competitors, markets, and the industry overall; MI also helps to improve the decision-making process. It provides useful information for identifying and uncovering opportunities and threats, and enables organizations to anticipate changes and effectively respond with innovative products or services. For this reason, it is considered one of the fundamental capabilities for creating competitive advantage and driving retail success [Obeng et al., 2015]. MI has different domains related to two primary areas: marketing research and customer relationship marketing/database marketing (Figure 1).The MI process can be as comprehensive or narrow as a company requires, and the information it produces tends to create change. Our research integrates a MI approach that follows the five-stage intelligence cycle of [Jenster, Solberg, 2009] (Table 3).It is important to emphasize that commitment from top management is crucial for championing this MI process. In addition, when developing MI activity the size of the firm is also important. Small firms are less sensitive to the reliability and diversity of all information sources, in contrast to medium- and big-sized firms [Cacciolatti, Fearne, 2013].
MethodologyShopping Experience Design ModelBased on the above review of the literature, we propose a model called the Shopping Experience Design (Figure 2), which combines the features and steps of both the MI and design thinking methodologies. This study argues that integrating these two approaches can help retailers (and, particularly, supermarkets) understand customer needs during the shopping process. It also considers technology to be an element for obtaining superior customer experience, hence, increasing organizational performance. The main aim is to help organizations offer service solutions that increase customer satisfaction.
Figure 1. Domains of marketing intelligence
Forecasting of future trends and needs
Monitoring of stakeholders
Brand building
Selection of target segments Development
of new products
Quantitative and qualitative analysis
of market forces
Source: compiled by the authors.

2016 Vol. 10 No 3 FORESIGHT AND STI GOVERNANCE 23
Customer experience is at the heart of the Shopping Experience Design model (Figure 2). Marketers and designers can use this model to enrich the interactions between stores and their customers and increase customer satisfaction. In the model, we envision present and future trends in which technology applications could play a significant role. This approach could be deemed an innovative method to understand and gain insights about customers when interacting with a service.The model comprises six stages, starting with MI as the central axis. MI is then integrated into the different stages of the design thinking process, with the aim of enriching the user-centred design process (Table 4). This model requires the collaboration of multi-functional teams, including marketers and designers. Feedback among phases should be continuously promoted.
Case studyWe applied the Shopping Experience Design model to a company that has been a leader in the Mexican supermarket sector since 1968. The company currently operates more than 674 stores across the country. It is the second largest retailer of product variety in Monterrey and, at the time of this study, was adopting a new corporate identity. For privacy reasons, this company will be called ‘Opportunity’.
Phase Description1. Problem Formulation Planning activity and problem determination to guide MI efforts.2. Information Gathering Comprises internal and external data gathering. In this stage, marketers should collect objective and
empirical market research data and analyse the validity and reliability of facts, assumptions, and conclusions.
3. Analysis and Production Information should be organized and analysed to convey intelligence reports. The aim is to provide valid and reliable interpretations of facts.
4. Presentation Requires a communication environment that facilitates horizontal and vertical dissemination of intelligence.
5. Feedback Assessment of obtained insights, executives with substantial industry experience can provide maturity and credibility to intelligence interpretation tasks.
Source: compiled by the authors based on [Jenster, Solberg, 2009].
Таble 3. Competitive intelligence cycle
Deepen Recognize Explore Inspire Transform Develop
Implementing marketing
intelligence cycle
Establishing target market
segments
Selecting elements of experience
and emotional factors
Generating concepts
Developing prototypes
Implementing new retail
service
Evaluating current
experience
Information collection
Analysis
EvaluationDelivering
results
Planning and direction
Projecting new expectatives of
customers
Figure 2. Shopping Experience Design
Source: compiled by the authors.
Rodriguez M., Paredes F., Yi G., pp. 18–28

24 FORESIGHT AND STI GOVERNANCE Vol. 10 No 3 2016
Innovation
Stage Description1. Deepen Involves developing market analysis from the perspective of intelligence to identify current trends and
improvements to solutions linked to the organization's business.2. Recognize Analyses the strengths and weaknesses of the organization from an intelligence perspective, considering and
establishing its target market.3. Explore Includes an examination of customer behaviours, including touch-points that are present during the shopping
experience. This stage is the most important because it performs an ethnographic analysis to identify customers’ interaction levels with each point.
4. Inspire The knowledge generated during the previous phases is analysed to develop solutions for improving customers’ shopping experiences.
5. Transform Involves the development of prototypes with the aim of materializing the features and benefits that the new product or service can bring.
6. Develop Involves implementing the new service or developing the final product in order to evaluate the results, improve the proposal, and measure the level of enhancement of customers’ experiences.
Source: proposed by the authors.
Таble 4. Stages of Shopping Experience Design
We note that our proposed approach is intended primarily for an emerging market. Currently, 2.6 billion people (one third of the world population) live in emerging-market cities. This figure is expected to reach 3.9 billion people by 2030, while developed-market cities are only expected to grow by 100 million people [Capizzani et al., 2012].Mexico is a promising land for retail due to its growing middle-class. In 2015, the retail sector grew by 5% [Euromonitor, 2016b]. It is expected to keep rising with the continued growth of the middle-class: 3.8 million households are expected to become middle-class by 2030 [Euromonitor, 2015].This store has several loyalty programmes, including giveaways, promotions, delivery shopping, phone ordering and agreements with other organizations. Their main programme is a reward system, wherein customers are able to trade cumulated points for certain products. However, in recent years, the store has struggled to retain customers, particularly since they have a diversity of channels (e.g. online, telephone, or traditional brick-and-mortar stores). Meanwhile, Monterrey has experienced an aggressive increase in the number of small stores near consumers’ homes, which are successfully competing with the big supermarkets. Given this situation, ‘Opportunity’ decided to explore a new solution to improve customers’ shopping experiences and to introduce a culture of customer satisfaction within the company.In the next section, we describe each stage of the Shopping Experience Design model as applied to the study of the ‘Opportunity’ company.
ResultsStage 1. DeepenThis phase is focused on the deployment of the MI Cycle: Planning and Direction
Planning should include not only the activities and people in charge, but also the allocation of resources and monitoring indicators. This activity was developed aligned to the specific needs of the involved company.
Information CollectionPrimary and secondary information were collected with the purpose of identifying market changes since 2012 until the present. Four main competitors of the company were identified, and their main strategies to attract and retain customers were classified in terms of technology use, service management, and campaigns. The information was collected by analysing the competitor’s’ websites and visiting supermarkets. Additionally, we analysed scholarly papers in the fields of innovation and market trends, as well as statistical databases and reports.
AnalysisBy analysing the obtained results, we were able to garner the following insights (Table 5).
Delivering Results and EvaluationThe analysis determined that the main competitors of ‘Opportunity’ have focused their strategies on providing better shopping process services through both physical and digital solutions. Mobile technology has become an essential part of consumers’ current lifestyles. The competition for larger participation in this industry will continue to grow in the coming years.
Stage 2. RecognizeAt this stage, we carried out an internal analysis of the company by evaluating its philosophy, target market, future plans, and external environment movements. Currently, Opportunity’s mission is to satisfy the

2016 Vol. 10 No 3 FORESIGHT AND STI GOVERNANCE 25
Source of information
General trends
Competitors • The ‘Opportunity’ company has four main direct competitors, which offer a wide diversity of services to their customers without taking advantage of mobile applications: they only use web 2.0 and network information systems.
• Only one competitor advertises social activities through their website.• Two of the competitors use technology applications as a resource to facilitate customer contact, either by
simplifying actions (e.g. through shopping lists or reward points) or by enabling better communication of suggestions and complaints.
Databases • The retail industry in Mexico has shown continuous growth. ‘Opportunity’ leads sales.• Supermarkets represent 20% of the Mexican retail market.• The company in our case study has faced annual declines in sales of up to 0.04%, while the main competitor has
increased its sales by 0.01% annually during the last few years.• Although the company that was studied is the market leader with 55 branches in Monterrey, their sales volume is
lower than their competitors.Specialized reports
• In the future, Mexican consumers, mainly young people, will increasingly use technology applications to facilitate their shopping process.
• From 2020, the use of digital resources will become an important factor for the development of shopping processes among consumers.
Source: compiled by the authors.
Таble 5. Insights by source of information
product and service needs of customers by encouraging the development of enduring relationships with clients, society, and the environment. The company’s vision is to offer the best customer experience and a comfortable working ambiance. With regard to market segmentation, this company serves the middle-class (C/C- level).
Stage 3. ExploreTools like client tour mapping and touch-point analyses were applied to identify areas for improvement within the supermarket. As Figure 3 shows, some of the main touch-points that were detected included shop-and-move decisions (touch-point A), the store entrance (touch-point B), product searches (touch-point C), payment for products (touch-point D), and movements of products (touch-point E). At different days and times, we observed 110 people while they shopped in the store. Additionally, many of these customers agreed to participate in an interview to explain the characteristics of their purchasing process.Based on this analysis, we found the most significant factors during the shopping process to be the practicality and efficiency in terms of finding promotions and delivery options.
Shopping planning
Going to the store
Arriving
Taking a shopping cart
Searching for products
Checking product prices
Waiting for payment
Paying
Taking shopping to final destination
Storing products ФИНИШ
START
SEARCH
FINAL
А
C
B
D
E
Figure 3. Touch-point analysis interface
Source: compiled by the authors.
Rodriguez M., Paredes F., Yi G., pp. 18–28

26 FORESIGHT AND STI GOVERNANCE Vol. 10 No 3 2016
Innovation
Products category
Date
Source: designed by the authors.
Figure 4. App home screen Figure 5. Daily available offers display
Source: designed by the authors.
Stage 4. InspireTh is stage included a brainstorming and subsequent association of solutions based on previous analyses. Th e fi nal proposal was to develop a digital tool to enhance customers’ shopping experiences: an app to facilitate communications between customers and the supermarket regarding products, services, and off ered promotions.
Stage 5. TransformTh is stage included the development of sketches of smartphone apps. Th e designs were conceived fi rstly using Corel X7 design soft ware, taking into consideration all the characteristics of an app. As illustrated in previous sections, the Shopping Experience Design model (Figure 2) promotes feedback among phases where the top management must be committed to the process. Th erefore, before testing the designed prototype, executives from ‘Opportunity’ gave us feedback and recommendations that were included into the app. Aft er this requirement was met, the prototype design was tested to measure customers’ responses.Th e proposed app allows clients to navigate between the store departments and see the available daily off ers (Figures 4-5). Th e prototype was very well perceived, including the additional features: online shopping including product delivery to the customer’s home, and a safe taxi service if the customer prefers to go to the store (Figure 6). Both these additional features can be charged to the total purchase cost.76% of the interviewees indicated that this digital resource would improve their shopping experience and satisfaction by making the process more effi cient and friendly. Th ey also suggested that it would be useful to include functions such as the locations of products, the monitoring of discounts, and taxi services in addition to home delivery.
Stage 6. DevelopmentTh e company involved would be in charge of further implementation. Aft er the proposed app was tested during the Transform stage, company managers agreed that it was properly designed and demonstrated strong interest in implementing it in a forthcoming project.
Conclusions and RecommendationsTh e proposed Shopping Experience Design model outlines a design activity with a broader perspective by considering two fundamental methodologies: design thinking and MI. Elements from both methodologies are integrated into a synergic and cyclical model in which customer experience is central. Using this approach, it is possible to get a deeper understanding of customers’ expectations and identify
Source: designed by the authors.

2016 Vol. 10 No 3 FORESIGHT AND STI GOVERNANCE 27
Rodriguez M., Paredes F., Yi G., pp. 18–28
Source: designed by the authors.
Figure 6. App additional features
the external events that may strategically impact the design. We showed that the use of technology is a key factor in creating strong and enduring relationships between people and products or services, and that the customer experience produced during the shopping process can be improved via this methodology.Th e proposed model promotes the use of technology to improve customer interactions and experiences. Examples of applications include apps for smart phones, hologram systems in aisles, and intelligent advisors.Our study found that the Shopping Experience Design model is viable. Th e results of testing it in our case study gave important insights that led to the development of an innovative solution that was accepted by 76% of the customers involved in the study. Our testing showed that the shopping experience can be signifi cantly improved in this way.Th e above conclusions underline that customer experience and use of technology are fundamental drivers for attracting and retaining customers. Our study has implications for decision makers in business strategy, marketing intelligence, as well as retail practitioners.Th is paper presented an approach based on a proposed theoretical model. We tested this model at one retail store, for which we then developed a specifi c technological solution. However, future research should involve testing the app in more branches of the company, adding more features to the app, or even applying it to other types of retail services.
Aaker D., Kumar V., Day G.S., Leone R. (2003) Marketing Research (9th ed.), New York: John Wiley and Sons.Acosta M., Elizondo M., Molina V., García G., Ramos L. (2013) La innovación como proceso interactivo: Estudio descriptivo del sistema
regional de innovación de Coahuila. Revista Internacional Administración & Finanzas, vol. 6, pp. 89–107.Amazon (2016) Amazon Prime Air. Available at: https://www.amazon.com/b?node=8037720011, accessed 03.06.2016.Azuma R., Baillot Y., Behringer R., Feiner S., Julier S., MacIntyre B. (2001) Recent advances in augmented reality. Computer Graphics and
Applications, IEEE, vol. 21, no 6, pp. 34–47.Berman B.R., Evans, J.R. (2003) Retail Management: A Strategic Approach (9th ed.), Upper Saddle River, NJ: Pearson Education.Brown T. (2008) Design thinking. Harvard Business Review, vol. 86, pp. 84–96.Bustos–Reyes C.A., González–Benito Ó. (2006) Papel del formato comercial en la lealtad al establecimiento minorista. Información Comercial
Española, ICE: Revista de economía, vol. 828, pp. 269–288.Cacciolatti L., Fearne A. (2013) Marketing intelligence in SMEs: Implications for the industry and policy makers. Marketing Intelligence and
Planning, vol. 31, pp. 4–26.Capizzani M., Huerta F.J.R., e Oliveira P.R. (2012) Retail in Latin America: Trends, Challenges and Opportunities (IESE Business School Study
no 170), Barcelona: University of Navarra.Clatworthy S. (2011) Service innovation through touch–points: Development of an innovation toolkit for the fi rst stages of new service
development. International Journal of Design, vol. 5, pp. 15–28.Cross N. (1999) Design Research: A Disciplined Conversation. Design Issues, vol. 15, no 2, pp. 5–10.
References
Th is research was supported by Tecnológico de Monterrey through Centro de Innovación en Diseño y Tecnología and its research group in Advanced Manufacturing.

28 FORESIGHT AND STI GOVERNANCE Vol. 10 No 3 2016
Innovation
Davis L.Y. (2013) Let us go shopping: Exploring Northwest Chinese consumers’ shopping experiences. International Journal of Consumer Studies, vol. 37, pp. 353–359.
DMS (2016) E-tailing and multi-channel retailing. Available at: http://www.dmsretail.com/etailing.htm, accessed 06.06.2016.Dorman A.J. (2013) Omni-channel retail and the new age consumer: An empirical analysis of direct-to-consumer channel interaction in the
retail industry (CMC Senior Theses, Paper 590), Claremont, CA: Claremont McKenna College. Available at: http://scholarship.claremont.edu/cmc_theses/590, accessed 06.06.2016.
Euromonitor International (2015) Mexico: It’s all about the Middle Class. Available at: http://blog.euromonitor.com/2015/10/mexico-its-all-about-the-middle-class.html, accessed 12.01.2016.
Euromonitor International (2016a) Internet Retailing in Mexico. Available at: http://www.euromonitor.com/internet-retailing-in-mexico/report, accessed 12.01.2016.
Euromonitor International (2016b) Retailing in Mexico. Available at http://www.euromonitor.com/retailing-in-mexico/report, accessed 12.01.2016.
Foley A., Ferry B. (2012) Technology for people, not disabilities: Ensuring access and inclusion. Journal of Research in Special Educational Needs, vol. 12, pp. 192–200.
Gartner (2016) Facebook Commerce (F-Commerce). Available at: http://www.gartner.com/it-glossary/facebook-commerce-f-commerce/, accessed 02.06.2016.
Gerritsen B.H., Soilen K.S., De Visser P.B., Hoogreef P.J., Hulst K., Janssen M.L., Horselenberg L., Van Dijk R.R., Consenheim E. (2014) Social media coming to the mall: A cross–channel response. Product development in the socio–sphere: Game changing paradigms for 21st century breakthrough product development and innovation (ed. D. Shaefer), New York: Springer International Publishing, pp. 169–235.
Grewal D., Levy M., Kumar V. (2009) Customer Experience Management in Retailing: An Organizing Framework. Journal of Retailing, vol. 85, pp. 1–14.
Herring L., Wachinger T., Wigley C. (2014) Making stores matter in a multichannel world. Perspectives on retail and consumer goods, no 3, pp. 4–12.
Hu B. (2014) Linking business models with technological innovation performance through organizational learning. European Management Journal, vol. 32, pp. 587–595.
IDS (2010) Bootcamp bootleg, Stanford, CA: Institute of Design at Stanford.Jacobs H. (2013) Co–innovation through multiple social identity processes. European Business Review, vol. 25, pp. 42–64.Jenster P., Solberg S.K. (2009) Market intelligence: Building strategic insights, Køge, Denmark: Copenhagen Business School Press.Klaus P., Maklan S. (2013) Towards a Better Measure of Customer Experience. International Journal of Market Research, vol. 55, pp. 227–246.Kotler P., Armstrong G. (1994) Principles of Marketing, Upper Saddle River, NJ: Prentice Hall. Levy M., Weitz B. (2012) Retailing Management, New York: McGraw–Hill, Irwin Publishers.Lewrick M., Williams R., Omar M., Tjandra N., Lee Z. (2015) Radical and Incremental Innovation Effectiveness in Relation to Market
Orientation in the Retail Industry: Triggers, Drivers and Supporters. Successful Technological Integration for Competitive Advantage in Retail Settings (ed. E. Pantano), Hershey, PA: IGI Global, pp. 239–268.
Manyika J., Chui M., Bisson P., Woetzel J., Dobbs R., Bughin J., Aharon D. (2015) The Internet of Things: Mapping the Value beyond the Hype, McKinsey Global Institute. Available at: https://www.mckinsey.de/sites/mck_files/files/unlocking_the_potential_of_the_internet_of_things_full_report.pdf, accessed 09.06.2016.
Martos-Partal M., González-Benito Ó. (2013) Studying motivations of store-loyal buyers across alternative measures of behavioural loyalty. European Management Journal, vol. 31, pp. 348–358.
Mell P., Grance T. (2011) The NIST definition of cloud computer, Gaithersburg, MD: National Institute of Standards and Technology.Meyer C., Schwager A. (2007) Understanding customer experience. Harvard Business Review, vol. 85, pp. 117–126.Miller M. (2014) How Walmart uses technology to connect online. Available at: http://forwardthinking.pcmag.com/none/324483–how–
walmart–uses–technology–to–connect–online–retail, accessed 13.07.2015.Moon H., Miller D., Kim S. (2013) Product design innovation and customer value: Cross–cultural research in the United States and Korea.
Journal of Product Innovation Management, vol. 30, pp. 31–43.Nadiri H. (2011) Customers’ zone of tolerance for retail stores. Service Business, vol. 5, pp. 113–137.Obeng E., Prescott J., Hulland J., Gilbert R., Maxham III J. (2015) Retail capability systems. AMS Review, vol. 5, pp. 103–122.Parasuraman A. (1996) Understanding and leveraging the role of customer service in external, interactive and internal marketing. Journal
of Service Research, vol. 2, no 4, pp. 307–320.Parasuraman A., Grewal, D. (2000) The Impact of Technology on the Quality–Value–Loyalty Chain: A Research Agenda. Journal of the
Academy of Marketing Science, vol. 28, pp. 168–174.Paul J., Sankaranarayanan K.G., Mekoth N. (2016) Consumer satisfaction in retail stores: Theory and implications. International Journal
of Consumer Studies (online version published before inclusion in an issue). Available at: http://onlinelibrary.wiley.com/doi/10.1111/ijcs.12279/abstract, accessed 14.06.2016.
Pere E., Rodríguez–Salvador M., Maspons–Moch R. (1999) Mapas tecnológicos y oportunidades de mercado. Proceedings of the VIII Seminario bianual latinoamericano de gestión tecnológica ALTEC, Valencia, Spain, pp. 318–325.
Petermans A., Janssens W., Cleempoel K. (2013) A holistic framework for conceptualizing customer experiences in retail environments. International Journal of Design, vol. 7, pp. 2–18.
Ramanan J., Ramanakumar K. (2014) Trends in retail. International Journal of Business and Management Invention, vol. 3, pp. 31–34.Safdari Ranjbar M., Tavakoli G.R. (2015) Toward an inclusive understanding of technology intelligence: A literature review. Foresight,
vol. 17, no 3, pp. 240–256.Schneider J., Stickdorn M. (2011) This is service design thinking, New Jersey, NJ: John Wiley and Sons Publishers.Shankar V., Inman J., Mantrala M., Kelley E., Rizley R. (2011) Innovations in shopper marketing: Current insights and future research issues.
Journal of Retailing, vol. 87, pp. 29–42.Sharma A., Stafford T. (2000) The Effect of Retail Atmospherics on Customers’ Perceptions of Salespeople and Customer Persuasion:
An Empirical Investigation. Journal of Business Research, vol. 49, pp. 183–191.Sharma M., Chaubey D. (2014) An empirical study of customer experience and its relationship with customer satisfaction towards the
services of banking sector. Journal of Marketing and Communication, vol. 9, pp. 18–27.Sirohi N., McLaughlin E., Wittink D. (1998) A model of consumer perceptions and store loyalty intentions for a supermarket retailer.
Journal of Retailing, vol. 74, pp. 223–245.Verganti R. (2008) Design, meanings and radical innovation: A metamodel and a research agenda. Journal of Product Innovation Management,
vol. 25. pp. 436–456.Verhoef P., Lemon K., Parasuraman A., Roggeveen A., Tsiros M., Schlesinger L. (2009) Customer Experience Creation: Determinants,
Dynamics and Management Strategies. Journal of Retailing, vol. 85, pp. 31–41.Vianna M., Vianna Y., Adler I., Lucena B., Russo B. (2011) Design Thinking: Business Innovation, Rio de Janeiro: MJV Press.Zeithaml V. (1988) Consumer perceptions of price, quality and value: A means ends model and synthesis of evidence. Journal of Marketing,
vol. 52, pp. 2–22.

SPATIAL DEVELOPMENT AND INNOVATION: RUSSIAN PRACTICE
SPECIAL SECTION

Spatial Development and Innovation: Russian Practice
30 FORESIGHT AND STI GOVERNANCE Vol. 10 No 3 2016
The guiding concept of EU cohesion policy, smart specialization, emerges from a regional focus. EU states and many others have adopted planning measures to foster local innovation in order to benefit
regional and national growth. As highlighted in some of the articles in this issue, smart specialization promotes the welfare of cities of all kinds, including those falling behind as well as those more advanced. In the world’s most competitive cities, researchers, entrepreneurs and policy makers achieve partnerships and firms in the regions as well as capitals have global ties [Tödtling, Trippl, 2005]. In less competitive cities, and parts of cities, place-based policies can help turn single industry towns into less compact polycentric urban regions [Musterd et al., 2006]. Regional and urban-oriented cohesion policy reflects a systems approach to both distribution and innovation, a spatial development plan to integrate networks and trade for faster-paced growth. Initiatives, forged in STI governance concepts, focus on enhancing demand and improving supply chains to boost local capacity to absorb new technologies. This is a policy for distributed growth and for powerful local outreach to global innovation. The regional strategy approach reflects theoretical work in the new economic geography and an analytical shift among EU policy leaders in alignment with thinking on the knowledge economy. Public policy, coordinated among sectors and social programs, aims to narrow the wide income gaps among regions distant from each other in large federations such as the EU and the Russian Federation. Indeed, globally, as well as in Europe, the regional income gap is larger than the gap among nations. Putting regional disparities forward as a point of departure for the great share of cohesion aid acknowledges the sharp departure in recent years from development policies of the past few decades. In the 1970s, international agencies, such as the World Bank and the IMF grew in influence due to development economists who then focused on basic needs, employment and redistribution. In the 1980s, however, widespread indebtedness, largely in response to a sharp rise in oil prices, shifted their orientation to stabilization and the reduction of public sector employment and programs in health and education, shrinking the state in a widespread consensus on macroeconomic priorities. Retreat from structural adjustment orientation followed mainly from the massive loss of manufacturing jobs in the 1980s and 1990s drew European policy planners back to their concern with poverty reduction and industrial policy. To these social concerns, they showed their adoption of the systems approach from STI policy in several directions toward long term planning and lagging productivity growth. Endogenous growth theory sharpened their concern about improving human capital, and evolutionary economics underscored its foundation in the framework of policies to strengthen knowledge, learning and institutions. The new knowledge is based on a paradox: while accelerating globalization and the role of the information-driven knowledge economy may seem to reduce the importance of proximity for firm performance, it is now clear that the reverse is true; geographic proximity generates agglomerative advantage, and city regions surge forward as the locus of economic development [Enright, 2000; Asheim et al., 2006]. The theory of place-based policy intervention, therefore, rests on the importance of integrating or coordinating technology policy and industrial policy [Lundvall, 1999; Nelson, Romer, 1996]. It also rests on the potential of regions to respond to policies, whose success depends on the absorption capacity of
Spatial Development and Innovation in Russia
Director, Center for Russian Studies, Presidential Academy of the National Economy and Public Administration (Russia); Leading Research Fellow, Institute for Regional Studies and Urban Planning, National Research University Higher School of
Economics (Russia); and Professor Emeritus, Oxford University, UK. E-mail: [email protected]
Carol Leonard
Address: 82 / 1, Vernadsky prospekt, Moscow 119571, Russian Federation
Citation: Leonard C. (2016) Spatial Development and Innovation in Russial. Foresight and STI Governance, vol. 10, no 3, pp. 30–33. DOI: 10.17323/1995-459X.2016.3.30.33

2016 Vol. 10 No 3 FORESIGHT AND STI GOVERNANCE 31
local institutions, their capability of absorbing new technologies and making effective use of research connections and government start-up co-funding. One illustration of a regional systems approach, or coordinated technology and industrial intervention, is the green innovation and clustering policies. Policies must address communities with widely divergent technological trajectories and sub-national governance styles; some more than others have interest and background in sustainability and renewable energy. A systems approach aims to bridge knowledge gaps and channel new networks of knowledge from diverse platforms of economic activity across these different and sometimes distant regions [Cooke, 2010]. There is a large element of unpredictability, to be sure, in sometimes untested policy initiatives.The main kind of regional innovation policies in Russia, therefore, rest on extensive research and regional statistics. From a growing empirical database, projected outcomes of cluster and other integrated STI policies are published in this journal Foresight and STI Governance (https://foresight-journal.hse.ru/en/). In the 3rd issue (2012), Abashkin and his colleagues [Abashkin et al., 2012] review the recent history of government policy. They show the degree to which the outcome of programs depends upon potential for improvement, especially in the business environment. They trace the empirical data behind recent pilot initiatives for innovative clusters, and they assess the strength of older territorial-industrial clustering. Territorial clusters have been constructed by reviving traditional networks and supply channels from the Soviet era as well as stimulus grants to encourage innovative governance, entrepreneurship, and the adoption of new technologies. Abashkin et al. also show the importance of the policy models upon which plans are in part based. Although cluster initiatives have been developed in nearly one-half of the states of Europe, some present particularly successful results, including the German BioRegio and InnoRegio projects and the French Competitive Clusters, which they describe. Some of the challenges that face Russian regional innovation policies are reviewed in this issue. One is the enormous complexity of urban agglomerations in general and clusters, in particular, involving so many different state and private sector actors, from large and smaller firms, capital providers, and regional and local authorities that can lead to unpredicted outcomes. The density of involved networks can be more important for the long-run outcome of shared innovation than the state’s initial stimulus. In the issue, articles show Russian research on applications of Regional Innovation Systems (RIS) to Russian regions and cities. They present qualitative and quantitative estimates of effective policy directions for the future, and they draw on extensive data locally available through ISSEK and other Russian institutes and universities. The first article is on cluster selection policy, also a measurement issue. Zemtsov et al., in the ‘Potential High-Tech Сlusters in Russian Regions: From Current Policy to New Growth Areas, raise concerns about the degree to which current measurement indicators predict efficient investment in clusters. The aim of their work is to develop, or refine, a tool determining the selection of future clusters, drawing on the considerable survey and output data for several rounds of applications just submitted. The authors project that for post-recession Russia the main way to be competitive in global spending on R&D will be to improve the efficiency of innovation space. They link sectors and locations that can be clearly identified for pilot clusters. The development and testing of analytic tools, they conclude, is only one step towards improving the efficiency of cluster policy in Russia, since in Russia, as in Europe, it can be difficult to bring together the theory and the expertise with the empirical reality. More clarification of what makes for success and more testing of those qualities is needed to refine theoretical understandings of the effective results of spending. For example, the literature shows the importance of the number of participants in a cluster, the dominance of private sector operations and the substantial presence of small and medium-size enterprises, but how can these criteria be used comparatively in particular cases for the evaluation of potential success? The empirical data, they argue, in the Baysian method, should be used in the testing and refinement of those theories. The empirical focus in this work is the indexing of sectors by innovative potential, and the linking of that to the contextual analysis of the regional economic structure. From these indices, they estimate the likelihood that clusters can be successful and funded efficiently. This work contains an invaluable discussion of the key industries of focus for investment in clusters, pharmaceuticals, petrochemicals and automotive industries. The authors point out that there are far more numerous sites for cluster initiatives than previously thought, although current cluster locations in these areas are demonstrating strong positive results.Two other contributions in this issue are introduced here to review Russian studies of urban innovation policy planning. In Zamyatina and Pilyasov’s ‘Single-Industry Towns of Russia: Lock-In and Drivers of Innovative Search’, the authors focus on managerial support for the unexpected, for community building, and for a new industrial policy. They argue that the main barrier to the introduction of support for new enterprises, and new ways of managing unemployment, is a cognitive one. That is, in the search for ways around challenges affecting small cities that are dependent upon single industrial firms, policy
Leonard C., pp. 30–33

Spatial Development and Innovation: Russian Practice
32 FORESIGHT AND STI GOVERNANCE Vol. 10 No 3 2016
planners too often narrow their efforts and fail to include at the planning stage those most affected, the unemployed and the communities. This work is rich in its discussion of cases, some Russian mono-industrial towns that have failed to retain the younger population by innovative programs, and some that have succeeded. They document the self-organizing force of local citizens in getting tasks done, such as the building of a bridge, without the help of expensive imported machinery. The authors find ground for optimism in the number of programs aimed at training local entrepreneurs and reducing regulatory barriers to tourism and other local industries. They also see urgency, however, in the take-up of more community-based planning models, especially requiring a more flexible managerial style. To resolve urgent issues, in the instance of a crisis of unemployment in some towns, they see a role for management consultants who can communicate with communities in the short run to build strong solutions for the long run. Another article on urban innovation is by Boykova, Ilina and Salazkin, the ‘Smart City Approach as a Response to Emerging Urban Challenges’. The article provides an important review of how smart city policies can be more effective. The focus here, as above, is on the management style, the inclusion of diverse management tools to develop projects, so that communities and resources can combine to make better services and governance. They show that “smart” can be applied not only to an energy grid or telecommunications infrastructure. They see current management styles as insufficiently flexible, insufficiently responsive to community voices, and excessively reliant on technologies to ease communications and joint endeavors. The article thus addresses the global policy interest in smart cities, while it also presents the results of survey research on Russia’s regions. A special expert survey conducted by the HSE Research Institute for Regional and Urban Planning in 2015 allowed them to evaluate the future prospects for diffusing the ‘smart city ‘ concept in Russian cities. They show that for the population, familiar with the idea of a smart city, its constraints seem real, especially in funding required to produce the intelligent infrastructure. On the whole there was a considerable appeal in smart city design, although surveys do not report awareness of how important citizen involvement can be. The conclusion of this work is that smart city design will make progress in particular sectors, such as utilities and, especially, in power supply, but the sweeping way in which intelligent management and ICT infrastructure could be used by citizens and communities to assist urban planning is an embryonic idea in Russia, as elsewhere. Makarov et al. show in “Modeling the Development of Regional Economy and an Innovation Space Efficiency” that university science can provide important guidance to policy makers about efficiently funding innovation. They address a central concern in current global innovation policy, the considerable state expenditure sometimes without clear results: measurement of the efficiency of spending on development initiatives. Efficiency of spending has grown in importance as an issue across Europe and the US in the post-recession era. The rapid reduction of R&D government spending has had discouraging results. Crisis triggered stagnation or decline in innovative activities in OECD countries has been extensive [OECD 2012, p. 3]. Meanwhile, among emerging countries with a still significant growth rate, China doubled spending on R&D between 2008 and 2012, and this has made it a major driver of global R&D [OECD 2014, p. 5]. In order to be competitive, it is important for post-recession countries to capture the impact not only of government spending. The design of support must include business, universities and public research organizations, which are critical partners with government to enhance innovation potential. The linkages, write Makarov et al, between public and private are increasingly broad and dense, with increasing numbers of new actors and forms of design and delivery. It is crucial that with funds to address these developments not yet back to pre-crisis levels, and corporate margins still deteriorating, policy practitioners systematize and strengthen their evaluative procedures. Makarov et al., below, present a Computable General Equilibrium (CGE) model of production in regional innovative space, using the Republic of Bashkortostan as an example. They then estimate scenarios in response to potential funding changes to show their impact on the size of the innovation space, which they define roughly as follows: The common infrastructure for innovation is the set of organizations that create new knowledge, innovative enterprises that develop new technologies, products and services, and the institutional research community that influences the process. This set is a resource for innovation activity, or a common space of innovation. It consists of all the potential links between the community of organizations that create new knowledge and the innovative enterprises that commercialize it. The number these links is the size of the innovation space.Combining new product and service technologies with the interaction space forms a design of quantitative indicators for a single region (constituting the Regional Innovation System, or RIS). The model estimates

2016 Vol. 10 No 3 FORESIGHT AND STI GOVERNANCE 33
a region’s production capacity (in 2010, 2011, 2012) by looking at seven actors, including state and non-state institutions of higher education and other scientific organizations, innovative enterprises, other branches of the economy, consumers (households), the regulatory authority, the banking sector and the outside world. The scenarios include increasing and reducing funding (including by tax incentives) for science education and innovation and innovative enterprises in their impact on the annual rate of growth of regional product to 2030. The results confirm the dependence of product and services innovation outcomes on the size of the innovation space. They suggest policy implications show a large impact of especially long-term investments. They also emphasize the potentially large role to be played by regional authorities in expanding the innovation space and by promoting interaction between the state, the firms, and the scientific and educational community over the long run.
Abashkin V., Boyarov A., Kutsenko E. (2012) Klasternaya politika v Rossii: ot teorii k praktike [Cluster Policy in Russia: From Theory to Practice]. Foresight-Russia, vol. 6, no 3, pp. 16–27 (in Russian).
Asheim B.T., Cooke P., Martin R. (2006) The rise of the cluster concept in regional analysis and policy. Clusters and regional development: Сritical reflections and explorations (eds. B.T. Asheim, P. Cooke, R. Martin), London: Routledge, pp. 1–29.
Cooke P. (2010) Regional innovation systems: Development opportunities from the ‘green turn’. Technology Analysis & Strategic Management, vol. 22, no 7, pp. 831–844.
Enright M.J. (2000) Survey on the characterization of regional clusters: Initial results, Hong Kong: University of Hong Kong.
Lundvall B.A. (1999) Technology policy in the learning economy. Innovation policy in a global economy (eds. D. Archibugi, J. Howells, J. Michie), Cambridge: Cambridge University Press, pp. 19–34.
Musterd S., Bontje М., Ostendorf W. (2006) The changing role of old and new urban centers: The case of the Amsterdam region. Urban Geography, vol. 27, no 4, pp. 360–387.
Nelson R.R., Romer P.M. (1996) Science, economic growth, and public policy. Challenge, vol. 39, no 1, pp. 9–21.Tödtling F., Trippl M. (2005) One size fits all?: Towards a differentiated regional innovation policy approach.
Research Policy, vol. 34, no 8, pp. 1203–1219.
References
Leonard C., pp. 30–33

Spatial Development and Innovation: Russian Practice
34 FORESIGHT AND STI GOVERNANCE Vol. 10 No 3 201634 FORESIGHT AND STI GOVERNANCE Vol. 10 No 3 2016
Potential High-Tech Сlusters in Russian Regions: From Current Policy
to New Growth Areas
Senior Research Fellow, Laboratory for Research on Corporate Strategies and Firm Behaviour Studies. E-mail: [email protected]
Stepan Zemtsov
Abstract
In the current climate of sanctions imposed against Russia by several countries in 2014, special attention
should be given to high-tech sectors of the economy as a key source of import substitution on the domestic market. One of the important policy measures is the support of the development of high-tech, specialized clusters by forming new linkages and strengthening existing ones between small and medium-sized businesses, large enterprises, and research organizations. The starting point for an effective cluster policy is to define areas with high potential
Keywords: clusters; small and medium enterprises; location quotients; pilot innovative clusters; regions; Russia; high-tech industries
for clustering these industries. The paper presents an original method to identify potential clusters and tests the method on Russian regions. We show that most of the state-supported pilot innovative territorial clusters are being developed in regions and sectors that have a high level of cluster potential. A typology of existing clusters depends on the index of clustering potential. We identified regions that have similar or comparatively favourable conditions for creating clusters in the pilot sectors.
DOI: 10.17323/1995-459X.2016.3.34.52
Citation: Zemtsov S., Barinova V., Pankratov A., Kutsenko E. (2016) Potential High-Tech Сlusters in Russian Regions: From Current Policy to New Growth Areas. Foresight and STI Governance, vol. 10, no 3, pp. 34–52. DOI: 10.17323/1995-459X.2016.3.34.52
Head, Laboratory for research on corporate strategies and firm behaviour studies. E-mail: [email protected]
Vera Barinova
Graduate Student, Department of Economic and Social Geography of Russia, Faculty of Geography, Moscow State University. Address: Moscow State University, Faculty of Geography, GSP-1, Lenin Hills,
Moscow 119991, Russian Federation. E-mail: [email protected]
Alexey Pankratov
Head, Cluster Policy Department, Institute for Statistical Studies and Economics of Knowledge, National Research University Higher School of Economics. Address: 11, Myasnitskaya str., Moscow 101000, Russian
Federation. E-mail: [email protected]
Evgeniy Kutsenko
Institute of Applied Economic Research, Russian Presidential Academy of National Economy and Public Administration under the President of the Russian Federation (RANEPA). Address: 82 / 1, Vernadsky
prospekt, Moscow 119571, Russian Federation

2016 Vol. 10 No 3 FORESIGHT AND STI GOVERNANCE 35
Cluster policy is a major component of the current Russian innovation-based development agenda. In early 2012, the Russian Ministry of Economic Development launched a tender for projects on setting
up pilot innovative territorial clusters (ITCs) in Russian regions. 25 cluster initiatives were selected to receive public funding out of about a hundred applications. Most of the approved projects were aimed at developing innovation infrastructure [Gokhberg, Shadrin, 2015; Kutsenko, 2015; Zemtsov et al., 2015; Bortnik et al., 2015], which (unlike integrated cluster development programmes) did not imply research and development (R&D), innovation activities, staff (re)training, and other major initiatives.1 Many Russian regions proclaim that the creation of clusters and providing support to them are priorities of their socio-economic development strategies. The objective here is usually to restructure core enterprises, establish a network of suppliers around them, promote the development of small and medium high-technology companies, and step up cooperation between businesses, R&D, and educational organizations. Many cluster initiatives emerge from the ‘bottom-up’, and frequently remain unnoticed by regional or federal authorities.The principles of companies’ territorial concentration have been studied for quite a long time. Alfred Marshall provided a detailed description of the so-called ‘localised industry’ during the pre-industrial era [Marshall, 1920], when companies belonging to certain groups of industries were located in relative proximity to each other thus forming highly competitive industrial circles. More recent studies of a similar nature analyse clusters of enterprises as ‘geographically concentrated groups of interdependent companies, specialized suppliers, service providers, and affiliated organizations (including universities, R&D organizations, etc.), in manufacturing or service sectors’ [Porter, 2008].Recent international studies show that being part of a cluster helps companies because it simplifies access to specialized production factors and labour, specific knowledge, and competencies [Porter, 1998; 2008; Karlsson, 2008]. New businesses are created more quickly in clusters [Bresnahan et al., 2001; Feldman et al., 2005]; they have better chances of surviving [Staber, 2001; Wennberg, Lindqvist, 2010]; the share of exporting companies is higher [Bair, Gereffi, 2001]; firms’ economic performance is better [Zhang, Li, 2008], and they innovate more actively [Cooke, Schwartz, 2007].Clusters only became a focus of government policy in the 1990s, not counting similar but different formations such as territorial production complexes [Pilipenko, 2004], growth poles, and other entities. The subsequent proliferation of clusters is primarily due to the work of Michael Porter [Porter, 2008]. The approach he suggested included recommendations to increase competitiveness for many countries, including Russia [Porter, Ketels, 2007]. Today, cluster policies are most actively implemented by the European Union member states (Germany, France, Spain, Austria, Czech Republic) [Ketels, 2003; Ketels et al., 2012] and Latin American countries (Mexico, Brazil, Chile, Colombia). Numerous studies of cluster policies have been conducted in the previous two decades, setting out recommendations for cluster policies [Kutsenko, 2015].A key issue in cluster policy is the feasibility of government intervention in clustering processes, and the limits of such actions. Many in the professional community believe that clusters emerge through a natural process, which governments can only hinder [Martin et al., 2008; Duranton, 2011]. In [van der Linde, 2003], only one of the more than 700 studied clusters (in Xīnzhú Shì, Taiwan) can be unequivocally considered the result of targeted government policy. On the other hand, it is hard to find a cluster that has not received any government support in any form. Some, such as the creative industry clusters in the UK, are totally dependent on public funding [Landry, 2008].An efficient cluster policy implies providing balanced support, which would help deal with ‘market failures’ on the one hand and also would not result in government failures. The latter can include setting the wrong priorities or erroneously choosing recipients to support, a mismatch between regulation tools and the nature of problems, lobbying by pressure groups, etc. These can render all government’s efforts in this sphere pointless (for more information, see [Kutsenko, 2012]). Many such errors are often found in policies pursued by many groups of countries. For example, certain regional development strategies in the EU have a low level of interdepartmental cooperation; are focused on R&D at the expense of analysing actual market demand; favour traditional industries over newly emerging ones; and give too much importance to prestigious projects and subject areas [Sörvik, Midtkandal, 2013].Recent decades have seen growing demand for projects to identify and evaluate areas with the highest potential for regional-level cluster development. First, we mean the aforementioned project headed by Michael Porter in the US [Porter, 2003; Delgado et al., 2014], and the activities of the European Cluster Observatory [Ketels, Protsiv, 2014a; Ketels, Protsiv, 2014b]. Based on the latter’s methodology, a pilot
Zemtsov S., Barinova V., Pankratov A., Kutsenko E., pp. 34–52
1 Draft list of pilot development programmes for innovative territorial clusters, with relevant analytical materials, dated 05.07.2012 No 135175-AK/D-19ч. Available at: http://economy.gov.ru/wps/wcm/connect/1a5dcd004bf64bef858d9d77bb90350d/doklad_proekt.pdf?MOD=AJPERES, last accessed on 26.07.2016.

Spatial Development and Innovation: Russian Practice
36 FORESIGHT AND STI GOVERNANCE Vol. 10 No 3 2016
project to identify priority industries and regions for setting up clusters in Russia was implemented in the late 2000s [Kutsenko, 2009; Kutsenko et al., 2011; Danko, Kutsenko, 2012]. In 2015, the Russian Cluster Observatory launched the Cluster Initiatives Map with detailed accumulated information about the approximately 100 clusters which provided relevant data.2
If government policies and support initiatives match the actual specialization areas of regions with the highest cluster development potential, the risks of pursuing an inefficient cluster policy are reduced. However, advanced tools to identify prospective development areas are applied relatively rarely. For example, only localization coefficients were used in the Upper Austria region to select clusters for government support [Pamminger, 2014]. However, even such relatively simple instruments significantly reduce the risks. We are not aware of any efforts to directly apply specialized tools to identify prospective industries in any Russian region that supports clusters. The development and testing of such tools hence seems to be a relevant practical step to increase the effectiveness of Russia’s cluster policy. Other important success factors of such policies, which should be considered when selecting clusters, include the following:• The predominance of private initiatives [INNO Germany AG, 2010, р. 108; Hagenauer et al., 2012,
р. 2; Abashkin et al., 2012; Lindqvist et al., 2013; Kutsenko, 2015];• The prioritization of small and medium businesses’ interests [Dohse, Staehler, 2008; Eickelpasch,
2008; DGCIS, 2009; Pro Inno Europe, 2009; Christensen et al., 2012; Lindqvist et al., 2013];•A wide range of cluster participants and promoting competition (not just cooperation) between
them [Porter, 1998; Pamminger, 2014; Kutsenko, 2015].One of the major drawbacks of the Russian pilot ITCs is, in our opinion, the insignificant number of small enterprises in them, and their insufficient interactions. Small enterprises are most interested in joining clusters, as well as in planning and implementing joint projects. Coordinating on projects means that they can consolidate resources in order to deal with common problems that would be unsolvable by any single company on its own. According to our calculations, the share of small and medium-sized companies in the total number of pilot clusters’ participants is much lower than in European countries [Zemtsov et al., 2015; Bortnik et al., 2015]. In international projects to identify clusters, the factors mentioned above are not taken directly into account at present. In other words, there is a gap between theoretical knowledge on the one hand, and providing expert support to decision makers on the other.The objective of this study is to make a methodological contribution to identify industries with the highest regional cluster development potential. Complementary to other factors such as the level of competition and support for small businesses, our proposed methodology will be tested by comparing indices reflecting the clustering potential of Russian regions in selected economic activity types with data on the location of pilot clusters selected for support by the Russian Ministry of Economic Development.
Data sources and methodologySpecial clustering indices were calculated to identify industries with high clustering potential. To this end, we applied the following algorithm based on the European Cluster Observatory’s methodology [Zemtsov, Bukov, 2016]. In the first stage, all Russian pilot ITCs were broken down by high-tech industries3 in accordance with their main specialization4 based on the Russian classification of economic activities, called OKVED (Table 1). Note that some clusters specialize in several high-tech industries. Statistics collected for all selected economic activities matching the specialization of pilot ITCs show the number of companies operating in various Russian regions in 2013, their revenues, and total number of employees. Calculations were based on data available in the SPARK5 and RUSLANA6 databases.In the second stage, we estimated each company’s share of total revenues, and the total number of employees of all firms specializing in the selected industries in each Russian region. Based on these
2 See http://map.cluster.hse.ru; last accessed on 16.06.2016.3 According to Rosstat’s classification [Rosstat, 2014] based on the OECD and Eurostat recommendations, high-tech industries
include the following OKVED groups: 24.4. Production of pharmaceutical products; 30. Production of office equipment and computers; 32. Production of electronic components, radio, TV, and communication hardware; 33. Production of medical prod-ucts; measuring, control, and testing instruments; optical instruments, photographic and cinematic equipment; watches; 35.3. Production of aircrafts and spacecrafts. Other ITC industries such as petrochemical, automobile, and shipbuilding, are classified as medium-technology. ICT (code 72) is included in research-intensive activities.
4 According to the Russian Cluster Observatory data. Available at: http://cluster.hse.ru/, last accessed on 16.06.2016.5 SPARK is a professional market and business analytics system. Available at: http://www.spark-interfax.ru/Front/Index.aspx, ac-
cessed on 16.06.2016.6 RUSLANA is a database with information about Russian, Ukrainian, and Kazakh companies. Available at: https://ruslana.bvdep.
com/, last accessed on 16.06.2016.
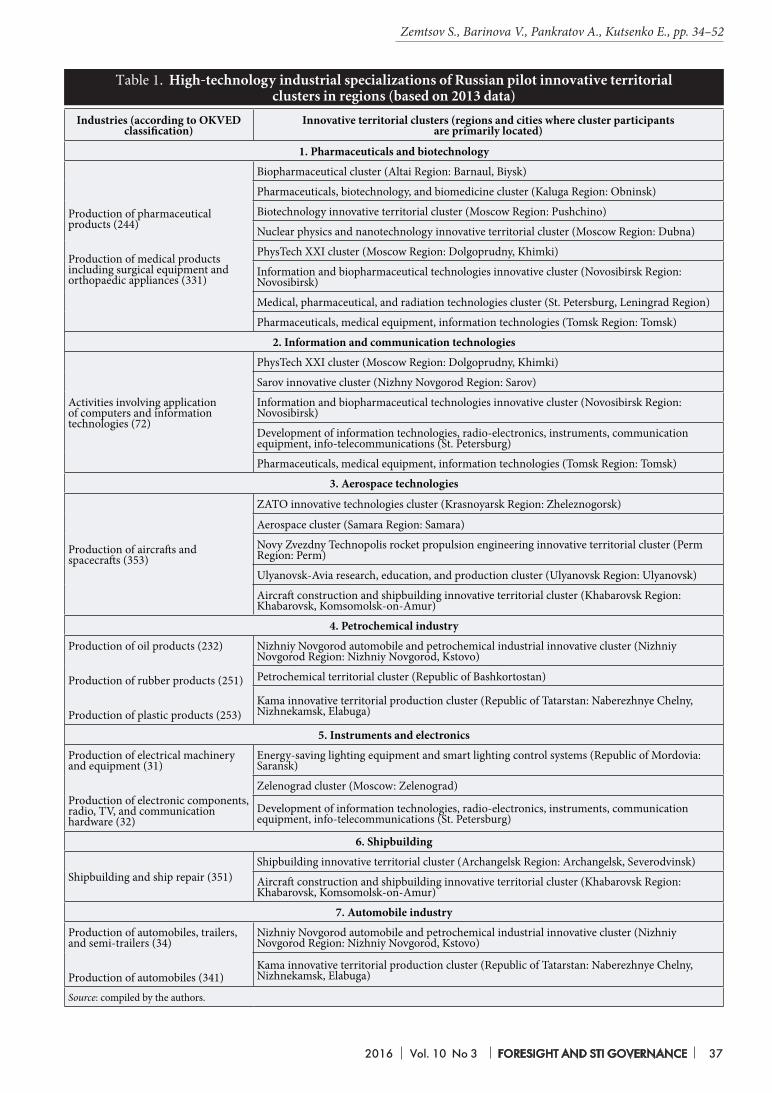
2016 Vol. 10 No 3 FORESIGHT AND STI GOVERNANCE 37
Таble 1. High-technology industrial specializations of Russian pilot innovative territorial clusters in regions (based on 2013 data)
Industries (according to OKVED classification)
Innovative territorial clusters (regions and cities where cluster participants are primarily located)
1. Pharmaceuticals and biotechnology
Production of pharmaceutical products (244)
Production of medical products including surgical equipment and orthopaedic appliances (331)
Biopharmaceutical cluster (Altai Region: Barnaul, Biysk)
Pharmaceuticals, biotechnology, and biomedicine cluster (Kaluga Region: Obninsk)
Biotechnology innovative territorial cluster (Moscow Region: Pushchino)
Nuclear physics and nanotechnology innovative territorial cluster (Moscow Region: Dubna)
PhysTech XXI cluster (Moscow Region: Dolgoprudny, Khimki)
Information and biopharmaceutical technologies innovative cluster (Novosibirsk Region: Novosibirsk)
Medical, pharmaceutical, and radiation technologies cluster (St. Petersburg, Leningrad Region)
Pharmaceuticals, medical equipment, information technologies (Tomsk Region: Tomsk)
2. Information and communication technologies
Activities involving application of computers and information technologies (72)
PhysTech XXI cluster (Moscow Region: Dolgoprudny, Khimki)
Sarov innovative cluster (Nizhny Novgorod Region: Sarov)
Information and biopharmaceutical technologies innovative cluster (Novosibirsk Region: Novosibirsk)
Development of information technologies, radio-electronics, instruments, communication equipment, info-telecommunications (St. Petersburg)
Pharmaceuticals, medical equipment, information technologies (Tomsk Region: Tomsk)
3. Aerospace technologies
Production of aircrafts and spacecrafts (353)
ZATO innovative technologies cluster (Krasnoyarsk Region: Zheleznogorsk)
Aerospace cluster (Samara Region: Samara)
Novy Zvezdny Technopolis rocket propulsion engineering innovative territorial cluster (Perm Region: Perm)
Ulyanovsk-Avia research, education, and production cluster (Ulyanovsk Region: Ulyanovsk)
Aircraft construction and shipbuilding innovative territorial cluster (Khabarovsk Region: Khabarovsk, Komsomolsk-on-Amur)
4. Petrochemical industry
Production of oil products (232)
Production of rubber products (251)
Production of plastic products (253)
Nizhniy Novgorod automobile and petrochemical industrial innovative cluster (Nizhniy Novgorod Region: Nizhniy Novgorod, Kstovo)
Petrochemical territorial cluster (Republic of Bashkortostan)
Kama innovative territorial production cluster (Republic of Tatarstan: Naberezhnye Chelny, Nizhnekamsk, Elabuga)
5. Instruments and electronics
Production of electrical machinery and equipment (31)
Production of electronic components, radio, TV, and communication hardware (32)
Energy-saving lighting equipment and smart lighting control systems (Republic of Mordovia: Saransk)
Zelenograd cluster (Moscow: Zelenograd)
Development of information technologies, radio-electronics, instruments, communication equipment, info-telecommunications (St. Petersburg)
6. Shipbuilding
Shipbuilding and ship repair (351)Shipbuilding innovative territorial cluster (Archangelsk Region: Archangelsk, Severodvinsk)
Aircraft construction and shipbuilding innovative territorial cluster (Khabarovsk Region: Khabarovsk, Komsomolsk-on-Amur)
7. Automobile industry
Production of automobiles, trailers, and semi-trailers (34)
Production of automobiles (341)
Nizhniy Novgorod automobile and petrochemical industrial innovative cluster (Nizhniy Novgorod Region: Nizhniy Novgorod, Kstovo)
Kama innovative territorial production cluster (Republic of Tatarstan: Naberezhnye Chelny, Nizhnekamsk, Elabuga)
Source: compiled by the authors.
Zemtsov S., Barinova V., Pankratov A., Kutsenko E., pp. 34–52

Spatial Development and Innovation: Russian Practice
38 FORESIGHT AND STI GOVERNANCE Vol. 10 No 3 2016
data, we calculated a coefficient of monopolization of the industry for each region, having removed the possible distorting impacts of a single company dominating the local market:
(1),
(2),
Where:HH — monopolization (or concentration) factor7 (Herfindahl–Hirschman Index) for industry i in region g;n — number of companies specializing in the industry in the region;s — share of company f;Emp — number of employees;Sale — revenue (million roubles)The opposite indicator (1-HH) may be called the deconcentration index: the higher its value, the lower the monopolization level of the regional economy.In the third stage, localization factors were calculated for the relevant industries in each region using three parameters: the number of companies, revenues, and the number of employees. Three characteristics were used for mutual verification purposes:
(3),
(4),
(5),
Where:LQ — localization factor for industry i in region g;Firm — number of companies;R — Russian average value of the indicator.In the fourth stage, the relative sizes of the regional industries (Size) were calculated i.e. the total relevant regional companies’ share in the total value of the industry’s indicator for the national economy.
(6),
(7),
(8).
In the fifth stage, we normalized the calculation results using a linear scaling formula to reduce the indicator values to the [0;1] interval in order to ensure their compatibility.
(9),
Where:Ind — normalized index of industry i in region g for characteristic Inc: number of companies, employment, and revenues.In the sixth stage, we calculated the Clustering Potential sub-index for each characteristic.
7 Index values greater than 0.25 indicate a highly concentrated regional market.

2016 Vol. 10 No 3 FORESIGHT AND STI GOVERNANCE 39
Cluster_subindFirmi,g = 1/2 (Ind(LQFirm
i,g) + Ind(SizeFirm)) IndFirmi,g (10),
Cluster_subindEmpi,g = 1/2 (Ind(LQEmp
i,g) + Ind(SizeEmp)) nd(1–HHEmpi,g ) (11),
Cluster_subindSalei,g = 1/2 (Ind(LQSale
i,g) + Ind(SizeSale)) Ind(1–HHSalei,g ) (12),
Where:Cluster_subindFirm — clustering sub-index of industry i in region g, based on the number of companies;IndFirm — index measuring the number of companies specializing in industry i in region g8;Cluster_subindEmp — clustering sub-index based on the number of companies’ employees;Cluster_subindSale — clustering sub-index based on companies’ revenues.Finally, in the seventh stage, the Integral Clustering Potential index was calculated:Cluster_Indi,g = 1/3 (Cluster_subindFirm
i,g + Cluster_subindEmpi,g + Cluster_subindSale
i,g) (13),
Where: Cluster_Ind — an index of the clustering potential of industry i in region g.The Clustering Potential index describes the conditions for the emergence of clusters taking into account the industry and regional characteristics. This index enables state support to be based on a more rigorous (in an objective and methodical sense) method for selecting clusters.
Verifying the selection of innovative clusters in RussiaWe calculated the clustering potential indices for all regions with pilot ITCs according to industrial specialization, and subsequently compared them with other Russian regions. This permitted us to check whether the selected ITCs were located in regions with the highest values of the aforementioned index. In addition, this procedure allowed us to identify new regions where similar high-tech clustering initiatives could be efficiently supported.
Pharmaceuticals and biotechnologyThanks to many small and medium enterprises,9 the Russian pharmaceutical industry is one of the most promising industries from the point of view of cluster policy. The averaged deconcentration index for the industry (formulas (1) and (2)) in the supported regions exceeds 0.75 (Table 2). Six pilot clusters are supported in this field – the highest number among all industries.About 1,500 companies are operating in the city of St. Petersburg and the surrounding Leningrad Region. The leaders of the pharmaceutical industry are Polysan, Biocad, Vertex, Geropharm, etc.; leading producers of medical equipment include Electron, ASK-Rentgen, Thermo Fisher Scientific, Trives. Among ITC participants, we also see some R&D organizations such as the Yefremov Institute of Electrophysical Instruments, St. Petersburg State Chemical and Pharmaceutical Academy, the S&T Centre RATEC, and others.Unsurprisingly, the highest clustering potential index was measured in the city of Moscow (Figure 1) which has 4,177 companies – producers and suppliers of pharmaceuticals and medical equipment. Here, the industry’s deconcentration index is 0.97. Several large companies operate in the city, such as the Moscow Pharmaceutical Factory, Semashko Moskhimpharmpreparaty, Bryntsalov-A Co., and several other high-tech firms. Among medical equipment producers, the Kazakov Moscow Instrumentation Plant and Unimed deserve a special note.We also note a high concentration of companies specializing in this industry in the following regions:• Nizhny Novgorod region: 275 companies, the largest being Nizhpharm, the Nizhny Novgorod
Chemical and Pharmaceutical Factory;• Sverdlovsk region: 306 companies, the largest of which is MEDTECHNIKA;• Republic of Tatarstan: 306 companies, of which the largest is the Kazan Medical Instruments Plant.
Information and communication technologiesFive ITCs were selected in the ICT sector. The low industry concentration index indicates favourable conditions for implementing cluster initiatives (Table 3).
8 This index is calculated on the basis of the number of companies using formula (9), but if there are >100 companies specializing in industry i operating in the region, the index is assigned the value of 1 because that many companies are certainly enough to form a cluster. The value 100 was chosen as the minimum number of companies required for clustering.
9 Many companies in the industry are packaging enterprises and drugstores producing perishable drugs; this must be taken into account when interpreting the results.
Zemtsov S., Barinova V., Pankratov A., Kutsenko E., pp. 34–52
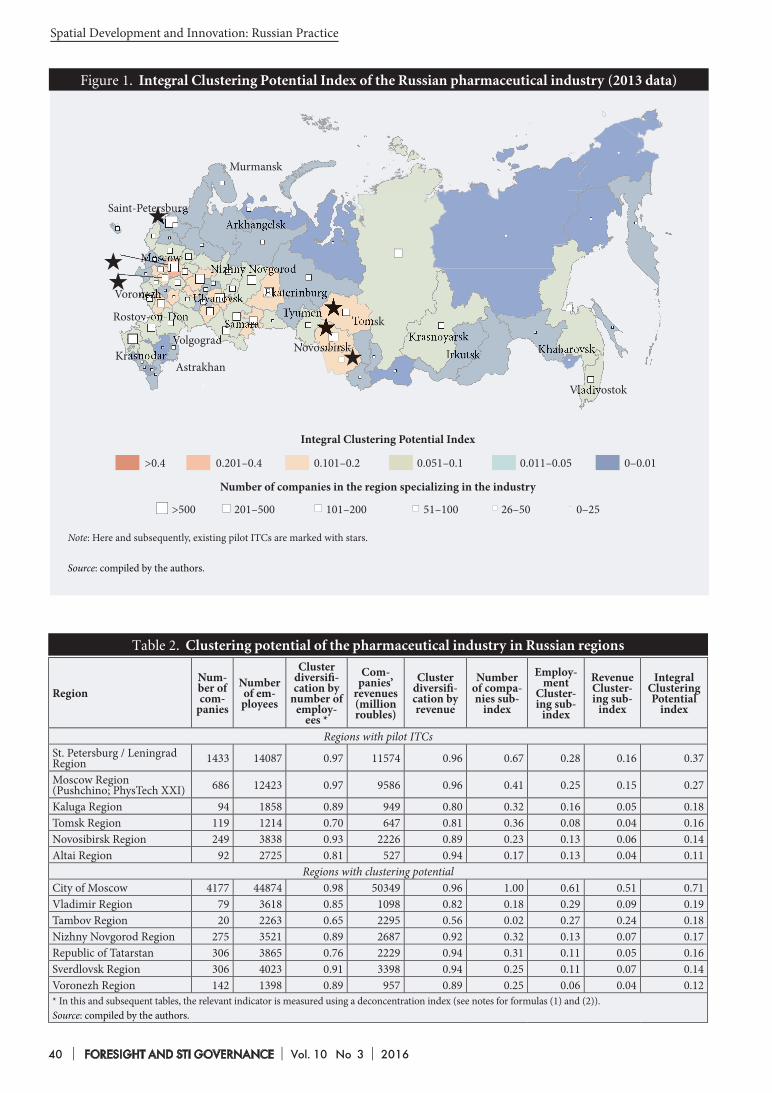
Spatial Development and Innovation: Russian Practice
40 FORESIGHT AND STI GOVERNANCE Vol. 10 No 3 2016
Murmansk
Saint-PetersburgArkhangelsk
MoscowNizhny Novgorod
Voronezh Ulyanovsk Ekaterinburg
Rostov-on-Don
Krasnodar
SamaraVolgograd
Astrakhan
Novosibirsk
TyumenTomsk
KrasnoyarskIrkutsk Khabarovsk
Vladivostok
Figure 1. Integral Clustering Potential Index of the Russian pharmaceutical industry (2013 data)
Source: compiled by the authors.
Note: Here and subsequently, existing pilot ITCs are marked with stars.
RegionNum-ber of com-
panies
Number of em-ployees
Cluster diversifi -cation by
number of employ-
ees *
Com-panies’
revenues (million roubles)
Cluster diversifi -cation by revenue
Number of compa-nies sub-
index
Employ-ment
Cluster-ing sub-
index
Revenue Cluster-ing sub-
index
Integral Clustering Potential
index
Regions with pilot ITCsSt. Petersburg / Leningrad Region 1433 14087 0.97 11574 0.96 0.67 0.28 0.16 0.37
Moscow Region (Pushchino; PhysTech XXI) 686 12423 0.97 9586 0.96 0.41 0.25 0.15 0.27
Kaluga Region 94 1858 0.89 949 0.80 0.32 0.16 0.05 0.18Tomsk Region 119 1214 0.70 647 0.81 0.36 0.08 0.04 0.16Novosibirsk Region 249 3838 0.93 2226 0.89 0.23 0.13 0.06 0.14Altai Region 92 2725 0.81 527 0.94 0.17 0.13 0.04 0.11
Regions with clustering potentialCity of Moscow 4177 44874 0.98 50349 0.96 1.00 0.61 0.51 0.71Vladimir Region 79 3618 0.85 1098 0.82 0.18 0.29 0.09 0.19Tambov Region 20 2263 0.65 2295 0.56 0.02 0.27 0.24 0.18Nizhny Novgorod Region 275 3521 0.89 2687 0.92 0.32 0.13 0.07 0.17Republic of Tatarstan 306 3865 0.76 2229 0.94 0.31 0.11 0.05 0.16Sverdlovsk Region 306 4023 0.91 3398 0.94 0.25 0.11 0.07 0.14Voronezh Region 142 1398 0.89 957 0.89 0.25 0.06 0.04 0.12* In this and subsequent tables, the relevant indicator is measured using a deconcentration index (see notes for formulas (1) and (2)).Source: compiled by the authors.
Таble 2. Clustering potential of the pharmaceutical industry in Russian regions
Number of companies in the region specializing in the industry
Integral Clustering Potential Index
>0.4 0.201–0.4 0.101–0.2 0.051–0.1 0.011–0.05 0–0.01
>500 201–500 101–200 51–100 26–50 0–25

2016 Vol. 10 No 3 FORESIGHT AND STI GOVERNANCE 41
About 20 core participants are registered in the St. Petersburg ICT cluster, the largest of which are Intel Russia, Tranzas, PROMT, Technoros, Rubin Research Institute, Speech Technology Centre, etc. Th e cluster also includes specialized R&D and educational organizations such as St. Petersburg State Electrotechnical University ‘LETI’, Bonch-Bruevich St. Petersburg State University of Telecommunications, and St. Petersburg National Research University of Information Technologies, Mechanics and Optics.Th e ICT sector demonstrates more uniform conditions for clustering across various Russian regions than other industries (Figure 2).
RegionNum-ber of com-
panies
Number of em-ployees
Cluster diversifi -cation by number of em-ployees
Com-panies’
revenues (million roubles)
Cluster diversifi -cation by revenue
Number of companies sub-index
Employ-ment
Cluster-ing sub-
index
Revenue Clustering sub-index
Integral Clustering Potential
index
Regions with pilot ITCsSt. Petersburg 9041 28541 1.00 2759 1.00 0.65 0.32 0.17 0.38Tomsk Region 968 2697 1.00 108 1.00 0.45 0.20 0.05 0.23Moscow Region(PhysTech XXI) 5550 10071 1.00 353 1.00 0.50 0.11 0.03 0.21
Novosibirsk Region 2733 6381 1.00 449 1.00 0.38 0.15 0.08 0.21Nizhny Novgorod Region (Sarov) 2082 4755 1.00 384 1.00 0.35 0.14 0.06 0.18
Regions with clustering potentialCity of Moscow 27063 152997 0.99 15831 0.99 1 0.85 0.56 0.80Yaroslavl Region 963 9024 1.00 102 1.00 0.38 0.53 0.05 0.32Amur Region 329 1894 0.56 450 0.48 0.26 0.17 0.25 0.23Republic of Tatarstan 2533 7532 1.00 599 1.00 0.38 0.20 0.08 0.22Rostov Region 2772 4349 1.00 168 1.00 0.49 0.12 0.03 0.21Sverdlovsk Region 3697 6055 1.00 501 1.00 0.44 0.11 0.06 0.21Source: compiled by the authors.
Таble 3. Clustering potential of the ICT industry
Figure 2. Integral Clustering Potential Index of the Russian ICT sector (2013 data)
Source: compiled by the authors.
Murmansk
Saint-PetersburgArkhangelsk
MoscowNizhny Novgorod
Voronezh Ulyanovsk Ekaterinburg
Rostov-on-Don
Krasnodar
SamaraVolgograd
Astrakhan
Novosibirsk
TyumenTomsk
KrasnoyarskIrkutsk Khabarovsk
Vladivostok
Zemtsov S., Barinova V., Pankratov A., Kutsenko E., pp. 34–52
Number of companies in the region specializing in the industry
Integral Clustering Potential Index
>0.4 0.201–0.4 0.101–0.2 0.051–0.1 0.011–0.05 0–0.01
>500 201–500 101–200 51–100 26–50 0–25

Spatial Development and Innovation: Russian Practice
42 FORESIGHT AND STI GOVERNANCE Vol. 10 No 3 2016
Regions with a high potential for developing ICT clusters include the city of Moscow (27,000 companies), Rostov and Sverdlovsk regions, and the Republic of Tatarstan with its significant number of companies and high clustering potential.
Aerospace technologiesFive ITCs have been created in this sector with public support (Table 4).Regions where aerospace ITCs are located serve as home bases for industry leaders such as Kuznetsov Co. (Samara), a key aerospace propulsion engineering enterprise; Proton-M (Perm), a manufacturer of liquid-fuel rocket engines; Aviakor (Samara), a major player in the passenger aircraft construction, repair, and maintenance market; AeroComposite-Ulyanovsk (Ulyanovsk), a manufacturer of aircraft construction elements, etc. The Gagarin Komsomolsk-on-Amur Aviation Plant, a manufacturer of the Russian medium-haul airliner Sukhoi Superjet 100, is located in Khabarovsk region. The town of Zheleznogorsk (Krasnoyarsk region) is home to the Academician Reshetnikov Information Satellite Systems Company (ISS Co.), the largest Russian satellite manufacturer.The Samara Aerospace ITC brings together 14 core residents including Kuznetsov Co., Aviakor Aviation Plant, the Progress State Research and Production Rocket and Space Centre, Aerodrome Equipment Factory Co., Ekran Research Institute, and others. Much significant research has been conducted at the Gagarin Samara State Technological University and the Samara State Aerospace University named after the Academician Korolev.Some of the regions that have received government support do not have a sufficient number of small and medium companies to create fully-fledged clusters. This primarily concerns Khabarovsk and Krasnoyarsk regions. At the same time, the pilot ITCs mentioned earlier cover multiple industrial sectors: the former includes shipbuilding companies, while the latter includes nuclear energy enterprises.The cities of Moscow and St. Petersburg, as well as Moscow and Nizhny Novgorod regions also have potential for successfully creating aerospace clusters: more than 100 aerospace enterprises operate in each of them (797 in the city of Moscow), plus major R&D and educational organizations (Figure 3).
RegionNum-ber of com-
panies
Number of em-ployees
Cluster diversifi-cation by
number of employees
Com-panies’
rev-enues
(million roubles)
Cluster diversifi-cation by revenue
Number of companies sub-index
Employ-ment
Cluster-ing sub-
index
Revenue Clustering sub-index
Integral Clustering Potential
index
Aircraft and spacecraft manufacturing clusters (OKVED codes 353, 35304, 35305, 35309)Regions with pilot ITCs
Samara Region 70 26155 0.77 24620 0.82 0.22 0.58 0.17 0.33Perm Region 14 9326 0.71 24865 0.76 0.01 0.21 0.17 0.13Ulyanovsk Region (Ulyanovsk-Avia) 31 150 0.75 685 0.75 0.13 0.01 0.01 0.05
Khabarovsk Region 13 0 1.00 0 1.00 0.02 0.00 0.00 0.01Krasnoyarsk Region 15 0 1.00 0 1.00 0.01 0.00 0.00 0.00
Regions with clustering potentialCity of Moscow 797 15161 0.87 66547 0.72 0.87 0.27 0.36 0.50Moscow Region 272 9952 0.88 20649 0.88 0.67 0.20 0.14 0.34St. Petersburg 107 20707 0.89 49334 0.90 0.21 0.42 0.35 0.32Nizhny Novgorod Region 19 18745 0.82 21114 0.82 0.02 0.47 0.15 0.21Republic of Tatarstan 87 7812 0.24 44315 0.09 0.31 0.06 0.03 0.13Rostov Region 42 15397 0.49 33552 0.12 0.08 0.23 0.03 0.11
Propulsion engineering (power plants) clusters (OKVED code 35301)Regions with pilot ITCs
Perm Region 7 5349 1.00 14085 0.48 0.02 0.24 0.15 0.14Regions with clustering potential
City of Moscow 44 6791 0.44 7271 0.40 0.27 0.08 0.04 0.13Yaroslavl Region 3 13387 0.18 18932 0.12 0.01 0.15 0.09 0.08Omsk Region 7 1341 1.00 3035 0.49 0.03 0.08 0.06 0.06Source: compiled by the authors.
Таble 4. Clustering potential of the aerospace industry

2016 Vol. 10 No 3 FORESIGHT AND STI GOVERNANCE 43
Figure 3. Integral Clustering Potential Index of the Russian aerospace industry (2013 data)
Source: compiled by the authors.
Murmansk
Saint-PetersburgArkhangelsk
MoscowNizhny Novgorod
Voronezh Ulyanovsk Ekaterinburg
Rostov-on-Don
Krasnodar
SamaraVolgograd
Astrakhan
Novosibirsk
TyumenTomsk
KrasnoyarskIrkutsk Khabarovsk
Vladivostok
Petrochemical industryTh ree pilot ITCs are currently being supported in the petrochemical industry: in the Republics of Bashkortostan and Tatarstan, and in Nizhny Novgorod region (Table 5). Th e deconcentration index in the aforementioned regions is about 0.5. All three regions have many petrochemical companies: Bashkortostan and Tatarstan have about 1,000, and Nizhny Novgorod region has about 765. Th e largest companies are: Lukoil-Nizhegorodneft orgsyntez (in the city of Kstovo and Kstovo District in Nizhny Novgorod region), Gazprom Neft ekhim Salavat (in the city of Salavat in the Republic of Bashkortostan), TAIF-NK and TANECO (in the city of Nizhnekamsk in the Republic of Tatarstan).Core participants of the Kama Production ITC currently include 30 organizations, including: Tatneft ekhiminvest Holding, Tatneft -Neft ekhim, TANECO, Nizhnekamskneft ekhim, Tatneft Petrochemical Complex. Th e cluster includes a signifi cant number of R&D centres including Kazan National Research Technological University, the Tupolev Kazan National Research Technological University, Kazan (Privolzhsky) Federal University, Kazan Chemical Research Institute, Kama State Engineering Economic Academy in Naberezhnye Chelny, and Kazan State Energy University.Our calculations suggest that petrochemical enterprises in the city of Moscow and Moscow region have a high clustering potential (Figure 4), although certain specifi cally Russian aspects such as legal entities being registered at their headquarters’ location (i.e. in many cases, in the national capital) must be taken into account. Th us, statistics do not always refl ect the actual location of production facilities. All major petrochemical companies operating primarily in Western Siberia are registered in the Moscow capital region, which signifi cantly skews the geography of the Russian petrochemical industry.A trend towards clustering was also displayed by petrochemical companies in the Yaroslavl, Omsk, and Samara regions. 850 fi rms specializing in this industry operate in the Samara region, with an average diversifi cation level exceeding 0.85.
Instruments and electronicsTh is industry’s diversifi cation index is close to 1, not just in the regions where relevant clusters already receive government support but in several other areas as well. Th is indicator value suggests a high potential for both cooperation and competition between cluster participants (Table 6).Th e offi cial list of ITCs features just one cluster specializing in instrumentation engineering and it is located in Saransk (Republic of Mordovia). Th is cluster’s production potential (132 companies) is much lower than the city of Moscow’s, the leader region
Zemtsov S., Barinova V., Pankratov A., Kutsenko E., pp. 34–52
Number of companies in the region specializing in the industry
Integral Clustering Potential Index
>0.4 0.201–0.4 0.101–0.2 0.051–0.1 0.011–0.05 0–0.01
>500 201–500 101–200 51–100 26–50 0–25

Spatial Development and Innovation: Russian Practice
44 FORESIGHT AND STI GOVERNANCE Vol. 10 No 3 2016
Figure 4. Integral Clustering Potential Index of the Russian petrochemical industry (2013 data)
Source: compiled by the authors.
Murmansk
Saint-PetersburgArkhangelsk
MoscowNizhny Novgorod
Voronezh Ulyanovsk Ekaterinburg
Rostov-on-Don
Krasnodar
SamaraVolgograd
Astrakhan
Novosibirsk
TyumenTomsk
KrasnoyarskIrkutsk Khabarovsk
Vladivostok
RegionNum-ber of com-
panies
Number of em-ployees
Cluster diversifi -cation by number of em-ployees
Com-panies’
revenues (million roubles)
Cluster diversifi -cation by revenue
Number of compa-nies sub-
index
Employ-ment
Cluster-ing sub-
index
Revenue Cluster-ing sub-
index
Integral Clustering Potential
index
Regions with pilot ITCsRepublic of Tatarstan 983 21473 0.91 153348 0.29 0.47 0.59 0.10 0.38Republic of Bashkortostan 1083 15752 0.79 172476 0.06 0.63 0.41 0.02 0.35Nizhny Novgorod Region (Nizhny Novgorod, Kstovo) 765 14892 0.95 355235 0.01 0.40 0.45 0.01 0.29
Regions with clustering potentialCity of Moscow 4044 39582 0.99 112842 0.64 0.69 0.56 0.10 0.45Moscow Region 1889 34305 0.99 7346 0.81 0.58 0.64 0.01 0.41Samara Region 847 17353 0.91 58081 0.76 0.44 0.47 0.10 0.34Yaroslavl Region 299 12169 0.88 28065 0.39 0.33 0.58 0.05 0.32Omsk Region 376 11493 0.87 40425 0.37 0.35 0.53 0.07 0.32St. Petersburg 1456 21675 0.98 61084 0.61 0.38 0.39 0.06 0.28Krasnodar Region 1021 10378 0.97 142443 0.68 0.41 0.23 0.19 0.27Volgograd Region 408 13045 0.76 249898 0.04 0.32 0.45 0.04 0.27Saratov Region 407 9830 0.76 13063 0.07 0.38 0.40 0.00 0.26Perm Region 470 13641 0.82 293968 0.11 0.31 0.38 0.08 0.26Leningrad Region 216 7800 0.92 62208 0.43 0.24 0.38 0.10 0.24Source: compiled by the authors.
Таble 5. Clustering potential of the petrochemical industry
has about 5,000 companies. Th e Mordovian instruments cluster mainly specializes in the production of lighting equipment and includes only about ten core residents, including Electrovypriamitel, Kadoshkinsky Electrical Engineering Plant, Saransk Precision Instruments Plant, and the Lodygin Lighting Sources Research Institute, etc.We found signifi cant clustering potential for instrument-making companies in the city of Moscow (approx. 4,960 enterprises), St. Petersburg (2,720 enterprises), and in Moscow Region (about 1,300 enterprises).
Number of companies in the region specializing in the industry
Integral Clustering Potential Index
>0.4 0.201–0.4 0.101–0.2 0.051–0.1 0.011–0.05 0–0.01
>500 201–500 101–200 51–100 26–50 0–25

2016 Vol. 10 No 3 FORESIGHT AND STI GOVERNANCE 45
In the electronics industry, we found a complete match between the publicly supported clusters and their home region potential (Figure 5). Th e two biggest clusters are located in the city of Moscow (Zelenograd) and St. Petersburg, with approx. 4,400 and 1,200 companies respectively. Th e most signifi cant members of the Zelenograd cluster include: the Molecular Electronics Research Institute and Micron Plant, Angstrem Group, ELVIS Research and Production Centre, Institute of Microelectronics Design of the Russian Academy of Sciences (RAS), and the Zelenograd Nanotechnology Centre.According to our estimates, the Kaliningrad, Kaluga, Penza, Ryazan, and Moscow regions also have signifi cant clustering potential in the instrumentation engineering and electronics industries.
ShipbuildingTwo ITCs have been established in the shipbuilding industry in Arkhangelsk region (the companies are located in Severodvinsk and Arkhangelsk), and Khabarovsk region (the cities of Khabarovsk and Komsomolsk-on-Amur). Th ere are about 120 and over 50 shipbuilding companies in Arkhangelsk and Khabarovsk regions respectively.Our calculations show that the clustering potential of the selected regions is lower than in St. Petersburg, the Primorsky, Astrakhan, and Murmansk regions. Th is opens up opportunities for establishing alternative shipbuilding clusters, provided they can successfully complete the initial organizational stage.In the Arkhangelsk region, the low clustering potential is primarily due to the high monopolization of the shipbuilding industry due to the activities of the undisputed industry leaders such as the largest in Russia Sevmash Co. and Zvezdochka Ship Repair Centre (the latter generates more than 90% of all shipbuilding industry’s revenues in the region). R&D organizations also play a major role, specifi cally the Onega Design and Research Bureau, Shipbuilding and Marine Arctic Machinery Research Institute of the Lomonosov Northern (Arctic) Federal University, and the North-Western Branch of the Safe Nuclear Energy Institute of the RAS.Khabarovsk region has even less favourable conditions for creating a shipbuilding cluster than Arkhangelsk region. For example, the number of relevant companies here does not exceed 100, while the monopolization level is higher. Th e Amur Shipbuilding Factory is the only large shipyard, generating practically all revenues and employing all regional shipbuilding workers.
Figure 5. Integral Clustering Potential Index of the Russian electronics industry (2013 data)
Source: compiled by the authors.
Murmansk
Saint-PetersburgArkhangelsk
MoscowNizhny Novgorod
Voronezh Ulyanovsk Ekaterinburg
Rostov-on-Don
Krasnodar
SamaraVolgograd
Astrakhan
Novosibirsk
TyumenTomsk
KrasnoyarskIrkutsk Khabarovsk
Vladivostok
Zemtsov S., Barinova V., Pankratov A., Kutsenko E., pp. 34–52
Number of companies in the region specializing in the industry
Integral Clustering Potential Index
>0.4 0.201–0.4 0.101–0.2 0.051–0.1 0.011–0.05 0–0.01
>500 201–500 101–200 51–100 26–50 0–25

Spatial Development and Innovation: Russian Practice
46 FORESIGHT AND STI GOVERNANCE Vol. 10 No 3 2016
Figure 6. Integral Clustering Potential Index of the Russian shipbuilding industry (2013 data)
Source: compiled by the authors.
Murmansk
Saint-PetersburgArkhangelsk
MoscowNizhny Novgorod
Voronezh Ulyanovsk Ekaterinburg
Rostov-on-Don
Krasnodar
SamaraVolgograd
Astrakhan
Novosibirsk
TyumenTomsk
KrasnoyarskIrkutsk Khabarovsk
Vladivostok
RegionNum-ber of
compa-nies
Num-ber of em-
ployees
Cluster diversifi -cation by
number of employees
Com-panies’
revenues (million roubles)
Cluster diversifi -cation by revenue
Number of compa-nies sub-
index
Employ-ment
Cluster-ing sub-
index
Revenue Cluster-ing sub-
index
Integral Clustering Potential
index
Electrical machinery production (instrumentation) clusters (OKVED code 31)Regions with pilot ITCs
Republic of Mordovia 132 7362 0.81 13169 0.88 0.33 0.47 0.32 0.37Regions with clustering potential
City of Moscow (Zelenograd) 4962 47534 0.99 120685 0.99 0.72 0.54 0.50 0.59St. Petersburg 2720 31753 0.99 103719 0.97 0.66 0.44 0.47 0.52Chuvash Republic 324 8773 1.00 20340 1.00 0.53 0.45 0.44 0.48Pskov Region 145 7389 0.87 17221 0.88 0.36 0.45 0.50 0.44Vladimir Region 290 12340 0.91 24061 0.80 0.34 0.47 0.30 0.37Sverdlovsk Region 1319 15665 0.97 34567 0.94 0.50 0.27 0.19 0.32Moscow Region 1322 24801 0.98 51490 0.97 0.37 0.35 0.25 0.32Samara Region 786 18883 0.77 44322 0.76 0.39 0.30 0.23 0.31
Electronics clusters (OKVED code 32)Regions with pilot ITCs
Moscow (Zelenograd) 4383 37845 0.98 85191 0.96 1.00 0.56 0.54 0.70St. Petersburg 1277 17806 0.96 22121 0.85 0.56 0.34 0.22 0.37
Regions with clustering potentialPenza Region 106 1737 0.66 2873 0.51 0.33 0.09 0.26 0.23Kaliningrad Region 179 2274 0.89 3146 0.29 0.38 0.16 0.08 0.21Kaluga Region 85 5324 0.78 2302 0.40 0.22 0.31 0.08 0.20Riazan Region 93 4770 0.61 461 0.73 0.24 0.22 0.04 0.17Moscow Region 681 2941 0.92 3712 0.84 0.36 0.05 0.05 0.15Source: compiled by the authors.
Таble 6. Clustering potential of the instrumentation and electronics industries
Number of companies in the region specializing in the industry
Integral Clustering Potential Index
>0.4 0.201–0.4 0.101–0.2 0.051–0.1 0.011–0.05 0–0.01
>500 201–500 101–200 51–100 26–50 0–25

2016 Vol. 10 No 3 FORESIGHT AND STI GOVERNANCE 47
As to possible alternative Russian regions (Figure 6), St. Petersburg has a much higher shipbuilding clustering potential: its deconcentration index reaches approximately 0.7, and the number of relevant companies exceeds 600. Leading positions are shared by the four biggest companies of which two are particularly powerful, playing a major role not just in the regional but also in the national economy: the Admiralty Shipyard, the Northern Shipyard shipbuilding factory, the Sredne-Nevsky shipbuilding factory, and the Almaz Shipbuilding Company.Other Russian regions with a notably high clustering potential include the Primorsky (420 companies, diversifi cation index 0.65), Astrakhan (247 companies, diversifi cation index 0.77), and Nizhny Novgorod (178 companies, diversifi cation index 0.64) regions.
Automobile industryTh e Russian automobile industry was booming in the second half of the 2000s, fueled by investments by major global corporations including Volkswagen, Toyota, Nissan, Ford, Volvo, Hyundai, etc. Clusters comprised of signifi cant numbers of small and medium companies (mainly supplies of parts and components) emerged around large plants, built during the Soviet and later in the post-Soviet period.Automobile clusters were established in two regions: the Nizhny Novgorod region and the Republic of Tatarstan (Table 8). Th ey include major Russian automobile factories such as GAZ Group (Nizhny Novgorod Region) KAMAZ (Naberezhnye Chelny, the Republic of Tatarstan), and Ford Sollers Elabuga (Elabuga, the Republic of Tatarstan). Th e aforementioned regions also serve as home bases for other major companies such as Pavlovo Bus Factory and Zavolzhsky Motor Factory (Nizhny Novgorod Region), and Elabuga Automobile Factory (Republic of Tatarstan).Prospective regions in terms of developing automobile clusters also include the Samara region (421 fi rms, of which the largest is Avtovaz), Ulyanovsk region (153 companies, the largest being Ulyanovsk Automobile Factory), and the city of Moscow (431 companies, the biggest are the Likhachev Plant and Renault Russia (until 2014, ‘Autoframos’).Th e geographical distribution of automotive companies also prompts one to note St. Petersburg (with 188 fi rms), which has the Toyota, Nissan, General Motors, Hyundai, Scania (buses) and Magna (a car parts factory) plants. Moreover, the Kaluga and Kaliningrad regions have car assembly facilities.
Figure 7. Integral Clustering Potential Index of the Russian automobile industry (2013 data)
Source: compiled by the authors.
Murmansk
Saint-PetersburgArkhangelsk
MoscowNizhny Novgorod
Voronezh Ulyanovsk Ekaterinburg
Rostov-on-Don
Krasnodar
SamaraVolgograd
Astrakhan
Novosibirsk
TyumenTomsk
KrasnoyarskIrkutsk Khabarovsk
Vladivostok
Zemtsov S., Barinova V., Pankratov A., Kutsenko E., pp. 34–52
Number of companies in the region specializing in the industry
Integral Clustering Potential Index
>0.4 0.201–0.4 0.101–0.2 0.051–0.1 0.011–0.05 0–0.01
>500 201–500 101–200 51–100 26–50 0–25

Spatial Development and Innovation: Russian Practice
48 FORESIGHT AND STI GOVERNANCE Vol. 10 No 3 2016
RegionNum-ber of
compa-nies
Number of em-ployees
Cluster diversifi-cation by
number of employees
Com-panies’
revenues (million roubles)
Cluster diversifi-cation by revenue
Number of compa-nies sub-
index
Employ-ment
Cluster-ing sub-
index
Revenue Cluster-ing sub-
index
Integral Clustering Potential
index
Regions with pilot ITCsNizhny Novgorod Region (Nizhny Novgorod) 250 16350 0.95 8631 0.68 0.55 0.41 0.43 0.46
Republic of Tatarstan 321 9788 0.93 5285 0.53 0.66 0.23 0.20 0.36Regions with clustering potential
Samara Region 421 25085 0.95 7816 0.49 0.91 0.61 0.28 0.60Ulyanovsk Region 153 24423 0.83 1607 0.73 0.68 0.82 0.18 0.56St. Petersburg 188 21984 0.92 8744 0.71 0.28 0.44 0.37 0.36City of Moscow 431 13148 0.86 5652 0.62 0.55 0.23 0.19 0.33Chelyabinsk Region 229 17637 0.84 1246 0.85 0.50 0.39 0.08 0.32Kaluga Region 42 7964 0.82 9110 0.33 0.08 0.24 0.33 0.22Moscow Region 158 6261 0.89 3689 0.49 0.26 0.12 0.11 0.16Kaliningrad Region 39 3139 0.63 4581 0.62 0.05 0.08 0.33 0.15Yaroslavl Region 51 13031 0.67 742 0.49 0.10 0.29 0.04 0.14Republic of Bashkortostan 72 10992 0.53 476 0.61 0.12 0.15 0.02 0.10Source: compiled by the authors.
Таble 8. Clustering potential of the automobile industry
Other industriesCoal is not traditionally considered a high-tech industry. However, related industries, primarily coal chemistry and waste recycling, do have significant innovation potential. A pilot ITC in this sector was created in the Kemerovo region which has the best conditions for developing such clusters: 715 companies specializing in the coal industry operate in this region, employing about 67,000 people. Along with major firms such as SUEK and Belovskaya Mine, the cluster participants include R&D and educational organizations, namely Kemerovo Research Centre of the Siberian Branch of the RAS, Gorbachev Kuzbass State Technological University, and the Siberian State Industrial University. Structurally closer to a classic territorial production complex, this cluster is designed not so much to promote the development of the coal industry in the Kemerovo region as to provide systemic support to new industries such as coal chemistry, waste recycling, and environmental protection. Potential competition to the Kemerovo region could come from the Republic of Khakassia, Krasnoyarsk, Rostov, and Sakhalin regions.The methodology that we have presented in this paper for estimating the match between regions with pilot ITCs and the actual conditions affecting cluster development in Russia is more applicable in the civilian sectors of the Russian economy. Applying this methodology to monitor ‘closed’ strategic industries is not possible due to the lack of publicly available relevant data. Some of these industries, however, are represented in the pilot ITCs, including new materials (the titanium cluster in Sverdlovsk region), radiation technologies (the city of Moscow, and the Moscow, Nizhny Novgorod, and Ulyanovsk regions),
RegionNum-ber of
compa-nies
Num-ber of em-
ployees
Cluster diversifi-cation by
number of employees
Com-panies’
revenues (million roubles)
Cluster diversifi-cation by revenue
Number of compa-nies sub-
index
Employ-ment
Cluster-ing sub-
index
Revenue Cluster-ing sub-
index
Integral Clustering Potential
index
Regions with pilot ITCsArchangelsk Region 119 15634 0.22 31839 0.25 0.30 0.22 0.19 0.24Khabarovsk Region 55 3394 0.02 3890 0.04 0.06 0.004 0.002 0.02
Regions with clustering potentialSt. Petersburg 616 13690 0.71 58828 0.68 0.60 0.34 0.36 0.43Astrakhan Region 247 1616 0.79 2011 0.76 0.70 0.12 0.05 0.29Primorsky Region 420 1175 0.73 5353 0.57 0.66 0.04 0.04 0.25Murmansk Region 190 99 0.44 260 0.50 0.54 0.00 0.00 0.18Kamchatka Region 107 28 0.63 29 0.76 0.51 0.00 0.00 0.17Kaliningrad Region 218 3587 0.16 12716 0.08 0.39 0.04 0.02 0.15Nizhny Novgorod Region 178 5255 0.56 6894 0.72 0.23 0.12 0.05 0.13Source: compiled by the authors.
Таble 7. Clustering potential of the shipbuilding industry
2016 Vol. 10 No 3 FORESIGHT AND STI GOVERNANCE 49
and the production of nuclear materials (the Moscow, Ulyanovsk, Nizhny Novgorod, and Krasnoyarsk regions).
Types of pilot innovative clusters in RussiaMeasuring the clustering potential of Russian pilot ITCs in high-tech industries has shown that the economic activities under consideration are not equally suitable for implementing such initiatives. The differences are due to their diverse territorial distribution, the existing market structure, and the shares of small and medium businesses. The industries described above can be notionally divided into three groups, based on their clustering potential (in descending order).Industries with the highest clustering potential index include pharmaceuticals, the production of medical equipment, and biotechnology; ICT; instrumentation engineering (production of electrical machinery), and electronics. The above industries display a high level of innovation activities, are concentrated in regions with the highest innovation potential [Baburin, Zemtsov, 2013], and most of the pilot ITCs specialize in them. Other Russian regions also have significant potential for the emergence of new clusters; this is particularly important in light of the programme for industrial clusters launched by the Russian Ministry of Industry and Trade in 2016.Recent overall government spending cuts increase the need to more carefully select recipients of public support. The clustering potential of industries can be an important criterion for such selection, together with clusters’ characteristics (the number of cluster participants, number of companies’ employees, amount of investment, export potential, etc.), and cluster participants’ specific projects.Our study covered a limited range of economic activities. Hence, further research should identify more industries that are receptive to cluster policies. At the same time, statistical classifications tend to become obsolete quite quickly and data analysis takes time; in other words, such methodologies are admittedly unsuitable for detecting emerging industries.10 That does not imply, however, that the cluster approach is useless. On the contrary, it may potentially prove the best way to provide systemic support for fast-growing companies (gazelles) when they are expanding, establishing close links with universities and R&D organizations, and interacting with state-owned companies. Moreover, a cluster approach can help to fine-tune various government policies, in particular, the promotion of exports and technology transfer. The significance of supporting emerging industries suggests that they should be included in the group with the highest clustering potential in order to implement cluster policy.Next comes the group of industries that are important to the Russian economy: those with an established territorial structure of production facilities and a high degree of monopolization due to the presence of very large companies. Such sectors include petrochemicals, shipbuilding, coal, aircraft and spacecraft construction, propulsion engineering, and automobiles. Many of these can be classified as Russian high-tech industries that define the country’s technological image globally. Other industries in this group have matured or are in decline. The probability of gazelle companies emerging in such sectors is lower, while the chances of encountering the ‘self-blocking effect’ are much higher. Supporting clusters in such industries is hindered by the problem of regional networks who are less interested in promoting innovation and more focused on preserving the status quo in the economy. Under such circumstances, the government should play a more active role, helping industries adjust to future markets and restructure their production, in particular by increasing the share of small and medium companies making high-quality products. One specific measure that could be introduced is to make it compulsory to link relevant cluster projects with the results of the Russian Long-Term S&T Foresight or with the National Technology Initiative’s roadmaps.The third group of industries includes production of new materials (e.g. the titanium cluster in the Sverdlovsk region), and nuclear and radiation technologies (we lack reliable data about the latter). These spheres are among the hardest for new companies to enter and freely operate on the market, while the existing players are managed and controled by the government. This eliminates the potential for this group to be expanded by new private businesses coming in. However, supporting such clusters did bring some results during the first, experimental stage of implementing cluster policy in Russia.Government efforts have led to dozens of diverse clusters operating in various Russian regions by 2016, including innovative, industrial, agro-industrial, medical, and tourism clusters. In almost all regions where pilot ITCs are located, new clusters and cluster centres have emerged in the last three years. Accordingly, compared with 2012 the situation has now noticeably changed; hence, government policy needs to move to a new stage that includes the following steps:
10 Other analytical methods can be applied to study emerging industries: see, for example, [Zemtsov, 2013].
Zemtsov S., Barinova V., Pankratov A., Kutsenko E., pp. 34–52

Spatial Development and Innovation: Russian Practice
50 FORESIGHT AND STI GOVERNANCE Vol. 10 No 3 2016
• Conducting an audit of supported clusters to establish whether they act as innovation-promoting networks, or as regional lobbyists protecting the status quo of an outdated industry structure;
• Taking into account the reputation of clusters (networks) when making decisions about granting them public support;
•Adjusting the mechanism for providing support to innovative clusters: a) supporting joint projects by cluster participants; b) introducing requirements for private investment in every publicly supported joint project; c) linking joint projects up with relevant technology agendas (e.g. Russian S&T Foresight, National Technology Imitative);
• Further integration of the cluster approach into industry promotion programmes of federal agencies that are responsible for de facto existing clusters (Ministry of Agriculture, Ministry of Communications, Ministry of Energy, and Ministry of Health).
Accordingly, further support to the third group of clusters should be provided only if they meet the new requirements described above.
ConclusionThe original contribution of this paper lies in its proposed approach to identify industries with a high clustering potential, namely in factoring in the degree of monopolization of regional markets to minimize distortions of the data by the activities of large companies. Moreover, we took into account an indicator of the number of companies to identify small and micro-companies for which there are no reliable data on revenues and the number of employees.We assessed the degree of match between the pilot ITCs supported with public funds and the actual regional entrepreneurial and competitive environment. Overall, the overwhelming majority of clusters selected by the Russian Ministry of Economic Development are located in regions with a high clustering potential in the relevant industries. At the same time, we also found some Russian regions with equivalent, or even more favourable, conditions for implementing a proactive cluster policy than in the selected regions. In particular, we showed that shipbuilding companies in the city of St. Petersburg, the Astrakhan, Primorsky, and Kamchatka regions have a higher clustering potential compared to Arkhangelsk and Khabarovsk regions. Pharmaceutical clusters established in the city of St. Petersburg, and the Moscow, Tomsk, Kaluga, Novosibirsk, and Altai regions have potential competitors in the city of Moscow, Nizhny Novgorod region, and the Republic of Tatarstan.Petrochemical clusters are supported in the Republics of Tatarstan and Bashkortostan and the Nizhny Novgorod region, while the Krasnodar and Samara regions’ clustering potential is no less than that in the Nizhny Novgorod region.In addition to the information and communication technologies clusters that receive public support (the cities of Moscow and St. Petersburg, the Tomsk, Moscow, Novosibirsk, and Nizhny Novgorod regions), the Perm, Rostov, and Sverdlovsk regions also have high clustering potential in this industry and show comparable numbers of relevant companies generating similar revenues.Aerospace clusters in the Perm and Ulyanovsk regions have lower clustering potential than in the capital areas of the cities of Moscow and St. Petersburg, and the Moscow region.In the electronics industry, Technopolis GS in the Kaliningrad region and relevant companies in the Penza region did not receive government support, although they did apply for pilot ITC cluster status in 2012.It should be noted that a condition of inclusion on the list of pilot ITCs was the presence of a coordinator organization capable of adequately preparing the application in a relatively short timeframe. We believe that explains why certain promising clusters were not on the list approved by the Russian Ministry of Economic Development. This testifies not so much to the faulty selection methodology applied by the federal agency but rather to the low level of applicants’ organizational abilities or the insufficient activity of regional authorities.We divided all high-tech ITCs into three groups based on the value of their clustering potential index. The first group was comprised of pharmaceuticals, the production of medical equipment and biotechnology, ICT, instrumentation engineering (production of electrical machinery), and electronics. The second group included the petrochemical industry, shipbuilding, coal industry, aircraft and spacecraft construction, propulsion engineering, and the automobile industry. The third group of industries included the production of new materials (e.g. the titanium cluster in the Sverdlovsk region), nuclear and radiation technologies.Each of the three groups mentioned above require a specific kind of cluster policy. Industries of the first group would benefit from state support for new clusters, the engagement of ‘sleeping’ regions, and an

2016 Vol. 10 No 3 FORESIGHT AND STI GOVERNANCE 51
The article has been prepared based on the results of a survey conducted under the auspices of the Basic Research Program of the National Research University HSE (NRU HSE), using subsidiary funds as part of state support for leading universities of the Russian Federation in the programme ‘5-100’.
References
extended set of regulatory tools. Policy recommendations for the second group of ITCs include adapting existing industries to future markets, restructuring production, and increasing the share of small and medium companies that make high-quality products. Clusters in the third group of ICTs require an audit to determine whether providing them with further public support would be feasible.The limitations of our applied approach stem from the lack of statistical data, which significantly varies depending on the industry and company size. The bigger the company, the more official data about it available (all other conditions being equal). No data on many small and micro-companies’ revenues and employment figures are available, the category to which most companies in the high-tech and emerging industries belong. Therefore, in our calculations we had to use data about all firms, not just small and medium ones. Arguably, the presence of large companies in a given region also enables clusters to be formed because of the emergence of spin-offs and the demand the former generate for small businesses’ products. Certain errors arise with attributing ITCs to the OKVED classification of economic activity types. Many companies are classified as specializing in traditional industries although in fact they manufacture innovative products. For example, biotechnology companies engaged in genetic engineering are classified as producers of agricultural products. The opposite may also be true: many pharmaceutical firms, for example, are formally classified as high-tech companies, although they make no innovative products and actually make packaging for medicines. Furthermore, we also lack data for industries connected with national defence (e.g. shipbuilding, nuclear energy, the production of communication equipment, etc.), which makes it impossible to apply our methodology to study clustering processes in these sectors.In our calculations, we used the official registration addresses of legal entities and not the actual locations of production facilities. Hence, the city of Moscow’s leading position as the Russian region with the highest clustering potential in certain industries is rather speculative.In the future, we intend to further develop our methodology by analysing the activities of educational and R&D organizations in clusters’ industrial specializations, and by assessing the links between various organizations. This would involve further research of cluster initiatives, including on the basis of the results of the aforementioned ‘Cluster Initiatives Map’ project coordinated by the HSE.
Abashkin V., Boyarov A., Kutsenko E. (2012) Klasternaya politika v Rossii: ot teorii k praktike [Cluster Policy in Russia: From Theory to Practice]. Foresight-Russia, vol. 6, no 3, pp. 16–27 (in Russian).
Baburin V., Zemtsov S. (2013) Geografiya innovatsionnykh protsessov v Rossii [Geography of innovation processes in Russia]. MSU Vestnik (Series 5, Geography), no 5, pp. 25–32 (in Russian).
Bair J., Gereffi G. (2001) Local clusters in global chains: The causes and consequences of export dynamism in Torreon’s blue jeans industry. World development, vol. 29, no 11, pp. 1885–1903.
Bortnik I., Zemtsov S., Ivanova O., Kutsenko E., Pavlov P, Sorokina A. (2015) Stanovlenie innovatsionnykh klasterov v Rossii: itogi pervykh let podderzhki [The innovation clusters development in Russia: The achievements of the first years of support]. Innovatsii [Innovations], no 7, pp. 26–36 (in Russian).
Bresnahan T., Gambardella A., Saxenian A. (2001) ‘Old economy’ inputs for ‘new economy’ outcomes: Сluster formation in the new Silicon Valleys. Industrial and Corporate Change, vol. 10, № 4, pp. 835–860.
Christensen T.A., Lämmer-Gamp T., Meier zu Kôcker G. (2012) Let’s make a perfect cluster policy and cluster programme. Smart recommendations for policy makers, Berlin: VDI/VDE Innovation + Technik GmbH (VDI/VDE-IT).
Cooke P., Schwartz D. (eds.) (2007) Creative Regions. Technology, Culture and Knowledge Entrepreneurship, London: Routledge.
Danko T., Kutsenko E. (2012) Osnovnye podkhody k vyyavleniyu klasterov v ekonomike regiona [The main approaches to the regional clusters identification]. Problemy sovremennoi ekonomiki [Problems of Modern Economics], no 1, pp. 248–254 (in Russian).
Delgado M., Porter M.E., Stern S. (2014) Defining clusters of related industries (NBER Working Paper no 20375), Cambridge, MA: National Bureau of Economic Research. Available at: http://www.nber.org/papers/w20375, accessed 17.01.2016.
DGCIS (2009) Competitiveness Clusters in France, Paris: Directorate General for Competitiveness, Industry and Services. Available at: http://www.industrie.gouv.fr/poles-competitivite/brochure-en.html, accessed 05.06.2016.
Dohse D., Staehler T. (2008) BioRegio, BioProfile and the Rise of the German Biotech Industry (Working Paper no 1456), Kiel: Kiel Institute for the World Economy. Available at: http://www.ifw-members.ifw-kiel.de/publications/bioregio-bioprofile-and-the-growth-of-the-german-biotech-industry/KWP_1456.pdf, accessed 05.06.2016.
Duranton G. (2011) California Dreamin’: The Feeble Case for Cluster Policies. Review of Economic Analysis, no 3, pp. 3–45.
Eickelpasch A. (2008) The Promotion of Regional Innovative Networks — Lessons from the German InnoRegio-Programme. Paper presented at the Innovation Pathways and Knowledge Economy, Final DISTRICT Conference, 16.04.2008, Brussels.
Feldman M., Francis J., Bercovitz J. (2005) Creating a cluster while building a firm: Entrepreneurs and the formation of industrial clusters. Regional Studies, vol. 39, no 1, pp. 129–141.
Zemtsov S., Barinova V., Pankratov A., Kutsenko E., pp. 34–52

Spatial Development and Innovation: Russian Practice
52 FORESIGHT AND STI GOVERNANCE Vol. 10 No 3 2016
Gokhberg L., Shadrin A. (2015) Pilotnye innovatsionnye territorial’nye klastery v Rossiiskoi Federatsii. Vypusk 2. Napravleniya realizatsii programm razvitiya [Pilot innovative territorial clusters in the Russian Federation. Issue 2. The development programs implementation guidelines], Moscow: HSE (in Russian).
Hagenauer S., Kergel H., Stürzebecher D. (2012) European Cluster Excellence BASELINE — Minimum Requirements for Cluster Organisations, Stuttgart: European Cluster Excellence Initiative. Available at: http://www.cluster-excellence.eu/fileadmin/cluster-excellence/grafiken/20111128_European_Cluster_Excellence_BASELINE_web.pdf, accessed 05.06.2016.
INNO Germany AG (2010) Clusters and clustering policy: A guide for regional and local policy makers, Brussels: European Commission. Available at: http://cor.europa.eu/en/Archived/Documents/59e772fa-4526-45c1-b679-1da3bae37f72.pdf, accessed 05.06.2016.
Karlsson C. (2008) Handbook of Research on Cluster Theory, Cheltenham: Edward Elgar.Ketels C. (2003) The Development of the cluster concept – Present experiences and further developments. Paper
presented at the NRW Conference on Clusters, Duisburg, Germany. Available at: http://www.clustermapping.us/sites/default/files/files/resource/The_development_of_the_cluster_concept_-_present_experiences_and_further_developments.pdf, accessed 14.07.2016.
Ketels C., Lindqvist G., Sölvell Ö. (2012) Strengthening Clusters and Competitiveness in Europe. The Role of Cluster Organisations, Stockholm: Cluster Observatory.
Ketels C., Protsiv S. (2014a) European Cluster Panorama 2014, Stockholm: Cluster Observatory. Available at: http://antonioviader.com/pdfs_preview/userupload/toni/Innovation_Policies/Metrics_Monitoring/EC%20Cluster%20Panorama%202014.pdf, accessed 05.06.2016.
Ketels C., Protsiv S. (2014b) Methodology and Findings Report for a Cluster Mapping of Related Sectors, Stockholm: Cluster Observatory. Available at: http://ec.europa.eu/enterprise/initiatives/cluster/observatory/d1, accessed 05.06.2016.
Kutsenko E. (2009) Klastery v ekonomike: praktika vyyavlenija. Obobshcheniye zarubezhnogo opyta [The practice of identifying clusters in the economy: The summary of the international practices]. Obozrevatel [Observer], no 10 (237), pp.109–126 (in Russian).
Kutsenko E. (2012) Ratsionalnaya klasternaya strategiya: manevriruya mezhdu provalami rynka i gosudarstva [A Rational Cluster Strategy: Manoeuvring between Market and Government Failures]. Foresight-Russia, vol. 6, no 3, pp. 6–15 (in Russian).
Kutsenko E. (2015) Pilot Innovative Territorial Clusters in Russia: A Sustainable Development Model. Foresight-Russia, vol. 9, no 1, pp. 32–55.
Kutsenko E., Kiselev A., Karnaukh A. (2011) Opredeleniye prioritetnykh napravlenii dlya formirovaniya i razvitiya klasterov malykh i srednikh predpriyatii v regional’noi ekonomike (na primere goroda Moskvy) [The priority directions for SMEs clusters development identification in the regional economy (the Moscow city case)]. Setevoi biznes i klasternyje tekhnologii [Network business and cluster technologies], Moscow: HSE, pp. 279–302 (in Russian).
Landry C. (2008) The Creative City: A Toolkit for Urban Innovators (2nd ed.), London: Earthscan.Lindqvist G., Ketels C., Sölvell Ö. (2013) The Cluster Initiative Greenbook 2.0, Stockholm: Ivory Tower Publishers.Marshall A. (1920) Principles of Economics (revised ed.), London: Macmillan; reprinted by Prometheus Books. Martin P., Mayer T., Mayneris F. (2008) Spatial concentration and firm-level productivity in France (CEPR Discussion
Paper no 6858), London: Centre for Economic Policy Research.Pamminger W. (2014) Cluster Academy Workshop: Learning from a ‘Cluster Region’. Available at: http://www.
slideshare.net/TCINetwork/tci2014-11-novclusterlabswerner-pamminger, accessed 05.06.2015.Pilipenko I. (2004) Printsipial’nye razlichiya v kontseptsii promyshlennykh klasterov i territorial’no-proizvodstvennykh
kompleksov [The principal differences of the industrial clusters and territorial production complexes’ concepts]. MSU Vestnik (Series 5, Geography), no 5, pp. 3–9 (in Russian).
Porter M.E. (1998) Cluster and the New Economics of Competition. Harvard Business Review, vol. 76, no 6, pp. 77–90.
Porter M.E. (2003) The economic performance of regions. Regional Studies, vol. 37, no 6–7, pp. 545–546.Porter M.E. (2008) On Competition, Boston, MA: Harvard Business Press.Porter M.E., Ketels C.H.M. (2007) Competitiveness at the Crossroads: Choosing the Future Direction of the Russian
Economy, Moscow: Center for Strategic Research. Available at: http://www.hbs.edu/faculty/Publication%20Files/Russia_Competitiveness_Crossroads_Dec2007_2423559d-9d53-4b95-b206-28d6208f851a.pdf, accessed 09.11.2015.
Pro Inno Europe (2009) INNO-PolicyTrendChart. Available at: http://proinno.intrasoft.be/index.cfm?fuseaction=wiw.measures&page=detail&ID=8922, accessed 05.06.2015.
Rosstat (2014) Metodika rascheta pokazatelei “Dolya produktsii vysokotekhnologichnykh i naukoyomkikh otraslei v valovom vnutrennem produkte” i “Dolya produktsii vysokotekhnologichnykh i naukoyomkikh otraslei v valovom regional’nom produkte subjekta Rossiiskoi Federatsii” [The calculation methodology of the indicators “The share of high-tech and knowledge-intensive industries in the gross domestic product” and “The calculation methodology of the indicators “The share of high-tech and knowledge-intensive industries in the gross regional product of the Russian Federation”]. Available at: http://www.gks.ru/free_doc/new_site/effect/met_pr21.docx, accessed 05.06.2016 (in Russian).
Sörvik J., Midtkandal I. (2013) Smart Specialisation in the Baltic Sea Region, Malmö: S3 Platform, DG JRC – IPTS.Staber U. (2001) Spatial Proximity and Firm Survival in a Declining Industrial District: The Case of Knitwear Firms
in Baden-Wurttemberg. Regional Studies, vol. 35, no 4, pp. 329–341.van der Linde C. (2003) The Demography of Clusters — Findings from the Cluster Metastudy. Innovation Clusters
and Interregional Competition (eds. J. Bröcker, D. Dohse, R. Soltwedel), Berlin: Springer Verlag, pp. 130–149.Wennberg K., Lindqvist G. (2010) The effect of clusters on the survival and performance of new firms. Small Business
Economics, vol. 34, no 3, pp. 221–241.Zemtsov S. (2013) Opyt vyavleniya i otsenki potentsiala innovatsionnykh klasterov (na primere otrasli “Ratsionalnoe
prirodopolzovaniye”) [Efforts to identify and evaluate the potential of innovative clusters]. Regionalnyie issledovaniya [Regional Research], no. 2, pp. 12-19 (in Russian).
Zemtsov S., Bukov D. (2016) Metody vyyavlenia klasterov malogo i srednego biznesa [The small and medium enterprises clusters’ identification]. Regional’naya ekonomika: teoriya I praktika [Regional Economics: Theory and Practice], no. 3, pp. 104–117 (in Russian).
Zemtsov S.P., Barinova V.A., Bukov D.V., Eremkin V.A. (2015) Uncovering Regional Clustering of High Technology SMEs: Russian Case. Mediterranean Journal of Social Sciences, no. 6, pp. 309–320.
Zhang S., Li X. (2008) Managerial ties, firm resources, and performance of cluster firms. Asia Pacific Journal of Management, vol. 25, no. 4, pp. 615–633.

2016 Vol. 10 No 3 FORESIGHT AND STI GOVERNANCE 532016 Т. 10 № 3 ФОРСАЙТ 53
Single-Industry Towns of Russia: Lock-In and Drivers of Innovative Search
Abstract
The problem of single-industry towns has become increasingly relevant recently in light of the crises in the Russian and global economy. The present article
attempts to examine this issue by using methodological approaches adopted internationally to analyse single-industry towns. At the heart of these approaches is the concept of path dependence, coupled with a method to identify the factors blocking innovative search in the so-called new industrial policy. The authors critically reevaluate the situation in single-industry towns, in contrast to the existing assessments that are widespread in Russian language research. Rather than analysing industrial sectoral specialization, they suggest studying the core of economic
Keywords: single-industry towns; lock-in in innovative development; innovative search; local community; new industrial policy; entrepreneurship; path dependence
development i.e. a city’s capacity to upgrade its local production system and to initiate innovative search.
The article describes the main principles of new industrial policy, which is vulnerable not so much to a narrow specialization but primarily to a package of technological, political, and cognitive lock-ins. These lock-ins prevent the growth of an innovative sector in single-industry towns and stop local communities from being able to adapt to changing economic conditions. The authors show the possibilities and concrete directions of innovative search in various single-industry towns in Russia. They give recommendations on the key policy instruments that can help overcome the existing lock-ins in monoprofile Russian towns.
DOI: 10.17323/1995-459X.2016.3.53.64
Leading Researcher, Faculty of Geography, Lomonosov Moscow State University. Address: Leninskie Gory, GSP-1, 119991 Moscow, Russian Federation. E-mail: [email protected]
Nadezhda Zamyatina
Citation: Zamyatina N., Pilyasov A. (2016) Single-Industry Towns of Russia: Lock-In and Drivers of Innovative Search. Foresight and STI Governance, vol. 10, no 3, pp. 53–64. DOI: 10.17323/1995-459X.2016.3.53.64
Director, Center for the Northern and Arctic Economies, Council for the Study of Productive Forces. Address: 7 Vavilova str., GSP-7, 177997 Moscow, Russian Federation. E-mail: [email protected]
Alexander Pilyasov
2016 Vol. 10 No 3 FORESIGHT AND STI GOVERNANCE 53

Spatial Development and Innovation: Russian Practice
54 FORESIGHT AND STI GOVERNANCE Vol. 10 No 3 2016
Relevance of studying Single-Industry Towns in modern Russia
The issue of single-industry towns has been repeatedly addressed in Russia and internationally. At times of crisis, the issue unsurprisingly attracts even more interest. We observe this both in 2008–2009 when the topic was under the radar of the mass media1, as well as in the last couple of years when authorities and expert community became genuinely concerned about the problem of single-industry towns2 [CISRE, 2012; Lappo, 2012; Lyubovnyi, 2013; BasEl, 2013; VSU, 2013; Pytkin, Zagoruiko, 2011; P’yankova, 2011; Turkov, 2012; Uskova et al., 2012]. A review of the literature shows how the majority of researchers argue that single-industry towns are a legacy of Soviet economic misjudgments; however, this is not completely true. Such towns emerged in Russia not so much because of the economic order of the USSR but mainly because of the industrial era itself, which predetermined the shape of most developed economies. To solve the problem of single-industry towns, it is essential to radically update approaches and modify management strategies rather than their industrial specializations.The theoretical part of this article compares the results of Russian and international studies on the subject. The array of sources we have analysed includes several dozen Russian and international works (for more detail, see [Zamyatina, Pilyasov, 2015]). The huge number of publications reflects how widespread this phenomenon is: large industrial facilities have become backbone enterprises in hundreds of regions all over the world. Attempts to reform them through dirigiste unified methods with no consideration for local peculiarities have been undertaken not only in Russia. These policies were one-off initiatives such as targeted support of infrastructure projects and the creation of large enterprises (e.g. car plants in coal mining and metallurgical regions) in highly specialized territories. As a rule, such initiatives have been inefficient as they did not solve local problems but only reproduced them. The majority of the more developed economies have gradually switched to a new methodological platform and started to implement approaches that could also be used in Russia despite the latter’s specificities.3
However, the current state policy and public discussions around single-industry towns in Russia have taken a completely different direction. Calls for direct federal government interventions in social and economic problems of specific cities are heard, while the potential of local communities is underestimated. These are hallmarks of centralized economic policy harmful to development of single-industry territorial entities. International experience shows a contrasting opposite approach is more effective, one focused on fostering innovative search in the towns themselves and enhancing their stability in a changing economic climate. One novel contribution of this article is its theoretical framework of new industrial policy, which remains rarely used by Russian scholars. One of the goals of the present study is to define the principles of this framework and assess how well it can be applied to Russian single-industry towns.The relevance of modern methods of governing single-industry towns in Russia can be disputed; therefore, we aim to demonstrate how a new industrial policy that relies on local innovative search can be applied in the Russian context. We show that a dismantling of traditional scenarios of development in periphery regions is already underway in single-industry towns of Russia. In seemingly hopeless cases, the local community mobilizes and new drivers of development appear. The paper describes the principles of new industrial policy when applied to Russian single-industry towns, gives specific examples of barriers to their development, and suggests a range of state support measures applicable in current conditions.
Theoretical Assumptions about the Governance of Single-Industry Towns: Innovative Search and New Industrial PolicyIn this paper, innovative search is broadly defined as efforts to select new efficient products, technological processes, and organizational solutions in various economic sectors. This particular set of tools has been suggested by various studies on restructuring single-industry towns as the most efficient long-term strategy [Agrawal et al., 2010; Anas, Xiong, 2005; Bartik, 2009; Caravelis, Russell, 2001; Gebauer et al., 2003; Maier, Trippl, 2011; Todtling, Trippl, 2004; Totzer, Gigler, 2005; Trippl, Otto, 2009].
1 On the evolution of views on single-industry towns, see the chapter “Single-Industry Towns Mythology” in [Zubarevich, 2010, pp. 82–96].
2 We specifically mention the first national programme on single-industry towns in CIS countries that was adopted in Kazakhstan by Government Decree # 683 of 25.05.2012 “On the Adoption of the Single-Industry Towns Development Programme for 2012 – 2020.”
3 Russia’s structural political and economic specificities, including its expansive territory and weak infrastructure, make for more rigid conditions compared to, for example, Europe, and mean Russia is closer to countries such as Brazil and India [Audretsch, Thurik, 2001].

2016 Vol. 10 No 3 FORESIGHT AND STI GOVERNANCE 55
Zamyatina N., Pilyasov А., pp. 53–64
The transition to a new development model is driven by the global context of changing technological patterns and engines of economic growth. The post-industrial economic structure, however, does not suggest that industrial development has to be abandoned, especially in single-industry towns. The industrial sector continues to play an important role in an economy but becomes just one of the elements of the system alongside the local institutional, cultural, entrepreneurial, research, and educational infrastructure. These changes influence industrial policy, which under the new conditions is undergoing a radical transformation, best described by Dani Rodrik in his paper Industrial Policy for the Twenty-First Century [Rodrik, 2004] and other works [Rodrik, 2008; 2014; Hausmann, Rodrik, 2002; Hausmann et al., 2007]. The elements of new industrial policy may be defined as the focused efforts to establish an environment for the development of industrial enterprises, including the modernization of the education system, promotion of scientific research, support for first-time entrepreneurs (potential suppliers and sub-contractors for large businesses), development of industrial services, and the optimization of the urban environment.A modern approach to modernizing single-industry and old industrial towns has developed gradually. Globally, namely in the famous German Ruhr region [Hermann, 2002], we can distinguish two stages of restructuring with different ideologies concerning innovative search: in the first stage, such activity does not exist while in the second stage, we see the gradual involvement of local economic agents (Table 1).As Russia has embarked on transforming single-industry towns much later than the majority of developed countries and still retains features of several various economic set-ups, it is important to introduce new industrial policy methods in the first stage of restructuring. It would be a mistake to wait for the results of a ‘natural’ evolution of single-industry territorial entities complemented by conventional regulation methods. Why is traditional industrial policy inefficient in the modern context? In virtually all countries, it has been implemented from above through so-called targeting, i.e. the selective support of a sector, industry, or enterprise. The costs of such an approach were arbitrariness in choosing the beneficiaries of state support, large-scale lobbying, and corruption among both public officials distributing state funds and direct recipients of grants, subsidies, and grants.In the relatively small, Asian economies, the above costs (due to these countries’ modest scale and inevitable transparency of disbursement schemes) were marginal compared to the undisputable advantages of boosting new production. In contrast, this traditional policy had in fact discredited itself in European countries. Since the 1980s, European governments began introducing radical market management principles. However, this orthodox liberal approach eventually came into collision with the goals of dynamic development of innovative economic sectors. It became clear that it was impossible to solve the problem of unbalanced regional specializations through purely market mechanisms, hence the aspirations for industrial policy of a different, horizontal type.The novelty of this policy primarily lies in its orientation towards searching for development opportunities of new types of industrial activities in a given particular territory, rather than direct support tools for sectors and enterprises, such as tax benefits, loans, subsidies or other mechanisms. In such an interpretation, new industrial policy takes a much more holistic form, and its specific efforts often seem unconventional. This refers to policy tools such as subsidizing call centers, tourist or agricultural companies, when these initiatives are aimed at training local entrepreneurs, as well as lowering barriers for local business. Implementing this policy involves not only business and industrial players, but also local authorities, service companies, non-commercial structures, and professional associations.
Parameters First ‘Inertia’ Stage: Surface Restructuring
Second ‘Innovative’ Stage: Deep Restructuring
Innovative search No Involves local economic agentsProduction profile Preserved and upgraded New trends of economic (industrial and
tertiary industry) specializations appear; old specialization organizationally shrunk and transformed
Industrial policy Centralized, dirigiste, envisages the implementation of a common strategy in all single-industry towns
Decentralized, sensitive to local contexts in determining new opportunities by local economic agents
Support programs Major industrial, infrastructure and educational projects
Network projects on setting up technology parks, business incubators, innovative clusters, etc.
Key problems Lock-ins in development — functional, cognitive, and political
Risks and uncertainties
Source: соmpiled by the authors.
Тable 1. Stages of Single-Industry Towns Restructuring

Spatial Development and Innovation: Russian Practice
56 FORESIGHT AND STI GOVERNANCE Vol. 10 No 3 2016
The priorities of new industrial policy are therefore defined according to its character: acceleration of innovative processes, promotion of local innovative systems and technological refurbishing of industry, including through external investment and intensifying exports of finished products. The decentralized character of the new industrial policy predefines its deeper local rootedness, based on an understanding of the implicit ‘endemic’ principles of management and business operations, as well as of local competences. The latter are not so much industry specific but more functional in nature, and aim to, for example, localize imported technologies that are often extremely intensive in terms of time, labour, and resources.New industrial policy suggests a truly individual approach for each single-industry town. The only common feature of the toolset is the drive to foster innovative search for development opportunities for the town’s backbone enterprise, small and medium businesses, and other subjects of the local industrial system. In due course, innovative search results in the selection of institutional practices for attracting investors, implementing projects, and shifting specializations that are efficient for that particular town. It is important to ensure that these positive externalities, new for the town’s economy, generate knowledge spillovers, create the conditions for the local community’s self-learning, and, moreover, can be easily evaluated in terms of their efficiency.A modern industrial policy requires the challenges and threats to the sustainable development of single-industry towns to be reassessed. The methodology of new industrial policy does not see in a narrow specialization or single industry an obstacle, but rather in the specificities of the local environment. Scholars use the notion of path dependence to describe this problem. Production processes and companies’ organizational principles, the structure of the urban community, functional space zoning, skills, behavioural models, and the mindsets of the local population are reproduced over many generations and come into conflict with the changing environment, slow down changes, and do not allow new trends to fully emerge. As Douglass North, a Nobel Prize in Economics winner, wrote: ‘Path dependence is not “inertia”, rather it is the constraints on the choice set in the present that are derived from historical experience of the past” [North, 2005]. Key restructuring problems come down to constraints on choosing ways of development that are generally divided into three groups (types) of so-called lock-ins of innovative development: functional, political, and cognitive [Starodubrovskaya, 2011; Hassink, 2005].The difference between a typical single-industry town and a locality with similar characteristics but a more diversified profile lies not in the presence of developmental barriers (these exist in all towns) but rather in how much these barriers are expressed. In single-industry mining towns, certain developmental models based on specific resources and operation practices have been established for decades. We typically find firmly held views about conveyor production process and finished product lines that have not changed for many years in these towns. It is not unusual to see families with several generations of workers in them. If the economy is stable, long-term factory traditions ensure greater stability of the production process. Using Mark Granovetter’s definition [Granovetter, 1985] this may be called the cultural embeddedness of the local economy. However, with time such embeddedness becomes a constraint as it resists radical innovations and reduces the economy’s adaptability to changing market conditions.These are the negative effects of path dependence. Conservative cultural and behavioural attitudes make it impossible to develop a fresh approach to a town’s problems or create demand for change within the local professional community. Instead of launching a process of agile adaptation to current trends and the needed technological and organizational reorganization, people are involved in longstanding discussions about the possibilities for development within the established economic and management paradigm. Ultimately, only a crisis may motivate economic actors, including local authorities, to initiate change based on an extensive innovative search. Getting rid of lock-ins of innovative development could have averted the collapse of many single-industry towns. We now examine in more detail the most characteristic lock-ins.The greatest challenges generally lie in overcoming cognitive barriers. These are primarily dependency mentalities fostered by a long experience of living in a context of social guarantees offered by a backbone enterprise during its prosperity phase. Such a mentality, on the one hand, stifles individual initiative, in particular that of small business. On the other hand, it decreases the perceived value of activities outside the single-industry town’s specialization. A successful backbone enterprise absorbs the most qualified and ambitious young talent, diluting alternative local business and other sectors of the production system.Political barriers usually consist of passive (and often corrupt) local authorities. This phenomenon is most pronounced when the backbone enterprise belongs to a holding company outside the town. However, the case of Kondopoga and the Kondopoga Pulp and Paper Mill (joint stock company ‘Kondopoga’) shows that a resident owner may also play a similar negative role in town development. This is especially true for single-industry towns that historically produced goods of national importance: their residents and backbone enterprise workers are accustomed to their own high social standing.

2016 Vol. 10 No 3 FORESIGHT AND STI GOVERNANCE 57
Small business development as a resource for economic diversification in such towns is more often than not mere imitation. Dependency mentality not only easily triggers social protests but also blocks preventive actions. In particular, inhabitants of single-industry towns are not usually keen to move to more dynamically developing regions [BazEl, 2013]. They do not even support obvious ways to overcome social tensions, such as offering work in nearby towns when their town’s backbone enterprise downsizes.
The former prosperity of the enterprise in Kondopoga resulted in a weak social and political system that manifested itself during the mass riots in 2006. The backbone enterprise used to be the biggest national producer of newsprint paper and owned well-developed social infrastructure. For many years, the factory was headed by the charismatic director, Vitaly Federmesser, who did much to improve urban infrastructure (e.g. paving slabs, fountain, unique carillon bells) and diversify public spaces (e.g. ice arena and arts palace) [KarelInform, 2013]. ‘All of these make Kondopoga similar to Moscow Region towns, such as Khimki, Mytishi, Liubertsy, etc.’ [Popov, 2007]. However, this company (successful up to the mid-2000s) hindered the development of small and medium enterprises and depleted the labour market by offering prestigious jobs with extremely competitive salaries. Consequently, all powers in the town were accumulated in the hands of the backbone enterprise management. The latter, according to some sources, tried but could not prevent mass disorders, as it did not have the necessary social technologies and was not ready for conflict [Grigoriev, 2006].
Pikalyovo became widely known because of the President’s intervention in a social and political crisis that broke out in the town. The crisis was provoked not so much by the downsizing policy of the company that owns the backbone enterprise, ‘Basic Element’, as by the specific behavioural mindsets of the local population. Even before the acute phase of the crisis, unemployed town residents, primarily the younger generation, were offered jobs in other towns, including in a town called Tikhvin located 25 kilometers from Pikalyovo. In some cases, they were even offered higher salaries. The most economically sound solution would be to organize daily transfers to the new place of work. However, local citizens rejected these job offers in other towns en masse, as well as community work and retraining with guaranteed employment. A political way to resolve the conflict prevailed over economic solutions [Dvas, 2009].
The production systems of specific cities have distinct peculiarities, which either aggravate structural constraints on innovative development or mitigate them. Below we summarize these characteristics.Excessively rigid production chains that decrease the ability of businesses to adapt to changing economic conditions and diversify is a classic problem of Russian single-industry towns. The key root cause for this group of barriers to innovative development is industry profile: the metal and mining industries are least able to diversify and restructure. However, the rigidness of production links usually has a very individual and specific character at each enterprise.Role of the backbone enterprise in the organizational structure of the company. Independent enterprises with headquarters or core asset business units of a holding company located in the given single-industry town have definite advantages from the point of view of innovative development. In such cases, the enterprise’s organizational independence ensures greater flexibility in decision making, research, and resource distribution.Agglomeration effects occur when a single-industry town is part of an urban agglomeration or is located close to a big regional centre. In such situations, the outcomes of agglomeration effects are negative externalities for the town’s production system. Being able to satisfy demand for consumer and business services by a 30-60-minute drive to the nearby big city also hinders internal market development within the single-industry town and ultimately, dispels any trust in the potential for businesses that offer alternatives to the backbone enterprise. Isolation, on the contrary, is often a driver of local economy development, however paradoxical this seems.
Zamyatina N., Pilyasov А., pp. 53–64

Spatial Development and Innovation: Russian Practice
58 FORESIGHT AND STI GOVERNANCE Vol. 10 No 3 2016
Agglomeration negatively affects the industrial functions of single-industry towns primarily. A town may survive by becoming a residential, tourist, or even business satellite town. A more comfortable environment in such towns may help them avoid depression and gain competitive advantages: satellite towns are ahead of agglomeration centres thanks to their proximity to nature, human scale of the urban environment, and social infrastructure within walking distance. Hence the creation of a comfortable environment may prove to be the most efficient rehabilitation effort for single-industry towns.The prevalence of strong social ties, reflected in a lack of trust or even outright hostility to outsiders is one of the typical cognitive barriers to innovative development of single-industry towns. Such barriers rarely play a critical role. They generally occur in the national republics of Russia where they are based on clan social groupings [Humphrey, 2007]. However, strong social ties and a distinction between ‘us’ and ‘them’ do remain even in towns with modern management, creating barriers (sometimes of a criminal nature) to local market entry for new players.
Industry development under unfavourable transport conditions can be illustrated by the case of Kostomuksha. ‘A local entrepreneur, Ivan Samokhvalov, explains the reason for setting up local production: “Petrozavodsk is about 500 kilometers away, St Petersburg about 930 kilometers, and the road is very bad at times. When I used to buy sausages in St Petersburg, a car usually arrived here very late at night. In the morning, I had to accept the goods, deliver them to stores, weigh them, and quote a price. Yet the shelf life of French sausages, for example, is 48 hours. So, no sooner had we delivered them, it was time to throw them away. We realized that these products have to be manufactured locally.”’ [Novikova, 2014; Ekspert Severo-Zapad, 2013]
We Have Clans in our Town
Source: interview with an entrepreneur in Dudinka (Krasnoyarsk Krai) taken by one of the authors (N.Z.) in September 2013.
The negative influence of social ties on local economic development is clearly illustrated by the following interview: ‘In our town, you know, it’s like Mafia or Kosa Nostra – we have clans. Whoever works where, the money is shared. Family connections are not as important as business ones. Whom do you consider to be one of “us”? More than that – when children move to Krasnoyarsk it happens that they all live in one district and communicate. …We do not need you (“them”) here. Here, up north, many people try to start a business – this and that is possible - but we won’t let them. We don’t need you, as you’re one of “them”.We won’t tolerate any of “them”. I for one take and give bribes, and nobody is afraid of taking from me because everybody knows me. Some guys from St. Petersburg came here about eight years ago, they wanted to start a business as the Internet here was crap…They gave away about $100,000 in bribes, but all for nothing. I told them: either you make me number one or get the hell outta’ here.’
Sometimes, the barriers to business development (including innovative business) created not so much by the inactivity of local authorities but by the opposition of separate groups of businessmen caused by the inefficient organization of social networks. As such, the entrepreneurial energy of the urban community is spent on political infighting at the expense of the actors’ economic interests. A classic example from Chicago has been described by the American political scientist Barbara Ferman [Ferman, 1996]. Sometimes, we observe an analogous situation in Russia when the urban community is split due to political activity substituting entrepreneurship.Often, local specificities facilitate and catalyze innovative search. It is precisely in towns with unique conditions that the local community is more active and new economic and institutional solutions are easier to implement and better perceived locally. These enclaves represent a kind of experimental ground where new approaches to local modernization emerge without direct state support. Innovative search begins under favourable conditions, and then is rolled out as a best practice to other territories with an artificially created environment.Location on a border or transit route – together with the associated tourist traffic and historical features of the area, etc. - is one of the conditions facilitating the launch of innovative search at a local level. Examples

2016 Vol. 10 No 3 FORESIGHT AND STI GOVERNANCE 59
of new enterprises in western regions of Karelia that were formerly part of Finland are indicative cases. A familiarity with the area facilitates market entry for Finnish investors and, consequently, almost all European or joint (with Finnish partners) ventures are located in this region of Karelia [RKS Group, 2013; Kospine.Ru, n.d.]. This example proves that external links clearly have a positive influence on the integration of local economic players into global networks. Accordingly, the most important conditions for improving the situation in single-industry towns are their openness, intensification of international economic and information exchange, and incorporation into trans-border social and industrial networks.Proximity to unique primary resources is an obvious, but not always fully appreciated, advantage for some towns. In the Russian context, this factor becomes critical not so much because of transportation costs but rather because of the chance to have personal control over the production process and reduce the risk of thievery by staff or contractors [Ekspert Severo-Zapad, 2013]. Every single-industry town should be interested in looking for resources (not only primary or natural) that make it an exceptional place. The unique skills and social ties outside the town of the local community that open ways to specific innovations are of utmost importance in this regard. Such search may result in very unusual forms. For example, one could hardly expect that the main source of income for some residents of Baikalsk in Siberia after the closure of their town’s backbone enterprise would become selling strawberries first grown commercially by immigrants from Ukraine [CISRE, 2012; Irkutsk Media, 2014].Strong municipal self-government. The successful extension of an industrial network structure that is responsive to progress and innovations often depends on an efficient leader who is able to mobilize local resources for the development of a remote area. The automotive construction cluster in Kaluga region was built specifically thanks to the authorities’ efforts. Many other, less widely known territories, such as Gubkinskiy in Yamalo-Nenets Autonomous Okrug, have similar experiences [Zamyatina, Pilyasov, 2013]. The downsides of strong municipal authorities include excessive influence of some individuals and random factors on drawing up economic and political strategies. Economic growth may slow down significantly when new key decision makers come into the picture or when the conditions of the town’s industry structure development changes slightly. To prevent such a scenario, it is possible to initiate institution building in industrial policy. In other words, individuals are substituted as drivers of innovative development at local level by sustainable institutions that specialize in supporting the production and dissemination of innovation, as well as the promotion of networking of market players.Strengthening local self-government and, most importantly, the involvement of local community in designing economic development strategies and expanding the dialogue between authorities, businesses, and NGOs representatives are cornerstones of single-industry towns’ sustainability. Not incidentally, the experiences of reviving the most depressive and crisis-ridden single-industry towns globally involve working with local communities and opinion leaders, and organizing public discussions on proposed developmental scenarios. It is precisely the local community, and not abstract indicators, that determines the destiny of single-industry territories, including making radical decisions such as liquidation or so-called ‘controlled shrinking’ of a town.A universal formula for local industry recovery is by improving the political, social, and economic environment. Although the link between these processes may seem questionable, longstanding sustainable changes become possible when their interconnections are taken into account.
New Industrial Policy Tools: Key RecommendationsSuccessful economic restructuring of single-industry towns requires the collective actions of authorities, businesses, and the local community. This is typically underestimated, with preference given to issues of budgeting, investment, and infrastructure development. At best, such collective action is mentioned in a declarative manner. However, these declarations remain abstract if one does not accept that the consolidation of efforts of all local economy actors is possible around a specific project, and its individual outcomes may vary a lot. For instance, projects promoting the social responsibility of local businesses may have not just vague charitable goals, but be targeted to creating new points of growth in the local social, cultural, leisure, and other sectors.Thus, the greatest chances for success of projects aimed at reviving the economy of single-industry towns are those implemented jointly, by pooling resources. This requires efficient communication between authorities and businesses, accountability of the former to the local community, close interaction between producers, alignment of development strategies of different sectors of the municipal economy, as well as sustainable growth of knowledge and competences. Improving transport routes, communication infrastructure, and expanding the channels of integration of single-industry towns into the global information space are technical requirements for opening up local economies.
Zamyatina N., Pilyasov А., pp. 53–64

Spatial Development and Innovation: Russian Practice
60 FORESIGHT AND STI GOVERNANCE Vol. 10 No 3 2016
In many countries, restructuring of single-industry towns is usually performed with the extensive involvement of local businesses, led by a group of innovative entrepreneurs. The latter open up new manufacturing niches and areas, and discover through experimentation promising opportunities for modifying the local specialization based on their given town’s specific economic and geographic location, existing natural resources, material assets, and human capital. Entrepreneurs’ creativity, as well as their readiness and capabilities for innovative search are generally boosted during times of crisis.
The case of the construction of a bridge across the Saryinka River in the town of Sharya, Kostroma region in Western Russia is an outstanding example of innovative search and local community involvement inspired by complicated social and economic conditions. One of the residential neighbourhoods was cut off from the town centre by the poor state of the old bridge. The residents, abandoning all hopes of getting help from the local administration, raised money for the new bridge themselves. This urgent need consolidated the community: many residents donated money to solve the problem, others purchased materials or personally participated in the construction process. The municipal administration provided some machinery needed for the construction. As material resources were limited, unconventional solutions were found: instead of an expensive crane, the builders used a large-tonnage railway jack owned by a local pensioner. The grassroots initiative dramatically decreased project costs from the initially estimated RUB 13 million to RUB500,000 [Trukhanova, 2013].
The case of Kiruna in Sweden is worth mentioning: the restructuring of the ‘LKAB’ backbone enterprise is included in a town planning policy that envisages the gradual relocation of a residential area [Chirkova, 2011]. It is noteworthy that the company lists transformation of the urban environment among its key strategic focus areas on its website [LKAB, n.d.].
The most remarkable and well-known example of rethinking the model of urban economic development is the transformation of Bilbao – an old industrial centre in northern Spain – after the opening of the Guggenheim Museum. The museum’s daring building in the Deconstructivist style designed by the outstanding architect Frank Gehry has transformed collective perceptions of the city: from a centre of iron industry, it has become one of the world’s Meccas of modern art and tourism [Lee, 2007].However, the example of Canada’s Dawson is more relevant for Russia. The capital of the ‘gold rush’, made famous by the novels of Jack London, has nowadays almost lost its former meaning and become a thematic tourist attraction. Interest in the town is stirred up by a continuous sequence of events expertly built into the annual calendar – from ice hockey tournaments and the spring carnival to bikers’ parades and vaudeville shows [DawsonCity.Ca, n.d.]. The transition from an industrial to cultural specialization is generally accompanied by a sharp population decrease. However, the town itself, its landscape and history are preserved. The town of Dawson is located in a remote area similar to many isolated towns in Russia’s Far North. Together with other similar small industrial towns on the periphery, Dawson may set an example for dozens of Russian settlements that have lost their industry but have preserved, at least partially, their cultural heritage coming from the heroic deeds of the construction workers of the first five-year plans, the dedication of the Komsomol brigades doing construction projects, the romantic hardships of Arctic exploration, stories of gold-diggers in Siberia, and space and atomic projects. These territories can and should switch from being depressed areas to becoming tourist centres for preserving the history and collective memory of Russia.
The ability to capitalize on local culture, history, traditions, etc. plays an important role in moving from a firmly established pattern of a single-industry town to a more dynamic one, in shifting from an inert state to a creative one. This process is usually described as ‘rebranding’ or changing the town’s image and its conception of development.

2016 Vol. 10 No 3 FORESIGHT AND STI GOVERNANCE 61
From a management perspective, the rehabilitation of Russian single-industry towns may take a variety of forms: state programmes for setting up technology parks, supporting local entrepreneurs and developing energy efficient technologies; grants to individual producers or academic institutions; and consultations for local administrations by NGOs (similar to the grant programmes of Opora Rossii for city branding; for example, the town of Kostomuksha in Karelia won Opora’s first competition in 2014). The most efficient federal policies seem to be the following:• Design and acceptance of the targeted programme ‘Development of Single-Industry Towns of Russia’
using the methodology of new industrial policy;• Creation of an Agency for the Development of Russian Single-Industry Towns, an initiative justified
by international and Russian practice. Setting up this Agency would send a signal to society as well as to Russian and international investors that the Russian government is committed to transforming single-industry towns in Russia; and
• Giving flagship status within the relevant federal programmes to some of the anchor projects in large and medium sized single-industry towns. The characteristic features of such projects should be their experimental and pilot nature aimed at fostering new specializations in the local economy and switching from the reproduction of the backbone enterprise to its development, extension, and diversification. It may be possible to consider new specializations such as green farming, production control (including in the backbone enterprise), energy efficiency projects, customized house-building, manufacturing of innovative construction materials, etc.
The ideology of new industrial policy envisages that these actions address the full range of a given town’s economic specializations.First, it is necessary to create a package of policies for towns in a crisis or relatively stable situation. A state of crisis requires immediate decisions to be taken by an operational body i.e. a specially created team for designing local development scenarios with the participation of the local community and experienced external consultants. Setting up mobile teams of experts who are able to act as crisis managers in different localities could be an important federal policy in this regard. Standard industrial policy solutions for single-industry towns, varying depending on the local unemployment rate or production level, have proven ineffective. Consultants may use a set of tools to develop new industries, including eco-industries, establish cultural facilities, etc. For example, the practices of large-scale acquisition of property, regulation of ownership relations, and establishing free land pools are often pursued to prevent the catastrophic degradation of urban infrastructure. Expanding existing local production may be beneficial; sometimes, organizing massive rotation schemes have proven a salvation. However, the specific actions for each town can only be customized and determined on-site in close cooperation with local communities, representatives of authorities and NGOs, as well as business. International practices in restructuring single-industry towns are also important to consider.Communication with local communities must be prioritized early on, in the diagnostic stage. Crises in backbone enterprises are not always disastrous for a town’s social and economic development. Sometimes, the local economy may have already adjusted to a new specialization. For example, Umyot settlement in Mordovia Republic, long included in the list of single-industry settlements, has carved out a unique niche for itself as a supplier of food services for transit traffic on the Moscow – Samara route. In Värtsilä settlement, a weak backbone metalware enterprise continues alongside the expansion of promising industries such as timber processing and cross-border trade. Even more remarkable is the example of Chistye Bory settlement in Kostroma Region where a backbone nuclear power plant was never built but the local community continues working in the construction industry using a rotation scheme [Zausaeva, 2015].As already noted, the success of a new industrial policy in the economic restructuring of a single-industry town directly depends on the degree of local community involvement in the policy’s design and implementation (representatives of the corporate sector, small businesses, municipal authorities, and experts). Regional offices of a specialized body, such as the federal Ministry of Industry and Trade, may be engaged in the day-to-day monitoring of the situation to be responsible for forming an anti-crisis team uniting representatives of emergency response teams and local stakeholders if the local situation significantly worsens.Policy tools applicable to relatively stable single-industry towns may be divided into several categories: improving the urban infrastructure; developing the local political system and local community networking; support for educational institutions; and diversification of the local industrial system.Urban environment and infrastructure. Mechanisms of reducing the costs of facilities maintenance play a critical role in a wide range of actions aimed at rehabilitating single-industry towns. These include fostering eco-industries (for example, using waste to generate electric or heat power has great potential
Zamyatina N., Pilyasov А., pp. 53–64

Spatial Development and Innovation: Russian Practice
62 FORESIGHT AND STI GOVERNANCE Vol. 10 No 3 2016
for dozens of towns located in forested areas); implementing alternative sources of energy and small-scale power generation; improving energy performance (for example, construction of energy efficient buildings and residential areas in Zhatai settlement of Yakutia region). Russia’s existing development institutions can help to implement the above mechanisms. However, a decisive role in Russia’s current circumstances probably lies with removing institutional barriers, a role confirmed by the best Russian practices of municipal development.Social and political environment. This is perhaps the hardest aspect of urban development to reform, which however usually produces the greatest effect. It primarily refers to establishing local small business associations and involving players into local programmes of social and youth entrepreneurship. We noted above that entrepreneurship and other network associations are most effective in coordinating the efforts of a local business community, and in representing its interests in interactions with other stakeholders, local and federal authorities, and development institutions.Network initiatives may be centered on such unexpected activities as organizing volunteer work. Experience has proven that even traditional ‘subbotniks’, if organized informally, promote unity of different social groups and enhance activities that aim to solve pressing urban problems. More often than not, subbotniks encourage the emergence of teams that want to actively transform the urban environment, do grassroots strategic planning of local development, and act as a voice for the opinions of the urban community during negotiations with the administration of a backbone enterprise and the local authorities. Generally, volunteer activities require the involvement of social communications and modern urban development experts; therefore, co-financing through grants (or reimbursement of costs) for such experts’ services may be an effective tool for the development of single-industry towns.Knowledge infrastructure. This category of policies includes professional development and re-skilling programmes, as well as tailoring educational standards to the actual needs of local businesses. International experience of benchmarking development pathways of single-industry towns, where businesses take different positions in structures of parent holdings, shows that the presence of research and application mechanisms in the local industrial system are critically important. Local education institutions of all levels, which have recently been extensively downsized in Russia, have huge potential not only in professional training, but also in conducting research and development that aim to solve local problems and design innovative products customized for the specific urban economy or backbone enterprise (recycling, power saving, development of new products and services on the back of core products, etc.). Policies, for example, to encourage research and development, launch testing sites, and support small innovative companies are especially important in this regard.Industrial system. Here we mean the search for technological processes that are different to those already used in the production chain, when it becomes possible to use new manufacturing methods, expand the product range, diversify the network of suppliers and consumers, and launch new spin-offs. It is practicable to establish new production runs, primarily based on innovative technologies, preferably with outside sources of financing (in particular, from development funds), and implement infrastructure projects (including the construction of new roads that literally open the way to new markets and suppliers for an enterprise).An almost universal formula for economic recovery of a single-industry town is development of eco-industry: recycling and reprocessing of industrial waste, secondary recycling and further recycling of mining industry products, heat and electric power generation using accumulated and current waste of timber-cutting, etc. In the long-term, one recommendation is to develop a federal targeted programme for eco-industry development in Russia, in which single-industry towns could be included as testing sites. Improving people’s quality of life directly depends on manufacturing food products for the local market. Support from the state agricultural bank, Rosselkhozbank, which has been implementing agro-industrial projects in some single-industry towns (e.g. Pavlovo, Semiluki, and others), may prove effective.Multi-sector industrial parks may represent a valuable way to support local business in single-industry cites that are centres of urban conglomerations (for example, Serov), as confirmed by a number of successfully implemented projects. Remote isolated towns require a different approach to rehabilitation, namely: an approach targeted to individual small and medium innovative enterprises, supporting specific focal points of economic growth, and setting up municipal technology parks that can ensure not so much high business efficiency and profitability for businesses as be a kind of ‘safety cushion’ for the local economy. The industrial system of such towns is characterized by a rigid production chain of the backbone enterprise, aggravated by geographical isolation that necessitates the search for very narrow production niches for recipients of support. The list of options for the more remote and isolated single-industry towns includes manufacturing equipment for small and medium companies located in other single-industry towns; making complete production lines for eco-industry enterprises; making innovative products for

2016 Vol. 10 No 3 FORESIGHT AND STI GOVERNANCE 63
Agrawal A., Cockburn I., Rosell C. (2010) Not Invented Here? Innovation in company towns. Journal of Urban Economics, vol. 67, pp. 78–89.
Anas A., Xiong K. (2005) The formation and growth of specialized cities: Efficiency without developers or Malthusian traps. Regional Science and Urban Economics, vol. 35, p. 445–470.
Audretsch D.B., Thurik A.R. (2001) What’s new about the new economy? Sources of growth in the managed and entrepreneurial economies. Industrial and Corporate Change, vol. 10, no 1, pp. 267–315.
Bartik T.J. (2009) The Revitalization of Older Industrial Cities: A Review Essay of Retooling for Growth. Growth and Change, vol. 40, no 1, pp. 1–29.
BazEl (2013) Monogoroda. Perezagruzka. Poisk novykh modelei funktsionirovaniya monogorodov Rossii v izmenivshikhsya ekonomicheskikh usloviyakh [Monocities. Restart. The search for new models of functioning of Russian single-industry towns in the changed economic conditions], Moscow: Bazovyi element (in Russian).
Caravelis M., Russell I. (2001) From Mining Community to Seasonal Visitor Destination: The Transformation of Sotiras, Thasos, Greece. European Planning Studies, vol. 9, no 2, pp.187–199.
Chirkova E. (2011) Kiruna. Metamorfozy monogoroda [Kiruna. Metamorphosis of a single-enterprise town]. Voprosy ekonomicheskoi i politicheskoi geografii zarubezhnykh stran, vol. 19, pp. 222–238 (in Russian).
CISRE (2012) Gorod posle kombinata. Sotsial’no-ekonomicheskie strategii zhitelei goroda Baikal’ska [City life after the plant closure. Socio-economic policies of Baikalsk residents], Irkutsk: CISRE (in Russian).
DawsonСity.Ca (n.d.) Dawson-city: official website. Available at: http://dawsoncity.ca/, accessed 22.12.2014.Dvas G. (2009) «My tol’ko znaem, chto u „Rusala” net deneg...». Interv’yu s Grigoriem Dvasom, vitse-gubernatorom
Leningradskoi oblasti [«We only know that “Rusal” has no money…». Interview with Gregory Dvas, vice-governor of the Leningrad region]. Kommersant, 01.06.2009. Available at: http://www.kommersant.ru/doc/1179661, accessed 25.09.2014 (in Russian).
Ekspert Severo-Zapad (2013) Sotsial’nyi biznes na yagodakh [Berrypicking-based social business]. Ekspert Severo-Zapad, 14.10.2013. Available at: http://www.expertnw.ru/news/2013-10-14/sotsialny-biznes-na-yagodakh/, accessed 22.12.2014 (in Russian).
Ferman B. (1996) Challenging the Growth Machine. Neighborhood Politics in Chicago and Pittsburg, Lawrence: University Press of Kansas.
Gebauer A., Woon N.C., Parsche R. (2003) Regional Technology Policy and Factors Shaping Local Innovation Networks in Small German Cities, Munich: Ifo Institute for Economic Research.
Granovetter M. (1985) Economic action and social structure: the problem of embeddedness. The American Journal of Sociology, vol. 91, no 3, pp. 481–510.
Grigoriev M. (2006) Chto sluchilos’ v Kondopoge? [What happened in Kondopoga?]. Ekspert [Expert], no 47 (541), 18.12.2006. Available at: http://expert.ru/expert/2006/47/chto_sluchilos_v_kondopoge/, accessed 25.09.2014 (in Russian).
Hassink R. (2005) How to Unlock Regional Economies from Path Dependency? From Learning Region to Learning Cluster. European Planning Studies, vol. 13, no 4, pp. 521–535.
Hausmann R., Rodrik D. (2002) Economic development as self-discovery (NBER Working Paper 8952), Cambridge, MA: NBER.
Hausmann R., Rodrik D., Sabel Charles F. (2007) Reconfiguring industrial policy: A framework with an application to South Africa (CID Working Paper no 168), Cambridge, MA: Harward University Press.
Hermann B. (2002) Political Economy of Modernising Old Industrial Areas and the Crisis of the New Economy — The Example of the Ruhr Area and the City of Dortmund. Paper presented to the 42nd European Regional Science Association Congress, Dortmund, 27–31.08.2002.
Humphrey C. (ed.) (2007) Urban Life in Post-Soviet Central Asia. London: UCL Press.
the agro-industrial complex, energy saving and construction materials; producing equipment and tools for modernizing the infrastructure of northern towns; use of alternative energy sources; design of new heat insulation materials, etc.Thus, the ideology of such reorganization efforts must be based on designing production network structures uniting different single-industry towns. Activities aimed at supporting some single-industry towns may create demand for new industries in other similar towns, for example, in the process of modernizing the housing and utilities sector.
* * *The nature of innovative search in single-industry towns is directly determined by the fundamental particularities of local communities. Nevertheless, however important this issue may be, it is not right to associate it exclusively with the issue of urban economy restructuring, as innovative potential has far greater scope. The demand for introducing the institutions and mechanisms of innovative search in single-industry towns is fueled by external factors. The best experiences of its implementation can and should be rolled out to other settlements with similar conditions. The ideas of innovative search may prove fruitful in many sectors and spheres of regional and municipal policy, which over time should be redirected towards creating the conditions for innovative activities for a maximum possible number of players.
This paper has been prepared based on [Zamyatina, Pilyasov, 2015].
References
Zamyatina N., Pilyasov А., pp. 53–64

Spatial Development and Innovation: Russian Practice
64 FORESIGHT AND STI GOVERNANCE Vol. 10 No 3 2016
Irkutsk Media (2014) Sezon klubniki v Irkutskoi oblasti: opytom vyrashchivaniya yagody podelilis’ zhiteli Baikal’ska [Strawberry season in Irkutsk region: Baikalsk inhabitants shared the experience of growing berries]. IrkutskMedia.Ru, 22.07.2014. Available at: http://irkutskmedia.ru/news/oblast/22.07.2014/372304/sezon-klubniki-v-irkutskoy-oblasti-opitom-viraschivaniya-yagodi-podelilis-zhiteli-b.html, accessed 15.07.2015 (in Russian).
Karelinform (2013) Dvorets iskusstv v Kondopoge sobirayutsya zakryt’ [Palace of the Arts in Kondopoga are going to close]. Karelinform, 07.03.2013. Available at: http://karelinform.ru/?id=36549#ixzz2yq4qaWU4, accessed 25.09.2014 (in Russian).
Kospine.Ru (n.d.) Kospine Furniture: official website. Available at: http://www.kospine.ru/o-kompanii.html, accessed 07.12.2014.
Lappo G.M. (2012) Goroda Rossii. Vzglyad geografa [Russian Cities. A Geographer’s View], Moscow: Novyi Khronograf (in Russian).
Lee D. (2007) Bilbao: 10 Years later. The New York Times, 23.09.2007. Available at: http://www.nytimes.com/2007/09/23/travel/23bilbao.html?em&ex=1190606400&en=898bb5be11939f56&ei=5087%250A&_r=0, accessed 22.12.2014.
LKAB (n.d.) Focus areas / LKAB’s Strategy/Future // LKAB: official website. Available at: http://www.lkab.com/en/Future/LKAB-Strategy/Focus-areas/, accessed 12.12.2014.
Lyubovnyi V.Ya. (2013) Goroda Rossii. Al’ternativy razvitiya i upravleniya [Russian Cities. Alternatives for development and management], Moscow: Ekon-inform (in Russian).
Maier G., Trippl M. (2011) New Path Creation in Old Industrial Regions. The Case of the Software Park Hagenberg in the Province of Upper Austria. Paper prepared for the 51st European Congress of the Regional Science Association International, 30.08–03.09.2011, Barcelona, Spain.
North D. (2005) Understanding the Process of Economic Change, Princeton, N.J.: Princeton University Press.Novikova L. (2014) KostomuShKi bol’she ne budet [KostomuShKa no longer]. 64th Parallel online, 11.11.2014.
Available at: http://64parallel.ru/gorod/kostomushki-bolshe-ne-budet/, accessed 20.12.2014 (in Russian).Popov V. (2007) Chto proizoshlo v Kondopoge? [What happened in Kondopoga?]. Available at: http://www.rusrepublic.
ru/kond.html, accessed 25.09.2014 (in Russian).P’yankova S.G. (2011) Formirovanie institutov razvitiya monoprofil’nykh territorii: zarubezhnyi i otechestvennyi
opyt [Formation of single-industry areas of development institutions: foreign and domestic experience]. Ekonomicheskie nauki [Economic Sciences], no 12, pp. 422–427 (in Russian).
Pytkin A. N., Zagoruiko I. Yu. (2011) Kontseptual’nye aspekty reformirovaniya promyshlennykh monogorodov [Conceptual aspects of reforming industrial monocities]. Vestnik Chelyabinskogo gosudarstvennogo universiteta [Herald of Chelyabinsk State University], no 6 (221), Ekonomika [Economics series], issue 31, pp. 83–86 (in Russian).
RKS Group (2013) V fokuse Kostomukshi - pokupka firmy “Karkhatek” ukrepila pozitsii kontserna [Kostomuksha’s focus – Acquisition of “Karhatek” strengthened the position of the Group]. Available at: https://pkcable.com/vpered-k-budushemu/55-v-fokuse-kostomukshi-pokupka-firmy-karhatek-ukrepila-pozicii-koncerna.html, accessed 21.06.2015 (in Russian).
Rodrik D. (2004) Industrial policy for the twenty-first century, Cambridge, MA: Harvard University.Rodrik D. (2008) Industrial policy: Don’t ask why, ask how. Middle East Development Journal, demo issue, pp. 1–29.Rodrik D. (2014) Green Industrial policy. Oxford Review of Economic Policy, vol. 30, no 3, pp. 469–491.Starodubrovskaya I. (ed.) (2011) Strategii razvitiya staropromyshlennykh gorodov: mezhdunarodnyi opyt i perspektivy
v Rossii [Development Strategy of the old industrial cities: international experience and prospects in Russia], Moscow: Gaidar Institute (in Russian).
Todtling F., Trippl M. (2004) Like Phoenix from the Ashes? The Renewal of Clusters in Old Industrial Areas. Urban Studies, vol. 41, no 5/6, pp. 1175–1195.
Tötzer T., Gigler U. (2005) Managing urban dynamics in old industrial cities: Lessons learned on revitalising inner-city industrial sites in six European case studies. Paper presented at the 45th Congress of the European Regional Science Association — Land Use and Water Management in a Sustainable Network Society, 23-27.08.2005, Amsterdam.
Trippl M., Otto A. (2009) How to turn the fate of old industrial areas: A comparison of cluster-based renewal processes in Styria and the Saarland. Environment and Planning A, vol. 41, pp.1217–1233.
Trukhanova E. (2013) Predprinimateli otremontirovali most [Entrepreneurs repaired the bridge]. Rossiiskaya gazeta, 18.01.2013. Available at: http://www.rg.ru/2013/01/18/reg-cfo/most.html, accessed 25.09.2014 (in Russian).
Turkov A.V. (ed.) (2012) Razvitie monoprofil’nykh naselennykh punktov v Rossiiskoi Federatsii: sbornik nauchnykh trudov [The development of single-industry settlements in the Russian Federation: The collection of scientific papers], Moscow: Financial University (in Russian).
Uskova T.V., Iogman L.G., Tkachuk S.N., Nesterov A.N., Litvinova N.Yu. (2012) Monogorod: upravlenie razvitiem [Single-industry towns: Management of development], Vologda: ISEDT RAS (in Russian).
VSU (2013) Problemy i perspektivy razvitiya monogorodov: materialy regional’nogo nauchno-prakticheskogo seminara [Problems and prospects of development of single-industry towns: Materials of regional scientific-practical seminar], Voronezh: Voronezh State University (in Russian).
Zamyatina N.Yu., Pilyasov A.N. (2013) Rossiya, kotoruyu my obreli: issleduya prostranstvo na mikrourovne [Russia, which we have found: Exploring space at a micro level], Moscow: Novyi Khronograf (in Russian).
Zamyatina N.Yu., Pilyasov A.N. (2015) Innovatsionnyi poisk v monoprofil’nykh gorodakh: blokirovki razvitiya, novaya promyshlennaya politika i plan deistvii [Innovative search in single-industry towns: the lock-in of new industry policy and a plan of action], Moscow: LENAND (in Russian).
Zausaeva Ya.D. (2015) Institutsional’nye faktory razvitiya nesostoyavshikhsya atomnykh gorodov [Institutional factors of failed nuclear cities]. Demoscope Weekly, no 631–632, 23.02 – 08.03.2015. Available at: http://demoscope.ru/weekly/2015/0631/analit04.php, accessed 15.07.2015 (in Russian).
Zubarevich N.V. (2010) Regiony Rossii: neravenstvo, krizis, modernizatsiya [Regions of Russia: The inequality crisis, modernization], Moscow: Independent Institute for Social Policy (in Russian).

2016 Vol. 10 No 3 FORESIGHT AND STI GOVERNANCE 65
The Smart City Approach as a Response to Emerging Challenges for Urban Development
Researcher, Institute for Statistical Studies and Economics of Knowledge (ISSEK). E-mail: [email protected]
Marina Boykova
Abstract
In light of the increasingly complex socioeconomic processes and changes, today’s cities as complex systems
will not be able to respond to numerous challenges unless they possess a governance model that can flexibly adjust to shifting external conditions. In this regard, there is growing demand for innovative management tools combining solutions from different fields. The ‘smart city’ concept is one of the most sought after. This article analyses the advantages of this concept, the necessary conditions, as well as the obstacles for implementing it. We consider the challenges related to becoming a ‘smart city’, the different ways a smart city comes into being, evaluate the future for smart city solutions, as well as assess the current willingness of administrations of Russian cities to adopt this model.
From our analysis, we conclude that ‘smart city’ strategies continue in many cases to rely on a narrow,
‘technological’ approach. Such an approach presupposes that the availability alone of smart infrastructure can solve
Keywords: smart city; urban policy; complex systems management; innovation; technological approach; comprehensive approach
many urban problems and improve the quality of urban life. However, in contrast to the extended, comprehensive approach, it does not address many socioeconomic factors and the real needs of the population. Consequently, certain targets remain largely unfulfilled. The implementation of an integrated approach implies a number of conditions, such as the ability to integrate management decisions taken at various levels and predict how changes in one system affect other systems; a focus on interdisciplinary collaboration; and an ability to deal with resistance to changes.
A survey conducted by the HSE’s Research Institute for Regional and Urban Planning in 2015 aimed to evaluate the future prospects for establishing the concept of ‘smart city’ in Russian cities. The survey results show that city managers in Russia in general positively perceive the ‘smart city’ approach as a basis for urban development strategies. Yet, the possibilities for implementing it are mostly seen as medium or long-term options.
DOI: 10.17323/1995-459X.2016.3.65.75
Director, Institute of Regional Studies and Urban Planning. E-mail: [email protected] Ilina
National Research University Higher School of Economics. Address: 20 Myasnitskaya str., 101000 Moscow, Russian Federation
Citation: Boykova M., Ilina I., Salazkin M. (2016)The Smart City Approach as a Response to Emerging Challenges for Urban Development. Foresight and STI Governance, vol. 10, no 3, pp. 65–75. DOI: 10.17323/1995-459X.2016.3.65.75
Chief Specialist, ISSEK. E-mail: [email protected]
Mikhail Salazkin

Spatial Development and Innovation: Russian Practice
66 FORESIGHT AND STI GOVERNANCE Vol. 10 No 3 2016
Modern cities are demonstrative reflections of diverse socioeconomic processes and changes, unparalleled in their dynamism, profoundness, and comprehensiveness. Playing increasingly
significant roles in the global economy, they simultaneously face destructive ecological and social effects from their rapid growth. Of foremost importance are the goals of improving living standards, reducing social inequality, protecting the environment, and ensuring effective governance. The latter is critical because modern cities are super-complex multilevel systems consisting of numerous elements – actors who interact and cooperate with the external environment, continuously absorbing technological and other innovations. This structure will not be able to respond numerous challenges without an ongoing transformation of governance and its adaptation to changing external conditions is not envisaged [Sirkin et al., 2005]. Consequently, finding such a model becomes vital and this is a huge challenge for management teams that see a city simply as an aggregate of material infrastructure components and technology solutions with no regard for diverse social groups’ interests and their interactions [Portugali, 2011].The cognitive problem of struggling to embrace cutting-edge management models has increasing significance [Bettencourt, 2012]. Adjusting to complex systems means adopting qualitatively new standards of governance that allow technological and social aspects to be taken into account. It also means adopting new phenomena, finding a consensus between actors, and generating coordinated and effective city development strategies.The concept of a smart city is one of such governance models and involves the active use of information and communications technology (ICT). This concept has been discussed in the scientific literature globally since the 1980s. Yet, the actual term of ‘smart city’ was first introduced in the early 1990s to highlight the increasing dependence of cities on technological and other innovations. A large volume of research examines issues of the ‘smart’ model of urbanization: its nature, opportunities, risks, and conditions for its successful implementation. An analysis of a vast range of sources shows the main advantages and limitations related to implementing such projects (Table 1). A ‘smart’ model of development implies an ongoing process of innovative changes that affect all governance levels and aspects of city life. These inevitably evoke resistance from the surrounding environment in many fields, to overcome which special competences are needed. This is a lengthy process requiring considerable time and other resources to prepare for deep transformations. The process involves introducing brand new governance systems and business models, which interact with themselves and society in extraordinary ways.We currently have a sufficient number of successful and failed projects to draw on and compile a list of strategic objectives, which provide the foundation for successfully implementing ‘smart cities’ [UN, 2015, 2016; Robinson, 2015]: • a team capable of integrating management solutions at different levels and of fruitfully cooperating
with the business and non-profit sector;• an ability to maintain the focus on system interactions, their condition, and mechanisms of
development, as well as to predict how changes in one system influence other systems;
Elements of a ‘Smart city’
policy Advantages Limitations
Construction ‘from scratch’
‘Smart city’ implementation possible from the start, clarity of aim
Complex design and infrastructure creation using cutting edge technologies and best city planning experiences
Possibility of analysing innovation business models and funding alternatives
Location choice based on strategic considerationsStandard approaches can be replicated as a result of
rapid deployment and economy of scale
Inevitable risk of slow progress in solving problems, starting from budgetary issues and lack of funding, and ending in inability to attract citizens and capital. Songdo in South Korea and Cyberjaya have faced some of these problems
Projects require great investments and tailored governance models
Performance-based approach could result in a limited view of social value, namely social cohesion and standards of living, threatening the sustainable development of new cities
Modification of an existing city
Urgency and relevance of cooperation between the public and private sectors. Engagement of local residents in developing ‘smart cities’ that are socially sustainable and inhabitable
Possibility of using crowdsourcing to speed up the innovation process
Stakeholders are initially identified, which allows for implementing innovative methods of cooperation and increases the reliability of funding
Greater economic returns from projects and demand for a ‘smart city’
Tremendous efforts needed to organize and discipline complex and established systems of people, organizations, and other relevant actors
Out-of-date infrastructure of an old city hampers the implementation of a ‘smart city’ model
Existing cities face many problems which compete for a share of the city’s resources. Thus, it is impossible to cover all aspects of a ‘smart city’ – the strategic objective is to correctly identify priorities.
Source: compiled by the authors based on: [Alawadhi et al., 2012; Bakici et al., 2013; Belissent, 2011; Bria, 2014; Brooker, 2012; Nordin, 2012; Garner, Dornan, 2011; Weyrich, Lind, 2001; Paskaleva, 2009; Pentikousis et al., 2011; Townsend et al., 2010; Robinson, 2016; Komninos et al., 2013; Baccarne et al., 2014; Washburn, Sindhu, 2010].
Таble 1. The advantages and limitations of the ‘smart city’ model in the context of new and existing cities

2016 Vol. 10 No 3 FORESIGHT AND STI GOVERNANCE 67
• interdisciplinary interactions, assessing the effects of transformation from different viewpoints, identifying hidden opportunities, taking into account the interests of different stakeholders, and designing agreed-upon strategies for development;
• the ability to work with resistance to change;• development of an integral, holistic decision-making approach;• bringing together information management, information security provision, and dissemination of
organizational innovations.Addressing the aforementioned elements means that avoidable failures can be evaded and costs can be reduced when implementing a ‘smart’ policy. This is especially vital for developing countries that lack sufficient resources for risky experiments with urban-based innovations. Here we see a bottleneck because these countries generally have their own understanding of the concept of ‘smart city’ and its particular components, such as ‘smart governance’, ‘smart infrastructure’, and ‘smart energy’. This leads to a serious breakdown, which hampers the development of an effective policy. In this regard, Russia is no exception. To analyse the extent to which such principles can be adapted in Russia and taken up at a regional level, a project of the HSE’s Research Institute for Regional and Urban Planning undertook an expert survey with the participation of one of the authors of this article in 2015.
International experiences in implementing ‘smart cities’ By looking at international experiences of smart cities, we can identify the two most accepted urban planning approaches towards ‘smart cities’– as technological and complex. Both have their own particularities, meaning, guidelines, advantages, and disadvantages. At first, the model was just a narrow technology-based approach, with ICT playing a fundamental role in all aspects of the urban economy. High-tech companies (IBM, Cisco, Google, and others) that have promoted sophisticated technologies to markets have contributed considerably to the development of this approach [Harrison et al., 2010; Paroutis et al., 2014]. However, the focus on the technological component makes it difficult to evaluate the complexity of urbanization and obtain a full understanding about the cities in which people want to live. In this approach, the goals are often confused: in practice the process of creating ‘smart cities’ is often limited to the modernization of infrastructure. Thus it remains unclear who the target group of this engineering infrastructure is, and whether inputs correspond to performance resulting from the functioning smart city.With the consequences of the technology-based approach becoming clear, its limitations also appeared for European and North American experts and policy makers. First, the focus on engineering does not take into account the diversity and complexity of urban systems. Second, the technological approach works when a city is created from scratch, using a ‘top down’ approach, which is primarily characteristic of Asian regions. The advantage of such cases is that a city appears comprehensive from the start. Ambitious projects implemented in a new area (Masdar, Abu-Dabi and others) are naturally ‘smarter’, have no inherited problems, and demonstrate to the utmost degree the essence of a ‘next generation city’ where technological solutions are coordinated, integrated, and complementary [Siegele, 2012].However, this model is not optimal for most European and North American countries, where cities have substantial historical and cultural backgrounds and different social contexts. In these countries, initiatives based on a complex approach are used: they are implemented using a ‘bottom-up’ approach in several stages, and they take into account the interests of a plurality of actors. In this case, the emphasis lies in creating human capital and aligning interdisciplinary cooperation focused on qualitative changes of the urban environment and society itself. A complex approach integrates technological and social innovations, and views a city as a ‘system of systems’ where the interaction of separate sub-systems is aimed at balanced development [Dirks et al., 2009; Kanter, Litow, 2009]. However, this approach also contains some pitfalls. Eager to create an ideal image of the city, as indicated by experts, there is a danger of a vast range of issues proliferating and blurring the image (what citizens should be like, socio-cultural environment, relationships between residents, etc.) [Vanolo, 2014]. A complex urban policy is effective if it develops out of discussions with a wide range of actors and contains well-articulated priorities. Only when all possible aspects are considered systematically can a ‘smart city’ hope to rise to a new level. Previous initiatives were not coordinated. Recently, the United Nations (UN) and the International Telecommunication Union (ITU) have tried to systematize the process on a global scale. We note the array of international studies, methodological manuals, standards, and effectiveness indicators, which are being developed to assess the progress of cities in implementing ‘smart’ policies. The indicators correspond to the objectives of sustainable development as stated by the UN in 2015 [UN, 2015]. Cities such as Dubai, Montevideo, Buenos Aires, Singapore, and others already use these indicators in their strategic governance. Besides, the so-called Rome Declaration1 has been drawn up and states the priorities that should be the basis of all policies to transition to a ‘smart’ model [UNECE, ITU, 2016]:
Boykova М., Ilina I., Salazkin М., pp. 65–75
1 Ratified at the Forum session ‘Shaping Smarter and More Sustainable Cities: Striving for Sustainable Development Goals’, which took place on May 19, 2016 in Rome (Italy) and was organized by the United Nations Economic Commission for Europe, UNECE and the International Telecommunication Union.

Spatial Development and Innovation: Russian Practice
68 FORESIGHT AND STI GOVERNANCE Vol. 10 No 3 2016
• to be guided by the above-mentioned effectiveness indicators when designing national and local legislation, standards and development plans, and when assessing cities’ performance in seeking
‘smart’ and ‘sustainable’ status;• to encourage adherence to international standards regarding the ‘Internet of Things’, which ‘smart
technologies’ are mainly based on;• to mobilize the use of expert resources and knowledge exchange to develop international, national,
and regional cooperation;• to develop ‘smart’ governance to provide a constructive dialogue between authorities and residents,
combining both ‘top-down’ and ‘bottom-up’ initiatives;• to balance the ‘smart city’ status criteria and progress indicators offered by different stakeholders and
design a global index of ‘smart cities’;• to develop a global platform for stakeholder dialogue and exchange of experiences;• to encourage ‘smart cities’ pilot projects and flagship initiatives.
The basic principles as set out by the UN Commission on Science and Technology for Development regarding ‘smart’ infrastructure design projects also deserve attention [UN, 2016]:• Focus of ‘smart’ infrastructure on the local population’s demands and inclusiveness: Development
should be based on a people-centric approach rather than on a ‘technological’ one. The order of priorities and accountability should be adhered to: living standards -> state of the urban environment
-> technological solutions. Local residents’ lifestyles, culture, behaviour, and needs should be taken into consideration, and can vary widely across countries and geographical regions; hence, the need for local adaptations of ‘smart’ solutions;
• Interoperability and flexibility: All infrastructure elements should be interchangeable, regulated according to certain standards, and able to be modified and improved;
• Risk management and safety: Infrastructure design should be based on a state-of-the-art risk management system, risk minimization policies, and adaptation to dynamic development under conditions of external shocks.
Policy challenges and resourcesGeneralizing from various cases of ‘smart cities’ permits us to draw up several success formulas and the reasons for failed initiatives. Policy makers face the problem of learning from and adapting existing experiences and innovative initiatives (technological, managerial, organizational and social) to find solutions to urban problems and to ensure dynamic development [Robinson, 2015]. We now outline the conditions that should be factored in when planning ‘smart’ policies.
Education and exchange of experiencesIt is commonly believed that a ‘smart’ model is a risky initiative because of a lack of evidence in its favour. However, there are more than enough qualitative cases testifying to its effectiveness and substantial contributions towards new standards of development.Progress towards ‘smart’ development has all the features of an innovative project. That is why a city in every single case is regarded as an experimental platform. The problem is that local governments have no experience in financing and implementing innovative business models that are able to convert existing finance schemes to successful results. Skilled work with large datasets and correct interpretation make it possible to reduce the number of mistakes and design a policy that is adapted as far as possible to existing and potential resources. ‘Smart city’ governance has no need for universal and all-encompassing management. Of course, a set of basic recommendations and principles exists but detailed instructions depend on the specificities of concrete areas and the available resources.A widespread barrier for implementing ‘smart’ solutions is the concern about the lack of practical pilots. A special initiative aiming to overcome this problem with regard to testing ‘intellectual’ urban technologies is being implemented in the United States. The US-based Pegasus Holdings, a private company, is constructing a model, uninhabited city called City Labs in the desert of New Mexico, equipped with all the necessary infrastructure. It was conceived as a testing area for scientific experiments and for developing innovative solutions. City Labs is considered an ideal platform for testing the latest technologies intended for use in megalopolises in a convenient and safe environment. In particular, Pegasus Holdings intends to test intellectual road traffic monitoring systems, ‘smart’ electrical grids, energy-efficient technologies, and new generation wireless communications. For example, special computer programs facilitating the management of residential energy and water consumption will simulate virtual citizens’ behaviour. The compatibility of disruptive technologies and existing municipal and other infrastructure will be tested in the same way [Monks, 2015].
Cooperation and governance‘Smart’ city development is not fostered exclusively by top-down or bottom-up initiatives. The two drivers are engaged in the process simultaneously. Thus an ‘integrator-coordinator’ who can combine the

2016 Vol. 10 No 3 FORESIGHT AND STI GOVERNANCE 69
available resources at the right time, place and in the required combination is needed. The availability of such a capability has great weight when making investment decisions. Goods and technology producers, service providers, and funding organizations are generally interested in the initiatives of cities where the local administrations have succeeded in creating the most advantageous conditions for such projects.The ‘Smart city’ model provides for the systematic flow of innovations that become possible due to the available technologies. At the same time, however, the interactions between the processes that consume resources and those that create economic and social value change. Within this conceptual framework, a vision that is shared by the city’s stakeholders is formed, and its implementation is encouraged by active cooperation between them.Federal governments have a substantial role in disseminating the ‘smart’ city model dissemination, in particular the model of intellectual services. Federal governments should cooperate with city administrations, businesses, and scientists to assess the potential advantages of introducing ‘smart’ solutions. Departments responsible for various municipal services should share this vision and have a roadmap for implementing it. Thus, the relevant actors will be able to get a clear idea about the current situation in the ‘smart cities’ market and the expected results, and fragmentation can be avoided. In Great Britain, for example, the Future City Catapult initiative is being implemented to coordinate stakeholders’ actions and design a coordinated development strategy [BIS, 2013].
Interdisciplinary collaboration The complex nature of ‘smart’ initiatives implies interdisciplinary collaboration involving experts in architecture, economics, social sciences, psychology, systems analysis, process engineering, and others. There is a large-scale challenge here connected with the need to overcome experts’ narrow disciplinary mentality and to develop their readiness to take into account an ‘external’ viewpoint [Robinson, 2015]. Introducing ‘smart’ solutions requires a cross-sectoral managerial approach. Spheres of municipal services such as energy grids, water supply, recycling, transport, and healthcare are dealt with and managed separately, hence limiting the potential opportunities for stakeholders. A cross-sectoral approach makes it possible to overcome this tendency [BIS, 2013]. However, the need for an interdisciplinary transition is a complex challenge. It requires specialists who are capable of moving beyond the bounds of narrow professional thinking, have at least some basic awareness of related disciplines, and possess multi-level process design skills.
Overcoming cognitive trapsGoverning cities as complex systems involves dealing with two types of difficulties: technological [Singh, 1997] and cognitive [Burleson, Caplan, 1998]. Cognitive difficulties are created by the huge number of diverse and intangible social and other drivers, which have indirect and dynamic linkages. In this instance, there is a temptation to choose a narrow approach focused on infrastructural high-tech solutions, which does not in most cases satisfy the local population’s demands and does not improve living standards.In contrast, cognitive ‘plasticity’ or compliance takes into consideration the social aspects and human capital and hence, allows for a more comprehensive and integrated approach. Being able to manage cognitive complexity is an increasingly urgent task. One of the most effective tools to do this is visualization, which clearly shows the non-linear interactions of different systems without any loss of essential information [Tufte, 2001; Keller et al., 2006; and others]. For example, quality function deployment, QFD2 [Hunt, Xavier, 2003; and others] is based on visualization and provides for an adequate ‘transition’ of stakeholders’ demands into development strategies. QFD and similar tools are based on scientific methods of data collection and processing, enable productive interactions between experts, mobilize intellectual capital, and make effective knowledge management possible [Khromov-Borisov, 2011]. These tools help to ‘decipher’ the true demands of any urban stakeholders and to design methods for satisfying these demands as best as possible.
The market of solutions for ‘smart cities’The UK’s Department for Business, Innovation and Skills (BIS) conducted a study of the intellectual technologies market for five key sectors of municipal services: water supply, recycling, energy grids, transport, and healthcare services [BIS, 2013]. This market has tremendous potential. Solutions implemented on this market can become a catalyst for the further development of existing designing and engineering services and the creation of new services. According to a forecast by BIS, the size of the aforementioned market will be USD 408 billion by 2020. In particular, by 2018 the market turnover will be USD 4.5 billion for digital infrastructure-based ‘smart’ transport services. These designs, in turn, will be the basis for other solutions meant for a larger market valued at about USD 100 billion in, for example, parking management, urban navigation, and road traffic. The development of services such
2 The method of QFD was proposed in Japan in the early 1960s. The conventional abbreviation QFD is usually used in the literature, although the term ‘consumer quality management’ is a more accurate definition reflecting the meaning of this method.
Boykova М., Ilina I., Salazkin М., pp. 65–75

Spatial Development and Innovation: Russian Practice
70 FORESIGHT AND STI GOVERNANCE Vol. 10 No 3 2016
as highway design and big data processing is also planned. The introduction of ‘smart’ solutions makes for better optimization of resources, more effective municipal sector management, longer service life of infrastructure, and lower costs.The confusion between the notions smart city solutions and future city solutions is a barrier for market development. The latter mean innovation projects focused mainly on the low carbon economy. In turn, ‘smart city’ designs mean digital technologies applied to address social, ecological, and economic issues. They can be based solely on digital infrastructure or in combination with material infrastructure; however, in the latter case, actors have no clear understanding of the sources of investment payback. Implementing ‘smart’ solutions and profit maximization demand a large-scale reorganization of existing operational and managerial processes. They are impossible without effective collaboration between companies in the value chain. Otherwise, it is very difficult for the companies to introduce disruptive technologies because they lack a comprehensive vision of the positive consequences of intellectual design. ‘Smart’ technologies help to optimize resource consumption, improve service quality due to skillful management of supply and demand, and save substantial amount of funds. For example, using ‘smart’ technologies in the water sector can save between USD 7.1 and 12.5 billion annually according to different assessments [BIS, 2013].Today, only through combined efforts can urban stakeholders develop a ‘smart’ solutions market to satisfy all their needs. As digital technologies are rapidly getting cheaper, the dynamics of the market will help these technologies to penetrate more, which in turn will make all areas of municipal services more effective. Energy, mobility, management and other intellectual systems are already being implemented in ‘smart cities’ by creating official support channels and mechanisms.The research and consulting organization Frost & Sullivan has estimated the overall market potential of ‘smart cities’ at USD 1.5 trillion by 2020 [Frost & Sullivan, 2014]. They include energy grids, transport, healthcare, construction, infrastructure, and governance. Nevertheless, raising funds and designing relevant business models remain on the agenda because many cities around the world lack sufficient resources. Four business models exist to help companies effectively cooperate with municipal authorities and services [Singh, 2014]:• ‘Build – Own – Operate’;• ‘Build – Operate – Transfer’;• ‘Build – Operate – Manage’;• Open Business Model.
The Open Business Model stimulates innovation the most, which is explained by the high level of flexibility and scalability the model gives. It is expected that actors will perform one or more of the following functions in the given market:• system integration (‘door-to-door’ service);• network operation (communication providers);• supply of equipment and software products;• service supply management.
In particular, ‘smart cities’ have become a strong driver of demand for energy grids, which involve diverse sources and are equipped with energy accumulation systems, and of demand for the corresponding intellectual devices. It is expected that the size of this market will exceed USD 1 trillion by 2019 [Frost & Sullivan, 2014], a 22% increase compared to today’s figures [Markets and Markets, 2016]. However, the requirements for the accumulative capabilities and the ecological standards of energy systems are becoming stricter. ‘Smart’ solutions are offered for high-tech industries, buildings, transport, and management of utilities and safety, providing maximum amounts of information and easier data access.The ‘smart cities’ market stimulates the search for innovative solutions that can solve the challenges of urbanization, provide feedback from users, and improve the dialogue between citizens and service suppliers. A diversity of infrastructure, digital technologies, social capital (including local competences) need to be activated when developing the ‘smart cities’ market. Substantial growth of this market is expected in the most developed countries in the world. Forecasts indicate that the market will be shaped by the latest wireless networks and computerization technologies such as Z-Wave, Insteon, and others [BIS, 2013].
Prospects for the transition to a ‘smart’ model in Russian citiesIn recent years, Russia has seen growing interest in the idea of ‘smart cities’. Pilot projects are currently being implemented in Ekaterinburg, Samara, Armavir, and other cities. The city of Moscow operates a web portal for state and municipal services, a unified medical data analytical system, and other similar initiatives. Nevertheless, we still do not observe a comprehensive understanding of the concept of ‘smart city’. Some organizations have attempted to offer their own vision of the term, which appears to be based on a narrow technological approach and the specific character of their activities. Essentially, they focus on the ‘energy’ elements of ‘smart’ infrastructure, which provide for the construction of safe, effective, and sustainable systems of energy production, supply, and consumption [Tsymbal, Koptelov, 2010].

2016 Vol. 10 No 3 FORESIGHT AND STI GOVERNANCE 71
The results of a study conducted in 2015 by the HSE’s Research Institute for Regional and Urban Planning illustrate the perceptions of the ‘smart city’ concept among municipal authorities, as well as the barriers to the wider dissemination of the concept in Russia.
Survey methodology and sampling description When drawing up the sample, the survey aimed to use a comprehensive approach when analysing the problems faced by Russian cities of different types, and to select suitable development models. The main sampling criteria of cities in which to carry out the survey were as follows:• size – megalopolises, large cities, medium-sized towns and small towns (Table 2);• contribution to federal and regional budget – donor or recipient cities;• policy approach – conservative or liberal;• location – variety of regions of Russia;• diversity of sector specialization, including science cities and monocities.
46 respondents from 23 cities and towns took part in the survey, representing the following social groups:• authorities (mayors, ministers, and heads of municipal administrations);• business (managers of backbone enterprises and investors);• science (urbanists, city planners);• expert community; • public.
Theorists, practical workers, and specialists in municipal management were represented in the sampling. Practical workers formed the majority of the sample: 60% of respondents had a direct relationship to the administration of urban territories. More than 90% had worked in this sphere for more than ten years, while only 3% had been working in that area for less than one year. Respondents’ average age was 45 years. All participants of the survey had completed higher education, with more than 30% possessing a PhD degree (either candidate or full doctor as per the Russian system of doctorates).Initially, we conducted a questionnaire survey. We then followed up the questionnaire with semi-structured interviews. The questions in the questionnaire and the formalized part of the interview were identical. There questionnaire contained 14 questions about the most important urban problems and their causes, including:• evaluation of the state of the principal elements of urban infrastructure;• choice of main areas and priorities of urban development, the influence of external factors and
changing socioeconomic conditions;• effectiveness of state and municipal administration and its influence on the scope for urban
development;• role of strategic planning and the introduction of new urbanization models (with an emphasis on
the idea of ‘smart city’);• engagement of the local population in decision making.
The survey paid special attention to the state of infrastructure because it determines the quality of the urban environment and influences competitiveness, it is also focused on the prospects of using innovative technologies.
Evaluation of current urban development problemsThe initial questionnaire survey revealed that local authorities were interested in the development of public infrastructure and in creating the necessary conditions. Respondents cited the following as the critical obstacles for urban development:• problems with the tax system;• frequent changes in the legislation;• lack of qualified and motivated personnel and competent managers;• difficulties in getting financial credit;• weak support from regional and federal authorities.
Category Population (thousands of people) Number of cities in the sample Share in the sample (%)Largest Over 1000 3 13.1Large 500–1000 1 4.3Big 100–500 14 60.9Medium 50–100 1 4.3Small Less than 50 4 17.4
Source: compiled by the authors.
Таble 2. Distribution of cities by category in the sample
Boykova М., Ilina I., Salazkin М., pp. 65–75

Spatial Development and Innovation: Russian Practice
72 FORESIGHT AND STI GOVERNANCE Vol. 10 No 3 2016
The survey results allow us to conclude that in recent years, municipal authorities have become considerably less motivated to modernize the territories for which they are responsible. The reasons for this are primarily caused by the existing system of inter-budgetary relations and the tax system. Respondents perceived the support mechanisms from regional and federal authorities as ineffective.Based on the questionnaire survey results, we were able to test some suggested trends in urban development and formulate the following additional hypotheses:• in decision making, short-term interests predominate;• there is no comprehensive idea about the effects of transitioning to new development models;• there are unclear barriers for introducing innovations.
By analysing the questionnaires, we were able to expand the list of questions for the follow-up in-depth interviews. Additional questions asked respondents to objectively assess urban problems and took account of each respondent’s area of expertise. They concerned the design of strategic plans and new city development models, their understanding of the principles of ‘smart’ development, their attitudes towards the idea of ‘smart city’, and the possibilities of introducing intellectual technologies. In many cases, the focus was on the challenges for a specific city or sector. The questions and answers were divided into four blocks:• city development problems;• specificities of developing public infrastructure;• effectiveness of state institutions of urban development management;• opportunities for implementing a ‘smart’ model in Russian cities and towns.
The answers varied depending on the size of the city that the respondents represented. It was striking that the expert assessments given during the interviews differed to those presented in the questionnaires.During the interviews, the reasons for the urban development problems and their possible solutions were discussed (Figure 1). The most important negative factor cited by the respondents was the lack of principles and tools for managing public funds to link spending of budget funds with concrete, measurable, and socially significant results. Introducing medium-term budget planning, result-oriented budgeting, and risk management were included in the list of the main areas for reform. Respondents noted the absence of opportunities for non-standard decision making, which is conditioned by the current legislation on municipal assets management (real estate, land, loans, property laws, etc.)Figure 1 shows the prevalence of two factors hampering the transition to a ‘smart city’ model: a lack of business support and the deterioration of physical and non-economic assets.Respondents also noted weak civic engagement; a low interest among educated and active people in settling down in a town. Respondents from small and medium-sized towns are more concerned about retaining human capital in the existing conditions. For the larger towns, the more pressing issue is how to provide a good quality of life to different social groups with varying income levels.A significant problem for business is the weak support from federal and regional authorities. A big driver for ‘smart’ model urban development could be radically upgrading infrastructure. However, municipal representatives said that they are focused only on repairing existing communications and see the opportunilities for modernization in the contemporary high-tech sphere.In terms of future planning, the views of all respondents on the key issues of urban socioeconomic development strategy largely coincided. There was a general understanding about the need for balanced
* The sum exceeds 100% as respondents could choose several answers. Source: compiled by authors based on the survey results.
Figure 1. Evaluations of the importance of different factors as sources of urban development problems (share of respondents who selected each answer out of the total number of respondents, %)*
Construction of affordable accommodation and development of the rental housing sector
Deterioration of physical and non-economic assets – machinery, municipal equipment, urban infrastructure facilities, and produc-tion assets of backbone enterprises
Inadequate transport infrastructure
Adverse demographic situation
High social costs in the municipal budget connected with support-ing a necessary level of social infrastructure
High rates for municipal services and their regulation
Support for entrepreneurship and business development infra-structure at the municipal level0 20 40 60 80 100

2016 Vol. 10 No 3 FORESIGHT AND STI GOVERNANCE 73
development. However, the overwhelming majority of respondents (90%) felt that the real contribution to modernization of the strategies under development was extremely low. In all cases, the reasons were related to methodological problems, a formal approach to strategic planning, the absence of implementation mechanisms, and a lack of financial support.Table 3 shows the distribution of answers to the question about the type of urban infrastructure that most influences the outflow of resources and influences how much investment a town can attract. The indisputable leader in both dimensions is housing utilities, although transport and social infrastructure are also rated highly.The majority of respondents responded positively about the rationale for active civic engagement in decision making on improving the urban environment. In turn, assessments of the effectiveness of policy mechanisms for problem solving were more diverse. Respondents perceived state and business financial support as playing a critical role. Organizational and some other aspects were seen as making only moderate contributions, while social mechanisms, external factors, and market conditions were felt to have the least significant influence.
Respondents’ ideas about the ‘smart’ modelFor the present article, we paid particular attention to the answers of the survey questions about the prospects of introducing innovative development models in Russian towns. According to the survey, all respondents are aware of the idea of a ‘smart model’ and its advantages. Respondents were offered to choose one of three definitions, which best corresponds to their idea of the meaning of this model (Table 4). More than two thirds of the survey participants are well aware of the ‘smart city’ model; approximately 50% of them have a certain position on it. Roughly 72% of respondents have received various suggestions for how to introduce intellectual technologies in the territories for which they are responsible.The majority expressed a positive attitude toward the discussed concept. Only 10% were critical, even going as far as to totally reject it. Nevertheless, only one respondent stated that he was fully ready now to look at implementing it in his town. Nearly 80% felt that the ‘smart city’ model could be introduced in the long-term (ten or more years). According to 50% of respondents, it is possible to implement the concept in Russia now but only in the largest cities, which have significant resources. Moscow (90%) and Kazan (10%) were most often mentioned as examples of such cities. Other opinions stated that the concept would be effective if implemented when constructing new towns from ‘scratch’ (91% of respondents) or when transforming science cities and Arctic towns (41 and 39% respectively).
Type of infrastructure Place in problem urgency rating
Influence on city’s attractiveness for business and
populationHousing utilities 1 HighTransport 2 ModerateGovernance, communications, and information systems as well as other municipal service organizations
3 Moderate
Social infrastructure (education, healthcare, culture, sport, social services) 4 HighConsumer market (trade, public catering, public services for population) 5 ModeratePublic security on the territory of municipality – LowSource: compiled by authors based on the survey results.
Таble 3. Respondents’ assessments of how serious a problem different types of municipal public infrastructure are, and their inf luence on the attractiveness of urban territories (towns)
for business and population
‘Smart city’ concept meaning – different definitions Share of respondents who selected each answer (%)
Information and ICT use as part of the functioning of individual systems of municipal facilities
17.4
Integrated innovative urban governance of social life with the use of ICT 60.9 Strategic management aimed at creating the conditions for developing human potential and providing sustainable development based on ICT and other innovative technologies
21.7
Source: compiled by authors based on the survey results.
Таble 4. Respondents’ interpretations about the notion of ‘smart city’
Boykova М., Ilina I., Salazkin М., pp. 65–75
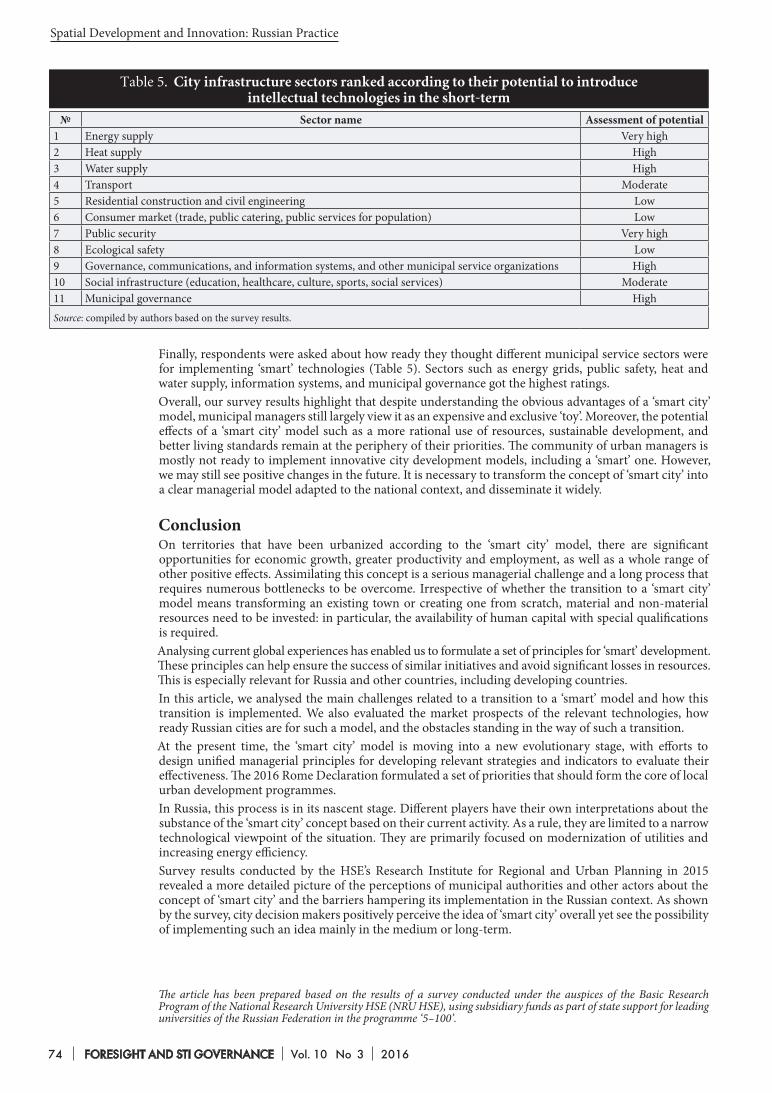
Spatial Development and Innovation: Russian Practice
74 FORESIGHT AND STI GOVERNANCE Vol. 10 No 3 2016
№ Sector name Assessment of potential1 Energy supply Very high2 Heat supply High3 Water supply High4 Transport Moderate5 Residential construction and civil engineering Low6 Consumer market (trade, public catering, public services for population) Low7 Public security Very high8 Ecological safety Low9 Governance, communications, and information systems, and other municipal service organizations High10 Social infrastructure (education, healthcare, culture, sports, social services) Moderate11 Municipal governance HighSource: compiled by authors based on the survey results.
Таble 5. City infrastructure sectors ranked according to their potential to introduce intellectual technologies in the short-term
Finally, respondents were asked about how ready they thought different municipal service sectors were for implementing ‘smart’ technologies (Table 5). Sectors such as energy grids, public safety, heat and water supply, information systems, and municipal governance got the highest ratings.Overall, our survey results highlight that despite understanding the obvious advantages of a ‘smart city’ model, municipal managers still largely view it as an expensive and exclusive ‘toy’. Moreover, the potential effects of a ‘smart city’ model such as a more rational use of resources, sustainable development, and better living standards remain at the periphery of their priorities. The community of urban managers is mostly not ready to implement innovative city development models, including a ‘smart’ one. However, we may still see positive changes in the future. It is necessary to transform the concept of ‘smart city’ into a clear managerial model adapted to the national context, and disseminate it widely.
ConclusionOn territories that have been urbanized according to the ‘smart city’ model, there are significant opportunities for economic growth, greater productivity and employment, as well as a whole range of other positive effects. Assimilating this concept is a serious managerial challenge and a long process that requires numerous bottlenecks to be overcome. Irrespective of whether the transition to a ‘smart city’ model means transforming an existing town or creating one from scratch, material and non-material resources need to be invested: in particular, the availability of human capital with special qualifications is required.Analysing current global experiences has enabled us to formulate a set of principles for ‘smart’ development. These principles can help ensure the success of similar initiatives and avoid significant losses in resources. This is especially relevant for Russia and other countries, including developing countries.In this article, we analysed the main challenges related to a transition to a ‘smart’ model and how this transition is implemented. We also evaluated the market prospects of the relevant technologies, how ready Russian cities are for such a model, and the obstacles standing in the way of such a transition.At the present time, the ‘smart city’ model is moving into a new evolutionary stage, with efforts to design unified managerial principles for developing relevant strategies and indicators to evaluate their effectiveness. The 2016 Rome Declaration formulated a set of priorities that should form the core of local urban development programmes.In Russia, this process is in its nascent stage. Different players have their own interpretations about the substance of the ‘smart city’ concept based on their current activity. As a rule, they are limited to a narrow technological viewpoint of the situation. They are primarily focused on modernization of utilities and increasing energy efficiency. Survey results conducted by the HSE’s Research Institute for Regional and Urban Planning in 2015 revealed a more detailed picture of the perceptions of municipal authorities and other actors about the concept of ‘smart city’ and the barriers hampering its implementation in the Russian context. As shown by the survey, city decision makers positively perceive the idea of ‘smart city’ overall yet see the possibility of implementing such an idea mainly in the medium or long-term.
The article has been prepared based on the results of a survey conducted under the auspices of the Basic Research Program of the National Research University HSE (NRU HSE), using subsidiary funds as part of state support for leading universities of the Russian Federation in the programme ‘5–100’.

2016 Vol. 10 No 3 FORESIGHT AND STI GOVERNANCE 75
Alawadhi S., Aldama-Nalda A., Chourabi H., Pardo T.A., Gil-Garcia R.J., Mellouli S., Scholl H.J., Nam T., Walker S. (2012) Smart cities and service integration initiatives in North American cities: A status report. Proceedings of the 13th Annual International Conference on Digital Government Research, New York: Association for Computing Machinery, pp. 289–290.
Baccarne B., Schuurman D., Mechant P., De Marez L. (2014) The Role of Urban Living Labs in a Smart City. Paper presented at the XXV ISPIM Conference – Innovation for Sustainable Economy & Society, 8–11 June 2014, Dublin, Ireland.
Bakici T., Almirall E., Wareham J. (2013) A Smart City Initiative: The Case of Barcelona Tuba. Journal of the Knowledge Economy, vol. 4, no 2, pp. 135–148.
Belissent J. (2011) Smart City Leaders Need Better Governance Tools: Smart City Governance Brings New Opportunities for Tech Providers, Cambridge, MA: Forrester Research.
Bettencourt L. (2012) Origins of Scaling in Cities (SFI Working Paper), Santa-Fe: Santa-Fe Institute.BIS (2013) The Smart City Market: Opportunities for the UK (BIS Research Paper no 13), London: Department for Business, Innovation
and Skills.Bria F. (2014) Digital Social Innovation Interim Report, London: NESTA.Brooker D. (2012) ‘Build it and they will come’? A critical examination of utopian planning practices and their socio-spatial impacts in
Malaysia’s intelligent city. Asian Geographer, vol. 29, no 1, pp. 39–56.Burleson B.R., Caplan S.E. (1998) Cognitive complexity. Communication and personality: Trait perspectives (eds. J.C. McCroskey, J.A. Daly,
M.M. Martin, M.J. Beatty), Creskill, NJ: Hampton Press, pp. 233–286Dirks S., Keeling M., Dencik J. (2009) How Smart is Your City?: Helping Cities Measure Progress, Somers, NY: IBM Global Business Services. Frost&Sullivan (2014) Strategic Opportunity Analysis of the Global Smart City Market. Smart City Market is Likely to be Worth a Cumulative
$1.565 Trillion by 2020, Frost&Sullivan.Garner C., Dornan A. (2011) How can knowledge cities become smart? Proceedings of the 4th Knowledge Cities World Summit,
26–27 October 2011, Bento Goncalves, Brazil (eds. T. Yigitcanlar, A.C. Fachinelli), The World Capital Institute, Ibero-American Community for Knowledge Systems, pp. 128–136.
Harrison C., Eckman B., Hamilton R., HartswickP., Kalagnanam J., Paraszczak J., Williams P. (2010) Foundations for Smarter Cities. IBM Journal of Research and Development, vol. 54, no 4, pp. 350–365.
Hunt R., Xavier F. (2003) The leading edge in strategic QFD. International Journal of Quality & Reliability Management, vol. 20, no 1, pp. 56 –73.
Kanter R.M., Litow S.S. (2009) Informed and interconnected: A manifesto for smarter cities (GMU Working Paper no 09-141), Boston: Harvard Business School.
Keller R., Eckert C.M., Clarkson P.J. (2006) Matrices or node-link diagrams: Which visual representation is better for visualising connectivity models? Information Visualization, no 5, pp. 62–76.
Khromov-Borisov S. (2011) Upravlenie slozhnost’yu [Managing Complexity]. Strategicheskii menedzhment [Strategic Management], no 4, pp. 318–326 (in Russian).
Komninos N., Pallot M., Schaffers H. (2013) Open innovation towards smarter cities. Open innovation 2013, Luxembourg: European Commission, Directorate-General for Communications Networks Content and Technology, pp. 34–41.
Markets & Markets (2016) Smart Cities Market by Solution and Services for Focus Areas (Transportation – Rail & Road, Utilities – Energy, Water, & Gas, Buildings – Commercial & Residential, and Smart Citizen Services – Education, Healthcare, & Security) – Global Forecast to 2020, Magarpatta: Markets & Markets.
Monks K. (2015) CITE: The $1 billion city that nobody calls home. Available at: http://edition.cnn.com/2015/10/06/business/test-city/index.html, accessed 14.02.2016.
Nordin R. (2012) Creating knowledge-based clusters through urban development: A study of Cyberjaya, MSC Malaysia (Doctoral thesis), Bonn: Rheinischen FriedrichWilhelms-Universität.
Paroutis S., Bennett M., Heracleous L. (2014) A strategic view on smart city technology: The case of IBM Smarter Cities during a recession. Technological Forecasting and Social Change, vol. 89, pp. 262–272.
Paskaleva K.A. (2009) Enabling the smart city: The progress of city e-governance in Europe. International Journal of Innovation and Regional Development, vol. 1, no 4, pp. 405–422.
Pentikousis K., Zhu D., Wang H. (2011) Network infrastructure at the crossroads the emergence of smart cities. Proceedings of the 15th International Conference “Intelligence in Next Generation Networks (ICIN)”, Berlin: IEEE, pp. 109–114.
Portugali J. (2011) Complexity, Cognition and the City (Understanding Complex Systems), Berlin: Springer-Verlag.Robinson R. (2015) Six Inconvenient Truths about Smart Cities. Available at: https://theurbantechnologist.com/2015/02/15/6-inconvenient-
truths-about-smart-cities/, accessed 15.05.2016.Robinson R. (2016) Why Smart Cities still aren’t working for us after 20 years. And how we can fix them. Available at: https://
theurbantechnologist.com/2016/02/01/why-smart-cities-still-arent-working-for-us-after-20-years-and-how-we-can-fix-them/, accessed 15.05.2016.
Siegele L. (2012) Mining the urban data. Economist, 21.11.2012. Available at: http://www.economist.com/news/21566408-cities-will-become-smarter-different-ways-many-people-expected-mining-urban-data, accessed 15.05.2016.
Singh K. (1997) The Impact of Technological Complexity and Interfirm Cooperation on Business Survival. The Academy of Management Journal, vol. 40, no 2, pp. 339–367.
Singh S. (2014) Smart Cities — A $1.5 Trillion Market Opportunity. Forbes, 19.06.2014. Available at: http://www.forbes.com/sites/sarwantsingh/2014/06/19/smart-cities-a-1-5-trillion-market-opportunity/#3b9495237ef9, accessed 15.05.2016.
Sirkin H.L., Keenan P., Jackson A. (2005) The Hard Side of Change. Harvard Business Review, October issue. Available at: https://hbr.org/2005/10/the-hard-side-of-change-management, accessed 15.05.2016.
Townsend A., Maguire R., Liebhold M., Crawford M. (2010) The future of cities, information, and inclusion: A planet of civic laboratories, Palo Alto, CA: Institute for the Future.
Tsymbal S., Koptelov A. (2010) Intellektual’nye tekhnologii v teploenergetike [Intellectual technologies in heating]. EnergoRynok [Energy Market], no 4, pp. 57–59 (in Russian).
Tufte E.R. (2001) The Visual Display of Quantitative Information, Cheshire: Graphics Press.UN (2015) The UNECE–ITU Smart Sustainable Cities Indicators, Vienna: United Nations. Available at: http://www.unece.org/fileadmin/
DAM/hlm/projects/SMART_CITIES/ECE_HBP_2015_4.pdf, дата обращения 17.05.2016.UN (2016) Issues Paper on Smart Cities and Infrastructure, Vienna: United Nations. Available at: http://unctad.org/meetings/en/
SessionalDocuments/CSTD_2015_Issuespaper_Theme1_SmartCitiesandInfra_en.pdf, accessed 17.05.2016.UNECE, ITU (2016) Rome Declaration (adopted by the participants of the Forum ‘Shaping Smarter and More Sustainable Cities: Striving
for Sustainable Development Goals’, 19.05.2016, Rome, Italy). Available at: https://www.itu.int/en/ITU-T/Workshops-and-Seminars/Documents/Forum-on-SSC-UNECE-ITU-18-19-May-2016/Rome-Declaration-19May2016.pdf, accessed 17.05.2016.
Vanolo A. (2014) Smart Mentality: The Smart City as Disciplinary Strategy. Urban Studies, vol. 51, no 5, pp. 883–898.Washburn D., Sindhu U. (2010) Helping CIOs Understand “Smart City” Initiatives, Cambridge, MA: Forrester Research.Weyrich P., Lind W. (2001) Twelve Anti-Transit Myths: A Conservative Critique, Washington, DC: Smart Growth America.
References
Boykova М., Ilina I., Salazkin М., pp. 65–75
Spatial Development and Innovation: Russian Practice
76 FORESIGHT AND STI GOVERNANCE Vol. 10 No 3 2016
Modeling the Development of Regional Economy and an Innovation Space Efficiency
Director, CEMI RAS*. E-mail: [email protected] Makarov
Abstract
Forming the regional space of innovation is accompanied by the simultaneous development of various structures. The contemporary model of
innovative development assumes interactions between government, industry, and universities. In this paper, the set of potential links between research organizations and the innovation activity of enterprises is characterized as the innovative space and is seen as a resource for innovation.
Obtaining quantitative characteristics of such links and interactions is one of the most difficult tasks in analysing innovation processes. Our hypothesis is that regional innovation depends on the size of the innovation space and on how effectively it is used. The econometric modeling results do not contradict our hypothesis.
Keywords: regional economy; innovation; econometric modeling; check of hypotheses; stochastic border; efficiency assessment
Our estimates of the size of the innovation space used by regions of Russia when creating new production technologies confirm the high potential value of this resource. Using a Computable General Equilibrium (CGE) model that we developed, we analysed the innovative elements of regional economies (based on the example of the Republic of Bashkortostan) and quantitatively assessed the effects of different scenarios that aim to improve the socioeconomic system. We included an indicator of the effective use of the innovation space for a given region as one of the agents of the CGE model production function.
Our results indicate the important role of regional authorities in promoting cooperation between the state, industry, and the research and education communities as well as in developing regional innovation systems.
DOI: 10.17323/1995-459X.2016.3.76.90
Citation: Makarov V., Ayvazyan S., Afanasyev M., Bakhtizin A., Nanavyan A. (2016) Modeling the Development of Regional Economy and an Innovation Space Efficiency. Foresight and STI Governance, vol. 10, no 3, pp. 76–90. DOI: 10.17323/1995-459X.2016.3.76.90
Deputy Director, CEMI RAS*. E-mail: [email protected]
Sergey Ayvazyan
Head of Laboratory, CEMI RAS*. E-mail: [email protected] Afanasyev
Head of Laboratory, CEMI RAS*. E-mail: [email protected] Bakhtizin
Senior Research Fellow, CEMI RAS*. E-mail: [email protected] Nanavyan
*Central Economic Mathematical Institute of the Russian Academy of SciencesAddress: 47 Nakhimovsky ave., 117418 Moscow, Russian Federation

2016 Vol. 10 No 3 FORESIGHT AND STI GOVERNANCE 77
Makarov V., Ayvazyan S., Afanasyev M., Bakhtizin A., Nanavyan A., pp. 76–90
Accomplishing the following objectives would contribute to the development of the knowledge economy in Russia:
• Upgrading research institutes, including those in the system of the Russian Academy of Sciences;• Upgrading the national education system;• Integrating all elements of the innovation system i.e. universities, research institutes, and high-
technology companies [OECD, 2014].One of the main criteria that is used globally to measure the productivity of innovation systems is research and development (R&D) results, measured as output of innovative products, the number of new technologies, patents, and academic publications. Generally accepted indicators of the productivity of innovation activity include R&D expenditures (absolute or relative to GDP, and their unit cost effectiveness). Statistics indicate that Russia significantly lags behind OECD member countries in innovation. Thus, in 2012 R&D expenditures in Russia amounted to 1.13% of GDP [Rosstat, 2015] compared to an average of 1.97% of GDP spent on R&D among EU member states, and 2.4% of GDP in OECD countries [Russian Government, 2014]. Russia’s public expenditures on education as a share of GDP and total government budget also remain below the OECD average at 3.9% and 10.9%, respectively, compared to the corresponding average figures of 5.6% and 12.9% for OECD countries [OECD, 2014].At the same time, the 2015 National Report on Innovation in Russia noted that ‘increased R&D expenditures do not result in the growth of inventions or ideas’, which is one of the ‘major problems… with the current research environment’ [MED, RVC, 2015]. The authors of the report conclude that increasing R&D expenditures would be inappropriate. Others, such as Alexander Varshavsky [Varshavsky, 2016], hold a contrary opinion, noting the low level of R&D funding in Russia: ‘in absolute terms, Russia came in 9th place globally for R&D expenditures in 2012 lagging behind not just the US, China, and Japan but also France, UK, and Taiwan.’ When these expenditures are measured as a share of GDP: ‘Russia came in 29th place out of 37 countries [and] 28th in terms of per capita R&D expenditures.’ Between 2000 and 2013, the number of R&D personnel dropped from 888,000 to 727,000. As a result: ‘Russia lies in 28th place out of 37 countries in terms of the number of researchers per 100,000 population.’ On the basis of these data, Varshavsky (2016) concludes that attributing the low productivity of innovation exclusively to problems within the research environment is incorrect. Reforming the higher education system and academies of sciences takes the form of closing down research organizations, steps which negatively affect the country’s intellectual capital nationally and regionally. Such a reform approach leaves no chance for increasing the country’s reserve of ‘intellectual resources’ or effectively using these resources. An analytical review of international university mergers [Romanenko et al., 2015] emphasizes the difficulties in accomplishing such mergers and in managing the newly merged organization without conflict.Surveys designed to measure Russian entrepreneurs’ perceptions of the productivity of public spending on R&D, intellectual property protection, and on the development of innovation infrastructure also deserve a mention. The majority of respondents believed that efforts to set up a national innovation system in Russia remain largely fragmented, unsystematic, and limited [RVC, 2013; Ekspert-RA, 2012]. Producers are poorly motivated to be innovative partly because of the low level of competition in the market; meanwhile, the important role played by government in the economy makes the use of ‘administrative resources’ a more attractive option than technological development. Thus, in 2013 only 10.1% of Russian companies introduced innovations [Rosstat, 2013а], which is 80%-83% lower than in Germany or the UK. The share of high-tech products in total Russian exports is 10%, compared to 18% in the US and 27% in China [World Bank, 2013]. ‘About one third of companies do not allocate any funds for innovation activities. A majority of the most active companies spent less than 5% of revenue on innovation activities in 2010, while only 7% of them spent more than 10% of their revenue on innovation.’ [Ivanov et al., 2012].An important aspect of developing an innovation-based economy is promoting regional innovation, and upgrading the regional innovation systems (RIS) as part of a national strategy. Linking innovative development with overcoming the resource-based development scenario both nationally and regionally has by now become a cliché. At the same time, regional development is seen as a ‘systemic process… implemented mainly through the application of scientific, technological, and managerial innovations’ [Kleiner, Mishurov, 2011]. The major components of a RIS are R&D organizations, universities, innovative companies, and the infrastructure providing all actors with access to the necessary resources.The latest model of regional innovation development (that of the Triple Helix) applied in the countries leading in innovation imply coordinated efforts by government, industry, and universities [Etzkowitz, 2008]. Such an approach is used in the US, UK, Germany, and France. Given Russia’s well-developed basic research capabilities, this model can also be fully applied in Russia to the whole innovative cycle, from generating innovative ideas to the mass production of end products. Nevertheless, ‘obviously the government, businesses, and the society have different ideas about universities’ contribution to innovation development, while various regions face different challenges and have different potential to promote knowledge- and innovations-based economic growth’ [Gibson, Butler, 2013]. Various researchers have noted that a crucial factor of successful innovation processes is the ability of regional actors to work together [Golichenko, Balycheva, 2012; Makarov, 2010; Efimova, 2012; Lapayev, 2012; Makoveyeva, 2012; Rumyantsev, 2013; Simachev, 2012; Shchepina, 2011]. Communication networks connect groups

Spatial Development and Innovation: Russian Practice
78 FORESIGHT AND STI GOVERNANCE Vol. 10 No 3 2016
(clusters) of companies, universities, and R&D centres. In addition to direct effects, such interactions create positive externalities and synergies [Polterovich, 2010].Regarding the definition of a RIS, it has been noted that such systems are ‘components of the national innovation system localised for specific territories. Most researchers agree about defining the qualitative characteristics of regional innovation systems (italics by authors). A RIS includes several connected elements (organizations and institutions) and has boundaries (limits) separating it from the surrounding environment [Mikheeva, 2014]. Measuring the quantitative characteristics of such networks, and their interactions, is one of the most difficult aspects of studying innovation processes. It involves improving metrics, performing calculations, and conducting experiments to assess the role of regions in the development of various national innovation systems [OECD, 2010].This paper analyses the potential links between various components of Russian RIS, namely the organizations generating new knowledge and innovative ideas; design bureaus and institutes; and innovative companies. The proposed methodology for collecting and verifying quantitative data on the role of science and industry in the innovation process allows us to estimate the intellectual resources absorbed by industry, and the potential for interaction between various actors at national and regional levels. Our hypothesis suggests that the emerging links within regional and national innovation systems serve as inputs for the innovation process, the productivity of which is in direct proportion to the share of effective interactions between R&D organizations and companies operating in a given region. Our estimates of the productivity of such cooperation are included in the innovation component of the Computable General Equilibrium (CGE) model of regional economy (based on the example of the Republic of Bashkortostan). We also present and analyse various scenarios to increase the productivity of the regional socio-economic system.
Assumptions, hypotheses, and modelsWe consider organizations which conduct R&D and generate new knowledge as the creators of innovative ideas. These include academy of science institutes, universities, and other research organizations. Innovations emerge as a result of interactions between new knowledge-creating organizations, design institutes and bureaus, and innovative companies. The institutional conditions for such interactions and its productivity are determined by the state. Thus the overall innovation infrastructure can be defined as the set of organizations which create new knowledge, innovative enterprises which help develop new technologies, products and services, and the institutional environment which affects this process. The overall innovation space – the totality of potential links between knowledge creators and innovative companies – is seen as a resource for innovation activity. The number of such links determines the size of the innovation space.Innovations can be notionally divided into several types: technological, informational, organizational, and marketing. For the first kind of innovations, new production technologies are particularly important; Christopher Freeman considered the capability of developing these as an important characteristic of an innovation system [Freeman, 2011]. Experimental techniques for measuring the innovation space, which we apply here to new production technologies, are also relevant for other kinds of innovations. The concepts of ‘overall infrastructure’, ‘overall space’, and ‘size of the overall space’ are generalizable for each type of innovations.Let Si be the number of organizations generating new knowledge in region i; Bi — is the total number of innovative companies in region i.Thus, the number of potential links between organizations creating new knowledge and innovative companies, i.e., the size of the overall innovation space in region i will be limited by the value = Si Bi.Suppose we take a specific type of innovation. Let be the share of R&D organizations participating in the creation of this kind of innovation in region i of the total number of R&D organizations; is the share of innovative companies in region i cooperating with R&D organizations in developing innovations of this type out of the total number of innovative companies in the given region. Thus, the size of the innovation space for this type of innovation produced, in region i equals , where
is the share of innovation space for this type of innovation of the total innovation space.Let us introduce a production function describing how the number of newly created innovations of this type depends on the number of R&D organizations and their collaborating innovative companies, which we call the ‘innovation resources’. Let be the number of innovations created in region i in a unit of time. Then . To simplify the analysis, we use the power function of the kind
. Let us introduce a normalizing condition a = 1 to determine the productivity of cooperation between the R&D organization and the regional company.Assertion 1.Let us assume that the condition (1) holds true.In that case, the number of innovations of a specific type created in the region directly depends on the size of the overall innovation space. If condition (1) holds true, it means that the elasticity of the number of newly created innovations to the number of R&D organizations is the same as the elasticity to the number

2016 Vol. 10 No 3 FORESIGHT AND STI GOVERNANCE 79
of companies. Assertion 1 means that if condition (1) holds true, the results of innovation activities will be determined by the number of potential links between new knowledge-generating organizations and innovative companies operating in the region i.e. by the size of the overall innovation space.Indeed, let us assume that condition (1) holds true. Then after applying a transformation, we get:
.
In that case, the production function may be represented as , where , . Thus if condition (1) holds true, the size of the overall innovation space can be seen as a resource for creating any specific type of innovation.Hypothesis 1: The results of Russian regions’ innovation activities directly depend on the size of overall innovation space.To test hypothesis 1, it would suffice to check if condition (1) holds true. Let us designate . Note that can have a positive or negative value. Then after applying a transformation, we get:
In that case, the production function may be represented as: , where .Empirical testing of hypothesis 1 is carried out by testing the statistical hypothesis1 . We present the results of this hypothesis testing using data on the number of newly developed production technologies in the next section. The productivity of the overall innovation space in terms of creating specific innovation types is measured on the basis of the stochastic frontier concept.Assumptions:1) , are random values;2) the share of the innovation space for a specific type of innovation of the total innovation space can be presented as , where is a constant, is a normally distributed random value with zero expectation, and — a non-negative random value with semi-normal distribution.If hypothesis 1 holds true, then:
,
Where: is a normally distributed random value with zero expectation; is a non-negative random value with semi-normal distribution.
The random component vi – ui reflects how the innovation process is affected by uncertainty and productivity factors. Normally distributed random value vi with zero expectation is applied to model the effect of the former: . The effect of productivity factors is modelled using an independent from vi non-negative random value ui with zero-truncated normal distribution and zero expectation:
.According to the stochastic frontier concept [Kumbhakar, Lovell, 2004], is the largest expected share of overall innovation space used by innovative regions, which determines the stochastic frontier production function . The stochastic frontier production function can be presented as . Then the random value can be interpreted as the share of overall innovation space effectively used by the region to create a specific type of innovation. Note that for any region, the inequality holds true.The function in logarithmic form looks like this:
, (2)Where: .Since , then . Given estimated parameters we have . We can also estimate the mathematical expectation [Battese, 1988]:
Where: TEi may be seen as an indicator of the region’s effectiveness in making use of the overall innovation space to create a specific type of innovation. To measure (the share in that space which is productively used by the region), the value is applied. Then the value can be taken as the size of the innovation space for a specific type of innovation. Innovation dynamics and the number of innovations created in all regions are determined by the parameter . The latter’s growth rate affects the growth of the stochastic frontier , i.e., the growth of expected number of innovations created in productive innovative regions.
1 Establishing links between R&D organizations and companies, and creating innovation are seen as random processes. Therefore, the number of innovations created in a unit of time is also random.
Makarov V., Ayvazyan S., Afanasyev M., Bakhtizin A., Nanavyan A., pp. 76–90

Spatial Development and Innovation: Russian Practice
80 FORESIGHT AND STI GOVERNANCE Vol. 10 No 3 2016
6
5
4
3
2
1
0
-1
-2
-3
(ordinate or vertical axis) on (size of the overall innovation space in the region)(abscissa or horizontal axis) based on data for 2010–2012, in logarithms
Figure 1. Dependency of the number of newly developed production technologies teh12i
Source: соmpiled by the authors.
Label Indicatortehi Number of new production technologies developed in the region [Rosstat, 2013c]Pi Number of companies in the region [Rosstat, 2013d]Ii Share of innovative companies out of the total number of companies in the region [Rosstat, 2013a]Si Number of companies in the region which conduct R&D [Rosstat, 2013b]Source: соmpiled by the authors.
Table 1. Data sources
0 2 4 6 8 10 12 14 16 18 20
The growth rate of is determined by the ratio of parameters c and : since , if grows, also grows; if c grows, so does . Simultaneous growth of these two parameters indicates an increased share of productively used innovation space and increased innovation activity overall. If c and change in opposite directions, growth of will be determined by the growth of the ratio . An important advantage of applying the stochastic frontier concept to measure parameters c and is their tolerance of non-innovative regions’ characteristics.Thus if hypothesis 1 holds true, we can measure the share of overall innovation space the region uses to create innovations of a specific type. In subsequent sections of the paper, we present the results of testing hypothesis 1 and measuring the share of overall innovation space in Russian regions. We use official Russian statistical data from Rosstat on the number of newly developed technologies, R&D organizations, and innovative companies for the period 2008–2012.
Data, hypotheses testing, and the estimates of the model parametersTable 1 below presents the indicators we used to test hypothesis 1 and to estimate the size of the overall innovation space in Russian regions. Table 1 also shows the labels used for these indicators and the sources of the data.Using the above designations, the number of innovative companies in the region is determined by the value .We also apply the following designations:teh10i — the average number of production technologies annually developed in the region in 2008–2010;2teh11i — the average number of production technologies annually developed in the region in 2009–2011;teh12i — the average number of production technologies annually developed in the region in 2010–2012.Figure 1 shows the logarithmic dependence of teh12i (newly developed production technologies) on (the size of the overall innovation space) for 80 Russian regions based on data for 2010–2012.To test statistical hypothesis , the parameters were estimated for the following model:
2 An averaged out value is used because of the need to smooth out source data.

2016 Vol. 10 No 3 FORESIGHT AND STI GOVERNANCE 81
Estimates Model (3) для teh10 Model (3) для teh11 Model (3) для teh12(1) (2) (3) (4)
0.7814*** 0.7140*** 0.6808***c –5.7531*** –4.9016*** –4.4133***
–.1993 –0.1710 –0.1380 rejected rejected rejected
Log likely –116.56 –124.66 –130.83Source: соmpiled by the authors.
Table 2. Estimated parameter values for model (3)
. (3)Rows 3-5 (Table 2) contain the estimated values of parameters , c, and in model (3), calculated using the maximum likelihood method. Row 6 (Table 2) presents the results of testing the hypothesis
— no inefficiency [Ayvazyan, Afanasyev, 2015]. The last row contains the maximum values of the log-likely function.In the models built for 2010, 2011, and 2012, the estimated values are insignificantly different from zero (by about 10%). The statistical hypothesis is not rejected.3 The results of testing the hypothesis
do not contradict hypothesis 1 (that the results of Russian regions’ innovation activities are directly dependent on the size of the overall innovation space).The second, third, and fourth columns of Table 3 present the estimated values of the parameters and c in model (2) for each year (2010, 2011, and 2012). Rows 7-8 contain the computed values for and
respectively. Next, we tested the following two hypotheses.Hypothesis 2: the elasticity of the number of newly developed production technologies to the size of the overall innovation space is constant in time.Hypothesis 3: the constant c in model (2) is constant in time.To test hypotheses 2 and 3, we constructed model (4) with variable coefficients based on data for the three-year period 2010–2012:
(4)Column (5) in Table 3 contains the estimates of model (4) parameters. The estimate of parameter in model (4) is significant at the 10% level. Hypothesis 2 is rejected in favour of an alternative: that the elasticity of the number of newly developed production technologies to the size of the overall innovation space decreases with time. The estimate of parameter с0 model (4) is significant at the 10% level. Hypothesis 3 is rejected in favour of an alternative: that the constant c in model (2) increases with
3 A positive and statistically significant estimated effect of in model (3) can be accompanied by an insignificant effect of , due to possible multicollinearity effect. To additionally test the hypothesis = 0 against an alternative hypothesis , we can use statistics , where is the value of the likelihood function under the alternative hypothesis, and is the value of the likelihood function under the zero hypothesis. Ayvazyan et al. [Ayvazyan et al., 2012] show that if at a specified significance level of value of test statistics is bigger than the fractile of distribution level , hypothesis should be rejected.
Estimates Model (2) for teh10 Model (2) for teh11 Model (2) for teh12 Model (4)for 2010–2012
(1) (2) (3) (4) (5).6832*** .6465*** .6170*** .6816***
c –5.2781*** –4.7775*** –4.1406*** –5.2571***— — — –.0355*
— — — .5618*отвергается отвергается отвергается отвергается
Log likely –116.72 –125.16 –130.88 –375.62–7.7249 –7.3889 –6.71074.42E-04 6.18E-04 1.22E-03
рост % 39.9 97.1Source: соmpiled by the authors.
Table 3. Estimated parameter values for models (2) and (4)
Makarov V., Ayvazyan S., Afanasyev M., Bakhtizin A., Nanavyan A., pp. 76–90

Spatial Development and Innovation: Russian Practice
82 FORESIGHT AND STI GOVERNANCE Vol. 10 No 3 2016
Source: соmpiled by the authors.
Figure 3. Correlation between the number of newly developed production technologies and the value - the size of the innovation space used
to develop these technologies (2012 data)
0 1000 2000 3000 4000 5000 6000 7000
250
200
150
100
50
0
time. Although the estimated value of significantly decreases, the ratio is growing. Consequently, we observe a growth of the share of the overall innovation space used by innovative regions to develop new production technologies. The last row in Table 3 shows the growth of as a percentage.For each of 80 Russian regions, we estimated the productivity of how well the regions use their overall innovation space : — for 2010, — for 2011, and — for 2012 are presented in columns 5-7 in Table 4, respectively.In Figure 2a, each dot represents the productivity of the regional innovation system. The abscissa (horizontal) axis shows regional values for 2010; the ordinate (vertical) axis — for 2011, with a correlation coefficient of 0.8876. The productivity estimates for the next two years are strongly dependent. In Figure 2b, the abscissa (horizontal) axis shows values for 2011, the ordinate (vertical) axis — values for 2012, with a correlation coefficient of 0.8959. The correlation between the productivity estimates which determines the stability of regions’ rankings over time is equally high. Measuring the productivity of innovation space provides important characteristics of regional innovation activities, supplementing their estimated technological productivity as described in [Ayvazyan et al., 2016].Table 4 (columns 2–4) shows the estimated values of the size of the innovation space used by each of the 80 Russian regions to develop new technologies, based on data from 2012. Figure 3 illustrates the correlation between the number of newly developed production technologies (the ordinate or vertical axis) and the value – the size of the innovation space that Russian regions made use of to develop such technologies (the abscissa or horizontal axis). The two dots in the upper right section of Figure 3
0.0 0.2 0.4 0.6 0.8 1.0
1
0.9
0.8
0.7
0.6
0.5
0.4
0.3
0.2
0.1
0.00.0 0.2 0.4 0.6 0.8 1.0
Figure 2. Distribution of regional overall innovation spaces’ productivity values
Source: соmpiled by the authors.
0.9
0.8
0.7
0.6
0.5
0.4
0.3
0.2
0.1
0.0
Figure 2a Figure 2b

2016 Vol. 10 No 3 FORESIGHT AND STI GOVERNANCE 83
iV~ 2010 iV~ 2011 iV~ 2012 iTE 2010iTE 2011
iTE 2012
(1) (2) (3) (4) (5) (6) (7)Belgorod Region 18.587 26.421 34.315 0.812 0.76 0.769Bryansk Region 9.197 17.81 23.376 0.736 0.718 0.632Vladimir Region 14.898 6.62 19.06 0.53 0.249 0.314Voronezh Region 59.947 78.764 103.936 0.635 0.582 0.482Ivanovo Region 1.212 6.724 20.214 0.162 0.559 0.495Kaluga Region 30.483 43.397 99.066 0.879 0.873 0.814Kostroma Region 2.044 1.181 3.955 0.641 0.353 0.655Kursk Region 0.046 0.245 2.167 0.024 0.04 0.131Lipetsk Region 0.046 0.671 1.358 0.028 0.131 0.133Moscow Region 460.693 956.31 1583.051 0.409 0.48 0.445Orel Region 5.809 5.159 4.958 0.618 0.46 0.329Ryazan Region 0.683 1.93 3.096 0.113 0.171 0.14Smolensk Region 5.584 2.635 2.108 0.647 0.302 0.19Tambov Region 0.681 0.04 0.039 0.12 0.017 0.011Tver Region 5.778 4.534 6.528 0.352 0.209 0.173Tula Region 8.757 10.112 34.847 0.375 0.34 0.484Yaroslavl Region 16.891 19.004 52.712 0.432 0.325 0.413City of Moscow 2304.145 3934.007 6415.534 0.12 0.121 0.118Republic of Karelia 0.253 0.242 5.179 0.079 0.05 0.212Republic of Komi 0.685 1.234 3.998 0.108 0.178 0.237Arkhangelsk Region 22.089 22.884 41.637 0.734 0.607 0.652Vologda Region 2.508 1.951 4.07 0.231 0.14 0.188Kaliningrad Region 4.534 5.913 7.257 0.679 0.644 0.381Leningrad Region 11.66 16.601 26.15 0.611 0.663 0.615Murmansk Region 0.048 0.04 0.039 0.014 0.014 0.011Novgorod Region 3.431 5.23 10.273 0.622 0.697 0.781Pskov Region 3.061 2.578 2.047 0.486 0.383 0.272City of St. Petersburg 1150.927 2743.222 6034.485 0.284 0.336 0.407Republic of Adygei 0.043 0.037 0.035 0.076 0.055 0.048Republic of Kalmykia 0.041 0.035 0.032 0.267 0.212 0.16Krasnodar Region 24.805 42.081 78.579 0.249 0.304 0.275Astrakhan Region 11.609 13.711 14.453 0.615 0.767 0.781Volgograd Region 2.643 1.314 0.264 0.091 0.058 0.018Rostov Region 34.521 49.317 67.456 0.232 0.255 0.197Republic of Dagestan 16.186 11.074 26.254 0.763 0.804 0.541Republic of Ingushetia 0.041 0.035 0.033 0.205 0.16 0.108Republic of Kabardino-Balkaria 2.316 4.606 5.662 0.508 0.586 0.456Republic of Karachai-Cherkessia 0.042 0.036 0.033 0.138 0.126 0.112Republic of Northern Ossetia – Alania 0.045 0.038 0.036 0.036 0.036 0.031Chechen Republic 0.041 0.035 0.033 0.263 0.202 0.129Stavropol Region 0.048 0.041 0.04 0.013 0.01 0.007Republic of Bashkortostan 16.682 20.068 25.166 0.162 0.13 0.107Republic of Mari El 0.045 0.038 0.037 0.044 0.036 0.024Republic of Mordovia 6.54 11.903 19.157 0.817 0.725 0.65Republic of Tatarstan 47.622 81.455 261.866 0.179 0.173 0.225Republic of Udmurtia 5.887 11.677 35.67 0.262 0.254 0.376Republic of Chuvashia 16.388 17.393 22.625 0.69 0.592 0.356Perm Region 59.635 105.258 150.129 0.295 0.448 0.363Kirov Region 0.694 0.041 0.04 0.086 0.011 0.008Nizhny Novgorod Region 356.293 409.947 569.755 0.657 0.596 0.567Orenburg Region 8.879 3.642 5.336 0.309 0.148 0.141Penza Region 16.387 15.005 41.563 0.741 0.467 0.616Samara Region 102.141 133.777 156.808 0.489 0.507 0.501
Table 4. Estimates for the size of the technology innovation space (columns 2–4), and productivity of use of the overall innovation space in Russian regions (columns 5–7)
Makarov V., Ayvazyan S., Afanasyev M., Bakhtizin A., Nanavyan A., pp. 76–90

Spatial Development and Innovation: Russian Practice
84 FORESIGHT AND STI GOVERNANCE Vol. 10 No 3 2016
iV~ 2010 iV~ 2011 iV~ 2012 iTE 2010iTE 2011
iTE 2012
(1) (2) (3) (4) (5) (6) (7)Saratov Region 47.392 49.843 94.334 0.712 0.709 0.628Ulyanovsk Region 6.533 18.636 35.529 0.461 0.741 0.785Kurgan Region 0.253 0.04 3.906 0.078 0.018 0.302Sverdlovsk Region 232.885 592.361 1062.763 0.32 0.477 0.522Tyumen Region 44.015 46.814 48.776 0.344 0.275 0.224Chelyabinsk Region 126.056 241.501 432.767 0.701 0.709 0.644Republic of Altai 0.044 0.039 0.037 0.066 0.024 0.022Republic of Buryatia 7.256 2.658 5.015 0.711 0.265 0.302Republic of Tuva 0.612 0.751 0.561 0.49 0.722 0.513Republic of Khakassia 0.043 0.037 0.035 0.081 0.071 0.045Altai Region 5.111 6.852 6.785 0.151 0.136 0.102Zabaikalskiy Region 0.659 0.229 0.035 0.212 0.135 0.041Krasnoyarsk Region 33.851 94.745 184.217 0.323 0.55 0.587Irkutsk Region 38.744 30.549 130.824 0.486 0.427 0.66Kemerovo Region 18.293 26.684 43.465 0.624 0.629 0.597Novosibirsk Region 109.523 261.62 394.804 0.422 0.452 0.405Omsk Region 25.345 20.193 33.751 0.54 0.402 0.351Tomsk Region 10.309 16.298 17.936 0.177 0.206 0.193Republic of Sakha (Yakutia) 1.825 0.244 1.378 0.199 0.046 0.109Kamchatka Region 0.249 0.68 1.376 0.101 0.103 0.11Primorskiy Region 5.164 13.469 28.742 0.126 0.155 0.18Khabarovsk Region 7.001 2.858 1.484 0.187 0.073 0.039Amur Region 0.045 0.039 0.037 0.036 0.027 0.019Magadan Region 4.955 9.253 8.047 0.812 0.678 0.801Sakhalin Region 1.119 0.651 2.765 0.467 0.223 0.4Jewish Autonomous Region 0.039 0.034 0.032 0.385 0.305 0.14Chukchi Autonomous Region 0.035 0.032 0.031 0.597 0.474 0.255Source: соmpiled by the authors.
Table 4 continued
represent the cities of Moscow (on the right) and St. Petersburg (on the left). The dots in the lower left section represent the remaining 78 regions. The six dots visually distinguishable from the rest represent Moscow, Sverdlovsk, Nizhny Novgorod, Chelyabinsk, Novosibirsk, and Kaluga regions.Table 5 lists 11 regions of Russia ranked by the average annual number of production technologies they developed between 2010 and 2012. Their combined share amounts to about 75% of the total number of such technologies. The table also presents a ranking of regions’ productivity in terms of making use of their overall innovation space. Two regions – the cities of Moscow and St. Petersburg – develop significantly more new technologies than the others (Figure 3). However, the leaders in terms of productivity of using their overall innovation space are Kaluga, Irkutsk, and Chelyabinsk regions.Makarov et al. [Makarov et al., 2014] group 80 Russian regions based on their industrial production structure. Using the principal components method and the commonality criteria described in the aforementioned work, they propose five groups of regions: basic regions (with a balanced economy), manufacturing, mining, agricultural, and developing regions (column 4, Table 5). Each of the five groups can be put into one of two groups – ‘basic’ (with a balanced economic structure) or ‘manufacturing’ regions.In Table 5, regions marked with * are among the top ten, and those marked with ** among the top 20 leaders in terms of the Innovation Development Index compiled by the Association of Innovative Regions of Russia [AIRR, 2015]. This ranking is based on 23 indicators, including ‘Internal R&D expenditures as a percentage of gross regional product (GRP)’, ‘revenues from technology exports as a percentage of GRP’, ‘fixed assets replacement ratio’, ‘GRP per worker employed in the region’, ‘Share of high-technology and research-intensive industries’ output as a percentage of GRP.’[Ayvazyan, Afanasyev, 2015] propose an agent-oriented model of new production technologies’ development based on cooperation between business and science. This model includes, along with other regional economic characteristics, estimates of the productivity of the innovation space. We present the latter in Table 4 and subsequently used them to add an innovation component to the Computable General Equilibrium (CGE) model, as discussed in the next section.

2016 Vol. 10 No 3 FORESIGHT AND STI GOVERNANCE 85
№ Region Productivity ranking Group1 City of St. Petersburg* 9 basic2 City of Moscow* 11 basic3 Moscow Region* 8 basic4 Sverdlovsk Region* 6 manufacturing5 Nizhniy Novgorod Region* 5 manufacturing6 Chelyabinsk Region** 3 manufacturing7 Novosibirsk Region** 10 basic8 Kaluga Region* 1 manufacturing9 Krasnoyarsk Region** 4 basic10 Irkutsk Region 2 basic11 Samara Region** 7 basicSource: соmpiled by the authors.
Table 5. Characteristics of Russian regions’ innovation activities
Regional CGE model with an innovation componentExperts are familiar with numerous models based on various factors of science and technology (S&T), including the accumulation of knowledge. These belong to the group of economic growth models traceable all the way back to the theories of Adam Smith, David Ricardo, and Robert Solow (for example, see [Solow, 1956; Afanasyev, 1988]). In the 1990s, endogenous growth models became popular in economic theory, of which the best-known are those proposed by Paul Romer [Romer, 1990] and Charles Jones [Jones, 1998]. These models were based on indicators such as knowledge obtained via R&D, human capital, and technologies. In Romer’s model, the rate of S&T progress was determined by the number of researchers and their productivity. In other words, as these two indicators grew, so too did the rate of S&T progress (a statement not always confirmed empirically). Jones’s model was based on Romer’s and includes the level of technological development as an additional indicator. Both these models imply that the number of researchers and knowledge producers are proportional to the country’s population. Detailed reviews of models of knowledge production can be found in [Varshavsky, 1984, 2003; Makarov, 2009].Without going into the mathematical finer points of the above-mentioned and other existing models, we note that none of the models enable us to measure the multiplicative effects of changes in the sphere of innovation on the wider economy. On the contrary, our proposed model does accomplish this, both in the mid- and long-term. It is also distinctive by applying the Computable General Equilibrium (CGE) theory to economic modelling. As far as we know, our model is the first large-scale dynamic model which deals with sectors of the knowledge economy (or the ‘new economy’) individually, while taking into account their interconnections with the overall economic system. The impact on the latter can be measured by monitoring changes in the following quantitative indicators:1) Investments in R&D and educational organizations, innovative and other companies;2) VAT, corporate and organizational tax, property tax, personal income tax, and unified social tax rates; 3) Salaries in the R&D and education sector, and wages paid by innovative and other Russian companies and organizations;4) Deposit interest rates for companies and individuals;5) Volume of social payments to households (pensions, benefits, etc.);6) Supply of money in the economy.The first version of the model focused on the whole Russian national economy, and was not modified to match specific regional conditions [Makarov et al., 2009]. Subsequently, we adjusted the model in line with the regional features of the Republic of Bashkortostan, thanks to the efforts of local researchers (N.Z. Solodilova and D.N. Beglov). During the next stage, we included in the set of economic agents’ production functions the indicator to measure the productivity of using the overall innovation space when developing production technologies (TEi) in the Republic of Bashkortostan for the years 2010, 2011, and 2012.
Brief description of the modelThe model comprises seven economic agents, of which the first three are producers:1) R&D and education sector, which provides training for students and knowledge creation services, and includes public and private higher education institutions, as well as R&D organizations;2) Innovation sector – all the innovative companies and organizations in the Republic of Bashkortostan;3) Other industries in the Republic of Bashkortostan;4) All consumers – made up of all households in the Republic of Bashkortostan;
Makarov V., Ayvazyan S., Afanasyev M., Bakhtizin A., Nanavyan A., pp. 76–90

Spatial Development and Innovation: Russian Practice
86 FORESIGHT AND STI GOVERNANCE Vol. 10 No 3 2016
5) Regulatory authorities;6) Banking sector;7) Outside world.The production potential of the first three economic agents in our model can be estimated using a modified Cobb–Douglas function. The resulting value reflects the added value created by the relevant sector in the form of end products:
(5)
Where:i = 1, 2, 3 — number of an economic agent;
— dimension coefficient; — capital assets coefficient;
— labour input coefficient; — coefficient of the sector’s expenditures on new knowledge, primarily R&D; — coefficient of the sector’s expenditures on training and education; — coefficient of the sector’s expenditures on innovative goods; — coefficient of the sector’s productivity in using the overall innovation space.
The production function has the following components: capital assets (average values for the beginning (Ki(t–1)) and the end (Ki(t)) of the year); demand for labour at public (P3l) and private (P1l) prices.The last multiplier of the function is a bit more complex: it represents the effect that the sector’s spending on knowledge, training and education, and innovative products has on the added value created. As we can see, formula (1) takes into account demand for these production factors during the preceding period. Thus, if no investments were made in these areas during the previous period, we have e0 = 1, i.e., R&D and innovation activities did not affect the output at all. Yet as such investments (however small they may be) are made annually, the production function – with this ‘intellectual’ component growing all the time – positively affects the sector’s output of end products.We highlight certain features of the function applied in our model which distinguish it from other models, i.e., models that take S&T progress into account. Exogenous S&T progress functions are the most commonly used in economics due to the relatively simple procedures for evaluating parameters. Note that S&T progress can be factored in in three different ways: via labour, capital, and output parameters. In the last case (the most common one), S&T progress is presented as an exponentially growing time function with a constant growth rate. In other words, changes in the S&T progress parameters in this case remain outside the economic system they describe.We can see from equation (5) that in our production function (where S&T progress is also applied as an exponential factor), expenditures on knowledge, training and education, and innovative products are used as endogenous values. Thus, our function belongs to the group of endogenous S&T progress functions mentioned in the introduction of this paper. Its primary difference from other functions of the same group (e.g. the Romer function) lies in the fact that our function takes into account capital assets and all knowledge creation costs.A significant difference of the production function compared with its previous version is the presence in equation (5) of the indicator to measure the productivity of using the overall innovation space TEi for the region in question. This indicator captures the ‘degree of cooperation between research and industry in the region’ i.e. effectively, the institutional conditions put in place by the government for developing the regional innovation system. Thus, the model takes into account not only the sectors’ expenditures on innovation, education and training, and new knowledge, but also the impact of existing economic institutions. Figure 4 presents a conceptual scheme of the model overall.According to Figure 4:I. The R&D and Education sector (economic agent 1) provides services whose consumers can be divided into three groups:1) The Innovation sector (mostly R&D services); other sectors of the economy; and economic agent 5. According to the System of National Accounts (SNA) classification, this concerns non-marketed R&D services whose consumers include, among others, the sector itself. In the model these services are represented by the variable ;2) Economic agent 5 (free educational services according to the SNA methodology); paid education and training services for the innovation sector; other sectors of the economy; and households. Some of these services are consumed by the sector itself. In the model, these services are represented by the variable
;3) Services for the outside world: R&D services paid for by research grants: .II. The Innovation sector’s (economic agent 2) output is sold in two main types of markets:

2016 Vol. 10 No 3 FORESIGHT AND STI GOVERNANCE 87
— market where the product is distributed among the economic agents included in the model;
— taxes and subsidies.
c1 — end products market for households;c2 — end products market beyond the region;g1 — end products market for economic agent 5;l1 — labor market for private companies;l3 — labor market for public sector organizations;n1 — innovative products market;n2 — innovative products market beyond the region;z1 — knowledge market;z2 — knowledge market beyond the region;r1 — education and training services market.
Graphic symbols:
— economic agent;
— the agent is selling a product in the market;
— the agent is buying a product;
— agents’ actions in connection with labor supply and demand;
Parameters
Source: соmpiled by the authors.
Figure 4. Conceptual scheme of applying the CGE model to innovation sector
1) Internal market. Here we mean end products made using technological and other innovations. According to the Rosstat methodology, this indicator is based on the volume of shipped innovative products. Their consumers include all production sectors together with the innovation sector itself (their R&D and technological innovations costs), and economic agent 5 (public funding allocated to support innovation activities). In the model, these products are represented by the variable ;2) Outside world: .III. Other industries (economic agent 3) make the following product types (divided into four groups):1) End products for households ( ) — products for everyday consumption (food, etc.); consumer durables (household appliances, cars, etc.); and services;
Makarov V., Ayvazyan S., Afanasyev M., Bakhtizin A., Nanavyan A., pp. 76–90
Government (all public authorities) (5)
R&D and Education Sector (1)
Innovation Sector (2)
Other Industries (3) All Consumers (4)

Spatial Development and Innovation: Russian Practice
88 FORESIGHT AND STI GOVERNANCE Vol. 10 No 3 2016
2) End products for economic agent 5 ( ), including the following:a) End products for government agencies (according to the SNA methodology, government agencies’ expenditures on procurement of finished products), including:• Free services for the population provided by health and culture organizations (except educational
services, which are provided by economic agent 1);• Services for the whole of society, such as public administration, law enforcement, national defence,
basic research, communal and housing services, etc.;b) End products for non-profit organizations serving households, i.e. free social services;3) Investment products – expenditures to upgrade produced and non-produced material assets i.e. capital assets ( ). According to the SNA methodology, this product type is defined as the sum of gross accumulated capital assets and increased tangible current assets, minus the costs of acquired new and existing capital assets (except write-offs).To make products and provide services, producing agents 1–3 acquire the following production elements:1) Labour (at public and private sector prices): and ;2) Investment products: , and ;3) Innovative products: , and ;4) Knowledge provision services (e.g. R&D): , and ;5) Educational and training services (commercial education and training): , and .IV. All consumers (economic agent 4) acquire end products produced by other industries: . Households also use paid educational services ( ), while the sector provides labour for private companies ( ) and public organizations ( ).V. Economic agent 5 sets tax rates, determines the amount of public funding and subsidies allocated to producers and social recipients, and acquires end products ( ) produced by other industries. In addition, as already noted, agent 5 creates demand for innovative products ( ), non-market R&D services ( ), and free educational services ( ).VI. The Banking sector sets deposit interest rates.After iterative recalculations using the model, combined demand and supply in each product and service markets even out due to two different mechanisms applied depending on the pricing mode. It should be noted that in most cases prices are set on the basis of price indices for the reference period. When products’ or services’ prices are set by the government, the balance is achieved by adjusting the budget; in the case of legal or shadow markets, the balance is set by changing the actual price.The number of markets in our model is as follows: end products for households, end products for economic agent 5, investment and innovative products, education and knowledge provision services are sold in six internal markets. Additionally, the model takes into account three external markets: innovative products (n2), knowledge (z2), and other exported products (c2). Thus we have nine product markets, and two labour markets.
ResultsIn the present study, we analysed four different options for changing the funding arrangements for innovation activities, R&D and educational organizations:1. Increasing investments in innovation activities, R&D and education by 30% compared with the current level, at the cost of proportionally reducing expenditures in other economic sectors;2. Reducing investments in innovation activities, R&D and education by 30% compared with the current level, while proportionally increasing expenditures in other economic sectors;3. Reducing overall taxation of innovative companies, R&D and educational organizations by 30% compared with the current level, i.e. reducing the amount of collected taxes by 30% and leaving these funds in the organizations’ bank accounts.4. Increasing investments in innovation activities, R&D and education by 30% compared with the current level, while at the same time also reducing overall taxation of innovative companies, R&D and educational organizations by 30%.Our calculations performed using the model indicated that in the long-term, investments in innovation result in a higher growth rate than do investments in other sectors of the economy. The same holds true for providing tax breaks to research-intensive companies. The actual calculated results for the four above-mentioned options are presented below (Table 6).4
4 These results are described in more detail in the report on research conducted in the framework of the National Science and Technology Programme of the Republic of Bashkortostan, entitled ‘Long-term S&T Foresight for the Republic of Bashkortostan.’

2016 Vol. 10 No 3 FORESIGHT AND STI GOVERNANCE 89
Тable 6. Changes of average annual gross regional product growth rates by 2030 (as a percentage of the basic scenario)
Option 1 +0.684Option 2 –0.124Option 3 +0.316Option 4 +1.112Source: соmpiled by the authors.
In our opinion, the methodology for building CGE models to analyse the economic system’s innovation component can also be applied in other Russian regions.
ConclusionsThe approach to studying the emergence of a knowledge economy in Russian regions, and the conditions required for its development, is focused on an important innovation resource: namely, the potential links between R&D organizations and innovative companies. The potentially significant role of this resource is due to the fact that its effective use directly affects regional innovation performance and overall economic growth on macro- and meso-levels.The number of new production technologies developed in regions is proportional to the size of the overall innovation space, which is determined by the number of potential links between R&D organizations and innovative companies operating in the region. The results of the study do not contradict our hypothesis.Between 2010 and 2012, the share of the innovation space used by innovative regions to develop new technologies grew. For each year during this period, we estimated the size of the overall innovation space used by Russian regions to develop new production technologies.Regional authorities play an important role in promoting partnerships between the state, industry, and the research and education community, as well as in further developing the RIS. Their contribution may lead to a bigger overall innovation space in the region, and to its increased productivity in terms of creating specific types of innovation.We developed a CGE model to analyse the innovation component of a regional economy (based on the example of the Republic of Bashkortostan) and estimate in quantitative terms the consequences of various scenarios aimed at increasing the productivity of a socio-economic system. In our opinion, the methodology for building CGE models which take into account S&T progress can also be applied in other Russian regions.In the long-term, investments in innovation result in a higher growth rate compared to investing equal amounts in other sectors of the economy. The same holds true for providing tax breaks to research-intensive companies. At first glance, returns on investments into the innovation sector are not as high as could be expected. On the other hand, supporting high-technology sectors, while this does not yield quick results, enables the existing S&T potential to be maintained. This can subsequently provide the basis for diversifying the regional economy. We emphasize that our proposed model allowed us to estimate just the overall effect of the scenarios for the whole economic system, while analysing specific sectors of the economy would provide higher-quality data. However, models disaggregated by economic sectors would require inter-industry data as inputs, which are currently unavailable. Nevertheless, we emphasize that supporting R&D, education, and innovation should be seen as a regional development priority as confirmed by our calculations.We added an indicator to measure the productivity of using the overall innovation space in a given region into the production function of economic agents in the CGE model. This makes the model more realistic because it takes into account the institutional structure of the environment in which the agents operate.
ReferencesAfanasyev V.S. (1988) Glava 2. David Rikardo [Chapter 2. David Ricardo]. Vsemirnaya istoriya ekonomicheskoi mysli
(v 6 tomakh) [World History of Economic Thought (6 volumes)] (ed. V.N. Cherkovets), vol. II – Ot Smita i Rikardo do Marksa i Engel’sa [From Smith and Ricardo to Marx and Engels], Moscow: Mysl’ (in Russian).
AIRR (2015) Reiting innovatsionnykh regionov [Ranking of innovative regions], Moscow: Association of innovative regions of Russia (in Russian).
Ayvazyan S.A., Afanasiev M.Yu. (2015) Modelirovanie proizvodstvennogo potentsiala na osnove kontseptsii stokhasticheskoi granitsy. Metodologiya, rezul’taty empiricheskogo analiza [Modeling of productive capacity based on stochastic frontier concept. The methodology and the results of empirical analysis], Moscow: KRASAND (in Russian).
Makarov V., Ayvazyan S., Afanasyev M., Bakhtizin A., Nanavyan A., pp. 76–90

Spatial Development and Innovation: Russian Practice
90 FORESIGHT AND STI GOVERNANCE Vol. 10 No 3 2016
Ayvazyan S.A., Afanasiev M.Yu., Kudrov A.V. (2016) Modeli proizvodstvennogo potentsiala i otsenki tekhnologicheskoi effektivnosti regionov RF s uchetom struktury proizvodstva [Models of productive capacity and technological efficiency evaluations of regions of the Russian Federation concerning the output structure]. Ekonomika i matematicheskie metody [Economics and Mathematical Methods], no 1, pp. 28–44 (in Russian).
Ayvazyan S.A., Afanasyev M.Yu., Rudenko V.A. (2012) Nekotorye voprosy spetsifikatsii trekhfaktornykh modelei proizvodstvennogo potentsiala kompanii, uchityvayushchikh intellektual’nyi kapital [Some specification aspects for three-factor models of a company’s production potential taking into account intellectual capital]. Prikladnaya ekonometrika [Applied Econometrics], vol. 27, no 3, pp. 36–69 (in Russian).
Battese C. (1988) Prediction of Firm-level Technical Efficiencies with a Generalized Frontier Production Function and Panel Data. Journal of Econometrics, vol. 38, pp. 387–399.
Efimova I.N. (2012) Nauchno-innovatsionnyi klaster kak osnova modernizatsii regional’noi sistemy obrazovaniya, politiki, ekonomiki i biznesa [Research and innovation cluster as a basis for modernization of regional system of education, politics, economics and business]. Alma mater, no 6, pp. 15–18 (in Russian).
Ekspert-RA (2012) Innovatsionnaya aktivnost’ krupnogo biznesa [Innovation activity of large business]. Available at: http://www.raexpert.ru/researches/expert-inno/partl/, accessed 18.03.2015 (in Russian).
Etzkowitz G. (2008) Triple Helix. University–Industry–Government. Innovation in Action, New York, London: Routledge.
Freeman C. (2011) Technology Policy and Economic Performance: Lessons from Japan, London: Pinter. Gibson D., Butler J. (2013) Issledovatel’skie universitety v strukture regional’noi innovatsionnoi sistemy: opyt Ostina,
shtat Tekhas [Research Universities in the Framework of Regional Innovation Ecosystem: The Case of Austin, Texas]. Foresight-Russia, vol. 7, no 2, pp. 42–57 (in Russian).
Golichenko O.G., Balycheva Yu.E. (2012) Tipichnye modeli innovatsionnogo povedeniya predpriyatii [Typical models of innovation behavior of enterprises]. Innovatsii [Innovations], no 2, pp. 19–28 (in Russian).
Government of the Russian Federation (2014) Ezhegodnyi monitoring sredstv, vydelennykh iz federal’nogo byudzheta na finansirovanie NIOKR [Annual monitoring of R&D funding allocated from the federal budget], Moscow: Analytical Center for the Government of the Russian Federation (in Russian).
Ivanov D.S., Kuzyk M.G., Simachev Yu.V. (2012) Stimulirovanie innovatsionnoi deyatel’nosti rossiiskikh proizvodstvennykh kompanii: vozmozhnosti i ogranicheniya [Fostering Innovation Performance of Russian Manufacturing Enterprises: New Opportunities and Limitations]. Foresight-Russia, vol. 6, no 2, pp. 18–42 (in Russian).
Jones C. (1998) Introduction to Economic Growth, New York: W.W. Norton & Company. Kleiner G.B., Mishurov S.S. (eds.) (2011) Innovatsionnoe razvitie regiona: potentsial, instituty, mekhanizmy [The
innovative development of the region: The capacity, institutions, mechanisms], Ivanovo: Ivanovo State University (in Russian).
Kumbhakar S., Lovell K. (2004) Stochastic Frontier Analysis, Cambridge: Cambridge University Publishers. Lapaev S.P. (2012) Metodologicheskie osnovy innovatsionnogo razvitiya regiona [Methodological bases of innovative
development of the region], Orenburg: OOO NPK «Universitet» (in Russian). Makarov V.L. (2009) Obzor matematicheskikh modelei ekonomiki s innovatsiyami [Review of mathematical models
of economy with the innovations]. Ekonomika i matematicheskie metody [Economics and Mathematical Methods], no 1, pp. 3–14 (in Russian).
Makarov V.L. (ed.) (2010) Gorizonty innovatsionnoi ekonomiki v Rossii. Pravo, instituty, modeli [Horizons of economics of innovation in Russia. Law, institutes, models], Moscow: LENAD (in Russian).
Makarov V.L., Aivazyan S.A., Afanasyev M.Yu., Bakhtizin A.R., Nanavyan A.M. (2014) Otsenka effektivnosti regionov RF s uchetom intellektual’nogo kapitala, kharakteristik gotovnosti k innovatsiyam, urovnya blagosostoyaniya i kachestva zhizni naseleniya [Evaluating the efficiency of the Russian regions in view of intellectual capital, readiness for innovation, well-being and quality of life]. Ekonomika regiona [Regional Economics], no 4, pp. 9–30 (in Russian).
Makarov V.L., Bakhtizin A.R., Bakhtizina N.V. (2009) Vychislimaya model’ ekonomiki znanii [Calculable model of knowledge economy]. Ekonomika i matematicheskie metody [Economics and Mathematical Methods], no 1, pp. 70–83 (in Russian).
Makarov V.L., Bakhtizin A.R., Sulakshin S.S. (2007) Primenenie vychislimykh modelei v gosudarstvennom upravlenii [The use of calculable models in public administration], Moscow: Nauchnyi ekspert (in Russian).
Makoveyeva V.V. (2012) Setevoe vzaimodeistvie — klyuchevoi faktor razvtiya integratsii obrazovaniya, nauki i biznesa [Network interaction: The key factor of education, science and business integration]. Vestnik Tomskogo gosudarstvennogo universiteta [Tomsk State University Journal], no 354, pp. 163–166 (in Russian).
MED, RVC (2015) Natsional’nyi doklad ob innovatsiyakh v Rossii [National Report on Innovations in Russia], Moscow: Ministry of Economic Development, Russian Venture Company (in Russian).
Mikheeva N.N. (2014) Sravnitel’nyi analiz innovatsionnykh sistem rossiiskikh regionov [Comparative Analysis of Innovative Systems in the Russian Regions]. Prostranstvennaya ekonomika [Spatial Economics], no 4, pp. 61–81 (in Russian).
OECD (2010) Science Technology and Industry Outlook, Paris: OECD. OECD (2014) Education at a glance. Country note: The Russian Federation, Paris: OECD. Polterovich V.M. (2010) Strategiya modernizatsii rossiiskoi ekonomiki [Strategy of modernization of the Russian
economy], Moscow: Aleteiya (in Russian).

2016 Vol. 10 No 3 FORESIGHT AND STI GOVERNANCE 91
Romanenko K.R., Kozlov D.V., Leshukov O.V., Lisyutkin M.A., Platonova D.P., Semenov D.S. (2015) Uroki mezhdunarodnogo opyta sliyanii universitetov [Lessons from International Experience of Merging Universities]. Seriya «Sovremennaya analitika obrazovaniya» [Modern Education Analytics Series], Issue 2, Moscow: HSE, pp. 1–24 (in Russian).
Romer P. (1990) Endogenous Technological Change. Journal of Political Economy, vol. 985, no 2, pp. 71–102.Rosstat (2013a) Innovatsionnaya aktivnost’ organizatsii: Regiony Rossii. Cotsial’no-ekonomicheskie pokazateli
[Innovation performance of organizations: The regions of Russia. Socio-economic indicators]. Available at: http://www.gks.ru/bgd/regl/b12_14p/IssWWW.exe/Stg/d03/22-15.htm, accessed 24.01.2015 (in Russian).
Rosstat (2013b) Organizatsii, vypolnyayushchie nauchnye issledovaniya. Regiony Rossii. Cotsial’no-ekonomicheskie pokazateli [Research performing organizations. Regions of Russia. Socio-economic indicators]. Available at: http://www.gks.ru/bgd/regl/b12_14p/IssWWW.exe/Stg/d03/22-15.htm, accessed 08.06.2015 (in Russian).
Rosstat (2013c) Razrabotannye novye tekhnologii. Regiony Rossii. Cotsial’no-ekonomicheskie pokazateli [New developed technologies. Regions of Russia. Socio-economic indicators]. Available at: http://www.gks.ru/bgd/regl/b14_14p/IssWWW.exe/Stg/d03/21-13, accessed 08.06.2015 (in Russian).
Rosstat (2013d) Chislo predpriyatii regiona. Regiony Rossii. Cotsial’no-ekonomicheskie pokazateli [The number of enterprises in the region. Regions of Russia. Socio-economic indicators]. Available at: http://www.gks.ru/bgd/regl/b14_14p/IssWWW.exe/Stg/d02/12-01.htm, data obrashcheniya 08.06.2015 (in Russian).
Rosstat (2015) Vnutrennie zatraty na issledovaniya i razrabotki [Gross domestic expenditure on research and development]. Rossiya v tsifrakh [Russia in Figures], Moscow: Federal State Statistics Service. Available at: http://www.gks.ru/wps/wcm/connect/rosstat_main/rosstat/ru/statistics/publications/catalog/doc_1135075100641, accessed 24.02.2016 (in Russian).
Rumyantsev A.A. (2013) Osnovnye svoistva i problemnye polya nauchno-innovatsionnogo prostranstva regiona [Basic Properties and Problem Fields of Scientific-Innovation Space of the Region]. Prostranstvennaya ekonomika [Spatial Economics], no 2, pp. 103–118 (in Russian).
RVC (2013) Otkrytyi ekspertno-analiticheskii otchet o khode realizatsii «Strategii innovatsionnogo razvitiya Rossiiskoi Federatsii na period do 2020 goda» [Outdoor expert and analytical report on the implementation of the “Russian Federation Innovative Development Strategy for the period up to 2020”], Moscow: Russian Venture Company.
Shchepina I.N. (2011) Ustoichivost’ innovatsionnogo povedeniya rossiiskikh regionov [Stability of innovative behavior of Russian regions]. Innovatsii [Innovations], no 6 (152), pp. 78–84 (in Russian).
Simachev Yu.V. (2012) Partnerstvo biznesa i nauki v innovatsionnoi sfere [Science-industry cooperation in the innovation sphere]. Atomnaya strategiya XXI veka [Nuclear Strategy of the XXI century], no 6, pp. 8–10 (in Russian).
Solow R.M. (1956) A Contribution to the Theory of Economic Growth. Quarterly Journal of Economics, no 70, pp. 65–94.
Varshavsky A.E. (1984) Nauchno-tekhnicheskii progress v modelyakh ekonomicheskogo razvitiya [Scientific and technical progress in the models of economic development], Moscow: Finansy i statistika [Finance and Statistics] (in Russian).
Varshavsky A.E. (2003) Razvitie ekonomiki znanii i neobkhodimost’ obespecheniya preemstvennosti v ekonomicheskoi nauke Rossii [The development of the knowledge economy and the need to ensure continuity in economic science in Russia]. Prognozirovanie tempov i faktorov ekonomicheskogo rosta [Predicting the pace and drivers of economic growth] (compiled by A.V. Suvorov), Moscow: MAKS Press, pp. 222–285 (in Russian).
Varshavsky A.E. (2016) O Natsional’nom doklade ob innovatsiyakh v Rossii 2015 [On National Report on Innovations in Russia 2015]. Innovatsii [Innovations], no 2, pp. 8–14 (in Russian).
World Bank (2013) High-technology exports (% of manufactured exports). Available at: http://data.worldbank.org/indicator/TX.VAL.TECH.MF.ZS, accessed 08.06.2015.
Makarov V., Ayvazyan S., Afanasyev M., Bakhtizin A., Nanavyan A., pp. 76–90