And Others TITLE Fitting New Measurement Models to GRE ...
59
DOCUMENT RESUME ED 386 474 TH 024 028 AUTHOR Bennett, Randy Elliot; And Others TITLE Fitting New Measurement Models to GRE General Test Constructed-Response Item Data. GRE Board Professional Report No. 89-11P. INSTITUTION Educational Testing Service, Princeton, NJ. Graduate Record Examination Board Program. SPONS AGENCY Graduate Record Examinations Board, Princeton, N.J. REPORT NO ETS-RR-91-60 PUB DATE Dec 91 NOTE 59p. PUB TYPE Reports Evaluative/Feasibility (142) EDRS PRICE MF01/PC03 Plus Postage. DESCRIPTORS Algebra; College Entrance Examinations; *College Students; *Constructed Response; Error Patterns; *Goodness of Fit; Higher Education; *Item Response Theory; *Measurement Techniques; Models; Scoring; Test Construction; Word Problems (Mathematics) IDENTIFIERS *Graduate Record Examinations; *Partial Credit Model ABSTRACT This exploratory study applied two new cognitively sensitive measurement models to constructed-response quantitative data. The models, intended to produce qualitative characteristics of examinee performance, were fitted to algebra word problem solutions produced by 285 examinees taking the Graduate Record Examinations (GRE) General Test. The two types of response data modeled, error diagnoses and partial-credit scores, were produced by an expert system. Error diagnosis, analyzed using K. Yamamoto's (1989) Hybrid model, detected a class of examinees who tended to miss important pieces of the problem solution, but made relOtively few errors of other types. Comparisons with matched examinees whose response patterns were better captured by the unidimensional item response theory model suggested subtle differences in error frequency rather than sharp qualitative distinctions. In contrast with the error data, partial-credit scores modeled using D. A. Rock's Hierarchically Ordered Skills Test (Rock and J. Pollack, 1987) procedure did not fit well, in part owing to limitations of the task theory being tested. Implications for the development of refined task and error theories, improvements to expert-system scoring procedures, and response modeling are discussed. Three figures and 11 tables present analysis results. Four appendixes present items, the scoring rubric, and information about bugs. (Contains 36 references.) (Author/SLD) *********************************************************************** Reproductions supplied by EDRS are the best that can be made from the original document. ***********************************************************************
-
Upload
khangminh22 -
Category
Documents
-
view
1 -
download
0
Transcript of And Others TITLE Fitting New Measurement Models to GRE ...

DOCUMENT RESUME
ED 386 474 TH 024 028
AUTHOR Bennett, Randy Elliot; And OthersTITLE Fitting New Measurement Models to GRE General Test
Constructed-Response Item Data. GRE BoardProfessional Report No. 89-11P.
INSTITUTION Educational Testing Service, Princeton, NJ. GraduateRecord Examination Board Program.
SPONS AGENCY Graduate Record Examinations Board, Princeton,N.J.
REPORT NO ETS-RR-91-60PUB DATE Dec 91NOTE 59p.
PUB TYPE Reports Evaluative/Feasibility (142)
EDRS PRICE MF01/PC03 Plus Postage.DESCRIPTORS Algebra; College Entrance Examinations; *College
Students; *Constructed Response; Error Patterns;*Goodness of Fit; Higher Education; *Item ResponseTheory; *Measurement Techniques; Models; Scoring;Test Construction; Word Problems (Mathematics)
IDENTIFIERS *Graduate Record Examinations; *Partial CreditModel
ABSTRACTThis exploratory study applied two new cognitively
sensitive measurement models to constructed-response quantitativedata. The models, intended to produce qualitative characteristics ofexaminee performance, were fitted to algebra word problem solutionsproduced by 285 examinees taking the Graduate Record Examinations(GRE) General Test. The two types of response data modeled, errordiagnoses and partial-credit scores, were produced by an expertsystem. Error diagnosis, analyzed using K. Yamamoto's (1989) Hybridmodel, detected a class of examinees who tended to miss importantpieces of the problem solution, but made relOtively few errors ofother types. Comparisons with matched examinees whose responsepatterns were better captured by the unidimensional item responsetheory model suggested subtle differences in error frequency ratherthan sharp qualitative distinctions. In contrast with the error data,partial-credit scores modeled using D. A. Rock's HierarchicallyOrdered Skills Test (Rock and J. Pollack, 1987) procedure did not fitwell, in part owing to limitations of the task theory being tested.Implications for the development of refined task and error theories,improvements to expert-system scoring procedures, and responsemodeling are discussed. Three figures and 11 tables present analysisresults. Four appendixes present items, the scoring rubric, andinformation about bugs. (Contains 36 references.) (Author/SLD)
***********************************************************************
Reproductions supplied by EDRS are the best that can be madefrom the original document.
***********************************************************************

I 11
U S DEPARTMENT OF EDUCATIONOnice ot Educational Research ano Improvement
EOUCA TIONAL RESOURCES INFORMATIONCENTER (ERIC)
This document has been reproduced(Mewed trom the person or OrpanuabonOrro.nstmo .1
0 Knor changes have been made to Improvereproducbon oughts
Pointlol wearer oprnions stated in this docu-ment dO nOt necessarily represent otlicralOE RI position or policy
0
E S EAR C
a a a
a
I 111 a
II I f
to
I
BEST COPY AVAILABLE
I. s
E S
e
a
'PERMISSION TO REPRODUCE THISMATERIAL HAS BEEN GRANTED BY
I Eg ,9 it)
TO THE EDUCATIONAL RESOURCESINFORMATION CENTER (ERIC)

Fitting New Measurement Models to GRE General TestConstructed-Response Item Data
Randy Elliot BennettMarc M. Sebrechts
andKentaro Yamamoto
GRE Board Report No. 89-11P
December 1991
This report presents the findings of aresearch project funded by and :arriedout under the auspices of the GraduateRecord Examinations Board.
Educational Testing Service, Princeton, N.J. 08541

The Graduate Record Examinations Board and Educational Testing Service arededicated to the principle of equal opportunity, and their programs,
services, and employment policies are guided by that principle.
Graduate Record Examinations and Educational Testing Service are U.S.registered trademarks of Educational Testing Service; GRE, ETS,
and the ETS logo design are registered in the U.S.A. and inmany other countries.
Copyright * 1991 by Educational Testing Service. All rights reserved.
'1

Abstract
This exploratory study applied two new cog-itively sensitive measurementmodels to constructed-response quantitative 'qta. The models, intended toproduce qualitative characterizations of examinee performance, were fitted toalgebra word problem solutions produced by examinees taking the GRE GeneralTest. Two types of response data were modeled--error diagnoses and partial-credit scores--both produced by an expert system. Error diagnoses, analyzedusing Yamamoto's (1989a) Hybrid model, detected a class of examinees whotended to miss important pieces of the problem solution but made relativelyfew errors of other types. Group members were of low quantitative proficiencyoverall, though considerable variability was evident. Comparisons withmatched examinees whose response paterns were better captured by theunidimensional IRT model suggested subtle differences in error frequencyrather than sharp qualitative distinctions. In contrast with the error data,partial-credit scores modeled using Rock's (Rock & Pollack, 1987) HOSTprocedure did not fit well, in part owing to limitations of the task theorybeing tested. Implications for the development of refined task and errortheories, improvements to expert-system scoring procedures, and responsemodeling are discussed.

Among other things, multiple-choice tests have been criticized for beingcomprised of seemingly artificial tasks that offer little instructionallyrelevant information (Fiske, 1990; Guthrie, 1984). A conception intended tomove standardized testing programs toward greater task fidelity andinstructional utility is "intelligent assessment' (Bennett, in press). Thisconception attempts to integrate research on complex constructed-responseitems, artificial intelligence, and cognitively driven measurement models. Acomplex constructed-response denotes a task whose solutions are composed ofmany elements, take a variety of correct forms, and, when erroneous,approximate accurate answers to different degrees; these tasks (e.g., writingthe steps associated with solving an algebra problem) come closer to the onestypically encountered in academic and work settings. Artificial intelligenceis invoked as a practical means of analyzing solutions, producing bothpartial-credit scores and qualitative analyses. Finally, the drivingmechanisms underlying the tasks and their scoring are cognitively groundedmeasurement models that may dictate what the characteristics of items shouldbe, which items from a large pool should be administered, how item responsesshould be combined to make more general inferences, and how uncertainty shouldbe handled.
Considerable progress has been made toward realizing this integration.Progress has occurred primarily in applying methods derived from intelligenttutoring (Wenger, 1987) to analyzing solutions to constructed-responsequestions. These methods have been implemented in the context of two testingprograms, the College Board's Advanced Placement Computer Science (APCS)examination and the Graduate Record Examinations (GRE) General Test. Themethods take the form of several expert systems--that is, computer programsintended to emulate the analytic behaviors of a content expert. The systems,PROUST, MicroPROUST, and GIDE, are described in detail elsewhere (Johnson,1986; Johnson & Soloway, 1985; Sebrechts, LaClaire, Schooler, & Soloway,1986).
A variety of item formats have been explored. In computer science,these formats call for the examinee to write a short procedure or to correct afaulty one. Scoring accuracy has been moderate to high, with correlationsbetween machine and human ratings ranging from the .70s to .90s, thoughtypically some solutions cannot be scored (Bennett, Gong, Kershaw, Rock,Soloway, & Macalalad, 1990; Braun, Bennett, Frye, & Soloway, 1990). .
For algebra word problems, four constructed-response formats have beenprobed; open-ended, which presents the examinee with only the problem stem;goal specification, including the problem stem, a list of givens, and a listof unknowns; equation setup, which gives the unknowns and the equations neededto derive them; and faulty solution, comprised of the problem stem and anincorrect solution for the examinee to correct. In contrast to computerscience, all responses to these problems could be machine scored, in partbecause the hierarchical nature of algebra solutions permits the integrity ofprevious solution steps to be inferred from subsequent ones (Sebrechts,Bennett, & Rock, 1991). Agreement between machine and human content experts'scores was reasonably high, with a median correlation across 12 problems of.88.

-2-
Preliminary evidence relevant to the construct meaning of machine scoresfor several of the formats has also been gathered. The computer sciencefaulty solution format appears to measure the same construct as the APCS test(Bennett, ROCK, Braun, Frye, Spohrer, & Soloway, 1990), which is composed ofboth multiple-choice and open-ended programming tasks. In algebra, theconstructed-response scores appear to measure a dimension highly related to--but somewhat different from--that underlying the quantitative section oftheGRE General Test. The difference in the two dimensions may be due in part tothe broader range of content and difficulty covered by the latter measure(Bennett, Sebrechts, & Rock, in press).
The effort devoted to developing and evaluating item formats andanalytic programs has necessarily preceded application of measurement modelsto scoring and diagnosis, which has focused on item-level performance.Aggregating an examinee's responses across items, however, is necessary ifdiagnoses are to characterize examinee performance at a meaningfu1 level(e.g., be indicative of stable errors or of particular skill dericiencies).
Measurement models for guiding such aggregations have only recentlybecome available (e.g., Falmagne, 1989; Masters & Mislevy, in press; M.Wilson, 1989). Such models should be cognitively driven; that is, they shouldderive their structure in considerable part from domain characteristics.Further, a model should have a principled mechanism for handling uncertainty,or noise in the data, resulting from the sometimes irrelevant influences thathelp determine observed performance. By formalizing relationships among thedomain, observed performance, and the characterizations to be inferred fromthat performance, measurement models should provide more efficient andpsychologically meaningful statements than ad hoc approaches.
This study was undertaken to investigate the fit of two recentlydeveloped measurement models--Hybrid (Yamamoto, 1989a) and HOST(Hierarchically Ordered Skills Test) (Rock & Pollack, 1987)--to constructed-response data collected through the Graduate Record Examinations program and,secondarily, to explore theoretical notions about the cognitive structuresassociated with solving algebra word problems. In combination with complexconstructed-response items and intelligent analysis methods, cognitivelysensitive measurement models may eventually offer a foundation for powerful,interactive diagnostic assessment systems.
Method
Subjects
Subjects were participants in a series of studies concerned withautomated scoring of constructed-response algebra word problems. The samplewas composed of 285 volunteers drawn from a pool of more than 50,000 examineestaking a single form of the GRE General Test administered nationally in June1989. (See Sebrechts, Bennett, & Rock, 1991, for details of sampleselection.) The sample differed somewhat from the General Test populationalong several dimensions. For example, the sample's General Test performancewas significantly, though not dramatically, higher (by .4, .3, and .3 standarddeviations, for verbal, quantitative, and analytical, respectively), and themost notable of several statistically significant demographic differences wasin a greater proportion of non-Whites (see Table 1).

-3-
Table 1
Background Data for Study Sample
Jure 1989 StudyVariable Population Sample
General Test PerformanceVerbal Mean(SD)Quantitative Mean (SD)Analytical Mean (SD)
50,548
476(122)532(140)513(132)
285
527(132)*573(141)*558(129)*
Percentage female 55% 60%
Percentage non-Whitea 16% 24%*Percentage U.S. citizens 79% 85%*Undergraduate MajorBusiness 4% 2%*Education 14% 6%*Engineering 13% 12%
Humanities/Arts 14% 21%*Life Sciences 18% 18%Physical Sciences 10% 9%Social Sciences 18% 24%*Other 9% 10%
Intended GraduateMajorBusiness 2% 2%
Education 18% 12%*Engineering 10% 9%
Humanities/Arts 8% 9%Life Sciences 16% 15%Physical Sciences 8% 9%Social Sciences 13% 19%*Other 11% 9%Undqcided 15% 18%
aU.S. citizens only.*p < .05
-4-
Instruments
Constructed-response items were adapted from standard, five-optionmultiple-choice algebra word problems taken from disclosed forms of theGeneral Test quantitative section administered between 1980 and 1988. Threeprototype items--one from each of the rate x time, interest, and work sets--were selected and three "isomorphs" were written for each prototype.Isomorphs were intended to differ from the prototype in surfacecharacteristics only, for example, in topic (filling a tank vs. sendingcharacters to a printer, determining percent profit instead of simpleinterest), and linguistic form, but not in underlying processes used to reacha solution.
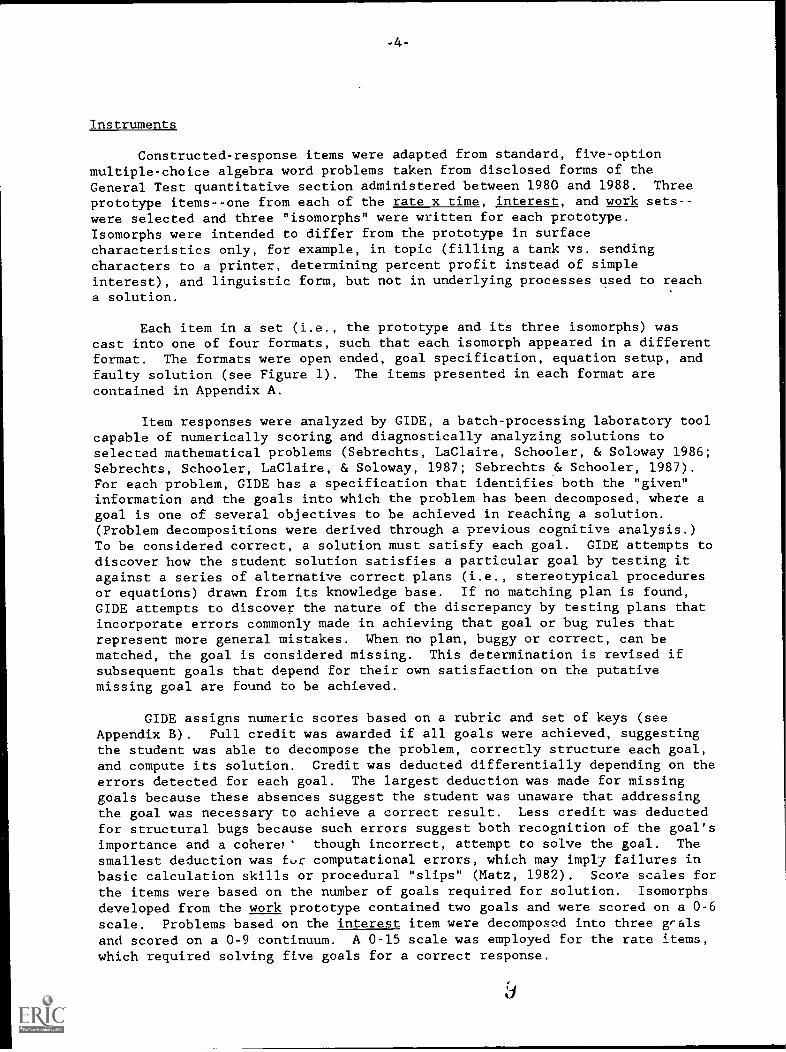
Each item in a set (i.e., the prototype and its three isomorphs) wascast into one of four formats, such that each isomorph appeared in a differentformat. The formats were open ended, goal specification, equation setup, andfaulty solution (see Figure 1). The items presented in each format arecontained in Appendix A.
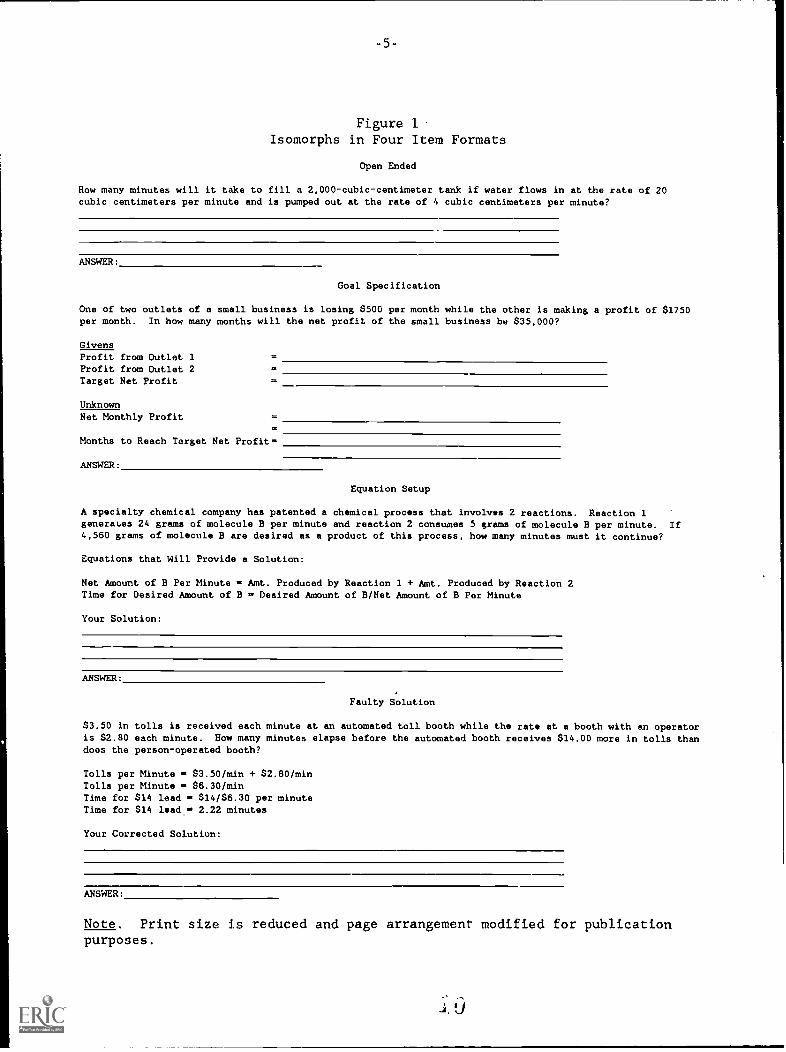
Item responses were analyzed by GIDE, a batch-processing laboratory toolcapable of numerically scoring and diagnostically analyzing solutions toselected mathematical problems (Sebrechts, LaClaire, Schooler, & Soloway 1986;Sebrechts, Schooler, LaClaire, & Soloway, 1987; Sebrechts & Schooler, 1987).For each problem, GIDE has a specification that identifies both the "given"information and the goals into which the problem has been decomposed, where agoal is one of several objectives to be achieved in reaching a solution.(Problem decompositions were derived through a previous cognitive analysis.)To be considered correct, a solution must satisfy each goal. GIDE attempts todiscover how the student solution satisfies a particular goal by testing itagainst a series of alternative correct plans (i.e., stereotypical proceduresor equations) drawn from its knowledge base. If no matching plan is found,GIDE attempts to discover the nature of the discrepancy by testing plans thatincorporate errors commonly made in achieving that goal or bug rules thatrepresent more general mistakes. When no plan, buggy or correct, can bematched, the goal is considered missing. This determination is revised ifsubsequent goals that depend for their own satisfaction on the putativemissing goal are found to be achieved.
GIDE assigns numeric scores based on a rubric and set of keys (seeAppendix B). Full credit was awarded if all goals were achieved, suggestingthe student was able to decompose the problem, correctly structure each goal,and compute its solution. Credit was deducted differentially depending on theerrors detected for each goal. The largest deduction was made for missinggoals because these absences suggest the student was unaware that addressingthe goal was necessary to achieve a correct result. Less credit was deductedfor structural bugs because such errors suggest both recognition of the goal'simportance and a cohere? though incorrect, attempt to solve the goal. Thesmallest deduction was fvr computational errors, which may imply failures inbasic calculation skills or procedural "slips" (Matz, 1982). Score scales forthe items were based on the number of goals required for solution. Isomorphsdeveloped from the work prototype contained two goals and were scored on a 0-6
scale. Problems based on the interest item were decomposed into three gralsand scored on a 0-9 continuum. A 0-15 scale was employed for the rate items,which required solving five goals for a correct response.
-5-
Figure 1Isomorphs in Four Item Formats
Open Ended
How many minutes will it take to fill a 2,000-cubic-centimeter tank if water flows in at the rate of 20cubic centimeters per minute and is pumped out at the rate of 4 cubic centimeters per minute?
ANSWER:
Goal Specification
One of two outlets of a small business is losing $500 per month while the other is making a profit of $1750per month. In how many months will the net profit of the small business be $35,000?
GivensProfit from Outlet 1Profit from Outlet 2Target Net Profit
UnknownNet Monthly Profit
Months to Reach Target Net Profit=
ANSWER:
Equation Setup
A specialty chemical company has patented a chemical process that involves 2 reactions. Reaction 1generaLes 24 grams of molecule B per minute and reaction 2 consumes 5 grams of molecule B per minute. If4,560 grams of molecule B are desired as a product of this process, how many minutes must it continue?
Equations that Will Provide a Solution:
Net Amount of B Per Minute = Amt. Produced by Reaction 1 + Amt. Produced by Reaction 2Time for Desired Amount of B = Desired Amount of B/Net Amount of B Por Minute
Your Solution:
ANSWER:
Faulty Solution
$3.50 in tolls is received each minute at an automated toll booth while the rate at a booth with an operatoris $2.80 each minute. Bow many minutes elapse before the automated booth receives $14.00 more in tolls thandoes the person-operated booth?
Tolls per Minute = $3.50/min + $2.80/minTolls per Minute $6.30/minTime for $14 lead = $14/$6.30 per minuteTime for $14 lead = 2.22 minutes
Your Corrected Solution:
ANSWER :
Note. Print size is reduced and page arrangement modified for publicationpurposes.
U

-6-
Data Collection
Items were presented in paper-and-pencil format in individual and small
group sessions. Examin3es were asked to complete the problems at their own
pace, though a one-hour period was suggested. Handwritten responses weretyped to machine-readable form according to transcription rules (seeSebrechts, Bennett, & Rock, 1991) and the resulting 3,420 transcripts (12items x 285 examinees) scored by GIDE. GIDE's scores for a subsample ofexaminees were then compared with those given by content experts to theoriginal hand-written responses (Sebrechts, Bennett, & Rock, 1991). For the12 items, correlations between GIDE and the mean of the humans' scores rangedfrom .74 to .97 with a median of .88.
Hybrid Model Description, Analyses, and Results
General Description
Yamamoto's Hybrid approach combines latent class models and itemresponse theory (IRT) (Lord, 1980), with the former intended to capture suchcognitive components as error tendencies, problem-solving strategies, mentalmodels, and levels of operation.
Latent class models are built on the idea of a categorical or nominallatent variable (Lazarsfeld, 1960). There are two major assumptions in suchmodels: (1) the classes (e.g., types of misconception, tendency toward aparticular error) are mutually exclusive and together exhaustive7-that is,each examinee belongs to one and only one class, and (2) responses areconditionally independent given the class of the responder. In applicationssimilar to that reported here, a unique, idealized response pattern isassociated with each latent class. Subjects who belong to the latent classshould give responses similar to the idealized pattern. The imperfect fit ofa subject's responses to that ideal pattern is characterized by a vector ofconditional probabilities that suggests the likelihood with which the subjectmight be considered a member of one or another of the latent classes.
In practice, there will be individuals whose performance is not wellcaptured by a limited set of classes. This eventuality may be o'qed to theexistence of more classes than are represented in the model, or to respondingin an inconsistent fashion, for example, making particular errors on someitems but not on others where their occurrence would be expected. Performancethat does not fit one of the hypothesized latent classes may be characterizedmore appropriately by the IRT model, which makes no strong assumptions aboutthe qualitative understandings that examinees have. The Hybrid model accountsfor these individuals by scaling them along a general dimension underlyingperformance on the problem set, while simultaneously providing diagnosticinformation for those examinees who fit a latent class.
There are three sets of parameters for the Hybrid model: (1) IRTparameters (item parameters for each item and an ability parameter for eachexaminee), (2) mixture proportions of IRT and latent classes for thepopulation as a whole, and (3) a set of conditional probabilities for each ofthe latent classes. These parameters are estimated using the marginal maximumlikelihood method (Bock & Aitkin, 1981; Mislevy, 1983).
11
-7-
At present, the fit of the Hybrid model cannot be precisely tested usingstatistical methods. For comparing the fit of two nested models--such as theIRT-only model versus IRT-with-latent-classes--the improvement of the log-likelihood ratio relative to the number of degrees of freedom expended can beexamined using the chi-square statistic (if the number of subjects is largeand the number of items is small). Additionally, the Akaike InformationCriterion (AIC)--a parsimonious fit index--can be employed. When thecompeting models are not nested, a clear-cut statistical index is notavailable and greater weight must be placed on subjective judgments of thereasonableness of model parameters.
The performance of the Hybrid model has been assessed using data onelectronic technicians' ability to interpret logic gate symbols (Gitomer &Yamamoto, 1991). Five latent classes were represented based on specificerrors commonly made by technicians. The model's latent class portion wasable to capture 25% of the response patterns, a respectable performance giventhe specificity of the error classes. In addition, for individuals picked upby the latent classes, the distinction among error classes given particularresponse patterns was quite sharp, making class assignments very clear.Finally, the probability of belonging to any latent class was unrelated tooverall ability estimates, supporting the model's capacity to representqualitative states.
Data Analyses
Hypothesized model. The cognitive structures modeled were major errorclasses evidenced by examinees in problem solving. Major error classes,rather than specific bug types, were modeled because research has suggestedthat the former may be stable whereas the latter generally are not (Payne &Squib, 1990; Tatsuoka, Birenbaum, & Arnold, 1989; VanLehn, 1982). Theanalyses were intended to explore whether groups of examinees could bedistinguished based on these classes.
Major error classes were defined with reference to a general theory ofproblem solving propounded by Newell and Simon (1972), and applied todiagnosis by Johnson and Soloway (Johnson, 1986; Johnson & Soloway, 1985).The theory posits that problems can be decomposed into goals and each goalsolved with a stereotypical m...thod or plan. Errors are conceptualized asdeviations from these goal-plan structures and can occur in failing to addressa goal, in posing an incorrect plan, or in carrying out low-level operationsas part of a plan.
This theoretical perspective suggests four major error classes withinthe algebra word problem domain. Mathematical errors involve a failure toexecute a low-level operation (e.g., by inappropriately shifting a decimal, byincorrectly treating the remainder of a division as a decimal). Specific planerrors are inappropriate procedures for solving a goal linked to a particularproblem class (e.g., confusing the rates for different trip segments).General plan errors suggest more universal failures to formulate procedures,with the same malformation having the potential to occur across problemcontexts (e.g., dividing when multiplication is called for). Finally, missinagoals, as noted, suggest the omission of a critical solution component. The
specific errors composing each cla.- werl identified through a detailedcognitive analysis of GRE quantitative algebra problems (see Sebrechts,
1 2

-8-
Bennett, & nook, 1991). Descriptions of the specific errors appear inAppendix C.1
Preliminary analyses. Preliminary analyses were conducted to describebug occurrence and to suggest what latent classes might be represented in thedata. The latter purpose was accomplished by estimating the relations withinand among the four major bug categories across items, thereby indicating theextent to which examineez tended to repeat bugs from a category or to makeerrors from one category in conjunction with those of another. For each ofthe 12 items, each examinee was assigned four 0/1 scores, where 0 indicatedthe absence of a bug of a given class and 1 indicated the presence of one ormore bugs from that class. This produced 44 scores per examinee (12 items x 4bug'categories minus the specific plan category for the two-goal work items,on which these errors were not observed). The 44 x 44 tetrachoric correlationmatrix among these scores was then calculated and factor analyzed usingTestfact (D. T. Wilson, Wood, & Gibbons, 1987). Loadings were computed viathe marginal maximum likelihood estimation method with promax rotation.Omitted items were treated as indicat.ing missing goals and not-reached itemswere ignored.
Model-fitting analyses. Using the HYBIL program (Yamamoto, 1989b), twomodels were fitted to the 44-score examinee vectors: (1) a two-parameterlogistic IRT-only model in which examinees were arrayed along a scale ofpropensity to make errors and (2) a Hybrid model. Several points should benoted about these models. First, the IRT model employed two--rather thanthree--parameters because the probability of guessing correctly forconstructed-response items is extremely low. Second, IRT modelsconventionally array individuals according to the probability of getting itemscorrect. The convention was reversed here because the information of interestrelated to the error(s) committed. Finally, the assumption of conditionalindependence was violated in the limited instance in which all goals weremissing. Such responses, by definition, could contain no other bugs.
The Hybrid model contained several levels of constraint on the latentclass parameters. These were:
1.ak(1-pk),where:
ak ,Tki=1 j class k);
fik p(xj--0 ,Tki-0 I class k);
xi is one of four 0/1 scores on each of 12 items where each 0/1
score indicates the presence or absence of a bug from one of thefour major bug classes; and
Tki is an element from the idealized response pattern, Tk, of a
particular latent class, k, that indicates the response that isexpected given membership in that class.
2.ak7 fik, where ak, Ploxi and Tki are defined as above.
-9-
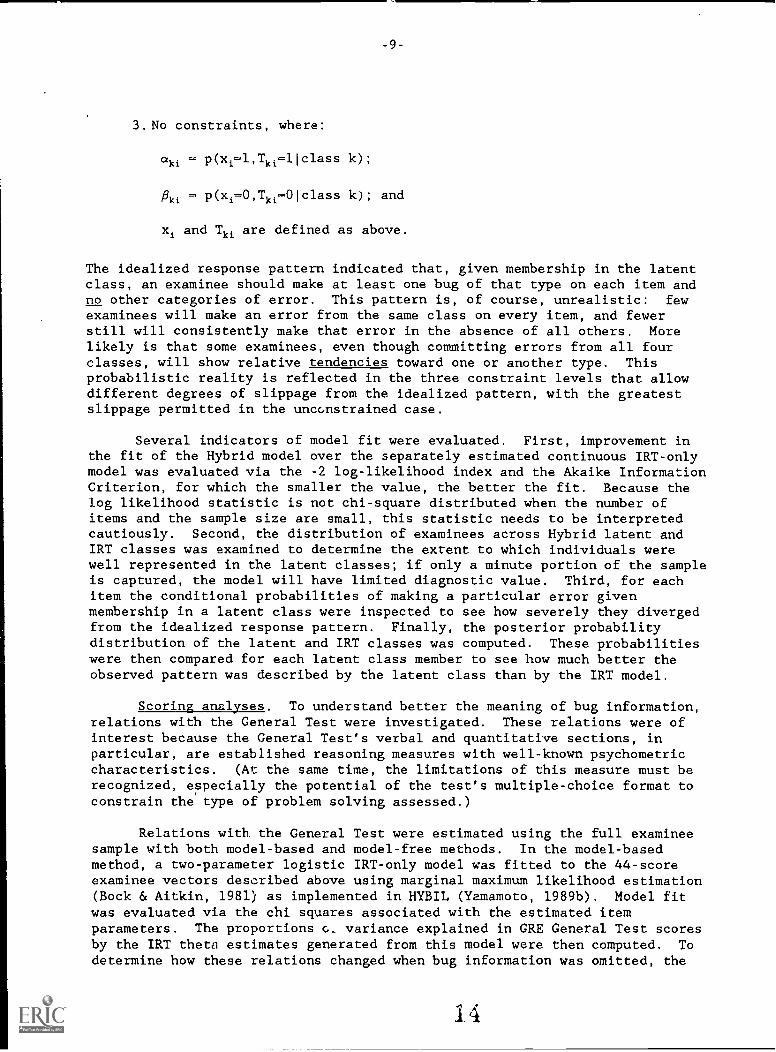
3.No constraints, where:
aki k);
Pki p(xi=0,Tki701Class k); and
x and Tki are defined as above.
The idealized response pattern indicated that, given membership in the latentclass, an examinee should make at least one bug of that type on each item andno other categories of error. This pattern is, of course, unrealistic: fewexaminees will make an error from the same class on every item, and fewerstill will consistently make that error in the absence of all others. Morelikely is that some examinees, even though committing errors from all fourclasses, will show relative tendencies toward one or another type. Thisprobabilistic reality is reflected in the three constraint levels that allowdifferent degrees of slippage from the idealized pattern, with the greatestslippage permitted in the unconstrained case.
Several indicators of model fit were evaluated. First, improvement inthe fit of the Hybrid model over the separately estimated continuous IRT-onlymodel was evaluated via the -2 log-likelihood index and the Akaike InformationCriterion, for which the smaller the value, the better the fit. Because thelog likelihood statistic is not chi-square distributed when the number ofitems and the sample size are small, this statistic needs to be interpretedcautiously. Second, the distribution of examinees across Hybrid latent andIRT classes was examined to determine the extent to which individuals werewell represented in the latent classes; if only a minute portion of the sampleis captured, the model will have limited diagnostic value. Third, for eachitem the conditional probabilities of making a particular error givenmembership in a latent class were inspected to see how severely they divergedfrom the idealized response pattern. Finally, the posterior probabilitydistribution of the latent and IRT classes was computed. These probabilitieswere then compared for each latent class member to see how much better theobserved pattern was described by the latent class than by the IRT model.
Scoring analyses. To understand better the meaning of bug information,relations with the General Test were investigated. These relations were ofinterest because the General Test's verbal and quantitative sections, inparticular, are established reasoning measures with well-known psychometriccharacteristics. (At the same time, the limitations of this measure must berecognized, especially the potential of the test's multiple-choice format toconstrain the type of problem solving assessed.)
Relations with the General Test were estimated using the full examineesample with both model-based and model-free methods. In the model-basedmethod, a two-parameter logistic IRT-only model was fitted to the 44-scoreexaminee vectors described above using marginal maximum likelihood estimation(Bock & Aitkin, 1981) as implemented in HYBIL (Yamamoto, 1989b). Model fitwas evaluated via the chi squares associated with the estimated itemparameters. The proportions 0.. variance explained in GRE General Test scoresby the IRT theta estimates generated from this model were then computed. Todetermine how these relations changed when bug information was omitted, the
1 4

-10-
0/1 scoring commonly employed with multiple-choice questions was simulated byfitting a two-parameter logistic IRT-only model. Scoring for this model wasconventional, with each item graded to indicate the complete absence of bugs(1) or the presence of one or more errors (0). The fit of the model to these12-score examinee vectors was evaluated and the proportions of varianceexplained in General Test scores calculated. For both model-based analyses,omitted items were treated as indicating missing goals, and not-reached itemswere ignored.
The model-free method used least-squares linear multiple regression.GRE General Test scores were regressed separately on the 44-score and 12-itemexaminee vectors. Twenty-five examinees with multiple not-reached items wereexcluded from this analysis.
Data analysis summary. The Hybrid approach was used to model four majorerror classes evidenced by examinees in problem solving: mathematical,specific plan, general plan, and missing goal. Preliminary analyses wereconducted to describe bug occurrence and to suggest which of the potentiallatent classes deriving from the four error types might be represented in thedata. Next, an IRT-only model and a Hybrid model were fit to the examineeresponses, each of which consisted of 44 scores indicating the errors made oneach item. Finally, bug classes were related to General Test scores toinvestigate the meaning of error information.
Results
Preliminary analyses. On average, examinees made relatively few errors.The mean number of bugs per examinee taken across all items was 11, or almost1 per item, with a standard deviation of 8. (The median was 9 and the rangeextended from 0 to 35.) The distribution was essentially unimodal, with themajority of examinees making between 1 and 13 errors. Seven examinees got allitems correct.
Table 2 shows the percentages of subjects evidencing at least one bugfrom a major category for a given item. Because not all examinees finishedthe test, the chances of bug occurrenCe vary across items. Consequently,differences,in bug incidence need to be carefully interpreted. As the tableindicates, the distribution of examinees across the four major categories wasreasonably similar from one isomorph to the next. An obvious exception wasthe "active ingredient" problem, characterized by an unusually high proportionof specific plan rrrors, the overwhelming majority of which turned out to be"percent-as-decimal" bugs--treating .25% as .25. These errors occurred farless frequently for the other isomorphs, in which whole-number percentageswere used (e.g., 5% rather than .25%). (See Appendix D for the incidence ofspecific bugs.)
In most instances, less than a third of examinees made a particularcategory of error on any given item. The exceptions were for the specificplan category on the "active ingredient" problem noted above and for matherrors on the five-goal items. The latter mistakes were owed primarily toproviding an answer that was very close to--but not precisely--correct (e.g.,6.30 for 6.33).

Table 2
Percentages of Examinees Evidencing Major Bug Types by Item
FaultySolution--$3.50 Tolls
Two-Goal Items (Work)Equation GoalSetup--Chemical Co.
Specific.--Small Bus.
Open-Ended--2000cc Tank
Bug Type (n-273) (n=284) (n=277) (n-274)Math 8% 13% 3% 6%
General plan 12% 19% 16% 12%
Specific plan 0% 0% 0% 0%
Missing goal 18% 8% 5% 17%
Three-Goal ItemsEquationSetup--Graphics
FaultySolution-.Active Ingd.
(Percent)GoalSpecific.--Load Cement
Open-Ended--Investment
Bug Type (n-271) (n=283) (n=275) (n=272)Math 4% 4% 4% 8%
General plan 19% 6% 9% 10%
Specific plan 62% 2% 5% 11%
Missing goal 17% 8% 2% 15%
Five-Goal Items (D=RT)
Faulty Equation Goal Open-Solution-- Setup-- Specific.-- Ended--DOT Crew 720 Pages 2400g Tank 600-Mile
Bug Type (n=278) (n=284) (n=283) (n-269)Math 47% 42% 40% 44%General plan 22% 24% 29% 16%Specific plan 11% 24% 31% 15%Missing goal 26% 16% 20% 19%
Note. Percentages are of the number of examinees responding to each item thatis indicated in parentheses.
16

-12-
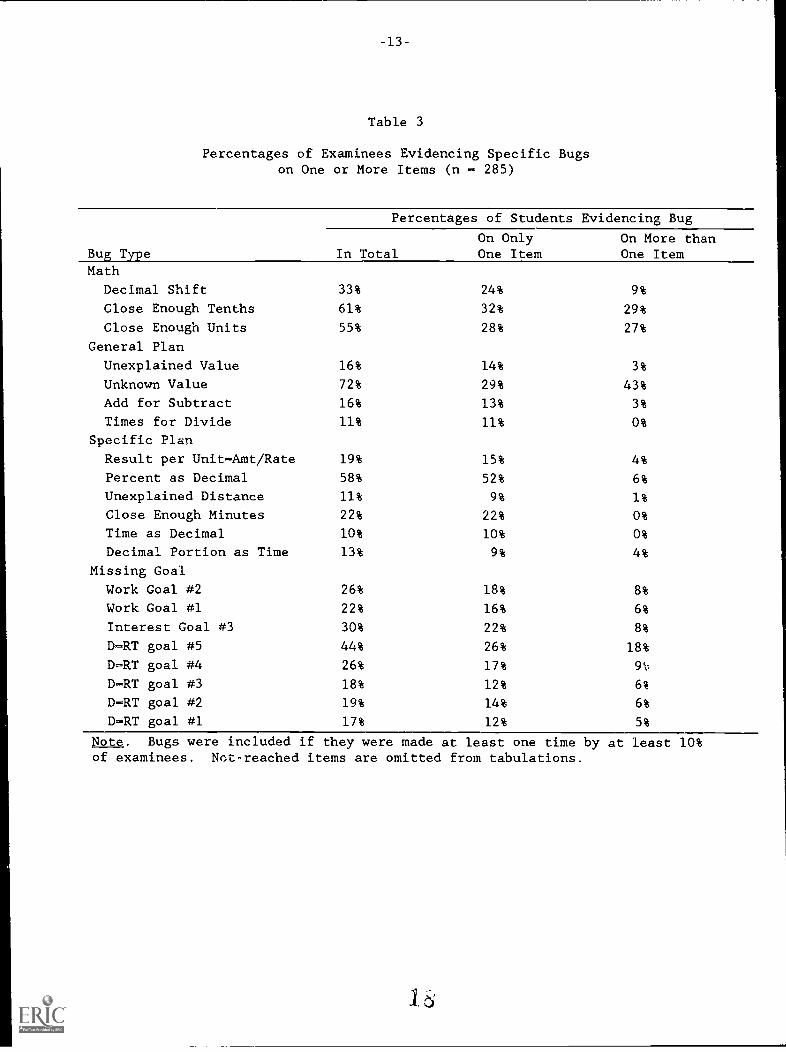
Table 3 shows the percentage of students evidencing specific bugs on oneor more items. (Bugs were included if they were made one time or more by atleast 10% of examinees.) The results are generally consistent with otherfindings on the stability of specific bugs (e.g., Payne & Squibb, 1990). Of
the 21 errors listed, only 4 were made repeatedly by 10% of the sample; 14were made consistently by at least 5%. Of the four most persistent bugs, twowere math errors (decimal and unit precision mistakes made repeatedly by 29%and 27% of examinees, respectively), one was an unexplained-value general-planerror (made by 43% of examinees), and the last was a missing-goal bug(committed by 18% of students). The stability of even these bugs wasrelatively weak, however: less than six percent of the sample made any one ofthem on four or more questions and almost no one showed them on five orgreater items.
The stability of, and relations among, major error classes wereinvestigated via exploratory factor analysis of the 44 x 44 matrix ofcorrelations among the four bug classes. This analysis produced two factorswith eigenvalues of 7.9 and 2.6. (The remaining eigenvalues were less than1.9 and gradually decreased.) On the first factor, missing-goal bugsgenerally had the highest loadings (mean .54, SD .19), and the loadingsfor the other bug categories were considerably smaller (mean .19, SD .26).
Factor two had a reverse pattern: low loadings for missing goals (mean-.03, SD .23) and higher ones for the other bug categories (mean .25, SD
.21). The two factors were correlated at .51.
Model-fitting, analyses. Since the factor analysis suggested thatmissing-goal errors were somewhat independent of other bugs, a Hybrid modelwas fitted that captured examinees either in a single latent class (i.e.,missing goals in the absence of other errors) or with the IRT model. Attemptsto fit Hybrid models with more latent classes increased the number of capturedexaminees only marginally and are not reported.
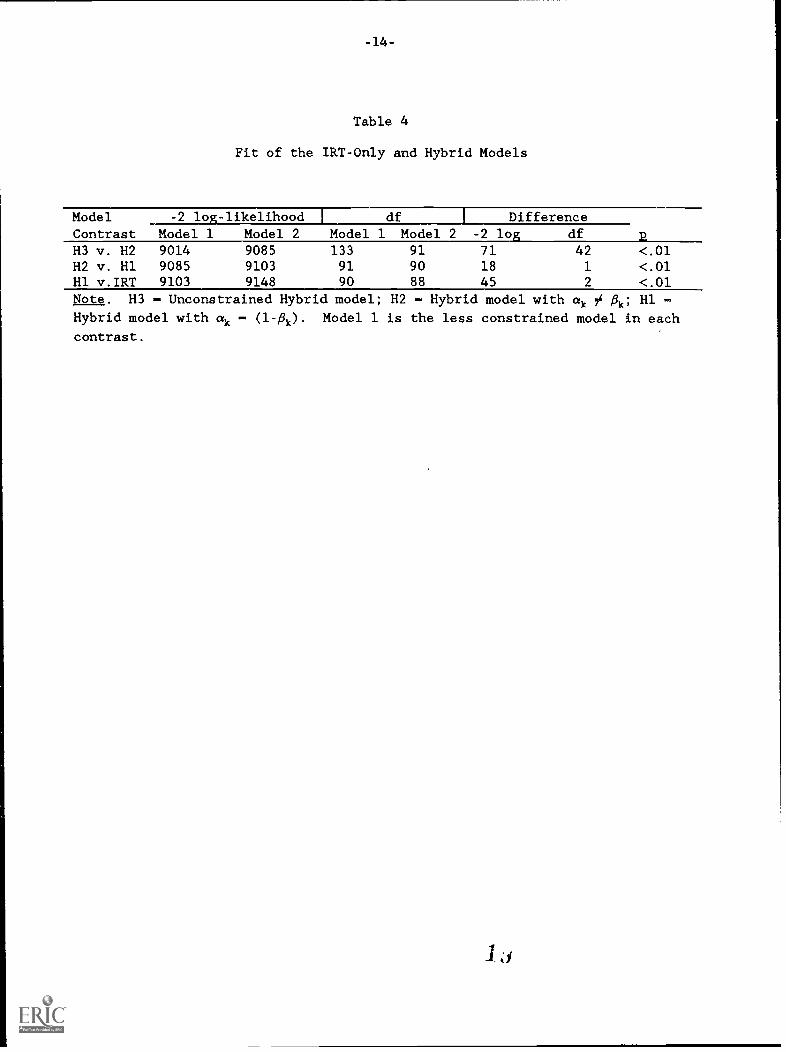
Table 4 shows the -2 log-likelihood fit statistic for the IRT-only modeland the Hybrid model under three levels of constraint. Each model was fitusing the 44-score bug occurrence vector. As the table indicates, the Hybridmodels provided significant improvements over the IRT-only model, with theunconstrained Hybrid fitting best. The Akaike Information Criterion (AIC)presented a similar picture, though the best fit was suggested for themoderately constrained model. (For the least to most constrained Hybridmodels, the AICs were 9280, 9267, and 9283; for the IRT-only model, the valuewas 9324.) Because the fit statistics did not agree on which of these twoHybrid models was to be preferred, the unconstrained model was selected forfurther examination. This model captured a larger latent class and, throughits free conditional probabilities, permitted exploring the association oferror tendency with item content and format (the latter a central concern ofthe HOST analysis reported below).
Under the unconstrained model, 12% of the sample--32 examinees--wereencompassed by the missing-goals class. Conditional probabilities for thefour error classes given membership in the missing-goals latent class arepresented in Table 5. As the table indicates, there is a modest tendencytoward missing-goals errors: the mean conditional probability for this classwas .33 compared with .20 for the three other error classes combined (.19 for
1 i
-13-
Table 3
Percentages of Examinees Evidencing Specific Bugson One or More Items (n = 285)
Bug Type
Percentages of Students Evidencing Bug
In TotalOn OnlyOne Item
On More thanOne Item
Math
Decimal Shift 33% 24% 9%
Close Enough Tenths 61% 32% 29%
Close Enough Units 55% 28% 27%
General Plan
Unexplained Value 16% 14% 3%
Unknown Value 72% 29% 43%
Add for Subtract 16% 13% 3%
Times for Divide 11% 11% 0%
Specific Plan
Result per Unit-Amt/Rate 19% 15% 4%
Percent as Decimal 58% 52% 6%
Unexplained Distance 11% 9% 1%
Close Enough Minutes 22% 22% 0%
Time as Decimal 10% 10% 0%
Decimal Portion as Time 13% 9% 4%
Missing Goal
Work Goal #2 26% 18% 8%
Work Goal #1 22% 16% 6%
Interest Goal #3 30% 22% 8%
D=RT goal #5 44% 26% 18%
D-RT goal #4 26% 17% 9i:
D-RT goal #3 18% 12% 61
D-RT goal #2 19% 14% 6%
D-RT goal #1 17% 12% 5%
Note. Bugs were included if they were made at least one time by at least 10%of examinees. Not-reached items are omitted from tabulations.
-14-
Table 4
Fit of the IRT-Only and Hybrid Models
Model -2 lo -likelihood df DifferenceContrast Model 1 Model 2 Model 1 Model 2 -2 log df 2113 v. 112 9014 9085 133 91 71 42 <.01112 v. 111 9085 9103 91 90 18 1 <.01H1 v.IRT 9103 9148 90 88 45 2 <.01Note. 113 - Unconstrained Hybrid model; 112 - Hybrid model with ak ¢ flk; H1 -
Hybrid model with ak (1-00 Model 1 is the less constrained model in each
contrast.
1 d
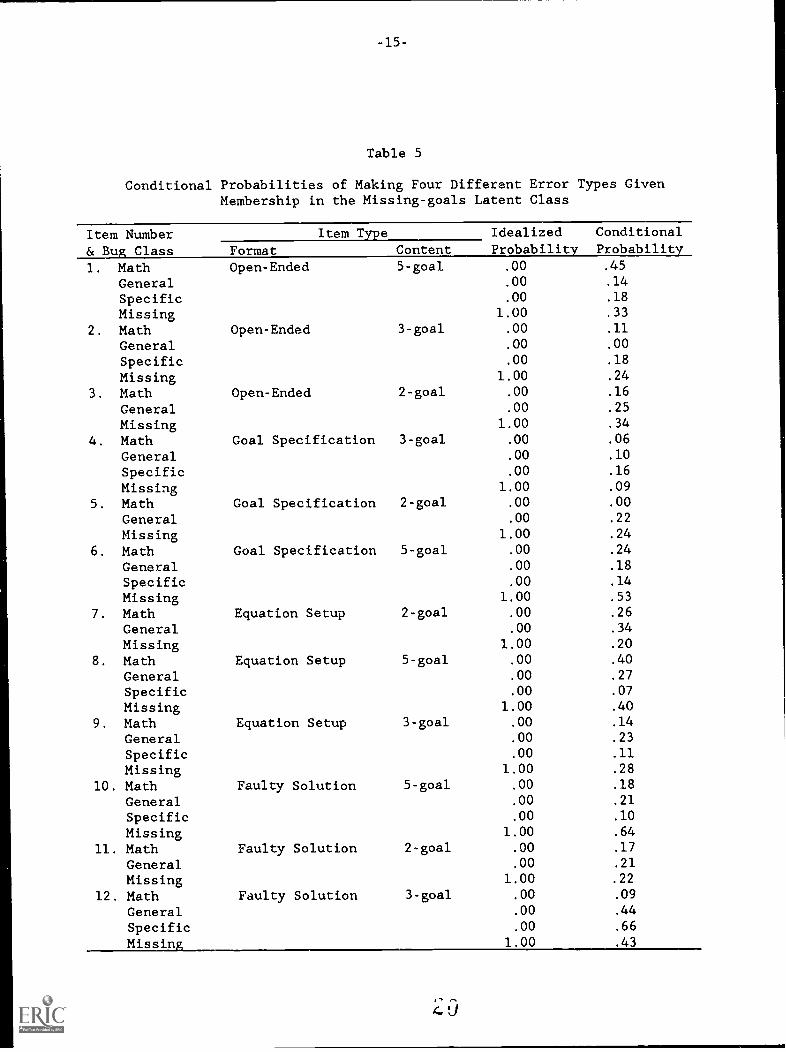
Table 5
Conditional Probabilities of Making Four Different Error Types GivenMembership in the Missing-goals Latent Class
Item Number& Bug Class
Item Type Idealized ConditionalProbabilityFormat Content Probability
1. Math Open-Ended 5-goal .00 .45
General .00 .14
Specific .00 .18
Missing 1.00 .33
2. Math Open-Ended 3-goal .00 .11
General .00 .00
Specific .00 .18
Missing 1.00 .24
3. Math Open-Ended 2-goal .00 .16
General .00 .25
Missing 1.00 .34
4. Math Goal Specification 3-goal .00 .06
General .00 .10
Specific .00 .16
Missing 1.00 .09
5. Math Goal Specification 2-goal .00 .00
General .00 .22
Missing 1.00 .24
6. Math Goal Specification 5-goal .00 .24
General .00 .18
Specific .00 .14
Missing 1.00 .53
7. Math Equation Setup 2-goal .00 .26
General .00 .34
Missing 1.00 .20
8. Math Equation Setup 5-goal .00 .40
General .00 .27
Specific .00 .07
Missing 1.00 .40
9. Math Equation Setup 3-goal .00 .14
General .00 .23
Specific .00 .11
Missing 1.00 .28
10. Math Faulty Solution 5-goal .00 .18
General .00 .21
Specific .00 .10
Missing 1.00 .64
11. Math Faulty Solution 2-goal .00 .17
General .00 .21
Missing 1.00 .22
12. Math Faulty Solution 3-goal .00 .09
General .00 .44
Specific .00 .66
Missin 1.00 .43

-16-
math, .22 for general, and .20 for specific). In several instances, however,the conditional probabilities diverged--sometimes markedly--from this tendency(items 1, 4, 7, 8, and 12). For item 12, perhaps the most seriouslymisfitting item, the probability of a specific-plan error was .66, comparedwith .43 for a missing goal, a reversal of the idealized model. This was the"active ingredient" item on which a large number of "percent-as-decimal" bugsoccurred.
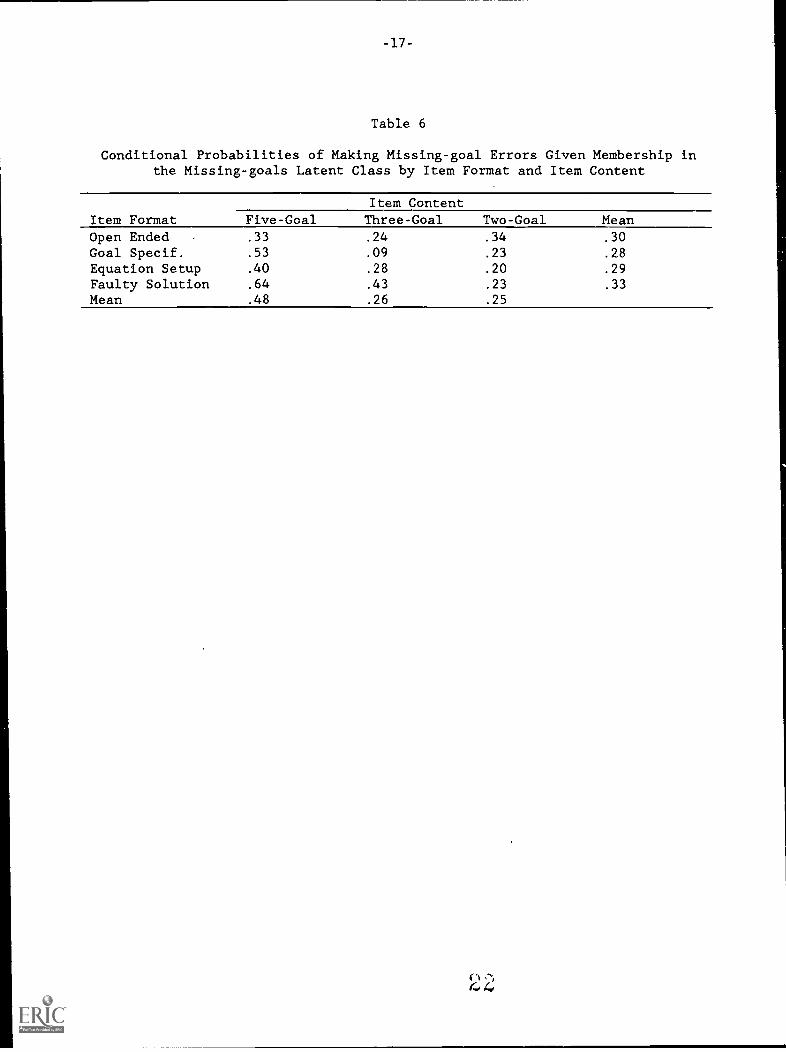
In Table 6, the conditional probabilities of missing-goal errors givenmembership in that class are shown by format and content. For five-goalproblems, the probability of making a missing-goal error was consistentlyhigher than for the other two content types, perhaps because the fourth goal(i.e., find the activity's duration) is frequently the terminal one in other,similar problems. No distinction among formats was evident.
The posterior probabilities of the latent and IRT classes were comparedfor each member of the missing-goals group to see how much better the latentclass characterized the observed pattern than did the IRT model. The mean andmedian IRT probabilities for the group were .06 and .02, respectively; thecorresponding latent class probabilities were .91 and .97. Twenty-seven ofthe 32 missing-goals group members had latent class probabilities greater than.85 and IRT probabilities less than .10.
What characteristics distinguished the missing-goals group? Comparedwith the total sample, missing-goals examinees had lower partial-credit scoreson the 12-item constructed-response test (a mean of 64 and standard deviationof 26 vs a mean of 97 and standard deviation of 22); had lower mean GeneralTest scores (427 vs 527 for verbal, 409 vs 573 for quantitative, 427 vs 558for analytical); were more frequently noncitizens (34% vs 15%), and, of thosewho were citizens, were more frequently non-White (54% vs 24%).
Although missing-goals examinees had relatively low mean quantitativescores, these individuals were not necessarily the least adept performers onthe GRE quantitative sect-lon. The point-biserial correlation between groupmembership and GRE quantitative score was -.42, t(283) - 7.79, R < .001,suggesting a significant but moderate relationship. Seven of 32 members hadquantitative scores exceeding the total sample's lower quartile (i.e., > 470).The mean score for the quartile was 378 with a standard deviation of 65; themean for the missing-goals group was 409 (SD = 142).
As expected, latent class members made frequent missing-goal errors.These examinees made a median of four such errors with a range of 2-10. Itemresponses containing missing-goal errors were divided between those that werepartially misspecified and those that were completely malformed. Partiallymisspecified responses were lacking at least one solution component (but notall), and were generally accompanied by other errors. The completelymalformed responses varied from no response or only a restatement of giveninformation, to partial solutions following incorrect paths. These completelymalformed responses generated a missing-goal bug for each goal in the problemdecomposition and, by definition, were accompanied by no other errors(Figure 2 gives examples of each response type.) Examinees tended to makemore partially misspecified responses (median - 3, range - 1-5) thancompletely malformed ones (median - 1, range - 0-8); only one student showedthe reverse pattern.
-17-
Table 6
Conditional Probabilities of Making Missing-goal Errors Given Membership inthe Missing-goals Latent Class by Item Format and Item Content
Item ContentItem Format Five-Goal Three-Goal Two-Goal MeanOpen Ended .33 .24 .34 .30
Goal Specif. .53 .09 .23 .28
Equation Setup .40 .28 .20 .29
Faulty Solution .64 .43 .23 .33
Mean .48 .26 .25
r 1 , ;

-18-
Figure 2Responses Containing Missing Goals
(a) A partially misspecified response with no error other than a singlemissing goal.
Money in a certain investment fund earns an annual dividend of 5 percent ofthe original investment. In how many years will an initial investment of $750earn total dividends itqual to the original investment? (Open-ended format)
12 months - 5%$750 original amount750 x 5/100 - 37.50
(b) Two partially misspecified responses: one with a final missing goal andan unreduced expression bug; the other with a final missing goal, a close-enough tenths bug, and a decimal-as-time bug.
A graphics designer earns 2% of a $1500 yearly bonus for each stOft ofovertime she works. How many shifts of overtime must she work to earn theequivalent of the entire yearly bonus? (Equation-setup format)
X - 2% x 1500X - 1500 x .02
On a 600-hundred mile motor trip, Bill averaged 45 miles per hour for -hefirst 285 miles and 50 miles per hour for the remainder of the trip. If hestarted at 7:00 a.m., at what time did he finish the trip (to the nearestminute)? (Open-ended format)
600 miles - 285 = 315285/45 - 6.33315/50 - 6.3312.66 - 13.06 min13 hrs 6 min
(c) A completely malformed response with all goals missing.
A Department of Transportation road crew paves the 15 mile city portion of a37.4 mile route at the rate of 1.8 miles per day and paves the rest of theroute, which is outside the city, at a rate of 2.1 miles per day. If theDepartment of Transportation starts the project on day 11 of its workcalendar, on what day of its work calendar will the project be completed?(Faulty solution format)
15 miles37.4 - 1.8 day37.4:1.8 day as X:2.1
Note. The formats in which problems were administered are indicated inparentheses after each item. Responses are from examinees with posteriorprobabilities of belonging to the missi g-goals class - 1.00.

-19-
Latent class members were also more likely than the overall sample notto complete the constructed-response test (though because the Hybrid modelingignored not-reached items, nonresponse was not directly a factor in formingthe missing-goals group). Some 31% of the group did not reach items, comparedwith about 11% of the total sample.
Table 7 compares the responses of several missing-goals examinees withIRT-modeled subjects matched on GRE quantitative and total constructed-re-ponse test scores. The matches were somewhat imprecise due to the need tosatisfy both criteria simultaneously and to eliminate examinees who hadmultiple not-reached items. As expected from the latent class conditionalprobabilities, these examinces do tend to make more missing-goal errors in therelative absence of other mistakes. Also as expected, this tendency ismodest, perhaps better characterized as one of degree rather than a sharpqualitative distinction.
Closer inspection of the responses of missing-goals examinees revealed alimited number of mistakes in transcribing examinee responses from written tomachine-readable form and in GIDE's processing of the transcriptions. Thetranscription errors generally involved failing to record the minimalnotations that constituted some responses (e.g., a partially executed plan forthe first goal with no attempt to solve subsequent goals); this sometimescaused GIDE to interpret a response as a series of missing goals when, infact, it should have been described as containing a plan error in conjunctionwith missing goals. The processing errors took several forms. In some cases,examinees represented clock-time results using decimals instead of colons(e.g., 7:37.8 instead of 7:37:48 or simply 7:38), which GIDE misinterpreted asa missing goal. In a second instance, the examinee formulated a solutioncomponent as a nested equation, causing the same erroneous analysis. Finally,
GIDE misinterpreted an examinee's restatement of given information (24=B) asan approximation of the correct answer (240 minutes) with a decimal-shifterror, thus failing to recognize an instance in which the goal was, in fact,missing.
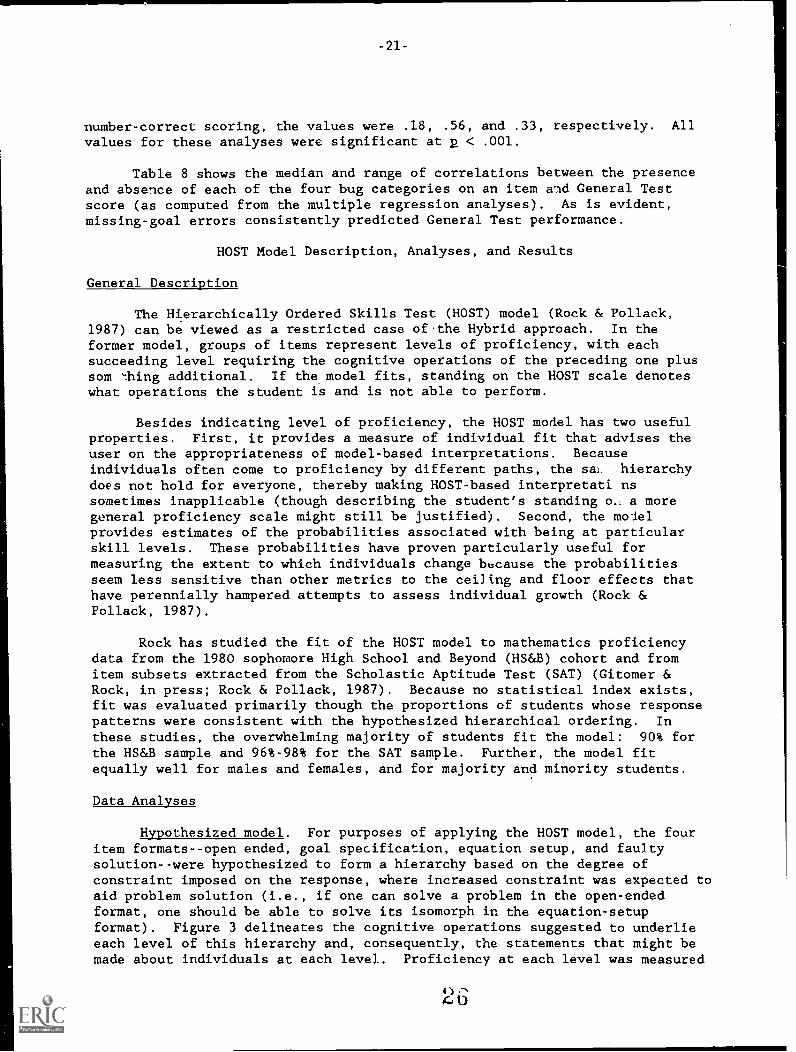
Scoring analyses. For the two-parameter IRT-only model using the 44-score number-correct examinee vector, the fit of the estimated item parametersproduced chi squares between .23 and 10.25 (8 df) for 43 of the 44 itemscores; the chi square for the remaining score was 32.04. Proportions ofvariance accounted for by the regressions of GRE verbal, GRE quantitative, andGRE analytical on these scores were .20, .50, and .33, respectively, with allvalues significant at R < .001.
The two-parameter IRT-only model was also fitted to the 12-score number-correct examinee vector. The fit of the estimated item parameters producedchi squares from .11 to 4.09 (8 df). Proportions of variance accounted for bythe regressions of GRE verbal, GRE quantitative, and GRE analytical on thesescores were similar to those produced by the 44-score vectors (.18, .54, and.31, respectively, all significant at R < .001).
The multiple regressions were computed after deleting 25 examinees withmultiple not-reached items, 8 of whom were members of the missing-goals group.With bug information, the proportion of variance accounted for in GRE verbalwas .29, .62 for GRE quantitative, and .43 for GRE analytical. For the
24

-20-
Table 7
Response Patterns of Three Pairs of Matched ExamineesCaptured by the Hybrid and IRT Models
Contrast #1 Contrast #2 Contrast #3
Missing Missing MissingVariable Goals IRT Goals IRT Goals IRT
GRE quantitative 340 340 460 480 610 580
Partial-credit score 55 64 95 94 84 85
Latent class prob. .97 .00 .94 .00 .99 .01
Item1 600-mile * M A M,A2 Investment M G
3 2000cc Tank M M,G4 Load Cement G
5 Small Business M6 2400g Tank M,G A,G G,S M M A7 Chemical Company M A G A A,G8 720 Pages M M,A,G,S A G,S A M,G,S9 Graphics M,G M,S A,S M
10 DOT Crew M,A M,A,S A M,A,S A11 $3.50 Tolls M M,G12 Active Ingredient G,S M,G,S G,S S M A,S
Note. Latent class probability - probability that the examinee's responsepattein belongs to the missing-goals latent class. Partial-credit score - thesum of the scores on the 12 constructed-response items (scale - 0 - 120).Error codes are M - missing goal, A - math, G - general plan, S - specificplan. Each error code indicates the presence of one or more errors of thattype. * - not-reached item ignored by the Hybrid model.
4.0
-21-
number-correct scoring, the values were .18, .56, and .33, respectively. All
values for these analyses were significant at R < .001.
Table 8 shows the median and range of correlations between the presenceand absence of each of the four bug categories on an item wad General Testscore (as computed from the multiple regression analyses). As is evident,missing-goal errors consistently predicted General Test performance.
HOST Model Description, Analyses, and Results
General Description
The Hierarchically Ordered Skills Test (HOST) model (Rock & Pollack,1987) can be viewed as a restricted case of the Hybrid approach. In theformer model, groups of items represent levels of proficiency, with eachsucceeding level requiring the cognitive operations of the preceding one plussom -.hing additional. If the model fits, standing on the HOST scale denoteswhat operations the student is and is not able to perform.
Besides indicating level of proficiency, the HOST model has two usefulproperties. First, it provides a measure of individual fit that advises theuser on the appropriateness of model-based interpretations. Becauseindividuals often come to proficiency by different paths, the sah hierarchydoes not hold for everyone, thereby making HOST-based interpretati nssometimes inapplicable (though describing the student's standing o a moregeneral proficiency scale might still be justified). Second, the moJelprovides estimates of the probabilities associated with being at particularskill levels. These probabilities have proven particularly useful formeasuring the extent to which individuals change because the probabilitiesseem less sensitive than other metrics to the ceiling and floor effects thathave perennially hampered attempts to assess individual growth (Rock &Pollack, 1987).
Rock has studied the fit of the HOST model to mathematics proficiencydata from the 1980 sophomore High School and Beyond (HS&B) cohort and fromitem subsets extracted from the Scholastic Aptitude Test (SAT) (Gitomer &Rock, in press; Rock & Pollack, 1987). Because no statistical index exists,fit was evaluated primarily though the proportions of students whose responsepatterns were consistent with the hypothesized hierarchical ordering. In
these studies, the overwhelming majority of students fit the model: 90% forthe HS&B sample and 96%-98% for the SAT sample. Further, the model fitequally well for males and females, and for majority and minority students.
Data Analyses
Hypothesized model. For purposes of applying the HOST model, the fouritem formats--open ended, goal specification, equation setup, and faultysolution--were hypothesized to form a hierarchy based on the degree ofconstraint imposed on the response, where increased constraint was expected toaid problem solution (i.e., if one can solve a problem in the open-endedformat, one should be able to solve its isomorph in the equation-setupformat). Figure 3 delineates the cognitive operations suggested to underlieeach level of this hierarchy and, consequently, the statements that might bemade about individuals at each level. Proficiency at each level was measured

-22-
Table 8
Medians and Ranges of Correlations Between the Presence of Bug Classes onIndividual Items and GRE General Test Score (n 260)
Bug Class
GRE General Test Score
Verbal Quantitative Analytical
Math .08 (.00-.16) .19* (.02-.29) .12 (.01-.26)
General .15* (.02-.21) .18* (.06-.27) 16* (.04-.20)
Specific .12 (.03-.19) .23* (.12-.34) .17* (.13-.26)
Missing .17* (.08-.27) .27* (.14-.37) .20* (.09-.35)
Note. Each cell is based on 12 correlations except for the Specific bugcells, which are based on 8 values.
*R < .05 (two-tailed test)

-23-
Figure 3
Proposed Hierarchical Arrangement of Item Formats
Level Format Operations
4 Open ended Identify givens and unknowns.Create representation for problembased on knowns and unknowns.Map equations onto problem statement.Solve equations.Check solution, detect error(s),and recover.
3 Goal specifi- Create representation for problemcation based on knowns and unknowns.
Map equations onto problemstatement.Solve equations.Check solution, detect error(s),and recover.
2 Equation setup Map equations onto problem statement.Solve equations.Check solution, detect error(s),and recover.
1 Faulty solution Check solution against problemstatement, detect error(s), andrecover.

-24-
by a three-item parcel (one item fromon a different partial-credit scale.isomorphic to one another, difficultywith the exception of that introduced
'each content set), with each item scoredBecause items were constructed to beacross levels should be roughly similarby question format.
As Figure 3 indicates, the formats are suggested to form a Guttman-typesimplex (Guttman, 1954). That is, items at level 2 call for the sameoperations as those at level 1 (i.e., check solution, detect errors, andrecover), but also demand additional processes (i.e., map equations ontoproblem statement and solve equations). As a result, examinees who areproficient at level 2 should have a high probability of being proficient atlevel
Because the HOST model is predicated on item format and the constructed-response items were administered in format sequence, not-reached items wouldbe expected to introduce spurious effects. Consequently, examinees who didnot reach two or more items were removed from the analysis. Twenty-five ofthe 285 examinees were excluded by this criterion; 19 of these did not reach 3or more items (an entire HOST level).
Model-fitting analyses. To test the fit of the HOST model, a pass/failscore was generated for each proficiency level. Scores were aggregated acrossitems in a level because previous attempts to fit Guttman-type scales to itemdata have almost always produced disappointing results, in part due to the lowreliability of individual items. Variations on two pass/fail scoring schemeswere used. The first method computed the level score by taking the sum of theitem scores (from 0-30) and considering an examinee to have passed the parcelif the score equaled or exceeded the cut value. Cut values were 23, 27, and30. Under the second method, each item score was calculated as a percentageof the maximum possible item score and the student was considered to pass theitem if the score equaled or exceeded the cut point. Cut points under thismethod were 75%, 90%, and 100% of the scale maximum. A student was consideredto have passed the parcel if any two items were passed.
The fit of the HOST model was assessed through several means. First,
mean scores (taken across students and items) were computed for each level tosee if the expected item ordering held. Second, a four-element vector wasformed for each individual, with each 0/1 element indicating proficiency for agiven level. The elements were ordered from level 1 through 4 so that if theformats constituted a perfect hierarchical scale, 0 should never precede 1.The percentage of scale reversals was computed separately for single (e.g.,0111), double (e.g., 1001), and triple (e.g., 0001) reversals.
Data analysis summary. The HOST procedure was used to model a hierarchyof cognitive operations composed of four proficiency levels. Each proficiencylevel was marked by three items cf the same format, with formats varying inthe degree of constraint imposed upon the response. Pass/fail scores weregenerated for each proficiency level. Mean differences among levels werecompared and student proficiency vectors examined to determine if thehypothesized hierarchy was supported.

-25-
Results
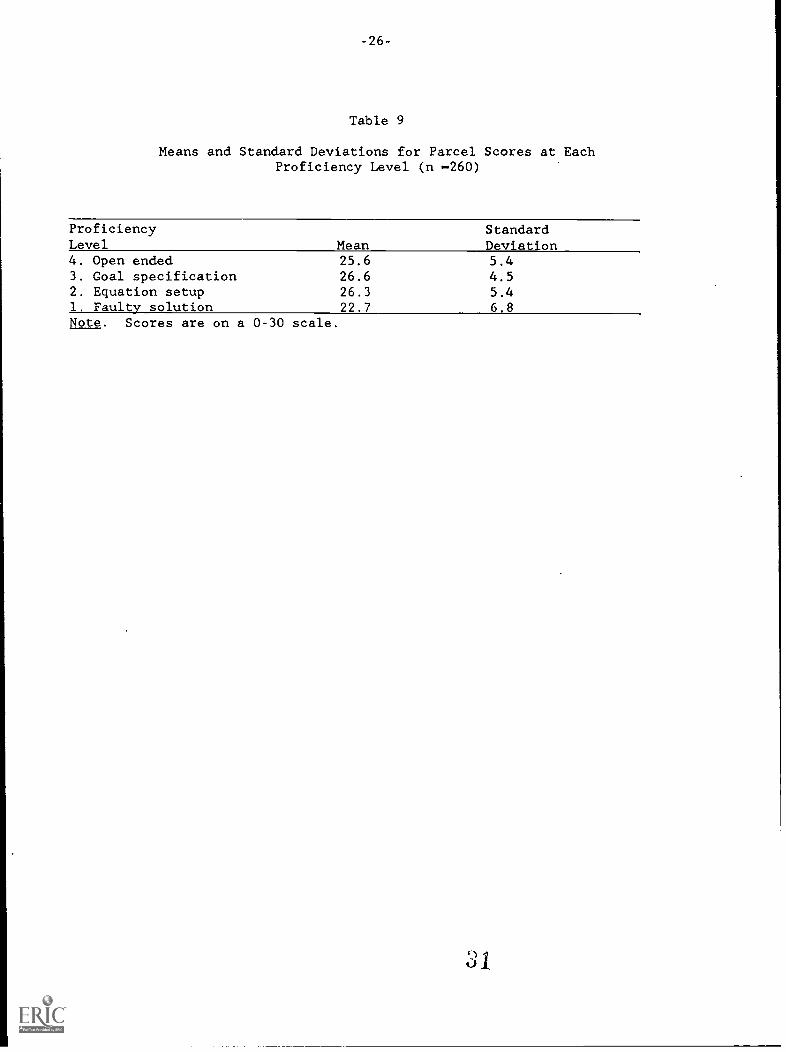
Model-fitting analyses. Table 9 shows the mean parcel scores for thefor proficiency levels, where a parcel score was the sum of the partial-credit scores for each constituent item. As the table indicates, thedistributions were skewed, showing a marked ceiling effect. Additionally,three of the four means fell within an item of one another. The singleoutlying mean--for level 1 (faulty solution)--ran counter to the expectedordering, showing that level to be the most difficult instead of the leastchallenging.
Mean partial-credit scores for the individual items are depicted inTable 10. Items are arranged by level (format) within content set, the latterindicated by score range (0-6, 0-9, 0-15), permitting the difficulties ofisomorphic items of different levels to be compared. Again, level 1 problemswere always the most difficult; within content sets, however, the means wereclosely similar. The singular exception was for the "active ingredient" item,a level 1 question that differed in difficulty from the nearest item in itscontent group by a full standard deviation (where the standard deviation wasthe mean of the standard deviations of the content set).
Table 11 presents the percentages of students with different parcelpass/fail patterns under three cut scores for each of two scoring methods.Two points are noteworthy. First, regardless of method, only a smallpercentage of examinees unequivocally fit the hypothesized model. Althoughbetween 43% and 67% of response patterns were consistent with the model, theoverwhelming majority of these patterns were either consistent passes (1111)or failures (0000), both of which may mask model misfit. As the cut score wasadjusted to increase fit within either method, the percentage of consistentmixed patterns (i.e., 1000, 1100, 1110) remained almost constant (changinrfrom 3% to 6% to 5% under the item-score method). At the same time, thecombined percentage of perfect and failure patterns increased while thepercentage of inconsistent patterns (i.e., single, double, and triplereversals) decreased. This covariation suggests that the total percentage ofconsistent patterns may significantly overestimate model fit. Second, some ofthe misfit can be traced to the level 1 (faulty solution) items. Under bothscoring methods, the most frequent single reversals usually involved theseproblems (i.e., 0111, 0110, 0100).
Discussion
This exploratory study investigated the fit of two cognitively orientedmeasurement models to constructed-response item data and, secondarily, probedideas about cognitive structure in solving algebra word problems. The Hybridmodel captured a small percentage of examinees whose performance was not wellcharacterized by the IRT model. This group tended to miss critical problemcomponents while making relatively few errors of other types. No associationwith item format was evident, although this error tendency was more prevalentwith five-goal problems, perhaps because these problems contained an easy-to-forget final step. Comparison of the responses of these individuals withthose represented by the IRT model suggested that the groups weredistinguished more by degree than by a sharp qualitative difference.2 Still,
-26-
Table 9
Means and Standard Deviations for Parcel Scores at EachProficiency Level (n 260)
ProficiencyLevel Mean
StandardDeviation
4. Open ended 25.6 5.43. Goal specification 26.6 4.52. Equation setup 26.3 5.41. Faulty solution 22.7 6.8Note. Scores are on a 0-30 scale.

-27-
Table 10
Means and Standard Deviations for Item Scores (n 260)
ItemFormat& Level Scale
StandardDeviation
2000cc Tank Open . (4) 0-6,Mean
5.0 2.0Small Business Goal (3) 0-6 5.6 1.0Chemical Co. Equation (2) 0-6 5.3 1.5$3.50 in Tolls Faulty (1) 0-6 4.9 2.1Investment Open (4) 0-9 7.9 2.3Load Cement Goal (3) 0-9 8.6 1.2Graphics Equation (2) 0-9 8.4 1.9Active Ingrd. Faulty (1) 0-9 5.9 2.6600-Mile Open (4) 0-15 12.7 3.32400g Tank Goal (3) 0-15 12.3 3.6720 Pages Equation (2) 0-15 12.6 3.4DOT Crew Faulty (1) 0-15 11.9 4.2
tj 4

-28-
Table 11
Numbers of Students with Different Patterns of Parcel Pass/Fail Scores UnderTwo Scoring Methods and Three Cut Scores (n 260)
ParcelPass/FailPattern
Total-Score Method Item-Score Method
23 27 30 75% 90% 100%
Consistent
0000 4% 16% 53% 2% 9% 11%
1000 0% 0% 1% 0% 1% 0%
1100 0% 2% 3% 1% 0% 0%
1110 7% 4% 2% 2% 5% 5%
1111 54% 23% 3% 62% 36% 27%
Total 65% 45% 60% 67% 51% 43%
Single reversal
0111 17% 17% 3% 19% 18% 17%
1011 2% 2% 2% 2% 3% 2%
1101 1% 2% 0% 0% 3% 3%
0110 4% 10% 4% 2% 7% 8%
1010 0% 0% 1% 0% 0% 0%
0100 3% 4% 8% 1% 1% 2%
Total 27% 34% 19% 25% 33% 33%
Double reversal
1001 0% 0% 1% 0% 0% 0%
0101 1% 6% 4% 1% 3% 6%
0011 2% 5% 2% 3% 6% 8%
0010 4% 6% 5% 5% 4% 6%
Total 7% 17% 11% 8% 13% 21%
Triple reversal
0001 1% 3% 10% 0% 2% 3%
Total 1% 3% 10% 0% 2% 3%
Note. In the total-score method, the parcel score is computed bysumming the item scores (0-30) And considering a examinee to have passedthe parcel if the score equaled dr exceeded the cut value. For theitem-score method, each item score was calculated as a percentage of themaximum possible item score and the student was considered to pass theitem if the score equaled or exceeded the cut point. A student wasconsidered to have passed the parcel if any two items were passed.

-29-
a tendency to misspecify important solution components may comprise the moresalient of a given examinee's quantitative skill difficulties, even if it co-exists with other less pronounced deficits. That this error tendency may beimportant was supported by its significant relation with General Testperformance. Thus, if these results can be replicated, this information mayhave value for descriptive or remedial purposes, possibly for a largerpercentage of individuals as the focus shifts to more representative segmentsof the General Test population.
Why weren't more error classes detected and why wasn't the detectedclass more distinct? A persistent issue in the error analysis literature isstability. Several investigators have found substantial inconsistency inindividuals' math errors (Payne & Squibb, 1990; Tatsuoka, Birenbaum, & Arnold,1989). VanLehn (1982), however, has argued that systematicness can bedetected when bugs are viewed from the perspective of repair theory, whichsuggests that students make local fixes upon encountering an impasse inproblem solving. The particular fix may vary from one time or problem to thenext, but having the same genesis, the resulting bugs should be related.Although GIDE's analyses are based on a problem-solving theory thatconceptualizes bugs as deviations from correct goal-plan structures, thespecific bugs composing a general class do not necessarily emanate from thesame underlying source. Consequently, a reorganization of error classesaccording to underlying generative mechanisms might permit greater consistencyto be observed.
Other factors may have limited the discovery of multiple, distinctexaminee classes. For one, examinees made relatively few errors--less thanone per item on average--possibly too little to evidence much consistency.Second, the number of items was such that there was limited opportunity toobserve repeated errors. Finally, transcription and processing mistakes mayhave introduced noise. The frequency and gravity of these errors would appearto be low given the extensive checks placed on transcription (see Sebrechts,Bennett, & Rock, 1991) and the high relations of GIDE's scores with bothexperts' grades and GRE quantitative performance (Bennett, Sebrechts, & Rock,in press; Sebrechts, Bennett, & Rock, 1991). Even subtle transcription andprocessing mistakes, however, can change the general bug category detected,thereby masking consistency and diluting distinctions among examinees.
The second model explored, HOST, unequivocally fit only a smallpercentage of examinee responses. The primary source of misfit appeared to bethe faulty solution format, which was hypothesized to be the easiest butconsistently proved to be the hardest item type. This result suggests thatthe hypothesized hierarchical structure needs to be modified to recognize thisformat's greater cognitive complexity. The other formats were not readilydistinguishable--possibly because many individuals were able to performsuccessfully regardless and because others were not clear as to how theformats could be used. This result left open the possibility that, exceptingfaulty solutions, the proposed hierarchy might fit in a less skilled sampleinstructed in how the formats might differencially aid problem solving.Transcription and processing errors were less likely to be relevant herebecause of the positive outcomes of previous investigations using the samenumeric score data.
34
-30-
What are the implications of this work for GRE Program research anddevelopment? As noted, this study is part of an integrated research programon intelligent assessment (Bennett, in press). This program is pursuing goalsrelated to constructed-response testing, interactive systems incorporatingartificial intelligence, and cognitively driven measurement models. Withrespect to constructed-response testing, the top priority is a more refinedtask theory to account for the functioning of the various formats, faultysolution in particular. Stronger task theory might, in addition, suggestclasses of bugs that are more likely to be associated with one format thananother. Finally, it might better clarify the role of missing goals and itsmeaning for characterizing a subgroup of examinees.
The beginnings of a task theory exist in the goal-plan structures usedin this study, which were previously derived from an analysis of open-endeditems (Sebrechts, Bennett, & Rock, 1991). Further progress might be achievedthrough protocol analysis as well as by experimental studies. The formerapproach should help in building a more finely grained process model for eachformat (including how examinees use goal-plan information given in the itemstem). The latter method might involve testing particular hypothesesdeveloped from that process model. For example, given a model in whichproviding correct goal-plan structures facilitates problem solving, the sameitems in different formats might be randomly assigned to examinees (avoidingthe confounding sometimes introduced by isomorphs). A second design wouldrequire presenting difficult problems by computer in open-ended format withone group getting progressively more goal-plan information if the problem isnot solved. (This design could be implemented using the data collectioninterface being developed under a related GRE-funded effort.)
How might the faulty solution format fit into such a task theory? It isconceivable that examinees work these relatively unfamiliar problems by firstsolving them as if they were open-ended and then comparing the solution to thegiven one to identify the discrepancies. Difficulty would increase because ofthis added step and because the given solution might represent a strategydifferent from the one followed by the examinee, making comparison morecomplex. Another possibility is that examinees use the faulty solution tohelp generate a response but are misled by the given information, and thusreplicate parts of the erroneous solution. This supposition might be testedin the present data by looking for a higher incience of these replicated bugsfor the faulty solution format.
Regarding the research program's second goal, the development ofinteractive item delivery and analysis technology, it should be noted thatsuch delivery eliminates the need for transcription and the errors inevitablyassociated with it. With this problem aside, emphasis should be onsystematically studying the accuracy of GIDE's diagnoses and improving itsanalytical mechanism. This investigation might be conducted similarly to theprior study of scoring accuracy (Sebrechts, Bennett, & Rock, 1991), whichcompared GIDE's scores with those of human content experts. Experts might beasked to diagnostically analyze solutions from the existing data set. Expertdiagnoses would be compared with the analyses already produced by GIDE anddisagreements discussed to ensure that they represented erroneous machineprocessing. After the processing errors were corrected, the study would bereplicated with data collected interactively from a new examinee sample takingboth the existing items and an overlapping set now being developed.
-31-
The third goal, integrating cognitively driven measurement models,should follow the development of more refined task and bug theories. Asstronger theories are posed, the HOST and Hybrid models might again be appliedto test theoretical predictions. Other measurement models that should beconsidered include Mislevy's (in press) inference nets and Tatsuoka's (1983)rule space. These studies should be conducted with more items chosen toprovide multiple opportunities for observing theoretically related orotherwise salient bugs (e.g., the "active ingredient" decimal-as-percent bug),as well as with more representative examinees samples. On this latter point,an argument might be made for oversampling students whose skills are somewhatlower than average as these individuals need diagnostic feedback and might bemore likely to fall into latent classes. This strategy needs to be carefullyconsidered as error consistency appears to be particularly low among unskilledstudents (Payne & Squibb, 1990; Tatsuoka, Birenbaum, & Arnold, 1989).
The three goals enunciated by this research program are intended to leadto components for enhancing existing assessment programs and building newproducts and services. These components might, for example, be incorporatedin software for preparing students to take the General Test, in the GeneralTest itself to provide more specific information to examinees, or in newprogram offerings intended to alert students early in their undergraduatecareers to the fundamental skills they need to increase their chances forsuccess in graduate education. As suggested, considerable progress has beenachieved in developing innovative item formats, automatically scoringresponses, and studying the meaning of the resulting partial-credit scores.In addition, substantial work has been invested in understanding how examineescorrectly and incorrectly solve specific problems. This study has taken aninitial step toward aggregating that information across items to produce moregeneral qualitative characterizations. Such characterizations will likelyplay an important role as the GRE and other testing programs expand their focito satisfy increasing needs for information service.

References
Bennett, R. E. (in press). Intelligent assessment: Towardconstructed-response testing, artificial intelligence,measurement. In N. Frederiksen, R. J. Mislevy, and I.Test theory for a new generation of tests. Hillsdale,Erlbaum Associates.
an integration ofand model-basedBejar (Eds.),NJ: Lawrence
Bennett, R. E., Gong, B., Kershaw, R. C., Rock, D. A., Soloway, E., &Macalalad, A. (1990). Assessment of an expert system's ability tograde and diagnose automatically student's constructed responses tocomputer science problems. In R. O. Freedle (Ed.), Artificialintelligence and the future of testing (pp. 293-320). Hillsdale, NJ:Lawrence Erlbaum Associates.
Bennett, R. E., Rock, D. A., Braun, H. I., Frye, D., Spohrer, J. C. & Soloway,E. (1990). The relationship of expert-system scored constrained free-response items to multiple-choice and open-ended items. AppliedPsychological Measurement, 14, 151-162.
Bennett, R. E., Sebrechts, M. M., & Rock, D. A. (in press). Expert-systemscores for complex constructed-response quantitative items: A study ofconvergent validity. Applied Psychological Measurement.
Birenbaum, M., & Tatsuoka, K. K. (1987). Open-ended versus multiple-choiceresponse formats--It does make a difference for diagnostic purposes.Applied Psychological Measurement, 11, 385-395.
Bock, R. D., & Aitkin, M. (1981). Marginal maximum likelihood estimation ofitem parameters: Application of an EM algorithm. Psychometrika, 46,443-459.
Braun, H. I., Bennett, R. E., Frye, D., & Soloway, E. (1990). Scoringconstructed responses using expert systems. Journal of EducationalMeasurement, 27, 93-108.
Falmagne, J. C. (1989). A latent trait theory via a stochastic learningtheory for a knowledge space. Psychometrika, 54, 283-303.
Fiske, E. B. (1990, January 31). But is the child learning? Schools tryingnew tests. The New York Times, pp. 1, B6.
Gitomer, D. H., & Rock, D. A. (in press). Addressing process variables intest analysis. In N. Frederiksen, R. MI3levy, and I. Bejar (Eds.), Testtheory for a new generation of tests. Hillsdale, NJ: Lawrence Erlbaum.
Gitomer, D. H., & Yamamoto, K. (1991). Performance modeling that integrateslatent trait and class theory. Journal of Educational Measurement, 28,173-189.
Guthrie,-J. T. (1984). Testing higher level skills. Journal of Reading, 28,.188-190.
1
-34-
Guttman, L. (1954). A new approach to factor analysis: The radex. In P. F.Lazarsfeld (Ed.), Mathematical thinking in the social sciences.Glencoe, IL: Free Press.
Johnson, W. L. (1986). Intention-based diagnosis of novice programmingerrors. Los Altos, CA: Morgan Kaufmann Publishers.
Johnson, W. L., & Soloway, E. (1985). PaOUST: An automatic debugger forPascal programs. Byte, 10(4), 179-190.
Lazarsfeld, P. F. (1960). Latent structure analysis and test theory. In H.
Gulliksen and S. Messick (Eds.), Psychological scaling: Theory andapplications (pp. 83-86). New York: Wiley.
Lord, F. M. (1980). Applications of item response theory to practicaltesting problems. Hillsdale, NJ: Lawrence Erlbaum Associates.
Masters, G. N., & Mislevy, R. J. (in press). New views of student learning:Implications for educational measurement. In N. Frederiksen, R. J.Mislevy, and I. Bejar (Eds.), Test theory for a new _generation of tests.Hillsdale, NJ: Lawrence Erlbaum Associates.
Mislevy, R. J. (1983). Item response models for grouped data. Journal ofEducational Statistics, 8, 271-288.
Mislevy, R. J. (in press). A framework for studying differences betweenmultiple choice and free response. In R. E. Bennett & W. C. Ward(Eds.), Choice vs. construction in cognitive measurement. Hillsdale,NJ: Lawrence Erlbaum Associates.
Matz, M. (1982). Towards a process model for high school algebra. In D. H.Sleeman and J. S. Brown (Eds.), Intelligent tutoring systems. London:Academic Press, Inc.
Newell, A., & Simon, H. A. (1972). Human problem solving. Englewood Cliffs,NJ: Prentice-Hall.
Payne, S. J., & Squibb, H. R. (1990). Algebra mal-rules and cognitiveaccounts of error. Cognitive Science, 14, 445-481.
Rock, D. A., & Pollack, J. (1987). Measuring gains--A new look at an oldproblem. Paper presented at the Educational Testing Service/Departmentof Defense Conference, San Diego, CA.
Sebrechts, M. M., Bennett, R. E., & Rock, D. A. (1991). Machine-scorablecomplex constructed-response quantitative items: Agreement betweenexpert system and human raters' scores (RR-91-11). Princeton, NJ:Educational Testing Service.
Sebrechts, M. M., LaClaire, L., Schooler, L. J., & Soloway, E. (1986).
Toward generalized intention-based diagnosis: GIDE. In R. C. Ryan(Ed.), Proceedings of the 7th National Educational Computing Conference(pp. 237-242). Eugene, OR: International Council on Computers inEducation.

-35-
Sebrechts, M. M., Schooler, L. J., LaClaire, L., & Soloway, E. (1987).
Computer-based interpretation of students' statistical errors: Apreliminary empirical analysis of GIDE. Proceedings of the 8th NationalEducational Computing Conference (pp. 143-148). Eugene, OR:International Council on Computers in Education.
Sebrechts, M. M., & Schooler, L. J. (1C87). Diagnosing errors in statisticalproblem solving: Associative problem recognition and plan-based errordetection. Proceedings of the Ninth Annual Cognitive Science Meeting(pp. 691-703). Hillsdale, NJ: Lawrence Erlbaum Associates.
Tatsuoka, K. K. (1983). Rule space: An approach for dealing withmisconceptions based on item response thecry. Journal of EducationalMeasurement, 20, 345-354.
Tatsuoka, K. K., Birenbaum, M., & Arnold, J. (1989). On the stability ofstudents' rules of operation for solving arithmetic problems. Journalof Educational Measurement, 26, 351-361.
VanLehn, K. (1982). Bugs are not enough: Empirical studies of bugs,impasses and repairs in procedural skills. The Journal of MathematicalBehavior, 3(2), 3-71.
Wenger, E. (1987). Artificial intelligence and tutoring systems. Los Altos,CA: Morgan Kaufmann Publishers.
Wilson, D. T., Wood, R., & Gibbons, R. (1987). Testfact: Test scoring, itemstatistics, and item factor analysis. Mooresville, IN: Scientific
Software.
Wilson, M. (1989). Saltus: A psychometric model of discontinuity incognitive development. Psychological Bulletin, 105, 276-289.
Yamamoto, K. (1989a). Hybrid model of IRT and latent class models (RR-89-41). Princeton, NJ: Educational Testing Service.
Yamamoto, K. (1989b). HYBIL: A computer program to estimate Hybrid modelparameters [Computer program]. Princeton, NJ: Educational TestingService.

-37-
Footnotes
1. The association between the four major error categories and thethree scoring categories described earlier (computational, structural, missinggoal) is indirect. Mathematical errors were considered to be computationaland cost one point. General and specific plan errors may be computational(e.g., failing to reduce an'answer) or they may more obviously affect the planstructure (e.g., dividing when multiplication was called for), in which casetwo points were deducted. Missing-goal bugs always cost three points.
2. In part, the uniqueness of this latent class can be attributed to thefact that for any given goal, a missing-goal bug precludes the existence ofother errors. This dependency does not appear to be a strong one, however, asevidenced by the close similarity of the response.patterns for matchedexaminees and by the fact that latent class examinees more often than notcommit a missing goal in conjunction with a coherent attempt to solve othercomponents of the same problem.
tj

Appendix A
Items
41

-41-
Faulty Solution
A Department of Transportation road crew paves the 15 mile city portion of a37.4 mile route at the rate of 1 3 miles per day and paves the rest of theroute, which is outside the city, at a rate of 2.1 miles per day. If theDepartment of Transportation starts the project on day 11 of its workcalendar, on what day of its work calendar will the project be completed?
The active ingredient is 0.25 percent of a 3-ounce dose of a certain coldremedy. What is the number of doses a patient must take before receiving thefull 3 ounces of the active ingredient?
$3.50 in tolls is received each minute at an automated toll booth while therate at a booth with an operator is $2.80 each minute. How many minuteselapse before the automated booth receives $14.00 more in tolls than does theperson-operated booth?
Eauation Setup
Of the 720 pages of printed output of a certain program, 305 pages are printedon a printer that prints 15 pages per minute and the rest are printed on aprinter that prints at 50 pages per minute. If the printers run one after theother and printing starts at 10 minutes and 15 seconds after the hour, at whattime to the nearest second after the hour will the printing be finished?
A graphics designer earns 2% of a $1500 yearly bonus for each shift ofovertime she works. How many shifts of overtime must she work to earn theequivalent of the entire yearly bonus?
A specialty chemical company has patented a chemical process that involves 2reactions. Reaction 1 generates 24 grams of molecule B per minute andreaction 2 consumes 5 grams of molecule B per minute. If 4,560 grams ofmolecule B are desired as a product of this process, how many minutes must itcontinue?
Goal Specification
800 gallons of a 2,400 gallon tank flow in at the rate of 75 gallons per hourthrough a clogged hose. After the hose is unclogged, the rest of the tank isfilled at the rate of 250 gallons per hour. At what time to the nearestminute will the filling of the tank be finished if it starts at 5:30 a.m.?
On every $150 load of cement it delivers to a construction site, Acme CementCompany earns a 4 percent profit. How many loads must it deliver to the siteto earn $150 in profit?
One of two outlets of a small buslness is losing $500 per month while theother is making a profit of $1750 per month. In how many months will the netprofit of the small business be $35,000?
Open Ended
On a 600-hundred mile motor trip, Bill averaged 45 miles per hour for thefirst 285 miles and 50 miles per hour for the remainder of the trip. If he
started at 7:00 a.m., at what time did he finish the trip (to the nearestminute)?
Money in a certain investment fund earns an annual dividend of 5 percent ofthe original investment. In how many years will an initial investment of $750earn total dividends equal to the original investment?
How many minutes will it take to fill a 2,000-cubic-centimeter tank if waterflows in at the rate of 20 cubic centimeters per minute and is pumped out atthe rate of 4 cubic centimeters per minute?

Appendix B
Scoring Rubric
4 J

-45-
GRE Quantitative Constructed-Response Scoring Rubric
1. If the student provides two or more solutions, consider only the best one.In general, do not deduct credit if the student explicitly corrects errors.
2. Consider all available information including that in the "CalculationsSpace."
3. If only the final answer is present and it is correct, give full creditbecause there is no process on which to make any other decision. In all othercases, the total score for the problem is the sum of the scores for each goal.
4. Each goal is worth 3 points. Deduct points as follows:
a. Deduct 3 points if the goal is missing and is not implicitlysatisfied. A goal is considered missing when there is no reasonableattempt to solve for it. A goal is considered to be implicitlysatisfied if it can be inferred from other parts of the solution.
b. Deduct 2 points if the goal is present but contains an uncorrectedstructural error (e.g., inverting the dividend and the divisor,confusing operators). For a 0aoal to be considered present butstructurally incorrect, it must be clearly evident that the student ismaking an attempt--however misguided--to solve the goal (thereby showingawareness that solving for that goal is a step in the problem's solutionprocess). The minimal evidence needed to indicate such an attempt isthe presence of a reasonable expression bound to a label that can beunambiguously associated with that goal.
c. Deduct 1 point for each computational error within a present goal.Count as computational errors miscalculations (including those beyondthe required level of precision), transcription errors (valuesincorrectly copied from one part of the problem to another), errors incopying a given from the problem statement, conversion errors (unlessotherwise indicated), and, for the last goal only, failing to reduce thefinal answer to a single value. Only deduct for the same computationalerror once. For all computational errors, carry through the result tosubsequent goals, giving full credit to those subsequent goals if theyare structurally and computationally correct given their incorrectinput.
d. Deduct 1 point for failing to carry the result of a goal to therequired level of precision (i.e., two decimal places or the precisionrequired by the individual problem, whichever is greater).
e. Deduct 0 points if the goal is present and correct. A goal should beconsidered to be present and correct if (1) the result and the methodare correct, (2) the result is correct and the method is notidentifiably faulty, or (3) the method is correct and the result isincorrect only because the inputs to the gcal appropriately came from aprevious goal that incorrectly computed those inputs.
In making the above deductions, try to distinguish between errors that can beexplained by a single fault and those that are composites of two or more
4,:

-46-
faults. The following example could be conceived as a single error in whichthe student has mistakenly converted a decimal representation to time. This
would constitute a single error for which 1 point would be deducted.
Timel 10.67Timel 11 hr 7 min
In contrast, the following production could be interpreted as two separableerrors, one in failing to round 10.66 to 10.67 (the result of 800/75), and the
second in confusing decimal and time representations. For this goal, onepoint would be deducted for each of these computational mistakes.
Timel 800/75Timel 11 hr 6 min
5. Unless the final answer (the value on the ANSWER line) is redundant withthe culminating value in the student's solution, treat this final answer aspart of the solution proper. That is, in many student solutions the ANSWERline value is not redundant but instead represents the result of the student'slast goal. Such values should be included in scoring that goal.
6. Treat as equivalent the various operational notations (e.g., *, x, (), .);
mixed numbers and improper fractions (e.g., 81/3 e-.ad 25/3); numbers with and
without units (400 and 400 doses); and percentages, decimals, and fraction
equivalents (e.g., 1/4%, .25%, .0025, and 1/40).
7. Treat as correct a goal that is satisfied except for the presence of a unitconversion if that conversion is made in a subsequent goal. In the examplebelow, treat equivalently the conversion of hours to hours and minutes whetherit occurs in goal #5, goal #4, or in goals #1 and #2.
Problem: On a 600-hundred mile motor trip, Bill averaged 45 miles per hour for the first 285 miles
and 50 miles per hour for the remainder of the trip. If he started at 7:00 a.m., at what time did
he finish the trip (to the nearest minute)?
a. Timel = 285 miles / 45 miles per hour
Timel = 6.33 hours
b. Distance2 = 600 miles 285 miles
Distance2 = 315 miles
c. Time2 = 315 miles / 50 mile per hour
Time2 = 6.3 hours
d. Total time = 6.33 hours + 6.3 hours
Total time = 6 hours 20 min + 6 hours 18 min
Total time = 12 hours 38 min
e. Finish time = 7:00 am + 12 hours 38 min
Finish time 7:38 pm
(6.33 hours = 6 hours and 20 minutes)
(6.3 hour:. = 6 hours and 18 minutes)
(1:00 am + 12.63 hrs = 7:38 pm)
8. In some cases, the scoring key for a problem presents two alternative goaldecompositions. Score the examinee response according to the decompositionthat best characterizes the response. Be sure to use the same maximum scoresand the same point deduction rules regardless of the decomposition being usedto score the response. Under this rule, partially correct solutions that
4

-47-
follow more efficient decompositions will generally receive more points thansimilar quality solutions following less efficient decompositions:
9. The minimum score for a goal is 0 as is the minimum total score for asolution.

Appendix C
Bug Definitions

-51-
Canonical Solutions
Below are standard-form solutions. Following these canonical solutionsare uniquely named and numbered bugs, their definitions, and examples.Examples are shown as deviations from the canonical solutions. The solutionfrom which the example deviates is indicated by D-RT for distance problems, %for percent problems, and WORK for work problems. In most cases only therelevant modified lines are given. These lines are in most cases numbered andmatched to the canonical version.
D=RT (Five-Goal Problems)
1. Timel = 285 miles / 45 miles per hour2. Timel = 6.33 hours3. Distance2 - 600 miles 285 miles4. Distance2 = 315 miles5. Time2 = 315 miles / 50 miles per hour6. Time2 = 6.3 hours7. Total time = 6.33 hours + 6.3 hours8. Total time = 6 hours 20 min + 6 hours 18 min9. Total time = 12 hours 38 min10. Finish Time - 7:00 am + 12 hours 38 min11. Finish Time = 7:38 pm
Percent (%) (Three-Goal Problems)
Solution A:
1. 5% = .052. Annual Dividend = .05 * $7503. Annual Dividend - $37.504. Investment Time - $750 / $37.50 per year5. Investment Time - 20 years
Solution B:
1. 5% dividend per year * X years - 100% dividend2. X years - 100% dividend / 5 % dividend per year3. X - 20 years
Work (Two-Goal Problems)
1. Net filling rate - 20 cc per minute 4 cc per minute2. Net filling rate - 16 cc per minute3. Filling Time - 2000 cc / 16 cc per minute4. Filling Time - 125 minutes
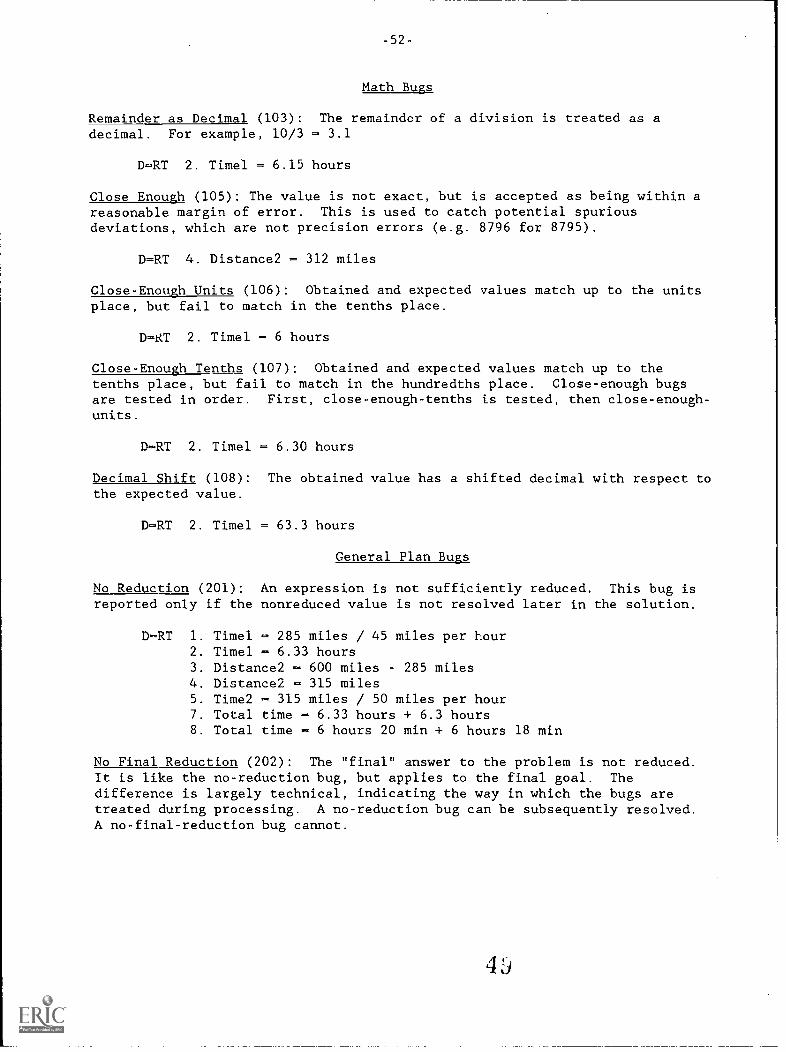
-52-
Math Bugs
Remainder as Decimal (103): The remainder of a division is treated as adecimal. For example, 10/3 = 3.1
D-RT 2. Timel = 6.15 hours
Close Enough (105): The value is not exact, but is accepted as being within areasonable margin of error. This is used to catch potential spuriousdeviations, which are not precision errors (e.g. 8796 for 8795).
D=RT 4. Distance2 - 312 miles
Close-Enough Units (106): Obtained and expected values match up to the unitsplace, but fail to match in the tenths place.
D=ItT 2. Timel - 6 hours
Close-Enough Tenths (107): Obtained and expected values match up to thetenths place, but fail to match in the hundredths place. Close-enough bugsare tested in order. First, close-enough-tenths is tested, then close-enough-units.
D-RT 2. Timel = 6.30 hours
Decimal Shift (108): The obtained value has a shifted decimal with respect tothe expected value.
D=RT 2. Timel = 63.3 hours
General Plan Bugs
No Reduction (201): An expression is not sufficiently reduced. This bug isreported only if the nonreduced value is not resolved later in the solution.
D-RT 1. Timel = 285 miles / 45 miles per hour2. Timel - 6.33 hours3. Distance2 - 600 miles - 285 miles4. Distance2 - 315 miles5. Time2 315 miles / 50 miles per hour7. Total time - 6.33 hours + 6.3 hours8. Total time - 6 hours 20 min + 6 hours 18 min
No Final Reduction (202): The "final" answer to the problem is not reduced.It is like the no-reduction bug, but applies to the final goal. Thedifference is largely technical, indicating the way in which the bugs aretreated during processing. A no-reduction bug can be subsequently resolved.A no-final-reduction bug cannot.

-53-
D-RT 1. Timel - 285 miles / 45 miles per hour2. Timel - 6.33 hours3. Distance2 600 miles - 285 miles4. Distance2 - 315 miles5. Time2 315 miles / 50 miles per hour6. Time2 - 6.3 hours7. Total time - 6.33 hours + 6.3 hours8. Total time - 6 hours 20 min + 6 hours 18 min9. Total time - 12 hours 38 min10. Finish Time - 7:00 am + 12 hours 38 min
Times for Divide (203): The student uses multiplication where division is
required.
D=RT 1. Timel - 285 miles * 45 miles per hour
Divide for Times (204): The student uses division where multiplication is
required.
StA 2. Annual Dividend - .05 / $750
Add for Subtract (205): Addition is used where subtraction is required.
D=RT 3. Distance2 = 600 miles + 285 miles
Unknown Value (206): The studenE uses a value in his or her solution thatfits the required structure, but that cannot otherwise be accounted for bymath or more specific plan errors.
D-RT 1. Timel - 285 miles2. Timel - 5
* 45 miles per hour
Out-of-Plan Value (207): A value used in a subsequent goal fits into theoverall plan structure, but it is unclear what the source of the value is.
D-RT 7. Total time =8. Total time =9. Total time =10. Finish Time11. Finish Time
5.6 hours + 5.3 hours5 hours 36 min + 5 hours 18 min10 hours 54 min- 7:00 am + 10 hours 54 min- 5:54 pm
Unexplained Value (208): A plan has a single unexplained value within thecorrect structure. This bug is used in INTEREST and WORK problems. D-RT uses
more specific bugs, 401 and 402.
WORK 3. Filling time - 2000 cc / 64 cc per minute
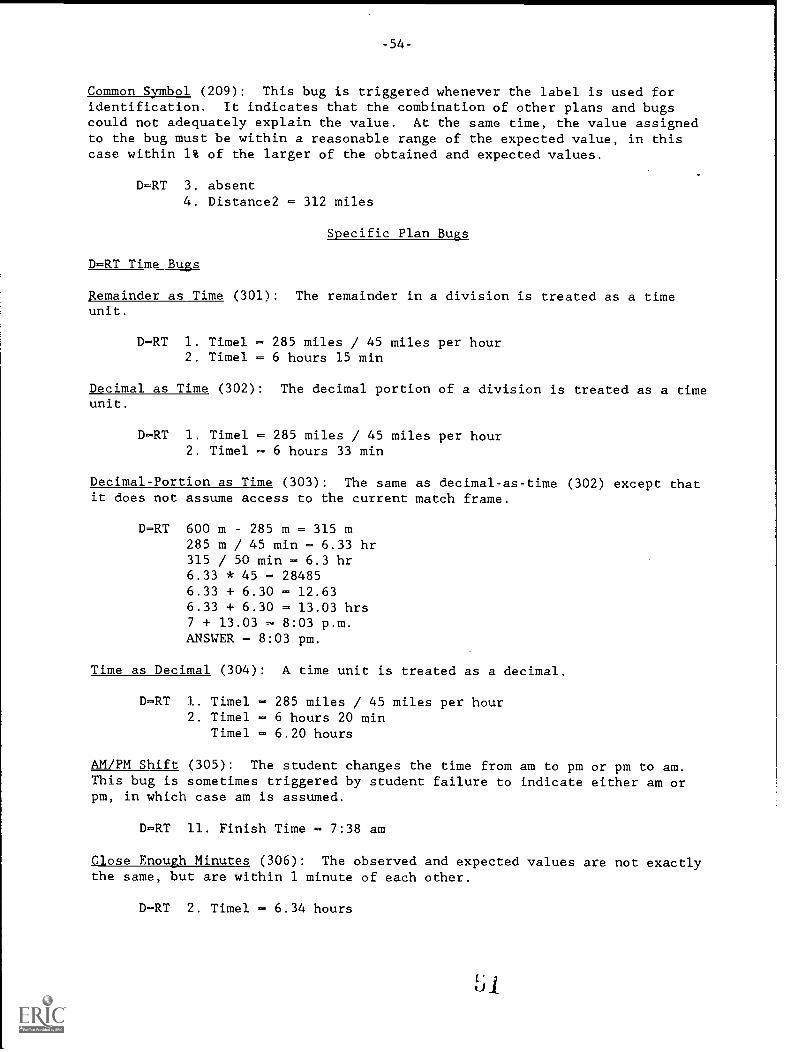
-54-
Common Symbol (209): This bug is triggered whenever the label is used foridentification. It indicates that the combination of other plans and bugscould not adequately explain the value. At the same time, the value assignedto the bug must be within a reasonable range of the expected value, in thiscase within 1% of the larger of the obtained and expected values.
D-RT 3. absent4. Distance2 = 312 miles
Specific Plan Bugs
D-RT Time Bugs
Remainder as Time (301): The remainder in a division is treated as a timeunit.
D-RT 1. Timel - 285 miles / 45 miles per hour2. Timel - 6 hours 15 min
Decimal as Time (302): The decimal portion of a division is treated as a timeunit.
D-RT 1. Timel - 285 miles / 45 miles per hour2. Timel - 6 hours 33 min
Decimal-Portion as Time (303): The same as decimal-as-time (302) except thatit does not assume access to the current match frame.
Time
D-RT 600 m - 285 m = 315 m285 m / 45 min - 6.33 hr315 / 50 min - 6.3 hr6.33 * 45 - 284856.33 + 6.30 - 12.636.33 + 6,30 - 13.03 hrs7 + 13.03 - 8:03 p.m.ANSWER - 8:03 pm.
as Decimal (304): A time unit is treated as a decimal.
D-RT 1. Timel - 285 miles / 45 miles per hour2. Timel - 6 hours 20 min
Timel - 6.20 hours
AM/PM Shift (305): The student changes the time from am to pm or pm to am.This bug is sometimes triggered by student failure to indicate either am orpm, in which case am is assumed.
D-RT 11. Finish Time - 7:38 am
Close Enough Minutes (306): The observed and expected values are not exactlythe same, but are within 1 minute of each other.
D-RT 2. Timel - 6.34 hours
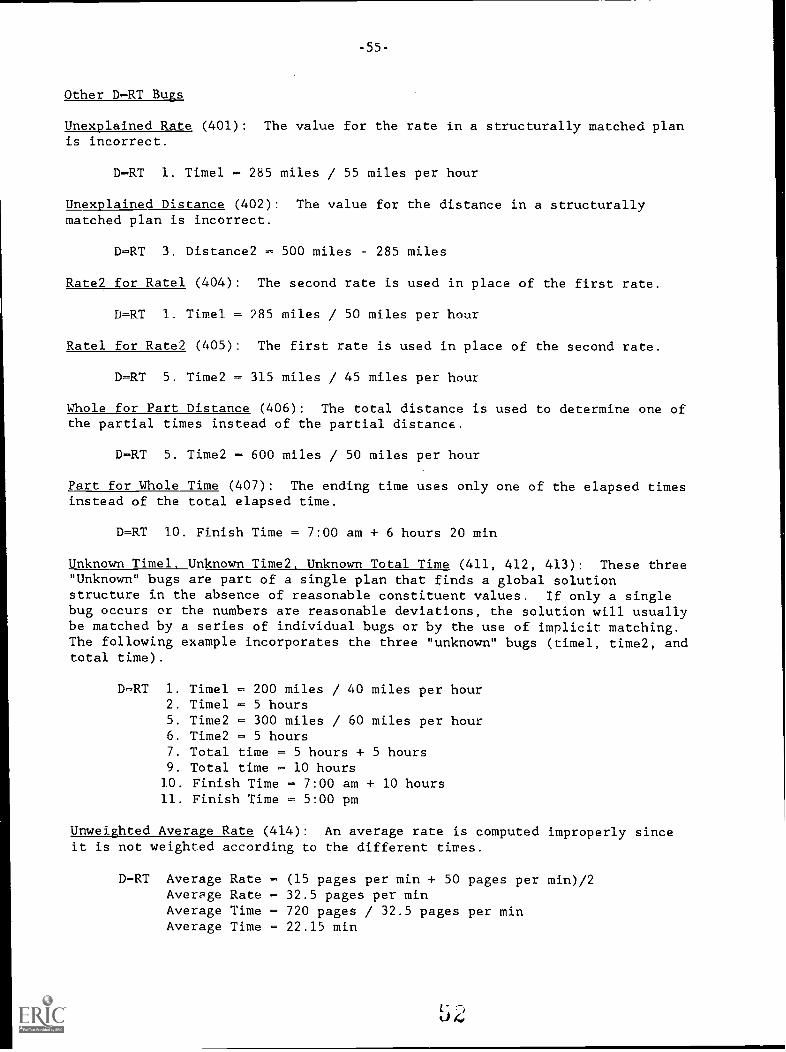
-55-
Other D-RT Bugs
Unexplained Rate (401): The value for the rate in a structurally matched planis incorrect.
D-RT 1. Timel - 285 miles / 55 miles per hour
Unexplained Distance (402): The value for the distance in a structurallymatched plan is incorrect.
D-RT 3. Distance2 - 500 miles - 285 miles
Rate2 for Ratel (404): The second rate is used in place of the first rate.
D=RT 1. Timel - 285 miles / 50 miles per hour
Ratel for Rate2 (405): The first rate is used in place of the second rate.
D-RT 5. Time2 = 315 miles / 45 miles per hour
Whole for Part Distance (406): The total distance is used to determine one ofthe partial times instead of the partial distance.
D-RT 5. Time2 - 600 miles / 50 miles per hour
Part for Whole Time (407): The ending time uses onlyinstead of the total elapsed time.
D-RT 10. Finish Time = 7:00 am + 6 hours 20 min
one of the elapsed times
Unknown Timel, Unknown Time2. Unknown Total Time (411, 412, 413): These three"Unknown" bugs are part of a single plan that finds a global solutionstructure in the absence of reasonable constituent values. If only a singlebug occurs or the numbers are reasonable deviations, the solution will usuallybe matched by a series of individual bugs or by the use of implicit matching.The following example incorporates the three "unknown" bugs (timel, time2, andtotal time).
D-RT 1. Timel - 200 miles / 40 miles per hour2. Timel - 5 hours5. Time2 - 300 miles / 60 miles per hour6. Time2 - 5 hours7. Total time - 5 hours + 5 hours9. Total time - 10 hours
10. Finish Time - 7:00 am + 10 hours11. Finish Time - 5:00 pm
Unweighted Average Rate (414): An average rate is computed improperlyit is not weighted according to the different times.
D-RT Average RateAverage RateAverage TimeAverage Time
- (15 pages per min + 50 pages per min)/2- 32.5 pages per min- 720 pages / 32.5 pages per min= 22.15 min
since

-56-
Percent Bugs
Percent as Decimal (501): The percent value is treated as a decimal (e.g. 5%
is treated as 5.0).
%A 1. absent2. Annual Dividend - 5 * $7503. Annual Dividend - $37504. Investment Time = $750 / $3750 per year5. Investment Time - 0.20 years
Decimal as Percent (502): A decimal value is treated as a percent (e.g., .05
as if it were .05% or .0005).
%A 2. Annual Dividend = 0.05 * $7503. Annual Dividend - $0.3750
MiXed Percent and Decimal (503): The student mixes decimal and percent
values.
%B 1. 0.05 dividend per year * X years = 100% dividend2. X years - 100% dividend / 0.05 dividend per year3. X - 2000 years
Result per Unit-Amount/Rate (504): The dividend is calculated as a divisionof investment by rate instead of a multiplication of investment times therate. This bug also applies to calculating the profit per load, amount earnedper shift, and active ingredient per dose.
%A 2. Annual Dividend - $750 / 0.05
Work Bugs
Subtract Order (603): The items are subtracted in the wrong order (i.e.,volume out minus volume in).
WORK 1. Net filling rate - 4 cc per minute - 20 cc per min
Missing Coals
These tugs indicate that the stated goal is missing. No goal can haveany other associated bug if it is "missing."

-57-
D-RT Bugs
Missing First Goal (911): Timel is missing. The goal takes the canonicalform, Timel - Distancel / Ratel.
D-RT 3. Distance2 - 600 miles - 285 miles4. Distance2 315 miles5. Time2 315 miles / 50 miles per hour6. Time2 - 6.3 hours10. Finish Time - 7:00 am + 12 hours 38 min11. Finish Time - 7:38 pm
Missing Second Goal (912): Distance2 is missing. The goal takes the- Total Distance - Distancel. .canonical form, Distance2
D-RT 1. Timel = 285 miles / 45 miles per hour2. Timel - 5.7 hours5. Time2 2.85 miles / 50 miles per hour6. Time2 - 6.3 hours7. Total time - 5.7 hours + 6.3 hours8. Total time - 5 hours 42 min + 6 hours 18 min9. Total time - 12 hours10. Finish Time - 7:00 am + 12 hours11. Finish Time - 7:00 pm
Missing Third Goal (913): Time2 is missing The goal takes the canonicalform, Time2 Distance2 / Rate2.
D-RT 1. Timel - 285 miles / 45 miles per hour2. Timel - 6.33 hours3. Distance2 = 600 miles - 285 miles4. Distaace2 - 315 miles10. Finish Time - 7:00 am + 6 hours 20 min11. Finish Time - 1:20 pm
Missing Fourth Goal (914): Total Time is missing. The goal takes th(canonical form, Total Time - Timel + Time2.
D-RT 1. Timel - 285 miles / 45 miles per hour2. Timel - 6.33 hours3. Distance2 - 600 miles - 285 miles4. Distance2 315 miles5. Time2 315 miles / 50 miles per hour6. Time2 - 6.3 hours10. Finish Time - 7:00 am + 6 hours 20 min11. Finish Time - 1:20 pm

-58-
Missing Fifth Goal (915): Finish Time is missing. The goal takes thecanonical form, Finish Time = Start Time + Total Time.
D-RT 1. Timel - 285 miles / 45 miles per hour2. Timel = 6.33 hours3. Distance2 - 600 miles - 285 miles4. Distance2 = 315 miles5. Time2 = 315 miles / 50 miles per hour6. Time2 - 6.3 hours7. Total time = 6.33 hours + 6.3 hours8. Total time - 6 hours 20 min + 6 hours 18 min9. Total time = 12 hours 38 min
Percent Bugs
Missing First Goal (921): The Percent Conversion is missing. The goal takesthe canonical form, Decimal - .01 * percent
Missing Second Goal (922): Annual Dividend is missing. The goal takes thecanonical form, Annual Dividend - Rate Per Year * Investment.
4. Investment Time = $750 / 55. Investment Time = 150 years
Missing Third Goal (923): Investment Time is missing. The goal takes thecanoltical form, Investment Time - Investment / Dividends Per Year.
%A 1. 5% - .052. Annual Dividend = .05 * $7503. Annual Dividend = $37.50
Work Bugs
Missing First Goal (931): Net Filling Rate is missing. The goal takes thecanonical form, Net Filling Rate - Rate In - Rate Out.
WORK 3. Filling time = 2000 cc / 20 cc per minute4. Filling time = 100 minutes
Missing Second Goal (932): Filling Time is missing. The goal takes thecanonical form, Fill Time= Volume / Net Rate.
WORK 1. Net filling rate - 20 cc per minute - 4 cc per minute2. Net filling rate = 16 cc per minute

Appendix D
Bug Incidence by Item
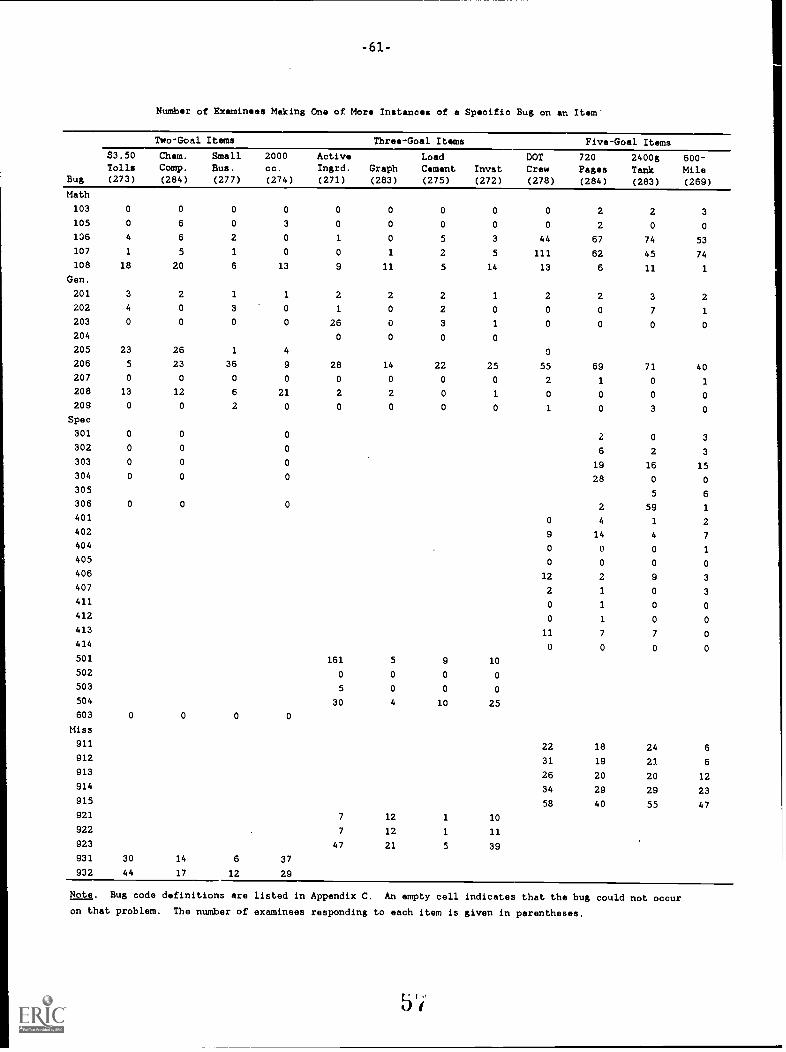
-61-
Number of Examinees Making One of More Instances of a Specific Bug on an /tem'
Two-Goal Items Three-Goal Items Five-Goal Items
$3.50Tolls
Chem.
Comp.
SmallBus.
2000
cc.
ActiveIngrd. Graph
Load
Cement InvstDOT
Crew720
Pages2400gTank
600-
MileBug (273) (284) (277) (274) (271) (283) (275) (272) (278) (284) (283) (269)
Math
103 0 0 0 0 0 0 0 0 0 2 2 3
105 0 6 0 3 0 0 0 2 0 0
106 4 6 2 0 1 0 5 3 44 67 74 53
107 1 5 1 0 0 1 2 5 111 62 45 74
108 18 20 6 13 9 11 5 14 13 6 11 1
Gen.
201 3 2 1 1 2 2 2 1 2 2 3 2202 4 0 3 0 1 0 2 0 0 0 7 1
203 0 0 0 0 26 0 3 1 0 0 0 0204 0 0 0 0
205 23 26 1 4 0
206 5 23 36 9 28 14 22 25 55 69 71 40207 0 0 0 0 0 0 0 0 2 1 0 1
208 13 12 6 21 2 2 0 1 0 0 0 0
209 0 0 2 0 0 0 0 0 1 0 3 0
Spec
301 0 0 0 2 0 3
302 0 0 0 6 2 3303 0 0 0 19 16 15304 0 0 0 28 0 0
305 5 6306 0 0 0 2 59 1
401 0 4 1 2402 9 14 4 7
404 0 0 0 1
405 0 0 0 0
406 12 2 9 3
407 2 1 0 3
411 0 1 0 0
412 0 1 0 0
413 11 7 7 0
414 0 0 0 0
501 161 5 9 10
502 0 0 0 0
503 5 0 0 0
504 30 4 10 25
603 0 0 0 0
Miss
911 22 18 24 6
912 31 19 21 6
913 26 20 20 12914 34 29 29 23915 58 40 55 47
921 7 12 1 10
922 7 12 1 11
923 47 21 5 39
931 30 14 6 37
932 44 17 12 29
Note. Bug code definitions are listed in Appendix C. An empty cell indicates that the bug could not occur
on that problem. The number of examinees responding to each item is given in parentheses.
b`r

-62-
Specific Bugs as Percentages of the Number of Examinees Responding to an Item
Two-Goal Items Three-Goal Items Five-Goal Items
$3.50Tolls
Chem.
Comp.
SmallBus.
2000
cc.
ActiveIngrd. Graph
LoadCement Invst
DOTCrew
720
Pages2400g
Tank /
600-
Mile
Bug (273) (284) (277) (274) (271) (283) (275) (272) (278) (284) (-285'Y (269)
Math
103 0% 0% 0% 02 02 02 02 0% 0% 1% 1% 1%
105 0% 22 02 12 0% 0% OZ 0% 0% 1% 02 0%
106 1% 2% 12 0% 0% 0% 22 12 16% 24% 26% 20%
107 0% 2% 0% 0% 0% 0% 1% 2% 40% 22% 16% 28%
108 7% 7% 2% 52 3% 42 27. 5% 52 22 4% 0%
Gen.
201 1% 1% 0% 02 1% 1% 1% 02 1% 12 1% 1%
202 1% 0% 1% OX 02 0% 1% 0% OX 02 2% 02
203 02 02 02 02 102 OX 12 0% 0% 0% 0% OZ
204 0% 0% 02 0%
205 8% 9% 0% 1% 0%
206 2% 8% 132 3% 10% 5% 8% 9% 20% 24% 25% 152
207 02 0% 0% 0% 0% 0% 0% 0% 12 0% 02 0%
208 5% 42 2% 82 1% 1% 0% 0% 0% 02 0% 0%
209 0% 0% 12 OZ 0% 0% 02 0% 0% 0% 1% 0%
Spec
301 0% 0% 02 1% 0% 1%
302 0% 0% 0% 22 1% 12
303 OZ 02 02 7% 6% 6%
304 0% 0% 0% 10% 0% 0%
305 2% 2%
306 02 02 0% 12 21% 0%
401 02 1% 02 1%
402 3% 5% 1% a%
404 0% 02 0% 02
405 OZ 02 0% 0%
406 4% 1% 3% 12
407 1% 0% 0% 1%
411 0% 02 0% 0%
412 0% 0% 0% 0%
413 42 22 2% 0%
414 0% 0% 0% 0%
501. 59% 2% 32 42
502 0% 0% 0% 0%
503 22 0% 02 OX
504 112 1% 42 9%
603 0% 02 0% 02
Miss
911 8% 6% 8% 2%
912 11% 7% 72 2%
913 92 7% 7% 4%
914 12% 10% 10% 9%
915 212 14% 19% 17%
921 3% 4% 0: 4%
922 3% 42 02 4%
923 17% 7% 2% 14%
931 11% 5% 22 14%
932 16% 6% 4% 11%
Note. Bug code definitions are listed in Appendix C. An empty cell indicates that the bug could not occur
o'a that proklem. The number of examinees responding to each item is given in parentheses.

54020-07473 .Y121M.7 209075
BEST COPY AVAILABLE 59