Analytical Raman spectroscopic study of cacao seeds and their chemical extracts
6
Analytica Chimica Acta 538 (2005) 175–180 Analytical Raman spectroscopic study of cacao seeds and their chemical extracts Howell G. M. Edwards a , Susana E. Jorge Villar b , Luiz Fernando C. de Oliveira c,∗ , Mireille Le Hyaric c a Chemical and Forensic Sciences, The School of Pharmacy, University of Bradford, Bradford BD7 1DP, UK b Dpto. de Didacticas Especificas, Area Geodinamica Interna, Universidad de Burgos, Calle Villadiego s/n, 09001 Burgos Spain c N´ ucleo de Espectroscopia e Estrutura Molecular, Departamento de Qu´ ımica, Universidade Federal de Juiz de Fora Campus Universit´ ario, Juiz de Fora, MG, 36036-330, Brazil Received 12 November 2004; received in revised form 8 February 2005; accepted 15 February 2005 Available online 16 March 2005 Abstract A Raman spectroscopic study of cacao seeds and their extracts has been successful in the identification of biomarker bands for theobromine, a member of the caffeine group of alkaloids. Unlike caffeine detected in guarana, the spectral signatures of theobromine suggest that it occurs as the free base in cacao. No theophylline or caffeine alkaloids were detected in cacao. Raman spectroscopic monitoring of the heptane and ethyl acetate organic extracts of pulverised cacao seeds demonstrates the removal of the fatty and waxy components whereas the methanol extract is found to remove and concentrate the highly coloured aromatic polyphenolic compounds. The theobromine alkaloid is still detectable in the solid residues from the extractions. This study suggests that Raman spectroscopic monitoring of cacao seed processing should be investigated further for the purposes of industrial process analytical control. © 2005 Elsevier B.V. All rights reserved. Keywords: Cacao; Raman spectroscopy; Theobromine; Seed extractions 1. Introduction Cacao (Sterculiaceae theobroma cacao L.), commonly named kakao, cacau, criollo or cacaoyer, is the starting mate- rial for chocolate production. It is known in popular medicine as an antiseptic, diuretic and parasiticide [1]. More recently, studies have shown that cacao liquor extract acts therapeu- tically on rats with hepatocarcinogenesis, targetting mainly the tumour marker enzymes and having the potential in de- creasing the severity of this disease [2]. Chemically, cacao seeds contain 40–50% of fat (cacao butter, oleum theobro- matis, oil of cacao), a free alkaloid base theobromine (con- tent 0.9–2.4%), caffeine (0.05–0.35%), starch (1.3–7.5%), a red phenolic pigment, cacao red and ca. 30 g of -carotene [3–6]. ∗ Corresponding author. Tel.: +55 32 3229 3310; fax: +55 32 32293314. E-mail address: [email protected] (L.F.C. de Oliveira). Cacao butter is by far the most important chemical compo- nent of cacao, since its physical and chemical characteristics provide specific functional properties of great demand in the food, pharmaceutical and cosmetic industries, related to the fact that cacao butter is considered the main transport and sus- pension medium for cacao powder, chocolate liquor, sugar and several other ingredients used in chocolate production [7]. In this sense, the analytical determination of the chemi- cal components in cacao is of great importance industrially, especially for the quality control. There are several analyti- cal methods described in the literature for the analysis of the chemical content of cacao seeds, including gas and liquid chromatography and mass spectrometry [7–16]; however, all of these are destructive of sample and can be time-consuming. A recent investigation has shown the capability of Raman mi- croscopy in analysing foods in general and in particular the fatty content of cacao [17]. However, this study was not spe- cific in analysing the molecular vibrations that could be used 0003-2670/$ – see front matter © 2005 Elsevier B.V. All rights reserved. doi:10.1016/j.aca.2005.02.039
Transcript of Analytical Raman spectroscopic study of cacao seeds and their chemical extracts

Analytica Chimica Acta 538 (2005) 175–180
Analytical Raman spectroscopic study ofcacaoseedsand their chemical extracts
Howell G. M. Edwardsa, Susana E. Jorge Villarb,Luiz Fernando C. de Oliveirac,∗, Mireille Le Hyaricc
a Chemical and Forensic Sciences, The School of Pharmacy, University of Bradford, Bradford BD7 1DP, UKb Dpto. de Didacticas Especificas, Area Geodinamica Interna, Universidad de Burgos, Calle Villadiego s/n, 09001 Burgos Spain
c Nucleo de Espectroscopia e Estrutura Molecular, Departamento de Qu´ımica, Universidade Federal de Juiz de Fora CampusUniversitario, Juiz de Fora, MG, 36036-330, Brazil
Received 12 November 2004; received in revised form 8 February 2005; accepted 15 February 2005Available online 16 March 2005
Abstract
bromine,a hat it occursa ande ethanole detectablei bei©
K
1
nrasttcsmtr[
po-isticsthe
o thesus-arctionemi-ly,lyti-f theid
lming.mi-
r thee-sed
0d
A Raman spectroscopic study ofcacaoseeds and their extracts has been successful in the identification of biomarker bands for theomember of the caffeine group of alkaloids. Unlike caffeine detected in guarana, the spectral signatures of theobromine suggest ts the free base incacao. No theophylline or caffeine alkaloids were detected incacao. Raman spectroscopic monitoring of the heptanethyl acetate organic extracts of pulverisedcacaoseeds demonstrates the removal of the fatty and waxy components whereas the mxtract is found to remove and concentrate the highly coloured aromatic polyphenolic compounds. The theobromine alkaloid is still
n the solid residues from the extractions. This study suggests that Raman spectroscopic monitoring ofcacaoseed processing shouldnvestigated further for the purposes of industrial process analytical control.
2005 Elsevier B.V. All rights reserved.
eywords: Cacao; Raman spectroscopy; Theobromine; Seed extractions
. Introduction
Cacao (Sterculiaceae theobroma cacaoL.), commonlyamed kakao, cacau, criollo or cacaoyer, is the starting mate-ial for chocolate production. It is known in popular medicines an antiseptic, diuretic and parasiticide[1]. More recently,tudies have shown thatcacaoliquor extract acts therapeu-ically on rats with hepatocarcinogenesis, targetting mainlyhe tumour marker enzymes and having the potential in de-reasing the severity of this disease[2]. Chemically,cacaoeeds contain 40–50% of fat (cacaobutter,oleum theobro-atis,oil of cacao), a free alkaloid base theobromine (con-
ent 0.9–2.4%), caffeine (0.05–0.35%), starch (1.3–7.5%), aed phenolic pigment,cacaored and ca. 30�g of �-carotene3–6].
∗ Corresponding author. Tel.: +55 32 3229 3310; fax: +55 32 32293314.E-mail address:[email protected] (L.F.C. de Oliveira).
Cacaobutter is by far the most important chemical comnent of cacao, since its physical and chemical characterprovide specific functional properties of great demand infood, pharmaceutical and cosmetic industries, related tfact thatcacaobutter is considered the main transport andpension medium forcacaopowder, chocolate liquor, sugand several other ingredients used in chocolate produ[7]. In this sense, the analytical determination of the chcal components incacaois of great importance industrialespecially for the quality control. There are several anacal methods described in the literature for the analysis ochemical content ofcacaoseeds, including gas and liquchromatography and mass spectrometry[7–16]; however, alof these are destructive of sample and can be time-consuA recent investigation has shown the capability of Ramancroscopy in analysing foods in general and in particulafatty content ofcacao[17]. However, this study was not spcific in analysing the molecular vibrations that could be u
003-2670/$ – see front matter © 2005 Elsevier B.V. All rights reserved.oi:10.1016/j.aca.2005.02.039

176 H.G. M. Edwards et al. / Analytica Chimica Acta 538 (2005) 175–180
as biomarkers i.e. the vibrational bands that are characteristicof the main components in each system which are responsiblefor the spectral signatures. In recent years, we have been ableto describe the use of Raman spectroscopy as a powerful toolin the analytical and spectroscopic description of complexchemical systems in archaeological[18], botanical[19,20],and food[21,22] samples; in all of these it has been possi-ble to describe the key vibrational biomarkers of significancefor the characterisation of genuine materials and from whichprocess information can follow.
The main purpose of this current study is the identificationof key biomolecules using Fourier-transform Raman spec-troscopy which has hitherto been described as a successfulnon-destructive technique employed in analytical investiga-tions of natural products.Cacaoseeds were extracted andthe Raman spectra of the raw materials and of successive sol-vent extractions were analysed, specifically for the presenceof the alkaloid theobromine. The results obtained here willbe applicable in several fields for quality control procedures,including the pharmaceutical and food industries, whereca-cao seeds have been used as a raw material for a range ofmanufactured products.
2. Experimental
2
radep mS eres
2
( hex-a Allt con-c ion, a
sample of the seed residue (C2, C4, and C6) was separatedand air-dried before analysis.
In addition, samples C7 and C8 were supplied as peeled,wholecacaoseeds and unpeeled, whole seeds, respectively.
2.3. Raman spectroscopy
Fourier-transform Raman spectroscopy was carried out inthe macroscopic mode with a specimen footprint of about 100microns using a Bruker IFS 66 instrument with an FRA 106Raman module attachment and a Nd3+/YAG laser operatingat 1064 nm in the near infrared and InGaAs detector cooledwith liquid N2. To improve the signal-to-noise ratios, 2000scans were accumulated over a period of about 30 min, usinga 4 cm−1 spectral resolution. All spectra were obtained sev-eral times as replicates from each sample provided to showreproducibility; no changes in band positions and intensitieswere observed between replicates.
3. Results and discussion
3.1. Raman spectroscopic analysis
The solid samples comprise the whole seed (C8); a peeledwhole seed (C7); a ground, dried specimen of the same (C0);t ; andm . Thefi om-p ld bep etatea
l-l om4 to5 7%,a sentsa 35.0t %)a lsop 0%)[ s ares turals erthe-l ernela amanba trumo t3 con-s heseid -r urec as-s ulder
.1. Specimens
All the reagents and solvents used were analytical gurchased from Aldrich. Thecacaoseeds were obtained froalvador (Bahia, Brazil) and after drying and peeling, wubjected to mechanical grinding.
.2. Extraction technique
According toScheme 1, about 50 g of groundcacaoseedsC0) were extracted in a Soxhlet apparatus first withne, then with ethyl acetate and finally with methanol.
he extracts (C1, C3, and C5, respectively) were thenentrated under reduced pressure. After each extract
Scheme 1.
he solid residues from heptane (C2); ethyl acetate (C4)ethanol (C6) extractions of the powdered dried seeds
rst heptane extraction would remove the nonpolar fatty counds (C1), and then the more polar components wourogressively removed from the residues using ethyl acnd methanol (C3 and C5 samples).
The chemical composition ofcacaoseed shows the foowing approximate composition (g/100 g): moisture fr.35 to 7.0%; protein from 14.7 to 20.50%; fat from 46.06.0%; ash from 3.6 to 5.3%; crude fibre from 4.2 to 8.nd carbohydrates from 8.7 to 28.2%. The fat content pren average composition that is richer in oleic acid (from
o 41.0%), followed by stearic acid (from 34.0 to 39.9nd palmitic acid (from 23.0 to 30.0%); some cultivars aresent a small content of linoleic acid (about 2.0–3.
6,7]. The Raman spectra of the C0, C7, and C8 samplehown inFig. 1. The Raman spectrum of the unpeeled, naeed consists of several rather broad features which, nevess, make an interesting comparison with the peeled knd the bulk, ground, dried and seed kernel. The main Rands of the C0 sample can be seen inTable 1, together withtentative vibrational assignment. The FT-Raman specf the latter consists of several CH stretching vibrations a000–2850 cm−1, and some sharp bands which can beidered as key features of the kernel and fat matrix; tnclude C O stretching bands at 1743 and 1730 cm−1 (shoul-er), (C C) + (C O) stretching at 1659 cm−1 and a broad unesolved aromatic CCH quadrant stretching mode featentred at 1609 cm−1. The former Raman band can beigned to carbonyl ester stretching vibration, and the sho

H.G. M. Edwards et al. / Analytica Chimica Acta 538 (2005) 175–180 177
Fig. 1. FT-Raman spectra of C0, C7, and C8cacaosamples. See Section2andScheme 1for details.
at 1730 cm−1 can be assigned to carbonyl stretching from thecellulosic structure in the seeds[23]. Strong C H deforma-tion bands at 1461 and 1442 cm−1 and weaker, asymmetricdeformations at 1366 and 1332 cm−1 are also noted, but thestrong, sharp feature at 1297 cm−1 and the triplet at 1129,1097, and 1060 cm−1 dominate the central region of thisspectrum; the former is probably a CH2 deformation mode,whereas the latter are assignable to (CO) + (C CH) cou-pled stretching modes. The features at 889 cm−1, sharp, and780, 760 (broad), 766 (shoulder), and 608 cm−1 (broad) are
Table 1Main Raman wavenumbers (cm−1) from C0 sample
Wavenumber (cm−1) Tentative assignment
3002 sh νasym(CH)2956 sh ν(CH)2929 sh ν(CH)2881 vs ν(CH)2849 s ν(CH)2724 w1743 w ν(C O) of ester (from fatty acids)1730 sh ν(C O)1659 w ν(C O) +ν(C C)1609 w ν(CCH)1531 vw �(C C) in carotenoids and red compounds1461 sh δ(CH)1442 s δ(CH)11111111877664
assignable to (CC) and (CCO) stretching modes. The pres-ence of cellulosic glycosides in the rind of the seeds wouldalso give rise to features in the region of 700–1100 cm−1.Weaker bands below 600 cm−1 are complex modes whichcould contain components from CCO and CCC deformations.The sequence of weaker features at 1531 and 1177 cm−1 arereasonably assigned to conjugated CC and C C modes fromcarotenoids in the seed specimen[24].
The peeled, whole kernel by comparison, has a ratherbroader spectral distribution, but generally, many of the fea-tures are the same as those of the whole seed—with bandsat 1741, 1655, 1608, 1442, 1367, 1332, 1302, 1274, 1014,1002, 974, 867, 782, 726, 618, 433, and 365 cm−1 (see as-signment atTable 1). However, bands at 1400 cm−1 and thesignificant doublets at 1129, 1097 cm−1 1060, and 889 cm−1
are now missing. The unpeeled, whole seed ofcacaogivesan even broader, more diffuse spectrum, but the major spec-tral features noted for the powdered and peeled seeds arestill identifiable. However, the (CO) stretching mode near1740 cm−1 is absent, since there is now a larger contributionfrom the cellulosic compounds[23], and the (CC) stretchingmode near 1659 cm−1 is considerably reduced in intensity.The relative intensity of the strong sharp bands near 1440 and1297 cm−1 is reduced and the spectral signatures of the as-signed carotenoid component are somewhat increased here.
More significantly, however, the bands near 1129, 1097,a noti re thel ) andC e ba-s ntlygs rest-i fiablei ayero ker-n ilarc
(C1)i m-p d areds ndsa( tow )e 0( -v -c ntsa cids[ ns oils[ id is
366 vw δ(CH)332 w δ(CH)297 s δ(CH2)272 sh δ(CH)170 vw ν(C C) in carotenoid129 m ν(C O) +ν(C CH)097 wm ν(C O) +ν(C CH)060 m ν(C O) +ν(C CH)89 w ν(C C) +ν(CCO)80 w ν(C C) +ν(CCO)66 sh ν(C C) +ν(CCO)20 sh δ(C C C)08 w ν(C C) +ν(CCO)
78 vw δ(CCO + CCC)tp of a
nd 1060 cm−1 seen in the bulk, powdered kernel, butn the peeled whole seed kernel are now present, as aower wavenumber bands assignable to glycosidic (COCCO modes. We can interpret this spectral data on this of the seed kernel outer layer containing predominalycosidic components, with little or no aromatic or (CC)tretching mode from unsaturated components. It is inteng that these latter components are seen to be identin the bulk seed powder; this could be attributed to a lf intermediate composition underlying the rind and theel, which is relatively poorer in glycosides but has a simontent in aromatic and carotenoid components.
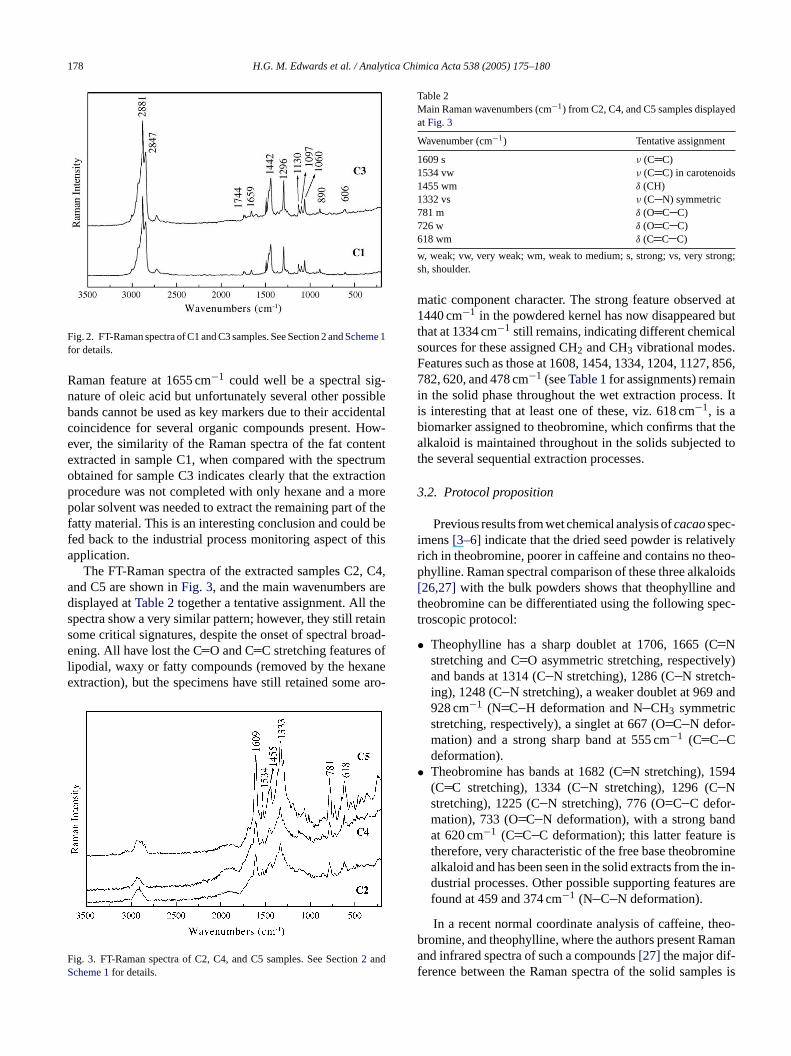
The Raman spectrum of the extracted fat compoundss shown inFig. 2together with the spectrum of the C3 sale. It can be seen that both spectra are very similar anominated by the very strong features in the CH2 and CH3ymmetric stretching region; other medium intensity bare present at 1442 cm−1 (CH2 deformation) and 1296 cm−1
in phase methylene twisting motion), whereas mediumeak intensity bands are present at 1744 (CO stretchingster, 1659 (CC stretching), 1130 (CC stretching),106C O deformation) and 880 cm−1 (C CH deformation). Preious work carried out on severalTheobromonaspecies, inludingT. cacao, has shown that the main fat constituere oleic (C18:1), stearic (C18:0), and palmitic (C16:0) a
7]. The comparison of our data forcacaowith recent Ramapectroscopic analytical work on the unsaturates in olive25] shows little resemblance, however, since oleic ache major component of olive oil and incacaobutter this isresent as a relatively minor component. The presence
178 H.G. M. Edwards et al. / Analytica Chimica Acta 538 (2005) 175–180
Fig. 2. FT-Raman spectra of C1 and C3 samples. See Section2andScheme 1for details.
Raman feature at 1655 cm−1 could well be a spectral sig-nature of oleic acid but unfortunately several other possiblebands cannot be used as key markers due to their accidentalcoincidence for several organic compounds present. How-ever, the similarity of the Raman spectra of the fat contentextracted in sample C1, when compared with the spectrumobtained for sample C3 indicates clearly that the extractionprocedure was not completed with only hexane and a morepolar solvent was needed to extract the remaining part of thefatty material. This is an interesting conclusion and could befed back to the industrial process monitoring aspect of thisapplication.
The FT-Raman spectra of the extracted samples C2, C4,and C5 are shown inFig. 3, and the main wavenumbers aredisplayed atTable 2together a tentative assignment. All thespectra show a very similar pattern; however, they still retainsome critical signatures, despite the onset of spectral broad-ening. All have lost the CO and C C stretching features oflipodial, waxy or fatty compounds (removed by the hexaneextraction), but the specimens have still retained some aro-
FS
Table 2Main Raman wavenumbers (cm−1) from C2, C4, and C5 samples displayedatFig. 3
Wavenumber (cm−1) Tentative assignment
1609 s ν (C C)1534 vw ν (C C) in carotenoids1455 wm δ (CH)1332 vs ν (C N) symmetric781 m δ (O C C)726 w δ (O C C)618 wm δ (C C C)
w, weak; vw, very weak; wm, weak to medium; s, strong; vs, very strong;sh, shoulder.
matic component character. The strong feature observed at1440 cm−1 in the powdered kernel has now disappeared butthat at 1334 cm−1 still remains, indicating different chemicalsources for these assigned CH2 and CH3 vibrational modes.Features such as those at 1608, 1454, 1334, 1204, 1127, 856,782, 620, and 478 cm−1 (seeTable 1for assignments) remainin the solid phase throughout the wet extraction process. Itis interesting that at least one of these, viz. 618 cm−1, is abiomarker assigned to theobromine, which confirms that thealkaloid is maintained throughout in the solids subjected tothe several sequential extraction processes.
3.2. Protocol proposition
Previous results from wet chemical analysis ofcacaospec-imens[3–6] indicate that the dried seed powder is relativelyrich in theobromine, poorer in caffeine and contains no theo-phylline. Raman spectral comparison of these three alkaloids[26,27] with the bulk powders shows that theophylline andtheobromine can be differentiated using the following spec-troscopic protocol:
• Theophylline has a sharp doublet at 1706, 1665 (CNstretching and CO asymmetric stretching, respectively)and bands at 1314 (CN stretching), 1286 (CN stretch-ing), 1248 (C N stretching), a weaker doublet at 969 and
• 4
disminee in-s are
heo-b amanaf les is
ig. 3. FT-Raman spectra of C2, C4, and C5 samples. See Section2 andcheme 1for details.
928 cm−1 (N C H deformation and NCH3 symmetricstretching, respectively), a singlet at 667 (OC N defor-mation) and a strong sharp band at 555 cm−1 (C C Cdeformation).Theobromine has bands at 1682 (CN stretching), 159(C C stretching), 1334 (CN stretching), 1296 (CNstretching), 1225 (CN stretching), 776 (OC C defor-mation), 733 (OC N deformation), with a strong banat 620 cm−1 (C C C deformation); this latter featuretherefore, very characteristic of the free base theobroalkaloid and has been seen in the solid extracts from thdustrial processes. Other possible supporting featurefound at 459 and 374 cm−1 (N C N deformation).
In a recent normal coordinate analysis of caffeine, tromine, and theophylline, where the authors present Rnd infrared spectra of such a compounds[27] the major dif-
erence between the Raman spectra of the solid samp

H.G. M. Edwards et al. / Analytica Chimica Acta 538 (2005) 175–180 179
related to the bands at 550–650 cm−1 region, concerning theC C C deformation. This vibrational mode can be seen at625 cm−1 for theobromine, and at 550 cm−1 for theophyllineas strong intensity bands. The significant difference betweenthese two vibrational modes can be understood in terms ofthe methyl group positions in both structures[27].
Comparison of the theobromine signatures[26,27] withthe Raman spectrum of the dried bulk, powdered seed kernelindicates that there are no signatures present for theophylline(in confirmation of the wet chemical analyses) and that thetheobromine bands at 1334 (CN stretching), 1225 (CNstretching), 946 (NCH3 stretching), 776 (OC C stretch-ing), 733 (O C C deformation), 620 (CC C deformation),509 (C N CH3 deformation), and 459 (CN C asymmetricdeformation) are identifiable. It must be also said, accordingto Ribeiro-Claro and Amado[28] that the main Raman bandsderived from theobromine and observed in thecacaospectracan be assigned to the hydrated xanthine derivative species,instead of the dehydrated structure, since this chemical formis more stable and bioavailable.
Finally, the three products of the Soxhlet extraction byprogressively more polar solvents, viz heptane, ethyl acetateand methanol (C1, C3, and C5) show a differentiation as fol-lows: the spectra of the heptane and ethyl acetate extractswere very closely similar to each other. Clearly, the modesof (C O) and (C C) stretching modes have now been “iso-l od-u mentt ys y as-s edt ura ipleta nd1 o-b ssest ract( rentf trac-t g aro-m uad-r et eris-t ei e at1 etc tratest nates lour( .S sev-e nt inb ,t thek uredp
4. Conclusions
Raman spectroscopy has been used successfully to moni-tor the extraction stages of the processing ofcacaoseeds andthe following important information applies:
(i) Theobromine is present in the powdered seedkernels—probably as the free base alkaloid, fromvibrational band wavenumbers, in contrast with caffeinein guarana, several modes of which are found to shiftwith molecular coordination probably on account ofcomplexation with tannins and phenolic compounds inthe seeds.
(ii) No theophylline or caffeine is detectable in thecacaospecimens.
(iii) The heptane and ethyl acetate extracts remove fatty andwaxy compounds, including the lipids. The methanol ex-tract removes the aromatic polyphenolic compounds.
(iv) Theobromine is detectable in the solid products of themultiple Soxhlet extractions of thecacaoseeds.
(v) Some features, e.g. the bands at 1744 and 1659 cm−1,(C O) and (C C) stretching modes, respectively, arerepresentative of fatty material, mainly the C18:1 (oleicacid), and could be used as a key marker of this chemicalspecies.
ld bea od ofc thee
A
De-s ls
R
d in980.
o,
p.75.-
727.87
036
[ om-
[ 32.
ated” from the aromatic components left in the solid prcts of the extraction process—this confirms their assign
o fatty lipids and waxes. The 1440 cm−1 signature is vertrong and probably, therefore, can be almost certainligned to lipid (CH2) bending chains. C1 is generally termhe “fatty cacaobutter” extract and this description fits ossignment from the Raman spectra. The glycosidic trt 1129, 1097, and 1061 cm−1 and other bands at 890 a297 cm−1 are clearly also in the “fatty” fraction. No theromine has been extracted in these two Soxhlet proce
his result should be compared with the polar liquid extmethanol, C5) the spectrum of which is completely differom those obtained from heptane and ethyl acetate exions. Here, we see evidence in sample C5 of a very stronatic component, including some carotenoid, with a q
ant ring stretching band at 1609 cm−1. The presence of somheobromine is now indicated here as well, with charactic bands at 618, 781, and 1534 cm−1. The dominant featurn the C5 spectrum, however, is the aromatic ring mod609 cm−1 and this correlates well with the evidence of whemical analysis that this stage of the process concenhe polyphenolic colouring matter of an as yet indetermitructure—in fact, the concentrated extract C5 is red in cowhich is also seen in C8, the outer shell of thecacaoseeds)ome common vibrational features are also present inral other red pigments, as for example, brazilin (preserasilwood)[20] and dracorhodin (present in dragonıs blood
he pigment from dragon tree)[19], and has been used asey biomarker to indicate the presence of such a coloolyphenolic species.
;
This study suggests that Raman spectroscopy coudopted as a non-destructive and relatively rapid methacaoseed process control and quality monitoring ofxtracts.
cknowledgments
Dr. L.F.C. de Oliveira thanks to Conselho Nacional deenvolvimento Cientıfico e Tecnologico (Brazil) for financiaupport.
eferences
[1] A.Y. Leung, Encyclopedia of Common Natural Ingredients UseFood, Drugs, and Cosmetics, John Wiley and Sons, New York, 1
[2] I. Amin, B.K. Koh, R. Asmah, J. Med. Food 7 (2004) 7.[3] H.T. Rohan, El beneficio delcacao bruto destinado al mercad
Organizacion de las Naciones Unidas para la Alimentacion y laAgricultura, p. 223. Roma, 1964.
[4] G.A.R. Wood,Cacao, The Tropical Agriculture Series third ed.292, 304. Burnt-Mill, Harlow; Longman-Group-Ltd., London, 19
[5] G.A.R. Wood, R.A. Lass,Cacao, forth ed., p.620, Burnt-Mill, Harlow; Longman-Group-Ltd., London, 1985.
[6] A. Sotelo, R.G. Alvarez, J. Sci. Food Agric. 39 (1991) 1940.[7] R. Liendo, F.C. Padilla, A. Quintana, Food Res. Int. 30 (2000)[8] M. Buchgraber, C. Senaldi, F. Ulberth, E. Anklam, J. AOAC Int.
(2004) 1153.[9] M. Buchgraber, F. Ulberth, E. Anklam, J. Chromatogr. A 1
(2004) 197.10] C. Hlongwane, I.G. Delves, L.W. Wam, F.O. Ayorinde, Rapid C
mun. Mass Spectrom. 15 (2001) 2034.11] F. Ulberth, M. Buchgraber, Eur. J. Lipid Sci. Tech. 105 (2003)
180 H.G. M. Edwards et al. / Analytica Chimica Acta 538 (2005) 175–180
[12] J. Wollgast, E. Anklam, Food Res. Int. 33 (2000) 423.[13] R. Bruni, E. Bianchini, L. Bettarello, G. Sacchetti, J. Agric. Food
Chem. 48 (2000) 691.[14] D.R. Carpenter, J.F. Hammerstone Jr., L.J. Romanczyk Jr., W.M.
Aikten, J. Am. Oil Chem. Soc. 71 (1994) 845.[15] J.F. Hammerstone Jr., L.J. Romanczyk Jr., W.M. Aitken, Phytochem-
istry 35 (1994) 1237.[16] F. Marx, J.G.S. Maia, Z. Lebensm, Unters. For. 193 (1991) 460.[17] A. Celedon, J.M. Aguilera, Food Sci. Tech. Int. 8 (2002) 101.[18] H.G.M. Edwards, L.F.C. de Oliveira, P. Middleton, R.L. Frost, An-
alyst 127 (2002) 277.[19] H.G.M. Edwards, L.F.C. de Oliveira, H.D.V. Prendergast, Analyst
129 (2004) 134.[20] H.G.M. Edwards, L.F.C. de Oliveira, M. Nesbitt, Analyst 128 (2003)
82.[21] L.F.C. de Oliveira, R. Colombara, H.G.M. Edwards, Appl. Spectrosc.
56 (2002) 306.
[22] H.G.M. Edwards, D.W. Farwell, L.F.C. de Oliveira, J.M. Alia, M.Le Hyaric, M.V. de Almeida, Anal. Chim. Acta 532 (2005) 177–186.
[23] U.P. Agarwal, An overview of Raman spectroscopy as appliedto lignocellulosic materials. In: D.S. Argygopoulos (Ed.), Ad-vances in Lignocellulosics Characterization, TAPPI Press, Atlanta,1999.
[24] R. Withnall, B.Z. Choudhry, J. Silver, H.G.M. Edwards, L.F.C. deOliveira, Spectrochim. Acta, Part A 59 (2003) 2207.
[25] B. Muik, B. Lendl, A. Molina-Diaz, M.J. Ayora-Canada, Anal. Chim.Acta 487 (2003) 211.
[26] H.G.M. Edwards, T. Munshi, M. Anstis, Spectrochim. Acta, Part A.,in press.
[27] S. Gunasekaran, G. Sankari, S. Ponnusamy, Spectrochim. Acta, PartA 61 (2005) 117.
[28] P.J.A. Ribeiro-Claro, A.M. Amado, Spectrochim. Acta, Part A, inpress.