Analysis of the case of Izmir, a metropolitan area in Turkey: who could be neglected in health...
10
ORIGINAL ARTICLE Analysis of the case of Izmir, a metropolitan area in Turkey: who could be neglected in health planning in developing countries? Safak Taner Gursoy & Feride Aksu & Meltem Ciceklioglu & Raika Durusoy & Aslı Davas & Hür Hassoy & Hatice Sahin Received: 6 September 2006 / Accepted: 6 March 2007 / Published online: 13 April 2007 # Springer-Verlag 2007 Abstract The aims of this study were to determine the possible underestimated groups in needs assessment and prioritization in developing countries by focusing on the case of Izmir and to analyse the characteristics of people who are not aware of their needs (unfelt needs) and people who had symptoms which did not result in health service utilization (undemanded wants). This was a cross-sectional: Izmir metropolitan area with a population of 2.4 million; sample size: 1,173 houses; cluster sampling: 117 clusters, 10 households in each cluster including 791<15 years of age and 2,489 adults. The population-based coverage was 79% and household-based coverage 76%. Backward con- ditional logistic regression analysis was used. Symptoms: in children who were born in Izmir, whose mothers were educated more than 5 years, whose fathers perceived the level of income as bad and whose family had a real estate other than the house they live in and in adults who were female, educated less than 5 years, ever married and unemployed were higher. Health service utilization: in children who were born in Izmir, whose mothers were educated more than 5 years, whose fathers perceived the level of income as bad and whose fathers were employed and had health insurance and in adults who were female, educated more than 5 years, who had health insurance and who had a real estate other than the house they live in were higher. Children who were born in Izmir, whose mothers were educated more than 5 years, whose family had a real estate other than the house they live in and whose fathers were employed were more frequently diagnosed. Adults who were female, unemployed and perceived the level of income as bad were less frequently diagnosed. According to the results of this study, when symptoms (wants), health service utilization (demand) and diagnosed diseases (met demand) are taken into consideration during needs assess- ment, prioritization and the health planning process, vulnerable groups (less educated, unemployed, uninsured, relatively poor, female, living in worse conditions) among children and adults would be neglected. If health care is guaranteed by the public sector to all as a matter of right, health needs of vulnerable groups should be represented in health planning. Keywords Need . Want . Demand . Health care planning . Neglected groups Introduction Mortality and fertility rates are decreasing across the globe, resulting in ageing populations and higher life expectancies (Frankel et al. 2000). On the other hand developments in science and technology are leading to a growing demand for health services and, in some cases, to higher costs in provision of these services. Thus all these factors exert an increasing pressure on health budgets of countries (Ministry J Public Health (2007) 15:423–432 DOI 10.1007/s10389-007-0104-6 DO00104; No of Pages S. Taner Gursoy (*) : F. Aksu : M. Ciceklioglu : R. Durusoy : A. Davas : H. Hassoy Department of Public Health, Ege University Faculty of Medicine, Ege Üniversitesi Tip Fakültesi, Halk Sagligi Anabilim Dali, 35100 Bornova-Izmir, Turkey e-mail: [email protected] H. Sahin Department of Medical Education, Ege University Faculty of Medicine, Ege Üniversitesi Tip Fakültesi, TıpEğitimi Anabilim Dali, 35100 Bornova-Izmir, Turkey
Transcript of Analysis of the case of Izmir, a metropolitan area in Turkey: who could be neglected in health...

ORIGINAL ARTICLE
Analysis of the case of Izmir, a metropolitan area in Turkey:who could be neglected in health planningin developing countries?
Safak Taner Gursoy & Feride Aksu &
Meltem Ciceklioglu & Raika Durusoy & Aslı Davas &
Hür Hassoy & Hatice Sahin
Received: 6 September 2006 /Accepted: 6 March 2007 / Published online: 13 April 2007# Springer-Verlag 2007
Abstract The aims of this study were to determine thepossible underestimated groups in needs assessment andprioritization in developing countries by focusing on thecase of Izmir and to analyse the characteristics of peoplewho are not aware of their needs (unfelt needs) and peoplewho had symptoms which did not result in health serviceutilization (undemanded wants). This was a cross-sectional:Izmir metropolitan area with a population of 2.4 million;sample size: 1,173 houses; cluster sampling: 117 clusters,10 households in each cluster including 791<15 years ofage and 2,489 adults. The population-based coverage was79% and household-based coverage 76%. Backward con-ditional logistic regression analysis was used. Symptoms: inchildren who were born in Izmir, whose mothers wereeducated more than 5 years, whose fathers perceived thelevel of income as bad and whose family had a real estateother than the house they live in and in adults who werefemale, educated less than 5 years, ever married andunemployed were higher. Health service utilization: inchildren who were born in Izmir, whose mothers wereeducated more than 5 years, whose fathers perceived the
level of income as bad and whose fathers were employedand had health insurance and in adults who were female,educated more than 5 years, who had health insurance andwho had a real estate other than the house they live in werehigher. Children who were born in Izmir, whose motherswere educated more than 5 years, whose family had a realestate other than the house they live in and whose fatherswere employed were more frequently diagnosed. Adultswho were female, unemployed and perceived the level ofincome as bad were less frequently diagnosed. Accordingto the results of this study, when symptoms (wants), healthservice utilization (demand) and diagnosed diseases (metdemand) are taken into consideration during needs assess-ment, prioritization and the health planning process,vulnerable groups (less educated, unemployed, uninsured,relatively poor, female, living in worse conditions) amongchildren and adults would be neglected. If health care isguaranteed by the public sector to all as a matter of right,health needs of vulnerable groups should be represented inhealth planning.
Keywords Need .Want . Demand . Health care planning .
Neglected groups
Introduction
Mortality and fertility rates are decreasing across the globe,resulting in ageing populations and higher life expectancies(Frankel et al. 2000). On the other hand developments inscience and technology are leading to a growing demandfor health services and, in some cases, to higher costs inprovision of these services. Thus all these factors exert anincreasing pressure on health budgets of countries (Ministry
J Public Health (2007) 15:423–432DOI 10.1007/s10389-007-0104-6
DO00104; No of Pages
S. Taner Gursoy (*) : F. Aksu :M. Ciceklioglu :R. Durusoy :A. Davas :H. HassoyDepartment of Public Health, Ege University Faculty of Medicine,Ege Üniversitesi Tip Fakültesi,Halk Sagligi Anabilim Dali,35100 Bornova-Izmir, Turkeye-mail: [email protected]
H. SahinDepartment of Medical Education, Ege University Facultyof Medicine, Ege Üniversitesi Tip Fakültesi,Tıp Eğitimi Anabilim Dali,35100 Bornova-Izmir, Turkey
of Health 2004). Frankel et al. attribute this pressure toincreasing life expectancy, new technologies and raisedpublic expectations (Frankel et al. 2000). The extent of thispressure seems similar, but in fact is not. The consequencesof this pressure are much more remarkable in developingcountries. In other words it seems unfair to have the samepolemics in developing countries.
The pressures on health budgets force the decisionmakers to look for evidence in order to make rationaldecisions. There are difficulties in obtaining certain andqualified evidence. This stimulates the decision makers toidentify and assemble systematically all the relevant evi-dence available, to assess its quality, limitations anduncertainty, and to use the best possible methods to comeup with estimates of the quantities of interest in them, withestimates of the uncertainty in these (Murray et al. 2001).These compilations of evidence have been used in order todetermine the needs for many years. Several approacheshave been adopted as a proxy for assessing population’shealth care needs: mortality rates, socioeconomic status,service utilization or prevalence rates, which are all at themacro-level. Stevens et al. considered that interest in aneeds-driven health system passed through several stages(Stevens et al. 2002). A sociological approach in the 1960swas followed by “rational planning” and resource allocationbased on deprivation and epidemiology in the 1970s; in the1990s, National Health Service reform introduced need-target resource allocation and by the year 2000 the focuswas on “collaborative action” where the need for healthcare was to be collectively identified by interested “stake-holders” (Asadi-Lari et al. 2003).
Aims
This article is based on the selected data of the “Definitionof the Priority Symptoms, Reasons for Contact with HealthCare and Diseases Research in the Izmir MetropolitanArea”. In this article we discuss the different approaches inassessment of the health needs used in planning and whichgroups are underestimated during this planning process indeveloping countries. The framework of this discussion isbased on the differentiation of the needs concept illustratedby Mooney (1992) and Wright et al. (1998).
We took into consideration the groups who hadsymptoms, had utilized the health service and had beendiagnosed. Analysing the characteristics of these groups wehave tried to find out the characteristics of the neglectedgroups, namely the people who are not aware of their needs(unfelt needs) and people who had symptoms which did notresult in health service utilization (undemanded wants). Thesuppositions made in this article are only based ontherapeutic care; preventive care is ignored.
Background
“Turkish Health Reform” is an endless story which beganin 1980 and still continues. The reform period has lastedlonger than in other countries, because of the efforts of theopponents, mainly the Turkish Medical Association.
Before the so-called reform, health services in Turkeywere provided mainly by the Ministry of Health, SocialInsurance Organization, Universities, the Ministry ofDefence, and the private sector. Health care financing wasmainly based on general taxes and secondly on premiums.The main focus of the health care organization wascommunity-based primary health care centres. The mainway of payment to health workers were salaries.
The health reform aims to make changes in financing (nottaxes, but only premiums and establishing a general healthinsurance organization), organization (not community-basedprimary health care centres, but list-based family medicine),status of health workers (not civil servants but contract-basedwork) and hospitals (not financed by government butautonomously).
After the coup d’état in 1980, the Turkish economicsystem began to change towards liberalization. Health careand social security were left to the hands of market forces.The first attempt was the Basic Health Law which aimed toestablish a universal health insurance scheme and take thefirst step to make the state hospitals private. This law wasoverturned by the Constitutional Court.
Between 1989 and 1991 the State Planning Organization(SPO) carried out the studies which are called the master planemphasizing the reforms in health. The First Health Project,which consisted of programmes of health care reform,supported by the World Bank, began in 1991. In 1992 and1993 National Health Congresses with the representatives ofall sectors were held to discuss the committee reports.Unfortunately the opponents were not taken into consider-ation. The loan agreement between Turkey and the WorldBank for the Second Health Project was signed in 1994.
A series of draft laws on issues such as health care funding,the personal health insurance system, the integration of basichealth services with curative health services, primary healthcare and family medicine were submitted to the GrandNational Assembly at the beginning of 1995, but they couldnot succeed (Savas et al. 2002). In 2001, rolling funds inprimary health centres were implemented. The reformprocess was interrupted till 2002 because of the politicalinstability and early general elections. In 2002, only thename of the project but not the context was changed to“Transformation in Health” by the AK Party government.
The ownership of Social Security Organization hospitalswas transferred to the Ministry of Health in 2004. At thesame time, “performance-based payment” began. The Lawon Family Medicine was accepted by the Grand National
424 J Public Health (2007) 15:423–432
Assembly in the same year. The draft laws of SocialSecurity and General Health Insurance were submitted tothe Grand National Assembly in 2005 and passed. This lawwas to be put into practice at the beginning of 2007, butwas postponed. Family medicine is still a pilot projectlimited to 8 of 81 cities.
There is strong public objection to the transition inhealth care because old experiences showed that it isimpossible to collect premiums. Bag-Kur (the SocialInsurance Agency of Merchants, Artisans and the Self-employed) and the Social Insurance Organization (SIO;Turkish Acronym is SSK) can only collect 15 and 81% ofall their premiums, respectively (Soyer et al. 2003). On theother hand, the unemployment rate is high and the informalsector is widespread. Family medicine is not communitybased, but list based. So, preventive medicine is ignored inthis study.
Up till now health care workers were civil servants withjob security, but from now on they will become contract-based workers and they will lose their job security.
Framework
There is no consensus on the definition of need. In asociological environment, Bradshaw defined need as: nor-mative (distinguished by professionals, such as vaccination),felt (wants, wishes and desires), expressed (vocalized needsor how people use services) and comparative needs, whichindicate that needs arising in one location may be similar forpeople with similar sociodemographic characteristics livingin another location (Asadi-Lari et al. 2003).
Assessment of health needs is the systematic method ofidentifying unmet health and health care needs of apopulation and making changes to meet these unmet needs.It involves an epidemiological and qualitative approach todetermining priorities which incorporates clinical and costeffectiveness and patients’ perspectives. This approachmust balance clinical, ethical, and economic considerationsof need, that is what should be done, what can be done, andwhat can be afforded (Jordan et al. 1998).
Health planning processes mainly take into considerationwants and demands. Precise information about diseases,their incidence, their consequence, their causation and theirtrend is more than ever necessary to inform policy-makingin a context where increasingly vocal and well-informedpeople demand more health services and interventions thanresources available are able to finance (Mathers et al.2001). This is valid for developed countries and the upperclasses of developing countries, but the majority of thepeople in developing countries may not be aware of theirhealth needs and their needs may not be transformed tohealth demands. In developed countries the wants and
demands usually cover the needs, even more than theneeds. Taxonomy of need was constrained because ofinherent problems with the concept of need. For that reasonwe developed a taxonomy of need, taking into consider-ation the condition of our country. We differentiated healthneeds as needs, wants, unfelt needs, demands, undemandedwants, met demands and unmet demands (Fig. 1).
Wants mean that people are aware of their health needsand represented here by the symptoms. The needs that thepeople are not aware of are classified as unfelt needs. Foran example, the families that have not taken their childrenfor immunization service are in this group. Demands are thefelt needs, which result in health service utilization, andrepresented here by the health service utilization. Theundemanded wants are the felt needs or symptoms whichdo not result in health service utilization. Met demandscover the access to diagnosis and treatment, while unmetdemands cover the group who had no access to a diagnosisor were diagnosed but could not access treatment.
In the health planning process the collection of evidenceand sources of data are as important as the definitions of theconcepts. Sources of data could be used in order todetermine the needs and their pros and cons are as follows(Mathers et al. 2001).
1. Disease registersIn developed countries there are reliable and compre-
hensive health registries. Not all the registries cover thewhole country. If a registry is well kept and has good datain only part of the country, a judgment needs to be made onhow representative the information is for the whole countryor how the data can be adjusted to better reflect populationestimates. This is especially valid for developing countrieswhere sometimes even a registry does not exist.2. Population surveys
Self-report surveys do not always overestimate the trueprevalence of disease. In the case of insufficiency ofpopulation surveys, it becomes more difficult to estimatedata.3. Epidemiological studies
If information from registries or good quality surveys islacking, the next most useful source of information tends tobe epidemiological studies. Unfortunately in developingcountries there is a limited number of reliable epidemio-logical studies on very few fields of health.4. Health facility data.
In relation to international efforts to improve the healthof populations, this means assessing the available evidenceand using the best available methods to quantify the burdenof disease and injury, its causes in terms of risk factors andbroader health determinants, and the likely burden in thefuture. In recent years Global Burden of Disease (GBD)studies became fashionable and have been used widely in
J Public Health (2007) 15:423–432 425

many countries. In the developed countries where there arereliable health records, incidence and prevalence data couldbe used in order to evaluate the priority health problems,but in developing countries the health records are notreliable. Where the evidence is uncertain or incomplete, justlike the situation in developing countries, the GBD attemptsto make the best possible inferences based on the knowledgebase that is available and to assess the uncertainty in theresulting estimates (Mathers et al. 2001). A neglected andundiscussed limitation of the GBD studies is the datasource which is mainly based on self-declarations ofpeople. While the GBD is based on self-reported andhealth demand data, the results might represent the needs ofthe groups who are able to access and utilize healthservices. This aspect of the GBD could be manipulatedaccording to the political perspective and will of thedecision makers.
Methods
Design and study population
The study design is cross-sectional. The inhabitants of theIzmir metropolitan area represent the study population.Izmir is located on the coast of the Aegean Sea in westernTurkey which is the most relatively developed region. Themetropolitan area has a population of 2,424,745. The urban
population accounts for a total of 81%. Izmir has a youngpopulation; the total age dependency ratio is 44% where thechild-woman ratio is 254%. The unemployment rate is11.9% (Turkish Statistical Institute 2006). The ratio of fullyvaccinated children is rather low in Turkey. The highestratio of fully vaccinated children is 63.0% in the westernregion including Izmir.
Sample size and data collection
We calculated the sample size by using the possibleminimum disease prevalence per year which is 3% (Neufeldet al. 1997). This led us to a sample size of 4,189 personswith a 95% confidence interval (CI), accepting a sampleerror of 8‰, the design effect is 2 and non-response rate is1.2. In order to reach the number of the targeted house-holds, the sample size was divided by 3.57 which was theaverage size of a household in the Izmir region. The samplesize based on households was calculated as 1,173 houses.The cluster sampling method was used; 117 clusters and 10households in every cluster were targeted.
Data collection was through face-to-face interviews withthe members of the households; the data of the group lessthan 15 years of age were collected from their mothers. Atleast three visits were performed to collect data andrendezvous to talk with the other members. The person-based and household-based coverage rates were 79 and76%, respectively. The main reasons for non-responses
Needs
Wants
(Felt needs)
Unfelt needs
Demands
(Demanded wants)
Un-demanded
wants
Met demands
(Access to diagnose &
treatment)
Unmet demands
(Could not access to
diagnose or diagnosed but
could not access
treatment)
Fig. 1 Differentiation of needs.This conceptual framework isadopted from Mooney 1992 andWright et al. 1998 and revisedby the authors considering theconditions of developingcountries
426 J Public Health (2007) 15:423–432
were the absence of the people at home and being refused.People living in the metropolitan area refused the inter-viewers due to security reasons.
Variables and statistical analysis
The household questionnaire included sociodemographic andsocioeconomic variables while the other questionnaires in-cluded topics about symptoms and diseases classified accord-ing to organ systems and reasons for contact with health care.
Logistic regression was used to analyze the data accordingto adults and the group less than 15 years of age separately. Allindependent variables have been taken into account in thebackward conditional logistic regression analysis. Variables inthe last step of the backward conditional logistic regressionanalysis are shown in the tables.
For each independent variable the category found to beat highest risk for health level in descriptive analysis wasselected as the reference group and scored as “1” forconstructing the odds ratio. The independent variablegroups are: age (continuous), education level (≤5 years: 1,>5 years: 0), place of birth (other than Izmir: 1, Izmir: 0),place of longest residence (<10 years in Izmir: 1, ≥10 yearsin Izmir: 0), health insurance (not insured: 1, insured: 0),employment status (unemployed: 1, employed: 0), per-ceived level of income (bad: 1, good: 0), having real estateother than the house they live in (have not: 1, have:0), typeof the house (detached house: 1, apartment: 0), householdper room (>1 person: 1, ≤1 person: 0), gender (female: 1,male: 0), marital status (single: 1, ever married: 0). In thegroup less than 15 years of age, marital status is excluded;father’s perceived level of income, employment status andmother’s education level are accepted in the analysis. Thedependent variable groups are: symptom (positive: 1,negative: 0), health service utilization (negative: 1, positive:0) and diagnosed diseases (negative: 1, positive: 0).
Symptoms and health service utilization within the lastmonth and diagnosed diseases within the last year aredependent variables. While analyzing the symptoms, peoplewho had a diagnosis are excluded. People who had at least onesymptom accepted as symptom (+). Diagnosis and healthservice utilization data are based on the self-report of people.
We included 791 children under 15 years of age and2,489 adults in this study. Females accounted for 53.5% ofthe adults and 47.2% of the children. When symptomswere analyzed the data of the children who had chronicdiseases (n=91) were excluded; for that reason the totalnumber was 681, and data were missing for 18. With thesame approach when symptoms were analyzed the data ofthe adults who had chronic diseases (n=1,350) wereexcluded; for that reason the total number of adults was1,350, and data were missing for 32. The reason for theseexclusions is that chronic diseases would interfere withsymptoms.
Results
The mean age of the participants is 30.3±19.2. The oldestone is 93 years old. Females represent 52% (1,579) of thestudy population; 49.9% (1,632) of them were living in anapartment and 50.1% (1,638) of them in a detached house.People who were born in Izmir account for 52.3% (1,714)of the study population; 27.1% (890) do not have healthinsurance, 11.6% (378) have a real estate other than thehouse they live in. The mean household size is 3.88±1.75.
Of the adults, 71.4% have ever been married, 47.5% areunemployed, but 84% of them stated the level of theirincome was good.
Associations between the presence of symptoms, healthservice utilization, diagnosed diseases and variables aregiven in Tables 1, 2, 3, 4, 5 and 6.
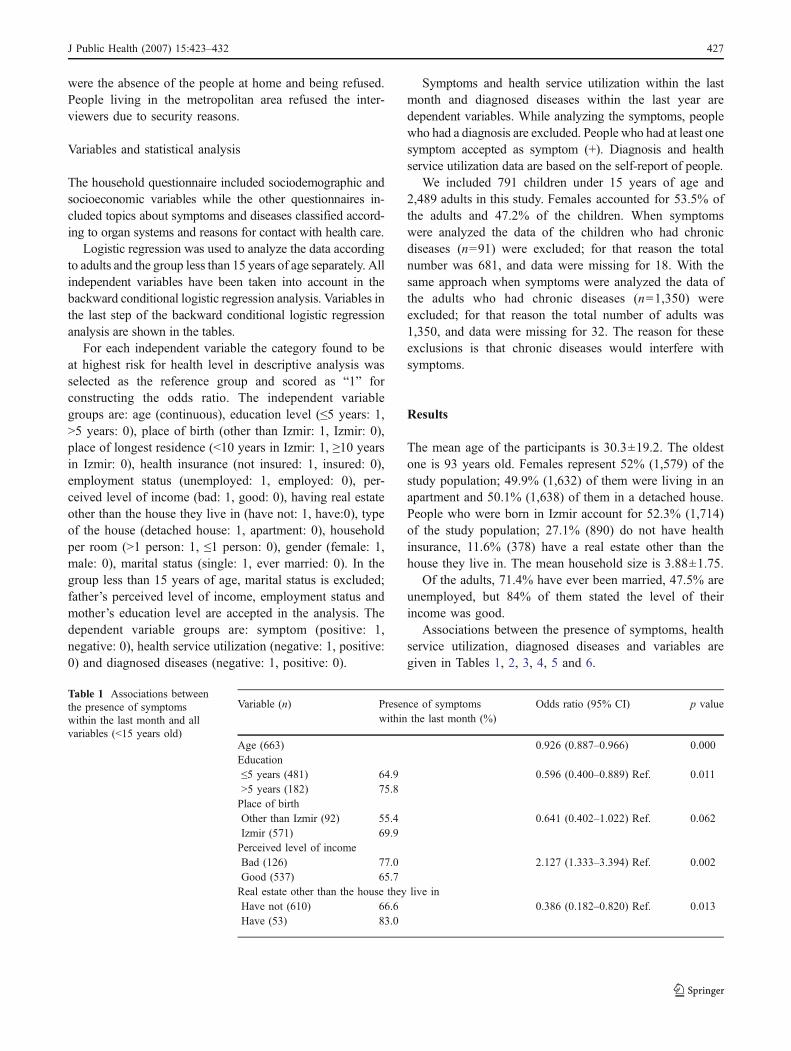
Table 1 Associations betweenthe presence of symptomswithin the last month and allvariables (<15 years old)
Variable (n) Presence of symptomswithin the last month (%)
Odds ratio (95% CI) p value
Age (663) 0.926 (0.887–0.966) 0.000Education≤5 years (481) 64.9 0.596 (0.400–0.889) Ref. 0.011>5 years (182) 75.8Place of birthOther than Izmir (92) 55.4 0.641 (0.402–1.022) Ref. 0.062Izmir (571) 69.9Perceived level of incomeBad (126) 77.0 2.127 (1.333–3.394) Ref. 0.002Good (537) 65.7Real estate other than the house they live inHave not (610) 66.6 0.386 (0.182–0.820) Ref. 0.013Have (53) 83.0
J Public Health (2007) 15:423–432 427

Of the children, 67.9% had at least one symptom withinthe last month. Symptoms in the group under 15 years ofage were higher among the children who were born inIzmir, whose mothers were educated more than 5 years,whose fathers perceived the level of income as bad andwhose family had a real estate other than the house theylive in. On the other hand when age increased by 1 year, thesymptoms increased 0.926-fold.
The percentage of the symptom positives among adultswas 68.9%. Symptoms were higher among adults who werefemale, educated less than 5 years, ever married andunemployed.
Health service utilization rate of children within the lastmonth was 26%. Health service utilization in the groupunder 15 years of age was higher among the children whowere born in Izmir, whose mothers were educated morethan 5 years, whose fathers perceived the level of income asbad, whose fathers were employed and had health insur-
ance. On the other hand when age increased by 1 year, thehealth service utilization increased 1.156-fold.
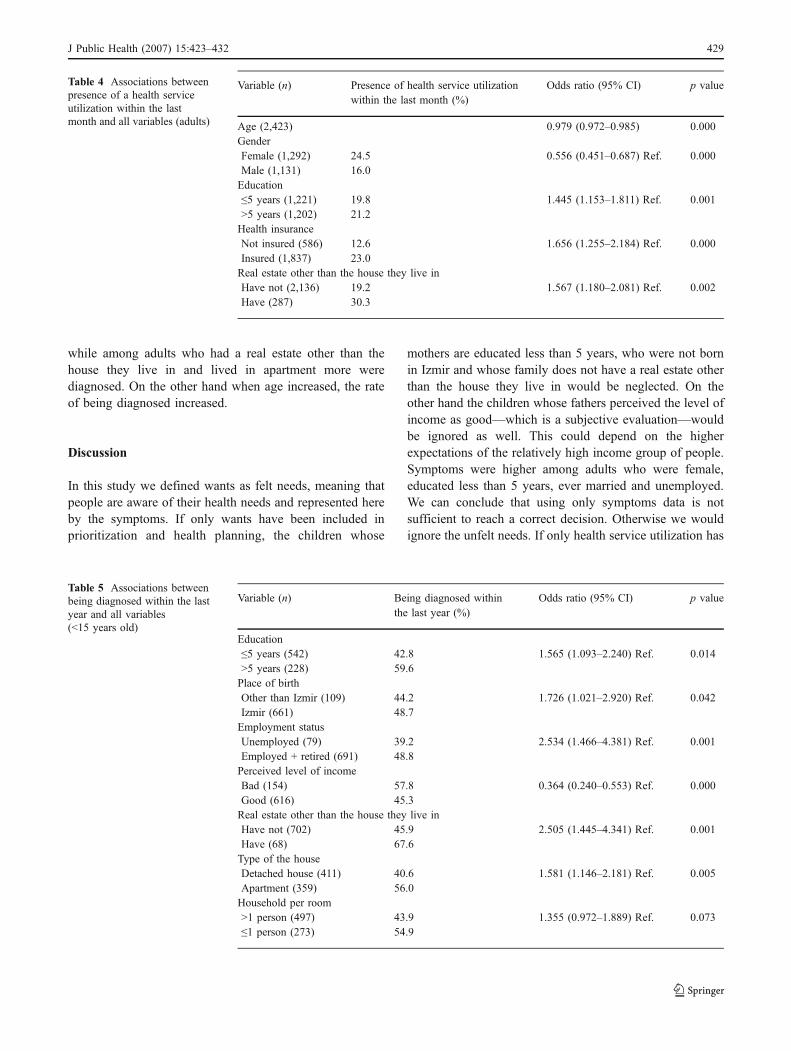
Of the adults, 20.5% used the health service within thelast month. Health service utilization was higher amongadults who were female, who were educated more than5 years, who had health insurance and who had a real estateother than the house they live in. On the other hand whenage increased, the health service utilization decreased.
The rate of being diagnosed in the last year was 47.8%in children. Among the children who were born in Izmir,whose mothers were educated more than 5 years, whosefamily had a real estate other than the house they live in andwhose fathers were employed, more were diagnosed. Onthe other hand the rate was lower among the children whosefathers perceived the level of income as good.
In adults, 60% of them were diagnosed in the last year.Among adults who were female, unemployed and whoseperceived level of income was bad, fewer were diagnosed,
Table 2 Associations betweenpresence of symptoms withinthe last month and all variables(adults)
Variable (n) Presence of symptomswithin the last month (%)
Odds ratio (95% CI) p value
GenderFemale (671) 77.8 2.230 (1.751–2.841) Ref. 0.000Male (679) 60.1Marital statusSingle (506) 62.1 0.646 (0.499–0.834) Ref. 0.001Ever married (844) 73.0Education≤5 years (615) 75.1 1.395 (1.081–1.801) Ref. 0.011>5 years (735) 63.7Employment statusUnemployed (557) 69.8 1.233 (0.962–1.580) Ref. 0.098Employed + retired (793) 68.2
Table 3 Associations betweenpresence of a health serviceutilization within the lastmonth and all variables(<15 years old)
Variable (n) Presence of health service utilizationwithin the last month (%)
Odds ratio (95% CI) p value
Age (770) 1.156 (1.107–1.207) 0.000Education≤5 years (542) 23.6 1.439 (0.996–2.078) Ref. 0.053>5 years (228) 33.8Place of birthOther than Izmir (109) 10.1 2.627 (1.347–5.124) Ref. 0.005Izmir (661) 29.3Health insuranceNot insured (274) 17.2 2.203 (1.484–3.270) Ref. 0.000Insured (496) 31.9Employment statusUnemployed (79) 15.2 2.308 (1.137–4.685) Ref. 0.021Employed + retired (691) 27.9Perceived level of incomeBad (154) 27.9 0.512 (0.322–0.815) Ref. 0.005Good (616) 26.3
428 J Public Health (2007) 15:423–432
while among adults who had a real estate other than thehouse they live in and lived in apartment more werediagnosed. On the other hand when age increased, the rateof being diagnosed increased.
Discussion
In this study we defined wants as felt needs, meaning thatpeople are aware of their health needs and represented hereby the symptoms. If only wants have been included inprioritization and health planning, the children whose
mothers are educated less than 5 years, who were not bornin Izmir and whose family does not have a real estate otherthan the house they live in would be neglected. On theother hand the children whose fathers perceived the level ofincome as good—which is a subjective evaluation—wouldbe ignored as well. This could depend on the higherexpectations of the relatively high income group of people.Symptoms were higher among adults who were female,educated less than 5 years, ever married and unemployed.We can conclude that using only symptoms data is notsufficient to reach a correct decision. Otherwise we wouldignore the unfelt needs. If only health service utilization has
Table 4 Associations betweenpresence of a health serviceutilization within the lastmonth and all variables (adults)
Variable (n) Presence of health service utilizationwithin the last month (%)
Odds ratio (95% CI) p value
Age (2,423) 0.979 (0.972–0.985) 0.000GenderFemale (1,292) 24.5 0.556 (0.451–0.687) Ref. 0.000Male (1,131) 16.0Education≤5 years (1,221) 19.8 1.445 (1.153–1.811) Ref. 0.001>5 years (1,202) 21.2Health insuranceNot insured (586) 12.6 1.656 (1.255–2.184) Ref. 0.000Insured (1,837) 23.0Real estate other than the house they live inHave not (2,136) 19.2 1.567 (1.180–2.081) Ref. 0.002Have (287) 30.3
Table 5 Associations betweenbeing diagnosed within the lastyear and all variables(<15 years old)
Variable (n) Being diagnosed withinthe last year (%)
Odds ratio (95% CI) p value
Education≤5 years (542) 42.8 1.565 (1.093–2.240) Ref. 0.014>5 years (228) 59.6Place of birthOther than Izmir (109) 44.2 1.726 (1.021–2.920) Ref. 0.042Izmir (661) 48.7Employment statusUnemployed (79) 39.2 2.534 (1.466–4.381) Ref. 0.001Employed + retired (691) 48.8Perceived level of incomeBad (154) 57.8 0.364 (0.240–0.553) Ref. 0.000Good (616) 45.3Real estate other than the house they live inHave not (702) 45.9 2.505 (1.445–4.341) Ref. 0.001Have (68) 67.6Type of the houseDetached house (411) 40.6 1.581 (1.146–2.181) Ref. 0.005Apartment (359) 56.0Household per room>1 person (497) 43.9 1.355 (0.972–1.889) Ref. 0.073≤1 person (273) 54.9
J Public Health (2007) 15:423–432 429
been included in needs assessment, in both age groups lesseducated and uninsured, the children who were not born inIzmir, whose fathers were unemployed, the adults who arefemale and do not have a real estate other than the housethey live in would be ignored. Briefly if we only use thedemand data we would ignore the undemanded wantswhich do not result in health service utilization. Similarfindings were presented in a different study, which statedthat the percentage of presence of symptoms was 55.3%and health service utilization rate was 23.3% in the groupbelow 6 years of age at one metropolitan area of Izmir(Hassoy 2005). The utilization rate was 11% in Turkey in1995 (Ministry of Health 1995) and 20% in Antalya in1999 (Belek 2004). In our study, the health serviceutilization rate was higher due to study year and being ina metropolitan area of a relatively developed part of Turkey.
The current debate in all economically and technologi-cally advanced countries about the best system of deliveryfor health care raises a fundamental moral and philosoph-ical question: why should health care not be thought of as acommodity like any other, to be bought and sold in themarket place, and with a price determined simply by theordinary mechanisms of supply and demand? (Matthews1998). The increasing costs of modern health care, alliedwith widespread economic pessimism, have led healthpolicy-makers worldwide to emphasize retrenchment andcost control (Frankel 1991). In fact, one of the mostconsistent observations in public health research is thatpeople in poorer socioeconomic groups have poorer healthand more health problems than those belonging to richergroups (Regidor et al. 1997).
Market forces and political ideology are the drivingforces of care provision; unfortunately the policy-makers in
developing countries like Turkey which had different healthconditions and incomparably worse health indicators tendto use the same approaches. Although there is an increasethrough the time, when the life expectancies are consideredthere is still a 10-year difference between the developedcountries and Turkey. For example the life expectancy is69 years in Turkey, whereas it is 79 years in Germany(UNICEF 2006). At the same time the age distribution isdifferent as well. Turkey has a younger population.According to the results of the Turkish Population andDemographic Survey, 29% of the population is under 15 yearsof age [HIPS (Hacettepe Institute of Population Studies)2003]. The number of outpatient contacts per person inTurkey was 3.18 in the year 2004 (Ministry of Health ofRepublic of Turkey 2004a; Ministry of Health of Republic ofTurkey 2004b) while in Germany the number of outpatientcontacts per person is 9.5 and 11.5 per year even in the years1999 and 2002, respectively, varying by survey (Busse andRiesberg 2004). The ratio of children who are fullyvaccinated, by receiving bacille Calmette-Guérin (BCG),measles, and three doses of diphtheria-pertussis-tetanus(DPT) vaccine and polio is between 34.8 and 62.9% fordifferent regions of Turkey [HIPS (Hacettepe Institute ofPopulation Studies) 2003]. The proportion of mothers whodid not receive any antenatal care is 23% [HIPS (HacettepeInstitute of Population Studies) 2003]. Taking into consider-ation these data we can conclude that demand for health carehas not grown as much. The pressure on health budgetsphenomenon is clarified when the health expenditures percapita are compared. In 2002 health expenditures per capitawere US $5,274 in the USA, US $2,639 in Germany andonly US $172 in Turkey (World Bank 2005). On the otherhand when the percentage of health expenditures in the gross
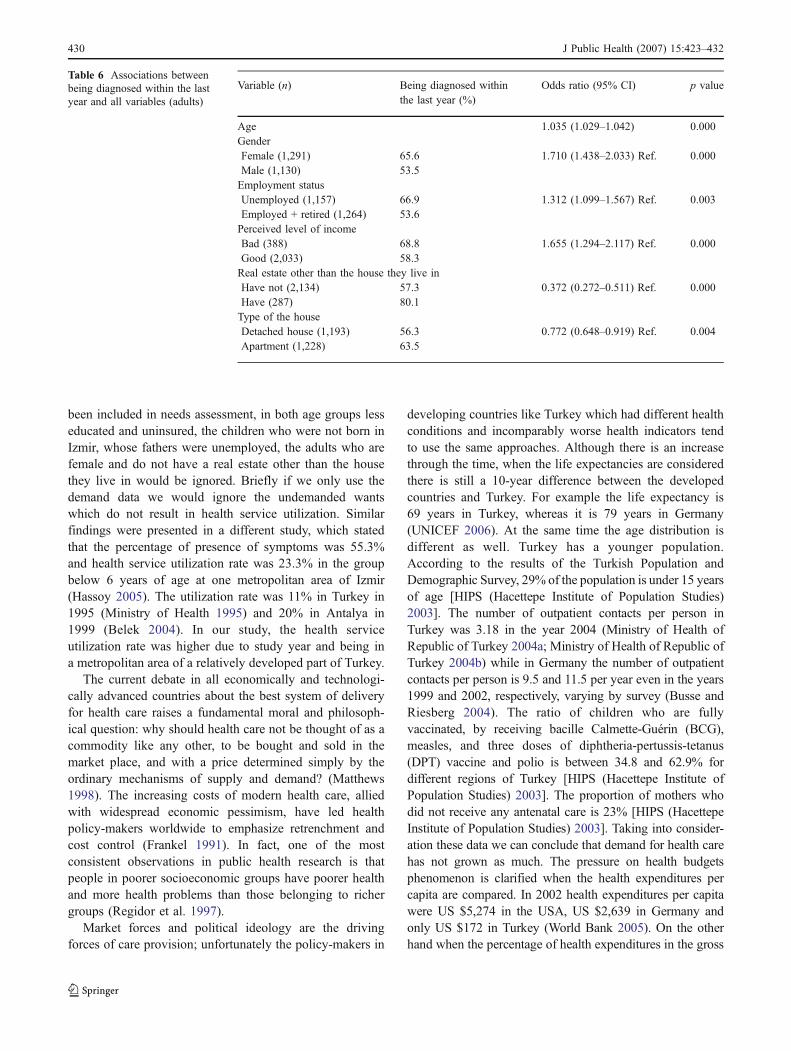
Table 6 Associations betweenbeing diagnosed within the lastyear and all variables (adults)
Variable (n) Being diagnosed withinthe last year (%)
Odds ratio (95% CI) p value
Age 1.035 (1.029–1.042) 0.000GenderFemale (1,291) 65.6 1.710 (1.438–2.033) Ref. 0.000Male (1,130) 53.5Employment statusUnemployed (1,157) 66.9 1.312 (1.099–1.567) Ref. 0.003Employed + retired (1,264) 53.6Perceived level of incomeBad (388) 68.8 1.655 (1.294–2.117) Ref. 0.000Good (2,033) 58.3Real estate other than the house they live inHave not (2,134) 57.3 0.372 (0.272–0.511) Ref. 0.000Have (287) 80.1Type of the houseDetached house (1,193) 56.3 0.772 (0.648–0.919) Ref. 0.004Apartment (1,228) 63.5
430 J Public Health (2007) 15:423–432
domestic product (GDP) is compared, it is 14.6% in theUSA, 10.9% in Germany and 6.5% in Turkey. In addition tothis, in Turkey the public sector fiscal deficit exceeds 6% ofthe GDP—due in large part to the huge burden of interestpayments, which accounted for more than 40% of centralgovernment spending in 2004 (CIA 2005). According to thereport of the Free Social Scientists Group, the 2003 budgetof Turkey would serve as a tool of transferring resources tothe rentier class instead of planning public services (Inde-pendent Social Scientists 2003).
Health planning should be justified on the grounds of bothequity and efficiency. However, when the need assessment isnot carried out properly either equity or efficiency could notbe realized. Our findings supported this approach.
In this study we have determined social and economicfactors in relation to health service utilization. The HealthService Utilization Survey in Turkey showed that females,university graduates, people who are covered by any typeof insurance system and higher income groups used healthservices more than the others (Ministry of Health 1995).Met demands cover the access to diagnosis and treatment.If only being diagnosed had been included in needsassessment, the children whose mothers are educated lessthan 5 years, who were not born in Izmir, whose fathers wereunemployed and do not have a real estate other than the housethey live in would be neglected. All of the findings point outthe vulnerable groups except for the perceived level ofincome, which may be due to the subjectivity of this criterion.Among adults those who were female, unemployed andwhose perceived level of income was bad would be neglectedin the planning procedure. At the same time adults who are notaccepted as risk groups, who live in an apartment and have areal estate other than the house they live in would not be takeninto account. These two groups were not evaluated asneglected, but possibly they have less health problems; ourdatabase is not able to verify this. In conclusion if we only usethe being diagnosed data instead of prevalence or incidencedata, we would ignore the unmet demand; it means thatwhatever their situation is patients who had no access to adiagnosis or were diagnosed but could not access treatmentwould be neglected in the planning procedure.
Frankel explains that epidemiological investigationscannot give us an answer, because prevalence and incidencesurveys have often failed to incorporate other factors thatmay influence health care requirements (Frankel 1991). Indeveloping countries, as we mentioned before, there are noteven dependable incidence and prevalence data, and thedata obtained through self-report are not reliable as well.
Currently, many countries exert great efforts to maximizeoutputs derived from current health care services and thusneed to consider reallocation of resources to assure theircost-effective use. In the process of health service planningneeds assessment should include the needs of the disad-
vantaged groups. During the needs assessment demograph-ic and epidemiological trends are usually taken intoconsideration. We underline the importance of social andeconomic circumstances which should never be ignored.
Needs assessment could be used for prioritization of thehealth problems. During the prioritization, cost-effectivenessof available technologies and strategies for improving health,information on inequalities in health status, health determi-nants, and access to and use of health services should be takeninto consideration. In addition to the process of prioritization,in developing countries the real question is not only theefficient use of the resources, but more prior to that, the lack ofhealth expenditures and health infrastructure. If health care isguaranteed by the public sector to all as a matter of right, healthneeds of vulnerable groups should be represented in healthplanning. Social policy that addresses socioeconomic, demo-graphic and epidemiological determinants of health based onstrong evidence should be a vital part of health planning.
Limitations
Because the perceived level of income is a subjectiveevaluation, it is hard to differentiate the vulnerable groupsby only depending on these data. The symptoms invulnerable adults were high, while health service utility inboth vulnerable age groups was low. Diagnosed diseaseswere generally lower in the risk groups of both children andadult age groups. Nevertheless employed adults had beendiagnosed less frequently, possibly due to the difficulties ingetting permission to apply for health service. This study didnot explore the working conditions. Children who have livedin Izmir more than 10 years were diagnosed less often. We donot have a clue to explain these data; maybe if morecontextual variables had been included in this study, wecould express the inequity among the inhabitants of Izmir.
Due to non-response, there have been differencesbetween the response group and the population of theIzmir metropolitan area in terms of sex, marital status andsocial security. The reasons for this difference might be thehigher probability of finding women and socioeconomicallydeprived groups at home during the field survey. However,there was no difference according to age group distributionand education, decreasing the effect of non-response. Onthe other hand, we supposed that having a chronic illness isa confounding factor for the presence of a symptom. Thiswas not controlled, and so we excluded it.
Our conclusions need to be qualified. The criteria thatwere used in this research are based on mainly individuallevel factors rather than contextual factors. This study couldcriticize the determinants of the need which have been usedby the previous and fashionable researches performed in
J Public Health (2007) 15:423–432 431
developing countries. We believe, however, that morecomprehensive determinants of the need should be defined.
Acknowledgements We are grateful for financial support providedby the T.R. Prime Ministry State Planning Organization and EgeUniversity Research Foundation.
Conflict of interest statement The authors confirm that there are norelevant associations that might pose a conflict of interest.
References
Asadi-Lari M, Packham C, Gray D (2003) Need for redefining needs.Health Qual Life Outcomes 1:34
Belek İ (2004) Sosyoekonomik Konumda ve Sağlıkta SınıfsalEşitsizlikler: Antalya’da Beş Yıllık Bir Araştırma. TurkishMedical Association Publications, Ankara
Busse R, Riesberg A (2004) for WHO Regional Office for Europe onbehalf of the European Observatory on Health. Health care systemsin transition: Germany. Systems and policies, Copenhagen
CIA (2005) The world fact book, Turkey, http://www.cia.gov/cia/publications/factbook/geos/tu.html, accessed 26 December
Frankel S (1991) Health needs, health-care requirements, and the mythof infinite demand. Lancet 337(8757):1588–1590
Frankel S, Ebrahim S, Davey Smith G (2000) The limits to demandfor health care. BMJ 321:40–45
Hassoy H (2005) Gülyaka Sağlık Ocağı Bölgesinde 0-6 YaşÇocukların Sağlık Hizmeti Kullanımları, Sürekli Hizmet Kayna-kları ve Etkileyen Faktörler. Public Health Thesis, Ege University
HIPS (Hacettepe Institute of Population Studies) (2003) Turkeydemographic and health survey 2003. http://www.hips.hacetxtepe.edu.tr/tnsa2003eng/reports.htm, accessed 12 May 2006
Independent Social Scientists (2003) Evaluation of 2003 budget andMarch 3rd stability package: new economic measures are the cost ofIMF programme, not of peace. http://www.bagimsizsosyalbilimciler.org/Yazilar_BSB/BSBMart2003.pdf, accessed 26 December 2005
Jordan J, Wright J, Wilkinson J, Williams R (1998) Assessing localhealth needs in primary care: understanding and experience inthree English districts. Qual Health Care 7:83–89
Mathers CD, Sabaté E, Lopez D (2001) Guidelines for epidemiologicalreviews: the Global Burden of Disease 2000 project. GlobalProgramme on Evidence for Health PolicyWorldHealth Organization
Matthews E (1998) Is health care a need? Med Health Care Philos 1(2):155–161
Ministry of Health (1995) Health services utilization survey in Turkey.Ministry of Health, Ankara
Ministry of Health (2004) Refik Saydam Hygiene Center PresidencySchool Of Public Health, Başkent University. National burden ofdisease and cost effectiveness project burden of disease finalreport http://www.hm.saglik.gov.tr/pdf/nbd/raporlar/burdenofdiseaseENG.pdf, accessed 12 May 2006
Ministry of Health of Republic of Turkey (2004a) General directorateof primary health services, annual report of general directorate ofprimary health services, http://www.saglik.gov.tr/extras/istatistikler/temel2004/index.htm, accessed 12 May 2006
Ministry of Health of Republic of Turkey (2004b) General directorateof curative services, annual report of general directorate of curativeservices, inpatient health services, http://www.saglik.gov.tr/extras/istatistikler/ytkiy2004/2004KITAP%20ICINDEKILER.xls,accessed 12 May 2006
Mooney G (1992) Economics, medicine and health care. HarvesterWheatsheaf, Hemel Hempstead, UK
Murray CJL, Lopez Alan D, Mathers Colin D, Stein C (2001) TheGlobal Burden of Disease 2000 project: aims, methods and datasources. Global programme on evidence for health policydiscussion Paper No. 36, World Health Organization
Neufeld V, Pickering R, Simpson J (1997) Priority health problems in theeducation of health professionals. Community-Partnerships seriesvolume 2. Network Publications, Maastricht, The Netherlands
Regidor E, Navarro P, Dominguez V, Rodriguez C (1997) Inequalitiesin income and long-term disability in Spain: analysis of recenthypotheses using cross sectional study based on individual data.BMJ 315:1130–1135
Savas BS, Karahan Ö, Saka RÖ, Thomson S, Mossialos E (2002)Health care systems in transition: Turkey. European Observatoryon Health Care Systems 4(4), Copenhagen
Soyer A, Yazgan A, Kılıç B, Yavuz CI, Şeyhoğlu CO, Akyol E et al(2003) What do the health reforms bring to the public and tohealthcare workers in Turkey in 2003-Sağlıkta Dönüşüm Pro-gramı, 2003 Türkiye’sinde Halka ve Hekimlere/Sağlık Persone-line Ne Getiriyor?, Turkish Medical Association, http://www.ttb.org.tr/eweb/s_donusum/iii.htm, accessed 20 December 2006
Stevens A, Raftery J, Mant J (2002) An introduction to HCNA theepidemiological approach to health care needs assessment. http://hcna.radcliffe-oxford.com/introframe.htm, accessed 12 May 2006
Turkish Statistical Institute (2006) Household work force surveyFebruary 2006 results (January, February, March) Hanehalkı İşgücüAraştırması 2006 Şubat Dönemi Sonuçları (Ocak, Şubat, Mart2006), http://www.tuik.gov.tr/PreHaberBultenleri.do?id=283,accessed 23 May 2006
UNICEF (2006) The state of the world’s children 2006: excluded andinvisible. http://www.unicef.org/sowc06/pdfs/sowc06_table6.pdf,accessed 12 May 2006
World Bank (2005) World development indicators 2005. http://devdata.worldbank.org/wdi2005/section2.htm, accessed 26 December 2005
Wright J, Williams R, Wilkinson JR (1998) Development andimportance of health needs assessment. BMJ 316:1310–1313
432 J Public Health (2007) 15:423–432