
Analysis of Pyrotechnic Components - Chemical Safety Board
57
Analysis of Pyrotechnic Components Results of chemical, thermal and mechanical insult testing of components of four fireworks samples 31 December 2013 Amy J. R. Bauer
-
Upload
khangminh22 -
Category
Documents
-
view
1 -
download
0
Transcript of Analysis of Pyrotechnic Components - Chemical Safety Board

Analysis of Pyrotechnic Components
Results of chemical, thermal and mechanical insult testing of components of four fireworks samples 31 December 2013
Amy J. R. Bauer

1
Table of Contents Table of Figures ............................................................................................................................................. 3
List of Acronyms ............................................................................................................................................ 4
1.0 Executive Summary ................................................................................................................................. 5
2.0 Introduction ............................................................................................................................................ 5
3.0 Approach and Objectives ........................................................................................................................ 7
4.0 Experimental Methods and Procedures ................................................................................................. 9
4.1 Handling Precautions .......................................................................................................................... 9
4.2 Sample Preparation .......................................................................................................................... 10
4.2.1 Sample Preparation for Mechanical Insult Testing .................................................................... 10
4.2.2 Sample Preparation for Chemical and Thermal Testing ............................................................ 11
4.3 Brief Test Descriptions of All Tests .................................................................................................... 12
4.3.1 Mechanical Insult Test – Impact. ............................................................................................... 12
4.3.2 Mechanical insult test – Friction ................................................................................................ 13
4.3.3 Electrostatic Discharge test........................................................................................................ 14
4.3.4 Scanning Electron Microscope – Energy Dispersive X-ray (SEM-EDAX) Analysis ....................... 14
4.3.5 Inductively Coupled Plasma Atomic Emissions Spectroscopic (ICP-AES) Analysis ..................... 15
4.3.6 Fourier Transform Infrared Spectroscopy (FTIR) Analysis ......................................................... 15
4.3.6 Differential Scanning Calorimetry (DSC) Analysis ...................................................................... 15
5.0 Data, Observations and Results ............................................................................................................ 16
5.1 O-Triple-C Results.............................................................................................................................. 22
5.1.1 Sample O-Triple-C, Sub-sample A .............................................................................................. 22
5.1.2 Sample O-Triple-C, Sub-sample ................................................................................................. 25
5.1.3 O-Triple-C, Sub-sample C ........................................................................................................... 27
5.2 Sky Festival Samples.......................................................................................................................... 28
5.2.1. Sky Festival Sub-sample A ......................................................................................................... 28
5.2.2. Sky Festival Sub-sample B ......................................................................................................... 30
5.2.3. Sky Festival Sub-sample C ......................................................................................................... 31
5.2.4. Sky Festival Sub-sample D ......................................................................................................... 33
5.2.5. Sky Festival Sub-sample E ......................................................................................................... 35
5.2.6. Sky Festival Sub-sample F ......................................................................................................... 36
5.2.7. Sky Festival Sub-sample G ......................................................................................................... 38
2
5.3 Halawa Samples ................................................................................................................................ 39
5.3.1. Halawa Sample A ...................................................................................................................... 39
5.3.2. Halawa Sample B ....................................................................................................................... 40
5.3.3. Halawa Sample C ....................................................................................................................... 42
5.4 Krazy Kids Samples ............................................................................................................................ 43
5.4.1. Krazy Kids Sample A .................................................................................................................. 43
5.4.2. Krazy Kids Sample B .................................................................................................................. 45
5.4.3. Krazy Kids Sample C .................................................................................................................. 47
5.5 Standards .......................................................................................................................................... 48
5.5.1. Potassium chlorate and aluminum homemade flash powder .................................................. 48
5.5.2. Potassium perchlorate and aluminum homemade flash powder ............................................ 49
5.5.3. Potassium perchlorate/chlorate mixed and aluminum homemade flash powder................... 50
6.0 Discussion ............................................................................................................................................. 52
6.1 Results Categorization ...................................................................................................................... 52
6.1.1 Lift Charges................................................................................................................................. 53
6.1.2 Flash Powder .............................................................................................................................. 53
6.1.3 Stars/Comets .............................................................................................................................. 53
6.1.4 Clay ............................................................................................................................................. 54
6.2 Particle Size Effects ........................................................................................................................... 54
6.3 Differential Scanning Calorimetry Observations............................................................................... 54
7.0 Conclusion ............................................................................................................................................. 55
8.0 References ............................................................................................................................................ 55
9. 0 Appendix .............................................................................................................................................. 55
10.0 Acknowledgments ............................................................................................................................... 56
3
Table of Figures Figure 1 Components of a typical aerial firework1 ....................................................................................... 6
Figure 2. Photo of initial cutting procedure. ............................................................................................... 10
Figure 3. Initial processing of the larger samples; chopping with a razor blade. ....................................... 11
Figure 4. Completely processed powder. ................................................................................................... 11
Figure 5. MBOM Impact Testing Machine .................................................................................................. 12
Figure 6. ABL Friction Testing Machine ...................................................................................................... 13
Figure 7. ABL Friction Machine, showing a positive result ........................................................................ 13
Figure 8. Detail of electrode assembly of ESD testing machine. ................................................................ 14
Figure 9. ABL Electrostatic Discharge Testing Machine. ............................................................................. 14
Figure 10. Enlarged photograph of O-Triple-C, A........................................................................................ 22
Figure 11. 40x SEM image of O-Triple-C, A. ................................................................................................ 22
Figure 12. SEM and EDAX data of O-Triple-C, A. ......................................................................................... 23
Figure 13. DSC results for O-Triple-C, A, showing no thermal decomposition below 500 degrees C. ....... 24
Figure 14. Enlarged photo of O-Triple-C, B. ................................................................................................ 25
Figure 15. SEM and EDAX data, O-Triple-C B. ............................................................................................. 25
Figure 16. DSC data from O-Triple-C, B. Sample decomposition onset at 365 degrees C. ....................... 26
Figure 17. Enlarged photo of O-Triple-C, C. ................................................................................................ 27
Figure 18. SEM and EDAX data for O-Triple-C, C......................................................................................... 27
Figure 19. Enlarged photo of Sky Festival A sample. .................................................................................. 29
Figure 20. SEM and EDAX data of Sky Festival A. ....................................................................................... 29
Figure 21. Enlarged photo of Sky Festival B. .............................................................................................. 30
Figure 22. SEM and EDAX data for Sky Festival B sample. .......................................................................... 31
Figure 23. Enlargement of photo of Sky Festival Sub-sample C. ................................................................ 32
Figure 24. The EDAX analysis on this slide is of the whole image.............................................................. 32
Figure 25. Enlarged photo of Sky Festival sample D. .................................................................................. 33
Figure 26. SEM and EDAX data on Sky Festival D, note the predominance of the P peak. ........................ 34
Figure 27. SEM and EDAX data on Sky Festival D. ....................................................................................... 34
Figure 28. Enlarged photo of Sky Festival E ................................................................................................ 35
Figure 29. SEM image of Sky Festival E, scale on bottom ........................................................................... 35
Figure 30. EDAX results of Sky Festival E, S and K dominating ................................................................... 36
Figure 31. Enlarged photo of Sky Festival F ............................................................................................... 37
Figure 32. SEM image of Sky Festival F, showing texture of black particle ............................................... 37
Figure 33. EDAX results of Sky Festival F, showing a clay-like composition .............................................. 37
Figure 34. Photo of Sky Festival G sample ................................................................................................. 38
Figure 35. SEM image of Sky Festival G sample ......................................................................................... 38
Figure 36. EDAX results of Sky Festival G sample ...................................................................................... 38
Figure 37. Enlarged photo of Halawa sample A. ........................................................................................ 39
Figure 38. SEM and EDAX data for Halawa sample A. ................................................................................ 40
Figure 39. Enlarged photo of Halawa sample B .......................................................................................... 41
Figure 40. SEM and EDAX data for Halawa sample B ................................................................................. 41
4
Figure 41. Enlarged photo of Halawa C sample. ........................................................................................ 42
Figure 42. SEM and EDAX data for Halawa C sample. ................................................................................ 43
Figure 43. Enlarged photo of Krazy Kids sample A. .................................................................................... 44
Figure 44. SEM and EDAX data of Krazy Kids sample A. ............................................................................. 44
Figure 45. Enlarged photo of Krazy Kids sample B. ..................................................................................... 45
Figure 46. SEM and EDAX data of white regions of Krazy Kids sample B, Ba peaks dominating. .............. 46
Figure 47. Enlarged photo of Krazy Kids sample C. ..................................................................................... 47
Figure 48. SEM and EDAX data of Krazy Kids sample C............................................................................... 47
Figure 49. KClO3 crystal in homemade flash powder ................................................................................. 49
Figure 50. EDAX results for KClO3 flash powder......................................................................................... 49
Figure 51. SEM of KClO4 and Al flash powder standard ............................................................................. 50
Figure 52. EDAX results from KClO4 and Al flash powder .......................................................................... 50
Figure 53. SEM image of KP&KC + Al homemade flash powder ................................................................ 51
Figure 54. EDAX analysis of the mixed flash powder ................................................................................. 51
Figure 55. DSC run of mixed flash powder, showing that chlorate can be detected in a DSC endotherm 52
List of Acronyms ABL - Alleghany Ballistics Laboratory
ATF - Bureau of Alcohol, Tobacco, Firearms and Explosives
ATF-FTIR - Attenuated total reflectance Fourier-transform infrared spectrometry
ARA - Applied Research Associates
CSB - U.S. Chemical Safety Board
DI - deionized water
DSC - differential scanning calorimetry
EDS - electrostatic discharge
EDAX - energy dispersive X-ray spectrometry
FTIR - Fourier-transform infrared spectrometry
IC - ion chromatography
ICP-AES - inductively coupled plasma atomic emission spectrometry
LC/MS - liquid chromatography mass spectrometry
MBOM - modified Bureau of Mines
ml - milliliter
MIL-STD - military standard
NA - not applicable
NCOI - non-conflict of interest
PETN - pentaerythritol tetranitrate
PPE - personal protective equipment
RDX - cyclotrimethylenetrinitramine
SEM - scanning electron microscopy
TIL- threshold of initiation level
5
1.0 Executive Summary This document describes testing of the physical and chemical characteristics of component
samples of four fireworks collected and provided by the CSB to determine whether these
samples had chemical or physical characteristics that would potentially increase their
susceptibility to unintentional or accidental initiation. This document contains a narrative that
discusses the merged results of an extensive set of mechanical insult, thermal sensitivity and
chemical composition testing. All the raw analytical data is present in the attached Appendices.
Although no formal testing protocol exists to determine sensitivity of pyrotechnic materials, all
analyses were performed with well-characterized, industry standard testing. Sensitivity to
mechanical insult was evaluated through use of calibrated instruments and military-approved
methods to establish response to impact, friction and electrostatic discharge. These mechanical
insult tests showed that although some of the materials were indeed very sensitive, that
appreciable similarity exists between samples of material having the same purpose within the
firework (the components are discussed in the next section). It should also be noted at the outset
that these materials are expected to be quite sensitive, and that our results are in agreement with
the basic nature of all fireworks materials, especially flash powder mixtures.
Elemental composition analysis was performed on the dry samples with scanning electron
microscopy and x-ray elemental analysis (SEM-EDAX) and after partial dissolution in water, by
inductively-coupled plasma spectrometry (ICP-AES). Anions were analyzed with liquid
chromatography/mass spectrometry (LC/MS) (perchlorate) and ion chromatography (IC)
(anions, in this case, chlorate and nitrate), and also by attenuated total reflectance Fourier-
transform infrared spectrometry (ATF-FTIR) analyses. The results of the chemical analysis
demonstrated no definitive unusual chemistry in any of the samples, and that the composition of
different samples having the same purpose within the fireworks was relatively conserved.
The likelihood of adverse reaction when exposed to high temperatures was evaluated with
differential scanning calorimetry. None of the samples exhibited sensitivity to temperatures less
than 350 °C.
Key findings of the testing:
The presence of sensitizing chlorates was not established.
Thermal and testing regarding susceptibility to mechanical insult indicate that the flash
powder type components are in general quite sensitive relative to standard reference
material (military explosives and lab-generated flash powder), but that this sensitivity
was expected by virtue of the chemical composition of the materials.
2.0 Introduction Fireworks are a class of explosive pyrotechnic devices used for aesthetic, cultural, and religious
purposes. They are most commonly used as part of a fireworks display. Fireworks produce four
primary effects: noise, light, smoke and floating materials (confetti, for example). They are
designed to burn with flames and sparks of many colors. Displays are popular throughout the
world and are the focal point of many cultural and religious celebrations, including Independence
Day in the U.S.
6
Fireworks are generally classified as to where they perform, either as a ground or aerial firework.
In the latter case they may provide their own propulsion (typically called a skyrocket) or be shot
into the air by a mortar (aerial shell). The most common feature of fireworks is a paper or
cardboard tube or casing filled with the combustible material, often pyrotechnic stars. The aerial
shell is the backbone of today's commercial aerial display. A smaller version for consumer use is
known as the festival ball in the United States. There are also ground fireworks; while less
popular than aerial fireworks, they can produce various shapes like rotating circles, stars and 3D
globes.
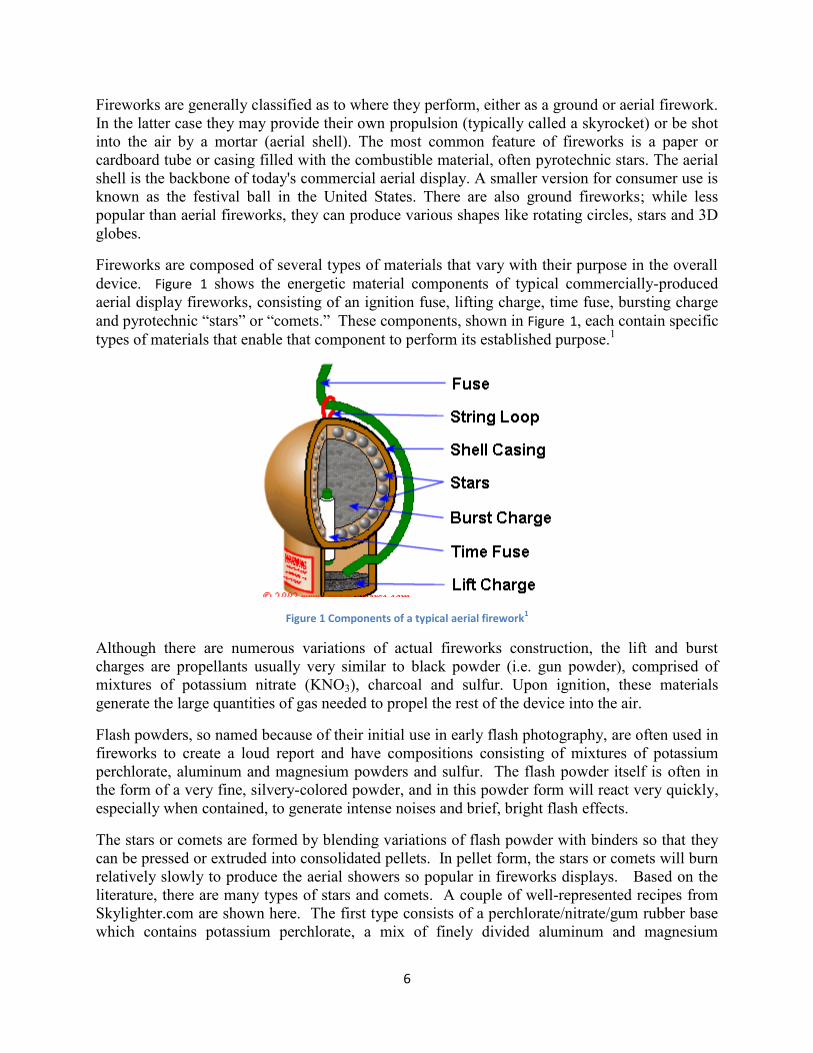
Fireworks are composed of several types of materials that vary with their purpose in the overall
device. Figure 1 shows the energetic material components of typical commercially-produced
aerial display fireworks, consisting of an ignition fuse, lifting charge, time fuse, bursting charge
and pyrotechnic “stars” or “comets.” These components, shown in Figure 1, each contain specific
types of materials that enable that component to perform its established purpose.1
Figure 1 Components of a typical aerial firework1
Although there are numerous variations of actual fireworks construction, the lift and burst
charges are propellants usually very similar to black powder (i.e. gun powder), comprised of
mixtures of potassium nitrate (KNO3), charcoal and sulfur. Upon ignition, these materials
generate the large quantities of gas needed to propel the rest of the device into the air.
Flash powders, so named because of their initial use in early flash photography, are often used in
fireworks to create a loud report and have compositions consisting of mixtures of potassium
perchlorate, aluminum and magnesium powders and sulfur. The flash powder itself is often in
the form of a very fine, silvery-colored powder, and in this powder form will react very quickly,
especially when contained, to generate intense noises and brief, bright flash effects.
The stars or comets are formed by blending variations of flash powder with binders so that they
can be pressed or extruded into consolidated pellets. In pellet form, the stars or comets will burn
relatively slowly to produce the aerial showers so popular in fireworks displays. Based on the
literature, there are many types of stars and comets. A couple of well-represented recipes from
Skylighter.com are shown here. The first type consists of a perchlorate/nitrate/gum rubber base
which contains potassium perchlorate, a mix of finely divided aluminum and magnesium

7
powders, very fine charcoal powder, potassium nitrate, red gum, and powdered sulfur. In
another major type, potassium perchlorate is substituted with potassium nitrate and blended with
the fine charcoal powder, sulfur, dextrin, and flaked aluminum.2
Metal salts are added to create the colors associated with the fireworks. For example, strontium
nitrate yields a bright red color, sodium nitrate is yellow and copper salts yield both blue and
green, depending upon the anion associated with the copper.
These components are assembled into a device as shown in Figure 1, and launched from a mortar
to begin the processes that result in the display. As previously described, the lift charge propels
the shell out of the mortar tube, and the time fuse ignites the burst charge at the correct altitude.
The burst charge than creates the explosion of the shell and the release and ignition of the stars,
causing the pattern that appears in the sky.
One primary aim of the work was to test all the materials for the presence of chlorates, which
used to be a common ingredient in flash powder mixtures. These compounds are recognized by
the community to yield even more sensitive flash powder mixes than the more commonly used
perchlorates. Chlorates are more dangerous in several ways. Firstly, they are known to be more
inherently sensitive to mechanical insult. In addition, chlorates can react with sulfuric acid to
form a highly reactive solution of chloric acid and potassium sulfate:
2 KClO3 + H2SO4 → 2 HClO3 + K2SO4
The products of the above reaction are sufficiently reactive that they will spontaneously ignite if
combustible material (sugar, paper, etc.) is present.3 This is a particular problem when sulfur is
present in the mixture, as almost all sulfur components will yield small amounts of sulfuric acid
with time and exposure to humidity. The presence of chlorate compounds in fireworks is no
longer common, but testing for this anion is important because of the additional danger in
handling they represent.
The results discussed in this report all indicate that the material submitted to us for testing is
within the range of ordinary pyrotechnics recipes that can be discovered in literature and on the
internet. This is not to say that the materials are not sensitive; they certainly are, as shown by the
testing related to exposure to calibrated impact, frictional forces and electrostatic discharge.
Quotations in the text describe that this degree of sensitivity is to be expected.
3.0 Approach and Objectives ARA received samples of 4 fireworks, each separated into subsamples by pyrotechnic
component. These samples were chosen for analysis to determine if they were more sensitive to
initiation than expected. This testing includes susceptibility to reaction by exposure to impact,
frictional forces and exposure to electrostatic discharge, as well as chemical and thermal
analysis. Altogether, 16 sampled materials were subjected to testing, along with five standard
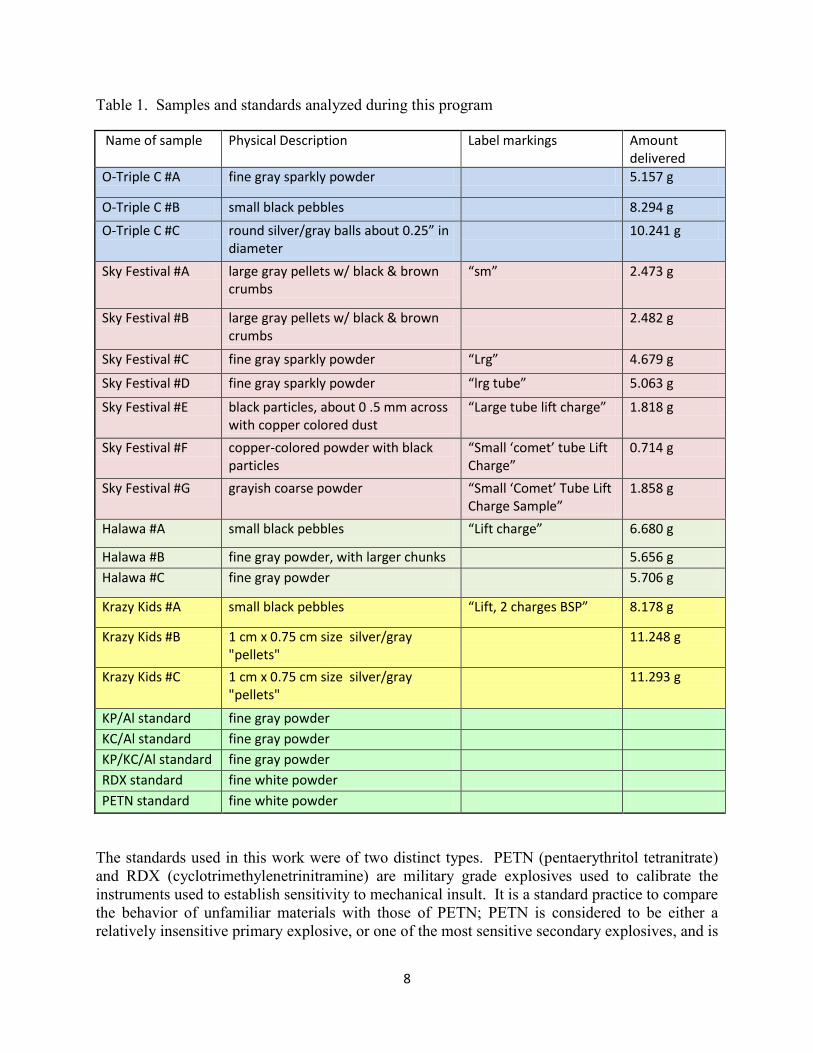
materials. Descriptions of all these materials are presented in Table 1.
8
Table 1. Samples and standards analyzed during this program
Name of sample Physical Description Label markings Amount delivered
O-Triple C #A fine gray sparkly powder 5.157 g
O-Triple C #B small black pebbles 8.294 g
O-Triple C #C round silver/gray balls about 0.25” in diameter
10.241 g
Sky Festival #A large gray pellets w/ black & brown crumbs
“sm” 2.473 g
Sky Festival #B large gray pellets w/ black & brown crumbs
2.482 g
Sky Festival #C fine gray sparkly powder “Lrg” 4.679 g
Sky Festival #D fine gray sparkly powder “lrg tube” 5.063 g
Sky Festival #E black particles, about 0 .5 mm across with copper colored dust
“Large tube lift charge” 1.818 g
Sky Festival #F copper-colored powder with black particles
“Small ‘comet’ tube Lift Charge”
0.714 g
Sky Festival #G grayish coarse powder “Small ‘Comet’ Tube Lift Charge Sample”
1.858 g
Halawa #A small black pebbles “Lift charge” 6.680 g
Halawa #B fine gray powder, with larger chunks 5.656 g
Halawa #C fine gray powder 5.706 g
Krazy Kids #A small black pebbles “Lift, 2 charges BSP” 8.178 g
Krazy Kids #B 1 cm x 0.75 cm size silver/gray "pellets"
11.248 g
Krazy Kids #C 1 cm x 0.75 cm size silver/gray "pellets"
11.293 g
KP/Al standard fine gray powder
KC/Al standard fine gray powder
KP/KC/Al standard fine gray powder
RDX standard fine white powder
PETN standard fine white powder
The standards used in this work were of two distinct types. PETN (pentaerythritol tetranitrate)
and RDX (cyclotrimethylenetrinitramine) are military grade explosives used to calibrate the
instruments used to establish sensitivity to mechanical insult. It is a standard practice to compare
the behavior of unfamiliar materials with those of PETN; PETN is considered to be either a
relatively insensitive primary explosive, or one of the most sensitive secondary explosives, and is
9
thusly used to give a boundary between those two classes. PETN may be detonated by striking
with a hammer on a hard steel surface, and is generally considered the least sensitive explosive
with which this may be done. RDX is only slightly less sensitive to mechanical insult. By
comparing the sensitivity of an explosive against the behavior of PETN, therefore, it may be
determined whether or not the material can be classified as a primary or secondary explosive.
This determination will impact the ability to safely handle the material, and give considerations
on how this would be done.
The second type of standards serves several purposes. The three homemade flash powders are
stoichiometric mixtures of finely divided aluminum powder (Al) and potassium chlorate (Al +
KClO3), potassium perchlorate (Al + KClO4) or a mix of the two (Al + KClO3 and KClO4).
These materials are used to assure good detection of these important chemicals, which may be
found in all the flash powder types of samples, to understand endothermic behavior in the
thermal testing (as the oxidizers melt), to demonstrate the susceptibility to mechanical insult of
sulfur-free flash powders, and to provide at least one sample that would analyze positively for
chlorate.
Other calibration verification standards were used in the chemical analysis and thermal testing.
If those samples fell within appropriate limits, they are not discussed in this report.
The primary objective of this work is to establish the relative sensitivity of each sub-sample as
related to the chemistry of the material. Both the sensitivity to mechanical insult and the
chemical composition were carefully evaluated, in comparison with the behavior of the standard
materials and common recipes for amateur pyrotechnics production. Taken together, the
measurements indicate that the samples provided are within the range of ordinary published
formulations.
4.0 Experimental Methods and Procedures
4.1 Handling Precautions Fireworks components are known to be extremely sensitive to mechanical insult (i.e. impact,
friction and electrostatic discharge). Flash powder, a mixture of finely divided metal powder and
oxidizer, in particular is recognized by authors in the amateur pyrotechnics community, as being
particularly dangerous: “The first rule of caution is to note that compositions are extremely
hazardous when subjected to heat, friction, sparks, static electricity or a sharp blow. Mixing
or manufacturing flash compositions is possibly more dangerous than attempting to
manufacture black powder, improvised plastic or other nitrate type explosives.”4 Because
flash powders are a component found in nearly every pyrotechnic device, all the samples were
treated as a significant hazard. In spite of the limited amounts of material delivered as samples,
an accident with any one of them could have resulted in disfiguring injuries for those involved.
Therefore, we used all the normal safety precautions exercised in an explosives laboratory.
The technicians performing the testing wore fireproof lab coats, laboratory glasses, nitrile gloves
and grounding heel straps during the performance of this work. Additionally, when doing the
sample processing, they were also wearing wrist grounding straps. When running the actual
mechanical insult test series, they used hearing protection, in this case earplugs. No persons
10
uninvolved with the testing were permitted in the lab when the samples were not locked in
storage. Normal safety precautions of banning spark-producing devices and cell phones from the
lab were observed.
The samples were stored in an ATF-approved explosives magazine. Chains of custody (included
in the delivered materials) were utilized every time the samples were removed from the
magazine, such that every usage of the material was documented. NCOI forms were signed by
all technicians who took part in the program.
A standard operating procedure including safety protocol and PPE requirements was written
from the military standards and the samples were processed and tested for mechanical insult
sensitivity at the ARA office in Panama City, FL.
4.2 Sample Preparation
This section describes the preparation of all samples for each specific test.
4.2.1 Sample Preparation for Mechanical Insult Testing
The samples with larger particle size distributions needed to be safely processed into a powder
form prior to testing. The military standard specifies that the tests be performed on a particular
sample quantity not possible on the large chunks present in some of the sub-samples. For the
specimens not delivered as a fine powder, a processing technique was developed.
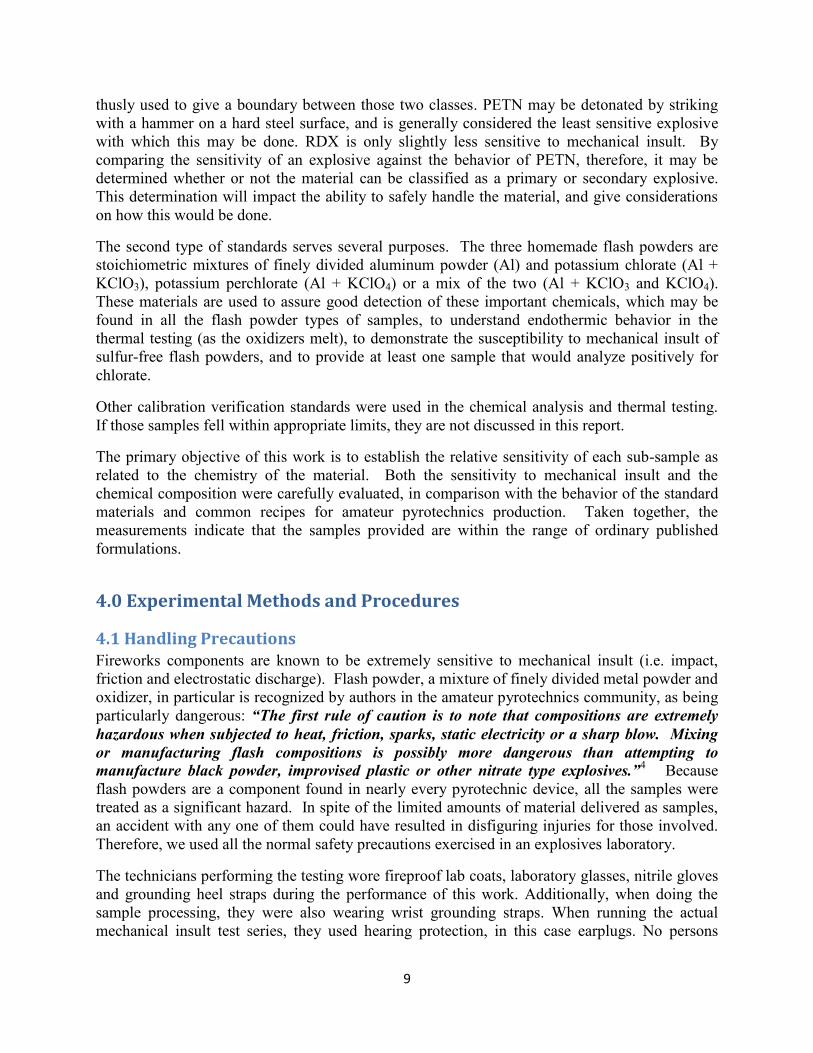
To eliminate possible friction hazard, the process was performed on a plastic sheet over a paper
towel, rather than on a metallic surface. This treatment provided an extra cushion that kept the
applied impact to a minimum. Large sample particles were first cut into smaller pieces with a
razor blade, and the resulting chunks crushed into a powder form with a non-sparking metal
spatula. This process is shown in Figure 2 and the results in Figure 3. To keep the direct forces to
a minimum, a small rolling action over the chunks generated a powder of more appropriate
particle sizes. On every sample, this technique worked very well in producing a coarse powder
(Figure 4). These powders, along with those samples that had arrived as powdered material, were
submitted to the testing.
Figure 2. Photo of initial cutting procedure.
11
Figure 3. Initial processing of the larger samples; chopping with a razor blade.
Figure 4. Completely processed powder.
4.2.2 Sample Preparation for Chemical and Thermal Testing
In preparations for SEM and EDAX, a small amount of the powder was removed from the
container via spatula. Carbon tape was then lightly pressed against the powder, tapping off any
loose power, leaving a thin monolayer of powder stuck to the tape. The carbon tape with the
sample on it was then placed directly on the sample platform in the SEM. The carbon tape is
composed largely of carbon and oxygen, and its use negates any information about these
elements in the EDAX elemental composition data. The other reported elements come from
calibrated signal channels.
In the analysis of a single-phase, pure element, sample at 15 kV the smallest possible interaction
volume is about 1 μm in diameter. Elements with atomic number higher than that of Na are well
analyzed with this technique, and have detection limits in the range of 1/104 to 1/10
5. Actual
interaction regions are slightly more diffuse with the real samples, which are heterogeneous in
both composition and morphology.
Regions where the electron beam is incident on the sample range from the very tightest focus
(used to identify the composition of individual particles) to full-image (used to establish overall
sample composition). Regions marked in some SEM images in the results section indicate the
location of the interaction region, but not necessarily the size of the spot probed with EDAX.
EDAX results are normally viewed as semi-quantitative, and are used in this work to establish
presence or absence of certain materials, rather than the absolute concentration of them.
Sample preparation for the ICP analysis consisted of 1 mg of sample being put into 10 ml of
deionized water (DI). 1 ml of this slurry was then added to 10 ml of HNO3. Note that no sample

12
digestion was performed, as this data was viewed largely as a simple confirmation of EDAX
results. In these results, scandium (Sc) was used as an internal standard, and several of the
channels were not calibrated. This latter fact explains the presence of positive readings in the
uranium channels, rather than the actual presence of uranium.
Analysis of anions was performed by chromatographic techniques: Samples for the anion
analyses were put into deionized water (DI), 0.25 g into 25 ml. Analyses were performed on
filtered solution. No preservatives were used.
IR spectroscopy was also used to analyze anions. This analysis was done with wetted samples
largely to eliminate possible safety problems of squeezing the sample material between the
sample holder and the pressure clamp. The
sample holder allows the attenuated total
reflectance to be measured through the sample.
ATR-FTIR samples were generated by putting 1
mg of each sample into 10 ml of DI. This
solution was thoroughly shaken and allowed to
settle. 9 ml of liquid was removed, leaving
behind a dense slurry of sample and DI. A
disposable pipette was used to add 1 drop of the
slurry to the diamond surface in the center of the
metal sample holder on the FTIR and the IR tip
was lowered onto the holder, pinning a thin layer
of slurry between the tip and the holder. Blank
backgrounds were collected prior to sample
analyses.
Thermal stability testing: Sample sizes of
approximately 1 mg were directly put into
sample pans and hermetically sealed before
analysis in the differential scanning calorimeter
(DSC).
4.3 Brief Test Descriptions of All Tests
4.3.1 Mechanical Insult Test – Impact.
To establish sample sensitivities to initiation by
impact, the Modified Bureau of Mines (MBOM) Impact test machine was used, shown in Figure
5. MBOM Impact test machine creates high impact forces on energetic materials. The machine’s
impacting mass (2.5 kg) is dropped from programmable heights (up to 100 cm) before striking a
sample situated on a steel anvil. The combined effects of impact and confinement ignite the
material at heights that provide energy above the reactive threshold. Reaction of the material is
determined by observation and/or examination of the sample residue.
In order to determine the relative impact sensitivity, the “Bruceton” or “Stair-step” method of
initiation threshold identification is performed. A 25 ± 5 mg sample of material is placed on 1
inch square 180 grit sandpaper in a small pile under the striker. The drop weight of 2.5 kg is set
at the determined height. While observing the sample area, the drop weight is released via
Figure 5. MBOM Impact Testing Machine
13
electromagnet. After recording the reaction as a “go” or “no go”, the drop weight is removed
from the striker and the anvil and striker faces are cleaned. A “go” is determined by the
operators observing smoke, flash, flame, sparks, or a loud report to differentiate it from regular
machine noise. As per the “Bruceton” testing method, when a “go” is recorded, the operator sets
the next test height to the next lower log interval. If a “no go” is recorded, the operator sets the
next test height to the next higher log interval. The operator repeats this process 25 times. These
numbers yield a H50%, or height where the sample will react 50% of the time. Calibration
standards of RDX and PETN were run in this machine, and results well within the accepted
limits of the military method were obtained. Testing was conducted in accordance with MIL-
STD 1751A Method 1021.5
4.3.2 Mechanical insult test – Friction
ARA used an Allegheny Ballistics Laboratory
(ABL) Friction Test Apparatus for conducting these
tests, shown in Figure 6. The apparatus delivers a
sliding friction input into a small sample (nominally
10 mg) of test material. The primary parts of the
test apparatus are a friction wheel that applies a load
to the sample and a friction plate upon which the
test sample is placed. An explosive sample is
positioned on the friction plate; the friction wheel is
lowered onto the sample
at a pre-determined load,
such that the sample is
pinched between the plate and the wheel. The pendulum weight is
raised to the 8 feet per second height and locked in place by an
electromagnetic brake. When ready to test, the brake is released, and
the pendulum weight impacts the friction plate causing it to slide
rearwards.
Initiation of the sample is determined by production of an audible pop,
flame or smoke, as shown in Figure 7. This test simulates potential
initiation of explosive that may be caught in mechanical parts, which
could apply a pinch or sliding load on the explosive. Solids, liquids, or
powders can be tested with this apparatus. Testing was conducted in
accordance with MIL-STD 1751A Method 1021.5
Figure 6. ABL Friction Testing Machine
Figure 7. ABL Friction Machine, showing a positive result

14
4.3.3 Electrostatic Discharge test
Total energy deposited in a human ESD event is
reported to be tens of millijoules (mJ).6 Giving a
safety factor of approximately 10x, any material
initiated with discharges under 0.25 joules is
normally classified as hazardous. Most explosives
and pyrotechnics are hazardous to an
electrostatically generated spark. A quantitative
measure of sensitivity to spark is determined by the
electrostatic discharge (ESD) test. The ABL ESD
machine operates by generating an electric charge in
a bank of capacitors across an electron gap at 5,000
VDC (Figure 8. Detail of electrode assembly of ESD
testing machine.). The electric charge is discharged
through a sample of the test material held on a
grounded Teflon plate. The discharge point is a
needle of specific design that is lowered toward the
sample. As the distance between needle and the
grounded plate narrows, the electricity arcs from the
needle to the grounded plate. The electric arc passes through the test sample resulting in a
reaction or non-reaction of the material. The whole apparatus is shown in Figure 9.
The goal of the ESD test is to find the threshold of initiation level (TIL). This is the highest level
of electrical energy (joules) at which 20 consecutive “no gos” are recorded. The operator places
approximately 10 mgs of the test material on the platform. The appropriate capacitor is selected
by the turn of two knobs and is charged to
5000 Vdc. The operator fires the machine
and observes. If results are negative, i.e.,
no reaction, the test is continued until 20
consecutive “no-gos” are reported. If the
test sample has a positive result, i.e., flash,
spark, burn, odor, or noise other than
instrument noise, then testing should be
performed at the next lower level until 20
consecutive “no-gos” are reported. The
final number is reported as number of “no
gos” out of 20 at the tested power level;
for example “0/20 “No Gos” @ 0.19
Joules.”
4.3.4 Scanning Electron Microscope – Energy Dispersive X-ray (SEM-EDAX) Analysis
SEM is a type of high-magnification imaging in which the sample is scanned with a focused
beam of electrons. These electrons typically interact with the sample material on an atomic
level, yielding information about the material’s morphology (in the case of the fireworks
samples, particle size and heterogeneity). Detection is performed through observation of an
image of secondary electrons emitted from the sample after having been excited by the input
Needle
Sample
Figure 8. Detail of electrode assembly of ESD testing machine.
Figure 9. ABL Electrostatic Discharge Testing Machine.

15
beam. These images are not natively colored, because no light of visible wavelength is
involved. The images are typically shown in black and white. When excited by the electron
beam, X-rays characteristic of the atomic composition of the sample are also emitted, which
forms the basis of the X-ray elemental analysis. The instrument was run under a relatively
high-pressure and humidity environment, enabling imaging of materials sensitive to
electrostatic discharge to be performed.
4.3.5 Inductively Coupled Plasma Atomic Emissions Spectroscopic (ICP-AES) Analysis
ICP-AES, also called ICP-optical emission spectrometry (ICP-OES) is a type of emission
spectroscopy that uses a high-temperature plasma to excite atoms in a sample to highly excited
states or to create ions. These excited or ionized atoms emit light at frequencies characteristic
of their elemental composition. Detection of this light is used to determine the trace elements
present in a sample. For this analysis, samples are typically dissolved or digested into an acidic
aqueous matrix that is fed into the plasma torch through a nebulizer that sprays the matrix into
the torch as an aerosol. Results are generated by comparing the amount of light produced at
each of a number of wavelengths to those generated from a known amount of that same element
from a standard.
4.3.6 Fourier Transform Infrared Spectroscopy (FTIR) Analysis
In FTIR analysis, the absorbence of light in the IR region by the sample is measured. This type
of instrument uses a broadband infrared source coupled with wavelength deconvolution with a
Michelson interferometer to determine which molecular features are present from the sample.
In the fireworks, FTIR is principally used for identification of anions in powdered salts, like the
nitrate in potassium nitrate (NO3-). The output spectra often has units of % transmission vs
wavenumber. In this case, because of the sensitivity of the samples toward impact and friction,
they were presented to this instrument dissolved in water.
4.3.6 Differential Scanning Calorimetry (DSC) Analysis
Differential scanning calorimetry is a thermoanalytical technique in which the difference in the
amount of heat required to increase the temperature of a sample and reference is measured as a
function of temperature. Both the sample and reference are maintained at nearly the same
temperature throughout the experiment. Generally, the temperature program for a DSC analysis
is designed such that the sample holder temperature increases linearly as a function of time. The
basic principle underlying this technique is that when the sample undergoes a physical
transformation such as phase transitions, more or less heat will need to flow to it than the
reference to maintain both at the same temperature. Whether less or more heat must flow to the
sample depends on whether the process is exothermic or endothermic. Although the
endothermic events result in remarkable data in this work, chiefly we are interested in
exothermic behavior indicative of decomposition.
16
5.0 Data, Observations and Results
In this section, the results of the chemical composition testing will be presented sample by
sample, and then compared with each sample’s sensitivity to initiation by mechanical insult. A
small percentage of the data, mostly SEM images, are presented here to guide the reader.
The section is organized into two tables of overall results. Table 2 is organized by sample name.
Table 3 presents the same information broken down by sample type. Following the tables, each
individual material is addressed. The results section for each material is structured into a
description of the sample, both visual and SEM. The EDAX results are related to the SEM
image, and here the overall composition is given, rather than the composition of individual
particles, unless they are exceptional. Many other SEM-EDAX results are available on each
material in the Appendix. Because of the heterogeneity of the powders, the EDAX should be
considered a semi-quantitative measurement, a sort of overall average of the material seen in the
SEM image. As previously mentioned, although oxygen and carbon values are given in the
EDAX results, these numbers are probably not useful, because of the contribution of these
signals from the tape used to present the sample to the testing.
ICP data given in this section is largely a “presence or absence” measurement, a correlative study
looking for agreement with the EDAX work. The samples were not digested prior to the testing,
and therefore materials not soluble in water will appear only weakly, or not at all. However, in
every case, good agreement was established between the elemental composition data from the
EDAX and the ICP.
FTIR and chromatographic analysis used to determine anions were also a correlative pair. In this
case, the primary measurement was IC (for chlorate and nitrate) and LCMS (for perchlorate).
These should also be considered semi-quantitative results, because of the small amount of
material used to create the slurry for testing (FTIR) and the filtered solution used in the
chromatographic analyses. It is unknown if sample heterogeneity can be adequately represented
by samples as small as those we received
The chief result from thermal testing is the decomposition temperature of small quantities of
sample material. The testing takes the sample from room temperature to 500 °C at a rate of 20
°C per minute. Interesting data is also obtained from lower temperature endotherms where
chemical components of the sample undergo crystal rearrangement or melt. These exact
temperatures vary with sample particle size, and also the presence of the other components in the
sample matrix. DSC thermograms are shown on only a few of the individual sample
descriptions, in order to save space. All the others are available in the Appendix.
The mechanical insult testing yields a value for each type of possible initiation; impact, friction
and electrostatic discharge. These values are used to compare the behavior of the sample with
those of the standards, in order to classify the samples as more (or less) dangerous to handle than
military explosives that are often considered the least reactive primary explosives (PETN and
RDX). A non-detect (ND) is reported if the sample is not sensitive to that particular stimulus.
Results ordered by sample name are given in Table 2. Results that have been presented by type
of material are shown in Table 3.

17
Table 2. Compiled Results of Testing by Sample Name
Name of sample Physical Description
Impact (H50%)
Friction (F50%)
ESD (joules)
Major cations
Major anions
Sulfur %/wt
Thermal decomp onset
Units cm psi 0/20 at °C
O-Triple C #A fine gray sparkly powder 62 9 0.063 Mg, Al, K, Ti
ClO4- 2.5 >500
O-Triple C #B small black pebbles ND ND 0.25 K NO3- 5-32 365
O-Triple C #C "BB" size round silver/gray balls 12 13 0.063 Mg, Al, K, Ti
ClO4-,
NO3-
4-30 355
Sky Festival #A large gray pellets w/ black & brown crumbs
22 9 0.063 Mg, Al, K, Cu
ClO4- 14 361
Sky Festival #B large gray pellets w/ black & brown crumbs
14 15 0.025 Mg, Al, K, Sr, Ca
ClO4- 1.2 >500
Sky Festival #C fine gray sparkly powder ND 9 0.025 Mg, Al, K ClO4- ND >500
Sky Festival #D fine gray sparkly powder ND 9 0.025 Mg, Al, K, P Ca, Si, Fe
ClO4- ND >500
Sky Festival #E black particles, about 0 .5 mm across with copper colored dust
ND ND 0.63 K NO3- 14 Not tested
Sky Festival #F copper colored powder with black particles
Not tested
Not tested
Not tested
K, Si, Al and Fe
NO3- ND Not tested
Sky Festival #G grayish coarse powder 20 9 0.25 Al, Mg, Sr, K
ClO4- 1.7 Not tested
Halawa #A small black pebbles ND ND 0.063 K NO3- 8 363
Halawa #B fine gray powder, with larger chunks 50 9 0.013 Mg, Al, K, Ti, Si
ClO4- 2.4 >500

18
Name of sample Physical Description
Impact (H50%)
Friction (F50%)
ESD (joules)
Major cations
Major anions
Sulfur %/wt
Thermal decomp onset
Units cm psi 0/20 at °C
Halawa #C fine gray powder 72 9 0.063 Mg, Al, K, Ti
ClO4- 4-13
>500
Krazy Kids #A small black pebbles ND ND 0.25 K, Al NO3- 10 363
Krazy Kids #B 1 cm x 0.75 cm size silver/gray "pellets"
28 265 0.063 K, Al, Ba ClO4-,
NO3-
12 354
Krazy Kids #C 1 cm x 0.75 cm size silver/gray "pellets"
23 134 0.13 Mg, Al, K, Sr, Ca
ClO4-,
NO3-
7
353
KP/Al fine gray powder 60 77 0.013 Al, K ClO4- ND Not tested
KC/Al fine gray powder 71 71 0.013 Al, K ClO3- ND Not tested
KP/KC/Al fine gray powder 55 77 0.013 Al, K ClO4-,
ClO3-
ND >500
RDX fine white powder 19 11 0.063 Not tested Not tested
Not tested
Not tested
PETN fine white powder 12 13 0.063 Not tested Not tested
Not tested
Not tested
19
Table 3. Results segregated by sample type
Name of sample Physical Description
Impact (H50%)
Friction (F50%)
ESD (joules)
Major cations
Major anions
Sulfur Thermal decomp onset
Units cm psi 0/20 at °C
Flash powders without sulfur do not thermally decompose < 500 °C
O-Triple C #A fine gray sparkly powder 62 9 0.063 Mg, Al, K, Ti ClO4- 2.5 >500
Sky Festival #C fine gray sparkly powder ND 9 0.025 Mg, Al, K ClO4- ND >500
Sky Festival #D fine gray sparkly powder ND 9 0.025 Mg, Al, K, Ca, Si, Fe, P
ClO4- ND >500
Halawa #B fine gray powder, with larger chunks 50 9 0.013 Mg, Al, K, Ti, Si
ClO4- 2.4 >500
Halawa #C fine gray powder 72 9 0.063 Mg, Al, K, Ti ClO4- 4-13 >500
KP/Al fine gray powder, standard 60 77 0.013 Al, K ClO4- ND Not tested
KC/Al fine gray powder, standard 71 71 0.013 Al, K ClO3- ND Not tested
KP/KC/Al fine gray powder, standard 55 77 0.013 Al, K ClO4-,
ClO3-
ND >500
Lift charges (black powders) are not sensitive to impact or friction.
Halawa #A small black pebbles ND ND 0.063 K NO3- 8 363

20
Name of sample Physical Description
Impact (H50%)
Friction (F50%)
ESD (joules)
Major cations
Major anions
Sulfur Thermal decomp onset
Units cm psi 0/20 at °C
O-Triple C #B small black pebbles ND ND 0.25 K NO3- 5-32 365
Krazy Kids #A small black pebbles ND ND 0.25 K, Al NO3- 10 363
Sky Festival #E black particles, about 0 .5 mm across with copper colored dust
ND ND 0.63 K NO3- 14 Not tested
“Stars” and “comets” - sulfur usually sensitizes flash powder to both mechanical insult and thermal decomposition.
O-Triple C #C "BB" size round silver/gray balls 12 13 0.063 Mg, Al, K, Ti ClO4-,
NO3-
4-30 355
Sky Festival #A large gray pellets w/ black & brown crumbs
22 9 0.063 Mg, Al, K, Cu ClO4- 14 361
Sky Festival #B large gray pellets w/ black & brown crumbs
14 15 0.025 Mg, Al, K, Sr, Ca
ClO4- 1.2 >500
Sky Festival #G grayish coarse powder 20 9 0.25 Al, Mg, K, Sr ClO4- 1.7 Not tested
Krazy Kids #B 1 cm x 0.75 cm size silver/gray "pellets"
28 265 0.063 K, Al, Ba ClO4-,
NO3-
12 354
Krazy Kids #C 1 cm x 0.75 cm size silver/gray "pellets"
23 134 0.13 Mg, Al, K, Sr, Ca
ClO4-,
NO3-
7 353
The following sample appears to be pyrotechnic clay, used to separate sections and guide gas emission.
Sky Festival #F copper colored powder with black particles
Not tested
Not tested
Not tested
K, Si, Al and Fe
NO3- ND Not tested

21
Name of sample Physical Description
Impact (H50%)
Friction (F50%)
ESD (joules)
Major cations
Major anions
Sulfur Thermal decomp onset
Units cm psi 0/20 at °C
These samples are calibration samples for the mechanical insult testing machines.
RDX fine white powder 19 11 0.063 Not tested Not tested
Not tested
Not tested
PETN fine white powder 12 13 0.063 Not tested Not tested
Not tested
Not tested
22
5.1 O-Triple-C Results
5.1.1 Sample O-Triple-C, Sub-sample A
This sample is a silvery gray powder that contains white flakes (0.2 - 0.5 mm in length). 5.157 g
of this material was delivered. These white flakes are easily seen in an enlarged version of the
optical photograph, Figure 10, and even more so in the 40x magnified SEM image (Figure 11).
These white flakes are present in a matrix of darker pellets. The appearance is similar to that of
the flash powder standards.
Figure 10. Enlarged photograph of O-Triple-C, A.
Figure 11. 40x SEM image of O-Triple-C, A.
The SEM-EDAX analysis of O-Triple-C A is shown below ( Figure 12).
The top composition analysis was performed on the wide particle that takes up most of the
micrograph. This particle is composed of titanium, with hints of other metal particles. Titanium
is used in fireworks to make bright whitish sparks, and magnesium and aluminum are also
common components of flash powders. The smaller particles that appear darker in the
micrograph are heavily laden with chlorine, making up the other chief component of common
flash powders, the oxidizer component.
The chlorine in the sample was found as perchlorate, observed in both FTIR and LC/MS data.
No chlorate or nitrate anions were observed. The ICP data confirms the presence of K (likely the
cation associated with the perchlorate), Mg and Al, but does not find Ti. This is due to the
insolubility of the metal particles in the light acid treatment used to dissolve the sample in water
for introduction to the ICP. Chemical composition shows this sample appears to be a flash

23
powder, with some additional metal dust that may serve to make streamers in the final
pyrotechnic product. This sample is quite sensitive to various forms of mechanical insult, as is
discussed in the section on mechanical insult below, but does not decompose when heated, as
shown by DSC results.
Figure 12 . SEM image and two EDAX spectra of O-Triple-C, A. The arrows point to the source of the EDAX signals. Figure 12. SEM and EDAX data of O-Triple-C, A.
24
Figure 13. DSC results for O-Triple-C, A, showing no thermal decomposition below 500 degrees C.
Data Summary of O-Triple-C A:
Mechanical Insult Data
Impact (H50%) – 62 cm
Friction (F50%) – 9 psi
ESD (Joules) – 0.063 J
Primary Chemical Results
Predominant metals (EDAX) – Mg, Al, K and flakes of Ti
Predominant metals (ICP-AES) – Mg, Al, K
Anion(s) – perchlorate
Other species – S (2.5%/wt)
Thermal Sensitivity Data
DSC exotherm – NA
Other DSC features – endotherms at 112 and 305 °C indicate sulfur melting point
or loss of water and KClO4 crystal phase transition, respectively. The endotherm
at 455 °C may be related to sulfur volatilization (reported to boil at 444.6 °C)
This material is a flash powder, having a normal composition compared to recipes on amateur
fireworks websites given the data obtained during the testing. As such, it is very sensitive to
initiation by ESD and frictional forces.

25
5.1.2 Sample O-Triple-C, Sub-sample B
This sample is composed of black pebbled material, as shown in an enlarged photograph in
Figure 14. 8.294 g of this material was delivered. It has the overall appearance of black powder
and there were pieces of fuse material delivered with the sample. The fuse material was not
analyzed.
Figure 14. Enlarged photo of O-Triple-C, B.
SEM shows it to be composed of large particles, and EDAX (Figure 15) taken across the entire
field of view demonstrates that it is free of any chlorine compound, a result that is mirrored in
both the FTIR and the anion (IC) analytical data. Instead, this sample contains nitrate, which is
most likely the counter-ion to the potassium, and sulfur. Black powder has the general recipe of
potassium nitrate (KNO3), sulfur and charcoal, which mirrors the composition found in this
sample. ICP analysis verifies the presence of the potassium and the absence of any meaningful
amount of any other metals.
Figure 15. SEM and EDAX data, O-Triple-C B.
EDAX results collected from white regions in the SEM image result in a heavier potassium
signal but not chlorine, which likely indicates that the white regions in the image are KNO3
crystals. Additionally, EDAX results from the grayish portions of the SEM image (as distinct
from the smaller black particles) are even heavier on the potassium signal. The sulfur peak is
smaller, perhaps indicating a lack of sulfur in the light smoother grayish places on the image.
26
This sample is quite heterogeneous, which is related to the wide range of sulfur measurements
received in EDAX results. There was no “large area” EDAX taken for this particular sample,
and therefore the range of the sulfur results is reported, rather than one that is representative of
the sample as a whole.
DSC results indicate that this sample begins to decompose when heated past 365 °C.
Figure 16. DSC data from O-Triple-C, B. Sample decomposition onset at 365 degrees C.
Data Summary of O-Triple-C B:
Mechanical Insult Data
Impact (H50%) – No initiation observed
Friction (F50%) – No initiation observed
ESD (Joules) – 0.25 J
Primary Chemical Results
Predominant metals (EDAX) – K
Predominant metals (ICP-AES) – K
Anion(s) – nitrate
Other species – sulfur (5-32%/wt)
Thermal Sensitivity Data
DSC exotherm with onset at 365 and peaking at 437 °C is indicative of
decomposition
Other DSC features – endotherm at 132 °C is likely a KNO3 (α to β) crystalline
phase change. The endotherm at 330 °C is KNO3 melting.
This sample appears from the presented data to be a lift charge; a variety of black powder. As
such, it is less sensitive to initiation by mechanical forces than the flash powder samples that
were analyzed.

27
5.1.3 O-Triple-C, Sub-sample C
This sample is composed of grayish powder and larger gray chunks. 10.241 g of this material
was delivered. This sample is composed of a silvery gray powder and round gray balls a few
mm in diameter. Figure 17 is an enlarged photograph of the sample material in a Velostat
container. The larger particles were processed into powder with a razor blade at the time of the
mechanical insult testing, and this prepared sample was also used to acquire SEM and EDAX
data (Figure 18).
Figure 17. Enlarged photo of O-Triple-C, C.
Figure 18. SEM and EDAX data for O-Triple-C, C.
EDAX on the entire region of the SEM image is dominated by metal powders (Al and Mg) and
sulfur. Potassium is also present. The composition of metals is confirmed in the ICP data.
Chlorine is also extant, as perchlorate, indicated in the anion analysis (LC/MS) and FTIR
spectrum. Nitrate is present in a smaller quantity (seen in LC/MS data). EDAX analysis of the
large white spade-shaped particle in the Figure 18 image yields a very high concentration of
titanium.
This sample is quite heterogeneous, which is related to the wide range of sulfur measurements
received in EDAX results. There was no “large area” EDAX taken for this particular sample,
C
28
and therefore the range of the sulfur results is reported, rather than one that is representative of
the sample as a whole.
DSC results indicate that this sample begins to decompose when heated past 355 °C.
Data Summary of O-Triple-C C:
Mechanical Insult Data
Impact (H50%) – 12 cm
Friction (F50%) – 13 psi
ESD (Joules) – 0.063 J
Primary Chemical Results
Predominant metals (EDAX) – Mg, Al, K and flakes of Ti
Predominant metals (ICP-AES) – Mg, Al, K
Anion(s) – perchlorate, smaller quantity of nitrate
Other species – sulfur (4-30%/wt)
Thermal Sensitivity Data
DSC exotherm with onset at 355 °C and peaking 403 °C is indicative of
decomposition
Other DSC features – endotherm at 305 °C indicates a KClO4 crystal phase
transition.
This material appears to be pyrotechnic “star” or “comet” material, which is flash powder mixed
with sulfur and various materials to cause the chunks to adhere together. Sulfur is a known
sensitizer of flash powder, causing even higher degrees of sensitivity to initiation by mechanical
insult, as well as to thermal decomposition. This sensitization is clearly observable in the data
from this material. Even so, sulfur is a common component of pyrotechnic material and its
presence is no way indicative of special compounding.
5.2 Sky Festival Samples
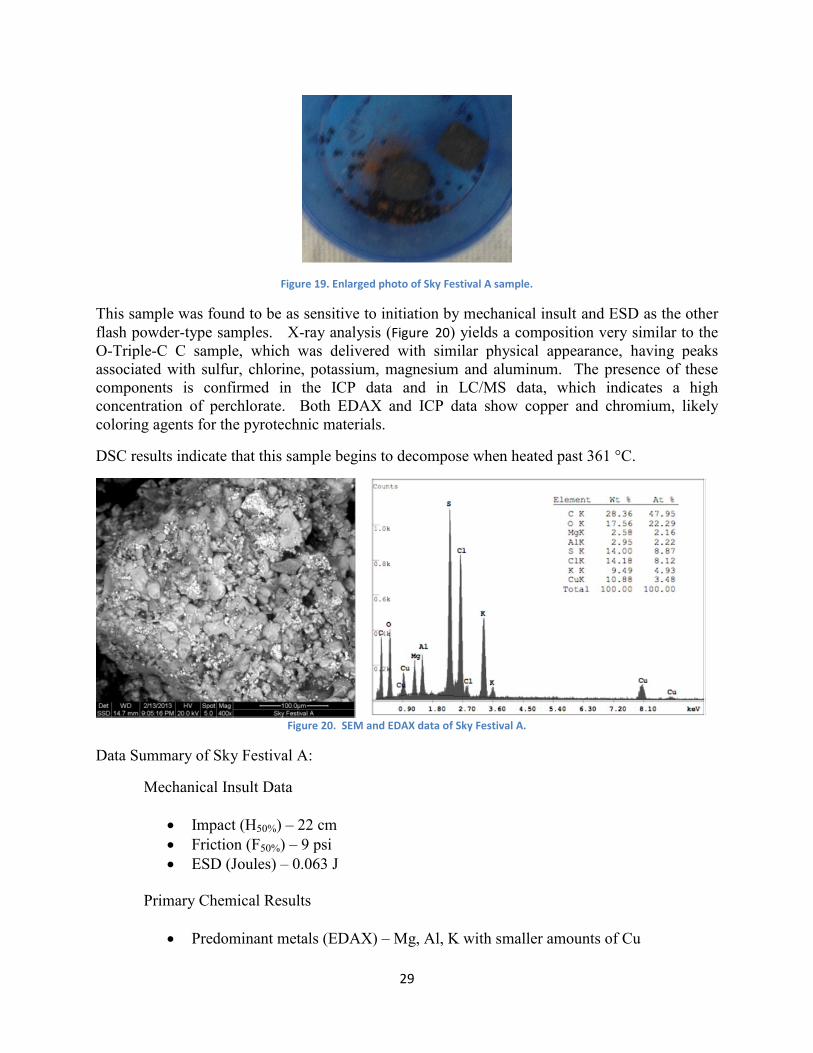
5.2.1. Sky Festival Sub-sample A
2.473 g of this material was delivered. It is composed of large gray pellets intermixed with
smaller black and brown particulate. This material was processed into smaller particles for
testing. These larger chunks are probably “stars” or “comets.” An enlarged photo of this
material is shown in Figure 19.
29
Figure 19. Enlarged photo of Sky Festival A sample.
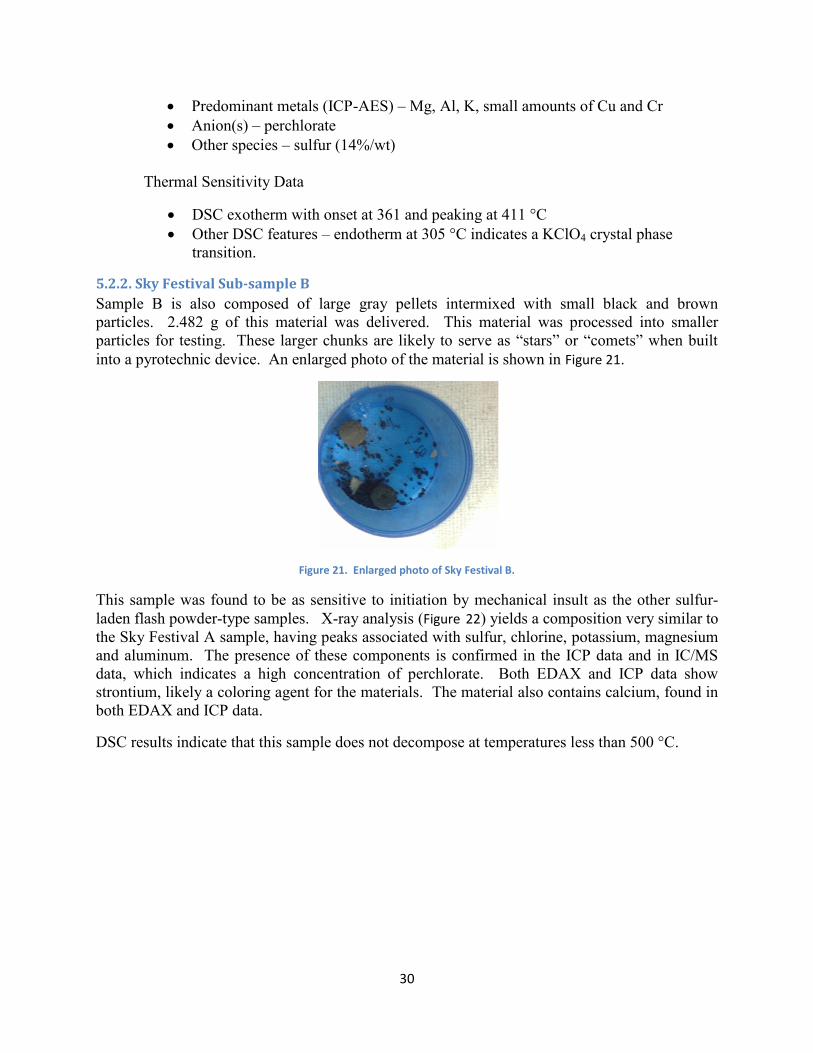
This sample was found to be as sensitive to initiation by mechanical insult and ESD as the other
flash powder-type samples. X-ray analysis (Figure 20) yields a composition very similar to the
O-Triple-C C sample, which was delivered with similar physical appearance, having peaks
associated with sulfur, chlorine, potassium, magnesium and aluminum. The presence of these
components is confirmed in the ICP data and in LC/MS data, which indicates a high
concentration of perchlorate. Both EDAX and ICP data show copper and chromium, likely
coloring agents for the pyrotechnic materials.
DSC results indicate that this sample begins to decompose when heated past 361 °C.
Figure 20. SEM and EDAX data of Sky Festival A.
Data Summary of Sky Festival A:
Mechanical Insult Data
Impact (H50%) – 22 cm
Friction (F50%) – 9 psi
ESD (Joules) – 0.063 J
Primary Chemical Results
Predominant metals (EDAX) – Mg, Al, K with smaller amounts of Cu
A
30
Predominant metals (ICP-AES) – Mg, Al, K, small amounts of Cu and Cr
Anion(s) – perchlorate
Other species – sulfur (14%/wt)
Thermal Sensitivity Data
DSC exotherm with onset at 361 and peaking at 411 °C
Other DSC features – endotherm at 305 °C indicates a KClO4 crystal phase
transition.
5.2.2. Sky Festival Sub-sample B
Sample B is also composed of large gray pellets intermixed with small black and brown
particles. 2.482 g of this material was delivered. This material was processed into smaller
particles for testing. These larger chunks are likely to serve as “stars” or “comets” when built
into a pyrotechnic device. An enlarged photo of the material is shown in Figure 21.
Figure 21. Enlarged photo of Sky Festival B.
This sample was found to be as sensitive to initiation by mechanical insult as the other sulfur-
laden flash powder-type samples. X-ray analysis (Figure 22) yields a composition very similar to
the Sky Festival A sample, having peaks associated with sulfur, chlorine, potassium, magnesium
and aluminum. The presence of these components is confirmed in the ICP data and in IC/MS
data, which indicates a high concentration of perchlorate. Both EDAX and ICP data show
strontium, likely a coloring agent for the materials. The material also contains calcium, found in
both EDAX and ICP data.
DSC results indicate that this sample does not decompose at temperatures less than 500 °C.
B

31
Figure 22. SEM and EDAX data for Sky Festival B sample.
Data Summary of Sky Festival B:
Mechanical Insult Data
Impact (H50%) – 14 cm
Friction (F50%) – 15 psi
ESD (Joules) – 0.025 J
Primary Chemical Results
Predominant metals (EDAX) – Mg, Al, K, Sr and Ca
Predominant metals (ICP-AES) – Mg, Al, K, Sr and Ca
Anion(s) – perchlorate
Other species – sulfur (1.2%/wt)
Thermal Sensitivity Data
DSC exotherm – NA
Other DSC features – endotherm and subsequent perturbation at and above 305 °C
probably indicates a KClO4 crystal phase transition.
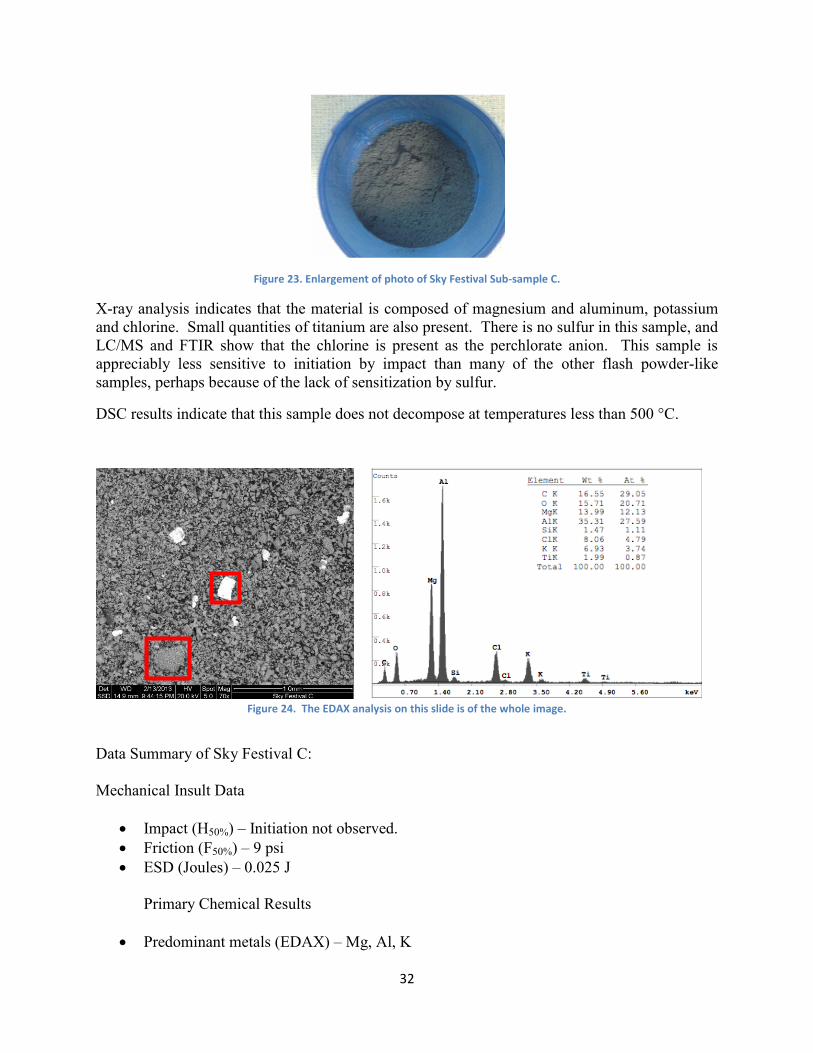
5.2.3. Sky Festival Sub-sample C
4.679 g of this material was delivered. This sample is a fine silvery powder, as shown in Figure
23. SEM and EDAX data are shown in Figure 24. The X-ray data shown represents the entire
SEM image. The white particle in the box is nearly pure titanium, and the grayish particle is
nearly completely aluminum.
32
Figure 23. Enlargement of photo of Sky Festival Sub-sample C.
X-ray analysis indicates that the material is composed of magnesium and aluminum, potassium
and chlorine. Small quantities of titanium are also present. There is no sulfur in this sample, and
LC/MS and FTIR show that the chlorine is present as the perchlorate anion. This sample is
appreciably less sensitive to initiation by impact than many of the other flash powder-like
samples, perhaps because of the lack of sensitization by sulfur.
DSC results indicate that this sample does not decompose at temperatures less than 500 °C.
Figure 24. The EDAX analysis on this slide is of the whole image.
Data Summary of Sky Festival C:
Mechanical Insult Data
Impact (H50%) – Initiation not observed.
Friction (F50%) – 9 psi
ESD (Joules) – 0.025 J
Primary Chemical Results
Predominant metals (EDAX) – Mg, Al, K
C

33
Predominant metals (ICP-AES) – Mg, Al, K
Anion(s) – perchlorate
Other species – NA
Thermal Sensitivity Data
DSC exotherm – NA
Other DSC features – endotherm at 305 °C indicates a KClO4 crystal phase transition.
5.2.4. Sky Festival Sub-sample D
This sample is another fine grayish powder, as shown in Figure 25. 5.063 g of this material was
delivered. The SEM-EDAX data (Figure 26) of this sample shows a similar composition to Sky
Festival C, except that one of the larger particles interrogated by the x-rays contains a large
concentration of phosphorus. This signal is quite localized, not being visible in the x-ray
signatures of the sample as a whole, and entirely missing from the ICP data. Potassium,
aluminum and magnesium are present in large concentrations. This sample has a wide array of
cations present in minor quantities, including calcium, silicon and iron. The only anion present
in appreciable quantities is perchlorate, as reported by both FTIR and IC/MS.
DSC results indicate that this sample does not decompose at temperatures less than 500 °C.
Figure 25. Enlarged photo of Sky Festival sample D.
D

34
Figure 26. SEM and EDAX data on Sky Festival D, note the predominance of the P peak.
Figure 27. SEM and EDAX data on Sky Festival D.
Data Summary of Sky Festival D:
Mechanical Insult Data
Impact (H50%) – Initiation not observed.
Friction (F50%) – 9 psi
ESD (Joules) – 0.025 J
Primary Chemical Results
Predominant metals (EDAX) – Mg, Al, K, Ca, Si, Fe
Predominant metals (ICP-AES) – Mg, Al, K, Ca, Si, Fe
Anion(s) – perchlorate
Other species – P
35
Thermal Sensitivity Data
DSC exotherm – NA
Other DSC features – endotherm at 305 °C indicates a KClO4 crystal phase transition.
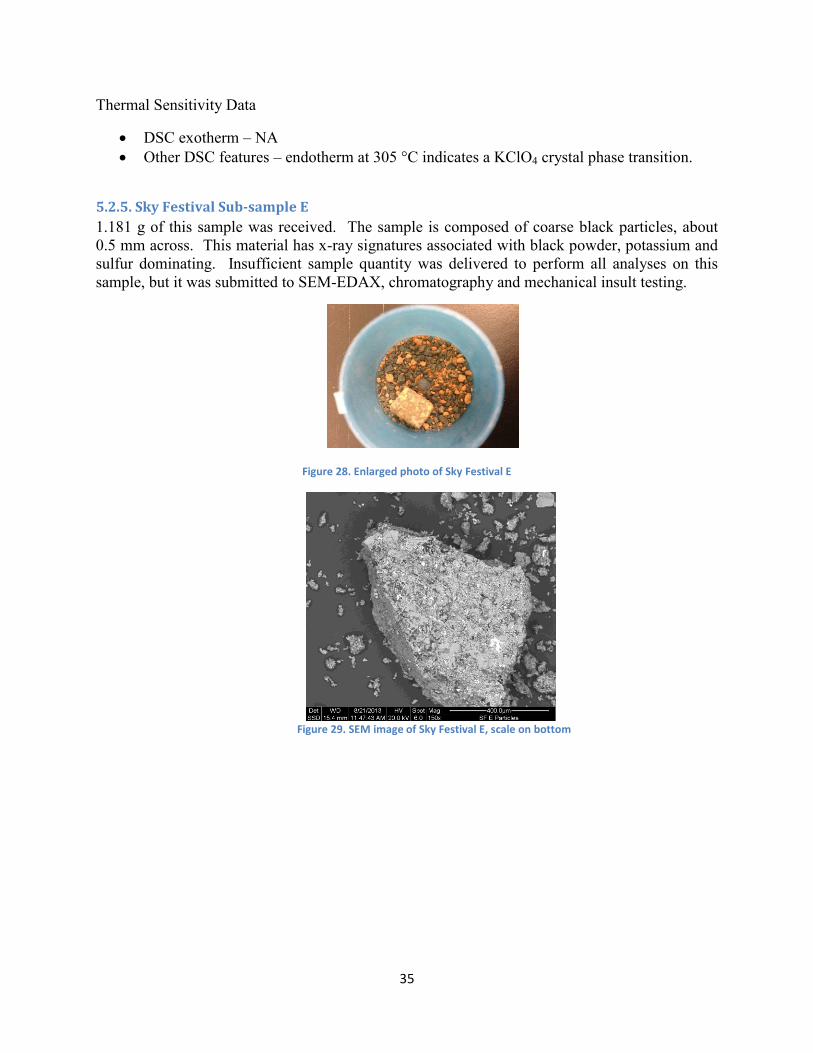
5.2.5. Sky Festival Sub-sample E
1.181 g of this sample was received. The sample is composed of coarse black particles, about
0.5 mm across. This material has x-ray signatures associated with black powder, potassium and
sulfur dominating. Insufficient sample quantity was delivered to perform all analyses on this
sample, but it was submitted to SEM-EDAX, chromatography and mechanical insult testing.
Figure 28. Enlarged photo of Sky Festival E
Figure 29. SEM image of Sky Festival E, scale on bottom
36
Data Summary of Sky Festival E:
Mechanical Insult Data
Impact (H50%) – Initiation not observed.
Friction (F50%) – Initiation not observed.
ESD (Joules) – 0.63 J
Primary Chemical Results
Predominant metals (EDAX) – K and small amounts of other materials
Predominant metals (ICP-AES) – Not performed
Anion(s) – nitrate only
Other species – S (14%/wt)
Thermal Sensitivity Data
DSC exotherm – not performed
Other DSC features – not performed
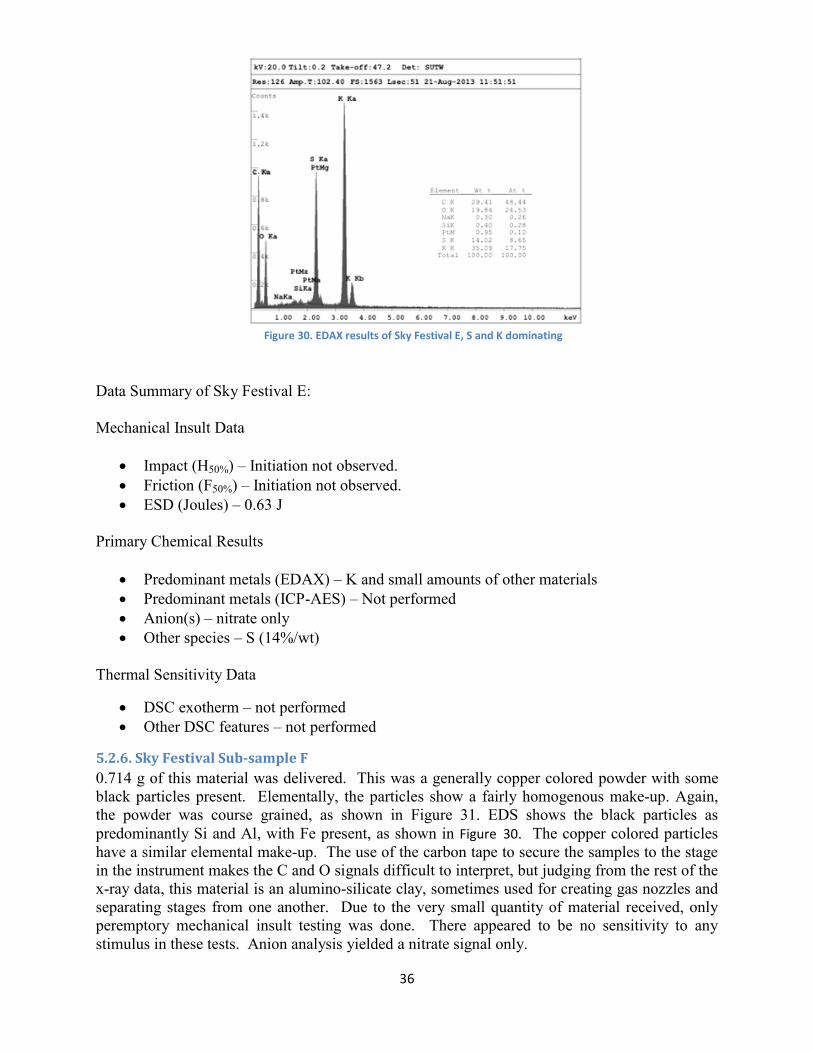
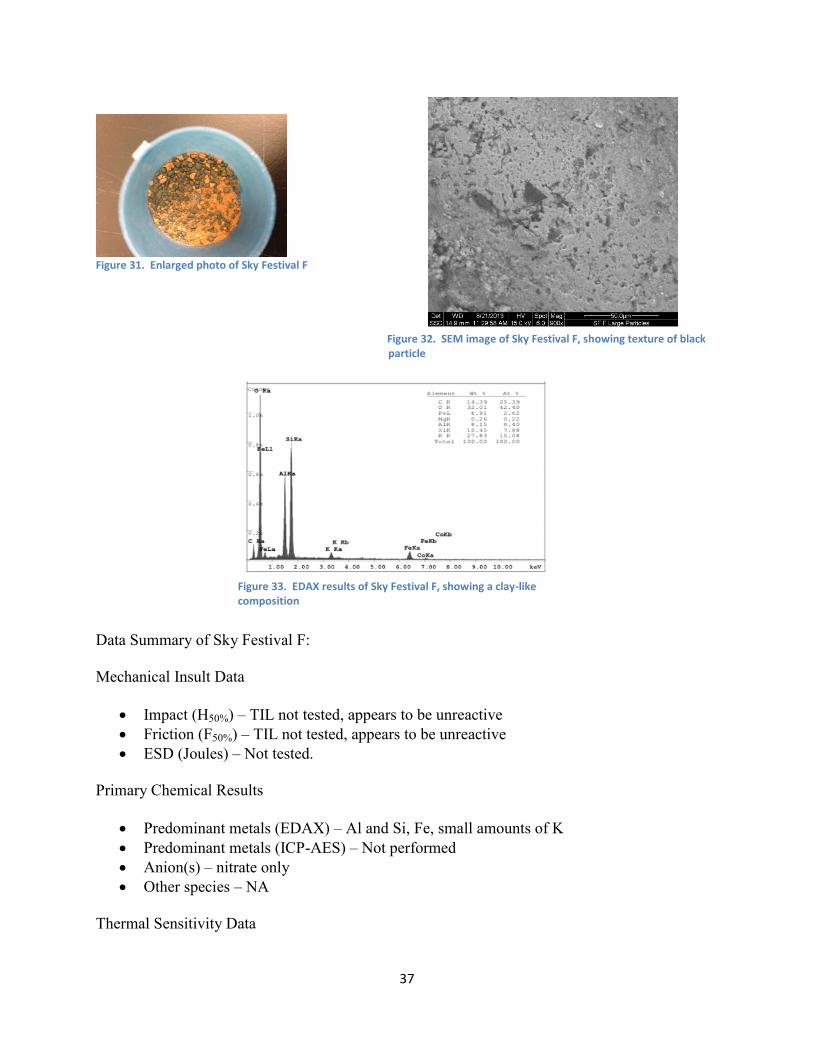
5.2.6. Sky Festival Sub-sample F
0.714 g of this material was delivered. This was a generally copper colored powder with some
black particles present. Elementally, the particles show a fairly homogenous make-up. Again,
the powder was course grained, as shown in Figure 31. EDS shows the black particles as
predominantly Si and Al, with Fe present, as shown in Figure 30. The copper colored particles
have a similar elemental make-up. The use of the carbon tape to secure the samples to the stage
in the instrument makes the C and O signals difficult to interpret, but judging from the rest of the
x-ray data, this material is an alumino-silicate clay, sometimes used for creating gas nozzles and
separating stages from one another. Due to the very small quantity of material received, only
peremptory mechanical insult testing was done. There appeared to be no sensitivity to any
stimulus in these tests. Anion analysis yielded a nitrate signal only.
Figure 30. EDAX results of Sky Festival E, S and K dominating
37
Figure 31. Enlarged photo of Sky Festival F
Figure 32. SEM image of Sky Festival F, showing texture of black particle
Data Summary of Sky Festival F:
Mechanical Insult Data
Impact (H50%) – TIL not tested, appears to be unreactive
Friction (F50%) – TIL not tested, appears to be unreactive
ESD (Joules) – Not tested.
Primary Chemical Results
Predominant metals (EDAX) – Al and Si, Fe, small amounts of K
Predominant metals (ICP-AES) – Not performed
Anion(s) – nitrate only
Other species – NA
Thermal Sensitivity Data
Figure 33. EDAX results of Sky Festival F, showing a clay-like composition

38
DSC exotherm – not performed
Other DSC features – not performed
5.2.7. Sky Festival Sub-sample G
This was a grayish, course grained powder (Figure 34 and Figure 35). EDAX composition shows
the presence of S, Al, Mg and Sr, as shown in x-ray spectra presented in Figure 36. 1.858 g of
this material was received. “Small ‘Comet’ Tube Lift Charge Sample” was written on the
sample bag. The material as delivered had two pieces of fusing in it. This material was received
also in very small quantity, so SEM-EDAX, chromatography and mechanical insult were the
only tests performed on this material.
Figure 35. SEM image of Sky Festival G sample
Figure 36. EDAX results of Sky Festival G sample
Figure 34. Photo of Sky Festival G sample

39
Data Summary of Sky Festival G:
Mechanical Insult Data
Impact (H50%) – 20 cm
Friction (F50%) – 9 psi
ESD (Joules) – 0.25 J
Primary Chemical Results
Predominant metals (EDAX) – Mg, Al, K, and Sr
Predominant metals (ICP-AES) – not performed
Anion(s) – perchlorate
Other species – sulfur (1.7%/wt)
Thermal Sensitivity Data
DSC – not performed
5.3 Halawa Samples
5.3.1. Halawa Sample A
This sample is composed of black pebbles, with brown granules. 6.680 g of this material was
received, “Lift charge” was written on the sample bag. It is similar in appearance to the O Triple
C B sample, save that it contains no fuse-type material. Figure 37 contains an enlarged photo of
the sample in a Velostat container.
Figure 37. Enlarged photo of Halawa sample A.
SEM and EDAX data for this sample is shown in Figure 38 which is dominated by potassium and
sulfur signals. Chlorine is completely absent from the X-ray data. ICP analysis verifies the
dominance of K and S, and also the lack of aluminum and magnesium. The sole anion identified
by both FTIR and IC/MS is nitrate.
DSC results indicate that this sample begins to decompose when heated past 363 °C
A

40
Data Summary of Halawa A:
Mechanical Insult Data
Impact (H50%) – Initiation not observed
Friction (F50%) – Initiation not observed
ESD (Joules) – 0.063 J
Primary Chemical Results
Predominant metals (EDAX) – K
Predominant metals (ICP-AES) – K
Anion(s) – nitrate
Other species – S (8%/wt)
Thermal Sensitivity Data
DSC exotherm with onset at 363 and peaking at 433 °C is indicative of decomposition
Other DSC features – endotherm at 134 °C is likely the KNO3 (α to β) crystalline phase
change. The endotherm at 332 °C is KNO3 melting.
5.3.2. Halawa Sample B
This sample is a fine gray powder containing larger gray chunks. 5.656 g of this material was
received. An enlarged photograph of the sample in a Velostat container is shown in Figure 39.
The chunks in this material are not as regular as in other similar samples. The SEM and EDAX
data for this material is shown in Figure 40, which has an x-ray spectrum similar to that of the
other flash powder samples, consisting of powdered aluminum and magnesium, chlorine and
potassium and titanium. There is also a smaller concentration of silicon. These materials are
Figure 38. SEM and EDAX data for Halawa sample A.
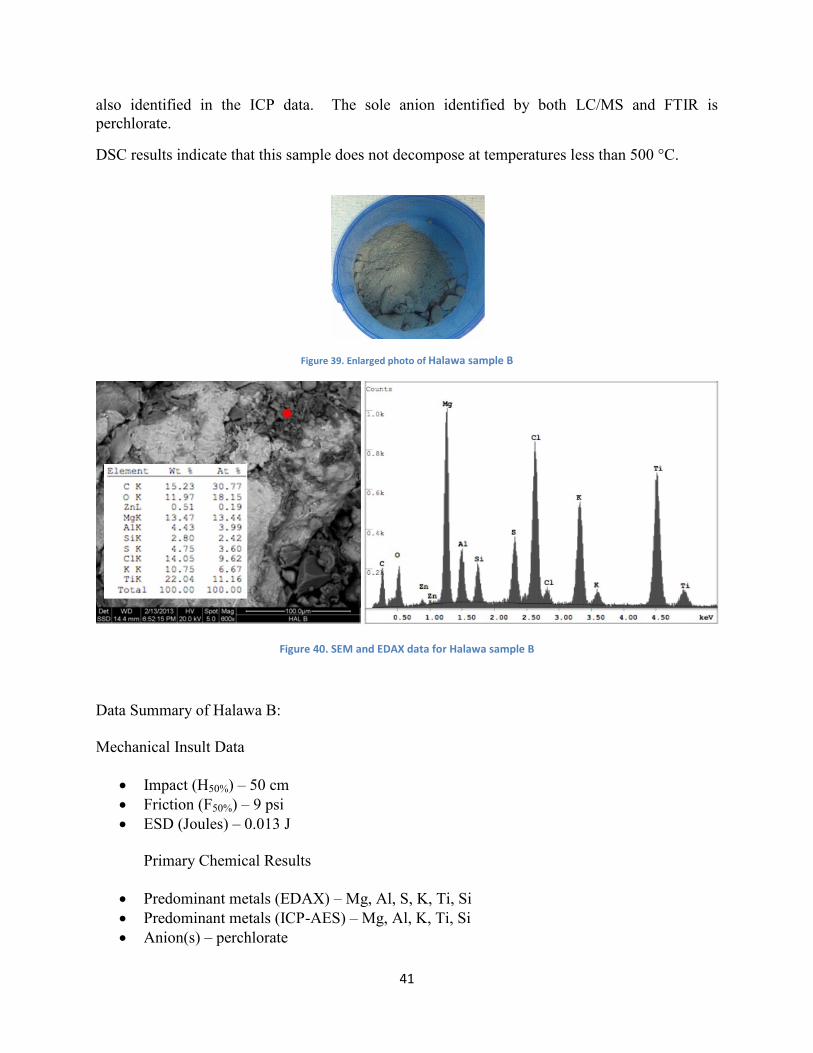
41
also identified in the ICP data. The sole anion identified by both LC/MS and FTIR is
perchlorate.
DSC results indicate that this sample does not decompose at temperatures less than 500 °C.
Figure 39. Enlarged photo of Halawa sample B
Figure 40. SEM and EDAX data for Halawa sample B
Data Summary of Halawa B:
Mechanical Insult Data
Impact (H50%) – 50 cm
Friction (F50%) – 9 psi
ESD (Joules) – 0.013 J
Primary Chemical Results
Predominant metals (EDAX) – Mg, Al, S, K, Ti, Si
Predominant metals (ICP-AES) – Mg, Al, K, Ti, Si
Anion(s) – perchlorate
B

42
Other species – S (2.4%/wt)
Thermal Sensitivity Data
DSC exotherm – NA
Other DSC features – endotherm at 113 °C is likely loss of moisture, at 305 °C, the
endotherm is likely KClO4 phase transition.
5.3.3. Halawa Sample C
This sample is another finely divided gray powder. 5.706 g of this material was received. A
photo is provided in Figure 41. SEM and EDAX data is presented in Figure 42. The x-ray
spectrum is very similar to the preceding sample, showing high concentrations of magnesium
and aluminum, sulfur and chlorine. There are smaller amounts of potassium and titanium. These
results are corroborated by the ICP analysis except that the sulfur is not seen in those data (the
detection limits for S in ICP are quite high, so this is not a concern). The only anion observed in
the data in any abundance is perchlorate.
This sample is quite heterogeneous, which is related to the wide range of sulfur measurements
received in EDAX results. There was no “large area” EDAX taken for this particular sample,
and therefore the range of the sulfur results is reported, rather than one that is representative of
the sample as a whole.
DSC results indicate that this sample does not decompose at temperatures less than 500 °C.
Figure 41. Enlarged photo of Halawa C sample.
C
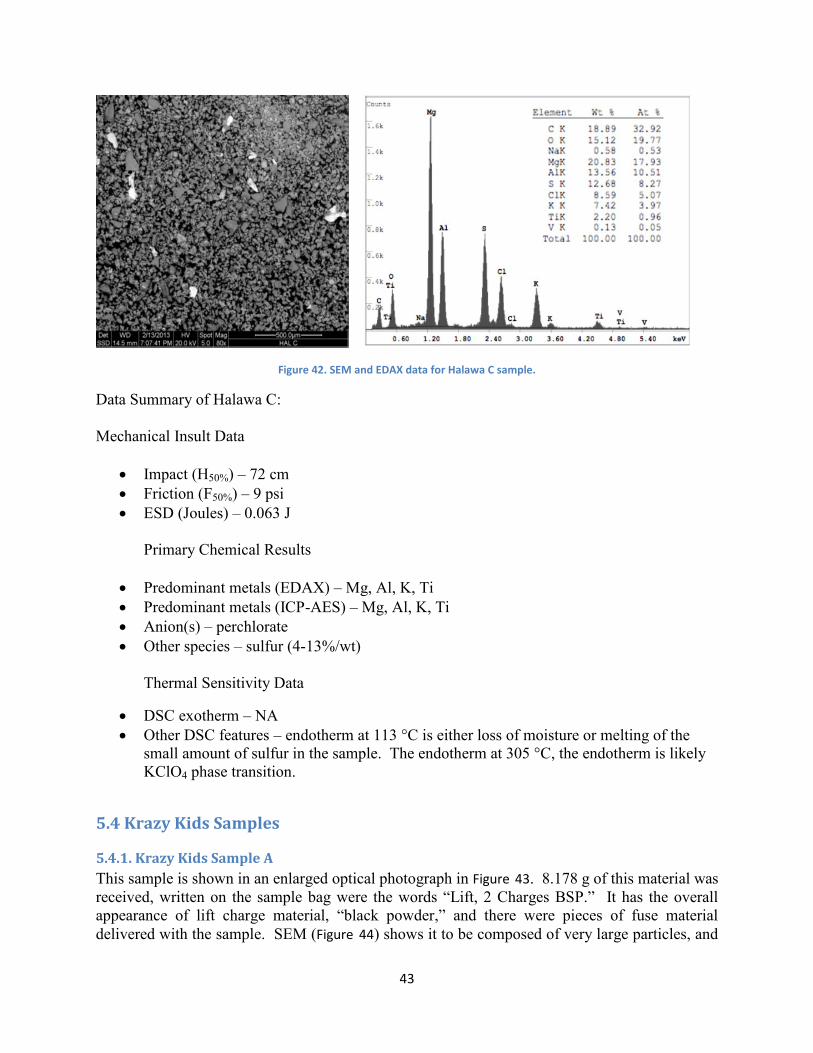
43
Figure 42. SEM and EDAX data for Halawa C sample.
Data Summary of Halawa C:
Mechanical Insult Data
Impact (H50%) – 72 cm
Friction (F50%) – 9 psi
ESD (Joules) – 0.063 J
Primary Chemical Results
Predominant metals (EDAX) – Mg, Al, K, Ti
Predominant metals (ICP-AES) – Mg, Al, K, Ti
Anion(s) – perchlorate
Other species – sulfur (4-13%/wt)
Thermal Sensitivity Data
DSC exotherm – NA
Other DSC features – endotherm at 113 °C is either loss of moisture or melting of the
small amount of sulfur in the sample. The endotherm at 305 °C, the endotherm is likely
KClO4 phase transition.
5.4 Krazy Kids Samples
5.4.1. Krazy Kids Sample A
This sample is shown in an enlarged optical photograph in Figure 43. 8.178 g of this material was
received, written on the sample bag were the words “Lift, 2 Charges BSP.” It has the overall
appearance of lift charge material, “black powder,” and there were pieces of fuse material
delivered with the sample. SEM (Figure 44) shows it to be composed of very large particles, and

44
EDAX taken across the entire field of view demonstrates that it is free of any chlorine
compound, a result that is mirrored in both the FTIR and the anion (IC) analytical data. Instead,
this sample contains nitrate, which is most likely the counter-ion to the potassium, and sulfur.
ICP analysis verifies the presence of the potassium and the absence of any meaningful amount of
any other metals. X-ray data indicates a small quantity of aluminum, possibly a local
contaminant, since the ICP-OES analysis does not contain Al signals.
DSC results indicate that this sample decomposes when heated above 363 °C.
Figure 43. Enlarged photo of Krazy Kids sample A.
Figure 44. SEM and EDAX data of Krazy Kids sample A.
Data Summary of Krazy Kids A:
Mechanical Insult Data
Impact (H50%) – Initiation not observed
Friction (F50%) – Initiation not observed
ESD (Joules) – 0.25 J
A
45
Primary Chemical Results
Predominant metals (EDAX) – K, small peak associated with Al
Predominant metals (ICP-AES) – K
Anion(s) – nitrate
Other species – sulfur (10%/wt)
Thermal Sensitivity Data
DSC exotherm with onset at 363 and peaking at 429 °C is indicative of decomposition;
the appearance of an exotherm at 321 °C in one test has not been identified.
Other DSC features – endotherm at 134 °C is likely the KNO3 (α to β) crystalline phase
change. The endotherm at 332 °C is KNO3 melting.
5.4.2. Krazy Kids Sample B
11.248 g of this sample was received. This sample is composed of a silvery gray powder and
cylindrical gray pellets about 1 cm tall x 0.75 cm wide. Figure 45 is an enlarged optical
photograph of the sample material in a Velostat container. The larger roundish particles were cut
into powder with a razor blade at the time of the mechanical insult testing, and this prepared
sampled was used to acquire SEM and EDAX data (Figure 46).
Figure 45. Enlarged photo of Krazy Kids sample B.
The SEM and EDAX data show small peaks associated with aluminum and magnesium, larger
ones that are characteristic of potassium and sulfur, and several features related to barium, an
element usually used to create color in pyrotechnics. The barium signals are related to the white
speckles in the SEM image, the darker material is devoid of this element, and the sulfur and
potassium features dominate. This sample is unique in the test set in that there are two anionic
species associated with it, nitrate and perchlorate. This is less obvious in the FTIR data than the
aqueous laboratory work-up.
DSC results indicate that this sample decomposes when heated above 354 °C.
B
46
Figure 46. SEM and EDAX data of white regions of Krazy Kids sample B, Ba peaks dominating.
As we discussed in the initial description of samples, many star and comet recipes available on
the internet have both nitrate and perchlorate in them.
Data Summary of Krazy Kids B:
Mechanical Insult Data
Impact (H50%) – 28 cm
Friction (F50%) – 265 psi
ESD (Joules) – 0.063 J
Primary Chemical Results
Predominant metals (EDAX) – K, small peak associated with Al, lots of Ba
Predominant metals (ICP-AES) – K, Al (looks higher in the ICP than the EDAX), lots of
Ba
Anion(s) – nitrate and perchlorate
Other species – S (12%/wt)
Thermal Sensitivity Data
DSC exotherm with onset at 354 and peaking at 439 °C is indicative of decomposition.
Other DSC features – endotherm at 113 °C is either loss of moisture or melting of the
small amount of sulfur in the sample. The endotherm at 320 °C is likely KClO4 phase
transition.

47
5.4.3. Krazy Kids Sample C
11.293 g of this sample was received. This sample is composed
of grayish powder and larger gray chunks. This sample is
composed of a silvery gray powder and cylindrical gray pellets
about the twice the size of BBs (dimensions approximately 1
cm tall x 0.75 cm wide). Figure 47 is an enlarged optical
photograph of the sample material in a Velostat container. The
larger cylindrical-shaped particles were cut into powder with a
razor blade at the time of the mechanical insult testing, and this
prepared sampled was used to acquire SEM and EDAX data
(Figure 48).
Figure 47. Enlarged photo of Krazy Kids sample C.
Figure 48. SEM and EDAX data of Krazy Kids sample C.
X-ray data from this sample indicates classic flash powder components with strontium used as a
colorant. ICP-AES corroborates the presence of aluminum, calcium, potassium, magnesium,
sulfur and strontium. FTIR shows both nitrate and perchlorate, in agreement with LC/MS.
DSC results indicate that this sample decomposes when heated above 353 °C.
Data Summary of Krazy Kids C:
Mechanical Insult Data
Impact (H50%) – 23 cm
Friction (F50%) – 134 psi
ESD (Joules) – 0.13 J
Primary Chemical Results
Predominant metals (EDAX) – Mg, Al, K, Sr
C
48
Predominant metals (ICP-AES) – Mg, Al, K, Sr, Ca
Anion(s) – nitrate and perchlorate
Other species – sulfur (7%/wt)
Thermal Sensitivity Data
DSC exotherm with onset at 353 and peaking at 439 °C is indicative of decomposition.
The small exotherm peaking at 300 °C in one test has not yet been identified.
Other DSC features – endotherm at 116 °C is either loss of moisture or melting of the
small amount of sulfur in the sample. The endotherm at 300 °C is likely KClO4 phase
transition.
5.5 Standards
5.5.1. Potassium chlorate and aluminum homemade flash powder
This standard was made by mixing 1.38 grams of atomized aluminum powder with 0.62 grams
of potassium chlorate. The two components were mixed by hand for approximately 10 minutes
before being submitted to testing.
Data Summary of KClO3 and Al standard:
Mechanical Insult Data
Impact (H50%) – 71 cm
Friction (F50%) – 71 psi
ESD (Joules) – 0.013 J
Primary Chemical Results
Predominant metals (EDAX) –Al, K, Cl
Predominant metals (ICP-AES) – Al and K
Anion(s) – chlorate and perchlorate, some question about the purity of this standard.
Discussions with Test America yielded no particular reason that a sample that had been
produced with only potassium chlorate and aluminum powder could result in a significant
perchlorate signal.
Other species – NA

49
Figure 49. KClO3 crystal in homemade flash powder
Figure 50. EDAX results for KClO3 flash powder
5.5.2. Potassium perchlorate and aluminum homemade flash powder
This standard was made by mixing 1.36 grams of atomized aluminum powder with 0.64 grams
of potassium perchlorate. The two components were mixed by hand for approximately 10
minutes before being submitted to testing.
Data Summary of KClO4 and Al standard:
Mechanical Insult Data
Impact (H50%) – 60 cm
Friction (F50%) – 77 psi
ESD (Joules) – 0.013 J
Primary Chemical Results
Predominant metals (EDAX) – Al, K, Cl
Predominant metals (ICP-AES) – Al and K
Anion(s) – perchlorate, very small chlorate signature Other species – NA

50
Figure 51. SEM of KClO4 and Al flash powder standard
Figure 52. EDAX results from KClO4 and Al flash powder
5.5.3. Potassium perchlorate/chlorate mixed and aluminum homemade flash powder
This standard was made by mixing 0.63 grams of atomized aluminum powder with 0.685 grams
of potassium perchlorate and 0.685 g of potassium chlorate. The three components were mixed
by hand for approximately 10 minutes before being submitted to testing.
DSC results indicate that this sample does not decompose at temperatures less than 500 °C.
Data Summary of KClO3/KClO4 and Al standard:
Mechanical Insult Data
Impact (H50%) – 55 cm
Friction (F50%) – 77 psi
ESD (Joules) – 0.013 J
Primary Chemical Results
Predominant metals (EDAX) –Al, K, Cl
Predominant metals (ICP-AES) – Al and K
Anion(s) –perchlorate and chlorate
Other species – NA

51
Thermal Sensitivity Data
DSC exotherm - NA
Other DSC features –endotherms at 305 and 358 °C are likely KClO4 phase transition
and the melting of the KClO3 in the sample, respectively. This result suggests that DSC
alone can be utilized to determine the presence of chlorate in fireworks samples that
decompose at temperatures higher than its melting point.
Figure 53. SEM image of KP&KC + Al homemade flash powder
Figure 54. EDAX analysis of the mixed flash powder

52
Figure 55. DSC run of mixed flash powder, showing that chlorate can be detected in a DSC endotherm
6.0 Discussion
In this section, items not fully addressed in sections related to individual materials are
discussed. These issues include the categories into which the materials fall by virtue of chemical
and physical characteristics, some commentary on particle size and a brief note about
endothermic data in DSC test results.
6.1 Results Categorization
Major results of this testing program are presented in Tables 2 and 3. Overall, the results of the
chemical, thermal and mechanical insult testing of the materials fell naturally into three classes
of explosive materials, and one sample of non-explosive material (See Table 3):
Lift Charges
Flash Powder
Stars/Comets
Clay
The results demonstrate how chemical and physical properties of the various sections within the
fireworks are conserved.
Published melting point of KClO3 is
356 °C.

53
6.1.1 Lift Charges
Lift charge materials, with physical descriptions of “black pebbles” and the like, contain
relatively high concentrations of sulfur (around 10%/wt) and large concentrations of KNO3.
They all exhibit thermal decomposition events that show onset around 360 °C and peak at about
440 °C. They are sensitive to electrostatic discharge, but not impact or friction, and contain
potassium and nitrate anions. The decomposition (ignition) temperature and overall lack of
sensitivity to mechanical forces matches those in the literature well.8
6.1.2 Flash Powder
The second clear category is flash powder material with a relatively low sulfur content (in
general, <3%/wt). These materials are more sensitive to friction and ESD than PETN and
RDX, and therefore to be classed as primary explosive materials, but less sensitive to impact
than these standards. All samples contain high concentrations of both Al and Mg, and
perchlorate. Very small chlorate signals are seen in some materials, but all represent overall
chlorate concentrations of <0.1%/wt. These materials do not thermally decompose at
temperatures less than 500 °C, further indicating negligable chlorate concentration. The high
decomposition (ignition) temperature has been documented in the case of flash powder
materials containing magnesium. The chemical components of these materials and sensitivity
to mechanical forces match those in the literature well.8
6.1.3 Stars/Comets
“Stars” or “comets” are larger particle size materials with a higher sulfur content. Most of these
materials are quite sensitive to reaction after mechanical stress, and are also sensitive to ESD.
Because of this sensitivity, these materials should also be considered primary explosives. As a
class, they have more variability than the other two classes of results. In general, they have
higher concentration of sulfur than the flash powder samples. They also have higher
concentrations of salts related to color production in the device, only some of these materials
contain nitrate. All samples contain large concentrations of perchlorate. Very small chlorate
signals are seen in some materials, but all represent overall chlorate concentrations of
<0.1%/wt. Decomposition at high temperatures happens in all samples, but under conditions
that vary appreciably, instead of the relatively conserved behavior of the lift charge samples. In
these samples, the onset of the exotherm is around 350 °C, and reaches its peak at 400-450 °C,
roughly matching the ignition temperatures listed in Conkling for a flash powder recipe
containing sulfur.8

54
6.1.4 Clay
The last sample, Sky Festival #F, appears to be pyrotechnic clay, as the primary elements found
within are aluminum and silicon. This sample was not fully tested, as a very small quantity was
received, but informal mechanical insult testing shows it to be insensitive.
6.2 Particle Size Effects
For a given material, the level of insult required to initiate a reaction, and the subsequent extent
of that reaction in any of these tests is not only a function of its basic chemical composition, but
its physical characteristics as well. These physical characteristics include physical state (i.e., gas,
liquid or solid), and in the case of solids in particular, compacted samples versus particulates or
powders, and the particle size of those powders. Almost all commercial propellants and
pyrotechnics are produced and packaged in powder form, although the particle sizes of those
powders can vary significantly. Their reaction rates are a function of both pressure and of
particle size: as pressure increases, the burn rate will increase and for a specific material at a
fixed pressure, smaller grain powders will burn faster than larger grain powders. Likewise, a
specific material will typically exhibit greater sensitivity to thermal insults, whether internally
generated or from external heat sources, as the particle size is decreased.
In the present results, there are notable differences in particle size (documented in SEM images),
however, no analysis was performed upon this aspect of the sample. This is chiefly due to the
presence of chemical variability that would serve to make unequivocal designation of particle
size effects difficult and uncertain.
6.3 Differential Scanning Calorimetry Observations
Differential scanning calorimetry (DSC) was performed on all but the Sky Festival samples #E,
#F and #G. The DSC provides two principal types of information, the presence or absence of a
decomposition exotherm, which has already been discussed. The second type of information is
based on the interpretations of the endotherms which exist prior to any decomposition event. It
is clear throughout the data that the presence and temperatures of these endotherms can help to
identify fireworks components. For example, crystal rearrangement and melting of KNO3 were
visible in the DSC data of the lift charges. The consistency of the temperature of all the
decomposition exotherms present in this data set may well be related to the boiling point of
sulfur at 445 °C and the substantial vapor pressure developed before reaching the actual boiling
temperature. The most interesting thing about the endotherms are their probable use in
distinguing the presence of substantial concentrations of pyrotechnically interesting salts based
on melting or crystal rearrangement points.
55
The chemical formulations that are intimated by the testing are all quite ordinary, being
discussed at length in both internet resources and hardcopy ones, with one exception.7,8
Sky
Festival #D sample exhibited one particle with a significant phosphorus signature when probed
by a very narrow excitation beam in EDAX. This signal is not repeated in either the less
focused EDAX nor in the ICP data. In fact, of the five EDAX spectra collected on this
particular sample, there is a phosphorus signature in only one, indicating a low overall
concentration of this element in the material. This sample is not more sensitive than the other
flash powder type materials, either on a mechanical or thermal basis, so this result, although
interesting, in all likelihood does not represent a substantial deviation from the compositions of
the other samples in the tested set.
7.0 Conclusion
Analysis of Pyrotechnic Components results indicate that the test samples provided behaved
in ways that are consistent with extant fireworks literature available both in internet and
hardcopy resources. Flash powders and their derivatives are recognized as extremely dangerous
materials that are very sensitive to ignition by common handling forces, including impact,
friction and static discharges of the magnitude possible from the human body. This high level
of sensitivity is the rationale behind safety warnings and precautionary advice given in every
guide to handling these compounds. These warnings include remote mixing of larger quantities
and advice not to store bulk flash powder near personnel.
8.0 References 1. http://www.pyrouniverse.com/consumer/howtheywork.htm
2. www.skylighter.com
3. http://en.wikipedia.org/wiki/Potassium_chlorate
4. Moran, Paul, Complete Book of Flash Powder, self published 1993
5. MIL-STD-1751A, DEPARTMENT OF DEFENSE TEST METHOD STANDARD: SAFETY AND
PERFORMANCE TESTS FOR THE QUALIFICATION OF EXPLOSIVES (HIGH EXPLOSIVES,
PROPELLANTS, AND PYROTECHNICS) (11 DEC 2001)
6. Unger, B. “Electrostatic Discharge Failures of Semiconductor Devices,” IEEE International
Reliability Physics Symposium Proceedings, 1981
7. Russell, Michael S., The Chemistry of Fireworks, 2nd Ed., Royal Society of Chemistry, 2009
8. Conkling, John A., and Christopher J. Mocella, Chemistry of Pyrotechnics, 2nd Ed., CRC Press 2011
9. 0 Appendix To be submitted separately on a CD. Many of the raw data sets are very large files.

56
10.0 Acknowledgments The author recognizes the hard work of both Mr. Andrew Goddard and Ms. Elizabeth Morgan in
the collection of the mechanical insult data, and useful discussions with Fred Sandstrom and Dr.
Scott Preston, all of ARA.