A tool for characterizing and succinctly representing the data access patterns of applications
Upload
independentCategory
view
3download
0
Analysis and Characterization of Large-Scale Web Server
Access Patterns and Performance
Arun K. Iyengar, Mark S. Squillante, Li Zhang
IBM Research Division
Thomas J. Watson Research Center
Yorktown Heights, NY 10598faruni,mss,[email protected]
Abstract
In this paper we develop a general methodology for characterizing the access patterns of Web server requests based
on a time-series analysis of finite collections of observed data from real systems. Our approach is used together with
the access logs from the IBM Web site for the Olympic Games to demonstrate some of its advantages over previous
methods and to construct a particular class of benchmarks for large-scale heavily-accessed Web server environments.
We then apply an instance of this class of benchmarks to analyze aspects of large-scale Web server performance,
demonstrating some additional problems with commonly used methods to evaluate Web server performance at differ-
ent request traffic intensities.
ii
Iyengar, Squillante, Zhang, Analysis of Web Server Access Patterns & Performance 1
1 INTRODUCTION
The World Wide Web is growing at an extremely rapid pace. It continues to play an ever increasing and
important role in our daily life. A critical issue for continued and successful growth concerns the performance of Web
servers, which must provide reliable, scalable and efficient access to Internet services.
A significant body of work in the research literature has focused on variousaspects of Web server perfor-
mance — e.g., see [Arlitt and Williamson 1996; Diaset al. 1996; Liu et al. 1996; Yeager and McGrath 1996;
Arlitt and Williamson 1997; Bangaet al. 1997; Banga and Druschel 1997; Dougliset al. 1997a; Huet al. 1997;
Iyengaret al. 1997; Mogulet al. 1997; Mosedaleet al. 1997; Challengeret al. 1998; Gaddeet al. 1998; Mosberger
and Jin 1998] and the references cited therein. Much of the Web server performanceresearch has focused on various
aspects of caching and has demonstrated the potentially significant improvements in performance provided by some
of these methods — e.g., see [Chankhunthodet al. 1996; Gwertzman and Seltzer 1996; Williamset al. 1996; Bolot
and Hoschka 1997; Cao and Irani 1997; Dougliset al. 1997a; Dougliset al. 1997b; Duskaet al. 1997; Gribble
and Brewer 1997; Iyengar and Challenger 1997; Krishnamurthy and Wills 1997; Kroegeret al. 1997; Loon and
Bharghavan 1997; Nabeshima 1997; Scheuermannet al. 1997; Wooster and Abrams 1997; Yoshida 1997; Caceres
et al. 1998; Gaddeet al. 1998; Niclausseet al. 1998] and the references therein. Other studies have examined
various forms of prefetching and have shown the potentially considerable performance benefits of such approaches,
e.g., see [Bestavros 1995; Padmanabhan and Mogul 1996; Cunha and Jaccoud 1997; Kroegeret al. 1997] and the
references cited therein.
A detailed analysis and characterization of Web server access patterns is fundamental togaining key insights
and to fully realizing the potential improvements in Web server caching, prefetching and overall performance that
is required for providing reliable, scalable and efficient access to Internet services. This is especially the case for
large-scale heavily-accessed Web server environments, which have received considerably less attention in the research
literature due in part to the lack of data. These environments, however, are becoming increasingly important and
common as the Web is used more and more to access information on popular sporting events and on the latest news,
and to provide access to new applications resulting from the emergence of electronic commerce. Examples include the
IBM Web site for the Olympic Games, which in 1998 served 56.8 millionrequests on the peak day and had a maximum
of 110,414 hits per minute, the IBM Web site for the 1998 Championships at Wimbledon, which had 145,478 hits in
a single minute, and the Web sites for popular news and financial services such as CNN and Schwab. Note that the
underlying data in many of these cases are also changing at a relatively fast rate.
SPECweb96 [SPECweb 1996] and WebStone [WebStone 1996] are two benchmarks commonly used to gener-
ate Web server access patterns and analyze Web server performance issues. WebStone tries to measure the maximum
request rate that a Web server can sustain by issuing as many requests as possible from synchronous clients. Web-
2 Iyengar, Squillante, Zhang, Analysis of Web Server Access Patterns & Performance
Stone merely stress tests the system, and it is not capable of characterizing the burstiness, trends, interdependencies
and seasonal behavior which is shown by our empirical analysis to exist inthe real access patterns of the large-scale
heavily-accessed Web sites motivating our study. As we also demonstrate in this paper, such access pattern character-
istics can be critical to Web server response time measures. Although SPECweb96 introduces delays between client
requests, interrequest times are not obtained by analyzing and characterizing realWeb site data, and thus it suffers in
this respect from many of the same problems as WebStone.
One objective of this paper therefore is to develop a general methodologyfor empirically analyzing and char-
acterizing Web server access patterns. Our methodology is based on constructinga set of general stochastic processes
that captures the behavior found in real systems. In particular, we view collections of observed data from a Web server
as realizations of a set of underlying time-varying stochastic processes, and we exploit time-series analysis to obtain
the key properties of this set of processes from the collections of data. This includes decomposing the time-series
analysis into piecewise time-series processes, and the use of statistical methods to isolate and determine the trends,
interdependencies, seasonal effects and noise of each time-series process. By combining this set of processes in a gen-
eral manner, we obtain a methodology for characterizing Web server access patterns that is more general and flexible
than previously proposed approaches (e.g., [Bolot and Hoschka 1997; Jagerman and Melamed 1992]). Our approach
also provides the ability to make accurate predictions of some future events based on previous observations [Granger
and Newbold 1986; Bowerman and O’Connell 1987; Brockwell and Davis 1987; Kendall and Ord 1990] (see Sec-
tions 4, 5 and 6) and to capture seasonal behavior [Brockwell and Davis 1987; Kendall and Ord 1990] (see Sections 4
and 5).
The basis of our methodology was introduced in [Iyengaret al. 1998a] where it is applied to the access logs
from the IBM Web site for the 1996 Olympic Games in Atlanta, U.S.A. In this paper we apply our general methodology
to characterize and represent the access patterns of Web server requests from the IBMWeb site for the 1998 Olympic
Games in Nagano, Japan. We focus here on the totality of requests of all typesreceived at the Web server. However,
our methodology can be equally applied in a straightforward manner to requests for each individual Web page, or set
of pages, and to requests from individual users, or set of users. This complements previous work that has considered
other aspects of Web workload characterization (see Section 5). A more recent study [Squillanteet al. 1998] extends
our methodology of the present paper by introducing thelogARIMA, or eARIMA, process to incorporate heavy-tailed
distributions together with the set of time-series processes of our methodology, which is in addition to addressing the
trends, interdependencies, seasonal behavior and noise of non-stationarytime-series data.
Another objective of this paper is to present an empirical analysis of the accesslogs from the Web site for
the 1998 Olympic Games, which reflects an important class of Web server environments that is quite different from
those previously considered in the literature. This empirical analysisprovides insights and a better understanding of
the access patterns in such heavily-accessed large-scale Web server environments. By applying these methods to the
Iyengar, Squillante, Zhang, Analysis of Web Server Access Patterns & Performance 3
access logs from the 1996 Atlanta Olympics and comparing the results with those from the 1998 Olympic Games,
we also make a few observations regarding the changes in access patterns due to workload evolution over time and
identify the behavior that has remained consistent. This is a particularly interesting aspect of Web performance to
consider given the ongoing explosive growth in the use of the World Wide Web for access to the latest news and sports
results, as just one example. The increase in the maximum hits per minute from 110,414 in the Nagano Olympics to
145,478 in the Wimbledon Championships only a few months later maybe just one specific example of this.
The empirical analysis presented in this paper provides the basis for a classof benchmarks, which we call
Flintstone, that is more accurate than WebStone or SPECweb96 for the large-scale heavily-accessed Web server envi-
ronments of interest. Our approach can also be applied to different Web access logs to construct realistic benchmarks
and workloads that are representative of different environments sharing the characteristics of those found in the present
study. In fact, we are currently adapting our implementation of the Flintstone methods developed in this paper to auto-
mate the construction of benchmarks directly from any collection(s) of realWeb server data, which we hope to make
publically available in the near future.
An important use of these accurate benchmarks of large-scale heavily-accessed Webserver environments is to
evaluate various Web server performance issues, including the design and evaluation of more effective caching and
prefetching algorithms. A vital aspect of such performance evaluation studies, which is often ignored, concerns the
fact that Web access logs and traces reflect a specific request traffic intensity found over the given observation interval.
If one simply scales (i.e., speeds-up or slows-down) time in the traceto consider different traffic intensities, which
is basically the only option without the use of additional methods,then this is equivalent to a linear scaling of the
mean and standard deviation of the interrequest times (i.e., the coefficient of variation remains fixed) that ignores the
burstiness, trends, interdependencies and seasonal effects of the request patterns and that does not change the ordering
among the requests (e.g., with respect to the evaluation of caching algorithms). On the other hand, when time is scaled
together with any non-negligible burstiness, trends, interdependencies and seasonal behavior implicit in the traces,
then the scaling of the interrequest mean and standard deviation may not be linear and, more importantly, the temporal
request patterns can be quite different including possible changes in theordering of the requests. For example, consider
a pageA with highly dependent accesses and a pageB with little or no dependencies among its accesses; the scaling
of time will have a different affect on the interreference times forA than it does forB due to the dependencies among
accesses toA, which can easily include a change in the temporal ordering of some of the accesses to pagesA andB.
The need to evaluate Web server performance issues under heavier request trafficis particularly important due to the
ongoing explosive growth in the use of Web servers for access to the latest information, as noted above.
By isolating and characterizing the trends, interdependencies, seasonal effects and noise in the access pat-
terns, our methodology makes it possible to scale the Web server request traffic in a general and flexible manner so
that various aspects of Web server performance can be examined at all traffic intensities of interest. The alternative
4 Iyengar, Squillante, Zhang, Analysis of Web Server Access Patterns & Performance
approach of simply scaling time in the access patterns (described above), whichis often used in the performance eval-
uation research literature, has been employed to study Web server performance issues. A comparison between this
approach and Flintstone demonstrates some of the problems with the former and some of the important advantages
of our methodology, both with respect to characterizing the request trafficpatterns, scaling these patterns to consider
different server loads, and the impact of such issues on certain aspects of Web server performance.
This paper makes several important contributions. We develop a general methodology for analyzing and char-
acterizing Web server access patterns, which supports the scaling of Web requeststo any traffic intensity of interest
and supports different forms of prediction (some examples are discussed in Section 6). We also perform an empirical
analysis of the data from the 1998 Nagano Olympic Games based on our generalmethodology, which should help to
provide a better understanding of such heavily-accessed large-scale Web serverenvironments. This empirical analysis
is then used to develop a class of benchmarks, which we exploit to examinevarious Web server performance issues in
the Web environments of interest.
The remainder of this paper is organized as follows. We first present an overview of our methodology for
characterizing Web server access patterns, and then Section 3 describes the Web server system and performance
evaluation used in our study. A representative sample of the results ofapplying our methodology to the Olympic
access logs together with the corresponding Web server performance measures arepresented in Section 4. Related
work is discussed in Section 5, and our concluding remarks are provided inSection 6.
2 WEB SERVER ACCESS PATTERNS
A general methodology for accurately representing the access patterns of real Web server environments must
capture the trends, interdependencies, seasonal behavior and random noise of the request patterns for the system of
interest. This methodology must further capture the dynamic changes inthese characteristics that often occur in Web
server environments. Our approach achieves these objectives by constructinga set of time-series processes based on
a time-series analysis of finite collections of observed data from real Web server systems. We then combine these
piecewise time-series processes in a general manner to obtain a general methodology for characterizing Web server
access patterns. In this section we present an overview of our general approach, focusing primarily on the key results
that are needed for the empirical analysis and characterization of trace data using our methodology. We refer the
interested reader to [Iyengaret al. 1998b] for additional technical details.
Consider collections of time-varying request observations from the Webserver environment of interest such
that each observation is indexed by its time parametert. We partition this time series of requests intoM phasesof
access pattern behavior, each of which is a time-series processZm = fZm;t ; t 2 INgwhereZm;t is a random variable
corresponding to thetth request of themth time-series phase,1 � m �M , IN � f0; 1; 2; : : :g. Within this framework,

Iyengar, Squillante, Zhang, Analysis of Web Server Access Patterns & Performance 5Zm;t can be interpreted as the time epoch of thetth request, or thetth interrequest time, or the number of requests
at (discrete) timet, all with respect to the time-series processZm. The Web server request patterns then follow a
particular time-series processZi for some period of time, at which point there is a transition to anothertime-series
processZj (where we allowi = j). When the requests are following the time-series processZm, we say that the Web
server access model is instatem. The duration of time that the system spends in each of these states is governed by a
set of stochastic processesLi;j = fLi;j;n ; n 2 INg in the following manner.
Consider the case where the Web server access model makes a transition from state i to statej at times for thenth time,n � 1. To clarify the exposition, and without loss of generality, suppose thatZj;t represents the time between
the tth andt� 1st request of the time-series processZj , t � 1. Let Nj(s) 2 IN denote the number of requests that
the system has observed fromZj at times. The Web server request patterns in this case then follow the time-series
processZj for the period of time given by eLi;j;n = Li;j;n + Ri;j;n;whereLi;j;n is the base lifetime of thenth visit to statej from statei andRi;j;n is the residual life of this visit. In
particular, the Web server requests from times to times+ Li;j;n +Ri;j;n occur at the time epochsf s+ Zj;t+1; s+ Zj;t+1 + Zj;t+2; : : : ; s+ Li;j;n +Ri;j;n gwheret = Nj(s). The remaining elements of our Web server access model are the initial time-series probability
vector� � (�1; : : : ; �M ), where the access model starts in statem with probability�m,PMk=1 �k = 1, and the state
transition probability matrixP � [pi;j ]f1�i;j�Mg, where the access model makes a transition to statej upon leaving
statei with probabilitypi;j ,PMk=1 pi;k = 1, 1 � i �M .
Our methodology is based on the use of any general stochastic process for eachof theLi;j and the use of
general ARIMA time-series processes for theZm, which includes seasonal models. One can often find in practice
(e.g., see Section 4) a time series that has a consistent pattern of behaviorfor some period of time, and then it exhibits
a shift to a different consistent pattern of behavior. Our approach can be applied to any (sufficiently large) collection
of observed data to capture this behavior, as shown by our empirical analysis in Section 4. We can thus divide
any given finite set of observations into phases, either visually or by the use of more sophisticated methods such as
change-point detection [Basseville and Nikiforov 1992], and then use the time-series analysis below to characterize
each piecewise time series as an ARIMA model. By decomposing the time-series analysis into piecewise ARIMA, or
PARIMA, processes and combining these processes in the manner described above, we obtain a general methodology
for accurately characterizing Web server access patterns. Moreover, this approach can makeit possible to use smaller
order ARIMA processes to represent each of these piecewise time series (see Section 4), which is important from a
practical viewpoint.
Our Web server access model can consist of a separate set of stochastic processes foreach type of Web server

6 Iyengar, Squillante, Zhang, Analysis of Web Server Access Patterns & Performance
request, or a single set of stochastic processes for all requests, or any ofthe possibilities in between these extremes.
A single set of stochastic processes is considered in what follows, fromwhich the other cases can be handled in
a straightforward manner as a mixture of such sets of stochastic processes. Our approach is also easily extended
to Markov chainsP of order greater than 1. By using the appropriately defined time-series process, our general
methodology supports any level of access granularity that is desired, or that is necessitated by the granularity of the
set of observation data available. In particular, for very fine-grained access data where each Web server request has a
unique arrival time, a time-series processZm can be used whereZm;t is a continuous random variable representing
the time between thetth andt� 1st request. When only coarse-grained access data is available, then it is often more
appropriate to use a time-series processZm where the interrequest timesZm;t are discrete random variables. More
generally, each arrival epoch in both of these cases can represent a batch of Web server requests such thatZm =f(Zm;t;Km;t) ; t 2 INg, whereZm;t is as defined above andKm;t 2 IN� f0g denotes the request batch size. When
very coarse-grained access data is available for certain large-scale heavily-accessed environments, such as the time
series data considered in Section 4, then a time-series processZm can be used whereZm;t 2 IN represents the number
of requests at (discrete) timet.As mentioned above, we use the general class of ARIMA models for the time-series processesZm. ARIMA
models have been widely used in other fields to analyze time series data. They are essentially based on decomposing
the time series into three components, namely the autoregressive (AR), the integration (I) and the moving-average
(MA) linear filters. Intuitively, the time-series data is passed through the integration, autoregressive and moving-
average filters in series to determine the appropriate order and parameters for each filter. Once random noise is
obtained as the final output, suggesting that the burstiness, trends and interdependencies have been properly extracted,
then the resulting integration, autoregressive and moving-averagefilters can be used to accurately model the original
time-series data. Seasonal ARIMA models additionally capture any periodic, or seasonal, behavior in the time-series
data. In the remainder of this section, we briefly describe each of the ARIMA model components in turn. To clarify
the presentation, we will drop our use of the subscriptm with the understanding that our discussion applies for each
of theM time-series processesZm.
2.1 The Integration Filter
Given a non-stationary time seriesfZt ; t 2 INg, the integration filter can be used to remove polynomial-order
trends via differencing to obtain a stationary process. Other methods for handling trends and seasonal behavior can be
easily accommodated in our methodology [Brockwell and Davis 1987; Kendalland Ord 1990].
The differencing operator� � 1�B is defined in terms of the backward shift operatorB such thatBZt = Zt�1; (1)

Iyengar, Squillante, Zhang, Analysis of Web Server Access Patterns & Performance 7
and thus �Zt = Zt � Zt�1:For example, if the processZt is growing linearly with time, the first order difference,Yt = �Zt = Zt � Zt�1, will
be stationary. WhenZt is growing quadratically, thenYt grows linearly, and thus we have to differenceYt to obtain a
stationary series. This consists of essentially taking the second order difference ofZt, which yieldsYt � Yt�1 = Zt � 2Zt�1 + Zt�2 = �2Zt:The rank and Unit Root tests [Kendall and Ord 1990; Brockwell and Davis 1987] provide effective methods
for determining the appropriate orderd of differencing required to obtain a stationary process from the original time
series data. In the remainder of this section, we assumeZt = �dZ 0t is a stationary series with mean 0.
2.2 The AR Model
A stationary time seriesfZt ; t 2 INg is said to be governed by an orderp autoregressive processAR(p) if the
current value of the series,Zt, depends linearly on the values of the previousp observationsZt�1; : : : ; Zt�p, and a
random noise variable�t. More formally, this process can be written asZt = �1Zt�1 + : : : + �pZt�p + �t (2)
wheref�tg is an independent and identically distributed (i.i.d.) sequence, each of whose elements has distribution
N(0; �2� ) (i.e., a normal distribution with mean 0 and variance�2� ). The orderp of the AR process is determined by
the lag at which the partial autocorrelation function becomes negligible [Kendall and Ord 1990; Brockwell and Davis
1987].
2.3 The MA Model
A stationary time seriesfZt ; t 2 INg is said to be governed by an orderq moving-average processMA(q) if
the current value of the series,Zt, depends linearly on the values of the previousq white noise variables�t�1; : : : ; �t�p.More formally, this process can be written asZt = �t � �1�t�1 � : : : � �q�t�q (3)
wheref�tg is white noise with mean 0 and variance�2� . The lag at which the autocorrelation function drops to a
negligible level tells us a great deal about the orderq of the MA process [Kendall and Ord 1990; Brockwell and Davis
1987].
8 Iyengar, Squillante, Zhang, Analysis of Web Server Access Patterns & Performance
2.4 The ARMA and ARIMA Models
We first combine the autoregressive and moving-average processes to obtain the more general class ofautore-
gressive moving-average(ARMA) models. A stationary time series is said to be an ARMA(p; q) process if it can be
represented as Zt � �1Zt�1 � : : : � �pZt�p = �t � �1�t�1 � : : : � �q�t�q ; (4)
wherep andq are the orders of the AR and MA processes, respectively. The lags beyond which the autocorrelation
function and the partial autocorrelation function become negligible respectively provide considerable information
about the MA and AR orders [Kendall and Ord 1990; Brockwell and Davis 1987].
Upon incorporating the differencing filter of Section 2.1 into the above ARMA model, we obtain the general
class of ARIMA models. A time series is an ARIMA(p; d; q) process if�dZt is an ARMA(p; q) process, i.e., if(1 � �1B � : : : � �pBp)�dZt = (1 � �1B � : : : � �qBq)�t:2.5 Model Estimation and Diagnostics
Assuming a stationary series, we consider constructing an ARMA model tofit the given Web trace data by first
estimating the autocorrelation function and the partial autocorrelation function, and identifying the AR and MA orders.
Since these functions possess the fundamental characteristics of the timeseries, much of our time-series analysis is
based on examining the autocorrelation function and the partial autocorrelation function to formulate sufficiently
accurate models.
Specifically, we calculate estimates of the autocorrelation function with lagk and the partial autocorrelation
function with lagk. Various statistical tests are then used for increasing values ofka andkp to determine if the auto-
correlation function at lagka and the partial autocorrelation function at lagkp are negligible. Given the corresponding
order of the ARMA model, we can use the standard least-square method or the maximum likelihood method to es-
timate the parameters of the model, with which estimates for the residuals�t can then be calculated. The residuals
should be white noise if the model is correct, and this can be checked with different statistical tests. If the residuals
are purely random, we can conclude that the model fits the data well. However, if the residuals are not white noise, we
will need to modify the model (e.g., increase the AR and MA orders) and continue the analysis following the approach
described in this section.
3 WEB SERVER SYSTEM
Iyengar, Squillante, Zhang, Analysis of Web Server Access Patterns & Performance 9
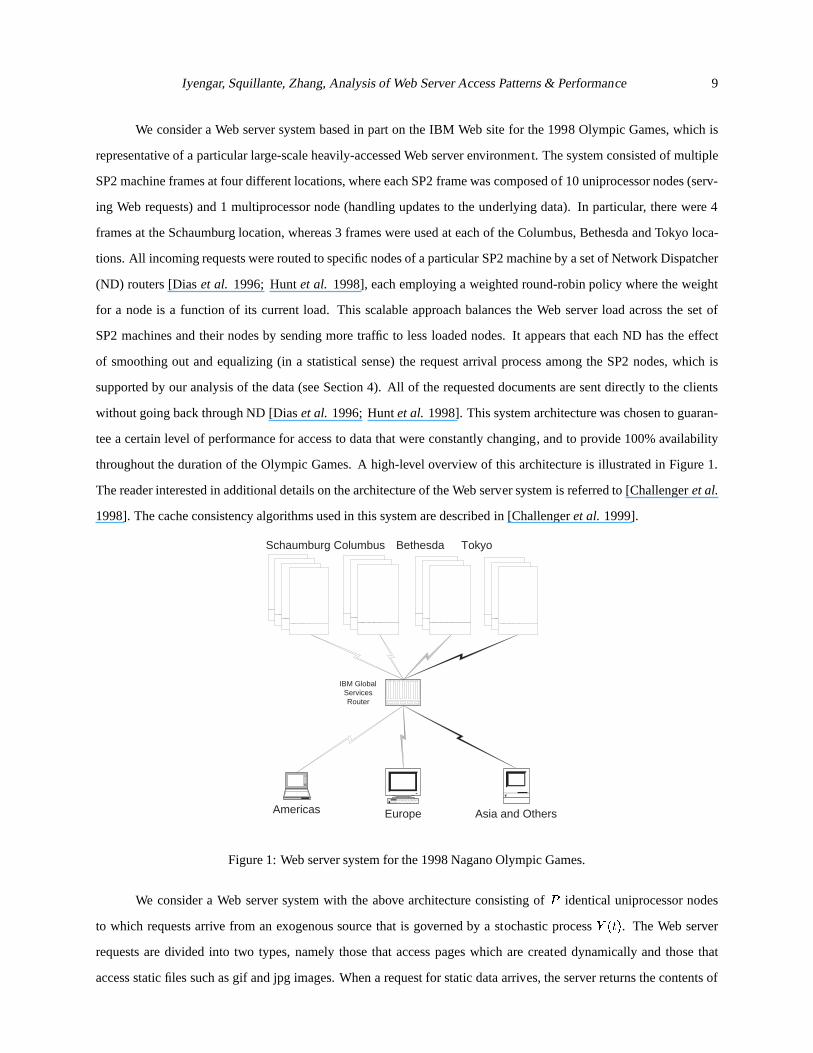
We consider a Web server system based in part on the IBM Web site for the 1998 Olympic Games, which is
representative of a particular large-scale heavily-accessed Web server environment. The system consisted of multiple
SP2 machine frames at four different locations, where each SP2 frame was composed of 10 uniprocessor nodes (serv-
ing Web requests) and 1 multiprocessor node (handling updates to the underlying data). In particular, there were 4
frames at the Schaumburg location, whereas 3 frames were used at each of the Columbus, Bethesda and Tokyo loca-
tions. All incoming requests were routed to specific nodes of a particularSP2 machine by a set of Network Dispatcher
(ND) routers [Diaset al. 1996; Huntet al. 1998], each employing a weighted round-robin policy where the weight
for a node is a function of its current load. This scalable approach balances the Web server load across the set of
SP2 machines and their nodes by sending more traffic to less loaded nodes. It appears that each ND has the effect
of smoothing out and equalizing (in a statistical sense) the request arrival process among the SP2 nodes, which is
supported by our analysis of the data (see Section 4). All of the requested documents are sent directly to the clients
without going back through ND [Diaset al. 1996; Huntet al. 1998]. This system architecture was chosen to guaran-
tee a certain level of performance for access to data that were constantly changing, and to provide 100% availability
throughout the duration of the Olympic Games. A high-level overview of this architecture is illustrated in Figure 1.
The reader interested in additional details on the architecture of the Web server system is referred to [Challengeret al.
1998]. The cache consistency algorithms used in this system are describedin [Challengeret al. 1999].
SP2 SP2 SP2 SP2 SP2 SP2 SP2 SP2 SP2
Americas Europe Asia and Others
Schaumburg Columbus Bethesda Tokyo
IBM Global Services Router
Figure 1: Web server system for the 1998 Nagano Olympic Games.
We consider a Web server system with the above architecture consisting ofP identical uniprocessor nodes
to which requests arrive from an exogenous source that is governed by a stochastic processY (t). The Web server
requests are divided into two types, namely those that access pages which are created dynamically and those that
access static files such as gif and jpg images. When a request for static data arrives, the server returns the contents of
10 Iyengar, Squillante, Zhang, Analysis of Web Server Access Patterns & Performance
the corresponding file. In contrast, dynamic requests are for HTML pages that require the server to execute a program
to generate the dynamic pages. Dynamic data generally change more frequentlythan static data; e.g., a dynamic page
may contain some information that is maintained in an evolving database such as the current score of a game.
A high percentage of the pages at the 1998 Olympic Web site were created dynamically, which was essential
in this environment where the contents of Web pages were constantly changing. Embedded image files comprised the
majority of static data requests. The time to serve a dynamic page request is often significantly more than that required
to satisfy a static request. In particular, the average processor time tosatisfy requests for static files was on the order of a
few milliseconds, whereas the average processor time to serve a dynamic page request (without the use of a cache) was
several orders of magnitude larger. We consider a single-class workload model based primarily on the data available
to us, which includes the use of Web server caches. The service demands of the Web server requests are therefore
modeled as i.i.d. positive real-valued random variables following an ordermB phase-type probability distribution with
mean��1 = 10ms and coefficient of variation0:5 � cvB � 4, where both parameter settings are to match system
measurements and cover various environments of interest. The use of a phase-type distribution for the service times is
of great practical importance because this class of distributions is dense within the set of probability distributions on(0;1), and a considerable body of research has examined the fitting of phase-type distributions to empirical data (e.g.,
see [Asmussen 1997] and the references cited therein). Recent work has also considered effectively approximating
heavy-tail distributions by a subset of the class of phase-type distributions to analyze performance models [Feldmann
and Whitt 1998].
The Web server request arrival processY (t) is formulated according to the general methodology presented
in Section 2 applied to the log files that were kept for every node of the Olympic Web site. The per-node log file
records the origin of each request (i.e., the IP address of the client machine), the time of the request (rounded to the
nearest second), the page requested, and the size of the page. With a few exceptions, the log files contain multiple
requests at each second. Given the coarse granularity of the access request times inthese logs and the large-scale
heavily-accessed Web server environment they represent, we use the set of time-series processesfZ1; Z2; : : : ; ZMgwhereZm = fZm;t 2 IN ; t 2 INg represents the number of requests at thetth step of themth time-series phase,1 � m � M . Simulation is used to obtain performance measures for this instance of our Web server system model
due to this complex arrival process.
An alternative approach often used in the performance evaluation research literature is based on approximating
the arrival processY (t) by calculating the first two moments of the request patterns from the Web server access
logs and then fitting a distribution to match these first two moments.To consider different traffic intensities, there is
sufficient information to only scale time in the trace data which is equivalent to a linear scaling of the mean while
keeping the coefficient of variation constant. We refer to this approach asM2M because it matches the first two
moments of both the trace data and the direct linear scaling of this data. Forcomparison in Section 4, we consider the
Iyengar, Squillante, Zhang, Analysis of Web Server Access Patterns & Performance 11
use of an ordermA phase-type distribution with mean��1 and coefficient of variationcvA both set to approximate the
arrival processY (t) following the M2M approach. In this case the system model is equivalent to a PH/PH/P queue,
for which we exploit an exact analytic solution. The interested reader is referred to [Squillante 1998] for the technical
details.
4 EMPIRICAL RESULTS
We conducted a detailed empirical analysis of the access logs from the IBM Web site for the 1998 Olympic
Games based on our methodology of Section 2 under the Web server system modelof Section 3. In this section we
present a small representative sample of our results.
Table 1 presents a summary of some of the statistics and data from our empirical analysis of the Olympic Web
site access logs for February 13, 1998. This represents the busiest day experienced by the Web site, consisting of 56.8
million hits. The first two columns of data provide the total number of requests, and the corresponding percentage, for
each page type. The second two columns provide the same information but for the number of pages in each page type,
and the last columns of data provide similar information regarding the number of bytes for each page type. Among
these different types of files, all of the gif, jpg, txt and class files together with most of the other (data/audio/etc) files
are static. Approximately 75% of the html/htm files are static. All of the pages with a question mark (?), the livecam
file and roughly 25% of the html/htm files are dynamic. Overall, approximately 32% of the requests are made to the
dynamic pages. We also note that the average page size is 10KB.
Figure 2 shows the number of requests received per second by the entire Web site over a period of one hour
obtained directly from the access logs (labeled “Request Batch Size”). Since the request arrival process is non-
stationary over the course of the entire hour, the graph in the figurewas also divided into four phases during which the
arrival process was found to be stationary. This partitioning of the time series can be done with the use of methods
such as change-point detection [Basseville and Nikiforov 1992]. For the results in Figure 2, however, we partitioned
the time series visually as the trends are quite clear. In particular, the first phase consists of an increasing trend and the
remaining three phases contain no trends, where the crossover points between each pair of adjacent phases captures
the level shift (i.e., sudden increase or decrease) in the batch sizes of the corresponding phases. Our Web access
pattern analysis of Section 2 was then used to statistically examine each of thefour phases of traffic, as well as the
traffic for the entire hour. We note that an ARMA(2,2) process characterizesthe entire time series quite well, whereas
an ARMA(1,2) process and an ARMA(1,1) process were sufficient to characterize phases 1 and 2 – 4, respectively.
Figure 2 also plots the ensemble average for these models (labeled “Fit”) aswell as their upper and lower confidence
levels. In addition to our statistical tests of the fit of the models showing them to be accurate representations of the
data, we conducted a number of experiments to inspect the patterns of requests generated by our models and found

12 Iyengar, Squillante, Zhang, Analysis of Web Server Access Patterns & Performance
REQUEST PAGE ID PAGE SIZE
Request Type Number Percent Number Percent Number (bytes) Percent
html/htm 4546990 8.0 8702 14.4 55085096 8.8
gif 24923318 43.9 4263 7.0 45030983 7.2
jpg 2781497 4.9 6102 10.1 70617034 11.2
txt 666690 1.2 34 0.1 41358 0.0
class 4068082 7.2 253 0.4 812635 0.1
question mark (?) 1702843 3.0 36941 61.0 409765517 65.2
livecam 15218947 26.8 1 0.0 1487 0.0
other (data/audio/etc) 2922597 5.1 4241 7.0 47603967 7.6
Total 56830964 100.0 60537 100.0 628958077 100.0
GET (http1.0) 44388877 78.1
GET (http1.1) 12402936 21.8
HEAD (http1.0) 27053 0.1
HEAD (http1.1) 94 0.0
HTTP1.0 44426656 78.2
HTTP1.1 12404308 21.8
code304 (if-modified-since) 12367258 21.8
code200 (successful-transfer)43856936 77.2
code404 (unknown URL) 566878 1.0
Table 1: Summary of statistics and data from empirical analysis of the Olympic Web site access logs.

Iyengar, Squillante, Zhang, Analysis of Web Server Access Patterns & Performance 13
them to be in excellent agreement with the access log data. This can also be observedin the results of Figure 2.
400
500
600
700
800
900
1000
1100
1200
1300
11000 11500 12000 12500 13000 13500 14000
Bat
ch S
ize
Time (seconds)
Number of requests every second for all HTTP requests over an hour on 2/13
Request Batch SizeFit
Upper LimitLower Limit
Figure 2: Traffic data for the Olympic Web site over the course of an hour on February 13, 1998, and measures from
the corresponding ARMA(2,2) model.
In Table 2 we provide additional details on the ARMA models for each of the four phases, as well as for the
entire hour as a whole. We note that our decomposition of the time-series analysis into piecewise time series makes
it possible to use smaller order ARMA processes to represent each of these phases, which was one of the motivating
factors for our approach (see Section 2). Although there appears to be sometrend in the first phase, the length is
relatively small and it still can be accommodated by the ARMA(1,2) process. The ARMA parameters for the various
phases do not differ by very much. This suggests that the parameters characterize thenatureof the time-series process
within the particular hour. Similar observations and results were obtained for different hours.
We also conducted a similar empirical analysis of the request patterns for the 1996 Olympic Web site based
on our methodology in Section 2. In comparing the characteristics of bothsets of ARMA models, we observe from
statistical tests that there is a considerable increase in the correlations and dependencies among the request patterns
from the 1998 Olympic Games. We suspect that this is probably due to the use of more complex Web pages with more
embedded images in the 1998 Olympic Web site. Additional details and results from our empirical analysis of the
1996 Olympic access logs can be found in [Iyengaret al. 1998a].
Figure 3 shows the number of requests received every five minutes by the entire Web site, as well as from
the three geographical areas, on a specific day. We observe that the three peaks in the overall traffic are primarily
due to the bursts of references from the three different geographical areas. In particular, the first peak is mostly due
to the burst of requests from Asia with Europe and the Americas contributing less traffic. The second, and largest,
14 Iyengar, Squillante, Zhang, Analysis of Web Server Access Patterns & Performance
Time Range phase 1 phase 2 phase 3 phase 4 full hour
Mean Request Rate (per sec)739.06855 778.44931 885.22983 790.06949 776.46206
Mean Interrequest Time (secs) 0.001353 0.001285 0.001130 0.001266 0.001288cvA 0.08156 0.05874 0.05589 0.06304 0.09531
ARIMA Order (1,0,2) (1,0,1) (1,0,1) (1,0,1) (2,0,2)
AR, Lag 1 0.93379 0.89556 0.88816 0.85055 1.76722
AR, Lag 2 0 0 0 0 -0.76741
MA, Lag 1 0.43863 0.57780 0.60750 0.46598 1.39975
MA, Lag 2 0.11325 0 0 0 -0.41680� 40.4722 37.3229 42.1189 39.7995 40.0500
Table 2: Piecewise analysis of the traffic data in Figure 2.
peak is primarily due to the bursts of traffic from both Asia and Europe, with the Americas contributing less requests.
The third, and widest, peak is mostly due to the bursts of requests from both Europe and the Americas, with Asia
contributing considerably less traffic.
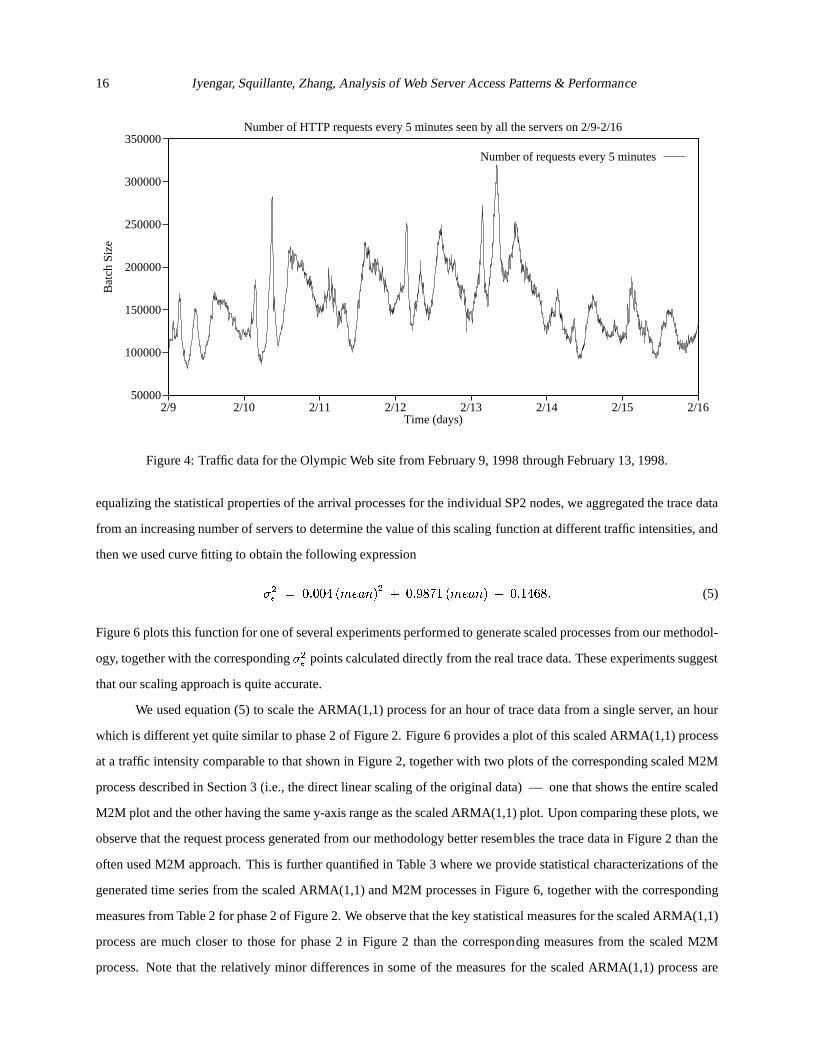
Figure 4 plots the number of requests received every five minutes by the entire Web site over a period of
one week. We observe considerable seasonal variations corresponding to daily cycles, where each day reflects the
three-peak behavior shown above. We also observe trends that exhibit varying patterns through the different days of
the week. In particular, from Monday (2/9) through Friday (2/13) we see an increasing trend in the traffic pattern
intensity, whereas the traffic pattern intensity decreases over the weekend, only to be repeated the next Monday (2/16).
This behavior is similarly found in other weeks, demonstrating seasonal variations that correspond to weekly cycles.
The above seasonal effects can be easily captured in our general methodology for analyzing and characterizing
Web access patterns by using seasonal ARIMA models for the set of time-series processes [Brockwell and Davis 1987;
Kendall and Ord 1990]. Seasonal models can be quite effective for predictingfuture behavior, as has been established
in other fields [Granger and Newbold 1986; Bowerman and O’Connell 1987;Brockwell and Davis 1987; Kendall and
Ord 1990]. Our methodology therefore can be used to examine various Webserver performance issues, including the
design and evaluation of more effective caching and prefetching algorithms,as confirmed by some of our preliminary
analysis in this area. A limiting factor in the accuracy of ARIMA-based prediction can often be the lack of sufficient
data [Bolot and Hoschka 1997]. This, however, is not a problem in our study, and given the increasing growth of the
World Wide Web, it is likely that sufficient data will be available for this purpose. We are currently further pursuing
this avenue of research.
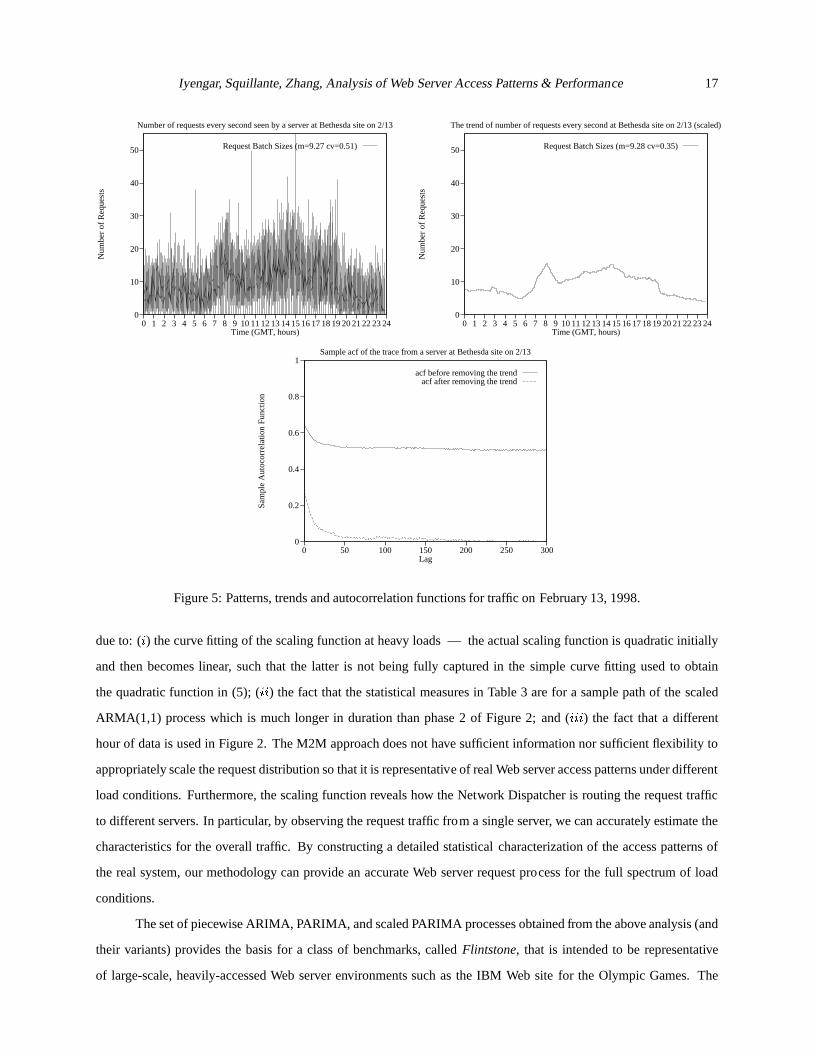
Our analysis of the access logs from the 1998 Olympic Web site providessome evidence for self-similarity in
the request patterns. To examine some of the causes of this behavior in more detail, we extracted the trend from various

Iyengar, Squillante, Zhang, Analysis of Web Server Access Patterns & Performance 15
120000
140000
160000
180000
200000
220000
240000
260000
280000
300000
320000
0 1 2 3 4 5 6 7 8 9 1011121314151617181920212223
Num
ber
of R
eque
sts
Time (GMT, hours)
Number of requests every 5 minutes seen by all the servers on 2/13
Request Batch Sizes (max=319472)
0
20000
40000
60000
80000
100000
120000
140000
0 1 2 3 4 5 6 7 8 9 1011121314151617181920212223
Num
ber
of R
eque
sts
Time (GMT, hours)
Number of requests every 5 minutes seen by all the servers for Asia on 2/13
Request Batch Sizes (max=137040)
0
20000
40000
60000
80000
100000
120000
140000
0 1 2 3 4 5 6 7 8 9 1011121314151617181920212223
Num
ber
of R
eque
sts
Time (GMT, hours)
Number of requests every 5 minutes seen by all the servers for Europe on 2/13
Request Batch Sizes (max=113505)
0
20000
40000
60000
80000
100000
120000
140000
0 1 2 3 4 5 6 7 8 9 1011121314151617181920212223
Num
ber
of R
eque
sts
Time (GMT, hours)
Number of requests every 5 minutes seen by all the servers for the Americas on 2/13
Request Batch Sizes (max=128273)
Figure 3: Traffic data for the Olympic Web site and for the different geographical areas on February 13, 1998.
portions of the traffic data and obtained the corresponding autocorrelation functions for both the original time series
and the same time series with the trend removed (i.e., the residuals). Figure 5 illustrates one example of this where we
have the original time series for one day, the trend we extracted for this series, and the corresponding autocorrelation
functions. We observe that the autocorrelation function for the residuals decays quite rapidly with increasing lag,
whereas the autocorrelation function for the original time series tends to flatten out at a considerably higher value.
This suggests that the burstiness, trends, interdependencies and seasonalbehavior in the request patterns of the Web
server environment under consideration may be a more dominant cause of any self-similar behavior found in the traffic
data rather than as the result of heavy-tailed distributions. However,we have subsequently incorporated heavy-tailed
behavior into our methodology [Squillanteet al. 1998].
We previously described the importance of scaling the Web request patterns to different traffic intensities.
One way to scale the ARMA processes to arbitrary request rates is to keep the ARand MA parameters constant.
Specifically, for ARMA(1,1) we setZi = �1Zi�1 + �i � �1�i�1, �i � N(0; �2� ) andBatchi = Zi + mean. We
also set�1 and�1 equal to their estimate from the access logs. The variance (�2� ) can then be scaled according to any
positive increasing functionf . Since our analysis shows that the set of ND routers has the effect of smoothing and
16 Iyengar, Squillante, Zhang, Analysis of Web Server Access Patterns & Performance
50000
100000
150000
200000
250000
300000
350000
2/9 2/10 2/11 2/12 2/13 2/14 2/15 2/16
Bat
ch S
ize
Time (days)
Number of HTTP requests every 5 minutes seen by all the servers on 2/9-2/16
Number of requests every 5 minutes
Figure 4: Traffic data for the Olympic Web site from February 9, 1998through February 13, 1998.
equalizing the statistical properties of the arrival processes for the individual SP2 nodes, we aggregated the trace data
from an increasing number of servers to determine the value of this scalingfunction at different traffic intensities, and
then we used curve fitting to obtain the following expression�2� = 0:004 (mean)2 + 0:9871 (mean) + 0:1468: (5)
Figure 6 plots this function for one of several experiments performed to generate scaled processes from our methodol-
ogy, together with the corresponding�2� points calculated directly from the real trace data. These experiments suggest
that our scaling approach is quite accurate.
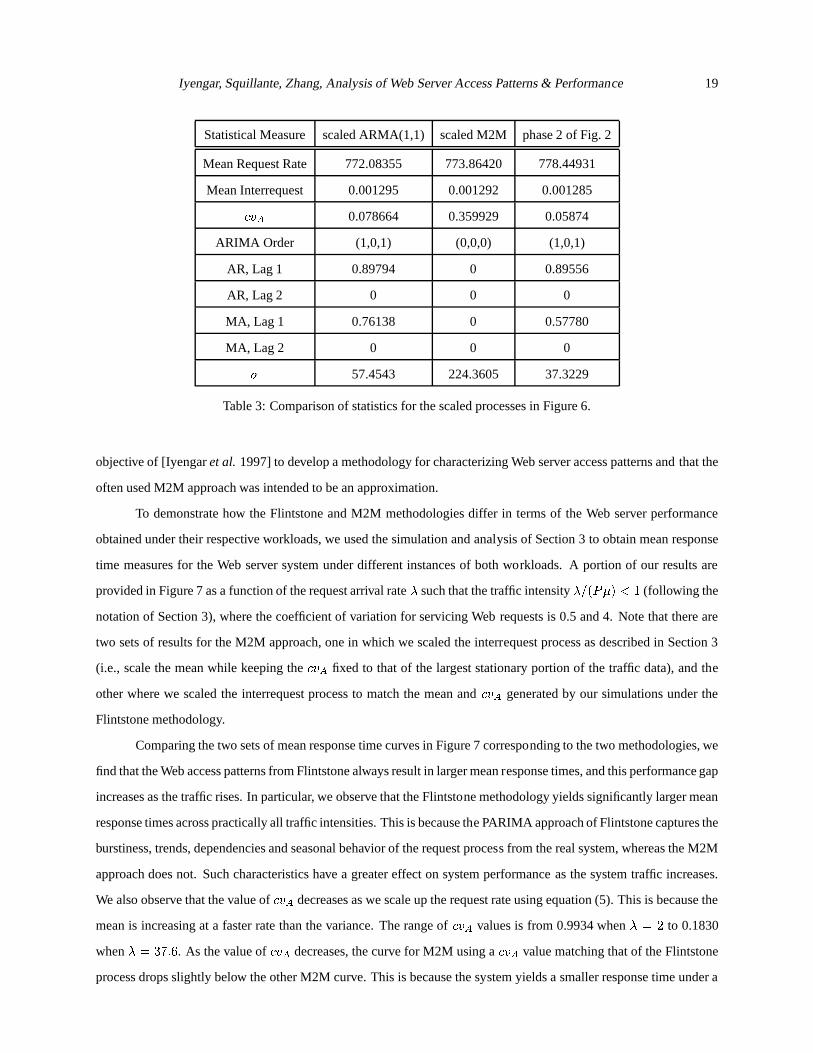
We used equation (5) to scale the ARMA(1,1) process for an hour of trace data from a single server, an hour
which is different yet quite similar to phase 2 of Figure 2. Figure 6 provides a plot of this scaled ARMA(1,1) process
at a traffic intensity comparable to that shown in Figure 2, together with two plots of the corresponding scaled M2M
process described in Section 3 (i.e., the direct linear scaling of the original data) — one that shows the entire scaled
M2M plot and the other having the same y-axis range as the scaled ARMA(1,1) plot. Upon comparing these plots, we
observe that the request process generated from our methodology better resembles the trace data in Figure 2 than the
often used M2M approach. This is further quantified in Table 3 where we provide statistical characterizations of the
generated time series from the scaled ARMA(1,1) and M2M processes in Figure6, together with the corresponding
measures from Table 2 for phase 2 of Figure 2. We observe that the key statistical measures for the scaled ARMA(1,1)
process are much closer to those for phase 2 in Figure 2 than the corresponding measures from the scaled M2M
process. Note that the relatively minor differences in some of the measuresfor the scaled ARMA(1,1) process are
Iyengar, Squillante, Zhang, Analysis of Web Server Access Patterns & Performance 17
0
10
20
30
40
50
0 1 2 3 4 5 6 7 8 9 101112131415161718192021222324
Num
ber
of R
eque
sts
Time (GMT, hours)
Number of requests every second seen by a server at Bethesda site on 2/13
Request Batch Sizes (m=9.27 cv=0.51)
0
10
20
30
40
50
0 1 2 3 4 5 6 7 8 9 101112131415161718192021222324
Num
ber
of R
eque
sts
Time (GMT, hours)
The trend of number of requests every second at Bethesda site on 2/13 (scaled)
Request Batch Sizes (m=9.28 cv=0.35)
0
0.2
0.4
0.6
0.8
1
0 50 100 150 200 250 300
Sam
ple
Aut
ocor
rela
tion
Fun
ctio
n
Lag
Sample acf of the trace from a server at Bethesda site on 2/13
acf before removing the trendacf after removing the trend
Figure 5: Patterns, trends and autocorrelation functions for traffic onFebruary 13, 1998.
due to: (i) the curve fitting of the scaling function at heavy loads — the actual scaling function is quadratic initially
and then becomes linear, such that the latter is not being fully captured in thesimple curve fitting used to obtain
the quadratic function in (5); (ii) the fact that the statistical measures in Table 3 are for a sample path of thescaled
ARMA(1,1) process which is much longer in duration than phase 2 of Figure 2; and (iii) the fact that a different
hour of data is used in Figure 2. The M2M approach does not have sufficient information nor sufficient flexibility to
appropriately scale the request distribution so that it is representative of real Web server access patterns under different
load conditions. Furthermore, the scaling function reveals how the Network Dispatcher is routing the request traffic
to different servers. In particular, by observing the request traffic from a single server, we can accurately estimate the
characteristics for the overall traffic. By constructing a detailed statisticalcharacterization of the access patterns of
the real system, our methodology can provide an accurate Web server request process for the full spectrum of load
conditions.
The set of piecewise ARIMA, PARIMA, and scaled PARIMA processes obtained from the above analysis (and
their variants) provides the basis for a class of benchmarks, calledFlintstone, that is intended to be representative
of large-scale, heavily-accessed Web server environments such as the IBM Web sitefor the Olympic Games. The

18 Iyengar, Squillante, Zhang, Analysis of Web Server Access Patterns & Performance
0
100
200
300
400
500
600
700
0 50 100 150 200 250 300
Var
ianc
e
Mean Load
Scaling function of variance w.r.t load
Fit y=0.004x^2+0.9871x+0.1468
0
200
400
600
800
1000
1200
1400
1600
0 500 1000 1500 2000 2500 3000 3500
Bat
ch S
ize
Time (seconds)
Generated M2M process, mean interarrival time=0.0013, cv=0.5875
Batch Size
400
500
600
700
800
900
1000
1100
1200
1300
0 500 1000 1500 2000 2500 3000 3500
Bat
ch S
ize
Time (seconds)
Generated ARMA process, mean interarrival time=0.0013, cv=0.0775
Batch Size
400
500
600
700
800
900
1000
1100
1200
1300
0 500 1000 1500 2000 2500 3000 3500
Bat
ch S
ize
Time (seconds)
Generated M2M process, mean interarrival time=0.0013, cv=0.5875
Batch Size
Figure 6: Scaled ARMA(1,1) and M2M processes, together with ARMA scalingfunction.
alternative M2M approach has been used in other studies to analyze and scale Web server access distributions to
evaluate Web server performance (e.g., [Iyengaret al. 1997]). This approach uses an i.i.d. sequence of interrequest
times that matches the mean andcvA, from which the batch size process can be obtained by counting the number
of requests within each second. It can be rigorously shown under general conditions that the batch sizes obtained in
this manner are i.i.d. for different time intervals, thus not capturing the trends, interdependencies and seasonal effects
observed from our empirical analysis of the 1998 Olympic Web site access logs.
It is well known that the first two moments are not sufficient to completely characterize a stochastic process
in general, and this is particularly the case for bursty processes. As a specific (simple) example, we note that the
value ofcvA for each phase in Table 2 is much smaller than thecvA value for the entire hour. This is because the
process is non-stationary and there are some phases for which the mean of the process shifts. The value ofcvA is very
sensitive to such shifts, as illustrated by the results in Table 2. Because it is based solely on the first two moments,
the M2M approach is not very robust with respect to characterizing a general stochastic arrival process, especially a
non-stationary process (i.e., one with non-negligible trends). Our Flintstone methodology, however, can be used to
accurately characterize the access patterns of the real Web server system. It is important to also note that it was not an
Iyengar, Squillante, Zhang, Analysis of Web Server Access Patterns & Performance 19
Statistical Measure scaled ARMA(1,1) scaled M2M phase 2 of Fig. 2
Mean Request Rate 772.08355 773.86420 778.44931
Mean Interrequest 0.001295 0.001292 0.001285cvA 0.078664 0.359929 0.05874
ARIMA Order (1,0,1) (0,0,0) (1,0,1)
AR, Lag 1 0.89794 0 0.89556
AR, Lag 2 0 0 0
MA, Lag 1 0.76138 0 0.57780
MA, Lag 2 0 0 0� 57.4543 224.3605 37.3229
Table 3: Comparison of statistics for the scaled processes in Figure 6.
objective of [Iyengaret al. 1997] to develop a methodology for characterizing Web server access patterns andthat the
often used M2M approach was intended to be an approximation.
To demonstrate how the Flintstone and M2M methodologies differ in terms of the Web server performance
obtained under their respective workloads, we used the simulation and analysis of Section 3 to obtain mean response
time measures for the Web server system under different instances of both workloads. A portion of our results are
provided in Figure 7 as a function of the request arrival rate� such that the traffic intensity�=(P�) < 1 (following the
notation of Section 3), where the coefficient of variation for servicing Webrequests is 0.5 and 4. Note that there are
two sets of results for the M2M approach, one in which we scaled the interrequest process as described in Section 3
(i.e., scale the mean while keeping thecvA fixed to that of the largest stationary portion of the traffic data), and the
other where we scaled the interrequest process to match the mean andcvA generated by our simulations under the
Flintstone methodology.
Comparing the two sets of mean response time curves in Figure 7 corresponding to the two methodologies, we
find that the Web access patterns from Flintstone always result in larger mean response times, and this performance gap
increases as the traffic rises. In particular, we observe that the Flintstone methodology yields significantly larger mean
response times across practically all traffic intensities. This is because the PARIMA approach of Flintstone captures the
burstiness, trends, dependencies and seasonal behavior of the request process from the real system, whereas the M2M
approach does not. Such characteristics have a greater effect on system performanceas the system traffic increases.
We also observe that the value ofcvA decreases as we scale up the request rate using equation (5). This is because the
mean is increasing at a faster rate than the variance. The range ofcvA values is from 0.9934 when� = 2 to 0.1830
when� = 37:6. As the value ofcvA decreases, the curve for M2M using acvA value matching that of the Flintstone
process drops slightly below the other M2M curve. This is because the system yields a smaller response time under a
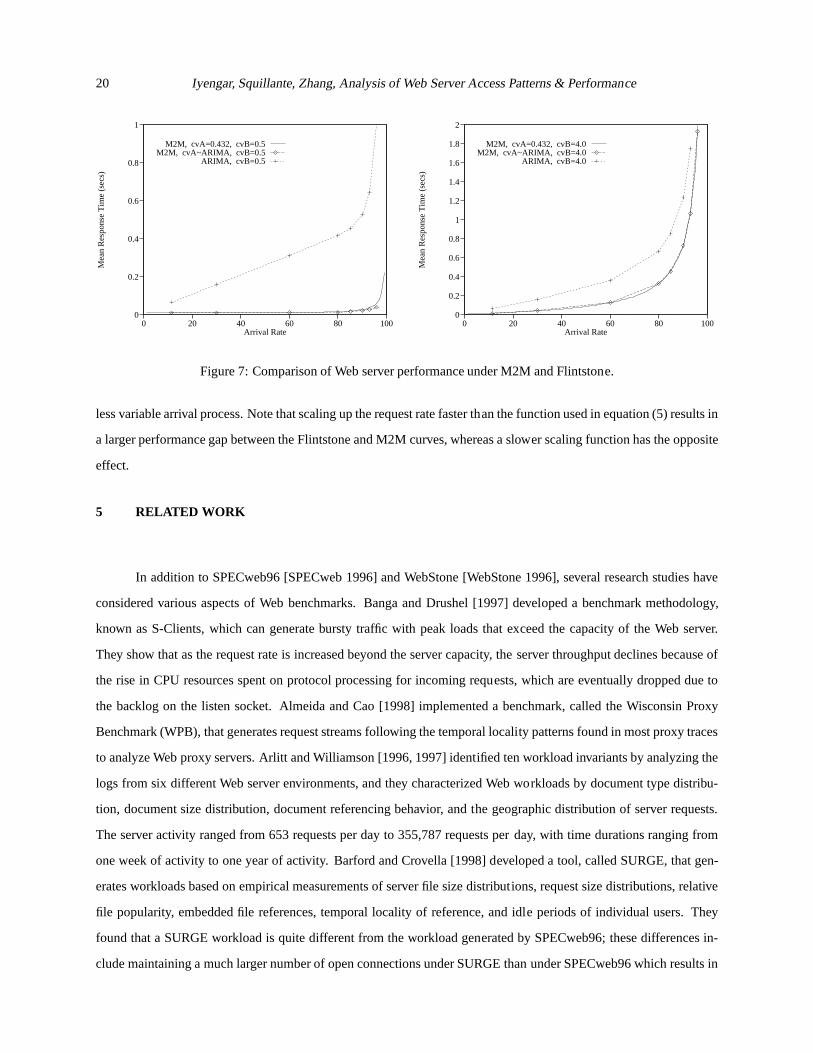
20 Iyengar, Squillante, Zhang, Analysis of Web Server Access Patterns & Performance
0
0.2
0.4
0.6
0.8
1
0 20 40 60 80 100
Mea
n R
espo
nse
Tim
e (s
ecs)
Arrival Rate
M2M, cvA=0.432, cvB=0.5M2M, cvA~ARIMA, cvB=0.5
ARIMA, cvB=0.5
0
0.2
0.4
0.6
0.8
1
1.2
1.4
1.6
1.8
2
0 20 40 60 80 100
Mea
n R
espo
nse
Tim
e (s
ecs)
Arrival Rate
M2M, cvA=0.432, cvB=4.0M2M, cvA~ARIMA, cvB=4.0
ARIMA, cvB=4.0
Figure 7: Comparison of Web server performance under M2M and Flintstone.
less variable arrival process. Note that scaling up the request rate faster than the function used in equation (5) results in
a larger performance gap between the Flintstone and M2M curves, whereas a slower scaling function has the opposite
effect.
5 RELATED WORK
In addition to SPECweb96 [SPECweb 1996] and WebStone [WebStone 1996], several research studies have
considered various aspects of Web benchmarks. Banga and Drushel [1997] developed a benchmark methodology,
known as S-Clients, which can generate bursty traffic with peak loads that exceed the capacity of the Web server.
They show that as the request rate is increased beyond the server capacity, theserver throughput declines because of
the rise in CPU resources spent on protocol processing for incoming requests, which are eventually dropped due to
the backlog on the listen socket. Almeida and Cao [1998] implemented a benchmark, called the Wisconsin Proxy
Benchmark (WPB), that generates request streams following the temporal locality patterns found in most proxy traces
to analyze Web proxy servers. Arlitt and Williamson [1996, 1997] identified ten workload invariants by analyzing the
logs from six different Web server environments, and they characterized Web workloads by document type distribu-
tion, document size distribution, document referencing behavior, and the geographic distribution of server requests.
The server activity ranged from 653 requests per day to 355,787 requests perday, with time durations ranging from
one week of activity to one year of activity. Barford and Crovella [1998] developed a tool, called SURGE, that gen-
erates workloads based on empirical measurements of server file size distributions, request size distributions, relative
file popularity, embedded file references, temporal locality of reference, and idle periods of individual users. They
found that a SURGE workload is quite different from the workload generated by SPECweb96; these differences in-
clude maintaining a much larger number of open connections under SURGE thanunder SPECweb96 which results in
Iyengar, Squillante, Zhang, Analysis of Web Server Access Patterns & Performance 21
a much higher CPU load. Courage and Manley [1998] implemented a self-configuring derivative of WebStone, called
WebStone-SS, whose request patterns and user characterizations are based on an analysis of real server logs and in-
clude the effects of CGI traffic, error traffic, and if-modified-since GET traffic. They use the WebStone-SS benchmark
to show that some CGI scripts can have a considerable impact on Web server load, thus increasing the response time of
all requests. Mosberger and Jin [1998] developed a tool, called httperf, that facilitates the construction of benchmarks
which include the ability to generate loads exceeding the server capacity, and that supports extensions to new workload
generators and performance measurements.
Our study differs from this previous research in several important ways. We considered a large-scale heavily-
accessed Web server environment that, to our knowledge, has not been considered inthe research literature, the likes
of which are becoming increasingly important and common. Moreover, we developed a general methodology for
empirically analyzing and characterizing the access patterns of such environments.Our methodology is quite different
from the approaches employed in the above previous studies. It provides the ability to scale Web server request traffic
in a general and flexible manner, which is particularly important given thecontinuing explosive growth of the World
Wide Web. It also provides the ability to make accurate predictions and capture seasonal behavior by exploiting aspects
of our methodology in ways that have been proven effective in other fields [Granger and Newbold 1986; Bowerman and
O’Connell 1987; Brockwell and Davis 1987; Kendall and Ord 1990]. This methodology is the basis for our Flintstone
class of benchmarks that is more accurate with respect to request patterns than the benchmarks described above for
the large-scale heavily-accessed environments of interest. We therefore view our research as being complementary to
the above previous studies that have considered other aspects of Web benchmarks. Furthermore, it should be possible
to combine our methodology with SPECweb96, WebStone, S-Clients, WPB, SURGE or WebStone-SS to obtain a
powerful and realistic tool for testing various aspects of Web server performance with realistic large-scale heavily-
accessed workloads.
A number of studies have found evidence that Web traffic is self-similar. Based on an analysis of the request
patterns at Boston University’s Department of Computer Science from January 17, 1995 to February 28, 1995, Crovella
and Bestavros [1997] present evidence that the distribution of Web document transmission times are self-similar,
possibly due to the distribution of Web document sizes, and that the distribution of browser silent times (i.e., when
they are not making requests) are heavy-tailed, possibly due to the influence of user “think time.” They argue that
self-similarity in Web traffic can be explained by these findings and the superposition of many such transfers in a
local-area network. The study of Arlitt and Williamson [1996, 1997]found that the sizes of requested documents
have a heavy tail similar to a Pareto distribution with� � 1, and that the overall interrequest times had heavier than
exponential tails. Their results also provide evidence, however, that the request patterns for individual documents have
an exponential tail, from which they conclude that successive requests forthe same Web document are exponentially
distributed and independent. Barford and Crovella [1998] have further shown that their SURGE benchmark generates
22 Iyengar, Squillante, Zhang, Analysis of Web Server Access Patterns & Performance
self-similar network traffic at heavy loads. This does not appear to be true for SPECweb96, and it results in SURGE
placing greater strain on the system than SPECweb96.
Once again, our research complements the related work above by providing an empirical analysis of a different
Web server environment in which the density of requests at the server was significantly higher than at any of the Web
sites in these previous studies. Moreover, as described in Section 4, ouranalysis of the real access patterns for the
1998 Olympic Games Web site suggests that the burstiness, trends, interdependencies and seasonal effects exhibited
in this request traffic may be a more dominant cause of any self-similar behavior found in the access logs of this
Web server environment, whereas heavy-tailed distributions appear to havea considerably less dominant effect. We
therefore focused in our study on developing and applying a methodology that combines a set of PARIMA time-series
processes in a general manner to capture what appears to be the dominant cause of any self-similarity in the large-
scale heavily-accessed Web site considered in this paper. Our empirical analysis, however, does appear to show some
heavy-tailed behavior in the request patterns, and in a more recent study [Squillanteet al. 1998] we incorporate such
heavy-tail behavior into the methodology developed in the present paper.
Bolot and Hoschka [1997] used basic ARMA models to examine the hourly variations in the number of requests
and bytes transferred in trace data from one of INRIA’s Web servers between November 1, 1994 and July 31, 1995.
Their results demonstrate the strong seasonal variations in these measures corresponding to the daily cycles one might
expect in such Web server environments, and they use these models in an attempt to forecast Web server load for
capacity planning. The predicted values reflect the daily variations observed inthe real data, but these predictions were
generally lower than the actual values by about 10% to 30%. The authors notedthat their ability to make medium- and
long-term forecasts was limited by insufficient trace data to capture the long-term growth of Web traffic and yearly
cycles. Our study differs from this paper in several ways. We use a moregeneral methodology to empirically analyze
the Web access patterns, and we demonstrate some of the advantages of our approach over those used in [Bolot and
Hoschka 1997]. We also consider a very different Web server environment, for which we have a considerable amount
of data that can be used to evaluate various approaches for exploiting aspectsof our methodology to make medium-
and long-term forecasts. Our results are also quite different, likely due to the considerably different environment
considered. This includes seasonal variations reflecting both daily and weeklycycles.
6 DISCUSSION AND CONCLUSION
In this paper we have presented a general methodology for analyzing and characterizing large-scale heavily-
accessed Web server access patterns based on time-series analysis, from which more accurate and effective benchmarks
can be obtained for evaluating Web server performance. By decomposing the time-series analysis into piecewise time-
series processes and combining these processes in an appropriate manner, we obtained a very general and accurate

Iyengar, Squillante, Zhang, Analysis of Web Server Access Patterns & Performance 23
methodology for characterizing Web server access patterns. Moreover, our statistical representation of these access
patterns makes it possible to scale the Web server traffic in an appropriate manner so that Web server performance
can be examined at all traffic intensities of interest, which cannot be performed correctly without such a detailed
characterization of the trends, interdependencies, seasonal behavior and noisein the access patterns.
Our methodology was applied to the access logs from the IBM Web site for the 1998 Nagano Olympic Games,
and the resulting Flintstone class of benchmarks was shown to exhibitconsiderable advantages over previous methods
with respect to accurately characterizing the traffic patterns, accurately scaling these patterns to consider different
server loads, and the impact of such issues on overall Web server performance. Given this detailed characterization of
Web server access patterns, an empirical analysis based on our methodology was thenused to provide insights and a
better understanding of these traffic patterns for an important Web server environment that has received little attention
in the research literature.
Our methodology for analyzing and characterizing Web server access patterns can be applied to a number
of additional practical problems. One such example concerns the predictionof future traffic at a Web site. Simple
projections based on future growth of the Web would at best be adequate for predicting average request rates. Such
projections would inadequately predict burstiness, interdependencies, seasonal effects and peak request rates. In order
to achieve consistently fast response times, it is necessary to have adequate capacity to handle peak request periods. By
using our statistical methods to isolate and characterize the trends, interdependencies, seasonal behavior and noise in
the access patterns, each of which may scale differently, we believe that Flintstone provides a more effective approach
for predicting peak request rates than previously proposed approaches for analyzing and characterizing Web access
patterns. Consequently, the resources needed to handle Web traffic at a particular site in the future can be estimated
more accurately.
In particular, we are pursuing the use of Flintstone to aid us in predicting the request rates and patterns that
will be received by the official Web site for the 2000 Olympic Summer Games. This Web site may set world records
for request rates, as did the 1998 Olympic Games Web site. In order to make our predictions, we will exploit our
analysis of the Web logs from both the 1996 and 1998 Olympic Games presented in this paper. Even though the Web
has changed considerably since 1996, the 1996 access logs are still important because they correspond to Summer
Olympic Games. We will also consider general growth in Web traffic as well as Web page design in making our
predictions. The latter can have a significant impact on the hits received by asite [Challengeret al. 1998]. Our
predictions will be used to determine the type of capacity the 2000 Olympic Games Web site will need.
Another application of Flintstone would be for generating realistic workloads for benchmarking Web servers.
As we previously mentioned, commonly used benchmarks such as SPECweb96 and WebStone fail to generate inter-
request times that are based on actual Web request data. In contrast, Flintstonegenerates request data that reflects the
trends, burstiness, interdependencies and seasonal behavior which occur in real situations. Flintstone also generates

24 Iyengar, Squillante, Zhang, Analysis of Web Server Access Patterns & Performance
request traffic that can be scaled to different arrival rates. Consequently, Flintstone can be used to benchmark Web
server performance across a wide variety of traffic intensities.
Flintstone can also be used to generate request distributions that are customized for specific Web logs. In order
to benchmark a Web site in a manner tailored to the request traffic received by the site, the Flintstone methodology
would be applied to characterize the Web logs from the site. Flintstone would then be used to generate a request
distribution (or possibly several request distributions with different average arrival rates) from the Web logs which
could then be fed into a benchmark tool for measuring the performance of the Web server.
Caching and prefetching are both techniques to hide latency, but there is a complex tradeoff between caching
and prefetching — if the system prefetches too aggressively then it adversely affects caching, and if it does not
prefetch enough then the system must incur the full fetch latency. The tension between caching and prefetching
and its associated tradeoffs are particularly important in Internet application environments, as the potential benefits
of such methods can be quite significant. We note that optimal algorithms have been developed for these types of
problems [Kimbrel and Karlin 1996]. These algorithms, however, require the availability of some form of advance
knowledge of future data requests. Flintstone can be used to provideaccurate estimates of this information for each
Web page by exploiting aspects of our methodology in ways that have been proven effective in other fields [Granger
and Newbold 1986; Bowerman and O’Connell 1987; Brockwell and Davis 1987; Kendall and Ord 1990]. For example,
time-series models based on our methodology could be constructed on-line and dynamically adjusted for each Web
page. These models are then used to predict the next request(s) (as well as other events, e.g., updates) for the page in
the near future. Such predictions are then used for the optimal caching and prefetching algorithms to minimize latency.
Acknowledgements
We thank Jim Challenger, Paul Dantzig, Dan Dias, Tracy Kimbrel, Ed MacNair andDavid Yao for various
fruitful discussions regarding the research described in this paper. Wealso thank Jim Challenger for his help with the
access logs from the 1996 and 1998 Olympic Games.
REFERENCES
Almeida, J. and P. Cao (1998), “Wisconsin Proxy Benchmark 1.0,” http://www.cs.wisc.edu/ cao/wpb1.0.html.
Arlitt, M. F. and C. L. Williamson (1996), “Web Server Workload Characterization: The Search for Invariants,” In
Proceedings of the ACM Sigmetrics Conference on Measurement and Modeling ofComputer Systems, pp. 126–
137.
Arlitt, M. F. and C. L. Williamson (1997), “Internet Web Servers: Workload Characterization and Performance Impli-
cations,”IEEE/ACM Transactions on Networking 5, 5, 631–645.
Iyengar, Squillante, Zhang, Analysis of Web Server Access Patterns & Performance 25
Asmussen, S. (1997), “Phase-Type Distributions and Related Point Processes: Fitting and Recent Advances,” In
Matrix-Analytic Methods in Stochastic Models, S. R. Chakravarthy and A. S. Alfa, Eds., Marcel Dekker, pp.
137–149.
Banga, G., F. Douglis, and M. Rabinovich (1997), “Optimistic Deltas for WWW Latency Reduction,” InProceedings
of the USENIX 1997 Technical Conference.
Banga, G. and P. Druschel (1997), “Measuring the Capacity of a Web Server,” InProceedings of the Usenix Symposium
on Internet Technologies and Systems, pp. 61–72.
Barford, P. and M. E. Crovella (1998), “Generating Representative Web Workloads for Network and Server Perfor-
mance Evaluation,” InProceedings of the ACM Sigmetrics Conference on Measurement and Modeling ofComputer
Systems, pp. 151–160.
Basseville, M. and I. Nikiforov (1992),Detection of Abrupt Changes: Theory and Application, Prentice Hall.
Bestavros, A. (1995), “Using Speculation to Reduce Server Load and ServiceTime on the WWW,” InProceedings of
the 4th International Conference on Information and Knowledge Management.
Bolot, J. and P. Hoschka (1997), “Performance Engineering of the WorldWide Web: Application to Dimensioning
and Cache Design,”World Wide Web Journal, 185–195.
Bowerman, B. L. and R. T. O’Connell (1987),Time Series Forecasting: Unified Concepts and Computer Implementa-
tion, Duxbury Press, Boston.
Brockwell, P. J. and R. A. Davis (1987),Time Series: Theory and Methods, Springer-Verlag.
Caceres, R., F. Douglis, A. Feldmann, G. Glass, and M. Rabinovich (1998), “Web Proxy Caching: The Devil is in the
Details,” InProceedings of the Internet Server Performance Workshop, pp. 111–118.
Cao, P. and S. Irani (1997), “Cost-Aware WWW Proxy Caching Algorithms,” In Proceedings of the Usenix Symposium
on Internet Technologies and Systems, pp. 193–206.
Challenger, J., P. Dantzig, and A. Iyengar (1998), “A Scalable and Highly Available System for Serving Dynamic Data
at Frequently Accessed Web Sites,” InProceedings of SC’98.
Challenger, J., A. Iyengar, and P. Dantzig (1999), “A Scalable System for Consistently Caching Dynamic Web Data,”
In Proceedings of INFOCOM’99.
Chankhunthod, A., P. B. Danzig, C. Neerdaels, M. F. Schwartz, and K. J. Worrell (1996), “A Hierarchical Internet
Object Cache,” InProceedings of the 1996 USENIX Technical Conference, pp. 153–163.
Courage, M. and S. Manley (1998), “An Evaluation of CGI Traffic and Its Effect on WWW Latency,” http://www.eecs.
harvard.edu/ vino/web/hbench-web.
Crovella, M. E. and A. Bestavros (1997), “Self-Similarity in World Wide Web Traffic: Evidence and Possible Causes,”
IEEE/ACM Transactions on Networking 5, 6, 835–845.
Cunha, C. R. and C. F. B. Jaccoud (1997), “Determining WWW User’s Next Access and Its Application to Prefetch-

26 Iyengar, Squillante, Zhang, Analysis of Web Server Access Patterns & Performance
ing,” In Proceedings of the International Symposium on Computers and Communications.
Dias, D., W. Kish, R. Mukherjee, and R. Tewari (1996), “A Scalable and Highly Available Web Server,” InProceedings
of the 1996 IEEE Computer Conference (COMPCON).
Douglis, F., A. Feldmann, B. Krishnamurthy, and J. Mogul (1997a),“Rate of Change and other Metrics: a Live Study
of the World Wide Web,” InProceedings of the Usenix Symposium on Internet Technologies and Systems, pp.
147–158.
Douglis, F., A. Haro, and M. Rabinovich (1997b), “HPP: HTML Macro-Preprocessing to Support Dynamic Document
Caching,” InProceedings of the Usenix Symposium on Internet Technologies and Systems, pp. 83–94.
Duska, B. M., D. Marwood, and M. J. Feeley (1997), “The Measured Access Characteristics of World-Wide-Web
Client Proxy Caches,” InProceedings of the Usenix Symposium on Internet Technologies and Systems, pp. 23–36.
Feldmann, A. and W. Whitt (1998), “Fitting Mixtures of Exponentialsto Long-Tail Distributions to Analyze Network
Performance Models,”Performance Evaluation 31, 245–279.
Gadde, S., J. Chase, and M. Rabinovich (1998), “A Taste of Crispy Squid,” In Proceedings of the Internet Server
Performance Workshop, pp. 129–136.
Granger, C. and P. Newbold (1986),Forecasting Economic Time Series, Academic Press, New York.
Gribble, S. D. and E. A. Brewer (1997), “System Design Issues for Internet Middleware Services: Deductions from a
Large Client Trace,” InProceedings of the Usenix Symposium on Internet Technologies and Systems, pp. 207–218.
Gwertzman, J. and M. Seltzer (1996), “World-Wide Web Cache Consistency,”In Proceedings of the 1996 USENIX
Technical Conference, pp. 141–151.
Hu, J., I. Pyarali, and D. Schmidt (1997), “Measuring the Impact of Event Dispatching and Concurrency Models on
Web Server Performance Over High-speed Networks,” InProceedings of GLOBECOM ’97, pp. 1924–1931.
Hunt, G., G. Goldszmidt, R. King, and R. Mukherjee (1998), “NetworkDispatcher: A Connection Router for Scalable
Internet Services,” InProceedings of the 7th International World Wide Web Conference.
Iyengar, A. and J. Challenger (1997), “Improving Web Server Performance by Caching Dynamic Data,” InProceedings
of the Usenix Symposium on Internet Technologies and Systems, pp. 49–60.
Iyengar, A., E. MacNair, and T. Nguyen (1997), “An Analysis of Web Server Performance,” InProceedings of GLOBE-
COM ’97, pp. 1943–1947.
Iyengar, A. K., E. A. MacNair, M. S. Squillante, and L. Zhang (1998a), “A General Methodology for Characterizing
Access Patterns and Analyzing Web Server Performance,” InProceedings of the International Symposium on
Modeling, Analysis, and Simulation of Computer and Telecommunication Systems (MASCOTS), pp. 167–174.
Iyengar, A. K., M. S. Squillante, and L. Zhang (1998b), “Analysis and Characterization of Large-Scale Web Server
Access Patterns and Performance,” Technical Report RC 21328, IBM Research Division.
Jagerman, D. L. and B. Melamed (1992), “The Transition and AutocorrelationStructure of TES Processes Part I:
Iyengar, Squillante, Zhang, Analysis of Web Server Access Patterns & Performance 27
General Theory,”Stochastic Models 8, 2, 193–219.
Kendall, M. and J. Ord (1990),Time Series, Oxford University Press.
Kimbrel, T. and A. R. Karlin (1996), “Near-optimal parallel prefetching andcaching,” InProceedings of the IEEE
Symposium on Foundations of Computer Science.
Krishnamurthy, B. and C. E. Wills (1997), “Study of Piggyback Cache Validation for Proxy Caches in the World Wide
Web,” In Proceedings of the Usenix Symposium on Internet Technologies and Systems, pp. 1–12.
Kroeger, T. M., D. D. E. Long, and J. C. Mogul (1997), “Exploring the Bounds of Web Latency Reduction from
Caching and Prefetching,” InProceedings of the Usenix Symposium on Internet Technologies and Systems, pp.
13–22.
Liu, Y. H., P. Dantzig, C. E. Wu, J. Challenger, and L. M. Ni (1996), “ADistributed Web Server and its Performance
Analysis on Multiple Platforms,” InProceedings of the International Conference for Distributed Computing Sys-
tems.
Loon, T. S. and V. Bharghavan (1997), “Alleviating the Latency and Bandwidth Problems in WWW Browsing,” In
Proceedings of the Usenix Symposium on Internet Technologies and Systems, pp. 219–230.
Mogul, J., F. Douglis, A. Feldmann, and B. Krishnamurthy (1997),“Potential Benefits of Delta-Encoding and Data
Compression for HTTP,” InProceedings of ACM SIGCOMM’97, pp. 181–194.
Mosberger, D. and T. Jin (1998), “httperf – A Tool for Measuring Web Server Performance,” InProceedings of the
Internet Server Performance Workshop, pp. 59–67.
Mosedale, D., W. Foss, and R. McCool (1997), “Lessons Learned Administering Netscape’s Internet Site,”IEEE
Internet Computing 1, 2, 28–35.
Nabeshima, M. (1997), “The Japan Cache Project: An Experiment on Domain Cache,”In Sixth International World
Wide Web Conference Proceedings.
Niclausse, N., Z. Liu, and P. Nain (1998), “A New Efficient Caching Policyfor the World Wide Web,” InProceedings
of the Internet Server Performance Workshop, pp. 119–128.
Padmanabhan, V. N. and J. C. Mogul (1996), “Using Predictive Prefetching toImprove World Wide Web Latency,”
Computer Communications Review 26, 22–36.
Scheuermann, P., J. Shim, and R. Vingralek (1997), “A Case for Delay-Conscious Caching of Web Documents,” In
Sixth International World Wide Web Conference Proceedings.
SPECweb (1996),SPECweb96 Benchmark, System Performance Evaluation Cooperative (SPEC).
Squillante, M. S. (1998), “A Matrix-Analytic Approach to a General Class of G/G/c Queues,” Technical report, IBM
Research Division.
Squillante, M. S., D. D. Yao, and L. Zhang (1998), “Web Traffic Modeling and Web Server Performance Analysis,”
Technical report, IBM Research Division.

28 Iyengar, Squillante, Zhang, Analysis of Web Server Access Patterns & Performance
WebStone (1996),World Wide Web Server Benchmarking, Silicon Graphics, Inc.
Williams, S., M. Abrams, C. R. Standridge, G. Abdulla, and E. A. Fox (1996), “Removal Policies in Network Caches
for World-Wide Web Documents,” InProceedings of SIGCOMM ’96, pp. 293–305.
Wooster, R. P. and M. Abrams (1997), “Proxy Caching That Estimates Page Load Delays,” InSixth International
World Wide Web Conference Proceedings.
Yeager, N. J. and R. E. McGrath (1996),Web Server Technology, Morgan Kaufmann Publishers, Inc., San Francisco,
CA.
Yoshida, A. (1997), “MOWS: Distributed Web and Cache Server in Java,” InSixth International World Wide Web
Conference Proceedings.
Copyright © 2022 FDOKUMEN