ANALYSING KNOWLEDGE SHARING INTENSITY USING ORGANISATIONAL NETWORK ANALYSIS IN HIGHER LEARNING...
14
International Journal of Information Technology and Business Management 29 th July 2014. Vol.27 No.1 © 2012- 2014 JITBM & ARF. All rights reserved ISSN 2304-0777 www.jitbm.com 38 ANALYSING KNOWLEDGE SHARING INTENSITY USING ORGANISATIONAL NETWORK ANALYSIS IN HIGHER LEARNING INSTITUTIONS: A CASE OF THE UNIVERSITY OF KIGALI (UOK) Tinega Haron Chweya 1 Lecturer in the Department of Information Technology, School of Pure and Applied Sciences, Mount Kenya University (MKU), Rwanda. [email protected] Dr. kerosi Josephat Bosire 2 Senior lecturer department of finance, Faculty of Business and management, University of Kigali (Rwanda) [email protected] Ondwari Daisy Nyanganyi 3 Lecturer in the Department of Information Technology, Faculty of Science and Technology, University Of Kigali (UOK), Rwanda. [email protected] Abstract: Knowledge sharing has been distinguished as a key enabler in leveraging knowledge management in organizations. Leaving knowledge in tacit form may prevent organizations such as Higher Learning Institutions from competing as the Institutions risk losing tacit knowledge when an individual in possession of such knowledge becomes incapacitated, retires from their position, gets hired by their competitor or even dies. It is in this viewpoint that this research identified the knowledge sharing among the academic staff as the core process in achieving efficiency in the University of Kigali (UOK). This paper seeks to show the knowledge sharing patterns among the academic staff and the frequency with which the academic staff share knowledge. The results can provide information to the management in providing the infrastructure, activities or programmes as well as systems of rewards and recognition that can increase the intensity of knowledge sharing. A case study was conducted on all the fourteen (14) fulltime staff in the University Of Kigali (OUK). Since the number of the fulltime academic staff is small, this research used censors to find the sample size. The questionnaire, as an instrument for data collection was distributed on all the 14 fulltime academic staff of the University Of Kigali and the results was analyzed using UNICET to find the frequency and intensity of knowledge sharing among the academic staffs in the University of Kigali (UOK). From the findings, it can be observed that the frequency with which the academic staff conducts knowledge sharing is low (in every few weeks). Therefore there is a need to understand the factors that contribute to low knowledge sharing intensity in Higher Learning Institutions such as the University of Kigali (UOK). Keywords: Higher Learning Institutions, Fulltime Academic Staff, Intensity of Knowledge Sharing, Social Network Analysis, Organisational Network Analysis. 1.0 INTRODUCTION Knowledge has always been a precious commodity within organizations and it can be defined as the ability of people and organizations to understand and act effectively [23]. Knowledge not only helps both the individuals and organizations to cope with routine
-
Upload
independent -
Category
Documents
-
view
10 -
download
0
Transcript of ANALYSING KNOWLEDGE SHARING INTENSITY USING ORGANISATIONAL NETWORK ANALYSIS IN HIGHER LEARNING...
International Journal of Information Technology and Business Management 29
th July 2014. Vol.27 No.1
© 2012- 2014 JITBM & ARF. All rights reserved
ISSN 2304-0777 www.jitbm.com
38
ANALYSING KNOWLEDGE SHARING INTENSITY USING
ORGANISATIONAL NETWORK ANALYSIS IN HIGHER LEARNING
INSTITUTIONS: A CASE OF THE UNIVERSITY OF KIGALI (UOK)
Tinega Haron Chweya
1
Lecturer in the Department of Information Technology, School of Pure and Applied Sciences, Mount Kenya
University (MKU), Rwanda.
Dr. kerosi Josephat Bosire2
Senior lecturer department of finance, Faculty of Business and management, University of Kigali (Rwanda)
Ondwari Daisy Nyanganyi3
Lecturer in the Department of Information Technology, Faculty of Science and Technology, University Of Kigali
(UOK), Rwanda.
Abstract:
Knowledge sharing has been distinguished as a key enabler in leveraging knowledge management in organizations.
Leaving knowledge in tacit form may prevent organizations such as Higher Learning Institutions from competing as
the Institutions risk losing tacit knowledge when an individual in possession of such knowledge becomes
incapacitated, retires from their position, gets hired by their competitor or even dies. It is in this viewpoint that this
research identified the knowledge sharing among the academic staff as the core process in achieving efficiency in
the University of Kigali (UOK). This paper seeks to show the knowledge sharing patterns among the academic staff
and the frequency with which the academic staff share knowledge. The results can provide information to the
management in providing the infrastructure, activities or programmes as well as systems of rewards and recognition
that can increase the intensity of knowledge sharing. A case study was conducted on all the fourteen (14) fulltime
staff in the University Of Kigali (OUK). Since the number of the fulltime academic staff is small, this research used
censors to find the sample size. The questionnaire, as an instrument for data collection was distributed on all the 14
fulltime academic staff of the University Of Kigali and the results was analyzed using UNICET to find the frequency
and intensity of knowledge sharing among the academic staffs in the University of Kigali (UOK). From the findings,
it can be observed that the frequency with which the academic staff conducts knowledge sharing is low (in every few
weeks). Therefore there is a need to understand the factors that contribute to low knowledge sharing intensity in
Higher Learning Institutions such as the University of Kigali (UOK).
Keywords: Higher Learning Institutions, Fulltime Academic Staff, Intensity of Knowledge Sharing, Social
Network Analysis, Organisational Network Analysis.
1.0 INTRODUCTION
Knowledge has always been a precious commodity
within organizations and it can be defined as the
ability of people and organizations to understand and
act effectively [23]. Knowledge not only helps both
the individuals and organizations to cope with routine

International Journal of Information Technology and Business Management 29
th July 2014. Vol.27 No.1
© 2012- 2014 JITBM & ARF. All rights reserved
ISSN 2304-0777 www.jitbm.com
39
situations, it also equips us to deal with new
situations, anticipate outcomes, and improvise when
needed [19]. Organizations that need to grow,
compete, and function in an ever evolving
environment, naturally do not leave the development
of precious knowledge within the organization to
chance. The exchange of information and knowledge
among employees is a vital part of the field known as
knowledge management [3]. To facilitate knowledge
management the management of organizations will
introduce incentives to promote innovation, learning,
and effective knowledge sharing [19].
Sharing is a natural thing to do for everyone, but
knowledge sharing within organizations is a complex
matter. In order to advance the goals of an
organization, individuals must move their knowledge
to the level of groups or organization (Ipe, 2003).
Knowledge exists at multiple levels, and even while
individuals are only one level, their sharing is
imperative to management and creation at all levels
within the organization. Once knowledge has been
moved to the organizational level it can be converted
into economic value. The organization is not the only
one to benefit, individuals sharing knowledge
contributes to both individual and organizational
learning.
Knowledge sharing relies on the willingness of
individual professionals to share with others. Because
people tend to hoard their knowledge, the
transformation from individual to organizational
knowledge is not easy. Organizations cannot force
their employees to do so. The headquarters of an
organization tried to control its subunits, but the more
control it exercised, the less knowledge was being
shared [17]. What organizations can do though is
facilitate and encourage knowledge sharing. In order
to do so, insight into what motivates professionals is
needed [2].
Organizational performance today is primarily a
result of the effectiveness of cross functional
processes (Rummler & Brache, 1995). Leaders must
accept the ambiguity of today’s organizations
(Parkhe, Wasserman, & Ralston, 2006; Weick, 1979)
and find ways to visualize, explain, shape and align
organizations around the mission, values, vision and
strategy. Using structure to articulate the intent of the
organization creates a challenge for leaders because it
creates a perception of stability, and humans have a
general need for certainty, routine and predictability.
However, especially in knowledge-intensive
organizations such as higher learning institutions,
people and information need to be brought together
in adaptable and flexible ways (Charan, 1999; Cross
& Parker, 2004; [13]. Conceptualizing organizations
as social communities in which knowledge is
structured, coordinated, and shared is central to
understanding knowledge sharing behavior in
organizations [11] Organizations are knit together by
ties of a complex and diverse nature. Ties can differ
according to whether they are based on friendship,
work, or advice; and whether what flow through them
are resources, information, knowledge or affection;
whether they are face-to-face or electronic among
others. The substance and type of ties in a network
can have important implications for action [13].
Organisational Network Analysis (ONA)
Typically, formal relationships are documented with
job descriptions and organizational charts. Every
organization also has its informal networks – people
who know each other and help each other regardless
of rank, function, job title, etc. (Greenburgh, 1983).
[9] differentiates between prescribed networks and
emergent networks in organizations. He defined
prescribed networks as those that are composed of a
set of formally specified relationships between
superiors and subordinates and among functionally
differentiated groups that must interact to accomplish
an organizationally defined task. Emergent networks,
on the other hand, involve informal, discretionary
patterns of interaction where the content of the
relationship may be work related, social, or a
combination of both. The emergent network,
Galaskiewicz (1979) explains, ‘‘develops out of the
purposive action of social actors who seek to realize
their self interest, and depending on their abilities and
interest, will negotiate routinized patterns of
relationships that enhance their interests’’.
Research on knowledge sharing within organizations
has showed that 73% of people share their knowledge
actively and regularly. Only 30% moves knowledge
outside the small personal network [10]. With two
third of professionals keeping their knowledge close
by, and a quarter not actively sharing any knowledge
at all, the learning organization seems a bit cripple.
Lew Platt, former CEO of Hewlett Packard, once
said: “If HP knew what HP knows, we would be
three times as profitable.” The shared awareness
among individuals about who knows what – that is
lacking at HP and probably other organizations – is
called transactive memory. Jackson and Klobas
(2010) developed a set of questions that measure the
transactive memory of an organization. Another

International Journal of Information Technology and Business Management 29
th July 2014. Vol.27 No.1
© 2012- 2014 JITBM & ARF. All rights reserved
ISSN 2304-0777 www.jitbm.com
40
dimension of knowledge sharing is about the people
that do the sharing. With whom do professionals
exchange information and knowledge? As mentioned
before, 70% keeps knowledge within a small circle.
This however leads to redundancy in ideas, for
people that work closely together tend to think alike.
[6] has argued that relationships between members of
different groups bring forth a diversity of ideas,
because people will connect different thoughts. He
called this ‘the strength of weak ties’. The sort of
knowledge shared can be explicit and transmittable in
formal language (Lee, 2001). Especially operational
or routine knowledge is concrete and can easily be
communicated [23]. Tacit knowledge on the other
hand is context-specific and personal, and therefore
difficult to formalize and communicate (Lee, 2001).
So there we are, the scholars and professionals in the
field of knowledge sharing are faced with the
challenge to get people to share all kinds of
knowledge with a wide circle and to find useful
knowledge with the right people at the right place.
1.1 Knowledge Sharing in Higher
Learning Institutions (HLIs)
Higher Learning Institutions (HLIs) are bestowed
with an important responsibility of managing
knowledge production, distribution and apply the
knowledge acquired to efficiently respond to the
constantly changing environment. Therefore, HLIs
are not only required to create knowledge quickly but
also acquire and apply it swiftly in order to gain the
competitive edge (Syed-Ikhsan and Rowland, 2004;
Yang, 2007) hence making knowledge sharing an
inevitably important task for members of Higher
Learning Institutions (HLIs) in knowledge
management. Unfortunately, studies in knowledge
sharing (KS) among the academic staff in the
knowledge-based institution such as Higher Learning
Institutions (HLIs) are minimal in number [4]. The
dearth of research on knowledge management is
more pronounced in Higher Learning Institutions
(HLIs) of developing nations, where there is a low
level of research output. A World Bank report [15]
shows that in the year 2005, only 3563 (2.7%) of the
scientific publications from around the world are
from Sub-Saharan Africa (2009:56). Increasing
student enrollment, however, has placed huge
teaching demands on academics, in terms of person-
hours they spend in teaching. Moreover, lack of
understanding of how best to share knowledge, has
adversely affected faculty’s tendency to engage in
knowledge sharing activities; as a result of which
professors are now more inclined to give service to
the overwhelming student population, when possible
by earning additional income from teaching extra
hours [1] Generally, research output in terms of
publications (books, reviewed journals), engagement
in research projects, and the culture and competence
to create and hold venues for intellectual debate and
discussions has not generally flourished [1] in
developing nations such as Rwanda and these can be
attributed to lack of understanding on the factors that
affect knowledge sharing among the employees. On
the whole, the poor incentive system for research, the
inadequate orientation for problem-based research
collaboration, the preferred engagement of the
academics for teaching rather than research and the
general weak knowledge infrastructure [16] that
supports scientific exploration are attributed as major
limitations of the system that constrain the conduct of
research as has been reported by the World Bank
tertiary education report on Sub-Saharan countries
(2009).
Strengths of ties in knowledge sharing Dimensions of strength [6], a pioneering student of
social networks, stated that weak ties are efficient for
knowledge sharing because they provide access to
novel information and people that would otherwise
be disconnected from the group seeking knowledge.
Strong ties or relationships he thought hindered new
information and new enterprise knowledge because
such relationships are comprised of small groups of
actors who already know what everyone knows.
Subsequent research has generally supported
Granovetter’s theory, but switched the emphasis to
the effective character of strong ties [12]. The
strength of an interpersonal connection was found to
affect how easily knowledge is shared [18][7] Other
research found that employees who communicate
with each other frequently or who have a strong
emotional attachment are more likely to share
knowledge than those who communicate infrequently
or who are not emotionally attached. This study will
use Social Network Analysis (SNA) tool called
Unicet to measure the association between the
strength of different types of ties with the intensity of
knowledge sharing behavior. Social Network
Analysis (SNA) is an approach, process and set of
tools that reveals networks and patterns of
relationships between individuals or entities (Cross,

International Journal of Information Technology and Business Management 29
th July 2014. Vol.27 No.1
© 2012- 2014 JITBM & ARF. All rights reserved
ISSN 2304-0777 www.jitbm.com
41
Borgatti, Parker, 2002). When used to examine
organizational relationships and patterns, it is often
called Organizational Network Analysis (ONA).
ONA reveals the acknowledged or perceived
relationships among individuals, teams, departments,
divisions and organizations, as compared to the
expected relationships prescribed or predicted by
strategic intent, organization charts, job roles,
workflow interdependencies, clients, demographics,
time, place, process or functional boundaries
(Galbraith, 2001; Mintzberg, 1979). ONA
visualizations display patterns of relationships, and
may discover unexpected networks, explain conflicts
or behaviors, diagnose opportunities for
interventions, outline specific developmental needs
or reveal the de facto design of the organization.
Recent studies have used either frequency of
interaction or closeness of ties as surrogates for tie
strength [5] or the average of the two indicators of
closeness and frequency for measuring tie strength
[7][8][14].
2.0 METHODOLOGY
In order to achieve the specific objectives of this
study, this research is a case study carried on the
University Of Kigali because it is a relatively new
institution of Higher Learning that is developing its
work culture. The population of the university at the
time of the study was 37 personnel. The study
however targeted teaching staff with fulltime contract
and since the number of the respondents was only
fourteen fulltime academic staff, the research used
sensors in determining the sample size. This research
used questionnaire for data collection because all
respondents have the ability to read and write and the
study required that they fill the instruments on their
own convenience.
The questions on the questionnaire were divided into
two sections. The first section captured the
demographic data while the second section required
the respondent to respond the question on how
frequent the respondent will seek support from the
other actors using a likert scale: 4 = Every Day, 3 =
Every Week, 2 = Every Few Weeks, 1= Every Few
Months, and 0 = Rarely or NeverThe results were
then prepared using excel spreadsheet before inserted
into UCINET for interpretation the network diagrams
were drawn using Netdraw software Application
.
3.0 RESULTS
3.1 Demographic In this study, the demographic profile is indicative of
respondents’ age, education level, gender and
professional experience. Finding shows that majority
respondents (100 percent) are aged between 25 and
46 years. Particularly, half of the respondents (50
percent) are aged between 25 and 35. The remaining
half (50 percent) are aged between 36 and 46 years
old as shown below graph
Figure 1. Age of Respondents
Source: Primary Data,(2014)
In addition, majority (78.6 percent) of the respondents are male with the remainder (21.4 percent) being female as
shown in the figure below.
Figure 2. Gender of Respondents
25 to 35 Years …
36 to 46 Years …
Age (Years)
International Journal of Information Technology and Business Management 29
th July 2014. Vol.27 No.1
© 2012- 2014 JITBM & ARF. All rights reserved
ISSN 2304-0777 www.jitbm.com
42
Source: Primary Data,(2014)
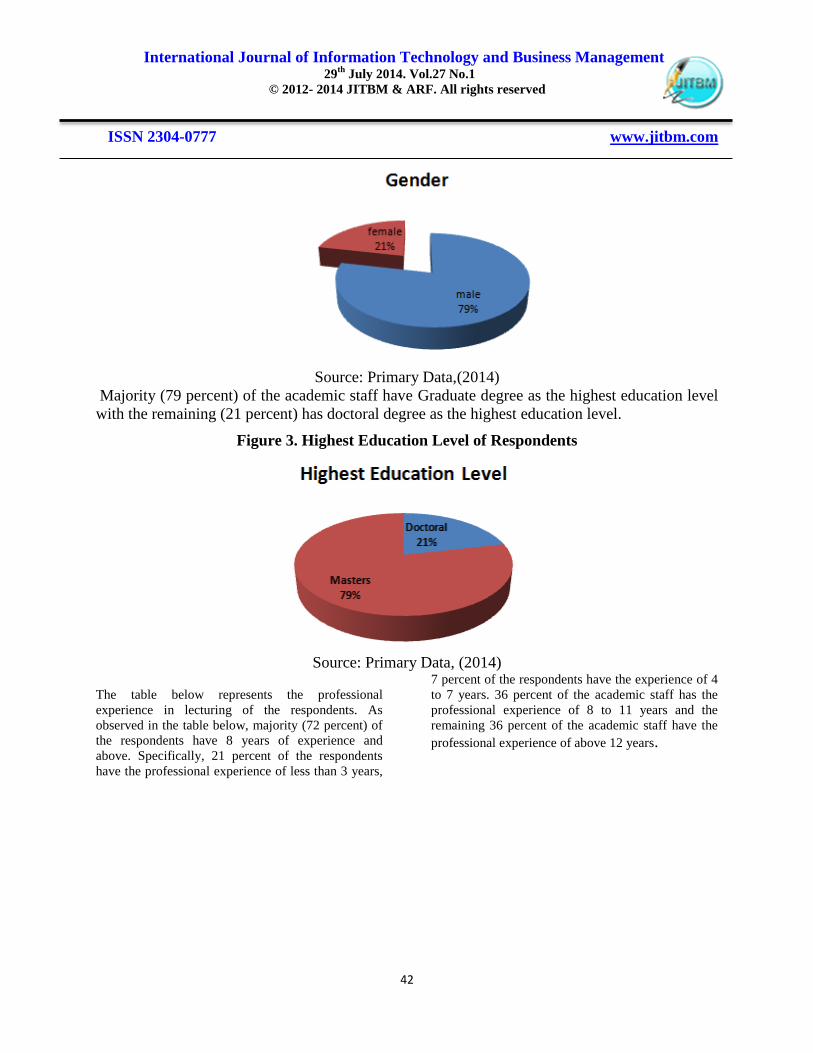
Majority (79 percent) of the academic staff have Graduate degree as the highest education level
with the remaining (21 percent) has doctoral degree as the highest education level.
Figure 3. Highest Education Level of Respondents
Source: Primary Data, (2014)
The table below represents the professional
experience in lecturing of the respondents. As
observed in the table below, majority (72 percent) of
the respondents have 8 years of experience and
above. Specifically, 21 percent of the respondents
have the professional experience of less than 3 years,
7 percent of the respondents have the experience of 4
to 7 years. 36 percent of the academic staff has the
professional experience of 8 to 11 years and the
remaining 36 percent of the academic staff have the
professional experience of above 12 years.

International Journal of Information Technology and Business Management 29
th July 2014. Vol.27 No.1
© 2012- 2014 JITBM & ARF. All rights reserved
ISSN 2304-0777 www.jitbm.com
43
Figure 3. Professional Experience of Respondents
Source: Primary Data, (2014)
When comparing the respondent age with the
professional experience, it was observed that
respondents aged between 25 years and 35 years have
experience of less than 8 years. 42.9 percent have the
experience of less than 3 years; the other 42.9 percent
have experience of between 8 years and 11 years.
The remaining 14.3 percent have an experience of
between 4 to 7 years. All the respondents aged
between 36 years to 46 years old have an experience
of 8 years and above. In particular, 28.6 percent of
the respondents aged between 36 to 46 years have 8
to 11 years of experience. The remaining percentage
71.4 percent have an experience of 71.4 percent.
Table 1. Comparison of Respondent's age with Professional Experience
Professional Experience (Years)
Age (Years) less than 3 4 - 7 8 - 11 12 and above
25 - 35 % within age 42.9% 14.3% 42.9% .0%
% within
Professional
Experience
100.0% 100.0% 60.0% .0%
36 - 46 % within age .0% .0% 28.6% 71.4%

International Journal of Information Technology and Business Management 29
th July 2014. Vol.27 No.1
© 2012- 2014 JITBM & ARF. All rights reserved
ISSN 2304-0777 www.jitbm.com
44
% within
Professional
Experience .0% .0% 40.0% 100.0%
% within age 21.4% 7.1% 35.7% 35.7%
% within
Professional
Experience
100.0% 100.0% 100.0% 100.0%
Source: Primary Data,(2014)
Age and Educational Level Comparing respondent’s age with the highest
educational level, respondents aged between 25 and
35 years have the highest education level of Graduate
degree. 42.9 percent of those respondents aged
between 36 years to 46 years have the doctoral
degree as the highest education level while the
remaining 57.1 percent have Graduate Degree
.
Table 2. Comparison of Respondent's Age with Educational Level
education level
Age Doctoral Graduate
25 – 35 % within age .0% 100.0%
% within education level .0% 63.6%
36 – 46 % within age 42.9% 57.1%
% within education level 100.0% 36.4%
% within age 21.4% 78.6%
% within education level 100.0% 100.0%
Source: Primary Data, (2014)
3.2 Knowledge Sharing Behavior (KSB) in UOK
Knowledge Sharing Behavior (KSB) can be defined
as the extent somebody actually does knowledge
sharing (Kim and Bock, 2002).
3.2.1 Findings on Support
The table below shows the results on the actor’s
degree of centrality on support.
Table 3. Summary of the results on the actor's degree of centrality on support
Actor
Out-Degree
(frequency)
Out-Degree
(percentage)
In-Degree
(frequency)
In-Degree
(percentage)
Betwe
en
1 10 76.92308 11 84.61538 8.612
2 2 15.38462 6 46.15385 0
3 0 0 6 46.15385 0
4 11 84.61538 10 76.92308 9.036
5 13 100 10 76.92308 8.012
6 7 53.84615 9 69.23077 0.643

International Journal of Information Technology and Business Management 29
th July 2014. Vol.27 No.1
© 2012- 2014 JITBM & ARF. All rights reserved
ISSN 2304-0777 www.jitbm.com
45
7 0 0 10 76.92308 0
8 10 76.92308 8 61.53846 1.644
9 12 92.30769 5 38.46154 0.518
10 13 100 10 76.92308 8.012
11 5 38.46154 10 76.92308 0.286
12 13 100 5 38.46154 0.733
13 13 100 8 61.53846 3.362
14 7 53.84615 8 61.53846 0.143
Mean 8.286 63.73846 8.286 63.73846 2.929
Std
Dev 4.858 37.36923 2.054 15.8 3.715
Source: Primary Data,(2014) The Out-Degree: The number of actors the actor
can approach for problem solving
The actor out-degree is the number of the actors the
actor can approach for support in case he/she is faced
with difficult situations at work. From the table
above, it can be observed that actor 1, 4, 5, 8, 9, 10,
11, 12 and 13 have the higher out-degrees than the
average network out-degree of 8.286 which is 63.7
percent meaning that they have strong out-degree
ties. It can be observed that majority of the actors
have a high out-degree therefore majority of actors
can reach out other actors in the organization thus
making them influential.
The frequency with which the actor seek support
from other actors at work
This study also analyzed the frequency with which
the actor seeks support from other actors when facing
difficult situation at work. The results are displayed
in the table below.
Table 4. Frequency with which the actor seeks support from other actors when faced with
difficult situation at work
Actor 1 2 3 4 5 6 7 8 9 10 11 12 13 14
Avg
2.6
15
0.53
8 0
1.76
9
2.23
1
1.84
6 0
1.84
6
2.69
2
2.92
3
0.76
9
1.92
3
2.76
9
1.23
1
SD
1.5
46
1.27
8 0 1.31 1.31
1.83
3 0 1.35
0.82
1
0.99
7 1.12 0.73 1.31
1.42
3
Source: Primary Data,(2014) According to the table 4 above, actor 2 whose
average is 0.538 rarely or never approaches other
actors for support whenever he/she encounters a
difficult situation at work. Actor 11 and 14 whose
average is 0.769 and 1.231 respectively approaches
other actors every few months for support when they
encounter a difficult situation at work. Actor 4, 5, 6,
8 and 12 whose averages are 1.769, 2.23, 1.846,
1.846, and 1.923 respectively approach other actors
every few weeks for support when they encounter a
difficult situation at work. Finally, actors 1, 9, 10 and
13 whose averages are 2.615, 2.692, 2.923 and 2.769
approach other actors every week for support when
they encounter difficult situation at work.

International Journal of Information Technology and Business Management 29
th July 2014. Vol.27 No.1
© 2012- 2014 JITBM & ARF. All rights reserved
ISSN 2304-0777 www.jitbm.com
46
Figure 4. Frequency with which the actor seeks support from other actors when faced with
difficult situation at work
Source: Primary Data, (2014)
The In-Degree: The number of actors the actor
can approach for problem solving
If an actor receives many ties (in-degrees), they are
often said to be prominent, or to have high prestige.
From the table 1 above, it can be observed that actor
1, 4, 5, 6, 7, 10 and 11 have in degrees above the
average (8.286) and a percentage of 63.7 percent.
Actor 1 whose in-degree percentage is 84.6 percent is
the most sought after actor followed by actor 4, 5, 7,
10 and 11 all whose in-degree percentage is 76.9
percent and finally actor 6 whose in-degree
percentage is 69.2.
The frequency with which the actor is sought after
for support by other actors at work
The table below shows the extent to which other
actors seek support from the actor in the study. It can
be observed that actor 9 and 12 whose average is
0.615 and 0.692 are rarely or never approached for
support by the other actors when other actors are
faced with the difficult situation at work. Actors 2, 3,
7, 8 and 13 whose averages are 0.846, 0.769, 1.308,
1.385 and 1.462 are in every few months approached
by other actors for support whenever the other actors
are faced with difficult situation at work. Actors 6, 10
and 11 whose averages are 2.077, 2 and 2.077
respectively are approached in every few weeks by
other actors for support whenever the other actors are
faced with the difficult situation at work. Finally,
actors 1, 4 and 5 whose averages are 3.154, 2.462 and
2.615 respectively are in every week approached by
other actors for support whenever other actors are
faced with the difficult situation at work.
Table 5. Frequency with which other actors seek support from the actor
Actor 1 2 3 4 5 6 7 8 9 10 11 12 13 14
Avg 3.2 0.8 0.8 2.5 2.6 2.1 1.3 1.4 0.6 2 2.1 0.7 1.5 1.7
SD 1.4 1.0 1 1.5 1.5 1.5 1 1.3 1 1.5 1.5 1 1.6 1.5
Source: Primary Data,(2014)
0
0.5
1
1.5
2
2.5
3
3.5
1 2 3 4 5 6 7 8 9 10 11 12 13 14
Fre
qu
en
cy
Actors
Out Degree
Average
SD

International Journal of Information Technology and Business Management 29
th July 2014. Vol.27 No.1
© 2012- 2014 JITBM & ARF. All rights reserved
ISSN 2304-0777 www.jitbm.com
47
Figure 5. Graph showing a summary with which other actors seek support from the actor
Source: Primary Data,(2014)
The figure below provides a summary on the actor’s in-degree and out-degree based on the
findings in table 1.
Figure 6. In and Out Degree on support
Source: Primary Data, (2014)
Looking at the thickness (the strength) of the links in
the figure above it can be observed that actor 3, 12
and 7 do not frequently approach other actors for
support whenever they are faced with a difficult
situation at work. However, this can be attributed to
the fact that actor 3 and 7 did not participate in the
research and since they are the academic staff they
must be included.
Betweenness
Betweenness centrality views an actor as being in a
favored position to the extent that the actor falls on
the geodesic paths between other pairs of actors in
0
0.5
1
1.5
2
2.5
3
3.5
1 2 3 4 5 6 7 8 9 10 11 12 13 14
Fre
qu
en
cy
Actors
In - Degree
Avg
SD
0
20
40
60
80
100
1 2 3 4 5 6 7 8 9 10 11 12 13 14
Fre
qu
en
cy in
pe
rce
nta
ge
Actors
In and Out Degree
Out-Degree (percentage)
In-Degree (percentage)

International Journal of Information Technology and Business Management 29
th July 2014. Vol.27 No.1
© 2012- 2014 JITBM & ARF. All rights reserved
ISSN 2304-0777 www.jitbm.com
48
the network. That is, the more people depend on an
actor A to make connections with other actors, the
more power the actor A has. If, however, two actors
are connected by more than one geodesic path, and
actor A is not on all of them, Actor A lose some
power. Using the computer, it is quite easy to locate
the geodesic paths between all pairs of actors, and to
count up how frequently each actor falls in each of
these pathways. From the table 1 above, it can be
observed that there is a lot of variation in actor
betweenness (from 0 (zero) to 9.036), and that there
is quite a bit of variation (std. dev. = 3.175 relative to
a mean betweenness of 2.929). Despite this, the
overall network centralization is relatively low. This
makes sense, because we know that fully one half of
all connections can be made in this network without
the aid of any intermediary -- hence there cannot be a
lot of "betweenness." In the sense of structural
constraint, there is not a lot of "power" in this
network. Actor 1, 4, 5 and 10 appear to be relatively
a good bit more powerful than others by this
measure. Clearly, there is a structural basis for these
actors to perceive that they are "different" from
others in the population. Indeed, it would not be
surprising if these four actors saw themselves as the
movers-and-shakers, and the deal-makers that made
things happen. In this sense, even though there is not
very much betweenness power in the system, it could
be important for group formation and stratification.
Figure 7. The graph showing the betwenness of the graph for support
Source: Primary Data,(2014)
Network cohesion
The figure below provides a visual summary of table 1 discussed above.
0
1
2
3
4
5
6
7
8
9
10
1 2 3 4 5 6 7 8 9 10 11 12 13 14
Fr
eq
ue
ncy
Actors
Betweenness
Betweenness

International Journal of Information Technology and Business Management 29
th July 2014. Vol.27 No.1
© 2012- 2014 JITBM & ARF. All rights reserved
ISSN 2304-0777 www.jitbm.com
49
Figure 8. Graph on support
Source: Primary Data, (2014)
The table below provides the summary on
the network cohesion. The analysis was
done using Ucinet.
Table 6. Table showing the summary of
the graph
Measures Support
Density 0.637
Average Degree 8.286
Connectness 0.857
Average Distance 1.263
Shortest Distance 0.454
Diameter 3
Breadth 0.254
compactness 0.746
Source: Primary Data, (2014)
4.0 DISCUSSIONS AND
INTERPRETATION From the above results in table 6, it can be observed
that the network density is 0.637 which means that
63.7 percent of all possible arcs are present. Network
density is the ratio of the number of edges in the
network over the total number of possible edges
between all pairs of nodes. However, it is worth
mentioning that the density is inversly related to
network size: the lager the social network, the lower
the density because the number of possible lines
increaeses rapidly with the number of vertices wheras
the number of relations which each person can
maintain is limited. However, Network density is not
very useful because it depends on the size of the
network and it is therefore advisable to look at the
number of relations in which each vertex is involved.
Therefore, we can use the average degree of all
vertices to measure the structural cohesion of a
network: both the in degree and the out degrees. In
the network above, the average degree both in degree
and out degree is 8.286. Additionally, in the figure 6
above, connectness of the network is 0.857 that is
85.7 percent. this means that majority (85.7 percent)
of actors can be reached by other actors. The average
distance is 1.263 with the shortest distance between
the two nodes being 0.454 and the the longest
distance between any two nodes in a network
(Network diameter) being 3 it is useful measure of
the reach of the network (as opposed to looking only
at the total number of vertices or edges). It also
indicates how long it will take at most to reach any
node in the network (sparser networks will generally

International Journal of Information Technology and Business Management 29
th July 2014. Vol.27 No.1
© 2012- 2014 JITBM & ARF. All rights reserved
ISSN 2304-0777 www.jitbm.com
50
have greater diameters). The breadth of the network
is 0.254 and the compactness of the network is 0.746.
From this results, it can observed that there are
relatively strong ties in the network. However, the
frequency with which the actors perform knowledge
sharing is slightly low (in every few weeks ). This
might be attributed to the fact that knowledge shared
by the actors if for official purposes and that is why it
is actors with office responsibility who have very
strong ties and therefore, actors share knowledge
within the university structure. In his paper “The
Strenght of Weak Ties” [6] argued that, we all have
strong ties with the ones closest to us, and weak ties
with acquaintances. Individuals with hardly any weak
ties operate in their own tightly knit group, are
confined to the news and viewpoints within this
group, and deprived of information from other parts
of the social system. Van der Leij and Goyal of the
University of Cambridge (2011) have applied it to
knowledge sharing among co-authors in the field of
economics. Their research rejected the hypothesis
that weak ties are more crucial than strong ties, the
economists’ networks showed a ‘strength of strong
ties’ property. The removal of a weak tie caused less
damage to the shortest path to knowledge than the
removal of a strong tie did. The professionals in a
large electronics company in a study by [7]
experienced different consequences of having weak
ties with other units; it speeded up their project when
knowledge was not complex. Even though strong ties
are useful, especially for sharing detailed
information, weak ties seem to be essential for the
spreading of knowledge. With only 30% of all
professionals moving knowledge outside the small
personal network [10] the strength of weak ties
appears not to be used sufficiently within
organizations.
5.0 CONCLUSION
With today’s knowledge intensive economy in which
work of importance is accomplished by informal
network, Higher Learning Institutions that focus on
understanding the organization networks will be able
to: Identifying and understanding the existing
organization network patterns can yield substantial
satisfaction and performance benefits; establish
network relationships that are critical anchoring
points for employees, whose loyalty and commitment
may be more to sets of individuals in their network
than to a given organization; identify and assess the
health of strategically important networks within an
organization making it possible to work with
important groups to facilitate effective collaboration;
assess the effects of decisions on the social fabric of
the organization; identify issues currently hindering
group performance and specific behaviors and
organizational design elements requiring
modification to improve group efficiency and
effectiveness; identify and work with employees that
are highly central in the organization. This is because
employees become central for legitimate reasons
such as flow demands or unique expertise that a
person brings to bear. Alternatively, we also find
people that are central and impacting an overall
network’s effectiveness by virtue of either becoming
overburdened by their job or having a tendency to
hoard information. Network diagrams can help
determine who these people are and what might be
done to both allow other connections and work to
occur around them as well as protect the organization
should these people decide to go elsewhere. Finally,
it is just as important to use the network diagrams (or
metrics) to identify peripheral people and find ways
to improve their connection where appropriate. These
people are often under-utilized by the group and are
also frequently at the highest risk for turnover. Given
the difficulty in attracting and retaining talented
employees today, we have found it highly important
to find ways to move people into the central part of
the network more quickly. Yet despite their
importance, these networks are rarely well-supported
or even understood by the organizations in which
they are embedded. Citing the growing significance
of knowledge sharing and the importance of weak
ties to the success of knowledge management and to
organizational survival, several researches have
called for further investigation of the factors that
shape knowledge sharing behaviors in the
organizational context. As knowledge sharing
intention does not happen in vacuum, but is
influenced by other factors. Research has consistently
shown that, while social relationships cannot be
mandated by management, they are strongly affected
by elements under management control, such as
hierarchical levels, horizontal departments, office
location, project staffing, and so on.

International Journal of Information Technology and Business Management 29
th July 2014. Vol.27 No.1
© 2012- 2014 JITBM & ARF. All rights reserved
ISSN 2304-0777 www.jitbm.com
51
REFERENCES
1. Asgedom, A. (2007). Academic freedom
and the development of Higher Education in
Ethiopia: The case of AAU, 1950-2005.
PhD Thesis, University of East Anglia, The
UK.
2. Bock, G. W., Zmund, R. W., Kim, Y. G.,
Lee, J. N. (2005). Behavioral Intention
Formation in Knowledge Sharing:
Examinining the Roles of Extrinsic
Motivators, Social- Psychological Forces,
and Organizational Climate. MIS Querterly,
29(1), 87-111.
3. Cabrera, A., Cabrera, E. F. (2002).
Knowledge-Sharing Dilemmas.
Organizational Studies, 23(5), 687-710.
4. Cheng M.Y., Ho J, S. Y., and Lau P. M.
(2009). Knowledge sharing in academic
institutions: a study of Multimedia
University Malaysia. Electronic Journal of
Knowledge Management, 7 (3),
5. Ghoshal, S., Korine, H. and Szulanski, G.
(1994), ‘‘Inter-unit communication in
multinational corporations’’, Management
Science, Vol. 40 No. 1, pp. 96-110.
6. Granovetter, M. (1973), ‘‘The strength of
weak ties’’, American Journal of Sociology,
Vol. 78 No. 6, pp. 1360-80.
7. Hansen, M. (1999), ‘‘The search-transfer
problem: the role of weak ties in sharing
knowledge across organization subunits’’,
Administrative Science Quarterly, Vol. 44
No. 1, pp. 82-111.
8. Hansen, M. (2002), ‘‘Knowledge networks:
explaining effective knowledge sharing in
multiunit companies’’, Organization
Science, Vol. 13 No. 3, pp. 232-48.
9. Ibarra, H. (2000), ‘‘Structural alignments,
individual strategies, and managerial action:
elements toward a network theory of getting
things done’’, in Nohria, N. and Eccles, R.
(Eds), Networks and Organization,Harvard
Business School Press, Boston, MA, pp.
165-88.
10. Intermediair. (2012). Kennis delen lastig in
bedrijven. Retrieved July 10, 2014, from
http://www.intermediairpw.nl/artikel/vakinf
ormatie/302765/kennis-delen-lastig-in-
edrijven.html
11. Kogut, B. and Zander, U. (1992),
‘‘Knowledge of the firm combinative
capacities and the replication of
technology’’, Organization Science, Vol. 3,
pp. 383-97
12. Krackhardt, D. (2003), ‘‘The strength of
strong ties: the importance of philos in
organizations’’, in Cross, R.,Parker, A. and
Sasson, L. (Eds), Networks in the
Knowledge Economy, Oxford University
Press, New York,NY, pp. 82-105.
13. Nohria, N. (2000), ‘‘Is a network
perspective a useful way of studying
organizations?’’, in Nohria, N. and
14. Reagans, R. and McEvily, B. (2003),
‘‘Network structure and knowledge transfer:
the effects of cohesion and range’’,
Administrative Science Quarterly, Vol. 48,
pp. 240-67.
15. Salmi, J. (2009). The challenge of
establishing world class universities, The
World Bank; Washington, DC.
16. Teferra, D. (2004). Striving at the periphery,
craving for the centre: The realm of African
scholarly communication in the digital age.
Journal of Scholarly Publishing, 35 (3), 159-
167.
17. Tsai, W. and Ghoshal, S. (1998), ‘‘Social
capital and value creation: the role of intra-
firm networks’’, Academy of Management
Journal, Vol. 41 No. 4, pp. 464-76.
18. Uzzi, B. (1997), ‘‘Social structure and
competition in inter-firm networks: the
paradox of embeddedness’’, Administrative
Science Quarterly, Vol. 42, pp. 35-67.
19. Wiig, K. M., (2000). Knowledge
Management: An Emerging Discipline
Rooted in a Long History. In C. Despres &
D. Chauvel (Eds.) Knowledge Horizons, The
present and the promise of Knowledge
Management. Oxford: Butterworth-
Heinemann.