ANALELE UNIVERSITĂŢII DIN ORADEA FASCICULA - Zenodo
239
ANALELE UNIVERSITĂŢII DIN ORADEA FASCICULA: PROTECŢIA MEDIULUI VOL XXXV ANUL 25 Editura Universităţii din Oradea 2020
-
Upload
khangminh22 -
Category
Documents
-
view
1 -
download
0
Transcript of ANALELE UNIVERSITĂŢII DIN ORADEA FASCICULA - Zenodo

ANALELE UNIVERSITĂŢII DIN ORADEA
FASCICULA: PROTECŢIA MEDIULUI
VOL XXXV ANUL 25
Editura Universităţii din Oradea
2020

II
I.S.S.N. 1224-6255 (Ed. română) = I.S.S.N. 2065 – 3476 (Ed. engleză) = I.S.S.N. 2065 – 348
ANALELE UNIVERSITĂȚII DIN ORADEA, FASCICULA PROTECȚIA MEDIULUI Science Editor: Prof. Ioan Chereji, PhD, Romania
Prof. Péter Pepó, PhD, Hungary Editor in Chief: Ass. Prof. Ioana Borza, PhD, Romania
Prof. Cornel Domuţa, PhD, Romania
Vice Editors in Chief: Prof. Nicolae Csép, PhD, Romania Sc.r. Daniela Răducu, PhD, Romania
Production Editors Prof. Gheorghe Bandici, PhD, Romania
Prof. Ioan Vlad, PhD, Romania Prof. Mircea Curilă, PhD, Romania
Ass. Prof. Andra Lazăr, PhD, Romania Ass. Prof. Radu Brejea, PhD, Romania
Ass. Prof. Brîndușa Covaci, PhD, Romania Ass. Prof. Leon Muntean, PhD, Romania Ass. Prof. Sorin Muntean, PhD, Romania
Ass. Prof. Cristian Domuța, PhD, Romania
SCIENTIFIC BOARD AGRONOMY
Prof. Leon Sorin Muntean, PhD, Romania - President Prof. Kazuyuki Inubushi, PhD, Japan
Prof. Bernard Bodson, PhD, Belgium Prof. Nagy Janos, PhD, Hungary Prof. Kátai János, PhD, Hungary Prof. Béla Kovács, PhD, Hungary
Prof. Vlado Kovacevic, PhD, Croatia Prof. Vladimir Pacuta, PhD, Slovakia Prof. Alexander Feher, PhD, Slovakia Prof. Jovan Crnobarac, PhD, Serbia
Prof. Vyacheslav M. Semenov, PhD, Russia Dr.Sc. Boris Kogut, PhD, Russia Prof. Vasile Vîntu, PhD, Romania
Prof. Gerard Jităreanu, PhD, Romania Prof. Paul Pârșan, PhD, Romania
Prof. Gheorghe David, PhD, Romania Prof. Gallia Butnaru, PhD, Romania Prof. Teodor Robu, PhD, Romania Prof. Ioan Rotar, PhD, Romania
Prof. Costel Samuil, PhD, Romania Prof. Mircea Savatti, PhD, Romania Prof. Gavrilă Morar, PhD, Romania
Prof. Neculai Dragomir, PhD, Romania Prof. Teodor Marusca, PhD, Romania
Prof. Teodor Rusu, PhD, Romania Prof. Dan Vârban, PhD, Romania
Prof. Floarea Nicolae, PhD, Romania Prof. Elena Trotus, PhD, Romania
HORTICULTURE Prof. Doru Pamfil, PhD, Romania – President
Prof. Radu Sestraș, PhD, Romania Prof. Dorel Hoza, PhD, Romania
Prof. Silviu Apahidean, PhD, Romania Prof. Maria Apahidean, PhD, Romania
Prof. Antonia Ivascu, PhD, Romania Prof. Elena Bucurean, PhD, Romania Prof. Viorel Şcheau, PhD, Romania
Prof. Gheorghe Sarca, PhD, Romania Prof. Viorel Cheregi, PhD, Romania
ENVIRONMENTAL ENGINEERING- FORESTRY Prof. Adrian Alexandru Badea, PhD,Romania - President
Prof. Dan Șchiopu, PhD, Romania Prof. Ioan Jelev, PhD, Romania
Prof. Lazányi János, PhD, Hungary Prof. Tamas János, PhD, Hungary Prof. Maria Popa, PhD, Romania
Prof. Teodor Eugen Man, PhD, Romania Prof. Silvica Oncia, PhD, Romania
Prof. Emil Luca, PhD, Romania Prof. Ioan Păcurar, PhD, Romania Prof. Marcel Dîrja, PhD, Romania Prof. Mihai Decun, PhD, Romania
Prof. Agatha Popescu, PhD, Romania Prof. Marian Constantin, PhD, Romania Prof. Nicu Cornel Sabău, PhD, Romania
Prof. Ecaterina Fodor, PhD, Romania Prof. Adrian Timofte, PhD, Romania
Prof. Marcel Duda, PhD, Romania, Romania GENERAL EDITORIAL COMMITTEE: President: Lect. Ana Pereș, PhD; Vice presidents: Ass. Prof. Anamaria Supuran, PhD; Lect. Cristian Oneț, PhD; Lect. Anca Popa PhD; Lect. Eugenia Șerban, PhD. EDITORIAL COMMITTEE FOR EACH DOMAIN: Agronomy, Horticulture: Ass. Prof. Mariana Vlad, PhD; Ass. Prof. Aurora Venig, PhD; Lect. Manuel Gitea, Lect. Alina Stanciu, PhD; Lect. Gheorghe Donca, PhD; Lect. Ileana Ardelean, PhD; Lect. Mihai Cărbunar, PhD; Lect. Mariana Bei, PhD. Lect. Teodora Vidican, PhD; Lect. Carmen Iancu, PhD; Lect. Ioana Vlad, PhD; Lect. Paula Tirpe, PhD. Environmental Engineering: Lect. Gabriela Vicaș, PhD; Lect. Monica Costea, PhD; Lect. Emilia Pantea, PhD; Lect. Eugen Jude, PhD; Lect. Aurelia Oneț, PhD; Lect. Nandor Köteles, PhD. Forestry: Ass. Prof. Gabriel Cheregi, PhD; Lect. Codruța Lucaci, PhD; Lect. Stelian Pantea, PhD; Lect. Călin Pășcuț, PhD; Lect. Voichița Timiș-Gânsac, PhD; Lect. Szilard Bartha, PhD; Lect. Călin Iovan, PhD; Lect. Laviniu Burescu, PhD; Lect. Petrică Moțiu, PhD; Lect. Ruben Budău, PhD;
III
CONTENTS
AGRONOMY 1. Bandici Gheorghe, Ardelean Ileana, Vidican Teodora
Studies Regarding the Influence of Crop Rotation and Regime Nutrition Interaction on Phytomass Accumulation in Winter Wheat Cultivated on the Preluvosoils
1
2. Blajovici (Balint) Alexandra Marilena, Brejea Radu Considerations Regarding the Holding and Use of Agricultural Land in the Southwest Area of Bihor County
9 3. Bunea Anca, Matei Ioan, Dulf Vasile, Fortiu Marcel, Țiganea Anamaria
Emphaszing the Main Soil Classes and Types Located in Bradului Depression, Romania
15 4. Bunta Gheorghe, Bucurean Elena, Cosma Corina
Results Regarding the Fusarium Head Blight Attack on Wheat in Western Romania
19 5. Chilba Ciprian, Brejea Radu, Chilba Raluca
Research on the Productivity of Sorghum Hybrids, in Inand, Bihor County 31
6. Covaci Cristian Eugen Research Regarding the Influence of Fertilizers on Winter Wheat Yield and Yield Quality in the Region of Carei, Satu Mare County
37 7. Creț Adina, Chiș Carmen, Şipoș Monica
The Allelopathic Effects of Some Essential Oil on the Biotest Species Sinapis alba L.
43 8. Dejeu Ioana Lavinia, Frenț Olimpia Daniela, Sacalîș Ileana, Zbârcea
Claudia, Marian Eleonora, Bodea Anca Salomea Comparison of Antioxidant Activity Between Rosa Canina L. and Hippophae Rhamnoides L. Harvested from Romania
49 9. Donca Gheorghe
Some Aspects of Drone Contribution to Precision Agriculture
57 10. Dumuţa Corneliu, Brejea Radu Petru, Martin (Boros) Anca Mădălina
The Evaluation of the Radioactivity of the Agricultural Land from the Băiţa – Beiuș Area
63 11. Frenț Olimpia-Daniela, Dejeu Ioana-Lavinia, Zbârcea Claudia, Marian
Eleonora Synthesization of Β -Naftolorange, an Azo Dye with Superior Purity
69 12. Frenț Olimpia-Daniela, Dejeu Ioana-Lavinia, Săliștean Irimel-Samuel,
Zbârcea Claudia, Marian Eleonora Antioxidant Capacity of Hypericum Perforatum Flowers in Maramures County
77 13. Marușca Teodor, Dihoru Gheorghe, Doniță Nicolae, Memedemin
Daniyar, Pășcuț Călin Gheorghe Contributions to the Evaluation of the Productivity of Permanent Grasslands from the Babadag Plateau (Dobrogea)
85 14. Mintaş Olimpia, Mintaş Ioan
The Impact and Vulnerabilities of Agriculture in Nord-West Region of Romania to Climate Change
95

IV
15. Mondici Susana, Goga Nicolae, Brejea Radu Solutions to Control the Volunteer Sunflower from Soybean Crop in the North-Western Part of Romania
101 16. Nistor Andrei, Brejea Radu, Boroș Mădălina
Evaluation and Microbiological Characterization of The Peat and Some Soils Contaminated with Petroleum Products from Salonta Municipality, Bihor County
109 17. Tăut Florian Dumitru, Brejea Radu, Roșca Sanda, Martin Anca Mădălina
Medicago sativa L. Culture Proposals Under the Influence of Ecological Conditions in Bihor County
115
HORTICULTURE
1. Bucurean Eva
The Influence of Fertilization with Chemical Fertilizers on Phosphorus and Potassium Present in the Apple Tree Leaves During 2017-2019 Period
123
2. Ienciu Andrada, Cărbunar Mihai, Cărbunar Mihaela Lavinia, Vidican Oana Maria Research on the Influence of Cultivars and Crop System on Eggplant Growth and Production in Solarium
127 3. Venig Aurora, Bunea Aurel, Venig Adelina
Researches Regarding the Application of Fertilizers for Fruit Trees in the Concept of Environmental Protection and Obtaining Competitive Harvests in the Fruit Area of Bihor
133 4. Vidican Iuliana Teodora, Iancu Carmen Violeta, Stanciu Alina Ștefania,
Cărbunar Mihaela Comparative Study on the Capacity of Regenerative Organogenesis in Opuntia Fragilis Var Fragilis And Aylostera Heliosa Grow In Vitro on Medium Supplemented with 2,5 mg/l 2,4-dichlorophenoxyacetic acid (2,4-D)
139 5. Vlad Ioana Andra
Establishing The Necessary Macro And Microelements Necessary For Growth and Development of Prunus Laurocerasus Plants Cultivated in Containers
149
FORESTRY
1. Crainic Ghiţă Cristian, Sicoe Silviu, Curilă Mircea, Curilă Sorin The Influence Of Structural Characteristics on the Stability of Stands Affected by Windfalls and Windbreaks
153 2. Fetea Marius Serban
Design of Digital Analysis Programs for Three Types of Wooden Structures Different as External Loading Using the Initial Parameters Method
165 3. Mateș Iosif Constantin, Burescu Petru
The Juniper Vegetation of Bihor Mountains, the Căpățâna Wetland Complex. Phytocenoses of the Association Pino Mugo-Sphagnetum.
173 4. Moţiu Petrică Tudor
Research on 4636 Forest Ecosystem Type Sessil Oak-European Beech Mixed Stand with Festuca Drimeja (Regional Version With Common Hornbean and Turkey Oak) Within the Segment of Landscape Situated on Low Western Hills of Tinca Forest District
181

V
5. Seghedin Georgeta, Timofte Adrian Ioan
Forest Education Programmes Proposed by the Forest National Administration-Romsilva in Partnership With Specialized Universities and Other Stakeholders (Ist Part)
191
ENVIRONMENTAL ENGINEERING 1. Covaci Brîndușa
Construction Industry: Entrepreneurship, Circular Economy and Environment Protectiono. Case Study of Romanian Mountains Area
197 2. Ilie Aurelian Leonardo, Marinescu Mariana
Accidental or Passage Bird Species (Vertebrata: Aves) In Romanian Fauna, Observed in Bihor County (North Western Part of Romania) During 2014-2020
209
3. Mintaş Olimpia, Mintaş Ioan, Vicaș Gabriela Impact and Vulnerabilities of Intensive Animal Husbandry in the North-West Region f Romania for Climate Change
217 4. Pantea Ioan
Product Sustainability and Emotional Design
223 5. Pereş Ana Cornelia, Köteles Nandor, Domuţa Cristian, Amarie Sara
The Monthly and Annual Air Temperature Regimes in the Vad-Borod Depression
229

1
Annals of the University of Oradea, Fascicle: Environmental Protection Vol. XXXV, 2020 Analele Universităţii din Oradea, Fascicula: Protecţia Mediului Vol. XXXV, 2020
STUDIES REGARDING THE INFLUENCE OF CROP ROTATION AND REGIME NUTRITION INTERACTION ON PHYTOMASS
ACCUMULATION IN WINTER WHEAT CULTIVATED ON THE PRELUVOSOILS
Bandici Gheorghe*, Ardelean Ileana*, Vidican Teodora*
*University of Oradea, Faculty of Environment Protection, Department of Agricultural, Oradea, Romania
Corresponding author: University of Oradea, Faculty of Environment Protection, Department of Agricultural, 26 Magheru Str., zip code: 410048, Oradea, Romania, tel.: 004059412550, fax. 0040259416274,
e-mail: [email protected]
Abstract
The crop rotation is a decisive factor influencing growth and development of wheat. Plant growth is fundamental in obtaining yield and is related vegetation and technological
factors, the level of yield being reflected in the intensity of phytomass accumulation. In the majority of cases, total growth of green mass is considered on the assumption that a maximum yield is obtained by increasing total dry weight phytomass production and by a favourable repartition of it among plant’s organs.
Bîlteanu Gh., (1993) after long tests demonstrated the importance of crop rotation on wheat yields on brown-red soils in Romanian Plain. On clay-illuvial podzols, the introduction of ameliorative plants such as red clover represented an element of outmost importance for increase of the wheat yield.
Key words: crop rotation,regime nutrition, phenophase, phytomass, preluvosoils, early ripening, incomplete ripening, complete ripening
INTRODUCTION
Crop rotation together with other appropriate agricultural practices contribute to the favourableness of growth and development conditions of wheat root system, to an improved synthesis of specific organic compounds and their improved translocation to plant’s organs (Lazany, 2000; Bandici ., 1997, 2001) Finally, all the enumerated conditions lead to improved efficiency per area unit.
Zamfirescu, (1977) stressed out that the accumulation process of total green mass relies on the absorption of nutrients from soil through plant’s root system. In turn, root system depends on the level of foliar system functioning conditioned by water and nutrients’ provision of soil. (Lazany, 2003).
The importance of rationale fertilization and of the crop rotation, on growths and development of plants is stated by many authors: Austin, 1978, Soltner, 1990, Salisbury andRoss, 1995, Domuta et al., 2007,2008).

2
Most of the reserches were centred on the influence of crop rotation on the yields, namely on the phytomass accumulation. the crop rotations with regard to wheat was very satisfactory in this order as forerunner plant: pea, beans, winter rape, bots, linseed, soja, red clover, potato, sugar beet, sunflower, corn etc. (Bandici, Gus, 2001, Muntean et al., 2011, Domuta, 2012).
Dincă, (1982), made some references on the role of crop rotation on wheat yield and on the organic accumulation in whole plant and grains.
It is demonstrated that after 10-year monoculture, wheat yield decreases continously in comparative with rotations. it fluctuates as a consequence of changing climatic conditions. under such circumstances, fertilization does not induce a significant yield increase. a particularly important problem is linked to wheat crop increment, which must fit the rising consumption needs of world population (Zăhan 1989, Bandici et al., 2003, Ardelean, 2013). MATERIAL AND METHOD The research was set at Agricultural Researche and Development Station (A.R.D.S) Oradea (Romania), between 2018-2019. The experimental design was polyfactorial in subdivides stands using as factors interaction: crop rotation x phenophase and regime nutrition x phenophase. The influence of later factors was studied on the dynamics phytomass accumulation of winter wheat cultivated on preluvosoils. As biological material, the Delia race of wheat was employed. Experimental results (phytomass accumulation) were analyzed by ANOVA (analysis of variance) and expressed as g of dry weight/10 plants (Bandici, 2007). RESULTS AND DISCUSSION
The present paper presents the correlation between phytomass accumulation and crop rotation quality in winter wheat cultivation.
The Table 1 presents the phytomass accumulation during the less favourable year 2018. The results show that the forerunner plant do not influence phytomass accumulation increase as winter wheat advances in vegetation. The increase is dependent on the properties and quality of the crop rotation, the best yields being obtained after the cultivation of pea.
Thus, in wheat monoculture the phytomass accumulation increases from 0.96 g. dry weight/10 plants (at beginning winter) to 45.40 g. dry weight/10 plants at complete ripening. If corn is used as crop rotation, but specially after pea, the increases in yield are superior, varying between 0.87-
3
60.43 g. dry weight/10 plants after corn and between 1.50-66.97 g. dry weight/10 plants after pea, respectively as winter wheats’forerunner plants.
The phenomenon keeps same pace but at values in 2019, a less favourable year (table 2). The phytomass accumulation varies in wheat monoculture between 0.20-35.60 g. dry weight/10 plants and 0.23-42.83 g. dry weight/10 plants after corn and between 0.20-47.10 g. dry weight/10 plants after pea. Regardless to climatic conditions, at a different scale, a positive correlation was found between phenophase x regime nutrition: as wheat advances to maturity, there is a progressive accumulation of total phytomass in seeds (table 3). Concerning 2018, results show a very significant increase in phytomass at the beginning of winter in unfertilized alternative (1.00 g dry weight/10 plants). At the complete ripening there is an increase to 49.92 g dry weight/10 plants, in unfertilized alternative (Zăhan, 1989).
In 2019, a less favorable year, phytomass accumulation decreases as compared to a favorable year, taking values in a narrower, range between 0.22 g dry weight/10 plants at beginning of winter and 31.32 g dry weight/10 plants at compared ripening in unfertilized alternative.
It is worth to mention that in 2018 the quantity of accumulated phytomass was directly proportional with fertilization level as it was rising during study period (49.92 g dry weight/10 plants) in unfertilized alternative and 69.49 g dry weight/10 plants in fertilized alternative, organo-mineral complex was used in all experimental alternative as fertilized.
In a less favorable year, 2019, phytomass accumulation decreased depending on nutrition regime (31.32 g dry weight/10 plants in unfertilized alternative and 51.80 g dry weight/10 plants in fertilized alternative using the same organo-mineral complex as fertilizer). It is worth to mention that during the two research years, a negative correlation was found between percent participation of compound synthesized before fructification and seeds formation and fertilization level. This phenomen is more accentuated in unfertilized alternatives as compared with fertilized with organo-mineral complex and is influenced unfavorable climatic conditions.

4
Table 1
The effect of nutrition regime x phenophase interaction on winter wheat dry weight phytomass accumulation dynamics on preluvosoils. (Oradea 2018)
Phenophase Total dry weight phytomass, seeds and straw g./10 plants Nutrition regime N0P0 N120P80 N100P80 + 10t/ha manure
Total s d.W.
Seeds Straw Total s d.W.
Seeds Straw Total s d.W.
Seeds Straw
At winter beginning 1.00 - 1.00 1.17 - 1.17 0.97 - 0.97 At the end of winter 1.22 - 1.22 1.55 - 1.55 1.65 - 1.65 The beginning of vegetation 2.65 - 2.65 2.62 - 2.62 4.65 - 4.65 The formation of first interned 4.77 - 4.77 6.10 - 6.10 7.45 - 7.45 Straw elongation 11.62 - 11.62 16.85 - 16.85 19.37 - 19.37 The formation of spike 36.70 - 36.70 43.05 - 43.05 44.10 - 44.10 Beginning of seeds formation 43.62 - 43.62 49.55 - 49.55 49.31 - 49.31 Early ripening 47.62 9.50 38.12 52.90 13.75 39.15 56.45 13.25 43.20 Incomplete ripening 49.82 15.75 34.07 57.32 18.45 38.87 63.55 17.40 46.15 Complete ripening 49.92 21.00 28.92 57.95 24.50 33.45 69.49 27.75 41.74
LSD 5% LSD 1 %
LSD 0.1 %
0.063 g/10 plants d.w. For total plant phytomass: 0.083 g/10 plants d.w. 0.106 g/10 plants d.w.
2.3 g/10 plants d.w. For seeds: 3.1 g/10 plants d.w. 4.0 g/10 plants d.w.
Statistical significations:
- for Total plant phytomass: under 0.063 = insignificant (-); 0.063-0.083 = significant (*); 0.083-0.106 = distinct significant (**); over 0.106 = very significant (***); - for seeds: under 2.3 = insignificant (-); 2.3-3.1= significant (*); 3.1-4.0 = distinct significant (**); over 4.0 = very significant (***).

5
Table 2. The effect of the crop rotation x phenophase on winter wheat phytomass accumulation dynamics. on preluvosoils
(Oradea, 2019)
Phenophase Total dry weight phytomass. seeds and straw g./10 plants Crop rotation Wheat monoculture (Mt) Corn (W-C) Pea (P-W-C) Pea (P-W-C-C) Total
s d.W.
Seeds Straw Total s
d.W.
Seeds Straw Total s
d.W.
Seeds Straw Total s
d.W.
Seeds Straw
At winter beginning 0.20 - 0.20 0.23 - 0.23 0.30 - 0.30 0.20 - 0.20 At the end of winter 0.37 - 0.37 0.37 - 0.37 0.40 - 0.40 0.37 - 0.37 The beginning of vegetation 0.47 - 0.47 0.47 - 0.47 0.50 - 0.50 0.47 - 0.47 The formation of first interned 0.80 - 0.80 0.97 - 0.97 1.33 - 1.33 0.93 - 0.93 Straw elongation 3.73 - 3.73 3.43 - 3.43 4.37 - 4.37 4.33 - 4.33 The formation of spike 8.60 - 8.60 9.47 - 9.47 11.0 - 11.00 10.60 - 10.60 Beginning of seeds formation 24.83 - 24.83 25.50 - 25.50 34.03 - 34.03 33.13 - 33.13 Early ripening 33.87 9.83 24.04 36.00 8.50 27.50 35.73 11.33 24.40 41.33 10.83 30.50 Incomplete ripening 35.37 11.70 23.67 41.87 11.00 30.87 40.73 13.90 26.83 45.33 12.17 33.16 Complete ripening 35.60 13.37 22.23 42.83 12.80 30.03 43.43 17.50 25.93 47.10 15.97 31.13
LSD 5% LSD 1 %
LSD 0.1 %
0.073 g/10 plants d..w. .For total plant phytomass: 0.096 g/10 plants d.w. 0.123 g/10 plants d.w.
2.7 g/10 plants d.w. For seeds: 3.6 g/10 plants d.w. 4.7 g/10 plants d.w.
Statistical significations: - for Total plant phytomass: under 0.073 = insignificant (-); 0.073-0.096 = significant (*); 0.096-0.123 = distinct significant (**); over 0.123 = very significant (***); - for seeds: under 2.7 = insignificant (-); 2.7-3.6 = significant (*); 3.6-4.7 = distinct significant (**); over 4.7 = very significant (***).

6
Table 3
The effect of nutrition regime x phenophase interaction on winter wheat dry weight phytomass accumulation dynamics on preluvosoils (Oradea 2019)
Phenophase Total dry weight phytomass. seeds and straw g./10 plants Nutrition regime N0P0 N120P80 N100P80 + 10t/ha manure
Total s d.W.
Seeds Straw Total s d.W.
Seeds Straw Total s d.W.
Seeds Straw
At winter beginning 0.22 - 0.22 0.22 - 0.22 0.25 - 0.25 At the end of winter 0.35 - 0.35 0.37 - 0.37 0.40 - 0.40 The beginning of vegetation 0.45 - 0.45 0.47 - 0.47 0.50 - 0.50 The formation of first interned 0.90 - 0.90 0.95 - 0.95 1.17 - 1.17 Straw elongation 2.45 - 2.45 4.47 - 4.47 4.97 - 4.97 The formation of spike 5.82 - 5.82 11.30 - 11.30 12.62 - 12.62 Beginning of seeds formation 23.00 - 23.00 30.07 - 30.07 35.05 - 35.05 Early ripening 26.45 6.03 20.42 38.97 11.85 27.12 44.77 12.50 32.27 Incomplete ripening 30.22 7.35 22.87 43.05 14.07 28.98 49.20 15.15 34.05 Complete ripening 31.32 9.72 21.60 43.60 15.70 27.90 51.80 19.30 32.50
LSD 5% LSD 1 %
LSD 0.1 %
0.063 g/10 plants d.w. For total plant phytomass: 0.083 g/10 plants d.w. 0.106 g/10 plants d.w.
2.3 g/10 plants d.w. For seeds: 3.1 g/10 plants d.w. 4.0 g/10 plants d.w.
Statistical significations:
- for Total plant biomass: under 0.063 = insignificant (-); 0.063-0.083 = significant (*); 0.083-0.106 = distinct significant (**); over 0.106 = very significant (***); - for seeds: under 2.3 = insignificant (-); 2.3-3.1= significant (*); 3.1-4.0 = distinct significant (**); over 4.0 = very significant (***).

7
Thus, in 2018, a favorable year, increasing the fertilization had as result a decrease of participation percentage from 33.7 g dry weight/10 plants in unfertilized alternative to 15.3 g dry weight/10 plants in fertilized with organo-mineral complex alternatives.
In 2019, considered an unfavorable year, the decreases varied between 11.2 g dry weight/10 plants in unfertilized and 7.9 g dry weight/10 plants in fertilized alternatives using organo-mineral complex of fertilizers. CONCLUSIONS
The crop rotation has a positive effect on total phytomass
accumulation as compared with wheat monoculture, the obtained values being conditioned by a higher favourableness of climatic factors.
With regard to phytomass accumulation in seeds, it was positively influenced by the quality of the crop rotation, being higher in correlation with the nutrition regime qualities.
REFERENCES 1. Ardelean I., 2013, Agrotehnica. Editura Universitătii din Oradea. p.417 2. Austin R.B., 1978, ADAS, Qualerly Review, 29, 76-87.12 3. Bandici G. E., 1997, Contributii la stabilirea influenței premergătoarei si a fertilizării asupra
dinamicii acumularii biomasei, la grâul de toamna, cultivat pe soluri cu exces temporar de umiditate, în centrul Câmpiei de Vest a României. Doctoral thesis. University of Agriculture Sciences and Veterinary Medicine Cluj-Napoca, Romania, p.250.
4. Bandici G. E., C. Domuta, I. Ardelean, 2003, The influence of the forerunner plant, fertilisation level and climatic conditions on the total wet and dry gluten content of winter wheat seeds cultivated on brown luvic soils in the Western Plain of Romania. Lucrari ştiintifice USAMVB., Seria B, vol. XLV, Bucuresti, p.281-284, p.330.
5. Bandici, G.E., Guş, P.,2001, Dinamica acumulării de biomasă la grâul de toamnă. University of Oradea Press, 107 p.
6. Bîlteanu, G., 1993, Fitotehnie, Ceres Printing House. Bucharest, pp. 457. 7. Dinca D., 1971, Influenta rotatiei asupra productiei, valorificarii îngrasamintelor si calitatii
biologice a recoltelor de grâu si porumb pe solul brun roscat de padure. Probleme agricole, no.9, p.56-59, p.70.
8. Dincă, D., 1982, Asolamentele agriculturii moderne. Ceres Printing House. Bucharest. 257 pp 9. Domuta C., 2012, Agrotehnică. Editura Universitătii din Oradea. p.506 10. Domuta C., Bandici Gh., Ciobanu Gh., N. Csep, Ciobanu C., Samuel A., Bucurean E., Sandor
M., Borza I., Bunta Gh., Ileana Ardelean, Cr. Domuta, 2007, “Asolamentele în Câmpia Crisurilor”. Editura Universitatii din Oradea, ISBN 978-973-759-350-4, pag. 254.
11. Domuta C. , Bandici Gh., Ciobanu Gh. Ciobanu C., Samuel A., N. Csep, Bucurean E., Borza I., Sandor M., Bunta Gh., I. Ardelean, Cr. Domuta., 2008, Asolamentele in sistemele de agricultura, Editura Universitatii din Oradea, pag. 297..
12. Lazany, J., 2000, Soil fertility management in Westik’s crop rotation experiment. Role of fertilizers in Sustainable Agriculture. CIEC Conference. pp.77-80.
13. Lazany, J., 2003, Differences in soil carbon content in the treatments of Westik’s crop rotation experiment. Natural resources and sustainable development. International scientific session and reviewed papers. Oradea-Debrecen, pp. 119-120.

8
14. Muntean L. S., S. Cernea, G. Morar, M. Duda, D. Vârban, S. Muntean, 2011, Fitotehnie. Academic Pres Printing House, Cluj-Napoca, p.83-135, p.255.
15. Salisbury F.B., C.W. Ross, 1995, Fisiologia vegetale. Seconda edizione italiana condota sulla quarta edizione americana. Editura Zanichelli..
16. Soltner D., 1990, Phytotechnie speciale, Colection sciences et Techniques Agricoles, Angers. 17. Zamfirescu, N., 1977, Bazele biologice ale producţiei vegetale. Ceres Printing House,
Bucharest, 337 p. 18. Zăhan, P., Zăhan, R., 1989, Cercetări privind influenţa plantei premergătoare şi a fertilizării
asupra dinamicii de acumulare a masei vegetale la grâul cultivat pe soluri podzolice cu exces temporar de umiditate din Câmpia de Vest a ţării (I). Probleme de agrofitotehnie teoretică şi aplicată nr. 1, vol. XI: 97-102.

9
Annals of the University of Oradea, Fascicle: Environmental Protection Vol. XXXV, 2020 Analele Universităţii din Oradea, Fascicula: Protecţia Mediului Vol. XXXV, 2020
CONSIDERATIONS REGARDING THE HOLDING AND USE OF AGRICULTURAL LAND IN THE SOUTHWEST AREA
OF BIHOR COUNTY
Blajovici (Balint) Alexandra Marilena*, Brejea Radu**
*Agency of Payents and Intervention for Agriculture Bihor, 1 Matei Corvin St, 330138, Oradea, Romania, e-mail:[email protected];
**University of Oradea, Faculty of Environmental Protection, 26 Gen. Magheru St., 410048, Oradea, Romania, e-mail: [email protected]
Abstract
This issue is interesting to be approached from a legal point of view of the situation of restitutions, due to the fact that in the plain area had operated forced co-operation, respectively making available the agricultural land to the state, as well as due to high agricultural performance specific to these areas.
Three communes located in the southwest of Bihor County were taken for analysis: Sînnicolau Roman, Gepiu and Ciumeghiu.
Key words: Bihor, land, agricultural, property, Sînnicolau Roman, Gepiu, Ciumeghiu
INTRODUCTION
This paper presents an overview of the holding and use of
agricultural land located in the southwest of Bihor County, respectively the geographical area of the communes: Sînnicolau Român, Gepiu and Ciumeghiu.
In this study I will start from the notion of property - definition - and to the regulations contained in various normative acts.After the successive agrarian reforms, the owner of agricultural land has more and more restricted rights regarding the sale of agricultural land located outside the built-up area, the culminating point being reached in 2020, with the entry into force of Law no. 175/2020 for the amendment and completion of Law no. 17/2014 regarding some regulation measures of the sale-purchase of agricultural lands located outside the built-up area and of amendment of Law no. 268/2001 on the privatization of companies that manage public and private land owned by the state for agricultural purposes and the establishment of the State Domains Agency, on October 13, 2020.
MATERIAL AND METHOD
The study presents a series of general information that were taken from the specialized literature, according to the mentioned bibliography, and
10
those that refer to exact data come from the actual collection of data in the field and from the records of the National Institute of Statistics (INS) by accessing INSSE site, Wikipedia and lege5.ro. Also, I used information sources by accessing online publications with an agricultural profile.
RESULTS AND DISCUSSION
The explanatory dictionary of the Romanian language shows us what the term ,,property" means, namely, full ownership of a good.( Ioan Oprea, Carmen Gabriela Pamfil, Rodica Radu, Victoria Zastroiu, 2017). In order to better understand the meaning of this word, a foray into the distant past is necessary. ,,Proprietas" or ,,proprietatis" means ,,proper" in Latin, meaning the freedom to own a good.Regarding property, during the communist regime, private property was forced into a form of collective ownership in the form of collectivization.
In 1864, the Romanian Civil Code defined in art. 480 property as follows: ,,Property is the right that one has to enjoy and dispose of a thing exclusively and absolutely, but within the limits determined by law."
The Universal Declaration of Human Rights of 10 December 1948 issued by the United Nations contains references to the right to property in art. 17:
,,1. Everyone has the right to own property both alone as well as in association with others.
2. No one shall be arbitrarily deprived of his property. '' Also, the Charter of Fundamental Rights of the European Union,
issued in 2000 and made mandatory in 2009 (Article 6 of the Treaty on European Union) provides references to the right to property.
The European Convention on Human Rights contains references to the right to property even in Article 1.
At European level in the 2000s, was aimed the promotion of an European Governance, the main ideas being exposed in the White Paper. Transparency of decision-making in public administration provides citizens with the necessary elements for efficient management of resources (land, taxes, etc.) (Timofte, 2016).
The Romanian Constitution regulates the property at art. 136 para. 1. Regarding the communes studied, the Sînnicolau Român
communewas founded in 2003, due to the reorganization of Cefa commune, based on Law no. 102 of April 3, 2003 for the establishment of Sînnicolau Român commune, Bihor county, through the reorganization of Cefa

11
commune. The newly established commune consists of the villages: Sînnicolau Român, Berechiu and Roit. It borders the communes of Nojorid, Cefa, Gepiu, Girișu de Criș, Toboliu and at a distance of 800 meters from Hungary. It has an area of 75.09 km2. (Wikipedia)
Fig..1 Map of Sînnicolau Român commune (according to Wikipedia)
According to the Monograph of Sînnicolau Român commune, during the period of ,,Great Romania" the villages that belonged to Sînnicolau Român commune were part of the territorial jurisdiction of the Cefa commune, but some of these villages remained in Hungary as a result of the Treaty of Trianon from June 4, 1920 (Gruia Fazecas, Marta Doru, Augustin Țărău, Feier Florica, 2017). As a result of the Vienna Dictate of 1940, it returns to the Hungarian administrative organization ,,Horthyst", and after the World War II, in the period 1950-1968 the commune belongs to Salonta district. In 1968, when Nicolae Ceaușescu was in power, Romania was administratively organized based on Law no. 2 of 1968 regarding the administrative organization of the territory of Romania, still in force today. Thus, the Sînnicolau Român commune resumes its old status, but until 1986, when it was assigned to the Cefa Commune due to the systematization of the territories carried out based on Law no. 58/1974 regarding the systematization of the territory and of rural and urban
12
localities.Subsequently, in 2003, Sînnicolau Român Commune became an administrative-territorial unit with legal personality.
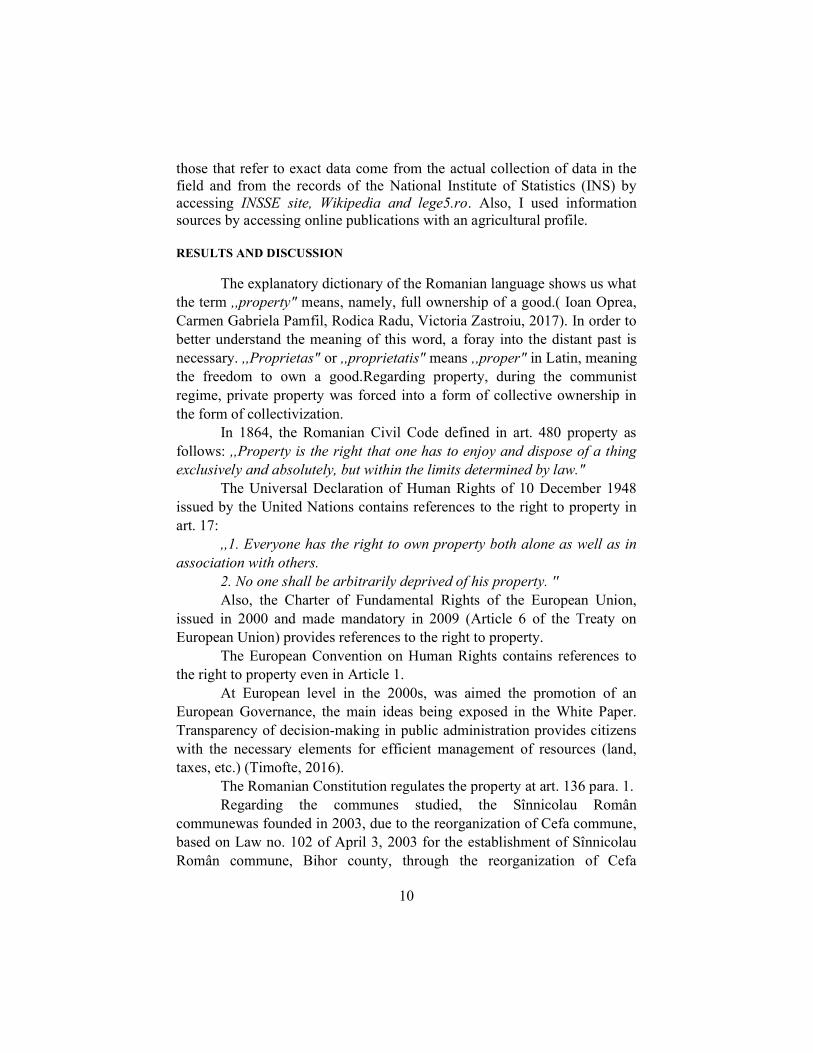
Gepiu commune was founded in 2003, due to the reorganization of Cefa commune, based on Law no. 586 of December 22, 2003 for the establishment of Gepiu commune, Bihor county, through the reorganization of Cefa commune. The newly established commune consists of the villages: Gepiu and Bicaci. It borders the communes of Cefa, Sînnicolau Român, Mădăras, Nojorid and Husasău de Tinca. It has an area of 38.21 km² (Wikipedia).
Fig..2 Map of Gepiu commune (according to Wikipedia)
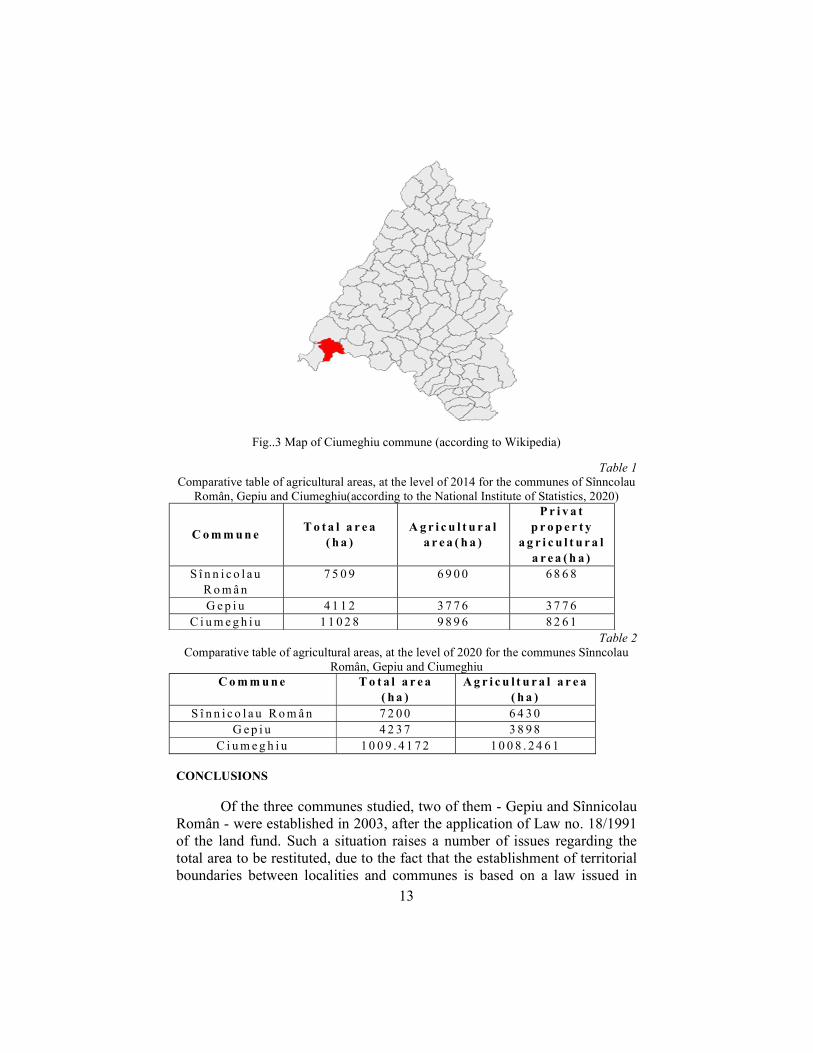
Ciumeghiu commune was established by Law no. 2 of 1968 regarding the administrative organization of the Romanian territory and includes the villages: Ciumeghiu, Ghiorac and Boiu. It borders the communes of Batăr, Avram Iancu, the city of Salonta, Arad County and Hungary. It has an area of 110.28 km² (Wikipedia).
13
Fig..3 Map of Ciumeghiu commune (according to Wikipedia)
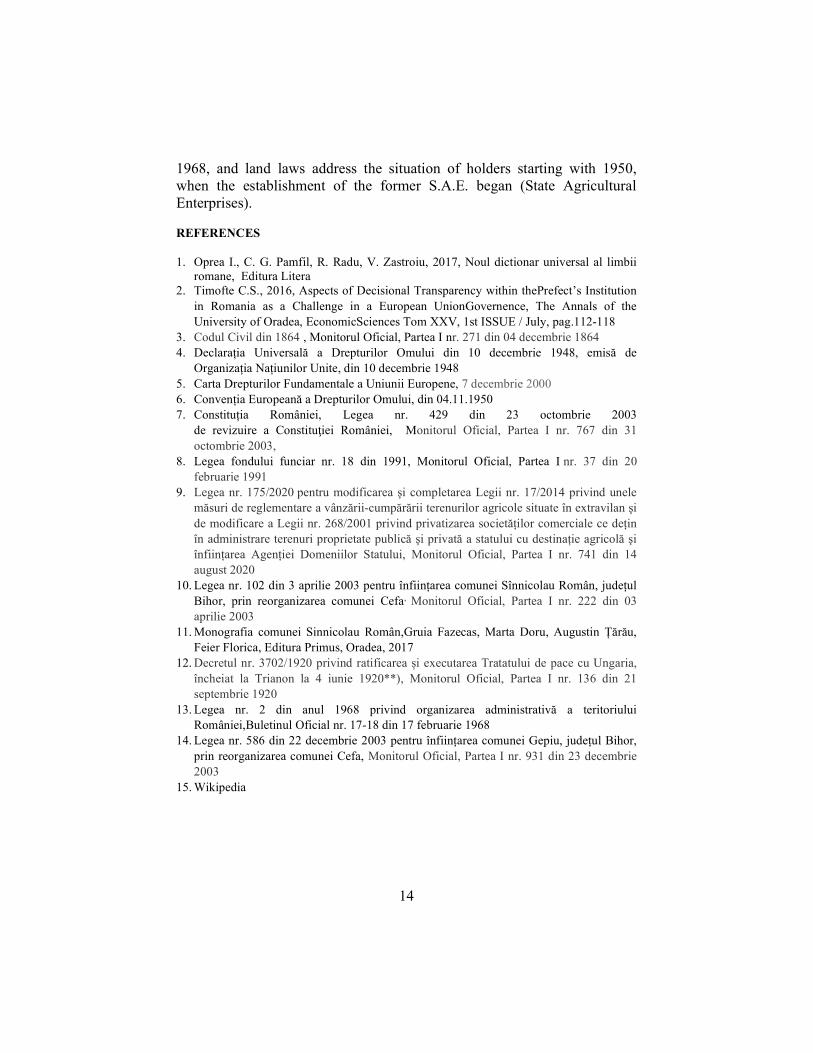
Table 1 Comparative table of agricultural areas, at the level of 2014 for the communes of Sînncolau
Român, Gepiu and Ciumeghiu(according to the National Institute of Statistics, 2020)
C o m m u n e T o t a l a r e a
( h a ) A g r i c u l t u r a l
a r e a ( h a )
P r i v a t p r o p e r t y
a g r i c u l t u r a l a r e a ( h a )
S î n n i c o l a u R o m â n
7 5 0 9 6 9 0 0 6 8 6 8
G e p i u 4 1 1 2 3 7 7 6 3 7 7 6 C i u m e g h i u 1 1 0 2 8 9 8 9 6 8 2 6 1
Table 2 Comparative table of agricultural areas, at the level of 2020 for the communes Sînncolau
Român, Gepiu and Ciumeghiu C o m m u n e T o t a l a r e a
( h a ) A g r i c u l t u r a l a r e a
( h a ) S î n n i c o l a u R o m â n 7 2 0 0 6 4 3 0
G e p i u 4 2 3 7 3 8 9 8 C i u m e g h i u 1 0 0 9 . 4 1 7 2 1 0 0 8 . 2 4 6 1
CONCLUSIONS
Of the three communes studied, two of them - Gepiu and Sînnicolau Român - were established in 2003, after the application of Law no. 18/1991 of the land fund. Such a situation raises a number of issues regarding the total area to be restituted, due to the fact that the establishment of territorial boundaries between localities and communes is based on a law issued in
14
1968, and land laws address the situation of holders starting with 1950, when the establishment of the former S.A.E. began (State Agricultural Enterprises). REFERENCES 1. Oprea I., C. G. Pamfil, R. Radu, V. Zastroiu, 2017, Noul dictionar universal al limbii
romane, Editura Litera 2. Timofte C.S., 2016, Aspects of Decisional Transparency within thePrefect’s Institution
in Romania as a Challenge in a European UnionGovernence, The Annals of the University of Oradea, EconomicSciences Tom XXV, 1st ISSUE / July, pag.112-118
3. Codul Civil din 1864 , Monitorul Oficial, Partea I nr. 271 din 04 decembrie 1864 4. Declarația Universală a Drepturilor Omului din 10 decembrie 1948, emisă de
Organizația Națiunilor Unite, din 10 decembrie 1948 5. Carta Drepturilor Fundamentale a Uniunii Europene, 7 decembrie 2000 6. Convenția Europeană a Drepturilor Omului, din 04.11.1950 7. Constituția României, Legea nr. 429 din 23 octombrie 2003
de revizuire a Constituţiei României, Monitorul Oficial, Partea I nr. 767 din 31 octombrie 2003,
8. Legea fondului funciar nr. 18 din 1991, Monitorul Oficial, Partea I nr. 37 din 20 februarie 1991
9. Legea nr. 175/2020 pentru modificarea şi completarea Legii nr. 17/2014 privind unele măsuri de reglementare a vânzării-cumpărării terenurilor agricole situate în extravilan şi de modificare a Legii nr. 268/2001 privind privatizarea societăților comerciale ce dețin în administrare terenuri proprietate publică şi privată a statului cu destinație agricolă şi înființarea Agenției Domeniilor Statului, Monitorul Oficial, Partea I nr. 741 din 14 august 2020
10. Legea nr. 102 din 3 aprilie 2003 pentru înființarea comunei Sînnicolau Român, județul Bihor, prin reorganizarea comunei Cefa, Monitorul Oficial, Partea I nr. 222 din 03 aprilie 2003
11. Monografia comunei Sinnicolau Român,Gruia Fazecas, Marta Doru, Augustin Țărău, Feier Florica, Editura Primus, Oradea, 2017
12. Decretul nr. 3702/1920 privind ratificarea și executarea Tratatului de pace cu Ungaria, încheiat la Trianon la 4 iunie 1920**), Monitorul Oficial, Partea I nr. 136 din 21 septembrie 1920
13. Legea nr. 2 din anul 1968 privind organizarea administrativă a teritoriului României,Buletinul Oficial nr. 17-18 din 17 februarie 1968
14. Legea nr. 586 din 22 decembrie 2003 pentru înființarea comunei Gepiu, județul Bihor, prin reorganizarea comunei Cefa, Monitorul Oficial, Partea I nr. 931 din 23 decembrie 2003
15. Wikipedia

15
Annals of the University of Oradea, Fascicle: Environmental Protection Vol. XXXV, 2020 Analele Universităţii din Oradea, Fascicula: Protecţia Mediului Vol. XXXV, 2020
EMPHASZING THE MAIN SOIL CLASSES AND TYPES LOCATED IN BRADULUI DEPRESSION, ROMANIA
Bunea Anca*, Matei Ioan*, Dulf Vasile*, Fortiu Marcel*, Țiganea Anamaria*
*University of Agricultural Sciences and Veterinary Medicina Cluj-Napoca, Faculty of Agriculture,3-
5 Calea Mănăștur, 4400372 Cluj-Napoca, Romania, e-mail: [email protected], [email protected], [email protected], [email protected],
Abstract
An unanimously acknowledged aspect is that, in the world, the quality of soils is not satisfactory, and the registered trends even show a worsening of this state of art. For this reason, it is considered that a first step in order to improve this aspect is performing the inventory of the main classes and types of soil, at regional level. Thus, the present study was undertaken in order to highlight the existing classes and types of soil in the Bradului Depression located in Hunedoara County, Romania. The results of the study indicate that the constituent soils of the Bradului Depression are the representatives of five classes, nine types and thirteen subtypes, with a spatial distribution highlighted by the soil map, drawn up at a scale of 1: 25,000, and the largest areas are occupied by: Eutricambisol (class Cambrisols), Alosol (Luvisols class), and Regosol (Protisols class), and the smallest areas are occupied by soil types: Rendzina (Cernisols class), Preluvosol (Luvisols class) and Erodosol (Antrisols class).
Key words: Antrisol, Cambrisol, Cernisol, Luvisol, Protisol
INTRODUCTION
Globally, the quality of soils is not among the best, and the evolution trend is considered to be oriented even towards a worsening of the situation (McInnes-Clarke et al., 2019). Problems related to soil quality are created by a number of factors, but agricultural practices registered both at the level of large farms and at the level of those who own medium and small areas of agricultural land (Cui et al., 2018), are considered as being of major importance in this context (Lai, 2008). Also in the category of important causes of severe soil degradation are: erosion, compaction and salinization (Keesstra et al., 2016). All of these have a high potential to destroy the productive capacity of the soil, which can worsen global food security situations (Fan et al., 2008; Godfray et al., 2010; Tester and Langridge, 2010). The present study was conducted in order to highlight the existing classes and types of soil in the Brad Depression located in Hunedoara County, Romania.

16
MATERIAL AND METHOD
The study was conducted in the area located in the Fir Depression. It is represented by an area equal to 98,000 ha located on the territory of Hunedoara county. The geographical area studied includes 11 localities, representing both rural and urban areas, respectively communes: Baia de Criş, Blăjeni, Buceş, Bucharest, Bulzeşti, Crişcior, Luncoiu, Ribiţa, Tomeşti and Vaţa, to which is added the city of Brad.
In order to identify the classes and types of soil in the experimental site, the Romanian Soil Taxonomy System - 2012 (SRTS - 2012) is used. The soil map was prepared in accordance with the established methodology. RESULTS AND DISCUSSION
The constituent soils of the Bradului Depression are the representatives of five classes, nine types and thirteen subtypes, with a spatial distribution highlighted by the soil map, drawn up at a scale of 1: 25.000 (Fig. 1).
Fig. 1. The map of soil type in Bradului Depression The soil classes, types and subtypes have a different distribution on
the territory of the 10 localities located in the study area (Fig. 2). It is noted that Bulzeștii de Sus is the locality that includes all soil
types identified in the Bard Depression, but in proportions that differ greatly from one soil type to another, but Alosol and Eutricambosol are predominant. The localities that include the fewest soil classes are those on whose territory three classes and four soil types have been identified. The localities that include three types of soil are Luncoiu de Jos (predominant being Alosol and Eutricambosol), Bucharest (predominantly Regosol) and

17
Baia de Cris (predominantly being Eutricambosol), and those that include four types of soil are represented by the city of Brad, where predominant is Eutricambosol and the localities Ribița (where alluvial and Eutricambosol predominate) and Criscior, where Alosol predominates (Fig. 2).
Bulzeștii de
Sus
LuncoiudeJos
Tomești
Vața de Jos
Baia de
CrișBrad
Ribița
Blăjeni
Bucureșci
Criscior
Buceș
Rendzină 81 202
Regosol 532 900 2112 3412 4032 98 9916
Preluvosol 20 200 900 200
Litosol 550 200 200 1100 843
Eutricambosol 2950 3900 520 2928 3112 5520 3435 2000 1580 1070 700
Erodosol 1600 240
Districambosol 1012 4023 145 625
Aluviosol 300 920 1700 500 839 1500 3520 710 1250 900
Alosol 3900 80 2500 10500 5021 40 1032 1930
0%
10%
20%
30%
40%
50%
60%
70%
80%
90%
100%%
Locality
Alosol Aluviosol Districambosol Erodosol EutricambosolLitosol Preluvosol Regosol Rendzină
Fig. 2. The areas and shares occupied by the soil types identified in localities from Depression of Brad
The largest areas are occupied by the classes: Cambrisols (with the
Eutricambisol type), Luvisols (with the Alosol type) and Protisols (with the Regosol type). The smallest areas are occupied by the classes Antrisols (with Erodosol type) and Cernisols (with Rendzina type), to which is added a class of soils already mentioned for the category which soils occupying the largest areas, respectively Luvisols, but which by the type Preluvosol also falls into the category of those who occupy the lowest areas. Thus, Eutricambosols occupy the largest area, equal to 27,715 ha, which

18
corresponds to a proportion of 28.28% of the total area studied. Alosols occupy 25,000 ha (25.51% of the total studied area) being followed, in descending order by: Regosol with 21,000 ha (21.43% of the total studied area), Aluvosol with 12,139 ha (12.38% of the total studied area), Districambosol with 5,805 ha (5.92% of the total studied area), Lithosol with 2,893 ha (2.95% of the total studied area), Erodosol with 1,840 ha (1.88% of the total studied area).To those, there are added Preluvosol with 1,320 ha (1.35% of the total studied area) and Rendzine with 283 ha representing 0.3% of the total studied area.
CONCLUSIONS
The study carried out on the types of soil in the Bradului Depression highlights the fact that the largest areas are occupied by: Eutricambisol (Cambrisols class), respectively the area of 27,715 ha (28.28% of the total studied area); Alosol (Luvisols class), respectively the surface of 25,000 ha (25.51% of the total studied area) and Regosol (Protisols class), respectively the surface of 21,000 ha (21.43% of the total studied area). The same study shows that the smallest areas are occupied by soil types: Rendzina (Cernisols class), respectively the area of 283 ha (0.30% of the total studied area); Preluvosol (Luvisols class), respectively the surface of 1,320 ha (1.35% of the total studied area), and Erodosol (Antrisols class), respectively the surface of 1,840 ha (1.88% of the total studied area). REFERENCES 1. Cui Z., Zhang H., Chen X., Zhang C., Ma W., Huang C., Zhang W.,. Mi G, Miao Y., Li
X., 2018, Pursuing sustainable productivity with millions of smallholder farmers. Nature, no. 555, pp. 363–368.
2. Fan M., Shen J., Yuan L., Jiang R., Chen X., Davies W.J., Zhang F., 2012, Improving crop productivity and resource use efficiency to ensure food security and environmental quality in China. Journal of Experimental Bot., no. 63, pp. 13–24
3. Godfray H., Beddington J., Crute I., Haddad L., Lawrence D., Muir J.F., Pretty J., Robinson S., Thomas S., Toulmin C., 2010, Food security: The challenge of feeding 9 billion people. Science no. 327, pp. 812–818
4. Keesstra S., Pereira P., Novara A., Brevik E.C., Azorin–Molina C., Parras–Alcantara L., Jordan A., Cerda A., 2016, Effects of soil management techniques on soil water erosion in apricot orchards. Science of Total Environment, no. 551–552, pp. 357–366
5. LAl R., 2008, Soils and sustainable agriculture: A review, Agronomic Sustainable Development, 28, 57–64.
6. McInnes-Clarke S.K., Jenkins B.R., Rawson A., Murphy B.W., 2019, Sharing soil knowledge and evaluating progress in the New South Wales Soil Knowledge Network. Soil Use and Management, no. 35, pp. 105-116
7. Tester M., Langridge P., 2010, Breeding technologies to increase crop production in a changing world. Science, no. 327, pp. 818–822
8. http://www.fao.org/faostat/en/#data/RL

19
Annals of the University of Oradea, Fascicle: Environmental Protection Vol. XXXV, 2020 Analele Universităţii din Oradea, Fascicula: Protecţia Mediului Vol. XXXV, 2020
RESULTS REGARDING THE FUSARIUM HEAD BLIGHT ATTACK ON WHEAT IN WESTERN ROMANIA
Bunta Gheorghe*, Bucurean Elena**, Cosma Corina*
*Agricultural Research and Development Station Lovrin, 200 Principala St., Lovrin, Romania, e-
mail: [email protected] **University of Oradea, Faculty of Environmental Protection, 26 Gen. Magheru St., 410048, Oradea,
Romania.
Abstract This paper presents some results regarding the attack of the Fusarium head blight (FHB) in
the year 2019 at Oradea, Romania. The climatically conditions (a great number of days with rainfall and high relative humidity) favoured a strong attack, the most wheat genotypes being strongly damaged... Our new cultivars Dacic and Lovrin 5 X had a good reaction to the disease, their yields being significant upper to experimental average.
About the effects of attack on ears, the genotypes: Otilia, Ursita, F.14078 GP1 and Dacic were the list affected by Fusarium. The effect of Fusarium attack were strong in reducing the thousand kernel weight (TKW) and finally in yield decrease.
These unusual climatically conditions were a good opportunity for breeding, selection of genotypes to FHB resistance being the most important target on this year. Key words: cultivar, wheat, yield, resistance, fusarium.
INTRODUCTION A challenge for this century is to increase production of cultivars resistant to biotic (like wheat scab) and non-biotic stress, without increasing the land area production (Tessman and Sanford, 2019). There are more than 50 species and varieties of Fusarium sp. which attacks a lot of cultivated plants (Ittu et al., 1979). The most grave symptoms in wheat are caused (in order) by Fusarium graminearum Schwalbe f. c. Giberella zeae (Schw) Petch, Fusarium avenaceum, Fusarium culmorum and Fusarium nivale. Durum wheat is more susceptible to Fusarium than bread wheat (Buerstmayr et al., 2019). In warm and humid conditions, Fusarium graminearum is the pathogen that caused the disease, but in cooler and humid environments, Fusarium culmorum and Fusarium avenaceum ones are frequent (Tessman and Sanford, 2019). Fusarium head blight (FHB) occurs especially in areas with warm and humid summer (Mesterhazy, 2001). Climatically factors that favoured infection are: temperature (17-210C) during the flowering period, 7-12 hours of sunlight brightness daily and high (70-80%) relative humidity (Bunta, 1992). Temperature and humidity around anthesis influence FHB infection and disease development, resistance to disease may not be genetically controlled (Buerstmayr et al., 2019).

20
A fungicide control is expensive and not always effective enough, also breeding of resistant cultivars seems to be the most important task (Mesterhazy, 2001). Under epidemic conditions, even the most efficient fungicides may not be good enough to keep the toxin level below the critical threshold, particularly on susceptible cultivars (Mesterhazy et al., 2011). Infected grains contain toxic fungal metabolites (mycotoxins), like deoxynivalenol (DON), that make it unsuitable for food and feed (Zhu et al., 2019). Fusarium head blight (FHB) significantly reduces the percentage of high-molecular- weight glutenins and low-molecular-weight glutenins, two important components of gluten (Tessmann, 2019). Disease infection occurs during or just after anthesis, when open florets provide the opportunity for the pathogen to enter and initiate infection (Tessmann, 2019). Morphological traits of wheat can act as barrier between pathogen and plant and provide a passive form of resistance to disease. Plant height, flowering time, anther extrusion, spike density, spikelet number are some of the traits described related to FHB. Genotypes witch have higher plant height have better resistance to FHB (Spanic et al., 2011). Plant height was negatively correlated with all disease traits (Tessmann and Sanford, 2019). In addition, spike inclination was negatively correlated with all disease traits, indicating that more inclined spikes had lower disease levels. Heading date can impact FHB, since in early or late hearing date can provide escape from infection (Petersen et al., 2016). Between hearing date and Fusarium damaged kernels and DON were identified positive significant correlations, early genotypes being more resistant to FHB. Negative correlations between morphological and scab traits were observed across all traits. Despite their small effects, traits as spike length, spikelet number and spike inclination can function as passive resistance mechanisms, reducing pathogen contact with the floral tissue (Tessmann and Sanford, 2019). Buerstmayr et al. (2019) considered that there are two types of FHB resistance in wheat: type I, resistance to initial infection and type II, the resistance to the spread to infection within a plant. These two types vary independently among cultivars. The plant defence to FHB can be active resistance (genetically factors) or passive one (morphological and developmental traits: plant height, anther extrusion, and flowering date). The resistance to FHB is race non-specific and gives protection against several Fusarium species (Mesterhazy, 2001), the resistance being a complex phenomenon. A central importance to FHB is (Buerstmayr et al., 2019): 1. The abundance and aggressiveness of inoculums around anthesis;

21
2. The environmental conditions during the critical period; 3. The susceptibility or resistance status of the plant; Multiple mechanisms of host resistance to FHB can be evaluated: 1. Initial infection 2. Spread of pathogen in spike tissues 3. Deoxynivalenol (DON) accumulation 4. Kernel infection 5. Yield reduction (Xu et al., 2020). Resistance to type 1 is associated with phenological, morphological and flower biology traits, such as: plant height, days to hearing, anther extrusion. Cleistogamy is the best type 1 resistance against FHB. Closed- flowering or rapid anther extrusion genotypes are more resistant to FHB than the genotypes where the anther was partially extruded (Tassmann, 2019). The breeding for FHB is difficult (Bunta Gh. and Bunta A., 1992) because: 1. There are a lot of Fusarium species, very adaptable; 2. Don’t exists a precise method for resistance evaluation; 3. The same genotypes have different reactions in different areas, years and inoculums; 4. Don’t be available sources of immunity to disease. Resistant cultivars are one of the must important ways to control or reduce the effects of FHB. That is a quantitative disease, involving multiple genes with major and minor effects (Tessmann, 2019). In Europe, some cultivars are sources of resistance: Arina, Fundulea 201 R, Renan, and Remus. Different authors identified during the years some sources for resistance to FHB: Sumai 3, a Chinese spring variety and Frontana, from Brazil (Zhu et al., 2019). Triticum dicoccoides and different local germplasm could be additional sources of resistance. Frontana ensure resistance to initial infection while Sumai 3 to fungal spread within a spike. Ittu Mariana and collaborators (1989) presents some cultivars with good resistance to FHB: Wu Gong, Mai, Na Su 2 (China), Nobeoka Bozu (Japan), Libelulla (Italy), Bizel (France). Sumai 3, Ning 7840, Yangmai 158, Ningmai 9 and other Fusarium resistant cultivar were developed through standard methods (Ma et al., 2019). In addition to inter-varietals crosses, other methods were used: substitution and translocation lines with alien chromosomes or chromosomes fragments, somaclonal variation, recurrent selection, molecular marker-assisted selection. Recently, Fhb1 has been cloned and diagnostic markers have been developed, which will facilitate successful deployment of Fhb 1 in wheat breeding (Bai et al., 2018).
22
One breeding methods to increase resistance to FHB is selection of seedling inoculated with different races of Fusarium (Shin et al., 2014), a simple, rapid and reliable for the early screening of resistance. In Romania, some old cultivars were identified to be resistant: Turda 195, Alina, Silvana Fundulea 29 ((Moldovan, et al., 1986). In the heredity of resistance to Fusarium there are more types of genetic actions, the non-additive ones (dominances and epitasis) being predominates (Moldovan and col., 1988). In north-west Romania (Crisana county), strong head blight attacks were recorded in the years: 1970, 1985, 1991 (Bunta, 1992). MATERIAL AND METHOD
The experiment vas conducted in the experimental field of the
Agricultural Research and Development Station Lovrin, situated near the town Oradea, in the North-west of Romania. It consists in 25 genotypes (cultivars and breeding lines) tested during the agricultural year 2018-2019. The surfaces of plots were 5 square meters and the number of replicates was three, randomized. The results were computed statistically and the interpretation of dates was done by limit standard deviation (LSD). The correlation between characters was used too. The best trend line model of interactions between characters (linear, exponential, power, polynomial and mowing line) were computed and than the most significant were presented in the figures.
The yield results of genotypes were compared with the average of experiment. In the list of cultivars is included the Russian old cultivar Bezostaya 1, to facilitate the observation of genetically progress during the last period.
For a better understanding of genotypes reaction to FHB, in the paper are presented the climatically parameters (temperature, precipitations and humidity) registered during the months May and June. RESULTS AND DISCUSSION
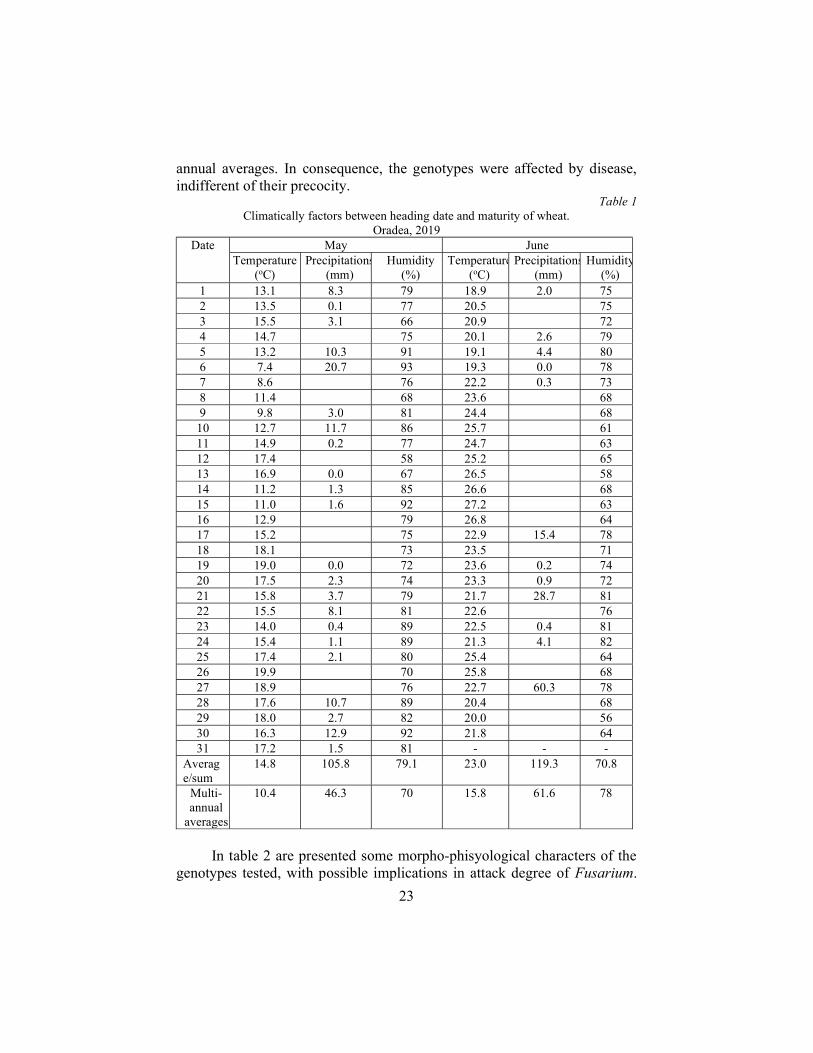
Because it is known that the apparition and spread of inoculums of
Fusarium is very dependent to climatically conditions, in table 1 are presented the daily averaged temperature, sum of daily precipitations and the humidity of atmosphere, during the months May and June. It can see that a number of 22 days in May and 12 days in June were raining, generating high humidity, at temperatures between 14.8oC and 23.0oC. The sum of precipitations exceeded 100.0 mm/m2 in the both months, more than multi-
23
annual averages. In consequence, the genotypes were affected by disease, indifferent of their precocity.
Table 1 Climatically factors between heading date and maturity of wheat.
Oradea, 2019 Date May June
Temperature (oC)
Precipitations(mm)
Humidity (%)
Temperature(oC)
Precipitations(mm)
Humidity(%)
1 13.1 8.3 79 18.9 2.0 75 2 13.5 0.1 77 20.5 75 3 15.5 3.1 66 20.9 72 4 14.7 75 20.1 2.6 79 5 13.2 10.3 91 19.1 4.4 80 6 7.4 20.7 93 19.3 0.0 78 7 8.6 76 22.2 0.3 73 8 11.4 68 23.6 68 9 9.8 3.0 81 24.4 68 10 12.7 11.7 86 25.7 61 11 14.9 0.2 77 24.7 63 12 17.4 58 25.2 65 13 16.9 0.0 67 26.5 58 14 11.2 1.3 85 26.6 68 15 11.0 1.6 92 27.2 63 16 12.9 79 26.8 64 17 15.2 75 22.9 15.4 78 18 18.1 73 23.5 71 19 19.0 0.0 72 23.6 0.2 74 20 17.5 2.3 74 23.3 0.9 72 21 15.8 3.7 79 21.7 28.7 81 22 15.5 8.1 81 22.6 76 23 14.0 0.4 89 22.5 0.4 81 24 15.4 1.1 89 21.3 4.1 82 25 17.4 2.1 80 25.4 64 26 19.9 70 25.8 68 27 18.9 76 22.7 60.3 78 28 17.6 10.7 89 20.4 68 29 18.0 2.7 82 20.0 56 30 16.3 12.9 92 21.8 64 31 17.2 1.5 81 - - -
Average/sum
14.8 105.8 79.1 23.0 119.3 70.8
Multi-annual
averages
10.4 46.3 70 15.8 61.6 78
In table 2 are presented some morpho-phisyological characters of the
genotypes tested, with possible implications in attack degree of Fusarium.

24
The number of plants/m2 varied between 319 and 427 and the number of ears/m2 between 461 and 586. Date of earring varied between May 7 and May 18. At the first look, it seems that there is no correlation with Fusarium attack (visual estimation by notes or % of ears with symptoms of damaged). In accordance with notes, it seems that the genotypes: Otilia and Dacic are the list affected by FHB. Estimating the extension of symptoms on ears (in %), the same genotypes and in addition: Ursita, F14.078 GP 1 were the more resistances.
Table 2 Morpho-phisyological characters of the tested genotypes.
Oradea, 2019. Nr. Crt. Genotype Density/ m2 Date of
earring Fusarium
head blight (notes)
% of ears attacked plants ears
1 GLOSA 400 497 7/05 4/5 33.5 2 BOEMA 424 512 9/05 3.7/5 24.4 3 LITERA 335 473 10/05 .7/6 35.9 4 MIRANDA 357 461 9/05 4.7/6 31.8 5 IZVOR 320 566 9/05 5.7/6 26.3 6 OTILIA 380 497 11/05 3/3 13.7 7 PITAR 324 476 10/05 7/7 34.3 8 PAJURA 337 541 9/05 5.3/6 29.4 9 SEMNAL 355 494 12/05 5/5 29.9 10 URSITA 329 541 10/05 3/4 17.0 11 VOINIC 345 552 12/05 3.7/4 22.6 12 ZAMFIRA 319 522 12/05 3.7/4 25.4 13 AMURG 393 520 8/05 6/7 35.5 14 ARMURA 372 521 14/05 4/4 28.0 15 ABUNDENT 397 537 13/05 3.7/4 21.3 16 F14.078 GP 1 427 564 12/05 3/3.7 9.9 17 A4-10 379 553 14/05 7/8 35.1 18 ADELINA 401 578 11/05 4.3/5 28.4 19 ȘIMNIC 60 373 532 13/05 4/5 33.3 20 DACIC 363 553 18/05 3.3/4 16.1 21 LV. 5X 415 524 14/05 5.7/6 36.6 22 LV. 9T 384 557 15/05 6.7/8 38.2 23 LV. 6107 383 548 13/05 6.7/7 30.0 24 LV. 6111 391 586 13/05 5.7/6 29.9 25 BEZOSTAIA 345 548 17/05 4/4 24.3
Averages 370 530.4 11/05 4.7/5.4 27.6
In these circumstances, the yield levels of the genotypes (table 3) varied between only 3630,6 Kg/ha (Izvor) and 5936.0 kg/ha (F. 14.078 GP 1, a breeding line created at NARDI Fundulea). The average of experiment was 4900.3 kg/ha, less than the last years, just for the damages caused by FHB. It is important to underline that the breeding line F. 14.078 GP 1 was

25
the most resistant to Fusarium damages, estimated by % of ears attacked. Other genotypes (Otilia, Dacic and Abundent) were in the same time very yielding and resistant, too. The best yielding and FHB resistant genotypes are new creations, obtained during the last years at NARDI Fundulea and ARDS Lovrin, by selection in natural or artificial conditions of infection with Fusarium.
Table 3 Results regarding the yield of some winter wheat genotypes.
Oradea, 2019
Class. Genotype Yield
Differences (kg/ha)
Significance of
differences kg/ha relative
(%) 1 F. 14.078 GP 1 5936.0 121.1 +1035.7 *** 2 ABUNDENT 5865.2 119.7 +964.9 *** 3 OTILIA 5743.2 11.2 +842.9 ** 4 DACIC 5660.8 115.5 +760.5 ** 5 VOINIC 5491.6 112.1 +591.3 * 6 LOVRIN 5X 5447.6 111.2 +547.3 * 7 ARMURA 5239.8 110.2 +339.5 8 BOEMA 1 5187.5 105.9 +287.2 9 MIRANDA 5008.9 102.2 +108.6
10 LOVRIN 6111 4999.9 102.0 +99.6 11 SEMNAL 4979.3 101.6 +79.0 12 ZAMFIRA 4977.7 101.5 +77.4
Experimental average 4900.3 100,0 0 - 13 URSITA 4892.8 99.8 -7.5 14 ȘIMNIC 60 4848.9 99.0 -51.4 15 LOVRIN 6107 4782.6 97.6 -117.7 16 A 4-10 4738.7 96.7 -161.6 17 ADELINA 4671.2 95.3 -229.1 18 GLOSA 4619.2 94.3 -281.1 19 PITAR 4613.5 94.1 -286.8 20 LOVRIN 9T 4483.5 91.5 -416.8 21 PAJURA 4318.3 88.1 -582.0 o 22 LITERA 4202.2 85.8 -698.1 o 23 BEZOSTAIA 4105.7 83.8 -794.6 oo 24 AMURG 4062.8 82.9 -837.5 oo 25 IZVOR 3630.6 74.1 -1269.7 ooo
LSD 5%= 521.1 Kg/ha; LSD 1%= 706.2 Kg/ha;
LSD 0.1%= 945.5 Kg/ha. In table 4 are presented the correlations calculated for all characters evaluated, for all 25 genotypes. The yield correlated positive with plant density and number of grains/ear and negative with Fusarium head blight and test weight (hectolitre mass). It can concluded that FHB caused the

26
diminished of grains weight and in consequence a reduced yield. Wheat dwarf virus (WDV) did not influenced significant the yield and some morphological or physiological characters, but brown rust caused the diminished the thousand kernel weight (TKW).
Table 4 The correlations between morphological and physiological characters in wheat.
Oradea, 2019 Nr. Crt. Characters 1 2 3 4 5 6 7 8 9 10 11 12 13
1 Yield 1 0.45* -0.19 0.32 -0.13 -0.34 0.10 -0.56oo -0.23 0.01 0.53** 0.01 -0.41o
2 Plants density
1 -0.16 0.06 0.02 -0.05 0.23 -0.02 -0.12 0.21 -0.06 -0.16 0.01
3 Height 1 0.48* -0.17 -0.51o 0.38 -0.20 0.10 0.06 -0.24 -0.09 0.14
4 Date of earring
1 -0.01 -0.90oo 0.70** -0.10 -0.24 0.43* 0.08 -0.32 0.01
5 Maturity 1 0.44* 0.14 0.24 0.15 0.31 -0.15 -0.12 0.20
6 Grain fill period
1 -0.57oo 0.19 0.28 -0.25 -0.14 0.23 0.08
7 Brown rust
1 0.28 0.03 0.29 0.03 -0.61oo 0.22
8 FHB 1 0.19 -0.01 -0.36 -0.56oo 0.27
9 WDV 1 -0.03 -0.19 -0.09 -0.01
10 Ears density
1 -0.37 0.15 -0.04
11 grains/ear 1 -0.18 -0.15
12 TKW 1 -0.01
13 Test weight
1
N = 25; r5% = 0.40; r1% = 0.52.
More suggestive are the graphical presentation of trend line between
the studied factors. In figure 1 is presented the polynomial regression (the most representative from 5 types of regression) between yield and Fusarium attack (intensity). More significant (R2= 0.5378**) were the regression between fusarium attack, evaluated by % of ears affected by whitened, from total number of ears.
Figure 3 presents the effect of Fusarium on grains diminution mass (TKW), a crescent intensity of attack affected the gains mass. The evaluation of wheat genotypes resistance by notes or by % of ears whitened seams to be equal (figure 4). This fact is most important in breeding activity when we have to evaluate the reactions to disease of thousands descendents.

27
.
Fig. 1 The regression between Fusarium intensity and yield of genotypes
Fig. 2 The regression between ears attack by Fusarium and yield of genotypes.
y = -8E-06x2 + 0.0726x - 128.55R² = 0.5378**
0
5
10
15
20
25
30
35
40
45
3000 4000 5000 6000 7000
Ears
att
ack
(%)
Yield (kg/ha)
y = 74.164x2 - 993.09x + 7971R² = 0.2047*
3000
3500
4000
4500
5000
5500
6000
6500
0 2 4 6 8 10
Yiel
d (k
g/ha
)
Fusarium intensity (notes)

28
Fig. 3 The relationship between Fusarium intensity and TKW
Fig. 4 The relationship between Fusarium intensity and ears attack
CONCLUSIONS
The unusual attack of Fusarium graminearum during the year 2019
permitted the estimation of genotypes reaction to this disease. The less affected genotypes were: F. 14.078 GP 1, Otilia, Dacic and
Abundent, all of them being new creations. The most affected by Fusarium attack is gains mass and implicitly
yield.
y = -0.1752x2 + 1.3731x + 72.792R² = 0.2273*
70
71
72
73
74
75
76
77
78
79
0 1 2 3 4 5 6 7 8 9
TKW
(g)
Fusarium intensity (notes)
y = -0.9313x2 + 13.515x - 16.609R² = 0.3775**
05
1015202530354045
0 1 2 3 4 5 6 7 8 9
Ears
att
ack
(%)
Fusarium intensity (notes)

29
In estimating genotypes resistance to Fusarium attack, the numbers of ears affected (in %) or intensity attack (evaluated by notes), have the same importance.
REFERENCES
1. Bai, G., Su, Z., Cai, J., 2018, Wheat resistance to Fusarium head blight. Can. Journ.
of Plant Path., 40 (3), pp. 336 – 346. 2. Buerstmayr, M., Steiner, B., Buerstmayr, H., 2019. Breeding for Fusarium head
blight resistance in wheat – Progress and challenges. Plant Breeding, pp. 1 – 26. 3. Bunta, Gh., Bunta, A., 1992. Contribuții la îmbunătățirea metodologiei de apreciere
a rezistenței soiurilor de grâu la fuzarioza spicului (Fusarium sp.). Probl. Genet. Teor. Apl., XXVI, (1-2), pp. 1 – 22.
4. Ittu, M., Craiciu, D., Popescu, Fl., Ioan, G., Cristea, G., 1979, Aspecte genetice ale relațiilor de tip gazdă- parazit in cadrul genului Fusarium. Probl. Genet. Teor. Apl., XI, (3), pp. 193 – 211.
5. Ittu, M., Săulescu, N., N., Ittu, Gh., Moldovan, M., 1989, Elemente noi în strategia ameliorării grâului pentru rezistența la boli. Probl. Genet. Teor. Apl., XXI, (3), pp. 123 – 147.
6. Ma, H., Zhang, X., Yao, Y., Cheng, S., 2019. Breeding for resistance to Fusarium head blight of wheat in China. Front. Agr. Sci. Eng., 6 (3), pp. 251 – 264.
7. Mesterhazy, A., 2001. Breeding for Fusarium head blight resistance in wheat. In Wheat in a global environment, Kluwer Academic Publishers, Neetherlands, Bedo Z. And Lang L. (eds), pp. 353 – 358.
8. Mesterhazy, A., Toth, B., Varga, M., Bartok, T., Szabo-Hever, A., Farady, L., Lehoczki-Krsjak, S., 2011. Role of fungicides, application of nozzle types and the resistance level of wheat varieties in the control of Fusarium head blight and deoxynivalenol. Toxins, 3 (11), pp. 1453 - 1483.
9. Moldovan, M., Negulescu, F., Săulescu, N., N., Botezan, V., Ittu, Gh., Moldovan, V., 1986, Aspecte privind comportarea unor genotipuri de grâu la fuzarioza spicelor. Probl. Genet. Teor. Apl., XVIII, (1), pp. 17 – 40.
10. Moldovan, M., Botezan, V., Moldovan, V., 1988, Cercetări privind determinismul genetic al reacției grâului la fuzarioza spicelor. Probl. Genet. Teor. Apl., XX, (4), pp. 239 – 253.
11. Petersen, S., Lyerly, J.H., Maloney, P.V., Brown-Guedira, G., Cowger, C., Costa, J.M., Dong, Y., Murphy, J.P., 2016, Mapping of Fusarium head blight resistance quantitative trait loci in winter wheat cultivar N.C.- Neuse. Crop Science, 56, pp. 1473 – 1483.
12. Shin, S., Kim, K.-H., Kong, C.-S., Cho, K.-M., Park, C., S., Okagaki, R., Park, J.-K., 2014. A siple method for the assessement of Fusarium head blight resistance in Korean wheat seedlings inoculated with Fusarium graminearum. The Plant Path. Journal, 30 (1), pp. 25 – 32.
13. Spanic, V., Lemmens, M., Drezner, G., Dvojkovic, K., 2011. Interrelations between height of winter wheat genotypes and resistance to Fusarium head blight (FHB). Romanian Agricultural Research, 28, pp. 43 – 48.
14. Tessmann, E.W., 2019. Impact of a warmed environment, spike morphology and genotype on FHB levels in a soft red winter wheat mapping population. Uknowledge, These and Dissertations, Plant and Soil, USA, pp. 1 – 208.

30
15. Tessmann, E.W., Van Sanford, D.A., 2019. Associations between morphological and FHB traits in a soft red winter wheat population. Euphytica, 215:189, https://doi. Org.10.1007/s 10681-019-2509-z.
16. Zhu, Z., Hao, Y., Mergoum, M., Bai, G., Humphreys, G., Cloutier, S., Xia, X., He, Z., 2019, Breeding wheat for resistance to Fusarium head blight in the global North: China, USA and Canada. The Crop Journal, 7 (6), pp. 730 – 738.
17. Xu, K., He, X., Dreisigacker, S., He, Z., Singh, P. K., 2020, Anther extrusion and its association with Fusarium head blight in CIMMYT wheat germplasm. Agronomy, 10 (1), 47; https://doi, org/10.3390/agronomy 10010047.

31
Annals of the University of Oradea, Fascicle: Environmental Protection Vol. XXXV, 2020 Analele Universităţii din Oradea, Fascicula: Protecţia Mediului Vol. XXXV, 2020
RESEARCH ON THE PRODUCTIVITY OF SORGHUM HYBRIDS, IN INAND, BIHOR COUNTY
Chilba Ciprian*, Brejea Radu**, Chilba Raluca*
*National Institute for Variety Testing and Registration, Bucharest 61 Marasti Blvd. Romania, Inand
Variety Testing Center, Inand no. 304, Bihor County. Romania-mail: [email protected], e-mail [email protected]
**University of Oradea, Faculty of Environmental Protection, 26 Gen. Magheru St., 410048, Oradea, Romania, e-mail: [email protected]
Abstract Climate change has become a reality. Modern agriculture will have to look for solutions to
these climate changes. Sorghum is one of the cereals of the future, a plant that easily adapts to water stress conditions, less fertile, eroded soils, a plant that better withstands high temperatures, drought, heat due to the viability of pollen that withstands over 400C and not least sorghum is an ecological plant that absorbs in one year per 1 hectare cultivated over 50 tons of CO2 from the atmosphere. In this paper we studied 3 sorghum hybrids in climatic conditions in Inand, Bihor County an area affected by climate change. Key words: sorghum, hybrid, temperature, rainfall. INTRODUCTION
Grain sorghum is a crop of the future, an alternative to corn cultivation in global warming conditions. Harvested in the form of grains, sorghum has the most diverse uses, from animal or human food to energy biomass.
Agronomical, sorghum benefits from innovations brought by genetics by creating new hybrids with different characteristics such as: high productivity, resistance to various diseases or pests, adaptation to water stress conditions.
Weed control is progressing through the marketing of herbicides, especially against grasses.
The introduction of sorghum into the crop leads to a decrease in pests, it is known for its effects against nematodes.
The use of sorghum is also very effective as an alternative to corn on land heavily affected by Diabrotica.
The ability of sorghum to efficiently extract much of the available mineral nitrogen from the soil makes it a plant with moderate requirements for nitrogen fertilizers, leaving very little mineral nitrogen in the soil, which helps reduce water nitrite pollution. (Prosorgho 2016).

32
MATERIAL AND METHOD
In this paper we set out to study the productivity of some hybrids at Inand in the conditions of 2018. We started to grow 3 sorghum hybrids for grain Es Foehn, Arabesk, Es Shamal which we grew on a plot of 420 m2. When preparing the land we plowed at 22-25 cm, in the spring we carried out a work with the disc harrow in the aggregate with the harrow with adjustable fangs at 8-10 cm depth. Before sowing, we carried out a work with the combine for a better crushing, leveling and laying the soil (Domuta C 2006). Sowing was carried out with the SPC-6 seed drill at a density of 300,000 germinating grains per hectare and at the same time fertilization with 250 kg of complex fertilizers 16.16.16. per hectare. After sowing we performed pre-emergent herbicide dispersion with Dual Gold EC 1.2 liters per hectare. To maintain the sorghum crop when the plant was in the three-leaf stage, a mechanical weeding and fertilization with 100 kg of nitrogen per hectare were carried out. To control weeds in vegetation we carried out an herbicide dispersion with Amino 600 SL 1 liter / ha. The climatic conditions in Inand for 2018 referred to temperature and precipitation. The temperatures for the agricultural year 2018 were noted every day at 700, 1300 and 1700 hours were averaged per day and then per decade and then per month. Precipitation was noted in mm per day then the amount per decade was made and then the amount per month. Physical analyzes, humidity, hectoliter mass were performed with the Perten 5200 A analyzer. The mass of 1000 grains (MMB) is determined after harvest for each hybrid. It is expressed in grams. The seeds are counted randomly and grouped by 10, then grouped by100 and then grouped by 500. The two samples of 500 are weighed separately and the results are collected. The mass of 1000 grains is thus obtained. (State Institute for Variety Testing and Registration 2008)

33
RESULTS AND DISCUSSION
In table 1 we have noted the average temperatures per decade then
the monthly average starting with September 2017 with the beginning of the production cycle and until August 2018. Also in table 1 we have the precipitations per decades, then the total per month. On the last column of the table we have noted the rainy days on the production cycle these totaling 66 days.
Table 1 Temperatures and precipitation recorded in Inand in the agricultural year 2018
MONTH
Temperature ˚C Precipitation mm Decade
I Decade
II Decade
III Monthly average
Decade I
Decade II
Decade III
Whole month
Rainy days
September 2017 19.3 20.9 11.4 17.2 23.1 - 28.2 51.3 4
October 2017 12.2 14.8 8.4 11.8 - - 37.9 - 4
November 2017 6.1 6.4 2.5 5 5.8 8.9 39 53.7 5
December 2017 2.1 3.6 3.2 2.9 28.2 42.5 - 70.7 7
January 2018 4.9 1 1.1 2.3 8.6 14.3 3.8 26.7 4
February 2018 2.9 1.3 -2.9 0.4 41.8 12.2 8.8 62.8 9
March 2018 1.4 4.1 3 2.8 28.8 25.1 22.4 76.3 11 April 2018 14 18.2 20.7 17.6 27.3 - 9.8 37.1 4 May 2018 22 17.8 22.1 20.6 - 33 - 33 5 June 2018 23.2 23.2 22.2 22.9 13.2 25.9 10.1 49.2 4 July 2018 21 22.6 23.3 22.3 34.5 22.9 22.3 79.7 9
August 2018 25.9 26.6 23.7 25.4 - - - - 0

34
In figure 1 we have the graph of the average monthly temperatures, where we can observe the coldest month as February with an average of 0.40C and the warmest month as August with an average temperature of 25.40C.
The average temperature per production cycle is 12.60C, the average temperature higher than those of 1995,1996,1997 when the average annual temperature was 10.70, 10.40 and 10.90C
Fig 1 Graph of monthly average temperatures on the production cycle.
In figure 2 we have the precipitation graph on the production cycle where we can see that in October 2017 and August 2018 we did not have precipitation, and the total amount of precipitation on the production cycle is 540.5 mm.
17,2
11,8
52,9 2,3
0,42,8
17,6
20,622,9 22,3
25,4

35
Fig. 2 Graph of monthly precipitation in mm
Table 2 presents the yield of sorghum hybrids on the plot of 420 m2
and the productions in kg.
Table 2 Productions for sorghum hybrids on the plot
CRT NO
VARIANT PLOT SURFACE IN m2
PRODUCTION/ PLOT IN kg
1 FOEHN 420 290 2 ARABESK 420 284 3 ES SHAMAL 420 297
Table 3 presents the results of the physical analyzes, respectively the
humidity, the mass of 1000 grains (MMB), the hectoliter mass (MHL) and the productions of the hybrids related to the hectare.
Table 3 Hybrid yields per hectare and physical analyzes
CRT NO
VARIANT HUMIDITY %
MMB(g) MHL (Kg)
PRODUCTION / HECTARE IN kg
1 FOEHN 13.1 26 81 6905 2 ARABESK 13.0 24 79 6762 3 ES SHAMAL 12.8 27 81 7071
CONCLUSIONS
The average temperature of the production cycle 2018 from Inand, Bihor county was 12.60C and the precipitations were 540.5 mm in 66 days.
51,3
0
53,770,7
26,7
62,876,3
37,1 3349,2
79,7
00 0 0 0 0 0 0 0 0 0 0 0
Precipitation

36
In these climatic conditions, the best production was obtained for the ES Shamal sorghum hybrid of 7071kg / ha at a humidity of 12.8%, the STAS production at a humidity of 14% is 7169 kg / ha.
The Foehn sorghum hybrid obtained a production of 6905 kg / ha at a humidity of 13.1% and the STAS production is 6977kg / ha.
For the Arabesk sorghum hybrid, the production obtained was 6762kg / ha at a humidity of 13%, the STAS production being 6840 kg / ha.
The Es Shamal hybrid has the largest MMB of 27g and Foehn and Arabesk have 26g and 24g grams respectively.
The hectoliter mass is equal for the Shamal and Foehn hybrids and it is 81 kg and for the Arabesk hybrid it is 79 kg. REFERENCES
1. Borcean I, David Gh., Borcean A., 2006, Techniques for Cultivation and Protection of Cereals and Vegetables West Publishing House Timișoara.
2. Prosorgho 2016 - Grain sorghum, Culture Guide, Arvalis publishing house 3. Suciu Z., Berar V., Lăcătușu N., 1988, Experimental technique guide 4. Pintilie C., Șt Romoșanu, L. Pop, Gh Timariu, P. Sebok, M. Guș 1985,
Agrotechnics Didactic and Pedagogical Publishing House 5. Gh Bîlteanu, A. Vasiliu, I Stancu, V .Velican, A. Canarache 1967- The manual of
the agronomic engineer, agro-forestry publishing house 6. Dragomir N., 2009, Technologies for cultivating annual and perennial forage
grasses.Waldpress Publishing House. 7. Domuţa C. 2006, Differentiated agrotechnics, University of Oradea publishing
house. 8. Borza I.M., A, Ş Stanciu 2010, Phytotechnics, University of Oradea publishing
house. 9. Mureşan T. and Kraus M., 1965, Hybrid sorghum for grains. Agro - Forestry,
publishing house Bucharest. 10. Bandici Gh.E, 2018, Plant physiology, University of Oradea publishing house. 11. State Institute for Variety Testing and Registration Bucharest 2008- Methodology
for examining agronomic and use value. 12. Dragomir N., 1988, Seed production technology for grain sorghum. ICCPT
Fundulea. Production of cereal seeds, vegetables, technical and fodder plants

37
Annals of the University of Oradea, Fascicle: Environmental Protection Vol. XXXV, 2020 Analele Universităţii din Oradea, Fascicula: Protecţia Mediului Vol. XXXV, 2020
RESEARCH REGARDING THE INFLUENCE OF FERTILIZERS ON WINTER WHEAT YIELD AND YIELD QUALITY IN THE
REGION OF CAREI, SATU MARE COUNTY
Covaci Cristian Eugen*
*University of Oradea, Faculty of Environmental Protection, 26 Gen. Magheru St., 410048, Oradea, Romania, e-mail: [email protected]
Abstract
Wheat is one the most important food crops and it is by far the most popular cereal in Europe. Romania is among the six important producers. Nowadays formers are trying to get high grain yields in line with food quality, but at the same time they are trying to minimize production costs and to use environmentally friendly technologies. The objective of this experiment was to clarily the impact of nitrogen fertilization on winter wheat yield and yield quality Nitrogen fertilizer affected significantly the gluten quality parameters of winter wheat. The two year research confirmed significant yield increase until the nitrogen fertilizer rate.
Key words: nitrogen fertilization, grain quality, winter wheat, yield
INTRODUCTION
Wheat is one of the oldest cultivated plants being one of the most adaptable crop plants at various environmental conditions, with a very wide ecological plasticity to pedo-climatic conditions, occupying the largest agricultural area (Bradshaw, 2016) and benefiting from efficient biological mechanisms in adaptation to soil conditions (Stoian et al., 2015).
Winter wheat is the most widely grown winter cereal in Romania and farms are increasingly striving to use agrotechnical measures that reduce production costs. Nowadays, not only yield amount but also the quality of the produced grain is important, because the quality of grains determines their direction of use. That is why formers are trying to get high grain yields in line with food (accepted for bread baking) quality, while minimize production costs and using environmentally friendly technologies.
Wheat flour plays a very important role in our daily diet, which is the basic material of many industries. The quality parameters of wheat can be affected by many agrotechnical factors (Erdei, Szaniel, 1975). Considering these factors, one of ten most important is proper nutritional supply, which can be achieved by artificial fertilizing (Gyori, Gyorine, 1998).
Optimal nutrient provision is an important factor to get high yield with high grain quality. Nitrogen is one of the most important elements of plant nutrition, which often to a great extent determines not only wheat yield level, but especially grain baking quality. It is also one of the most mobile plant nutrients in the soil. Therefore, it is important to evaluate the use of

38
high nitrogrn fertilizer rates, because unsuitable nitrogen doses lead to increased nitrate leaching which contributes to eutrophication of surface waters.
It is important to look cost effictive and environmentally friendly rates of N-fertilizers in different tillage systems with different forecrops for winter wheat.
The objective of this experiment was to clarity the nitrogen fertilization impact on winter wheat yield and yield quality.
The recommended optimal N-fertilizers dosage is between 120-150 kg/ha (Asthir et al., 2017) to realize yield and quality potential of the genotype, to avoid nitrogen leaching out and plant lodging. Nitrogen fertilizing can affect significantly the ratio and the amount of gluten proteins (Wieser, Seilmeier, 1998), therefore the baking test volume and the gluten spreading (GS) as well (Pollhamer, 1973).
Balanced fertilization ensures high productivity of wheat and nitrogen is considered as the most influential factor for good bread making quality. Accordingly, there are many studies concerning correlations between fertilization and yield components or quality parameters for wheat.
The important changes in fertilization practices are associated with aforementioned environmental aspects but also economic ones: fabrication of mineral nitrogen is costly and energy consuming (Buchi et al., 2016).
Other important aspect is related with nitrogen fertilizer type and application manner in order to obtain the best yield and quality parameters. There are inconsistent opinions regarding comparisons between liquid and dry nitrogen sources for wheat crop.
Some studies concerning the efficiency of splitting of nitrogen doses on yield indicated that the application of nitrogen in more than two splits increased grain weight per year. It is recomended to add 120 kg/ha in four splits to obtain the best result of qualitity and quality of the wheat. MATERIAL AND METHOD
Experimental research was carried ont in the region of Carei, Satu Mare county, for this experiment were chosen Combin, Falado and Sorrial varieties.
The studies were carried out between 2018 and 2020 using the above mentioned winter wheat varietes on a 3 ha lot, each winter wheat variety was cultivated on 1 ha, the soil type was Cambic chernozem. The area had medium humus content, medium phosphorus and potassium supply and neutral PH. The forecrop of the experiment was maize. For all three wheat varieties were adopted the same technology and phytosanitary treatments. The 50% of nitrogen and the whole amount of the phosphorus and
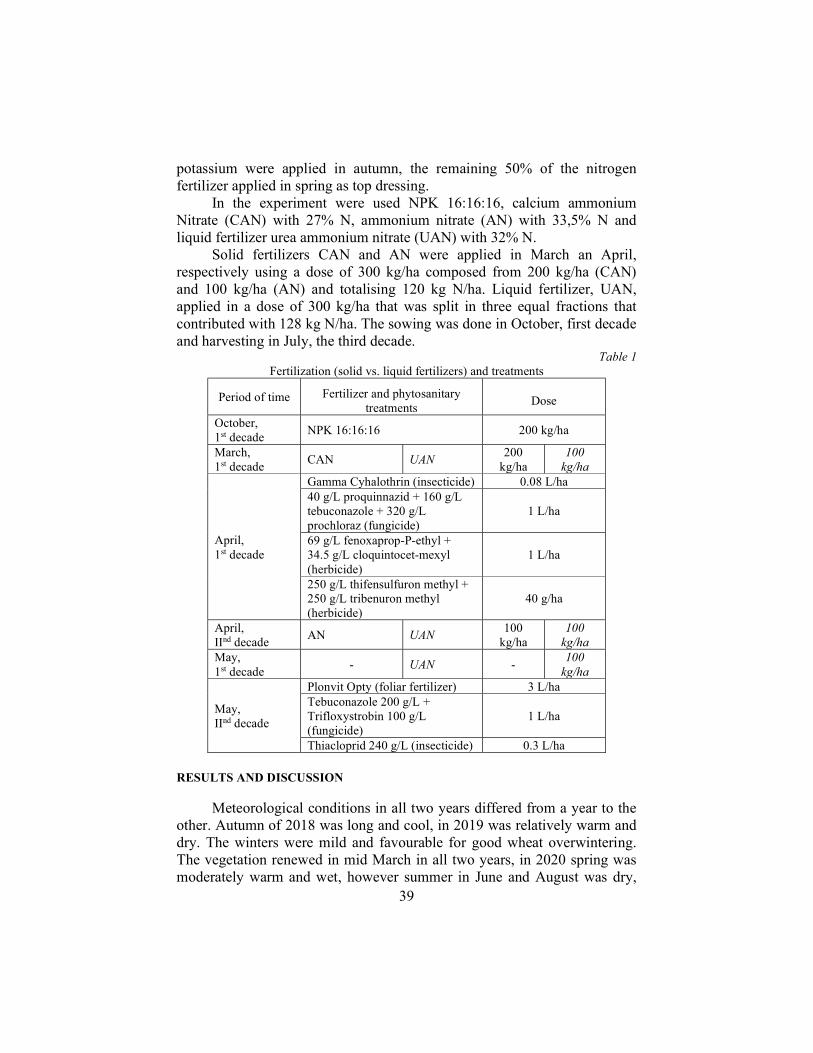
39
potassium were applied in autumn, the remaining 50% of the nitrogen fertilizer applied in spring as top dressing.
In the experiment were used NPK 16:16:16, calcium ammonium Nitrate (CAN) with 27% N, ammonium nitrate (AN) with 33,5% N and liquid fertilizer urea ammonium nitrate (UAN) with 32% N.
Solid fertilizers CAN and AN were applied in March an April, respectively using a dose of 300 kg/ha composed from 200 kg/ha (CAN) and 100 kg/ha (AN) and totalising 120 kg N/ha. Liquid fertilizer, UAN, applied in a dose of 300 kg/ha that was split in three equal fractions that contributed with 128 kg N/ha. The sowing was done in October, first decade and harvesting in July, the third decade.
Table 1 Fertilization (solid vs. liquid fertilizers) and treatments
Period of time Fertilizer and phytosanitary treatments
Dose
October, 1st decade
NPK 16:16:16 200 kg/ha
March, 1st decade
CAN UAN 200
kg/ha 100
kg/ha
April, 1st decade
Gamma Cyhalothrin (insecticide) 0.08 L/ha 40 g/L proquinnazid + 160 g/L tebuconazole + 320 g/L prochloraz (fungicide)
1 L/ha
69 g/L fenoxaprop-P-ethyl + 34.5 g/L cloquintocet-mexyl (herbicide)
1 L/ha
250 g/L thifensulfuron methyl + 250 g/L tribenuron methyl (herbicide)
40 g/ha
April, IInd decade
AN UAN 100
kg/ha 100
kg/ha May, 1st decade
- UAN - 100
kg/ha
May, IInd decade
Plonvit Opty (foliar fertilizer) 3 L/ha Tebuconazole 200 g/L + Trifloxystrobin 100 g/L (fungicide)
1 L/ha
Thiacloprid 240 g/L (insecticide) 0.3 L/ha
RESULTS AND DISCUSSION
Meteorological conditions in all two years differed from a year to the other. Autumn of 2018 was long and cool, in 2019 was relatively warm and dry. The winters were mild and favourable for good wheat overwintering. The vegetation renewed in mid March in all two years, in 2020 spring was moderately warm and wet, however summer in June and August was dry,

40
but July was characterized by high rainfall. The results showed that the average wheat grain yield was very high in all two years of research.
After harvesting the whole plots, yield was weightened, grain purity and moisture content detected, and yield data was recalculated to standard moisture (14%) and 100% purity. The nitrogen fertilization rate increased significantly the average grain yield in all two years.The maize forecrop did not exploit the nutrient and water supplies of the soil and created favourable conditions for winter wheat.
The results concerning yield related to mineral fertilization and wheat varieties indicated that using liquid fertilizer (UAN) by splitting the total dose (300 kg/ha) in three equal fractions lead to the highest yields for all three wheat varieties.
The results imdicated that yusing liquid fertilizer (UA/n) bu splitting the total dose (300 kg/ha) in three equal fractions lead to the highest yields for all three wheat varieties in the two years of research (6830 kg/ha in 2018-2019 for Combin, 6790 kg/ha in the years 2019-2020), the other two types had the following results: in the years 2018-2019, Sorrial: 6510 kg/ha, Falado: 6500 kg/ha; in the year 2019-2020 the results were similar for these two types: Sorrial 6480 kg/ha, Falado 6460 kg/ha.
Table 2
Influnce of wheat variety and of mineral fertilization on yield (kg/ha) in the years 2018-2019
Yield, kg/ha fertilization
wheat variety
Starter Starter+CAN+AN Starter+UAN
Combin 5810 6190 6830 Falado 5650 6020 6510 Sorrial 5610 5980 6500
Table 3
Influnce of wheat variety and of mineral fertilization on yield (kg/ha) in the years 2019-2020
Yield, kg/ha fertilization
wheat variety
Starter Starter+CAN+AN Starter+UAN
Combin 5770 6080 6790 Falado 5610 5940 6480 Sorrial 5560 5880 6460
Comparing all three wheat varietes it may be noticed that the same
fertilization level conducted to higher yields for Combin.

41
CONCLUSIONS
Winter wheat yield has been significantly affected by nitrogen fertilizer rate, conditions of growing year. Average yield increased significantly until the nitrogen fertilizer. The gluten quality parameters of winter wheat were significantly influenced by fertlizing and cultivers.
The experimental results allowed obtaining the conclusions below: 1. The application of liquid fertilizer UAN in three fractions produced the highest yields for all three wheat varieties. 2. Wet gluten and protein contents increased with nitrogen fertilization and fractionate application of UAN.
The results of the study suggested that choice of nitrogen fertilizers might be important in winter wheat culture, with positive results obtained with UAN explained by reduced mineralization of these fertilizers due to dry weather conditions in spring inducing better nitrogen availability during protein storage.
As a general conclusion, application of fertilizers by splitting the total dose in three equal fractions, conducted to the best values for yield components and quality parameters.
REFERENCES
1. Asthir B., Jain D., Kaur B., Bains N.S., 2017, Effect of nitrogen on strach and protein content in grain influence of nitrogen doses on grain starch and protein accumulation in diversified wheat genotypes. Journal of Environmental Biology, vol. 38
2. Boeriu I., Eustatiu M., 1973, Cultua graului. Ed Ceres din Bucuresti 3. Borcean I., Borcean A., David G., 2002, Cultura si protectia plantelor. Ed.
Agroprint din Timisoara 4. Bradshaw JE, 2016, Plant breeding: Past, Present and Future. Ed. Springer,
Edinbutgh, UK 5. Buchi L., Charles R., Schneider D., Maltas A., Fossati D., Mascher F., 2016,
Performance of eleven winterwheat varities in a long term experiment on mineral nitrogen an organic fertilization, Field Crops Research
6. Ceapoiu N., 1984, Graul. Ed. Academiei din Bucuresti 7. David G., 2003, Tehnologia plantelor de camp. Ed. Eurobit din Timisoara 8. Domuta C., 2005, Agrotehnica terenurilor in panta nord-vestul Romaniei . Ed.
Universitatii din Oradea 9. Domuta C., 2006, Agrotehnica diferentiata. Ed. Universitatii din Oradea 10. Erdei P., Szaniel I., 1975, A minosegi buza termesztese. Konyvkiado 11. Gyori Z., Gyorine I.M., 1998, A buza minosege es minositese. Mezogazdasagi
Szaktidas Kiado, Budapest 12. Laura Paulette,2008–Pedologie, Editura Todesco, Cluj Napoca 13. Muntean L. S., Roman G. V., Borcean I., Axinte M., 2003, Fitotehnie. Ed. Ion
Ionescu de la Brad din Iasi 14. Oancea I., 2012, Tehnologii agricole performante. Ed. Ceres din Bucuresti

42
15. Pollhamer E., 1973, A buza minosege a kulonbozo agrotechnikai kiserletekben, Akademiai Kiado, Budapest
16. Povara R., 2001, Riscul meteorologic in agricultura. Graul de toamna. Ed. Economica din Bucuresti
17. Racz I., Has I., Moldovan V. Kadar R., Ceclan OA., 2014, Stability evaluation of yield and its main components in a set of winter varieties, Analele I.N.C.D.A. Fundulea
18. Rusu T., 2005, Agrotehnica. Ed. Risoprint din Cluj-Napoca 19. Saulescu N., 1984, Ameliorarea graului. Ed. Academiei din Bucuresti 20. Stoian V., Vidican R., Rotar I. Anitei M. 2015, Mycorhizal networks in a fertilized
winter wheat crop, Agronomy Series of Scientific Research/Lucrari Stiintifice Seria Agronomie, 58(1)
21. Szekely E., Kadar R., Moldovan V., Has I., 2010, Studiul variabilitatii unor insusiri morfo fiziologice si de calitate in cadrul colectiei de grau de toamna. Analele I.N.C.D.A. Fundulea
22. Wieser H., Seilmeier W., 1998, The Influence on Nitrogen Fertilisation on Quanties and Proportions of Different Protein Types in Wheat Flour, J. Sci. Food Agriculture, 76
23. Zahan P., Bandici G., 1999, Agrotehnica solurilor acide din nord-vestul Romaniei, Ed. Universitatii din Oradea

43
Annals of the University of Oradea, Fascicle: Environmental Protection Vol. XXXV, 2020 Analele Universităţii din Oradea, Fascicula: Protecţia Mediului Vol. XXXV, 2020
THE ALLELOPATHIC EFFECTS OF SOME ESSENTIAL OIL ON THE BIOTEST SPECIES SINAPIS ALBA L.
Creț Adina*, Chiș Carmen**, Şipoș Monica٭٭٭
,.University of Oradea, B. Sc. student in Biology, Informatics and Science Faculty, 1Universitatii St ٭
Oradea, Romania **Onisifor Ghibu" College, 3 Onisifor Ghibu St, Oradea, Romania
***University of Oradea, Biology Department, Informatics and Science Faculty, 1Universitatii St., Oradea, Romania, e-mail: [email protected]
Abstract
This paper study the allelopathic effects of allyl isothiocyanate, rosemary, clove, pine and eucalyptus essential oil dilution (0.2; 0.1; 0.02; 0.01; 0.002 and 0.001%) on seed germination ability and seedling growth of biotest species Sinapis alba L. The dilutions 0.2% and 0.1% of clove and allyl isothiocyanate essential oils totally inhibited the germination capacity of the white mustard seeds. The major component from the essential oil of clove named eugenol can be a natural herbicide. At Sinapis alba L. significantly inhibited the growth of hypocotyls. The descending order regarding the allelopathic inhibitory efficiency of the essential oils on seedling growth of biotest species Sinapis alba L. was the following: allyl isothiocyanate, clove, eucalyptus, rosemary and pine.
Key words: allyl isothiocyanate, rosemary, clove, pine and eucalyptus essential oil, Sinapis alba L., allelopathy INTRODUCTION The future research can be focused on developing a natural plant products as an environmentally safe herbicide in replacement to the harmful chemical herbicides.Thus is expected that the chemical herbicide will be strictly limited. The natural products with inhibitory allelopathic effects will be used for weeds control (Muhammad et al., 2019). The researches aim at using essential oils extracted from plants like herbicides raised (Sarić-Krsmanović et al., 2019). Many studies investigated the rosemary (Chen et al., 2013; Frabboni et al., 2019; Maccioni et al., 2020), clove (Mayer et al., 2008; Ahuja et al., 2015), pine (Ibánez et al., 2019) or eucalyptus (Aragao et al., 2015; Benchaa et al. 2018) essential oil allelopathic potential against weeds. Other paper study the allelopathic effects of different dilution with allyl isothiocyanate oil on caryopses germination ability and seedling growth of different cereal varieties (Șipoș et al., 2016; Bortiș et Șipoș, 2018).

44
MATERIAL AND METHOD The experiments were carried out in the greenhouse of the University of Oradea and we used the seeds of Sinapis alba L. (white mustards). The mustard germinative faculty (FG) was tested and the value was above 80%. The oils with allelopathic effect were used: Sigma-Aldrich pure allyl isothiocyanate (mustard oil), rosemary, clove, pine and eucalyptus essential oils. The essential oils produced by Fares Laboratories had the following chemical composition:
Rosmarinus aetheroleum (rosemary oil from leaves and branches) - α - pinene, camphene, limonene, 1-8 cineole, camphor, linalool, bornyl acetate.
Caryophyllus aromaticus floris aetheroleum (clove oil from flowers) -eugenol 70-90%, caryophyllene, eugenyl acetate.
Pinus sylvestris aetheroleum (pine oil from leaves) - α - pinene, β - pinene, sabinene, myrcene, limonene, phallandrene.
Eucalyphtus globulus aetheroleum (eucalyptus oil from leaves) - 1-8 cineole, α - pinene. These were dispersed in water by ultrasonication with the Emmi-04D device with frequency 40 KHz. A quantity of 100 ml of distilled water and an amount of 0.2 ml of essential oil were introduced in an Erlenmayer glass with a glass stopper. After the ultrasonication for 15 minutes at water temperature a solution with a concentration of 0.2% (V1) was obtained. With graduated cylinders and distilled water, dilutions of 0.1%, 0.02%, 0.01%, 0.002% and 0.001% were made. These represented the experimental variants (V2, V3, V4 , V5 and V6). Transparent and colourless plastic casseroles were used for germination. The filtered paper moistened with 30 ml of distilled water or the same amount with different dilutions of used oils was placed inside. For all experimental variants and control lots 50 mustard seeds were placed in each casserole. The germinators were kept at room temperature and semi-darkness (T = 21-23°C). The germination ability was determinate after 9 day. For seedling growth length of the embryonic root and hypocotyle of the Sinapis alba L. plantlet was determinate. Statistical analysis included: arithmetic media (M) and Student’s test (SigmaPlot 2001 software). The control arithmetic media was considered 100%. Percentage differences relative to the control of the biotest species Sinapis alba L. grown on various dilutions (V1-V6) of essential oils and their statistical significance (a-significant p <0.05; b-insignificant p> 0.05).

45
RESULTS AND DISCUSSION The dilutions 0.2% (V1) and 0.1% (V2) of allyl isothiocyanate essential oil completely inhibited the germination of the white mustard seeds (Table 1). The 0.02% allyl isothiocyanate solution (V3) significantly inhibited the growth in length of the roots of white mustard seedlings. Other dilutions (V4, V5 and V6) also caused inhibitions but statistically insignificant. The growth in length of the hypocotyls in the experimental variant V3 were -10.21% ( p> 0.05). The experimental variants (V4, V5 and V6) longer lengths of hypocotyls were recorded but these were statistically insignificant (see Table 2). The allelopathic substances at low concentrations cause an elongation of the vegetative organs of the seedlings. In conclusion, in the case of the allyl isothiocyanate, the concentration of 0.02% (V3) determined significant inhibitions of biotest seedling growth. The following dilutions (V4-0.01%; V5-0.002%; V6-0.001%) caused insignificant inhibitions of root growth and elongations of the hypocotyls.
Table 1 The germination faculties of the seeds of the biotest species Sinapis alba L. in control groups and various dilutions (V1-V6) of essential oils (allyl isothiocyanate, rosemary,
clove, pine, eucalyptus) Germination of Sinapis alba L. seeds
Control sample
V1 0.2%
V2 0.1%
V3 0.02%
V4 0.01%
V5 0.002%
V6 0.001%
Allyl isothiocyanate
80% 74% 62% 66% 64%
Rosemary 82% 68% 62% 72% 72% 68% 80% Clove 82% 70% 72% 62% 78% Pine 81% 72% 74% 70% 90% 70% 76% Eucalyptus 82% 74% 84% 80% 78% 72% 80% The germination of the seeds of the biotest species Sinapis alba L. was not significantly affected by any of the dilutions of rosemary essential oil used by us in the study (Table 1). Mustard roots growth were insignificantly inhibited in V1 dilution (0.2%). In the case of the dilutions V2 (0.1%), V3 (0.02%), V5 (0.002%) and V6 (0.001%) elongation of the roots were observed. In fact the V2-V6 dilutions of rosemary essential oil were not phytotoxic for the roots. The growth in length of hypocotyls of white mustard seedlings was not significantly influenced (see Table 2). In the case of dilutions 0.2% (V1) and 0.1% (V2) of clove essential oil the germination of white mustard seeds was completely inhibited. The other dilutions considered in the study (V3-V6) did not substantially affect seeds germination (Table 1). Under the action of experimental dilutions V3-V6 of clove essential oil growth of roots of the mustard seedlings were

46
predominantly stimulated. The hypocotyls were inhibited. This result might be explained by the fact that the allelopathic substance eugenol (volatile phenolic constituent, 70-90% in the essential clove oil used by us) spread in the environment inside the germinators. The concentration of eugenol significantly inhibited the growth of hypocotyls (-47.47% in the case of experimental variant V3).
Table 2 Percentage differences relative to the control samples (considered 100%) regarding the
growth in length of the embryonic roots and hypocotyls of the biotest species Sinapis alba L. in various dilutions (V1-V6) of essential oils (allyl isothiocyanate, rosemary, cloves, pine, eucalyptus) and their statistical significance (a-significant p <0.05; b-insignificant p> 0.05)
Essential oils
Sinapis alba L. - vegetative organs
V1 0.2%
V2 0.1%
V3 0.02%
V4 0.01%
V5 0.002%
V6 0.001%
Allyl isothiocyanat
Root - - -28.91 % a
-12.21% b
-17.15% b
-14.23% b
Hypocotyl - - -10.21% b
+8.74% b
+15.46% b
+12.64% b
Rosemary Root -17.94% b
+2.65% b
+21.77% b
+26.37% b
+4.76% b
+11.96% b
Hypocotyl +3.19% b
-9.45% b
+6.6% b
-0.31% b
+4.23% b
-0.04% b
Clove Root - - +21.08% b
+11.11% b
+13.07% b
-1.82% b
Hypocotyl - - -47.47% a
-12.13% a
-21.27% a
-6.88% b
Pine Root -5.77% b
+15.29% b
+31.97% a
+23.57% a
+30.89% a
+52.30% a
Hypocotyl +7.87% b
+3.22% b
+11.71% b
-8.35% b
+1.24% b
+2.68% b
Eucalyptus Root -24.39% a
+10.22% b
-2.91% b
-15.19% b
-18.95% b
-12.85% b
Hypocotyl +7.63% b
-1.81% b
+8.79% b
+4.24% b
+0.14% b
-1.92% b
The germination of white mustard seeds was not affected by any of the dilutions of pine essential oil considered by us in the study (Table 1). The growth in the length of the mustard roots was insignificant inhibited (p>0.05) only in the case of V1 dilution (0.2%). The V2 (0.1%) and V3, V4, V5, V6 dilutions caused elongations of the roots (see Table 2). The growth

47
in the length of the hypocotyls of the white mustard seedlings was insignificantly influenced. The germination of white mustard seeds was not affected by any dilutions of the eucalyptus essential oil (Table 1). Mustard seedling roots were significantly inhibited in the case of V1 dilution (0.2%). The influences were insignificant at the dilution of V2 (0.1%) solution of eucalyptus essential oil. The insignificant stimulation was observed at the dilutions V3, V4, V5 and at V6 the inhibition was insignificant. In the case of hypocotyls stimulations from dilutions (V1, V3, V4 and V5) and inhibitions from dilutions (V2 and V6) were insignificant. CONCLUSIONS 1. The dilutions V1 (0.2%) and V2 (0.1%) of clove and allyl isothiocyanate essential oils proved to be phytotoxic. They totally inhibited the germination capacity of the white mustard seeds. 2. In the case of allyl isothiocyanate the concentration of 0.02% (V3) proved to be phytotoxic. It caused significant inhibitions of the roots. 3. The dilution of 0.02% (V3) of clove essential oil significantly inhibited the growth of hypocotyls (-47.47%). The volatile phenolic constituent eugenol (70-90% in the clove essential oil used by us) spread inside the environment of the germinators. 4. Mustard seedling roots were significantly inhibited at V1 dilution (0.2%) of eucalyptus essential oil. In the experimental variants V2-V6 (0.1%; 0.02%; 0.01%; 0.002%; 0.001%) the influences on the growth in length of the seedling organs were insignificant. 5. In the case of rosemary and pine essential oil dilution we observed that in V1 dilution (0.2%) mustard roots growth were insignificantly inhibited. The dilutions V2-V6 determined elongation of the roots. The growth in length of hypocotyls of white mustard seedlings was not significantly influenced. 6. The descending order regarding the allelopathic inhibitory efficiency of the essential oils on seedling growth of biotest species Sinapis alba L. was the following: allyl isothiocyanate, clove, eucalyptus, rosemary and pine. Acknowledgment: We wish to thanks for support by non-reimbursable funds to Direction of Project Development and Implementation (DDIP) of Bihor county. REFERENCES
1. Ahuja, N., Batish, D.R., Singh, H.P., Kohli, R.K., 2015, Herbicidal activity of eugenol towards some grassy and broad-leaved weeds, Journal of Pest Science, 88 (1), pp. 209-218

48
2. Aragao, F. B., Palmieri, M. J., Ferreira, A. , Costa, A. V., Queiroz, V. T., Pinheiro,P. F., Andrade-Vieira, L. F., 2015, Phytotoxic and cytotoxic effects of Eucalyptus essential oil on lettuce (Lactuca sativa L.), Allelopathy Journal 35 (1), pp.259-272
3. Benchaa, S., Hazzid, M., Abdelkrim, H., 2018, Allelopathic effect of Eucalyptus citriodora esential oil and its potential use as bioherbicide, Chemistry & Biodiversity 15 (8); https://doi.org/10.1002/cbdv.201800202
4. Bortiș, R., Șipoș, M., 2018, Interferențe alelopatice în germinație și creștere la grâu și muștarul alb, Științe exacte și științe ale naturii, Vol. X, pp.33-36
5. Chen, F., Peng, S., Chen, B., Ni, G., Liao, H., 2013, Allelopathic potential and volatile compounds of Rosmarinus officinalis L. against weeds, Allelopathy Journal, 32 (1), pp. 57-66
6. Frabboni, L., Tarantino, A., Petruzzi, F., Disciglio, F., 2019, Bio-Herbicidal effects of oregano and rosemary essential oils on chamomile ( Matricaria chamomilla L.)crop in organic farming system, Agronomy, 9(9), 475; https://doi.org/10.3390/agronomy9090475
7. Ibánez, M.D., Blázquez, M.A., 2019, Phytotoxic effects of commercial Eucalyptus citriodora, Lavandula angustifolia and Pinus sylvestris essential oils on weeds, crops and invasive species, Molecules, 24(15), 2847;https://doi.org/10.3390/molecules24152847
8. Maccioni, A., Santo, A., Falconieri, D.,Piras, A., Farris, E., Maxia, A., Bacchetta, G., 2020, Phytotoxic effects of Salvia rosmarinus essential oil on Acacia saligna seedling growth, Flora 269, 151639; https://doi.org/10.1016/j.flora.2020.151639
9. Muhammad, Z., Inayat, N., Majeed, A., Rehmanullah, A. H., Ullah, K., 2019, Allelopathy and agricultural sustenability: Implication in weed management and crop protection - an overview, European Journal of Ecology, 5 (2), pp. 54-61; https://doi.org/10.2478/eje-2019-0014
10. Sarić-Krsmanović, M., Umiljendić, J.G., Radivojević, L., Šantrić, L., Potočnik, I., Durović-Pejčev, R., 2019, Bio-herbicidal effects of five essentisl oils on germination and early seedling growth of velvetleaf (Abutilon theophrasti Medik.), Journal of Environmental Science and Healt, 54(4), pp. 247-251; https://doi.org/10.1080/03601234.2018.1550309
11. Şipoș M., Bandici Gh, Pop V., 2016, Allelopathic effects of allyl isothiocyanate on caryopses germination ability and seedling growth Triticosecale Witt. and Triticum aestivum L., Analele Univ. Oradea, Fascicula Protectia Mediului, Vol. XXVI, pp.65-70
12. http://www.essentialoils.co.za/essential-oils/mustard.htm#Chemical

49
Annals of the University of Oradea, Fascicle: Environmental Protection Vol. XXXV, 2020 Analele Universităţii din Oradea, Fascicula: Protecţia Mediului Vol. XXXV, 2020
COMPARISON OF ANTIOXIDANT ACTIVITY BETWEEN ROSA CANINA L. AND HIPPOPHAE RHAMNOIDES L. HARVESTED
FROM ROMANIA
Dejeu Ioana Lavinia*, Frenț Olimpia Daniela*, Sacalîș Ileana**, Zbârcea Claudia***, Marian Eleonora*, Bodea Anca Salomea****
*University of Oradea, Faculty of Medicine and Pharmacy, 29 N. Jiga St., 410028, Oradea, Romania
e-mail: [email protected] **Pharmacist
***Secondary School “Mrs. Oltea”, Oradea, Romania ****County Clinic Emergency Hospital Oradea, Department of Dermatology, Oradea, Romania
Abstract
Rosa canina L. is a medicinal plant used in traditional folk medicine with good results in arthritis, rheumatism, gout, fever, gastrointestinal disorders. Rosa canina fruits and hips contain a large amount of Vitamin C. The rose hips are used for the production of jams, jellies or beverages.
Hippophae rhamnoides L. known as sea buckthorn contains antibacterial, anti-fungal, anti-sebum properties and also is a good source of Vitamin C. Sea buckthorn is a valuable plant because it contains flavonoids, carotenoids, minerals and Omega 3. The aim of the present study was to investigate the antioxidant activity of rosehip and sea buckthorn fruits harvested from two sources from Romania and we observed that the highest concentration of polyphenols and antioxidant activity (by FRAP, DPPH methods) is found in the ethanolic extract of rosehip fruits, regardless of the area from which they were harvested and the highest concentration of flavonoids is in the ethanolic extract from sea buckthorn fruits. Key words: Rosa canina L., medicinal plant, Vitamin C, sea buckthorn, antioxidant INTRODUCTION
Rosa canina L. is a medicinal plant with therapeutic activities against arthritis, rheumatism, gout, sciatica, fever, colds, gastrointestinal disorders, gastric ulcers, gallstones and it is used for its anti-inflammatory, laxative, astringent, antioxidant and diuretic effect (Orhan et al., 2009).
The vegetable product of Rosa Canina, rosehip, is a shrub up to 3 meters tall, thorny, very common near fences, meadows, in the forest, from the Black Sea area to the mountain regions at an altitude of 1700 meters. Rosa canina fruits are a valuable source of polyphenols and vitamin C (Fig. 1) (Fan et al., 2014).
Fig. 1. Rosa Canina plant and fruits

50
It is also called field rose and wild rose and is widespread in Europe, West Asia and North Africa. In the spontaneous flora of our country we find 30 species of rosehip, of which 8 are also cultivated (Palade, 1998, Pârvu, 2002). Flowers, leaves and fruits can be used from rosehip. The flowers and leaves are harvested only in May and June, and the fruits are harvested from late July, August, early September, when they are still pleasant-looking red-orange and have the highest content of vitamin C.
Hippophae rhamnoides L. from the Elaeagnaceae Family is also called Sea buckthorn, blue sea buckthorn, spiny sea buckthorn, river-sea buckthorn, is a bushy, rustic shrub, found in clusters or extensive bushes, on the banks of rivers, stony shores, especially on the geological formations of the salt marshes, mountainous, in cold-temperature regions of Northern Europe, China, Mongolia and Russia (Fig. 2) (Tkacz et al., 2019). In the Alps it can be found even at an altitude of 2000 meters, and in the Himalayas it can be found even at an altitude of 5000 meters (Palade M, 1998, Tița, 2005).
In Romania we can find it in large areas in the Subcarpathians of Muntenia and Moldova, in the Bistrița Valley and the Siret Valley. Today sea buckthorn is considered one of the most valuable species because it contains flavonoids, carotenoids, minerals, Omega 3 and has antibacterial, anti-sebum, antifungal properties (Pundir et al., 2020).
Fig. 2. Hippophae rhamnoides L. plant and fruits
The fruit of Hippophae rhamnoides L. is used as a food with high
nutritional and medicinal values and is a good source of vitamin C (500-900 mg/100g) (Fig. 2) (Bal et al., 2011, Ma et al., 2020, Makovics-Zsohar et al., 2014). MATERIAL AND METHOD
Materials: in this study we compared the antioxidant activity of rosehip and sea buckthorn fruits from two sources: sea buckthorn fruits harvested from Bihor county, Oradea area and Maramureș county, Berbești area and rosehip fruits harvested from Bihor county, Oradea area and Maramureș county, Berbești area.

51
Methods: The sea buckthorn fruits were harvested by hand in October 2018, when their color was yellow-orange and the taste was sour, slightly astringent, and the rose hips in September 2018, when the fruits change from reddish to red-orange. Sea buckthorn and rosehip fruits were harvested from two areas of Romania, the northern area, Maramureș County and the northwestern area, Bihor County.
The fruits were harvested without any impurities (leaves) or unripe fruits. The washing was done in several waters, and for the rosehips the darker end was cleaned. Drying was performed in a drying chamber at a temperature of 30-35°C for 24 hours. The extraction was performed for 90 minutes, using a Soxhlet device, and methyl alcohol as solvent, purchased from Silver Chemicals, Romania.
The obtained extracts were concentrated with a rotary evaporator at a temperature of 40°C, at 80 rpm and a pressure of 200 atm, and then ethyl alcohol was added.
Determination of the total polyphenols, total flavonoids and antioxidant activity of the extracts was performed by spectrophotometric methods, using a UV-VIS PG Instruments T70 spectrophotometer. RESULTS AND DISCUSSION
Determination of the total polyphenol content by the Folin-Ciocâlteu method: 1.7 mL deionized water, 0.2 mL Folin-Ciocâlteu reagent, 1 mL Na2CO3 solution of 20% concentration are added to 0.1 mL alcoholic extract, kept in the dark for 90 minutes and read the absorbance at 765 nm. Then we calculate the total polyphenol concentration using the regression equation; the concentration in total polyphenols of the extracts.
The results are expressed in milliequivalents of gallic acid GAE/100 g DW (dry sample) (Everette et al., 2010, Ikawa et al., 2003, Jurca et al., 2016).
The results obtained for total polyphenols by the Folin-Ciocâlteu method for the four samples are shown in Table 1.
From the analysis of the data provided by Table 1 it is observed that the highest concentration of total polyphenols is found in the ethanolic rosehip extract from Bihor (536.43 ± 5.19 mg GAE/100 g dry matter), followed by the ethanolic rosehip extract from Maramureș (523.18 ± 4.73 mg GAE/100 g dry matter), the differences not being significant. The results obtained are consistent with other determinations made by other researchers (541.12 mg GAE/100g dry matter), who placed in descending order the content of total polyphenols several species of Rosa: R. spinosissima> R. canina> R. rugosa> R. gallica (Koczka et al., 2018).

52
Table 1 Calculation of the average total polyphenol concentration of rosehip and sea buckthorn fruit extracts expressed in
mg GAE/100 g dry product Sample Absorbance
sample read at 765 nm
Sample concentration (mg GAE/100
g dried substance)
Average sample concentration (mg GAE/100 g dried substance)
Rosehip from Bihor
0.725 531.241 536.432±5.191 0.742 543.472
0.730 534.583 Rosehip
from Maramureș
0.713 521.880 523.183±4.731 0.721 527.915
0.710 519.764 Sea
buckthorn from Bihor
0.347 251.182 247.772±3.411 0.339 244.953
0.342 247.171
Sea buckthorn
from Maramureș
0.349 252.645 256.653±4.161 0.355 256.802
0.360 260.502
Other data obtained for Rosa canina L. were: Roman et al. (Roman
et al., 2013) found a TPC range of 326 mg to 575 mg GAE/100 g DW, Yoo et al. (Yoo et al., 2008) determined 818 mg GAE/100 g DW in extracts obtained with water extraction solvent, Fattahi et al. (Fattahi S. et al., 2012) found 180-225 mg GAE / 100 g DW, Yilmaz and Ercisli et al. (Yilmaz Ercisli, 2011) 102 mg GAE / 100 g DW and Barros et al. (Barros et al., 2011) 149.35 mg GAE / g extract in methanolic extracts.
The data in the literature are very varied, so the total polyphenol content depends on the extraction solvent and the geographical area from which the rosehip fruits were harvested. It was also noted that a higher polyphenol content and antioxidant activity were obtained for alcoholic, methanolic or ethanolic extracts from various plant products, compared to extracts obtained with water as a solvent. For these reasons, in recent scientific studies, alcohol extraction is more frequently used than water extraction to determine the antioxidant properties of various plant products (Koczka et al., 2018).

53
From the analysis of the data provided in Table 1 it is observed that the highest concentration of total polyphenols is found in the sea buckthorn ethanolic extract from Maramureș (256.65 ± 4.16), followed by the sea buckthorn ethanolic extract from Bihor (247.77 ± 3.41), the differences not being significant.
The determination of the total flavonoid content was done using a colorimetric method described in other studies (Jurca et al., 2016, Kim et al., 2003). The flavonoid concentration of the fruit extract samples was expressed in mg equivalents gram of quercetin / mL.
The results of the analyzes are shown in Table 2. Table 2
Calculation of the average flavonoid concentration of ethanolic fruit extracts (rosehip / sea buckthorn) expressed in mg EQ / 100 g dry product
Sample Absorbance sample read at
510 nm
Sample concentration in flavonoids (mg EQ/100
g dried substance)
Average sample concentration in flavonoids
(mg EQ/100 g dried substance)
0.320 39.085 Rosehip from Bihor 0.318 38.842 39.407 ±0.888 0.330 40.295 0.334 40.779 Rosehip from Maramureș 0.338 41.264 40.537 ±0.727 0.324 39.569 1.201 145.756 Sea buckthorn from Bihor 1.146 139.096 141.841±3.915 1.159 140.671 1.208 146.604 145.201±1.531 Sea buckthorn from Maramureș 1.198 145.393 1.184 143.670
By observing the data in Table 2 it can be concluded that the highest
concentration of flavonoids between the two ethanolic extracts of rosehip fruits is obtained for the sample from Maramureș, even if there are no significant differences. In fact, the concentration of flavonoids obtained for rosehip fruit is in line with other data provided by current research, 41 mg QE / 100 g dried fruit (Amadczak A. et al., 2012), 101.3-163.2 mg QE / 100 g frozen fruit pulp for different varieties of rose canine (Roman et al., 2013).
For ethanolic sea buckthorn extracts, the analysis of the data in Table 2 shows that for sea buckthorn from Maramureș has a higher amount of flavonoids than the sample from Bihor. There are no big differences between the sea buckthorn fruits from the two counties. However, comparing the two fruits analyzed, the highest amount of flavonoids is found in sea buckthorn fruits compared to rosehip fruits.
Determination of the antioxidant activity with the 2,2-diphenyl-1-picrylhydrazyl (DPPH) method is a fast, cheap and simple method. The method is widely used to measure the antioxidant activity of some

54
compounds in various foods against free radicals or compounds that can release hydrogen ions (Jurca et al., 2016).
The results obtained after performing the DPPH method are presented in Table 3.
Table 3 DPPH test results on rosehip / sea buckthorn ethanolic extracts
Sample White absorbance
Sample absorbance
Percentage of inhibition %
Average percentage of inhibition %
Rosehip from Bihor
0.6959 0.1453 79.1201 81.0074±1.8873 0.1224 82.4110
0.1288 81.4912 Rosehip from Maramureș
0.6959 0.1205 82.6841 82.5933±0.4261 0.1188 82.9286
0.1241 82.1672 Sea buckthorn
from Bihor 0.6959 0.3239 53.4604
52.0979±1.3625 0.3402 51.1103 0.3359 51.7231
Sea buckthorn from
Maramureș
0.6959 0.3215 0.3316 0/3154
53.8010 52.3495 54.6774
53.6093 ±1.2598
The data provided in Table 3 show that the highest percentage of
inhibition, so the best ability to neutralize free radicals, was found in the ethanolic extract of rosehip from Maramureș, followed by that of rosehip from Bihor. The highest percentage of inhibition among the ethanolic extracts of sea buckthorn fruits was the one from fruits in Maramureș. Comparing the extracts from the two fruits taken in the analysis, the rosehip has the highest antioxidant activity.
Determination of antioxidant activity by the FRAP method (ferric reducing antioxidant power), is a simple spectrophotometric method that tests the antioxidant capacity of some compounds and is based on the reduction of ferric tripyridyltriazine (Fe (III) -TPTZ) complex, freshly prepared in ferrous tripyridyltriazine complex ((Fe (II) -TPTZ) by a reducer. The reaction takes place at acid pH (Jurca et al., 2016).
Table 4 shows the results obtained for the antioxidant activity of ethanolic extracts from rosehip / sea buckthorn fruits by the FRAP method.

55
Table 4 The results of the FRAP method on ethanolic extracts from rosehip / sea buckthorn fruits
Sample Absorbance read at 595 nm
Sample concentration (µmoli TE/100 g dried substance)
Average sample concentration (µmoli TE/100 g dried substance)
Rosehip from Bihor
0.2495 95.4706 94.0812±1.3894 0.2449 92.7647
0.2470 94.0082 Rosehip from Maramureș
0.2493 95.3510 94.6815±1.1168 0.2462 93.5647
0.2489 95.1289 Sea buckthorn
from Bihor
0.1629 44.5312 44.1403±0.3909 0.1616 43.7894
0.1622 44.1002 Sea buckthorn
from Maramureș
0.1639 45.1427 45.2437±0.6136 0.1652 45.8573
0.1632 44.7311
The data provided by Table 4 show that the highest antioxidant capacity has the ethanolic rosehip extract from Maramureș, followed by the ethanolic rosehip extract from Bihor (Jurca T. et al., 2016). It can be seen that the ethanolic extract of sea buckthorn fruits from Maramureș has the highest antioxidant activity. Comparing the extracts from the two fruits taken in the analysis, the rosehip fruits have a higher antioxidant activity, compared to the sea buckthorn fruits. CONCLUSIONS
The results obtained in this study show that the antioxidant activity of rosehip and sea buckthorn fruits in different locations, grown in different environmental conditions, requires further investigation. The highest concentration of polyphenols and antioxidant activity (by FRAP, DPPH methods) is found in the ethanolic extract of rosehip fruits, regardless of the area from which they were harvested and the highest concentration of flavonoids is in the ethanolic extract from sea buckthorn fruits.
REFERENCES 1. Adamczak A., Buchwald W., Zielinski J., Mielcarek S., 2012, Flavonoid and organic
acid content in Rose hips (Rosa L., sect. Caninae DC. EM. Christ.), Acta Biologica Cracoviensia
2. Bal L.M., Meda V., Nail S.N., Satya S., 2011, Sea buckthorn berries: A potential source of valuable nutrients for nutraceuticals and cosmoceuticals, Food Research International, Vol. 44, pp. 1718-1727
3. Barros L., Carvalho A.M., Ferreira I.C.F.R., 2011, Exotic fruits as a source of important phytochemicals: Improving the traditional use of Rosa canina fruits in Portugal, Food Research International, Vol. 44, pp. 2233-2236
4. Everette J.D., Bryant Q.M., Green A.M., Abbey Y.A., Wangila G.W., Walker R.B., 2010, Through Study of Reactivity of Various Compound Classes toward the Folin-Ciocalteu Reagent, Journal of Agricultura land Food Chemistry, Vol. 58, pp. 8139-8144
56
5. Fan C., Pacier C., Martirosyan D.M., 2014, Rose hip (Rosa canina L.): A functional food perspective, Functional Foods in health&Disease, Vol. 4
6. Fattahi S., Jamei R., Sarghein S.H., 2012, Antioxidant and antiradical activities of Rosa canina and Rosa pimpinellifolia fruits from West Azerbaijan, Iranian Journal of Plant Physiology, Vol. 2, Nr. 4, pp. 523-529
7. Ikawa M., Schaper T.D., Dollard C.A., Sasner J.J., 2003, Utilization of Folin-Ciocalteu Phenol Reagent for the Detection of Certain Nitrogen Compounds, J. Agric. Food Chem., Vol. 51(7), pp. 1811-1815
8. Jurca T., Vicaș L., Toth I., Braun M., Marian E., Teusdea A., Vicaș S., Mureșan M., 2016, Mineral elements profile, bioactive compounds and antioxidant capacity of wild blueberry and of pharmaceutical preparations from blueberry (Vaccinium Myrtillus, Farmacia, Vol. 64
9. Kim D.O., Jeong S.W., Lee C.Y., 2003, Antioxidant capacity of phenolic phytochemicals from varoius cultivars of plums, Food Chemistry, Vol. 81, pp. 321-326
10. Koczka N., Stefanovits-Banyai E., Ombodi A., 2018, Total polyphenols content and antioxidant capacity of rosehips of some rosa species, Medicines
11. Ma Q.G., Wei R.R., Shang D.L., Sang Z.P., Dong J.H., 2020, Structurally Diverse Flavonolignans with Immunosuppresive and Neuroprotective Activities from the Fruits of Hippophae rhamnoides L., J. Agric. Food Chem.
12. Makovics-Zsohar N., Hegedus A., Stefanovits-Banyai E., Redei R., Papp N., 2014, The antioxidant capacity of sea buckthorn (Hippophae rhamnoides L.) berries depends on the genotype and harvest time, Int. Journ. Of Horticultural Science
13. Orhan N., Aslan M., Hosbas S., Deliorman OD., 2009, Antidiabetic Effect and Antioxidant Potential of Rosa canina Fruits, Pharmacognosy Magazine, Vol. 5, pp. 309-315
14. Palade M., 1998, Botanică Farmaceutică sistematică generală, Editura Tehnică, București, pp. 266-267
15. Pârvu C., 2002, Enciclopedia Plantelor, Plante din flora României, Editura Tehnică, București, Vol. 1, pp. 48-49, 56-59
16. Pundir S., Garg P., Dviwedi A., Ali A., Kapoor V.K., Kapoor D., Kulshrestha S., Lal U.R., Negi P., 2020, Ethnomedicinal uses, phytochemistry and dermatological effects of Hippophae rhamnoides L.: A review, Journal of Ethnopharmacology
17. Roman I., Stănilă A., Stănilă S., 2013, Bioactive compounds and antioxidant activity of Rosa canina L. biotypes from spontaneous flora of Transylvania, Chemistry Central Journal
18. Tiță I., 2005, Botanică farmaceutică, Ediția a II-a, Editura Didactică și pedagogică, R.A., București, pp. 680-682
19. Tkacz K., Wojdylo A., Turkiewicz I.P., Bobak L., Nowicka P., 2019, Anti-oxidant and anti-enzymatic activities of sea buckthorn (Hippophae rhamnoides L.) fruits modulated by chemical components, Antioxidants
20. Yilmaz S.O., Ercisli S., 2011, Antibacterial and antioxidant activity of fruits of some species from Turkey, Romanian Biotechnological Letters
21. Yoo K.M., Lee C.H., Moon B.K., Lee C.Y., 2008, Relative antioxidant and cytoprotective activities of common herbs, Food Chemistry
22. Zakynthinos G., Varzakas T., 2015, Hippophae rhamnoides: safety and nutrition, Curr. Res. Nutr. Food Sci.

57
Annals of the University of Oradea, Fascicle: Environmental Protection Vol. XXXV, 2020 Analele Universităţii din Oradea, Fascicula: Protecţia Mediului Vol. XXXV, 2020
SOME ASPECTS OF DRONE CONTRIBUTION TO PRECISION AGRICULTURE
Donca Gheorghe*
*University of Oradea, Faculty of Environmental Protection, 26 G. Magheru st., 410048 Oradea, Romania, e-mail: [email protected]
Abstract
The pressure to produce more food has led to the need for identification of applicable solutions, to solve, to improve the sustainability of production processes and accelerate innovation in the agriculture. These solutions based on the technical revolution can be characterized by the Farming 4.0 concept.
This concept is primarily based on the application of precision agriculture methods with the help of new technical achievements such as robots, UAVs (Unmanned Aerial Vehicles), IoT (Internet of Things), AI (Artificial Intelligence), Big Data and Cloud.
Among the important technological achievements, we list the automatic steering based on GPS, autonomous tractors and agricultural machines, the replacement of the thermal motors with electric motors, using batteries as the main source of energy, robots and drones for agriculture, direct communication between agricultural machines and centralization of all information in Cloud-based software applications.
This article gives a brief overview of the achievements based on the use of UAVs in agriculture and tries to synthesize the main future directions. Key words: drone, UAVs, Farming 4.0, IoT, precision agriculture. INTRODUCTION
The Department of Economic and Social Affairs, Population Division, of the United Nations, (United Nations, 2017) has predicted that the global population will reach 8.55 billion people by 2030 and almost 10 billion people by 2050. In order to feed this growing population, according to FAO, food production must increase with 70 percent by 2050 and a 60 percent increase in demand for high quality protein such as milk, meat and eggs.
Agriculture is energy intensive and the pressure to produce more food requires more energy, an increasingly costly input to the production process.
The early part of the past decade saw the rise of data-driven technologies and insights, going from basic analytics tools to the significantly more powerful business intelligence (BI) suite, which boasts the ability to aggregate an organization’s data and display it, in an easily digestible format. The massive leap in analytics capacity meant that data became a valuable asset, and organizations are happy to invest millions into applications and tools if it means they can use it successfully for ROI acceleration.
One of the important sources of data is the aerial images captured by agricultural drones. This data must be correlated with other data obtained from field sensors or other sources.

58
MATERIAL AND METHOD
Satellites have been used for a decade to monitor large croplands and forestry but a new level of precision and flexibility has been obtained with the use of Unmanned Aerial Vehicles (UAVs). For example, Sen4CAP software is an advanced solution for agriculture monitoring, commissioned by the European Space Agency, gives a direct access to the complete Copernicus Sentinel satellite data repository and dynamically scalable processing opportunities.
Drones however can monitor crops much more accurately, frequently and affordably, delivering higher quality data that are updated regularly to provide insight into crop development and highlight inefficient or ineffective practices. The ability to assess the health of a crop quickly and precisely can be invaluable for farmers. If a bacterial or fungal infection are identified, early detection allows quick action to be taken in order to remedy the issue
The global drone regulations database (Global Drone Regulations Database, 2017), which has been developed as a multiagency effort provides more in-depth information on drone regulations.
The next agricultural revolution are driven by data, which will help to increase agricultural productivity with minimum damage to the environment and increased livelihoods for communities involved in agriculture.
UAVs application in agriculture opens the gateway to access real time information on the farm. It can be used at different stages throughout the cropping cycle:
- Soil and field analysis – After getting precise 3D maps for soil, planting can be planned and nutrient status can be analysed for further operations.
- Planting – UAS shoot seeds with nutrients in the soil with an average uptake of 75 percent, thus bringing down costs for planting.
- Crop spraying – Drones can scan the ground and spray the correct amount of liquid, modulating distance from the ground and spraying in real time for even coverage.
- Crop monitoring – Time-series animations can show the precise development of a crop and reveal production inefficiencies, enabling better crop management.
- Irrigation – Drones with hyperspectral, multispectral, or thermal sensors can identify which parts of a field are dry or need improvements.
- Health assessment – By scanning a crop using both visible and near-infrared light, drone-carried devices can identify which plants reflect different amounts of green light and NIR light. This information can produce multispectral images that track changes in plants and indicate their health.
In the early days of using drones to capture aerial imagery, just having

59
an aerial image of farmland, added great value. Farmers soon wanted more from their images and the term “actionable intelligence” (Eisaian, 2017) has used. The first step in providing this actionable intelligence was producing crop health maps for farmers to pinpoint areas of potential yield loss. This was achieved by measuring the amount of biomass or live green vegetation in the crops using near-infrared (NIR) sensors that can detect vegetation levels based on the amount of light reflected off the leaves – the higher the biomass content, the more light that is reflected. These vegetation levels use the Normalized Difference Vegetation Index (NDVI), a simple graphical indicator for these measurements, to produce what are called NDVI maps. These maps show crop health through colours, which vary from dark green/blue for areas with most vegetation to red for the least healthy areas.
Now it’s all about the sensor attached to the drone, the processing and analysis of that imagery, and the real-time, actionable insights that analysis can give to farmers.
SAP launched Leonardo (FAO and ITU, 2018) which is a digital platform especially tailored to adding insights to data captured from any IoT platform – the very actionable insights that growers and farmers are craving (Fig. 1).
SAP Leonardo innovation portfolio for Internet of things (IoT) solutions integrates technologies and runs them seamlessly in the cloud. It’s Design Thinking methodology recognizes the fact that each farmer’s and grower’s exact requirements are different from a standard software offering, though they may share many of the attributes of prior solutions. For example, data captured from a drone can be incorporated into a system in a standard way that should not have to be rewritten every time an application is deployed, but how the data is analysed and displayed could well change from farmer to farmer. To this end, Design Thinking offers a standard methodology to quickly brainstorm and prototype solid solutions using standard Leonardo software components.
Fig. 1. SAP Leonardo platform structures (FAO and ITU, 2018)

60
An important design attribute is that the IoT platform uses HANA Cloud. The amount of data that can be collected is staggering, vastly in excess of any cost-efficient traditional on-site storage. For example, a typical drone carrying five sensors complemented by 15 other IoT sensors in the field, with peak sensor data bandwidth of ~50 terabyte/month, sampling at ~1Hz and conducting 10 to 20 field operations per season for a 2 000 ha/farm can produce the equivalent of 50 TB worth of data. Apart from using the cloud to consume and store the data easily, HANA Cloud also has fast analytic capabilities.
Drones in agriculture are aerial camera platform, equipped with an autopilot using GPS and sensors for collecting relevant data. They can be equipped with a regular camera for visible images, which can provide some information about plant growth, coverage and other things. A multispectral sensor expands the utility of the technique and allows farmers to see things that cannot be seen in the visible spectrum, such as moisture content in the soil, plant health, stress levels and fruits. These could help overcome the various limitations that hinder agricultural production.
RESULTS AND DISCUSSION
The agriculture drones market is expected to grow from USD 1.2 billion in 2020 to USD 5.7 billion by 2025 (Markets and Markets, 2020).
Agriculture drones are advanced data-gathering tools for serious professionals. Prices for complete, ready-to-fly ag drone systems range from $1,500 to well over $25,000.
The most challenging part of the agriculture drone surveying process is translating the hundreds of high-res images you just captured into information you can actually use. Most drone operators need to process hundreds of visual, thermal and multi-spectral images per flight, to identify changes in crop health over time or to spot anomalies. All of these images need to be stitched together, converted into orthomosaic 2D images, processed and analysed to get useful information from the flight.
Most agriculture drone operators use the following tools to turn aerial images into useful data. All of them use cloud-based processing:
• Pix4D: this popular & expensive image processing platform converts a series of aerial images into 2D orthomosaics, 3D point clouds and 3D mesh models. Pix4D can also calculate NDVIs, DVIs, SAVIs and custom indices as needed. To use Pix4D, you upload your images, let them process, then receive your reports and visuals typically within minutes to a few hours. Pricing is $350 per month to rent or $8,700 to own.
• AgEagle’s RAPID. • senseFly’s Postflight Terra 3D: based on Pix4D, this is senseFly’s

61
software for converting aerial imagery into 2D orthomosaics, 3D models and differential indices. Terra 3D is provided free with all eBee drones.
• PrecisionMapper by PrecisionHawk: now called Data Mapper, this is a cloud-based application that gives anyone the ability to upload, store, process, and share their aerial image data. Works with some, but not all, UAS platforms.
• Trimble: designed for professional land surveyors, Trimble’s Photogrammetry Module office software to create detailed orthophotos, digital elevation models, point clouds, volume calculations and 3D models. Trimble’s general-purpose Inpho UASMaster Module can be used for advanced photogrammetric processing.
• DataMapper by PrecisionHawk: a 100% cloud-based platform that supports image capture, differential processing and algorithmic analysis for many industries. Their unique Algorithm Marketplace lets you pick & apply specific algorithms to extract useful data such as NDVI, DVI, plant counts, scouting reports and more.
• Correlator3D™ by SimActive: advanced photogrammetric processing client software for use on high-end PCs. Several aerial survey firms such as AeroVironment use them. Performs aerial triangulation (AT) and produces dense digital surface models (DSM), digital terrain models (DTM), point clouds, orthomosaics and vectorized 3D models.
CONCLUSIONS
All over the world is a growing concern for the development of intelligent machines for agriculture. This concern has materialized through the emergence of precision agriculture technologies and Digital Farming or Smart Farming concepts, which has transformed into Farming 4.0, the fourth revolution in agriculture. We can conclude that the agricultural industry is about to be disrupted and will transform into a high-tech industry and will need a high skilled farmers.
There are several challenges pertaining to the implementation of UAVs in the agricultural context: – Right from planning the flight path till processing the final image, software plays a crucial role in the applicability of this technology. – Different nations have their own regulatory regimes pertaining to the use of UAVs in agriculture. – Technological unawareness may be a hurdle in its penetration. – Most drones have short flight ranges thus limiting the acreage that they can cover. The ones with the longer flight ranges are more expensive. – Drones with features that are suitable for use in agriculture are expensive. – Mostly farmlands may not have good connectivity, thus either the farmer.

62
REFERENCES
1. Brazeau M., 2018, Fighting weeds: Can we reduce, or even eliminate, herbicides by utilizing robotics and AI?, Genetic Literacy Project, North Wales 2. CEMA (European Agricultural Machinery), 2017, Digital Farming: what does it really mean?, http: //cema-agri.org/sites/default/files/CEMA_Digital%20Farming%20-%20 Agriculture%204.0_%2013% 2002%202017.pdf 3. Eisaian A., 2017, Tansformational power of digital agriculture–why now? https://www.intelinair.com/transformational-power-of-digital-agriculture-why-now/ 4. European Commission, 2018, Digital Transformation Monitor, Drones in Agriculture 5. FAO, IFAD, UNICEF, WFP and WHO, 2018, The State of Food Security and Nutrition in the World 2018. Building climate resilience for food security and nutrition. Rome, FAO. 6. FAO and ITU, 2018, E-Agriculture in Action: Drones for Agriculture, Bangkok 7. Global Drones Regulations Database, 2017, Find country, https://www.droneregulations.info/ 8. Karan K. S., Vimalkumar R., 2020, Design and Development of a Drone for Spraying Pesticides, Fertilizers and Disinfectants, International Journal of Engineering Research & Technology, Vol. 9, Issue 05, 9. Klompenburga van T., Kassahuna A., Catalb C., 2020, Crop yield prediction using machine learning: A systematic literature review, Computers and Electronics in Agriculture, Volume 177, October 2020 10. Markets and markets, 2020, Agriculture Drones Market, https://www. marketsandmarkets.com /Market-Reports/agriculture-drones-market-23709764.html 11. Marr B., 2019, The Amazing Ways John Deere Uses AI And Machine Vision To Help Feed 10 Billion People, https://www.forbes.com/sites/bernardmarr/2019/03/15/the-amazing-ways-john-deere-uses-ai-and-machine-vision-to-help-feed-10-billion-people/?sh=1360149a2ae9 12. Naio Technologies, 2019, Autonomous vegetable weeding robot - Dino, https://www. naio-technologies.com/en/agricultural-equipment/large-scale-vegetable-weeding-robot/ 13. Nixon A., 2020, Best Drones For Agriculture 2020: The Ultimate Buyer’s Guide, https://bestdroneforthejob.com/drone-buying-guides/agriculture-drone-buyers-guide/ 14. Patraucean V., Pascanu R., 2019, Artificial Intelligence for High School - Machine Learning perspective, https://docs.google.com/presentation/d/ 18asJJTerSX0e28n5VKxdE1bsOoVKG0pS2bGl_f7ow8w/edit#slide=id.p 15. Radoglou-Grammatikis P., Sarigiannidis P., Lagkas T., Moscholios I., 2020, A compilation of UAV applications for precision agriculture, Computer Networks, Volume 172, https://doi.org/10.1016/j.comnet.2020.107148. 16. Rycroft M., 2019, Electric powered farm vehicles set to revolutionize agriculture sector, EE Publishers (Pty) Ltd, https://www.ee.co.za/article/electric-powered-farm-vehicles-set-to-revolutionise-agriculture-sector.html 17. Saad A., Abou B., Abdoulaye G., 2020, Water Management In Agriculture: A Survey On Current Challenges And Technological Solutions. IEEE Access. Pp. 1-1. 10.1109/Access.2020.2974977 18. Sukkarieh S., 2018, Digital Farmhand boosts food security in the Pacific, Faculty of Engineering, The University of Sydney, https://sydney.edu.au/engineering/news-and-events/2018/08/03/digital-farmhand-boosts-food-security-in-the-pacific.html 19. United Nations, Department of Economic and Social Affairs, Population Division (2019), World Population Prospects 2019, The 2019 Revision, NY, https://population.un.org/wpp/Publications/Files/WPP2019_10KeyFindings.pdf 20. Walch K., 2019, How AI Is Transforming Agriculture. https://www.forbes.com/sites/ cognitiveworld/2019/07/05/how-ai-is-transforming-agriculture/.

63
Annals of the University of Oradea, Fascicle: Environmental Protection Vol. XXXV, 2020 Analele Universităţii din Oradea, Fascicula: Protecţia Mediului Vol. XXXV, 2020
THE EVALUATION OF THE RADIOACTIVITY OF THE AGRICULTURAL LAND FROM THE BĂIŢA – BEIUȘ AREA
Dumuţa Corneliu*, Brejea Radu Petru **, Martin (Boros) Anca Mădălina**
*SC Water Company Oradea SA, 3 Duiliu Zamfirescu St., [email protected]
**University of Oradea, Faculty of Environmental Protection, 26 Gen. Magheru St., 410048 Oradea, Romania, E-mail: [email protected]
Environmental Protection Agency of Bihor County, 25 A, Dacia Street, Oradea, Romania, E-mail: [email protected] , [email protected]
Abstract
The agricultural land from Băiţa – Beiuș area are fragmented in small and very small plots of land and the agricultural crops, even if they are not spread over large areas of land, are variously represented. In the Băiţa – Beiuș area people cultivate corn, wheat, potatoes, vegetables in greenhouses for self consumption or they used to sale the crops in the markets from Ştei, Beiuş or Vaşcău.
As a result of the primary extraction and processing of the uranium ore from the former uranium mining operation (an activity that took place over several decades), there appeared tailings dumps and depleted ore totaling a volume of approximately 2000000m3 organized on an area of 1250000m2, mine mouths, mine waters and those that wash and / or drain the tailings dumps, dust from dumps entangled by air movements. These represent a potential source of radioactive pollution for the agricultural land, for the plant and animal biodiversity, as well as for the human community in the Băiţa - Beiuș area. There are radioactive elements in concentrations of the order of ppm, in all the types of rock and in all the types of soil which influence to a greater or lesser extent the evolution and growth of crop plants, spontaneous vegetation. They reach the body of both animals and people. Key words : radioactivity, radioactive waste, radiations, dumps, agricultural crops, agricultural lands. INTRODUCTION
The research aims to perform measurements on the level of radioactivity of agricultural land in different areas, in the Băița - Beiuș area, for a period of 2 years during which the research was carried out (2018 - 2019).
Accepting this space as part of the great geographical unit of the Crişurilor Plain having as limits: - in the North, the Someş Plain; - in the South, the Banat Plain; - in the West, the conventional border with Hungary and further on the great geographical unit of the Pannonian Plain; - the Eastern limit is closed by the Bihor mountain massifs: Vlădeasa which embraces this lagoon with the Pădurea Craiului Mountain range to the North and the Codru Moma Mountains to the South. (Posea, 1997)

64
Fig. 1. Beiuș Basin (according to Google maps 2019)
˶Pollution, direct or indirect introduction, as a result of natural
phenomena or human actions, of solids, liquids and vapors or forms of energy (ionizing electromagnetic radiation, heat, sound or vibration) may have harmful effects on human health, on the quality of aquatic or terrestrial ecosystems which may cause damage to property, or which may cause damage or interfere with the comfort or legal use of the environment. When substances that alter the properties or initial characteristics of environmental factors are unstable isotopes, the pollution is called radioactive pollution.̏ (Directive 60/2000 / EC of the European Parliament and of the Council)
The property of some nuclei to emit α, β particles and γ radiation spontaneously without external intervention is called radioactivity. The process is known as radioactive decay and that element is also called a radionuclide or radioisotope. (Mocanu, 1991)
The sources of radioactive pollution in the Băița - Beiuș area are represented by the mining mouths and by the tailings dumps resulting from the processes of extraction, primary processing, crushing, sorting, transport and storage, deposition of radioactive dust and aerosols. But it is important to mention that these sources are in fact potential sources of radioactive pollution, they can become major sources of pollution in case of accidents for agro-ecosystems and environmental factors in the vicinity of the perimeter of the former uranium mining. (Dalea, 2000)
The topicality of this issue results from the existence of possibilities of risks of radioactive pollution, from the surface proposed for research in the Băiţa - Beiuș area, environmental factors, plant and animal biodiversity, as well as the human factor, due to the existence of tailings dumps and mining mouths from the former uranium mining operation EM Băiţa. (Dalea, 2004)
In the Băiţa area, Bihor county, the largest uranium mining operation in Romania had taken place for several decades. Other uranium areas of

65
national importance are: Ciudanoviţa - Banat, Stulpicani, Leşu Ursului - Suceava.
Pedogenesis takes place in the South-East area of the Beiuș Basin in a specific way in which the presence of relief, meteorological and anthropogenic elements equally influences and strongly affects the solification process. (Brejea, 2010)
The development and the dynamic evolution of the Crişurilor Plain in the S-E area of the Bihor county, the upper and middle course of the Crişul Negru sub-basin have different characteristics in which we distinguish the Piedmont area where it develops as a narrow strip influenced by exposure and steeper landforms. This specific feature is lost in the Beiuş Basin, where it is replaced by the hilly structure specific to the glacis plain. All this geomorphology in which the elements of high mountainous relief and high plain intertwine determines the existence of mosaic areas of soil types.
Fig. 2. South – East of the Beiuș Basin (2019)
MATERIAL AND METHOD
The research methods consisted of: field observations, discussions with landowners and owners, consultation of archived documents, discussions with local government staff in the Băița – Beiuș area, field measurements, sampling and analysis of soil samples in the laboratory.
The samples for soil samples were taken with the pedological probe from land areas in the Băița – Beiuș area, the analyzes were performed in the laboratories of the Faculty of Environmental Protection in Oradea, at OSPA Oradea, Environmental Guard, CNU and IFIN-HH.

66
Fig. 3. Pedological probe
Radionuclides determined in the soil samples by spectrometry range
U238, Ra226. Sample weight: ~ 30–200 g (solid samples). The description of the method Spectrometry range is a nuclear
technique used in the analysis of the gamma-emitting radionuclides, which are present in different types of samples.
Analytical stages : - identification of radionuclides (qualitative analysis); - determination of the specific activity / activity of radionuclides, expressed in Bq, Bq / kg or Bq / l (quantitative analysis).
Analysis of natural radioactivity in environmental samples by low background gamma spectrometry - the gamma spectrum of the natural background in the laboratory is mainly due to radionuclides in the radioactive series uranium-radio (U238- Ra226) and thorium (Th232), as well as radionuclide K40.
The relatively large random temporal variations of radon in the spectrum of the natural background in the laboratory require the alternative measurement of samples and background, especially in the case of samples with low levels of natural radioactivity. The measurement time, for samples and natural background, is about 24 hours. To determine the radius, the samples are sealed and measured after 3-4 weeks to achieve the radioactive balance between Ra226 and its gaseous descendant Rn222 (radon). Gamma spectrometry measures Pb214 and Bi214, radionuclides descendants of radon. U, Th and K concentrations in the samples can be determined by measuring the radioactivity of uranium (U238), thorium (Th232) and potassium (K40).
RESULTS AND DISCUSSION
The soil samples from the agricultural lands, in the years 2018-2019,
from the Băița - Beiuș area were taken from the arable layer of 0-50 cm and analyzed by gamma spectrometry.

67
Table 1
Content of U238in the soil samples from agricultural lands between 2018 and 2019 in the Băița-Beiuș area
Crt. No.
Sample location U238 Bq/Kg 2018
U238 Bq/Kg 2019
1 Băița Plai - Barieră 321 308 2 Nucet 40 41 3 Câmpani 33 27 4 Ștei next to Moara 4 38 44 5 Beiuș 10 10
Table 2
Content of Ra226 in the soil samples from agricultural lands between 2018 and 2019 in the Băița-Beiuș area
Crt. No. Sample location Ra226 Bq/Kg 2018
Ra226 Bq/Kg 2019
1 Băița Plai - Barieră 321 308 2 Nucet 40 41 3 Câmpani 33 27 4 Ștei next to Moara 4 38 44 5 Beiuș 10 10
Please note that the reference values for the content of Ra226 are in the
range : - 10 - 60 Bq / kg for sediment samples; - 10 - 40 Bq / kg for soil samples; - 20 - 150 Bq / kg for vegetation samples. The results show that the environmental radiological danger in the Băița – Beiuș area, resulting from the measurements performed in the period 2018-2019 in the soil samples, does not exceed the reference threshold allowed at national and global level. It can be concluded that the study area is safe for population, agriculture and any other purposes. CONCLUSIONS
Waste dumps, mining mouths, air-suspended particles, precipitation that washes and / or drains tailings dumps from the mining perimeter can be sources of radioactive pollution for agricultural land, spontaneous vegetation, agricultural crops, animals and man, from the Băița – Beiuș area.
Global and local weather and climate phenomena influence soil quality indicators and the migration of natural radionuclides into the deep layers of the soil.
The measurements regarding the radioactivity performed for the soil samples, by gamma spectrometry, from the Băița - Beiuș area showed a higher level than the national average of the values for the radioactive

68
elements U238 and Ra226, but they are not values that exceed the reference threshold.
It is recommended to monitor and perform measurements with a frequency of at least monthly, or with a higher frequency in the event of undesirable events, regarding the presence of radioactive elements in environmental factors.
The results show that the environmental radiological danger in the Băița – Beiuș area resulting from the analysis of the soil samples performed, have values lower than the value allowed at national and global level. It can be concluded that the study area is safe for the population, agriculture and any other activities or purposes.
REFERENCES
1. Alexandri C., et al, 2002, Agricultura românească în ultimul deceniu – o analiză sectorială, Institutul de Economie Agrară, București;
2. Brejea R., 2010, Ştiinţa solului – îndrumător de lucrări practice. Editura Universităţii din Oradea;
3. Brejea R., Domuţa C., 2011, Practicum de pedologie, Editura Universităţii din Oradea;
4. Coste I., 2001, Ecologie generală şi agricolă, Editura Orizonturi Universitare, Timişoara;
5. Dalea A., 2004 , Influenţa radiaţiilor asupra fiziologiei porumbului , Editura Universităţii din Oradea;
6. Dalea A., Bara V., 2000, Some aspects of radioactive pollution of Baiţa River Hidroecosistem. Analele Univ. Bacău;
7. Ileana Ardelean, 2013, Agrotehnica, Editura Universității din Oradea, Oradea; 8. Mocanu N., 1991, Comunitatea vegetaţiei terestre cu materiale radioactive. Natura
1-4 (45-50); 9. Posea G., Câmpia de Vest a României, Editura Fundaţiei România de Mâine,
Bucureşti, 1997; 10. Directive 60/2000 / EC of the European Parliament and of the Council 11. http://www.anpm.ro/ 12. http://www.nipne.ro/ 13. http://www.cnu.ro/

69
Annals of the University of Oradea, Fascicle: Environmental Protection Vol. XXXV, 2020 Analele Universităţii din Oradea, Fascicula: Protecţia Mediului Vol. XXXV, 2020
SYNTHESIZATION OF β -NAFTOLORANGE, AN AZO DYE WITH SUPERIOR PURITY
Frenț Olimpia-Daniela*, Dejeu Ioana-Lavinia*, Zbârcea Claudia**, Marian Eleonora*
*University of Oradea, Faculty of Medicine and Pharmacy, 1 December Square, Oradea, Romania
E-mail: [email protected], [email protected] **Secondary School"Mrs. Oltea", Oradea, Romania
Abstract Azo dyes are a class of synthetic organic compounds that have wide use in the
chemical industry. In the past only natural dyes were used for the dyeing of materials, obtained from plant or animal organisms, now the cultivation of plants has decreased because the synthetic substances much cheaper and much more varied in color and shades have developed.
In this paper we synthesized an azo dye, β-naftolorange, by a simple method of diazotating sulphanilic acid with sodium nitrite in the presence of hydrochloric acid and coupling with β-naftol. The resulting azocolor can be used in industry as a colouring substance because, from the analyses carried out, FTIR and calcination, it has been shown to have superior purity. Keywords: azodyes, organic compounds, β-naftolorange, diazotating, coupling INTRODUCTION
Azo dyes are natural or synthetic colored organic substances that have azo bond structure as chromophore group responsible for color production. In addition to azo bound -N=N-, chromophore groups can also be the nitroso -N=O groups and nitro -NO groups. The dye in order to be able to color the materials on which they are applied, such as: textile fibers, food, medicines, cosmetics, etc. must also contain in structure auxochrome groups, that darken or intensify the color of the dye. Auxochromic groups in structure of azocolorants can be: amino-NH , hydroxylphenolic or its alkylated derivatives Ar-OH, Ar-OR (Banu et al., 2010, Neițescu, 2015, Sahar, Manal, 2012, Marian et al., 2011 ).
Azo dyes are the most widespread and the most used dyes in almost all industries because they are the largest class of organic dyes, accounting for over 70% of world dye production. They have many advantages: have a low purchase price, the method by which they are obtained is simple, are not sensitive to temperature, light and oxygen (Dan et al, 2018, Allam et al., 2011, Farah et al, 2011).
Although azo dyes are of particular interest to the food industry, many studies show that when they enter the body, products resulting from metabolism can affect people's health. The age categories most affected by
70
these dyes are children, pregnant women and elderly that can cause them: allergies, intolerance, respiratory disorders, reproductive disorders, hyperactivity, carcinogenic effects, after long consumption (Parneli et al., 2014, Gültekin, Doguc, 2013, Sulekova et al., 2016, Orănescu, 2008).
IR spectrometry is a simple method, important for analytical chemistry and not only, frequently used to determine the functional groups in the structure of organic / medicinal substances, to identify pure compounds or to detect the presence of specific impurities in a substance (Muntean, Bojiță, 2004 , Bojiță et al., 2003, Munajad, Subroto, 2018, Peyne et al., 2017, Wang et al., 2016, Ozgenc et al., 2017).
In this paper we synthesized by a diazotization and coupling reaction an azo dye, then we determined the reaction yield, we analyzed the structure of the compound using the FTIR method and the purity of synthesized product using the calcination method.
MATERIALS AND METHODS MATERIALS
Sulphanilic acid or p-aminobenzenesulfonic acid and 𝛽-naphthol (Sigma-Aldrich), sodium hydroxide (Elemental SRL), sodium nitrite and sodium chloride (Silver Chemicals), hydrochloric acid (Chemical Company), 25 mm ultrapure filter paper PN1250025, FTIR 7800 PG Instruments spectrometer, Nabertherm calcination furnace, Binder ED 56 9010-0333 oven.
METHODS
5 g of sulfanylic acid are dissolved in 12.5 mL of 2 N NaOH, stirring continuously until complete dissolution. A solution containing 2 g NaNO in 25 mL 4N HCl is added over it. The solution is prepared under a niche because when adding hydrochloric acid over the sodium nitrite, a lot of yellow nitrous vapors are released. After mixing to the two solutions, a thick suspension of p-diazobenzenesulphonic acid is formed, which is added dropwise with stirring to a solution of sodium 𝛽-naphtholate formed by dissolving 4 g of 𝛽-naphthol in 50 mL of 2N NaOH, at room temperature. The azo dye is immediately formed, which can be seen in the form of yellow-orange sheets.
A complete precipitation is made if a saturated NaCl solution is added. Filter on filter paper and then wash the azo dye with cold water. After filtration and washing, the 𝛽-naphtholorange obtained is dried in an oven at 40 °C for 6 hours until the mass of product remains constant. Weigh the mass of dye obtained and calculate the efficiency of diazotisation and coupling reaction.

71
FTIR spectrometric determinations of the base compounds and the final compound were performed at the spectral range 4000-400 cm with a resolution of 2 cm and KBr was used for pelleting. A calcination furnace with a heating range of 30-3000º C was used to determine the purity of the synthesized azo dye.
RESULTS AND DISCUSSIONS
After obtaining the azo dye, the reaction yield is calculated according
to the formula:
η =m × 100
m
m = practical mass (how much i got), m = theoretical mass (as I used), η =
yield. After replacing the values obtained in the formula, a good yield of
82.5% was obtained. The spectra of sulphanilic acid, β-naphthol and dye obtained were further analysed. Figure 1 shows the spectrum of β-naphthol and table 1 shows wave numbers, vibration intensity and vibrational attributions of β-naphthol.
Fig.1. FTIR spectrum of β-naphthol on the 4000 – 400 cm
Table 1. Wave number, vibration intensity and vibrational attributions of β-naftol
Wave number (cm-1) Vibration intensity Vibrational attribution 470.01 Great Deformation of the aromatic δC-C bond in the plane 742.46 Great Deformatin in the plane of the connection δC-C-O 813.81 Great Deformatin in the plane of the connection δC-H 844.67 Great Out-of-plane deformation of the connection 𝛾C-H 958.45 Average Vibration of the aromatic/naphthalnic ring
1170.58 Great Stretching vibration 𝜈C-O of the phenolic hydroxyl group 1214.93 Very large Stretching vibration 𝜈C-O of the phenolic hydroxyl group 1276.65 Great Link stretching vibration 𝜈C-C-O 1329.45 Poor Vibration of the aromatic/naphthalnic ring 1378.85 Poor Aromatic stretching vibration 𝜈C-C 1405.80 Average Vibration of the deformation of the link δO-H 1465.63 Average Vibration of the aromatic/naphthalnic ring 1511.92 Great Link stretching vibration 𝜈C=C 1581.34 Average Vibration of deformation δO-H of the absorbed water 1600.63 Great Vibration of the aromatic/naphthalnic ring 1629.55 Great Stretching vibration 𝜈O-H of the absorbed water 3046.36 Poor Aromatic stretching vibration 𝜈C-H 3264.89 Great Vibration of the phenolic link 𝜈O-H

72
It should be noted that in small wave numbers, the spectral bands correspond to the deformation of some links, while for the same links, the spectral bands corresponding to the stretching vibrations found in larger wave numbers. This is possible because the energy needed to change the amplitude of a deformation vibration is less than the energy needed to change the amplitude of a stretching vibration. Thus, the deformation of the aromatic C-C bond appears as a high-intensity vibration at 470.01 cm , while the stretching vibration of the same link occurs at 1378.85 cm and the intensity is low. The deformation vibration of the C-C-O bond occurs at 742.46 cm and the stretching vibration of the same link occurs at 1276.65 cm .
Stretching vibrations due to the aromatic ring occur in several wave numbers: 958.45 cm-1 (average), 1329.45 cm-1 (poor), 1465.63 cm-1 (average), 1600.63 cm-1 (great).
A vibration of very high intensity is represented by the stretch vibration of the C-O link in the phenolic hydroxyl group that occurs at the wave number 1214.93 cm-1. Two other high-intensity vibrations are due to tensile vibrations of the C-C-O bound at 1276.65 cm-1 and C=C bound at 1511.92 cm-1.
The FTIR spectrum of sulphanilic acid is shown in Figure 2.
Wave number (cm-1)
Fig. 2. FTIR spectrum of sulphanilic acid in the range 4000 – 400 cm-1
Spectral bands in FTIR of sulphanilic acid are shown in table 2.
Table 2. Wave number, vibration intensity and vibrational attributions of the sulphanilic acid
spectrum Wave number (cm-1) Vibration intensity Vibrational attribution
431.98 Small Deformation vibration in the plane δC-C 559.26 Average Deformation vibration in the plane δC-H 686.53 Great Deformation vibration in the plane δN-H
825.36 Small Out-of-plan deformation vibration 𝛾C-H
1008.59 Great Vibration of the stretching of the aromatic ring 1033.66 Great Stretch vibration of the link 𝜈C-C-N 1120.44 Great Stretch vibration of the link 𝜈S=O 1155.15 Great Stretch vibration of the link 𝜈N-H 1257.36 Average Stretch vibration of the link 𝜈C-N 1496.49 Average Deformation vibration in the plane δO-H from water absorbed 1546.63 Small Stretch vibration of the link 𝜈C=C 1577.49 Small Deformation vibration in the plane δO-H from water absorbed 1600.63 Small Vibration of the aromatic ring 1628.91 Small Deformation vibration in the plane δO-H from water absorbed 2642.00 Small Stretch vibration of the link 𝜈O-H from water absorbed 2848.35 Small Stretch vibration of the link vC-H 2989.12 Small Stretch vibration of the link 𝜈C-H 3093.26 Small Stretch vibration of the link 𝜈C-H

73
The sulfanilic acid spectrum can be interpreted taking into account structure of organic compound, which contains a benzene nucleus, sulfonic and amino groups. Thus in addition to the vibrations characteristic of the benzene nucleus, deformation and stretching vibrations of the functional groups that are grafted on the benzene nucleus will appear. Deformation vibrations in plane of the C-C (431.98 cm-1), CH (559.26 cm-1), NH (686.53 cm-1) bonds and deformation vibration off-plane of the CH (825.36 cm-1) bonds are vibrations that find at small wave numbers in FTIR spectrum. The tensile vibrations of aromatic ring occur at 1008.59 cm-1 of high intensity and at 1600.63 cm-1 of low intensity. Three vibrations of very high intensity are those due to the tensile vibrations of the C-CN bonds (1033.66 cm-1), S=O bond (1120.44 cm-1) and NH bond (1155.15 cm-1) (Sonibare et al, 2010).
In the FTIR spectrum of sulphanilic acid can also be found deformation vibrations in the plane of the OH bonds (1496.49 cm-1, 1577.49 cm-1) and tensile vibrations of the OH bond (1628.91 cm-1, 2642.00 cm-1) from the water absorbed from atmosphere. The tensile vibrations of the C-H bonds have low intensity and are found at large wave numbers (2848.35 cm-1, 2989.12 cm-1, 3093.26 cm-1) (Xi et al., 2019, Rudyk et al., 2019).
The FTIR spectrum of 𝛽-naphtholorange is represented in figure 3.
Număr de undă (1/cm)
Fig. 3. FTIR spectrum of synthesized dye (β -naphtholorange) in the 4000 – 400 cm-1
Spectral bands in the FTIR spectrum of β-naphtholorange are assigned
according to table 3.

74
Table 3 Wave number, vibration intensity and vibrational attributions of β-naftolorange
Wave number (cm-1) Vibration intensity
Vibrational attribution
480.19 Small Deformation vibration in the plane δC-C 575.81 Small Deformation vibration in the plane δC-H 698.11 Small Deformation vibration in the plane δN-H
825.36 Small Out-of-plan deformation vibration 𝛾C-H
1008.59 Great Vibration of the stretching of the aromatic ring 1033.66 Average Stretch vibration of the link 𝜈C-C-N 1118.51 Great Stretch vibration of the link 𝜈S=O 1174.44 Average Stretch vibration of the link 𝜈C-O from O-Na+
1474.19 Small Deformation vibration in the plane δO-H 1511.92 Average Stretch vibration of the link 𝜈C=C 1570.23 Small The deformation vibration in the plane of the water absorbed 1600.63 Small Vibration of the aromatic ring 1619.91 Small Deformation vibration in the plane δO-H from water absorbed 3056.34 Small Stretch vibration of the link 𝜈C-H 3369.03 Small Stretch vibration of the phenolic link 𝜈O-H
In β-naphtholorange spectrum, most vibrations are found encountered
in FTIR spectra of the reactants, less tensile vibrations of the N-H bond, a bond that has partially disappeared. Thus, the stretching vibration of the N-H bond from 1155.15 cm-1 and the stretching vibrations of the C-H bond from large wave numbers (2642.00, 2848.35 and 2989.12 cm-1) disappear. However at 698.11 cm-1 the deformation vibration is found in δ plane, even if its intensity is very low. This could be explained by the fact that reaction product is not completely pure, it may present sulfanilic acid as traces / impurities.
The rest of vibrations that occur in spectrum of the reaction product are vibrations characteristic of covalent bonds. One can also notice the δ deformation vibration, vibration that occurs at 752.19 cm-1, has low intensity, unlike β-naphthol spectrum, where vibration intensity was very high. A vibration that decreases in intensity is ν , a vibration that occurs at 1174.44 cm-1. Also, the presence in the β-naphtholorange spectrum of the deformation vibration in the δ plane, even if it has a very low intensity, can also lead to idea that the reaction product is also impure with β-naphthol. There are two other vibrations whose intensity has decreased, the tensile vibration of C-H bond (3056.34 cm-1) and the tensile vibration of phenolic O-H bond, probably trace / impurity in the reaction product.
Presence of azo bond, -N=N-, can only be observed in color of the synthesized azo dye, because bond does not show infrared vibration.
Determination of purity of the synthesized azo dye could be performed by calcining a small amount in a calcination furnace. The calcination was carried out for 90 minutes and temperature reached by the oven was 1000 °C. The sample taken was dried in an oven at 80 °C for 60 minutes to remove water that was absorbed in the synthesis step, then triturated until a very fine

75
powder was obtained. The analysis was performed in triplicate. By calcining the samples, an amount of ash remained, which consists of metal oxides (Na O) contained in azo dye.
Amount of samples taken to be calcined and amount of ash remaining after calcination are given in Table 4.
Table 4. Data obtained when calcination of the naftolorange
Analysis of purity of the azo dye using the calcination method has led to conclusion that synthesized β-naphtholorange has a relatively good purity for the reaction product to be used for industrial purposes (96.90 ± 0.35 %). CONCLUSIONS
Azo dyes are natural organic or synthetic coloured substances
containing the azo group and having the ability to colour the materials on which they are applied. Synthesis of the β-naphtholorange by the diazotation and coupling reaction had a relatively good yield and was demonstrated using FTIR spectrophotometry. Determination of purity of the synthesized azo dye has shown that it has good purity, so it can be used for industrial purposes. REFERENCES 1. Allam K. V., G.P. Kumar, 2011, Colorants the cosmetics for the pharmaceutical dosage
forms, International Journal of Pharmacy and Pharmaceutical Sciences, 3, 20, 1-9 2. Banu C., A. Stoica, N. Buțu, E. Bărăsescu, D. Resmeriță, C. Vizireanu, C. Lungu, M.
Iordan, 2010, Aplicații ale aditivilor și ingredientelor în industria alimentară, Ed. Asab București, 11-26-48-866
3. Bojiţă M., R. Săndulescu, L. Roman, R. Oprean, 2003, Analiza şi controlul medicamentelor, vol. II, Editura Intelcredo Deva, 210-250
4. Constantin D.N., 2015, Chimie organică, vol I, București 5. Dan O. D., L. Vicaș, E. Marian, 2018, Impact of azo dyes on the body and their use in
the food industry and pharmaceutics, Analele Universității din Oradea, Fascicula: Protecția Mediului, 31, 22, 251-256
6. Farah M., C. Drumond, J.K. Dorta, D.P. Oliveira, 2010, Azo dyes and their metabolites: does the discharge of the azo dye into water bodies represent human and ecological risks?, Advance in Treating Textile Effluent, DOI: 10.5772/19872, 1-24
Sample/Mass Crucible
mass naked (g)
Calcinating sample mass
(g)
Crucible mass + sample
(g)
Sodium oxide mass resulting
from calcination mNa2O(g)
Mass of sodium oxide found in the calcinating
sample (g)
Sample purity (%)
(1) (2) (3) (4)=
(2)+(3) (5) (6)
(7) = (5) x
100/(6) P1 19.7316 1.2885 21.0201 0.2088 0.2147 97.25 P2 19.4768 1.3258 20.8026 0.2133 0.2209 96.56 P3 18.5489 1.4256 19.9745 0.2301 0.2376 96.88

76
7. Gültekin F., D.K. Doguc, 2012, Allergic and immunologic reactions to food additives, Clinical Reviews In Allergy & Immunology, 45, 1, 6–29
8. Marian E., T. Jurca, L. Vicas, I. Kacso, M. Miclaus, I. Bratu, 2011, Inclusion compounds of erythromycin with b-cyclodextrin, Revista de Chimie, 62, 11, 1065-1068
9. Munajad A., C. Subroto, 2018, Fourier transform infrared (FTIR) spectroscopy analysis of transformer paper in mineral oil-paper composite insulation under accelerated thermal aging, Energies, 11, 2, 364
10. Muntean D.L., M. Bojiță, 2004, Controlul medicamentelor. Metode spectrale, cromatografice și electroforetice de analiză, Editura Medicală Universitară Iuliu Hațieganu, Cluj-Napoca, 98-130
11. Orănescu E., 2008, Aditivi alimentari, necesitate și risc, Ed. Agir, București, 3-46 12. Ozgenc O., S. Durmaz, S. Kuştaş, 2017, Chemical analysis of tree barks using ATR-
FTIR spectroscopy and conventional techniques, BioResources, 12, 4, 9143-9151 13. Parnali C., M.M. Alvi, 2014, Excipients and active pharmaceutical ingredients,
Pediatric Formulations, 347-361 14. Peyne J., J. Gautron, J. Doudeau, E. Joussein, S. Rossignol, 2017, Influence of calcium
addition on calcined brick clay based geopolymers: a thermal and FTIR spectroscopy study, Construction and building materials, 152, 794-803
15. Rudyk, R. A., M.A. Checa, C.A. Catalán, S.A. Brandán, 2019, Structural FT-IR, FT-Raman and ECD studies on the free base, cationic and hydrobromide species of scopolamine alkaloid, Journal of Molecular Structure, 1180, 603-617
16. Sahar S. A. S., Manal M.E.M.S., 2012, The effects of using color foods of children on immunity properties and liver, kidney on rats, Food and Nutrition Sciences, 3, 7, 897-904
17. Sonibare O.O., T. Haeger, S.F. Foley, 2010, Structural characterization of Nigerian coals by X-ray diffraction, Raman and FTIR spectroscopy, Energy, 35, 12, 5347-5353
18. Sulekova M., A. Hudák, M. Smrcova, 2016, The determination of food dyes in vitamins by RP-HPLC, Molecules, volume 21, 10, 1-8
19. Wang Q., J.B. Ye, H.Y. Yang, Q. Liu, 2016, Chemical composition and structural characteristics of oil shales and their kerogens using Fourier Transform Infrared (FTIR) spectroscopy and solid-state 13C Nuclear Magnetic Resonance (NMR), Energy & Fuels, 30, 8, 6271-6280
20. Xi X., S. Jiang, W. Zhang, K. Wang, H. Shao, Z. Wu, 2019, An experimental study on the effect of ionic liquids on the structure and wetting characteristics of coal, Fuel, 244, 176-183

77
Annals of the University of Oradea, Fascicle: Environmental Protection Vol. XXXV, 2020 Analele Universităţii din Oradea, Fascicula: Protecţia Mediului Vol. XXXV, 2020
ANTIOXIDANT CAPACITY OF HYPERICUM PERFORATUM FLOWERS IN MARAMURES COUNTY
Frenț Olimpia-Daniela*, Dejeu Ioana-Lavinia*, Săliștean Irimel-Samuel**, Zbârcea Claudia***,
Marian Eleonora*
*University of Oradea, Faculty of Medicine and Pharmacy, 1 December Square, Oradea, Romania E-mail: [email protected]
**pharmacist at Andisima Farm SRL ***Secondary School"Mrs. Oltea", Oradea, Romania
Abstract
Hypericum perforatum is a medicinal plant that has a wide spread throughout our country. The active principles it contains has made it beneficial in the treatment of depressive diseases because they have fewer adverse effects than synthetic drugs.
In this paper, the antioxidant activity of Hypericum perforatum flowers was studied, harvested during the period when it contained the highest amount of hypericin and hyperforin, responsible for the antidepressant action. First an alcoholic extract from flowers was obtained from which it was determined: polyphenolic compounds using the Folin-Ciocâlteu method, the total of flavonoids using colorimetric and spectrophotometric methods and then the antioxidant capacity using two tests: DPPH and FRAP.
Keywords: ringtones, antioxidant, antidepressant, hypericin, hyperforin, flavonoids INTRODUCTION St. John's wort, Hypericum perforatum, is part of the Hypericum family along with other plant species. Of the existing species it is the most used in therapy because it is the richest in active principles. St. John's wort can be used internally to treat depression, viral and bacterial diseases, inflammation or externally St. John's wort oil to heal wounds, burns, eczema, ulcers, cuts, hemorrhoids (Voller, Rosenson, 2004, Bojor, 2018, Sarris et al., 2012, Behnke et al., 2002, LaaKmann et al., 2002, Gastpar et al., 2006).
The Folin-Ciocâlteu method is widely used to identify the content of total polyphenols. By this method, total polyphenol content is calculated as galic acid equivalents/g vegetable product; the method takes place in the basic medium using sodium carbonate when the phenolic hydroxyl groups contained in the phenolic and polyphenolic compounds of the ethanolic extract of the plant product are identified. Folin – Ciocâlteu is a mixture of phosphomolybdate and phosphotungstat. Sodium carbonate first reacts with phenolic hydroxyl groups, forms sodium phenolates, which then react with the Folin-Ciocâlteu reagent, forming compounds that color the solution in blue, which is all the more intense as there are several phenolate groups (Everette et al., 2010, Ikawm et al., 2003, Dejeu et al., 2019).

78
Flavonoids have high antioxidant capacity, i.e. they can act against free radicals, have anti-inflammatory and immune properties, can help the human body to maintain it’s health and fight against viruses, bacteria, etc. The total flavonoids was determined by using a colorimetric and spectrophotometric methods. Most of the researchers use two tests for the rapid determination of antioxidant capacity: DPPH the name comes from the reagent that uses 1,1-diphenyl-2-picrilhydrazil and FRAP, which comes from English, Ferring Reducing Antioxidant Power (Arnao, 2003, Li et al., 2018, Williams et al., 1995, Benzie, Strain, 1996, Mot et al., 2011).
The DPPH technique is performed to determine the antioxidant capacity in vitro or the ability to release hydrogen ions of compounds extracted from different plant products (Sacalîs, 2020, Guzel et al., 2019).
Also a method of determining the antioxidant capacity of compounds in plant products is FRAP method. This method is based on the reduction reaction of the ferric tripiridiltriazine complex (Fe(III)-TPTZ), which must be freshly prepared, the reduction being made to the ferrous tripiridiltriazine complex ((Fe(II)-TPTZ). This requires an acid reducer and pH (Jurcă et al., 2016).
MATERIALS AND METHODS MATERIALS
Dried flowers of Hypericum perforatum, analytical balance KERN ABT 220-5DNM, methanol Silver Chemicals Romania, ethanol Silver Chemicals Romania, Soxhlet device, rotavapor Hei-VAP Advantages Heidolph, semi-automatic pipette pipet4u Performance 0.5-5mL, bidistilled water, Folin-Ciocâlteu reagent, IKA VORTEX 3, sodium carbonate Silver Chemicals Romania, spectrophotometer PG Instruments T70 +, sodium nitrite Silver Chemicals Romania, aluminum chloride Silver Chemicals Romania, sodium hydroxide Silver Chemicals Romania, solution DPPH and FRAP freshly prepared. OBTAINING ALCOHOLIC EXTRACT FROM HYPERICUM PERFORATUM FLOWERS BY SOLID-LIQUID EXTRACTION METHOD
The extract was obtained by the solid-liquid extraction method using
the Soxhlet apparatus. This type of extraction is used when we want to separate one or more components from a solid phase using a liquid phase.
I put a one gram of dried and crushed flowers in a paper cartridge, which I placed in the extraction space of the extractor. As extraction solvent I used the methanol that I put in a flask in which the boiling process takes place. After the extraction method was completed, I concentrated the obtained

79
extract using a rotary evaporator. It operated at a speed of 80 rpm, a pressure of 200 atmospheres, at a temperature of 40 °C. I concentrated it until there was a residue in the flask in the form of a film, which I then took up with 100 mL of ethanol. In this case, we used tap water as a coolant.
DETERMINATION OF POLYPHENOLIC COMPOUNDS FROM THE ALCOHOLIC EXTRACT OF HYPERICUM PERFORATUM BY THE FOLIN-CIOCÂLTEU METHOD
0.1 mL of freshly prepared extract, 1.7 mL of double-distilled water and 0.2 mL of Folin-Ciocâlteu reagent diluted 10 times are placed in a test tube. The contents of the test tube are shaken with a vortex and then left to stand for 5 minutes. 1 mL of 20% Na2CO3 solution is introduced into the test tube to obtain a basic medium (pH = 10) for the reaction to take place between the Folin-Ciocâlteu reagent and the phenolates present in the extract and the solution to turn blue. Reaching the highest intensity of the blue color is obtained after the test tube is kept in the dark for 90 minutes and then its absorbance is read on the UV-VIS spectrophotometer, at a wavelength of 765 nm compared to the standard ethanol. The tests are done in triplicate.
DETERMINATION OF TOTAL FLAVONOID CONTENT
Measure 1 mL of the sample extract and place in the test tube with 4
mL of double-distilled water and 0.3 mL of 5% NaNO2 solution. The test tube mixture was stirred with a vortex and allowed to stand for 5 minutes, then 0.3 mL of AlCl3 10% solution was added. The contents are mixed, left to stand for 6 minutes and then treated with 2 mL of 1M NaOH solution, 2.4 mL of double-distilled water and again shaken vigorously. Read the absorbance of the samples on the UV-VIS spectrophotometer at a wavelength of 510 nm using quartz cuves. The test is done in triplicate.
Prepare another blank sample: from 4 mL of distilled water, 0.3 mL of 5% NaNO2 solution is stirred, leave to stand for 5 minutes, then 0.3 mL of 10% AlCl3 solution is added and again left to stand for 6 minutes, then add 2 mL of 1M NaOH solution, 2.4 mL of double-distilled water and shake vigorously.
DETERMINATION OF THE ANTIOXIDANT CAPACITY OF HYPERICUM PERFORATUM ALCOHOLIC EXTRACT BY THE DPPH METHOD
Place in the test tube 2.9 mL of freshly prepared 6x10⁻⁵ M DPPH
solution, 0.1 mL alcoholic extract which is then shaken and kept in the dark at room temperature for 15 minutes. Then read the absorbance at a

80
wavelength of 515 nm. It is considered as blank, the solution of DPPH. The test is performed in triplicate. DETERMINATION OF THE ANTIOXIDANT CAPACITY OF THE ALCOHOLIC EXTRACT OF HYPERICUM PERFORATUM BY THE FRAP METHOD
Place in the test tube 0.1 mL of alcoholic extract, 0.5 mL of FRAP
solution, 2 mL of double distilled water, shake the contents, leave to stand at room temperature for 60 minutes, read the absorbance on the UV-VIS spectrophotometer at wavelength of 595 nm using a quartz tub. It is used as a standard Trolox and the samples are made in triplicate.
RESULTS AND DISCUSSION
After reading the absorbance of the ethanolic extract at the wavelength
of 765 nm, using the equation of the calibration curve present in figure 1. The concentration of the total polyphenols, expressed in mg galic acid equivalents (GAE)/100 g dry sample, shall be calculated. The equation of the calibration right is:
Y = 0.0135X + 0.0832, R2 = 0.9963 Where: Y – absorption of gallic acid solutions of different concentrations, read at 765 nm using a UV-VIS spectrophotometer; X – concentration of gallic acid solutions.
Fig. 1. Calibration curve for ethanolic solutions of different concentrations in gallic acid
The results obtained for the total polyphenols by the Folin-Ciocâlteu
method for the extract from the ringing flowers are shown in table 1.
0
0,2
0,4
0,6
0,8
0 10 20 30 40 50 60
Abs
orb
ance
(u.a
.)
Solution cincentration (mEg gallic acid/100 g vegetable product)
calibration curve for Folin-Ciocalteu method- ethyl alcohol-

81
Table 1. Calculation of the average total polyphenol concentration of St. John's wort flower extract
expressed in mg GAE/g dry product
Sample Sample absorption
read at 765 nm
Sample concentration (mg
GAE/1 g dry matter) (= 1000X)
Average sample concentration (mg GAE/g dry matter)
Alcoholic extract from Hypericum
perforatum flowers
0.0973 65.911 66.281±0.889 0.0990 67.170
0.0971 65.763
From the analysis of the data obtained it can be concluded that the
alcoholic extract of Hypericum perforatum has an appreciable content of total polyphenols (66.281±0.889). The result is consistent with other determinations by other researchers (62.9 mg GAE/g dry matter (Ciobanu et al., 2018), 75.44-121.19 mg GAE/g dry matter (Shabani et al., 2019), 107.38 mg GAE/G dry matter (Tusevski et al., 2019)).
Calibration curve, presented in figure 2, for the determination of flavonoids was drawn using standard quercetin solutions, of different concentrations.
The equation of the calibration line made with quercetin in aqueous medium is:
Y = 0.8259 X -0.0028 where: Y - absorbance of the sample of ethanolic extract read at 510
nm; X - flavonoid concentration of the sample of ethanolic extract expressed in mg equivalents gram of quercetin/mL.
Fig. 2. Calibration curve performed with quercetin standard in aqueous medium
The results of the analyzes are shown in Table 2.
00,010,020,030,040,050,060,070,080,09
0 0,02 0,04 0,06 0,08 0,1 0,12
Ab
sorb
ance
(u.a
.)
Solution concentration (mg quercetin equivalents)
Calibration curve of standard quercetin solutions

82
Table 2.
Calculation of the average flavonoid concentration of ethanolic extract of St. John's wort flowers expressed in mg EQ/g dry matter
Sample Sample
absorption read at 510 nm
Sample concentration in flavonoids (mg EQ/mL
alcoholic extract)
Sample concentration in flavonoids (mg EQ/g dry
matter) (=100X)
Average sample
concentration in flavonoids (mg EQ/g dry
matter)
Alcoholic extract from Hypericum perforatum
flowers
0.851 1.034 103.378 108.019±4.641
0.902 1.095 109.553
0.915 1.111 111.127
From the analysis of the data in the table, we can conclude that the
alcoholic extract of Hypericum perforatum flowers has a high concentration of flavonoids. The data obtained are consistent with those provided by current studies of some researchers: 108.65-125.35 mg GAE/g dry matter (Shabani et al., 2019) 68.59 mg GAE/g dry matter (Tusevski et al., 2019).
The percentage of DPPH inhibition is calculated using the equation:
% 𝑖𝑛ℎ𝑖𝑏𝑖𝑡𝑖𝑜𝑛 =𝐴 − 𝐴
𝐴 ∙ 100
where: A – blanc absorption read at 515 nm (t = 0 minutes); A – sample absorption read at 515 nm (t = 15 minutes).
The results obtained after performing the DPPH method are presented in Table 3.
Table 3. DPPH test results on alcoholic extract from ringing flowers
Sample Blanc
absorbance Sample
absorbance
Inhibition percentage,
%
Average inhibition
percentage, % Alcoholic extract from Hypericum
perforatum flowers 0.6959
0.193 72.27 72.86±0.59 0.187 73.12
0.186 73.20
The data provided by table 3. show that the alcoholic extract of flowers of Hypericum perforatum L. has a high percentage of inhibition, so a good ability to neutralize free radicals (72.86 ± 0.59), as evidenced by other existing studies (92.45% (Sun et al., 2018)).
The antioxidant capacity according to the FRAP method in alcoholic extracts can be calculated using the regression equation:
y = 0.0017 x + 0.0872

83
where: y - the absorbance of the sample read on the UV-VIS spectrophotometer at 595 nm, expressed in u.a., x - concentration in µmoles equivalent Trolox/sample of 0.1 mL alcoholic extract.
Table 4 shows the results obtained for the antioxidant capacity of the alcoholic extract by the FRAP method.
Table 4. Results of the FRAP method on alcoholic extract from Hypericu perforatum flowers
Sample Sample
absorption read at 595 nm
Sample concentration
(μmoli TE/100 g dry matter)
Average sample concentration
(μmoli TE/100 g dry matter)
Alcoholic extract from Hypericu perforatum
flowers
0.206 69.882
72.431±2.745 0.210 72.235 0.215 75.176
The data provided in Table 4 show that the alcoholic extract of Hypericum perforatum flowers has a lower antioxidant capacity (72.431 ± 2.745 moles TE/100 g dry matter) than rosehips (94.685 ounces TE/100 g dry matter), but higher than sea buckthorn fruit (45.2437 µmoles TE/100 g dry matter) (Sacalîs, 2020). The data obtained are consistent with the data reported in other papers (78.117 µmoles TE/100 g dry matter (Guzel et al., 2019)).
CONCLUSIONS
From the analysis of the obtained data it can be concluded that the alcoholic extract of Hypericum perforatum has an appreciable content of total polyphenols (66.281 ± 0.889 mg GAE/g dry matter ), has a high concentration of flavonoids (108.019 ± 4.641 mg EQ/g dry matter) and a high percentage of inhibition, so a good neutralizing capacity of free radicals (72.86 ± 0.59%) and an antioxidant capacity (72.431 ± 2.745µmoles TE/100 g dry matter) lower than rosehip fruit, but higher than sea buckthorn fruit.
REFERENCES 1. Arnao M. B., 2000, Some methodological problems in the determination of antioxidant
activity using chromogen radicals: a practical case, Trends Food Sci. Technol., 11, 11, 419-421.
2. Behnke K., G.S. Jensen, H. Graubaum, 2002, Hypericum perforatum versus fluoxetine in the treatment of mild to moderate depression. Adv Therapy, 19, 1, 43–52.
3. Benzie I.F.F., J. J. Strain, 1996, The ferric reducing ability of plasma (FRAP) as a measure of "antioxidant power": The FRAP assay, Anal. Biochem., 239, 1, 70-76.
4. Bojor O., 2018, Ghidul Plantelor Medicinale Şi Aromatice de la A la Z., Editura Dharana, Bucureşti 2018, ISBN 978-606-9029-02-2: pp. 217-218.
5. Ciobanu N., M.C. Toma, C. Ciobanu, A. Benea, 2018, Evaluation of polyphenolic profile and antioxidant activity of some species cultivated in the Republic of Moldova, Eurasian Journal of Analytical Chemistry, 13, 3, 1-7.

84
6. Dejeu I., L. Vicaș, T. Jurca, A. Pallag, T. Costea, E. Marian, 2019, Preparation and characterizatin of liposomes loaded with polyphenols extracted from callendula flowers, Annals of the University of Oradea, Fascicula: Environmental Protection, 18, B, 18, 129-134
7. Everette D.J., Q.M. Bryant, A.M. Green, Y.A. Abbey, G.W. Wangila, R.F.Walker, 2010, Thorough study of reactivity of various compound classes toward the Folin-Ciocalteu reagent, Journal of agricultural and food chemistry, 58, 14, 8139-8144
8. Gastpar M, A. Singer, K. Zeller, 2006, Comparative efficacy and safety of a once-daily dosage of hypericum extract STW3-VI and citalopram in patients with moderate depression: a double-blind, randomised, multicentre, placebo-controlled study, Pharmacopsychiatry, 39, 2, 66-75
9. Guzel A., A. Mehmet, M.A. Şanda, 2019, Determination of Antioxidant activity of Hypericum perforatum, Journal of Integrative and Anatolian Medicine, 1, 9-18.
10. Ikawm M., T.D. Schaper, C.A. Dollard, J.J. Sasner, 2003, Utilization of Folin–Ciocalteu phenol reagent for the detection of certain nitrogen compounds, J. Agric. Food Chem., 51, 7, 1811–1815.
11. Jurca T., L. Vicas, I. Toth, M. Braun, E. Marian, A. Teusdea, S. Vicas, M. Muresan, 2016, Mineral elements profile, bioactive compounds and antioxidant capacity of wild blueberry and od pharmaceutical preparations from blueberry (Vaccinum Myrtillus), Revista Farmacia, 64, 4, 581-587.
12. Laakmann G, G. Jahn, C. Schüle, 2002, Hypericum-perforatum-Extrakt bei der Behandlung leichter bis mittelschwerer Depressionen. Klinische und pharmakologische Aspekte [Hypericum perforatum extract in treatment of mild to moderate depression. Clinical and pharmacological aspects], Nervenarzt., 73, 7, 600-612.
13. Li M.F., P.W. Pare, J.L. Zhang, T.L. Kang, Z. Zhang, D.L. Yang, K.P. Wang, H. Xing, 2018, Antioxidant capacity connection with phenolic and flavonoid content in Chinese medicinal herbs, Rec. Nat. Prod., 12, 3, 239-250.
14. Mot A.C., R. Silaghi-Dumitrescu, C. Sarbu, 2011, Rapid and effective evaluation of the antioxidant capacity of propolis extracts using DPPH bleaching kinetic profiles, FT-IR and UV–vis spectroscopic data, J. Food Compos. Anal., 24, 4, 516-522.
15. Sacalîș I., 2020, Lucrare licență, Universitatea din Oradea, Facultatea de Medicină și Farmacie.
16. Sarris J, M. Fava, I. Schweitzer, D. Mischoulon, 2012, St John's wort (Hypericum perforatum) versus sertraline and placebo in major depressive disorder: continuation data from a 26-week RCT. Pharmacopsychiatry. 45, 7, 275-278.
17. Shabani A, M. Karapandzova, I.C. Karanfilova, G. Stefkov, M.S. Crcarevska, S. Kulevanova, 2019, Distribution of total phenols, flavonoids and hypericin in different plant organs of wild-growing St. John’s-wort (Hypericum perforatum L., Hypericaceae) from North Macedonia, Mac. Pharm. Bull., 65, 2, 83-89.
18. Sun P., T. Kang, H. Xing, Z. Zhang, D. Yang, J. Zhang, P.W. Paré, M. Li, 2018, Phytochemical Changes in Aerial Parts of Hypericum perforatum at Different Harvest Stages, Rec. Nat. Prod., 13, 1, 1-9.
19. Tusevski O., M. Todorovska, M. Spasenoski, S.G. Simić, 2019, Antioxidant activity and phenolic compounds in Hypericum perforatum L. wild-growing plants collected in the Republic of Macedonia, Biologica Nyssana, 10, 2, 159-168.
20. Vollmer J.J. and J. Rosenson, 2004, Chemistry of St. John’s Wort: Hypericin and Hyperforin, Journal of Chemical Education, 81, 10, 1450-1456.
21. Williams B.W., M.E. Cuvelier, C. Berset, 1995, Use of a free radical method to evaluate antioxidant activity, LWT - Food Sci. Tech. 28, 1, 25-30.

85
Annals of the University of Oradea, Fascicle: Environmental Protection Vol. XXXV, 2020 Analele Universităţii din Oradea, Fascicula: Protecţia Mediului Vol. XXXV, 2020
CONTRIBUTIONS TO THE EVALUATION OF THE PRODUCTIVITY OF PERMANENT GRASSLANDS FROM THE
BABADAG PLATEAU (DOBROGEA)
Marușca Teodor*, Dihoru Gheorghe**, Doniță Nicolae***, Memedemin Daniyar****, Pășcuț Călin Gheorghe*****
* Research-Development Institute for Grasslands, 5 Cucului St., 500128 Brașov,
Romania, e-mail: [email protected] ** Institute of Biology, 296 Independenței St., 060031 Bucharest, Romania,
e-mail: [email protected] *** Academy of Agricultural and Forestry Sciences, 61 Mărăști Bd., 1 Sector, 011464
Bucharest, Romania **** ”Ovidius” University of Constanța, Factulty of Natural and Agricultural Sciences, 1
Aleea Universității St., 900470 Constanța, Romania, e-mail: [email protected]
***** University of Oradea, Faculty of Environmental Protection, 26 Gen. Magheru St., 410048 Oradea, Romania, e-mail: [email protected]
Abstract
In this paper it is presented a case study for assessing the productivity of permanent grasslands based on floristic relevées. On the grasslands of Babadag Plateau (Tulcea County), with a fairly varied vegetation, 19 grasslands associations were determined belonging to 7 phytocoenological alliances that fall into 4 orders and classes (Festuco-Brometea, Molinio-Juncetea, Puccinellio-Salicornietea, Plantaginetea majoris). At the level of plant association, Lolio-Agrostetum stoloniferae and Lolio-Plantaginetum majoris have the highes productivity with productions of 15-21 t/ha green fodder mass. The lowest productions were evaluated at Koelerio-Artemisietum lerchianae and Trigonello (gladiatae)-Orlayetum with productions of 1.1-1.2 t/ha green mass. Grasslands vegetation shows a particular interest at the level of alliances which most closely resembles with European level habitats. Of these, the most productive ones are Polygonion avicularis and Agrostion albae which have a capacity of 1-1.2 livestock unit/ha in a season of 185 days of grazing. The least productive phytocoenological alliances were Artemisio-Kochion and Pimpinello-Thymion zygoidi with 0.05-0.23 livestock unit/ha loading with animals. These data serve to assess the grasslands from economics point of view, their improvement and rational use, necessary for the preparation and application of pastoral arrangements. Key words: permanent grasslands, pastoral value, feed production, carrying capacity.
INTRODUCTION
In general, studies and research on grassland vegetation in our country contain little or no data on feed production and their quality. These productivity data of the grasslands are necessary to make the best decisions on their improvement, the evaluation of the optimal carrying capacity and other elements regarding the rational management of this important way of use for animal husbandry.

86
By developing a new method for assessing the productivity of grasslands based on floristic surveys, older or newer vegetation studies can be compared as an evolution between them and completed with economic data of production and quality necessary for the preparation of pastoral arrangements (Marușca 2019).
In addition, this method of assessment, which is sufficiently precise, can replace the direct determination by mowing of grassland production in fenced test areas, which is more difficult and sometimes impossible to apply in practice. MATERIAL AND METHOD
As exemplification of the evaluation of the productivity of the grasslands, ”Flora și vegetația Podișului Babadag” synthesis work was chosen - authors Gh. Dihoru and N. Doniță, published by the Romanian Academy Publishing House in 1970.
In chapter 3 ”Vegetația ierboasă a Podișului Babadag” pages 163-243, which also include the vegetation of the permanent meadows drawn up by Gh. Dihoru, the following cenotaxones are outlined:
Class FESTUCO – BROMETEA, Br.-Bl. et Tx. 43 Steppe vegetation Order FESTUCETALIA VALESIACAE, Br.-Bl. et Tx. 43 Aliance Festucion rupicolae, Soó 64 Primary: Ass. Stipo (ucrainicae)-Festucetum valesiacae ass. nov. Ass. Crysopogonetum grylli dobrogicum ass.nov.reg. Ass. Medicagini-Festucetum valesiacae Wagner 40 Ass. Elytrigietum intermediae prov. Ass. Cynodonti-Poëtum angustifoliae (Rapaics 26), Soó 57 Ass. Trigonella (gladiatae)-Orlayetum prov. Secondary: Ass. Bombycilaeno-Botriochloetum ischaemi ass.nov.reg. Ass. Poëtum bulbosae (Prodan 39, Răvăruț et al.56) prov. Ass. Artemisietum austriacae (Săvul. 27p.p.) Prodan 39 Ass. Agropyretum pectiniformae Prodan 39 emend. Dihoru hoc loco Al. Artemisio-Kochion, Soó 57 Ass. Agropyro-Kochietum prostratae Zoloymi (57) 58 Al. Pimpinello-Thymion Fed.nov. Vegetation of calcareous hills Ass. Agropyro-Thymetum zygoidi ass.nov. Ass. Koelerio-Artemisietum lerchianae ass.nov. Ass. Festucetum callierii Șerbănescu 65, ined

87
Class MOLINIO-JUNCETEA , Br.-Bl. 49 Mesophilic vegetation Order MOLINIETALIA, W. Koch 26 Aliance Agrostion albae, Soó 33 Ass. Lolio-Agrostetum stoloniferae prov.
Class PUCCINELLIO-SALICORNIETEA, Țopa 39 Vegetation of weak salts Order PUCCINELLIETALIA, Soó 40 Aliance Juncion gerardi , Wendelbg. 43 Ass. Juncetum gerardi, Wenzl. 34 Ass. Agrosti-Caricetum distantis, (Rapaics 27), Soó 30
Class PLANTAGINETEA MAJORIS, Tx. Et Prsg.50 Vegetation of trampled places Order PLANTAGINETALIA MAJORIS, Tx (47)-50 Aliance Polygonion avicularis, Br.- Bl. 31 Ass. Lolio-Plantaginetum majoris (Lincola 21) Beger 30 Ass. Cynodonetum dactyloni (Prodan 1939) prov.
Marsh vegetation (Class Phragmitetea) was excluded from the grass layer phytocoenological units, as well as segetal (Class Secalietea) and ruderal (Class Chenopodietea) vegetation with less or no importance for feed production.
Appreciation of abundance-dominance (AD) of species from the herbaceous layer in the grasslands of Babadag Plateau was performed on the well-known Braun-Blanquet scale, described by Cristea et al. (2004). Conversion of AD assessment notes into percentages according to constancy classes (K) was made after the model initiated by Marușca (2019) (table 1).

88
Table 1 Appreciation of participation (P%) from synthetic floristic surveys, depending on the
abundance-dominance scale intervals (AD) and average constancy (K%) for phytocoenoses of permanent grasslands (after Marușca 2019 rebuilt)
AD Scale Br. – Bl.
AD according to K (%) V
(81 – 100) IV
(61 – 80) III
(41 – 60) II
(21 – 40) I
(<20) 5 87.5* 61.3 43.8 26.3 8.8
4 - 5 75.0 52.5 37.5 22.5 7.5 3 - 5 62.5 43.8 31.3 18.8 6.3 2 - 5 52.5 36.8 26.3 15.8 5.3 1 - 5 46.3 32.4 23.2 13.9 4.6 + - 5 44.0 30.8 22.0 13.2 4.4
4 62.5* 43.8 31.3 18.8 6.3 3 – 4 50.0 35.0 25.0 15.0 5.0 2 – 4 40.0 28.0 20.0 12.0 4.0 1 – 4 33.8 23.7 16.9 10.1 3.4 + - 4 31.5 22.1 15.8 9.5 3.2
3 37.5* 26.3 18.9 11.3 3.8 2 – 3 27.5 19.3 13.8 8.3 2.8 1 – 3 21.3 14.9 10.7 6.4 2.1 + - 3 19.0 13.3 9.5 5.7 1.9
2 17.5* 12.3 8.8 5.3 1.8 1 – 2 11.3 7.9 5.7 3.4 1.1 + - 2 9.0 6.3 4.5 2.7 0.9
1 5.0* 3.5 2.5 1.5 0.5 + - 1 2.8 2.0 1.4 0.8 0.3
+ 0.5* 0.4 0.3 0.2 0.1 *) Appreciation scale transformation A+D, Braun-Blanquet in percentage, after Tűxen and Ellenberg (1937) in Cristea et all. (2004).
After the transformation of the scale of appreciation of the
phytocoenological notations in percentages of participation next to each species from the floristic survey cassified on three large fodder groups: Poaceae, Fabaceae and other families, we note feed quality (F4 - F9) and harmful (F1 - F3) indicators along with useful(M1 - M9) and harmful (M0 for F1 - F3) forage phytomass indicators.
The fodder value indices (F) after Kovacs (1979), Păcurar and Rotar (2014) and Marușca (2019) are the following:
Feed value indices (F): 1 = toxic to animals and humans; 2 = harmful to animal products; 3 = harmful to the vegetal layer; 4 = weak fodder (ballast species); 5 = mediocre fodder (former F1); 6 = medium forage (formerly F2);
89
7 = good fodder (former F3); 8 = very good fodder (former F4); 9 = excellent fodder (former F5); X = species of unknown feed value. The surveys thus prepared with the participation in % of the species
in the vegetal layer with the mention of the fodder quality indices (F) and those of useful phytomass (M) make possible the calculation of the pastoral value (VP) according to the formula:
xF/9P(%)VP
in which: VP = pastoral value indicator (0 - 100) according to which the forage quality of a grassland is assessed: 0 - 5 degraded grassland; 5 - 15 very weak; 15 - 25 weak; 25 - 40 mediocre; 40 - 60 medium; 60 - 80 good; 80 - 100 very good.
F = Has values between 4-9
For the evaluation of the net fodder production, a new indirect method of determination was applied based on the floristic surveys and production indices (M) of the fodder species (F4-F9) from the vegetal layer of the grasslands (Marușca 2019).
Calculation formula for the determination of the average green mass production index (IM) of permanent grassland phytocoenoses is the following:
xM/100P(%)IM
in which: M - has values between 1-9 only for values of F between 4-9 After establishing the average green feed mass index (IM) the
corresponding interval of the IM value is searched from table 2 and multiplied by the coefficient of transformation into green mass production (CMV), resulting the production in tonnes per hectare and finally the coefficient of appreciation for this indicator.
The green mass production of phytocoenoses is very heterogeneous, starting with 0.2 t/ha (very weak) and can reach over 30 t/ha (excellent) on well-managed and well-exploited permanent grasslands.
Based on these data, the optimal load with animals or carrying capacity (CP) expressed in livestock units (LU/UVM) per hectare are further established using the formula:
NzxZp
MV(kg/ha)CP(UVM/ha)
in which: Nz = the daily requirement of grass for 1 livestock unit (UVM), 65 kg (50 kg + 30% (15kg) seasonal climate fluctuations and unconsumed debris)
Zp = number of grazing days (season)

90
The duration of the optimal grazing season for the Babadag Plateau
is on average 185 days. Table 2
Production indices for feed species and estimating the useful yield per hectare of permanent unfertilized grasslands (after Marușca, 2019)
Average production indices green mass forage species (IM)
Coefficients of transformation in
green mass production (CMV)
Green mass production
estimate (MV) (t/ha)
Appreciation of production
value
0.1 – 0.5 0.6 – 1.0
x 1.8 x 1.9
0.18 – 0.90 1.14 – 1.90
Very weak
1.1 – 1.5 1.6 – 2.0
x 2.0 x 2.1
2.20 – 3.00 3.36 – 4.20
Weak
2.1 – 2.5 2.6 – 3.0
x 2.2 x 2.3
4.62 – 5.50 5.98 – 6.90
Weak - Medium
3.1 – 3.5 3.6 – 4.0
x 2.4 x 2.5
7.44 – 8.40 9.00 – 10.00
Medium
4.1 – 4.5 4.6 – 5.0
x 2.6 x 2.7
10.66 – 11.70 12.42 – 13.50
Middle - Good
5.1 – 5.5 5.6 – 6.0
x 2.8 x 2.9
14.28 – 15.40 16.24 – 17.40
Good
6.1 – 6.5 6.6 – 7.0
x 3.0 x 3.1
18.30 – 19.50 20.46 – 21.70
Good - Very good
7.1 – 7.5 7.6 – 8.0
x 3.2 x 3.3
22.72 – 24.00 25.08 – 26.40
Very good
8.1 – 8.5 8.6 – 9.0
x 3.4 x 3.5
27.54 – 28.90 30.10 – 31.50
Excellent
Appreciation of carrying capacity of grasslands is done this way:
Units of livestock Grassland appreciation (UVM)/ha value
0.01 – 0.20 Degraded (Degr.) 0.21 – 0.40 Very weak (FS) 0.41 – 0.60 Weak (S) 0.61 – 0.80 Mediocre (Med.) 0.81 – 1.20 Middle (Mijl.) 1.21 – 1.60 Good (B) 1.61 – 2.00 Very good (FB) Over 2.00 Excellent (Ext.)
These studies extended to a larger number of cenotaxons over large
physical-geographical areas can finally be generalized. In addition, these studies and assessments on the productivity and
carying capacity of past permanent pastures can be compared with those of

91
today in order to dynamically establish their evolution from economics point of view.
RESULTS AND DISCUSSION
Following the calculations performed at the level of the widest spread vegetal association for the steppe grasslands in the Babadag Plateau, it turned out that the least productive are the most degraded, respectively Agropyro-Kochietum prostratae association and Bombycilaeno-Botriochloetum association with pastoral value (VP) of 6-8, green mass (MV) feed production assessed at 0.6-0.7 t/ha, which supports a load of only 0.05-0.06 livestock units UVM/ha (table 3).
Table 3 Productivity of plant associations of xerophilous grasslands
Plant associations Pastoral
value (VP)
Useful phytomass
index (IM)
Green mass production
(MV) (t/ha)
Livestock units
(UVM/ha)
Festucion rupicolae alliance (Primary) Stipo (ucrainicae)-Festucetum valesiacae association
33 2.01 2.42 0.37
Chrysopogonetum grylli dobrogicum association
15 1.04 2.08 0.17
Medicagini-Festucetum valesiacae association
55 3.52 8.80 0.73
Elytrigietum intermediae association 45 4.78 12.91 1.08 Cynodonti-Poȅtum angustifoliae association 45 3.74 9.35 0.78 Trigonella (gladiatae)-Orlayetum association 14 0.63 1.20 0.10
Festucion rupicolae alliance (Secondary) Bombycilaeno-Botriochloetum association 8 0.38 0.68 0.06 Poëtum bulbosae association 42 0.85 1.62 0.14 Artemisietum austriacae association 25 0.93 1.77 0.15 Agropyretum pectiniformae association 48 2.99 6.88 0.57
Artemisio-Kochion alliance Agropyro-Kochietum prostratae association 6 0.32 0.58 0.05
At the opposite pole there are the phytocoenoses from Medicagini-Festucetum valesiacae association, Cynodonti-Poȅtum angustifoliae association and Elytrigietum intermediae association with pastoral value (VP) and green mass production (MV) which allow a load of 0.73-1.08 livestock units UVM/ha, considered medium as an appreciation value of the productivity of these steppe grasslands. For other less spreaded mesophilous and halophilous phytosociological associations, trampled places and calcareous hills, the most valuable ones are Lolio-Plantaginetum majoris association and Lolio-Agrostetum stoloniferae association with pastoral value (VP) of 67-91 (good and very good) green mass production (MV)

92
about 12-15 t/ha, which allows an optimal loading of 1.2-1.8 livestock units UVM/ha, considered as good and very good (table 4).
The weakest productivity was evaluated at Koelerio-Artemisietum lerchianae association which allows a loading of barely 0.05 livestock UVM/ha, followed by Juncetum gerardi association with 0.12 livestock units UVM/ha, both considered to be severely degraded or economically insignificant.
Table 4 Productivity of plant associations of mesophilic grasslands, trampled places
and calcareous hills
Plant associations Pastoral
value (VP)
Useful phytomass
index (IM)
Green mass production
(MV) (t/ha)
Livestock units
(UVM/ha)
Agrostion albae alliance Lolio-Agrostetum stoloniferae association 67 5.20 14.56 1.21
Juncion gerardi alliance Juncetum gerardi association 13 0.75 1.42 0.12 Agrosti-Caricetum distantis association 49 2.35 5.17 0.43
Polygonion avicularis alliance Lolio-Plantaginetum majoris association 91 6.83 21.17 1.76 Cynodontetum dactyloni association 29 1.02 2.04 0.17
Pimpinello-Thymion zygoidi alliance Agropyro-Thymetum zygoidi association 29 1.38 2.76 0.23 Koelerio-Artemisietum lerchianae association
28 0.60 1.14 0.09
Festucetum callieri association 28 2.02 4.44 0.37
For comparison with current grassland habitats, their productivity was assessed (VP, MV and UVM) at the level of phytosociological alliance, which we consider more general and all-encompassing, similar to habitats in the new concept of vegetation classification (table 5).
Table 5 Average productivity of the main permanent grasslands and optimal carrying capacity at the
level of phytosociological alliance (habitat)
Phytosociological alliance Pastotal
value (VP)
Green mass production (MV) (t/ha)
Livestock units
(UVM/ha) %
Festucion rupicolae (primary) 35 6.13 0.51 102 Festucion rupicolae (secondary) 31 2.74 0.23 46
Artemisio-Kochion 6 0.58 0.05 1011 Agrostion albae 67 14.56 1.21 242
Juncion gerardi 31 3.29 0.27 54 Polygonion avicularis 60 11.61 0.97 194 Pimpinello-Thymion zygoidi 28 2.78 0.23 46 General average 37 5.96 0.50 100

93
The highest VP of 60-67 were evaluated at Agrostion albae and Polygonion avicularis and the lowest of 6-28 to Artemisio-Kochion and Pimpinello-Thymion zygoidi.
As regards the production assessed by MV at the alliance level the situation is identical with VP, allowing a load of 0.97-1.21 livestock units UVM/ha, considered as medium for Polygonion avicularis and Agrostion albae respectively 0.05-0.23 livestock units UVM/ha for the least valuable, Artemisio-Kochion and Pimpinello-Thymion zygoidi.
By comparison, the grasslands from Agrostion stoloniferae (alba) alliance from the Măcin Mountains have a grazing capacity of 1.38 livestock units UVM/ha, with 14% higher, and those in Oltenia allow an optimal load of 1.36 livestock units UVM/ha with only 12% more than the Babadag Plateau because the latter are more degraded (Marușca et al. 2019, 2020).
General arithmetic mean at the level of phytosociological alliances for the Babadag Plateau is presented with a pastoral value of 37 (mediocre), green fodder mass production (net phytomass) nearly 6 t/ha which can maintain 0.5 livestock units UVM/ha in an optimal grazing season.
In the Măcin Mountains located in the north of the Babadag Plateau with a fairly similar grassland vegetation, a pastoral value of 35 is recorded compared to 37 the average in the plateau and an average production of 5.89 t/ha compared to 5.96 t/ha in the plateau, both economics indicators being higher by 1-6% on the plateau compared to the mountain (Marușca et al. 2019).
This difference is quite small on assessing the productivity of permanent grasslands from the plateau and the mountain, and it confirms to us that the new method applied is correct.
As productivity based on floristic surveys is assessed upon a large number of grassland phytocoenoses it will be possible to draw clearer and clearer conclusions on their economics value, to serve in the end preparation of pastoral arrangements, to improve and sustainably manage this important agricultural activity. CONCLUSIONS
The permanent grasslands in the Babadag Plateau have a great variability from a phytocoenological and agroproductive point of view, with steppe vegetation, mesophilous and halophilous plant associations, trampled places and calcareous hills.
The highest productivity (pastoral value and fodder production) can be observed with the grasslands belonging to Polygonion avicularis alliance and Agrostion albae alliance with 60-67 pastoral value (VP) 12-15 t/ha

94
green fodder mass (MV) which allows an optimal loading of 1-1.2 livestock unit (UVM)/ha in 185 grazing days.
The lowest productivity is evaluated at Artemisio-Kochion alliance and Pimpinello-Thymion zygoidi alliance with 6-28 pastoral value (VP), 0.6-3 t/ha green fodder mass (MV) which barely allow 0.1-0.2 livestock unit (UVM)/ha in a grazing season.
The average productivity in the Babadag Plateau is 37 in terms of pastoral value (VP), 6 t/ha green fodder table (MV), and an optimal capacity of 0.5 livestock unit (UVM)/ha, calculated for 185 grazing days, with a need of 65 kg green fodder mass (MV)/ livestock unit (UVM)/day.
The data on the productivity of the grasslands through the new method of evaluation based on floristic surveys are used to prepare pastoral arrangements and research on the evolution over time of this main indicator. REFERENCES
1. Cristea V., Gafta D., Pedrotti F., 2004, Fitosociologie, Ed. Presa Universitară
Clujeană, pp. 360. 2. Dihoru Gh, Doniță N., 1970, Flora și vegetația podișului Babadag, Ed. Academiei
Române, București, pp. 438. 3. Kovacs A. J., 1979, Indicatorii biologici, ecologici şi economici ai florei pajiştilor,
Redacţia de propagandă tehnică agricolă, Bucureşti, pp. 50. 4. Marușca T., 2016, Praticultura pe înțelesul tuturor, Editura Profesional-Agromedia
SRL, București. 5. Marușca T., 2019, Contributions to the evaluation of pasture productivity using the
floristic releve. Romanian Journal of grassland and forage crops, 19, pp. 33- 47. 6. Marușca T., Taulescu Elena, Roșca V., Băjenaru B.S., Memedemin D., 2019,
Controbution to the evaluation of grassland productivity on the Macinului Mountains National Park. Romanian Journal of grassland and forage crops, 20, pp. 17-26.
7. Marușca T., Ionescu I., Simion Ioana, Taulescu Elena, Mălinaș Anamaria, 2020, Contributions to the evaluation of the productivity of the permanent grasslands from North Oltenia. Romanian Journal of Grassland and Forage Crops, 21, pp. 49-59, Cluj-Napoca.
8. Păcurar F., Rotar I., 2014, Metode de studiu și interpretare a vegetației pajiștilor. Ed. Risoprint, Cluj-Napoca.
9. Pășcuț C. Gh., 2018, The pastoral value of Finiș valley grassland (Codru-Moma Mountains, Bihor county). Analele Universității din Oradea, Fascicula: Protecția Mediului, Vol. XXXI, pp. 159-168.

95
Annals of the University of Oradea, Fascicle: Environmental Protection Vol. XXXV, 2020 Analele Universităţii din Oradea, Fascicula: Protecţia Mediului Vol. XXXV, 2020
THE IMPACT AND VULNERABILITIES OF AGRICULTURE IN NORD-WEST REGION OF ROMANIA TO CLIMATE CHANGE
Mintaş Olimpia*, Mintaş Ioan*
*University of Oradea, Faculty of Environmental Protection, 26 G. Magheru st., 410048 Oradea,
Romania, e-mail: [email protected]
Abstract Global environmental change has the potential to exacerbate ecologically and societally the
impact of biodiversity change. In many regions, land conversion is forcing the population to decline to the edges of the coverage of their species, where they become increasingly vulnerable to collapse if exposed to additional human impact. Degradation of natural resources is one of the greatest vulnerabilities to the impact of climate change. Rising temperatures will have a negative impact on crop yields, especially in southern Romania, where there are already crops approaching their temperature tolerance threshold. While the direct impact is associated with rising temperatures, the indirect impact is due to changes in soil moisture and probably the incidence of pests and diseases. The most significant effects is probably be borne by small farmers who have a limited financial and technical capacity to adapt to climate variability and change. This article aims to improve the understanding of the impact of climate change, the vulnerability of agricultural adaptation practices to climate change. Key words: Climate change, agriculture, vulnerability, impact
INTRODUCTION
Global warming currently involves two major problems for humanity: on the one hand, the need to drastically reduce greenhouse gas emissions, in order to stabilize the level of concentration of these gases in the atmosphere, to prevent anthropogenic influence on the climate system and to enable natural ecosystems to adapt naturally, and on the other hand, the need to adapt to the effects of climate change, given that these effects are already visible and inevitable due to the inertia of the climate system, regardless of the outcome of emission reduction actions. (4).
Despite all global efforts to reduce greenhouse gas emissions, the global average temperature will continue to rise in the coming period, requiring the most urgent measures to adapt to the effects of climate change. The "5th Global Report on Climate Change Assessment (AR5)" IPCC (Intergovernmental Panel on Climate Change) comprehensively presents the latest scientific findings and observations on the causes of climate change and its impact in the short, medium term. and their length (12). The report examined various options for adapting to the effects of climate change and reducing emissions, including the interdependencies specific to the sustainable development of society, given the relevant long-term socio-economic and scientific aspects.

96
Mitigating the effects of climate change in agriculture is a priority objective in strategic development actions. The interdisciplinary nature of the actions implies a global approach by identifying and correlating the activities of development and implementation of intra- and intersectoral measures with those of responding to the effects of climate change. Plant production varies from year to year, being significantly influenced by fluctuations in climatic conditions and especially by the occurrence of extreme weather events. Climate variability affects all sectors of the economy, but agriculture remains the most vulnerable, and the impact on it is more pronounced today, as climate change and variability are becoming more pronounced. (12). MATERIAL AND METHOD
The environmental issues and their consequences on alive organisms
have extended, becoming a threat to survival. We are facing a full ecological crisis, crisis which requires an international approach of the environmental issue. The „biocapacity” of the Earth exceeds today with 25% the capacity to support the needs of human kind, thus this crisis is manifested in three directions (8): - in the multiplication 4 times of the globe’s population in the XXth century, from 1,6 billions in 1900 to 6,4 billions in 2000; - in the development of dangerous technologies and their export in the 3rd world countries, poor countries, which lead to the deterioration of their environment due to the lack of instruments for the environmental control; - the replacement of natural products with synthetic, toxic ones, which accumulated in the environment’s biosystem. (1,2)
At the level of Central and Eastern Europe, the scenarios show a clear decrease in rainfall, especially in the summer season, so a rainfall deficit that will affect all areas of activity, mainly agriculture, population and ecosystems. The most vulnerable cultivated species will be especially the annual cereals and hoe crops, the water deficit in the summer season, which coincides with the period of maximum water requirements, causing significant decreases in production. In this sense, a new reorientation in the structure of agricultural crops is required, respectively varieties with a high tolerance to high temperatures and water stress generated by lack of water. At the same time, it is necessary to adapt agricultural technologies to water resources, soil water conservation by choosing a system of minimum works representing a new trend of reorientation of requirements on quality and conservation of soil and water resources. Also, the decrease of water resources by 10-30%, especially in deficient areas, will accentuate the consequences of lack of water, the effects being amplified by pollution and inadequate technologies.

97
The complex effects of climate change on agriculture underpin the need for risk reduction decision-making in order to maintain appropriate crop standards and promote sustainable agriculture. Thus, climate variability and change must be addressed in the light of daily agricultural activities, with the help of mitigation strategies and adaptation measures.(3,6)
In the field plant cultivation sector, the selection of cultivated varieties mainly includes the correlation of local environmental conditions with the degree of resistance of genotypes (varieties / hybrids) to limiting vegetation conditions (drought, excess moisture, high temperatures, cold / frost, etc.).
The succession of crops in time and space are efficient ways for each agricultural user to protect the productive potential of the soil and, implicitly, to ensure constant yields. Opportunities in establishing a sustainable management system in crop structure and crop rotation choice include: adaptability of genotypes to the potential of ecological areas; direct effects on the physical (structural structure and stability),
chemical (nutrient content) and biological (amount of organic matter) properties of the soil;
reducing the risk of transmitting diseases and pests or developing weeds;
protection of soils against erosion, surface runoff and crust formation; decreasing the degree of erosion and maintaining agricultural
productions at constant values; efficient use of plant nutrients; management of agricultural lands by using a rotation system,
maintaining a balance regarding the share of permanent crops in relation to the annual ones;
prevention of water pollution by drainage and percolation of water outside the areas crossed by the root system of plants, in the case of irrigated crops.
In the structure of crops, the choice of varieties / hybrids is based on their adaptability to the pedoclimatic conditions specific to the area, in correlation with market requirements. In terms of relief, knowledge of the depth of groundwater and surface water ensures the prevention of pollution risks as a result of the technologies applied.
In the structure of crops, the choice of varieties / hybrids is based on their adaptability to the pedoclimatic conditions specific to the area, in correlation with market requirements. In terms of relief, knowledge of the depth of groundwater and surface water ensures the prevention of pollution risks as a result of the technologies applied. The size of the slopes must also be taken into account when carrying out soil work, in particular plowing, to prevent soil degradation as a result of water erosion.

98
use of varieties / hybrids adapted to the crop rotation system on the farm;
use of mixed crops, intercropping, permanent crops, double crops on the same plots or within the farm to increase biodiversity.
Irrigation agriculture is based on the artificial distribution of water in agricultural land to establish crops and ensure the growth of agricultural plants. The choice of irrigation system according to local needs and conditions regarding the area, type of crop and soil properties are the basic requirements in a sustainable agricultural management system. The main directions for the revitalization of the irrigation sector, as a first measure to reduce the effects of drought, are the following: elaboration of a complex study regarding the prioritization of the
rehabilitation of land improvement arrangements and of the irrigation sector in North-West Romania;
rehabilitation of pumping stations from irrigation facilities declared of public utility, in order to reduce energy consumption and increase hydraulic efficiency;
waterproofing of water transport, supply and distribution channels in irrigation facilities; adapting the hydrotechnical schemes of the irrigation systems to the new operating conditions and establishing the areas that can be declared of public utility, in order to optimally operate them.
RESULTS AND DISCUSSION Recommendations and adaptation measures: selection of cultivated varieties by correlating local
environmental conditions with the degree of resistance of genotypes to limiting vegetation conditions (drought, excess humidity, high temperatures, cold / frost, etc.);
crop management and rational land use, while maintaining a low impact of agricultural practices on the environment and climate;
cultivation of a larger number of varieties / genotypes, respectively varieties / hybrids, in each agricultural year, with different vegetation period, for a better capitalization of the climatic conditions, especially the humidity regime and the staggering of the agricultural works;
the choice of genotypes resistant to limiting vegetation conditions, with a high tolerance to "heat", drought and excess moisture;

99
selection of varieties of plants with natural resistance to specific diseases caused by pathogens;
practicing crop rotation and establishing a crop structure that includes at least 3 groups of plants, respectively straw cereals 33%, hoes 33% technical plants and legumes 33%. The following types of crops can be used in vegetable production: agricultural, fodder, special and mixed.(4)
CONCLUSIONS
The direct and indirect effects of global warming will be manifested, thus, in several general directions: - modifications of vegetation, the appearance of weeds which may become fatal for the ecosystem, in time; - the increase of the level of seas and oceans with approximately 50 cm in the year 2050, which might put in danger lots of ecosystems, especially by an increase of salinity; - weather abnormalities manifested though tropical rains, storms, tornados, waves of heat, etc. With an impact on the entire biosystem and on all alive mechanisms; - the appearance of diseases transmitted through vectors, in some regions of the globe this phenomenon may lead to incidence, prevalence and, possibly, mortality; - the food safety is threatened, high temperatures will affect crops in some regions of the world, especially due to modifications of the rainfall regime and the soil’s humidity; - emphasis on the desertification, due to the „green revolution” which lead to a dramatic increase of the agricultural production, especially in the past 40 years after the second world war; - withdrawal of alpine glaciers has as main cause the increase of green house gas concentration, phenomenon noticed for the first time in the XIXth century, leading to the withdrawal of river flows (used in irrigations and as drinkable water), which generated a real "water crisis” with consequences in the limitation of population increase in many regions from the globe.
Our society must adopt a practical attitude in solving the environmental issues, instead of the one adopted until now, a reactive attitude, taken each time when a crisis appears. An optimism reason might be the fact that the great majority of alive organisms from Terra are robust, powerful, which many times demonstrated the ability to adapt to a large scale of precarious weather conditions. Mankind enters into the largest crisis ever encountered, but the man is full of resources and in the best shape, even in crisis moments.
IPCC, in its report, approached several options to diminish these global modifications: non-polluting methods of transportation, reduction of gas emissions of human establishments, preservation of agricultural

100
fields, policies and strategies of management of woods from the Earth, an efficient industry, so on. REFERENCE
1. Berca M., 2000, General ecology and environmental protection, Ceres Publishing
House, Bucharest 2. ***Codul de atitudini pentru prevenirea impactelor mutuale dintre agricultură și
schimbările climatice,: http:// www.cameraagricolavn.ro/biblioteca 3. ***Comisia Europeană, Cartea Albă „Adaptarea la efectele schimbărilor climatice:
către un cadru de acțiune la nivel european”, 2009 4. Ghidul privind adaptarea la efectele schimbărilor climatice, 2008 5. ***Comisia Europeană, Cartea Verde a Comisiei către Consiliu, Parlamentul
European, Comitetul Economic și Social European și Comitetul Regiunilor: „Adaptarea la schimbările climatice în Europa - posibilitățile de acțiune ale Uniunii Europene”, 2007
6. ***Comisia Europeană, Direcția Generală pentru Agricultură și Dezvoltare Rurală, „Agricultura UE - asumarea provocării schimbărilor climatice”, 2008
7. ***Convenția-cadru a Națiunilor Unite asupra schimbărilor climatice (UNFCCC) 8. ***IPCC, „Climate Change 2013: The Physical Science Basis. Contribution of
Working Group I to the Fifth Assessment Report of the Intergovernmental Panel on Climate Change Stocker, T.F., D. Qin, G.-K. Plattner, M. Tignor, S.K. Allen, J. Boschung, A. Nauels, Y. Xia, V. Bex and P.M. Midgley (eds.), 2013, Cambridge University Press, Cambridge, United Kingdom and New York, NY, USA, 1535 pp
9. ***IPCC, „Climate Change 2014: Mitigation of Climate Change. Working Group III Contribution to the IPCC 5th Assessment
10. Report - Changes to the Underlying Scientific/Technical Assessment to ensure consistency with the approved Summary for Policymakers (XXXIX/Doc.17) and presented to the Panel at its Thirty-Ninth Session”, 2014
11. ***Ministerul Mediului și Schimbărilor Climatice, „Ghid privind adaptarea la efectele schimbărilor climatice”, 2008, disponibil
12. ***Programul privind schimbările climatice și o creștere economică verde, cu emisii reduse de carbon - Rezumat al evaluărilor sectoriale rapide și al recomandărilor de includere a măsurilor privind schimbările climatice în Programele Operaționale Sectoriale 2014-2020, disponibil la: http://documents.worldbank.org
13. ***Strategia Națională a României privind Schimbările Climatice 2013–2020, disponibilă la: http://www.mmediu.ro/beta/wpcontent/ uploads/2012/10/2012-10-05-Strategia_NR-SC.pdf
14. ***Tubiello, F., et al., „Climate change response strategies for agriculture: challenges and opportunities for the 21st century.” Agriculture and Rural Development Discussion Paper 42. World Bank, 2008
15. ***Tubiello, F., Fischer, F., „Reducing Climate Change Impacts on Agriculture: Global and Regional Effects of Mitigation, 2000–2080.”, Technological Forecasting and Social Change 74 (7): 1030–1056, 2007
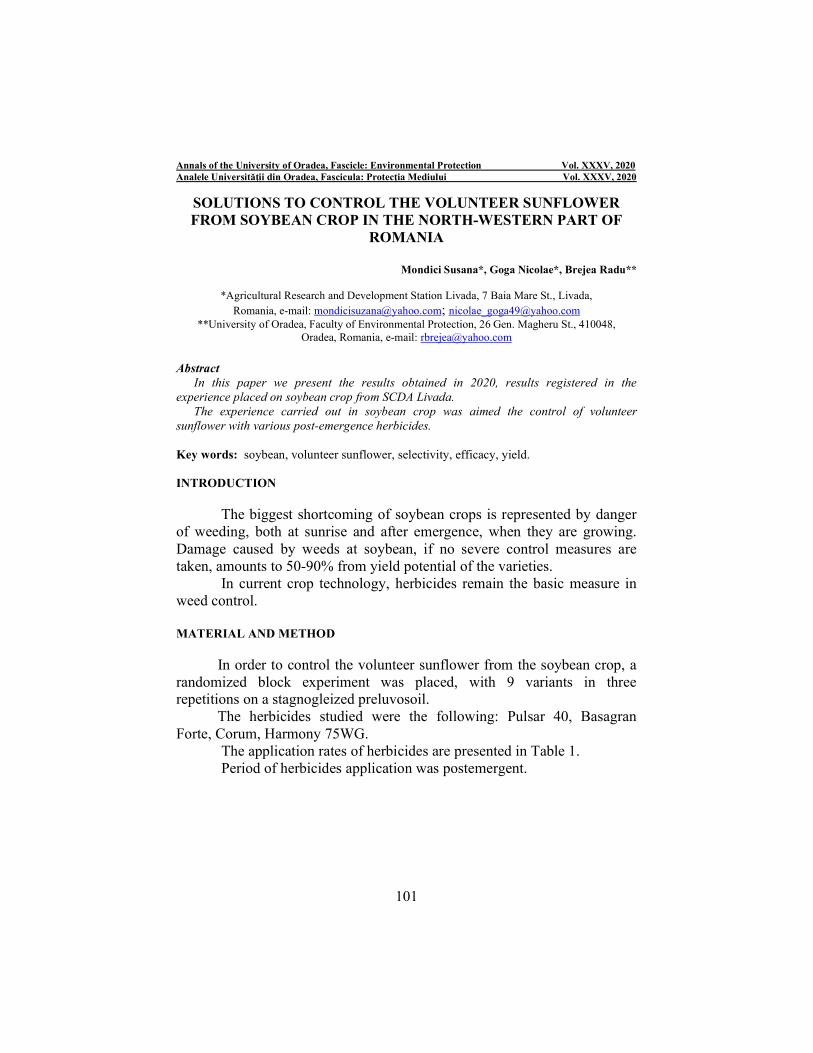
101
Annals of the University of Oradea, Fascicle: Environmental Protection Vol. XXXV, 2020 Analele Universităţii din Oradea, Fascicula: Protecţia Mediului Vol. XXXV, 2020
SOLUTIONS TO CONTROL THE VOLUNTEER SUNFLOWER FROM SOYBEAN CROP IN THE NORTH-WESTERN PART OF
ROMANIA
Mondici Susana*, Goga Nicolae*, Brejea Radu**
*Agricultural Research and Development Station Livada, 7 Baia Mare St., Livada, Romania, e-mail: [email protected]; [email protected]
**University of Oradea, Faculty of Environmental Protection, 26 Gen. Magheru St., 410048, Oradea, Romania, e-mail: [email protected]
Abstract
In this paper we present the results obtained in 2020, results registered in the experience placed on soybean crop from SCDA Livada.
The experience carried out in soybean crop was aimed the control of volunteer sunflower with various post-emergence herbicides.
Key words: soybean, volunteer sunflower, selectivity, efficacy, yield. INTRODUCTION
The biggest shortcoming of soybean crops is represented by danger of weeding, both at sunrise and after emergence, when they are growing. Damage caused by weeds at soybean, if no severe control measures are taken, amounts to 50-90% from yield potential of the varieties.
In current crop technology, herbicides remain the basic measure in weed control.
MATERIAL AND METHOD In order to control the volunteer sunflower from the soybean crop, a randomized block experiment was placed, with 9 variants in three repetitions on a stagnogleized preluvosoil. The herbicides studied were the following: Pulsar 40, Basagran Forte, Corum, Harmony 75WG. The application rates of herbicides are presented in Table 1. Period of herbicides application was postemergent.

102
Table 1 Herbicides applied at soybean crop, 2020
Var Herbicide Rate
l,kg/ha Active substance
1 Pulsar 40 1.2 imazamox 40g/l
2 Pulsar 40 2.0 imazamox 40g/l
3 Basagran Forte 2.5 bentazon 480 g/l + wettol 100g/l
4 Basagran Forte 4.0 bentazon 480 g/l + wettol 100g/l
5 Corum + Dash 1.9+1.0 (bentazon 480g/l + imazamox22,4g/l) + adjuvant
6 Corum + Dash 2.5+1.0 (bentazon 480g/l + imazamox22,4g/l) + adjuvant
7 Harmony 75WG+ Trend 0.012+0.250 (tifensulfuron-metil, 750 g/kg) + adjuvant
8 Harmony 75WG+ Trend 0.020+0.250 (tifensulfuron-metil, 750 g/kg) + adjuvant
9 Untreated - -
During the vegetation period, observations were made on the selectivity of herbicides on soybean crop and the efficacy on volunteer sunflower and not only.
Determination of the selectivity was made by awarding the EWRS notes and of the efficiency by counting the volunteer sunflower and the weed species on 1 mp in each variant.
The biological material used in the experimental field was the Onix variety, an early variety, with good suitability for mechanized harvesting
Harvesting was done with the combine for harvesting of the experimental plots. RESULTS AND DISCUSSION
The treatmant was efefctuated in 16. 06. 2020. Based on the observations made (Table 2) we appreciate that the herbicides: Basagran Forte, Corum and Harmony, applied in the phase of three trifoliate leaves of soybeans have a slight phytotoxicity, phytotoxicity that disappears with the vegetation growth of the crop plant.
Table 2 Selectivity of herbicides used for control of volunteer sunflower from soybean crop, 2020
Var Herbicide Rate l,kg/ha
Time of application
Note EWRS - Selectivity
18.06.2020 18.08.2020 1 Pulsar 40 1.2 post 1 1 2 Pulsar 40 2.0 post 1 1 3 Basagran Forte 2.5 post 2 1 4 Basagran Forte 4.0 post 3 1 5 Corum + Dash 1.9+1.0 post 2 1 6 Corum + Dash 2.5+1.0 post 2,5 1 7 Harmony 75WG+ Trend 0.012 + 0.250 post 3 1 8 Harmony 75WG+ Trend 0.020+ 0.250 post 3 1 9 Untreated - - 1 1
Note EWRS Note 1 = plannts without phytotoxicity symptoms; Note 9 = plannts with phytotoxicity symptoms
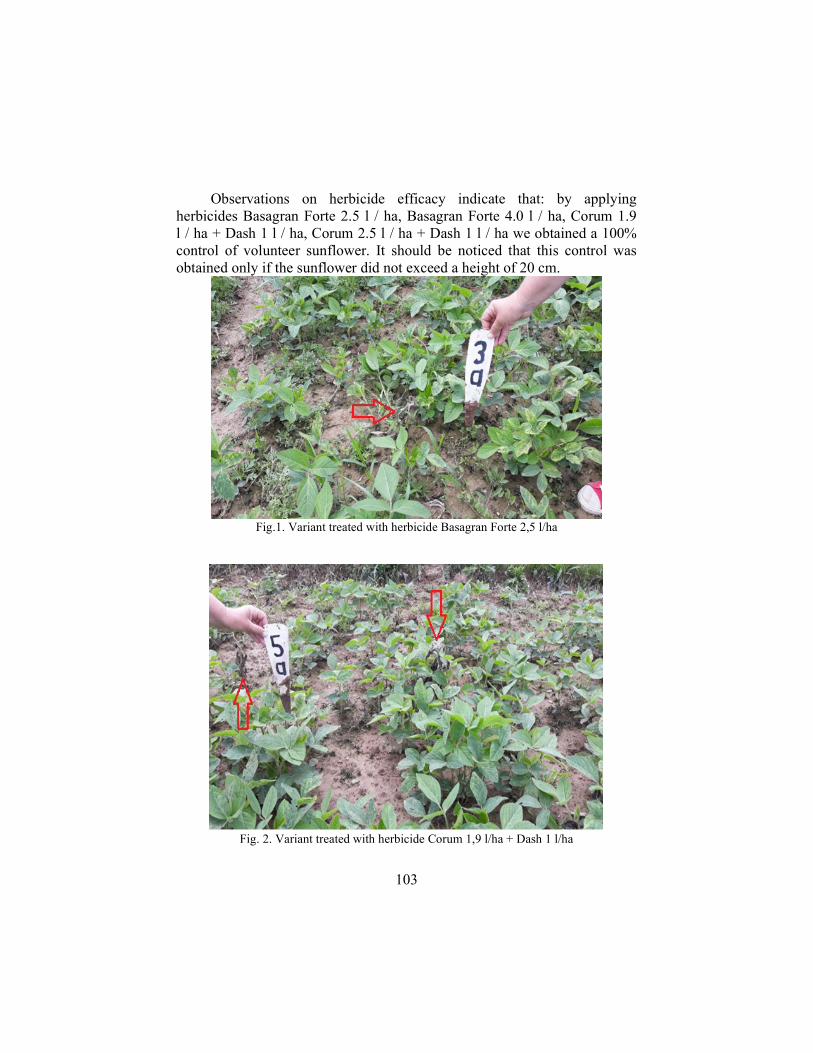
103
Observations on herbicide efficacy indicate that: by applying herbicides Basagran Forte 2.5 l / ha, Basagran Forte 4.0 l / ha, Corum 1.9 l / ha + Dash 1 l / ha, Corum 2.5 l / ha + Dash 1 l / ha we obtained a 100% control of volunteer sunflower. It should be noticed that this control was obtained only if the sunflower did not exceed a height of 20 cm.
Fig.1. Variant treated with herbicide Basagran Forte 2,5 l/ha
Fig. 2. Variant treated with herbicide Corum 1,9 l/ha + Dash 1 l/ha
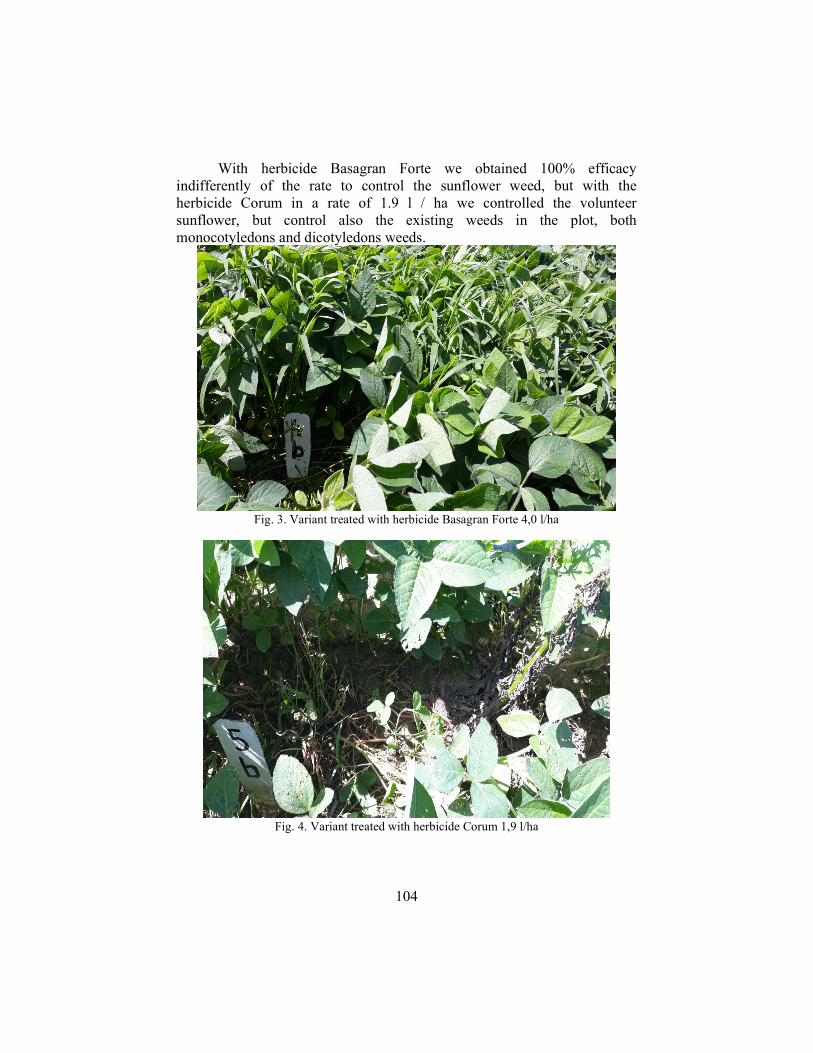
104
With herbicide Basagran Forte we obtained 100% efficacy indifferently of the rate to control the sunflower weed, but with the herbicide Corum in a rate of 1.9 l / ha we controlled the volunteer sunflower, but control also the existing weeds in the plot, both monocotyledons and dicotyledons weeds.
Fig. 3. Variant treated with herbicide Basagran Forte 4,0 l/ha
Fig. 4. Variant treated with herbicide Corum 1,9 l/ha

105
In variants 1,2,7,8, variants in which we applied the herbicide Pulsar and Harmony in different rates, the efficacy on the volunteer sunflower was 0% (Table 3).
Table 3 The efficacy of herbicides to control volunteer sunflower in soybean crop, 2020
Var Herbicide Rate
l,kg/ha Time of
application Efficacy %
1 Pulsar 40 1.2 post 0 2 Pulsar 40 2.0 post 0 3 Basagran Forte 2.5 post 100 4 Basagran Forte 4.0 post 100 5 Corum + Dash 1.9+1.0 post 100 6 Corum + Dash 2.5+1.0 post 100 7 Harmony 75WG+ Trend 0.012+0.250 post 0 8 Harmony 75WG+ Trend 0.020+0.250 post 0 9 Untreated - - 0
Fig. 5.Variant treated with herbicide Pulsar 2,0 l/ha

106
Fig. 6. Variant treated with herbicide Harmony 20 g/ha
The best efficacy for weeds was obtained in the variant treated with
Corum 2.5 l / ha + Dash1l / ha (Adjuvant) and the variant treated with Corum 1.9 l / ha + Dash1l / ha (Adjuvant) were registered an efficacy by 99-100% (Table 4).
Table 4 Efficiency of herbicides in weeds control from soybean crop, 2020
Var Herbicide Rate
l,kg/ha Time of
application Efficacy%
1 Pulsar 40 1.2 post 45 2 Pulsar 40 2.0 post 62 3 Basagran Forte 2.5 post 37 4 Basagran Forte 4.0 post 61 5 Corum + Dash 1.9+1.0 post 99 6 Corum + Dash 2.5+1.0 post 100 7 Harmony 75WG+ Trend 0.012+0.250 post 25
8 Harmony 75WG+ Trend 0.020+0.250 post 10 9 Untreated - - 0
Analyzing the yields results we see that in the variants treated with
Pulsar 40 1.2l / ha, Pulsar 40 2l / ha, Corum 1.9l / ha + Dash 1l / ha (Adjuvant), Corum 2.5l / ha + Dash 1l / ha (Adjuvant) the yield spore is statistically assured both untreated and compared to the average experience (Table 5). In the variants were we obtained a low efficiency, the yield spore

107
was not ensured statistically in the untreated variant, and compared to the average experience we obtained negative spore.
Table 5. The influence of herbicide treatments on yield in soybean crop, 2020
No. Var.
Herbicide Rate l,kg/ha
Yield q/ha
Diff. +/-
to Mt
Diff. +/- to x̅
Semnification
Mt x̅
1 Pulsar 40 1.2 55.9 12.9 4.7 xxx x 2 Pulsar 40 2.0 62.0 19.0 10.8 xxx xxx 3 Basagran Forte 2.5 43.3 0.3 -7.8 - 00 4 Basagran Forte 4.0 46.6 3.6 -4.5 - 0 5 Corum + Dash 1.9+1.0 61.6 18.6 10.4 xxx xxx
6 Corum + Dash 2.5+1.0 62.3 19.3 11.1 xxx xxx 7 Harmony 75WG+
Trend 0.012+0.250 46.0 3.0 -5.1 - 0
8 Harmony 75WG+ Trend
0.020+0.250 39.6 -3.4 -11.5 - 000
9 Untreated - 43.0 - -8.1 - 00 Average Exp. 51.14 -
LSD 5% = 4.45 q/ha 1% = 6.13 q/ha 0,1% = 8.44 q/ha CONCLUSIONS
The research was carried out in 2020 on soybean crop, the experience being located at SCDA Livada on a stagnogleized preluvosoil. The herbicides applied in variants 3,4,7,8 showed a slight phytotoxicity that disappears with the advancement in vegetation.
Both in the control of volunteer sunflower weed and in the control of other existing weeds, the most efficient was herbicide Corum in both rates.
By applying the herbicide Pulsar 40 and Corum we obtained a yield spore statistically assured compared to both the untreated and the average experience.
The presence of volunteer sunflower in this experiment did not affect soybean yield, but uncontrolled weeds in variants 3,4,7,8 decreased the yield.
REFERENCES 1. Berca M., 1996, Probleme actuale ale combaterii buruienilor. Combaterea integrată a
buruienilor. Al X-lea Simpozion Naţional de Herbologie, Sinaia. 2. Berca M., 1996, Combaterea buruienilor din culturile agricole. Editura. Fermierul
român, Bucureşti. 3. Berca M., 2000, Ecologia generală şi protecţia mediului – Editura. Ceres Bucureşti 4. Berca M., Tănase Gheorghe, 2000, Relaţiile de concurenţă între buruieni şi plantele de
cultură – Al XII –lea Simpozion Naţional de Herbologie – Sinaia 5. Berca M., 2004, Managementul integrat de combatere a buruiuenilor. Editura Ceres

108
6. Brejea R., 2009, Tehnologii de protecţie sau refacere a solurilor. Editura. Universităţii din Oradea, ISBN 978-973-759-937-7., pp. 360
7. Brejea R., 2010, Ştiinţa solului – îndrumător de lucrări practice, Editura Universităţii din Oradea.
8. Brejea R., 2011, Practicum de Tehnologii de Protecţie a Solurilor. Editura Universităţii din Oradea.
9. Brejea R., 2011, Practicum de pedologie, Editura. Universităţii din Oradea. 10. Chirilă C-tin., 2001, Biologia Buruienilor Organografie, Corologie, Dinamică,
Importanţă. Editura. Ceres Bucureşti 11. Ciobanu Gh., Domuţa C., 2003, Cercetări agricole în Crișana. Editura.Universității din
Oradea 12. Ciocârlan V., Berca M., Chirilă C., Coste I., Popescu Gh., 2004, Flora segetală a
României Bucureşti, Editura Ceres. 13. Fritea T., Ghinea L., 1995, Dinamica rezervei de seminţe de buruieni şi a îmburuienării
culturilor în cadrul unei rotaţii de trei ani pe luvisolul albic de la Livada.Anale ICCPT vol. LXII pag. 255-279
14. Fritea T., Vlăduţu I., Ghinea L., 1996, Dinamica speciilor perenede buruieni(Elymus repens, Cirsium arvense şi Convolvulus arvensis) ca urmare a tratamentelor cu erbicide în cadrul unei rotaţii de 3 ani. Al X-lea Simpozion Naţional de Herbologie, Sinaia
15. Fritea T., 1998 - Cercetări privind efectele colaterale ale utilizării erbicidelor pe solurile acide din nord-vestul ţării. Teză de doctorat A.S.A.S. Gh.Ionescu Sisesti, Bucureşti.
16. Mondici S., 2016, Cercetări privind influenţa tipului de sol asupra compoziţiei floristice a buruienilor. Analele Universităţii din Oradea, Fascicula Protecţia Mediului
17. Mondici S., Fritea T., Brejea R., 2016, Cercetări privind protecţia culturilor împotriva buruienilor efectuate la SCDA Livada. Analele Universităţii din Oradea, Fascicula Protecţia Mediului
18. Mondici S., Fritea T., 2016, Soluții de combatere a buruienilor, testate la SCDA Livada, pentru principalele culturi agricole. Cercetare și performanță în agricultură SCDA Livada Nr.1
19. Şarpe N., Ciorlăuş At., Ghinea L., Vlăduţu I., 1975 Erbicidele – principiile şi practica combaterii buruienilor Editura. Ceres pag.52-64
20. Şarpe N.,Strejan Gh.,1981, Combaterea chimică a buruienilor din culturile de câmp. Editura Ceres Bucureşti
21. Vlăduţu I., 1967, Buruienile specifice solurilor podzolice şi combaterea lor prin erbicide. Agrotehnica solurilor acide din nord-vestul României.I.P.Maramureş Baia Mare pag.135-160.
22. Vlăduţu I., Fritea T., Şarpe N.,1982, Rotaţia aplicării erbicidelor în cadrul unui asolament specific podzolului argilo-iluvial din nord-vestul ţării. Probleme de agrofitotehnie teoretică şi aplicicată IV, 3 pag.329-339.
23. Vlăduţu I., Fritea T., Kurtinecz P., 1988, Contribuţii privind combaterea integrată a buruienilor pe argiloiluvisolurile din nord-vestul Transilvaniei. Probleme de agrofitotehnie teoretică şi aplicată X, 2 pag.139-177

109
Annals of the University of Oradea, Fascicle: Environmental Protection Vol. XXXV, 2020 Analele Universităţii din Oradea, Fascicula: Protecţia Mediului Vol. XXXV, 2020
EVALUATION AND MICROBIOLOGICAL CHARACTERIZATION OF THE PEAT AND SOME SOILS CONTAMINATED WITH
PETROLEUM PRODUCTS FROM SALONTA MUNICIPALITY, BIHOR COUNTY
Nistor Andrei *, Brejea Radu**, Boroș Mădălina***
*SC Ecopro Consult SRL, - 31A Padis Street, Oradea, Romania
e-mail: [email protected] **University of Oradea, Faculty of Environmental Protection, 26 Gen. Magheru St., 410048
e-mail: [email protected] ***Environment Protection Agency, 26 Dacia Street
e-mail: [email protected]
Abstract This paper is based on results obtained from research conducted on soil samples
contaminated with petroleum products from Salonta, Bihor County. Soil contamination occurred as a result of accidental oil spills from a liquid fuel depot of a former disused thermal power plant in the vicinity of the locality. Key words: pollution, microflora; contaminated soil, oil product,
INTRODUCTION
Microbial degradation of petroleum products in natural ecosystems is
a particular case of the activity of microorganisms, called by Ahearn (1973) hydrocarbons. It is a complex process, the evolution of which depends on the nature and relative proportion of the various constituents of oil, the nature of the communities of microorganisms characteristic of natural environments and a number of environmental factors that influence their activity.
Hydrocarbon microorganisms are active in most soils. The effects of soil pollution with petroleum products are variable depending on its quantity and composition, the nature of the soil, the type of vegetation, etc.
The present paper proposes the use of peat as a substrate for the absorption of petroleum products that contaminate different soils.
In the present paper, we aimed to characterize from a chemical and microbiological point of view, peat samples taken from Salonta, Bihor county, as well as a microbiological characterization of a soil sample strongly contaminated with petroleum products.
In order to better capture the microbial activity, we numerically determined the main ecophysiological groups of microorganisms involved

110
in the carbon and nitrogen circuit, microorganisms that have at the same time biodegradative properties of carbon and nitrogen compounds present in soil or peat. MATHERIAL AND METHOD
To solve the proposed issues, an experimental model was developed,
consisting of a series of concordant methods, microbiological analysis and assessment of soil biological activity.
All the results obtained were expressed numerically and presented in the form of tables and graphs.
Quantitative screening of microorganisms present in peat
(highlighting the main ecophysiological groups of microorganisms involved in the circuit of biogenic elements, biochemical activity of microorganisms present in indigenous peat).
Performing the analysis of the peat sample taken from Poiana Stampei, the total number of germs of each physiological group of microorganisms that make up the circuit of carbon and nitrogen elements was determined.
The results obtained are presented in table 1. In this experiment, the total microflora present in the peat sample
was determined, finding that the number of microorganisms present is of the order of 107, which indicates the presence of an active microflora at pH 5.5, particularly active, at least under conditions of laboratory. The distribution of these microorganisms by ecophysiological groups is given by the determination of cellulosic, ammonifying, pre-proteolytic microorganisms, nitrogen fixers, as well as nitric bacteria, all of which contribute to the degradation of organic compounds containing carbon and nitrogen.
Table 1. Determination of the main ecophysiological groups of microorganisms present in
indigenous peat
No. Microbiological indicator Total No. microorganisms / g
peat 1 Total microflora 890 x 107 2 Cellulosolytic 326 x 105
3 Amonificatori 158 x 1018
4 Denitrification 143 x 102 5 Proteolytic 924 x 1012 6 Nitrate 425 x 105
7 Nitrous 376 x 106 8 Aerobic nitrogen fixators 184 x 102 9 Anaerobic nitrogen fixators 215 x 102

111
Fig. 1. Logarithm in base 2 of the number of microorganisms determined in the peat sample.
The graphical representation of the log in base 2 of the number of
microorganisms highlights the presence in large quantities of ammonifying microorganisms and proteolytic microorganisms that have a role in the decomposition of organic substances into simpler substances or carbon dioxide and ammonia. Subsequent research will demonstrate the usefulness of the presence of these microorganisms in peat samples in the process of degradation of petroleum products.
Quantitative screening of microorganisms present in soil
contaminated with petroleum products Soil samples heavily contaminated with petroleum products were
taken near gas station depots. The soil has been in contact with the pollutant for several years, which led us to assume that a microflora has developed over time that has adapted to the substrate. As in the case of peat, we proceeded to determine the main ecophysiological groups of
0
10
20
30
40
50
60
70
Ce
lulo
zolit
ici
Am
onifi
cato
ri
Den
itrifi
cato
ri
Pro
teol
itici
Nitr
ici
Nitr
osi
Fix
ator
i ae
robi
Fix
ator
i ana
ero
bi
log. in baza 2

112
microorganisms potentially present in heavily contaminated soil. By sowing some soil dilution suspensions on selective media that allow the development of only some groups of microorganisms and incubate them at 280C optimal time necessary to highlight the biochemical activity of these microorganisms, the data presented in table 2 were obtained.
Table 2
Determination of the main ecophysiological groups of microorganisms present in the soil strongly contaminated with petroleum products
No. Microbiological indicator
Nr. total microorganisms / g peat
1 Total microflora 970 x 108 2 Cellulosolytic 266 x 105
3 Amonificatori 429 x 1018
4 Denitrification 182 x 101 5 Proteolytic 965 x 1012 6 Nitrate 225 x 105
7 Nitrous 274 x 106 8 Aerobic nitrogen fixators 284 x 101
9 Anaerobic nitrogen fixators
183 x 101
Fig. 2. Logarithm in base 2 of the number of microorganisms determined in the soil sample heavily contaminated with petroleum products
The graphical representation of the logarithm in base 2 of the number
of microorganisms, highlights the presence of all groups of microorganisms studied in the contaminated soil sample, and through future experiments we will be able to exploit this existing microbiological potential.
0
10
20
30
40
50
60
70
Denitrificatori Nitrosi
log in baza 2

113
CONCLUSIONS
Analyzing the data obtained from the quantitative screening of
microorganisms present in peat, we observe the predominance of cellulosic and ammonifying microorganisms, which demonstrates the ability of microorganisms present in peat to degrade organic substances containing carbon and nitrogen.
Also, the presence of nitrogen fixatives and proteolytics demonstrates that the circuit of carbon and nitrogen elements that takes place in the peat is complete, so that this substrate can be used for various microbiological purposes. The best represented are the cellulosolytic, proteolytic and ammonifying groups, with positive implications for future studies.
Analyzing the data obtained from the quantitative screening of microorganisms present in the soil contaminated with petroleum products, we find the presence of a very rich total microflora, of the order of 108, which shows that in this soil subject to contamination with petroleum products, over time a adapted microflora, able to use these products in the metabolism process. Regarding the numerical distribution of microorganisms, the presence in large quantities of ammonifying and proteolytic microorganisms, as well as cellulosolytic ones is found. Nitrates and nitrous with a role in the formation of nitrites and nitrates are also richly represented, thus providing the necessary nitrogen source for the other groups of microorganisms present in the soil.
REFERENCES
1. Brejea R., 2010, Stiinta solului – îndrumător de lucrări practice. Editura
Universitătii din Oradea. 2. Brejea R., Domuta C., 2011, Practicum de pedologie. Editura Universitătii din
Oradea. 3. Brejea R., 2011, Practicum de tehnologii de protectie a solurilor. Editura
Universitătii din Oradea. 4. Brejea R., 2014, Tehnologii de Protectie a Solurilor. Editura Universitătii din
Oradea. 5. Domuta C., Brejea R., 2010, Monitoringul mediului, Ed. Universitătii din Oradea, 6. Domuta C. (coord.) si colab., 2012, 50 de ani de cercetări agricole în Oradea,
Ed. UniveristăŃii din Oradea 7. Doncean Gh., Barbalat, Al., 1992, Strategia cercetării. Optimizarea proceselor
tehnologice, Ed. Performantica 8. Jonathan B. Snape, Irving J. Dunn, John Ingham, Jiri E. Prenosil, 1995 Dynamics
of Environmental Bioprocesses. Modelling and Simulation, New York, 9. Martin A., 1994 Biodegradation and bioremediation.San Diego :Academic Press, 10. Meyers, W. 1994 – Oill spill response guide, NOYDES data Co. newark, NJ 11. Păcurar I., Buta M. 2010, Pedologie si bonitarea terenurilor agricole, Ed. Risoprint
Cluj Napoca

114
12. Roulia M., Chassapis K., Fotinopoulos Ch., Savvidis, Th., Katakis D., 2003, Dispersion and Sorption of Oil Spills by Emulsifier-Modified Expanded Perlite, Spill Sci.Tech. Bul., 8
13. Rusu T., si colab. 2009, Metode de cercetare ale solului si plantei, Ed. Risoprint Cluj Napoca,
14. Taloi D.,1987, Optimizarea proceselor tehnologice, (Aplicatii în metalurgie), Ed. EA, Bucuresti

115
Annals of the University of Oradea, Fascicle: Environmental Protection Vol. XXXV, 2020 Analele Universităţii din Oradea, Fascicula: Protecţia Mediului Vol. XXXV, 2020
MEDICAGO SATIVA L. CULTURE PROPOSALS UNDER THE INFLUENCE OF ECOLOGICAL CONDITIONS IN BIHOR COUNTY
Tăut Florian Dumitru*, Brejea Radu*, Roșca Sanda**, Martin Anca Mădălina*
*University of Oradea, Faculty of Environmental Protection, 26, Gen. Magheru Street, 41008 Oradea,
Romania, e-mail: [email protected]; [email protected] **Faculty of Geography, Babes, Bolyai University, Clinicilor
Street 4-7, 400006 Cluj Napoca, Romania e-mail: [email protected]
Abstract The negative consequences of the manifestation of extreme climatic events (such as storms, short-term
heavy rainfall with floods and water stagnating on the farmlands), the extension of pedologic droughts periods and the effects on farmland productivity entails the execution of interdisciplinary studies capable to embody the whole complex of changes registered at the soil-plant-atmosphere level. Thus, we aim to propose crops with medium requirements from ecological conditions, in close relation with the global climatic changes, as well as adaptable and resistant to the fluctuations of the climatic parameters, but most importantly, in line with the needs and demands of the local community. We consider lucerne to be such a species, very adaptable to prolonged drought periods, like those experiences in the recent years, as well as to short periods of water overflow. The main objective of the present study is represented by the preliminary analysis of the average temperatures and rainfall values and relief characteristics (altitude, inclination), aspects which can paint an initial overall picture on the favourability of the lucerne crops. Key words: Medicago sativa L., favourability, climate change, Bihor county
INTRODUCTION
Global climate modifications affect the whole planet by disrupting an increasing number of activities, as well as decreasing the quality of human life. One of the most impacted sectors is the agriculture, which registers diminishing agricultural production, extinction of certain species and incontrollable prevalence of invasive species. As a consequence, implementing a sustainable management adapted to these recent challenges is more than necessary.
It is expected that, at a European level, the negative effects of climate change will accentuate the water deficit in the warm areas, will intensify the economical differences between states, increase the degree of abandonment of farming land (due to diminishing of production and of the periods with agricultural activities, as well as due to an increase in regional marginalization).
Therefore, the necessity of modernizing the irrigation systems becomes a crucial objective to be accomplished on a short and medium term. This should intervene and reduce to a minimum the water loss from crops, loss which appeared as a consequence of diminishing rainfall quantities on a yearly and seasonal level.
The scenario of warmer and dryer summers, with reduced water supplies in the soil, determines the necessity of an effective planning of the crop technologies, of the funds allocated, as well as the careful selection of the species with requirements adapted to the new environmental factors. (Hamidov et al., 2018)
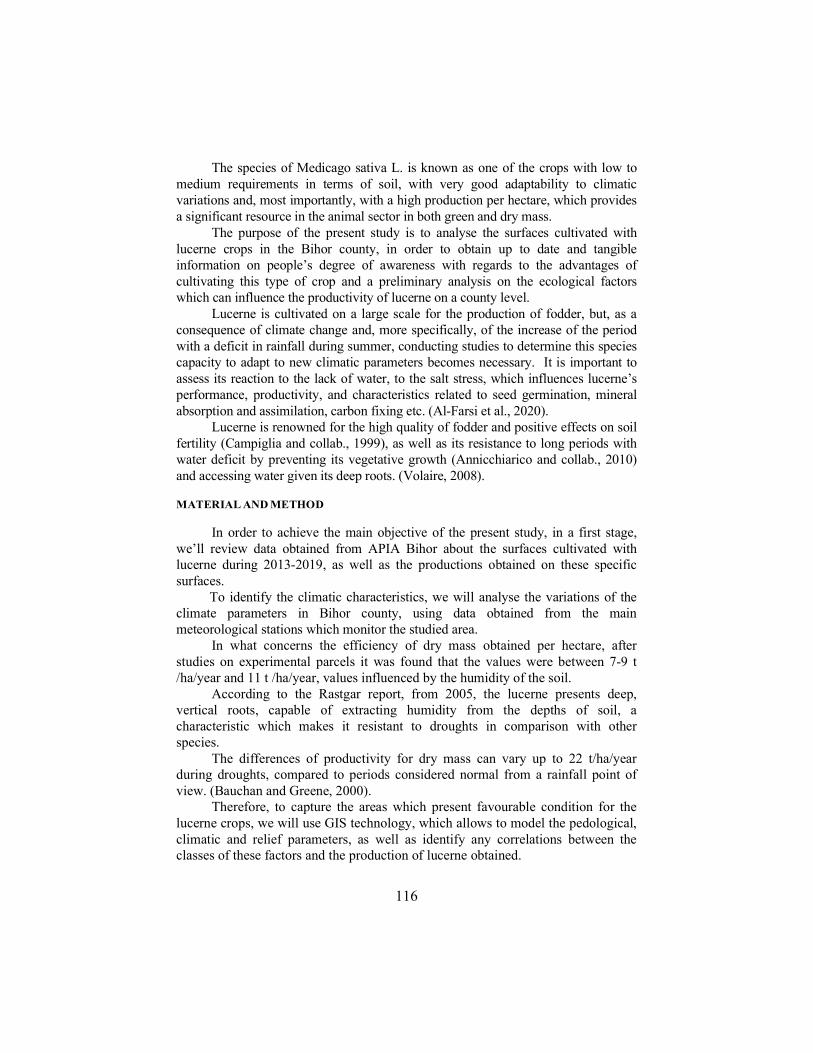
116
The species of Medicago sativa L. is known as one of the crops with low to medium requirements in terms of soil, with very good adaptability to climatic variations and, most importantly, with a high production per hectare, which provides a significant resource in the animal sector in both green and dry mass.
The purpose of the present study is to analyse the surfaces cultivated with lucerne crops in the Bihor county, in order to obtain up to date and tangible information on people’s degree of awareness with regards to the advantages of cultivating this type of crop and a preliminary analysis on the ecological factors which can influence the productivity of lucerne on a county level.
Lucerne is cultivated on a large scale for the production of fodder, but, as a consequence of climate change and, more specifically, of the increase of the period with a deficit in rainfall during summer, conducting studies to determine this species capacity to adapt to new climatic parameters becomes necessary. It is important to assess its reaction to the lack of water, to the salt stress, which influences lucerne’s performance, productivity, and characteristics related to seed germination, mineral absorption and assimilation, carbon fixing etc. (Al-Farsi et al., 2020).
Lucerne is renowned for the high quality of fodder and positive effects on soil fertility (Campiglia and collab., 1999), as well as its resistance to long periods with water deficit by preventing its vegetative growth (Annicchiarico and collab., 2010) and accessing water given its deep roots. (Volaire, 2008). MATERIAL AND METHOD
In order to achieve the main objective of the present study, in a first stage,
we’ll review data obtained from APIA Bihor about the surfaces cultivated with lucerne during 2013-2019, as well as the productions obtained on these specific surfaces.
To identify the climatic characteristics, we will analyse the variations of the climate parameters in Bihor county, using data obtained from the main meteorological stations which monitor the studied area.
In what concerns the efficiency of dry mass obtained per hectare, after studies on experimental parcels it was found that the values were between 7-9 t /ha/year and 11 t /ha/year, values influenced by the humidity of the soil.
According to the Rastgar report, from 2005, the lucerne presents deep, vertical roots, capable of extracting humidity from the depths of soil, a characteristic which makes it resistant to droughts in comparison with other species.
The differences of productivity for dry mass can vary up to 22 t/ha/year during droughts, compared to periods considered normal from a rainfall point of view. (Bauchan and Greene, 2000).
Therefore, to capture the areas which present favourable condition for the lucerne crops, we will use GIS technology, which allows to model the pedological, climatic and relief parameters, as well as identify any correlations between the classes of these factors and the production of lucerne obtained.

117
RESULTS AND DISCUSSION
According to this data, we can remark extended surfaces of farmland,
specific to a county with large areas of plain (these are extended on 41,51% of the territory on Bihor county). Also, territories occupied with permanent pastures currently account for 845 km2.
Due to expansive areas of the mountainous sector and favourable pedological and climatic conditions, the forest vegetation occupies 2379 km2 which represents 31,55 % of the analysed territory.
Reviewing the areas cultivated with lucerne crops in Bihor county, according to the data monitored by Romania’s Agency for Payment for the Environment, reduced variations were observed in the period between 2013-2019, when the production per hectare was over 24 tonnes/hectare (Table 1).
Table 1
Statistical data on alfalfa production in Bihor County
Year 2013 2014 2015 2016 2017 2018 2019
Alfalfa production Tons / year
181.133 241.657 321.335 216.019 246.762 1.109.920 1.107.124
Cultivated area (Ha)
7.127 8.849 8.594 8.796 10.186 27.748 27.543
Average production per hectare
24.415 27.309 26.918 24.559 24.226 40.000 40.200
Alfalfa is characterized by a great ecological plasticity for Romania’s
territory, thus, local agriculturists establish pure crops, as well as mixed crops with other herbage species for fodder. The current associations are made with cocksfoot grass (Adrian variety), hybrid ryegrass (Cătălin variety) or Italian ryegrass and Alexandria clover (Viorel variety). (www.samanta.ro)
Following the studies conducted by the Fudulea Institute of Research for Agricultural Development, the only national centre of plant amelioration in Romania, it was determined that, at the time being, the agriculturists can use 12 varieties of lucerne which are in line with the requirements in terms of quantity and quality, in pure or mixed crops. In addition to these, they can choose between Ileana variety, with a quantity of green mass fodder of 100 t/hectare and 20 t/hectare of dry mass fodder, Pampilia variety, with a quantity of green mass fodder of 95 t/hectare and 19,1 t/hectare of dry mass fodder and Liliana variety, with a quantity of green mass fodder of 95 t/hectare and 19,1 t/hectare of dry mass fodder. (www.incda-fudulea.ro)
The climatic data used in the present study are available for free on the platform: http://rp5.ru/weater_archive. In order to have an up to date view and capture the modifications on the lucerne production, we used values of the climatic

118
parameters from the last few years. Analysing the average temperature values in the period 2005-2019 captured
by the meteorological station in Oradea, it was observed an average value of 12,15ᵒ Celsius, specific for a temperate climate with western, oceanic influences.
Fig. 1. Multiannual average temperature map from Bihor county
Fig. 2. Map of the average multiannual precipitations at the level of Bihor county
Seasonal variations are recorded in what concerns the average air
temperature, January being a month characterized by values below 0.5 ᵒC, which marks the presence of winters with temperatures that seldom reach the freezing point. In the next months, towards end of winter and spring, the average air temperature raises slightly, with values of +2,4 ºC in February, 7,1 ºC in March, 12,9 ºC in April, 16,9 ºC in May. The lucerne crops are usually established early in spring, (1st-15th of March in the plain areas, 5th-25th of March in the hill areas), but they can be sowed also in the autumn (25th of August-5th of September) on dry soil, to avoid the uneven emergence of lucerne.
The loss of lucerne seedlings can raise up to 50% in the situation when, after sowing, the temperature drops down to -7 ºC.
Analysing the variation of the monthly rainfall from the data provided by the meteorological station in Oradea, it was determined that the lowest value of rainfall is registered during wintertime (December, January and February), but also in April and October, while the highest values are specific to end of spring (May) and summertime (June and July).
Thus, April and September, months with low quantities of rainfall, are problematic to lucerne crops at the beginning of the vegetation period, influencing the degree of emergence in case of spring sowing, as well as the last harvest.

119
Table 2
Monthly variation of average annual temperature and rainfall in period Average annual temperature
Month
I II III IV V VI VII VIII IX X XI XII
-0,5 2,4 7,1 12,9 16,9 21,3 22,3 23,5 17,9 12,3 7,8 2,0
Rainfall average annual
344 323 388 340 748 884 776 407 331 416 427 405
From the analysis of climate data from the meteorological stations across
Bihor county, it was observed that summers are becoming increasingly hot and benefit from high quantities of rainfall in 24 hours (which often exceed 50 mm), winters are becoming gentler, with less and less snowy days.
For example, in the Bulletin of the Romanian Meteorological Society, year IV, 2017, it is highlighted an increase in the yearly average temperature with over 2 degrees Celsius in the southern side of Bihor county, compared to the multiannual average value in the period 1980-2010 and 1 degree Celsius over the northern part.
A reduction in the quantity of rainfall was also observed, compared to the multiannual average of the period 1981-2010, with values over 75 mm in the outskirts of the city of Oradea, with approximately 50 mm in the plain area of Bihor county. The quantity of rainfall in the hill sector also decreased, with approximately 25 mm.
Analysing the variation on climatic elements at national level, a trend of reduction of the yearly average rainfall value was observed, compared to the values of the last 100 years, and an increase of the daily rainfall, with values between 5-20 mm, in detriment of rainfall values higher than 20 mm.
It is recognized that daily rainfall with a quantity between 0,1-4,9 is mostly lost as a consequence of evapotranspiration, therefore, the water deficit identified on a territorial level remains of major importance.
In addition to these, there are territories affected by soil erosion, which represent one of the factors to contribute to a drop in the agricultural production on significant territories in the studied area (Domuța and Brejea, 2010). Solutions are being sought to improve the irrigation systems on the territories which do not cover the necessary amount of water, as well as to recommend crops of species with a higher degree of resistance and adaptability to drought, in order to reduce the dysfunctionalities which appear on a regional level in these fragile territories.
From an altitudinal point of view, Bihor county is characterized by altitudes varying between 82 m in the plain area and 1829 in the mountain area. (Table 3).

120
Table 3
Distribution of altitudinal and slope classes in Bihor county
Altitude class (m)
Characteristic forms of relief Areas
(Km2) % 82-200 Terraces, meadows, plains 3766.7 49.8
201-500 Low and medium hills 2264.9 30.0 501-750 High hills 877.8 11.6
751-1000 Very high hills 286.0 3.8 1001-1250 Low altitude mountains 177.8 2.4 1250-1829 Medium altitude mountains 187.6 2.5
Slope groups (%)
Name of slope groups (Km2) %
≤2 Horizontal 1787 23.7 2,1-5 Very low declivity 1818 24.1
5,1-10 Low declivity 990 13.1 10,1-25 Medium declivity 1840 24.4 25,1-50 High declivity 942 12.5
50,1-100 Very high declivity 169 2.2 >100 Abrupt 1 0.001
Analysing the distribution of relief in Bihor county on altitude classes, we
captured a series of observations in relation to the stratification of the vegetation, the variation of rainfall and soil types. The lower altitude class is the most significant in terms of expansion, with terrace and river meadows near the main rivers which cross the county (Crișul Negru, Crișul Repede, Barcău and their tributary rivers).
Fig. 3. Map of the land geodeclivity of the county
Fig. 4. Geographical position of the study area and major relief units
This sector encompasses low areas from an altitude point of view, which
offer favourable conditions to crop cultivation, even intensive ones. The soil in these areas are often favourable, and the high density of the draining also

121
constitutes a contributory factor for agriculture. In addition to this extended sector, the area of low and medium hills, with altitudes between 201-500m, are also very prosperous to farmland for 30% of the analysed area. (Table 3)
These two altitudinal spacings, which are characteristic to the low plain and low and medium hills area, are surfaces favourable for the pure lucerne crops and would allow good harvests for this type of activity.
The sector of high and very high hills, with altitudes between 501-750 m and 750,1-1000 m, are characteristic to 15,4% of the territory of Bihor county. These two sectors contain areas with features less favourable to lucerne crops, limited to sectors affected by soil erosion and restrictions induced by stagno-gleying features of the soil and the extension of soils with a limitative texture in what concerns the agrotechnical activities.
However, the before mentioned sector, as well as the sectors of low and medium altitude mountains (1001-1250 m and over 1250 m) are favourable for mixed crops (lucerne and other varieties of herbage) and obtaining higher quantities of green mass on the pastures in the mountainous area, if sowed with lucerne.
Another important indicator from the family of relief features is the geodeclivity. In case of low values of geodeclivity, the areas will show a high level of favourability for the crops, mainly for the ones which require technical activities of preparing the soils or maintaining it (Moţoc and Mircea, 2002, Moțoc and Mircea, 2005, Dârja and collab., 2002), while high values in terms of inclination will lead to restrictive access for the agricultural machineries, modifications in the hydric regime of the soils and, lastly, favouring the erosion of the soils, mainly in the first year of lucerne crops.
In what concerns the distribution of the relief in Bihor county on inclination classes, the most prevalent one is the group of very low slopes, under 2%, characteristic to plain areas, territories with a high degree of mechanization of the sowing and harvesting activities, like the cases of lucerne crops. These occupy 23,7% of the analysed territory, being exceeded as surface by the class of slopes 2,1-5 %, which represents the slopes with the lowest degree of inclination, also favourable for crops.
CONCLUSIONS
According to the forecasts conducted at a European level, it is expected that, in Romania, in the upcoming period, the trend will be one of intensifying the alternation between periods of high temperatures, especially in summertime, through diminishing quantities of rainfall on the territories which are already characterized by water deficit, and periods with large quantities of rainfall, in a very short time.
The adjustment measures to climate change are reflected also in the action plans to adapt to the best technological measures applicable, in the proposals to rotate the crops in order to balance the rainfall deficit, in the proposals to review the sowing periods when establishing the crops, taking into consideration the new
122
environmental conditions, dependent on the current climatic variability. Following the in-depth analysis of the environmental factors which can have
an influence on lucerne crops, together with GIS technology, which offers the possibility of qualitative and quantitative framing of all parcels currently used as pastures or grasslands, we conclude that landowners can benefit from such an in-detail analysis of the restrictive factors for the productivity of pure or mixed lucerne crops in their respective areas. Thus, it is important to understand if the restrictive factors are related to pedological features, when measures dedicated to diminishing their negative effect can be taken, or if it is the case of climate factors, when the possibility to intervene is limited. Following such an analysis, the specialists can propose different agricultural activities to ameliorate the state of the soil, or propose new ways of usage of the terrains so every determinant ecological factor can be properly highlighted, and visible through the economical valence of the territory. REFERENCES 1. Domuţa C., 2009, Irigarea culturilor. Ed. Universităţii din Oradea, pp.78-150 2. Al-Fasi S.M., Nawaz A., Rehman A., Nadaf A.K., Al-Sadi A.M., Siddique K.H.M., Farooq M.,
2020, Effects, tolerance mechanisms and management of salt stress in lucerne (Medicago sativa), Crop and Pasture Sciences, DOI: 10.1071/CP20033.
3. Annicchiarico P, L Pecetti, A Abdelguerfi, Bouizgaren A, Carroni AM, Hayek T, M’Hammadi BM, Mezni M, 2010, Adaptation of landrace and variety germplasma and selection strategies for lucerne in the Mediterranean basin. Field Crops Res 120: 283-291.
4. Bauchan G and S Greene, 2000, Report on the status of Medicago germ plasma in the United States, Agricultural Service, USDA. 51pp.
5. Campiglia E, F Caporali, R Barberi and R Mancinelli, 1999, Influence of 2-, 3-, 4- and 5-year stands of Alfalfa on winter wheat yield. In: Olesen JE, Eltun R, Goodlimg MJ, Jensen ES, Kopke U (Eds.), Proc. Int. Workshop ‘Designing and Testing Crop Rotations for Organic Farming’. DARCOF, Tjele, DK, pp: 165-171.
6. Dîrja M, Budiu V, Tripon D, Păcurar I, Neag V., 2002, Eroziuna hidrică şi impactul asupra mediului, Edit Risoprint, Cluj-Napoca, p.100.
7. Domuța, C., Brejea, R., 2010, Eroziunea terenurilor în pantă din nord-vestul României, Editura Universității din Oradea.
8. Hamidov, A., Helming, K., Bellocchi, G., Bojar, W., Dalgaard, T., Ghaley, B. B., Kværnø, S. H. 2018, Impacts of climate change adaptation options on soil functions: A review of European case‐studies. Land Degradation & Development, 29(8), 2378.
9. Moţoc M, Mircea S, 2002, Evaluarea factorilor care determină riscul eroziunii hidrice în suprafaţă, Edit Bren, Bucureşti, p 60.
10. Moţoc M, Mircea S, 2005, Unele probleme privind formarea viiturilor şi eroziunea în bazine hidrografice mici, Edit. Cartea Universitară, Bucureşti, 104 p.
11. Volaire F, 2008, Plant traits and functional types to characterize drought survival of pluri-specific perennial herbaceous swards in Mediterranean areas. Eur J Agron, 29: 116-124.
12. www.incda-fudulea.ro 13. www.samanta.ro

123
Annals of the University of Oradea, Fascicle: Environmental Protection Vol. XXXV, 2020 Analele Universităţii din Oradea, Fascicula: Protecţia Mediului Vol. XXXV, 2020
THE INFLUENCE OF FERTILIZATION WITH CHEMICAL FERTILIZERS ON PHOSPHORUS AND POTASSIUM PRESENT IN
THE APPLE TREE LEAVES DURING 2017-2019 PERIOD
Bucurean Eva*
**University of Oradea, Faculty of Environmental Protection, 26 Gen. Magheru St., 410048, Oradea, Romania, e-mail: [email protected]
Abstract
Fertilization represents an important technological link, which is meant to provide on a permanent basis an optimum level of nutritive elements for the soils filled with roots. These have to be accessible for the roots and in adequate relations for the carying out of the physiological balance, in order to encourage a good growth of the trees and an abundant fruit bearing, year after year
Adding fertilizers on the plantations has many possitive effects, such as: the increase of the fruit production, the quickening of the ripening, the increase of the assimilation of the leafage, the prolongation of the trees’ lifetime, the growth in resistance of the trees against the frost, against the attacks of the cryptogenic diseases.
Key words: chemical fertilizer, the phosphorus and the potassium present in the leaves, type Golden delicious, type Starkrimson
INTRODUCTION
The effect of the chemical fertilizers on the growth and apple fruit-bearing have raised interest in many researchers. According to the age of the trees, to the depth of the trophic layer, the content of humus and clay in the soil, they proposed fertility systems of the orchards as near as possiblle to the needs of the trees (Amzăr, Branişte, 2000).
Sean from the efficiency angle and from the enorgetic productivity, the proddem of the establisment of an adequated efficient fertility system has a big importance that materializeas in the fruit obtained.
Considered to be the king of the fruits, the apple tree has in its composition considerable quantities of vital elements for the human body such as: carbon hydrate, lignin, cellulose, free acids, pectin, phosphorus, magnesium, A, B, C vitamins (Drăgănescu,2002).
Starkrimson is the most well spread species from the delicious red group because of its weakness and great capacity of fructification. It has big fruits in the shape of a truncated cone, colored in dark red, of a very good quality production needs an adequate division into the zones confronted with the vegetation factors (Cimpoieş et al., 2001).
Golden delicious is the most cultivated species of apple, has middle vigour, forms thick crowns, and has the tendency of overloading with fruits.

124
It is productive, but for a good quality of the fruit it has to be planted in regions with small atmospheric humidity, otherwise it rusts and it is very sensitive to the scurf and it dehydrates slowly over the period of preserving in normal conditions. The fruit has an average size, spherical, green-yellowish at harvesting, reaching a golden yellow at the consumption maturity, sweet taste and specific flavor (Cimpoieş et al., 2001). MATERIAL AND METHODS
The research took place in an apple tree orchard at Cheresig country over 2 apple ranges: Golden delicious and Starkrimson grafted on the middle vigor port grafted M4.
The trees are planted in an intensive system, the distance between the rows being of 4 m and the distance in the row is 5.5-6.0 mg P2O5, 6,0- 6,5mg K2O poorly supplied with humus. The yearly rainfalls amount to 625 mm and the yearly average temperature 10,1- 10,5 degrees C. The experiment includes a number of 6 variants, 5 fertilized variants and a witness variant.
The doses of chemical fertilizers for the fertility of the variants from the experiment have been the following: V1 N40P20K0; V2 N70P35 K0; V3 N140P70K0; V4 N200P100K50; V5 N270P135K70 applied in two stagies in spring and autumn.
The total nitrogen was determined through the Kjeldahl method procedure, the nitric nitrogen through the calorimetric method; the phosphorus and the potassium through the gravimetric method. RESULTS AND DISCUSSION
The supply of the soil with phosphorus in soluble forms was less
pointed out in the composition of the leaves, the differences being most of the time insignificant.
The phosphorus didn’t show big variations of the values from one season to another or between the fertile variants and the witness. The growths in phosphorus existed, but they didn’t follow any certain rule, in some cases these have diminishing values unjustified for a Golden delicious (table 1).

125
Table 1 The phosphorus present in the leaves for the Golden delicious type
Variant Applied chemical
fertilizer (kg/ ha)
Type Golden delicious 2017 2018 2019
23.04 28. 08 25.04 30.08 24.04 24.08 V0 - 0.13 0.16 0.15 0.17 0.16 0.17 V1 N40P20K0 0.19 0.16 0.18 0.19 0.19 0.19 V2 N70P35 K0 0.17 0.17 0.18 0.22 0.17 0.16 V3 N140P70K0 0.16 0.16 0.20 0.20 0.19 0.19 V4 N200P100K50 0.16 0.17 0.19 0.18 0.18 0.20 V5 N270P135K70 0.19 0.20 0.21 0.24 0.20 0.21
For the Starkrimson type, the condition is quite similar to the Golden delicious. (table 2).
Table 2 The phosphorus in leaves for the Starkrimson apple
Variant Applied chemical
fertilizer (kg/ha)
Type Starkrimson 2017 2018 2019
23.04 28.08 25.04 30.08 26.04 24.08 V0 - 0.14 0.15 0.16 0.17 0.17 0.17 V1 N40P20K0 0.23 0.21 0.27 0.25 0.29 0.28 V2 N70P35 K0 0.23 0.10 0.29 0.26 0.26 0.25 V3 N140P70K0 0.23 0.24 0.28 0.21 0.30 0.31 V4 N200P100K50 0.25 0.20 0.29 0.23 0.32 0.33 V5 N270P135K70 0.26 0.24 0.28 0.25 0.32 0.35
The potassium For the Golden delicious type the values of the content in potassium
have been registered a regression from spring to autumn, but comparing the fertilized variants and the unfertilized ones the differences were insignificant. High values have been registered for the fertilized variants with potassium (Table 3).
Table 3 Potassium in the leaves for the Golden delicious apple
Variant Applied chemical fertilizer (kg/ ha)
Type Golden delicious 2017 2018 2019
23.04 28.08 25.04 30.08 26.04 24.08 V0 - 1.20 0.78 1.22 0.81 1.23 1.01 V1 N40P20K0 1.26 0.77 1.25 0.83 1.28 1.05 V2 N70P35 K0 1.24 0.75 1.24 0.75 1.22 0.78 V3 N140P70K0 1.22 0.78 1.26 0.78 1.28 0.76 V4 N200P100K50 1.43 1.18 1.60 1.11 1.59 1.12 V5 N270P135K70 0.53 1.25 1.68 1.31 1.70 1.19
The values of the potassium content of the leaves grew from one year to another for all variants, except in the third year of experience. During this third year, the process has been used mostly for the fructification process, reaching low values for the V1, V2, V3 variants in comparison with the V4, V5 variants. In the case of the last variants, the dosage of the used chemical fertilizer has been much more in comparison with V1, V2, and V3.

126
Drawing the analysis of V4, V5 in comparison with V1, V2, V3, variants, it results that the values of the potassium content of the leaves are higher than in the case of the fertilized variants with larger doses of potassium.
Table 4. The potassium in the leaves of Starkrimson apple
Variant Applied chemical fertilized (kg/ha)
Type Starkrimson 2017 2018 2019
23.04 28.08 25.04 30.08 26.04 24.08 V0 - 1.46 0.79 1.11 0.82 1.25 1.01 V1 N40P20K0 1.57 0.77 1.15 0.79 1.37 1.10 V2 N70P35 K0 1.55 0.81 0.95 0.71 1.15 0.91 V3 N140P70K0 1.65 0.75 0.81 0.69 1.41 0.95 V4 N200P100K50 1.85 1.15 1.51 0.98 1.48 1.11 V5 N270P135K70 1.89 1.21 1.81 1.15 1.65 1.17
CONCLUSIONS
Based on the results obtained after the fertilization with diferent doses of chemical fertilizers, we can draw the following conclusions: the phosphorus was present in relatively close quantities to the fertilized variants. In all the situations, the concentrations have been higher in the fertilized variants in comparison with the witness variant.
The potassium was found in high quantities in the leaves of the trees from the variants fertilized with this element for both ranges.
REFERENCES
1. Amzăr V., N., Branişte, 2000, Cultura mărului, Editura Ceres Bucureşti. 2. Baciu A.A, 2005, Pomicultură generală,Editura Universitaria, Craiova. 3. Bunea A., 2002, Tehnologia înfiinţării şi întreţinerii livezilor, Editura Universităţii din Oradea 4. Botu I., M. Botu, 2003, Pomicultura modernă şi durabilă, Editura Conphys, Râmnicu Vâlcea. 5. Branişte N., Andrieş N., Ivaşcu A., 2003, Tehnologia obţinerii de soiuri de pomi cu rezistenţă genetică
la boli şi dăunători, Editura Medro, Bucureşti. 6. Branişte, N., 2002, Catalog de soiuri şi material săditor pomicol, Ed. Ceres, Bucureşti. 7. Cimpoieş Gh., V. Bucarciuc, I. Caimacan, 2001, Soiuri de măr, Editura Ştiinţa, Chişinău. 8. Cosmulescu S. N., 2003, Protecţia mediului în ecosistemele pomicole, Editura Sitech, Craiova. 9. Cosmulescu S., Baciu A., Gavrilescu E., 2004, Cultivar influence on some hydrosolubile enzymes
activity in apple, Buletinul USAMV Cluj Napoca, Editura Academic Press. 10. Cosmulescu S., A. A. Baciu, 2003, Pomologie, EdituraUniversitaria Craiova 11. Drăgănescu E.,2002, Pomologie,. Editura Mirton Timişoara. 12. Drăgănescu E., 2003, Pomicultură, Editura Agroprint, Timişoara. 13. Davidescu V., D., Davidescu, 1999, Compediu de agrochimie, Ed. Academiei Române, Bucureşti. 14. Davidescu. D. V. Davidescu,1992, Agrochimie horticolă, Editura Academiei Române Bucureşti 15. Ghena N., N. Branişte, 2003, Cultura specială a pomilor, Editura Matrix Rom, Bucureşti. 16. Grădinariu G. și colab., 1998, Pomicultură, Editura Moldova, Iași. 17. Hoza. D., 2003, Sfaturi practice pentru cultura pomilor Editura Nemira. 18. Isac I.și colab., 2001, Ghidul micului pomicultor, Tipografia Smeura, Pitești 19. Popescu M. și colab., 1993, Pomicultură generală și specială, Ed. Didactică și Pedagogică, București 20. Rați I., 2001, Mărul, pasiune și afacere, Editura Moldova, Bacău. 21. Stănică F.,1996, Cercetări experimentale privind fertilizarea în livezi Teză de doctotat U.S.A.
Bucureşti.

127
Annals of the University of Oradea, Fascicle: Environmental Protection Vol. XXXV, 2020 Analele Universităţii din Oradea, Fascicula: Protecţia Mediului Vol. XXXV, 2020
RESEARCH ON THE INFLUENCE OF CULTIVARS AND CROP SYSTEM ON EGGPLANT GROWTH AND PRODUCTION IN
SOLARIUM
Ienciu Andrada*, Cărbunar Mihai**, Cărbunar Mihaela Lavinia**, Vidican Oana Maria**
*SC RONAQUA SRL Oradea, Romania, ienciu [email protected] *University of Oradea, Faculty of Environmental Protection, 26 Gen. Magheru St., 410048
Oradea; Romania, e-mail:[email protected] Abstract
The Bengal area is considered an important center of origin, with secondary centers in China, where they have been known for over 1500 years. The nutritional value of eggplant is lower compared to other vegetables. The research focused on growth, the number of leaves per plant and the number of branches on eggplants grown in the solarium, in two different systems, conventional and ecological. These are some parameters needed to have a complex image of a cultivar, ultimately influencing productivity. The results obtained show us the differences between the conventional and ecological system.
Key words: eggplant, cultivar, solarium INRODUCTION
Vegetables are juicy foods with a high water content (75-95%), the rest being dry matter, represented by both plastic purpose and energetic substances (proids, carbohydrates, lipids) and biocatalytic substances, especially vitamins and minerals (Apahidean, 2016).
In a proportion of 5-10% it is recommended to cover with protein from vegetables and the reduced need for vitamins of 1-5 mg / day for the body is ensured from vegetables in a high proportion of 30% for complex B, 80-90 and 100% in case vitamins A, C, respectively P and E (Ciofu, 1994, Soare, 2008). Chen and Li (1996), mention that eggplants come from India where they have been known for a long time, there are many types with small fruits, sometimes known as Solanum melongena, var. insanum from Bengal, India. Because there is a diversity of varieties with different shapes and colors, widespread in Southeast Asia this area is considered an important center of origin. Vavilov (1928), quoted by Chen and Li (1996), mentions that the center of origin for eggplants is the Indo-Burmese region, but there are secondary centers in China, where eggplants have been known for more than 1,500 years.
The nutritional value of eggplants, due to their chemical composition, is lower compared to other vegetables, yet they have a special organoleptic value (Radu and Chilom, 1996, Drăghici, 2002).

128
Baked eggplants can be kept frozen for winter consumption (Duță, 2005). Eggplant fruits contain 92.7% water, 1.1% protein, 4.56% nitrogen-free extracts (Ceaușescu et al., 1980, Horgoș, 2000). They also contain 7-10% dry matter represented by carbohydrates 3.5%, proteins 1-1.6%, vitamins C, 5-10 mg, B1, B2, PP, P, mineral salts: K 200-220 mg, P 25-40 mg, Ca 15-20 mg, Mg 16 mg, per 100g fresh product and food salts, substances that partially retain and eliminate toxins and cholesterol from the digestive tract (Apahidean, 2000).
MATERIAL AND METHOD
The present research was carried out in 2017, in an ecological micro-farm and an adjacent vegetable garden, in a conventional system, in Husasău de Tinca, a locality located in the NW of the country. In two solariums, in ecological and conventional system, two experiments with 10 variants were placed, each variant having 10 plants, the witness was the average of the experience. The placement of the variants was done according to the method of subdivided blocks. The biological material was represented by 10 varieties, respectively: Zaraza, Violeta di Firenze, Black Beauty, Japanese Pickling, Dourga, Monstruese NY, Listada da Gandia. JiloTingua Verde, Carina, Orange de Turquie.
RESULTS AND DISCUSSION
The experiences were set up in early April. The first aspect analyzed was plant growth.
The height of eggplant plants grown in solarium in different systems (conventional and ecological) was influenced by the cultivar used but also by the cultivation method (table 2). The eggplant plants had the most successful size on the Orange variety of Turkey (30.01 cm and 34.77 cm) and the largest on the Zaraza variety (77.65 cm and 79.72 cm). Compared to the average experience (58.30 cm) the plant height was higher for the varieties Zaraza, Violeta di Firenze, Dourga and JiloTingua Verde. In general, eggplants grown in the solarium system, in an ecological system, had a smaller size compared to plants grown in the conventional system.
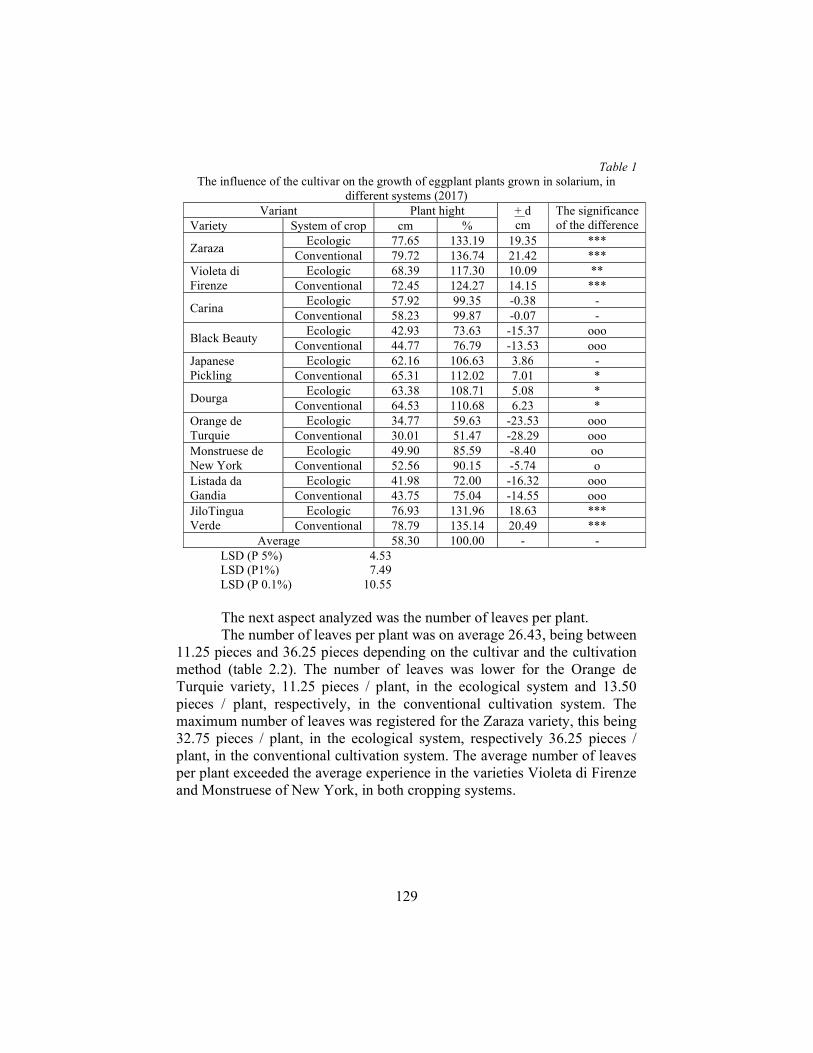
129
Table 1 The influence of the cultivar on the growth of eggplant plants grown in solarium, in
different systems (2017) Variant Plant hight + d
cm The significance of the difference Variety System of crop cm %
Zaraza Ecologic 77.65 133.19 19.35 ***
Conventional 79.72 136.74 21.42 *** Violeta di Firenze
Ecologic 68.39 117.30 10.09 ** Conventional 72.45 124.27 14.15 ***
Carina Ecologic 57.92 99.35 -0.38 -
Conventional 58.23 99.87 -0.07 -
Black Beauty Ecologic 42.93 73.63 -15.37 ooo
Conventional 44.77 76.79 -13.53 ooo Japanese Pickling
Ecologic 62.16 106.63 3.86 - Conventional 65.31 112.02 7.01 *
Dourga Ecologic 63.38 108.71 5.08 *
Conventional 64.53 110.68 6.23 * Orange de Turquie
Ecologic 34.77 59.63 -23.53 ooo Conventional 30.01 51.47 -28.29 ooo
Monstruese de New York
Ecologic 49.90 85.59 -8.40 oo Conventional 52.56 90.15 -5.74 o
Listada da Gandia
Ecologic 41.98 72.00 -16.32 ooo Conventional 43.75 75.04 -14.55 ooo
JiloTingua Verde
Ecologic 76.93 131.96 18.63 *** Conventional 78.79 135.14 20.49 ***
Average 58.30 100.00 - - LSD (P 5%) 4.53 LSD (P1%) 7.49 LSD (P 0.1%) 10.55 The next aspect analyzed was the number of leaves per plant. The number of leaves per plant was on average 26.43, being between
11.25 pieces and 36.25 pieces depending on the cultivar and the cultivation method (table 2.2). The number of leaves was lower for the Orange de Turquie variety, 11.25 pieces / plant, in the ecological system and 13.50 pieces / plant, respectively, in the conventional cultivation system. The maximum number of leaves was registered for the Zaraza variety, this being 32.75 pieces / plant, in the ecological system, respectively 36.25 pieces / plant, in the conventional cultivation system. The average number of leaves per plant exceeded the average experience in the varieties Violeta di Firenze and Monstruese of New York, in both cropping systems.

130
Table 2 The influence of the cultivar on the number of leaves/plant on eggplants grown in
solarium, in different systems (2017)
Variant Number of leaves/plant + d
pieces
The significance of the difference Variety System of crop pieces %
Zaraza Ecologic 32.75 123.91 6.32 ***
Conventional 36.25 137.16 9.82 *** Violeta di Firenze
Ecologic 29.00 109.72 2.57 * Conventional 31.75 120.13 5.32 ***
Carina Ecologic 27.25 103.10 0.82 -
Conventional 28.75 108.78 2.32 *
Black Beauty Ecologic 23.75 89.86 -2.68 oo
Conventional 25.50 96.48 -0.93 - Japanese Pickling
Ecologic 30.00 113.51 3.57 ** Conventional 22.75 86.08 -3.68 oo
Dourga Ecologic 31.25 118.24 4.82 **
Conventional 32.75 123.91 6.32 *** Orange de Turquie
Ecologic 11.25 42.57 -15.18 ooo Conventional 13.50 51.08 -12.93 ooo
Monstruese de New York
Ecologic 29.50 111.62 3.07 * Conventional 32.75 123.91 6.32 ***
Listada da Gandia
Ecologic 24.00 90.81 -2.43 o Conventional 27.00 102.16 0.57 -
JiloTingua Verde
Ecologic 18.00 68.10 -8.43 ooo Conventional 20.75 78.51 -5.68 ooo
Average 26,43 100,00 - - LSD (P 5%) 2.06
LSD (P1%) 3.11 LSD (P 0.1%) 4.86
The average number of sprouts per plant was 2.69, which varied between 1.50 (Orange de Turquie, in ecological system) and 4.75 (Monstruese de New York, in conventional system), (table 3). In the conventional system, the number of sprouts per plant was higher in most varieties (Zaraza, Carina, Black Beauty, Dourga, Monstruese de New York), the differences from the average experience being ensured statistically.

131
Table 3
The influence of the cultivar on the degree of branching of the eggplant plants grown in the solarium, in different systems (2017)
Variant Average number of
sprouts/plant
+ d pieces
The significance of the difference Variety System of crop pieces %
Zaraza Ecologic 2.75 102.23 0.06 -
Conventional 3.00 111.52 0.31 * Violeta di Firenze
Ecologic 2.00 74.349 -0.69 oo Conventional 2.25 83.64 -0.44 o
Carina Ecologic 2.75 102.23 0.06 -
Conventional 3.00 111.52 0.31 *
Black Beauty Ecologic 2.50 92.94 -0.19 -
Conventional 3.25 120.82 0.56 ** Japanese Pickling
Ecologic 2.00 74.35 -0.69 oo Conventional 2.25 83.64 -0.44 o
Dourga Ecologic 2.50 92.94 -0.19 -
Conventional 3.00 111.52 0.31 * Orange de Turquie
Ecologic 1.50 55.76 -1.19 ooo Conventional 1.75 65.06 -0.94 ooo
Monstruese de New York
Ecologic 2.25 83.64 -0.44 o Conventional 4.75 176.58 2.06 ***
Listada da Gandia
Ecologic 2.25 83.64 -0.44 o Conventional 2.25 83.64 -0.44 o
JiloTingua Verde
Ecologic 2.00 74.35 -0.69 oo Conventional 2.75 102.23 0.06 -
Average 2,69 100.00 - - LSD (P 5%) 0.27
LSD (P1%) 0.55 LSD (P 0.1%) 0.73
CONCLUSIONS
The researches carried out in the NW of the country on the cultivation of eggplants grown in solarium in the conventional and ecological system, highlighted some conclusions, namely:
1. Plant height, number of leaves per plant, number of branches, are influenced by the cultivar, both in the conventional and in the ecological system.
2. Eggplants grown in solarium, in ecological system, had a smaller size compared to plants grown in conventional system.
3. Compared to the average experience (58.30 cm) the plant height was higher for the varieties Zaraza, Violeta di Firenze, Dourga and JiloTingua Verde.
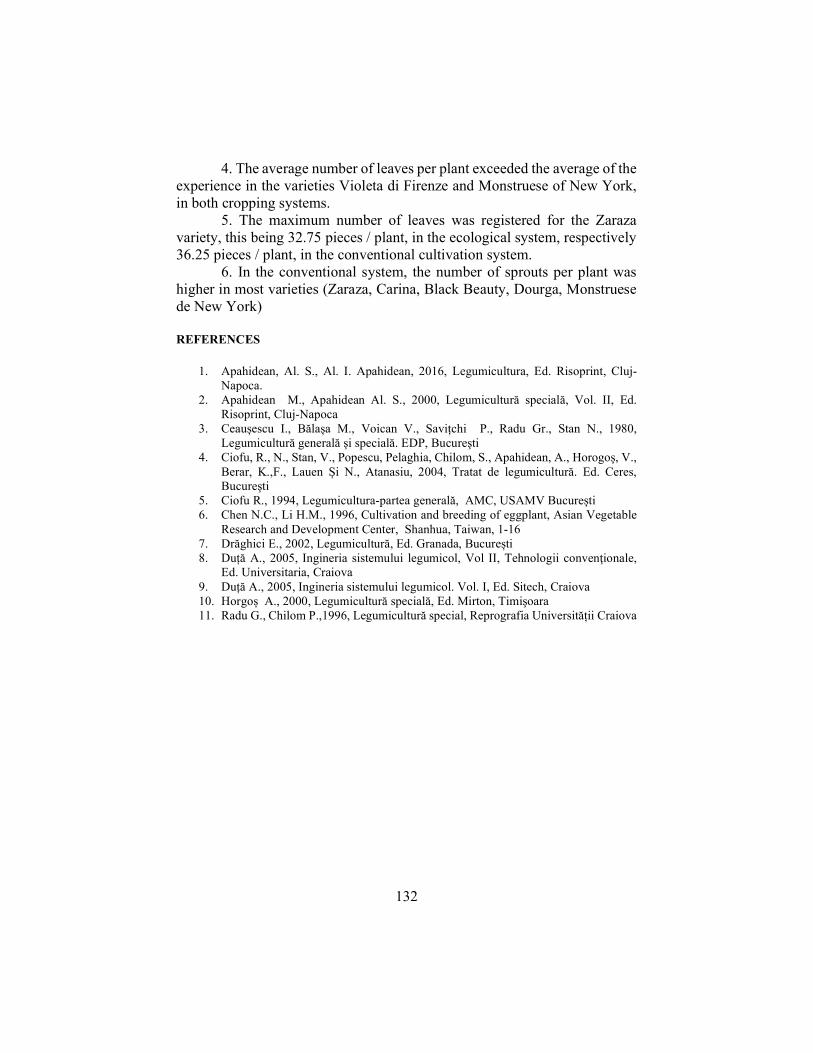
132
4. The average number of leaves per plant exceeded the average of the experience in the varieties Violeta di Firenze and Monstruese of New York, in both cropping systems.
5. The maximum number of leaves was registered for the Zaraza variety, this being 32.75 pieces / plant, in the ecological system, respectively 36.25 pieces / plant, in the conventional cultivation system.
6. In the conventional system, the number of sprouts per plant was higher in most varieties (Zaraza, Carina, Black Beauty, Dourga, Monstruese de New York)
REFERENCES
1. Apahidean, Al. S., Al. I. Apahidean, 2016, Legumicultura, Ed. Risoprint, Cluj-Napoca.
2. Apahidean M., Apahidean Al. S., 2000, Legumicultură specială, Vol. II, Ed. Risoprint, Cluj-Napoca
3. Ceaușescu I., Bălașa M., Voican V., Savițchi P., Radu Gr., Stan N., 1980, Legumicultură generală şi specială. EDP, Bucureşti
4. Ciofu, R., N., Stan, V., Popescu, Pelaghia, Chilom, S., Apahidean, A., Horogoş, V., Berar, K.,F., Lauen Și N., Atanasiu, 2004, Tratat de legumicultură. Ed. Ceres, Bucureşti
5. Ciofu R., 1994, Legumicultura-partea generală, AMC, USAMV București 6. Chen N.C., Li H.M., 1996, Cultivation and breeding of eggplant, Asian Vegetable
Research and Development Center, Shanhua, Taiwan, 1-16 7. Drăghici E., 2002, Legumicultură, Ed. Granada, București 8. Duță A., 2005, Ingineria sistemului legumicol, Vol II, Tehnologii convenţionale,
Ed. Universitaria, Craiova 9. Duță A., 2005, Ingineria sistemului legumicol. Vol. I, Ed. Sitech, Craiova 10. Horgoș A., 2000, Legumicultură specială, Ed. Mirton, Timişoara 11. Radu G., Chilom P.,1996, Legumicultură special, Reprografia Universității Craiova

133
Annals of the University of Oradea, Fascicle: Environmental Protection Vol. XXXV, 2020 Analele Universităţii din Oradea, Fascicula: Protecţia Mediului Vol. XXXV, 2020
RESEARCHES REGARDING THE APPLICATION OF FERTILIZERS FOR FRUIT TREES IN THE CONCEPT OF
ENVIRONMENTAL PROTECTION AND OBTAINING COMPETITIVE HARVESTS IN THE FRUIT AREA OF BIHOR
Venig Aurora*, Bunea Aurel*, Venig Adelina*
*University of Oradea, Faculty of Environmental Protection, 26 Gen. Magheru St., 410048,
Oradea, Romania, e-mail: [email protected] Abstract
During this research there were studied 7 variants, on a brown soil with silty texture, fertilized with various NPK doses, and control variant without fertilizers. The fruit tree fertilization with various doses of NPK influenced positively the contents of mobile P2O5 and K2O in the soil, with statistically ensured differences. The trunk growth in with was also positively influenced by the fertlizers’ doses, where as the main importance belonged to the nitrogen alone, and less to the nitrogen combined with phosphorous and potassium. There is also noticed a tight connection between the leaves’ content in NPK and the yield of fruit. The differences are statistically enured in the case of the nitrogen and potassium. The premature death is redoubled by the fertilzers doses, at an annual rhytm more and more reduced, as the trees grow older, and it fails completely.The various content of clay in the soil doesn’t bring any important alterations regarding the premature death of the trees. Keywords: fertilizer, crop, NPK content, soil. INTRODUCTION
Obtaining high quality crops using fertilizers was and remains a priority for researchers and specialists in pomiculture, in continuous modernization. (Buta, 2017). Thus, once the modern pomiculture appeared, researches has also been intensified on establishing the scientific criteria (Bunea, 1979) meant to indicate optimal fertilization formulas depending on the type of soil, species, (Cepoiu et al., 2005). In this context, we mention the contributions made by numerous authors (Hera, Borlan, 1980, Mihut, 2005, Stanciu, 2006, Cociu et al, 1999, Chira, et al, 2005), that have established positive correlations between different fertilizer doses, soil content, nutrients, foliar diagnosis and harvest.
If, in the beginning years, the use of fertilizers was aimed to obtain the highest yields, over time the emphasis was placed on quality. (Berar V. 2012). So that in the last years it will be pursued to obtain high quality fruit, with reduced chemical interventions that will not influence the composition of the finished product concurrently with an efficient protection of the environment. (Bunea, 1985) . Nitrogen (N) and potassium (K) are closely

134
related to orchard productivity, since they are usually found in higher concentrations than others macronutrients in apple (Malus × domestica Borkh) fruits. (Venig, 2013). Fertilizers are commonly applied to improve the yield and quality in orchards. (Victor, 2003). But unbalanced fertilization negatively affects the nutrient contents of the fruit. (Venig, 2006). Fruit with low energy and high mineral and vitamin contents are significant foods for human nutrition and human health. (Danciu, Venig, 2003). Starting from these desires in the present paper we set out to lean more on some research results with fertilizers for apple and apricot trees, representative species in the North-Western part of the country. MATERIAL AND METHOD
The experiences were located at apple trees, on sandy soil, modelled with an organic content below 1% and at apricot trees on a typical brown soil, in Oradea. The soil maintenance system was in the form of a field and the trees were driven and maintained with a free flattened crown. The observations and determinations consisted in measuring the growth of the trunk thickness and determining the production on each variant. On the ground, samples were collected on 0-20 cm and 20-40 cm depth, which were analyzed in terms of NPK content. RESULTS AND DISCUSSION
Regarding the modifications of some soil properties following the application of the fertilizer doses presented in the tables below, we observe that all the studied variants led to the increase of the NPK content in the soil which influenced the level of the three leaves macro-elements. It is worth noting the graph in fig. 1, in which there is a positive correlation between the doses of nitrogen and its presence in the leaves at the apple trees with a statistically assured regression coefficient.
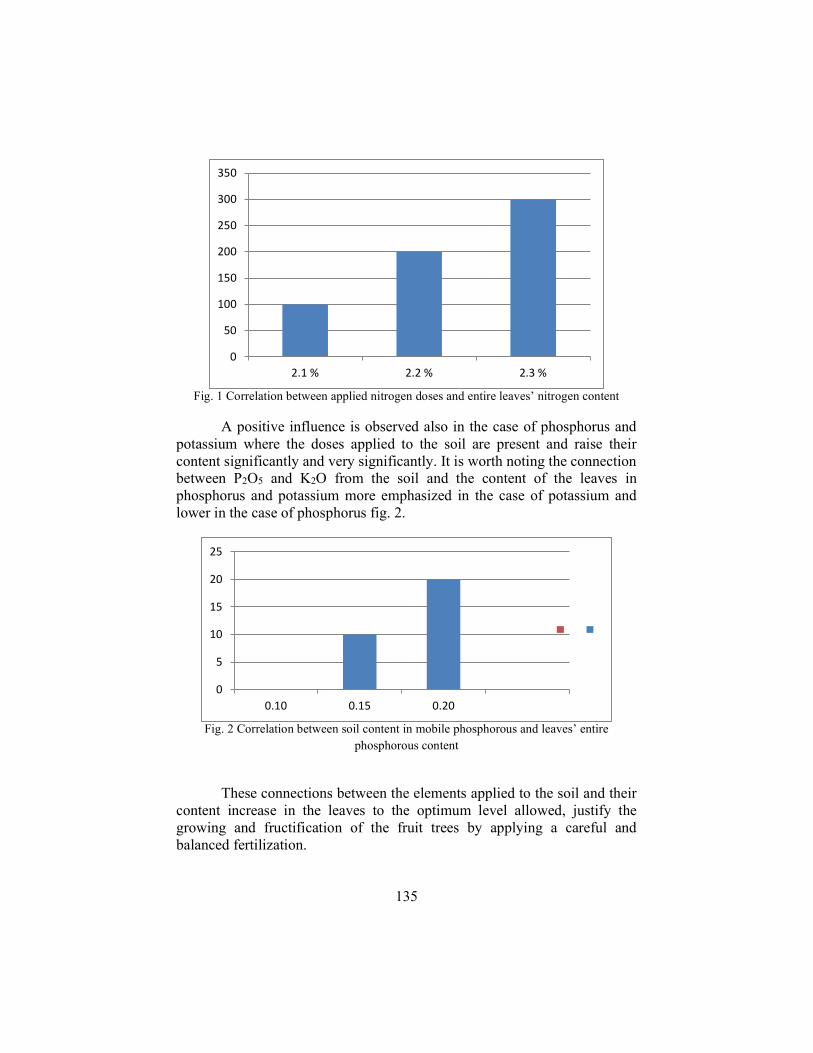
135
Fig. 1 Correlation between applied nitrogen doses and entire leaves’ nitrogen content
A positive influence is observed also in the case of phosphorus and potassium where the doses applied to the soil are present and raise their content significantly and very significantly. It is worth noting the connection between P2O5 and K2O from the soil and the content of the leaves in phosphorus and potassium more emphasized in the case of potassium and lower in the case of phosphorus fig. 2.
Fig. 2 Correlation between soil content in mobile phosphorous and leaves’ entire
phosphorous content
These connections between the elements applied to the soil and their
content increase in the leaves to the optimum level allowed, justify the growing and fructification of the fruit trees by applying a careful and balanced fertilization.
0
50
100
150
200
250
300
350
2.1 % 2.2 % 2.3 %
0
5
10
15
20
25
0.10 0.15 0.20

136
The results regarding the increase in the thickness of the trunk and of the fruit production also know an ascending tendency, all the fertilized variants bring increase of growth and production in comparison with the witness unfertilized with chemical fertilizers. Analyzing the production of apples according to the doses of fertilizers applied it is found that all the variants that received these inputs produced more fruits, on average realizing an annual increase between 1.1 t / ha in the case of fertilized trees with N 100 and 8.8 t / ha at those fertilized with higher doses N 200, P 100, K 200.
The increase of the production but does not go progressively, with the harvest because especially in the first 5 years but also after 10 years of fructification there is a stagnation followed by a decrease of the level of production in the variants with the highest doses of NPK. This aspect is observed especially from the curve representing the average of the first 5 years of fructification, where the ceiling is realized when applying to the trees a moderate dose of 300 kg / ha (V3 N 100 P 100 K 100) and then to decrease as the doses of NPK increase. Similarly, apricot is a species that is sensitive to pedoclimatic factors, but responds very well to the application of different doses of fertilizers.
In table nr. 1 where are shown the productions obtained on variants, we observe that they are modest but strongly influenced by the applied fertilizers.
Table 1 The influence of some NPK doses on apricot fruit production
Variant
Fruit years Average of 9 years 1-3 4-6 7-10
t/ha % t/ha % t/ha % t/ha Dif % V1=Mt 1.2 100 1.6 100 4.3 100 3.0 0.0 100
V2=N100 1.8 120 4.5 280 7.2 167 4.3 1.3 143 V3=N100P80 2.0 166 5.7+ 345 8.2+ 191 5.3 2.3 177
V4=N100P80K100 2.5+ 208 5.0+ 301 8.8+ 200 5.4 2.4 180 V5=N200P80K100 2.5+ 208 5.0+ 301 5.2 118 4.3 1.4 143 V6=N200P160K100 2.3 190 4.5 280 6.6 160 4.5 1.5 150 V7=N200P160K200 2.4+ 200 4.4 274 7.5 171 4.4 1.4 147
V8=N200 annual* P400K500
2.4+ 200 5.6 344 7.8 181 5.3 2.3 177
LSD 5% 1.20 3.45 3.76
In the case of apricot, the best results were obtained at fertilized trees
with moderate doses, if we consider that the highest production of 5.4 t / ha was obtained from trees fertilized with N100 P 80 K100 while at higher doses the crop level have been capped, even observing a decreasing trend. Analyzing the connections that result in the graphs and tables, it is

137
resembled the fact that the apple and apricot orchards represented in this research respond very well to the inputs represented by NPK fertilizers.
These researches force us to reflect carefully when making decisions regarding the application of the fertilization formula and to consider that the application of fertilizers is an important aspect in the technological chain, which must be applied balanced and complete.
Because if we look more closely at the apple in the unfertilized control we will see that here were also harvested from 11 t / ha to 31 t / ha depending on the years and the age of the trees, during the entire 10-year cycle obtaining research on average 19 t / ha. Reaching the level of over 20 t / ha in 5 years out of the 10 analyzed in trees without fertilization should not lead us to think about giving up fertilization of orchards as the important link in the technological chain that competes in reaching high performance parameters but at a more careful treatment of this problem. This, especially at present, when the fruits that are consumed in a fresh state are required to be obtained as close to nature and with few interventions as friendly to nature.
This good purpose must take into account the value and potential of the fruit of the species and variety for the purpose of the harvest and for maintaining the fertility potential of the soil indefinitely.
All the more so if we consider that with the harvest, between 2.3 and 3.5 kg of nitrogen, 1.0-1.5 kg of phosphorus and 3.0-5.5 kg of potassium are extracted from the soil per ton of fruit, which periodically we will need to return to the soil. CONCLUSIONS
From the researches with fertilizers carried out at apple and apricot including the first ten years of fructification , the following can be seen: The fertilizers applied to the soil are found in accessible form to trees, the doses used have increased its content in phosphorus and potassium to an optimum level or close to the sandy soil that has a lower capacity to retain nutrients;
The reaction of the trees to the application of the fertilizers was positive, the research data showing a close connection between the content of the soil and the leaves in the applied nutrients;
The growth of the trees was positively influenced by the doses of fertilizers applied - all fertilized variants registering increases of thickening of the trees compared to the control; fruit production followed the same trend as the other elements analyzed being in all the upper variants of the unfertilized control;

138
The highest fruit yields achieved by applying one kilogram of fertilizer to the active substance of 23 kg apples were obtained from fertilized trees with doses of N100P100K100, this parameter decreasing as the fertilizer doses increase;
Regarding the results as a whole and in conjunction with the current trends in fruit growing, we can say that a good fruit harvest can be obtained by using moderate doses of fertilizers (N100P80-100K100 kg / ha active substance) that take into account all known criteria including those related to environmental protection;
Nor the harvest made by the unfertilized apple of approximately 20 t / ha should not be observed especially if we consider that it was obtained on the poorest soils with very low clay; When establishing a fertilization plan approved by the requirements of the trees and carrying out competitive harvests, it will have to take into account the research results and the indicators resulting from the pedological and agrochemical mapping of the soil and last but not least, the best environmental protection for an indefinite period. REFERENCES
1. Berar V., 2012, Horticultură practică, Editura de Vest 2. Bunea A., 1979, Cercetări privind valorificarea nisipurilor și solurilor nisipoase din nord-
vestul țării prin plantații intensive de măr, Teză de doctorat 3. Bunea A., 1985, The effect of chemical fertilizers on growth fruiting and premature
decline of apricot under North-Western conditions of Romania, Acta Horticulturae, 192 4. Buta M., 2017, Pedologie. Material didactic, Editura Risoprint 5. Cepoiu N., C. Păun, V. Spiță, 2005, Pomicultură practică, Editura Ceres 6. Chira L., V. Chereji, M. Roman, 2005, Caisul și piersicul, Editura MAST 7. Chira A., L. Chira, F. Mateescu, 2005, Pomii fructiferi. Lucrări de înființare și întreținere
a plantațiilor, Editura M.A.S.T., 2005 8. Chira L., I. Pașca, 2008, Cultura mărului, Editura M.A.S.T. 9. Cociu V., coordonator, 1999, Caisul, Editura Ceres, cap. 10, Fertilizarea plantațiilor de
cais 10. Danciu V.M., A. Venig, 2003, Noțiuni și principii privind cultura pomilor și arbuștilor
fructiferi pe suprafețe medii și mici, Editura Universității din Oradea 11. Ghena N., 1977, Pomicultură generală și specială, Editura Didactică și Pedagogică 12. Hera C., Z. Borlan, 1980, Ghid pentru alcătuirea plantărilor de fertilizare, Editura Ceres 13. Mihăiescu G., 2007, Pomicultura de la A la Z, Editura Asab 14. Mihuț E., 2005, Cultura pomilor fructiferi, Editura Comision Dic 15. Oprea R.C., 2013, Compendiu de pedologie, Editura Universitară 16. Stanciu Gh ., 2006, Horticultura României, Editura Cetatea de Scaun 17. Stănică F., N. Braniște, 2011, Ghid pentru pomicultori, Editura Ceres 18. Venig A., 2013, Îndrumător de lucrări practice în pomicultură, Editura Universității din
Oradea 19. Venig A., 2006, Practicum de pomicultură generală, Editura Universității din Oradea 20. Victor I., 2003, Livada noastră, de la 2-3 pomi la sute, Editura Alex-Alex

139
Annals of the University of Oradea, Fascicle: Environmental Protection Vol. XXXV, 2020 Analele Universităţii din Oradea, Fascicula: Protecţia Mediului Vol. XXXV, 2020
COMPARATIVE STUDY ON THE CAPACITY OF REGENERATIVE ORGANOGENESIS IN OPUNTIA FRAGILIS VAR
FRAGILIS AND AYLOSTERA HELIOSA GROW IN VITRO ON MEDIUM SUPPLEMENTED WITH 2,5 mg/l 2,4-
dichlorophenoxyacetic acid (2,4-D)
Vidican Iuliana Teodora*, Iancu Carmen Violeta, Stanciu Alina Ștefania, Cărbunar Mihaela
*University of Oradea, Faculty of Enviromental Protection,11 Borsecului St., 410571
Oradea, e-mail: [email protected]
Abstract In this experiment we chose two species of cactus, respectively: Opuntia fragilis var fragilis
belonging to the genus Opuntia, a cactus with great economic importance for which there is a continuous growth for virus-free seedlings, obtained only by in vitro micropropagation (Johnson and Emino 1979, Escobar et al., 1986; Rubluo et al., 1996; Smith et al. 1991) and Aylostera heliosa, a decorative cactus with both port and flowers, but which is difficult to propagate by grafting but much easier by in vitro micropropagation. These cacti can be successfully acclimatized by developing a strong root system.
In order to establish the in vitro culture, we harvested buds from the stems of Opuntia fragilis var fragilis and Aylostera heliosa. We inoculated the explants on a culture medium consisting of macroelements and Fe EDTA Murashige-Skoog (1962), Heller microelements (1953), supplemented with 2,5 mg/l 2,4-dichlorophenoxyacetic acid (2,4-D).
The evolution of the explants was monitored for 90 days. The response of the explants of Opuntia fragilis var fragilis and Aylostera heliosa to the presence in the culture medium of an amount of 2,5 mg/l 2,4-D was different, so the presence in the culture medium of auxin as expected favorably influenced callus induction in both species while rhizogenesis was noted only in Opuntia fragilis var fragilis with an increase of 135,29% in the number of roots formed and 138,23% in their average length. Keywords: in vitro cultures, 2,4-dichlorophenoxyacetic acid, roots, callus
INTRODUCTION
Ontogenetic development of plants is determined by endogenous and exogenous factors that can have an action more or less specific. Phytohormones, are endogenous stimuli, but may be added to the culture medium, the exogenous form of synthetic compounds that have the capacity to mimic the effects of natural growth regulators.
Auxins are phytohormones or growth regulators frequently used in tissue cultures, having a stimulating action on rhizogenesis, considering that the cumulative effect of endogenous auxins with the intake of exogenous auxins, leads to obtaining as many roots as possible (Juárez et al. , 2002). Among the synthetic auxins is 2,4-dichlorophenoxyacetic acid (2,4-D), which is the most used and recommended growth regulator that stimulates the generation of calluses in explants. At moderate concentrations, it boosts

140
cell division in the cambium, but becomes toxic at higher concentrations. In callus culture, auxin provides high friability, facilitating the separation of cells in cell suspensions and somatic embryogenesis. Cacti are considered to be extremely susceptible in the differentiation process when they are grown in mineral environments rich in growth regulators (Copăceacu, 2001) invariably inducing organogenesis processes.
Fig.1. Image representing cacti, where: A - Opuntia fragilis var fragilis; B – Aylostera heliosa.
After Griffith, 2001a and Pinkava, 2002 genus Opuntia (fig.1A) cacti are the most studied species in the world, due to the economic importance of this cactus. Opuntia cactus is a valuable economically, is eaten as a vegetable, but also has edible fruit, also used as fodder (Kluge and Ting, 1978; Casas and Barbera, 2002). This plant is considered a good indicator of the presence of pollutants (Nobel, 1994), it is also considered as an important tool to combat desertification (El Gamrat, 2004). Like other species of cactus, Opuntia fragilis var fragilis, can multiply rapidly and efficiently by micropropragare in vitro (Karimi1 et al., 2010).
Aylostera heliosa (fig.1B), cactus, decorative both in the port - thorns due to the comb aligned to the white-silver edge (Perez et al., 2002), and by red or orange flowers is a very difficult species multiplied by grafting (Myeong et al., 2004). Aylostera heliosa like other cacti can multiply quickly and efficiently by in vitro micropropagation (Karimi1 et al., 2010).
In this experiment our goal was to study the reactions of phytoinocles of Opuntia fragilis var fragilis and Aylostera heliosa to the existence in the culture medium of 2,4 - dichlorophenoxyacetic acid (2,4-D) added in the same concentration, of 2,5 mg/l. We thus obtained the following variants: V0 or control group (medium without growth regulators), V1 in which we cultivated inoculi of Opuntia fragilis var fragilis on a medium supplemented with 2,5 mg/l 2,4 - dichlorophenoxyacetic and V2 in which we cultured Aylostera heliosa inocula on a medium supplemented with 2,5 mg/l 2,4 - dichlorophenoxyacetic.

141
MATERIAL AND METHOD To initiate in vitro cultures of Opuntia fragilis var fragilis and
Aylostera heliosa i keep prelevet strains with mature areolas but with less thorns trainers, shorts and white. The material so obtained was secţiont transverse operation which resulted dished washers that were divided so that eventually fragments were inoculated following dimensions: about 1 cm long and 0,5 cm thick, yet have minimum 2-3 areola. After these operations we obtain the explants from mid dial and lateral (Fig. 2).
Fig. 2. Schemetic representation of Opuntia fragilis var fragilis and Aylostera heliosa young stems (a, b), and how slicing it into rings ellipsoid (c) and lateral explants inoculated on media centers and aseptic (d), where: ar - areola.
Knowing that in vitro cultures of naturally occurring cacti - the
areola - some long hairs and bristles, host parties for a variety of organisms (Garcia-Saucedo et al., 2005), sanitized of plant material was achieved by submersare for one minute at 96 º alcohol, followed by the coating process it with a solution of 0.8% sodium hypochlorite mixed with water in a ratio of 1:2, which were added three drops of Tween 20 as surfactant (Cachiță et al., 2004). Sanitized lasted 20 minutes, during which the plant material was continuously stirred. After decanting disinfectant plant material was washed with sterile distilled water to remove chlorine, achieving five consecutive rinses, of five minutes each.
After sterilization, the plant material was deposited in Petri capsules on filter paper discs (previously sterilized in the oven) in a laminar flow hood, horizontal air sterile operation, followed by sizing operation and future inocula removal of necrotic parts thereof.
Culture medium used for growth explants consisted of: macro Murashige-Skoog EDTA and Fe (1962), Heller microelements (1953), mineral mixture to which was added vitamins: pyridoxine HCl, thiamine HCl and nicotinic acid (containing 1 mg/l each), m-Inositol - 100 mg/l, sucrose - 20 g/l and agar 7 g/l pH of the medium was adjusted to a value of 5,8, its first autoclaving. The basal medium (MB) presented, we added 2,4-dichlorophenoxyacetic acid (2,4-D) concentration of 2,5 mg/l 2,4-D,

142
achieving the following: V0 or control group (medium without growth regulators), V1 in which we cultivated inoculi of Opuntia fragilis var fragilis on a medium supplemented with 2,5 mg/l 2,4 - dichlorophenoxyacetic and V2 in which we cultured Aylostera heliosa inocula on a medium supplemented with 2,5 mg/l 2,4 - dichlorophenoxyacetic.
The culture medium was placed in a glass vial with a capacity of 15 ml (each container was placed 5 ml of medium). Medium vials were sterilized for 30 minutes, by autoclaving at a temperature of 121°C. After cooling media proceeded to inoculate explants, aseptic room operation performed in a laminar flow hood with sterile air. To obstruction fitoinoculi containers we used polyethylene, immobilized with elastic.
Containers inocula were transferred to room for growth, under the following conditions: temperature ranged from 24ºC in peroada light and 20° during the phase of darkness and light was the regime fotoperiodic 16 hours lumină/24h, lighting cultures achieving is the white light emitted by fluorescent lamps, the intensity of 1700 lux.
Reaction and evolution of explants was monitored for 90 days. In this time period were conducted periodic observations and readings every 30 days. Values recorded biometric control group (V0, fitoinoculi grown on basic medium, without growth regulators) were considered the reference as 100% being reported - every trait - all readings averaged every experimental variant part.
RESULTS AND DISCUSSION
In the explants of Opuntia fragilis var fragilis grown on a medium supplemented with 2,5 mg/l 2,4-D (V1), the average number of roots formed was 0,6 roots/variant above the value of the same parameter recorded in the control group V0 increase) (Fig.3), which represents an increase of 135,29% (Fig.4). The presence of auxin 2,4-D at a concentration of 2,5 mg/l (V1) in the culture medium also positively influenced the increase in root length, so the average length of the largest root formed - in absolute values - exceeded the value recorded by this parameter in the control group by 1,3 cm (Fig.3), thus marking an increase of 18,23% (Fig.4) (Vidican et al, 2016); these differences are considered, from a statistical point of view, to be very significant generated at the level of the explants (Table 1). While in the case of Aylostera heliosa explants the presence in the culture medium of 2,5 mg/l 2,4-D (V2) did not stimulate the formation of roots, the phenomenon of rhizogenesis did not manifest itself until this date (Vidican et al, 2011).

143
Fig.3. Graphic presentation of the average values corresponding to the parameters recorded at the level of vitrocultures of Opuntia fragilis var fragilis and Aylostera heliosa on aseptic medium modified by us - (variant V0) - with the addition of 2,5 mg/l 2,4-D, data expressed in absolute values; (where: A-the average number of newly formed roots; B – the average length of the largest root; C-the average number of calluses; D-the average diameter of calluses).
The action of 2,4-dichlorophenoxyacetic acid (2,4-D) added at a concentration of 2,5 mg/l (V1) stimulated the induction of callus formation in both explants Opuntia fragilis var fragilis as well as those of Aylostera heliosa, in the first case the number of calluses being 1,4 calluses/variant (Fig.3) reaching an average diameter of 2,4 cm (Fig.4); while in the second case the average number of calluses/variant was 1,6 (Fig.3) higher in the case of phytoinocles belonging to variant V2 (average supplemented with 2,5 mg l 2,4-D), compared to the values of the same parameter recorded in the control group V0 (medium without growth regulators) these having an average diameter that exceeded the control V0 by 2,9 cm.

144
Fig.4. Graphic presentation of the average values corresponding to the biometric parameters at the level of vitropultures of Opuntia fragilis var fragilis and Aylostera heliosa on aseptic medium modified by us, with the addition of 2,5mg/l 2,4-D, data expressed in percentages, obtained after reporting the values read at the results recorded at the respective parameters biometrized to the control group (V0), without growth regulators, values considered to be 100%; (where: A-the average number of newly formed roots; B – the average length of the largest root; C-the average number of calluses; D-the average diameter of calluses).
In terms of percentage in Opuntia fragilis var fragilis the average number of calluses formed showed an increase of 217,85% (Fig.4) with no increase in their diameter of 240% (Fig.4) compared to the control V0, and in Aylostera heliosa there was an increasing trend, so the values recorded at control V0 were exceeded by an increase of 260% in the number of calluses formed (Fig.4) and of 226,08% in their average diameter (Fig.4). these results, from a statistical point of view, are considered to be very significant (Table 1).

145
Table 1. Results of the biometric evaluation 90 days after inoculation of the explants on V0
or control group (medium without growth regulators), V1 in which we cultivated inoculi of Opuntia fragilis var fragilis on a medium supplemented with 2,5 mg/l 2, 4 - dichlorophenoxyacetic and V2 in which we cultured Aylostera heliosa inocula on a medium supplemented with 2,5 mg/l 2,4 - dichlorophenoxyacetic.
The obtained results determine us to appreciate that the addition in the
culture medium of 2,5 mg/l 2,4-D constitutes a sufficient measure for the induction of callus in the explants of Opuntia fragilis var fragilis and Aylostera heliosa, estimates that are in agreement with those reported by Sandra A. et al., (1996), in Cereus peruvianus cultures practiced "in vitro".
In the case of our experiment, the callus generated in the explants of Opuntia fragilis var fragilis, inoculated and grown on culture medium supplemented with 2,5 mg/l 2,4-D (V1) or due to the abundance covered the entire surface of the nutrient substrate (Fig.5.1.B), in which case it shows signs of early semescence - fact highlighted by the cream color - either it was located at the base of the neotulpins in the form of opalescent, friable, pale green tissue (Fig.5.1.C).

146
1.
2. Fig.5. Inoculi of 1 - Opuntia (Tournef.) Mill.fragilis var. fragilis and 2 - Aylostera heliosa, 90 days after inoculation of the “in vitro” explant, where: A-roots; B-callus showing signs of early senescence; C-callus friable; and: iiv – viable initial inoculum; mc –Culture medium; nc-newly formed stems; rd-roots; ar-areoles; sp-spines; cl-callus; mg-buds).
Callus generated from Aylostera heliosa explants grown on a medium lacking growth regulators is located on the surface of the explant but also on the culture medium, it shows signs of early senescence, indicated by its cream or even light brown color (Fig.5.2.A). In the case of explants inoculated on culture medium supplemented with 2,5 mg/l 2,4-D (V2), the callus was crumbly, snow-white (Fig.5.2.B), and due to its abundance it covered the entire surface of the culture medium. CONCLUSIONS
1. Summarizing the results obtained from the observations made for 90
days on the phytoinocles of Opuntia fragilis var fragilis and Aylostera heliosa from the values recorded on inoculated explants and grown on medium supplemented with 2,5 mg/l 2,4-D, we can say that the response of

147
explants in both cases is, as expected, favorable to callus induction, thus in Aylostera heliosa there is a 260% increase in the average number of calluses/variant while in Opuntia fragilis var fragilis increased by 217,85%.
2. The values of the average diameter of the callus compared to the batch supplemented with 2,5 mg/l 2,4-D compared to control V0 (phytoinocles grown on basic medium, without growth regulators) and considered as reference, registered a plus of and an increase of 226,08% in Aylostera heliosa and 240% in Opuntia fragilis var fragilis.
3. The presence in the culture medium of 2,5 mg/l 2,4-D stimulated the formation of roots only in the experimental variant V1 (Opuntia fragilis var fragilis) where the number of newly formed roots exceeded by 135,29% the value the same parameter recorded in the control group, and the average length of the largest newly formed root was also 138,23% higher than that of the control group V0, while in Aylostera heliosa, rhizogenesis did not occur in this interval time.
REFERENCES
1. Cachiţă C.D., C.Deliu, R.L Tican., A. Ardelean, 2004, Tratat de biotehnolo-gie
vegetală. vol.I, Editura Dacia, Cluj-Napoca, p. 29-154. 2. Copăcescu V.S., 2001, Cactuşii, monografie; Ed. Ceres, Bucuresti, p. 11-517. 3. Casas A., G. Barbera, 2002, Mesoamerican domestication and diffusion. In P. S.
Nobel [ed.], Cacti: biology and uses, University of California, Berkeley, California, USA, p. 143–162.
4. El Gamrat T., 2004, Prospects and Constraints of Desert Agriculture. Lessons from West Omdurman, Environmental Monitoring and Assessment, vol. 99, p. 57–73.
5. Escobar H.A., V.M. Villalobos, A. Villegas, 1986, Opuntia micropropagation by axillary proliferation. Plant Cell Tissue Org. Cult., vol. 7, p. 269–277.
6. Garcıa-Saucedo P.A., Valdez-Morales M., Valverde M.E., Cruz-Herna-ndez A., Paredes-Lopez O., 2005, Regeneration of three Opuntia genotypes used as human food. Plant Cell, Tissue and Organ Culture, vol. 80, p. 215–219.
7. Griffith M. P., 2001a, A new Chihuahuan Desert prickly pear, Opuntia x rooneyi. Cactus and Succulent Journal (U.S.A.), vol. 73, p. 307-310.
8. Heller R., 1953, Rescherches sur la nutrition minérale des tissus végétaux cultives in vitro. Ann.Sci. Nat. Bot. Veg. Ser.,vol. II, p. 1-5.
9. Johnson J., E. Emino, 1979a, Tissue culture propagation in the Cactaceae. Cactus and Succulent Journal (U.S.A.), vol. 51, p. 275 - 279.
10. Juarezi, M.C., Passera C.B., 2002, In vitro propagation of Opuntia ellisiana Griff. and acclimatization to field conditions. Biocell, vol. 26, p. 319–324.
11. Karimi1 N., M.R. Mofid, M. Ebrahimi, R. Naderi, 2010, Effect of areole and culture medium on callus induction and regeneration Cereus peruvianus Mill. (Cactaceae), Trakia Journal of Sciences, 8(2): 31-35.
12. Kluge M., I.P. Ting, 1978, Crassulacean acid metabolism: an ecological analy-sis, Springer-Verlag, Berlin, Germany, Ecological studies, vol. 114, p. 324–335.
13. Murashige T., F. Skoog, 1962, A revised medium for rapid growth and bioassays with tobacco tissue cultures. Physiologia Plantarum, vol. 15, p. 473 –497.

148
14. Myeong I.J., Ghang-Hui C., Jung-Myung L., 2004, Production and Breeding of cacti for grafting in Korea. Chronica horticulturae, Korea, vol. 44, nr. 3, p. 7-10.
15. Pérez E., Pérez M., Davila C., Villalobos E., 2002, In vitro propagation of three species of columnar cacti from the Sonoran Desert. Hortscience, vol. 37, nr. 4, p. 693 – 696.
16. Pinkava D.J., 2002, On the evolution of continental North American Opuntioideae. Succulent Plant Research, vol. 6, p. 59-98.
17. Rubluo A., J. Reyes, B. Rodriguez-Garay, E. Pimienta-Barrios, I. Brunner, 1996, Métodos de propagación biotecnológicos y convencionales en cactáceas para zonas áridas. In: Técnicas Convencionales y Biotecnológicas para la Propagación de Plantas de Zonas Áridas, J Izquierdo, G Palomino (eds). Santiago, Chile, vol 9, p. 345.
18. Smith R., P. Burdick, J. Anthony, A. Reilley, 1991, In vitro propagation of Coryphantha macromeris. HortScience, vol. 26, nr. 3, p. 315.
19. Vidican I.T., Urdea O., Study on the regenerative capacity and organogenrsis of Aylostera (Speg.) heliosa explants, in the presence of 2,4 - dichlorophenoxyacetic acid (2,4-D) in culture medium, 2011, Analele Universităţii din Oradea, Fascicula Protecţia Mediului, Simpozion Internaţional, Vol. XVII, ISSN: 1224-6265, p. 397-405.
20. Vidican Iuliana Teodora, Lazăr Andra Nicoleta, Stanciu Alina Ştefania, 2016, Study on the Ability of Regenerative Organogenous Explants Opuntia (Tournef.) Mill. fragilis var. fragilis, currently in the Culture Medium Dichlorophenoxiacetic 2,4 (2,4-d), Analele Universităţii din Oradea, Fascicula Protecţia Mediului, Vol. XXVII, anul 21, ISSN: 1224-6255, pag. 163-171

149
Annals of the University of Oradea, Fascicle: Environmental Protection Vol. XXXV, 2020 Analele Universităţii din Oradea, Fascicula: Protecţia Mediului Vol. XXXV, 2020
ESTABLISHING THE NECESSARY MACRO AND MICROELEMENTS NECESSARY FOR GROWTH AND
DEVELOPMENT OF PRUNUS LAUROCERASUS PLANTS CULTIVATED IN CONTAINERS
Vlad Ioana Andra*
*University of Oradea, Faculty of Environmental Protection, Bd. General Magheru, nr.26
Oradea, Romania, e-mail: [email protected]
Abstract Ensuring and maintaining a proper supply status in the container substrate with easily
accessible nutrients is the basis for obtaining good results in the cultivation of Prunus laurocerasus plants. (Vlad I., 2012). Fertilization is necessary to replace the reserve consumed by plants or leaching, to help restore and improve the condition of the substrate and hydro physical properties, to stimulate the activity of microorganisms involved in the disaggregation of organic substances to increase the content of nutrients easily accessible to plants (Zaharia D, 1993). The requirements of prunus laurocerasus plant compared to nutrients differ depending on soil moisture, plant age, container size and crop substrate (Krussman, 1986).
Obtaining favorable influences in the growth of Prunus laurocerasus plants is also conditioned by the quantitative ratios that are made in the substrate, in the main nutrients (Iliescu, 1994). Key word: Prunus laurocerasus, containers, fertilizers, culture substrate. INTRODUCTION Maintaining the fertility of the crop substrate can be achieved by applying fertilizer doses approximately equal to the annual consumption of Prunus laurocerasus plants and the rate of humus mineralization, and decreasing the fertility of the substrate occurs when the doses of fertilizers used are less than the amount of elements nutrients extracted annually from the culture substrate and the rate of humus mineralization or when no fertilizers are applied (Parnia, 1992). By applying moderate doses of fertilizers it is possible to ensure not only maintaining the fertility of the soil but also obtaining very good results in plant growth and development (Voican, 1994). MATERIAL AND METHODES The experiments took place in Santandrei, Bihor, with the following options: V1- culture in containers in peat 60% and leaf soil 40%. V2 - culture in 50% peat containers and 50% leaf soil. V3 - 40% peat container culture and 60% leaf soil.

150
The substrates used were neutralized and fertilized with the following doses calculated per m3 of substrate: - calcium carbonate 4 kg. - simple superphosphate 2 kg. - ammonium nitrate 0.5 kg. - magnesium sulphate 1.5 kg. - potassium sulphate 1.5 kg. - borax 20 g. - copper sulphate 25 g. - iron sulfate 50 g. - manganese sulfate 20 g. - zinc sulfate 15 g. - ammonium molybdate 5 g. The basic fertilizers were mixed powdered with the substrate, and those with microelements were dissolved in water and administered evenly. RESULTS AND DISCUSSION
In order to achieve a rational fertilization, substrate samples were collected once a month, during April-September, which were analyzed in the laboratory. The evolution of the content of mineral substances in the culture substrate following the fertilizations performed is presented in table 1. During the experiment, the content of nitrogen, phosphorus and potassium decreases, due not only to the consumption of plants but also to the leaching of a quantity of water-soluble substances. This made it necessary to maintain the content at optimal levels for all variants (15-30 mg N; 8-12 mg P2O5; 25-40 mg K2O; 8-15 mg MgO). The doses of fertilizers administered during a vegetation period were 1000kg / ha (300kg ammonium nitrate, 300 kg superphosphate, 200kg potassium sulphate and 200 Kg ammonium nitrate), 800kg / ha for variant 2 and 600kg / ha for variant 3 (96,000 plants containers per hectare).

151
Table 1.
Results of laboratory tests and fertilizations performed on containers of Prunus laurocerasus grown in containers
Number and date bulletin of
analyze
PH water
Mineral content Water soluble (1: 5) mg / 100g dry substrate Moisture%
Residue mineral
%
Fertilizations performed (kg/ha) Nitrogen by ammonium
Sulfate of potassium
Super- phosphate
Nitro chalk N P2O5 K2O CaO MgO
Variant 1 1/21 IV 6,9 18 9 29 44 14 67 0,37 2/19V 6,8 17 8 28 41 13 65 0,35 300 3/22VI 6,7 16 12 26 39 12 64 0,39 4/23 VII 6,6 15 11 25 35 11 63 0,37 300 200 200 5/20VIII 6,9 17 10 28 38 10 62 0,42 6/18IX 6,7 16 9 27 37 9 61 0,38 Variant 2 1/21 IV 6,7 10 30 40 13 65 0,39 2/19V 6,7 10 28 38 13 65 0,35 3/22VI 6,6 9 25 35 12 64 0,33 200 200 4/23 VII 6,9 8 28 39 11 63 0,38 200 200 5/20VIII 6,8 10 27 38 9 62 0,39 6/18IX 6,7 9 26 37 9 61 0,35 Variant 3 1/21 IV 7,0 11 31 46 15 64 0,38 2/19V 6,9 10 29 42 14 64 0,37 3/22VI 6,8 8 27 38 13 63 0,39 200 100 4/23 VII 6,7 11 25 35 12 62 0,41 200 100 5/20VIII 6,8 10 28 38 11 62 0,40 6/18IX 6,7 9 27 36 10 61 0,37
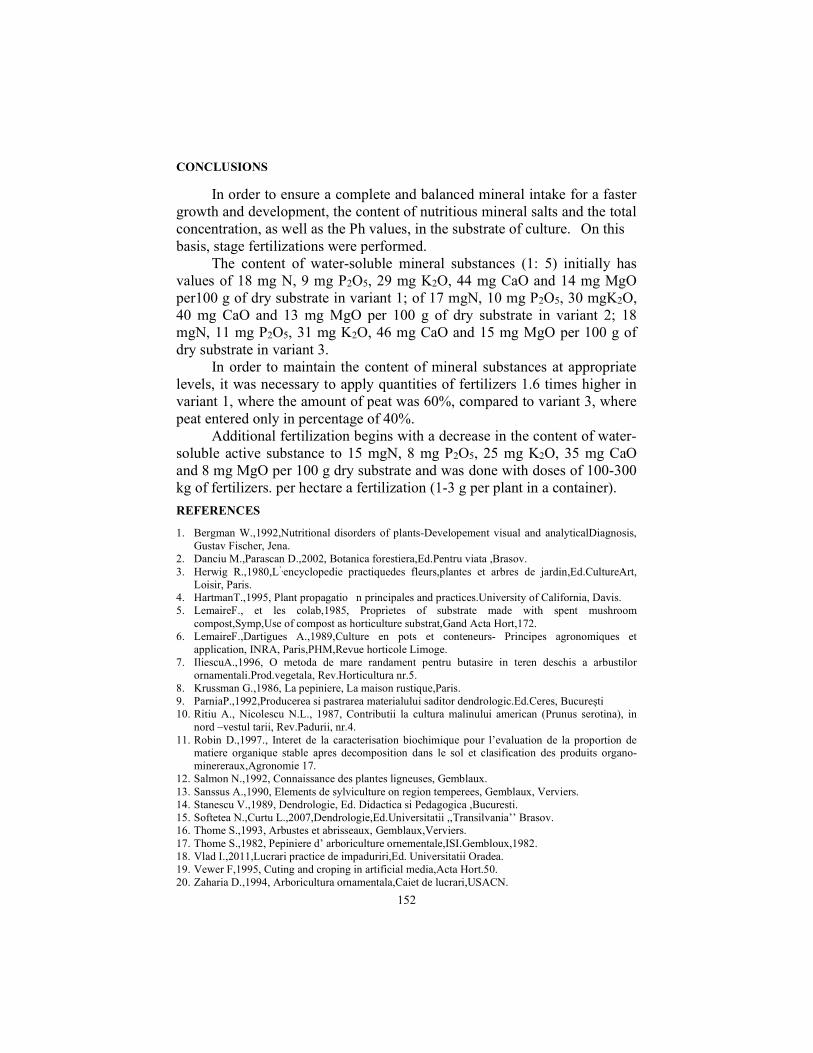
152
CONCLUSIONS
In order to ensure a complete and balanced mineral intake for a faster growth and development, the content of nutritious mineral salts and the total concentration, as well as the Ph values, in the substrate of culture. On this basis, stage fertilizations were performed. The content of water-soluble mineral substances (1: 5) initially has values of 18 mg N, 9 mg P2O5, 29 mg K2O, 44 mg CaO and 14 mg MgO per100 g of dry substrate in variant 1; of 17 mgN, 10 mg P2O5, 30 mgK2O, 40 mg CaO and 13 mg MgO per 100 g of dry substrate in variant 2; 18 mgN, 11 mg P2O5, 31 mg K2O, 46 mg CaO and 15 mg MgO per 100 g of dry substrate in variant 3. In order to maintain the content of mineral substances at appropriate levels, it was necessary to apply quantities of fertilizers 1.6 times higher in variant 1, where the amount of peat was 60%, compared to variant 3, where peat entered only in percentage of 40%. Additional fertilization begins with a decrease in the content of water-soluble active substance to 15 mgN, 8 mg P2O5, 25 mg K2O, 35 mg CaO and 8 mg MgO per 100 g dry substrate and was done with doses of 100-300 kg of fertilizers. per hectare a fertilization (1-3 g per plant in a container).
REFERENCES
1. Bergman W.,1992,Nutritional disorders of plants-Developement visual and analyticalDiagnosis, Gustav Fischer, Jena.
2. Danciu M.,Parascan D.,2002, Botanica forestiera,Ed.Pentru viata ,Brasov. 3. Herwig R.,1980,L’,encyclopedie practiquedes fleurs,plantes et arbres de jardin,Ed.CultureArt,
Loisir, Paris. 4. HartmanT.,1995, Plant propagatio n principales and practices.University of California, Davis. 5. LemaireF., et les colab,1985, Proprietes of substrate made with spent mushroom
compost,Symp,Use of compost as horticulture substrat,Gand Acta Hort,172. 6. LemaireF.,Dartigues A.,1989,Culture en pots et conteneurs- Principes agronomiques et
application, INRA, Paris,PHM,Revue horticole Limoge. 7. IliescuA.,1996, O metoda de mare randament pentru butasire in teren deschis a arbustilor
ornamentali.Prod.vegetala, Rev.Horticultura nr.5. 8. Krussman G.,1986, La pepiniere, La maison rustique,Paris. 9. ParniaP.,1992,Producerea si pastrarea materialului saditor dendrologic.Ed.Ceres, București 10. Ritiu A., Nicolescu N.L., 1987, Contributii la cultura malinului american (Prunus serotina), in
nord –vestul tarii, Rev.Padurii, nr.4. 11. Robin D.,1997., Interet de la caracterisation biochimique pour l’evaluation de la proportion de
matiere organique stable apres decomposition dans le sol et clasification des produits organo-minereraux,Agronomie 17.
12. Salmon N.,1992, Connaissance des plantes ligneuses, Gemblaux. 13. Sanssus A.,1990, Elements de sylviculture on region temperees, Gemblaux, Verviers. 14. Stanescu V.,1989, Dendrologie, Ed. Didactica si Pedagogica ,Bucuresti. 15. Softetea N.,Curtu L.,2007,Dendrologie,Ed.Universitatii ,,Transilvania’’ Brasov. 16. Thome S.,1993, Arbustes et abrisseaux, Gemblaux,Verviers. 17. Thome S.,1982, Pepiniere d’ arboriculture ornementale,ISI.Gembloux,1982. 18. Vlad I.,2011,Lucrari practice de impaduriri,Ed. Universitatii Oradea. 19. Vewer F,1995, Cuting and croping in artificial media,Acta Hort.50. 20. Zaharia D.,1994, Arboricultura ornamentala,Caiet de lucrari,USACN.

153
Annals of the University of Oradea, Fascicle: Environmental Protection Vol. XXXV, 2020 Analele Universităţii din Oradea, Fascicula: Protecţia Mediului Vol. XXXV, 2020
THE INFLUENCE OF STRUCTURAL CHARACTERISTICS ON THE STABILITY OF STANDS AFFECTED BY WINDFALLS AND
WINDBREAKS
Crainic Ghiţă Cristian*, Sicoe Silviu**, Curilă Mircea***, Curilă Sorin****
* Lect. Dr.Eng. - University of Oradea, Faculty of Environmental Protection, Department of Forestry
and Forestry Engineering, **PhD student - University of Oradea, Faculty of Environmental Protection
***University of Oradea, Faculty of Environmental Protection, Department of Environmental Engineering
****University of Oradea, Faculty of Electrotechnics and Informatic, Department of Electronics and Telecommunications
Abstract
The stability of stands can be quantified according to their structural, qualitative and synthetic characteristics. The indicators that can be determined according to the main dendrometric characteristics are represented by the thickness index, the density indices, the slenderness index and the Hart-Beking spacing index.
In order to determine the structural and synthesis indices, the field data were recorded on sample plot. by statistical-mathematical inventory.
The values of the indices, which were determined following the processing of field data, emphasized the fact that the analyzed and studied stands have a relatively low thickness and density as well as a corresponding spacing. What is more, the stability to the action of the dominant wind, evaluated by means of slenderness index, is high.
The effects of the extreme weather events that occurred on September 2017 can be explained in correlation with soil thickness and with the presence of the rock relatively to the soil surface. These aspects predisposed the stands to ecosystem instability, being at the same time predisposing factors to a series of ecosystem imbalances.
In conclusion, the stability of stands affected by windfalls and windbreaks is influenced by a complex of factors that are directly correlated with vegetation, environmental conditions and the complex of silvicultural interventions, necessary to be achieved at the right time. Key words: stand stability indices, affected stands, thickness indices, density indices, spacing indices, slenderness indices. INTRODUCTION
The effects of extreme meteorological phenomena, namely windfalls and windbreaks, on compact surfaces, caused to deciduous stands within the management unit VII Văratec, Sudrigiu Forest District, County Forest Administration Bihor, since 17 09 2017, have affected a considerable area, seriously disrupting the production process.
For the edification and analysis of the factors that favored and triggered the windfalls and windbreaks, in the stands within the management unit VII Văratec, it is necessary to analyze and study the structural, qualitative and synthetic characteristics of these stands. Inthis

154
context, a relevant silvicultural analysis and diagnosis must be carried out, determining the extent to which the characteristics of the affected stands have contributed to the onset and to the realization of these major natural disasters, respectively.
The elements that are necessary to determine the characteristics of the affected stands, to perform the analysis and silvotechnical diagnosis, are represented by: the composition of the stands, the width index, the density indices, the slenderness index and the Hart-Beking spacing factor. The determination of these elements will be performed following the processing of the data recorded on the occasion of the statistical-mathematical inventories, in the experimental devices, located in the affected stands.
The thickness of the stand can be evaluated as a ratio between the number of existing trees per unit area and the optimal number of trees, established with the production tables for a stand with the same structural and qualitative characteristics.
Thickness by number of trees
(1) where, IN - thickness index by number of trees; Nfield - number of trees in the field, per hectare: Ntable - number of trees in the production tables, per hectare, for a
stand with the same structural and qualitative characteristics. Stand density Density on the basal area
(2) where, IG - thickness index on the basal area; Gfield - basal area per hectare, from the field; Gtable - basal area from the production tables, per hectare, for a stand
with the same structural and qualitative characteristics. Density by volume
(3) where, IV - density volume by volume; Vfield - volume per hectare, from the field; Vtable-the volume in the production tables, per hectare, for a stand
with the same structural and qualitative characteristics; Hart-Beking spacing factor

155
The spacing factor of the stand expresses the degree of spacing of the trees in the stand, as a ratio between the theoretical distance between the trees and the dominant height, respectively. This index will be calculated in two variants, in the situation where the trees in the stand are arranged in the corners of a square of side a and respectively in the corners and center of a hexagon of side a, respectively in chinconz.
100% domh
as ; (4)
Na
100004 ; (5)
2
3
100006
N
a ; (5)
hhhdom 15.0 (7)
hhdom 15.1 ; (8)
where: S% - spacing index; a -average distance between trees in m; N- number of trees per hectare; hdom –dominant height;
h - medium height. 10000 –number of m2in a hectare.
2
3- factor indicating the distribution in chinconz.
a4 - the theoretical average distance between the trees when they are arranged in a square device;
a6-the value of the theoretical average distance between the trees when they are arranged in chinconz;
As a result, we will have the following expressions for spacing indices:
1004%4
domh
as (9)
1006%6
domh
as (10)

156
The spacing factor of the stand, usually used for young and mature stands, pure and equine, can be considered a sensitive indicator of its thickness and stability.
Depending on the value of the spacing factor, the stands can be classified as follows:(from Florescu, Nicolescu, 1994, according to Riou-Niver 1984, Bary-Lenger 1988):
-S%>20% - stands with normal thicknesses; -S% =15-20% - relatively thick stands; -S% =10-15% - thick, unstable stands; -S% <10% - excessively thick stands.
The slenderness index The slenderness index (z) is expressed by the ratio between the average height and the average diameter of the trees. In excessively thick stands, the trees have high heights and small diameters, as a result the slenderness index can register values higher than 100. Consequently, these stands are more vulnerable to damage caused by wind, snow and frost. For the main tree species in the national forest fund, in conditions of optimal ecosystem stability of the stands, the slenderness indices are necessary to have values between 60% - 90%.
100%
d
hz (11)
where:
h - medium height;
d - medium diameter.
MATERIAL AND METHOD
The case study was carried out in the 104A and 65B compartments (ua), in the management unit VII Văratec,Sudrigiu Forest District, within the County Forest Administration Bihor, during 2017 - 2020. The stands in the analyzed and studied plots, which were affected by windfalls and windbreakscaused by extreme weather phenomena on 17 09 2017.
For the realization of the case study, an appropriate bibliographic documentation was made, using in this context treatises and specialized works and scientific articles.
In the field, observations were made on the itinerary and in stationary, statistical-mathematical inventories and digital recording of field images.

157
The statistical-mathematical inventories were made on circular sample plots with an area of 1000 m2.
The following data were recorded in the field: species, base diameter, package diameter, diameter of the two-way perpendicular root, height of the two-way root, tree height, quality class, condition of the tree.
Photo.1- Location of the case study
(https://www.google.com/maps/place/Sudrigiu/@46.8444641) Photo. 2 presents the location of the case study for the stand in u.a. 65B.
Photo. 2 - Location of the stand in the u.a. 65B
Table 1 shows the description of the forest site and respectively, the
tree stand in the u.a.104A. The elements that formed the basis of the statistical-mathematical
inventory are the following: u.a. - 65B, Su.a. = 15.0 ha, C.L.P. = II, T = 116 years, K = 0.8, s% = 30, probability of coverage p = 90%, tolerance t = 10%, shape - circular, Sp = 1000 m2, RSp = 17.85 m.

158
Table 1 Description of the stand and site in the u.a. 65B
As a result, according to the Tabelele pentru inventarierea statistică
a arboretelor - 1972 edition, a number of 21 (experimental) sample plots of 1000 m2 of circular shape was established, the distance between the centers of the sample plots measuring 85 m. Photo. 3 shows the location of the case study for the stand in u.a. 104A.
Photo. 3 - Location of the stand in the u.a. 104A
Table 2 shows the description of the forest site and respectively, the tree stand in the u.a.104A.
Table 2 Description of the stand and site in the u.a. 104A

159
The elements that formed the basis of the statistical-mathematical inventory are the following: u.a. - 104A, Su.a. = 35.58 ha, C.L.P. = II, T = 105/70 years, K = 0.8, s% = 41%, probability of coverage p = 90%, tolerance t = 10%, shape - circular, Sp = 1000 m2, RSp = 17.85 m.
As a result, a number of 38 (experimental) sample plots of 1000 m2, of circular shape, was established, the distance between the centers of the sample plots measuring 95 m. RESULTS AND DISCUSSION The results obtained from the processing of data recorded on the occasion of statistical-mathematical inventories - respectively the number of trees, the basal area and the volume per hectare, are presented synthetically, by species, for each stand, below.
The following values were obtained for the stand in u.a. 65B: NGo = 119 pieces./ha; NFa = 15 pieces/ha; GGo = 14.076 m2/ha; GFa = 0.920 m2/ha; VGo = 190.271 m3/ha; VFa = 10.430 m3/ha.
Next, the analysis and silvicultural diagnosis for the stand in the u.a. 65B. The composition of the stand in u.a 65B The composition of the stand in u.a 65B will be determined
according to the number of trees per hectare, the basal area per hectare and the volume per hectare, respectively.
The composition of the stand by number of trees Nstand= NGo + NFa = 119 + 15 = 134 pieces./ha. In conclusion, the composition by number of trees in u.a 65B is:
9Go1Fa - the stand being practically pure. The composition of the stand on the basal surface Gstand= GGo + GFa = 14.076 + 0.920 = 14.996 m2/ha. In conclusion, the composition on the basal surface of u.a 65B is:
9Go1Fa - the stand being practically pure. Composition by volume Vstand= VGo+ VFa = 190.271 + 10.430 = 200.701 m3/ha. In conclusion the volume composition in u.a 65B is:
9Go1Fa - the stand being practically pure. Thickness and density of the stand

160
Table 3 Theoretical values for beech tree stand elements, from u.a. 65B (extract from the Biometria arborilor și arboretelor din România, Ediția 1972, table 106, p. 662)
1 Go: T = 110 years, C.L.P. II
N(pieces/ha) G(m2/ha) V(m3/ha) % 404 38.2 549 9
2 Fa: T = 110 years, C.L.P. II
N(pieces/ha) G(m2/ha) V(m3/ha) % 401 40.6 625 1
3 Medium values
N(pieces/ha) G(m2/ha) V(m3/ha) % 404 38.44 557 9 + 1
Thickness by number of trees
Stand density
Density by volume
For the u.a. 65B the values of the spacing indices are shown below.
mN
a 6.8627.74134
10000100004
m
N
a 3.9204.86004.116
10000
2
3134
10000
2
3
100006
mhhdom 2.3025.2615.115.1
%5.281002.30
6.81004
%4 domh
as
%7.3010025.30
3.91006
%6 domh
as
As a result, the values of the HartBeking spacing indices, we ascertain that the stand in 65B has a very good spacing.
The slenderness index
%6410041
25.26100%
d
hz
161
The value of 64% of the slenderness index indicates that the stand in the u.a. 65B has a high stability to the action of some destabilizing climatic factors (wind, snow, frost, etc.).
In photo. 4, uprooted trees, from the oak species, are presented in the stand from u.a. 65B.
Photo. 4 - Oak trees, uprooted in the stand from u.a. 65B
From the analysis of the image in photo 4 and the reality in the field, it can be seen that the roots of the uprooted oak have grown and developed horizontally, being traceable - atypical for this species, due to relatively low soil thickness .
There is also the presence of rock fragments, which were displaced by the roots (and soil) of uprooted trees.
The stand in u.a. 104A The following values were obtained for the stand in u.a. 104A: NGo= 6 pieces/ha; NFa = 175 pieces/ha; GGo = 0,418 m2/ha; GFa = 17,893 m2/ha; VGo = 5.345 m3/ha; VFa = 221.090 m3/ha.
Next, the analysis and silvicultural diagnosis for the stand in u.a. 104A. The composition of the stand in u.a. 104A The composition of the stand in u.a. 104A will be determined
according to the number of trees per hectare, the basal area per hectare and respectively, the volume per hectare.
The composition of the stand by number of trees Nstand= NGo+ NFa= 6 +175 = 181 pieces/ha. In conclusion, the composition by number of trees in 104A is: 10Fa,
disseminated oak, the stand being pure. The composition of the stand on the basal surface Gstand= GGo+ GFa = 0,418 + 17,893 = 18,311 m2/ha. In conclusion, the composition on the basal surface of u.a 104A is:
10Fa, the stand being pure and the oak species is disseminated.

162
Composition by volume Vstand= VGo+ VFa= 5.348 + 221.090 = 226.435 m3/ha. In this case, the volume composition of the stand in u.a 104A is:
10Fa, and the oak species is disseminated, the stand being pure. Thickness and density of the stand
Table 4 Theoretical values for beech tree stand elements, from u.a. 104A
(excerpt from Biometria arborilor și arboretelor din România, Ediția 1972, table 106, p. 662)
1 Fa: T = 70 years, C.L.P. III
N(pieces/ha) G(m2/ha) V(m3/ha) % 845 32.4 358 6
2 Fa: T = 105 years, C.L.P. III
N(pieces/ha) G(m2/ha) V(m3/ha) % 523 36.5 480 4
3 Medium values
N(pieces/ha) G(m2/ha) V(m3/ha) % 716 34.04 406.80 10
Density by number of stands
Tree Stand Density on the basal surface
Density per volume
Hart-Beking spacing index
For the stand located in u.a. 104 the values of the spacing indices are presented below.
mN
a 4.7249.55181
10000100004
m
N
a 8796.63750.156
10000
2
3181
10000
2
3
100006
mhhdom 5.305.2615.115.1
%3.241005.30
4.71004
%4 domh
as

163
%2.261005.30
81006
%6 domh
as
Given the values of the HartBeking spacing indices, we find that the 104A stand has a very good spacing.
From the analysis of the image in the photo.5 and of the objective reality in the field, it is found that the roots of the uprooted beech specimen, grew and developed horizontally, becoming tracing - atypical for this species, this aspect due -a relatively low soil thickness.
There is also the presence of a considerable volume of rock fragments, which was displaced by the root of the uprooted tree.
The slenderness index
%66%25.6610040
5.26100%
d
hz
The value of 66% of the slenderness index indicates that the stand in the u.a. 104A has a high stability to the action of destabilizing climatic factors (wind, snow, stove, etc.) Photo. 5 shows uprooted beech trees in the u.a. 104A.
Photo. 5 - Uprooted trees in the u.a. 104A stand
CONCLUSIONS
From the analysis of the results obtained from the processing of field data, and from the analysis and silvotechnical diagnosis, it can be concluded that the structural and synthesis indicators of the stands have values that build an ecosystem stability, consolidated even.Indicii de desime şi densitate a arboretelor studiate au valori subunitare, ca urmare stabilitatea acestora este bună.
The values of the Hart-Beking spacing factor in the studied stands are over 24%, as a result, they have an optimal spacing.
Also, the values of the slenderness indices that are included in the range 60 - 70%, indicate stands with high stability to the destabilizing action of some climatic factors - dominant winds in particular

164
An important factor that considerably influenced the stability of the studied stands, is represented by a relatively low physiological-active thickness of the soil (determined by the presence of rock on the surface) - aspect that limited the development of the tree rooting system in the studied stands.
As a result, these particularities of the soil and the lithological substrate favored and predisposed to windfalls the stands that presented an atypical rooting system, for the oak and beech species.
Acknowledgment The writing team of this work acknowledges the National Forest Administration
ROMSILVA, Bihor County Forest Administration and Sudrigiu Forest District for financing the researches that are the basis of this work by Contract no. 12395 / 23.07.2019, registered at the University of Oradea, Ecological rehabilitation of the stands affected by the storm that occurred in 17.09.2017, within the Sudrigiu Forest District, Bihor County Forest Administration. REFERENCES
1. Crainic Gh. C., 2019, Silvicultură vol.I (Silvobiologie) - Note de curs, Universitatea din Oradea,
Facultatea de Protecţia Mediului, Departamentul de Silvicultură şi Inginerie Forestieră; 2. Crainic Gh. C., 2019, Silvicultură vol. II (Silvotehnica) - Note de curs, Universitatea din Oradea,
Facultatea de Protecţia Mediului, Departamentul de Silvicultură şi Inginerie Forestieră; 3. Crainic Gh. C., 2019, Îndrumar pentru aplicaţii silvotehnice, Universitatea din Oradea, Facultatea
de Protecţia Mediului, Departamentul de Silvicultură şi Inginerie Forestieră; 4. Crainic Ghiţă Cristian, 2017, Aspects Relating To The Evaluation Of Accidental Wood Products,
In The Period 17 09-06 11 2017, In The Forestry District Sudrigiu, Bihor Forestry Department, Analele Universităţii din Oradea, Fascicula Protecţia Mediului, Vol. XXVIII, 2017, pp.189-196, ISSN 1224-6255;
5. Curilă Mircea, Curilă Sorin, Crainic Ghiță Cristian, Popescu (Curilă) Diana, 2019, Information Management System With Data Processing Algorithm Applied In The Forestry Sector,Annals of the University of Oradea, Fascicle: Environmental Protection Vol. XXXIII, 2019, ISSN 2065-3476, ISSN 2065-3484, pp. 115 - 122;
6. Florescu, I.I., Nicolescu, N.V., 1996: Silvicultura, Vol. I, Studiul pădurii, Editura Lux-Librix, Braşov;
7. Florescu, I.I., Nicolescu, N.V.,1998, Silvicultura, Vol. II, Silvotehnica, Editura Universităţii Transilvania din Braşov;
8. Nicolescu, N., 1995: Silvicultura, Îndrumar de lucrări practice, Editura Universităţii Transilvania din Braşov;
9. Sicoe Silviu Ioan, Crainic Ghiță Cristian, Iovan Călin Ioan, Sabău Nicu Cornel, 2019,Changes In The Common Beech Stand Micro-Relief Due To Windfalls In The Management Unit Vii Văratec, Sudrigiu Forest District, Bihor County, Romania, Natural Resources and Sustainable Development, Volume 9, Issue 2, 2019, Year 2019 - vol. 9 No. 2, eISSN 2601-5676, Print ISSN-L 2066-6276,mDOI: 10.31924/nrsd.v9i2.037, pp. 203 - 220;
10. ***Reabilitarea ecologică a arboretelor afectate de furtuna din 17 09 2017 în raza Ocolului Silvic Sudrigiu, Direcţia Silvică Bihor, 2010, Contract de cercetare cu mediul socio-economic, Referat parţial;
11. ***Reabilitarea ecologică a arboretelor afectate de furtuna din 17 09 2017 în raza Ocolului Silvic Sudrigiu, Direcţia SilvicăBihor, 2020, Contract de cercetare cu mediul socio-economic, Referat final.

165
Annals of the University of Oradea, Fascicle: Environmental Protection Vol. XXXV, 2020 Analele Universităţii din Oradea, Fascicula: Protecţia Mediului Vol. XXXV, 2020
DESIGN OF DIGITAL ANALYSIS PROGRAMS FOR THREE TYPES OF WOODEN STRUCTURES DIFFERENT AS EXTERNAL
LOADING USING THE INITIAL PARAMETERS METHOD
Fetea Marius Serban*
*Technical University of Cluj Napoca, Faculty of Building Services, B-dul 21 Decembrie 1989, nr. 128-130, Cluj Napoca, Romania, e-mail: [email protected]
Abstract In the present paper, the author presents the numerical analysis of the deformations from the main sections of the wooden structures by the method of the initial parameters. This work was carried out out of the desire to present a simpler numerical calculation algorithm than the classic case of analytical solving of these types of problems. Also, the use of numerical calculation allowed the reduction of the long time necessary to determine rigorous solutions compared to known analytical methods. In the paper presented by the author, the solution of the problems was done by applying the Matlab numerical calculation program.. Key words: numerical derivate, beam, wood, deflections.
INTRODUCTION
In the present paper, the author started the study from a structure of the type of recessed wooden beams that were loaded separately with three types of forces and external moments. Each case was treated in a separate paper. The beam was considered to have the same dimensional values in terms of its length and cross section. The length is three meters, and the section is circular with the same diameter D. Young's module was considered to have the same value 𝐸 = 0.12 ∙ 10 [𝑁/𝑚𝑚 ]. For all cases the stiffness of the bending beam is considered to be the constant E ∙ I = const.
The first structure studied was the case of a claped and loaded beam with a force evenly distributed along its entire length having the intensity q = 20 [N/m].
The second structure studied was the recessed bar loaded with a force concentrated at a distance of 1 [m] from the clamped end. The modulus of the concentrated force was considered to be F = 6 [KN].
The third structure studied was the recessed bar loaded with two concentrated outer moments, namely a moment M1 = 3 [KNm] and an outer moment M2 = 5 [KNm]. The outer moment M1, acts at a distance of 1 [m] from the embedded end, and the moment M2 at a distance of 2 [m] from the same end.
The calculation was initially done analytically for all three cases, after which it was performed numerically by the author designing three calculation

166
programs in Matlab. Within the analytical calculation, the determined expressions of the mechanical displacement were presented, followed by successive derivations in relation to the independent parameter “x” of the mechanical rotation, of the bending moment and of the shear force (Marţian,1999, Fetea, 2010).
The studied wooden bar has the following characteristics: - the length of the bar is 3.0 [m]; - the beam section is circular with initially unknown diameter
D=250[mm]; - the beam is considered to be embedded in the structure of a roof of
a family home; - the longitudinal modulus of elasticity for humidity of 12% is 𝐸 =
0.12 ∙ 10 [𝑁/𝑚𝑚 ]. - the moment of axial inertia of the section, I = (π ∙ D^4)/64 [m^4]; - the allowable arrow was considered to be, L/1000 = 3 [mm] - allowable rotation, φ_adm = 1° - uniformly distributed load having intensity q = 20 [N/m].
MATERIAL AND METHOD
The analytical study of the considered bar presents the following calculation algorithm:
- the connecting forces and moment bending in the supports were determined;
- based on the known general equation of the initial parameters, taking into account for each case, the original parameters were highlighted, represented by the shear force 𝑉 = 𝑇 and the bending moment 𝑀 of clamped edge. The initial parameters are the same in all three cases studied, only their values differ;
- using the derivation method, the expressions of rotation, bending moment and shear force were analytically determined. (Ciofoaia, 2001),
(Ivan,1997); - considering the free end of the beam, in this section the maximum
values of the mechanical displacement and of the mechanical rotation will be registered, respectively the minimum values of the bending moment and of the shear force.
- in the second part of the paper, the author presents the calculation programs designed for the three structures studied, using Matlab program.

167
𝑀 = 0
−𝑉 𝐿 + 𝑞𝐿
2= 0
𝑉 = 𝑞𝐿
2
𝑉 = 𝑉 = 20[𝐾𝑁] The analysis follows the classic stages of mechanical calculation of the
bars, determining according to the calculation algorithm the following parameters:
The efforts in the main sections beam (Catarig., 2001), (Missir, 2002): 𝑀 = 𝑀 = 0[𝐾𝑁𝑚]
𝑀 = 10[𝐾𝑁𝑚] The shear forces in A and B sections
𝑇 = 𝑉 = 20[𝐾𝑁] 𝑇 = 𝑉 = −20[𝐾𝑁]
The dimensioning of the dangerous section will be done using the
resistance condition in normal mechanical stresses (Catarig., 2001), (Ille V., 1981)
𝜎 =𝑀
𝑊≤ 𝜎
↓ 𝐷 = 189.7[𝑚𝑚]
𝐷 = 𝐷 + 5 = 194.7[𝑚𝑚]
Checking the dangerous section of the beam in normal mechanical stresses leads to the result (Missir V., 2002):
𝜎 =𝑀
𝑊= 13.87[
𝑁
𝑚𝑚] ≤ 𝜎
To determine the expressions of rotation and displacement along the axis of the bar, the method of direct integration of the differential equation of the deformed axis of the bar was used (Hadar, 1998). Starting from the expression of the bending moment along the beam axis, written according to the independent parameter "x", by two successive integrations the expressions of rotation and displacements were determined. The expressions

168
do not allow their direct determination being a function of two integration constants (Catarig., 2001) , (Goia, 2000). By imposing the conditions at the limits, the two integration constants C2 = 0 and C1 = 6.66 were determined
𝜑 =𝑑𝑣
𝑑𝑥= −
1
𝐸𝐼𝑉 𝑥 − 𝑞
𝑥
2𝑑𝑥 + 𝐶
𝑣 =𝑑𝜑
𝑑𝑥= −
1
𝐸𝐼(𝑉
𝑥
2− 𝑞
𝑥
6𝑑𝑥 + 𝐶 )𝑑𝑥 + 𝐶
Imposing for x=0 [m] and x=2 [m] result:
𝐶 = 6.66 𝐶 = 0
RESULTS AND DISCUSSION For the case studied. a numerical calculation program was designed in Matlab, aiming to determine the same parameters as in the case of the analytical study of the beam (Muntenu Gh.,1998). The following calculation program designed by the author and named - deflectionbeamssolve -MSF was made.
% Name program – “Deflectionbeamssolve – MSF” % Effort study
% L – beam length [m]
% q - uniformly distributed load intensity [KN/m^2]
% VA, VB - forces % R, mechanical resulting force of uniformly distributed force
% Vadm, allowable displacement[mm]
Sigmaadm=15
L =0:.2:2 Vadm=(L(1,11)*10^3)./1000 q=20 % Determination of sectional efforts
% Shear forces - TA, TB
R=20*L(1,11) VA=R./2 VB=VA TA=VA TB=-VB

169
syms T(x) T(x) = VA-q*x sol = vpasolve(T) for x=L(1,6) T(x) end TC=T(x) T=[TA TC TB] % Bending moments % MA, MB, MC –bending moments MA=0 MB=0 syms M(x) M(x)=VA*x-(q*x^2)/2 solMx = vpasolve(M) for x=L(1,6) M(x) end MC=M(x) % Analysis of the mechanical strength condition
Sigmaadm=15 syms x g(x)=x-((32*MC*10^6)/(pi*Sigmaadm))^(1/3) solgx=vpasolve(g) Dnec=solgx Def=Dnec+5 M=[MA MC MB] % Mechanical determination of the diameter of the dangerous section.
Sigmaadm=15
% “ Sigmaadm” Admissible mechanical stress in [N/mm^2] % Def - the effective diameter of the dangerous section
% Verification of dangerous section
% W - the effective mechanical resistance module of dangerous section Wef = (pi*Def^3)/32 Sigmamax = (MC*(10^6))/Wef % Check the mechanical stress allowed by15 [N/mm^2]
% Beam stiffness calculation
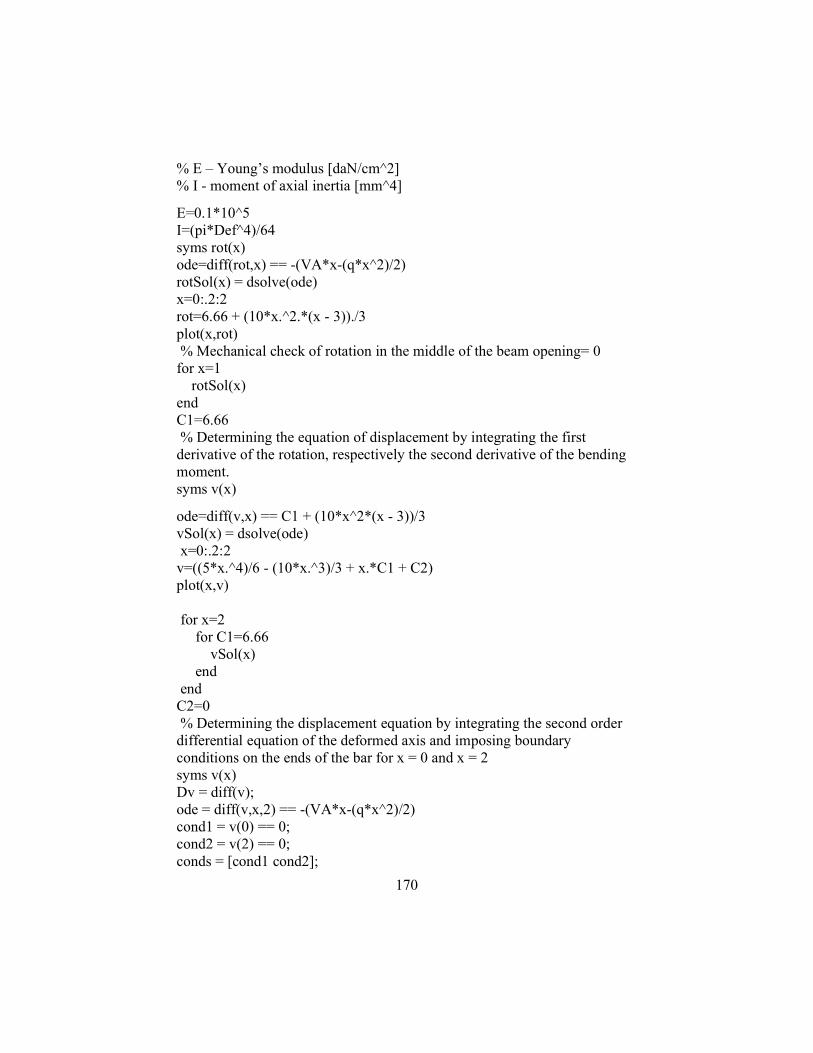
170
% E – Young’s modulus [daN/cm^2] % I - moment of axial inertia [mm^4]
E=0.1*10^5 I=(pi*Def^4)/64 syms rot(x) ode=diff(rot,x) == -(VA*x-(q*x^2)/2) rotSol(x) = dsolve(ode) x=0:.2:2 rot=6.66 + (10*x.^2.*(x - 3))./3 plot(x,rot) % Mechanical check of rotation in the middle of the beam opening= 0 for x=1 rotSol(x) end C1=6.66 % Determining the equation of displacement by integrating the first derivative of the rotation, respectively the second derivative of the bending moment. syms v(x)
ode=diff(v,x) == C1 + (10*x^2*(x - 3))/3 vSol(x) = dsolve(ode) x=0:.2:2 v=((5*x.^4)/6 - (10*x.^3)/3 + x.*C1 + C2) plot(x,v) for x=2 for C1=6.66 vSol(x) end end C2=0 % Determining the displacement equation by integrating the second order differential equation of the deformed axis and imposing boundary conditions on the ends of the bar for x = 0 and x = 2 syms v(x) Dv = diff(v); ode = diff(v,x,2) == -(VA*x-(q*x^2)/2) cond1 = v(0) == 0; cond2 = v(2) == 0; conds = [cond1 cond2];
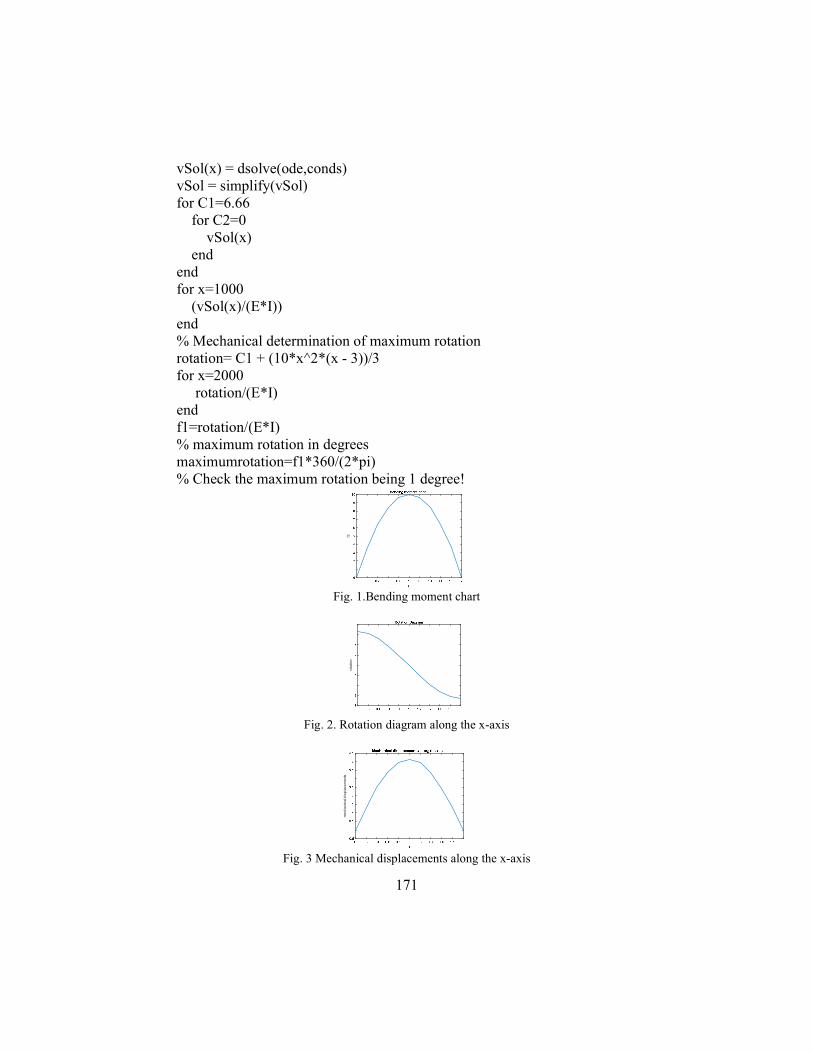
171
vSol(x) = dsolve(ode,conds) vSol = simplify(vSol) for C1=6.66 for C2=0 vSol(x) end end for x=1000 (vSol(x)/(E*I)) end % Mechanical determination of maximum rotation rotation= C1 + (10*x^2*(x - 3))/3 for x=2000 rotation/(E*I) end f1=rotation/(E*I) % maximum rotation in degrees maximumrotation=f1*360/(2*pi) % Check the maximum rotation being 1 degree!
Fig. 1.Bending moment chart
Fig. 2. Rotation diagram along the x-axis
Fig. 3 Mechanical displacements along the x-axis
f2ro
tatio
n
me
cha
nic
al d
isp
lace
me
nts

172
CONCLUSIONS
The conclusions that can be drawn from this comparative study are the following:
1. The elaboration of this program by the author represents an element of novelty, which allows solving any problem of static calculation of wooden beams, regardless of the external forces acting, the type of wood material, its mechanical-physical characteristics. The problem is easy to solve just by changing the values in the program. This feature will make the work of any engineer easier, being necessary to apply only the calculation program used.
2. As a conlusion, the „smart program” use to solve the deflections beams problem can be use in the light wood construction fields because will reduce significantly the time necessary to determine the correct values for the dimensioning of the section, its verification, the determination of the maximum displacements and rotations or in any section of the bar.
3. The practical implementation of numerical calculation methods is certainly in the future the only viable methods in quickly and accurately solving computational problems in engineering.
REFERENCES
1. Catarig A, Kopenetz L., 2001, Statica Constructiilor-Structuri Static Nedeterminate: Editura Matrix Rom, Bucuresti, pp 56-78.
2. Ciofoaia E, Curtu I, 1986, Teoria elasticitatii corpurilor izotrope si anizotrope. Reprografia Universitatii Transilvania Brasov, pp 62-66.
3. Fetea M., 2010, Calcul analitic si numeric in rezistenta materialelor. Editura Universitatii din Oradea, pp 45-49.
4. Gheorghiu H, Hadar A., 1998, Analiza structurilor din materiale izotrope si anizotrope., 1998. Editura Printech. Bucuresti.
5. Goia I, Rezistenta Materialelor, 2000. Editura Transilvania Express Brasov, pp. 38-46.
6. Ille V., 1977, Rezistenta Materialelor II. Atelierul de Multiplicare a Institutului Politehnic:470-471. Cluj-Napoca.
7. Ivan M. 1997, Statica, stabilitatea si dinamica constructiilor. Teorie si Probleme, EdituraTehnica. Bucuresti.
8. Marţian, I., Teoria elasticităţii şi plasticităţii, 1999 Lito UTCN, pp. 102-110. 9. Missir-Vlad, Ioana, Strength of Materials, 2002, Combined Static of Loading,
Editura Tehnică-Info, Chişinău. 10. Muntenu Gh, 1998, Metoda Elementelor Finite Reprografia Universitatii
Transilvania Brasov.

173
Annals of the University of Oradea, Fascicle: Environmental Protection Vol. XXXV, 2020 Analele Universităţii din Oradea, Fascicula: Protecţia Mediului Vol. XXXV, 2020
THE JUNIPER VEGETATION OF BIHOR MOUNTAINS, THE CĂPĂȚÂNA WETLAND COMPLEX. PHYTOCENOSES OF THE
ASSOCIATION PINO MUGO-SPHAGNETUM
Mateș Iosif Constantin*, Burescu Petru**
* University of Oradea Faculty of Medicine and Pharmacy, Doctoral School of Biomedical Sciences, “Piața 1 Decembrie” Square, no 10, Bihor County, Oradea, Romania e-mail:
[email protected] ** University of Oradea, Faculty of Environmental Protection, 26 Gen. Magheru St., 410048,
Oradea, Romania, e-mail: [email protected]
Abstract The phytocenoses edified by Pinus mugo are well represented in the wetland
complex from Căpățâna (springs of Someșul Rece river), with a percentage of 33.5% ADm and maximum constancy (K = V). The analysis of bioforms highlights that the highest share of plant species is made of chamaephytes (45.45%) specific to subalpine regions with frosty, snowy winters, followed by phanerophytes (27.27%), hemicryptophytes (18.18%) and therophytes (9.09%).
The spectrum of floristic elements shows the dominance of circumpolar species (63.63%), followed by alpine ones (18.18%) which include Central European-Alpine and Arctic-Alpine species, Eurasian, and European species on an equal footing (i.e. 9.09%).
The review of ecological indices indicates that in terms of humidity, the euryhydric species are dominant (45.45%), followed by mesophilic (27.27%), hygrophilic (18.18%) and meso-hygrophilic (9.09%) species. Regarding the temperature, the eurythermal (63.63%) and microthermal (36.36%) species are dominant. The chemical reaction of the soil favours the strongly acidophilic (63.63%), euryionic (27.27%) and acidophilic (9.09%) plant species.
The analysis of the genetic karyotype highlights the dominance of diploid plant species (81.81%) at a great distance from polyploid species (18.18%). The diploid index has a high value of 4.5. Key words: phytocenoses, bioforms, floristic elements, ecological indices, karyotype. INTRODUCTION
This association is very rare in Romania and gathers mountain shrubs of Pinus mugo that grow in the peatlands of Căpățâna in the form of islands on the mountain plateau, being bordered by spruces, at altitudes ranging from 1,597 m to 1,608 m, on deep peat histosols (1.5-4 m), of high acidity (pH = 3.5 - 5), permanently moist with small, drier reed bushes.
The well-represented specimens of Pinus mugo, developed in the form of clusters, reach heights ranging from 1 to 3 m, rarely reaching 4 m and

174
trunk diameters of 10-18 cm, and deciduous shrubs (Vaccinium uliginosum ssp.uliginosum) grows under the juniper bushes.
The phytocenoses of this association have been described only for Gutâi Mountains (Coldea et Plămadă, 1970) and Bihor Mountains (Pop et al., 1987; Coldea et Plămadă, 1989; Togor, 2016). MATERIAL AND METHOD
The material subjected to research consists of the very rare natural ecosystems edified by the Pinus mugo bushes in the Bihor Mountains, the wetland complex of Căpățâna (springs of Someşul Rece river). We carried out a total of 5 phytosociological surveys on the most representative phytocenoses. In the Association Table (see Table 1), we recorded all plant species found with the assessment of abundance and dominance (AD) index for each species according to (Braun-Blanquet et Pavillard, 1928) scale. The association of subalpine shrubs Pinus mugo and Sphagnum was reviewed and characterized ecologically, phyto-sociologically, cytogenetically based both on the Association Table and the histograms with reference to the distribution of bioforms, floristic elements, ecological indices and genetic karyotypes.
Finding and description of the association were carried out made based on the floristic criteria, with the help of characteristic, edifying, dominant and differential species. The name of the associations is in accordance with the ones established by the Code of Phytosociological Nomenclature developed by (Weber et al., 2000). The classification of the species in the corresponding cenotaxonomic units (i.e. subaliances, alliances, orders, classes) was made according to the ecological-floristic systems elaborated by (Tüxen, 1955), (Braun-Blanquet, 1964) and on the basis of more recent works of (Coldea et al., 1997) and (Sanda et al., 2003, 2008).
The ecological and phytosociological characterization of the species from the surveyed territory was made in accordance with the works of (Sanda et al., 2003), (Ciocârlan, 2009), and (Sârbu et al., 2013).
The information regarding the value of ecological indices, bioforms, floristic elements, number of chromosomes are presented after the synthesis works made by (Pop, 1977, 1982), (Sanda et al., 2003, 2008), (Cristea et al. 2004), (Ciocârlan, 2009), (Burescu et Toma, 2005), and (Doniţă et al., 2005).
The review of phytocenoses in terms of the influence of ecological factors such as moisture (M), temperature (T) and chemical reaction of the soil (R) were caried out according to the works of (Sanda et al., 2003) that adapted the values of ecological indices for plants in Central Europe on a
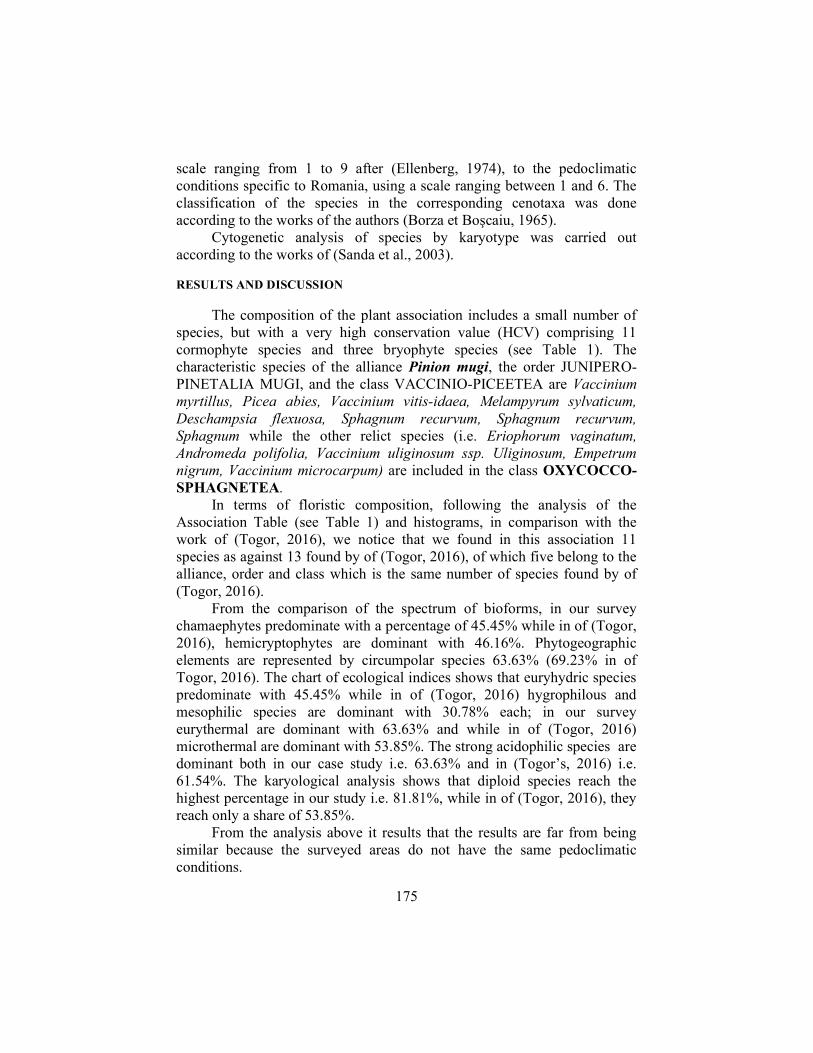
175
scale ranging from 1 to 9 after (Ellenberg, 1974), to the pedoclimatic conditions specific to Romania, using a scale ranging between 1 and 6. The classification of the species in the corresponding cenotaxa was done according to the works of the authors (Borza et Boşcaiu, 1965).
Cytogenetic analysis of species by karyotype was carried out according to the works of (Sanda et al., 2003). RESULTS AND DISCUSSION
The composition of the plant association includes a small number of species, but with a very high conservation value (HCV) comprising 11 cormophyte species and three bryophyte species (see Table 1). The characteristic species of the alliance Pinion mugi, the order JUNIPERO-PINETALIA MUGI, and the class VACCINIO-PICEETEA are Vaccinium myrtillus, Picea abies, Vaccinium vitis-idaea, Melampyrum sylvaticum, Deschampsia flexuosa, Sphagnum recurvum, Sphagnum recurvum, Sphagnum while the other relict species (i.e. Eriophorum vaginatum, Andromeda polifolia, Vaccinium uliginosum ssp. Uliginosum, Empetrum nigrum, Vaccinium microcarpum) are included in the class OXYCOCCO-SPHAGNETEA.
In terms of floristic composition, following the analysis of the Association Table (see Table 1) and histograms, in comparison with the work of (Togor, 2016), we notice that we found in this association 11 species as against 13 found by of (Togor, 2016), of which five belong to the alliance, order and class which is the same number of species found by of (Togor, 2016).
From the comparison of the spectrum of bioforms, in our survey chamaephytes predominate with a percentage of 45.45% while in of (Togor, 2016), hemicryptophytes are dominant with 46.16%. Phytogeographic elements are represented by circumpolar species 63.63% (69.23% in of Togor, 2016). The chart of ecological indices shows that euryhydric species predominate with 45.45% while in of (Togor, 2016) hygrophilous and mesophilic species are dominant with 30.78% each; in our survey eurythermal are dominant with 63.63% and while in of (Togor, 2016) microthermal are dominant with 53.85%. The strong acidophilic species are dominant both in our case study i.e. 63.63% and in (Togor’s, 2016) i.e. 61.54%. The karyological analysis shows that diploid species reach the highest percentage in our study i.e. 81.81%, while in of (Togor, 2016), they reach only a share of 53.85%.
From the analysis above it results that the results are far from being similar because the surveyed areas do not have the same pedoclimatic conditions.

176
Analysis of bioforms (see Fig.1 below) shows us that the highest chamaephytes have the highest share (45.45%) which is a specificity of to the subalpine regions with frosty, snowy winters, rich in snow, followed by phanerophytes (27.27%), hemicryptophytes (18.18 %) and therophytes (9.09%).
Fig. 1 Spectrum of bioforms in the Pino mugo-Sphagnetum association Legend: MPh = Megaphanerophytes; nPh = Nanophanerophyte; Ch =
Chamaephytes; H = Hemicryptophytes; Th = Annual therophytes.
The spectrum of floristic elements (see Fig. 2 below) highlights the dominance of circumpolar species (63.63%), followed by Alpine ones (18.18%) which include Central European-Alpine and Arctic-Alpine species, and Eurasian and European species in equal shares (9.09%).
Fig. 2. The spectrum of floristic elements in the association Pino mugo-Sphagnetum Legend: Cp = Circumpolar; Eua = Eurasian; E = European; Alp = Alpine
The chart of the ecological indices (see Fig. 3 below) indicates that in terms of humidity the dominant species are the euryhydric species (45.45%), followed by mesophiles (27.27%), hygrophiles (18.18%) and meso-hygrophiles (9.09% ). In terms of temperature, the species eurythermal (63.63%) and microthermal (36.36%) species are predominant.
18,18
9,09
45,45
18,18
9,09
0
10
20
30
40
50
MPh nPh Ch H Th
Number of species (%)
Bioforms
MPh nPhCh HTh
63,63
9,09 9,09
18,18
0
10
20
30
40
50
60
70
Cp Eua E Alp
Number of species (%)
Floristic elements
Cp Eua E Alp

177
As far as chemical reaction is concerned, the soil favours the strongly acidophilic (63.63%), euryionic (27.27%) and acidophilic (9.09%) species.
18,18
9,09 9,09
18,18
27,27
9,090
63,63
9,09
45,45
63,63
27,27
0
10
20
30
40
50
60
70
1 1,5 2 2,5 3 3,5 4 4,5 5 5,5 6 0
U T RNumber of species (%)
Ecologycal indices Fig. 3. Chart of ecological indices of the association Pino mugo-Sphagnetum
The analysis of the genetic karyotype (see Fig. 4) highlights the dominance of diploid species (81.81%) at a great distance from polyploid ones (18.18%). The diploid index has a high value of 4.5.
Fig. 4. The karyological spectrum for the association Pino mugo-Sphagnetum Legend: D = Diploid; P = Polypoid
These high value junipers are included in the habitat type: R3105
Southeast Carpathian dwarf pine bushes (Pinus mugo) in oligotrophic Sphagnum wetlands. Correspondence: NATURA 2000: 91D0* Bog woodland.; PAL.HAB: 31.562 Sphagnetum mountain pine scrub. These are rare, high conservation value habitats (HCVs) including relict species, part of the list of natural habitats of community interest which conservation
81,81
18,18
0102030405060708090
D P
Number of species(%)
Karyotype
D
P

178
Table 1 Pino mugo-Sphagnetum Kästner et Flössner 1933
Place and date of surveying: 1-5 Căpățâna wetlands, 21.07.2019 GPS 462811, 230544.7; 28.07.2019 GPS 462817.3, 230601.4; 462820.6, 230615.5; 462828.4; 230559.9; 462825.8, 230554. CONCLUSIONS
1. The association is of very high scientific importance because it includes five rare, vulnerable species, glacial relics, included in the Red Lists such as: Eriophorum vaginatum, Andromeda polifolia, Vaccinium uliginosum ssp. Uliginosum, Empetrum nigrum, Vaccinium microcarpum.
2. The phytocenoses of the association Pino mugi-Sphagnetum are dominated by chamaephytes (45.45%) specific to subalpine regions with frosty, snowy winters, followed by phanerophytes (27.27%), hemicryptophytes (18.18%) and therophytes ( 9.09%).
Biof. Fl. el M T R G
Survey no. 1 2 3 4 5
K
ADm
Altitude (mamsl) 1608 1607 1597 1602 1607 Herbaceous layer coverage (%)
80 90 40 90 90
Moss layer coverage(%)
90 80 85 60 85
Surface (sq.m.) 400 400 400 400 400
MPh Ec-Alp 0 2 0 D As. Pinus mugo 3 3 3 2 3 V 33,5
As. Sphagnum recurvum
5 4 4 3 4 V 62,5
As. Sphagnum magellanicum
+ + + + + V 0,5
As. Sphagnum fallax . . + + + III 0,3
Pinion mugi, Junipero-Pinetalia mugi, Vaccinio-Piceetea
Ch-nPh Cp 0 2 1 D Vaccinium myrtillus 3 3 + 4 3 V 35,1
MPh E 0 0 0 D Picea abies + + 1 + . IV 1,3
Ch-nPh Cp 3 2 1 D Vaccinium vitis-idaea + + + . + IV 0,4
Th Eua 3 0 1,5 D Melampyrum sylvaticum
+ + . + . III 0,3
H Cp 2 0 1 P Deschampsia flexuosa . + . . . I 0,1
Oxycocco-Sphagnetea
H Cp 4,5 0 1,5 D Eriophorum vaginatum 1 + 1 1 1 V 4,1
Ch-nPh Cp-Bo 5 2,5 1 P Andromeda polifolia + + + . + IV 0,4
Ch-nPh Cp-Bo 0 0 1 D Vaccinium uliginosum ssp.uliginosum
+ 2 + . + IV 3,8
nPh-Ch Cp-Arct
3,5 0 0 D Empetrum nigrum + + 1 . 1 IV 2,2
Ch Arct-Alp
5 0 2 D Vaccinium microcarpum
. + + + 1 IV 1,3

179
3. In terms of the geographical area of the association Pino mugo-Sphagnetum, circumpolar species are dominant (63.63%), followed by alpine species (18.18%).
4. Ecological indices show that, in terms of soil moisture, the euryhydric species are predominant (45.45%), while in relation to temperature, the eurythermal are dominant (63.63%) while as far as chemical reaction of the soil is concerned, the strongly acidophilic species dominate (63.63%).
5. In the genetic structure of the phytocenoses of the association Pino mugo-Sphagnetum, diploid species predominate (81.81%), which makes the genetic reserve for their evolution, at a great distance from polyploid species (18.18%). The diploid index has a high value of 4.5. REFERENCES
1. Borza, Al., Boşcaiu, N., 1965, Introducere în studiul covorului vegetal, Edit. Acad. R.P.R., Bucharest, 340 p.
2. Braun-Blanquet, J., (1964), Pflanzensoziologie, ed.III Springer-Verlag, Wien-New York.
3. Braun-Blanquet, J., Pavillard, G., 1928, Vocabulaire de sociologie végétale, ed.II, Imprimerie Roumegous & Dehan, Montpellier
4. Burescu, P., Toma, I., 2005, Manual de lucrări practice de botanică, Edit. Universităţii din Oradea, Oradea, 590 p.
5. Ciocârlan, V., 2009, Flora ilustrată a României: Pteridophyta et Spermatophyta, Edit. Ceres, Bucharest, 1141 p.
6. Coldea, Gh., Plămadă, E., 1970, Contribuţii la studiul clasei Scheuchzerio-Caricetea fuscae Nordh. 1936 în România (I), Hidrobiologia, Bucharest, 11:105-116
7. Coldea, Gh., Plămadă, E., 1989, Vegetaţia mlaştinilor oligotrofe din Carpaţii Româneşti (Clasa Oxycocco – Sphagnetea Br.-Bl. et Tx. 43), Contrib. Bot., Cluj-Napoca, 37-43
8. Coldea, Gh., Sanda, V., Popescu, A., Ştefan, N., 1997, Les associations végétales de Roumanie. Tome I: Les associations herbacées naturelles, Edit. Presa Universitară Clujeană, Cluj-Napoca, 261 p.
9. Cristea, V., Gafta, D., Pedrotti, F., (2004), Fitosociologie, Edit. Presa Universitară Clujeană, Cluj-Napoca, 396 p.
10. Doniţă, N., Popescu, A., Paucă-Comănescu, M., Mihăilescu, M., Biriş, I.A., (2005), Habitatele din România, Edit. Tehnică Silvică, Bucharest, 496 p.;
11. Ellenberg, H., (1974), Zeigerwerte der Gefässpflanzen Mitteleuropas, Scripta Geobotanica, Göttingen, 9:1-97
12. Pop, I., 1977, Biogeografie ecologică, vol.I., Edit. Dacia, Cluj-Napoca; 13. Pop, I., 1982, Plante spontane şi subspontane cu valoare economică din flora R.S.
România, Contrib. Bot., Cluj-Napoca, 131-142 14. Pop, I., Hodişan, I., Cristea, V., (1987), La végétation de certaines tourbières de la
Vallée Izbuc (Département de Cluj), Contrib. Bot., Cluj-Napoca, 111-120 15. Sanda, V., Biţă-Nicolae, C., Barabaş, N., 2003, Flora cormofitelor spontane şi
cultivate din România, Edit. „Ion Borcea”, Bacău, 316 p.

180
1. Sanda, V., Öllerer, K., Burescu, P., 2008, Fitocenozele din România. Sintaxonomie, structură, dinamică şi evoluţie. Edit. „Ars Docendi”, Bucharest, 570 p.
2. Sârbu, I., Ştefan, N., Oprea, A., 2013, Plante vasculare din România: Determinatoare ilustrat de teren, Edit. Victor B Victor, Bucharest, 1320 p.;
3. Togor,G.C., (2016), Flora şi vegetaţia din partea nordică a Munţilor Bihor, Teză de doctorat, Univ. din Oradea, 496 p.
4. Tüxen, R., 1955, Das System der nordwestdeutschen Pflanzengesellschaften, Mitt. Florist.-Soz. Arbeitsgem. N. F., 5:155-176
5. Weber, H.E., Moravec, J., Theurillat, J.P., 2000, International Code of Phytosociological Nomenclature, 3 ed., Journal of Vegetation Science, Uppsala, 739-768.

181
Annals of the University of Oradea, Fascicle: Environmental Protection Vol. XXXV, 2020 Analele Universităţii din Oradea, Fascicula: Protecţia Mediului Vol. XXXV, 2020
RESEARCH ON 4636 FOREST ECOSYSTEM TYPE SESSIL OAK-EUROPEAN BEECH MIXED STAND WITH FESTUCA DRIMEJA
(REGIONAL VERSION WITH COMMON HORNBEAN AND TURKEY OAK) WITHIN THE SEGMENT OF LANDSCAPE SITUATED ON
LOW WESTERN HILLS OF TINCA FOREST DISTRICT
Moţiu Petrică Tudor*
* University of Oradea, Faculty of Environmental Protection, 26 Gen. Magheru St., 410048, Oradea, Romania, e-mail: [email protected]
Abstract
Forest typology evolved from the necessity of differentiating management measures of the forests according to composition, structure, productivity, features of the stands, i.e. after their eco-systemic features (Doniță et al., 1990). Key words: forest ecosystems, geographical segment landscape, forest typology, sustainable forestry.
INTRODUCTION
The researches were made in Crisul Negru Plain and Tasadului Hills, the forests belonging to Tinca Forest Office. The area is situated in the south-western part of Bihor county and the relief in characterised by plains and small hills (up to 300 m).
The Low Hills, situated in the south western part of the study area, have average altitudes of 200-300 m, have reduced vertical fragmentation, with flat or slightly curved interfluves, elongated slopes and mid values inclinations. The valleys are rare, the clay deposits conditioning the formation of heavy soils, and on slopes the clay-loam deposits, with alternation of sand and gravel deposits, conditioning the formation of normal hydric soils.
The relief is fragmented by valleys, the slopes being the main relief form, but also extended plateaus. On slopes, the sedimentary formations of sand, loam, clay, gravel, caused the formation of basic stagnic luvisols, at most mid basic, with a well-balanced hydric regime and on few areas eutricambosoils, more fertile and with a well-balanced hydric regime.
The aim of the study was to establish the main forest ecosystem type within Tinca Forest District and to establish the state of these ecosystems to find the best management solution for a sustainable use, preserving and conserving the optimum biodiversity of the forest. The aim of the research

182
was also the scientific fundamentation, very useful both in forest management and in applied forestry, in order to find the best management solutions for a sustainable use. The soil indicators, herbaceous and shrub layer is consisted of: Festuca drymeja, Carex pilosa, Dactylis polygama, Melica uniflora, Asperula-Asarum-Stellaria. These types characterize stationary low-hill ecosystems where there are also soils with higher trophic levels, with balanced hydric regime, due to richer precipitation and permeable soils. Also, in the western low hills we meet: Genista-Festuca heterophylla type. This characterizes the ecosystems on acid soils, with more a reduced trophic level, and with a quasi-balanced water hydric regime alternating on the profile. MATERIAL AND METHOD
The locations of the research are the forests administrated by Tinca Forest District; the study has started in 2019 and continued in 2020.
The establishment of typological units (types of ecosystems) was made using the method of synthetic systemic indicators evaluating phytocoenosis, climate indicator forest plants and edaphic conditions: acidity, humidity, humus content, compactness. The use of phyto indicators is based on the principles of modern ecology according to which the plants, as primary producers and the phytocoenosis which they make up, exactly reflects not only the complex abiotic ecological factors, decisive for forest biocoenosis but also the nature and the functionality of these biocoenosises which finally represents the productivity of the forest ecosystem.
The forest ecosystems were analysed according to location within the study area; the features of the ecosystem type: surface area, geographical parameters (average altitude, altitude range); relief forms: types, inclination of the slopes, slope exposition, lithology, soil types and subtypes, ecological limitative factors); the description of the stands, the description of the herbaceous layer; the correspondence with: types of forests, types of stations, plant associations, types of habitat, present state of the stands and management measures (particularities): main features, distribution according to age classes, the source of main elements, natural regeneration, productivity classes, management measures, variability and succession tendency (forms of type, successional tendencies and forest facies).
The description of the forest ecosystem was made based on collected field data. In order to analyse the collected data were used different softwares, such as Excel, ArcGis.
After determining the types, they were mapped by researching all the planning units and classifying them into types, taking into account the composition of the trees, the type of grass-subshrub layer, the type of

183
humus. (Moțiu et al., 2011; Moțiu et al., 2012). The delimitation method of the forest ecosystems had as base some typological schemes made for the study area (for ex forest corps) (Moțiu et al., 2011; Moțiu et al., 2012). The landscaping units with non-native species cultures were classified into types based on the type of resort. RESULTS AND DISSCUSIONS TYPE OF ECOSYSTEM: 4636 Highly and medium productive European Beech with sessile oak, with moder (mull-moder), on oligomezobasic, hydric balanced brown luvic soils and luvisols, with Festuca drymeja (regional variant with hornbeam and Quercus cerris). Subtypes: 46361 highly productive subtype; 46362 middle productive subtype. Spreading: this type of ecosystem is widespread on the low hills, in: U.P.III - Trup Între Pâraie, Trup Gânței; U.P.IV - Trup Miheleu - Topile, Trup Valea Mare, Trup Holod - Hodiș; U.P. V - Trup Măgura. Characteristics of the type of ecosystem within the researched area:
a. Occupied area: 115,7 ha. b. Resorts:
- average altitude 215 m (variation difference 170-270 m); - relief: by shape - middle and lower slope; after inclination - moderate and strong slopes; after the exhibition - especially on shady slopes and a little on partly sunny or sunny; - rock: sands alternating with sandy clays; - types and subtypes of soil: Typical and stagnant Luvisol, Typical and mollic Eutricambosoil; - limiting ecological factors: in some situations soil with medium edaphic volume and medium trophicity; the lower slopes are an exception, where the edaphic volume is higher, the soil moisture regime is balanced and the soil trophicity is increased. Among the limiting factors we also mention the lack of heat in the soil in the winter season. c. The composition of the stands: in the dominant floor Quercus
petraea ssp. polycarpa and Fagus sylvatica (in various proportions), sometimes even Carpinus betulus; in some cases we find Quercus cerris (disseminated or in proportion of facies) and Prunus avium (in rare cases); in the dominant floor we find Carpinus betulus with variable coverage, of 5% - 50% of the surface, competes and endangers the main basic species. In some situations it can be encountered, with reduced frequency Pyrus pyraster.

184
d. The composition of the subshrubs: Crataegus monogyna, Rubus hirtus, Ligustrum vulgare; Cornus sanguinea and Rosa canina may occur with reduced frequency. Shrubs are generally poorly developed and spread unevenly, depending on the shading of the hornbeam subfloor, with coverage of up to 5% of the surface. Carpinus betulus it is also present in the subshrub, with coverage of 5% - 10% of the surface. The subshrub is poorly developed, with coverage of up to 10% of the surface, depending on the degree of illumination.
e. The composition of the herbaceous layer: Festuca drymeja, Carex pilosa, Dactylis polygama, Melica uniflora, Cruciata glabra, Stellaria holostea, G. schultesii, Geranium robertianum, Mycelis muralis, Viola reichenbachiana, Pulmonaria officinalis, Dentaria bulbifera, D. glandulosa, Stachys sylvatica, Circaea lutetiana, Anemone nemorosa, Carex sylvatica, C. digitata, Fragaria vesca. In some situations may be encountered: Stellaria graminea, Cruciata laevipes, Scrophularia nodosa, Urtica dioica, Brachypodium sylvaticum, Galium molugo, Potentilla micrantha, Veronica officinalis, V. chamaedrys, Carex praecox, Hypericum perforatum. Among the subshrub species can be found: Genista tinctoria, Cytisus nigricans, Chamaecytisus hirsutus and Vinca minor. The grass layer is unevenly developed, in patches, depending on the degree of shading, with coverage of 10% - 30% of the surface. Correspondence with:
- forest types: 5231 – sessile - beech with Festuca drymeja (m); 5311 – sessile oak – forests with beech of higher productivity (situations without lime); 5313 - sessile oak - forests with beech of average productivity (m) (situations without lime); - resort types: 6.9.1.1. - Hilly mixed oak stand with lower limit beeches Pm, luvisols, including whitish luvisols (± hipostagnic), medium edaphic; 6.9.1.2. - Hilly mixed oak stand with lower limit beeches Pm, luvisols, including whitish luvisols (± hipostagnic), highly edaphic; - plant associations: -; - habitat type: R4129 - Dacian oak forests (Quercus petraea) and beech (Fagus sylvatica) with Festuca drymeja.
The current state of the stands and management measures (particularities):
f. The structure of the trees: in figure 6.14 is presented, the distribution of the number of trees by diameter categories, and in figure 6.15, the vertical and horizontal structure of a representative tree inventoried in the u.a. 93E, U.P.IV. The composition of the stand: 6Fa 4Go disCa, age

185
105 years, number of trees per hectare: beech - 180, sessile oak - 108, hornbeam - 16.
Fig. 1 The distribution of tree numbers per hectar in stand, according to diameter cathegories and species in u.a. 93E, U.P.IV Topile area
Legend:
Fagus sylvatica Quercus petraea Carpinus betulus Fig. 2 The diagram of vertical structure (left) and plan projection of the
canopy (right) for test plot of 2500 sqm, using SVS software, 3.36 version, in u.a. 93E, U.P.IV Topile area
0
10
20
30
40
50
18 20 22 24 26 28 30 32 34 36 38 40 42 44 46 48 50 52 54 56 58 60 62 64
Nu
mb
er o
f tr
ees
pe
r h
ect
are
Diameter categories (cm)Quercus petraea Fagus sylvatica
186
Photo 1: Sessile oak and European beech mixed stand with Festuca
drymeja, u.a. 93E, U.P.IV Topile area (photo - P.T. Moțiu) g. Distribution by age range: 5-10 years - 3%; 21-40 years - 1%;
41-80 years - 51%; over 81 years - 45%. h. The origin of the main elements of the tree: sessile oak - natural
sowing 58%, sprout 34%, plantation 8%; beech - natural sowing 96%, sprout 4%; hornbeam - natural sowing 43%, sprout 57%.
i. Production class of the main tree elements: Sessile oak cl II/III; Beech cl III/IV; Hornbeam cl II 25,6%; Hornbeam cl III 34,3%; Hornbeam cl III/IV.
j. Natural regeneration: sessile oak regenerates well, beech regenerates very well, the hornbeam abundantly; the sessile oak encounters difficulties from the hornbeam and beech seed.
k. The indicated target composition: 5Go 2Fa 2Pam,Ci, Fr 1Ca. l. Age management measures: 0-5 years - clearing of natural
regenerations and / or plantations through works carried out on time and with perseverance on age ranges; 6-10 years - promoting vigorous sessile oak and beech specimens, as well as valuable well-formed mixed species, by applying clearances. It is mandatory to maintain the auxiliary species (rowanberries, hornbeam) to create a subfloor; 11-20 years - proportion of the mixture according to the fixed target composition, by cleaning, maintaining valuable specimens of sessile oak, mixed and auxiliary species;
187
21-40 years - designation of future trees (derived from seed) from the main basic species - sessile oak and beech (derived from seed) and from the main mixed species (mountain maple, field maple) and their promotion by combined thinning; 41-80 years - continuing to promote the future trees, through combined thinning around them, keeping the rest of the massif closed; over 80 years applying hygiene and preparatory cuts. Recommended treatment: progressive cuts.
m. Other management measures: introduction of mixed species (mountain maple) and secondary species (auxiliary) (preferably rowanberries) into the composition of the tree. Keeping the structure of the stands vertically closed. Shrubs from sprouts will be converted gradually, as much as possible by natural regeneration (if the tree is at the age of fruiting) or by restoration. It is recommended to increase the proportion of participation of sessile oak in the composition of trees through plantations in addition to natural regenerations; to control beech and hornbeam, to extract in time (before fruiting) the aspen and the willow, species that tend to eliminate sessile oak and other mixed species. In places with greater abundance of the sub floor and the sub-tree level, the works to help the natural regeneration in the years with abundant fruiting of the sessile oak are mandatory.
It is also recommended to reconstruct the fundamental natural type of forest ecosystem, in the case of stands partially derived with hornbeam by substitution.
n. Variability and successive tendencies (forms of the type, successive tendencies and silvofacies): in the researched territory we meet the geographical variant with hornbeam; within it we distinguish: the situation (form) with dry soils – wet in the summer season (form with less hornbeam) and the situation (form) with loose soils, wet – damp in the summer season, in the upper horizons with glomerular structure and mull type humus (the form with more hornbeam) with Eutricambosoil soil type.
Within this type of forest ecosystem, the natural tendency is to eliminate the sessile oak by beech and hornbeam, producing the succession to beech-hornbeam; in some situations the hornbeam achieves proportions of 70 - 80% in the composition of the stands, tending to eliminate the beech, leading the succession to the hornbeams by substitution.
o. Other type-specific features: the main basic species, sessile oak and beech, but also hornbeam, can achieve the second class of production, differentiating within this type of forest ecosystem and a highly productive subtype.
Artificial sowings are missing and the plantations are few (1.3 ha with sessile oak, 0.7 ha with mountain maple and 0.3 ha with oak), so the

188
man intervened a little with artificial regenerations, moreover just directed the natural regeneration.
The hornbeam, sometimes also the Quercus cerris - on sunny and partially sunny slopes, makes facies within the type, determining the regional variant of the type.
CONCLUSIONS
Knowing the physical-geographical conditions of the territory in which researches were carried out, are important for knowing the ecological complex of factors and determinants of the forest ecosystem biotope (forestry resort) (Chiriţă et al., 1964; Chiriţă et al., 1977). Therefore, it is evident that the regional variants of forest ecosystem types arise due to the influence of regional variants of climate and soil – paedogenetic sub-layers. The identification and description of types of forest ecosystems on smaller geographical units, from the level of landscapes (landschaft), in order to establish the ecological specificity within a certain territorial unit and the establishment of some sustainable management measures, gives the forest typology a strong regional feature (Doniță, 2004).
That is why we tried, as the research of this paper to establish ecosystem-based forest type principal existing in a territory smaller but representative low western hills within Tinca Forest District, to state the current status of types and propose appropriate management measures, designed to bring a type similar to the natural state.
In this type of forest ecosystem, the core constant species consists of: Fagus sylvatica, Carpinus betulus, Rubus hirtus, Festuca drymeja, Lamium galeobdolon, Galium odoratum, Anemone nemorosa, Asarum europaeum, Dryopteris filix-mas.
Main proposals for forest management on the composition of the investigated stands:
- Increasing proportions of sessile oak in the regeneration from European beech-sessile oak mixed stands up to 40%.
- Maintaining hornbeam in the mixture, wherever presented in proportions of at least 30%.
Regarding forestry measures by type of forest culture have revealed that there were concerns relating to differentiating normal types but not the present state of the as result of more or less proper management methods. Forester practitioner is forced to differentiate based on this action and the current state of forest types that manages them. REFERENCES 1. Beldie Al., Chiriţă C., 1967, Flora indicatoare din pădurile noastre. Editura Agro-
silvică, Bucureşti. 2. Ciocârlan, V., 2000, Flora ilustrată a României. Editura Ceres, București.

189
3. Chiriţă C., Tufescu V., Beldie Al., Ceucă G., Haring P., Stănescu V., Toma G., Tomescu Aurora, Vlad I., 1964, Fundamentele naturalistice şi metodologice ale tipologiei şi cartării staţionale forestiere, Editura Academiei, Bucureşti.
4. Chiriţă C., Vlad I., Păunescu C., Pătrășcoiu N., Roșu C., Iancu I., 1977, Staţiuni forestiere, Editura Academiei R.S.R., Bucureşti, p. 518.
5. Cristea, V., Gafta, D., Pedrotti, F. 2004, Fitosociologie, Editura Universitară Clujeană, ClujNapoca.
6. Dănescu F., Costăchescu C., Drăgan Dorina, 2010, Corelarea Sistemului român de clasificare a solurilor cu (SRCS, 1980) cu Sistemul român de taxonomie a solurilor (SRTS, 2003), Editura Silvică, București p. 80.
7. Dănescu F., Costăchescu C., Mihăilă Elena, 2010, Sistematica stațiunilor forestiere, Editura Silvică, București, p. 253.
8. Doniţă N., 2004, Tipologia forestieră integrată şi sarcini de viitor ale tipologiei forestiere în România, Revista Pădurilor, No. 2/2004.
9. Doniță N., Chiriță C., Stănescu V. et al., 1990, Tipuri de ecosisteme forestiere din România, C.M.D.P.A., I.C.A.S., București.
10. Doniţă N., Popescu A., Păucă-Comănescu Mihaela, Mihăilescu Simona, Biriş I., 2005, Habitatele din România, Editura Tehnică Silvică, Bucureşti.
11. Doniţă N., Borlea F., Turcu D., 2006, Cultura pădurilor. Editura Eurobit, Timişoara, p. 367.
12. Florescu I., Nicolescu N., 1996, Silvicultura, Vol. I, Studiul pădurii, Editura Lux Libris, Braşov, p. 210.
13. Florea, N., Munteanu, I., 2003, Sistemul român de taxonomie a solurilor (SRTS), Editura Esfalia, București.
14. Florescu I., Nicolescu N., 1998, Silvicultura, Vol. II, Silvotehnica, Editura Universităţii Transilvania din Braşov, p. 194.
15. Giurgiu V., 2004, Probleme actuale ale tipologiei forestiere Româneşti, RevistaPădurilor, No. 2/2004.
16. Mc.Gaughey, Robert J., 1999, Stand Vizualisation System (SVS vers. 3.36). USDA Forest Service, Pacific Northwest Research Station.
17. Moţiu P.T., 2004, Caracteristici dendrometrice ale unor specii alohtone cultivate în O.S. Tinca, Jud. Bihor, Analele Universităţii din Oradea, Fascicula Silvicultură, pp. 135-144.
18. Motiu P.T., Bartha Sz., 2006, Progresive clear-strip felling simplified in total regeneration stand, The 4thInternatinal Symposium „Natural resources and sustainable development”, Annals of the University of Oradea, Forestry Fascicula, University of Oradea Printing House, pp. 407-410.
19. Moțiu, P.T., 2011, Typological research of forest ecosystems from Crișul Negru Plain and Hills of Tăşad. „Risk Factors for Environment and Food Safety”. EdituraUniversităţii din Oradea, pg. 580 -588.
20. Moțiu P.T., 2011. Contributions to sustainable management measures, based on the type of forests from Crișul Negru Plain and Hills of Tăşad. „Risk Factors for Environment and Food Safety”. EdituraUniversităţii din Oradea, pg. 589 - 598.
21. Moțiu P.T., Bucur L., Nistor S., 2011, Contribution to the typological substantiation of the forestry using gis tools in Crișul Negru plain and Tășadului Hills, “Risk Factors for Environment and Food Safety”, Annals of the University of Oradea, Forestry Fascicula, University of Oradea Printing House, pp. 572-579.
22. Moțiu P.T., Bucur L., Nistor S., 2012, Researches on types of forest ecosystems in the Crisul Negru Low Plain, „Risk Factors for Environment and Food Safety”, Annals of the University of Oradea, Forestry Fascicula, University of Oradea Printing House, pp. 516-529.

190
23. Moțiu P.T., Bucur L., Nistor S., 2012, The methodology of elaboration researches regarding typology studies and typological mapping of forest ecosystems in Crisul Negru Plain and Tasadului Hills, „Risk Factors for Environment and Food Safety”, Annals of the University of Oradea, Forestry Fascicula, University of Oradea Printing House, pp. 507-516.
24. Moțiu P.T., Bucur L., Nistor S., 2013, Research on 5225 forest ecosystem type sessil oak with common hornbeam with Carex pilosa within the segment of landscape situated on low hills of Tinca forest district. „Risk Factors for Environment and Food Safety”. EdituraUniversităţii din Oradea, p. 453 - 462.
25. Motiu P. T., Bucur L., Nistor S., 2013, Research on 7214 forest ecosystem type turkey oak with common hornbeam with Arum-Brachypodium within the segment of landscape situated on high plain of Tinca forest district. „Risk Factors for Environment and Food Safety”. EdituraUniversităţii din Oradea, p. 463 - 472.
26. Motiu P. T., 2014, Research of the Main Types of Forest Ecosystems on the West Crişana Low Hills. „Risk Factors for Environment and Food Safety”. EdituraUniversităţii din Oradea, p. 503 - 508.
27. Motiu P. T., 2015, Research of the Main Types of Forest Ecosystems on the West Crişana Piedmont Plain. „Risk Factors for Environment and Food Safety”. EdituraUniversităţii din Oradea, p. 325 - 332.
28. Motiu P. T., 2016, The importance of knowing geology and geomorphology of a territory regarding typological research on geographical landscape segments. Editura Universităţii din Oradea, p. 437 - 444.
29. Motiu P. T., 2017. Research on 4236 forest ecosystem type european beech stand with Festuca drymeja within the segment of landscape situated on low western hills of Tinca forest district. „Risk Factors for Environment and Food Safety”. Editura Universităţii din Oradea, p. 203 - 210.
30. Motiu P. T., 2018. Research on 5535 forest ecosystem type sessil oak-turkey oak-hungarian oak mixed stand with Genista-Festuca heterophylla (regional version on stagnic luvosoles) within the segment of landscape situated on low western hills of Tinca forest district. „Risk Factors for Environment and Food Safety”. Editura Universităţii din Oradea, p. 135 - 144.
31. Research on 7135 forest ecosystem type turkey oak with Genista - Festuca heterophylla (regional version with common oak - sessil oak - hungarian oak mixed stand) within the segment of landscape situated on high plain of Tinca forest district, p. 147 -156.
32. Paşcovschi S., Leandru V., 1958, Tipuri de pădure din R.P.R., Editura Agro-Silvică, Bucureşti.
33. Paşcovschi S., Avram C., Constantinescu N., Petrescu L., Popa G., 1964, Complexe de măsuri silvotehnice pentru tipuri de pădure din Republica Populară Română, Editura Agro-Silvică, București.
34. Târziu D.R., 2006, Pedologie și stațiuni forestiere, Editura Silvodel, Brașov. 35. Târziu D., Spârchez G., Dincă L., 2004, Solurile României, Editura „Pentruviață”. 36. * * *, 1999, Amenajamentul O. S. Tinca - Studiul general, Bucureşti. 37. * * *, 2004, La typologie des stations forestières. Inventaire Forstier National. 38. * * *, 2007, Amenajamentul O. S. Tinca - Studiul general, Bucureşti.

191
Annals of the University of Oradea, Fascicle: Environmental Protection Vol. XXXV, 2020 Analele Universităţii din Oradea, Fascicula: Protecţia Mediului Vol. XXXV, 2020
FOREST EDUCATION PROGRAMMES PROPOSED BY THE FOREST
NATIONAL ADMINISTRATION-ROMSILVA IN PARTNERSHIP WITH SPECIALIZED UNIVERSITIES AND OTHER STAKEHOLDERS
(Ist PART)
Seghedin Georgeta *, Timofte Adrian Ioan **
*National Forest Administration-Romsilva, str. Petricani, nr.9A, București, România, e-mail:
[email protected] **University of Oradea, Faculty of Environmental Protection, 26 Gen. Magheru St., 410048
Oradea;Romania, e-mail:[email protected] Abstract
The paper addresses forest education programmes proposed by the Forest Nationa Administration-Romsilva (FNA- Romsilva) in the context of the increasingly acute loss of biodiversity in all forms (genetic, ecosystemic, habitats and landscapes) by promoting the acquisition of a national forest consciousness. Key words: forest education, awareness, sustainable management, standing crop, biodiversity, target group INTRODUCTION
Given the current pressure of various non-governmental organizations on the loss of biodiversity in general and forests in particular, corroborated with the general public's misunderstanding of how forests are managed (some of which benefited after the 1990s of the laws of abusive forest restitution, not understanding that the momentary benefits offered by the wood from the forest affect its entire ecosystem in the future), the National Forest Administration (NFA) - Romsilva aims to enter into partnerships with stakeholders from academia, pre- university education and various environmental NGOs in order to develop educational programs for all age groups, in order to acquire a long-term forest awareness.
The general purpose of these programs is: to promote the specific activity of NFA-Romsilva (the only administrator of the state forest fund - 48% of all forests in Romania) and the role of forestry staff in ensuring the continuity and sustainable management of the national forest fund.
The activities proposed within the programs have the role of information, raising awareness of the public of various age groups - transferring knowledge to all social and professional categories, focusing on: the role,

192
functions and importance of Romania's forests, on the ways in which each citizen can benefit and contribute to their conservation and growth.
The general objectives pursued in the elaboration of the educational programs are: (O1.) the transmission of the information in order to acquire knowledge about the forest and the way of its administration; (O2.) forming a proactive attitude towards the forest as an ecosystem and developing a responsible attitude of civil society towards the environment; (O3.) carrying out practical indoor and outdoor activities to set the knowledge and develop the skills of the target audience.
MATERIAL AND METHODS
In order to develop these programs together with the above- mentioned stakeholders, it was necessary to plan and carry out some steps. These consisted in:
- identifying the partners with relevant results in the field of environmental education, from the following areas of the civil society: school environment (forestry colleges), academia (Transilvania University of Brașov, “Ștefan cel Mare” University of Suceava; University of Oradea; University of Craiova), NGOs (WWF, Propark, Ecoassist, etc.) ;
- concluding partnership agreements and elaborating, in collaboration with partners, long-term educational programs, with the establishment of the topics to be developed. The main topics addressed are: what is the forest?, the role and functions of the forest, sustainable forest management and the role of the forester, established forestry techniques (care and management of stands, treatments), forest regeneration, stages of forest development, forest nursery - forest seedling reservoir, biodiversity conservation (virgin and quasi-virgin forests, protected natural areas, Natura 2000 sites);
- organizing four working meetings with the stakeholders and the working group set up at the level of Forest Administration on the forestry education direction. Once the educational programs have been developed, they must be implemented. The following steps will be considered as a working methodology:
- training of the personnel within the forestry directorates that co-operate with the target groups related to each educational program;
- concluding partnerships with school inspectorates/schools/ children's palaces, museums, local authorities, NGOs, etc .;

193
- drawing up a calendar of activities; contacting target groups; ensuring the logistics related to the activities (necessary facilities, transport, audio-video equipment, etc.);
- preparation of teaching materials (power-point presentations, short videos, cartoons, colorful images, stories, riddles, curiosities, etc.) in addition to the existing ones (e.g. Ecological education manual from Lunca Muresului National Park (N.P.) (www.luncamuresului.ro ) and from Piatra Craiului N.P. (www.pcrai.ro), the Forest Education Manual elaborated by Vânători-Neamț N.P. (https://vanatoripark.ro/) etc.); presentations, conferences and Q&A sessions on various topics, interactive games, contests, hobby and craft workshops, book presentations, documentaries, debate sessions and other indoor activities; excursions on thematic routes, guided field visits to various objectives (trout farms, pheasant farms, plantations, stands, nurseries), practical demonstrations (how to plant a tree, how to exploit it), interactive actions, team games, competitions, workshops, summer schools, educational camps, therapeutic bathing in the forest (forest bathing) etc. and other outdoor activities;
- involvement in field volunteering actions with forestry specialists; monitoring the quantifiable results from both a quantitative (number of activities, meetings, etc.), and qualitative point of view (feedback questionnaires, development of partner network);
- dissemination of the results in the local media and in social networks, as well as the allocation of a budget at the level of forestry directorates in order to implement forestry-educational activities.
Following the organization of the four working meetings by NFA-Romsilva with all the interested parties mentioned above and the consultation with them, the internal working group set up at the level of NFA-Romsilva on forest education proposed the implementation of the following educational programs: Programme 1 - Little friends of the forest (addressed to the target group - kindergarten children); Programme 2 - Let's get to know the forest! (target group – primary school pupils, grades 0-IV); Programme 3 - Discover the universe of the forest! (target group – gymnasium pupils, grades V-VIII); Programme 4 - Be active in the forest! (target group – highschool students, grades IX-XII);

194
Programme 5 - Be trained in the forestry field too! (target group - non-forestry students); Programme 6 - Empowering local communities with forest (target group - local communities / forest owners); Programme 7 - Raising awareness of forest-free local communities on the role and importance of the forests (target group - forest-free local communities). RESULTS AND DISCUSSIONS
The desired results from the application of these programs are: Training the future generations to know general notions about forestry and
to understand the role of the forester in ensuring the continuity of the forest;
Promoting the forestry professions; Involvement and support of local communities (NFA-Romsilva = reliable
partner). The structure of an educational program is given below:
• Programme: Px • Target group: ............ • The objective: ......... • General skills:
- P1-P5: learning, informing, skills and competences, raising awareness, involvement, curiosity;
- P6: informing, creating awareness, change of attitude and responsibility for the values and natural resources held.
- P7: raising awareness within the forest-free local communities with real possibilities (available land, support and openness from local authorities) on the importance, role and management of the forest (forest vegetation outside the forest fund.)
Planning of activities and result quantification Allocated budget/Financing • Secondary skills: What to do? What to feel? What to know? • Allocated time: from 25 minutes- • Topics 1, 2, 3 ,,,,,,,
• Objectives: 1, 2, 3 ..... • Examples of activities:
• Identifying the human resources needed to implement Px and establishing the responsibilities
• Locations of Px. Identification of pilot areas for implementation

195
• Teaching methods and materials used • Establishing the messages to be transmitted to each target group category.
One of the educational programs addressed to high school students is presented in detail below (Seghedin, 2019). Name of the program: P4 - Be active in the forest! (presentation of the Romanian Academy at the International Symposium - Forests and Education. The activity of foresters in the development and defense of forests - a means of education in the spirit of respect for the forest, 2019, Bucharest) Target group: high school students (IX-XII) mature enough to get involved and participate in volunteering activities specific to forestry, to be correctly informed and to promote fair forest values on social networks, and where they have uncertainties about information in the online / media environment, to ask certain questions and to know where to look for the correct information. Main competencies: learning, informing, skills, raising awareness, involvement, curiosity.
Table 1 Secondary competences
Secondary competences What to know? What to do? - the role and functions of the forest; what is a trophic network; - forest regeneration, how a forest is formed; - elementary forestry techniques (exploitation, regeneration, care works); forest nursery - reservoir of seedlings for the forest; - the role of the forester in the sustainable management of the forest; - recognition of forestry professions (forester, forest technician, forestry engineer); - the importance of forest protection, conservation and continuity; - types of forests and their geographical distribution, the succession of forest vegetation; the history of the forests in the area; - biotic and abiotic factors that intervene in the forest life
To spend more time in nature / forest, to get involved and participate more in forestry volunteer actions, in communication sessions, to become a volunteer forester / ranger for a day, to know how to plant correctly. To correctly promote forest values on social networks, and where there are uncertainties on the information in the online / media environment, to take an attitude, to ask questions and to know where to look for the correct information.
Allocated time: maximum 40 minutes for actions that take place in the classroom (presentations, games, trips). Examples of activities: thematic camps (3 days), summer schools, competitions. For example, in the program called FORESTER FOR A DAY! the following actions will be considered: - explanation of some basic notions of forest orientation, how to organize a forest district (F.D.), - explaining the content of forest management maps, the conventional signs on the map and their materialization in the field (limits of F.D., plots, subplots, boundaries, etc.). - practical demonstrations with the direct involvement of students: how to plant, species recognition, species assessment and inventory, - detection of pests / other causes leading to tree disease, - food administration to species of hunting interest, - plantation maintenance and natural regeneration, - inventory of standing and rough converted wood, etc. At the end of the day, the students will exchange impressions and be awarded with a diploma Forester for a day! - signed by the director of the F.D. (forestry directorate). The students can also be easily co-opted in the sanitation and reconditioning of the tourist routes, through which they will interact directly with the forest, taking responsibility for it. The programme CLEAN FOREST! - 1 day - consists in sanitation and reconditioning / arranging tourist routes; volunteer rangers patrols for a day, afforestation actions Other activities: monitoring the bark beetles, medicinal herbs workshops, etc.

196
One of the programmes carried out by NFA-Romsilva since 2011, is the international competition -Young People in European Forests (YPEF). This is the most important interactive forestry education competition in Europe. (http://www.ypef.eu/, www.rosilva.ro), whose main objective is to raise awareness and educate the young generation on Europe's natural heritage, biodiversity conservation and sustainable forest management. In Romania, the contest is organized under the patronage of NFA - Romsilva in collaboration with the Ministry of National Education and is addressed to high school students aged 14-19. The competition involves indoor and outdoor activities, orienteering, reading a map, species recognition, treasure hunting, measuring a tree using a stick of a certain length, cubing a tree, etc.
It takes place in teams of three students and has three stages: at county (organized at the headquarters of forestry departments), national (organized at one of the national or natural parks managed by NFA-Romsilva) and European level. The winning team at the national level will take part in the European contest which is usually organized in one of the European Union countries participating in this competition. More details can be found on the page www.rosilva.ro and on the facebook page of the YPEF contest at www.facebook.com/Concursul-International-YPEF-Tineri-in-padurile-Europei.
CONCLUSIONS
Given the great popularity of the implementation of the program - Youth in the forests of Europe since 2011 to date by NFA-Romsilva, in conjunction with other educational activities implemented over time, it was found that young people show involvement, curiosity in acquiring new knowledge in the forestry field. It can be concluded that the future implementation of these educational programs can only have a positive impact on the acquisition of a long-term forest awareness.
REFERENCES
1. Seghedin G., 2019, Programe de educație forestieră elaborate de RNP-Romsilva, paper presented within the International Symposium“Forests and Education. The activity of foresters in the development and defense of forests - a means of education in the spirit of respect for the forest”, Romanian Academy, Bucharest
2. https://www.facebook.com/silviu.geana/posts/2106189966126116 3. www.luncamuresului.ro 4. www.pcrai.ro 5. www.rosilva.ro 6. https://www.turnulsfatului.ro/2019/03/21/simpozion-international-dedicat-silviculturii-si-educatiei-
forestiere-de-ziua-internationala-a-padurilor-137030 7. https://vanatoripark.ro 8. www.ypef.eu

197
Annals of the University of Oradea, Fascicle: Environmental Protection Vol. XXXV, 2020 Analele Universităţii din Oradea, Fascicula: Protecţia Mediului Vol. XXXV, 2020
CONSTRUCTION INDUSTRY: ENTREPRENEURSHIP, CIRCULAR ECONOMY AND ENVIRONMENT PROTECTION.
CASE STUDY OF ROMANIAN MOUNTAINS AREA
Covaci Brîndușa *
*Centre for Mountain Economy of the Romanian Academy – National Institute of Economic Research, Calea 13 Septembrie 13, Bucharest, Romania, e-mail: [email protected]
Abstract
The article analyzes the construction sector in the Romanian mountains area and in the North-East region of Romania, in order to offer solid solutions for functional growth, especially through the circular economy applied in environment protection desiderata. According to EU statistics, the construction sector is among the emergent industries and creates one of the largest numbers of jobs at the Community level. In the Romanian mountains area and in the North-East region of Romania, this sector can be developed, because the main purpose of the Romanian emigrants is to be given abroad to the works and main goal of returning home is to build a house. In general, home constructions are an urgent necessity, but many times homes are oversized and it is difficult to achieve the goal. Thus, this sector is being investigated in sustainable growth and continues to increase because the Romanian emigrants to various countries of the world will not come home before succeed in completing the main purpose for working abroad in difficult conditions and away from family, friends, etc., respectively building their own home. The circular economy applied in the construction sector is directly connected by the environment protection, and the growth of the entrepreneurship must be analyzed through business demography indices. Key words: correlation, climate-yield, irrigation, de Martonne aridity index wheat, crop rotation
INTRODUCTION
The circular economy is applied for environment protection and based on several principles, which are applicable throughout the economy, but especially in the industry and especially in the construction sector. This branch of industry - construction - present interest for this paper because, based on statistical data, the author considers that it is one of the solutions to revive the economy of Romanian mountains area and North-East region.
The circular economy involves the transition from linear thinking models to circular models. This can be achieved by applying the principles of the circular economy, which are also applicable in construction, respectively: waste is a raw material, diversity is power, energy must come from renewable sources, and system-level thinking. In order to have a sustainable development, entrepreneurship, especially in construction sector, should apply the principles of the circular economy. (Driga and Lafuente, 2009)
As Nasi et. all (Nasi et. all, 2018, 22) postulates, ”in the last decades, green and sustainable supply chain management practices have been

198
developed, trying to reduce the negative consequences of production and consumption processes on the environment. In parallel to this, the circular economy discourse has been propagated in the industrial ecology literature and practice. Circular economy pushes the frontiers of environmental sustainability by emphasizing the idea of transforming products in such a way that there are workable relationships between ecological systems and economic growth.”
Circular economy in construction industry suppose environment protection and carefully using of building materials. Building materials and how they are used in buildings are the keys to minimal environmental impact. The impact of building materials on the environment is found in alteration of the environment through various human actions, energy required for the entire life cycle of the product (from raw material to product and then recycling), energy used for transport, energy required for end of life cycle, impact of adjacent actions, maintenance required during the life cycle. In order to minimize the impact of building materials on the environment, it is necessary to use them flexibly, monitor performance throughout the construction process (fast execution, light weight, etc.), be energy efficient, durable, without impact on the whole living, disposable, recyclable and reusable. Methods of making and using low impact materials according to the EPA (Environmental Protection Agency) are use of products resulting from industrial processes, existing materials locally (to minimize energy required for transportation), prefabricated materials and systems, materials and prefabricated systems (to minimize the realization energy). The most used materials with low impact on the environment are - natural organic materials with rapid growth (bamboo, straw), or animal origin (wool); natural stone, recycled stone; recycled materials (metal, copper) and non-toxic products. (Ciutina, 2020) MATERIAL AND METHOD
The construction sector is one of the largest waste generators worldwide, but especially in Romania and North-East region. The construction sector has a contribution to the EU's GDP of 9%, providing about 18 million jobs. (European Commision, 2018)
The main cause of the construction sector impact on the environment is the use of non-renewable materials, which produce waste that is impossible to reuse. (Nuñez-Cacho et. al, 2018)
In Romania, the culture regarding the use of renewable construction materials is no very well developed. This is why the circular economy is having problems in implementation.
199
Decisions to apply the circular economy in construction are related to the operational sphere (with reference to certain parts of production processing), tactical (with application to the whole process), and strategic (with implementation to the entire organization). (Nuñez-Cacho et. al, 2018)
The circular economy in the construction sector is directly connected by the business demography and enterprises growth, and represents the main preoccupation of the paper.
According to Eurostat data for the construction industry, the evolution of the business demography indices of the North-East region of Romania shows an increase in population of active enterprises in the 2011-2015 period, from 6049 units to 8078. It is understandable, from the data presented, that the construction sector in the North-East region has improved positively, especially in the context of increasing the employability of newly established companies.
Benefit for the construction sector in the North-East region of Romania, especially in the North-East region, is applicable because many of the Romanian emigrants work in other developed countries in the construction sector. They have the opportunity to discover new methods and working materials. These are taken over and can be built in their own construction in terms of sea and beautiful houses in Romania.
The construction industry in Romania is part, through which it can be heated, over another upper part of the industries. Also, they can be used for reusable materials, of good quality, as well as can be efficient in terms of Romanian constructions. Thus, the construction industry is constantly created in Romania, motivating the care of entrepreneurship and can support businesses that can function properly in this sector.
To verify the affirmations presented above, it has been formulated through the paper the following hypothesis: the alternative hypothesis H1 is The probability of recession across the construction industry is positively correlated with the central tendencies in this sector and with the circular economy. For the purposes of calibrating and supporting the settled hypothesis, its zero hypotheses are formulated thus: the null hypothesis H0 is The probability of recession across the listed sector is not positively correlated with the central tendencies in this sector (Zaman, Goschin and Vasile, 2013; Covaci B., Suciu and Covaci M, 2018). The hypothesis has been verified through descriptive statistics and analysis.
Methods of the paper are proposing the analysis of the descriptive statistics combined with exploratory research. The hypothesis is focused on using a circular economy in developing the construction industry in Romania (Covaci M., 2009; Covaci M., 2017; Covaci M., 2019), clusterization of the developed/emergent construction industry.

200
RESULTS AND DISCUSSION
Business demography and high growth enterprise activity for construction industry in Romanian mountain regions present between 2008-2016 period an important fluctuation, in general decrease, in values (tab. 1). The construction industry sector decline in Romanian mountain regions is explained by the contraction of activity due to insufficient policies regarding environment protection and not well applied of circular economy desiderata. Some indices, in general those with impact of future trends (with horizon of 2020) presented increases of the activity, as follow I1. by 24,28%; I4. 28,54%; I14. 338,64%; I18. 4,94%; I19. 3,41%. Still, the rest of the indices show that the construction industry in Romanian mountain regions decreased and trends for 2020 are uncertain, respectively I2. by -40,20%; I3. -18,08%; I5. -77,00%; I6. -24,31%; I7. -32,24%; I8. -44,14%; I9. -52,44%; I10. -33,08%; I9. -47,11%; I12. -33,91%; I13. -9,01%; I15. -44,28%; I16. -51,89%; I17. -30,29%; I20. -26,15%; I21. -6,41%; I22. -14,86%; I23. -7,05%; I24. -18,50%; I25. -51,37%; I26. -12,71%.
The fluctuation presented show that in the Romanian mountain regions is necessary to apply more the environment protection and the circular economy desiderata.
Table 1 Business demography and high growth enterprise by NACE Rev. 2 activity and other
typologies for Construction Industry in Romanian mountain regions
Indicator 2008 2014 2015 2016
I1. Population of active enterprises in t - number
20.182 23.314 23.711 25.083
I2. Births of enterprises in t - number 5.298 2.602 3.040 3.168
I3. Deaths of enterprises in t - number 2.605 2.511 2.134 :
I4. Enterprises newly born in t-3 having survived to t – number
1.773 1.679 1.541 2.279
I5. High growth enterprises measured in employment (growth by 10% or more) - number
213 38 46 49
I6. Persons employed in the population of active enterprises in t - number
167.163 119.603 120.394 126.518
I7. Employees in the population of active enterprises in t - number
163.604 108.643 108.878 110.860
I8. Persons employed in the population of births in t - number
12.407 6.422 6.235 6.930
I9. Employees in the population of births in t - number
10.957 5.352 4.596 5.211
I10. Persons employed in the population of deaths in t - number
5.211 3.165 3.487 :

201
I11. Employees in the population of deaths in t - number
4.139 2.242 2.189 :
I12. Persons employed in the population of enterprises newly born in t-3 having survived to t - number
10.777 5.713 5.443 7.123
I13. Persons employed in the year of birth in the population of enterprises newly born in t-3 having survived to t - number
5.037 3.987 4.288 4.583
I14. Net business population growth - percentage
: -0,2 1,7 5,79
I15. Business churn: birth rate + death rate - percentage
39,16 21,93 21,82 :
I16. Birth rate: number of enterprise births in the reference period (t) divided by the number of enterprises active in t - percentage
26,25 11,16 12,82 12,63
I17. Death rate: number of enterprise deaths in the reference period (t) divided by the number of enterprises active in t - percentage
12,91 10,77 9 :
I18. Survival rate 3: number of enterprises in the reference period (t) newly born in t-3 having survived to t divided by the number of enterprise births in t-3 - percentage
: 50,93 54,26 46,13
I19. 3 year old enterprises' share of the business population - percentage
8,79 7,2 6,5 9,09
I20. Employment share of enterprise births: number of persons employed in the reference period (t) among enterprises newly born in t divided by the number of persons employed in t among the stock of enterprises active in t - percentage
7,42 5,37 5,18 5,48
I21. Average size of newly born enterprises: number of persons employed in the reference period (t) among enterprises newly born in t divided by the number of enterprises newly born in t - number
2,34 2,47 2,05 2,19
I21. New enterprise paid employment rate: number of employees in the reference period (t) among enterprises newly born in t divided by the number of persons employed in t among enterprises newly born in t - percentage
88,31 83,34 73,71 75,19

202
I22. Employment share of enterprise deaths: number of persons employed in the reference period (t) among enterprise deaths divided by the number of persons employed in t among the stock of active enterprises in t - percentage
3,12 2,65 2,9 :
I23. Average employment in enterprise deaths: number of persons employed in the reference period (t) among enterprise deaths in t divided by the number of enterprise deaths in t – number
2 1,26 1,63 :
I24. Three-year old enterprises employment growth rate: number of persons employed in the reference period (t) among enterprises newly born in t-3 having survived to t divided by the number of persons employed in t-3 by the same enterprises, expressed as a percentage growth rate - percentage
113,96 43,29 26,94 55,42
I25. Employment share of 3 year old enterprises: Number of persons employed in enterprises newly born in t-3 having survived to t, divided by the number of persons employed in the population of active enterprises in t – percentage
6,45 4,78 4,52 5,63
Source: Author processing according Eurostat - Business Demography Statistics Regarding the North-East region of Romania, statistics for the
construction industry – the histogram (fig. 1) and the indices presented forwards (including tab. 2) - show an average of 6846.00 with a standard error of 375,063, a 95% confidence interval with a lower limit of 5959.12 and an upper limit of 7732.88, lower average value of 5% of 6875.94, a median of 6828.50, a variance of 1125377.143, a standard deviation of 1060.838, minimum of 5075 in 2015, maximum of 8078 in 2015, an interval of 3003, interquartile range of 1815, a gap of -373 with a standard error of .752, Kurtosis of -841 with a standard error of 1,481.
The values recorded by M-Estimators for various sectors of activity: Huber's M-Estimatora is 6927.41, Tukey's Biweightb - 6884.03, Hampel's M-Estimatorc - 6882.22 and Andrews' Waved - 6883.71 (a. The evaluation of the constant is 1,339; b. The evaluation of the constant is 4,685; c. The evaluation of constants has 1,700, 3,400 and 8,500; d. The constant valuation is 1,340 * pi). The percentiles in the evaluation average scenario are: for 5 percentiles - 5075.00, for 10 percentiles - 5075.00, for 25 percentiles - 6078.25 and for 50 percentiles - 6828.50. The percentiles in the

203
Tukey's Hinges scenario are: for 25 percentiles - 6107.50 and for 50 percentiles - 6828.50.
Fig. 1. Histogram for the construction sector in the North-East region of Romania
(2008-2015) Source: Author processing according to Eurostat - Business Demography Statistics
The normality tests through Kolmogorov-Smirnova scenario are
Statistic of .198, df of 8 and Sig. of .200* and through Shapiro-Wilk scenario are Statistic of .932, df of 8 and Sig. of .530* (*. This is the lower limit of true meaning, a. Lilliefors Corrected meaning).
Table 2 Extreme valuesa - construction industry, North-East region of Romania
Constructions
Superior
Case number Value
1 8 8078
2 6 7914
3 7 7829
4 5 6924
Inferior 1 3 5075
2 1 6049
3 2 6166
4 4 6733
Source: Author processing according Eurostat - Business Demography Statistics At a first analysis, the distribution curve is relatively symmetrically
central, and the scores around the average are very concentrated, with the appearance of leptocurticity, although the distribution is unimodal. (fig. 2) Working hypothesis: the distribution of scores is considered normal and,

204
therefore, parametric tests will be applied. The extreme values of the distribution, although they are in very small numbers, change the appearance of the histogram, by inducing a positive asymmetry, being still clinically important. The concentration of a large number of scores around the average (M = 6846) produces a certain leptocurticity of the distribution, due to the related phenomena in the Romanian economy. The logarithm of the values obtained, according to the universally accepted statistical rules, allowed to balance the distribution according to the normal Gauss-Laplace curve.
Fig. 2. Distribution graph Q-Q normal plot for constructions in the North-East region of
Romania - by logarithm (2008-2015) Source: Author processing based on Eurostat data - Business Demography Statistics The normal Q-Q plot test, after logarithm, shows a distribution of real
scores around normal values, represented by the oblique line in the graph, which corresponds to a normal distribution.
The Q-Q descended plot test, on the dispersion of empirical scores to normal, represented by the right with the score z = 0 for the mean and standard deviation 1, after logarithm, shows that they fall within a standard deviation, corresponding to a normal distribution. (fig. 3)
By logarithm, the scores obtained were subjected to statistical processing, after which all the factors involved in the study were taken into account, in order to obtain data as close as possible to the reality recorded in the North-East region of Romania, even if the measures taken in the economy they unbalanced the distribution of scores for a short period of time.

205
Fig. 3. Dispersion of the scores observed, compared to normal, by the Q-Q descended plot test - after logarithm, the construction sector in the North-East region of Romania (2008-
2015) Source: Author processing according to Eurostat data - Business Demography Statistics
The importance of these tests is given by the need to carefully observe
the influences of certain factors in the evolution of the construction sectors (fig. 4). Following the application of normality tests, after logarithmization, the null hypothesis must be rejected and the working hypothesis can be analyzed. The descriptive and inferential analysis will be done considering the distribution of scores within normal limits, according to the working hypothesis, for which the parametric tests are applied.
The central tendency for this sector in the analyzed period, amounting to 6846.00 (average), shows that the northeastern population of the active enterprises in the analyzed sector increased from 2008 (6049) to 2015 (8078), even if the rate of growth decreased. This has been realized in concordance with the application of the circular economy.
Some solutions for the circular economy in the construction industry propose ”technical challenges including the lack of recovery routes and the complex design of buildings, whilst significant, are likely to be overcome to some extent through further research on enabling technologies and sharing of knowledge. A larger obstacle is the existing stock of buildings and infrastructure where circularity principles have not been adopted. That said, there are many opportunities to advance the circular economy through the enabling factors identified. Ones that ranked highly significant include the greater recovery of materials through viable take-back schemes and higher

206
value markets, assurance schemes for reused materials, best practice exemplar case studies, and an awareness scheme.” (Adams et. all, 2017, 22)
Fig. 4. Inter-quartile diagram for the construction sector in North-East region of
Romania (2008-2015) Source: Author processing based on Eurostat data - Business Demography Statistics
CONCLUSIONS
The Romanian construction industry, especially from North-East region and from mountain area, should follow the idea of environment protection in order to apply circular economy.
The article meets the following needs, and analyzed the industrial constructions in the Romanian mountains area and North-East regions, and offered solutions for entrepreneurs in this sector.
The construction industry sector decline in Romanian mountain regions is explained by the contraction of activity due to insufficient policies regarding environment protection and not well applied of circular economy desiderata.
The central tendency for the construction industry during the analyzed period, with the value of 6846.00 (average), shows that the active enterprises of the construction sector in the North-East region of Romania, for the analyzed sector increased even though the growth rate decreased. And more, this is correlated with the circular economy. Construction entrepreneurs are encouraged to use reusable materials, including all waste from the construction process.

207
During the analyzed period, the H1 hypothesis was verified (activity intensification), the frequency having a total variation of 2.5 - from 0.5 to 3. The statistics presented above, and the histogram confirm the low congestion and the tendency to give up this sector in the northeastern region of Romania. At the same time, statistics confirm the slowdown in this sector.
The paper presents entrepreneurship, using a circular economy, as a key success for Romania, especially for the Romanian North-East region. The 2000-2007 period, but especially 2008-2015, was characterized by a major increase in the population of the active enterprises and of the occupied population in construction small businesses. (Covaci B., Suciu and Covaci M, 2018).
The major growth of the population of active enterprises in the construction sector is correlated with a strong drawing of the North-Eastern economy. The influence of clusterization and involvement of the academic environment in the North-East region and European funding to this specific industry must be considerable. (Covaci B., Suciu and Covaci M, 2018; Covaci M., 2014; Covaci B., 2019)
The paper demonstrates that circular economy must be applied for environment protection in the construction sector, especially in the Romanian mountains area and in the North-East region of Romania, and is directly connected by the population of active enterprises. The solutions for reviving this industry in the environment protection desiderata are correlated with responsible entrepreneurship according to the circular economy principles.
REFERENCES
1. Adams, K. T., Osmani M., Thorpe T. & Thornback J., 2017, Circular economy in construction: current awareness, challenges and enablers. Proceedings of the Institution of Civil Engineers-Waste and Resource Management. 170(1), 15-24
2. Ciutina A., 2020, Impactul construcţiilor asupra mediului - Faza de construcţie, Universitatea Politehnica Timişoara, https://www.ct.upt.ro/studenti/cursuri/ciutina/Impact%20%20Curs3.pdf
3. Covaci, B., Suciu M. C., Covaci M., 2018, Sectoarele secundar și terțiar, suport al dezvoltării montane în regiunea de Nord-Est a României. Journal of Montanology. 9 (IX): 129-137
4. Covaci, B., 2019, Antreprenoriatul, suport al dezvoltării umane. Studiu de caz privind activitățile administrative și de suport și activitățile profesionale, științifice și tehnice din Regiunea de Nord-Est a României. Journal for Freedom of Conscious. 7(2)
5. Covaci, M., 2009, Învăţarea tehnologizată şi particularităţile ei psihologice. Revista de Ştiinţe Socioumane a Universităţii Pedagogice de Stat „Ion Creangă”. 2009: 33-39

208
6. Covaci, M., 2014, Cultura organizațională în contextul globalizării. Revista Sfera Politicii. 4-5 (180-181), XXII: 75-81
7. Covaci, M., 2017, Spearman correlations between learning styles from rational level and Gardner intelligence types. Romanian Journal of Psychological Studies. Hyperion University. 5 (2): 31-38
8. Covaci, M., 2019, The Vark Model Investigated at the students from PPPE. Journal of Education Studies (JES). Adventus University. 1(1): 12-19
9. Driga, O., Lafuente González E.M. (2009). Antreprenoriatul Feminin în România Caracteristici personale şi efectul exemplelor antreprenoriale. Management. 62 (51): 57 – 65
10. European Commission. Construction / Growth. 2016-07-05. Retrieved 6 December 2018.
11. European Commision. Eurostat 12. Nasi, M. H. A., Andrea G., Adolf A. A., Koh, S. C. L. and Fred Y., 2017,
Comparing linear and circular supply chains: A case study from the construction industry. International Journal of Production Economics. 183(B): 443-457, p. 22â
13. Nuñez-Cacho, P., Górecki J., Molina-Moreno V., Corpas-Iglesias F. A. (2018). New Measures of Circular Economy Thinking in Construction Companies. Journal of EU Research in Business. 2018: 1– 16.
14. Zaman, Gh., Goschin Z., Vasile V., 2013, Evoluţia dezechilibrelor teritoriale din România în contextul crizei economice. Revista Română de Economie. 2 (46): 20-39

209
Annals of the University of Oradea, Fascicle: Environmental Protection Vol. XXXV, 2020 Analele Universităţii din Oradea, Fascicula: Protecţia Mediului Vol. XXXV, 2020
ACCIDENTAL OR PASSAGE BIRD SPECIES (VERTEBRATA: AVES) IN ROMANIAN FAUNA, OBSERVED IN BIHOR COUNTY
(NORTH WESTERN PART OF ROMANIA) DURING 2014-2020 Ilie Aurelian Leonardo*, Marinescu Mariana**
*Nicolae Jiga Theoretical High School, Str. Republicii, Nr. 36A, Tinca, Romania,
e-mail: [email protected] ** University of Oradea, Teacher Training Department, University Street, No. 1, Oradea, Romania,
e-mail: [email protected]
Abstract
The paper presents the researches about the accidental or passage bird species in Romanian fauna, observed in Bihor county in the period 2014 – 2020. Were observed 40 bird species, belonging to 9 orders and 33 genera. 23 bird species were mentioned for the first time in Romanian fauna. From the point of zoogeographic spread, the following categories of species were identified: North American, Mediterranean, Arctic, Siberian, Asian, North and South European species. These migrations are also heavily influenced by recent climate changes. If these climate changes will intensify, these migrations will be observed in as many bird species as possible from areas very far from Romania.
Key words: accidental species, Bihor county, Romania
INTRODUCTION
The Bihor county is located in Crișana region, in the north – western part of Romania. It presents a varied landscape, including Crișurilor Plain, Crișurilor hills and a mountainous area, with the highest elevation of the county (Cucurbăta Mare peak – 1848 m), the climate is temperate – continental moderate. The drainage is represented by Crișul Negru, Crișul Repede Barcăul, Ier rivers and their tributaries, different lakes. The climat influence and the landscape variety determined the presence of numerous vegetal and animal species, some of these considered endemic and others representing rarities at national level.
Data about the accidental bird species in Bihor county were published by author (Ilie, 2014 a; 2014 b; 2016 a; 2016 b; 2017 a; 2017 b; 2018 a; 2018 b; 2018 c; 2019). This paper is a synthesis of the observations about the accidental bird species performed by the authors in Bihor county in the period 2014 – 2020. MATERIAL AND METHOD
The bird species were observed with the help of the binoculars 20 x 50 and 8 x 25, completed with direct observations. For the determination of the species different guides were used (S.O.R. Hamlyn guide, 1999; S.O.R.,

210
2017) and for the validation of the existence in Romania or in its vecinity, the following electronic sources were consulted: wikipedia.org, ornitodata, rombird.ro, IUCN Red List for Threatened Species, rarebirds.hu. RESULTS AND DISCUSSION
In the period 2014 – 2020 there were identified the following accidental bird species: Order Suliformes - Phalacrocorax aristotelis Linnaeus, 1761 – three specimens, Oradea, Crișul Repede river, April 1, 2019. This is the first mention of this species in the western part of Romania, the species being mentioned only in Dobroudja. According to IUCN Red List of Threatened Species, this species was mentioned in Poland, Austria, Serbia, Slowakia, being vagrant in these countries. Probably passage species in Bihor county. The species can be found along the rocky coasts of seas and oceans. Order Anseriformes - Branta bernicla Linnaeus, 1758 – four specimens, Boiu, December 19, 2019. This is the second mention in the western part of Romania, according to rarebirds.hu the species being found in 1906 at Făgăraș (Brașov county). According to rombird.ro this species was found in Romania in Tulcea, Brăila and Buzău counties. North American, North European and Siberian species. - Branta canadensis Linnaeus, 1758 – three specimens, Râpa (Rogoaze lake), February 16, 2019; one specimen, Cheșa, May 4, 2019. North American species,vagrant in Europe during the cold season. - Anser brachyrhynchus Baillon, 1834 – two specimens, Râpa (Rogoaze lake), February 15, 2019. This is the second mention in Romania, the first mention being in Giulvăz, Timiș county, 1931 (according to rarebirds.hu). Accidental species in Romania, migratory species from northern Europe. Order Falconiformes - Falco rusticolus Linnaeus, 1758 – two specimens, Cheșa, November 27, 2017 (the first mention in Romania); one specimen, Tinca, December 18, 2017; one specimen, Tinca, January 16, 2018 (probably the same specimen). Very rare, accidental species in Romania, arrives from northern Europe, vagrant in Austria, Ukraine, Poland, Czech Republic (according to IUCN Red List for Threatened Species). The species was observed in Austria, near the border with Hungary, in 1994 (according to rarebirds.hu). The plumage is variable, being white, silver, black, rarely brown (according to wikipedia.org). Order Galliformes

211
- Alectoris rufa Linnaeus, 1758 – one specimen, probably escaped from captivity, Belfir, May 14, 2019. South – west European species, it was introduced in different parts of Europe for hunting or beauty purposes, existing in captivity. Order Coraciiformes - Ceryle rudis Linnaeus, 1758 - two specimens, one flying, the other fishing, Râpa, (Pusta Valley), June 8, 2015 (the first mention in Romania); one specimen, Tinca, Crișul Negru river, September 2, 2016. Erratic species, coming from Asia and North Africa to east or south – eastern part of Europe. In Europe, it is vagrant in France, Greece, Poland, Ukraine (according to IUCN Red List of Threatened Species). Order Charadriiformes - Stercorarius pomarinus Temminck, 1815 – one specimen, Cheșa, November 21, 2017. Rare, passage species in Romania, Arctic species. - Charadrius mongolus Pallas, 1776 – one specimen, Tinca, near Crișul Negru river, January 18, 2017; one male specimen, Râpa, May 18, 2019.Accidental species in Romania, East and Central Asian species, strongly migratory, vagrant in Europe during the cold season. - Limnodromus scolopaceus Say, 1823 – one specimen, Tinca, near Crișul Negru river, January 14, 2017 (the.first mention in Romania). North American species, accidental species in Romania. According to rarebirds.hu, in Hungary 25 observations were recorded in the period 1995 – 2019, most of them in the Hajdu – Bihar area, near the border with Romania. - Limnodromus griseus Gmelin, 1780 – one specimen, Tinca, near Crișul Negru river, January 12, 2017. Very rare, accidental species in Romania from North America. \ - Ichtyaetus audouini Payraudeau, 1826 – one specimen, Râpa, Crișul Negru river, November 12, 2017. Mediterranean species, mentioned for the first time in Romania. - Charadrius vociferus Linnaeus, 1758 – two specimens, Tinca, near Crișul Negru river, September 8, 2017. American species, accidental in Romania, vagrant. - Charadrius asiaticus Linnaeus, 1758 – one specimen, Râpa, near Crișul Negru river, October 1, 2017 (the first mention in Romania). Erratic, Asian species, vagrant in Romania (according to IUCN Red List of Threatened Species). - Tringa melanoleuca Gmelin, 1789 – one specimen, Belfir, May 20, 2019. Species mentioned for the first time in Romania, North American species, vagrant in Europe. - Pagophila eburnea Phipps, 1774 – one specimen, Tinca, Crișul Negru river, January 26, 2020 (the first mention in Romania); one specimen,

212
Tinca, March 29, 2020. Arctic species.According to IUCN Red List for Threatened Species, this species is vagrant in Czechia, Poland, Russian Federation, western and northern Europe. Order Columbiformes - Streptopelia orientalis Latham, 1790 – one specimen, Râpa, March 22, 2019. Asian species, some specimens migrate in Europe in autumn, winter and spring. Order Strigiformes - Bubo scandiacus Linnaeus, 1758 - one specimen, the edge of Tinca forest, December 14, 2014 ( the first mention in Romania); one specimen, Tinca, January 27, 2016; one specimen, Tinca, March 20, 2016; one specimen, Râpa, November 14, 2016; one specimen, Tinca, December 14, 2016 (probably the same specimen); one specimen, Belfir, January 10, 2019. Arctic species, during the winter, many specimens migrates to southern regions. According to rarebirds.hu, six specimens were observed in Hungary and Slowakia, during 1891 – 2015. Order Passeriformes - Cyanistes cyanus Pallas, 1770 – three specimens, Tinca, November 12, 2016; one specimen, Tinca, December 17 and 20, 2016; one specimen, Tinca, January 14, 2017 (probably the same specimen); one specimen, Belfir, April 7 and May 29, 2019 (probably the same specimen). Accidental species in Romania, observed in autumn, winter and rarely in spring. Russian, Central and North – western Asian species. - Calliope calliope Pallas, 1776 – one female specimen, Belfir, February 27, 2015 (the first mention in Romania); one male specimen, Tinca, January 12, 2017. Siberian species, it is an extremely rare vagrant to Europe during the cold season. - Pinicola enucleator Linnaeus, 1758 – two female specimens, Belfir, February 14 (the first mention in Romania) and 17, 2015; two female specimens, Tinca, November 17, 2016; one male specimen, Cheșa, November 4, 2017; one female specimen, Tinca spa, March 4, 2018. Erratic species in Romania, coming from northern Europe and Siberia. It is vagrant in Hungary, Serbia, Ukraine (according to the IUCN Red List of Threatened Species). According to rarebirds.hu four observations were recorded in Hungary and Slowakia in the period 1928 – 1985. - Zoothera aurea Holandre, 1825 – one specimen, Tinca, May 16, 2018 (the first mention in Romania). Accidental species in Europe, probably it was in passage to his breeding place from Siberia (at the end of May). - Tarsiger cyanurus Pallas, 1773 – two male specimens, Gurbediu, December 12, 2014 ( the first mention in Romania); two male specimens, Tinca, March 2, 2016; one male specimen, the edge of Râpa forest, April 11, 2016; two male specimens, Râpa, November 27, 2016; one male

213
specimen, Tinca, October 3, 2017; one female specimen, Râpa, January 25, 2019; one male specimen, Râpa ( the pine forest), February 5, 2019. Relatively rare species in Romania, vagrant species from northern Europe and Asia. - Poecile cinctus Boddaert, 1783 – two specimens, the edge of Tinca forest, November 24, 2014 ( the first mention in Romania); five specimens, the edge of Râpa forest, January 12, 2019 also together with other tit species.North American, North European and Siberian species, very rare in Romania during the cold season. - Turdus migratorius Linnaeus, 1766 – one specimen, Râpa, May 28, 2017 (the first mention in Romania); one specimen, Cheșa, March 4, 2018; one specimen, Felix spa forest, August 27, 2018. This species is coming from North American territory, being vagrant in Europe in autumn and winter. - Oenanthe leucura Gmelin, 1789 – one male specimen, Tinca, March – May, 2017 ( the first mention in Romania); one male specimen, Cheșa, November 18, 2017; one male specimen, Râpa, near the limestone quarry, March 18 and April 25, 2019 ( same place, probably the same specimen); one male specimen, Belfir, May 11, 2019. Erratic species, coming from southern Europe and North Africa, it is vagrant in Bulgaria, Serbia (according to IUCN Red List of Threatened Species). - Montefringilla nivalis Linnaeus, 1766 – one male specimen, Tinca, June 14, 2017 (the first mention in Romania); two male specimens, Cheșa, November 25, 2017. Erratic species, coming from South Europe and Asia Minor, it is vagrant in Hungary, Serbia, Ukraine, Slovakia, in mountain areas, there is a few data about his presence at reduced altitudes (according to the IUCN Red List of Threatened Species). According to rarebirds.hu, the last date of this species in Hungary is November 1, 2017. - Loxia leucoptera Gmelin, 1789 – one male specimen, Cheșa, August 28, 2017 (the first mention in Romania); one male specimen, Cheșa, March 18, 2018. North- East European and Siberian species, erratic species in Romania. - Passerella iliaca Merrem, 1786 – one specimen, Cheșa, October 3, 2017 (the first mention in Romania); one specimen, Belfir, May 28, 2019. North American species, it is vagrant in Italy, Germany, Russian Federation (according to IUCN Red List of Threatened species). - Alaudala rufescens Vieillot, 1819 – one specimen, hit by a car, Râpa, September 15, 2017. Accidental species from South Europe. - Turdus eunomus Temminck, 1820 – one specimen, Tinca, April 16, 2017 (the first mention in Romania). Siberian species, it is rare vagrant to Europe in the cold season. - Phylloscopus trochiloides Sundevall, 1837 – one specimen, Tinca, April 7, 2017; one specimen, Râpa, March 30, 2019; one specimen, Tinca,
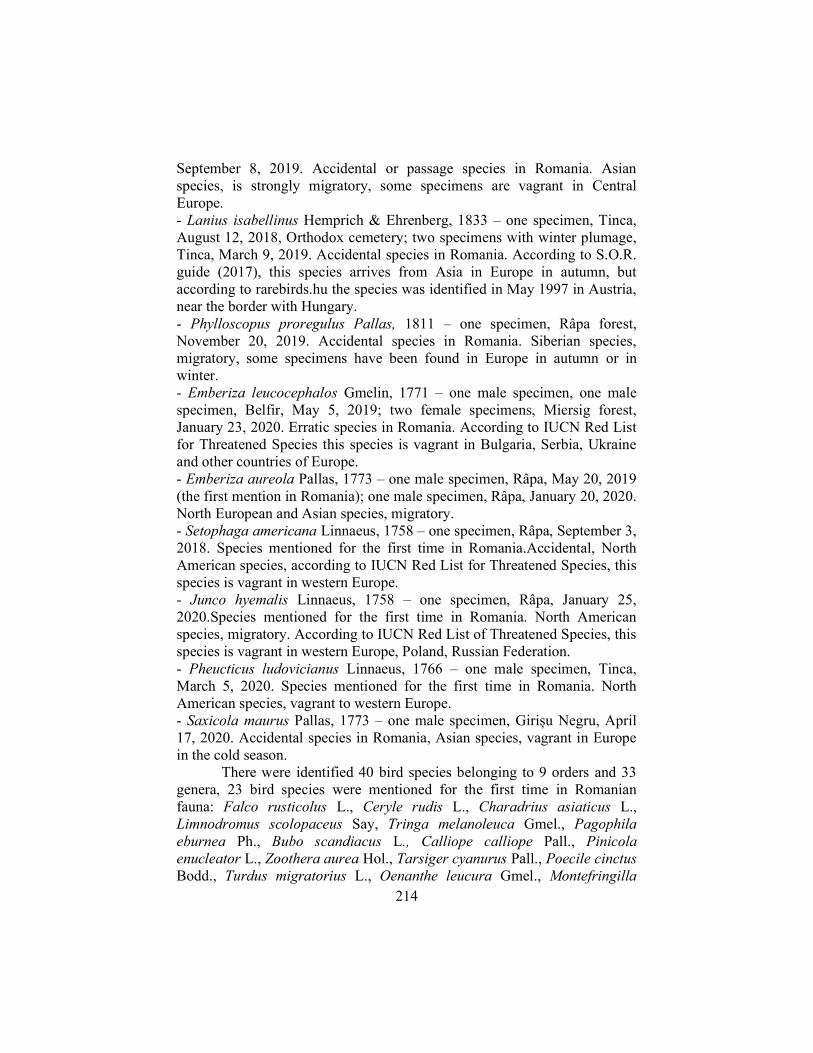
214
September 8, 2019. Accidental or passage species in Romania. Asian species, is strongly migratory, some specimens are vagrant in Central Europe. - Lanius isabellinus Hemprich & Ehrenberg, 1833 – one specimen, Tinca, August 12, 2018, Orthodox cemetery; two specimens with winter plumage, Tinca, March 9, 2019. Accidental species in Romania. According to S.O.R. guide (2017), this species arrives from Asia in Europe in autumn, but according to rarebirds.hu the species was identified in May 1997 in Austria, near the border with Hungary. - Phylloscopus proregulus Pallas, 1811 – one specimen, Râpa forest, November 20, 2019. Accidental species in Romania. Siberian species, migratory, some specimens have been found in Europe in autumn or in winter. - Emberiza leucocephalos Gmelin, 1771 – one male specimen, one male specimen, Belfir, May 5, 2019; two female specimens, Miersig forest, January 23, 2020. Erratic species in Romania. According to IUCN Red List for Threatened Species this species is vagrant in Bulgaria, Serbia, Ukraine and other countries of Europe. - Emberiza aureola Pallas, 1773 – one male specimen, Râpa, May 20, 2019 (the first mention in Romania); one male specimen, Râpa, January 20, 2020. North European and Asian species, migratory. - Setophaga americana Linnaeus, 1758 – one specimen, Râpa, September 3, 2018. Species mentioned for the first time in Romania.Accidental, North American species, according to IUCN Red List for Threatened Species, this species is vagrant in western Europe. - Junco hyemalis Linnaeus, 1758 – one specimen, Râpa, January 25, 2020.Species mentioned for the first time in Romania. North American species, migratory. According to IUCN Red List of Threatened Species, this species is vagrant in western Europe, Poland, Russian Federation. - Pheucticus ludovicianus Linnaeus, 1766 – one male specimen, Tinca, March 5, 2020. Species mentioned for the first time in Romania. North American species, vagrant to western Europe. - Saxicola maurus Pallas, 1773 – one male specimen, Girișu Negru, April 17, 2020. Accidental species in Romania, Asian species, vagrant in Europe in the cold season.
There were identified 40 bird species belonging to 9 orders and 33 genera, 23 bird species were mentioned for the first time in Romanian fauna: Falco rusticolus L., Ceryle rudis L., Charadrius asiaticus L., Limnodromus scolopaceus Say, Tringa melanoleuca Gmel., Pagophila eburnea Ph., Bubo scandiacus L., Calliope calliope Pall., Pinicola enucleator L., Zoothera aurea Hol., Tarsiger cyanurus Pall., Poecile cinctus Bodd., Turdus migratorius L., Oenanthe leucura Gmel., Montefringilla

215
nivalis L., Loxia leucoptera Gmel., Passerella iliaca Mer., Turdus eunomus Temm., Setophaga americana L., Junco hyemalis L., Pheucticus ludovicianus L., Ichtyaetus audouini Payr., Emberiza aureola Pall.
From the point of zoogeographic spread were identified different categories of species: North American, Siberian, Mediterranean, North and South European, Arctic, Asian. CONCLUSIONS
In the period 2014 – 2020, in Bihor county were identified 40 accidental or passage bird species belonging to 9 orders and 33 generations, 23 species being mentioned for the first time in Romanian fauna. These bird species are different from the point of zoogeographic spread. REFERENCES
1. Ilie A.L.,2014a, New faunistical researches from Tinca (Bihor county, Romania). Muzeul Județean Argeș, Pitești, Argesis – Studii și Comunicări – seria Științele Naturii, Tom XXII, pp. 61 – 72.
2. Ilie A.L.,2014b, New faunistical data from Tinca area (Bihor county, Romania). Universitatea din Oradea, D.P.P.P.D., Revista Educația omului de azi pentru lumea de mâine, Nr. 11, pp. 86 – 93.
3. Ilie A.L., 2016a, Faunistical data from Tinca area (Bihor county, Romania) during April – November, 2016. Muzeul Județean Argeș, Pitești, Argesis – Studii și comunicări – seria Științele Naturii, Tom XXIV, PP. 31 – 40.
4. Ilie A.L., 2016b, Monografie faunistică. Organismele vertebrate din zona Tinca ( județul Bihor, România), ( Faunal monography. Vertebrates from Tinca area, Bihor county, Romania). Edit. Sitech, Craiova, 267 pp.
5. Ilie A.L., 2017a, Faunal observations from Tinca area (Bihor county, Romania) during November 15, 2016 – April 1, 2017. Muzeul Județean Argeș, Pitești, Argesis – Studii și Comunicări – seria Științele Naturii, Tom XXV, PP. 35 – 49.
6. Ilie A.L., 2017b, Data about the fauna of vertebrates from the western half of Romania during 2016 – 2017. Universitatea din Oradea, D.P.P.P.D., Revista Educația omului de azi pentru lumea de mâine, Nr. 14, pp. 75 – 82.
7. Ilie A.L., 2018a, The ornithofauna from Cheșa area (Bihor county, Romania). Universitatea din Oradea, D.P.P.P.D., Revista Educația omului de azi pentru lumea de mâine, Nr. 15, pp. 60 – 64.
8. Ilie A.L., 2018b, The fauna of vertebrates from Tinca area (Bihor county, Romania) during September 1 – November 30, 2017. Universitatea din Oradea, D.P.P.P.D., Revista Educația omului de azi pentru lumea de mâine, Nr.15, pp. 65 – 70.
9. Ilie A.L., 2018c, Faunistical data from Bihor county (Romania) during 2016 – September 2018. Universitatea din Oradea, D.P.P.P.D., Revista Educația omului de azi pentru lumea de mâine, Nr. 15, pp. 71 – 80.
10. Ilie A.L., 2019, New data about the vertebrates from Bihor county (Romania) during 2014 – 2019. Universitatea din Oradea, D.P.P.P.D., Revista Educația omului de azi pentru lumea de mâine, Nr. 16, pp. 75 – 88.

216
11. S.O.R. Hamlyn guide., 1999, Păsările din România și Europa. Determinator ilustrat (The birds from Romania and Europe. Illustrated determiner). Octopus Publishing Group Ltd. 320 pp.
12. S.O.R., 2017, Ghid pentru identificarea păsărilor. Europa și zona mediteraneană. (Bird identification guide. Europe and Mediterranean area). Printer, Trento, Italy, 445 pp.
13. rarebirds.hu (accesed August 6, 2020) 14. www. IUCNREDLIST (accesed August 6, 2020) 15. wikipedia.org (accesed August 6, 2020) 16. ornitodata (accesed August 6, 2020) 17. rombird.ro (accesed August 6, 2020)

217
Annals of the University of Oradea, Fascicle: Environmental Protection Vol. XXXV, 2020 Analele Universităţii din Oradea, Fascicula: Protecţia Mediului Vol. XXXV, 2020
IMPACT AND VULNERABILITIES OF INTENSIVE ANIMAL HUSBANDRY IN THE NORTH-WEST REGION OF ROMANIA
FOR CLIMATE CHANGE
Mintaş Olimpia*, Mintaş Ioan*, Vicaș Gabriela*
*University of Oradea, Faculty of Environmental Protection, 26 G. Magheru st., 410048 Oradea, Romania, e-mail: [email protected]
Abstract
Global environmental change has the potential to ecologically and socially exacerbate the impact of biodiversity change. In many regions, land conversion is forcing the population to shrink to the edge of covering their species, where they become increasingly vulnerable to collapse if exposed to additional human impact. The most significant effects are probably borne by small farmers who have limited financial and technical capacity to adapt to climate variability and change. This article is proposed to improve the understanding of the impact of climate change, the vulnerabilities of animal husbandry adaptation practices to climate change.
Key words: Climate change, animal husbandry, vulnerability, impact INTRODUCTION
Global warming currently involves two major problems for humanity: on the one hand, the need to drastically reduce greenhouse gas emissions, in order to stabilize the level of concentration of these gases in the atmosphere, to prevent anthropogenic influence on the climate system and to enable natural ecosystems to adapt naturally, and on the other hand, the need to adapt to the effects of climate change, given that these effects are already visible and inevitable due to the inertia of the climate system, regardless of the outcome of emission reduction actions. (4).
Animal husbandry is the most important source of greenhouse gases in agriculture, more than 50% of which, at EU level, come from livestock farms and manure depots, the main greenhouse gases in this sector being methane. and nitrous oxide. High concentrations of CO2 in the atmosphere come from plant materials that are considered, similar to the situation in the energy sector, a renewable energy source. Carbon dioxide from the breath of domestic animals does not contribute to these amounts, but is again incorporated by plants into the organic matter and thus the cycle continues.
Methane is mostly generated by the fermentation of food in the intestinal tract of domestic animals, especially in the front of the stomach of ruminants, but also during the storage of animal fertilizer. Although methane carbon comes from plant material, it is not environmentally neutral, as is carbon dioxide formed by respiration. The greenhouse effect of methane is 21 times greater than that of carbon dioxide.

218
Nitrogen oxide is mainly generated by the conversion of nitrogen compounds in agricultural areas and animal manure depots. Agricultural activities also cause indirect emissions, which do not occur on farms, but are the consequence of the volatilization of ammonia and nitrogen oxides (NOX) into the atmosphere. Indirect emissions are also caused by the filtration and run-off of nitrogen compounds in surface and groundwater. Nitrogen oxide emissions depend mainly on the efficiency of nitrogen administration. Animal husbandry mainly has a negative impact on the climate, but can also have a positive effect in some respects. Herbivorous animals use extensive pastures, the soils of these pastures being usually rich in organic matter that can retain carbon dioxide, thus bringing benefits to the environment. On the other hand, manure increases the amount of organic matter in arable land. (12).
In general, the most important measure to reduce greenhouse gas emissions from the livestock sector is the efficient use of energy and protein, which needs to be improved through the proper management of manure, especially by achieving an efficient nitrogen cycle on farms. It should be noted that methane is also generated by non-productive animals, which need energy in the form of food to maintain vital functions. As productivity increases, the ratio of energy consumed for production to energy required for animal maintenance increases and, as a result, methane emissions per unit of production decrease. As far as nitrous oxide emissions are concerned, it is important to provide the animals with sufficient protein. Excess protein in the animal diet causes excessive nitrogen excretion and increased nitrous oxide emissions from manure storage systems, while protein deficiency results in sub-optimal energy use and increased methane emissions due to enteric fermentation.
In practice, animal husbandry is often separated from the cultivation of plants, often the two activities taking place on different farms or even in different regions, which makes it difficult efficient circulation of nitrogen. While livestock farmers have the problem of excess nitrogen on the farm, growers must use a large number of mineral fertilizers which are an important source of nitrous oxide. Therefore, agriculture must be carried out as much as possible in complex structures that combine animal husbandry and plant cultivation. MATERIAL AND METHOD
The environmental issues and their consequences on alive organisms have extended, becoming a threat to survival. We are facing a full ecological crisis, crisis which requires an international approach of the environmental

219
issue. The „biocapacity” of the Earth exceeds today with 25% the capacity to support the needs of human kind, thus this crisis is manifested in three directions (8): - in the multiplication 4 times of the globe’s population in the XXth century, from 1,6 billions in 1900 to 6,4 billions in 2000; - in the development of dangerous technologies and their export in the 3rd world countries, poor countries, which lead to the deterioration of their environment due to the lack of instruments for the environmental control; - the replacement of natural products with synthetic, toxic ones, which accumulated in the environment’s biosystem. (1,2) In Central and Eastern Europe, the scenarios show a clear decrease in rainfall, especially in the summer season, so a rainfall deficit that will affect most areas of activity such as animal husbandry, population and ecosystems. The specific activities of the adaptation process in the zootechnical field refer to the fund of genes, specific measures of elaboration of the diet, the grazing and sheltering of the animals, as well as to the techniques of storage of the fertilizers. Thus, greenhouse gas emissions from the livestock sector can be significantly reduced through genetic improvement, by analyzing the genetic potential of selected animal breeds, by a proper balance between energy and dietary proteins, by building appropriate shelters and suitable fertilizer depots. The introduction of appropriate grazing systems on farms can also help to reduce greenhouse gas emissions.
For the livestock sector, the code of good practice in agriculture recommends: large, properly sealed and equipped manure storage platforms; storing manure in cool and shady places; covering the basins with liquid residues to reduce ammonia emissions
into the atmosphere, by using waterproof tarpaulins; ensuring the appropriate quantities of manure within the farms
specialized in its collection and processing; construction of facilities for capturing biogas, resulting in reduced
methane emissions, and the energy obtained is used to reduce fossil fuels;
grazing in the open air compared to growing in shelter systems; education, raising awareness among farmers about the consequences
of the effects of climate change; continuous review of agricultural strategies to ensure their flexibility
in relation to the effects of climate change and adaptation measures.
Global warming and the prospect of depletion of conventional energy sources have required a new approach by introducing biofuels in order to reduce pollutant emissions and reduce carbon dioxide from the atmosphere.
220
Therefore, the widespread use of alternative sources will lead to a gradual shift from fossil fuels to renewable energy sources, in order to reduce greenhouse gas emissions. RESULTS AND DISCUSSION
For the efficient management of renewable energy sources it is recommended: increasing biodiversity on farms by introducing new crops; cultivation of annual or perennial herbs with high energy value
(cane, grass plants such as pear, sorghum, etc.); collection, storage and use of residual organic materials from
agriculture, food industry and farms with a high protein content (liquid manure, sewage and sewage, feed residues, crop residues, slaughterhouse waste);
increasing the share of crops destined for biogas production, such as corn, sugar beet, rapeseed, etc., which can be grown as raw material for biogas plants;
installation of solar panels for heating water and premises. (4) analysis of the genetic potential of selected animal breeds; elimination of poorly productive animals from the farm; for some species, such as cows, maintaining extremely high yields can lead
to low fertility and reduced longevity, which can ultimately lead to a decrease in all the positive effects of the respective yields. This is especially the case with exotic breeds, which are not adapted to local conditions;
avoid raising animals with low productivity, except for endangered species that need to be kept;
it is recommended to store the manure in cool and shady places, the heat accelerating the formation of methane;
it is not recommended to collect and store liquid manure under the wooden floor of the stables, as high temperatures and large areas cause an increase in ammonia nitrogen losses in the atmosphere;
coating liquid waste tanks with waterproof tarpaulins reduces ammonia emissions into the atmosphere. The natural crust formed on the surface of residues with a high amount of dry matter is much more effective in reducing ammonia emissions;
ensuring the appropriate quantities of manure in farms specialized in its collection and processing, which prevents the spread of odor and avoids the loss of ammonia nitrogen in the atmosphere;
the possibility of building facilities for capturing biogas, which reduce methane emissions, the energy obtained being used to reduce fossil fuels. Unfortunately, biogas production is too expensive for small farms.

221
CONCLUSIONS
The direct and indirect effects of global warming will be manifested, thus, in several general directions: - modifications of vegetation, the appearance of weeds which may become fatal for the ecosystem, in time; - the increase of the level of seas and oceans with approximately 50 cm in the year 2050, which might put in danger lots of ecosystems, especially by an increase of salinity; - weather abnormalities manifested though tropical rains, storms, tornados, waves of heat, etc. With an impact on the entire biosystem and on all alive mechanisms; - the appearance of diseases transmitted through vectors, in some regions of the globe this phenomenon may lead to incidence, prevalence and, possibly, mortality; - the food safety is threatened, high temperatures will affect crops in some regions of the world, especially due to modifications of the rainfall regime and the soil’s humidity; - emphasis on the desertification, due to the „green revolution” which lead to a dramatic increase of the agricultural production, especially in the past 40 years after the second world war; - withdrawal of alpine glaciers has as main cause the increase of green house gas concentration, phenomenon noticed for the first time in the XIXth century, leading to the withdrawal of river flows (used in irrigations and as drinkable water), which generated a real "water crisis” with consequences in the limitation of population increase in many regions from the globe.
Our society must adopt a practical attitude in solving the environmental issues, instead of the one adopted until now, a reactive attitude, taken each time when a crisis appears. An optimism reason might be the fact that the great majority of alive organisms from Terra are robust, powerful, which many times demonstrated the ability to adapt to a large scale of precarious weather conditions. Mankind enters into the largest crisis ever encountered, but the man is full of resources and in the best shape, even in crisis moments.
IPCC, in its report, approached several options to diminish these global modifications: non-polluting methods of transportation, reduction of gas emissions of human establishments, preservation of agricultural fields, policies and strategies of management of woods from the Earth, an efficient industry, so on.

222
REFERENCES
1. Berca M., 2000, General ecology and environmental protection Ceres Publishing
House, Bucharest 2. ***Codul de atitudini pentru prevenirea impactelor mutuale dintre agricultură și
schimbările climatice: http:// www.cameraagricolavn.ro/biblioteca 3. ***Comisia Europeană, Cartea Albă „Adaptarea la efectele schimbărilor climatice:
către un cadru de acțiune la nivel european”, 2009 4. Ghidul privind adaptarea la efectele schimbărilor climatice, 2008 5. ***Comisia Europeană, Cartea Verde a Comisiei către Consiliu, Parlamentul
European, Comitetul Economic și Social European și Comitetul Regiunilor: „Adaptarea la schimbările climatice în Europa - posibilitățile de acțiune ale Uniunii Europene”, 2007
6. ***Comisia Europeană, Direcția Generală pentru Agricultură și Dezvoltare Rurală, „Agricultura UE - asumarea provocării schimbărilor climatice”, 2008
7. ***Convenția-cadru a Națiunilor Unite asupra schimbărilor climatice (UNFCCC) 8. ***IPCC, Climate Change 2013: The Physical Science Basis. Contribution of Working
Group I to the Fifth Assessment Report of the Intergovernmental Panel on Climate Change [Stocker, T.F., D. Qin, G.-K. Plattner, M. Tignor, S.K. Allen, J. Boschung, A. Nauels, Y. Xia, V. Bex and P.M. Midgley (eds.)], Cambridge University Press, Cambridge, United Kingdom and New York, NY, USA, 1535 pp
9. ***IPCC, „Climate Change 2014: Mitigation of Climate Change. Working Group III Contribution to the IPCC 5th Assessment
10. Report - Changes to the Underlying Scientific/Technical Assessment to ensure consistency with the approved Summary for Policymakers (XXXIX/Doc.17) and presented to the Panel at its Thirty-Ninth Session”, 2014
11. ***Ministerul Mediului și Schimbărilor Climatice, „Ghid privind adaptarea la efectele schimbărilor climatice”, 2008, disponibil
12. ***Programul privind schimbările climatice și o creștere economică verde, cu emisii reduse de carbon - Rezumat al evaluărilor sectoriale rapide și al recomandărilor de includere a măsurilor privind schimbările climatice în Programele Operaționale Sectoriale 2014-2020, disponibil la: http://documents.worldbank.org
13. ***Strategia Națională a României privind Schimbările Climatice 2013–2020, disponibilă la: http://www.mmediu.ro/beta/wpcontent/ uploads/2012/10/2012-10-05-Strategia_NR-SC.pdf
14. ***Tubiello, F., et al., 2008, Climate change response strategies for agriculture: challenges and opportunities for the 21st century. Agriculture and Rural Development Discussion Paper 42. World Bank
15. ***Tubiello, F., Fischer, F., 2007, Reducing Climate Change Impacts on Agriculture: Global and Regional Effects of Mitigation, 2000–2080, Technological Forecasting and Social Change 74 (7): 1030–1056

223
Annals of the University of Oradea, Fascicle: Environmental Protection Vol. XXXV, 2020 Analele Universităţii din Oradea, Fascicula: Protecţia Mediului Vol. XXXV, 2020
PRODUCT SUSTAINABILITY AND EMOTIONAL DESIGN
Pantea Ioan*
*University of Oradea, e-mail: [email protected] Abstract
People's concern for beauty and comfort has highlighted over time the relationship of interdependence between the aesthetic and the functional, leading to the emergence of the concepts of environment, ambient, habitat, object, which today governs many aspects of the everyday life. An individual, being a living being, instinctively inclines to all that is natural, organic, and rejects all that is unnatural. Therefore, any object created naturally or artificially is considered beautiful when it meets the rules of organic, natural proportionality. An object is harmonious, it has a pleasant appearance, when it is well proportioned, when between the component parts and the whole there are judicious dimensional ratios that increase its aesthetic value. The reports that best respond to these desiderata are the reports that respect the natural laws of proportionality. The purpose of this paper is to construct the graphic design of an object, in a horizontal plane, using the harmonic network of the pentagram, in order to create harmony, the scale balance between one element and another or between an entire object and one of its parts. The sustainable emotional design links the principle of emotional design to sustainability. Key words: sustainability, product design, golden rule, pentagram . INTRODUCTION
The affective design is a branch of the ergonomic thinking that deals with the emotional effect that a product has on a user based on the interaction with him. It is how a product "affects" a person, and which results in an emotional or behavioral response through its attributes. The goal is to provide products that, for example, delight. Emotions can, however, be volatile or transient, leading to products whose attributes soon fade. If a person has a strong enough emotional attachment to a product, then they are less likely to throw it away. (Pantea, 2019)
The understanding and applying of the concepts of sustainability is becoming a necessity in a world that is trying to cope with the demographic pressures, the degradation of the natural environment, and the scarcity of the available resources or the instability of the financial markets. Companies need to integrate sustainability into their processes and strategies in order to effectively meet new challenges. The performance measurement and evaluation must include social, environmental and economic indicators. These issues need to be integrated and managed in a balanced way in order to understand the sustainability of a product from the perspective of all the interested parties. The consumer is not interested in the profit margin but is

224
interested in the effects of the purchased products on his health, considering them more and more seriously in the purchase decision. MATERIAL AND METHOD
In composition the most important concept is the concept of proportion, it refers to the relationship between the visual and the elements. The proportion is the scale, the amount of the degree of dominance or subordination between the visual elements, it can create order. The gold section aims to achieve a harmonious proportion, which plays an important role in creating the harmony of the construction, so the previously thought-out reports can create a unique, pleasing image for the viewer (Pantea, I., 2019). In order to make the pentagon, it is built a circle with perpendicular axes. Divide the radius OB into two equal parts obtaining the point K (figure 1). With the leg of the compass in K take the radius KG in the compass and draw an arc of a circle from G to the horizontal axis of the circle obtaining the point L, which folds on the circle in the point M (figure 2).
Fig. 1 Pentagon construction Fig. 2 Tracing the side
The GL segment represents the side of the pentagon (figure 3). Draw the diagonals NG and PG inside the pentagon (figure 4). If the side of the pentagon is 1, the NG diagonal is equal with φ (= √5 / 2 + 1/2 or 1.618034 ...). The side and the diagonal of any ordinary pentagon are in ratio 1:φ (figure 4). The analysis is done according to Pythagoras' theorem. To understand the φ inherent proportions of the pentagon, we must consider the right triangle 1/2:1 or 1:2 which initiates its construction KG = √5/2 (figure 5)

225
Fig. 3 Folding the side of the pentagon on the circle Fig. 4 Golden triangle In figure 6 we meet the gold section. (Fletcher R., 2006, 72)
Fig. 5 Pythagoras' Theorem Fig. 6 Golden section
Each segment of a common pentagonal system refers to the others as a function of the variable φ. If the pentagon GMNPQ and its five diagonals are drawn, the PN side of the pentagon is 1, the diagonal NG is equal to φ (figure 7). If the SP segment is equal to 1, it results that RS = 1/φ, PN = φ and NG = φ2 The segments grow simultaneously in geometric proportion. (Fletcher, 2006,)

226
Fig. 7 The golden triangle and the pentagram
RESULTS AND DISCUSSION
To achieve a visual balance in the design of any type, we can use the number 1.618033. Whether we accept it or not, behind any balanced element, we run into a mathematical calculation. This number represents the golden number or the golden section, and through its prism we obtain a pleasant aesthetic, being at the same time in relation to the human being. To build the harmonic network, the inverted pentagon is also drawn, with the tip down over the normal pentagon. We draw the diagonals forming gold triangles (figure 8). We mark the harmonic points of interest on the network of the pentagram created (figure 9). From these points, we build with the compass circles with the obtained radius, making the connection between the arcs of the circle.
Fig. 8 Drawing the pentagram

227
Fig. 9 Connecting the circle arches
A geometric figure is obtained consisting of arcs of a circle that have the center of the circles in the harmonic points of the pentagram and that form the contour of the horizontal surface of the carafe in the upper part (figure 10).
Fig. 10 The contour of the horizontal upper surface of the carafe obtained according to the harmonic network of the pentagram

228
CONCLUSIONS
The geometric organization itself does not produce the dynamic concept of inspiration. What the creative idea offers is a process of composition, a means of interrelating form, and a method of achieving visual balance. It is a system of uniting the elements into a unitary whole. The "golden section" aims to achieve a harmonious proportion, which plays an important role in creating the harmony of the construction, so the previously thought-out relationships can create a unique, pleasing image for the viewer. REFERENCES
1. Pantea I., 2019, Geometry and composition - gold section, Simpozionul international Invăţământ, Cercetare, Creaţie, Editia a X-a, Facultatea de Arte Constanta,Vol.5 No.1, pp. 229-234.
2. Pantea I, 2007, Elemente de proiectare în designul industrial, Editura Universităţii din Oradea.
3. Boileau, C., 1979, The Secret Geometry of the Painters, Bucureşti, ed. by Meridiane
4. Dumitrescu, Z., 1974, Geometric structures - plastic structures, Bucureşti, ed. by Meridiane.
5. Ghyka, Matila C., 1981, Estetică și Teoria Artei, Editura științifică și enciclopedică, București
6. Huntley, H. E., 1970, The Divine Proportion, A Study in Mathematical Beauty . New York: Dover, 1970
7. Kimberly Elam, 2001, Geometry of Design, New York 8. Le Corbusier (Charles Edouard Jeanneret), Modulor I and II. Trans. Peter de
Francia and Robert Anna Bostock of the1948 and 1955 editions. Cambridge: Harvard University Press. 1980
9. Rachel Fletcher, 2006, The Golden Section Nexus Network Journal 8, pp. 67-89, 10. Reynolds M. A., 2002, On the Triple Square and the Diagonal of the Golden
Section, Nexus Network Journal Vol. 4, No. 1, pp. 120-125
229
Annals of the University of Oradea, Fascicle: Environmental Protection Vol. XXXV, 2020 Analele Universităţii din Oradea, Fascicula: Protecţia Mediului Vol. XXXV, 2020
THE MONTHLY AND ANNUAL AIR TEMPERATURE REGIMES IN THE VAD-BOROD DEPRESSION
Pereş Ana Cornelia*, Köteles Nandor*, Domuţa Cristian*, Amarie Sara**
*University of Oradea, Faculty of Environmental Protection, 26 Gen. Magheru St., 410048 Oradea,
Romania, e-mail: [email protected]; [email protected]; [email protected] **Student of the University of Oradea, Faculty of Environmental Protection, 26 Gen. Magheru St.,
410048 Oradea, Romania, e-mail: [email protected]
Abstract
The study of air temperature in the Vad-Borod depression is based on data recorded at the weather station located in the depression, that is, the Borod station. The data were obtained from the Archives of the National Meteorological Administration (ANM). The analysis of the thermal regime in the Vad-Borod depression covered a period of 50 years.
The multiannual mean of air temperature in the Vad-Borod depression is 9.6ºC. The highest annual mean air temperature value was recorded in 2019, 11.4ºC, and the lowest
was 8.1ºC, recorded in 1985, which gives an amplitude of 3.3ºC. Over the year, the lowest monthly mean value is recorded in January, -1.1ºC, and the highest
in July, when it reaches 19.6ºC, which gives an amplitude of 20.7ºC. Over the 50 years included in the study, negative deviation was recorded in 56% of the cases,
while positive deviation was reported in 36% of the years. Key words: air temperature, negative deviations, positive deviations INTRODUCTION
The Vad-Borod depression is an intermontane depression in the north-west of the Apuseni Mountains, along the upper course of the Crișul Repede river. In the north-east the depression is surrounded by the Plopişului Mountains (Şes), in the south-east the Pădurea Craiului Mountains can be found, while in the west it opens wide towards the Western Plains (Posea, 1977; Pereş et al., 2019).
MATERIAL AND METHOD
The analysis of the air temperature regimes in the Vad-Borod
depression was conducted using the air temperature data recorded at the Borod weather station over a period of 50 years, between 1970 and 2019.
The Borod weather station was established on 1st December 1967 and it is located on a terrace of the Crişul Repede river in the Vad-Borod depression, at an altitude of 333 m, having the following geographical coordinates: north latitude 46º 59’ and east longitude 22º 36’ (Pereş et al., 2019).

230
RESULTS AND DISCUSSION
Annual mean air temperature The thermal regime of air in the Vad-Borod depression is determined
by the particularities of air circulation, of the radiative factors and of the subjacent surface (Pereş, Köteles, 2011, 2013, 2015).
The multiannual mean of air temperature for the 1970-2019 period in Borod is 9.6ºC.
The particularities of the subjacent active surface, the differences in altitude between the intermontane depression and the high peaks it is surrounded by result in spacial variations of the multiannual mean of air temperature in the area included in the study (Dragotă, Gaceu, 2002; Ciulache, 2002; Cristea, 2003; Dumiter, 2007; Köteles , Pereş, 2010).
The highest annual mean air temperature value in the period included in the study was recorded in 2019, 11.4ºC, in 2014 the mean was close, 11.3ºC, while in 2018 the annual mean was 11.2ºC. The lowest annual mean temperature was 8.1ºC and it was recorded in 1985, a value close to this one was recorded in 1980 too, 8.2ºC (Fig. 1).
Fig. 1. Annual mean air temperature evolution in Borod, 1970-2019
According to the above data, over the entire area of the depression the
variations of the annual mean temperatures are low, 3.3ºC, a value which results from the difference between the highest annual mean temperature, (11.4ºC in 2019) and the lowest annual mean temperature (8.1ºC in 1985). This value is due to the moderating action of the peaks surrounding the depression.
Deviations of annual mean air temperatures from the multiannual mean
The annual mean temperatures for the 1970-2019 period represent the „normal” or the multiannual middleness of temperature at the Borod

231
weather station, against which it is possible to show the direction and the value of deviations from one year to another. In order to highlight that, the deviations of annual values against the multiannual mean were calculated for the 1970-2019 period
Values higher than the multiannual mean were recorded in 36% of the years included in the study, the deviation values varied between 0.1ºC and 1.8ºC, the highest positive deviation being recorded in 2019, and the lowest in 1999 (Fig. 2).
Fig. 2. Variation of annual mean temperature deviations against the multiannual
mean in Borod, 1970-2019
Table 1 Multiannual mean temperature and the deviations of annual mean temperatures against the
multiannual mean in Borod, 1970-2019 Multiannual mean temperature Deviation
9.6ºC
18 years – Positive deviations - 36% 28 years – Negative deviations - 56%
4 years – No deviations - 8% Source: data provided for processing by the A.N.M. Archives
The years with negative deviations give the majority, 56% of the
cases, and the negative deviations varied between -0.1ºC and -1.5ºC. The highest negative deviation was recorded in 1985 (the annual mean was 8.1ºC), and the lowest 1972, 1989, 2004 and 2006 (with annual means of 9.5ºC) (Fig. 2).
There were four years 1975, 1979, 1992 and 2001, when the annual mean value was equal to the multiannual mean, that is, 9.6ºC (these were four years without deviations).
The four years give 8% of the cases, they are the ones with no deviations from the multiannual mean (9.6ºC).

232
Monthly mean air temperature The monthly mean temperature varies according to the amount of
solar energy reaching the surface of the Earth during a year. The monthly mean temperature follws a natural pattern, it increases
beginning with January, when the lowest monthly thermal mean is recorded, until July, a month with the highest monthly mean temperature, after which the monthly mean air temperature pattern is a decreasing one until the end of the year. So, the lowest monthly air temperature in Borod is recorded in January, with a mean value of -1.1ºC, and the highest in July, when it reaches 19.6ºC, which gives an amplitude of 20.7ºC (Fig. 3).
Fig. 3. Monthly pattern of air temperature in the Borod area, 1970-2019
Looking at the monthly mean thermal values in Borod, it can be seen
that after reaching the lowest mean value in January, the temperatures start to increase beginning with February, when they become positive, then they reach the maximum in July, after which they will decrease until December.
The annual mean thermal amplitude of 20.7ºC shows a lower degree of continentalism as compared with the eastern part of the country, where this value exceeds 24 – 25ºC, and last but not least, the thermal moderator role of the landforms.
In winter, the mean temperature is negative only in January, while in December and February as compared to January the temperatures are higher by approximately 1ºC, which is due to an intense cyclonic circulation. In January the cyclonic circulation is less active, while the anticyclonic circulation from north-east becomes stronger and the invasion of arctic or polar cold air leads to the lowest mean air temperature.
The winters in the Borod Depression are usually moderate, without strong frosts, due to the western circulation and due to the fact that it is more protected from the invasions of the polar air – continental from east and north-east (Gaceu, 2005).

233
In spring, due to the influence of the westen circulation and the spreading of the ridge of the Azores High over the south of Europe, spring comes faster than in the depressions from the eastern part of the country, but later than in the plain areas, which is shown by the mean value of April: 9.6ºC in Borod, as compared to 10.7ºC in Oradea (Măhăr, 2001, 2006; Moza, 2009; Pereș, 2012).
In the summer, due to western influences and to the altitude of landforms, the air temperature is not too high, 19.6ºC, as compared to 21.4ºC in Oradea.
In autumn, beginning with September, the temperature decreases sharply, the annual means of these months vary between 14.6ºC in September and 4.8ºC in November. This cooling of the air temperature is due to the intensification of air cooling through radiative processes and to the increase of cold air advection as a result of the influence of the Siberian anticyclon.
The analysis of the months’ thermal differences shows that the changes of mean temperature values from one month to another happen slowly in the summer and winter months (1-2ºC), more obvious thermal contrasts occur in the months of the transition seasons (10ºC). CONCLUSIONS
The multiannual mean of air temperature for the period included in the study is 9.6ºC. The highest annual mean air temperature value was recorded in 2019, 11.4ºC, and the lowest in 1985, 8.1ºC. The variations of annual mean temperatues are relatively small, their amplitude is 3.3ºC, which is the difference between the highest annual mean temperature (11.4ºC in 2019) and the lowest annual mean temperature (8.1ºC in 1985) for the period studied. This value is due to the moderating action of the peaks surrounding the depression.
The monthly mean temperature follows a natural pattern over the year, thus, the lowest mean air temperature in the Borod depression is recorded in January, a value of -1.1ºC, and the highest in July, when it reaches 19.6ºC, which gives an amplitude of 20.7ºC. REFERENCES
1. Ciulache S., 2002, Meteorologie şi climatologie, Editura Universitară Bucureşti. 2. Cristea M., 2003, Temperatura aerului în bazinul hidrografic al Crişurilor, Analele
Universităţii din Oradea, Seria Geografie, Tom. XIII, pag.77-80. 3. Dragotă C., Gaceu O., 2002, Consideraţii asupra temperaturilor extreme în Munţii
Bihor şi Vlădeasa, Universitatea „Ovidius” Constanţa. 4. Dumiter A. F., 2007, Clima şi topoclimatele oraşului Oradea, Editura Universităţii
din Oradea.

234
5. Gaceu O., 2005, Clima şi riscurile climatice din Munţii Bihor şi Vlădeasa, Editura Universităţii din Oradea.
6. Köteles N., Pereş A. C., 2010, Air’s temperature at surface of the soil (level 0 m), in the area of Oradea city. Analele Universităţii din Oradea, Fascicula Protecţia Mediului, Vol. XIV, Anul 15, International Symposium “Risk Factors for Environment and Food Safety”, Faculty of Environmental Protection, November 5 - 6, Oradea 2010, Editura din Oradea, 2010, ISSN 1583-4301, pag. 821-828.
7. Măhăra Gh., 2001, Meteorologie, Editura Universităţii din Oradea. 8. Măhăra Gh., 2006, Variabilităţi şi schimbări climatice, Editura Universităţii din
Oradea. 9. Moza A. C., 2009, Clima şi poluarea aerului în bazinul hidrografic Crişul Repede,
Editura Universităţii din Oradea. 10. Pereş A. C., Köteles N., 2011, The Yearly and Monthly Average Temperature of
the Air in Borod Depression, Analele Universităţii din Oradea, Fascicula Protecţia Mediului, Vol. XVII, Anul 16, Editura Universităţii din Oradea, 2011, ISSN 1224-6255, pag. 809-814.
11. Pereş A. C., 2012, Meteorologie şi climatologie, Editura Universităţii din Oradea. 12. Pereş A. C., Köteles N., 2013, The Thermic Regime of the Crişurilor Plain,
Natural Resources and Sustainable Development, University of Oradea Publishing House Oradea, ISBN 978-3-902938-02-2; ISSN 2066-6276, pp. 399-404.
13. Pereş A. C., Köteles N., 2013, The frequency of the days with different temperature values from Holod inter hillock hollow area, Analele Universităţii din Oradea, Fascicula Protecţia Mediului Vol. XXI, Anul 18, Editura Universităţii din Oradea 2013, ISSN 1224-6255, pag. 671-676.
14. Pereş A. C., Köteles N., 2015, Extreme Temperatures in the City of Oradea, Analele Universităţii din Oradea, Fascicula Protecţia Mediului Vol. XXV, Anul 20, Editura Universităţii din Oradea 2015, ISSN 1224-6255, pag. 261-266.
15. Pereş A. C., Costea M., Amarie S., Bodi R., 2019, Absolute Extreme Air Temperatures in the Vad-Borod Depression, Analele Universităţii din Oradea, Fascicula: Protecţia Mediului Vol. XXXIII, Anul 24, Editura Universităţii din Oradea, ISSN 1224-6255, pag. 207-210
16. Posea A., 1977, Crişul Repede, în vol. „Câmpia Crişurilor, Crişul Repede, Ţara Beiuşului”. Cercetări în Geografia României, Editura Ştiinţifică şi Enciclopedică, Bucureşti.