aluminoborate glass wasteforms to immobilize rare-earth oxides
Upload
khangminh22Category
view
2download
0
AN OVERVIEW OF THEUSEFULNESS AND STRATEGICVALUE OF RARE EARTH METALS
1Volker Zepf
Scientist at the Chair of Resource Strategy, University of Augsburg, Germany
1. CRITICAL RARE EARTHSThe rare earth elements (REEs), also called rare earth metals or just rare earths (REs), have been themost prominent and discussed raw materials since about 2009. In that year, China announced areduction in REE export quotas of nearly 50% to 30,000 tons (t)1 rare earth oxides (REOs) (the usualmeasure for traded RE materials) (Zepf, 2013). Thus, a supply risk was feared because China has a defacto production monopoly. At the same time, the economic importance of the REEs emerged becauseof important functions in environmentally friendly products such as energy-saving lamps, electric cars,and (some types of) wind turbine generators (WTGs). Consequently, REEs have repeatedly beenidentified as some of today’s most critical elements.
The supply risk issue gained further weight when some obvious environmental problems in REEmining were reported (Bradsher, 2009). To overcome these risky situations, new REE mines outsideChina were planned and set up. Research for better materials efficiency and substitutions was pushed.Eventually, the former mine at Mountain Pass, California, and the Mount Weld mine in southwesternAustralia went into commission around 2012. There, new mining, separation, and refining technologywas installed to allow environmentally sound production. Yet today, both companies struggle with lowprices for REEs, which cause huge financial deficits so that even bankruptcy is imminent. Despitethese problems, the companies try to keep operations running. Nevertheless, REEs have inherentspecial chemical and physical characteristics that allow extraordinary functionalities, and thus REEsare ideal ingredients for a huge variety of applications.
This introductory chapter will explain these issues briefly to show the whole complexity of theproduction and use of the REEs. The introduction gives an overview without too much detail, becausethe following chapters will provide these analyses.
1.1 WHAT REEs AREThe International Union of Pure and Applied Chemistry classifies REEs as a group of 17 elements inthe third group of the periodic table of elements (Connelly, 2005). The REEs thus include scandium
CHAPTER
1Note: Commas have been used as 1000 dividers; points indicate decimals.
Rare Earths Industry. http://dx.doi.org/10.1016/B978-0-12-802328-0.00001-2
Copyright © 2016 Elsevier Inc. All rights reserved.3

(Sc, atomic number 21), yttrium (Y, 39), and the lanthanides, which are lanthanum (La, 57), cerium(Ce, 58), praseodymium (Pr, 59), neodymium (Nd, 60), promethium (Pm, 61), samarium (Sm, 62),europium (Eu, 63), gadolinium (Gd, 64), terbium (Tb, 65), dysprosium (Dy, 66), holmium (Ho, 67),erbium (Er, 68), thulium (Tm, 69), ytterbium (Yb, 70), and lutetium (Lu, 71). Promethium is notusually included in the discussion because it is the only radioactive REE and principally it does notoccur in nature. Next to the umbrella term “REE,” the elements are further grouped into light REEs(LREEs) and heavy REEs (HREEs), and some authors such as Kingsnorth (2010) add a medium classof REEs (MREEs). The attributions to these groups are not distinct: the United States (US) GeologicalSurvey (USGS) calls La to Gd the LREEs and Tb to Lu and Y the HREEs (USGS, 2014). Kingsnorth,however, uses La to Nd as LREEs, Pm to Gd as MREEs, and Tb to Lu plus Y as HREEs (Kingsnorth,2010). Introduction of the three groups may become common because the new Chinese tax ratesdifferentiate among LRE, MRE, and HRE, i.e., light, medium, and high rare earth–rich concentrates(Argus, 2015).
The term “rare earth” traces back to the time of discovery of the elements, at around 1800. Theorigin and reason for calling the materials “rare” are not explicit, but the etymological explanationgiven by Reiners (2001) is helpful. She argues that the adjective “rare” was used from the fifteenthcentury onward for something strange, extraordinary, and astonishing (Reiners, 2001). Thus, “rare”does not refer to a rare occurrence but to a strange habitus of the materials. Today, the low concen-trations of REEs in ore bodies may be considered as being rare. “Earth,” however, is clearly a commonword for oxidic materials in the nineteenth century.
1.2 CHEMICAL AND PHYSICAL PROPERTIESMuch information about special chemical and physical properties is provided in standard scientificencyclopedias and schoolbooks. Therefore, here only a few specialties will be discussed becausethey explain both challenges during separation and refining and potential application areas forREEs. In general, with increasing atomic numbers, atoms attach one more electron, which adds tothe outer electron orbital and the atom radii become larger. For the lanthanides not only the outershell but also the lower-lying 4f-orbital is being filled with electrons. This results in a similar outer(electron) appearance of all lanthanides but also stronger forces inside the atoms. As a consequence,the atomic radii are decreasing with increasing atomic number, a phenomenon known as lanthanidecontraction. Some REE atoms have atomic radii similar to rock-forming elements, which explainswhy REEs are often found in rocks that contain calcium, thorium, uranium, and strontium (for moreinformation see Zepf, 2013). However, the physical properties have no such similarities but ratherdifferences. Some REEs have ideal magnetic behavior, such as Gd, Dy, Nd, and Sm, whereas otherssuch as Er and Tb inherit sharply defined energy states that can be used efficiently in lighting andlaser applications.
2. THE CRITICALITY ISSUEThe criticality of the REEs has been determined in numerous studies. One of the first articlesaddressing REEs as “critical resources for high technology” was the USGS in a Fact Sheet published in2002 (USGS, 2002). A further remarkable study, Minerals, Critical Minerals, and the US Economy,published in 2008 by the National Research Council (NRC), developed the well-known criticality
4 CHAPTER 1 AN OVERVIEW OF THE USEFULNESS AND STRATEGIC VALUE

matrix introducing as main indicators “supply risk” and the “impact to supply restriction”; thelatter indicator is about equivalent to the term economic importance. The group of the REEs wasidentified as highly critical in supply risk and nearly high concerning the impact of supply re-striction (NRC, 2008).
In 2009, Angerer et al. conducted a profound study on raw materials for emerging technologies inwhich neodymium was ranked the second most critical element (Angerer et al., 2009). In 2010, theEuropean Commission issued the Critical Raw Materials for the EU, a report of the ad hoc workinggroup that pinpointed the group of the REEs as critical with the highest supply risk and mediumeconomic importance (European Commission, 2010).
A sequel to the NRC work was the Critical Materials Strategy published in 2010 by the USDepartment of Energy in which in the matrix as developed by the NRC individual REEs were iden-tified as being the most critical elements under investigation (US DOE, 2010). The update 1 year laterconfirmed the status (US DOE, 2011). Consultants and press media joined the publication circle, e.g.,Reuters’ analysis of the “Fight for Rare Earths” (Reuters, 2010). Hurst (2010) reported on the ChineseREE industry and explained lessons to be learned.
In 2011, Ernst and Young (2011) reported on REEs as technology minerals for which deficits insupply were identified. The focus was more on mining ventures rather than on general criticality. In thesame year, the European Joint Research Center dealt with “Critical Metals in Strategic EnergyTechnologies” and attributed to dysprosium and neodymium an overall high risk based on market andpolitical factors (JRC, 2011). In 2014, the United Nations Conference on Trade and Developmentproduced a special report on REs that discussed global high dependency on Chinese REE productionand the importance of REEs for defense applications (UNCTAD, 2014). Since about 2010, many moresuch studies and sequels with more or less the same assessment showed up, so that from thisperspective the extraordinary importance and criticality of REEs were underlined.
3. OCCURRENCES, MINING, AND PRODUCTION3.1 ABUNDANCE AND GEOLOGYThe attribute of rarity in the name of “REEs” requires a closer look. There are 12 elements in theearth’s crust, which together comprise more than 99% of the mass (O, Si, Al, Fe, Ca, Mg, Na, K, Ti, H,Mn, and P) (Skinner, 1976). All other elements share the remaining 1%. Among them are the REEs.Within this group of relatively rare elements, the REEs range in the lower half, whereas severalelements seem fairly abundant. According to the research of Rudnick and Gao (2003), yttrium in theupper continental crust is about as abundant as lithium; cerium is about as abundant as zinc; neo-dymium and lanthanum are about as abundant as copper, and even dysprosium is about twice asabundant as gold or eight times as abundant as platinum. However, these citations of abundance giveonly average concentrations and mass values. The numbers do not reflect typical concentrations ofelements in rocks that develop during petrogenesis. Gold and copper, for example, occur in nativestates; i.e., these elements aggregate (sometimes) to nugget types, whereas REEs never occur in suchnative states. An interesting insight gives the annual mining production quantities of yttrium at anestimated 7000 t and lithium at 36,000 t; copper 18.7 million t; lanthanum2 about 25,300 t and
2Assuming an average ore concentration of 23% La and 18% Nd; calculated with an annual production of 110,000 t.
3. OCCURRENCES, MINING, AND PRODUCTION 5

neodymium1 19,800 t; and cerium1 55,000 t and zinc 13.3 million t (USGS, 2015b). Thus, the messageof the table describing abundance is of no real help when talking about actual extraction potential.
The major ores from which REEs are being produced are bastnaesite, monazite, xenotime, and ion-adsorption clays. Bastnaesite is a fluorocarbonate mineral with the basic formula3 [(Ln) (CO3) F]composed of various additions of LREE and a few HREEs (Zepf, 2013). This ore is the primaryfeedstock of the Chinese Bayan Obo and the California Mountain Pass Mine. Monazite, a phosphatemineral with the typical formula [(Ce, La, Y, Th)PO4], can contain additions of other LREEs and a fewHREEs. A major problem when processing monazites is radioactive residues, which have to be treatedaccordingly.Monazite is the main ore of the AustralianMountWeldmine. Xenotimes and ion-adsorptionclays contain relatively high percentages of HREE, but these minerals themselves are rare or have anoverall low REE concentration. Main extraction areas of these minerals are in southeastern Chineseprovinces.
3.2 MINING AND PRODUCTION3.2.1 Historical DevelopmentThe first commercial use of REEs was probably the invention of Auer-Light and Auermetal used forlighter flints; both products were discovered and merchandized by Austrian chemist Carl Auer vonWelsbach around the year 1900 (Zepf, 2013). The raw materials were heavy sand that served as ballastin ships. Over the course of the world wars heavy sand mining was pushed in a search for radioactivematerials for nuclear research mainly in the US. This first phase of REE mining is called the MonazitePlacer era (USGS, 2002).
With the invention of color television, the need for europium increased rapidly, and the discovery ofthe REE deposit at Mountain Pass in California in the mid-1960s can be considered the breakthrough ofREE mining; this second phase is called the Mountain Pass era, which ended in the mid-1980s. In the1950s, the iron ore deposit in Bayan Obowas discovered, which soon showed considerable REE content.Major production of these REEs began in the mid-1980s and became the primary producer of REOsin theworld.With closure of the mine atMountain Pass around the year 2000, monopoly over productionultimately went to China. This third phase is called the Chinese era (USGS, 2002).
3.2.2 Global Production and ReservesFigure 1 shows the development of global REE production from the 1950s to 2014. In the 1950s theglobal production of REOs reached about 1000 t and it doubled in 1960. In 1970 production grew to16,000 t; in 1980 to 27,000 t; in 1990 to 53,000 t; and in 2000 to 90,000 t, reaching two peaks in 2006and 2009 at 137,000 and 135,000 t, respectively. Since 2009, global production declined for threeyears to 110,000 t in 2014 (USGS, 2015a). In addition to these numbers, considerable illegal mining isprobably present.
Annual illegal production is estimated to be 40,000 t (Xinhua, 2014). At the final conference of theEuropean Rare Earths Competency Network, Kingsnorth stated that China admitted a 40% share ofillegal magnetic RE supply (Moores, 2014). Both numbers referring to illegal production areemphasized only to be estimates. It is also uncertain what these numbers actually tell: Does 40,000 trefer to REOs and does it have to be added to official production values? What elements belong to the
3Ln stands for lanthanides.
6 CHAPTER 1 AN OVERVIEW OF THE USEFULNESS AND STRATEGIC VALUE

magnetic RE supply? It is likely that considerable illegal mining and trade are present, but actual dataremain obscure.
Annual global production numbers are known; quantitative shares of the individual REEs are notavailable, however. The numbers can and have to be interpolated from known concentrations of singleelements in the mined ores. Of the REEs contained in the bastnaesite of the Bayan Obo ore body, 50%is cerium (CeO2), lanthanum comprises about 25% (La2O3), and the neodymium content is about 17%(Nd2O3) (Zhi Li and Yang, 2014). Using a simplified assumption that the entire global production isderived from such ores, the individual share can be deduced with reasonable reliability for LREEs: In2014, with an annual production of 110,000 t REOs, cerium contained is 55,000 t, lanthanum is27,500 t, and neodymium 18,700 t.
Various separation and refining techniques are explained, e.g., by Gupta and Krishnamurthy(2005), so just one major aspect needs recognition: that during separation and refining in a first step,cerium and lanthanum always have to be separated before other REEs can be extracted. This meansthat the separation of the cheapest REEs, cerium and lanthanum, requires a lot of beneficiation cost.The supply of these two elements is likely higher than demand. For lanthanum, the systemic substituteof lithium ion battery technology also reduces demand.
3.2.3 ReservesGlobal REE reserves in 2014 are given as 130 million t REO. Until 2008, global reserves were88 million t (USGS, 2009), so that today’s reserves are the result of recent exploration successes. Fromthese reserves, 55 million t belong to China (42%), 22 million t are Brazilian (17%), and Australia andthe US together own 5 million t, which is less than 5% of global reserves (USGS, 2015b). It is possible
FIGURE 1
Rare earth element production, 1950–2014. Notes: The production data refer to the lanthanides,
i.e., excluding yttrium and scandium production. Data given in metric tons (1 t = 1000 kg).
Sources: USGS Minerals Yearbooks 1994–2012; USGS Mineral Commodity Summarises 2015.
3. OCCURRENCES, MINING, AND PRODUCTION 7

that some of the current exploration projects will detect even more deposits so that reserve figurescould increase even more. Based on current annual production of 110,000 t REO and some130 million t of reserves, a reserves-over-production (R/P) value of nearly 1200 years results, a rangethat is one of the longest of all elements known. This fact should have a comforting effect, but REEsare still considered critical elements, because the topic of reserves is no criterion for determiningcriticality. Also, R/P values are only of theoretical quality because somebody has to start a miningproject, which requires large investments for several years before some cash back can be expected.Obviously only long-term considerations based on positive future earnings, i.e., high prices for rawmaterials, may push such projects. However, recent mining projects showed that predictions have beentoo optimistic.
3.2.4 Major MinesToday, the major active REE mines are located in China, the US, and Australia, with several globalprojects having reached mature states of development. In China, the world’s largest REE mine islocated in Bayan Obo, Inner Mongolia, with separation and refining facilities some 150 km south inBaotou. Further mining areas are in Sichuan and in the southeastern provinces, where mainly HREEsare being produced. In the US, the former Mountain Pass mine was reopened in 2012 and was plannedto produce about 20,000 t REOs per year with the option to ramp up production to 40,000 t REOs. Inthe 2014 annual report, however, the company reported production of about 5000 t REO, but alsoconsiderable risks and problems, so that prolonged operation is not guaranteed. Current productionwill increase only when market conditions improve (Molycorp, 2015c).
The Australian Lynas Corp. opened the Mount Weld mine in southwestern Australia, where REEsare mined from phosphate ores and the company produced nearly 4000 t REO in 2014 (Lynas, 2015).Plans dated 2010 talked about the production of 22,000 t REOs in 2014 (Lynas, 2010), which showsthe error of this prediction. Numerous other exploration projects were or are ongoing and a few havereached mature planning stages. Elsner (2011) reported 381 known RE projects worldwide (Elsner,2011) at different progress stages, and Technology Metals Research (TMR) provided an updated list ofadvanced RE projects, the TMR Advanced Rare-Earth Projects Index, which currently contains 53 inan advanced state. Among them are projects with huge ore bodies, e.g., in Greenland, Canada, the US,Kenya, Australia, Brazil, South Africa, and Russia (Hatch, 2015).
Predictions for future REE mining were and are controversial. Basically, all future demand pre-dictions, as presented by mining companies, were too optimistic. In 2010, Lynas Corporation esti-mated global demand to reach 182,000 t in 2014 (Lynas, 2010). Consultants estimated demand for2015 to reach 185,000 t given a data uncertainty of �15% (Chegwidden and Kingsnorth, 2010).Factually, production in 2014 was 110,000 t REO (USGS, 2015b); the first prediction was off by about50%; how accurate the second estimate was has yet to be seen. It is, of course, extremely difficult topredict market development, especially in the case of REEs, when supply risks lead to increasedresearch for material efficiency and substitutes and thus change demand.
3.2.5 EcologyIn 2009, journalists reported on damaging effects to humans and the environment from REE miningand separation. Hilsum reported from Baotou, where tailing ponds were full of acid and chemicals(Hilsum, 2009), and Bradsher addressed southeast Chinese mining of ionic clays in which REEs were
8 CHAPTER 1 AN OVERVIEW OF THE USEFULNESS AND STRATEGIC VALUE
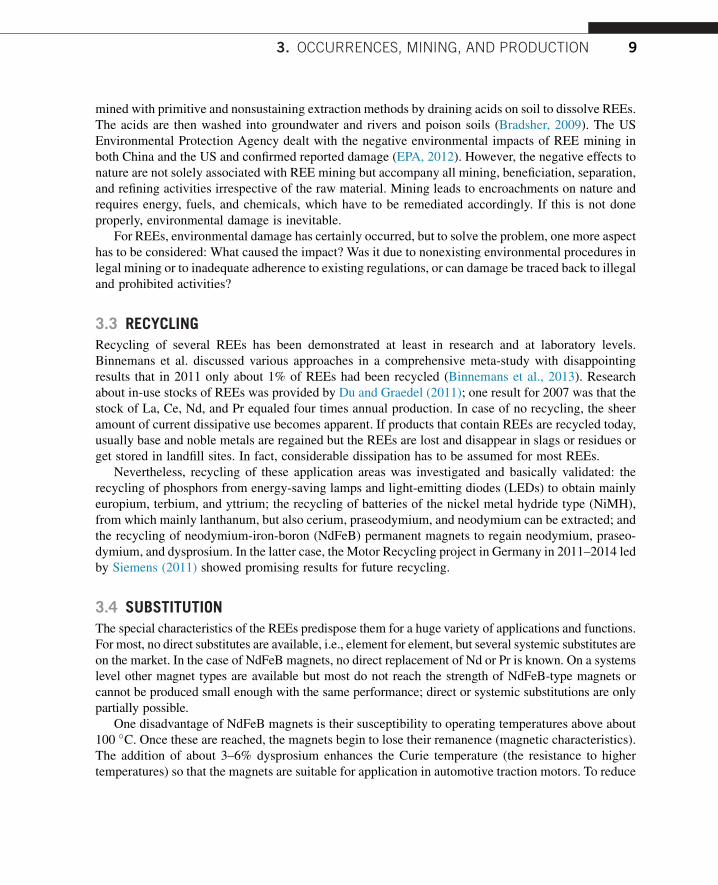
mined with primitive and nonsustaining extraction methods by draining acids on soil to dissolve REEs.The acids are then washed into groundwater and rivers and poison soils (Bradsher, 2009). The USEnvironmental Protection Agency dealt with the negative environmental impacts of REE mining inboth China and the US and confirmed reported damage (EPA, 2012). However, the negative effects tonature are not solely associated with REE mining but accompany all mining, beneficiation, separation,and refining activities irrespective of the raw material. Mining leads to encroachments on nature andrequires energy, fuels, and chemicals, which have to be remediated accordingly. If this is not doneproperly, environmental damage is inevitable.
For REEs, environmental damage has certainly occurred, but to solve the problem, one more aspecthas to be considered: What caused the impact? Was it due to nonexisting environmental procedures inlegal mining or to inadequate adherence to existing regulations, or can damage be traced back to illegaland prohibited activities?
3.3 RECYCLINGRecycling of several REEs has been demonstrated at least in research and at laboratory levels.Binnemans et al. discussed various approaches in a comprehensive meta-study with disappointingresults that in 2011 only about 1% of REEs had been recycled (Binnemans et al., 2013). Researchabout in-use stocks of REEs was provided by Du and Graedel (2011); one result for 2007 was that thestock of La, Ce, Nd, and Pr equaled four times annual production. In case of no recycling, the sheeramount of current dissipative use becomes apparent. If products that contain REEs are recycled today,usually base and noble metals are regained but the REEs are lost and disappear in slags or residues orget stored in landfill sites. In fact, considerable dissipation has to be assumed for most REEs.
Nevertheless, recycling of these application areas was investigated and basically validated: therecycling of phosphors from energy-saving lamps and light-emitting diodes (LEDs) to obtain mainlyeuropium, terbium, and yttrium; the recycling of batteries of the nickel metal hydride type (NiMH),from which mainly lanthanum, but also cerium, praseodymium, and neodymium can be extracted; andthe recycling of neodymium-iron-boron (NdFeB) permanent magnets to regain neodymium, praseo-dymium, and dysprosium. In the latter case, the Motor Recycling project in Germany in 2011–2014 ledby Siemens (2011) showed promising results for future recycling.
3.4 SUBSTITUTIONThe special characteristics of the REEs predispose them for a huge variety of applications and functions.For most, no direct substitutes are available, i.e., element for element, but several systemic substitutes areon the market. In the case of NdFeB magnets, no direct replacement of Nd or Pr is known. On a systemslevel other magnet types are available but most do not reach the strength of NdFeB-type magnets orcannot be produced small enough with the same performance; direct or systemic substitutions are onlypartially possible.
One disadvantage of NdFeB magnets is their susceptibility to operating temperatures above about100 �C. Once these are reached, the magnets begin to lose their remanence (magnetic characteristics).The addition of about 3–6% dysprosium enhances the Curie temperature (the resistance to highertemperatures) so that the magnets are suitable for application in automotive traction motors. To reduce
3. OCCURRENCES, MINING, AND PRODUCTION 9

the need for dysprosium, which is one of the rare REEs, intensive research has begun to identifysubstitutes for dysprosium or even for magnets with no REEs (ARPA-E, 2015; Arnold Magnetics,2013).
In the case of wind turbines, those based on REE magnets do not have a direction substitutionmaterial; on the systemic level, however, there are other efficient technologies in operation such asasynchronous drive turbines or electrically excited direct drive WTGs.
For phosphors in lighting applications, no potential substitutes are currently available, but theinvention of LEDs led to one way to reduce phosphor quantities. Batteries of the NiMH type receivedcompetition by lithium-ion technology, which has better energy densities and thus smaller sizes, fasterrecharging, no memory effect, less discharging, and longer power availability (Bosch, 2015).
In summary, the search for substitutes sounds ambiguous because for several applications systemicalternatives are available (e.g., wind turbines); the R/P is more than 1200 years, and research onrecycling is pushed forward.
4. APPLICATIONSThe REEs are a group of 17 elements that have some similarities but also individual characteristics sothat each element has a variety of applications, summarized in Table 1.
It should be noted that this list does not show which quantities of REEs are required in the variousapplications, nor does it say whether demand and supply are balanced or if there exist surpluses ordeficits of supply.
Another depiction of applications is often used along application areas such as permanent magnets,phosphors, battery alloys, fluid catalytic cracking (FCC), ceramics, glass additives, polishing powders,auto catalysts, and metallurgy. Table 2 shows the use of selected REEs in various applications.
A dominant argument is often cited that REEs are indispensable or at least necessary for high-technology applications, lifestyle products, and products and systems that guarantee the changeoverto a low-carbon energy society. The consideration that REEs are required for high-technology productsis correct, but this message does not say which element is required for which application in whatquantity. Cerium, for example, is required to produce automotive catalysts to enable, together withnoble metals platinum or palladium, an efficient exhaust emission control. This application is certainlya high-tech one and serves the environment. Cerium is currently the most available REE and thus is notcritical with respect to general physical existence, nor is there a supply risk expected, because Chinaitself probably is interested in selling huge amounts of (cheap) cerium to obtain at least some cash backto support operations.
The statement that wind turbines require REEs is often heard, but again this dogmatic-sounding“fact” usually implies a wrong perception, that all wind turbines require REEs. This definitely isnot the case. The share of asynchronous wind technology that does not contain REE-based generatorswas at about 82% at the end of 2013 (Smith, 2014), with 318 GW of wind energy installed globally(GWEC, 2014). The remaining 18% were direct drive systems, of which about half were ENERCONturbines that use separately excited magnets using copper wiring (Zepf, 2015). In fact, about 9% orabout 30 GWof installed WTGs are based on REE magnets. Direct drive systems incorporate featuresand characteristics that make them more suitable or advantageous for locations such as offshorewind parks.
10 CHAPTER 1 AN OVERVIEW OF THE USEFULNESS AND STRATEGIC VALUE
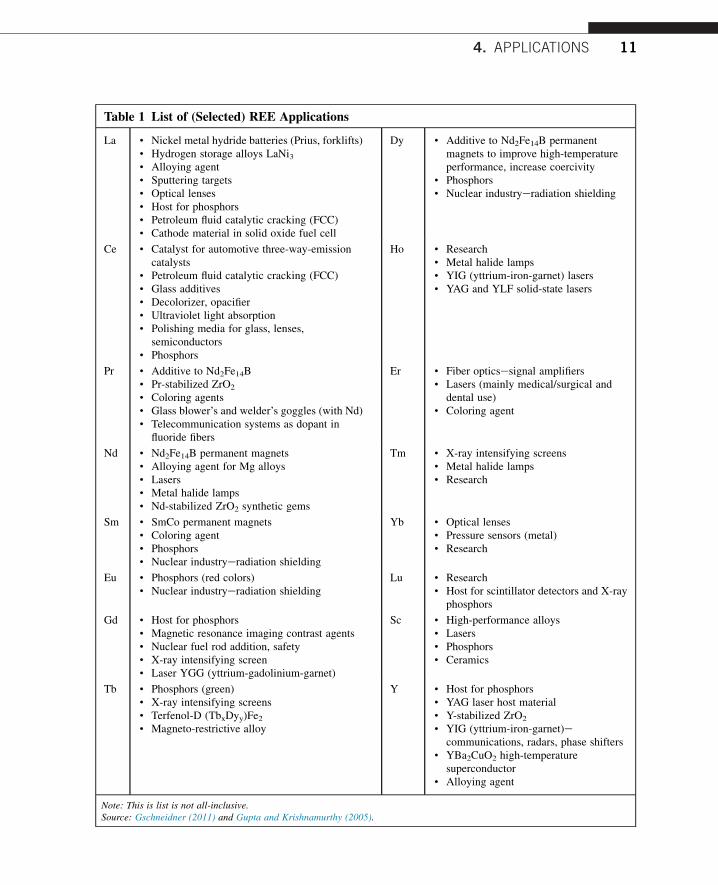
Table 1 List of (Selected) REE Applications
La · Nickel metal hydride batteries (Prius, forklifts)
· Hydrogen storage alloys LaNi3· Alloying agent
· Sputtering targets
· Optical lenses
· Host for phosphors
· Petroleum fluid catalytic cracking (FCC)
· Cathode material in solid oxide fuel cell
Dy · Additive to Nd2Fe14B permanentmagnets to improve high-temperatureperformance, increase coercivity
· Phosphors
· Nuclear industryeradiation shielding
Ce · Catalyst for automotive three-way-emissioncatalysts
· Petroleum fluid catalytic cracking (FCC)
· Glass additives
· Decolorizer, opacifier
· Ultraviolet light absorption
· Polishing media for glass, lenses,semiconductors
· Phosphors
Ho · Research
· Metal halide lamps
· YIG (yttrium-iron-garnet) lasers
· YAG and YLF solid-state lasers
Pr · Additive to Nd2Fe14B
· Pr-stabilized ZrO2
· Coloring agents
· Glass blower’s and welder’s goggles (with Nd)
· Telecommunication systems as dopant influoride fibers
Er · Fiber opticsesignal amplifiers
· Lasers (mainly medical/surgical anddental use)
· Coloring agent
Nd · Nd2Fe14B permanent magnets
· Alloying agent for Mg alloys
· Lasers
· Metal halide lamps
· Nd-stabilized ZrO2 synthetic gems
Tm · X-ray intensifying screens
· Metal halide lamps
· Research
Sm · SmCo permanent magnets
· Coloring agent
· Phosphors
· Nuclear industryeradiation shielding
Yb · Optical lenses
· Pressure sensors (metal)
· Research
Eu · Phosphors (red colors)
· Nuclear industryeradiation shieldingLu · Research
· Host for scintillator detectors and X-rayphosphors
Gd · Host for phosphors
· Magnetic resonance imaging contrast agents
· Nuclear fuel rod addition, safety
· X-ray intensifying screen
· Laser YGG (yttrium-gadolinium-garnet)
Sc · High-performance alloys
· Lasers
· Phosphors
· Ceramics
Tb · Phosphors (green)
· X-ray intensifying screens
· Terfenol-D (TbxDyy)Fe2· Magneto-restrictive alloy
Y · Host for phosphors
· YAG laser host material
· Y-stabilized ZrO2
· YIG (yttrium-iron-garnet)ecommunications, radars, phase shifters
· YBa2CuO2 high-temperaturesuperconductor
· Alloying agent
Note: This is list is not all-inclusive.Source: Gschneidner (2011) and Gupta and Krishnamurthy (2005).
4. APPLICATIONS 11

Table 2 Share of REEs in Various Application Areas
La(%)a
Ce(%)a
Pr(%)a
Nd(%)a
Sm(%)a
Eu(%)a
Gd(%)a
Tb(%)a
Dy(%)a
Y(%)a
CheckSum
DemandEstimate(2010)a
(%)a
ProductionEstimate:134,000 tREO(2010)a
(t REO)b
Permanentmagnets
23 69 2 1 5 100 24 32,160
Phosphors 9 10 5 2 5 69 100 6 8040
Batteryalloy
50 34 3 10 3 100 12 16,080
Fluidcatalyticcracking
90 10 100 16 21,440
Ceramics 17 12 6 12 53 100 1 1340
Glassadditives
24 66 1 3 2 96 8 10,720
Polishingpowders
31 65 4 100 15 20,100
Autocatalysts
5 90 2 3 100 7 9380
Metallurgy 26 52 5 17 100 9 12,060
Notes: Percentages show the share of the single REEs in the application area. For example, FCC means that from all REEs used, 90% is La and 10% is Ce. These values have noconnection with actual quantitative numbers, nor do they hint of supplyedemand (im)balances.Actual production in 2010 was 126,000 t REO, as reported by the USGS (2015b), p. 2012, Minerals Yearbook Rare Earths. Advanced release as of February 2015.aLynas (2010): Investor Presentation, March 2010.bCalculated using demand estimate percentages with estimated production for 2010.
12
CHAPTER1
AN
OVERVIEW
OFTHEUSEFULNESSANDSTRATEGIC
VALUE

5. PRICE DEVELOPMENT AND CONSEQUENCESUntil about 2008 to 2009, the prices4 for REEs, which are not traded on the stock exchanges, wererelatively stable and moderate. In 2010, prices for basically all REEs increased moderately, and inearly 2011 prices soared to an unprecedented price peak in July 2011. This price exaggeration struckall REEs with some variations. Shares of stock markets of non-Chinese mining companies climbed inparallel, pushing their operational status. A way to break the Chinese production monopoly was insight. From the end of July onward, however, prices declined and the trend continued in principle untilmid-2015, with a few variations for some REEs in between.
The expectation of high market prices for critical elements is no longer valid. Deceasing pricescaused the shares of new mines to decline as well, so that today these companies face severe financialproblems. The change in the Chinese export system in 2015 raised different hopes. In January, theexport quota was revoked and in May, export taxes were relieved. Lower prices were expected bycustomers, and higher prices by producers as a result of new and clear regulations. Indeed, pricesdeclined even further, maybe because Molycorp, Inc., had filed a voluntary petition for relief underChapter 11 of the US Bankruptcy Code and applied for restructuring support (Molycorp, 2015a). Soon,press releases announced the end of the REE hype (e.g., DPA release published by FAZ, 2015).
6. POLITICS AND POLICIESThe often determined criticality of the REEs mainly caused by the Chinese production monopoly andthe export restrictions imposed on various REE products made the topic a geopolitical issue. Thefollowing information is based on Zepf (2013), who dealt with Chinese predominance in this case.
After closure of the US mine in Mountain Pass in 2000, China’s production monopoly was sub-stantiated. At the same time, the first export quotas were disseminated by China but were never used totheir fullest extent. In 2006 and 2008, Chinese companies imposed production and processing quotas.Export taxes and the reduction of export quotas for 2010 eventually led to a critical perceptionregarding the future supply of REEs. Accompanied by unprecedented price hype in mid-2011, fearsexisted that the supply of REEs could actually be at stake.
China argued that they had to solve severe environmental problems that occurred during REEmining and processing. Dispute settlements brought forward to the World Trade Organization (WTO)by the US, Japan, and Europe against this argument and against the Chinese practice of export re-strictions were partially granted (Zepf, 2013). As a consequence, China withdrew the export quota inthe beginning of 2015 and abolished the export taxes as of May 1, 2015. Instead, a new RE resource taxwas introduced to replace recent policies. The new rates are staggered with 11.5% for LREE productsout of Inner Mongolia and 27% for MREE and HREE products (LOC, 2015).
In the US, the monopolistic production of China was seen to be critical to the defense industry,which requires REEs for a variety of products and weapon systems; consequently, REEs were put highon the agenda (GAO, 2010). To break China’s dominance over production, numerous explorationprojects were started worldwide and a few mines have succeeded as far as having started production.Lost know-how in extractive REE industries has been reworked. Miners and industries at the end of the
4Market prices can be retrieved from Internet platforms such as www.metal-pages.com or www.asianmetal.com.
6. POLITICS AND POLICIES 13

production chain have started vertical integration-type cooperation to support mining and safeguardsupply. This is shown, for example, by signed cooperation between Molycorp, Shin Etsu, and Siemensto provide REE supply for magnet production and the subsequent manufacture of wind turbines over a10-year period (Molycorp, 2015b). Next, intensive research projects especially in the US and Europewere set up to investigate material efficiencies and search for partial or complete substitution of REEsin several applications. Options for recycling increasingly improved and research is focused onobtaining procedures to run large-scale recycling.
7. WHERE WE ARE TODAYWithout question, the REEs are some of the most interesting materials that show impressive char-acteristics in a huge variety of applications. These range from simple lighter flints to magnets forspeakers, motors, generators; special steels; optimized fluid catalytic cracking to achieve higher yieldsin oil refining; lasers; batteries; and many more. They allow the production of lightweight materialswith better strength with a few percent additions of REEs. Some of these products can help in lowcarbon technologies and applications and provide nice lifestyle gadgets. Other uses are relativelyprofane but still required. So, from an economic importance point of view, the REEs can certainly beconsidered of high value.
The supply side is dominated by the current and perhaps future production monopoly of China.Supply risks can be considered high because in principle only one supplier country is available. On theother hand, China itself is participating in the global market, so the risk may be lower than anticipated.Regulatory interventions in China’s export practices that were not according to WTO rules succeededat first because quotas and taxes have been canceled, but newly announced resource taxes may showthat in the end no lower prices in this respect can be expected. This may prove advantageous for China,for the environment (as more money potentially is available), and for non-Chinese miners, and higherprices may render economic recycling possible.
Rare earth elements have a vast array of functionalities that make these materials ideal candidatesfor applications and products in all aspects of life. The complex story of the REEs still needs to beentangled to understand their relationships and to identify solutions for REE use. This book addressesthese challenges to the benefit of future economic and ecologic REE use.
ACKNOWLEDGMENTSThe author’s work is sponsored by the Bayerisches Staatsministerium fuer Bildung und Kultus, Wissenschaft undKunst (Bavarian Ministry for Education, Culture, Science and Arts) under the graduate program “Resourcestrategic concepts for sustainable energy systems” at the University of Augsburg.
REFERENCESAngerer, G., Marscheider-Weidemann, F., Luellmann, A., Erdmann, L., Scharp, M., Handke, V., Marwede, M.,
2009. Raw Materials for Emerging Technologies. The Influence of Sector-specific Feedstock Demand onFuture Raw Materials Consumption in Material-Intensive Emerging Technologies. Final report – Abridged.Fraunhofer IRB Verlag, Stuttgart, Germany.
14 CHAPTER 1 AN OVERVIEW OF THE USEFULNESS AND STRATEGIC VALUE

Argus, 2015. Argus White Paper: Impact of Changes to Chinese Policy on the Rare Earth Market in 2015.Retrieved from: https://www.argusmedia.com/Methodology-and-Reference/w/media/4EFDC00E1F484177A8268ED9C9C95D27.ashx.
Arnold Magnetics, 2013. Energy Critical Magnetic Material Manufacturing Processes. Retrieved from: http://www.arnoldmagnetics.com/WorkArea/DownloadAsset.aspx?id¼5951.
ARPA-E, 2015. Program Overview REACT – Rare Earth Alternatives in Critical Technologies. Retrieved from:http://arpa-e.energy.gov/?q¼arpa-e-site-page/view-programs.
Binnemans, K., Jones, P.T., Blanpain, B., Van Gerven, T., Yang, Y., Walton, A., Buchert, M., 2013. Recycling ofrare earths: a critical review. Journal of Cleaner Production 51 (2013), 1–22. http://dx.doi.org/10.1016/j.jclepro.2012.12.037.
Bosch, 2015. Vergleich mit NiCd, NiMH (Comparison Li-Ion technology with NiCd and NiMH (translationof the author)). Retrieved from: http://www.bosch-professional.com/static/specials/li-ion/de/de/technology-comparison.html.
Bradsher, K., December 26, 2009. Earth-Friendly Elements, Mined Destructively. The New York Times.Chegwidden, J., Kingsnorth, D.J., 2010. Rare earths: facing the uncertainties of supply. In: Presentation at the
6th International Rare Earths Conference, Hong Kong, November 2010. Retrieved from: http://download.docslide.us/uploads/check_up03/192015/554c0dbeb4c905f1518b4632.pdf.
Connelly, N.G., 2005. Nomenclature of Inorganic Chemistry: IUPAC Recommendations 2005. The Red Book.Royal Society of Chemistry, Cambridge.
Du, X., Graedel, T., 2011. Global in-use stocks of the rare earth elements: a first estimate. Environmental Scienceand Technology 45, 4096–4101. http://dx.doi.org/10.021/es102836s.
Elsner, H., 2011. Kritische Versorgungslage mit schweren Seltenen Erden – Entwicklung “Gruener Technologien”gefaehrdet? (Critical supply of heavy rare earths – development of green technologies at stake? (translation bythe author)) Commodity Top News 36. Retrieved from: http://www.bgr.bund.de/DE/Gemeinsames/Produkte/Downloads/Commodity_Top_News/Rohstoffwirtschaft/36_kritische-versorgungslage.pdf?__blob¼publicationFile&v¼4.
EPA, 2012. Rare Earth Elements: A Review of Production, Processing, Recycling, and Associated EnvironmentalIssues. United States Environmental Protection Agency, Office of Research and Development, Washington, D.C.
Ernst, Young, 2011. Technology Minerals. The Rare Earths Race Is On! Retrieved from: http://de.slideshare.net/Tehama/technology-minerals-the-rare-earths-race-is-on-april-2011.
European Commission, 2010. Critical Raw Materials for the EU. Report of the Ad-hoc Working Group onDefining Critical Raw Materials.
FAZ, July 06, 2015. Letzter US-Fordere pleite: Hype um Seltene Erden ist vorbei (Bankruptcy of lastUS-producer: hype around rare earth elements is over (translation of author)). Frankfurter AllgemeineZeitung, Agenturmeldung. Retrieved from: http://www.faz.net/agenturmeldungen/dpa/letzter-us-foerderer-pleite-hype-um-seltene-erden-ist-vorbei-13687628.html.
GAO, 2010. Government Accountability Office. Subject: Rare Earth Materials in the Defense Supply Chain.GAO-10–617R. Retrieved from: http://www.gao.gov/new.items/d10617r.pdf (07.07.15.).
Gschneidner Jr., K.A., 2011. The rare earth crisis – the supply/demand situation for 2010–2015. Material Matters 6.Article 2.
Gupta, C.K., Krishnamurthy, N., 2005. Extractive Metallurgy of Rare Earths. CRC Press, Boca Raton.GWEC, 2014. Global Wind Report: Annual Market Update 2013. Global Wind Energy Council. Retrieved from:
http://www.gwec.net/wp-content/uploads/2014/04/GWEC-Global-Wind-Report_9-April-2014.pdf.Hatch, G., 2015. TMR Advanced Rare-Earth Projects Index. Retrieved from: http://www.techmetalsresearch.com/
metrics-indices/tmr-advanced-rare-earth-projects-index/.Hilsum, L., 2009. “Rare Earth” Shortage Threatens Green Revolution. By Channel 4 News. Retrieved from: http://
www.channel4.com/news/articles/science_technology/rareþearthþshortageþthreatensþgreenþrevolution/3451837.html.
REFERENCES 15
Hurst, C., 2010. China’s Rare Earth Elements Industry: What Can the West Learn? Institute for the Analysis ofGlobal Security (IAGS), Washington, D.C.
JRC, 2011. Critical Metals in Strategic Energy Technologies. Assessing Rare Metals as Supply-Chain Bottlenecksin Low-Carbon Energy Technologies. European Commission, European Union, Luxembourg.
Kingsnorth, D., 2010. Rare earths: facing new challenges in the new decade. In: Presentation at the SME AnnualMeeting 2010 in Phoenix Arizona. Retrieved from: http://www.terramagnetica.com/downloads/IMCOA-2010-03-SME-Presentation-Final-R2.pdf.
LOC, 2015. Library of Congress: China – Resource Taxes Adjusted for Rare Earth, Tungsten, Molybdenum.Retrieved from: http://www.loc.gov/lawweb/servlet/lloc_news?disp3_l205404398_text.
Lynas, 2010. Investor Presentation 2010. Retrieved from: https://www.lynascorp.com/Presentations/2010/Investor_Presentation_March_10_823534.pdf.
Lynas, 2015. From Mine to Market. Lynas Corporation Annual Report 2014. Retrieved from: https://www.lynascorp.com/Annual%20Reports/2014%20Annual%20Report.pdf.
Molycorp, 2015a. Molycorp, Inc. (15–11357). (Chapter 11) case. Retrieved from: https://cases.primeclerk.com/molycorp.
Molycorp, 2015b. News Release April 15, 2015: Molycorp Chosen to Supply Rare Earths for Use in High-Efficiency Siemens Wind Turbine Generators. Retrieved from: http://www.molycorp.com/molycorp-chosen-to-supply-rare-earths-for-use-in-high-efficiency-siemens-wind-turbine-generators/.
Molycorp, 2015c. Form-10k. Annual Report for the Fiscal Year Ended on December 31, 2014. Retrieved from:http://phx.corporate-ir.net/External.File?item¼UGFyZW50SUQ9NTg1MDIxfENoaWxkSUQ9MjkzMTg4fFR5cGU9MQ¼¼&t¼1.
Moores, S., 2014. China Admits 40% of Magnetic Rare Earths Supply Is Illegal. Mining.com. Benchmark MineralIntelligence, October 21, 2014. Retrieved from: http://www.mining.com/web/china-admits-40-of-magnetic-rare-earths-supply-is-illegal-2/.
NRC, 2008. Minerals, Critical Minerals, and the U.S. Economy. National Research Council of the NationalAcademies. The National Academies Press, Washington, D.C.
Reiners, C.S., 2001. Was ist das Seltene an den Seltenen Erden? Eine chemiedidaktische Reflexion (What is the“rare” at the rare earths? A chemical-didactical reflexion (translation of the author)). Chemie in unserer Zeit 35(2), 110–115.
Reuters, 2010. Fight for Rare Earth. Retrieved from: http://www.groenerekenkamer.nl/download/RareEarths.pdf.Rudnick, R.L., Gao, S., 2003. Composition of the continental crust. In: Holland, H.D., Turekian, K.K. (Eds.),
Treatise on Geochemistry. Pergamon Science and Technology Books, San Diego, pp. 1–64.Siemens, 2011. Recycling Electric Motors as Source of RawMaterials. Retrieved from: http://www.siemens.com/
innovation/en/news/2011/e_inno_1137_2.htm.Skinner, B.J., 1976. A second iron age ahead? American Scientist 64 (3), 258–269.Smith, P., October 06, 2014. Questions of the Week: Will Permanent Magnet Generators Replace DFIG?
Windpower Monthly. Retrieved from: http://www.windpowermonthly.com/article/1315794/questionweek-will-permanent-magnet-generators-replace-dfig.
UNCTAD, 2014. Commodities at a Glance. Special issue on rare earths. No. 5. Retrieved from: http://unctad.org/en/PublicationsLibrary/suc2014d1_en.pdf.
US DOE, 2010. Critical Materials Strategy. Retrieved from: http://energy.gov/sites/prod/files/piprod/documents/cms_dec_17_full_web.pdf.
US DOE, December 2011. Critical Materials Strategy. Retrieved from: http://energy.gov/sites/prod/files/DOE_CMS2011_FINAL_Full.pdf.
USGS, 2002. Rare Earth Elements – Critical Resources for High Technology. USGS Fact Sheet 087-02. Retrievedfrom: http://pubs.usgs.gov/fs/2002/fs087-02/.
USGS, 2009. Mineral Commodity Summaries, January 2009. Rare Earths. Retrieved from: http://minerals.usgs.gov/minerals/pubs/commodity/rare_earths/mcs-2009-raree.pdf.
16 CHAPTER 1 AN OVERVIEW OF THE USEFULNESS AND STRATEGIC VALUE

USGS, November 2014. The Rare-earth Elements – Vital to Modern Technologies and Lifestyles. Fact Sheet2014-3078. Retrieved from: http://pubs.usgs.gov/fs/2014/3078/pdf/fs2014-3078.pdf.
USGS, 2015a. Historical Data. DS 140, Rare Earths Statistics. As of January 30, 2015. XLS-spreadsheet.Retrieved from: http://minerals.usgs.gov/minerals/pubs/historical-statistics/ds140-raree.xlsx.
USGS, 2015b. Mineral Commodity Summaries 2015. Retrieved from: http://minerals.usgs.gov/minerals/pubs/mcs/2015/mcs2015.pdf.
Xinhua, 2014. China Illegal Rare Earth Mining Hit 40,000 Tonnes Each Year, Expert. Retrieved from: http://en.xinhua08.com/a/20141103/1406631.shtml.
Zepf, V., 2013. Rare Earth Elements. A New Approach to the Nexus of Supply, Demand and Use. Exemplifiedalong the Use of Neodymium in Permanent Magnets. Springer, Berlin, Heidelberg.
Zepf, V., 2015. Das verkannte Recyclingpotential der Seltenen Erden – quantitative Ergebnisse fur Neodym inDeutschand (The unknown recycling potential of REEs – quantitatie results fur neodymium in Germany.(translation of the author)). In: Thome-Kozmiensky, K.J., Goldmann, D. (Eds.), Recycling und Rohstoffe,Band 8. TK Verlag Karl Thome-Kozmiensky, Neuruppin, pp. 463–476.
Zhi Li, L., Yang, X., 2014. China’s Rare Earth Ore Deposits and Beneficiation Techniques. Retrieved from: http://www.eurare.eu/docs/eres2014/firstSession/XiaoshengYang.pdf.
REFERENCES 17
本文献由“学霸图书馆-文献云下载”收集自网络,仅供学习交流使用。
学霸图书馆(www.xuebalib.com)是一个“整合众多图书馆数据库资源,
提供一站式文献检索和下载服务”的24 小时在线不限IP
图书馆。
图书馆致力于便利、促进学习与科研,提供最强文献下载服务。
图书馆导航:
图书馆首页 文献云下载 图书馆入口 外文数据库大全 疑难文献辅助工具
Copyright © 2022 FDOKUMEN