
An International Peer Reviewed Open Access Journal For ...
269
An International Peer Reviewed Open Access Journal For Rapid Publication VOLUME-10 NUMBER-3 (July-Sep 2017) Print ISSN: 0974-6455 Online ISSN: 2321-4007 CODEN: BBRCBA www.bbrc.in University Grants Commission (UGC) New Delhi, India Approved Journal
-
Upload
khangminh22 -
Category
Documents
-
view
0 -
download
0
Transcript of An International Peer Reviewed Open Access Journal For ...

An International Peer Reviewed Open AccessJournal For Rapid Publication
VOLUME-10 NUMBER-3 (July-Sep 2017)
Print ISSN: 0974-6455
Online ISSN: 2321-4007
CODEN: BBRCBA
www.bbrc.in
University Grants Commission (UGC) New Delhi, India Approved Journal

Registered with the Registrar of Newspapers for India under Reg. No. 498/2007Bioscience Biotechnology Research Communications
VOLUME-10 NUMBER-3 (July-Sep 2017)
Assessment of short term prognosis in patients with upper gastrointestinal bleeding
Saeid Hashemieh (MD), Ramtin Moradi (MD), Davood Karimi Hosseini (MD) and Habib Malek Pour (MD) 341-345
Resilience and basic psychological needs among Palestinian school students
Shadi Khalil Abualkibash and Maria Jose Lera 346-353
Effect of heptane food simulating liquid on surface microhardness of 4 composites (Filtek Z250, Aelite, Filtek Z350 and Clearfil ST)
Niusha Golbari, Morad Sadaghiani, Anahit Afrasiabi, Mahdi Allahdadi, Elmira Najafrad and Ehsan Sadeghi Ziaratgahi 354-358
Antibacterial and antioxidant activity of leaf organic extracts of local cultivars of Murraya koenigii (L.) Spreng from Tamilnadu
M. Kavitha 359-364
Effect of premarital counseling on shyness and expectations from marriage among medical science students
Iman Seyyed Moharrami, Malihe Pashib, Anahita Zandi, Seddigheh Abbaspour and Abbas Ghodrati Torbati 365-371
Exploring climate change over Khazar Basin based on LARSE-WG weather generator
Amir Hossein Halabian and M.S. Keikhosravi 372-379
Antibacterial activity of ZrO2 against metallo beta-lactamase and biofilm producing carcinogenic Pseudomonas aeruginosa
Rajasekar S., Vijayalakshmi S. and A. Mohankumar 380-385
Physicochemical and fungal diversity analysis of two different sources of polluted water of Cachar District Assam
Rajesh Paul and Jashodeb Arjun 386-390
Comparison of multiplex ligation-dependent probe amplification and qPCR for screening PAX5 gene detection in
acute lymphoblastic leukemia
Sahar Mehranfar, Sirous Zeniali, Nasser Samadi, Nazanin Maleki Sadeghi and Abbasali Hosein Pour Feizi 391-397
Effect of educational intervention based on health promotion model (HPM) on promoting behavior in safe delivery among
Afghani pregnant women refugees in Sirjan, Iran
Reza Sadeghi, Mostefa Shamsi, Fatemeh Baghernezhad Hesary and Victoria Momenabadi 398-403
Effect of soil tillage systems on chickpea yield and moisture of soil
Saeed Salehi, Asad Rokhzadi, Abdulwahab Abdolahi, Khosro Mohammadi and Ghorban Nourmohammadi 404-409
The role of different impression methods for complete denture prosthodontics
Sara Nikoee Bazvand, Farshad Khamchin Moghaddam, Nazila Najari Dizaji and Shahin Shams Lahijani 410-414
Influence of different spacing and cultivars on yield components and biochemical parameters of onion (Allium cepa L.)
Saurabh Kishor, R. B. Ram, M.L. Meena, Sachin Kishor, D. C. Meena and Anil Kumar 415-418
Investigations on the physical activity level of some Iranian drug suicidal patients
Maryam Hajain MD, Shahram Mohaghegh MD, Latif Gachkar MD and Effat Barari 419-423
Bond strength of porcelain to cobalt chromium dental alloy fabricated by selective laser melting and casting methods
Fariborz Vafaee, Farnaz Firouz, Parisa Alirezaii, Kusha Gholamrezaii and Sara Khazaei 424-430
Spatial and temporal ground water responses to seasonal rainfall replenishment in an alluvial aquifer
Sourabh Nema, M. K. Awasthi and R. K. Nema 431-437
Composition and quantity of cytotoxic waste from oncology wards: A survey of environmental characterization and source
management of medical cytotoxic waste
Y. Ghafuri and R. Nabizadeh 438-444
Fe3+-EDTA-zinc oxide nano-diagnostics: Synthesis and in vitro cellular evaluation
Kimia Roshani, Mazyar Etemadzade, Ramin Farhoudi, Seyed Esmaeil Sadat Ebrahimi, Morteza Pirali Hamedani, Artin Assadi and
Mehdi Shafiee Ardestani 445-454
Printed By:Faraz S. AliC-52, HB Colony, Koh-e-FizaBhopal - 462001, INDIA
Continued Inside Cover

Comparison of stress distribution around implants with three different attachments in overdenture supported by four maxillary
implants using finite element analysis method
Asadallah Ahmadzadeh and Ahmad Teimouri 455-462
In vitro anticariogenic activity of commercially existing anticavity tooth pastes and tooth powders against Lactobacillus
acidophilus isolated from childhood caries
Vijayalakshmi S., Rajasekar S. and Mohankumar A 463-474
Comparison of the effects of IPS e.max heat press layered and feldspathic porcelain on natural enamel tooth wear
Hedaiat Moradpoor, Marjan Mardanpour, Farnoush Golmohamadi and Sahar Raissi 475-480
Ameliorative effect of salicylic acid in salinity stressed Pisum sativum by improving growth parameters, activating
photosynthesis and enhancing antioxidant defense system
Farhan Ahmad, Ananya Singh and Aisha Kamal 481-489
Evaluation of satisfaction rate of dental implants in patients referred to private clinics of Kermanshah city
Hedaiat Moradpoor, Amir Hossien Moradi, Sara Taherzadeh and Sahar Raissi 490-496
Investigations on the relationship between perfectionism and psychological needs with the perception of body image in
cosmetic surgery applicants
Soodabeh Yavari and Asghar Jafari 497-503
Effect of water stress on gland function and some qualitative traits of commercial cultivars and promising potato clones
M. Ziachehreh, A. Tobeh, D. Hassanpanah, Sh. Jamaati and Y. Jahani 504-513
Interleukin-17 concentration as a biomarker in diagnosis of exudative pleural effusion compared with benign pleural effusion
Ali Arian Nia and Saeid Mehrabi 514-517
Prevalence of osseous changes of the temporomandibular joint in CBCT images of patients with and without
temporomandibular disorders
Shahriar Shahab, Zeynab Azizi, Farnaz Taghavi Damghani and Farnoosh Taghavi Damghani 518-524
Adhesion of Streptococcus mutans on glazed IPS e.max press, glazed feldspatic and dental enamel
Ezzatollah Jalalian, Fahimeh Sarzaeem and Mahkameh Koochaki Pourchafjiri 525-528
Comparison of surface roughness between CO2 laser and typical glazing on two types of porcelain vita and ivoclar
Alireza Izadi, DDS, PhD, Bijan Heidari, DDS, PhD, Shahin Kasrai, DDS, PhD Alireza Soltanian, DDS, PhD and Sahar Raissi, PhD 529-535
Comparative studies on cooking qualities of aged brown and polished rice, Oryza sativa
V. K. Tiwari, Neha Pachlasiya and H. L. Sharma 536-541
Perceived challenges by the Iranian baccalaureate surgical technology students in their clinical education: A qualitative study
H. Karimi Moonaghi, R. Zardosht, M. Etezad Razavi and S. Ahmady 542-550
Effect of dynamic loading on removal torque value of one-piece and two-piece abutments
Farnaz Firouz, Bijan Heidari, Sara Alijani and Sara Khazaei 551-556
Assessment of location of anterior ethmoidal artery using cone beam computed tomography (CBCT)
Shima Javdan, Roshanak Ghaffari and Saeed Sohilipour 557-563
Evaluation of two types of bleaching gel and light source on whitening of teeth
Baharan Ranjbar Omidi, Mohammad Nouri and Negin Farahmandpour 564-570
Area-metric analysis of the quality of obturation of four different techniques: An ex vivo study
Yazdan Shantiaee, Setareh Rostami, Shiva Shojaeeian and Sanaa Jabbari 571-579
Correlation of the maxillary sinus volume with gender and some of craniofacial indices using cone beam computed
tomography
Shahab Etemadi, Golnaz Seylavi and Afshin Yadegari 580-586
Comparison of interleukin 17 and 22 in saliva of oral lichen planus patients with healthy people
Shiva Shirazian, Farzaneh Aghahosseini, Eisa Salehi, Mehdi Vatanpour 587-591
On the prevalence of iron deficiency in children and adolescents with growth retardation
Arash Rahbar and Arian Hajian 592-596
Continued From Back Cover
Registered with the Registrar of Newspapers for India under Reg. No. 498/2007Bioscience Biotechnology Research Communications
VOLUME-10 NUMBER-3 (July-Sep 2017)

About the Journal
Bioscience Biotechnology Research Communications, BBRC is a broad based internationally indexed offi cial publication of Society for Science & Nature (SSN) since 2008. The international journal publishes peer reviewed original research papers, exciting reviews and short communications in basic and applied areas of life sciences and the upcoming state of the art technologies, including Biology and Medicine on a fast track. The young editorial team of BBRC tries hard to provide a high quality fl awless format of scientifi c communication for the popularization and advancement of science, worldwide. During these 10 years more than 1000 peer reviewed research papers of very high quality have been published in BBRC and authors like Kiran Shaw Majumdar of Biocon, Bangalore have contributed to BBRC helping it achieve high readership in a short span of time. Reviewing the published research articles, it becomes evident that on an average, about 7 papers out of 10 are subjected to healthy revisions in BBRC making quality reading. We owe this achievement to our reverend reviewers! We hope the standards set by BBRC will improve further mak-ing this international journal unique and easily accessible to the scientifi c fraternity across the globe. In its tenth year of successful existence as a scholarly publication, BBRC has now become an open access Thomson Reuters ISI ESC Indexed journal approved by University Grants Commission (UGC) Ministry of Human Resource Development, Government of India, New Delhi and has a NAAS-2017, Government of India, Indian Council of Agricultural Research (ICAR) New Delhi rating of 4.31.
Scope of the Journal
The journal offers an international peer reviewed fast track platform, encouraging contributions from research students, faculty members and academicians from developing countries. Manuscripts in the following areas of Bioscience and Biotechnology are considered for rapid publication:
• Biology, Botany, Zoology, Ecology and Aquaculture• Biophysics, Molecular Biology, Genetics and Genetic Engineering• Biotechnology, Bioinformatics, Proteomics and Nanotechnology• Microbiology, Pathology, Immunology and Diagnostics• Physiology, Endocrinology, Biochemistry and Biochemical Engineering• Environmental Sciences, Toxicology & Environmental Engineering• Biology and Medicine including Nutrition.• Diseases, Pharmaceutical Sciences and Public Health.
On Piracy, Pilferage and Other Human Academic Malpractice
Bioscience Biotechnology Research Communications strongly advocates the policy of outrightly condemning and reporting of any academic mal-practice with regard to manipulation, copying, pilfering or pirating of any research material or data in practice and writing thereof. It is the duty of all our revered contributors of BBRC to kindly verify the authenticity of their scientifi c text in all of their manuscripts with regard to standard of scientifi c research done worldwide. Our reviewers are also being requested to report any of such discrepancies immediately so as to curb this malady. Any case of any kind of piracy detected, will be liable for legal action as per prevailing laws. Articles found with any form of plagiarism will be liable for immediate retraction from the issue after proper confi rmation, following standard publication norms.
On Ethical and Animal Welfare Issues
Bioscience Biotechnology Research Communications requires that the experimental conditions under which human and animal assays and tests are performed are as per standard protocols used worldwide. Studies on animals must comply with the prevailing standards of animal welfare according to Indian Council of Medical Research Guidelines in India and likewise following similar condition following elsewhere. Authors must make it clear that the procedures they used were as humane as possible and have been complied with the guidelines. Studies involving human subjects must be carried out with the formal approval of the relevant Ethical Committee and evidence of such approval must be provided along with the submission.
Editor, Editorial Board and the Publisher of Bioscience Biotechnology Research Communications take no responsibility for inaccurate, mislead-ing data, opinion and statements appeared in the articles and advertisements published in this journal. It is sole responsibility of the contribu-tors and advertisers. No part of the journal can be reproduced without the written permission of the Editor, who also holds the copyright of the Bioscience Biotechnology Research Communications. It is also notifi ed that if any dispute arises regarding the journal, the matter will come within the jurisdiction of Bhopal.
Bioscience Biotechnology Research Communications(Abbreviation: Biosc. Biotech. Res. Comm.)
University Grants Commission (UGC) Ministry of HRD Government of India approved Journal.
Published by: Society For Science & Nature (SSN)Bhopal, India.

Patrons: Prof. Mir Athar Ali (MA Eng., Urdu & Persian, BT, LLB) Retired Professor of English, Senior Advocate High Court and Founder President, Athar Institute of Health and Management Studies, New Delhi, IndiaEr. Zainuddin Shah, Secretary Saifi a Educational Society, Bhopal, India
Honorary Editors: Dr. Sharique A. Ali, Ph.D., FLS (London), FRSB (UK)DAE-BARC Fellow (UNESCO Awardee)Dr. Sharique Ali has published more than 150 research papers in applied areas of Bioscience and Biotechnology and has completed about several projects, guided more than 35 Ph.D. students in Animal Sciences, with 100 % placement. He has also been conferred with several awards and citation, including the prestigious UNESCO Award. He has also taught at many foreign universities as a visiting professor. Dr. Ali has the distinction of being one of the youngest principal investiga-tors of US PL-480 International Research Project, at the age of 28. Presently, he is a Professor of Physiology and heads the Post Graduate Department of Biotech-nology, at Saifi a Science College, Bhopal. He has publications in high impact factor journals like: Comparative Physiology Biochemistry, Phytochemistry, Food & Chemical Toxicology, Cytokine, Viral Immunology, Viral Epidemiology (Elsevier) Environmental Conservation, Journal of Experimental Botany (Cambridge), Bul-letin Contamination Toxicology, Cell & Mol Biol Letters (Perga- mon), Cell Receptors & Signal Transduction, Journal of Pharmacy & Pharmacology, British Journal of Pharmacology (Wiley), Natural Product Res, Pharmacologia (Blackwell), Planta Medica (Verlag), In vitro Biology (Springer), Current Science and many others. Dr. Sharique A. Ali’s personal web-page can also be accessed at: http://www.drshariqali.com
Dr. Ayesha Ali, Ph.D., FSSN., (CSIR Fellow) [email protected]. Ayesha Ali, Professor of Zoology and Animal Biotechnology, Saifi a Science College, Bhopal, did her Ph.D. in Biochemical Toxicology as a UGC and CSIR National Fellow, having an outstanding academic career. She has published more than 100 research papers in National and International journals, visited many countries on academic assignments, completed several research projects and has guided more than 25 Ph.D. students in applied areas of Bioscences and Biotechnology. Dr Ali has also guided more than 100 Masters students for their dissertations in Zoology and Biotechnology. She has been teaching Bioscience to post graduate students since last four decades. She has been on the academic and Ph.D. examination boards of Bioscience of several colleges and universities in India and abroad.
Associate Foreign Editors:Dr S. Salim, PhD., 21925 Manor Crest Ln, Boyds, MD, United States of America – 20841
Dr JM Galgut, PhD.,671, Asprior Avenue, Mississauga, Ontario, Canada
Managing Editor: Dr. Mohd. Miraj, MPTh (Ortho) PhD Riyadh Saudi Arabia and New Delhi [email protected] young dynamic orthopedic and biomechanics specialist from AIIMS, New Delhi with several research papers in National and International journals. Presently, he is the Director of Athar’s Institute of Health & Management Studies, New Delhi (AIHMS - http://www.aihms.in/).
Technical Consultant: Er. Faraz Ali BE (Printing & Communication Graphics) [email protected]
Assistant Editor, Foreign Affairs: Dr. J. Peter Ph.D [email protected] and Dr. K. V. Metei Ph.D [email protected]. Peter has won the Young Scientist Award of MPCST, she is an outstanding young pigment cell researcher, has been to various countries like the US, UK, France, Germany, Japan, Austria, Holland, among many others on academic assignments. She has more than 30 publications to her credit and is looking after the foreign affairs of BBRC.
Dr. Vivek Metei Vivek has done his Ph.D. in Bioscience and has excellent high impact factor journal publications to his credit.
Assistant Editors: Ram Kumar Choudhary [email protected] and Ishrat Naaz [email protected] Choudhary, is a young hard working researcher, who is registered for his Ph.D. in Biotechnology. Ishrat Naaz as a MAN Fellow (UGC) has done her M.Sc. in Biotechnol-ogy. They have published many research papers in applied areas of Bioscience and Biotechnology and are sincere young scientists with great zeal and enthusiasm.
Editorial Secretaries: Nargis Khan, Naima Parveen and Gajendra Mahor are all young scientists, doing their research in Biosciences and Biotechnology at the Post graduate Department of Bio-technology, Saifi a Science College, Bhopal. These ambitious young sincere hardworking researchers are editorial members of BBRC.
Honorary Advisory and Editorial Board:
Bioscience Biotechnology Research Communications International Open Access Peer Reviewed Journal For Rapid Publication
(Indexed in Leading National and International Scientifi c Citation Agencies Approved by University Grants Commission (UGC) New Delhi)
(NAAS 2017 Journal Score — 4.31 Cosmos Impact Factor 4.006)Visit us at: http://www.bbrc.in
Dr. Absar Ahmad, National Chemical Laboratories, Pune, India, Prof. Asif A. Ali, Seed Technologist Govt of Maharashtra, Amravati, India, Dr. MS Baig, University of Flor-ida, USA, Dr. RR Bhonde, National Centre Cell Science Pune, India, Dr. Alex Eberle, University of Basel Switzerland, Switzerland, Dr. Idris Khan, Professor of Cardiology, Bombay Hospital Indore, India, Dr. KM Kulkarni, Ex Vice Chancellor Kolhapur University, Kolhapur Pune, India, Dr. Ashok Kumar, Professor of Biotechnology, Institute of Genomics & Integrative Biology New Delhi, India, Dr. Maxime Merheb, American University of Ras Al-Khaimah UAE, Dr. N Nandanwar, Humboldt Fellow, Berlin, Germany, Dr. Anil Prakash, Dean Life Sciences Barkatullah University Bhopal, India, Dr. Bashar Saad, American University, Palestine, Dr. Vinoy Shrivastava, Professor Chairman Bio-sciences Bhopal, India, Dr. Virendra Singh Mullana, Professor and Department of Virology, Medical College India, Dr. ON Tiwari, Institute of Bioresources and Sustainable Development (IBSD), Takyelpat, Imphal, Imphal, India, Dr. HA Akinnibosun, FLS London University of Benin Nigeria, UK, Dr. DK Belsare, DSc, FNASc Professor of Biosci-ence Bhopal, India, Dr. R Chandrashek-har, National Health Research Centre UK, Dr. Khalid Al Ghamdi, King Abdul Aziz University Jeddah, KSA, Dr. Sabir Hussain, City of Hope Hospital & Research Center, Califonia, USA, Prof. Sanat Mohanty Indian Institute of Technology, New Delhi, India, Dr. KS Sachdeva, National Institute of Family & Health New Delhi, India, Prof. Sukh M. Singh Professor and Head Department of Biotechnology BHU, Varanasi, India, Dr. Suhas Bhand, Environmentalist Mumbai, India, Dr. Zhiyang Chen Shanghai Medical University Shanghai, China, Dr. Supriya Ghosh, All India Institute of Medical Sciences New Delhi, India, Dr. FA Kabbinwar, Professor of Oncology, UCLA California, USA, Dr. Scott Newton Virginia State University USA, Dr. S Shah, Memorial Sloan Kettering Cancer Center New York, USA, Dr. Salman Syed, Sydney, Australia, Dr Maulin Shah Head Microbiology,Enviro Technology Ltd, Gujrat, India, Dr. Ranjana Trivedi, Michigan, USA.
CONTENTSVOLUME 10 • NUMBER 3 • JULY-SEP 2017
MEDICAL COMMUNICATION Assessment of short term prognosis in patients with upper gastrointestinal bleeding
Saeid Hashemieh (MD), Ramtin Moradi (MD), Davood Karimi Hosseini (MD) and Habib Malek Pour (MD)............................................................................341-345
PSYCHOLOGICAL COMMUNICATION Resilience and basic psychological needs among Palestinian school students
Shadi Khalil Abualkibash and Maria Jose Lera......................................................................................................................................................................346-353
MEDICAL COMMUNICATION Effect of heptane food simulating liquid on surface microhardness of 4 composites (Filtek Z250, Aelite, Filtek Z350 and Clearfi l ST)
Niusha Golbari, Morad Sadaghiani, Anahit Afrasiabi, Mahdi Allahdadi, Elmira Najafrad and Ehsan Sadeghi Ziaratgahi........................................................354-358
BIOTECHNOLOGICAL COMMUNICATION Antibacterial and antioxidant activity of leaf organic extracts of local cultivars of Murraya koenigii (L.) Spreng from Tamilnadu
M. Kavitha...........................................................................................................................................................................................................................359-364
MEDICAL COMMUNICATION Effect of premarital counseling on shyness and expectations from marriage among medical science students
Iman Seyyed Moharrami, Malihe Pashib, Anahita Zandi, Seddigheh Abbaspour and Abbas Ghodrati Torbati...........................................................................365-371
ENVIRONMENTAL COMMUNICATION Exploring climate change over Khazar Basin based on LARSE-WG weather generator
Amir Hossein Halabian and M.S. Keikhosravi........................................................................................................................................................................372-379
BIOTECHNOLOGICAL COMMUNICATION Antibacterial activity of ZrO
2 against metallo beta-lactamase and biofi lm producing carcinogenic Pseudomonas aeruginosa
Rajasekar S., Vijayalakshmi S. and A. Mohankumar..............................................................................................................................................................380-385
ECOLOGICAL COMMUNICATION Physicochemical and fungal diversity analysis of two different sources of polluted water of Cachar District Assam
Rajesh Paul and Jashodeb Arjun............................................................................................................................................................................................386-390
PATHOLOGICAL COMMUNICATION Comparison of multiplex ligation-dependent probe amplifi cation and qPCR for screening PAX5 gene detection in acute lymphoblastic leukemia
Sahar Mehranfar, Sirous Zeniali, Nasser Samadi, Nazanin Maleki Sadeghi and Abbasali Hosein Pour Feizi...........................................................................391-397
HEALTH SCIENCE COMMUNICATION Effect of educational intervention based on health promotion model (HPM) on promoting behavior in safe delivery among
Afghani pregnant women refugees in Sirjan, Iran
Reza Sadeghi, Mostefa Shamsi, Fatemeh Baghernezhad Hesary and Victoria Momenabadi......................................................................................................398-403
AGRICULTURAL COMMUNICATION Effect of soil tillage systems on chickpea yield and moisture of soil
Saeed Salehi, Asad Rokhzadi, Abdulwahab Abdolahi, Khosro Mohammadi and Ghorban Nourmohammadi.............................................................................404-409
DENTAL COMMUNICATION The role of different impression methods for complete denture prosthodontics
Sara Nikoee Bazvand, Farshad Khamchin Moghaddam, Nazila Najari Dizaji and Shahin Shams Lahijani...............................................................................410-414
BIOTECHNOLOGICAL COMMUNICATION Infl uence of different spacing and cultivars on yield components and biochemical parameters of onion (Allium cepa L.)
Saurabh Kishor, R. B. Ram, M.L. Meena, Sachin Kishor, D. C. Meena and Anil Kumar..........................................................................................................415-418
MEDICAL COMMUNICATION Investigations on the physical activity level of some Iranian drug suicidal patients
Maryam Hajain MD, Shahram Mohaghegh MD, Latif Gachkar MD and Effat Barari...............................................................................................................419-423
MEDICAL COMMUNICATION Bond strength of porcelain to cobalt chromium dental alloy fabricated by selective laser melting and casting methods
Fariborz Vafaee, Farnaz Firouz, Parisa Alirezaii, Kusha Gholamrezaii and Sara Khazaei.......................................................................................................424-430

BIOTECHNOLOGICAL COMMUNICATION Spatial and temporal ground water responses to seasonal rainfall replenishment in an alluvial aquifer
Sourabh Nema, M. K. Awasthi and R. K. Nema......................................................................................................................................................................431-437
ENVIRONMENTAL COMMUNICATION Composition and quantity of cytotoxic waste from oncology wards: A survey of environmental characterization and source
management of medical cytotoxic waste
Y. Ghafuri and R. Nabizadeh.................................................................................................................................................................................................438-444
BIOMEDICAL COMMUNICATION Fe3+-EDTA-zinc oxide nano-diagnostics: Synthesis and in vitro cellular evaluation
Kimia Roshani, Mazyar Etemadzade, Ramin Farhoudi, Seyed Esmaeil Sadat Ebrahimi, Morteza Pirali Hamedani, Artin Assadi and Mehdi Shafi ee Ardestani.......................................................................................................................................................................................................445-454
MEDICAL COMMUNICATION Comparison of stress distribution around implants with three different attachments in overdenture supported by four maxillary
implants using fi nite element analysis method
Asadallah Ahmadzadeh and Ahmad Teimouri.......................................................................................................................................................................455-462
BIOTECHNOLOGICAL COMMUNICATION In vitro anticariogenic activity of commercially existing anticavity tooth pastes and tooth powders against Lactobacillus acidophilus
isolated from childhood caries
Vijayalakshmi S., Rajasekar S. and Mohankumar A..............................................................................................................................................................463-474
MEDICAL COMMUNICATION Comparison of the effects of IPS e.max heat press layered and feldspathic porcelain on natural enamel tooth wear
Hedaiat Moradpoor, Marjan Mardanpour, Farnoush Golmohamadi and Sahar Raissi.............................................................................................................475-480
BIOTECHNOLOGICAL COMMUNICATION Ameliorative effect of salicylic acid in salinity stressed Pisum sativum by improving growth parameters, activating photosynthesis and
enhancing antioxidant defense system
Farhan Ahmad, Ananya Singh and Aisha Kamal...................................................................................................................................................................481-489
MEDICAL COMMUNICATION Evaluation of satisfaction rate of dental implants in patients referred to private clinics of Kermanshah city
Hedaiat Moradpoor, Amir Hossien Moradi, Sara Taherzadeh and Sahar Raissi.......................................................................................................................490-496
PSYCHOLOGICAL COMMUNICATION Investigations on the relationship between perfectionism and psychological needs with the perception of body image in cosmetic surgery applicants
Soodabeh Yavari and Asghar Jafari.......................................................................................................................................................................................497-503
AGRICULTURAL COMMUNICATION Effect of water stress on gland function and some qualitative traits of commercial cultivars and promising potato clones
M. Ziachehreh, A. Tobeh, D. Hassanpanah, Sh. Jamaati and Y. Jahani..................................................................................................................................504-513
BIOTECHNOLOGICAL COMMUNICATION Interleukin-17 concentration as a biomarker in diagnosis of exudative pleural effusion compared with benign pleural effusion
Ali Arian Nia and Saeid Mehrabi...........................................................................................................................................................................................514-517
DENTAL COMMUNICATION Prevalence of osseous changes of the temporomandibular joint in CBCT images of patients with and without temporomandibular disorders
Shahriar Shahab, Zeynab Azizi, Farnaz Taghavi Damghani and Farnoosh Taghavi Damghani................................................................................................518-524
DENTAL COMMUNICATION Adhesion of Streptococcus mutans on glazed IPS e.max press, glazed feldspatic and dental enamel
Ezzatollah Jalalian, Fahimeh Sarzaeem and Mahkameh Koochaki Pourchafjiri.......................................................................................................................525-528
MEDICAL COMMUNICATION Comparison of surface roughness between CO
2 laser and typical glazing on two types of porcelain vita and ivoclar
Alireza Izadi, DDS, PhD, Bijan Heidari, DDS, PhD, Shahin Kasrai, DDS, PhD Alireza Soltanian, DDS, PhD and Sahar Raissi, PhD.......................................529-535
AGRICULTURAL COMMUNICATION Comparative studies on cooking qualities of aged brown and polished rice, Oryza sativa
V. K. Tiwari, Neha Pachlasiya and H. L. Sharma....................................................................................................................................................................536-541
MEDICAL COMMUNICATION Perceived challenges by the Iranian baccalaureate surgical technology students in their clinical education: A qualitative study
H. Karimi Moonaghi, R. Zardosht, M. Etezad Razavi and S. Ahmady.....................................................................................................................................542-550
MEDICAL COMMUNICATION Effect of dynamic loading on removal torque value of one-piece and two-piece abutments
Farnaz Firouz, Bijan Heidari, Sara Alijani and Sara Khazaei.................................................................................................................................................551-556

BIOTECHNOLOGICAL COMMUNICATION Assessment of location of anterior ethmoidal artery using cone beam computed tomography (CBCT)
Shima Javdan, Roshanak Ghaffari and Saeed Sohilipour........................................................................................................................................................557-563
MEDICAL COMMUNICATION Evaluation of two types of bleaching gel and light source on whitening of teeth
Baharan Ranjbar Omidi, Mohammad Nouri and Negin Farahmandpour..................................................................................................................................564-570
MEDICAL COMMUNICATION Area-metric analysis of the quality of obturation of four different techniques: An ex vivo study
Yazdan Shantiaee, Setareh Rostami, Shiva Shojaeeian and Sanaa Jabbari..............................................................................................................................571-579
DENTAL COMMUNICATION Correlation of the maxillary sinus volume with gender and some of craniofacial indices using cone beam computed tomography
Shahab Etemadi, Golnaz Seylavi and Afshin Yadegari...........................................................................................................................................................580-586
MEDICAL COMMUNICATION Comparison of interleukin 17 and 22 in saliva of oral lichen planus patients with healthy people
Shiva Shirazian, Farzaneh Aghahosseini, Eisa Salehi, Mehdi Vatanpour.................................................................................................................................587-591
MEDICAL COMMUNICATION On the prevalence of iron defi ciency in children and adolescents with growth retardation
Arash Rahbar and Arian Hajian............................................................................................................................................................................................592-596
Medical CommunicationBiosci. Biotech. Res. Comm. 10(3): 341-345 (2017)
Assessment of short term prognosis in patients with
upper gastrointestinal bleeding
Saeid Hashemieh (MD)1, Ramtin Moradi (MD)2, Davood Karimi Hosseini (MD)3 andHabib Malek Pour (MD)1*1Department of Internal Medicine, Shahid Beheshti University of Medical Sciences2Mashhad Azad University School of Medicine3Stanford University School of Medicine, Palo Alto, CA, USA
ABSTRACT
Upper gastrointestinal bleeding (UGIB) is a medical emergency. There is no precise information of its prevalence and prognosis in patients. The aim of present study was to investigate the prognostic factors of UGIB in patients. In this prospective observational study 75 patients with UGIB referred to Hospital. Demographic and clinical data of them were recorded and analyzed. Mortality rate in fi rst hospitalization was 16% and in one-month follow up was 4%. There was no signifi cant association between age and gender with duration of hospitalization and one-month prognosis (p>0.05). Mortality was associated with acute abdomen and orthostatic hypotension I admission time, pep-tic ulcer in endoscopic evaluation, active bleeding, ICU admission and need to second endoscopy (p<0.05). Erosive gastritis, need to emergent surgery and use of NSAIDs signifi cant increase of mortality rate (p<0.05). It seems admis-sion time signs and symptoms, hemodynamic and coagulation status, endoscopic results and need to re-endoscopic evaluation are more prognostic factors in patients with UGIB.
KEY WORDS: SHORT TERM PROGNOSIS, UPPER GASTROINTESTINAL, BLEEDING
341
ARTICLE INFORMATION:
*Corresponding Author: Received 27th June, 2017Accepted after revision 27th Sep, 2017 BBRC Print ISSN: 0974-6455Online ISSN: 2321-4007 CODEN: USA BBRCBA
Thomson Reuters ISI ESC and Crossref Indexed Journal NAAS Journal Score 2017: 4.31 Cosmos IF: 4.006
© A Society of Science and Nature Publication, 2017. All rights reserved.Online Contents Available at: http//www.bbrc.in/DOI: 10.21786/bbrc/10.3/1
INTRODUCTION
The UGIB bleeding occurs frequently and is a common cause of hospitalization or inpatient bleeding. Such bleeding results in substantial patient morbidity, mor-tality and healthcare expense. Ulcer disease is the most
common cause of severe UGIB, causing about 40-50% of cases and UGIB is the most common complication of peptic ulcer disease (Kovacs and Jensen, 2008). The ini-tial management of the patient with UGIB should include evaluation of severity of the hemorrhage, patient resusci-tation, a brief medical history and physical examination,

342 ASSESSMENT OF SHORT TERM PROGNOSIS IN PATIENTS WITH UPPER GASTROINTESTINAL BLEEDING BIOSCIENCE BIOTECHNOLOGY RESEARCH COMMUNICATIONS
Saeid Hashemieh et al.
and consideration of possible interventions (Lin et al. 2005). This lack of evidence is refl ected in the literature. In databases and in product monographs for corticoster-oids, peptic ulcer disease and GI bleeding may or may not be described as possible adverse effects (de Abajo et al. 2013).
GI bleeding, bleeding peptic ulcer and perforation are feared complications of peptic ulcer disease, associ-ated with considerable morbidity and mortality (Lanas et al. 2011). In clinical recommendations, an association between corticosteroid use and peptic ulcer has been described as unlikely, and the value of antiulcer prophy-laxis has been questioned due to a low bleeding risk (Martinek et al. 2011). Non-steroidal anti-infl ammatory drugs (NSAID) use and Helicobacter pylori infection are the most important risk factors for peptic ulcer disease. Bleeding or perforation is also seen as complications to stress ulcers among patients with critical illness in inten-sive care units. GI bleeding and perforation are assumed to occur when ulcers erode into underlying vessels (Hal-liday et al. 2010). It is reported a high late as well as early mortality for upper GI bleeding, with very poor longer term prognosis following bleeding due to malignancies and varices. Aetiologies with the worst prognosis were often associated with high levels of social deprivation (Roberts et al. 2012).
The aetiology of hemorrhage can be broadly con-sidered to be non-variceal or variceal in origin. In the upper gastrointestinal haemorrhage accounts for85% of presentations, the major causative lesion being pep-tic ulcer disease, followed by erosive diseases such as oesophagitis, gastritis and duodenitis (Jairath & Barkun, 2012). Risk factors for developing upper gastrointesti-nal hemorrhage include old age, socio-economic disad-vantage, co-morbidities such as chronic renal disease, Helicobacter pylori infection and several pharmaceuti-cal agents including NSAIDS, aspirin, cyclo-oxygenase (COX) 2 inhibitors and anticoagulants. The remaining presentations (10–15%) are secondary to variceal hem-orrhage in patients with liver cirrhosis (Holcomb et al. 2015).
Coagulopathy exacerbates bleeding and should be corrected with blood products. Massive bleeding man-dates emergency endoscopy. Emergency endoscopy is performed as soon as the patient is stabilized after initial resuscitation. In patients with exigent bleed-ing, endoscopy can be performed during resuscitation (Button et al. 2011). Local studies indicate that as the incidence of upper GI bleeding has increased over time (Hearnshaw et al. 2010). There is also current interest in whether prognosis for emergency disorders varies according to the day of admission, the size of hospi-tal and the distance travelled to hospital although lit-tle has been reported about these for upper GI bleed-
ing (Shaheen et al. 2009). So, the main objective of this study was to establish short term prognosis in patients with UGI bleeding in 1 month follow-up period.
MATERIAL AND METHODS
This prospective observational study was done to assess short term prognosis in 75 patients with upper gastro-intestinal bleeding referred to the Imam Husein Hospita, (Tehran, Iran) during the 2015-16. The demographic information was collected using check list based on patient’s background, Para clinic information, hos-pitalization and follow-up data. Correlation between sex, gender, age, disease and medication background, gastrointestinal disorder, smoking or alcohol drinking, blood factors (hemoglobin, PT, PTT, INR and platelet) and endoscopic ulceration are determined at the arrival and after 1 month. Data is analyzed by repeated measure one-way analysis of variance (ANOVA) using SPSS 16.0 for Windows (SPSS, Inc., Chicago, IL, USA). For treat-ment showing a main effect by ANOVA, means com-pared by Tukey–Kramer test. P<0.05 was considered as signifi cant differences between treatments.
RESULT AND DISCUSSION
As seen in the current study, among 75 patients, 54 male (72%) and 21 women (28%) were include into the study. The mean age of the patients was 61.2 ± 18.6 years old (P=0.4).in this study, 37 (49.3%) had hematoma while 46 (61.3%) had melena, 11 (14.7%) Hematochezia and 27 (36%) with active bleeding were referred to the hospi-tal. In the initial investigation the mean blood pressure and diastolic pressures were 116.1±19.2 and 69.8±23.4 mmHg, respectively. Mean heart rate was 81.2±27.7/min. the clinical results of the patients included into the study is presented in table 1. According to the data, the man HB at the beginning and end of the study were 9.3 ± 2.9 and 9.8 ± 2.01 mg/dl, respectively. The mean PT, PTT and INR were 14.7 ± 8.7, 31.9 ± 25.2 and 1.5 ± 1.4, respectively.
The patient’s distribution based on disease back-ground is presented in table 2. According to the data, Hypertension and Cardiovascular disease were the most frequent among them. Also, ulcer was the prominent digestive disease 27 (36%). For family background for gastrointestinal disease, GI cancer 4 (5.3%) was the most report.
Based on the endoscopic observation, clean base and gastritis were the more problem 23 (30.7%) and 22 (29.3%) in the patients.
In this study, 4 patients (5.3%) needed for urgency surgery and 33 (44%) for packed cell. During the study,

BIOSCIENCE BIOTECHNOLOGY RESEARCH COMMUNICATIONS ASSESSMENT OF SHORT TERM PROGNOSIS IN PATIENTS WITH UPPER GASTROINTESTINAL BLEEDING 343
Saeid Hashemieh et al.
Table 1. The clinical results of the patients included into the study
Factor Minimum Maximum Mean ± SdHb (at arrival) (mg/dl) 2.9 16 9.3 ± 2.9
Hb (after treatment) (mg/dl) 6.8 15.7 9.8 ± 2.01
PT 1.3 50 14.7 ± 8.7
PTT 1 120 31.9 ± 25.2
INR 1 9.3 1.5 ± 1.4
Platelet 31500 479000 213200 ± 111800
Table 2. The patients distribution based on disease background
Factor N (%)Family background for Gastrointestinal disease
N (%)
Disease background Ulcer 2 (2.7)
Diabetes 31 (41.3) Gastrointestinal cancer 4 (5.3)
Hyperlipidemia 17 (22.7) Intestinal ulcers 2 (2.7)
Hypertension 41 (54.7) Medication Background
Cardiovascular disease 41 (54.7) NSAID 20 (26.7)
Cirrhosis 8 (10.7) SSRI 13 (17.3)
Hepatitis 5 (6.7) Warfarin 10 (13.3)
Digestive disorders Steroid 2 (2.7)
Ulcer 27 (36) Opioid therapy
Intestinal ulcers 8 (10.7) Alcohol 16 (21.3)
Gastrointestinal cancer 6 (8) Opiates 31 (41.3)
Gastrointestinal bleeding 8 (10.7) Smoking 5 (6.7)
Methadone 1 (1.3)
Table 3. The endoscopic observation in the patients
Endoscopic results N (%)Pigmented ulcer Pigmented ulcer 2 (5.3)
Clean base 23 (30.7)
Gastritis 22 (29.3)
Tearing 2 (2.7)
Gastric varices 7 (9.3)
Visiblessle ulcer 8 (10.7)
16 patients needed for hospitalization (21.3%) in the ICU. 6 (8%) of them had bleeding and 11 (14.7%) sub-sequent endoscopy. Hospitalization period was 5.5±2.5 days and 12 deaths during hospitalization and 3 deaths in 1 month follow-up were reported. After a month fol-low-up, digestive signs 32 (50.8%), bleeding 32 (50.8%), sever moral 2(3.1%), re-endoscpoy 2(3.1%), re-hospital-ization 2(3.1%), and death 3(3.4%) were recorded. No signifi cant difference detected between sex, age, family background, medication, Hematochezia, hematoma and melena before and after the study (P>0.05). No signif-icant difference observed in group aged <60 and >60 years old in mentioned factors (P>0.05).
According to the results, a signifi cant correla-tion observed between blood pressure and bad moral (P<0.001), GI bleeding (P=0.018), alcohol (P=0.04), Opium administration (P=0.000), NSAIDs (P=0.036), ulcer incidence in primary endoscopy (P=0.003), Gas-tritis (P=0.008), emergency surgery (P=0.000), ICU care (P=0.000), re-bleeding (P=0.010) and need for subse-quent endoscopy (P=0.000). A correlation exist between opium administration in 1 month follow-up and endo-scopic ulcer (P=0.07). A signifi cant correlation reported between death and peritonitis (P=0.046), hypotension
(P=0.053), gastric ulcer in endoscopy (P=0.04), bleeding (P=0.023), ICU care (P=008) and no differences found in re-endoscopy (P=027), NSAIDs (P=056), gastritis (P=073) and emergency surgery (P=053).
According to the results, mortality rate in fi rst hos-pitalization was 16% and in one-month follow up was 4%. There was no signifi cant association between age and gender with duration of hospitalization and one-month prognosis. Mortality was associated with acute abdomen and orthostatic hypotension I admission time, peptic ulcer in endoscopic evaluation, active bleeding, ICU admission and need to second endoscopy. Erosive gastritis, need to emergent surgery and use of NSAIDs

344 ASSESSMENT OF SHORT TERM PROGNOSIS IN PATIENTS WITH UPPER GASTROINTESTINAL BLEEDING BIOSCIENCE BIOTECHNOLOGY RESEARCH COMMUNICATIONS
Saeid Hashemieh et al.
signifi cant increase of mortality rate. It seems admission time signs and symptoms, hemodynamic and coagula-tion status, endoscopic results and need to re-endoscopic evaluation are more prognostic factors in patients with UGIB.
In a study, Lanas et al. (2011) on 2660 patients (64.7% men; mean age 67.7 years) signifi cant differences reported on across countries in bleeding continuation ⁄ re-bleed-ing (range: 9–15.8%) or death (2.5–8%) at 30 days were explained by clinical factors (number of comorbidities, age > 65 years, history of bleeding ulcers, in-hospital bleed-ing, type of lesion or type of concomitant medication). Other factors (country, size of hospital, profi le of team managing the event, endoscopic and/or pharmacological therapy received) were not able to affect these outcomes (Loperfi do et al. 2009). Risk factors that have been previ-ously identifi ed to be predictive of bleeding continuation and re-bleeding include presence of comorbidities out-comes (Loperfi do et al. 2009) endoscopy-observed high-risk stigmata of bleeding; worse health status at admis-sion; bleeding from a peptic ulcer ( Viviane and Alan, 2008) a fi nding of bright blood during rectal examination and in nasogastric tube aspirate; smoking; failure to use PPIs postendoscopy; postendoscopy use of intravenous or low molecular-weight heparins and low endoscopist experience (Travis et al. 2008).
A number of these previously identifi ed predictive factors were confi rmed in UGIB (i.e. presence of comor-bidities, bleeding from a duodenal ulcer), and a number of new predictors of bleeding continuation⁄ re-bleeding were characterized: older age (>65 years), presentation with haematemesis and a history of UGIB at baseline (Button et al. 2011). Previously characterized predictors of mortality include older age; presence of, and increas-ing number of, comorbidities; continued bleeding and ⁄ or re-bleeding and a fi nding of bright blood in the nasogastric tube aspirate (Marmo et al. 2010). The pre-dictive validity of older age and the presence of comor-bidities were confi rmed in UGIB; in fact, the presence of comorbidities was by far the strongest predictor of mor-tality in this patient population. Other factors identifi ed to be signifi cantly predictive of mortality in this study were presentation with clinical symptoms of acute upper GI bleeding and alcohol abuse (Shaheen et al. 2009).
The overall rate of deaths due to GI complications and the rate of deaths associated with NSAID/aspirin use reported are lower than some frequently quoted estimates from previous studies, despite the fact that our fi gures include both upper and lower GI complica-tions and also refer to low-dose aspirin use (Hawkey and Langman, 2003).
There are a number of reasons that may account for some of the discrepancies observed in the studies: variation in prescribing practice by country; differences
in the extent of NSAID use and in the co-prescription of gastroprotective drugs; decreasing GI complication rates; and differences in study methodologies. Our data would imply a lower NSAID consumption in Spain com-pared with other countries. However, the annual NSAID prescription rates in Spain are relatively high (35.4 mil-lion) (Van Leerdam et al. 2003) and are proportionally greater than rates reported in the United Kingdom and 50% of those reported in the United States (70 million), despite Spain’s smaller population. In addition, the rate of NSAID use among adults in Spain (20.6%) is simi-lar than that determined in the United States (Estudio, 2000). Upper GI bleeding is one of the most important emergency disorders with high rates of mortality during the acute phase. Longer term increased risk of mortality is partly due to very poor prognosis for malignancy and variceal etiologies; although it also refl ects an impact of high levels of social deprivation and chronic co-morbid disease among people with upper GI bleeding (Roberts et al. 2012).
Survival over the three years was substantially poorer than in the general population for most etiologies of bleeding, with the possible exception of ‘complications of analgesics, antipyretics and anti-infl ammatory drugs’ and duodenal ulcers, which were both less prevalent among deprived quintiles than most of the other eti-ologies. Relative survival was worse for duodenal ulcer than for gastric ulcer in the fi rst few months after admis-sion, but it was better than for gastric ulcer bleeds in the longer term. This fi nding is consistent with a large sin-gle-center study of surgery for peptic ulcer which found increased longer term mortality for gastric ulcer but not for duodenal ulcer (Stae¨l von Holstein et al. 1997). In conclusion it seems admission time signs and symp-toms, hemodynamic and coagulation status, endoscopic results and need to re-endoscopic evaluation are more prognostic factors in patients with UGIB.
REFERENCES
Button LA, Roberts SE, Evans PA, et al. 2011 Hospitalized incidence and case fatality for upper gastrointestinal bleeding from1999 to 2007: a record linkage study. Aliment Pharmacol Ther 2011; 33: 64–76.
Button LA, Roberts SE, Evans PA, Goldacre MJ, Akbari A, Dsilva R, Macey S, Williams JG 2011. Hospitalized incidence and case fatality for upper gastrointestinal bleeding from 1999 to 2007: a record linkage study. Aliment Pharmacol Ther 33: 64–76
Carmona L. Estudio 2000 EPISER. Madrid: Spanish Society of Rheumatology; 141–54.
De Abajo FJ, Gil MJ, Bryant V, et al.2013 Upper gastrointesti-nal bleeding associated with NSAIDs, other drugs and interac-tions: a nested case-control study in a new general practice database. Eur J Clin Pharmacol 69:691–701.

BIOSCIENCE BIOTECHNOLOGY RESEARCH COMMUNICATIONS ASSESSMENT OF SHORT TERM PROGNOSIS IN PATIENTS WITH UPPER GASTROINTESTINAL BLEEDING 345
Saeid Hashemieh et al.
Halliday HL, Ehrenkranz RA, Doyle LW.2010 Early (<8 days) postnatal corticosteroids for preventing chronic lung disease in preterm infants. Cochrane Database Syst Rev (1):CD001146.
Hawkey CJ, Langman MJ 2003 .Non-steroidal anti-infl amma-tory drugs: Overall risks and management. Complementary roles for COX-2 inhibitors and proton pump inhibitors. Gut 52(4):600–8.
Hearnshaw SA, Logan RF, Lowe D, Travis SP, Murphy MF, Palmer KR. 2010 Use of endoscopy for management of acute upper gastrointestinal bleeding in the UK: results of a nation-wide audit. Gut 59: 1022–9.
Holcomb, J.B., Tilley, B.C., Baraniuk, S. et al. (2015) Transfu-sion of plasma, platelets, and red blood cells in a 1:1:1 vs a 1:1:2 ratio and mortality in patients with severe trauma: the PROPPR randomized clinical trial. JAMA, 313, 471–82.
Kovacs TOG, Jensen DM. 2008 The short-term medical man-agement of non-variceal upper gastrointestinal bleeding. Drugs 68 (15): 2105-2111.
Lanas A, Garcia-Rodriguez LA, Polo-Tomas M, et al. 2011 The changing face of hospitalisation due to gastrointestinal bleed-ing and perforation. Aliment Pharmacol Ther 33:585–91.
Lin HJ, Lo WC, Cheng YC, et al. 2006 Role of intravenous ome-prazole in patients with high- risk peptic ulcer bleeding after successful endoscopic epinephrine injection: a prospective, randomized, comparative trial. Am J Gastroenterol 101: 500-5.
Loperfi do S, Baldo V, Piovesana E, et al. 2009 Changing trends in acute upper-GI bleeding: a population-based study. Gastro-intest Endosc 70: 212–24.
Marmo R, Koch M, Cipolletta L, et al. 2010 Predicting mortality in non-variceal upper gastrointestinal bleeders: validation of the Italian PNED score and prospective comparison with the Rockall score. Am J Gastroenterol 2010; 105: 1284–91.
Martinek J, Hlavova K, Zavada F, et al. 2010 A surviving myth— corticosteroids are still considered ulcerogenic by a majority of physicians. Scand J Gastroenterol 45:1156–61.
Roberts SE, Button LA, Williams JG (2012) Prognosis follow-ing Upper Gastrointestinal Bleeding. PLoS ONE 7(12): e49507. doi:10.1371/ journal.pone.0049507
Shaheen AA, Kaplan GG, Myers RP. 2009 Weekend versus weekday admission and mortality from gastrointestinal hem-orrhage caused by peptic ulcer disease. Clin Gastroenterol Hepatol 7: 303–10.
Stae¨l von Holstein C, Anderson H, Ahsberg K, Huldt B (1997) The signifi cance of ulcer disease on late mortality after partial gastric resection. Eur J Gastroenterol Hepatol 9: 33–40.
Travis AC, Wasan SK, Saltzman JR.2008 Model to predict rebleeding following endoscopic therapy for non-variceal upper gastrointestinal hemorrhage. J Gastroenterol Hepatol 23: 1505–10.
Van Leerdam ME, Vreeburg EM, Rauws EA, et al. 2003 Acute upper GI bleeding: Did anything change? Time trend analysis of incidence and outcome of acute upper GI bleeding between 1993/1994 and 2000. Am J Gastroenterol;98(7):1494–9.
Viviane A, Alan BN. 2008 Estimates of costs of hospital stay for variceal and nonvariceal upper gastrointestinal bleeding in the United States. Value Health 11: 1–3.

Psychological CommunicationBiosci. Biotech. Res. Comm. 10(3): 346-353 (2017)
Resilience and basic psychological needs among
Palestinian school students
Shadi Khalil Abualkibash1 and Maria Jose Lera2
1Faculty of Psychology Education Universidad de 2 Santiago de Compostela2Faculty of Psychology, Seville University, Seville, Spain
ABSTRACT
The purpose of this study is to explore the relationship between Basic Psychological Needs including Autonomy, Competence and Relatedness (Deci and Ryan, 2000) and factors predicting resilience (American Psychological, 2010) among Palestinian school students who are living under adversity in the West Bank. The participants were 537 students 13 and 14 years old (45% male and 55% female) representing both urban and rural areas of the northern West Bank. All participants completed the CYRM-28 Psychological Resilience Questionnaire (Liebenberg et al., 2012) and The Basic Psychological Needs Scale-General Version (Ilardi et al., 1993). Structural Equation Modeling (SEM) analysis results showed that the BPN model adequately explained variable variance (MOD FIT/CFI = 0.998) and that satisfying Basic Psychological Needs had positive and signifi cant effect on resilience factors of Caregiving (Physical and Psychological Caregiving), Individual (Personal Skills, Peer Support, and Social Skills), and Context (Spiritual, Education and Cultural Context). The role of (BPN) was signifi cant ( = 0.297, p < 0.001), ( = 0.409, p < 0.001), and ( = 0.241, p < 0.001) respectively Caregiving, Individual, and Context, factors were high (0.711, 0.706, and 0.80) respectively, which in turn indicated that (BPN) plays strong role in explaining the variance of Caregiving, Individual, and Context factors. Based on these fi ndings, (SDT) can predict Resilience factors in case of satisfying (BPN). Findings of the study support that educational and family practices focusing on satisfying psychological needs are related to childhood resilience in the face of adversity.
KEY WORDS: RESILIENCE, SELF-DETERMINATION (SDT), AND BASIC PSYCHOLOGICAL NEEDS (BPN)
346
ARTICLE INFORMATION:
*Corresponding Author: [email protected] 3rd July, 2017Accepted after revision 25th Sep, 2017 BBRC Print ISSN: 0974-6455Online ISSN: 2321-4007 CODEN: USA BBRCBA
Thomson Reuters ISI ESC and Crossref Indexed Journal NAAS Journal Score 2017: 4.31 Cosmos IF: 4.006
© A Society of Science and Nature Publication, 2017. All rights reserved.Online Contents Available at: http//www.bbrc.in/DOI: 10.21786/bbrc/10.3/2

Shadi Khalil Abualkibash and Maria Jose Lera
BIOSCIENCE BIOTECHNOLOGY RESEARCH COMMUNICATIONS RESILIENCE AND BASIC PSYCHOLOGICAL NEEDS AMONG PALESTINIAN SCHOOL STUDENTS 347
INTRODUCTION
Palestine is a nation in a unique geo-political situation where violence imposed by armed forces and/or mili-tary violence as well as with restriction of movement through checkpoints, closures and curfews, and acts of individual and communal threat and humiliation occur regularly. Traumatic events such as shootings, bomb-ings, destruction of houses, physical assaults and deaths occur in some areas on a daily basis Rytter et al., 2006, Abdeen et al., 2008, Soares et al., 2007, Qouta et al., 2008a, Thabet et al., 2016, Thabet, 2015, Mousa Thabet and Vostanis, 2017, Al-Sheikh and Thabet, 2017).
Numerous studies have noted distinct psychological and behavioral impacts of traumatic experiences dur-ing situations of political unrest on youth, related to psychological health, well-being, and long term out-comes, including increased risk of suffering from mental health problems, such as; PTSD, insomnia, depression, low feeling of self-effi cacy and self-esteem, anxiety and depressive symptoms, cognitive distortions, and behav-ioral disturbances (Worden, 1996, Saigh et al., 1995, Chimienti et al., 1989, Foa et al., 1999, Baker, 1990, Stubbs and Soroya, 1996, Garbarino and Kostelny, 1993, Moro et al., 1998, Clarke et al., 1993).
It has also been demonstrated that youth in pro-tracted confl ict zones exhibit increased diffi culties in social relationships, fear of the dark, phobias, bedwet-ting, social withdrawal, negative social-interaction, aggressive behavior, insecure attachment, forgetfulness, somatic disorders and psychosocial behavioral prob-lems, fear, anger, sadness, humiliation, guilt, nightmares and emotional disregulation (Giaconia et al., 1995, Punamäki, 1997, Foa et al., 1999, Vila et al., 1999, Qouta et al., 2008b), as well as academic challenges such as low grades, concentration diffi culties, and truancy from school (Qouta and El-Sarraj, 2004, Kanninen et al., 2003, Thabet and Vostanis, 2000, Altawil, 2008). These indica-tors reveal how diffi cult it is for children residing in high confl ict zones, such as Palestine, to have a normal devel-opmental trajectory and the high risk for negative lifes-pan risks related to childhood trauma. Given the high number or young people exposed to traumatic events in Palestine, it is necessary for individual, community, and national well-being and progress to identify protective factors to reduce the potentially negative impacts of this currently inevitable exposure to violence (Hobfoll et al., 2011, Nguyen-Gillham et al., 2008, Thabet and Thabet, 2015a, Thabet and Thabet, 2015b).
Deci and Ryan (2000) Proposes that the relationship between the social contextual environment and people’s well-being is critical for positive human development in Self-Determination Theory (SDT). Self-Determination Theory is based on the tenant that the fulfi llment of three
Basic Psychological Needs (BPN) including autonomy, competence and relatedness, is essential for positive functioning and when these basic psychological needs are fulfi lled, optimal psychological well-being should occur (Gunnell et al., 2013). Ryan and Deci (2000) argue that satisfaction of the (BPN) for autonomy, competence, and relatedness improves well-being, and strengthens inner resources related to resilience, whereas frustration in these three areas increased vulnerability for defense mechanisms and psychopathology (Weinstein and Ryan, 2011, Vansteenkiste and Ryan, 2013). Weinstein and Ryan (2011), proposed that psychological need satisfac-tion acts as a buffer in times of stress, reducing both ini-tial appraisals of stress and encouraging adaptive coping after stress-related events occur.
The model of motivational resilience used in this study is based on Self-Determination Theory (SDT) (Deci and Ryan, 1985), and organized around the assumption that all individuals aim to satisfy the basic psychologi-cal needs of competence, relatedness, and autonomy. According to this perspective, humans inherently seek to explore opportunities to satisfy these needs. Individuals feel energized and joyful during interactions in which their needs are satisfi ed, and frustrated when they are thwarted. Based on their history of experiences in par-ticular situations, people construct views of themselves and the world in relation to these needs. Over time, these expectations come to shape their participation in their environment (Skinner et al., 2014).
The construct of resilience has been broadened from those experiencing severe environmental disruption to include the general population with everyday stressors and diffi culties (Timmerman, 2014, Martin and Marsh, 2008). Resilience is intricately related to behavioral autonomy, self-realization, self-regulation, and psy-chological empowerment (Weston and Parkin, 2010). Resilient individuals exhibit behavioral autonomy in taking responsibility for their actions. Individuals who are resilient are most likely to possess high levels of self-realization and self-effi cacy (Timmerman, 2014). Moreover, resilient individuals do not shy away from challenging tasks but exert even more effort, use more effective strategies, and approach diffi cult tasks with persistence. Resilient individuals self-regulate by plan-ning for and setting goals and consequently monitoring their progress toward these goals. People who exhibit self-realization are aware of their strengths and abili-ties, refl ect upon their past successes with challenging events, develop self-effi cacious beliefs in their abili-ties, and demonstrate greater capacities for responding to future events with resilience (Timmerman, 2014). In addition, research shows a strong association between psychological empowerment and resilience (Pines et al., 2012).

Shadi Khalil Abualkibash and Maria Jose Lera
348 RESILIENCE AND BASIC PSYCHOLOGICAL NEEDS AMONG PALESTINIAN SCHOOL STUDENTS BIOSCIENCE BIOTECHNOLOGY RESEARCH COMMUNICATIONS
Numerous scholars have noted the bond between resilience and self-determination. Spreitzer (1995) stated that, persons who are empowered or self-determined demonstrate greater resilience. Empowered individuals display resilience, self-determination, power, control, ability, competence, self-effi cacy, autonomy, knowledge, and development (Uner and Turan, 2010).
Based on the previous research, the satisfaction of basic psychological needs, facilitated by supportive social contexts, appears to foster both a sense of well-ness and leads to the building of inner resources that underlie subsequently demonstrated resilience.
The current study was designed to explore the asso-ciation between factors of resilience factors and the sat-isfaction of Basic Psychological Needs among Palestin-ian youth in West-Bank Directorates by using structural equation modeling including:
- The association between (BPN) and Resilience
MATERIAL AND METHODS
PARTICIPANTS AND PROCEDURE
The sample consisted of 537 Palestinian public school student’s 13 and 14 years old living in the West Bank (OPT Occupied Palestinian Territories). They were 55% girls and 45% boys. About two thirds (64%) were from rural areas and (36%) from urban areas. For the study, 25 schools were randomly selected as representative of schools in the North directorate of the West Bank. At each school 10 students from 8th grade and 10 students from 9th grade, were randomly selected. The High Min-istry of Education provided the permission to access the public schools, and then researcher informed the pupils, their parents, and headmaster about the purpose of study, obtaining their verbal consent for participation.
MEASURES
The Child and Youth Resilience Measure [CYRM]
(Liebenberg et al., 2012) is a comprehensive instrument composed of three sub-scales, which refl ect the major
categories of resilience. The fi rst sub-scale is “Individual Factors” that included personal skills (5 items), peer sup-port (2 items) and social skills (4 items). The second sub-scale is labeled “Family Support”, as refl ected in physi-cal/material support (2 items) as well as psychological care giving (5 items). The third sub- scale is “Contextual Components” which are environmental characteristics that facilitate a sense of belonging in youth, including spirituality (3 items), culture (5 items), and education (2 items). All responses were measured on a Likert Scale from 1 to 5 (1 = “never” and 5 = “always”), (Liebenberg et al., 2012). The Cronbach alpha coeffi cients were cal-culated for each dimension in the CYRM-28, (individual factors, family support, and contextual components) 0.80, 0.78 and 0.84 respectively. Cronbach’s alpha for the total scale (28 items) was 0.92.
The (BPN) Scale-General Version contains 21 items and is adapted from the (BPN) -work version (Ilardi et al., 1993). Responses for all items were indicated on a Likert Scale from 1 (not true at all) to 7 (defi nitely true) (Ryan and Deci, 2000). The instrument includes three sub-scale scores, measuring the degree to which the per-son experiences satisfaction of each of the three needs.
DATA ANALYSIS
Structural equation modeling (SEM) using Analysis of Moment Structure (AMOS) (SPSS Version 21) was used to analyze the data. Confi rmatory Factor Analysis [CFA] and Path Analysis were used to test psychological resil-ience related to the factors of individual characteristics, caregiving, contextual components and the Basic Psy-chological Needs related to autonomy, competence, and relatedness. This study anticipated a positive path from (BPN) to factors of Psychological Resilience (Clauss-Ehlers, 2008, Pines et al., 2012, Ruban et al., 2003, Deci and Ryan, 2000, Skinner et al., 2014, Spreitzer, 1995, Timmerman, 2014, Uner and Turan, 2010, Wehmeyer, 1996, Weston and Parkin, 2010, Tuckman, 2003).
Figure 1, shows the proposed model:HA: There is positive path from (BPN) to factors indi-
cating Psychological Resilience including individual characteristics, caregiving, and context. (See Figure1).
Table 1. Demographic Characteristics for the Participants
Demographic variables (n = 537)
Frequencies (Valid Percentage n = 537)
GenderMales 242 45
Females 295 55
Age13 268 50
14 269 50
Place of residenceCity 196 34
Village 341 66

Shadi Khalil Abualkibash and Maria Jose Lera
BIOSCIENCE BIOTECHNOLOGY RESEARCH COMMUNICATIONS RESILIENCE AND BASIC PSYCHOLOGICAL NEEDS AMONG PALESTINIAN SCHOOL STUDENTS 349
FIGURE 1. Theoretical model psychological resilience factors and its relationship with satisfaction of BPNS among the Palestinian basic school students in West-Bank.
RESULTS AND DISCUSSION
DESCRIPTION OF (BPN) AND RESILIENCE
The researchers computed means and SD for (BPN) and its domains (Autonomy, Competence, and Relatedness) and for Resilience and its subscales (Individual Charac-teristics, Caregiving, and Context), (see table 2).
CONFIRMATORY FACTOR ANALYSIS OF THE COMPONENTS OF (BPN) AND RESILIENCE
The results indicate that factor loadings were higher than .50, ranging from 0.66 to 0.7 for the (BPN), and higher for the Resilience components from 0.73 to 0.86, At the construct level, the results demonstrate that the reliabilities of all of the constructs ranged from 0.70 to
0.86 (higher than the recommended cut-off of 0.70 for this measure).
THE ASSOCIATION BETWEEN (BPN) AND RESILIENCE COMPONENTS
The present study utilizes SEM to test the hypothesized model regarding the relationship between the compo-nent variables of (BPN) and Resilience factors including: Individual Characteristics, Caregiving, and Context. The model predicts a positive path from (BPN) to Individ-ual Characteristics, Caregiving, and Context, (the pre-identifi ed components of resilience). Table 4 presents the data on statistical fi t for the hypothesized model, using standardized paths coeffi cients (Beta), and the estimate of variance explained (R2).
The 2 value was 8.489 (d.f. = 6, p = 0.204). Therefore, the relative 2 was (CMIN/df = 1.415). The RMSEA esti-mate of 0.028 provided support for the general model. Bentler’s CFI was 0.998 indicating that the proposed model fi t the data according to this index.
Table 2. Means and standard deviations of total resilience and resilience factors of children (N = 537)
Descriptive Statistics
Constructs Mean Std. Deviation NBPNS 5.1485 .68308 537
Autonomy 4.9327 .90893 537
Competence 5.0636 .83385 537
Relatedness 5.4493 .80478 537
RESILIENCE 3.7956 .67234 537
Individual Factors 3.4708 .62142 537
Caregiving Factors 4.0093 .81419 537
Context Factors 3.9067 .79080 537
Table 3. Standardized Path Coeffi cient and P value
Parameter DescriptionStandardized Path
Coeffi cient () P ValueRelatedness from BPNS 0.666** 0.000
Competence from BPNS 0.640* 0.000
Autonomy from BPNS 0.749** 0.000
Context from Resilience 0.861** 0.000
Individual from Resilience 0.734** 0.000
Caregiving from Resilience 0.789** 0.000

Shadi Khalil Abualkibash and Maria Jose Lera
350 RESILIENCE AND BASIC PSYCHOLOGICAL NEEDS AMONG PALESTINIAN SCHOOL STUDENTS BIOSCIENCE BIOTECHNOLOGY RESEARCH COMMUNICATIONS
The goodness of fi t index (GFI), adjusted GFI (AGFI), and Normed fi t index (NFI) for the measure were 0.995, 0.982, and 0.994 respectively; demonstrating general fi t. Path coeffi cients from (BPN) to INDIVIDUAL, CAREGIV-ING, and CONTEXT as well as total Resilience were sig-nifi cant (see Table 4 and 5).
As shown in table 4 and 5, the standardized path coeffi cient of caregiving factors from (BPN) was signifi -cant ( = 0.297, p < 0.001), R2 (0.711), indicating that (BPN) plays a strong role in explaining the variance of caregiving.
Perditions from Individual Characteristics to (BPN) it was signifi cant ( = 0.409, p < 0.001), R2 for individual factors was high (0.706), which in turn indicated that (BPN) plays strong role in explaining the variance of individual factors; (Individual Personal Skills, Individual Peer Support, and Individual Social Skills).
The variability of Context factors explained by (BPN) it was signifi cant ( = 0.241, p < 0.001). R2 (0.80), which in turn indicated that (BPN) plays strong role in explain-ing the variance of context factors.
To conclude, fi gure 2 shows SEM for Resilience fac-tors and their relationship with satisfaction of (BPN).
As shown in the pervious model and tables 4 and 5, the results revealed that basic psychological needs were
signifi cantly and positively associated with the fac-tors of resilience; (individual, caregiving, and context) among the participants.
DISCUSSION
The study aimed to explore whether the satisfaction of basic psychological needs (BPN) affected resilience fac-tors, in a sample of middle-school students living under situations of geo-political adversity, in Palestine.
Results of the current investigation revealed that the general level of Resilience and (BPN) measures in the sample was high. Additionally, the results revealed that there is signifi cant relationship between (BPN) and the selected factors of Resilience (individual characteristics caregiving, and context), especially between BPN and Individual Characteristics.
The results demonstrate that satisfying basic psycho-logical needs of youth in high confl ict environments, has positive effect on resilience and well-being. By review-ing these results it can be supposed that satisfying basic psychological needs positively predicts resilience which is consistent with the explanation offered under self-determination theory (Baard et al., 2004) in which they propose that satisfying basic psychological needs, has a positive effect on resilience and well-being.
Additionally the results of this study are consistent with previous fi ndings that explored (Baard et al., 2004, Deci and Ryan, 2000, Kaydkhorde, 2014), relationships between the children and their families and environ-mental context as supporting and contributing to sat-isfaction of basic needs, leading to the facilitation of mental adaptation, resilience and well-being.
Meeting the Basic Psychological Needs of autonomy, competence and relatedness provide essential condi-tions for positive development and growth, consistency and well-being, (Deci et al., 2001), and may determine a large variance in behavioral functioning (Deci and Ryan, 2017, Sheldon et al., 1996) (Deci and Ryan, 2017).
Table 4. Model Fit Indices and Recommended Values for SEM Analysis (Kline, 2005)
Model Fit IndexModel Fit summery
Recommended Values
CMIN (Chi-square p value) 0.204 > .05
CMIN /df 1.145 ≤ 3
CFI 0.998 ≥ .90
GFI 0.995 ≥ .90
AGFI 0.982 ≥ .90
NFI 0.994 ≥ .90
RMSEA 0.028 ≤ .05
Table 5. Model Fit Indices, Recommended Values for SEM Analysis, and the Observed Values for the Proposed Model
Model Fit Index
Observed Values Parameter Description
Standardized Path Coeffi cient () P Value R2
Chi-square value 8.489 Relatedness from BPNS 0.666** 0.000 CAREGIVING = 0.711
d.f. 6 Competence from BPNS 0.640* 0.000 INDIVIDUAL = 0.706
CMIN (p value) 0.204 Autonomy from BPNS 0.749** 0.000 CONTEXT= 0.800
CMIN /df 1.145 Context from Resilience 0.861** 0.000 AUTONOMY = 0.561
CFI 0.998 Individual from Resilience 0.734** 0.000 COMPETENCE = 0.409
GFI 0.995 Caregiving from Resilience 0.789** 0.000 RELATEDNESS = 0.443
AGFI 0.982 Caregiving from BPNS 0.297** 0.000
NFI 0.994 Individual from BPNS 0.409** 0.000
RMSEA 0.028 Context from BPNS 0.241** 0.000

Shadi Khalil Abualkibash and Maria Jose Lera
BIOSCIENCE BIOTECHNOLOGY RESEARCH COMMUNICATIONS RESILIENCE AND BASIC PSYCHOLOGICAL NEEDS AMONG PALESTINIAN SCHOOL STUDENTS 351
In conclusion, Self-Determination Theory (SDT) is organized around the satisfaction of three basic psy-chological needs (BPN) including autonomy, compe-tence, and relatedness. Students’ histories of experiences with family, school, and the community; including their interactions with parents, teachers, and peers who sup-port or undermine their needs, cumulatively shape their academic identities, or their personal convictions about whether they truly belong (relatedness), have what it takes to succeed (competence), and genuinely endorse the goals and values of schooling (autonomy) Cleary defi ne their resilience, especially in adversive environ-ments. These self-system processes, along with the nature of the academic work students are given (i.e., whether it is authentic, relevant, purposeful, and important) are the proximal predictors of students’ motivational resilience (or vulnerability), including their engagement, coping, and re-engagement (Skinner et al., 2014).
In general, an individual with the skills and char-acteristics of resilience paired with the traits of self-determined behavior best prepares one to adapt to new environments and increases the utilization of personal responsibility to address pressures they encounter in the environment (Timmerman, 2014). Individuals who capably demonstrate self-determined behaviors and resilience are better able to consistently work toward achieving challenging goals without losing interest or lessening their effort despite hitting a plateau or expe-riencing outright failure on their fi rst attempt (Timmer-man, 2014).
In order to improve resilience among Palestinian children, individual skills factors (personal skills, peer support, and social skills), context factors (spiritually, education and culture) and caregiving factors (physical
and psychological) fostering and building suitable edu-cational and academic interventions may be key based on self-determination theory and the current fi ndings. Collective interventions, either at community level or school level may be the best way to effectively address these issues for Palestinean youth and the full range of the population (Rabaia et al., 2010, Pieters, 2016, Hoge et al., 2007).
LIMITATIONS
Despite demonstrating (BPN) effects, it is uncertain that the directionality of the effects is in accordance with the model. To further examine these hypotheses and to provide conclusions with respect to the direction of the effect, it is recommended that future research include longitudinal data and school-change interventions.
Further limitations of the current investigation is the self-report nature of the instruments utilized, it was not possible to know exactly how the students inter-preted the constructs and whether they viewed the con-structs in ways that the researcher intended. While this is a limitation of all survey self-report research of this nature, it should be noted that the confi rmatory factor analysis did provide some support that the students were responding as expected. Future research could overcome this limitation by including a mixed methods approach.
REFERENCES
a bdeen, Z., Qasrawi, R., Nabil, S. & Shaheen, M. 2008. Psy-chological Reactions To Israeli Occupation: Findings From The National Study Of School-Based Screening In Palestine. Inter-national Journal Of Behavioral Development, 32, 290-297.
FIGURE 2. SEM for psychological resilience factors and its relationship with satisfaction of BPNS among the Palestin-ian basic school students in West-Bank.

Shadi Khalil Abualkibash and Maria Jose Lera
352 RESILIENCE AND BASIC PSYCHOLOGICAL NEEDS AMONG PALESTINIAN SCHOOL STUDENTS BIOSCIENCE BIOTECHNOLOGY RESEARCH COMMUNICATIONS
A l-Sheikh, N. A. M. & Thabet, A. A. M. 2017. Post-Traumatic Stress Disorder Due To War Trauma, Social And Family Sup-port Among Adolescent In The Gaza Strip. J Nurs Health Sci| Volume, 3, 1.
A ltawil, M. A. S. 2008. The Effect Of Chronic Traumatic Expe-rience On Palestinian Children In The Gaza Strip. Phd Doctoral Dissertation, University Of Hertfordshire.
A merican Psychological, A. 2010. The Road To Resilience. Retrieved January, 7, 2011.
B aard, P. P., Deci, E. L. & Ryan, R. M. 2004. Intrinsic Need Satisfaction: A Motivational Basis Of Performance And Well‐Being In Two Work Settings1. Journal Of Applied Social Psy-chology, 34, 2045-2068.
B aker, A. M. 1990. The Psychological Impact Of The Intifada On Palestinian Children In The Occupied West Bank And Gaza: An Exploratory Study. American Journal Of Orthopsychiatry, 60, 496.
C himienti, G., Nasr, J. A. & Khalifeh, I. 1989. Children’s Reac-tions To War-Related Stress. Social Psychiatry And Psychiatric Epidemiology, 24, 282-287.
C larke, G., Sack, W. H. & Goff, B. 1993. Three Forms Of Stress In Cambodian Adolescent Refugees. Journal Of Abnormal Child Psychology, 21, 65-77.
C lauss-Ehlers, C. S. 2008. Sociocultural Factors, Resilience, And Coping: Support For A Culturally Sensitive Measure Of Resilience. Journal Of Applied Developmental Psychology, 29, 197-212.
D eci, E. & Ryan, R. 2017. Self-Determination Theory. Basic Psychological Needs In Motivation, Development, And Well-ness. New York, Ny: The Guilford Press.
D eci, E. L. & Ryan, R. M. 1985. Intrinsic Motivation And Self-Determination In Human Behavior, University Of Rochester, Rochester, New York, Usa, Springer Us.
D eci, E. L. & Ryan, R. M. 2000. The “What” And “Why” Of Goal Pursuits: Human Needs And The Self-Determination Of Behavior. Psychological Inquiry, 11, 227-268.
D eci, E. L., Ryan, R. M., Gagné, M., Leone, D. R., Usunov, J. & Kornazheva, B. P. 2001. Need Satisfaction, Motivation, And Well-Being In The Work Organizations Of A Former Eastern Bloc Country: A Cross-Cultural Study Of Self-Determination. Personality And Social Psychology Bulletin, 27, 930-942.
F oa, E. B., Ehlers, A., Clark, D. M., Tolin, D. F. & Orsillo, S. M. 1999. The Posttraumatic Cognitions Inventory (Ptci): Develop-ment And Validation. Psychological Assessment, 11, 303.
G arbarino, J. & Kostelny, K. 1993. Children’s Response To War: What Do We Know. The Psychological Effects Of War And Vio-lence On Children, 23-40.
G iaconia, R. M., Reinherz, H. Z., Silverman, A. B., Pakiz, B., Frost, A. K. & Cohen, E. 1995. Traumas And Posttraumatic Stress Disorder In A Community Population Of Older Adoles-cents. Journal Of The American Academy Of Child & Adoles-cent Psychiatry, 34, 1369-1380.
G unnell, K. E., Crocker, P. R. E., Wilson, P. M., Mack, D. E. & Zumbo, B. D. 2013. Psychological Need Satisfaction And
Thwarting: A Test Of Basic Psychological Needs Theory In Physical Activity Contexts. Psychology Of Sport & Exercise, 14, 599-607.
H obfoll, S. E., Mancini, A. D., Hall, B. J., Canetti, D. & Bonanno, G. A. 2011. The Limits Of Resilience: Distress Following Chronic Political Violence Among Palestinians. Social Science & Medi-cine, 72, 1400-1408.
H oge, E. A., Austin, E. D. & Pollack, M. H. 2007. Resilience: Research Evidence And Conceptual Considerations For Post-traumatic Stress Disorder. Depression & Anxiety (1091-4269), 24, 139-152.
I lardi, B. C., Leone, D., Kasser, T. & Ryan, R. M. 1993. Employee And Supervisor Ratings Of Motivation: Main Effects And Dis-crepancies Associated With Job Satisfaction And Adjustment In A Factory Setting1. Journal Of Applied Social Psychology, 23, 1789-1805.
K anninen, K., Punamäki, R.-L. & Qouta, S. 2003. Personality And Trauma: Adult Attachment And Posttraumatic Distress Among Former Political Prisoners. Peace And Confl ict: Journal Of Peace Psychology, 9, 97-126.
K aydkhorde, H., Moltafet, G., Chinaveh, M. 2014. Relation-ship Between Satisfying Psychological Needs And Resilience In High-School Students In Dezful Town. Academic Journal Of Psychological Studies, 3, 57-62.
K line, R. B. 2005. Principles And Practice Of Structural Equa-tion Modeling. 2005. New York, Ny: Guilford.
L iebenberg, L., Ungar, M. & Van De Vijver, F. 2012. Valida-tion Of The Child And Youth Resilience Measure-28 (Cyrm-28) Among Canadian Youth. Research On Social Work Practice, 22, 219-226.
M artin, A. J. & Marsh, H. W. 2008. Academic Buoyancy: Towards An Understanding Of Students’ Everyday Academic Resilience. Journal Of School Psychology, 46, 53-83.
M oro, L., Franciškovic, T., Varenina, G. & Urlic, I. War Trauma: Infl uence On Individuals And Community. War Violence, Trauma And Coping Process, 1998.
M ousa Thabet, A. A. & Vostanis, P. 2017. Relationships Between Traumatic Events, Religious Coping Style, And Post-Traumatic Stress Disorder Among Palestinians In The Gaza Strip. J Nurs Health Stud, 2, 1.
N guyen-Gillham, V., Giacaman, R., Naser, G. & Boyce, W. 2008. Normalising The Abnormal: Palestinian Youth And The Contradictions Of Resilience In Protracted Confl ict. Health Soc Care Community, 16, 291-8.
P ieters, H. C. 2016. “I’m Still Here”: Resilience Among Older Survivors Of Breast Cancer. Cancer Nurs, 39, E20-8.
P ines, E. W., Rauschhuber, M. L., Norgan, G. H., Cook, J. D., Canchola, L., Richardson, C. & Jones, M. E. 2012. Stress Resil-iency, Psychological Empowerment And Confl ict Management Styles Among Baccalaureate Nursing Students. Journal Of Advanced Nursing, 68, 1482-1493.
P unamäki, R.-L. 1997. Determinants And Mental Health Effects Of Dream Recall Among Children Living In Traumatic Condi-tions. Dreaming, 7, 235.

Shadi Khalil Abualkibash and Maria Jose Lera
BIOSCIENCE BIOTECHNOLOGY RESEARCH COMMUNICATIONS RESILIENCE AND BASIC PSYCHOLOGICAL NEEDS AMONG PALESTINIAN SCHOOL STUDENTS 353
Q outa, S. & El-Sarraj, E. 2004. Prevalence Of Ptsd Among Pal-estinian Children In Gaza Strip. Arabpsynet Journal, 2, 8-13.
Q outa, S., Punamäki, R.-L. & El Sarraj, E. 2008a. Child Devel-opment And Family Mental Health In War And Military Vio-lence: The Palestinian Experience. International Journal Of Behavioral Development, 32, 310-321.
Q outa, S., Punamäki, R. L., Miller, T. & El‐Sarraj, E. 2008b. Does War Beget Child Aggression? Military Violence, Gender, Age And Aggressive Behavior In Two Palestinian Samples. Aggressive Behavior, 34, 231-244.
R abaia, Y., Giacaman, R. & Nguyen-Gillham, V. 2010. Violence And Adolescent Mental Health In The Occupied Palestinian Territory: A Contextual Approach. Asia-Pacifi c Journal Of Public Health / Asia-Pacifi c Academic Consortium For Public Health, 22, 216s-221s.
R uban, L. M., Mccoach, D. B., Mcguire, J. M. & Reis, S. M. 2003. The Differential Impact Of Academic Self-Regulatory Methods On Academic Achievement Among University Students With And Without Learning Disabilities. Journal Of Learning Dis-abilities, 36, 270-286.
R yan, R. M. & Deci, E. L. 2000. Self-Determination Theory And The Facilitation Of Intrinsic Motivation, Social Development, And Well-Being. American Psychologist, 55, 68-78.
R ytter, M. J. H., Kjældgaard, A.-L., Brønnum-Hansen, H. & Hel-weg-Larsen, K. 2006. Effects Of Armed Confl ict On Access To Emergency Health Care In Palestinian West Bank: Systematic Col-lection Of Data In Emergency Departments. Bmj, 332, 1122-1124.
S aigh, P. A., Mroueh, M., Zimmerman, B. J. & Fairbank, J. A. 1995. Self-Effi cacy Expectations Among Traumatized Adoles-cents. Behaviour Research And Therapy, 33, 701-704.
S heldon, K. M., Ryan, R. M. & Reis, H. T. 1996. What Makes For A Good Day? Competence And Autonomy In The Day And In The Person. Personality And Social Psychology Bulletin, 1270-1279.
S kinner, E., Pitzer, J. & Brule, H. 2014. The Role Of Emotion In Engagement, Coping, And The Development Of Motivational Resilience. International Handbook Of Emotions In Education, 331-347.
S oares, A. M., Farhangmehr, M. & Shoham, A. 2007. Hofst-ede’s Dimensions Of Culture In International Marketing Stud-ies. Journal Of Business Research, 60, 277-284.
S preitzer, G. M. 1995. Psychological Empowerment In The Workplace: Dimensions, Measurement, And Validation. Acad-emy Of Management Journal, 38, 1442-1465.
S tubbs, P. & Soroya, B. 1996. War Trauma, Psycho‐Social Pro-jects And Social Development In Croatia. Medicine, Confl ict And Survival, 12, 303-314.
T habet, A. A. & Vostanis, P. 2000. Post Traumatic Stress Disor-der Reactions In Children Of War: A Longitudinal Study. Child Abuse & Neglect, 24, 291-298.
T habet, A. M. & Thabet, S. S. 2015a. Trauma, Ptsd, Anxiety, And Resilience In Palestinian Children In The Gaza Strip. Brit-ish Journal Of Education, Society & Behavioural Science, 11, 1-13.
T habet, A. M. & Thabet, S. S. 2015b. Trauma, Ptsd, Anxiety, And Resilience In Palestinian Children In The Gaza Strip.
T habet, A. M., Thabet, S. S. & Vostanis, P. 2016. The Rela-tionship Between War Trauma, Ptsd, Depression, And Anxiety Among Palestinian Children In The Gaza Strip. Health Science Journal.
T habet, S. S. 2015. Stress, Trauma, Psychological Problems, Quality Of Life, And Resilience Of Palestinian Families In The Gaza Strip. Clinical Psychiatry.
T immerman, L. C. 2014. Self-Determination In Transitioning First-Year College Students With And Without Disabilities: Using Map-Works For Assessment. Ball State University.
T UCKMAN, B. W. 2003. The Effect of Learning and Motivation Strategies Training on College Studentsi Achievement. Journal of College Student Development, 44, 430-437.
U NER, S. & TURAN, S. 2010. The construct validity and reli-ability of the Turkish version of Spreitzer’s psychological empowerment scale. BMC public health, 10, 117.
V ANSTEENKISTE, M. & RYAN, R. M. 2013. On psychological growth and vulnerability: Basic psychological need satisfac-tion and need frustration as a unifying principle. Journal of Psychotherapy Integration, 23, 263-280.
V ILA, G., PORCHE, L.-M. & MOUREN-SIMEONI, M.-C. 1999. An 18-month longitudinal study of posttraumatic disorders in children who were taken hostage in their school. Psychoso-matic Medicine, 61, 746-754.
W EHMEYER, M. L. 1996. Self-determination as an educa-tional outcome: Why is it important to children, youth and adults with disabilities. Self-determination across the life span: Independence and choice for people with disabilities, 15-34.
W EINSTEIN, N. & RYAN, R. M. 2011. A self-determination the-ory approach to understanding stress incursion and responses. Stress & Health: Journal of the International Society for the Investigation of Stress, 27, 4-17.
W ESTON, K. J. & PARKIN, J. R. 2010. Resilience. Encyclopedia of Cross-Cultural School Psychology. Springer.
W ORDEN, J. W. 1996. Children and grief: When a parent dies, Guilford Press.

Medical CommunicationBiosci. Biotech. Res. Comm. 10(3): 354-358 (2017)
Effect of heptane food simulating liquid on surface
microhardness of 4 composites (Filtek Z250, Aelite,
Filtek Z350 and Clearfi l ST)
Niusha Golbari1, Morad Sadaghiani2*, Anahit Afrasiabi3, Mahdi Allahdadi4, Elmira Najafrad5 and Ehsan Sadeghi Ziaratgahi6
1DDS. Post Graduate Student of Restorative Dentistry Department, Dental School, Shahid Beheshti University of Medical Sciences, Tehran, Iran2Department of Restorative Dentistry, Islamic Azad University, Dental Branch, Tehran, Iran 3DDS. Post Graduate Student of Restorative Dentistry Department, Dental School, Shahid Beheshti University of Medical Sciences, Tehran, Iran4DDS. Post Graduate Student of Restorative Dentistry Department, Dental School, Shahid Beheshti University of Medical Sciences, Tehran, Iran5DDS. Post Graduate Student of Restorative Dentistry Department, Dental School, Hamadan University of Medical Sciences, Tehran, Iran6DDS. Post Graduate Student of Restorative Dentistry Department, Dental School, Shahid Beheshti University of Medical Sciences, Tehran, Iran
ABSTRACT
Resin based composites are became more and more popular in restorative dentistry, particularly because of their esthetic aspects. Decreasing the microhardness of dental restorative composites after curing in oral environment can infl uence their clinical durability. The aim of the current study was to determine effect of food simulating liquids 50% heptane on surface microhardness of Z250 microhybrid, Aelite nanofi lled Z350 and Clearfi l nanohybrid composites. 20 specimens of each composite were prepared in a prefabricated mold with 5 diameter and 2 mm depth. All the specimens composite were stored in distilled water, immediately after curing for 24 hours as the control group. Then the specimens were taken out of the solution and washed, dried and then surface microhardness of specimens was evaluated by the microhardness device based on Vickers. These specimens were divided into two groups randomly;
354
ARTICLE INFORMATION:
*Corresponding Author: [email protected] 23rd July, 2017Accepted after revision 28th Sep, 2017 BBRC Print ISSN: 0974-6455Online ISSN: 2321-4007 CODEN: USA BBRCBA
Thomson Reuters ISI ESC and Crossref Indexed Journal NAAS Journal Score 2017: 4.31 Cosmos IF: 4.006
© A Society of Science and Nature Publication, 2017. All rights reserved.Online Contents Available at: http//www.bbrc.in/DOI: 10.21786/bbrc/10.3/3

Niusha Golbari et al.
BIOSCIENCE BIOTECHNOLOGY RESEARCH COMMUNICATIONS EFFECT OF HEPTANE FOOD SIMULATING LIQUID ON SURFACE MICROHARDNESS OF 4 COMPOSITES 355
each of them was immersed in one of the following solutions distilled water, 50% heptane for 7 days at 37 ºC. After one week conditioning period microhardness testing was carried out. The data were analyzed by 2way ANOVA and Tucky HSD test. According to the results, there were signifi cant differences on the initial microhardness of all com-posites in water (p<0.05). Microhardness of the Z250 was higher than the other groups in water and heptane (p<0.05). A signifi cant decrease observed on the secondary microhardness of the Aelite and Clearfi l composites in heptane compared to the fi rst time (p<0.05). The Clearfi l had higher decrease on microhardness in water and heptane com-pared to the other composites (p<0.05). The microhardness of composite resin materials used in this study infl uenced after immersion in Heptane food simulation solution and distilled water. The effect of heptane on change in surface microhardness is material dependent.
KEY WORDS: COMPOSITE,NANOHYBRID, MICROHYBRID,NANOFILL, HEPTANE, FOOD SIMULATING
INTRODUCTION
The administration of resin-based restorative materials in dentistry has increased recently because of their good aesthetic appearance, improvements in formulations, ease of handling, and ability to establish a bond to dental hard tissues. The mechanical property of the dental com-posites depends on the fi ller particles and particle size. Recent advancements on the organic matrix and inor-ganic fi llers have led to the development of new materi-als with reduced particle size and increased fi ller loading which improved mechanical properties and aesthetics on the current composite resin materials.Restorative materi-als are required to have long-term continuousness while the oral cavity is a complex aqueous environment and restorative material contacts with saliva, (Catelan et al. 2010, Hengtrakool et al. 2011, Erdemir et al. 2013 George and Kavyashree 2017).
Also, low pH due to acidic foods and drinks may infl uence the mechanical and physical characteristics of the materials (Miranda et al. 2011). Physical character-istics of restorative materials are an important concern when determining suitable restorative materials because they strongly infl uence the clinical longevity of restora-tions (Seifert et al. 2011). In clinical environment, micro-hardness of materials decrease might contribute to its deterioration. Under in vivo conditions, composite resin materials may be exposed either discontinuously or con-tinually to chemical agents found in saliva, food and beverages (Topcu et al. 2010). In the short- or long-term, these conditions have adverse effect on its physical and chemical structure (Valinoti et al. 2008). The material’s microhardness is one of the most important properties, which correlates with resistance to intra-oral softening, compressive strength and degree of conversion (Volta-relli et al. 2010). A low surface microhardness value is largely related to inadequate wear resistance and pro-clivity to scratching, which can compromise fatigue strength and lead to failure of the restoration (Erdemir et al. 2013). So, the aim of the current study was to determine effect of food simulating liquids 50% heptane
on surface microhardness of Z250 microhybrid, Aelite nanofi lled Z350 and Clearfi l nanohybrid composites
MATERIAL AND METHODS
In this experimental in vitro study 4 composite types were used (n=10). The composites allocated in stainless steel (5mm diamater×2mm thickness). A smooth plate put on the composite and the produced collected at 40 s by SDS Kerr (1000mW/cm2) and polymerized (2×2) and polished using aluminum oxide (3M ESPE) by spraying the water. Then samples stored in distilled water 37ºC for 24 h. Then microhardness of the samples determined using Intender (6100 Vickers, USA).
COMPOSITES
The information of the composites used in the study was Filtek z250 Micro hybrid (fi ller weight 82%, fi ller volume 60%) Zirconia silica (0.6μm) Bis-EMA, UDMA Bis-GMA. The Filtek Z350 was Nanofi lled (fi ller weight 78.5%, fi ller volume 59.5%) Zro2/sio2 nanocluster, Sio2 nanofi ller (5-20nm) Bis-GMA Bis-EMA UDMA TEG-DMA. The Aelite was Nanofi lled (fi ller weight 73%, fi ller volume 54%) Glass frit Amouphous silica (0.04-5μm) Exhoxylated Bisphenol A Dimethacrylate TEGDMA. The Clearfi lMajesty ES-2 was Nanohybrid (fi ller weight 93%, fi ller volume 81%) Silanatedbarium glass fi ller Pre-polymerized organic fi ller (0.04-1μm) hydrophobic aromatic dimethacyilate TEG-DMA Bis-GMA. The 50 gr force for 15 s is done using Intender on 3 points in each sample. Then the microhardness of the samples deter-mined. The 10 samples allocated into the heptane and 10 in distilled water for 7 days. After one week condition-ing period microhardness testing was carried out.
STATISTICAL ANALYSIS
The data were analyzed by 2way ANOVA and Tucky HSD test using SPSS 16.0 for Windows (SPSS, Inc., Chi-cago, IL, USA). P< 0.05 was considered as signifi cant differences between treatments.

Niusha Golbari et al.
356 EFFECT OF HEPTANE FOOD SIMULATING LIQUID ON SURFACE MICROHARDNESS OF 4 COMPOSITES BIOSCIENCE BIOTECHNOLOGY RESEARCH COMMUNICATIONS
RESULTS AND DISCUSSION
According to the results, there were signifi cant differ-ences on the initial microhardness of all composites in water (p < 0.05). Microhardness of the Z250 was higher than the other groups in water and heptane (p < 0.05). No signifi cant difference observed on primary micro-hardness of Aelite and Clearfi l (p > 0.05). A signifi cant decrease observed on the secondary microhardness of the Aelite and Clearfi l composites in heptane compared to the fi rst time (p < 0.05). The microhardness of Clearfi l signifi cantly decreased compard to the other composites in water and heptane conditions.
As seen in table 2, a signifi cant differences observed between primary and secondary microhardness of the Z350 (65.30±6.19 and 75.84±4.25), 75.84±4.25
(50.88±7.47 and 39.87±5.07), Z250 (73.69±3.69 and 85.22±9.33) and Clearfi l (43.66±4.99 and 35.47±4.61).
As seen in table 3, signifi cant difference was observed on microhardness of Aelite (0.006) and Clearfi l (0.0001) stored in heptane.
The primary and secondary microhardness of materi-als is presented in table 4.
DISCUSSION
During consumption of food or drink contacts teeth or restoration surfaces for only a short time before it is washed away by saliva. Usually contact of teeth with acidic food or drink for a prolonged period of time and the situation did not account for the role of saliva (Erdemir et al. 2013). As observed in the current study, surface microhardness of Z250 was higher than the other groups. After 24 hours distilled water had signifi cant effect on all the specimens. After 7days distilled water had signifi cant effect on all groups however, Heptane had signifi cant effect on Aelite and Clearfi l specimens. According to analyses after both 24 hours and 7 days Z250 and Z30 specimens showed increase in micro-hardness while Aelite and Clearfi l showed signifi cant decrease in microhardness. Clearfi l presented the low-est microhardness values. Distilled water was selected instead of artifi cial saliva to simulate the aching effect of saliva because the artifi cial saliva storage medium is not considered to be a more clinically relevant environ-ment (Erdemir et al. 2013).
The surface microhardness index of all restorative materials after a week of storage in distilled water was higher than the baseline surface microhardness val-
Table 1. The microhardness of the different composited composite stored in distilled water or heptane
Composite Food suspension
Primary microhardness
Secondary microhardness
Z350distilled water
65.3000 75.8450
Heptane 63.8390 67.3380
Aelitedistilled water
73.6970 85.2210
Heptane 77.3370 82.7360
Z250distilled water
50.8810 39.8760
Heptane 50.8720 39.8550
Clearfi ldistilled water
43.6690 35.4780
Heptane 43.4300 33.5460
Table 2. the primary and secondary microhardness of composite stored in distilled water
Composite Primary distilled water
Secondary distilled water
P value
Z350 65.30±6.19 75.84±4.25 0.0001
75.84±4.25 50.88±7.47 39.87±5.07 0.015
Z250 73.69±3.69 85.22±9.33 0.0001
Clearfi l 43.66±4.99 35.47±4.61 0.013
Table 3. the primary and secondary microhardness of composite stored in heptane
CompositePrimary heptane
Secondary heptane P value
Z350 63.83±3.55 67.33±5.95 0.226
Aelite 50.87±6.41 39.85±6.90 0.006
Z250 77.33±6.27 82.73±3.68 0.064
Clearfi l 43.43±4.46 33.54±2.62 0.0001
Table 4. the primary and secondary microhardness of materials
Compared materials t-Test P valueZ350 & Distilled water (primary & secondary)
-10.54±1.33 -7.906 0.001
Z350 & Heptane (primary & secondary)
-11.52±6.86 -5.312 0.226
Aelite & Distilled water (primary & secondary)
11.00±3.67 2.991 0.015
Aelite & Heptane (primary & secondary)
11.01±3.083 3.573 0.006
Z250 & Distilled water (primary & secondary)
-9.09±8.90 -3.231 0.001
Z250 & Heptane (primary & secondary)
-9.55±10.71 -2.820 0.064
Clearfi l & Distilled water (primary & secondary)
8.19±2.66 3.072 0.013
Clearfi l &Heptane (primary & secondary)
9.88±1.35 7.280 0.001

Niusha Golbari et al.
BIOSCIENCE BIOTECHNOLOGY RESEARCH COMMUNICATIONS EFFECT OF HEPTANE FOOD SIMULATING LIQUID ON SURFACE MICROHARDNESS OF 4 COMPOSITES 357
ues. This could possibly be explained by the ampli-fi ed monomer conversion and additional post-curing cross-linking reactions in the resin phase over the time. Compoglass F, Filtek Z250, Filtek Supreme and Premise specimens stored in distilled water had lower surface microhardness reductions compared to the specimens immersed in sports and energy drinks (Erdemir et al. 2013). In a study using Meliodent, FuturaGen and hard GC reline.
Rajaee et al. (2014) reported heptane conditioning decreased the fl exural strength of Meliodent and Futur-aGen and microhardness of FuturaGen. Ethanol solution had the most adverse effect on the microhardness and fl exural strength of the tested resin materials (Rajaee et al. 2014). Takahashi et al. (1998) reported that water immersion had different effects on the fl exural strength and microhardness of different denture base and reline resin materials. They concluded that the results could be due to the fact that the intrinsic strength of the resin and the amount of water sorption in the system infl uences the mechanical strength of water absorbed acrylic resins. It is reported two days of immersion in the water lead to a reduction in the microhardness of the resin samples. As mentioned, water absorption and continuation of the acrylic polymerization process is time-dependent and diffusion-controlled Azevedo et al. (2005). Organic solutions may damage the resin matrix (heptane and aqueous ethanol solution). On the other hand, water and citric acids can damage organic fi llers. Therefore organic solutions could decrease fl ex-ural strength and microhardness of dental resins (Yesi-lyurt et al. 2009).
In a study, Yanikoglu et al. (2009) determined the surface microhardness of fi lled (Estelite), nanofi l (Ælite), unfi lled (Valux Plus), hybrid (Tetric ceram) and Ormocer-based (Admira) composite resins in tea, coffee, Turk-ish coffee, mouthwash, cola, and distilled water. Based on their report the microhardness values of composite materials were statistically different in different immer-sion solutions. The acidity may change the polymeric matrixes of composite resin affecting dimethacrylate monomer present in their compositions (Al-Samadani, 2013). A previous study suggested that, by lowering the solutions’ pH, there is production of methacrylic acid that results in the sorption and hygroscopic expansion as a consequence of enzymatic hydrolysis and biodeg-radation (Sripetchdanond and Leevailoj, 2014). It was observed that sodium fl uoride containing mouth rinses also reduce the surface microhardness (Sripetchdanond and Leevailoj, 2014).
In a recent study, George et al (2017) on effect of four mouth rinses on microhardness of resin composite (Filtek™ P60) material (3M ESPE St. Paul, MN, USA) reported all the mouth rinses showed reduction in surface microhardness
of the esthetic restorative material. Yesilyurt et al. (2009) reported microhardness of silorane-based composite was not infl uenced by ethanol signifi cantly, which could be due to the hydrophobicity of the resin matrix. Except for Bis-EMA, all other molecules (Bis-GMA, UDMA, and TEG-DMA) have hydroxyl groups, which promote water sorp-tion. As for silorane-based composite, it has 3,4-epox-ycyclohexyl-cyclopolymethylsiloxane. In conclusion, the microhardness of composite resin materials used in this study infl uenced by food simulation solutions. The effect of heptane on change in surface microhardness is material dependent.
REFERENCES
Al-Samadani KH. 2013 Color stability of restorative materials in response to Arabic coffee, Turkish coffee and Nescafe. J Contemp Dent Pract. 14:681-90.
Azevedo A, Machado AL, Vergani CE, Giampaolo ET,Pavarina AC. 2005 Hardness of denture base and hard chair-side reline acrylic resins. J Applied Oral Sci. 13: 291-295.
Catelan KA, Briso AL, Sundfeld RH, Santos PH. 2010 Effect of artifcial aging on the roughness and microhardness of sealed composites. J Esthet Restor Dent. 22:324-30.
Erdemir U, Yildiz E, Eren MM, Ozel S.2013 Surface hardness evaluation of different composite resin materials: infl uence of sports and energy drinks immersion after a short-term period. J Appl Oral Sci. 21(2):124-31.
George R. and Kavyashree G. 2017 Effect of four mouth rinses on microhardness of esthetic restorative material: An in vitro study. J Int Oral Health 2017;9:55-9.
Hengtrakool C, Kukiattrakoon B, Kedjarune-Leggat U. 2011 Effect of naturally acidic agents on microhardness and surface micromorphology of restorative materials. Eur J Dent. 5:89- 100.
Miranda DA, Bertoldo CE, Aguiar FH, Lima DA, Lovadino JR. 2011 Effects of mouthwashes on Knoop hardness and surface roughness of dental composites after different immersion times. Braz Oral Res. 25:168-73.
Rajaee N, Vojdani M, Adibi S. 2014 Effect of food simulating agents on the fl exural strength and surface hardness of den-ture base acrylic resins. OHDM. 13(4): 1041-1047.
Seifert SM, Schaechter JL, Hershorin ER, Lipshultz SE. 2011 Health effects of energy drinks on children, adolescents, and young adults. Pediatrics. 127:511-28.
Sripetchdanond J, Leevailoj C. 2014 Wear of human enamel opposing monolithic zirconia, glass ceramic, and composite resin: An in vitro study. J Prosthet Dent 112:1141-50.
Takahashi Y, Chai J, Kawaguchi M. 1998 Effect of water sorp-tionon the resistance to plastic deformation of a denture base material relined with four different denture reline materials. Intern J Prosthods. 11: 49-54.
Topcu FT, Erdemir U, Sahinkesen G, Yildiz E, Uslan I, Acikel C. 2010 Evaluation of microhardness, surface roughness, and

Niusha Golbari et al.
358 EFFECT OF HEPTANE FOOD SIMULATING LIQUID ON SURFACE MICROHARDNESS OF 4 COMPOSITES BIOSCIENCE BIOTECHNOLOGY RESEARCH COMMUNICATIONS
wear behavior of different types of composite resins polymer-ized with two different light sources. Biomed Mater Res B Appl Biomater. 92:470-8.
Valinoti AC, Neves BG, Silva EM, Maia LC. 2008 Surface deg-radation of composite resins by acidic medicines and pH-cycling. J Appl Oral Sci. 16:257-65.
Voltarelli FR, Santos-Daroz CB, Alves MC, Cavalcanti AN, Marchi GM. 2010 Effect of chemical degradation followed by
tooth brushing on the surface roughness of restorative com-posites. J Appl Oral Sci. 18:585-90.
Yanikoglu N, Duymus ZY, Yilmaz B. 2009 Effects of different solutions on the surface hardness of composite resin material. Dent Mater J 28(3): 344–351
Yesilyurt C, Yoldas O, Altintas SH, Kusgoz A. 2009 Effects of food simulating liquids on the mechanical properties of a sil-orane-based dental composite. Dent Mater J 28:362-7.

Biotechnological CommunicationBiosci. Biotech. Res. Comm. 10(2): 359-364 (2017)
Antibacterial and antioxidant activity of leaf organic
extracts of local cultivars of Murraya koenigii (L.)
Spreng from Tamilnadu
M. KavithaSchool of Biosciences and Technology, VIT University, Vellore-632014, Tamilnadu, India
ABSTRACT
The aim of the present study was to evaluate the antibacterial activity against fi ve bacterial pathogens and anti-oxidant activity of three organic extracts prepared from the leaves of local cultivars of Murraya koenigii. Agar well diffusion was utilized to determine the zone of inhibition. Broth microdilution was employed to fi nd out the minimal inhibitory concentration (MIC) and minimal bactericidal concentration (MBC). Anti-oxidant activity was analysed using 2,2-Diphenyl-1-picryl hydrazyl (DPPH) free radical scavenging assay. The organic extracts displayed promis-ing antibacterial activity against Staphylococcus aureus, Escherichia coli and Pseudomonas aeruginosa. Ethyl alcohol extract presented highest inhibitory activity when compared to hexane and chloroform extracts. In relation to agar diffusion method, the ethyl alcohol extract displayed lowest MIC and MBC value of 12.5 and 25 mg ml-1 against Staphylococcus aureus and same MIC and MBC value of 25 and 50 mg ml-1 against Escherichia coli and Pseudomonas aeruginosa. The radical-scavenging activity of ethyl alcohol extract (IC50 = 30 μg ml-1) is very close to that of the standard compound, gallic acid (IC50 value of 35 μg ml-1). The results suggested that the local cultivars of M. koenigii carry benefi cial health effects in terms of antimicrobial and anti-oxidant activities and could be used as a promising dietary supplement.
KEY WORDS: MURRAYA KOENIGII; ETHYL ALCOHOL EXTRACT; CARBAZOLE ALKALOID; ANTIBACTERIAL ACTIVITY; ANTIOXIDANT ACTIVITY
359
ARTICLE INFORMATION:
*Corresponding Author: [email protected] 27th Nov, 2017Accepted after revision 26th Sep, 2017 BBRC Print ISSN: 0974-6455Online ISSN: 2321-4007 CODEN: USA BBRCBA
Thomson Reuters ISI ESC and Crossref Indexed Journal NAAS Journal Score 2017: 4.31 Cosmos IF: 4.006
© A Society of Science and Nature Publication, 2017. All rights reserved.Online Contents Available at: http//www.bbrc.in/DOI: 10.21786/bbrc/10.3/4

360 ANTIBACTERIAL AND ANTIOXIDANT ACTIVITY OF LEAF ORGANIC EXTRACTS OF LOCAL CULTIVARS BIOSCIENCE BIOTECHNOLOGY RESEARCH COMMUNICATIONS
M. Kavitha
INTRODUCTION
Spices and herbs which are used in food preparations traditionally are well known to contain several health promoting bioactive substances. Herbal medicines are used alternatively in many countries to cure many ail-ments (Kamboj, 2000). Herb based medicines are now marketed as nutraceuticals (health foods) (Brower, 1998). Indian Ayurvedic medicine is believed to be more than 5000 years old and it was well practiced and well recorded over the years (Garodia et al., 2007). Herbal drugs are generally used to prevent and treat various diseases and ailments or to support health and healing (De Smet, 1997). The World Health Organization (WHO) has also recognized the importance of traditional medi-cine and has set precise guidelines for the evaluation of the safety, effi cacy, and quality of herbal medicines. In recent years the research on the medicinal proper-ties of various traditionally used medicinal plants has gained considerable interest in order to ascertain their true medicinal values and also to assess their toxicity (Newman and Crag, 2007). Some drugs have been dis-continued due to their toxicity, while others have been modifi ed or combined with additional herbs to counter-balance side effects (Harish, 2001).
Bioactive principles of plants, also known as secondary metabolites exert a range of pharmacological activities in human beings besides serving as defense barriers in plants (Paul et al., 2015). They are responsible for therapeutic activities like hypoglycemic, anti-diabetic, anti-oxidant, anti-microbial, anti-infl ammatory, anti-carcinogenic, anti-malarial, anti-cholinergic, anti-leprosy activities etc. (Makri and Kintzios, 2007; Negi et al., 2011). Com-mon bioactive principles present in plants are, alkaloids, fl avonoids, polyphenols, terpenoids, coumarins, tannins, saponins, anthocyanins and glycosides (Paul et al., 2015).
Additionally secondary metabolites also prevent spoilage and deterioration of food products Panghal et al., 2011). Murraya koenigii (L.) Spreng popularly known as curry leaf plant is a familiar spice used in India for its characteristic fl avour and aroma. According to Wealth of India, it is also used in traditional Indian medicine as analgesic, febrifuge, stomachic, carminative and for the treatment of dysentery and skin eruptions. Recent studies on M. koenigii revealed its medicinal val-ues like antidiarrhoeal, antimicrobial, hepatoprotective, radical-scavenging, hypoglycemic, and immunomodu-latory properties (Maa et al., 2016). Phytochemical analysis of leaves, bark and root showed the presence of several bioactive constituents like carbazole alkaloids, -carotene, polyphenols, terpenoids and coumarins (Malwal and Sarin, 2011; Gahlawat et al., 2014).
The pharmacological activities of M. koenigii as reported in different studies seem to exhibit a certain
variation which is attributed mainly to the climatic dif-ferences among locations (Onayade and Adebajo, 2000). Therefore it has become a common practice to con-fi rm that the local cultivars of M. koenigii possess the expected benefi cial effects when consumed regularly. There are a few reports on phytochemical analysis and pharmacological activities of M. koenigii from India (Ningappa et al., 2008; Panghal et al., 2011; Malwal and Sarin, 2011; Biswas et al., 2012). But to my best knowledge, in recent years there are no studies on the antioxidant and antimicrobial activities of M. koenigii from Tamilnadu, a southern state of India. Therefore the present study on antibacterial and antioxidant activity of leaf organic extracts of local cultivars of Murraya koenigii from Tamilnadu was undertaken.
MATERIALS AND METHODS
2,2-Diphenyl-1-picrylhydrazyl (DPPH) was procured from Sigma chemicals. Mueller Hinton agar and broth were purchased from Hi-Media, Mumbai. All other chemicals used were of analytical grade commercially available in India.The antibacterial activity of the organic extracts was tested against fi ve bacterial strains. The only Gram positive bacterium included in the study was Staphylococcus aureus MTCC 96 (ATCC 9144). Four Gram negative bacteria used were Escherichia coli MTCC 901 (ATCC 13534), Klebsiella pneumoniae MTCC 109 (ATCC 15380), Salmonella paratyphi MTCC 735 and Pseudomonas aeruginosa MTCC 8291. All these bacteria were obtained from Microbial Type Culture Collection (MTTC), Institute of Microbial Technology, Chandigarh, India and they were maintained on nutrient agar. M. koenigii leaves were collected locally from various loca-tions of Tamil Nadu, India and authenticated by Bot-anist. Fresh leaves were washed thoroughly and dried under shade till constant weight. The dried leaves were ground to powder in a mixer grinder.
100 g of shade dried M. koenigii leaves powder was extracted with hexane, chloroform and ethanol sepa-rately at room temperature for 2 days and then the sol-vents were evaporated using vacuum rotary evaporator at 50oC. The organic extracts thus obtained were dried at room temperature till constant weight and then stored in brown bottles at 4oC for further study.
Antibacterial activity of the three organic extracts obtained from M. koenigii was evaluated by agar well diffusion method on Mueller-Hinton agar (MHA). The bacterial strains were grown on MHA and suspensions were prepared to match 0.5 McFarland standard. 100 μl of the suspension was spread on MHA plates. Wells of 6 mm diameter were punched in the seeded agar using sterile borer. Test well were loaded with 50 μl extracts

BIOSCIENCE BIOTECHNOLOGY RESEARCH COMMUNICATIONS ANTIBACTERIAL AND ANTIOXIDANT ACTIVITY OF LEAF ORGANIC EXTRACTS OF LOCAL CULTIVARS 361
M. Kavitha
(100 mg ml-1) and negative control well loaded with same volume of solvent. Ampicillin and streptomycin were used as a positive control. The plates were incu-bated at 37ºC for 24 h. The diameter of inhibition zones were measured in mm and results were recorded.
Minhibitory concentration (MIC) of the organic extracts was tested by the standard Clinical and labora-tory standards institute (CLSI) methods (Wayne, 2008). MIC was the lowest concentration of the extract which gives no visible bacterial growth. Broth microdilution technique was used to determine the MIC (Elansary et al., 2012). The organic extracts from M. koenigii were serially diluted to obtain the dilutions, 200, 100, 50, 25, 12.5, 6.25 and 3.12 mg ml-1. 100 μl from each dilution was transferred to respective wells followed by 90 μl of double strength Mueller-Hinton broth (MHB). Finally 10 μl respective bacterial suspensions were added to give fi nal dilution of 100, 50, 25, 12.5, 6.25, 3.12 and 1.56 mg ml-1 and the microtiter plate was incubated at 37oC for 24 h. Blank, positive and negative controls were in place. After incubation, the lowest concentrations of the extract, which did not show any visual growth of test organisms, were considered as MICs.
Minimum bactericidal concentration (MBC) of the organic extracts was also determined by the standard CLSI methods (Wayne, 2008). MBC was the lowest con-centration of the extract which kills the initial bacterial inoculum. Broth microdilution technique was performed to determine the MBC. The extracts from M. koenigii were serially diluted to obtain the dilutions, 200, 100, 50, 25, 12.5, 6.25 and 3.12 mg ml-1. 100 μl from each dilu-tion was added to corresponding wells followed by 90 μl of double strength MHB. At last 10 μl respective bacte-rial suspensions were transferred to provide fi nal dilu-tion of 100, 50, 25, 12.5, 6.25, 3.12 and 1.56 mg ml-1 and the plate was incubated at 37oC for 24 h. Blank, positive and negative controls were also included. After incuba-tion, the wells which did not show any visual growth of test organisms were considered. 100 μl of the sam-ple from those wells were transferred aseptically onto MHA, spread uniformly and the plates were incubated at 37oC for 24 h. After incubation, the concentrations at which no visible growth was seen were fi xed as the MBC.
Free radical scavenging activity of the organic extracts from M. koenigii was evaluated by its ability to scavenge DPPH (Elansary et al., 2012). DPPH is a free radical, but stable in nature. The DPPH solution is initially violet in color which fades when antioxidants donate hydrogen. The change in color is monitored using a spectrophotom-eter and thus the DPPH free radical scavenging activity is calculated (Molyneux, 2004). A stock solution of 0.1 mM DPPH in ethanol was prepared. Test concentrations of organic extracts were made in the range of 50-250 μg
ml-1 in ethanol. Gallic acid was used as standard. 1 ml of DPPH stock and 3 ml of test samples were mixed and allowed to react at room temperature for 30 min. The absorbance was measured at 517 nm using an ultravio-let visible spectrophotometer (Shimadzu, Japan). Lower absorbance of the reaction mixture indicated the higher free radical scavenging activity (Saikia and Upadhyaya, 2011). The percentage of free radical scavenging was calculated using the following Eq.
where A0 is the absorbance of the DPPH solution and AT is the absorbance of the test or reference. The percentage of free radical scavenging was then plotted against the concentration and a regression equation was obtained to calculate the IC50 which is defi ned as the total antioxi-dants necessary to decrease the initial DPPH radical by 50% (Koleva et al., 2002).
All the experiments were done in triplicates. The values in the tables represent the arithmetic mean and standard deviation or mean. The standard error was within experimental limits.
RESULTS AND DISCUSSION
The organic extracts obtained from M. koenigii were less viscous in nature and brownish in colour. The yield of the extracts was estimated to be 7, 6.5 and 9.2 % (v/w) for hexane, chloroform and ethanol respectively. The yield in the present study was comparable to the yield reported in other investigations (Ningappa et al., 2008; Brind et al., 2014).
The results of antibacterial activity were presented in Table 1. Based on the diameter of zone of inhibition, the three organic extracts exhibited inhibitory activ-ity against Staphylococcus aureus, Escherichia coli and Pseudomonas aeruginosa (Figure 1). Klebsiella pneumo-niae and Salmonella paratyphi were found to be resist-ant except for chloroform extract which showed a very faint zone of inhibition. The organic extracts presented a good potential of antibacterial activity against Escheri-chia coli and Pseudomonas aeruginosa with the zones of inhibition well above standard antibiotic. Ethyl alcohol extract displayed highest inhibitory activity when com-pared to hexane and chloroform extracts. The results were comparable to that of previous studies in which the researchers reported that the various organic extracts of M. koenigii exhibited signifi cant antimicrobial activity against both Gram positive and Gram negative bacteria (Panghal et al., 2011; Baskaran et al., 2011). This prop-erty is attributed to several carbazole alkaloids present in the organic extracts (Malwal and Sarin, 2011).

362 ANTIBACTERIAL AND ANTIOXIDANT ACTIVITY OF LEAF ORGANIC EXTRACTS OF LOCAL CULTIVARS BIOSCIENCE BIOTECHNOLOGY RESEARCH COMMUNICATIONS
M. Kavitha
FIGURE 1. MHA plates exhibiting zone of inhibition of M. koenigiiorganic extracts against (A) Escherichia coli, (B) Staphylococcus aureus, (C) Pseudomonas aeruginosa and (D) Klebsiella pneumoniae.
Table 1. Antibacterial activity of M. koenigii organic extracts by Agar well diffusion method
Te st organism Zone of Inhibition (in mm)
Hexane Chloroform Ethyl alcohol Standard
Staphylococcus aureus 15.5±0.5 16.23±0.87 16.33±0.57 23.16±0.76
Escherichia coli 11.5±0.86 12.83±0.28 15.83±0.28 11.83±0.76
Klebsiella pneumoniae 0 7.83±0.76 0 11.86±0.8
Salmonella paratyphi 0 7.5±0.5 0 14.83±076
Pseudomonas aeruginosa 13.66±0.76 13.66±0.76 14.83±0.76 12.9±0.85
The results of MIC and MBC of ethyl alcohol extract were summarized in Table 2. Relative to the results of agar diffusion method, the extract displayed lowest MIC and MBC value of 12.5 and 25 mg ml-1 respectively against Staphylococcus aureus. The extract produced same MIC and MBC value of 25 and 50 mg ml-1 against Escherichia coli and Pseudomonas aeruginosa. The results are equi-table to the results presented by Panghal et al. in which the organic extracts prepared from the leaves of M. koenigii manifested slightly better MIC values against the clinical isolates (Panghal et al., 2011). Zinc oxide
Table 2. Minimum Inhibitory Concentration and Minimum Bactericidal Concentration of M. koenigii organic extracts
Test organism MIC (mg ml-1) MBC (mg ml-1)
Test Standard Test Standard
Staphylococcus aureus
12.5 3.12 25 6.25
Escherichia coli 25 25 50 50
Pseudomonas aeruginosa
25 25 50 50

BIOSCIENCE BIOTECHNOLOGY RESEARCH COMMUNICATIONS ANTIBACTERIAL AND ANTIOXIDANT ACTIVITY OF LEAF ORGANIC EXTRACTS OF LOCAL CULTIVARS 363
M. Kavitha
nanoparticles synthesized using the leaf extract of M. koenigii displayed almost similar results to the present study (Elumalai et al., 2015). Antioxidant protein iso-lated from the leaves of M. koenigii also exhibited com-parable results (Ningappa et al., 2010). The variation in the antimicrobial activity of M. koenigii organic extracts specifi ed in various studies may be due to the differences in chemical composition which can result from the cli-matic differences among locations (Paul, 2015). Though several compounds like tocopherol, -carotene, lutein and alkaloids (Khanum et al., 2000) are reported in the leaf organic extracts, carbazole alkaloids are accounted for the antimicrobial activity (Ramsewak et al., 1999).
The results of free radical-scavenging ability of organic extracts of M. koenigii measured by the DPPH assay were given in Table 3. Ethyl alcohol extract dis-played highest radical scavenging activity with the IC50 value of 30 μg ml-1 than the rest two extracts. The radical-scavenging activity of ethyl alcohol extract is very close to that of the standard, gallic acid exhibiting the IC50 value of 35 μg ml-1. This is in agreement with other studies on anti-oxidant activity of leaf extracts of M. koenigii (Rao et al., 2007; Ningappa et al., 2008; Kusuma et al., 2011). The antioxidant activity of organic extracts from M. koenigii is attributed to the presence of polyphenolic compounds and carbazole alkaloids (Rao et al., 2007; Garodia et al., 2007). Ethyl alcohol extract exhibited greater radical-scavenging activity than the other two extracts and this can be inferred as ethanol is effective in extracting polyphenols (Singh et al., 2011).
CONCLUSION
As substantiated in the study, the ethyl alcohol extract from the leaves of M. koenigii, grown locally to ful-fi l culinary needs of Indian cuisine displayed excel-lent antimicrobial activity against both Gram positive and negative bacteria and also exhibited a quality free radical scavenging activity. Climate of the location and
growing season greatly infl uence the chemical compo-sition of M. koenigii and thus have an impact on the biological activities. The above study confi rmed that the local cultivars of M. koenigii possess benefi cial health effects in terms of antimicrobial and anti-oxidant activi-ties. Consequently, local cultivars of M. koenigii could be effectively used as spice and dietary supplement, however further study on molecular mechanism behind the role of various constituents on radical scavenging and antimicrobial inhibition needs to be done.
REFERENCES
Baskaran, C., Rathabai, V. and Kanimozhi, D. (2011) Screening for antimicrobial activity and phytochemical analysis of vari-ous leaf extract of Murraya koenigii. International Journal of Research in Ayurveda and Pharmacy, 2, 1807–1810.
Biswas, A.K., Chatli, M.K. and Sahoo, J. (2012) Antioxidant potential of curry (Murraya koenigii L.) and mint (Mentha spicata) leaf extracts and their effect on colour and oxidative stability of raw ground pork meat during refrigeration storage. Food Chemistry, 133, 467–472.
Brind, L., Misra, A. and Srivastava, S. (2014) Evaluation of central nervous system stimulating and analgesic activities of Murraya koenigii leaves. Journal of Acute Medicine, 4, 81–85.
Brower, V. (1998) Nutraceuticals: Poised for a healthy slice of the healthcare market? Nature Biotechnology, 16, 728–731.
De Smet, P.A. (1997) The role of plant derived drugs and herbal medicines in healthcare drugs. Drugs, 54, 801–840.
Elansary, H.O., Salem, M.Z.M., Ashmawy, N.A. and Yacout, M.M. (2012) Chemical composition, antibacterial and antioxi-dant activities of leaves essential oils from Syzygium cumini L., Cupressus sempervirens L. and Lantana camara L. Egyptian Journal of Agricultural sciences, 4, 144–152.
Elumalai, K., Velmurugan, S., Ravi, S., Kathiravan, V. and Ashokkumar, S. (2015) Bio-fabrication of zinc oxide nanopar-ticles using leaf extract of curry leaf (Murraya koenigii) and its antimicrobial activities. Materials Science in Semiconductor Processing, 34, 365–372.
Gahlawat, D.K., Jakhar, S. and Dahiya, P. (2014) Murraya koenigii (L.) Spreng: an ethnobotanical, phytochemical and
Table 3. Antioxidant activity of M. koenigii organic extracts measured in term of DPPH radical scavenging ability
Concentration (μg ml-1) DPPH scavenging activity (%) IC50 value (μg ml-1)
Ethyl alcohol Hexane Chloroform Gallic acid Gallic acid = 35Ethyl alcohol = 30Hexane = 22Chloroform = 27
20 12 9 9 13
40 23 16 21 28
60 35 25 33 42
80 48 34 42 55
100 62 45 54 68

M. Kavitha
364 ANTIBACTERIAL AND ANTIOXIDANT ACTIVITY OF LEAF ORGANIC EXTRACTS OF LOCAL CULTIVARS BIOSCIENCE BIOTECHNOLOGY RESEARCH COMMUNICATIONS
pharmacological review. Journal of Pharmacognosy and Phy-tochemistry, 3, 109–119.
Garodia, P., Ichikawa, H., Malani, N., Sethi, G. and Aggar-wal, B.B. (2007) From ancient medicine to modern medicine: ayurvedic concepts of health and their role in infl ammation and cancer. Journal of the Society for Integrative Oncology, 5, 25–37.
Harish, P. (2001) Herbal drugs. Current Science India, 81, 15.
Kamboj, V.P. (2000) Herbal medicine. Current Science India, 78, 35–39.
Khanum, F., Anilakumar, K.R., Sudarshan Krishna, K.R., Viswanathan, K.R. and Santhanam, K. (2000). Anticarcino-genic effects of curry leaves in dimethylhydrazine-treated rats. Plant Foods for Human Nutrition, 55, 347–355.
Koleva, I.I., van Beek, T.A., Linssen, J.P., de Groot, A. and Evs-tatieva, L.N. (2002) Screening of plant extracts for antioxidant activity: a comparative study on three testing methods. Phyto-chemical Analysis, 13, 8–17.
Kusuma, I.W., Kuspradini, H., Arung, E.T., Aryani, F., Min, Y.H., Kim, J.S., Kim, Y.U. (2011). Biological activity and phytochem-ical analysis of three Indonesian medicinal plants, Murraya koenigii, Syzygium polyanthum and Zingiber purpurea. Jour-nal of Acupuncture and Meridian studies, 4, 75–79.
Maa, Q.G., Xu, K., Sang, Z.P., Wei, R.R., Liu, W.M., Su, Y.L., Yang, J.B., Wang, A.G., Ji, T.F. and Li, L.J. (2016) Alkenes with anti-oxidative activities from Murraya koenigii (L.) Spreng. Bioorganic and Medicinal Chemistry Letters, 26, 799–803.
Makri, O. and Kintzios, S. (2007) Ocimum sp. (basil): Botany, cultivation, pharmaceutical properties, and biotechnology. Journal of Herbs Spices and Medicinal Plants, 13, 123–150.
Malwal, M. and Sarin, R. (2011) Antimicrobial effi cacy of Mur-raya koenigii (Linn.) Spreng. root extracts. Indian Journal of Natural Products and Resources, 2, 48–51.
Molyneux, P. (2004) The use of stable free radical diphenylpic-ryl-hydrazyl (DPPH) for estimating antioxidant activity. Song-klanarin Journal of Science and technology, 26, 211–219.
Negi, J.S., Singh, P. and Rawat, B. (2011) Chemical constitu-ents and biological importance of swertia: a review. Current Research in Chemistry, 3, 1–15.
Newman, D.J. and Crag, G.M. (2007) Natural products as sources of new drugs over the last 25 years. Journal of Natural Products, 70, 461–477.
Ningappa, M.B., Dhananjaya, B.L., Dinesha, R., Harsha, R. and Srinivas, L. (2010) Potent antibacterial property of APC protein from curry leaves (Murraya koenigii L.). Food Chemistry, 118, 747–750.
Ningappa, M.B., Dinesha, R. and Srinivas, L. (2008) Antioxi-dant and free radical scavenging activities of polyphenol-enriched curry leaf (Murraya koenigii L.) extracts. Food Chem-istry, 106, 720–728.
Onayade, O.A. and Adebajo, A.C. (2000) Composition of the oil of Murraya koenigii growing in Nigeria. Journal of Herbs Spices and Medicinal Plants, 7, 59–66.
Panghal, M., Kaushal, V. and Yadav, J.P. (2011) In vitro antimi-crobial activity of ten medicinal plants against clinical isolates of oral cancer cases. Annals of Clinical Microbiology and Anti-microbials, 10, 21.
Paul, C.C., Chiedozie, O.I. and Ferdinand, N.M. (2015) Bioactive principles from medicinal plants. Research Journal of Phyto-chemistry, 9, 88–115.
Ramsewak, R.S., Nair, M.G., Strasburg, G.M., De Witt, D.L. and Nitiss, J.L. (1999). Biologically active carbazole alkaloids from Murraya koenigii. Journal of Agricultural and Food Chemistry, 47, 444–447.
Rao, L.J.M., Ramalakshmi, K., Borse, B.B. and Raghavan, B. (2007). Antioxidant and radical-scavenging carbazole alka-loids from the oleoresin of curry leaf (Murraya koenigii Spreng). Food Chemistry, 100, 742–747.
Saikia, L.R. and Upadhyaya, S. (2011) Antioxidant activity, phenol and fl avonoid content of some less known medicinal plants of Assam. International Journal of Pharma and Bio-sciences, 2, 383–388.
Singh, A.P., Wilson, T., Luthria, D., Freeman, M.R., Scott, R.M., Bilenker, D., Shah, S., Somasundaram, S. and Vorsa, N. (2011). LC-MS-MS characterization of curry leaf fl avonols and anti-oxidant activity. Food Chemistry, 127, 80–85.
Wayne, P.A. (2008) Performance standards for antimicrobial sus-ceptibility testing; eighteenth informational supplement, CLSI document M100-18, Clinical and Laboratory Standards Institute.

Medical CommunicationBiosci. Biotech. Res. Comm. 10(3): 365-371 (2017)
Effect of premarital counseling on shyness and
expectations from marriage among medical
science students
Iman Seyyed Moharrami1, Malihe Pashib2*, Anahita Zandi3, Seddigheh Abbaspour4 and Abbas Ghodrati Torbati5
1MSc Consultant, Torbat Heydariyeh University of Medical Sciences, Torbat Heydariyeh, Iran 2MSc Clinical Psychology, Torbat Heydariyeh University of Medical Sciences, Torbat Heydariyeh, Iran3MSc Nursing Faculty Member Torbat Heydariyeh University of Medical Sciences, Torbat Heydariyeh, Iran 4MSc Faculty Member, Torbat Heydariyeh University of Medical Sciences, Torbat Heydariyeh, Iran 5Faculty Member Medical University of Torbate Heydariyeh, Torbate Heydariye, Iran
ABSTRACT
The period before from marriage is the one of the sensitive and critical periods in life and also is very infl uential period in preventing marital problems after marriage. The aim of this study is to investigate the effect of premarital Counseling on shyness and expect from marriage among students of Medical Sciences, Torbat Heydariyeh, Iran. This quasi-experimental study was conducted on 30 single students of Medical Sciences in Torbat Heydariyeh Iran. The assessment tools was shyness and expect from marriage scales that were complete d in the pre-test and post-test by participants. The intervention group participated in 8 sessions of premarital Counseling and the control group received no intervention. Data were analyzed using descriptive and Analytic statistics. The mean age of participants in control and intervention groups was 19.33±0.61 and 19.92±1.07 years, respectively. There was no signifi cantly different between background variables of two groups (p>0.05). In the control group there was no signifi cant differ-ence in shyness and expect from marriage, before and after the study, but there was a signifi cant difference between two mentioned variables in the intervention group (p<0.05). According to the results, it is suggested that premarital Counseling used for students before Choice of spouse until to reduce the disturbing factors in spouse selection pro-cess. Premarital Counseling improves shyness, cynical and idealistic expectations from marriage.
KEY WORDS: PREMARITAL COUNSELING, SHYNESS, MARRIAGE, EXPECT FROM MARRIAGE
365
ARTICLE INFORMATION:
*Corresponding Author: Received 27th June, 2017Accepted after revision 27th Sep, 2017 BBRC Print ISSN: 0974-6455Online ISSN: 2321-4007 CODEN: USA BBRCBA
Thomson Reuters ISI ESC and Crossref Indexed Journal NAAS Journal Score 2017: 4.31 Cosmos IF: 4.006
© A Society of Science and Nature Publication, 2017. All rights reserved.Online Contents Available at: http//www.bbrc.in/DOI: 10.21786/bbrc/10.3/5

366 EFFECT OF PREMARITAL COUNSELING ON SHYNESS AND EXPECTATIONS BIOSCIENCE BIOTECHNOLOGY RESEARCH COMMUNICATIONS
Iman Seyyed Moharrami et al.
INTRODUCTION
Formal legal marriage is a contract that is closed between men and women and Considers for each person special place and role (Houlgate, 2017). In recent years the use of pre-marital counseling program to strengthen marriage is common. Premarital counseling for couples preparation and prevent dissatisfaction and failure in marriage has a signifi cant impact and people learn how to be a successful and stable marriage, so premarital counseling have aspects of preventive, educational and therapeutic (Parhizgar et al., 2017). The research shows that traditional counseling before marriage is not ben-efi ting for married life and had not a positive impact on the stability of marriage (Moeti et al., 2017).
Premarital period is one of the sensitive and criti-cal points in life and is a very effective period in the continuity of life and prevention of marital problems after marriage (Vural & Temel, 2009). In post marital period, one of the factors that cause a basic change in the process of marriage and its path is expect of peo-ple from marriage, roles and marital needs (Bagarozzi, 2014). According to the fi ndings of researchers, having optimum belief, attitude and expect from marriage is the best and most important capital in marriage and guar-antees more happiness of people in the common marital path. Expects and beliefs of people from marriage affect the perception of people from each other and probability of marriage or non-marriage and determination of mar-riage time (Parrott & Parrott, 2005).
Expectations from marriage is a set of realistic, ideal-istic and cynical expects that shows the beliefs of people to triple fi elds of marriage namely intimacy, agreement and equality. expect from marriage shows the expects of people from the level of intimacy and closeness to the spouse, type of personality and attractiveness of future spouse, type of activities inside and outside of family, and the rate of responsibility and equality of couples in the affairs related to home and children (Nilforooshan, Abedi, Ahmadi, & Navidian, 2011). Expectations from marriage in people in premarital period has a signifi cant relationship with married life and life satisfaction like the level of intimacy, distance, division of labor, and the nature of the relationship between husband and wife with the main family (Holman, 2006). Theoretically, the primary experiences of the persona and relationships, whether as the observer of a relationship or participant in it, has a main role in the formation of expect from marriage. According to the Bowlby’s attachment theory, the primary experiences of person in relationship with the beliefs and expects of people from the next relation-ships (Mikulincer & Shaver, 2007).
The study of expectations from marriage in premari-tal period is very important so that the researchers in a
study examined and graded the areas of couples prob-lems and mentioned the unrealistic problems and expect from marriage and lack of intimacy and interest as the most important marital problem (Mazlomi, Dolatshahi, & Nazari, 2010). One of the other important issues that can affect the decisions of people in marriage is shyness. Shyness is associated with several distinct behavioral antecedents and biological correlates across develop-ment, including early behavioral inhibition and neu-roendocrine dysregulation, (Poole et al., 2017).
Shyness has become the main concern of different societies during the recent years and has become an important issue, so that it has led the researchers toward understanding this problem (Koydemir & Demir, 2008). Shyness is considered as a kind of social anxiety that is defi ned with the features like anxiety in front of an audience, distress and worry and shyness from being seen by others (Botvin & Kantor, 2000). Paying too much attention to the words and behaviors of oneself and fear of interaction with others, fear of not being confi rmed by others and worry of being judged is the main features of shy people. These people make conditions stressful and while being exposed to new situations or new peo-ple with illogical and automatic thoughts and usually avoid asking questions or even answering the questions of others (Shahri et al., 2014).
The study results of Afrooz show that the increase of the people who have problem in relationships with others, those who have fear of social contacts and are shy, the young people who do not know what to say and how behave when they enter a group, sense of inabil-ity to talk to people and lack of cooperation with them, depression and social isolation and fi nally rejection by society (Afroz, 2002). Studies show personality and therefore also shyness is infl uenced by various sociode-mographic variables, social roles and important events, which affect stability and lead to changes in personality (Van Zalk, Lamb, & Jason Rentfrow, 2017). Also Poole, Van Lieshout & Schmidt believe emerging evidence sug-gests that confl icted shyness (combination of shyness and sociability) places individuals at risk for maladjust-ment in childhood, adolescence, and emerging adult-hood (Poole, Van Lieshout, & Schmidt, 2017).
Since expectations from marriage is one of the most important factors to guarantee post marital satisfac-tions and on the other hand shy people are susceptible to make wrong decisions for marriage, without a doubt these two areas of evaluation have an important role in the guarantee of right decisions for marriage. For this purpose, today it is attempted to use the premarital pro-grams for single people. Premarital counseling is a new approach that presents some education in order to pre-vent the post marital dissatisfaction (Salarvand, Bahri, Heidary, & Khadive, 2011).

BIOSCIENCE BIOTECHNOLOGY RESEARCH COMMUNICATIONS EFFECT OF PREMARITAL COUNSELING ON SHYNESS AND EXPECTATIONS 367
Iman Seyyed Moharrami et al.
The experts of family area are suing about the effi -ciency of premarital counseling and teach people how to have a successful and durable married life (Fathzadeh et al., 2008). To fi nal purpose of premarital counseling is to help the strength and stability of marriage, the reduc-tion of divorce rate and promotion of marriage quality. Premarital counseling program with the study of effec-tive factors in successful marriage and the role of these factors in the supply of adjustment and marital life sat-isfaction deal with some approaches to select the appro-priate spouse and successful marriage and also prevent frustration in married life and study of its dimensions and factors through the mutual understanding of spouses, understanding the needs of both sides, mutual understanding, love, kindness and mutual commitment (MirMohammad Sadeghi, 2010). Although the effective-ness of premarital counseling to promote the level of life has been examined but its effect on expect from marriage and shyness of single students has been les studied. Thus, the present study aims to investigate the effect of premarital counseling on shyness and expect from marriage among students of Medical Sciences, Tor-bat Heydariyeh, Iran.
MATERIAL AND METHODS
The present study was a quasi-experimental interven-tion with pre-test, post-test and control group. The sta-tistical population includes all single and new arrival students of Torbat Heydarieh university of medical sci-ences in 1394 (n=110). After taking the licenses from Torbat Heydarieh university of medical sciences and taking conscious consent of the participants, 30 single students were selected by random-stratifi ed method and were placed in the intervention group and control group (groups of 15) by random allocation method. The inclu-sion criteria of participants to the study were gaining high score and very low score in the scale of expect from marriage and gaining a score more than 67 in shyness test. At the beginning of the study, the scale of expect from marriage and shyness scale was completed by the participants of intervention group and control group. Premarital counseling was performed in 8 sessions of 2 hour for the intervention group. During this time, the control group did not receive any education. The sum-mary of activities in intervention sessions are as follows:
The fi rst session; teaching concepts familiar, attrac-tive, familiar theories, advantages and limitations of familiarity, ten mistakes in the process of dating and matchmaking.
Second session; Training love triangle theory, the ele-ments of love, the effect of the issue on love, choose love and complete unfi nished love children and facilitate
donors.Third session; Life skills training including asser-tiveness skills, effective communication skills, asser-tiveness, stress management, anger management, etc. Fourth Session; Training process of mate selection, right and wrong reasons to marry, false expectations of mar-riage, people who are not suitable for marriage, person-ality disorder and inappropriate for marriage, good rela-tionships that are not marriage, married warning signs, criteria of successful marriage. Fifth Session; Defi ning engagement, the marriage, the difference candidate with familiarity, forced marriage, commitment concepts, bor-ders and boundaries, and the time of engagement. Sixth Session; the Marriage period, defi nition of marriage period, difference between marriage and engagement, requirements and functions of marriage period. Seventh session; Issues related to family, wife, threads between family, family issues related to the main economic issue, dowry, dowry, etc., division of labor in the process of marriage and expectations associated with these con-ditions and preparing participants for sessions. Eighth Session; Informing students about early marriage and its challenges, build confi dence, balance between the need for affi liation and need for independence, competitors, marriage, having children and sessions. After the end of training secessions, the participants of intervention and control groups completed the questionnaires again. The measurement tool was the standard questionnaire of Jones and Nelson expect from marriage and Stanford shyness.
Marriage expectation scale (MES) includes 40 items and 3 sub scales of cynical expect, realistic expects and idealistic expects. Its scoring range was graded accord-ing to Likert 5-point scale as totally disagree with 1 to totally agree with 5. The minimum score in this scale is 40 and maximum score is 200. Lower scores show cynical expect from marriage and higher scores show idealistic expect from marriage. Average scores show realistic expects (Nilforooshan et al., 2011). Jones and Nelson reported the reliability of questionnaire for the total scale by Cronbach’s Alpha as 0.79 to 0.80 and Dilon as 0.80 (Dillon, 2005; Jones & Nelson, 1997). The reliability of this questionnaire in the present study was obtained as 0.74.
Stanford shyness scale includes 40 items that was made in Stanford University and measures the shyness of people. Stanford shyness scale is in all questions with Likert 4-point scale including never (code 1), sometimes (code 2), often (code 3), and always (code 4). The mini-mum score is 40 and maximum score is 160. The score from 40 to 60 shows low shyness. 67 to 100 average shyness and more than 100 shows high shyness. In the study of Najaf Abadi et al., the validity of shyness was 0.74 and its reliability was obtained as 0.87 by Cron-bach’s Alpha method ( Najaf Abadi et al., 2013). In the

368 EFFECT OF PREMARITAL COUNSELING ON SHYNESS AND EXPECTATIONS BIOSCIENCE BIOTECHNOLOGY RESEARCH COMMUNICATIONS
Iman Seyyed Moharrami et al.
present study, the reliability of the tool was confi rmed as 0.77 for Cronbach’s Alpha. The statistical data of the study were analyzed by using SPSS statistical software version 21.
RESULTS AND DISCUSSION
The man age of participants in the control group was 19.33±0.61 and in intervention group was 19.92±1.07. In the control group 7 subjects (47.7%) and in intervention group 6 subjects (40%) were women. The frequency of medical emergencies was 5 subjects (33.3%), midwifery 7 subjects (46.7%) and anesthesiology was 3 subjects (6.7%) that this number is equal in both groups of con-trol and experimental. In terms of economic status, the maximum frequency was related to average economic status with 10 subjects (66.7%) in control group and 8 subjects (53.3%) in the experimental group. The use of Chi-2 statistical tests for the variables of gender, eco-nomic status, education and independent T-test for age showed that there is not a signifi cant difference between the mentioned variables in the two groups of control and experimental (p>0.05). It means that the two groups were homogenous in terms of the mentioned variables.
To compare the amount of shyness between the two groups of control and intervention before and after intervention, the Mann–Whitney test was used. This test did not show any signifi cant difference between the two groups before intervention in terms of shyness in stu-dents. (p=0.96) But after the intervention, there was a signifi cant difference between the two studied groups in terms of shyness (p=0.01). To study the two groups before and after the intervention of the Wilcoxon test was used. The results show that in the control group after the intervention, there was no statistically signifi -cant difference in the degree of shyness (p=0.31). But there was a statistically signifi cant difference in inter-vention group (p=0.01). So that at the beginning of
the study, 4 subjects had severe shyness (26.7%) and 9 subjects had average shyness (60%) in the experimental group but after the intervention, the number of shyness reduced to 0 subjects (0%) and average shyness reduced to 6 subjects (40%) (Table 1).
The second hypothesis of the present study claimed the signifi cant difference between the intervention group and control group in terms of expect from marriage. The obtained score of any sub scale, the relevant questions were added together and since the score range for each sub scale is different, each range was considered as 0 to 100 for the better understanding of scores range. The results of kolmogrov-smirnov showed that expect from marriage and its sub scales (realistic expects, cynical expects, idealistic expects) are normal in the control and experimental group before and after the intervention (p>0.05). Accordingly, the parametric tests were used for analysis.
The results of independent t-test showed that the intervention and control group had no signifi cant dif-ference at the beginning of the study in terms of the score of expect from marriage (p>0.05). It shows the assimilation of sample in the two groups according to the intended variables, but these were a signifi cant dif-ference after the performance of premarital counseling for intervention group (p<0.05) (Table 2).
To study the two groups before and after the inter-vention, the Paired t-test was used. The results of paired T-test showed that the mean score of expect from mar-riage in students after holding premarital sessions in intervention group (p<0.05). This difference was not seen in the control group. (p>0.05) (Tables 3, 4 and 5).
According to the obtained results, premarital coun-seling has a signifi cant effect on the shyness of students. Bashirpoor et al in a study compared the effect of group counseling with cognitive – behavioral approach and existential approach on the decrease of shyness in stu-dents. Both approaches had a signifi cant effect on the shyness of male students but in their study, the interven-
Table 1. The comparison of shyness between the participants before and after the intervention in the two groups of control and experimentala
Variable time Variable classes Control Experimental Pb
shyness
Before intervention
Weak 1(6.7) 2 (13.3)
0.96, z=-0.05Average 11 (73.3) 9 (60)
Severe 3 (20) 4 (26.7)
After intervention
Weak 2 (13.3) 9 (60)
0.01, z=-2.7Average 11 (73.3) 6 (40)
Severe 2 (13.3) 0 (0)
P-valuec 0.31, z=-1 0.01, z=2.49aValues are expressed as N (%).bMann-Whitney test resultscWilcoxon test results

BIOSCIENCE BIOTECHNOLOGY RESEARCH COMMUNICATIONS EFFECT OF PREMARITAL COUNSELING ON SHYNESS AND EXPECTATIONS 369
Iman Seyyed Moharrami et al.
Table 2. The comparison of the mean score of realistic expect from marriage in participants before and after intervention in the two groupsa
variable time Control experimental Pb
Realistic expectsBefore intervention 51.17±7.46 49.31±6.21 0.46, t=-1.67
after intervention 49.31±7.39 68.23±14.10 <0.001, t=-2.72
P-valuec 0.08, t=1.47 <0.001, t=4.56aValues are expressed as mean (SD).bIndependent t-test resultscPaired t-test
Table 3. The comparison of the mean score of idealistic expect from marriage in participants before and after intervention in the two groupsa
variable time Control experimental Pb
Idealistic expectsBefore intervention 70.95±15.06 75.83±14.33 0.46, t=-0.9
after intervention 73.45±12.51 59.16±18.38 0.02, t=-2.40
P-valuec 0.09, t=-1.78 0.006, t=3.25aValues are expressed as mean (SD).bIndependent t-test resultscPaired t-test
Table 4. The comparison of the mean score of cynical expect from marriage in participants before and after intervention in the two groupsa
variable time Control experimental Pb
Cynical expectsBefore intervention 65±13.65 73.6±9.02 0.06, t=3.25
after intervention 57.73±8.86 45±8.01 <0.001, t=-6.21
P-valuec =0.09, t=-1.76 <0.001, t=4.29aValues are expressed as mean (SD).bIndependent t-test resultscPaired t-test
Table 5. The comparison of the mean score of general expect from marriage in participants before and after intervention in the two groupsa
variable time Control experimental Pb
Expects from marriageBefore intervention 54.41±24.11 65.91±11.22 0.13, t=-1.56
after intervention 61.41±11.54 54.29±4.81 p<0.001, t=-4.22
P-valuec 0.1, t=1.64 0.03, t=2.2aValues are expressed as mean (SD).bIndependent t-test resultscPaired t-test
tion method of group counseling was cognitive-behav-ioral and existential while in the present study the inter-vention method was premarital counseling (Bshirpoor, Salimibejestani, & Farahbakhsh, 2013). Also, Rahmani and BaniAsadi in a study examined the effectiveness of teaching non-verbal relationship on the shyness of students and the obtained results showed that these educations have decreased the shyness of students in physiological and behavioral dimensions. However, the intervention method in the study of Rahmani et al. was different from the present study (Rahmani & BaniAsadi, 2013).
To explain the obtained results, the attitude of Gudarzi et al can be mentioned. They believe that the science of life skills education as a preventive method can have positive and useful effects on the increase of emotion control, coping with stress, high self-confi dence, and increase of self-concept, increases of self-esteem, better problem solving and interpersonal confl icts that lead to the reduction of shyness (Goudarzi, MakvandHosseini, Rezai, & Blotbngan, 2013).
In the present study, one of the discussions that were taught in sessions with students was teaching life skills such as establishing effective relationships,

Iman Seyyed Moharrami et al.
370 EFFECT OF PREMARITAL COUNSELING ON SHYNESS AND EXPECTATIONS BIOSCIENCE BIOTECHNOLOGY RESEARCH COMMUNICATIONS
self-assertion, stress management and assertiveness and this education can be effective in the reduction of shy-ness in students. People attend the society with more self-confi dence when they are equipped with social skills, so they create successful relationships and this success increases their self-confi dence and anxiety to attend in front of an audience (Dokanei Fard, 2007). Mahruz Yadak and Hatami also confi rmed the effect of teaching life skills on shyness and believe that people can make better decisions and cope with emotions like fear, anger, shyness or sadness in an appropriate way when they are equipped with these teachings (Mehroz Yadak & Hatami, 2010). Also, premarital counseling improved the cynical and idealistic expects in most students. According to the results of the present study, premarital counseling could reduce cynical and idealistic expects and increase realis-tic expects. Before the intervention, the average realistic expects of students was low but after premarital coun-seling, the average realistic expects increased and this result was useful. The average cynical expects of stu-dents was high before the intervention and signifi cantly decreased after the intervention. Also, the average ideal-istic expects of the intervention group had a signifi cant difference before and after the intervention and this dif-ference was not observed in the control group that did that did not receive any intervention.
The results of this study are in line with the study of Omidvar et al. they examined the effect of premarital Counseling on expects from marriage of students and the results showed that the counseling have a signifi -cant effect on expects from marriage (Omidvar, Fate-hiZadeh, & Ahmadi, 2009). Also, Sharp and Ganeng in their study proved the effect of systematic education on unrealistic and romantic expects of university students and showed that the students signifi cantly adjusted their unrealistic and romantic expects due to education (Sharp & Ganong, 2000). To explain the obtained result, the content of the sessions of the present study can be mentioned. In the present study, one of the issues that were studied in group sessions was the issues that were studied in group sessions was the study of the role of wife and husband, expect of participants in the study from their future spouse, expects and objectives of par-ticipants from marriage and creating family. Negative reasons for marriage including space away from inap-propriate family environment, economic problems and positive reasons for marriage like the need to love and intimacy, being parent and the need to accompany were clarifi ed. The subjects were explained that cynical or unrealistic expects lead to frustration and the frustra-tion due to the non-satisfi ed expects causes anger, and dissatisfaction from marital life (Ghahari, 2012).
Counseling can be a reason for the changes of ide-alistic and cynical expects from marriage. Also, in ses-
sions, the technique of exploration was used to clarify the meaning of expect from marriage in people and their beliefs. The double standard technique was used to change the wrong expects. So that, the participants were asked: what will you say if your close friend has a similar selection like you and rely on his/her spouse to meet all his/her expects?
Double standard technique makes people look at their problem in such a way as if it is the problem of someone else. Though this method, the participants found that expects from marriage is unrealistic. In general, premar-ital counseling led to the improvement of shyness and expect from marriage.
CONCLUSION
According to the study results, it is suggested that pre-marital counseling is used before the selection of spouse in order to reduce nuisance factors in the process of choosing spouse. Premarital counseling could reduce shyness, idealistic and cynical expects from marriage by providing information on the fi eld of risky marriages, relationships before marriage, barriers of appropriate process of information, teaching how to identify cog-nitive distortions and methods of challenging the false beliefs and effective relationships.
ACKNOWLEDGEMENTS
The authors sincerely appreciate all those involved in this research, especially Deputy of Education and Research of Torbat Heydarieh University of Medical Sci-ences who helped us with fi nancial support (Research Project Code 34.2).
CONFLICTS OF INTEREST
The authors declare that there are no confl icts of inter-ests regarding the publication of this article.
REFERENCES
Afroz, G. A. (2002). Psychology of Shyness and its Treatment (Vol. Sixth Edition). Tehran: Islamic culture.
Bagarozzi, D. A. (2014). Enhancing intimacy in marriage: a clinician’s guide: Routledge.
Botvin, G. J., & Kantor, L. W. (2000). Preventing alcohol and tobacco use through life skills training. Alcohol research and health, 24(4), 250-257.
Bshirpoor, M., Salimibejestani, H., & Farahbakhsh, K. (2013). To compare the effectiveness of group-based approach to exis-tential and cognitive-behavioral consultant on the degree of shyness male high school students. Journal of Applied Psy-chology and research, 14(2), 51-60.
Iman Seyyed Moharrami et al.
BIOSCIENCE BIOTECHNOLOGY RESEARCH COMMUNICATIONS EFFECT OF PREMARITAL COUNSELING ON SHYNESS AND EXPECTATIONS 371
Dillon, H. N. (2005). Family Violence and Divorce: Effects on Marriage Expectations. (Master of Arts in Clinical Psychology), East Tennessee State University.
Dokanei Fard, F. (2007). Life skills education impact on increas-ing students’ self-esteem and reduce shyness. Journal of new ideas in education, 2(3), 43-56.
Fathzadeh, M., Bigi, M. A., Bazrgar, M., Yavarian, M., Taba-tabaee, H. R., & Akrami, S. M. (2008). Genetic counseling in southern Iran: consanguinity and reason for referral. Journal of genetic counseling, 17(5), 472.
Ghahari, S. H. (2012). Premarital counseling. Guide psycholo-gists, counselors and psychiatrists (Vol. Third edition). Tehran: QatrehPublishers.
Goudarzi, N., MakvandHosseini, S. H., Rezai, A. M., & Blotbn-gan, A. A. (2013). Effective of teaching life skills to method of storytelling on the degree of shyness in students. Journal of Clinical Psychology Studies, 5(7), 121-136.
Holman, T. B. (2006). Premarital prediction of marital quality or breakup: Research, theory, and practice: Springer Science & Business Media.
Houlgate, L. D. (2017). Family Contracts: Marriage and Divorce Philosophy, Law and the Family (pp. 171-201): Springer.
Jones, G. D., & Nelson, E. S. (1997). Expectations of marriage among college students from intact and non-intact homes. Journal of Divorce & Remarriage, 26(1-2), 171-189.
Koydemir, S., & Demir, A. (2008). Shyness and cognitions: An examination of Turkish university students. The Journal of psychology, 142(6), 633-644.
Mazlomi, S., Dolatshahi, B., & Nazari, A. M. (2010). The effects of marriage enrichment program on increasing intimacy in couples without problem. Dena Journal, 5(3,4).
Mehroz Yadak, T., & Hatami, H. (2010). The effect of training life skills on reducing shyness and anger management in stu-dents.Proceedings of the Third Congress of Psychology.2010; 744-746. Paper presented at the Proceedings of the Third Con-gress of Psychology.
Mikulincer, M., & Shaver, P. R. (2007). Attachment in adult-hood: Structure, dynamics, and change: Guilford Press.
MirMohammad Sadeghi, H. (2010). Premarital education Isfa-han: Behzisti, Department of Cultural Affairs and prevention.
Moeti, B., Koloi-Keaikitse, S., & Mokgolodi, H. L. (2017). Mar-ried Women’s Lived Experiences on the Value of Traditional Premarital Counseling “Go Laya” on Marital Stability in Bot-swana. The Family Journal, 1066480717710951.
Nadi Najafabadi, F., Nazarichegeni, A., & Mehrabizadeh, M. (2013). The causal relationship between shyness and loneli-
ness with humor and self-esteem in girls mediation styles city of Najafabad. New Thoughts on Education, 9(2), 131-150.
Nilforooshan, P., Abedi, A., Ahmadi, A., & Navidian, A. (2011). Studying the factor structure, reliability, and validity of the Marriage Expectation Scale (MES). International Journal of Behavioral Sciences, 5(1), 11-19.
Omidvar, B., FatehiZadeh, M., & Ahmadi, S. (2009). The effect of premarital on marital expectations of students in Shiraz. Journal of family research, 5(18), 231-246.
Parhizgar, O., Esmaelzadeh-Saeieh, S., Kamrani, M. A., Rahimzadeh, M., & Tehranizadeh, M. (2017). Effect of Premari-tal Counseling on Marital Satisfaction. Shiraz E-Medical Jour-nal, 18(5).
Parrott, L., & Parrott, L. L. (2005). I Love You More: How Every-day Problems Can Strenghten Your Marriage: Zondervan.
Poole, K. L., Jetha, M. K., & Schmidt, L. A. (2017). Linking child temperament, physiology, and adult personality: Rela-tions among retrospective behavioral inhibition, salivary cor-tisol, and shyness. Personality and Individual Differences, 113, 68-73.
Poole, K. L., Van Lieshout, R. J., & Schmidt, L. A. (2017). Shy-ness and Sociability Beyond Emerging Adulthood: Implica-tions for Understanding the Developmental Sequelae of Shy-ness Subtypes. Journal of Social and Clinical Psychology, 36(4), 316-334.
Rahmani, R., & BaniAsadi, H. (2013). Effectiveness of Non-verbal Interaction Skills Training in the Decrease of Shyness. .Journal of Thought and Behavior, 7(26), 47-56.
Salarvand, S., Bahri, N., Heidary, S., & Khadive, M. (2011). Assessing Quality of the Pre-marriage Family Planning Con-sulting Classes: Viewpoints of Participant Couples. Journal of Isfahan Medical School, 29(128).
Shahri, M., Moeinikia, M., Zahed, A., & Narimani, M. (2014). Investigation the Impact of Paint Therapy on Communication Skills of Shyness Girl Students. Procedia-Social and Behavio-ral Sciences, 128, 327-331.
Sharp, E. A., & Ganong, L. H. (2000). Raising awareness about marital expectations: Are unrealistic beliefs changed by inte-grative teaching? Family Relations, 49(1), 71-76.
Van Zalk, N., Lamb, M. E., & Jason Rentfrow, P. (2017). Does Shyness Vary According to Attained Social Roles? Trends Across Age Groups in a Large British Sample. Journal of Per-sonality.
Vural, B. K., & Temel, A. B. (2009). Effectiveness of premarital sexual counselling program on sexual satisfaction of recently married couples. Sexual health, 6(3), 222-232.

Environmental CommunicationBiosci. Biotech. Res. Comm. 10(3): 372-379 (2017)
Exploring climate change over Khazar Basin based on
LARSE-WG weather generator
Amir Hossein Halabian1 and M.S. Keikhosravi2
1Associate Professor, Department of Geography, Payam-e Noor University, Tehran, Iran2Invited Teacher, Payam-e Noor University, Tehran Iran
ABSTRACT
The aim of this paper is to analyze climate change over Khazar Basin for the next decades. Khazar Basin is considered as one the most important one in Iran due to its specifi c climatic conditions. The experiment of climate change across the basin was conducted using 21 synoptic stations by the application of LARS-WG weather generator, the years from 1992 to 2015 were selected as the base period and the analyses were carried out to estimate climate change over the 2046-2065. The analyses for future climate change then were compared to the base period. The results revealed that in the future period, on average precipitation will decrease -37.1 mm and min and max temperature will increase 3.8 and 3.2 ºC respectively compared to the base period. Therefore it could be deduced that climate change can have adverse effects on the Basin and some adaptive steps must be taken to reduce the bad effects accordingly.
KEY WORDS: CLIMATE CHANGE, LARSE-WG, KHAZAR BASIN, PRECIPITATION, TEMPERATURE
372
ARTICLE INFORMATION:
*Corresponding Author: [email protected] 27th Nov, 2017Accepted after revision 26th Sep, 2017 BBRC Print ISSN: 0974-6455Online ISSN: 2321-4007 CODEN: USA BBRCBA
Thomson Reuters ISI ESC and Crossref Indexed Journal NAAS Journal Score 2017: 4.31 Cosmos IF: 4.006
© A Society of Science and Nature Publication, 2017. All rights reserved.Online Contents Available at: http//www.bbrc.in/DOI: 10.21786/bbrc/10.3/6
INTRODUCTION
Developing countries are vulnerable to climate changes, mainly due to their limited adaptive capacities in deal-ing with extreme events (Pouliotte et al., 2009). the main fi ndings from the latest report on climate change and a special report on extreme events from the Intergovern-mental Panel on Climate Change show a greater consen-sus about a likely increase in the frequency and intensity of heavy precipitation events over land areas since 1950
(IPCC). Therefore, it is of great importance to predict cli-mate change for the future decades to deal with its pos-sible effects over different geographical territories. In the past years many investigations have been conducted to reveal climate change for different temporal resolutions and also for different parts of the globe. The effects of climate change has been simulated in 12 rivers of India, the authors have concluded that under a scenario of cli-mate change a general reduction in the quantity of the available runoff will occur and the intensity of fl oods

Amir Hossein Halabian and M.S. Keikhosravi
BIOSCIENCE BIOTECHNOLOGY RESEARCH COMMUNICATIONS EXPLORING CLIMATE CHANGE OVER KHAZAR BASIN 373
in various parts of India may get deteriorated (Gosain et al., 2006). The results of an investigation also show that between 1995 and 2025, the extents of the regions that will be affected by severe water stress will increase and this condition is especially true for Southern and Western Africa and South Asia (Alcamo et al., 2000). In a research it was found that based on ENSEMBLES anthropogenic climate-change (ACC) global simulations and the Climate version of the Local Model (CLM) pre-cipitation is expected to be critically decreased in three selected region of Greece (Paparrizos et al. 2016).
In another study it was revealed that over the Central Asian region, the aridity is expected to increase (Lioubimt-seva and Henebry, 2009). In another research work it was found that for the periods from 2010 to 2040 and 2070 to 2100 and based on the CGCM 3.1 dry regions of the Iran will get less precipitation (Abbaspour et al., 2009). The fi ndings of Arnell and Gosling (2016) revealed that under the climate model (HadCM3 and SRES A1b), in 2050 the current 100-year fl ood would occur at least twice as frequently across 40 % of the globe, approximately 450 million fl ood-prone peo-ple and 430 thousand km2 of fl ood-prone cropland would be exposed to a doubling of fl ood frequency, and global fl ood risk would increase by approximately 187 % over the risk in 2050 in the absence of climate change.
Zhang et al. (2016) estimated stream fl ows in the Xin River Basin, China based on climate change sce-
narios downscaled from different GCMs (BCC-CSM1.1, CanESM2, and NorESM1-M) under three Representative Concentration Pathways (RCPs). The ensemble average of streamfl ow in GCMs demonstrated that many RCPs signifi cantly decrease from May to June but increase from August to September relative to the baseline period. The goal of this investigation is to reveal the changes of temperature and precipitation over the study region. As rain fed agriculture is very common in the basin the fi ndings of the current paper could assist policy makers to have a better picture of climate of the study region for the next decades.
MATERIAL AND METHODS
STUDY REGION
Khazar Basin is geographically located in the north parts of Iran with a very diverse climate. The Alborze Moun-tains which are extended from west to east have created two distinct climates in the region. The north parts of the Basin receive a lot of precipitation throughout the year while the southern counterpart receives much less precipitation as the humidity is often confi ned to the northern areas of the Basin. The climate of the north part is mild and humid but the western parts of the region
FIGURE 1. General location of Khazar Basin.

Amir Hossein Halabian and M.S. Keikhosravi
374 EXPLORING CLIMATE CHANGE OVER KHAZAR BASIN BIOSCIENCE BIOTECHNOLOGY RESEARCH COMMUNICATIONS
FIGURE 2. Location of the stations used in this study
have a cold climate. The general location of the Basin has been depicted in Figure (1).
MATERIALS AND METHODS
In this paper, the daily precipitation, min temperature and max temperature data of 21 synoptic stations across the Basin were applied from 1992 to 2015. The applied stations are operated by Islamic Republic of Iran Meteor-ological Organization (IRIMO) and are presented in text fi les by the IRIMO. In order to ensure a valid climate change analyses it is important to examine the accuracy of the applied data, so the climate variables of all the sta-tions have been checked for any possible outliers in the time series. Despite the fact that the resolution of Gen-eral Circulation Models (GCMs) has been signifi cantly increased but they still cannot predict meteorological outputs for small scales. Therefore, some models have been created to downscale the GCMs output. LARS – WG is a model which is used to downscale the GCMs output. In this investigation the LARS – WG version 5.5 was utilized. This version includes different GCMs data and the BCM2 which is one the GCMs has also been included in the model. LARS – WG utilize separate semi-empirical distributions for each of variables including min, max temperatures and precipitation and this downscaling method has been used in several studies (Semenov et al., 1998; Qian et al., 2004; Babaeian and Kwon, 2005; Law-less and Semenov, 2005; Khan et al., 2006).
In the next step to prepare the data to run the model, the data of each station were transferred into the format of the LARS- WG weather generator. The observed daily max temperature, min temperature and precipitation series for 1992–2015 at 21 stations are used as inputs to the LARS- WG weather generator and then the weather series of the variables are generated for each site. Using the BCM2 general circulation model with emission sce-nario of SRA1B we simulated the climate variables of
max temperature, min temperature and precipitation for the future period of 2046-2065 over the Basin. Then we computed the Basin wide average of min, max and pre-cipitation for the observed period and also for the future period based on the obtained results from the model. Using the Surfer 12 software package, all the three cli-mate variables were then interpolated over the Basin and mapped.
RESULTS AND DISCUSSION
The calculated observed min temperature for the Basin indicates that the central parts of the Basin are the warm-est areas compared to the other regions and in some parts the annual temperature is nearly 13 ºC, the west and east parts of the Basin are cold parts and in some areas in the north-west the min temperature falls below 0 ºC (Figure 3). The simulated annual min temperature indicates that compared to the based period there will be increase in temperature (Figure 4) and in all areas of the Basin min temperature will increase in various rates. The highest rate of increase is seen over the north-west parts of the Basin that are considered to be the cold and mountainous regions (Figure 5). In these regions the temperature increase is up to nearly 7 ºC but in central areas the increased temperature is less evident and it is generally less than 2 ºC.
For the observed period the max warmest tempera-tures in the Basin are generally seen over central to the east regions while the cooler max temperatures are over north-west of the Basin. The max temperature is below 15 ºC in the coolest parts but in the warm areas, the max temperature exceeds 21 ºC (Figure 6). In the future period the max temperature will increase for entire of the Basin (Figure 7) and the temperature in some areas will exceed 24 ºC. The map of difference of max tem-perature (future – base) indicates that north areas of the Basin from north-west to north-east will experience the

Amir Hossein Halabian and M.S. Keikhosravi
BIOSCIENCE BIOTECHNOLOGY RESEARCH COMMUNICATIONS EXPLORING CLIMATE CHANGE OVER KHAZAR BASIN 375
FIGURE 3. Map of observed min temperature (ºC) for the based period (1992-2015).
FIGURE 5. Map of difference of min temperature (future-base)
FIGURE 4. Map of simulated min temperature (ºC) for the future period (2046-2065).

Amir Hossein Halabian and M.S. Keikhosravi
376 EXPLORING CLIMATE CHANGE OVER KHAZAR BASIN BIOSCIENCE BIOTECHNOLOGY RESEARCH COMMUNICATIONS
FIGURE 6. Map of observed max temperature (ºC) for the based period (1992-2015).
FIGURE 7. Map of simulated max temperature (ºC) for the future period (2046-2065).
FIGURE 8. Map of difference of max temperature (future-base)

Amir Hossein Halabian and M.S. Keikhosravi
BIOSCIENCE BIOTECHNOLOGY RESEARCH COMMUNICATIONS EXPLORING CLIMATE CHANGE OVER KHAZAR BASIN 377
FIGURE 9. Map of observed precipitationfor the based period (1992-2015).
FIGURE 10. Map of simulated precipitation (mm) for the future period (2046-2065).
highest rate of temperature increase, in these regions the temperature can possibly increase up to 4.5 ºC but this rate is far less evident in south-west of Basin, in these areas temperature increase is below 2 ºC in general (Figure 8). The overall rate of temperature increase for the entire of the Basin is 3.2 ºC.
Owing to the complex topography of the Basin, the amount of precipitation is also highly variable across the Basin, in the central north parts, the annual precipitation is very signifi cant and it’s due to the proximity to Caspian Sea. In some parts the annual precipitation exceeds 1300
mm on average (Figure 9). The map of simulated pre-cipitation for the future period indicates that many areas of the Basin will experience reduction in precipitation (Figure 10). The rate of decrease is various from region to region, the highest reduction is identifi able over central to the west parts with the average reduction of up to 140 mm while some areas from central to the east have an increase amount of precipitation compared to the base period with an increase of up to 40 mm (Figure 11). In general for the future period, the precipitation will decrease 37.1 mm in comparison to the base period.

Amir Hossein Halabian and M.S. Keikhosravi
378 EXPLORING CLIMATE CHANGE OVER KHAZAR BASIN BIOSCIENCE BIOTECHNOLOGY RESEARCH COMMUNICATIONS
FIGURE 11. Map of difference of precipitation (future-base)
Table 1. Change of the observed and simulated climatic variables across the Basin.
Min temperature (ºC)
Max temperature (ºC)
Precipitation (mm)
Mean of observed (1992-2015) 5.4 17.2 555.5
Mean of simulated (2046-2065) 9.2 20.4 518.4
Difference (future – base ) 3.8 3.2 -37.1
CONCLUSION
In this investigation the climatic variables, including min, max temperature and precipitation were applied from 21 synoptic stations across the Khazar Basin and were then downscaled using LARS- WG weather genera-tor for the future period (2046-2065). The fi ndings of this study revealed that over the future period the min and max temperature will increase across the Basin and the rate of the increase is 3.8 and 3.2 ºC respectively. In some parts of the Basin in the north-west, the rate of increase for min temperature is up to 6.8 ºC while for max temperature it is up to 4.5 ºC. The analyses also showed that in general precipitation will decrease for the future period with the average amount of 37.1 mm, but there are some limited areas in the Basin which will experience a little increase for the precipitation. From the obtained results of this study it can be concluded that the Basin will be highly affected by climate change in the future which can have signifi cant impacts on the ecosystem. Therefore serious adaptive steps must be taken to mitigate the adverse effects of climate change because the agriculture in this Basin is mostly rain fed and temperature increase along with precipitation decrease can deteriorate the climatic conditions consid-erably.
FUNDING
This study has been funded by Payam-e Noor University.
CONFLICT OF INTERESTS
None declared
REFERENCES
Abbaspour K.C., Faramarzi M., Ghasemi S.S., Yang H (2009). Assessing the impact of climate change on water resources in Iran. Water Resources Research, 45: 1-16.
Alcamo J., Henrichs T., Rosch T. World water in 2025, global modeling and scenario analysis for the World Commission on Water for 21st century. Report A0002, Center for Environmen-tal System Research, University of Kassel, Germany.
Arnell, N. W., Gosling, S. N. (2016). The impacts of climate change on river fl ood risk at the global scale. Climatic Change, 134: 387-401.
Babaeian I., Kwon W.T. (2005). Climate change assessment over Korea using stochastic daily data. Proceeding of the First Iran–Korea Joint Workshop on Climate Modelling, Nov. 2005. Climate Research Institute, Mashad, Iran.
Gosain A.K., Rao S., Basuray, D .(2006). Climate change impact assessment on hydrology of Indian River basins. Current Science, 90: 346–353.

Amir Hossein Halabian and M.S. Keikhosravi
BIOSCIENCE BIOTECHNOLOGY RESEARCH COMMUNICATIONS EXPLORING CLIMATE CHANGE OVER KHAZAR BASIN 379
IPCC, Summary for policymakers, in Climate Change 2013: The Physical Science Basis. Contribution of Working Group I to the Fifth Assessment Report of the Intergovernmental Panel on Climate Change, T. F. Stocker, D. Qin,G.-K. Plattner et al., Eds., pp. 3–29, Cambridge University Press, Cambridge, UK, 2013.
Khan M.S., Coulibaly P., Dibike Y. (2006). Uncertainty analysis of statistical downscaling methods. Journal of Hydrology, 319, 357–382.
Lawless C., Semenov M.A. (2005). Assessing lea d-time for pre-dicting wheat growth using a crop simulation model. Agricul-tural and Forest Meteorology, 135: 302–313.
Lioubimtseva E., Henebry G.M. (2009) Climate and environ-mental change in arid Central Asia: impacts, vulnerability, and adaptations. Journal of Arid Environments 73: 2009, 963–977.
Paparrizos, S., Maris, F., Matzarakis, A. (2016). Integrated analysis of present and future responses of precipitation over
selected Greek areas with different climate conditions. Atmos-pheric Research, 169: 199-208.
Pouliotte J., Smit B., Westerhoff L. (2009). Adaptation and development: livelihoods and
climate change in Subarnabad, Bangladesh. Climate and Development, 1: 31–46.
Qian B.D., Gameda S., Hayhoe H., De Jong R., Bootsma, A. (2004). Comparison of LARSWG and AAFC-WG stochastic weather generators for diverse Canadian climates. Climate Research 26: 175–191.
Semenov M.A., Brooks R.J., Barrow E.M., Richardson, C.W. (1998). Comparison of the WGEN and LARS-WG stochastic weather generators in diverse climates. Climate Research 10: 95–107.
Zhang, Y., You, Q., Chen, C., Ge, J. (2016). Impacts of climate change on stream fl ows under RCP scenarios: A case study in Xin River Basin, China. Atmospheric Research, 178: 521-534.

Biotechnological CommunicationBiosci. Biotech. Res. Comm. 10(3): 380-385 (2017)
Antibacterial activity of ZrO2 against metallo
beta-lactamase and biofi lm producing
carcinogenic Pseudomonas aeruginosa
Rajasekar S., Vijayalakshmi S. and A. Mohankumar*Division of Microbial Technology Post Graduate and Research Department of Zoology Chikkanna Government Arts College, Tirupur-641602, Tamilnadu, India
ABSTRACT
Pseudomonas aeruginosa is frequent pathogen associated with hospital acquired infections exhibiting intrinsic resist-ance to numerous antibiotics. A total of 80 isolates of Pseudomonas spp. were isolated from blood cancer patient from three tertiary hospitals in and around Tirupur and Erode (Dt). Metallo beta-lactamase and biofi lm production is the most worrisome resistant mechanisms observed in P. aeruginosa. Emergence of antimicrobial resistance by pathogenic bacteria is a major health problem in recent years. The biofi lm and Metallo beta-lactamase production was tested by combined disc test and tissue culture plate method. Electrophoretic analysis of the plasmid DNA pre-pared was carried out by agarose gel electrophoresis on 0.7%. Nineteen carcinogenic isolates which was showed more than 50% resistance against tested antibiotics were selected for plasmid isolation. Recurrently, ZrO2 nanoparticles comprises of well-known inhibitory and bactericidal effects. The nanoparticles were obtained and tested against 10 Metallo beta-lactamase and biofi lm producing carcinogenic isolates. The nanoparticles showed appreciable activity at all tested concentrations (0.2, 0.4 and 0.6 mg/ml). Thus, it is concluded that the present study designed to determine the effi cacy of ZrO2 may serve as a promising antibacterial agent against cancer causing Pseudomonas aeruginosa.
380
ARTICLE INFORMATION:
*Corresponding Author: [email protected] 27th July, 2017Accepted after revision 21st Sep, 2017 BBRC Print ISSN: 0974-6455Online ISSN: 2321-4007 CODEN: USA BBRCBA
Thomson Reuters ISI ESC and Crossref Indexed Journal NAAS Journal Score 2017: 4.31 Cosmos IF: 4.006
© A Society of Science and Nature Publication, 2017. All rights reserved.Online Contents Available at: http//www.bbrc.in/DOI: 10.21786/bbrc/10.3/7
INTRODUCTION
Pseudomonas aeruginosa is one of the most important opportunistic bacteria, causing a wide variety of infec-tions especially in immune compromised hosts such as burn patients, patients suffering from respiratory
diseases like cystic fi brosis, and cancer chemotherapy patients (Govan and Deretic, 1996). It is gram negative short rod belong to family Pseudomonacaeae. Infections with P. aeruginosa is occupy very important position as of greatest concern in critically ill and immune compro-mised patients who have been hospitalized for extended

Rajasekar S., Vijayalakshmi S. and A. Mohankumar
BIOSCIENCE BIOTECHNOLOGY RESEARCH COMMUNICATIONS ANTIBACTERIAL ACTIVITY OF ZRO2 AGAINST METALLO BETA-LACTAMASE 381
periods of time and have received broad-spectrum anti-microbial therapy or cancer chemotherapy (Pollack, 2000, Ae Mftah et al., 2015).
The pathogenic cancer causing Pseudo bacterial life includes stages where the cells are associated and form a biofi lm on a surface (e.g. Costerton et al., 1995). The for-mation of these surface communities and their inherent resistance to antimicrobial agents are the cause of many persistent and chronic infections (Costerton et al., 1999).
Nowadays the P. aeruginosa presents a serious ther-apeutic challenge for treatment of both community-acquired and nosocomial infections, and selection of the appropriate antibiotic to initiate therapy is essential to optimizing the clinical outcome (Mavroidi et al., 2005). Unfortunately, selection of the most appropriate anti-biotic is complicated by the ability of P. aeruginosa to develop resistance to multiple classes of antibacterial agents, even during the course of treating an infection. Further acquired resistance is also reported by the pro-duction of plasmid mediated AmpC beta ()–lactamase, Extended Spectrum Beta ()–Lactamase (ESBL) and met-allo beta ()–lactamase (MBL) enzymes.
Currently, the nanoparticles are increasingly recog-nized for their utility in biological applications includ-ing nano medicine (mariappan et al., 2011). The ongoing worldwide nanotechnology revolution is predicted to impact several areas of biomedical research and other science and engineering applications. Nanoparticles-assisted drug delivery, cell imaging, and cancer therapy are important biomedical applications of nanotechnol-ogy (Hua Wang et al., 2011).
Despite their potential biomedical applications, very few studies have reported on the role of zirconia nano-particles as anticancer materials. As far as the authors know, this is the fi rst report of the in vitro anticancer effect of sulphated zirconia nanoparticles against three cancer cell lines. Specifi cally, the toxicity of sulphated zirconia nanopar ticles against human colon cancer HT29, human breast cancer MCF-7 and human liver cancer HepG2 cell lines was assessed, showing promis-ing results (Ae Mftah et al., 2015).
Moreover, it is reported here that these novel nanopar ticles hold promise not just for anticancer appli-cations but also for anti-infection applications. The steady increase in the antimicrobial resistance of micro-organisms represents a great public health concern. This requires the search for new unconventional antimicro-bial agents. Nanotechnology provides promising mate-rials to fi ght infectious diseases such as nanoparticles with antimicrobial activities. So hence the present study has made an attempt to point out the antimicrobial properties of the ZrO2 nanoparticles were determined using the agar diffusion method against cancer causing Pseudomonas aeruginosa.
MATERIALS AND METHODS
A total of 100 clinical cancer blood samples were col-lected from the jugular vein with a sterile syringe of different age group of blood cancer patients in different clinics and PHC (Primary Health Centre) from in and around Tirupur and Erode District. 80 isolates of Pseu-domonas aeruginosa were isolated from the samples. Col-ony morphology was reported as non-mucoid or mucoid and the isolated colonies were subjected to standard biochemical tests and 16S r-DNA gene sequencing for identifi cation of Pseudomonas aeruginosa. Finally all isolates were kept at – 20oC in media containing 8% dimethyl sulfoxide (DMSO) until use.
The qualitative and quantitative analyzes of the bio-fi lm produced were performed of clinical isolates of P. aeruginosa according to the protocol described by (Xicohtencatl - Cortes et al. 2015). Clinical strains of P. aeruginosa were incubated for growth in trypticase-soy broth (TSB) at 37°C for 24 h. For biofi lm formation, 24-well plates containing 1 ml of TSB were inoculated with 50 ml (1.5 x 10⁸ bacteria/ml) of a bacterial suspen-sion of each of the P. aeruginosa strains and incubated at 37°C for 24 h. Biofi lms were washed with phosphate buffer solution (PBS) (pH 7.4) and fi xed with 2% forma-lin at 4°C overnight. Subsequently, the fi xative solution was removed with PBS and the fi lms were stained with 1 ml of 1% crystal violet for 15 min. Excess crystal violet was removed and 1 ml of methanol at 70% was added for quantifi cation of the biofi lm to an optical density of 600 nm.All imipenem resistant isolates were tested for MBL by Imipenem- EDTA combined disc test (CDT).
The Imipenem- EDTA combined disc test (CDT) was performed as described by the method of Yong et al. (2002). The test organisms were inoculated on the plates with seeded Mueller Hinton agar as recommended by the CLSI. A 0.5 M EDTA solution was prepared by dissolving 18.61g of EDTA in 100 ml of distilled water and adjust-ing its pH 8.0. The Mixture was sterilized by autoclav-ing. After two Imipenem (10μg) discs were placed on the surface of agar plate, add fi nally 4μl of 0.5 M concen-tration of EDTA solution. Finally, the inhibition zones of imipenem- EDTA discs were compared after 16 to 18 h of incubation in air at 37°C. In the combined disc test, if the increase in inhibition zone with imipenem- EDTA disc was ≥7 mm it was considered as Metallo Beta Lac-tamase positive (Lee et al. 2001).
The blood cancer causing P. aeruginosa was treated with various different concentrations (0.2 mg/mL, 0.4 mg/mL, 0.6 mg/mL & 100μg/mL) of ZrO2 nanoparti-cles no signifi cant difference in the growth curve. The growth experiment under the infl uence of Zirconium nanoparticles thus reveals the non-toxic nature of the Zirconium nanoparticles in the bacterial system. In the

Rajasekar S., Vijayalakshmi S. and A. Mohankumar
382 ANTIBACTERIAL ACTIVITY OF ZRO2 AGAINST METALLO BETA-LACTAMASE BIOSCIENCE BIOTECHNOLOGY RESEARCH COMMUNICATIONS
present study plasmid DNA was done by boiling prepa-ration method (Holmes & Quigley, 1981; modifi ed by Riggs & McLachlan, 1986).
Antimicrobial activity of protease was carried out by using well diffusion method. The Pseudomonas aerugi-nosa was inoculated in LB broth and incubated for 24 hrs at 37oC. The turbidity of the broth was adjusted at 0.5 (optical density) using Spectrophotometer. The bacte-rial culture was inoculated on MHA plates using sterilized cotton swab. Allow it to dry for 2 – 5 min. Well was made using sterile cork borer. Various different concentrations (0.2 mg/mL, 0.4 mg/mL, 0.6 mg/mL & 100μg/mL) of dif-ferent μl of ZrO2 nanoparticles (50μl, 100μl and 150μl) was impregnated in to the well. The plates were swabbed with Pseudomonas aeruginosa. The plates were examined to measure the zone of inhibition around the well.
RESULTS AND DISCUSSION
The carcinogenic disease is caused by external factors, such as tobacco, infectious organisms, and an unhealthy
diet, and internal factors, such as inherited genetic muta-tions, hormones, and immune conditions. These factors may act together or in sequence to cause cancer. Cur-rently, emerging and reemerging infectious disease are a major problem in public health and global econom-ics. They are caused by different type of infection such as drug resistant infection, mostly involving bacteria, and many emerging pathogen is increasing signifi cantly over time because they are becoming progressively more resistant to conventional antibiotic compounds. For example, Pseudomonas aeruginosa has been reported as an opportunistic pathogen and one of the most impor-tant opportunistic bacteria, causing blood cancer by the intrinsic resistance to many antimicrobial agents. So, the need for the development of new antibiotics to counter drug resistance in bacterial pathogens has been stressed by various researchers worldwide.
Totally 100 carcinogenic blood samples were collected from the jugular vein with a sterile syringe of different age group of blood cancer patients in different clinics and PHC (Primary Health Centre) from in and around
PLATE 1. Isolated of colonies Pseudomonas aeruginosa from Blood Cancer

Rajasekar S., Vijayalakshmi S. and A. Mohankumar
BIOSCIENCE BIOTECHNOLOGY RESEARCH COMMUNICATIONS ANTIBACTERIAL ACTIVITY OF ZRO2 AGAINST METALLO BETA-LACTAMASE 383
Tirupur and Erode District. 80 isolates of Pseudomonas aeruginosa were isolated from the samples. The can-cer causing leading pathogen Pseudomonas aeruginosa strains were confi rmed by comparing the results with standard biochemical test and 16S-rDNA gene sequence.
In the study 28.75% of blood cancer causing Pseu-domonas aeruginosa isolates was found to be MBL pro-ducers. These isolates exhibited a ≥ 7 mm zone enhanced for Imipenem and EDTA combined than the Imipenem
disks alone. All the MBL producing isolates were multi drug resistant, most of which showed resistance to more than twelve antibiotics out of the twenty anti-biotics tested. Twenty three isolates: PARS01, PARS02 PARS03, PARS05, PARS06, PARS21, PARS41, PARS43, PARS44, PARS47, PARS51, PARS56, PARS58, PARS60, PARS61, PARS62, PARS63, PARS64, PARS74, PARS75, PARS74, PARS75, PARS77, PARS78 and PARS80 which was showed more than above 50% resistance used for Metallo Beta Lactamase production by Imipenem (IMP)-EDTA Combined Disk test of (Yong et al. 2002). The maximum zone of inhibition (mm) produced by the strain No. PARS21 and PARS 77 which showed 40 mm followed by minimum amount of zone of inhibition produced by the strain No. PARS56 and PARS64 which showed 30mm (Plate: 8; Table: 16). Electrophoretic analysis of the plasmid DNA prepared was carried out by agarose gel electrophoresis on 0.7%. Nineteen car-cinogenic isolates (PARS01, PARS02, PARS03, PARS05, PARS06, PARS21, PARS41, PARS43, PARS44, PARS47, PARS51, PARS56, PARS58, PARS60, PARS61, PARS63, PARS64 and PARS80) which was showed more than 50% resistance against tested antibiotics were selected for plasmid isolation.
The antibacterial activity of ZrO2 nanoparticles was studied by agar well diffusion method. Three differ-ent concentrations (0.2%, 0.4% and 0.6%) were used in this assay against leukemia (blood cancer) causing Pseudomonas aeruginosa. The maximum zone of inhibi-tion 18mm, 19mm and 22mm was observed in strain no. PARS47 followed by the minimum zone of inhibi-tion 15mm, 16mm and 17mm was observed in strain no. PARS64 and PARS56 at 150μl concentration of different μg- 50, 100 and 150 of ZrO2. Mahrukh Khattak et al., (2013) determined the frequency of Pseudomonas aerug-inosa in middle and outer ear and to check the antibiotic susceptibility pattern of commonly used antibiotics. The pathogen was highly sensitive to Gentamycin 30 (71.4%), followed by Aztreonam 28(66.6%), Cefi xime 22(52.3%), Imipenem 18(42.8%), amikacin 15(35.5%) and Cip-rofl oxacin 12(28.5%). Females were more susceptible to Pseudomonas infections. Isolates of Pseudomonas
PLATE 2. Detection of Metallo -Lactamase by Imipenam EDTA Combined Disc Test
PLATE 3. Biofi lm production by carcinogenic patho-gen Pseudomonas aeruginosa
PLATE 4. Isolation of plasmid from Pseudomonas aeruginosa

Rajasekar S., Vijayalakshmi S. and A. Mohankumar
384 ANTIBACTERIAL ACTIVITY OF ZRO2 AGAINST METALLO BETA-LACTAMASE BIOSCIENCE BIOTECHNOLOGY RESEARCH COMMUNICATIONS
aeruginosa from samples showed highest sensitivity (71.4%) to Gentamycin while maximum resistance was showed to Ciprofl oxacin (47.6%). In this research, simi-lar results were found in all the Pseudomonas aerugi-nosa in blood cancer origin were more highly sensitive to Imipenem (97.5%).
Resistance to imipenem has been found to be inde-pendent of -lactamase production and in P. aeruginosa has been attributed to diminished expression of certain outer membrane proteins (Buscher et al., 2000). More than 80% of isolates in this study were sensitive to imi-penem (97.5%). Compared with results of a study con-ducted at the Lagos University Teaching Hospital (LUTH) in which 12.5% were resistant to imipenem, in this study only 5.4% Pseudomonas strains were resistant. Imipe-nem is a drug that is not readily available in our envi-ronment and its cost is also prohibitive.
Plasmid analysis of the multi-resistant strains showed that 18 of the Pseudomonas strains harbored plasmids, eleven of which had similar plasmid band patterns of 1-7 plasmid bands having low to intermediate molecular weights. Plasmid prevalence was higher in the strains from blood cancer. Acquisition of mobile genetic ele-ments is known to be the main mechanism for short term accumulation of resistance determinants in bacterial genomes (Liu et al., 2000).Our fi nding that 18(78.75%) out of the 46 Pseudomonas isolates contained plasmids with seven different plasmid profi les, coincides with that reported by Tsakris et al., (1992) who found that 10 isolates harbored plasmids out of 35 multi resistant pseudomonas strains, with 6 different plasmid profi les. In another study, Poh et al., (1988) detected 11 different plasmid profi les in Ps. aeruginosa isolates.
Biofi lm producing organisms are responsible for many recalcitrant infections and are notoriously diffi -
cult to eradicate. They exhibit resistance to antibiotics by various methods like restricted penetration of anti-biotic into biofi lms, decreased growth rate and expres-sion of resistance genes (Hachem et al., 2007). There are various methods for biofi lm detection (Poole, 2004). In the present study the number of isolates showing strong biofi lm producers were 41(64%) and moderate biofi lm producers were 39(36%) by Tissue culture plate method similar to the study done by Afreenish Hassen et al., (2011). In their study noted that out of 110 isolates from different clinical samples tested for biofi lm production, the number of biofi lm producers identifi ed by Tissue cul-ture plate method (TCP) was 70(64.7%) and non or weak biofi lm producers were 40(36.3%). The recent study has performed the Tissue culture plate method by addition of 1% glucose in trypticase soy broth. Addition of sugar helps in biofi lm formation16. This was also reported by studies conducted by Mathur et al., (2006).
Metallo-beta-lactamase enzyme is an emerging threat and cause of concern for physician. The metal ion active sites appear to decrease their susceptibility to beta lac-tamase inhibitors and enable them to hydrolyze broad spectrum including carbapenems. The Metallobeta-lac-tamase are plasmid mediated, so the resistance can be spread among hospital pathogen and will cause prob-lems in treating infections (Mehul Chaudhari et al., 2011). In present study, attempt was made to detect Metallobeta- lactamase producing Pseudomonas aer-uginosa. Of 80 isolates of Pseudomonas aeruginosa, 23 (2.5%) were resistance to imipenem. All 23 isolates were found to be MBL producers. Of 23 isolates of MBL, 23 (28.75%) were isolated from blood cancer patient. The prevalence of detect Metallo-beta-lactamase producing Pseudomonas aeruginosa in our setup if 2.5%.
Ae Mftah et al., (2015) studied the sulphated zirco-nia nanoparticles showed high antimicrobial activity against both Gram-positive and Gram-negative bac-teria. It was found that the nanoparticles showed the highest activity against Pseudomonas aeruginosa and methicillin-resistant S. aureus, followed by Bacillus subtilis and Salmonella choleraesuis. The fi rst time that the exposure of cancer cells to sulphated zirconia nano-particles (3.9–1,000 μg/mL for 24 hours) resulted in a dose-dependent inhibition of cell growth, as determined by (4,5-dimethylthiazol-2-yl)-2,5-diphenyltetrazolium bromide assays. Similar promising results were observed for reducing bacteria functions. In this manner, this study demonstrated that sulphated zirconia nanoparti-cles with bronsted acidic sites should be further studied for a wide range of anticancer and antibacterial appli-cations. Followed by these present study similar results of antimicrobial ability of ZrO2 at different concentra-tion (0.2%, 0.4% and 0.6%) used against blood cancer causing Pseudomonas aeruginosa. Zirconium oxide was
PLATE 5. Antibacterial activity of ZrO2 against Metallo beta-lactamase and biofi lm producing carcinogenic Pseudomonas aeruginosa

Rajasekar S., Vijayalakshmi S. and A. Mohankumar
BIOSCIENCE BIOTECHNOLOGY RESEARCH COMMUNICATIONS ANTIBACTERIAL ACTIVITY OF ZRO2 AGAINST METALLO BETA-LACTAMASE 385
used and it shows prominent anti carcinogenic activity against test pathogen.
CONCLUSION
The study also highlights that ML incidence is increas-ing in our region. The metallo beta-lactamase and biofi lm production is the most worrisome resistant mechanisms observed in P. aeruginosa. Emergence of antimicrobial resistance by pathogenic bacteria is a major health prob-lem in recent years. The resistance may spread rapidly to various species of Gram-negative bacilli; therefore, to prevent the further spread of ML producers, it is essen-tial to rapidly detect ML-positive isolates to aid infection control. Recurrently, tiny nanoparticles, far smaller than the width of a human hair, might help the body’s own immune system fi ght tumors. Moreover, it is reported here that these novel metallo nanopar ticles (ZrO2) comprises of well-known inhibitory and bactericidal effects against cancer causing Pseudomonas aeruginosa.
REFERENCES
Ae Mftah, Fatah H Alhassan, Mothanna Sadiq Al-Qubaisi, Mohamed Ezzat El Zowalaty, Thomas J Webster, Mohammed Sh-eldin, Abdullah Rasedee, Yun Hin Taufi q-Yap, and Shah Samiur Rashid (2015). Physicochemical properties, cytotoxic-ity, and antimicrobial activity of sulphated zirconia nanoparti-cles. Int J Nanomedicine. 10: 765–774.
Afreenish Hassan, Javaid Hasman, Fatima and Maria (2011). Evaluation of different methods associated of biofi lm forma-tion in the clinical isolates. Braz. J. Infectious disease. 15(4): 305 - 311.
Buscher, KH., W. Cullman, W. Dick, Wendt. S and Opferkuch. W (2000). Imipenem resistance in P. aeruginosa is due to dimin-ished expression of the outer membrane proteins. J. Infect. Dis. 156: 681- 685.
Costerton, J.W., P.S. Stewart and Greenberg E.P (1999). Bacte-rial biofi lms: a common cause of persistent infections. Science. 284: 1318–1322.
Costerton, J.W., Z. Lewandowski, D.E. Caldwell, Korber D.R and Lappin-Scott H.M (1995). Microbial biofi lms. Annu Rev Micro-biol. 49: 711–745.
Govan, J.R and Deretic V (1996). Microbial pathogenesis in cystic fi brosis: mucoid Pseudomonas aeruginosa and Burk-holderia cepacia. Microbiol. Rev. 60: 539 – 74.
Holmes, D and Quigley M (1981). A rapid boiling method for the preparation of bacterial plasmids. Anal. Biochem. 114: 193-197.
Hua Wang, Denise Wingett, Kevin Feris, Madhusudan R Kon-gara, Alex Punnoose (2011). Fluorescent particles comprising nanoscale ZnO layer and exhibiting cell-specifi c toxicity. US Patent. US 7,939,560 B2. 1-8.
Lee, K., Y. Chong, H.B. Shin, Y.A. Kim, Yong D and Yum J.H (2001). Modifi ed Hodge and EDTA-disk synergy tests to screen metallo-lactamase-producing strains of Pseudomonas and Acetobacter species. Clin Microbiol Infect. 7: 88–91.
Liu, XZ., I. Zang and Poole K(2000). Interplay between the MexA MexB OprM multidrug Pseudomonas aeruginosa. J. Antimicrobiol. Chemother. 45: 433-436.
Mahrukh Khattak, Muhammad Saqib Ishaq, Maimoona Gul, M. Medrar Hussain, Ghadir Ali, Amir Mohammad, Khalid Javed and Arshad Parvez (2013). Isolation and identifi cation of Pseu-domonas Aeruginosa from ear samples and its antibiogram analysis. 6(2).
Mariappan Premanathan, Krishnamoorthy Karthikeyan, Kadarkaraithangam Jeyasubramanian and Govindasamy Manivannan (2011). Selective toxicity of ZnO nanoparticles toward Gram-positive bacteria and cancer cells by apoptosis through lipid peroxidation Nanomedicine: Nanotechnology, Biology, and Medicine. 7: 184–192.
Mathur, T., S. Singhal, S. Khan, DJ. Upadhyay, Fatma T and Rattan A (2006). Detection of biofi lm among clinical isolates of Staphylococci: An evaluation of three different screening methods. Indian J Med Microbiol. 24(1): 25-9.
Mavroidi, A., A. Tsakris, E. Tzelepi, S. Pournaras, Loukova V and Tzouvelekis L.S (2000). Carbapenem-hydrolyzing VIM-2 metallo-b-lactamase in Pseudomonas aeruginosa from Greece. J Antimicrob Chemother. 46: 1041–1042.
Mehul Chaudhari. S., B. Tanuja Javadekar, Govind Ninama and Neelam Pandya1 Jivraj Damor (2011). A study of metallo-beta-lactamase producing Pseudomonas aeruginosa in clinical sam-ples of S.S.G. hospital. National journal of medical research. 1(2): 60-63.
Pollack, M (2000). Pseudomonas aeruginosa. In: Principles and practice of infectious diseases (eds. G.L. Mandell, J. E. Bennett and R. Dolin), Churchill Livingstone, Philadelphia, PA, USA, 5th Ed: 2310-2335.
Poole, K (2004). Effl ux mediated multi resistance in Gram Negative bacteria. Clinical 0Microbiology and Infection. 10 (1): 12–26.
Riggs, M.G and McLachlan A (1986). Biotechnology Tech-niques. 4: 310 - 313.
Tsakris, A., A.C. Vatopoulous, Tzouvelekis L.S and Legakis N.J (1992). Diversity of resistant phenotypes and plasmid analysis in multi resistant 0:12 Ps. aeruginosa. Eur. J. Epidemiol. 8: 865-780.
Xicohtencatl-Cortes, J., V. Monteiro-Neto, Z. Saldana, M. A. Ledesma, Puente J.L, Girón J.A (2009). The type 4 pili of enterohemorrhagic Escherichia coli O157:H7 are multipurpose structures with pathogenic attributes. J Bacteriol. 191:411-421.
Yong, D., K. Lee, J.H. Yum, H.B. Shin, Rossolini G.M and Chong Y (2002). Imipenem-EDTA disk method for differentiation of Metallo eta lactamase producing clinical isolates of Pseu-domonas spp. and Acinetobacter spp. J Clin Microbiol. 40: 3798-801.

Ecological CommunicationBiosci. Biotech. Res. Comm. 10(3): 386-390 (2017)
Physicochemical and fungal diversity analysis of two
different sources of polluted water of Cachar District
Assam
Rajesh Paul and Jashodeb ArjunZoology Department Lumding College Lumding 782447 Assam
ABSTRACT
Analysis of physicochemical and fungal species from two different sources of water pollution, as Paper Mill Effl uents (PME) of Hindustan Paper Corporation and City Domestic Sewage (DS) of Cachar district, Assam was carried out during pre and post monsoon season (February, 2016 and May, 2016). Water samples were collected and analyzed for standard physicochemical parameters where pH, turbidity, electrical conductivity, total hardness were found within the limits prescribed by WHO and ISI where as total alkalinity, Total Dissolved Solids (TDS), nitrate and Phosphate content were found to be exceeding the permissible limits for both PME and DS. Aspergillus niger, A. fl avus. and Penicillium citri-num were among the most commonly encountered species of fungi from both the sites. Highly signifi cant microbial load was observed in domestic sewage (cfu/ml =22.0x10³, P<0.001) during the post monsoon season (May, 2016).
ABBREVIATIONS: PME: PAPER MILL EFFLUENT; DS: DOMESTIC SEWAGE
KEY WORDS: PAPER MILL EFFLUENTS, DOMESTIC SEWAGE, FUNGAL SPECIES, PHYSICO CHEMICAL PARAMETERS
386
ARTICLE INFORMATION:
*Corresponding Author: [email protected] 17th June, 2017Accepted after revision 25th Sep, 2017 BBRC Print ISSN: 0974-6455Online ISSN: 2321-4007 CODEN: USA BBRCBA
Thomson Reuters ISI ESC and Crossref Indexed Journal NAAS Journal Score 2017: 4.31 Cosmos IF: 4.006
© A Society of Science and Nature Publication, 2017. All rights reserved.Online Contents Available at: http//www.bbrc.in/DOI: 10.21786/bbrc/10.3/8
INTRODUCTION
Water is the basic need of life, a precious gift of nature to man and all the living creatures of this universe. So the quality of water is of vital concern as it is directly linked with human welfare. Only 3% of the water in the uni-verse is fresh and among the fresh waters, only around
5% or 0.15% of the total water are available for use. The total water resource available in India is 1850 km3, which is approximately 4% of the worlds fresh water resources (EPA-PWD, 2001) . But very fast it is becoming a scare commodity in many parts of the universe.
The water quality monitoring results obtained dur-ing 1995 to 2006 indicate that the organic and bacterial

Rajesh Paul and Dr. Jashodeb Arjun
BIOSCIENCE BIOTECHNOLOGY RESEARCH COMMUNICATIONS PHYSICOCHEMICAL AND FUNGAL DIVERSITY ANALYSIS OF TWO DIFFERENT SOURCES 387
contamination are continued to be critical in water bod-ies. This is mainly due to discharge of domestic waste-water mostly in untreated form from the urban centers of the country and at the same time the receiving water bodies also do not have adequate water for dilution. Therefore, the oxygen demand and bacterial pollution is increasing day by day which is mainly responsible for water borne diseases.
The total surface water resource of Assam State is estimated at about 600 billion cubic meters, where the annual replenishable groundwater resource of the State has been estimated as 27.23 billion cubic meters. But prolonged discharge of industrial effl uents, domestic sewage and solid waste dump causes pollution in the water resources which leads to enormous health prob-lems. The rapid growth of industrial resources has fur-ther affected water quality due to overexploitation and improper waste disposal practices. Hence there is always a need for concern over the protection and manage-ment of water resources .considering the above aspects of contamination ,the present study was undertaken to investigate the level of water pollution and at the same time to measure the microbial contamination due to industrial and domestic exposure in the country rivers.
MATERIALS AND METHODS
SAMPLING SITE AND PREPARATION OF WATER SAMPLES
The present study was carried out during the pre and post monsoon season (February, 2016 and May, 2016). Raw paper mill effl uent sample was collected from the outlet pipes in the local river Barak. For comparative analytical study domestic sewage was collected from Silchar, Munic-ipal drainage system at Tarapur area, where all the debris and discharges of the whole locality have been found to be discharged. Both the effl uent and sewage samples were collected in plastic gallons, pH was measured and stored at -20oC to prevent further microbial growth.
PHYSICO-CHEMICAL PARAMETERS AND MICROBIAL DIVERSITY STUDY
The paper mill effl uent and domestic sewage were ana-lyzed for a number of standard physico-chemical prop-erties, including Color, temperature, pH, turbidity, Dis-solved Oxygen (DO), Electrical Conductivity (EC), Total alkalinity (TA), Total Dissolved Solids (TDS), Total Hard-ness (TH), FCO2 , Nitrate and Phosphate content were ana-lyzed followed by the standard methods (USEPA,1996; APHA,1998).
For the isolation of fungi from both the effl uent and sewage samples , serial dilution plate technique was
used .1 ml of fi nal dilution of sample was inoculated on Czapek Dox Agar medium. In sterile Petri dishes Martin’s Rose Bengal was added as a bacteriostatic agent accord-ing to Smith and Dawson (1944). The tubes of colony forming units (cfu) was determined after incubating the inoculated plates in 3 replicates at 25oC (±2oC) for 4-5 days, thereafter fungal species were identifi ed using the keys as described by Gilman (1957); Raper and Fennel (1965).
STATISTICAL ANALYSIS
Results were presented as Mean±SE followed by micro-bial diversity studies where mean value was calcu-lated from three individual readings of a particular set. ANOVA was performed to determine the level of signifi -cance of microbial diversity studies. ANOVA was done using graph pad PRISM (Graph pad Inc., san Diego, CA, USA). Percentage occurrence used in this study include ,
Occurrence of Species A Percentage occurrence of species = Í 100 Occurrence of all species
RESULTS AND DISCUSSION
The result of physicochemical parameters performed from both paper mill effl uent and domestic sewage are presented in Table 1 and 2.
PH
pH is used to express the intensity of acid or alkaline condition of a water sample. In our case pH value ranged from 4.78-6.74, found within the permissible limits. Highly acidic pH was recorded in DS in both the seasons specially during the month of May. Water samples with low pH(<6.0) attributes to the discharge of acid contents into these effl uents by agricultural or domestic activi-ties. A decrease in pH may be caused by the increase in the amount of organic carbon, total carbonates available in the sewage resources. Though pH has no direct effect on human health still the different kinds of biochemical reactions taking place within human body are sensitive to variation of pH.
TURBIDITY
Turbidity is due to colloidal and fi ne dispersions in water resources. The turbidity value varied between 2.5-3.2 and found within the permissible limit of WHO and ISI.
DISSOLVED OXYGEN (DO)
Dissolved Oxygen is an important parameter for water quality assessment which refl ects the biological pro-

Rajesh Paul and Dr. Jashodeb Arjun
388 PHYSICOCHEMICAL AND FUNGAL DIVERSITY ANALYSIS OF TWO DIFFERENT SOURCES BIOSCIENCE BIOTECHNOLOGY RESEARCH COMMUNICATIONS
Table 1. Physico chemical characteristics of PME and DS in the month of February, 2016.
ParametersPaper Mill
Effl uent (PME)Domestic
Sewage (DS)WHO
StandardsISI
Standards
Color Pale brown Dark brown - -
Temperature 28 24 - -
pH 6.16 4.78 6.5-8.5 6.5-8.5
Turbidity 2.5 2.8 5.0 10
Dissolved Oxygen (DO) 23.24 4.44 - 5.0
Electrical conductivity (EC) 0.9 1.9 1400
Total Alkalinity 460 355 120 200
Total Hardness 214.67 138.67 500 300
FCO2 7.34 14 - -
Total Dissolved Solids (TDS) 665 3695 1000 500
Nitrate 7.942 8.414 5 45
Phosphate 2.192 3.778 0.1 -
Table 2 . Physico chemical characteristics of PME and DS in the month of May, 2016.
ParametersPaper Mill Effl uent
(PME)Domestic
Sewage (DS)WHO
StandardsISI
StandardsColor Pale brown Dark brown - -
Temperature 26 23 - -
pH 6.74 5.12 6.5-8.5 6.5-8.5
Turbidity 2.7 3.2 5.0 10
Dissolved Oxygen (DO) 17.96 3 - 5.0
Electrical conductivity (EC) 1.2 2.1 1400
Total Alkalinity 417 323 120 200
Total Hardness 298.67 202.66 500 300
FCO2 14.34 24.67 - -
Total Dissolved Solids (TDS) 617 3432 1000 500
Nitrate 8.123 9.235 5 45
Phosphate 2.431 4.537 0.1 -
All parameters are in mg/L except Temperature, pH, Turbidity, Electrical conductivity. Temperature in °C, Turbidity in NTU, Electrical conductivity in micromho /cm
Table 3. Result of microbial (fungal) diversity isolated from PME and DS (February, 2016 and May, 2016).
Treatment Groups
cfu /ml (x 103)
February, 2016 May, 2016
Paper Mill Effl uent (PME)(%)102550Domestic Sewage (DS) (%)102550
4.67±0.179.34a±0.4510.67b±0.45
7.34±0.3413.67c,b±0.45
15.67c,b,a±0.75
5.67±0.4510.34b±1.2
19.34a,b±0.75
8.0±0.7812.67b±1.04722.0b,c,a±1.95
Where, P < 0.05 = a, P < 0.01 = b, P < 0.001 = c
cesses taking place in water bodies. The DO value indi-cates the degree of pollution in water .In our study the DO content was found minimum during the month of May, which may be because the increased algal produc-tivity due to increased rate of photosynthesis (Rajku-mar et al, 2004).
ELECTRICAL CONDUCTIVITY (EC)
Electrical conductivity is a measure of water capacity to convey electrical current. It signifi es the amount of total dissolved salts. EC value was found within the range of 0.9-2.1 micromho /cm where DS showed higher EC value in both the seasons indicating the presence of high amount of dissolved inorganic substances in the ionized

Rajesh Paul and Dr. Jashodeb Arjun
BIOSCIENCE BIOTECHNOLOGY RESEARCH COMMUNICATIONS PHYSICOCHEMICAL AND FUNGAL DIVERSITY ANALYSIS OF TWO DIFFERENT SOURCES 389
form in domestic sewage as the conductance of water increases with salts. Higher the concentration of electro-lyte in water the more is its electrical conductance.
TOTAL ALKALINITY
The alkalinity of water is caused mainly due to OH, CO3, HCO3 ions, borates, phosphates and organic acids. It is an estimation of the ability of water to resist change in pH upon addition of acid. In the present study, alkalinity was found beyond the permissible limits of both WHO and ISI standards. Maximum alkalinity may be due to low temperature bringing down the rate of decomposi-tion of salts to a minimum thus by increasing alkalinity.
TOTAL HARDNESS
Water hardness is a measure of capacity of water to pre-cipitate soap. It is defi ned as the sum of Calcium and Magnesium concentration, both expressed as Calcium carbonate. In the present investigation, the Total Hard-ness value (138.67-298.67 mg/L) ranged within the per-missible limits with maximum hardness during summer (May), which might be due to reduced infl ow of water and rate of evaporation. The FCO2 value was recorded minimum in PME specially in February, 2010 which may be due to less suspended microbial load on suspended particles and algal masses (Michael, 1984).
TOTAL DISSOLVED SOLIDS (TDS)
TDS content was found within the range of 617-3695 mg/L where DS showed higher TDS content specially in pre monsoon season which exceeded the maximum permissible limit of ISI Standards indicating the enor-mous storage of different types of salts such as carbon-ates, bicarbonates, chlorides, phosphates, nitrates, mag-nesium calcium, sodium, potassium, manganese and organic matters.
Nitrate and Phosphate content were found at higher concentrations in domestic sewage specially in the sum-mer season (May, 2010) where Nitrate and Phosphate level for both the effl uents exceeded the permissible
limit of WHO Standards. Higher Phosphate concentra-tion may be because of the discharge of domestic wastes, soaps, detergents, fertilizers and human activities.
All together six species of fungi belonging to four genera were isolated and identifi ed from the water sam-ples. The majority of fungi were encountered rarely. Of the genus Aspergillus the best represented species were Aspergillus niger, A. fumigatus A. fl avus. and Peni-cillium citrinum which were isolated from PME as well as from DS. The fungi isolated from different samples of Barak River were likely to be originated from soil or entered the water with plant remains. The isolated fungi from river Barak belong mainly to the category of tran-sient accidental microorganisms, according to ecological classifi cation of aquatic heterotrophic microorganisms (Park, 1972b). Transient and accidental microorgan-isms can develop sporadic activity and soil fungi may participate in microbiological processes in water bodies (Park, 1972b). Among the fungal population Aspergil-lus was represented by highest number of species. This is in accordance with the statement of Barron (1968) that Aspergillus is biologically one of the most success-ful of all fungi and is expected to occur on all sorts of organic debris. Carlie and Watkinson (1997) in their study observed that Aspergillus and Penicillium sp have cel-lulolytic enzymes and wood degrading capability. Cel-lulolytic fi lamentous fungi have the ability to penetrate cellulose substrate through hyphal extensions. cfu rate was found to be highly signifi cant in DS (22.0x10³) espe-cially in summer followed by. ANOVA. Low cfu rate in February may be due to cold climatic condition inhibiting fungal growth. Maximum fungal diversity was recorded in domestic sewage in comparison to PME. Higher occur-rence of A. fl avus and Penicillium citrinum. was noted in PME where as A. niger and A. fumigatus were among the mostly encountered species in DS in both the seasons.
CONCLUSION
As the river water is being purifi ed by the municipal cor-porations before public consumption, so human being
Table 4. Occurrence of fungi isolated from PME and DS (February, 2016 and May, 2016)
Fungal SpeciesIdentifi ed
Water Samples
Paper Mill Effl uent (PME) Domestic Sewage (DS)
10% 25% 50% 10% 25% 50%
Feb May Feb May Feb May Feb May Feb May Feb MayA. fl avusA. nigerPenicilliumcitrinumA. fumigatusMucor sp.Rhizopus sp.
42.850
28.570
14.2814.28
47.0541.1711.76
000
500
21.420
17.8514.28
38.748.3812.9
000
50025 0
15.6259.375
39.6544.8215.51
000
27.2745.459.0918.18
00
044.45
051.853.70
31.739.029.7519.51
00
0500
42.17.89
0
31.9140.4210.63 17.02
00
056.06
0 31.816.06
0

Rajesh Paul and Dr. Jashodeb Arjun
390 PHYSICOCHEMICAL AND FUNGAL DIVERSITY ANALYSIS OF TWO DIFFERENT SOURCES BIOSCIENCE BIOTECHNOLOGY RESEARCH COMMUNICATIONS
have least possibilities to get effected as the effl uents and sewages get diluted in the river and after purifi ca-tion possibilities to develop water borne disease becomes negligible. But aquatic fl ora and fauna are directly get-ting exposed to the water of river Barak , might be tre-mendously effected by the exposure of this polluted water specially in the form of microbial contamination as no precautions have been undertaken yet for the safety of aquatic ecosystem including the aquatic plants and organisms specially fi shes. So, proper measures have to be undertaken for the maintenance of water quality in Barak river, so that the water quality and aquatic life including the aquatic fl ora and fauna can be protected from micro-bial contamination and water pollution as well.
ACKNOWLEDGEMENT
We are grateful to UGC for providing fellowship to RP and BR.
REFERENCES
American public health Association: Standard methods for the examination of water and wastewater 20th edition, APHA, AWWA, WPCF, Washington DC (1998).
Barron, G.L.: The genera of Hyphomycetes from soil. Williams and Wilkins Co, Baltimore (1968).
Bennett, J. W.: Klich, M.A. Mycotoxins. Clin. Microbiol. Rev. 16: 497-516 (2003).
Bitton, G .: Waste Water Microbiology.Gainesville, New York Wiley- Liss. 118p(1994).
Carlie, M.J., Watkinson, S.C .: The fungi. Academic Press, New York., pp. 269-275(1997).
Edema, M.O., Omemu, A.M., and Fapetu, O.M.: Microbiological and physicochemical analysis of different sources of drinking water. Nigerian Journal of Microbiology 15: 57-61(2001).
Environmental Planning Frame Work for Water Resources Management in Tamil Nadu, Final Draft, Public Works Depart-ment, Government of Tamil Nadu (2001).
EPA: US Environmental Protection Agency Safe Drinking Water Act.EPA 816-F-03-016 (2003).
Gilman, J.D.: A manual of soil fungi ,lowa state univ,press, Amer, lowa, USA, pp: 450 (1957).
ISI:10500 (1991): Indian standards of Drinking Water Specifi -cation, Bureau to Indian Standards (BIS),New Delhi, India.
ISI (1982): Tolerance limit for inland surface water subject to pollution, 2296, Indian Standards Institute, New Delhi, India.
Manivasakam, N.: Physical Chemical examination of water, sewage and industrial effl uents 5th Ed, Pragati Prakashan, Meeret, India (2005).
Michael, P. Ecological Methods for Field and Laboratory Inves-tigations. Tata Mc Graw Hill, New Delhi. 1984; pp- 434.
Park, D.: On ecology of heterotrophic microorganisms in fresh-water. Transactions of the British mycological Society 58: 291- 299 (1972b).
Rajkumar, S.,Velmurugan. P., Shanti, K., Ayyasamy, P.M., and Lakshmanaperumalsamy, P. Water Quality of Kodaikanal Lake, Tamilnadu in relation to physico-chemical and bacteriologi-cal characteristics, Capital Publishing Company, Lake 2004, pp.339-346.
Raper, K.B and Fennel, D.J. The Genus Aspergillus Williams and Wilkins, Baltimars, pp:686 (1965).
Smith, N.R. and Dawson, T.V.: The bacteriostatic action of rose Bengal in media used for the plate counts of soil fungi, Sill Sel, 58; 467-491(1944) .
United States Environmental Protection Agency: Acid diges-tion of sediments sludge and soils. Method-3050B, USEPA, Washington, DC (1996).
World Health Organization: Guidelines for drinking water qual-ity. World Health Organization, Geneva, Switzerland (1992).
World Health Organization: Guidelines for drinking water quality-I, recommendations Geneva, WHO, 2nd Ed. (1993).

Pathological CommunicationBiosci. Biotech. Res. Comm. 10(3): 391-397 (2017)
Comparison of multiplex ligation-dependent probe
amplifi cation and qPCR for screening PAX5 gene
detection in acute lymphoblastic leukemia
Sahar Mehranfar1, 2, Sirous Zeniali3,4, Nasser Samadi5, Nazanin Maleki Sadeghi6 and Abbasali Hosein Pour Feizi7*1,7Hematology & Oncology Research Center, Tabriz University of Medical Sciences, Tabriz, Iran2Department of Molecular Medicine, School of Advanced Medical Science, Tabriz University of Medical Science, Tabriz, Iran3Department of Molecular Medicine, Biotechnology Research Center, Pasteur Institute of Iran, Tehran, Iran4Kawsar Human Genetics Research Center, Kawsar Genomics Center, Tehran, Iran5Department of Biochemistry, Faculty of Medicine, Tabriz University of Medical Sciences, Tabriz, Iran6Lorestan University of Medical Sciences, Khorramabad, Iran
ABSTRACT
Despite the advances in diagnosis of leukemia, still we need a rapid and cost-benefi t screening method in patients with acute lymphoblastic leukemia (ALL). The aim of the present study is to evaluate the ability of Multiplex Ligation-dependent Probe Amplifi cation (MLPA) method in screening patients with ALL. 45 patients with ALL were selected. DNA were extracted, then PAX5 gene copy number abnormalities (CNAs) were studied by adopting MLPA and QPCR methods. To prove the results of two methods, PCR product from three samples were sent for sequencing. From 45 patients with B-ALL, 11 (24%) patients, showed CNAs after applying MLPA method. From among all mutations, 22 samples (29%) were seen in PAX5 gene. We used Sanger sequencing as a gold standard method to compare the two methods. After sequencing, we were submitted 2 genes in Gene Bank by accession numbers (ID) KX608846 and KX707789 in exon 10 of PAX5. MLPA is a rapid and valid method for screening of genes mutation and can be used in these laboratories as routine method especially in low-income countries.
KEY WORDS: ACUTE LYMPHOBLASTIC LEUKEMIA, COPY NUMBER ABNORMALITY, MLPA, QPCR
391
ARTICLE INFORMATION:
*Corresponding Author: [email protected] 2nd July, 2017Accepted after revision 22nd Sep, 2017 BBRC Print ISSN: 0974-6455Online ISSN: 2321-4007 CODEN: USA BBRCBA
Thomson Reuters ISI ESC and Crossref Indexed Journal NAAS Journal Score 2017: 4.31 Cosmos IF: 4.006
© A Society of Science and Nature Publication, 2017. All rights reserved.Online Contents Available at: http//www.bbrc.in/DOI: 10.21786/bbrc/10.3/9

Sahar Mehranfar et al.
INTRODUCTION
Today, B-cell acute lymphoblastic leukemia (B-ALL) is the most common childhood malignancy, especially in chil-dren below fi ve years of age. Today, we have extensive knowledge about leukemia like other cancers. In the last two decades, molecular methods have provided the physi-cians and researchers with a new vision towards the role of molecular factors in pathogenesis of diseases. Alterna-tive expression leads to the abnormal proliferation and differentiation of lymphoid ancestors (Fazio, Biondi, & Cazzaniga, 2011; O’neil & Look, 2007 Seiter et al., 2014).
Paired Box5 (PAX5) is an important transcription factor located on chromosome 9p13 and includes 10 exons. PAX5 is essential factor for the development of pro-B cell to mature B-cell(Fazio et al., 2011). Up to now, nine PAX transcription factors have been demon-strated, although, PAX5 is the only PAX protein which is expressed in the hematopoietic system (Busslinger, 2004; Cobaleda, Schebesta, Delogu, & Busslinger, 2007; Mat-thias & Rolink, 2005). The improvement of diagnostic and treatment protocols by using risk-adapted methods have enhanced cure rate up to 80%(Carter et al., 2001).
Therefore, the identifi cation of biomarkers can be a great help for the patients and the health-care system to reduce the health-care costs and side effects of chemo-therapy. Screening is highly pivotal in the developing countries where the fi nancial resources and drugs are limited. Childhood cancer rates has been rising slightly in the past few decades (Fathi et al., 2015).
In Iran, leukemia has an increasing trend and leaves a heavy burden on the whole society,(Fazeli et al., 2013). Thus, more attention needs to be paid to screening, early diagnosis, and effective treatment in order to increase the survival rate for children’s cancer (Mousavi et al., 2008).
In this study, we carried out Multiplex Ligation-depend-ent Probe Amplifi cation (MLPA) analysis on 45 ALL patients’ samples to determine the copy number abnormality (CNA) of PAX5 gene. MLPA is a technique capable of showing variations in the copy number of several human genes.Due to this capability, MLPA is mostly used in the molecular diagnosis of several genetic diseases whose pathogenesis is related to the presence of deletions or duplications of specifi c genes,(Schouten et al., 2002; Stuppia, Antonucci, Palka, & Gatta, 2012). Also, we adopted the real-time PCR method for comparing the results of two methods.
MATERIALS AND METHODS
58 Bone marrow(BM) or/and peripheral blood (PB) sam-ples were taken at the time of diagnosis of patients with B-ALL, who were presented to the Children’s Hospital of Tabriz University of Medical Sciences, between 2014 and 2016. The selection criteria included having at least
20% blast cells, and being between 1-14 years of age at the time of diagnosis. The exclusion criteria were the samples from foreign patients and DNA with insuffi -cient quality. Six samples were excluded due to failure of MLPA, Five samples due to bad quality of DNA and two of them were withdrawn. Additionally, 4 bone mar-row and 7 peripheral blood samples from healthy donors were analyzed as control samples. Graphical abstract of diagnosis process in this study are shown in (Figure 1).
The written informed consent was obtained from all the parents and the study protocol was approved by Eth-ics and Human Rights Committee of Tabriz University of Medical Sciences.
The DNA was extracted from BM or PB samples, using the QIAamp DNA minikit (Qiagen, Hilden, Ger-many) according to the manufacturer’s instructions. In order to verify the fi delity of DNA concentration and to evaluate its quality, a spectrophotometer,(NanoDrop,WilmingtonDE,,USA) and 1.5% agarose electrophoresis gel were used respectively.
Two pairs of primer for exone10 of PAX5 gene were designed using the online program oligo7. The primer sequences are shown in (Table 1). SYBR Green Real-time PCR (BIO-RAD iQ5, Bio-Rad, Hercules, California, USA) was done using a serial dilution of DNA samples includ-ing 100, 50, 25, 12.5 and 6.25ng in triplicate repeats. Then, according to the standard curves and by compar-ing the slope and effi ciency of each reaction (Schmitt-gen, Lee, & Jiang, 2008), 50 ng of DNA were preferable as the best concentration. The analysis was performed in a total volume of 20 μl including 50 ng of DNA, 0.2 mM specifi c primers and 10 μl of SYBR Green Master mix (Applied Biosystems, Foster City, California, United States) according to the manufacturer’s instructions, then (2−ΔΔCt) was calculated by normalizing samples and the relative gene copy numbers were calculated. The
FIGURE 1. Graphical abstract of diagnostic process.
392 COMPARISON OF MULTIPLEX LIGATION-DEPENDENT PROBE AMPLIFICATION AND QPCR BIOSCIENCE BIOTECHNOLOGY RESEARCH COMMUNICATIONS

BIOSCIENCE BIOTECHNOLOGY RESEARCH COMMUNICATIONS COMPARISON OF MULTIPLEX LIGATION-DEPENDENT PROBE AMPLIFICATION AND QPCR 393
Sahar Mehranfar et al.
copy numbers compared to the reference gene were determined. Following values were considered for result analysis: 1 for normal samples, 0.5 for heterozygous deletions, and 1.5 for heterozygous duplications. Results were analyzed using Microsoft Excel.
The MLPA probe sizes, chromosomal position and sequences and other complete details are available on the Website (www.MRC-Holland.com). The sensitivity of the MLPA kit P335-B2 was assessed previously by Kuiper et al (Kuiper et al., 2007) . In each run of MLPA, appropriate numbers of the samples, and three to six control samples were used in same run. All control samples were taken from the children with no acute leukemia or other types of malignancy. In this study, 50 ng of genomic DNA in fi nal volume of 5 μl were used to determine copy number of PAX5 gene by using the SALSA MLPA kit P335-B2 (MRC Holland, The Netherlands). Capillary electropho-resis were run on 3130XL Genetic Analyzer (Life Tech-nologies, Carlsbad, CA, USA) and amplifi ed PCR products were analyzed by Gene Marker version 1.95 (Soft Genet-ics State College, Pennsylvania, USA). Values over < 0.75 and > 1.35 were considered to be abnormal and values below 0.25 indicated biallelic deletion. Schematic MLPA analysis is shown in (Figure 2).
Normality of data was calculated by Kolmogorov-Smirnov test and was presented by Mean and Stand-ard Deviation. Non-normal variables were incidental as Median (Max & Min). The gene CNAs difference between the ALL and control samples were calculated by inde-pendent sample T-test and regression tree for accuracy of MLPA method. P-values less than 0.05 were consid-ered statistically signifi cant. All statistical analyses were done using the Statistical package for the Social Sci-ences (SPSS), version 16.0 (SPSS Inc, Chicago, IL, USA).
RESULTS AND DISCUSSION
45 patients with ALL, including 27 (60%) boys with mean age of 5.8±3.4 and 18 (40%) girl with mean age
of 6.0 ±2.7 years were studied (p>0.05). Statistically, no signifi cant differences were seen between the mean ages of genders. Demographic data of the participants have been summarized in (Table 2).
We found a wide range of alterations in the PAX5 gene in this study; deletion or duplication in one or more exons. In 2 cases, deletion and duplication were seen in different exons simultaneously. From among all patients, 11 (24%) patients showed 76 CNAs, from which, 22 (29%) were seen in PAX5 gene. The more frequent exons were 6, 7, and 8 (55%); the least one was exon 1 (4%). No signifi cant difference was observed between CNAs and sex, age, National Cancer Institute (NCI) risk group or source of samples (p<0.05). Schematic detected CNAs are shown in (Figure 3).
From among all samples, three samples showed changes in exon 10 by MLPA. All of these samples (3) were validated by real-time PCR. The standard melting curve of real-time PCR is shown in (Figure 1).
The accuracy obtained for MLPA method for detec-tion of CNAs comparisons of real-time PCR was 86%.
To prove the results of two methods, PCR product from these patients was sent to Bioneer for sequencing. The sequencing analyses were done by Chromas software, and the results were compared with the reported gene sequences. We submitted 2 genes in GenBank by acces-sion numbers (ID) KX608846 and KX707789 in exon 10 of PAX5. Schematic representation of each method is shown in (Figure 4).
ALL is a heterogeneous disease with differing in response to chemotherapy. The results of some studies demonstrated that the identifi cation of molecular mark-ers may improve the treatment approaches (Yang et al., 2011). Today, the determination of gene dosage is impor-tant for both clinical and research medicine and it is also required for therapeutic, prognostic, or diagnostic goals (Ginsburg & Willard, 2009; Vogelstein & Kinzler, 2004). Due to the growing need for molecular studies, a lot of new molecular markers have been discovered (Mrózek,
Table 1. The primer sequencing used in QPCR for PAX5 copy number abnormalities.
Gene name Product length Tm(Cº) Primer sequence
PAX5 F1 170 64 5-ATCTTAACCTAGGCAGAGCATC-3
PAX5 R1 170 61 5-CAAGAGACACACCATTTGGG-3
PAX5 F2 164 62 5-CTCCTTCTTAGTATCTACGAG-3
PAX5 R2 164 60 5-GAACTCAAAGAAACTGTCTGG-3
GAPDH F 120 60 5 -CGGTGGATCCCTTTAATTG-3-3
GAPDH R 120 58 5 –CAATAAAGGGGATCCACCG-3
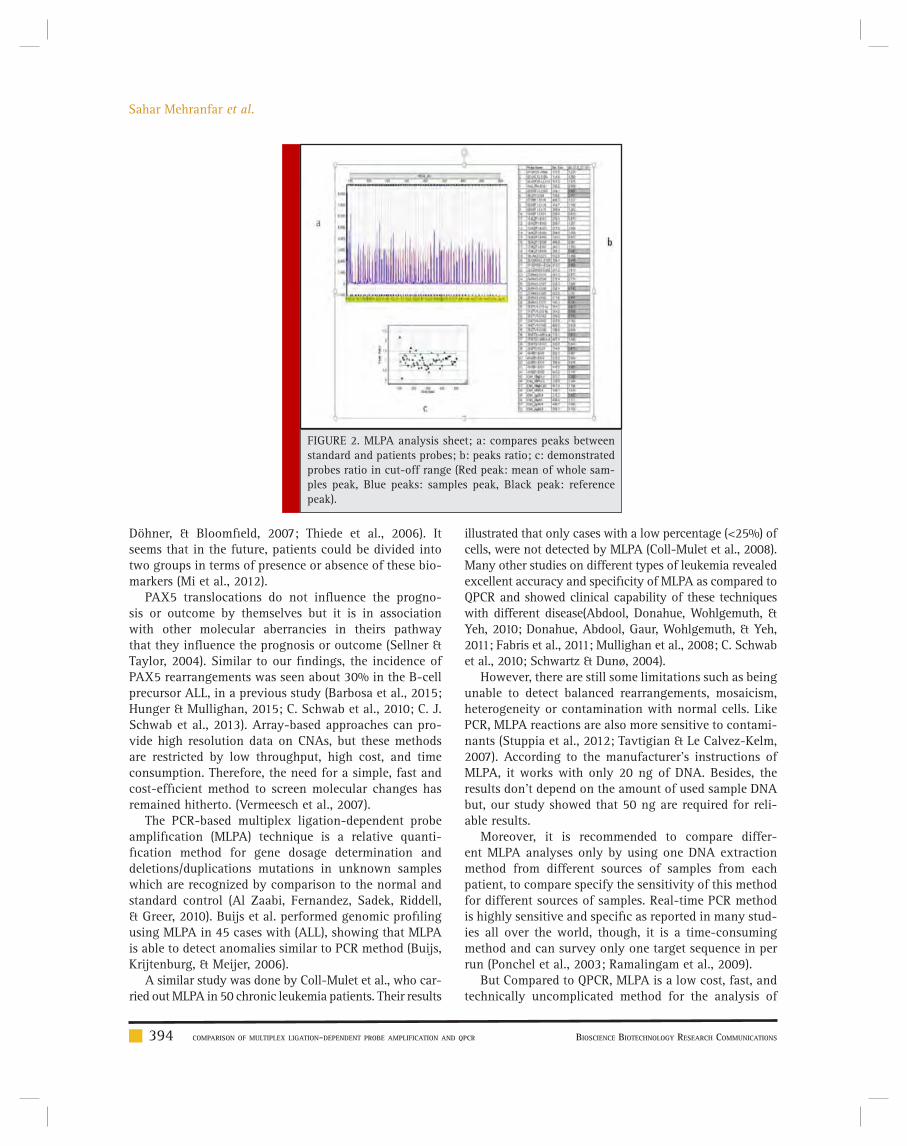
Sahar Mehranfar et al.
Döhner, & Bloomfi eld, 2007; Thiede et al., 2006). It seems that in the future, patients could be divided into two groups in terms of presence or absence of these bio-markers (Mi et al., 2012).
PAX5 translocations do not infl uence the progno-sis or outcome by themselves but it is in association with other molecular aberrancies in theirs pathway that they infl uence the prognosis or outcome (Sellner & Taylor, 2004). Similar to our fi ndings, the incidence of PAX5 rearrangements was seen about 30% in the B-cell precursor ALL, in a previous study (Barbosa et al., 2015; Hunger & Mullighan, 2015; C. Schwab et al., 2010; C. J. Schwab et al., 2013). Array-based approaches can pro-vide high resolution data on CNAs, but these methods are restricted by low throughput, high cost, and time consumption. Therefore, the need for a simple, fast and cost-effi cient method to screen molecular changes has remained hitherto. (Vermeesch et al., 2007).
The PCR-based multiplex ligation-dependent probe amplifi cation (MLPA) technique is a relative quanti-fi cation method for gene dosage determination and deletions/duplications mutations in unknown samples which are recognized by comparison to the normal and standard control (Al Zaabi, Fernandez, Sadek, Riddell, & Greer, 2010). Buijs et al. performed genomic profi ling using MLPA in 45 cases with (ALL), showing that MLPA is able to detect anomalies similar to PCR method (Buijs, Krijtenburg, & Meijer, 2006).
A similar study was done by Coll-Mulet et al., who car-ried out MLPA in 50 chronic leukemia patients. Their results
illustrated that only cases with a low percentage (<25%) of cells, were not detected by MLPA (Coll‐Mulet et al., 2008). Many other studies on different types of leukemia revealed excellent accuracy and specifi city of MLPA as compared to QPCR and showed clinical capability of these techniques with different disease(Abdool, Donahue, Wohlgemuth, & Yeh, 2010; Donahue, Abdool, Gaur, Wohlgemuth, & Yeh, 2011; Fabris et al., 2011; Mullighan et al., 2008; C. Schwab et al., 2010; Schwartz & Dunø, 2004).
However, there are still some limitations such as being unable to detect balanced rearrangements, mosaicism, heterogeneity or contamination with normal cells. Like PCR, MLPA reactions are also more sensitive to contami-nants (Stuppia et al., 2012; Tavtigian & Le Calvez-Kelm, 2007). According to the manufacturer’s instructions of MLPA, it works with only 20 ng of DNA. Besides, the results don’t depend on the amount of used sample DNA but, our study showed that 50 ng are required for reli-able results.
Moreover, it is recommended to compare differ-ent MLPA analyses only by using one DNA extraction method from different sources of samples from each patient, to compare specify the sensitivity of this method for different sources of samples. Real-time PCR method is highly sensitive and specifi c as reported in many stud-ies all over the world, though, it is a time-consuming method and can survey only one target sequence in per run (Ponchel et al., 2003; Ramalingam et al., 2009).
But Compared to QPCR, MLPA is a low cost, fast, and technically uncomplicated method for the analysis of
FIGURE 2. MLPA analysis sheet; a: compares peaks between standard and patients probes; b: peaks ratio; c: demonstrated probes ratio in cut-off range (Red peak: mean of whole sam-ples peak, Blue peaks: samples peak, Black peak: reference peak).
394 COMPARISON OF MULTIPLEX LIGATION-DEPENDENT PROBE AMPLIFICATION AND QPCR BIOSCIENCE BIOTECHNOLOGY RESEARCH COMMUNICATIONS

BIOSCIENCE BIOTECHNOLOGY RESEARCH COMMUNICATIONS COMPARISON OF MULTIPLEX LIGATION-DEPENDENT PROBE AMPLIFICATION AND QPCR 395
Sahar Mehranfar et al.
Table 2. Demographic data of acute lymphoblastic leukemia patients
Variable Frequency (Percent)
SexFemale 18(40%)
Male 27(60%)
Age
1-4 22(48%)
5-10 17(37%)
10-14 6(13%)
Mean of ageFemale 6.0 ±2.7
Male 5.8±3.4
NCI risk groupStandard risk 28(62%)
High risk 17(37%)
Source of samples
BM samples 19(42%)
PB samples 26(57%)
WBC count>50,000 11
<50,000 34
FIGURE 3. Schematic representation of the CNAs found in this study. PAX5 exons (1-10) are shown above. Numbers in the red shapes show the occurrence times for each rearrangement.
results. Moreover, in the future, MLPA could be applied to large CNAs screening. PCR and sequencing can be used for confi rming mutation only in selected gene seg-ments, but MLPA can be considered for screening a large area of genes, simultaneously.
CONCLUSION
Molecular screening is an essential test for comprehen-sive survey of disease, and provides complementary information for better diagnosis, treatment and follow-up of patients with acute leukemia. This approach may be useful as a criterion for measuring the effectiveness of new molecular tools such as genetic profiling. Con-sidering differences between two methods, more clini-cal studies are required to fi nd out the best one for our objectives. Our data clearly indicated that MLPA can be an attractive alternative method to other molecular and cytogenetic techniques that are now routinely used. Screening of critical genes in pathobiology of all cancers such as acute lymphoblastic leukemia could help early diagnosis in the early stages. It is especially useful when the inexpensive and available techniques are used eve-rywhere. It has been established that early diagnosis has a positive impact on the prognosis.

Sahar Mehranfar et al.
REFERENCES
Abdool, A ., Donahue, A. C., Wohlgemuth, J. G., & Yeh, C.-H. (2010). Detection, analysis and clinical validation of chro-mosomal aberrations by multiplex ligation-dependent probe amplifi cation in chronic leukemia. PLoS One, 5(10), e15407.
Al Zaabi, E. A., Fernandez, L. A., Sadek, I. A., Riddell, D. C., & Greer, W. L. (2010). Multiplex ligation-dependent probe ampli-fi cation versus multiprobe fl uorescence in situ hybridization to detect genomic aberrations in chronic lymphocytic leukemia: a tertiary center experience. The Journal of molecular diagnos-tics, 12(2), 197-203.
Barbosa, T. C., Terra-Granado, E., Magalhães, I. M. Q., Neves, G. R., Gadelha, A., Guedes Filho, G. E., . . . Pombo-de-Oliveira, M. S. (2015). Frequency of copy number abnormalities in com-mon genes associated with B-cell precursor acute lymphoblas-tic leukemia cytogenetic subtypes in Brazilian children. Cancer genetics, 208(10), 492-501.
Buijs, A., Krijtenburg, P. J., & Meijer, E. (2006). Detection of risk-identifying chromosomal abnormalities and genomic profi ling by multiplex ligation-dependent probe amplifi cation in chronic lymphocytic leukemia. Haematologica, 91(10), 1434-1435.
Busslinger, M. (2004). Transcriptional control of early B cell development 1. Annu. Rev. Immunol., 22, 55-79.
Carter, T. L., Watt, P. M., Kumar, R., Burton, P. R., Reaman, G. H., Sather, H. N., Kees, U. R. (2001). Hemizygous p16 INK4A deletion in pediatric acute lymphoblastic leukemia predicts independent risk of relapse. Blood, 97(2), 572-574.
FIGURE 4. The comparison of the results of 3 methods; a: sequenc-ing result, b: QPCR result, c: MLPA result.
Cobaleda, C., Schebesta, A., Delogu, A., & Busslinger, M. (2007). Pax5: the guardian of B cell identity and function. Nature immunology, 8(5), 463-470.
Coll‐Mulet, L., Santidrián, A. F., Cosialls, A. M., Iglesias‐Serret, D., De Frias, M., Grau, J., Domingo, A. (2008). Multiplex liga-tion‐dependent probe amplifi cation for detection of genomic alterations in chronic lymphocytic leukaemia. British journal of haematology, 142(5), 793-801.
Dona hue, A. C., Abdool, A. K., Gaur, R., Wohlgemuth, J. G., & Yeh, C.-H. (2011). Multiplex ligation-dependent probe amplifi -cation for detection of chromosomal abnormalities in myelo-dysplastic syndrome and acute myeloid leukemia. Leukemia research, 35(11), 1477-1483.
Fabr is, S., Scarciolla, O., Morabito, F., Cifarelli, R. A., Dininno, C., Cutrona, G., . . . Ciceri, G. (2011). Multiplex ligation‐depend-ent probe amplifi cation and fl uorescence in situ hybridization to detect chromosomal abnormalities in Chronic lymphocytic leukemia: A comparative study. Genes, Chromosomes and Cancer, 50(9), 726-734.
Fathi , A., Amani, F., & Bahadoram, M. (2015). Epidemiology of Childhood Cancer in Northwest Iran. Asian Pacifi c Journal of Cancer Prevention, 16(13), 5459-5462.
Fazel i, Z., Pourhoseingholi, M. A., Vahedi, M., Abadi, A., Bavand-Pour, F. S. F., & Baghestani, A. R. (2013). Leukemia cancer mortality trend in Iran, from 1995 to 2004. Iranian journal of cancer prevention, 6(3), 170.
Fazio , G., Biondi, A., & Cazzaniga, G. (2011). The Role of PAX5 in ALL: Citeseer.
396 COMPARISON OF MULTIPLEX LIGATION-DEPENDENT PROBE AMPLIFICATION AND QPCR BIOSCIENCE BIOTECHNOLOGY RESEARCH COMMUNICATIONS

BIOSCIENCE BIOTECHNOLOGY RESEARCH COMMUNICATIONS COMPARISON OF MULTIPLEX LIGATION-DEPENDENT PROBE AMPLIFICATION AND QPCR 397
Sahar Mehranfar et al.
Ginsb urg, G. S., & Willard, H. F. (2009). Genomic and person-alized medicine: foundations and applications. Translational research, 154(6), 277-287.
Hunge r, S. P., & Mullighan, C. G. (2015). Acute lymphoblas-tic leukemia in children. New England Journal of Medicine, 373(16), 1541-1552.
Kuipe r, R., Schoenmakers, E., Van Reijmersdal, S., Hehir-Kwa, J., van Kessel, A. G., Van Leeuwen, F., & Hoogerbrugge, P. (2007). High-resolution genomic profi ling of childhood ALL reveals novel recurrent genetic lesions affecting pathways involved in lymphocyte differentiation and cell cycle progres-sion. Leukemia, 21(6), 1258-1266.
Matth ias, P., & Rolink, A. G. (2005). Transcriptional networks in developing and mature B cells. Nature Reviews Immunol-ogy, 5(6), 497-508.
Mi, J ., Wang, X., Yao, Y., Lu, H., Jiang, X., Zhou, J. Tang, J. (2012). Newly diagnosed acute lymphoblastic leukemia in China (II): prognosis related to genetic abnormalities in a series of 1091 cases. Leukemia, 26(7), 1507-1516.
Mousa vi, S., Alamolhoda, A., Gouya, M., & Lickiss, N. (2008). Implementation of Comprehensive National Cancer Con-trol Program in Iran: an experience in a developing country. Annals of Oncology, 19(2), 398-400.
Mróze k, K., Döhner, H., & Bloomfi eld, C. D. (2007). Infl uence of new molecular prognostic markers in patients with karyotypi-cally normal acute myeloid leukemia: recent advances. Current opinion in hematology, 14(2), 106-114.
Mulligh an, C. G., Miller, C. B., Radtke, I., Phillips, L. A., Dal-ton, J., Ma, J., . . . Pui, C.-H. (2008). BCR–ABL1 lymphoblastic leukaemia is characterized by the deletion of Ikaros. Nature, 453(7191), 110-114.
O’neil, J., & Look, A. (2007). Mechanisms of transcription fac-tor deregulation in lymphoid cell transformation. Oncogene, 26(47), 6838-6849.
Ponchel , F., Toomes, C., Bransfi eld, K., Leong, F. T., Douglas, S. H., Field, S. L. Mighell, A. J. (2003). Real-time PCR based on SYBR-Green I fl uorescence: an alternative to the TaqMan assay for a relative quantifi cation of gene rearrangements, gene amplifi cations and micro gene deletions. BMC biotech-nology, 3(1), 1.
Ramalin gam, N., Liu, H.-B., Dai, C.-C., Jiang, Y., Wang, H., Wang, Q. Gong, H.-Q. (2009). Real-time PCR array chip with capillary-driven sample loading and reactor sealing for point-of-care applications. Biomedical microdevices, 11(5), 1007-1020.
Schmitt gen, T. D., Lee, E. J., & Jiang, J. (2008). High-through-put real-time PCR. Molecular Beacons: Signalling Nucleic Acid Probes, Methods, and Protocols, 89-98.
Schoute n, J. P., McElgunn, C. J., Waaijer, R., Zwijnenburg, D., Diepvens, F., & Pals, G. (2002). Relative quantifi cation of 40 nucleic acid sequences by multiplex ligation-dependent probe amplifi cation. Nucleic acids research, 30(12), e57-e57.
Schwab, C., Jones, L., Morrison, H., Ryan, S., Yigittop, H., Schouten, J., & Harrison, C. (2010). Evaluation of multiplex ligation‐dependent probe amplifi cation as a method for the detection of copy number abnormalities in B‐cell precursor acute lymphoblastic leukemia. Genes, Chromosomes and Can-cer, 49(12), 1104-1113.
Schwab, C . J., Chilton, L., Morrison, H., Jones, L., Al-Shehhi, H., Erhorn, A., . . . Harrison, C. J. (2013). Genes commonly deleted in childhood B-cell precursor acute lymphoblastic leukemia: association with cytogenetics and clinical features. Haematologica, haematol. 2013.085175.
Schwartz, M., & Dunø, M. (2004). Improved molecular diagno-sis of dystrophin gene mutations using the multiplex ligation-dependent probe amplifi cation method. Genetic testing, 8(4), 361-367.
Seiter, K. , Sarkodee-Adoo, C., Talavera, F., Sacher, R., & Besa, E. (2014). Acute lymphoblastic leukemia. Sarkodee-Adoo C, Talavera F, Sacher RA and Besa EC: Medscape Reference. WebMD. Accessed, 17.
Sellner, L . N., & Taylor, G. R. (2004). MLPA and MAPH: new techniques for detection of gene deletions. Human mutation, 23(5), 413-419.
Stuppia, L ., Antonucci, I., Palka, G., & Gatta, V. (2012). Use of the MLPA assay in the molecular diagnosis of gene copy number alterations in human genetic diseases. International journal of molecular sciences, 13(3), 3245-3276.
Tavtigian, S. V., & Le Calvez-Kelm, F. (2007). Molecular Diag-nostics: Methods and Limitations. Hereditary Breast Cancer, 179-205.
Thiede, C. , Koch, S., Creutzig, E., Steudel, C., Illmer, T., Schaich, M., & Ehninger, G. (2006). Prevalence and prognostic impact of NPM1 mutations in 1485 adult patients with acute myeloid leukemia (AML). Blood, 107(10), 4011-4020.
Vermeesch, J. R., Fiegler, H., de Leeuw, N., Szuhai, K., Schou-mans, J., Ciccone, R. Van Ravenswaaij, C. (2007). Guidelines for molecular karyotyping in constitutional genetic diagnosis. European Journal of Human Genetics, 15(11), 1105-1114.
Vogelstein , B., & Kinzler, K. W. (2004). Cancer genes and the pathways they control. Nature medicine, 10(8), 789-799.
Yang, Y. L ., Hung, C. C., Chen, J. S., Lin, K. H., Jou, S. T., Hsiao, C. C.Lin, S. R. (2011). IKZF1 deletions predict a poor prognosis in children with B‐cell progenitor acute lymphoblastic leuke-mia: A multicenter analysis in Taiwan. Cancer science, 102(10), 1874-1881.

Health Science CommunicationBiosci. Biotech. Res. Comm. 10(3): 398-403 (2017)
Effect of educational intervention based on health
promotion model (HPM) on promoting behavior in safe
delivery among Afghani pregnant women refugees in
Sirjan, Iran
Reza Sadeghi1, Mostefa Shamsi2, Fatemeh Baghernezhad Hesary3 and Victoria Momenabadi4* 1PhD Candidate Scholar of Health Education and Health Promotion, Sirjan Faculty of Medical Sciences, Kerman University of Medical Sciences (KMU), Kerman, Iran2MSc in Health Services Administration, Kerman University of Medical Sciences, Kerman, Iran3PhD Candidate Scholar of Health Education and Promotion, Social Determinates of Health Research, Birjand University of Medical Sciences, Birjand, Iran 4PhD Candidate Scholar of Health Education and Health Promotion, Department of Health Education and Health Promotion, Faculty of Public Health, Shiraz University of Medical Sciences, Shiraz, Iran
ABSTRACT
Health promotion behaviors can promote physical and psychological health in individuals and population, especially in Afghan Preg-nant Women. Therefore, this study performed to recognize the Effect of Educational intervention Based on Health Promotion Model (HPM) on promoting behavior in Safe Delivery among Afghan Pregnant Women in Sirjan city, 2016. This was a quasi- experimental study. 120 Pregnant Afghan Women attending health centers in Sirjan city were selected to participate in this study: (60 in intervention group and 60 in control group). The intervention was conducted over two sessions in 60 minutes. Data were collected by a validated and reliable questionnaire (39 questions) before intervention and three months after intervention. Data was analyzed by chi-square, Fisher’s exact, paired t-test and independent t-test. The average scores of both groups indicated that health-promoting behavior, perceived self-effi cacy, perceived barriers, perceived benefi ts, perceived social support and interpersonal norms, had no meaningful differences before the intervention. But after education, the average scores of all variables increased meaningfully in the intervention group (P<0.001). But, there was no increase or signifi cant difference in the control group. HPM was effective in educating Afghan Pregnant Women. Therefore, it is suggested that HPM can be used to improve the safe delivery in Afghan women.
KEY WORDS: HEALTH PROMOTION MODEL, AFGHAN PREGNANT WOMEN, SAFE DELIVERY, SIRJAN
398
ARTICLE INFORMATION:
*Corresponding Author: [email protected] 12th June, 2017Accepted after revision 10th Sep, 2017 BBRC Print ISSN: 0974-6455Online ISSN: 2321-4007 CODEN: USA BBRCBA
Thomson Reuters ISI ESC and Crossref Indexed Journal NAAS Journal Score 2017: 4.31 Cosmos IF: 4.006
© A Society of Science and Nature Publication, 2017. All rights reserved.Online Contents Available at: http//www.bbrc.in/DOI: 10.21786/bbrc/10.3/10

Reza Sadeghi et al.
INTRODUCTION
Maternal and infant mortality due to complications of pregnancy is a very important health indicator. What-ever the percentage of deliveries in non-sanitary and out-of-hospital increase, the mortality rate of infants and pregnant women and neonatal tetanus infection will increase too (Wax et al., 2010). Great deals of investment have been spent to reduce maternal and infant mortality rate and to reach the World Health Organization goal in the country, and also maternity and childbirth facilities have been built in various parts of Iran (Karyani et al., 2015).
One of the most vulnerable groups in this regard is refugees Afghan pregnant women. Decades of war and internal confl ict in Afghanistan has led to migrate a large number of Afghans to neighboring countries, including Iran. One of the problems of these immigrants in Iran is the high rates of non-safe and non-sanitary delivery despite the availability of maternity facilities (Kalafi et al., 2002). Even in the Sirjan city in spite of the existence of maternity and women’s specialists and well-equipped midwifery, 67% of Afghan women deliver babies at home in unsanitary conditions and by non-specialists, while this rate of giving birth at home is only 1% in developed countries (Sadeghi et al., 2015b). But in some developing countries, this ratio reaches to 50% or even more (Gloyd et al., 2001).
In the different studies, several reasons have been mentioned for giving birth at home, including high cost of delivery in the hospital, Fear of the hospital, hus-band’s opposition, wrong culture, mother’s emotional support at home and fear of cesarean section (Salehi and Pour, 2002).
The changing of this risky behavior in Afghan pregnant women requires proper education. The value of education depends on its Effectiveness and chang-ing or creation of health behaviors, which is possible with the proper use of theories and educational models (Glanz et al., 2008). Theories identify the main factors that had infl uenced in question behaviors, specify the relationships between these factors, and outline the cir-cumstances, the manner and the time of the occurrence of these relationships. Therefore, theories are useful in identifying the elements that should be considered as the main axis of interventions (Sadeghi et al., 2016). Health Promotion Pender Model is one of the comprehensive and predictive models which is used to study the health promoting behaviors and provides a theoretical frame-work for discovering affected factors in these behaviors (Pender, 2011).
The determinants of health promotion behaviors con-cepts in this model include: 1) individual experiences and Characteristics, 2) emotions and behavioral specifi c
cognition, and 3) behavioral outcomes. The concept of individual experiences and Characteristics is a concept that directly or indirectly infl uences on the behaviors through cognition and behavioral emotions, including personal factors and previous related behaviors. While the concept of cognition and behavioral specifi c emo-tions directly infl uence on the behaviors and include constructs such as perceived benefi ts and barriers, per-ceived self-effi cacy, behavioral emotions, interpersonal infl uences, and situational infl uences (Pender, 2011).
Professor Pender has identifi ed models that have infl uenced on explanation of behavior in over 50% of the researches, including personal factors (perceived health status), perceived benefi ts, perceived barriers, perceived self-effi cacy and interpersonal infl uences (Social support) (Pender, 2011).
Several studies have confi rmed the effectiveness of this model. In this regard, a study by Morowati Shari-fabad et al aimed at optimizing the health promotion model indicated that perceived self-effi cacy was the most important determinant of health promotion behav-iors and also perceived religious support was directly and indirectly have been effective by infl uencing on perceived self-effi cacy, perceived benefi ts, perceived barriers, and perceived importance of health promotion behaviors (Morowati et al., 2005). The results of Magli-one et al. showed that individuals with higher levels of social support, self-effi cacy and with commitment of planning are more physically active (Maglione and Hayman, 2009). Considering the importance of the safe delivery and due to the high rate of delivery at Afghani homes; it seems that a similar study has not done in this regard. Therefore, the present study aimed to investigate the effect of educational intervention using the health promotion model in promoting behavior of Safe delivery among refugees Afghan Pregnant Women in Sirjan city in 2016.
MATERIALS AND METHODS
This quasi- experimental study was conducted in 2016. The research environment was the health centers of Sir-jan city and the study population was Afghani preg-nant women. Subjects were selected by simple random sampling. The sample size was calculated by using the ratio difference formula by considering the confi dence level of 95%, a power of 80%, and about 3/3 differences in score before and after the intervention with a stand-ard deviation of 7 and 52 subjects in per group, but the sample size was fi nally calculated as 60 subjects with consideration of 10 percentage of possible number of subjects dropping out in each group (Mohammadipour et al., 2015).
BIOSCIENCE BIOTECHNOLOGY RESEARCH COMMUNICATIONS EFFECT OF EDUCATIONAL INTERVENTION BASED ON HEALTH PROMOTION MODEL 399

Reza Sadeghi et al.
The subjects were selected based on the inclusion cri-teria which were as follows: Afghans, being pregnant in the third up to fi fth month and resident of Sirjan city; the exclusion criteria were: without chronic disease such as pregnancy diabetes and high blood pressure, non-residence until the end of pregnancy and unwilling to participate in the study. Data collection tool was a self-administered questionnaire. The questionnaires were set anonymously and encoded and were arranged in three parts. The fi rst part contains the demographic character-istics including 5 questions about age, education, occu-pation, number of pregnancies, and residence. The sec-ond part was related to the evaluation of the structures of the Pender Health Promotion Model. This part contains seven questions for perceived benefi ts, seven questions of perceived barriers, seven questions of perceived self-effi cacy, six questions of perceived interpersonal norms, and six questions of perceived social support structures. The third part was related to the measurement of safe delivery behavior. The questions were scored as follows. questions about perceived benefi ts, perceived barriers, perceived self-effi cacy, interpersonal norms and per-ceived social support were scored 1-3 by Likert’s trilogy scale as agree (score 3) to disagree (score 1), The range of scores for perceived benefi ts, perceived barriers and perceived self-effi cacy were from 7 to 21 and for inter-personal norms and perceived social support was from 6 to 18. Also, the assessments of safe delivery behavior were of yes/no type questions.
In this research the analyzing the validity of the con-tent method was used for the analyzing the validity of the questionnaires. The questionnaire was approved by healthcare professionals to examine the issue’s compre-hensiveness. The re-test method was also used in the distance of 2 weeks to determine the reliability of the study. The correlation coeffi cient has calculated between the two-time responses as follows, for perceived benefi ts, 0.79, perceived barriers, 0. 77, perceived self-effi cacy, 0.74, perceived interpersonal norms, 0.84 and perceived social support, 0.81.
The method was as follows the researchers randomly divided subjects into intervention and control groups after the selection them based on inclusion criteria. At fi rst, the pre-test questionnaire was completed by the interviewer, then the education program was conducted for the intervention group. Educational content included the defi nition of pregnancy, maternity care, and also the benefi ts of safe delivery.The educational program was conducted for four groups of 15 subjects (60 subjects in intervention group), which consisted of two, one-hour training sessions in a one-month interval that were held in a lecture and group discussion. Also, an indi-vidual counseling was held for a pregnant woman and their family. The educational classes were held in health
centers and health care homes. After three months of conducting the classes, post-test questionnaires were completed by the researcher for the patients in the inter-vention and control groups.
The current research has been approved by the Eth-ics Committee of the Kerman University of medical sci-ences (ethics code: IR.KMU. REC. 1396.11). All the par-ticipants were voluntarily and consciously participated in the study and they were given the assurance that the information has been collected only in order to be used for research and will remain confi dential and the written testimonial had been gotten from all of the participants in order to participate in the study. Meanwhile, although the control group was not under educational interven-tion, but after completing the post-test, educations were provided to them with the same quantity and quality.
Data were analyzed by using Chi-square, Fisher’s exact test, independent t-test and paired t-test through SPSS version 16. The signifi cance level was considered less than 0.05.
RESULTS AND DISCUSSION
In this study, 120 participants were randomly divided into two groups, intervention (n = 60) and control (n = 60) then the mean and standard deviation of the ages of subjects in the study and control groups were analyzed and they were respectively 24.83 ± 9.43 and 25.12 ± 9.26 years old. This difference based on independent t-test did not show signifi cant differences in both intervention and control groups (P = 0.426). Also other demographic characteristics of the population did not show any sig-nifi cant differences between the two groups (Table 1).
The results showed that there wasn’t any signifi cant difference between the mean scores of perceived ben-efi ts, perceived barriers, perceived self-effi cacy, inter-personal norms and perceived social support before the intervention in the intervention and control groups, but after the intervention, the differences were signifi cantly clear and Scores were increased (Table 2).
The statistical results showed that in the study group, there was a signifi cant increase between the mean scores of perceived benefi ts, perceived barriers, perceived self-effi cacy, interpersonal norms and perceived social sup-port before and after the intervention, and also the educational intervention was effective (Table 3) .
The results also showed that the safe delivery behav-ior in the intervention group have increased from 23% to 57% after the educational intervention.
Afghan women carry out childbirth at home and in unhealthy conditions, due to traditional beliefs and mis-conceptions of them and their followers, which unfor-tunately can lead to the death of mother or infant and may lead to complications such as neonatal tetanus.
400 EFFECT OF EDUCATIONAL INTERVENTION BASED ON HEALTH PROMOTION MODEL BIOSCIENCE BIOTECHNOLOGY RESEARCH COMMUNICATIONS

BIOSCIENCE BIOTECHNOLOGY RESEARCH COMMUNICATIONS EFFECT OF EDUCATIONAL INTERVENTION BASED ON HEALTH PROMOTION MODEL 401
Reza Sadeghi et al.
Table 1. Comparing some variables among the refugees Afghan Pregnant Women in Sirjan city in the control and intervention groups
Variableintervention Group(n= 60) Number (%)
Control Group(n= 60) Number (%)
*p-value
OccupationHousewife 55 (50.4) 54 (49.6)
0.251Employed 5 (45.4) 6 (54.6)
Pregnancy statusFirst pregnancy 12 (52.1) 11 (47.9)
0.925More than one pregnancy 48 (49.4) 49 (50.6)
EducationLiterate 10 (47.6) 11 (52.4)
0.712illiterate 50 (50.5) 49 (49.5)
ResidenceCity 28 (49.1) 32 (50.8)
0.283Village 29 (50.9) 31 (49.2)
*Chi-square test
Table 2. The mean scores of refugees Afghan Pregnant Women in Sirjan between the control and intervention groups regarding Safe Delivery before and after the intervention
Before intervention (n=60)
p-value*
After intervention (n=60)
p-value*Intervention group Mean± SD
Control group Mean± SD
Intervention group Mean± SD
Control group Mean± SD
perceived benefi ts 12.14±2.21 11.94±1.87 0.212 18.42±0.64 12.02±1.56 <0.001
Perceived barriers 18.82±2.72 18.41±3.09 0.367 14.77±1.46 18.25±3.11 <0.001
perceived self-effi cacy 12.94±3.23 12.64±4.37 0.055 17.18±1.39 12.29±3.85 <0.001
interpersonal norms
10.19±2.61 10.71±2.83 0.412 14.21±1.67 11.14±2.78 <0.001
perceived social support 7.24±2.43 7.58±2.67 0.216 14.12±3.73 7.68±2.83 <0.001
*Independent t-test
Table 3. The comparison of the variables. The mean scores of refugees Afghan Pregnant Women in Sirjan between the control and intervention groups regarding Safe Delivery before and after the intervention
Intervention group (n=60)
p-value*
Control group (n=60)
p-value*Before InterventionMean± SD
After intervention Mean± SD
Before Intervention Mean± SD
After intervention Mean± SD
perceived benefi ts 12.14±2.21 18.42±0.64 <0.001 11.94±1.87 12.02±1.56 0.021
Perceived barriers 18.82±2.72 14.77±1.46 <0.001 18.41±3.09 18.25±3.11 0.424
perceived self-effi cacy
12.94±3.23 17.18±1.39 <0.001 12.64±4.37 12.29±3.85 0.356
interpersonal norms 10.19±2.61 14.21±1.67 <0.001 10.71±2.83 11.14±2.78 0.172
perceived social support
7.24±2.43 14.12±3.73 <0.001 7.58±2.67 7.68±2.83 0.481
*Paired t-test

402 EFFECT OF EDUCATIONAL INTERVENTION BASED ON HEALTH PROMOTION MODEL BIOSCIENCE BIOTECHNOLOGY RESEARCH COMMUNICATIONS
Reza Sadeghi et al.
Therefore, in order to control this important and fun-damental dilemma, we evaluated the relevant train-ing based on the health promotion model to promote safe delivery behavior.The fi ndings showed signifi cant increase in the safe and hygienic delivery of Afghan women from 23% to 57% in Sirjan city.
In the health promotion model, in the intervention group, all of the constructs of the model showed signifi -cant differences after the intervention.
In the health promotion model, perceived benefi ts are as a direct stimulus action of behavior and the adop-tion of an action to prevent the problem or action on a health behavior are dependent on its perceived benefi ts (Pender, 2011). The most important perceived benefi ts of safe delivery of Afghan pregnant women respectively included the baby’s health, their health, and the pre-vention of unwanted childhood complications at home. In the present study, the average of perceived ben-efi ts scores of patients in the intervention group has increased signifi cantly than in the control group after the education, which was consistent with the results of similar studies (Morovati, 2007, Leslie et al., 2000, Sad-eghi et al., 2014). But the results of the study of Ghaffari et al was inconsistent to the present study and did not indicate an increase in the average score of perceived benefi ts (Ghafari, 2007).
In the present study, fi nancial problems, lack of medical insurance and lack of access to facilities were respectively the most important obstacles in the target group. The signifi cant reduction in the average score of perceived barriers after educational intervention and inter-sectional collaboration in the health care sys-tem indicates that the education has a positive effect on removing the perceived barriers in the intervention group. The studies of Nowroozi et al. (Noroozi et al., 2011) and Karimi et al. (Karimi and Eshrati, 2012), which were conducted with this model, indicate that educa-tional intervention are effective in reducing perceived barriers.
Self-effi cacy is referred to a person’s confi dence to his ability in performing an action (Bandura, 2006). In the present study, the average of self-effi cacy score of the experimental group after the intervention was signifi -cantly increased, which were consistent with the studies of Morowati et al. (Morowati et al., 2005) and Sadeghi et al. (Sadeghi et al., 2015a), but they contradicted by the fi ndings of Kinsler et al. (Kinsler et al., 2004).
Also, in the study, after the education, the aver-age scores of the interpersonal norms of the interven-tion group were signifi cantly higher than in the con-trol group, which was consistent with the results of the studies of Chenari et al (Chenary et al., 2013) and Nos-ratabadi et al (Nosratabadi et al., 2015). In the present study, perceived social support was considered as the
most important determinant of the behavior of delivery at home, which this issue was arisen from the infl uences of family and relatives on this unhealthy behavior. But after educational sessions for the participants and their relatives, the average score in the intervention group was signifi cantly higher than in the control group, which is consistent with the results of conducted studies with this model (Lusk et al., 1997, Norouzi et al., 2010). Accord-ing to this research and the fi ndings, it is suggested that a precise educational program should be carried out based on the health promotion model for Afghan preg-nant women, their spouses and their relatives, and plan-ners should train them by using individual and group educational methods, in order to solve their fi nancial and health problems, and to prevent the risks of unsafe deliveries at home.
One of the limitations of this study was the problem of Afghan women’s language and their accent, which was solved by Afghan inquirer and educator, as well as Unwillingness of some of the women to participate in the study, which it was solved by convincing them through local clerks and Afghan elders. Another limita-tion of the study was the fi nancial and insurance prob-lems of Afghan women, which it was reduced by inter-agency co-ordinations.
CONCLUSION
The results of this study indicates the impact of educa-tional intervention based on the health promotion model on increasing the safe delivery of pregnancy in Afghan pregnant women in Sirjan city. education and interven-tion based on the health promotion model is helpful and effective to enhance awareness, to change the attitude and to adopt preventive behaviors for unsafe delivery at home.
ACKNOWLEDGMENTS
Researchers acknowledge the Faculty of Medical Sci-ences Research Committee of Sirjan city and Research Deputy of Kerman medical university, related staffs in health centers of Sirjan as well as all Afghan pregnant women who are participating in this study.
AUTHORS’ CONTRIBUTIONS
RS helped design the study, carried out data collection, data analysis, and drafted the manuscript. VM carried out the statistical analysis and interpretation. MS con-ceived the study, supervised the data collection and analyses, and helped draft the manuscript. BB edited and commented on the fi nal draft. All authors read and approved the fi nal manuscript.

BIOSCIENCE BIOTECHNOLOGY RESEARCH COMMUNICATIONS EFFECT OF EDUCATIONAL INTERVENTION BASED ON HEALTH PROMOTION MODEL 403
Reza Sadeghi et al.
CONFLICT OF INTEREST
The authors declare no confl icts of interest.
REFERENCE S
bandura, A. 2006. Guide For Constructing Self-Effi cacy Scales. Self-Effi cacy Beliefs Of Adolescents, 5.
Chenary, R Noroozi, A. & Tahmasebi, R 2013. Effective Fac-tors Of Health Promotion Behaviors Based On Health Promo-tion Model In Chemical Veterans Of Ilam Province In 2012-13. Www. Sjimu. Medilam. Ac. Ir, 21, 257-267.
Ghafari, M. 2007. Comparing The Effi cacy Of Health Belief Model And Its Integrated Model In Aids Education Among Male High School Students In Tehran. A Thesis For Degree Of Phd, Tehran: Tarbiat Modares University.
Glanz, K., Rimer, B. K. & Viswanath, K. 2008. Health Behavior And Health Education: Theory, Research, And Practice, John Wiley & Sons.
Gloyd, S., Floriano, F., Midwife, M. S., Chadreque, M. A., Nyangezi, J. M. & Platas, A. 2001. Impact Of Traditional Birth Attendant Training In Mozambique: A Controlled Study. Jour-nal Of Midwifery & Women’s Health, 46, 210-216.
Kalafi , Y., Hagh-Shenas, H. & Ostovar, A. 2002. Mental Health Among Afghan Refugees Settled In Shiraz, Iran. Psychological Reports, 90, 262-266.
Karimi, M. & Eshrati, B. 2012. The Effect Of Health Promotion Model-Based Training On Promoting Students’ Physical Activ-ity. Journal Of Kermanshah University Of Medical Sciences (J Kermanshah Univ Med Sci), 16, 192-200.
Karyani, A. K., Azami, S. R., Rezaei, S., Shaahmadi, F. & Ghaz-anfari, S. 2015. Geographical Distribution Of Gynecologists And Midwives In Kermanshah Province (2008-2013). Journal Of Kermanshah University Of Medical Sciences (J Kermanshah Univ Med Sci), 19, 294-302.
Kinsler, J., Sneed, C. D., Morisky, D. E. & Ang, A. 2004. Evalu-ation Of A School-Based Intervention For Hiv/Aids Prevention Among Belizean Adolescents. Health Education Research, 19, 730-738.
Leslie, E., Fotheringham, M., Owen, N. & Veitch, J. 2000. A Uni-versity Campus Physical Activity Promotion Program. Health Promotion Journal Of Australia: Offi cial Journal Of Australian Association Of Health Promotion Professionals, 10, 51.
Lusk, S. L., Ronis, D. L. & Hogan, M. M. 1997. Test Of The Health Promotion Model As A Causal Model Of Construction Workers’ Use Of Hearing Protection.
Maglione, J. L. & Hayman, L. L. 2009. Correlates Of Physical Activity In Low Income College Students. Research In Nursing & Health, 32, 634-646.
Mohammadipour, F., Izadi, T. A., Sepahvand, F. & Naderifar, M. 2015. The Impact Of An Educational Intervention Based On
Pender’s Health Promotion Model On The Lifestyle Of Patients With Type Ii Diabetes.
Morovati, M. 2007. The Effectiveness Of Modifi ed Health Pro-motion Model In Change Of Health Promotion Behaviors In The Yazd Elderly. Tehran: Tarbiat Modares University.
Morowati, S., Ghofranipour, F., Hidarnia, A. & Babaee-Ruchi, G. 2005. Modifi cation Of Health Promotion Model And Its Application Together With Adult Education Theory In Chang-ing Health Promoting Behaviors Of Older Adults In Yazd. J Med Tarbiat Modares U-Ni, 21, 54-8.
Noroozi, A., Tahmasebi, R. & Ghofranipour, F. 2011. Effect Of Health Promotion Model (Hpm) Based Education On Physical Activity In Diabetic Women. Iranian Journal Of Endocrinology And Metabolism, 13, 361-367.
Norouzi, A., Ghofranipour, F., Heydarnia, A. & Tahmasebi, R. 2010. Determinants Of Physical Activity Based On Health Promotion Model (Hpm) In Diabetic Women Of Karaj Diabetic Institute. Ismj, 13, 41-51.
Nosratabadi, M., Halvaiepour, Z. & Sadeghi, R. 2015. Exploring The Relationship Between Social Capitals, And Social Support With Mother’s Health In Mothers Referring To Health Centers Of Sirjan City: A Structural Model. Journal Of Urmia Nursing And Midwifery Faculty, 13, 781-790.
Pender, N. J. 2011. Heath Promotion Model Manual.
Sadeghi, R., Khanjani, N., Hashemi, M. & Movagheripour, M. 2014. Using Health Belief Model To Prevent Skin Cancer Among Farmers. Iranian Journal Of Health Education And Health Promotion, 2, 215-222.
Sadeghi, R., Mazloomy, S., Hashemi, M. & Rezaeian, M. 2016. The Effects Of An Educational Intervention Based On The Health Belief Model To Enhance Hiv-Preventive Behaviors Among Male Barbers In Sirjan. Journal Of Rafsanjan Univer-sity Of Medical Sciences, 15, 235-246.
Sadeghi, R., Rezaeian, M., Khanjani, N. & Iranpour, A. 2015a. The Applied Of Health Belief Model In Knowledge, Attitude And Practice In People Referred For Diabetes Screening Pro-gram: An Educational Trial. Journal Of Rafsanjan University Of Medical Sciences, 13, 1061-1072.
Sadeghi, R., Rezaeian, M. & Mohseni, M. 2015b. The Effect Of An Educational Program Based On Basnef Model On Breast Self-Examination Practice Of 20-45-Year-Old Women In Sir-jan City: A Training Trial Study.
Salehi, M. & Pour, Z. G. 2002. Reasons For Zahedan’s Women For Not Referring To Delivery Ward For Child Delivery. Journal Of Reproduction & Infertility, 3.
Wax, J. R., Lucas, F. L., Lamont, M., Pinette, M. G., Cartin, A. & Blackstone, J. 2010. Maternal And Newborn Outcomes In Planned Home Birth Vs Planned Hospital Births: A Metaanaly-sis. American Jo urnal Of Obstetrics And Gynecology, 203, 243. E1-243. E8.

Agricultural CommunicationBiosci. Biotech. Res. Comm. 10(3): 404-409 (2017)
Effect of soil tillage systems on chickpea yield and
moisture of soil
Saeed Salehi1*, Asad Rokhzadi2, Abdulwahab Abdolahi3, Khosro Mohammadi4 and Ghorban Nourmohammadi5
1,2,4Department of Agronomy, College of Agriculture, Sanandaj Branch, Islamic Azad University, Sanandaj, Iran3Dyland Agricultural Research Institute, Sararood branch, Agricultural Research, Education and Extension Organization (AREEO), Kermanshah, Iran5Department of Agronomy, Science and Research Branch, Islamic Azad University, Tehran, Iran
ABSTRACT
Sustainable agriculture is now considered as an important factor in the development of modern agriculture. Sustainable agriculture emphasizes the long-term yield stability with the least adverse impact on the environment. So tillage is a very important factor in agricultural economics. The aim of this study was to investigate the effect of tillage on chickpea yield in split strip plots based on a randomized complete block design with three replications in two growing years of 2014-2015 and 2015-2016 in Mahidasht located in Kermanshah. In this research, it was found that in the fi rst year, the results of analysis of variance showed that the effect of tillage was signifi cant only on grain yield at 5% level. However, the effect of tillage on moisture content was not signifi cant in the studied properties. In the second year of experiment, the tillage factor also had a signifi cant effect on grain yield, biological yield, and moisture content at the depth of 0-20 cm at 5% level, and it was signifi cant on moisture content at the depth of 20-40 cm at second phase at 1% level. Since the yield of the crop was lower in no tillage than in other cases, but the use of no tillage has caused that there is no place for agricultural equipment and machinery in the farm which caused density in soil. It should be noted that these machines and equipment are so expensive,this issue is very important in economic terms; therefore, the use of no tillage system is proposed.
KEY WORDS: NO TILLAGE, LOW TILLAGE, CONVENTIONAL TILLAGE, MOISTURE, CHICKPEA
404
ARTICLE INFORMATION:
*Corresponding Author: [email protected] 12th June, 2017Accepted after revision 14th Sep, 2017 BBRC Print ISSN: 0974-6455Online ISSN: 2321-4007 CODEN: USA BBRCBA
Thomson Reuters ISI ESC and Crossref Indexed Journal NAAS Journal Score 2017: 4.31 Cosmos IF: 4.006
© A Society of Science and Nature Publication, 2017. All rights reserved.Online Contents Available at: http//www.bbrc.in/DOI: 10.21786/bbrc/10.3/11

Saeed Salehi et al.
BIOSCIENCE BIOTECHNOLOGY RESEARCH COMMUNICATIONS EFFECT OF SOIL TILLAGE SYSTEMS ON CHICKPEA YIELD AND MOISTURE OF SOIL 405
INTRODUCTION
In today’s world, agriculture has faced the enormous challenges; soil erosion signifi cantly reduces the yield of crops.Shortage of water and an increase in the price of fuel and fertilizer will increase production costs. Increasing demand for food as a result of the unprec-edented growth of the population in recent decades has created a major challenge for researchers in the agri-cultural sector. The limitation of susceptible lands has caused that most of the strategies have not been led to increase yields per unit area Beans are one of the nutrient food for human and animal. In the agricultural systems of the world in rotation with other crops and nitrogen fi xation, atmosphere in co-existence with bac-teria provides the major part of the nitrogen needed for the next crops, (Sadeqipour, 2005, Goldani and Rezvani Moqaddam, 2007 and Afzali and Javaheri, 2013).
Soil tillage affects the important properties of soil such as temperature, moisture, and soil density. Thus, the cor-rect use of tillage system can be the suitable strategy for plant growth and the optimal yield. The conventional till-age prepare artifi cial bed for the plant growth through the breakdown of soil impermeable layers, cleansing of soil surface from plant debris and discontinuing the life cycle of weeds, insects and diseases. But these systems not only require a lot of energy, but also, in the long run, these may destroy the physical properties of the soil and erode it. While water permeability in soil increases in low tillage systems due to increased organic matter and earthworm activity compared with conventional tillage system. Also, the use of low tillage systems and soil freeze will reduce the cost of energy consumption, reduce erosion and soil degradation, (Habibzadeh, 2006, Rasouli and Abbaspour, 2008 and Heidari, 2011).
Tillage operations are an inseparable part of the crop production cycle. The purpose of the tillage operation is the primary and main work on the soil, which is planned to reduce soil resistance, cover vegetation cover, and homogenizing its structure (Shafi ei, 1992; Shafi ei, 1995). According to Papendick and Parr (1997), due to organic matter depletion in dryland areas, the agricultural sys-tem will not be sustainable based on conventional tillage. Chen et al. (2006) concluded that the lack of moisture in the surface layers of the soil may cause the plant derives its moisture from the deeper layers of the soil that the essential nutrients are low. Thus, the plant suffers from nutrient stress; the sum of these factors reduces the plant size and existing photosynthetic reserves to fi ll the pods, and ultimately, it reduces the plant’s yield.
Chassot et al. (2011) found that the surface of soil in no tillage is usually colder and wetter, and bulk densityis higher than conventional tillage. This has had an effect on the growth of chickpea root and the absorption of
nutrients. Amini and Movahedi Naeini (2013) concluded that reducing the yield of products in no tillage system is directly affected by more mechanical soil resistance or lack of moisture and access to nutrients. By increasing the special surface of soils and thinning of clay soils, their cement property is strengthened and the mechani-cal strength of the soil increases. Even in wet condi-tions, the soil of the test site with a high surface has a high mechanical strength because, due to the fi neness of the clay, the velocity of infl ation and its equilibrium are very slowly absorbed by the waterwhich leads to a clogging between the soil components and mechanical strength. Long-term studies in the semi-arid region of the United States regarding fi eld management by using conventional tillage, no tillage, and low tillage meth-ods indicated that the weed control in no tillage system using herbicides only increased the wheat grain yield and the soil moisture. The yield of tillage is in the mid-dle of the conventional and no tillage systems (Norwood and Currie, 1997).
MATERIAL AND METHODS
This research was carried out in dryland conditions in two separate experiments for chickpea in split plots (split plow split plots) based on a randomized complete block design with three replications in two growing years of 2014-2015 and 2015-2016 in Mahidshat which is located in Kermanshah. Three levels of tillage include: 1- conventional tillage (moldboard plowing), 2- low till-age (chisel plowing) and 3- no tillage. The experiment is carried out in a fi eld that was cultivated the previous year. The area of each experimental plot (5 x 10 m) is 50 square meters and each replicate includes 18 sub plots and the distance is 10 meters to allow the tractor to pass. The total number of plots in this experiment will be 108. The amount of soil organic matter is measured before and after the project at a depth of 0-20 cm. To determine the percentage of soil moisture content at fl owering time and harvesting, samples were taken from the depth of 0-20 cm and 20-40 cm. In the beginning of April, weeds are removed manually.
RESULTS AND DISCUSSION
Analysis of variance showed that the effect of tillage was signifi cant on yield only at 5% level. However, the effect of tillage on moisture content was not signifi cant in any of the traits (Table 4-1).
SECOND YEAR EXPERIMENT OF CHICKPEA
In the second year of experiment, the effect of tillage was signifi cant on grain yield, biological yield, moisture

Saeed Salehi et al.
406 EFFECT OF SOIL TILLAGE SYSTEMS ON CHICKPEA YIELD AND MOISTURE OF SOIL BIOSCIENCE BIOTECHNOLOGY RESEARCH COMMUNICATIONS
Table 4.1. Analysis of variance of the fi rst year to investigate the effects of tillage onchickpea
Mean of squares
Sources of changes df
Weight of 100 seeds
Number of pods per square meter
Number of seeds per pods
Grain yield
Biological yield
Replication 2 1.00 22.67 7.25 21072 224437
Error 1 4 2.02 5.77 1.64 11207 35285
Tillage 2 1.66 46.07 0.89 51799* 210352
Error 2 4 0.39 9.55 1.09 5820 232341
*and **indicate the signifi cance level at 1 and 5, respectively.
Table 4.2. Analysis of variance of the fi rst year to investigate the effects of moisture on chickpea
Mean of squares
Sources of changes df
Moisture content at the depth of 0-20
cmphase 1
Moisture contentat the depth of 20-40
cmphase 1
Moisture content at the depth of
0-20 cm phase 2
Moisture content at the depth of
20-40 cmphase 2Replication 2 3.21 19.17 8.42 55.68
Error 1 4 0.50 2.72 2.19 16.99
Tillage 2 2.97 0.41 3.28 0.96
Error 2 4 1.36 0.91 1.51 1.66
*and **indicate the signifi cance level at 1 and 5, respectively.
Table 4.3. Analysis of variance of the second year to investigate the effects of tillage on chickpea
Mean of squares
Sources of changes df
Weight of 100 seeds
Number of pods per square meter
Number of seeds per pods Grain yield
Biological yield
Replication 2 0.97 238 12 21358 261282
Error 1 4 0.75 112 33 43026 69751
Tillage 2 4.36 18 10 155361 724726*
Error 2 4 1.05 15 34 1384 91214
*and **indicate the signifi cance level at 1 and 5, respectively.
content at the depth of 0-20 cm at 5% level, it was also signifi cant on moisture content at the depth of 20-40 cm at the second phase at 1% level.
COMPARISON OF THE MEAN OF THE MAIN LEVELS OF THE FACTORS STUDIED IN CHICKPEA TWO-YEAR COMPOSITE ANALYSIS
The result of the comparison of the average levels of tillage is shown in Table 4-5 and 4-6. As it can be seen, the tillage factor had only signifi cant effect on 100-seed weight and moisture content at the depth of 20-40 cm on the second phase; and it had no signifi cant effect on other properties (Table 4-4, 4-5).
The tillage factor was only signifi cant on the char-acteristics of 100 seed weight and leaf area index and was not signifi cant on other characteristics. Mudak et al. (2001) in a seven-year trial on wheat yield reported that there is no signifi cant difference between con-ventional tillage systems and no tillage. Simon et al., (2009) reported that soil tillage has an impact on most soil characteristics such as temperature, moisture dis-tribution, and soil density, and the proper selection and implementation of an appropriate tillage system can provide a suitable bedding for the seed, and ultimately lead to optimal yield (Hemmat & Eskandari, 2006).
Although conventional tillage systems provide a good basis for plant growth by breaking the impermeable lay-

Saeed Salehi et al.
BIOSCIENCE BIOTECHNOLOGY RESEARCH COMMUNICATIONS EFFECT OF SOIL TILLAGE SYSTEMS ON CHICKPEA YIELD AND MOISTURE OF SOIL 407
Table 4.4. Analysis of variance of the second year to investigate the effects of moisture on chickpea
Mean of squares
Sources of changes df
Moisture content at the depth of
0-20 cm phase 1
Moisture content at the depth of
20-40 cm phase 1
Moisture content at the depth of 0-20 cmphase 2
Moisture content at the depth of
20-40 cmphase 2Replication 2 5.09 7.95 0.17 0.7
Error 1 4 0.81 5.75 0.38 0.57
Tillage 2 6.35 4.30 *1.32 **5.13
Error 2 4 2.56 2.09 0.16 0.20
*and **indicate the signifi cance level at 1 and 5, respectively.
FIGURE 1. Effect of tillage on grain weight
FIGURE 2. Effect of tillage on biological yield

Saeed Salehi et al.
408 EFFECT OF SOIL TILLAGE SYSTEMS ON CHICKPEA YIELD AND MOISTURE OF SOIL BIOSCIENCE BIOTECHNOLOGY RESEARCH COMMUNICATIONS
Table 4.6. Comparison of the mean of moisture effect
Characteristics
Factor
Moisture content at the depth of 0-20
cm phase1
Moisture content at the depth of
20-40cm phase1
Moisture contentat the depth of 0-20
cm phase 2
Moisture content at the depth of
20-40cm phase 2
YearFirst year 13.90b 26.96b 11.72a 15.34a
Second year 15.51a 30.53a 9.23b 12.20b
Tillage
0 1508a 28.43a b10.25 13.47a
1 14.89a a28.55 10.54a 14.07a
2 14.14a a29.25 a10.64 13.76a
In each column and for each factor, the meanings that have at least one letter are not signifi cantly different at the 5% probability level.*: Tillage 0, 1 and 2 respectively means non-tillage, low tillage, and conventional tillage.
FIGURE 3. Effect of tillage on moisture
Table 4.5. Comparison of the mean of tillage effect
Characteristics
FactorWeight of 100 seeds
Number of pods per square meter
Number of seeds per pods Grain yield Biologic yield
YearFirst year 10.16b 19.63a 27.23b 469.76 1248b
Second year 30.93a 25.41a 30.97a 829.06 2876a
Tillage
0 20.70a 21.53a 28.67b 0 1900b
1 20.73a 22.06a 29.36a 1 2125ab
2 20.20a 23.96a 29.27a 2 2161a
In each column and for each factor, the meanings that have at least one letter are not signifi cantly different at the 5% probability level.*: Tillage 0, 1 and 2 respectively means non-tillage, low tillage, and conventional tillage.
ers of soil and cutting the weed life cycle, pests and diseases (Mulumba & Lal, 2008), but these systems also require a lot of energy and In the long term, they destroy the physical properties of the soil (Sharma et al., 2011). Also, the use of low tillage and non-tillage systems reduces the costs of energy consumption, it decreases erosion and soil degradation (Katsviro 2002; Barzegar et al. 2004).
Astillage machines are heavy and large require 120 horsepower tractors to pull; these tractors cause density in the soil when traveling on the farm. So it’s economi-cal to use organic farming systems for ordinary farmers, and any farmer can use no tillage system.Since the yield in no-tillage compared to other system is lower, but there is no use of agricultural equipment and machines in no tillage system, this is so important in terms of economic.

Saeed Salehi et al.
BIOSCIENCE BIOTECHNOLOGY RESEARCH COMMUNICATIONS EFFECT OF SOIL TILLAGE SYSTEMS ON CHICKPEA YIELD AND MOISTURE OF SOIL 409
REFERENCES
Afzali, S.M. Javaheri A. (2013). The Effect of Soil Techniques on Soil Immersion Resistance, Technical Indices and Wheat yield. Journal of Agricultural Machinery, 3 (1): pp. 21-34.
Amini, S. Movahedi Naeini, S. A. R. (2013). Effects of Paper Mill Sludge Applicationon Physical Properties of an Illitic Loess Slowly Swelling Soil with High Specifi c SurfaceArea And Wheat Yield In a Temperate Climate. Journal of Agricul-tural Science. 1: 295-313.
Barzegar, AR. Hashemi, AM. Herbert, SJ. Asoodar, M. (2004). Interactive effects of tillage system and soil water content aggregate size distribution for seedbed preparation in Fluvisols southwest Iran. Soil and Tillage Research 78: 45-52.
Chassot, A. P. Stamp. W. Richner.(2011). Root distribution and morphology of maizeseedling as affected by tillage and ferti-lizer placement. Plant Soil 231, 123–135.13.
Chen, H.S. Liu, G.S. Yang Y.F.Ye, X.F. and Shi, Z. (2010). “Com-prehensive evaluation of tobacco ecological suitability of Henan province based on GIS”. Agri. Sci. China. 9: 583-592.
Goldani, M. Rezvani Moghadam, P. (2007). Effect of different moisture regimes and planting date on phenological character-istics and growth indices of three dry and blue chickpea culti-vars in Mashhad. Journal of Agricultural Sciences and Natural Resources. 14 (1): 229-242.
Habibzadeh, Y. (2006). Effect of plant density on grain yield and morphophysiological characteristics of three genotypes of mung bean in Ahvaz condition. Journal of Agricultural Sci-ences of Iran, No. 81 (29): 66-78.
Heidari, A. (2011). Effect of soil tillage methods on soil physi-cal characteristics and yield of wheat. Journal of Agricultural Science and Technology. Volume Fifty-Seven, No. 15. Pages 124-115.
Hemmat, A. Eskandari, I. (2006). Dryland winter wheat response to conservation tillage in a continuous cropping system in northwestern Iran. Soil and Tillage Research, 86, 99-109.
Katsvairo, T. Cox, WJ. Van, EH. (2002). Tillage and rotation effects on soil physical properties. Agronomy Journal 94: 299-304.
Mulumb, L. N. Lal, R. 2008. Mulching effects on selected soil physical properties. Soil and Tillage Research, 98, 106-111.
Norwood, C.A. Currie, R. S. (1997). Dry land corn vs. Grain sor-ghum in western kansas. Journal of production – agriculture (USA). (Jan-Mar 1997). V10 (1): 152-157.
Papendick, R.I. Parr, J.F. (1997). No-till farming: The way of the future for sustainable dryland agriculture. Ann. Arid Zone, 36 (3):193-208.
Rasouli, Sh. Abbaspour Gilandeh, Y.(2008). Investigating the effect of different soil tillage methods on soil physical proper-ties. Proceedings of the 5th National Congress on Agricultural Machinery and Mechanization. Mashhad.
Shafi ei, S. A.(1992). Principles of Agricultural Machinery, Vol. 1. Tehran University Press. No. 2135.
Shafi ee, S. A. (1995). Agricultural machines. Tehran University Press. No. 757.
Sadeqipour, A. (2001). Plant production science, fi rst part, beans (translation). Pezeshkiannejad Publications, Tehran.
Sharma, P. Abrol, V. Sharma, R.K. (2011). Impact of tillage and mulch management on economics, energy requirement and crop performance in maize–wheat rotation in rainfed subhumid inceptisols, India. European Journal of Agronomy, 34, 46-51.
Simon, T. Javurek, M. Mikanová, O. Vach, M. (2009). The infl u-ence of tillage systems on soil organic matter and soil hydro-phobicity. Soil and Tillage Research, 105, 44-48.

Dental CommunicationBiosci. Biotech. Res. Comm. 10(3): 410-414 (2017)
The role of different impression methods for complete
denture prosthodontics
Sara Nikoee Bazvand1, Farshad Khamchin Moghaddam1, Nazila Najari Dizaji2 and Shahin Shams Lahijani3*1Postgraduate student, Prosthodontics Department, Dental School, Shahid Beheshti University of Medical Science, Tehran, Iran2Assistant Professor, Prosthodontics Department, Dental School, Qom University of Medical Science, Tehran, Iran3Assistant Professor, Surgery Department, Dental School, Qom University of Medical Science, Tehran, Iran
ABSTRACT
The aim of the study was to determine dentist’s desire for role of different impression methods for complete denture prosthodontics.The 1378 questioners form randomly distributed among dentists. The form included questions related about their idea for application and effect of boarder modeling materials in complete denture prosthodontics. Among the total forms, 657 forms fully fi lled, signature and returned by the dentists. Results: Acceding to the data, the highest percent of the dentists included in this study was graduated 11-15 years ago (28%). Also, 73% of the dentists always apply two complete dentures prosthodontics. 73% of the dentists answered for always use administration of special trays. 64% of the dentists answered that they always use impression before border modeling and 25 % of them never use this. 89% of the dentists use compound material for border modeling. 64% of the patients use zinc oxide and eugenol (ZOE) and the 25% use Alginate. Also, poly ether and poly sulfate were desired by 10.5 and 0.5% of the dentists, respectively. As seen there are different ideas among dentist for different impression methods for complete denture prosthodontics.
KEY WORDS: IMPRESSION METHODS, MATERIAL, COMPLETE DENTURE PROSTHODONTICS
410
ARTICLE INFORMATION:
*Corresponding Author: Received 25th June, 2017Accepted after revision 21st Sep, 2017 BBRC Print ISSN: 0974-6455Online ISSN: 2321-4007 CODEN: USA BBRCBA
Thomson Reuters ISI ESC and Crossref Indexed Journal NAAS Journal Score 2017: 4.31 Cosmos IF: 4.006
© A Society of Science and Nature Publication, 2017. All rights reserved.Online Contents Available at: http//www.bbrc.in/DOI: 10.21786/bbrc/10.3/12

Sara Nikoee Bazvand et al.
BIOSCIENCE BIOTECHNOLOGY RESEARCH COMMUNICATIONS THE ROLE OF DIFFERENT IMPRESSION METHODS FOR COMPLETE DENTURE PROSTHODONTICS 411
INTRODUCTION
An impression is a record, a facsimile of mouth tissues taken at an unstrained rest position or in various posi-tions of displacement (Devan, 2005). In the case of an edentulous arch, this requires a unique combination of managing movable soft tissue commensurate with inte-grating different materials and a technique for accurate reproduction (Petrie et al., 2005). Stability of complete lower dentures has challenged dentists and patients alike. In particular, “fl at lower ridge” is associated with diffi -culties in providing successful dentures (McCord et al. 1992). Resorption rates vary from patient to patient and some authors have postulated several etiological factors related to residual (alveolar) ridge resorption, ranging from localized pressure to systemic factors (Likeman, 1997). Making accurate fi nal impression for complete dentures is a multistage process that involves a prelimi-nary impression, a customized fi nal impression tray and a fi nal border impression (Zarb et al. 1990).
It is important to thoroughly examine the patient’s mouth and select the most appropriate impression tech-nique (Suenaga et al. 1997). A major requirement for fi nal impression of complete dentures is to develop the peripheral contours to accommodate normal muscular function and to ensure peripheral adaptation without allowing air penetration between the future denture base and the mucous membrane (Daou, 2010). Differences are noticeable between the materials and methods currently used by dentists for fi nal impressions in complete den-ture prosthodontics (Daou, 2010).
Even though the current generation of impres-sion materials provides alternatives, making an initial impression still can be diffi cult when patients have sig-nifi cant resorption (Pyle, 1999). The concept of molding the periphery of complete denture prosthesis to the sur-rounding musculature has been accepted and taught for about past decades (Drago, 2003). Anecdotal evidence suggests that the impression techniques used in general dental practice may vary from those taught at dental schools (Drago, 2003). So, the aim of the study was to determine dentist’s desire for role of different impression methods for complete denture prosthodontics.
MATERIAL AND METHODS
This cross sectional study was done using question-ers on dentists during 2014-15. The 1378 questioners form randomly distributed among dentists. The form included questions related about their idea for applica-tion and effect of boarder modeling materials in com-plete denture prosthodontics. Among the total forms, 657 forms fully fi lled, signature and returned by the dentists. Then the data processed using excel software
using Microsoft offi ce ver. 2010 and presented as fre-quency and percent.
RESULTS AND DISCUSSION
The result of the different impression methods for com-plete denture prosthodontics is presented in fi gs. 1-6. The frequency of the dentists included into the study based on their years of graduate is presented in fi gure 1. As seen the highest percent of the dentists included in this study was graduated 11-15 years ago (28%) and only 11% was graduated less than 5 years
The frequency of the dentists answer for application of 2 complete dentures prosthodontics is presented in fi gure 2. As observed 73% of the dentists always apply two complete dentures prosthodontics, initial and fi nal while only 3 % sometimes used this.
As seen in fi gure 3, 73% of the dentists answered for always use administration of special trays and only 8 % of the dentists never used special trays.
Also, 64% of the dentists answered that they always use impression before border modeling and 25 % of them never use this (fi gure 4).
Additionally, 89% of the dentists use compound material for border modeling while 11% of the dentists desire to use poly ether materials (fi gure 5).
Furthermore, 64% of the patients use ZOF and the 25% use Alginate. Also, poly ether and poly sulfate were desired by 10.5 and 0.5% of the dentists, respectively (fi gure 6).
As seen there are different ideas among dentist for different impression methods for complete denture pros-thodontics. Also, there was different for materials used for complete denture prosthodontics among dentists. Since the last decade, several investigators have rec-ommended using newer elastomeric materials such as polyvinylsiloxane and polyether for fi nal impressions to replace the older and more traditional materials (Petrie et al., 2005). Four basic types of elastomer impression materials are currently in use in the dental profession such as silicone rubbers which polymerize by a conden-sation reaction, polysulfi de (mercaptan) rubbers, poly-ethers and silicones which polymerize an addition reac-tion. The latter have been introduced relatively recently and are also called polyvinylsiloxanes (Lacy et al., 1981).
There are many materials for the fi nal impression, such as gypsum, zinc oxide eugenol (ZOE) paste, poly-sulfi de rubber, polyether, polyvinyl siloxane and algi-nate. Preferences vary much among dentists. However, there is no evidence that one technique or material pro-duces better long term results than another (Duncan and Taylor, 2001). Many general practitioners use a single alginate impression as the defi nitive impression for

Sara Nikoee Bazvand et al.
412 THE ROLE OF DIFFERENT IMPRESSION METHODS FOR COMPLETE DENTURE PROSTHODONTICS BIOSCIENCE BIOTECHNOLOGY RESEARCH COMMUNICATIONS
FIGURE 1. The frequency of the dentists included into the study based on their years of graduate
FIGURE 2. The frequency of the dentists answer for application of two complete dentures prosthodontics (initial and fi nal)
FIGURE 3. The frequency of the dentists answer for administration of special trays

Sara Nikoee Bazvand et al.
BIOSCIENCE BIOTECHNOLOGY RESEARCH COMMUNICATIONS THE ROLE OF DIFFERENT IMPRESSION METHODS FOR COMPLETE DENTURE PROSTHODONTICS 413
FIGURE 5. The frequency of the dentists answer for material used for border modeling
FIGURE 4. The frequency of the dentists answer for Impression before border modeling
the construction of complete dentures, which confl icts with the teaching in practically all dental schools. It is, therefore, of interest that a randomized controlled trial found neither patient-assessed nor dentist-evaluated differences between dentures fabricated according to a traditional or a simplifi ed method. The simple tech-nique used alginate in a standard tray for the defi nitive impression, whereas the traditional technique included an individual tray with border molding and polyether for the fi nal impression (Kawai et al., 2005). Although impression materials differ in many aspects and a vari-ety of techniques exist in taking the impressions, there is no evidence to conclude that the clinical long-term outcome of dentures fabricated using varying materi-
als and methods would differ signifi cantly. These and other aspects of variation in methods and techniques are discussed in a review of an evidence base for complete dentures (Carlsson, 2006).
It is reported complete dentures fabricated with the conventional method that included a prelimi- nary impression made using alginate in a stock tray and sub-sequently a fi nal impression made using silicone in a border moulded custom tray resulted in higher general patient satisfaction (Lepe et al. 2002). Currently, there are a number of issues with prosthodontic protocols that may provide underlying reasons why clinically signifi -cant differences are not produced in randomized con-trolled trial. Prosthodontic trials can have numerous
Sara Nikoee Bazvand et al.
414 THE ROLE OF DIFFERENT IMPRESSION METHODS FOR COMPLETE DENTURE PROSTHODONTICS BIOSCIENCE BIOTECHNOLOGY RESEARCH COMMUNICATIONS
specifi c confounding variables such as patient related factors (ridge form, saliva fl ow, mucosal quality, patient expectation, psychological profi le, perceived aesthetics), technical construction factors (occlusal form, impression technique, processing methods, different technicians/technical procedures, the full use, or not, of the recorded sulcus depth) and dentist related factors (ability, edu-cation, number of clinicians, velocity of seating of the impression) (Dillon et al, 2008).
REFERENCES
Carlsson, G.E., 2006. Facts and fallacies: an evidence base for complete dentures. J. Prosthodont. 12, 280–287.
Daou EE. 2010 The elastomers for complete denture impres-sion: A review of the literature. The Saudi Dental Journal 22, 153–160.
Devan, M., 2005. Basic principles in impression making. J. Prosthet. Dent. 93, 503–508.
Dillon S, Hyde TP, Brunton P.2008 A technique to construct duplicate dentures for clinical research. Quintessence Journal of Dental Technology 6:30–9.
Drago, C.J., 2003. A retrospective comparison of two defi ni-tive impression techniques and their associated postinsertion adjustments in complete denture prosthodontics. J. Prostho-dont. 12 (3), 192–197.
Duncan, J.P., Taylor, T.D., 2001. Teaching an abbreviated impression technique for complete dentures in an undergradu-ate dental curriculum. J. Prosthet. Dent. 85, 121–125.
Kawai, Y., Murakami, H., Shariati, B., Klemetti, E., Blomfi eld, J.V., Billette, L. 2005. Do traditional techniques produce better conventional dentures than simplifi ed techniques? J. Dent. 33, 659–668.
Lacy, A.M., Bellman, T., Fukui, H., Jendersen, M., 1981. Time dependent accuracy of elastomer impression materials. Part I: condensation silicones. J. Prosthet. Dent. 45 (2), 209–214.
Lepe, X., Johnson, G.H., Berg, J.C., Aw, T.C., Stroh, G.S., 2002. Wettability, imbibition, and mass change of disinfected low viscosity impression materials. J. Prosthet. Dent. 88, 268–276.
Likeman PR. Tongue control of lower complete dentures: a clinical hint. Br Dent J 1997;182:229-230.
McCord JF, Grant AA, Quayle AA. 1992 Treatment options for the edentulous mandible. Eur J Prosthodont Restor Dent1:19-23.
Petrie, C.S., Walker, M.P., Williams, K., 2005. A surveys of US prosthodontists and dental schools on the current materials and methods for fi nal impressions for complete denture pros-thodontics. J. Prosthodont. 14 (4), 253–262.
Pyle, M.A., 1999. Impression technique for severely resorbed mandibles in geriatric patients. JADA 130.
Suenaga K, Sato T, Nishigawa G, Minagi S. 1997 Relation-ship between size of complete foundation area and resorption of alveolar ridge in the edentulous mandible. J Oral Reha-bil;24:315-319.
Zarb AZ, Bolender CL, Hickey JC, Carlsson GE.1990 Boucher’s prosthodontic treatment for edentulous patients. 10th ed. St Louis: C V Mosby.

Biotechnological CommunicationBiosci. Biotech. Res. Comm. 10(3): 415-418 (2017)
Infl uence of different spacing and cultivars on yield
components and biochemical parameters of onion
(Allium cepa L.)
Saurabh Kishor, R. B. Ram, M.L. Meena*, Sachin Kishor, D. C. Meena and Anil KumarDepartment of Applied Plant Science (Horticulture), Babasaheb Bhimrao Ambedkar University, Vidya Vihar Rae Bareli Road Lucknow (UP), India
ABSTRACT
The investigation was undertaken to determine the effect of spacing and cultivars on economic horticultural traits of onion. In trail different spacing was taken 7.5 10 cm, 10 10 cm, 12.5 10 cm and 15 10 cm. Three varieties viz. Agrifound Light Red, NHRDF Red-3 and NHRDF L-28 were used for study. The layout of experimental fi eld was laid down in Factorial Randomized Block Design with 3 replications. It is clearly revealed that the signifi cantly contrary, yield ha-1 was the highest (404.14 q ha-1) at closer spacing (10 10 cm) and the lowest was (362.47 q ha-1) at wider spacing 15 10 cm. The weight of individual bulb of onion (49.54 g) was increased with the wider spacing (12.5 10 cm). The bulb length (6.63 cm), diameter (6.97 cm) and number of scale per bulb (8.00) also the same trend in widest spacing (15 10 cm). The interaction of spacing and different cultivars had infl uenced signifi cantly on total solu-ble solids and ascorbic acid of onion bulb. Signifi cant effect was found among the varieties for total soluble solids, ascorbic acid, reducing sugar. Studied highest total soluble solids (13.960Brix), ascorbic acid (10.03), reducing sugar (8.50), non reducing (9.70%) and total sugars (17.70%) respectively.
KEY WORDS: ONION, SPACING, CULTIVARS, GROWTH AND YIELD
415
ARTICLE INFORMATION:
*Corresponding Author: [email protected] Received 1st July, 2017Accepted after revision 12th Sep, 2017 BBRC Print ISSN: 0974-6455Online ISSN: 2321-4007 CODEN: USA BBRCBA
Thomson Reuters ISI ESC and Crossref Indexed Journal NAAS Journal Score 2017: 4.31 Cosmos IF: 4.006
© A Society of Science and Nature Publication, 2017. All rights reserved.Online Contents Available at: http//www.bbrc.in/DOI: 10.21786/bbrc/10.3/13
416 INFLUENCE OF DIFFERENT SPACING AND CULTIVARS ON YIELD COMPONENTS BIOSCIENCE BIOTECHNOLOGY RESEARCH COMMUNICATIONS
Saurabh Kishor et al.
INTRODUCTION
Onion is a bulbous herbaceous biennial vegetable crop which belongs to family Alliaceae and widely grown as with cross-pollinated and monocotyledonous behavior having diploid chromosomes 2n=16 (Bassett, 1986). Onion is the most important bulb crop cultivated com-mercially in most parts of the world. The crop is grown for consumption both in the green states as well as in mature bulbs. It is valued for its bulbs having character-istics odour, fl avor, and pungency, which is due to the presence of a volatile oil-allyl-propyl-disulphide, (Kan-tona et al., 2003 and Habtamu et al., 2016 and Kishor et al., 2017).
Onion is the richest source of fl avonoids in the human diet and fl avonoid consumption has been asso-ciated with a reduced risk of cancer, heart disease and diabetes. In addition it is known for anti bacterial, anti-viral, anti-allergenic and anti infl ammatory potential. Even though the crop has great contribution both in economic and health issues, its production and produc-tivity is not scaled to the required level. This is because use of appropriate agronomic management practices and improved technology inputs are still not highly used which have undoubted contribution in increasing crop yield potential. One of the important measures to be taken in increasing the productivity of onion is deter-mining spacing for each agro-ecology since full package of information is required for each growing region the country to optimize onion productivity (Gupta, et al., 1994). Proper spacing ensures optimum plant growth through adequate utilization of moisture, light, spacing and nutrients (Zubeldia and Gases, 1977). The control of plant spacing is one of the cultural practices to control bulb size, shape and yield (Geremew et al., 2010). The higher yield and better control of over or under bulb size bulb size could be obtained if plants are grown at optimum density. Total bulb yield can be increased as population density increase (Kantona et al., 2003 and Habtamu et al., 2016 and Kishor et al., 2017).
Several researchers in many countries have shown that varieties and plant spacing had profound effects on the growth and yield of onion (Pandey et al., 1991; Bhonden et al., 1995 and Kumar et al., 1998, Kishor et al., 2017). Considering the above stated situations, the present study was undertaken to determine the effect of spacing on growth and yield of different cultivars of onion under Lucknow conditions (Allium cepa l.).
MATERIAL AND METHODS
The experiment was conducted at Horticulture Research Farm-II of Babasaheb Bhimrao Ambedkar University, Vidya Vihar Rae Bareli Road Lucknow (UP) during
November 2015 to April 2016 under subtropical condi-tion. The experiment site lies about 260 56 N latitude and 800 52 E longitude at an altitude of 111 m above sea level. The area experiences rainfall that stretches from April to October with the main rainy season from June to early September. The area receives average rainfall between 800-1000 mm with annual and maximum tem-perature ranging from 15 to 300C. Three varieties viz. Agrifound Light Red, NHRDF Red-3 and NHRDF L-28 and four plant spacing such as 7.5 10 cm, 10 10 cm, 12.5 10 cm and 15 10 cm were used for study. The experiment was laid out in Factorial Randomized Block Design (RBD) and replicated in thrice. Standard analytical methods were followed for recording vari-ous parameters. The observation was made on the fol-lowing parameters yield kg/plot, yield kg/ha, weight of bulb, bulb length (cm), bulb diameter (cm), number of scale per bulb, total soluble solids (0Brix) was measured with the help of an Erma hand refractometer and were corrected using standard reference table and express in terms of (0Brix) at 200, ascorbic acid (mg/100g) Ascor-bic acid content was determined by diluting the known volume of juice with 3% meta-phosphoric acid and titrating with 2,6- dichlorophenol-indo-phenol solu-tion, reducing sugar (%), non reducing sugar (%) and total sugars (% ) were determined by titrating the sample against Fehlings solution using methylene blue as an indicator. All the parameters were collected from fi ve randomly selected plants of each treatment. On set of the Rabi season these healthy bulb uniform shape and size were selected and transplanted well prepared fi eld Statistical analysis of the data obtained in different set of experiments was calculated following the standard procedure as stated by (Panse and Sukhatme, 1989).
RESULT AND DISCUSSION
YIELD COMPONENTS
The results obtained during the investigation in respect to yield components parameters viz., yield kg/plot, yield kg/ha, weight of bulb, bulb length (cm), bulb diameter (cm), number of scale per bulb, total soluble solids (0Brix), ascorbic acid (mg/100g), reducing sugar (%), non reduc-ing sugar (%) and total sugars (% ) Table 1. The interac-tion effect of spacing and different cultivars had infl u-enced signifi cantly on the parameters. The maximum yield (7.34 kg/plot and 489.77 q ha-1) was recorded from the variety Agrifound Light Red with spacing 10 10 cm followed by the variety NHRDF Red-3 (6.88 kg/plot and 458.77 q ha-1) with spacing 7.5 10 cm. The minimum yield (4.67 kg/plot and 311.44 q ha-1) was recorded from the variety Agrifound Light Red with spacing 12.5 10 cm. While the heaviest bulb (57.60 g) was recorded from

BIOSCIENCE BIOTECHNOLOGY RESEARCH COMMUNICATIONS INFLUENCE OF DIFFERENT SPACING AND CULTIVARS ON YIELD COMPONENTS 417
Saurabh Kishor et al.
Tabl
e 1.
Infl
uenc
e of
dif
fere
nt s
paci
ng a
nd c
ultiv
ars
on y
ield
com
pone
nts
and
bioc
hem
ical
par
amet
ers
f O
nion
Var
ieti
esSp
acin
gY
ield
(k
g/pl
ot)
Yie
ld
(q/h
a)W
eigh
t of
bu
lb (g)
Bul
b di
amet
er
(cm
)Le
ngth
of
bulb
(cm
)N
umbe
r of
sc
ale
per
bulb
Tota
l sol
uble
so
lids
(0 Bri
x)A
scor
bic
acid
(m
g/10
0g)
Redu
cing
su
gar
(%)
Non
red
ucin
g su
gar
(%)
Tota
l su
gars
(%
)
Agr
ifou
n Li
ght
Red
(7.5
x10c
m)
6.59
439.
5533
.22
5.01
4.86
7.00
10.6
67.
435.
508.
4713
.97
Agr
ifou
n Li
ght
Red
(10x
10cm
) 7.
3448
9.77
36.0
05.
055.
407.
0010
.76
8.60
6.63
8.37
15.0
0
Agr
ifou
n Li
ght
Red
(12.
5x10
cm)
4.67
311.
4422
.56
5.16
5.08
7.33
12.3
38.
906.
278.
6714
.93
Agr
ifou
n Li
ght
Red
(15x
10cm
)5.
8138
7.33
38.2
06.
866.
868.
0012
.53
8.83
7.93
9.77
17.7
0
NH
RDF
Red-
3 (7
.5x1
0cm
)6.
8845
8.77
44.3
35.
495.
407.
0012
.50
8.83
7.73
8.83
16.5
7
NH
RDF
Red-
3 (1
0x10
cm)
6.47
431.
7740
.36
5.48
5.36
7.33
13.9
68.
437.
378.
6716
.03
NH
RDF
Red-
3 (1
2.5x
10cm
)5.
8338
8.88
48.1
35.
685.
037.
3312
.76
9.20
7.83
8.57
16.4
0
NH
RDF
Red-
3 (1
5x10
cm)
6.71
447.
3355
.43
7.06
6.53
7.66
12.0
69.
938.
238.
6716
.90
NH
RDF
L-28
(7
.5x1
0cm
)5.
4036
0.22
43.6
35.
805.
387.
0013
.50
9.13
7.13
9.60
16.7
3
NH
RDF
L-28
(1
0x10
cm)
6.14
409.
5549
.80
6.52
5.10
7.33
13.2
38.
407.
609.
0016
.60
NH
RDF
L-28
(12.
5x10
cm)
5.80
387.
1157
.60
6.14
5.59
7.33
12.2
68.
767.
639.
0716
.70
NH
RDF
L-28
(15x
10cm
)5.
6637
7.77
55.0
07.
006.
518.
3311
.86
10.0
38.
508.
9717
.47
CD (P
=0.0
5)0.
1912
.86
8.54
0.48
N/S
N/S
0.80
0.82
N/S
N/S
N/S
SE(m
)±0.
064.
352.
890.
160.
230.
370.
270.
270.
560.
380.
67
the variety NHRDF L-28 with spacing 12.5 10 cm fol-lowed by variety NHRDF L-28 with spacing 15 10 cm (55.00 g) and lightest bulb was obtained from the variety Agrifound Light Red with 7.5 10 cm. While the biggest bulb diameter (7.06 cm) was recorded from the variety NHRDF Red-3 with 15 10 cm followed by the variety Agrifound Light Red with spacing 15 10 cm (6.86 cm).
The lowest bulb diameter (5.01 cm) was recorded from the variety Agrifound Light Red with 7.5 10 cm. While the length of bulb and number of scale per bulb was not signifi cantly infl uenced by the different spacing and cul-tivars. However, the highest length of bulb (6.86 cm) was recorded from the variety Agrifound Light Red with spac-ing 15 10 cm followed by variety NHRDF Red-3 with 15x10cm cm (6.53 cm) and the lowest bulb length (4.86 cm) was recorded from the variety Agrifound Light Red with spacing 7.5 10 cm. Thus, the number of scale per bulb (8.33) was increased from the variety NHRDF L-28 with spacing 15 10 cm followed by variety Agrifound Light Red with spacing 15 10 cm (8.00). This is due to proper spacing ensures optimum growth and weight of bulb through adequate utilization of moisture, light, spac-ing and nutrients (Zubeldia and Gases, 1977 Habtamu et al., 2016 ). These results are conformity with (Kumar et al., 1998), the highest yield with a spacing of 15 10 cm, (Kantona et al., 2003) and (Khan et al., 2003) total bulb yield can be increased as population density increase and (Gupta and Gaffer, 1980) bulb size and bulb weight decreased with the decrease in spacing (Kishor et al., 2017).
Table 1 indicated that interaction of spacing and dif-ferent cultivars had infl uenced signifi cantly on total soluble solids and ascorbic acid of onion bulb. The max-imum total soluble solids (13.960Brix) were obtained from variety NHRDF Red-3 with spacing 10 10 cm followed by variety NHRDF L-28 with spacing 7.5 10 cm (13.500Brix) and minimum (10.660Brix) was recorded from variety Agrifound Light Red with spacing 7.5 10 cm. While ascorbic acid (9.93 mg/100g) was increased from variety NHRDF RED-3 with spacing 15 10 cm followed by variety NHRDF RED-3 with spacing 12.5 10 cm (9.20 mg/100g) and minimum (7.43 mg/100g) amount of ascorbic acid was recorded from variety Agri-found Light Red with spacing 7.5 10 cm.
Thus reducing sugar, non reducing sugar and total sugars were not signifi cantly infl uenced by the different spacing and cultivars interaction. However, the maximum reducing sugar (8.50%) was recorded from variety NHRDF L-28 with spacing 15 10 cm followed by variety NHRDF Red-3 with spacing 15 10 cm (8.23%) and minimum (5.50%) was recorded from variety Agrifound Light Red with spacing 7.5 10 cm. While maximum non reduc-ing (9.70%) and total sugars (17.70%) were recorded from variety Agrifound Light Red with spacing 15 10 cm fol-lowed by spacing 7.5 10 cm and 15 10 cm with variety

418 INFLUENCE OF DIFFERENT SPACING AND CULTIVARS ON YIELD COMPONENTS BIOSCIENCE BIOTECHNOLOGY RESEARCH COMMUNICATIONS
Saurabh Kishor et al.
NHRDF L-28. This result is in agreement with the fi ndings of (Gupta and Gaffer 1980), (Khan et al., 2003) in onion and (Kumar et al., 1998) obtained the better quality with spacing of 15x10 cm in onion.
CONCLUSION
Our study was concerted to the combined application of different spacing and varieties favorably infl uenced plant growth attributes. Results clearly emphasized the importance of spacing as well as selection of varieties of onion, as the conjoint use of them yielded higher and gave a remunerative return. Based on the trend of yield and economical aspects of onion observed in the present study; it was concluded that for getting higher bulb yield of onion, combined application of 10 10 cm spacing with var. Agrifound Light Red, was best under Lucknow conditions by 7.5 10 cm spacing with var. NHRDF Red-2 and 15 10 cm spacing with var. NHRDF Red-2. These results however need to be further confi rmed on multi locations large scale trials before passing as rec-ommendations to the onion growers of Lucknow.
ACKNOWLEDGEMENT
The authors express their thanks to Director, NHRDF Regional Station, Deoria (UP) for providing seed materials.
REFERENCES
Bassett, M. J (1986) Breeding Vegetable Crops. AVI Publishing Co., USA. 584pp.
Bhonden, S. R., Ram, L., Pandey, U.B. and Tiwari, H.N. (1995). Effect of Micronutrients on Growth, Yield and Quality of Kha-rif Onion. News lett. National Hort. Res. 14- 15 (1): 16-20.
Geremew, A., Teshome, A., Kasaye, T. and Amenti, C (2010). Effect of Intra-Row Spacing on Yield of Three Onion (Allium
Cepa L.) Varieties at Adami Tulu Agricultural Research Center (Mid Rift Valley Of Ethiopia). J. Hort. For. 2 (1): 7-11.
Gupta and Gaffer (1980). Effect of Row Spacing and Different Combination of NPK Fertilizer on the Yield of Onion. Bangla. Horti. 8: 8-12.
Gupta, R.P., Srivastava, K.J., Pandey, U.B. and Midmore, D.J (1994). Disease and Insect Pest of Onion in India. Acta Hort. 358: 265-372.
Habtamu, T., Minuyelet, J., Esmelealem, M. and Alebachew E. (2016). Infl uences of Inter and Intra row Spacing on Yield, Yield Component and Morphological Characteristics of Onion (Allium cepa L.) at Western Amhara region. Afr. J. Agric. Res. 11(20):1797-1804
Kantona, R. A. L., Abbeyb, L., Hillac, R.G., Tabil, M.A. and Jane, N.D. (2003). Density Affects Plant Development and Yield of Bulb Onion (Allium Cepa L.) In Northern Ghana. J. Veg. Crop Prod. 8(2):15-25.
Khan, M.A., Hasan, M.K., Miah, M.A.J., Alam, M.M. and Masum, A.S.M.H. (2003). Effect of Plant Spacing on the Growth and Yield of Different Varieties of Onion. Pakistan Journal of Biological Science. 6(18): 1582-1585.
Kishor, S., Ram,R.B., Kishor, S., Meena,M.L. and Satyendra (2017). Effect of Spacing and Different Cultivars on Growth and Yield of Onion Under Lucknow Conditions (Allium Cepa L.). Int.J. Pure App. Biosci. 5(4):612-616. (Online)
Kumar, H., Singh, J.V., Kumar, A. and Singh, M. (1998). Studies on the Effect of Spacing on Growth and Yield of Onion (Allium Cepa L.) Cv. Patnared. Indian J. Agric. Res. 32: 134-138.
Pandey, U. B., Singh, L. Kumar, R., Singh, L., Kumar, R. and Rayehaudhury, S.P. (1991). Response of Different Level of N, P, K on the Yield And Quality of Kharif Onion. Recent Adv. Med.. Aromat. & Spice Crops. 1: 231-234.
Panse, V.G. and Sukhatme, P.V. (1989) Statistical Methods for Agriculture Workers. Publication and information division. ICAR, New Delhi.
Zubeldia, A. and Gases, J. L. (1977) Effect of Spacing and the Number of Stem on the Ealiness and Total Yield of Tomato Cultivars. Production Vegetable. 7: 73-97.

Medical CommunicationBiosci. Biotech. Res. Comm. 10(3): 419-423 (2017)
Investigations on the physical activity level of some
Iranian drug suicidal patients
Maryam Hajain MD1, Shahram Mohaghegh MD2*, Latif Gachkar MD3 and Effat Barari4
1Community Medicine Specialist, Minimally Invasive Surgery Research Center, Iran University of Medical Sciences, Tehran, Iran 2Assistant Professor of Sports and Exercise Medicine, Clinical Research Development Center of Loghman Hakim Hospital, Shahid Beheshti University of Medical Sciences, Tehran, Iran 3Professor of Shahid Beheshti University of Medical Sciences, Tehran, Iran4Toxicological Research Center, Shahid Beheshti University of Medical Sciences, Tehran, Iran
ABSTRACT
As it is important to use the preventive and therapeutic effects of exercise and physical activity in the management of suicidal patients, we primarily need to know physical activity level of suicidal patients. However there are little data in this topic. The females to male ratio of patients were about 2.1:1. with the average age of 29.7, minimum 13 and maximum 88 years, with standard deviation of 12.1. Physical activity level of majority (76.4 percent) of patients was in the range of low (less than 600 Metabolic equivalent/minute per week). Other variables except sex were not associated signifi cantly with the physical activity level of patients. Physical activity level was signifi cantly lower in females than males (P = 0.001, Chi square test). Low physical activity level and female sex are possible risk factors for drug suicidal attempts in Iranian patients.
KEY WORDS: EXERCISE, MENTAL HEALTH, PHYSICAL ACTIVITY, POISONING, SUICIDE
419
ARTICLE INFORMATION:
*Corresponding Author: [email protected] 27th Nov, 2016Accepted after revision 26th Jan, 2017 BBRC Print ISSN: 0974-6455Online ISSN: 2321-4007 CODEN: USA BBRCBA
Thomson Reuters ISI ESC and Crossref Indexed Journal NAAS Journal Score 2017: 4.31 Cosmos IF: 4.006
© A Society of Science and Nature Publication, 2017. All rights reserved.Online Contents Available at: http//www.bbrc.in/DOI: 10.21786/bbrc/10.3/14
INTRODUCTION
Suicide is a global public health problem. Annually, almost 1 million people die in suicides worldwide (Turecki et al. 2015). The global suicide rate in 2008 was about 11.6 per 100,000. However, suicide has an increas-
ing incidence and it is estimated to be for more than 2% of the global burden of disease by the year 2020 (Behmanehsh Poor et al. 2014). Demographic, social, and cultural factors can affect suicidal epidemiology (Mirhashemi et al. 2016). As suicide is condemned in Islam, the suicidal rate is low in most Islamic countries,

420 INVESTIGATIONS ON THE PHYSICAL ACTIVITY LEVEL OF SOME IRANIAN DRUG SUICIDAL PATIENTS BIOSCIENCE BIOTECHNOLOGY RESEARCH COMMUNICATIONS
Maryam Hajain et al.
yet it has shown to have increasing rate in recent years (Pritchard et al. 2007). According to the last WHO report, the reported suicide rates in Iran per 100,000 was 5.3 in both sexes: 3.6 in females and 7.0 in males (Mirhashemi et al. 2016) but fi gure nearly 2 times greater for average suicide rate (9.9 per 100,000) was measured based on data elucidation (Hassanian-Moghaddam et al. 2017). Suicide and attempted suicide rates in Iran increased from 8.3 per 100,000 in 2001 to 19.4 in 2005, then declined to 16.3 in 2007 (Saberi-Zafaghandi et al. 2012). However, the offi cially reported fi gures for suicide are lower than what really occurred (Malakouti et al. 2015). Suicide with drug and self-immolation are two most common reported methods of suicide in Iran (Nazarzadeh et al. 2013, Poorolajal et al. 2015).
Physical training and an active lifestyle have been used as major public health tools in the prevention and treatment of many physical diseases including cardiovas-cular and metabolic diseases (Peluso et al. 2005). Also, the effects of exercise on the brain, cognitive function, and behavior have been of interest (Deslandes 2014). Based on several epidemiological studies, it has been shown that exercise and physical activity can have preventive or delaying effects on the onset of different mental dis-orders, and also can be used as therapeutic tools solely or in adjunct with other treatments for mental disorders (Zschucke et al. 2013). About 90% of individuals who had successful suicide had an identifi able psychiatric disorder before death (Arsenault-Lapierre et al. 2004) and at least 50% of suicide deaths are related to depressive episodes, either as major depressive disorder or bipolar disorder (Holma et al. 2014). In a Cochrane review which com-pared exercise intervention with no treatment, or with standard interventions (cognitive therapy and pharma-cotherapy) in the management of depressive symptoms, a moderate clinical effect was found for exercise, which indicated that exercise was as effective as these standard treatments (Rimer et al. 2012). In a recent cross-sectional study which examined the relationship between suicidal thoughts (ST) and suicidal attempts (SA) and the level of physical activity (PA) among South Korean adolescents, there was an inverse dose-response relationship between the level of physical activity (defi ned as vigorous, moder-ate, and low) and ST and SA (Cho 2014). Also, in urban areas of the Iran, suicide is more common than rural areas (Shirazi et al. 2012). The cause of higher rate of suicide in cities may be related to lifestyle factors including more stress and lower physical activity level which can be the result of air pollution (Hajian et al. 2015).
Hajain et al. (2015) compared with those in rural areas. As it is important to use the preventive and thera-peutic effects of exercise and physical activity in the management of suicidal patients, we primarily need to know physical activity level of suicidal patients in Iran.
There is no data on the physical activity level of sui-cidal patients in Iran. So, the aim of the present study was to investigate physical activity level of drug suicidal patients in a referral hospital of poisoning management in Tehran.
MATERIAL AND METHODS
In the current cross-sectional study, the Persian-trans-lated long form interview-administered International Physical Activity Questionnaire (IPAQ) was used for assessing physical activity level of 406 drug suicidal patients who were admitted to poisoning ward of Loghman Hospital (the next morning after admission) between December 2014-April 2015. The validity and reliability of this version of IPAQ have already been proven in Iranian sample of individuals (Vasheghani-Farahani et al. 2011). After obtaining the consent form, interview was conducted by an expert with alive drug suicidal patients who had good consciousness level and cooperation or with close relatives of the patients who were informed about the physical activity habits of the patients. The results were expressed as low (less than 600 metabolic equivalent (MET). minute per week), medium (between 600 to 3000 MET. minute per week), and high (more than 3000 MET. minute per week) level of physi-cal activity. Also, the patients were asked about their age, weight, marital and educational statuses, number of children, absence or presence, and in this case, the type of background mental disorders, the history and the number of previous suicide attempt(s). The data was then analyzed using SPSS (v. 16) and related statistical tests (ANOVA test for quantitative and Chi square test for qualitative variables).
RESULTS
Totally, 406 patients were evaluated: 278 females (68.4%) and 128 males (31.6%) with the average age of 29.7, minimum 13 and maximum 88 years, with stand-ard deviation of 12.1. The average weight of patients was 64.8 kilograms, minimum 37 and maximum 145 kilograms, with standard deviation of 15.6. Other epi-demiologic characteristics of patients are provided in Table 1. A total of 310 patients (76.4%) had low physi-cal activity level, 80 patients (19.7%) medium, and 16 patients (3.9%) had high physical activity level. There were no signifi cant differences in weight, number of chil-dren, and suicide history, marriage and educational status between patients with different physical activity levels (p value more than 0.05). There was signifi cant difference in terms of different physical activity levels between the two sexes (p value = 0.001), which means females in low

BIOSCIENCE BIOTECHNOLOGY RESEARCH COMMUNICATIONS INVESTIGATIONS ON THE PHYSICAL ACTIVITY LEVEL OF SOME IRANIAN DRUG SUICIDAL PATIENTS 421
Maryam Hajain et al.
Table 2. Physical activity levels of drug suicidal patients according to sex of them
Physical activity Level Total
low moderate highSex female 224 49 5 278
Percent 80.6% 17.6% 1.8% 100%
male 86 31 11 128
Percent 67.1% 24.2% 8.7% 100%
Total 310 80 16 406
Percent 76.4% 19.7% 3.9% 100.0%
Table 1. Demographic properties of drug suicidal patients
Variable Description Number Percent
Marriage status
Single 187 46.1
Married 202 49.8
Divorce 17 4.2
Number of children
0-1 320 79
2-3 71 17.5
More than 3 15 3.5
Education
Up to Diploma 305 75.1
Diploma to BSc 86 21.1
MSc and higher 15 3.6
Mental disorder (according to patient’s statement)
No disease 317 78.1
Depression 52 12.8
Anxiety 3 .7
Psychosis 2 .5
Bipolar 4 1.0
Other 20 4.9
0 245 60.3
History of suicide
1 70 17.2
2 15 3.7
3 14 3.4
4 5 1.2
5 4 1.0
6 3 .7
7 1 .2
physical activity group had relatively higher percentage than their male counterparts and males in moderate and high physical activity groups had relatively higher per-centage than their female peers.(Table 2).
DISCUSSION
According to the fi ndings of the present study, from among 406 drug suicidal patients admitted to Loghman
Hospital, the majority (76.4% percent) had low physical activity level. In a randomized cross over trial in high-level suicide risk patients, regular endurance training in the form of mountain hiking was shown to reduce hope-lessness, depression, and suicide ideation (Sturm et al. 2012). Moreover, the moderate level of evidence has been reported for the inverse dose-response relationship between mental disorders (depression and distress) and physical activity level in the latest guideline for exercise testing and prescription of American College of Sports Medicine (ACSM) (Ferguson 2014).
The mechanisms whereby exercise and physical activity induce positive psychological health are diverse and complex. Broadly, it can be divided into reducing stress response, minimizing excessive infl ammation, and enhancing growth factor expression and neural plastic-ity. Physical fi tness, achieved through regular exercise and/or spontaneous physical activity blunts stress reac-tivity, protects against potentially adverse behavioral and metabolic consequences of stressful events of life (Silverman et al. 2014).
Physical activity level of the patients of the preset study was measured by IPAQ includes both physical activity and exercise, i.e. a type of physical activity that is planned, structured, repetitive, and purposeful (Carek et al. 2011). Although much of the research on posi-tive psychological effects of exercise has been done on aerobic exercise, resistance exercise or strength training can also induce many physiological and psychological advantages. Increase in cognition and self-esteem, and decrease in depression and anxiety after both single-bout sessions and long-term resistance training have been identifi ed in growing body of literature (Strickland et al. 2014). Also there are evidences that indicate that outdoor physical activity interventions such as moun-tain hiking, stimulates higher positive and lower nega-tive affective responses compared to an indoor physical activity condition(Niedermeier et al. 2017).
In our study, the majority (68.4 percent) of drug sui-cidal patients were female. Also, the female to male ratio was higher in low physical activity level group. These sexual differences have been seen in the previous studies (Esteghamati et al. 2011, Koohpayehzadeh et al. 2014), as well, and may be due to Iranian cultural and social backgrounds which encourage men to be more physi-cally active compared with women.
The most common underlying mental disorder in our study was depression. Depression was also found in other studies as a risk factor for suicide and suicidal thought and self-destructive behavior in Iranian people (Ekramzadeh et al. 2012, Dabaghzadeh et al. 2015). It has been reported that the risk of suicide is increased by more than 50 percent in depressed individuals and it is about 20 times that of the general population in people

422 INVESTIGATIONS ON THE PHYSICAL ACTIVITY LEVEL OF SOME IRANIAN DRUG SUICIDAL PATIENTS BIOSCIENCE BIOTECHNOLOGY RESEARCH COMMUNICATIONS
Maryam Hajain et al.
with major depression (Baek et al. 2015). There is now compelling evidence that lifestyle factors including diet, physical activity and exercise, relaxation and meditative techniques, quality of sleep, environmental pollutants, and social support are signifi cant in the pathogenesis and treatment of depression; moreover, epidemiological studies have shown that low physical activity can be a risk factor for the development of depressive symptoms and that regular physical activity in early years of life is linked with reduced risk of experiencing depression in adulthood (Sarris et al. 2014).
Therefore, prevention of depression and other mental disorders by doing regular physical activity and exercise is a cost-effective approach for people who experience higher rates of mental illness compared with the general population. Indeed, mandatory physical exercise for the prevention of mental illness has been proposed for medi-cal students in USA (Bitonte et al. 2014) as high prevalence of depression and anxiety has been reported among USA and Canada medical students, with levels of overall psy-chological distress indicators consistently higher than that in the general population and age-matched peers (Dyrbye et al. 2006). This approach can be used in the public sui-cide prevention programs too, as exercise has been shown to improve stress management ability, general feelings of well-being, and self-esteem and can act as a nonspecifi c psychological therapy (Kaminsky et al. 2006).
CONCLUSION
Low physical activity level and female sex are possible risk factors for drug suicidal attempts in Iranian patients. More precisely designed studies are needed to evaluate the relationship between physical activity and suicidal attempts in females. Promotion of increasing physical activity and exercise for patients at risk of suicide espe-cially females, are recommended.
LIMITATIONS
The study was done in a drug poisoning management center and suicidal patients with causes other than drug poisoning were not included. Also the cases were alive patients and the dead ones were not included.
ACKNOWLEDGMENT
The fund of this study was provided by research pro-posal number 4589 of Shahid Beheshti university of medical sciences, Clinical Research Development Center of Loghman Hakim Hospital.
CONFLICT OF INTEREST
There is no confl ict of interest.
REFERENCES
Arsenault-Lapierre, G., Kim, C. Turecki, G. (2004).Psychiatric diagnoses in 3275 suicides: a meta-analysis.BMC Psychiatry 4: 37-37.
Baek, J. H., Park, J.-I., Ahn, J., Roh, S.-w., Heo, J.-Y., Fava, M., Mischoulon, D. Jeon, H. J. (2015).Review of Suicide Prevention Programs: Massachusetts, United States, in Comparison with Seoul.Psychiatry Investigation 12(3): 281-287.
Behmanehsh Poor, F., Tabatabaei, S. M. Bakhshani, N. M. (2014).Epidemiology of Suicide and its Associated Socio-demographic Factors in Patients Admitted to Emergency Department of Zahedan Khatam-Al-Anbia Hospital.Int J High Risk Behav Addict 3(4): e22637.
Bitonte, R. A. DeSanto, D. J., 2nd (2014).Mandatory physical exercise for the prevention of mental illness in medical stu-dents.Ment Illn 6(2): 5549.
Carek, P. J., Laibstain, S. E. Carek, S. M. (2011).Exercise for the treatment of depression and anxiety.Int J Psychiatry Med 41(1): 15-28.
Cho, K. O. (2014).Physical Activity and Suicide Attempt of South Korean Adolescents - Evidence from the Eight Korea Youth Risk Behaviors Web-based Survey.J Sports Sci Med 13(4): 888-893.
Dabaghzadeh, F., Jabbari, F., Khalili, H. Abbasian, L. (2015).Associated Factors of Suicidal Thoughts in HIV-Positive Indi-viduals.Iran J Psychiatry 10(3): 185-191.
Deslandes, A. C. (2014).Exercise and Mental Health: What did We Learn in the Last 20 Years?Frontiers in Psychiatry 5: 66.
Dyrbye, L. N., Thomas, M. R. Shanafelt, T. D. (2006).Systematic review of depression, anxiety, and other indicators of psycho-logical distress among U.S. and Canadian medical students.Acad Med 81(4): 354-373.
Ekramzadeh, S., Javadpour, A., Draper, B., Mani, A., Withall, A. Sahraian, A. (2012).Prevalence and correlates of suicidal thought and self-destructive behavior among an elderly hospital popula-tion in Iran.Int Psychogeriatr 24(9): 1402-1408.
Esteghamati, A., Khalilzadeh, O., Rashidi, A., Kamgar, M., Mey-samie, A. Abbasi, M. (2011).Physical activity in Iran: results of the third national surveillance of risk factors of non-communi-cable diseases (SuRFNCD-2007).J Phys Act Health 8(1): 27-35.
Ferguson, B. (2014).ACSM’s Guidelines for Exercise Testing and Prescription 9th Ed. 2014.The Journal of the Canadian Chiropractic Association 58(3): 328-328.
Hajain, M. Mohaghegh, S. (2015).Indoor air pollution in exer-cise centers.Int J medical toxicology and forensic medicine 5(1): 22-31.
Hassanian-Moghaddam, H. Zamani, N. (2017).Suicide in Iran: The Facts and the Figures from Nationwide Reports.Iranian Journal of Psychiatry 12: 5.
Holma, K. M., Haukka, J., Suominen, K., Valtonen, H. M., Man-tere, O., Melartin, T. K., Sokero, T. P., Oquendo, M. A. Isom-etsa, E. T. (2014).Differences in incidence of suicide attempts between bipolar I and II disorders and major depressive disor-der.Bipolar Disord 16(6): 652-661.

Maryam Hajain et al.
BIOSCIENCE BIOTECHNOLOGY RESEARCH COMMUNICATIONS INVESTIGATIONS ON THE PHYSICAL ACTIVITY LEVEL OF SOME IRANIAN DRUG SUICIDAL PATIENTS 423
Kaminsky, L. A. Medicine, A. C. o. S. (2006). ACSM’s resource manual for guidelines for exercise testing and prescription, Lippincott Williams & Wilkins Baltimore, MD.
Koohpayehzadeh, J., Etemad, K., Abbasi, M., Meysamie, A., Sheikhbahaei, S., Asgari, F., Noshad, S., Hafezi-Nejad, N., Rafei, A., Mousavizadeh, M., Khajeh, E., Ebadi, M., Nakhjavani, M. Esteghamati, A. (2014).Gender-specifi c changes in physical activity pattern in Iran: national surveillance of risk factors of non-communicable diseases (2007-2011).Int J Public Health 59(2): 231-241.
Malakouti, S. K., Davoudi, F., Khalid, S., Ahmadzad Asl, M., Moosa Khan, M., Alirezaei, N., Mirabzadeh, A. DeLeo, D. (2015).The Epidemiology of Suicide Behaviors among the Countries of the Eastern Mediterranean Region of WHO: a Systematic Review.Acta Med Iran 53(5): 257-265.
Mirhashemi, S., Motamedi, M. H., Mirhashemi, A. H., Taghipour, H. Danial, Z. (2016).Suicide in Iran.Lancet 387(10013): 29.
Nazarzadeh, M., Bidel, Z., Ayubi, E., Asadollahi, K., Carson, K. V. Sayehmiri, K. (2013).Determination of the social related fac-tors of suicide in Iran: a systematic review and meta-analysis.BMC Public Health 13: 4.
Niedermeier, M., Einwanger, J., Hartl, A. Kopp, M. (2017).Affective responses in mountain hiking—A randomized crosso-ver trial focusing on differences between indoor and outdoor activity.PloS one 12(5): e0177719.
Peluso, M. A. Guerra de Andrade, L. H. (2005).Physical activity and mental health: the association between exercise and mood.Clinics (Sao Paulo) 60(1): 61-70.
Poorolajal, J., Rostami, M., Mahjub, H. Esmailnasab, N. (2015).Completed Suicide and Associated Risk Factors: A Six-Year Population Based Survey.Archives of Iranian Medicine 18(1): 39-43.
Pritchard, C. Amanullah, S. (2007).An analysis of suicide and undetermined deaths in 17 predominantly Islamic countries contrasted with the UK.Psychol Med 37: 421-430.
Rimer, J., Dwan, K., Lawlor, D. A., Greig, C. A., McMurdo, M., Morley, W. Mead, G. E. (2012).Exercise for depression.Cochrane Database Syst Rev 7: CD004366.
Saberi-Zafaghandi, M. B., Hajebi, A., Eskandarieh, S. Ahmadzad-Asl, M. (2012).Epidemiology of suicide and attempted suicide derived from the health system database in the Islamic Republic of Iran: 2001-2007.East Mediterr Health J 18(8): 836-841.
Sarris, J., O’Neil, A., Coulson, C. E., Schweitzer, I. Berk, M. (2014).Lifestyle medicine for depression.BMC Psychiatry 14: 107.
Shirazi, H. R., Hosseini, M., Zoladl, M., Malekzadeh, M., Mome-ninejad, M., Noorian, K. Mansorian, M. A. (2012).Suicide in the Islamic Republic of Iran: an integrated analysis from 1981 to 2007.East Mediterr Health J 18(6): 607-613.
Silverman, M. N. Deuster, P. A. (2014).Biological mechanisms underlying the role of physical fi tness in health and resilience.Interface Focus 4(5): 20140040.
Strickland, J. C. Smith, M. A. (2014).The anxiolytic effects of resistance exercise.Frontiers in Psychology 5: 753.
Sturm, J., Ploderl, M., Fartacek, C., Kralovec, K., Neunhauserer, D., Niederseer, D., Hitzl, W., Niebauer, J., Schiepek, G. Farta-cek, R. (2012).Physical exercise through mountain hiking in high-risk suicide patients. A randomized crossover trial.Acta Psychiatr Scand 126(6): 467-475.
Turecki, G. Brent, D. A. (2015).Suicide and suicidal behaviour.Lancet.
Vasheghani-Farahani, A., Tahmasbi, M., Asheri, H., Ashraf, H., Nedjat, S. Kordi, R. (2011).The Persian, last 7-day, long form of the International Physical Activity Questionnaire: translation and validation study.Asian J Sports Med 2(2): 106-116.
Zschucke, E., Gaudlitz, K. Ströhle, A. (2013).Exercise and Phys-ical Activity in Mental Disorders: Clinical and Experimental Evidence.Journal of Preventive Medicine and Public Health 46(Suppl 1): S12-S21.
Medical CommunicationBiosci. Biotech. Res. Comm. 10(3): 424-430 (2017)
Bond strength of porcelain to cobalt chromium dental
alloy fabricated by selective laser melting and casting
methods
Fariborz Vafaee1, Farnaz Firouz1, Parisa Alirezaii2, Kusha Gholamrezaii2 and Sara Khazaei1*1Associate Professor, Department of Prosthodontics, School of Dentistry, Hamadan University of Medical Sciences, Hamadan, IR Iran2Assistant Professor, Department of Prosthodontics, School of Dentistry, Shahid Beheshti University of Medical Sciences, Tehran, IR Iran
ABSTRACT
This study aimed to compare the bond strength of porcelain to cobalt-chromium dental alloy fabricatedby selective laser melting (SLM) and casting methods.Twelve rectangular barsmeasuring 25x3x0.5 mmwere fabricated of cobalt-chromium alloy for each of the SLM and casting groupsaccording to ISO9693:1999. Porcelain was appliedat the center of each bar measuring 3 8 mm with 1 mm thickness. Three-point fl exural bond strength test was performed to assess the bond strength of porcelain to alloy. Data were analyzed and compared between the SLM and casting groups via Independent sample t-test (alpha=0.05). Mode of failure was also determined by visual inspection of samples. The mean bond strength of porcelain to SLM alloy (35.26±1.22 MPa) was signifi cantly higher than that to casting alloy (33.21±3.02 MPa) (P<0.05). Most failures in both groups were mixed and no sample showed adhesive failure. The SLM metal-ceramic system showed higher bond strength than the required threshold by ISO9693:1999. Compared to alloys fabricated by the casting method, the SLM method showed higher bond strength to porcelain. This relatively new technology is promising for dental application and can serve as a suitable alternative to the conventional casting method for the fabrication of metal-ceramic restorations.
KEY WORDS: SHEAR STRENGTH; METAL-CERAMIC; LASER MELTING
424
ARTICLE INFORMATION:
*Corresponding Author: [email protected] 23rd June, 2017Accepted after revision 24th Sep, 2017 BBRC Print ISSN: 0974-6455Online ISSN: 2321-4007 CODEN: USA BBRCBA
Thomson Reuters ISI ESC and Crossref Indexed Journal NAAS Journal Score 2017: 4.31 Cosmos IF: 4.006
© A Society of Science and Nature Publication, 2017. All rights reserved.Online Contents Available at: http//www.bbrc.in/DOI: 10.21786/bbrc/10.3/15

Fariborz Vafaee et al.
BIOSCIENCE BIOTECHNOLOGY RESEARCH COMMUNICATIONS BOND STRENGTH OF PORCELAIN TO COBALT CHROMIUM DENTAL ALLOY FABRICATED 425
INTRODUCTION
Metal-ceramic systems for dental restorations are avail-able since the 1960sand the success of metal-ceramic restorations depends on the strength and uniformity of bond at the metal-porcelain interface, which is the most sensitive area in terms of crack formation (Bowers 1985) and (Drummond and et al 1984, Pavlovic
` 2017 and
Abduo 2017). Cracks mainly occur at the metal-ceramic interface or within the veneering porcelain (Daftary 1986) and (Zhukovsky 1996). Factors such as trauma, fatigue, occlusal loads and incompatibility between the mechanical properties of metal and porcelain may result in porcelain fracture especially of cohesive type (Pamei-jer 1996 and Kelsey 2000,Ren 2016 and Kaleli 2017). Metal-ceramic frameworks are conventionally fabri-cated using the lost wax casting (Anusavice 2003) and (Kaleli 2017).
However, problems associated with casting of base metal alloys such as high melting point, high oxidation potential during casting, time consuming nature of cast-ing and fi nishing of these alloys, limit their application. Thus, application of a technique to eliminate the casting process may enhance the use of these alloys (Bhaskaran 2013) and (Akova 2008).
The selective laser melting (SLM) technology, also known as the three-dimensional (3D) printing, was introduced for the fabrication of metal copings in metal-ceramic crowns. This technique does not have many of the limitations of the conventional waxing technique, so thatthe restorations are fabricated by incremental appli-cation of 0.02 μ layers (Xin 2012). This technique works based on the computer aided design (CAD) data obtained from the framework design, and uses high temperature laser beams for selective melting of metal framework, which is in the form of powder. The metal framework is formed by incremental addition of these thin layers (Akova 2008).
The success of SLM is related to its ability in fabri-cation of metal components with complex geometrical shapes from a 3D CAD model. Moreover, this technique can produce components with mechanical properties comparable or superior to those of conventionally fabri-cated components (Örtorp 2011) and (Quante 2008).Thus, it can be an alternative to the conventional process. Only a few studies have assessed the bond strength of porce-lain to alloys fabricated by the SLM technique. Some of these studies have reported superior mechanical proper-ties for copings fabricated by this method and higher bond strength of porcelain compared to those fabricated by the conventional casting method ,while some others found no signifi cant difference in bond strength of por-celain between the two groups (Liu YH 2010) and (Wu 2014) and (Ren 2016).
Considering the gap of information and the contro-versies in this regard, this study aimed to assess the bond strength of cobalt-chromium (CoCr) alloy fabricated by the SLM technique and the conventional wax burnout and casting method.
MATERIALS AND METHODS
This in vitro, experimental study was conducted on 24 samples (12 fabricated by conventional casting and 12 fabricated by the SLM technique). In the casting group,12rectangular bars were fabricated measuring 25 mm ± 1mm × 3 mm ± 0.1 mm × 0.5 mm ± 0.05 mmac-cording to the ISO9693-1 (The International Organiza-tion for Standardization 2012) using green wax sheets (Berg, Karl Berg GmbH, Engen, Germany). They were spruedand fl asked using phosphate-bonded investment material. After wax burnout at 650°C, melted CoCr was poured into the space created by wax burnout using a standard broken-arm centrifugal casting machine (Kerr, Orange, CA, USA). Metal sheets were cleaned from investment material and the sprues were cut. Dimensions were adjusted and the thickness of sheets was ensured by a caliper and gauge.
In the SLM group, 12 samples were fabricated with the same dimensions as those in the casting group using EOSINT M270 machine (Manufacturing system; Bego, Bremen, Germany).This device was equipped with ytter-bium laser fi ber with less than 200 W laser power, scan-ning speed of 5-10 mm/second, wavelength of 1060-1100 nm, beam diameter of 100-500 μm and powder feed rate of 5-7 g/minute. Using data obtained from a CAD fi le with STL format, the device fused metal particles and after scanning each cross-section, the alloy thickness decreased by one layer and a new layer of alloy was applied on the upper surface. This process was repeated until the entire restoration was formed. Table 1 shows the composition of CoCr alloy used for the casting (WBC 9581TM, Bego, Germany) and SLM (EOS Cobalt Chrome SP2; EOSGmbH, Germany) techniques.
The samples in both groups were then subjected to air-borne particle abrasion for fi ve seconds (with 110-250 μ aluminum oxide particles at 3-4 MPa pressure for the SLM alloy and 120 μ aluminum oxide particles at 0.35 MPa pressure for the casting alloy) to provide sur-face roughness similar to the standard process practiced in the clinical setting. The samples were then cleaned with vapor spray for six seconds. Pre-oxidation was then performed according to the manufacturer’s instruc-tionsat 950-980°C for fi ve minutes for SLM and 980°C for eight minutes for the casting alloy. Air-borne particle abrasion was then performed again and before porcelain application, the samples were cleaned in an ultrasonic

Fariborz Vafaee et al.
426 BOND STRENGTH OF PORCELAIN TO COBALT CHROMIUM DENTAL ALLOY FABRICATED BIOSCIENCE BIOTECHNOLOGY RESEARCH COMMUNICATIONS
Table 1. Composition of CoCr alloy used for the casting and SLM techniques according to the manufacturers (wt%)
Group Co Cr Mo W Si Nb V Fe Mn Ce
SLM alloy 63.9 25.3 5.2 5.5 1 – – Max 0.5 Max 0.1 –
Cast alloy 61 26.6 5 <2 – – <2 – – <2
Co, cobalt; Cr, chromium; Mo, molybdenum; W, tungsten; Si, silicon; Nb, niobium; V, vanadium;Fe, iron; Mn, manganese; Ce ,Cerium; SLM, selective laser melting; max, maximum.
FIGURE 1. Casting group samples
FIGURE 2. SLM group samples
bath containing 95% ethanol (Elmasonic, Elma Hans GmbH & Co, Koln, Germany) for fi ve minutes.
Next, equal layers of opaque and body porcelain (VMK 95, Vita, Bad Säckingen, Germany) with 8 mm length, 3 mm width and 1 mm thickness (0.2 mm opaque porcelain and 0.8 mm body porcelain) were applied and baked according to the manufacturer’s instructions
FIGURE 3. Silicon index used for porcelain application
FIGURE 4. Three-point fl exural test
(Figures 1 and 2). For the purpose of standardization of porcelain thickness, a silicon index was used for all sam-ples (Figure 3). To minimize the effect of confounders, all procedures were performed by one operator.
A three-point fl exural strength test was performed according to the ISO9693-1 standard using a universal testing machine (Z020, Zwick Roell, Germany) .Surface of the sample with porcelain over it was placed down-ward and the two ends of each rod were placed on the supporting fulcrums with 0.9 mm diameter and 20 mm distance from each other. Load was applied to the center of each sample by a crosshead with 0.9 mm diameter at a speed of 1 mm/minute(fi gure 4). Load application was continued until failure (abrupt drop in the stress-strain curve). The load at failure was recorded and reported by the computer. Bond strength in megapascals (MPa) was calculated using the formula A= k x F (N/mm2) where k

Fariborz Vafaee et al.
BIOSCIENCE BIOTECHNOLOGY RESEARCH COMMUNICATIONS BOND STRENGTH OF PORCELAIN TO COBALT CHROMIUM DENTAL ALLOY FABRICATED 427
FIGURE 5. the surface morphology of metal matrix in casting sample(the upper) and inSLM sample (the lower)
is a constant related to thickness and modulus of elastic-ity of the alloy and F is the maximum load in Newtons causing debonding.
After conduction of fl exural test, the samples were visually inspected to determine the mode of failure. Mode of failure was divided into three groups of adhe-sive( at the metal-porcelaininterface), cohesive (com-pletely within the porcelain) and mixed (a combination of adhesive and cohesive types).
Finally, Data were analyzed by Independent samples t-test.
RESULTS AND DISCUSSION
Table 2 shows the mean and standard deviation of bond strength in the two groups.
Independent samples t-test was used to compare the mean values between the two groups, which showed that the mean bond strength of porcelain was signifi -cantly higher to alloy in SLM group compared to the casting group (p=0.04).
Inspection of the surface of samples in the SLM group before porcelain applying showed that the surface of bars in the SLM group was dark gray without metal shine. Figure 5 shows photography of the surface morphology of metal matrix of the one sample of each group after porcelain debonding. Visual inspection of each sample during fl exural strength testing showed that debonding cracks between metal and ceramic occurred at one end of the ceramic layer and not at the center.
In terms of mode of failure, in the SLM group, most failures were mixed and no adhesive failure was noted. In the casting group, all failures were mixed (Table 3).
DISCUSSION
Failure of the metal-porcelain bond can occur as the result of a combination of factors such as different coef-fi cients of thermal expansion of metal and ceramic, pres-ence of micro-cracks within the porcelain and occlusal loads or trauma. Loss of porcelain to metal bond is the second most common cause of replacement of metal-ceramic restorations [18]. The reason for use of SLM technology in this study was the recent introduction of this technique and its numerous advantages. The SLM technique enables the fabrication of restorations with a more uniform quality and standardization of restoration shaping process with lower cost, requiring less human force, saving time due to elimination of many proce-dural steps (compared to the conventional method) and elimination of human errors. Moreover, CAD, compared to manual waxing, results in more accurate control of the porcelain thickness and decreased risk of fracture. SLM scanners have disadvantages as well including limitation of scanning systems in terms of resolution and creating rounder margins as well as creation of cloudy spots caused by scanning, which result in inter-nal mismatch (Walton 1986) and (Huang 2015) and (Li 2014). High cost of laser device used in this technique is another disadvantage of this method.Also, the CoCr alloy
Table 2. Mean and standard deviation of bond strength in the two groups (MPa)
Group Mean± standard deviationSLM 35.26 ±1.22
Casting 33.21 ± 3.02
Table 3. Mode of failure in the two groups
Group Adhesive failure
Cohesive failure
Mixed failure
SLM 0 5 7
Casting 0 0 12
Fariborz Vafaee et al.
428 BOND STRENGTH OF PORCELAIN TO COBALT CHROMIUM DENTAL ALLOY FABRICATED BIOSCIENCE BIOTECHNOLOGY RESEARCH COMMUNICATIONS
fabricated by the SLM method has not shown any cyto-toxic potential and evidence shows that ithas higher corrosion resistance and lower release of cobalt ion compared to the casting group (Xin 2012).
Among the suggested tests for assessment of bond strength, Schwickerath crack initiation test or three-point fl exural strength test was fi rst suggested by Lenz et al, and is alsorecommended by the ISO9693:1999(E) for determination of debonding strength of metal-ceramic systems(Lenz 1995). Although several mechani-cal tests such as fl exural, torsional, shear, tensile or a combination of fl exural and shear tests can be used for assessment of the bond strength at the metal-ceramic interface, the validity of the bond strength assessment tests is still questionable (Kontonasaki 2008).
The three-point fl exural strength test reveals the modulus of elasticity, fl exural strain, fl exural stress and fl exural stress-strain response of a material. The main advantage of this test is easy sample preparation and conduction. However, it has drawbacks as well. One drawback is that the test result is affected by the geom-etry of samples, load application and speed of strain application (Kontonasaki 2008). For this reason, in the current study, we tried our best to control for all the confounding factors that had the potential to affect the results such as speed of load application (crosshead speed), distance between the two fulcrums and dimen-sions of the samples. All samples were fabricated with the same dimensions. Also, a custom-made silicon index was used for control of the length and thickness of ceramic layer when applying the porcelain.
In order to acceptably compare the bond strength of ceramic to metal between restorations fabricate by two different techniques, the materials used should be the same in terms of behavior with regard to the formation of oxide layer, coeffi cient of thermal expansion, etc. as much as possible (Kontonasaki 2008) and (Zinelis 2003). Therefore, in the current study, alloys with the most similar composition were chosen for SLM and casting groups in order to minimize the effect of elements in the composition of alloys and assess the pure effect of fabrication method on the results .
The bond between the porcelain and metal can be achieved bythree mechanisms of van der Waals forces, mechanical retention and chemical bond; chemical bond is the dominant factor responsible for metal-porcelain bond. Chemical bond is infl uenced by the composition of elements in the alloy and formation of oxide layer on the metal surface. Due to the signifi cance of the thick-ness of oxide layer in a successful bond, the pre-oxida-tion phase of alloy was performed for both groups in our study prior to the addition of porcelainaccording to the manufacturer’s instructions (Bagby 1990) and (Jochen 1986).
In this study, the SLM group showed higher porce-lain bond strength compared to the casting group, which was in line with the results of Liu et al [14]. One pos-sible reason for higher bond strength of the SLM group was the surface properties of this alloy. The SLM sys-tem works based on incremental application of melted powders. The surfaces of fabricated components by the SLM technique often have sticky powder. In other words, relatively melted powders are added to the surface of components and make them rougher (Zhang 2014). Due to the inherent roughness of the surface ofSLM sam-ples and according to the results of a study by Zhang (Zhang 2014), it may be stated that these surfaces can increase the contact area of framework and porcelain. At the same time, surface porosities can provide strong micromechanical retention for porcelain and enhance the bond strength (Zhang 2014).
Another possible explanation is penetration of porce-lain into the gaps created between layers as well as the balling phenomenon during incremental fabrication by the laser sintering process, which increase the contact area and bond strength by creation of undercuts (Eun-Jeong 2014) and (Gu D 2007).
The fact that all tested samples in our study yielded higher bond strength than the minimum strength required by ISO9693:1999(E), which is 25 MPs shows that the alloy fabricated by the SLM technique can not only provide an acceptable bond for clinical applica-tion, it even yields higher bond strength than the cast-ing method. Akova and Serra-Prat in separate studies showed that despite higher bond strength of the casting group, the difference between the casting and SLM tech-niques did not reach statistical signifi cance (Serra-Prat 2014). Controversy between their results and ours may be attributed to the different form of samples (cylindri-cal) and assessment of shear bond strength instead of fl exural bond strength.
Xiang and Ren found no signifi cant difference in bond strength of the SLM and casting groups; although the values obtained in the SLM group were higher in both studies (Xiang 2012). Difference between their results and ours may be due to difference in the load application speed for fl exural test, difference in laser system and composition of alloys used and size of sand-blasting particles.
Inspection of the surface of samples in the SLM group before porcelain applying revealed that the surface of bars in the SLM group was dark gray and had no metal shine in our study. The reason may be that the metal powder particles are fused on the surface of components fabricated by the SLM method; thus, the samples show a color similar to that of metal powder particles.
Visual observation of each sample during the fl exural strength testing revealed that the debonding cracks at
Fariborz Vafaee et al.
BIOSCIENCE BIOTECHNOLOGY RESEARCH COMMUNICATIONS BOND STRENGTH OF PORCELAIN TO COBALT CHROMIUM DENTAL ALLOY FABRICATED 429
the metal-ceramic interface occurred at one end of the ceramic layer and not at the center of it, which was in agreement with ISO9693:1999(E) standards. Evaluation of surface morphology of metal matrix after porcelain debonding showed that the color was different at the center and at the ends of the samples. This indicated that the ceramic layer was still present on the entire surface of samples. Moreover, mode of metal-ceramic debond-ing may indicate the fracture energy that degrades the metal-ceramic bond. The higher the amount of porce-lain body remaining on the metal surface, the higher the adhesion of porcelain body to metal, the higher the fracture energy and the lower the risk of porcelain frac-ture would be in the clinical setting (Wagner 1993) and (Lavine 1966). Five samples in the SLM group showed cohesive failure while in the casting group, all fractures were mixed. The reason is probably the higher bond strength of the SLM group. Since after debonding high amounts of porcelain remained on the alloy surface, it may be concluded that a strong bond was created between dental porcelain and SLM alloy at the interface. Thus, this technique can increase the success rate of por-celain fused to metal restorations.
Since this study had an in vitro design, the SLM alloy should also be evaluated in the oral cavity. Also, it is recommended to assess the marginal fi t of copings fab-ricated by this technique. The bonding interface should be evaluated using scanning electron microscope and energy-dispersive X-ray spectroscopy in future studies. The microstructure of SLM alloy must also be analyzed under a metallographic microscope.
CONCLUSION
The SLM alloy system not only provides a clinically accept-able bondstrength , the bond strength of restorations fab-ricated by this method to porcelain was even higher than that of restorations fabricated by the conventional casting method. Thus, this relatively new technology can serve as an alternative to the conventional casting method for the fabrication of metal-ceramic restorations.
ACKNOWLEDGEMENTS
The work described in this paper has been retrieved from Dr. ParisaAlirezaii’sthesis. The authors would like to thank Dr. MarziehMahmoodi for useful statistical con-sultations.
REFERENCES
Abduo, J. and Lyons, K.M., 2017. Interdisciplinary interface between fi xed prosthodontics and periodontics. Periodontol-ogy 2000, 74(1), pp.40-62.
Akova, T., Ucar, Y., Tukay, A., Balkaya, M.C. and Brantley, W.A., 2008. Comparison of the bond strength of laser-sintered and cast base metal dental alloys to porcelain. dental materi-als, 24(10), pp.1400-1404.
Bae, E.J., Kim, J.H., Kim, W.C. and Kim, H.Y., 2014. Bond and fracture strength of metal-ceramic restorations formed by selective laser sintering. The journal of advanced prosthodon-tics, 6(4), pp.266-271.
Bagby, M., Marshall, S.J. and Marshall, G.W., 1990. Metal ceramic compatibility: a review of the literature. The Journal of prosthetic dentistry, 63(1), pp.21-25.
Bhaskaran, E., Azhagarasan, N.S., Miglani, S., Ilango, T., Krishna, G.P. and Gajapathi, B., 2013. Comparative Evaluation of Marginal and Internal Gap of Co–Cr Copings Fabricated from Conventional Wax Pattern, 3D Printed Resin Pattern and DMLS Tech: An In Vitro Study. The Journal of Indian Prostho-dontic Society, 13
Bowers, J.E., Vermilyea, S.G. and Griswold, W.H., 1985. Effect of metal conditioners on porcelain-alloy bond strength. The Journal of prosthetic dentistry, 54(2), pp.201-203.
(3), pp.189-195.
Brocker, C.N., 2012. Characterization of aldehyde dehydroge-nase 7A1 (ALDH7A1) and the potential mechanisms underly-ing pyridoxine-dependent epilepsy (Doctoral dissertation, Uni-versity of Colorado at Denver).
Chung, K.H. and Hwang, Y.C., 1997. Bonding strengths of porcelain repair systems with various surface treatments. The Journal of prosthetic dentistry, 78(3), pp.267-274.
Daftary, F. and Donovan, T., 1986. Effect of four pretreatment techniques on porcelain-to-metal bond strength. The Journal of prosthetic dentistry, 56(5), pp.535-539.
Drummond, J.L., Randolph, R.G., Jekkals, V.J. and Lenke, J.W., 1984. Shear testing of the porcelain-metal bond. Journal of dental research, 63(12), pp.1400-1401.
Gu, D. and Shen, Y., 2007. Balling phenomena during direct laser sintering of multi-component Cu-based metal powder. Journal of Alloys and Compounds, 432(1), pp.163-166.
Huang, Z., Zhang, L., Zhu, J. and Zhang, X., 2015. Clinical marginal and internal fi t of metal ceramic crowns fabricated with a selective laser melting technology. The Journal of pros-thetic dentistry, 113(6), pp.623-627.
Jing-min, L.I., Wei-qian, W.A.N.G. and Jing-yuan, M.A., 2014. Comparison of the clinical effects of selective laser melting deposition basal crowns and cobalt chromium alloy base crowns. Shanghai Journal of Stomatology, 23(3).
Jochen, D.G., Caputo, A.A. and Matyas, J., 1986. Effect of metal surface treatment on ceramic bond strength. The Journal of prosthetic dentistry, 55(2), pp.186-188.
Kaleli, N. and Saraç, D., 2017. Comparison of porcelain bond strength of different metal frameworks prepared by using con-ventional and recently introduced fabrication methods. The Journal of Prosthetic Dentistry.
Kelsey 3rd, W.P., Latta, M.A., Stanislav, C.M. and Shaddy, R.S., 1999. Comparison of composite resin-to-porcelain bond

Fariborz Vafaee et al.
430 BOND STRENGTH OF PORCELAIN TO COBALT CHROMIUM DENTAL ALLOY FABRICATED BIOSCIENCE BIOTECHNOLOGY RESEARCH COMMUNICATIONS
strength with three adhesives. General dentistry, 48(4), pp.418-421.
Kukiattrakoon, B., Hengtrakool, C. and Kedjarune-Leggat, U., 2010. Chemical durability and microhardness of dental ceram-ics immersed in acidic agents. ActaOdontologicaScandinavica, 68(1), pp.1-10.
Lavine, M.H. and Custer, F., 1966. Variables affecting the strength of bond between porcelain and gold. Journal of dental research, 45(1), pp.32-36.
Lenz, J., Schwarz, S., Schwickerath, H., Sperner, F. and Schäfer, A., 1995. Bond strength of metal–ceramic systems in three‐point fl exure bond test. Journal of Applied Biomaterials, 6(1), pp.55-64.
Liu, Y., Wang, Z., Gao, B., Zhao, X., Lin, X. and Wu, J., 2010. Evaluation of mechanical properties and porcelain bonded strength of nickel–chromium dental alloy fabricated by laser rapid forming. Lasers in medical science, 25(6), pp.799-804.
Nair, S.J., Hegde, V. and Vallabhaneni, T.T., 2016. Effect of multiple fi rings on shear bond strength of feldspathic porce-lain to base metal alloys: an in-vitro study. Indian Journal of Dental Advancements, 8(2), pp.89-94.
Örtorp, A., Jönsson, D., Mouhsen, A. and von Steyern, P.V., 2011. The fi t of cobalt–chromium three-unit fi xed dental pros-theses fabricated with four different techniques: A compara-tive in vitro study. Dental Materials, 27(4), pp.356-363.
Quante, K., Ludwig, K. and Kern, M., 2008. Marginal and inter-nal fi t of metal-ceramic crowns fabricated with a new laser melting technology. Dental Materials, 24(10), pp.1311-1315.
Pameijer, C.H., LOUW, N.P. and FISCHER, D., 1996. Repair-ing fractured porcelain: how surface preparation affects shear force resistance. The Journal of the American Dental Associa-tion, 127(2), pp.203-209.
Pavlovic`, V.B., Vulic
`evic
`, Z. and Pavlovic
`, V.P., 2017. Contem-
porary Dental Ceramics. In Proceedings of the IV Advanced Ceramics and Applications Conference (pp. 95-119). Atlantis Press, Paris.
Pittayachawan, P., McDonald, A., Petrie, A. and Knowles, J.C., 2007. The biaxial fl exural strength and fatigue property of Lava™ Y-TZP dental ceramic. dental materials, 23(8), pp.1018-1029.
Serra-Prat, J., Cano-Batalla, J., Cabratosa-Termes, J. and Figueras-Àlvarez, O., 2014. Adhesion of dental porcelain to cast, milled, and laser-sintered cobalt-chromium alloys: shear bond strength and sensitivity to thermocycling. The Journal of prosthetic dentistry, 112(3), pp.600-605.
Sudsangiam, S. and van Noort, R., 1999. Do dentin bond strength tests serve a useful purpose?.Journal of Adhesive Dentistry, 1(1).
The International Organization for Standardization. Metal-ceramic systems. ISO 9693-1: 2012(E):1-4.
Wagner, W.C., Asgar, K., Bigelow, W.C. and Flinn, R.A., 1993. Effect of interfacial variables on metal‐porcelain bond-ing. Journal of Biomedical Materials Research Part A, 27(4), pp.531-537.
Walton, J.N., Gardner, F.M. and Agar, J.R., 1986. A survey of crown and fi xed partial denture failures: length of service and reasons for replacement. The Journal of prosthetic dentistry, 56(4), pp.416-421.
Wu, L., Zhu, H., Gai, X. and Wang, Y., 2014. Evaluation of the mechanical properties and porcelain bond strength of cobalt-chromium dental alloy fabricated by selective laser melting. The Journal of prosthetic dentistry, 111(1), pp.51-55.
Xiang, N., Xin, X.Z., Chen, J. and Wei, B., 2012. Metal–ceramic bond strength of Co–Cr alloy fabricated by selective laser melt-ing. Journal of dentistry, 40(6), pp.453-457.
Xin, X.Z., Xiang, N., Chen, J., Xu, D. and Wei, B., 2012. Cor-rosion characteristics of a selective laser melted Co–Cr dental alloy under physiological conditions. Journal of Materials Sci-ence, 47(12), pp.4813-4820.
Zhang, S., Li, Y., Hao, L., Xu, T., Wei, Q. and Shi, Y., 2014. Metal-ceramic bond mechanism of the Co-Cr alloy denture with origi-nal rough surface produced by selective laser melting. Chinese Journal of Mechanical Engineering, 27(1), pp.69-78.
Zhukovsky, L., Godder, B., Settembrini, L. and Scherer, W., 1996. Repairing porcelain restorations intraorally: techniques and materials. Compendium of continuing education in den-tistry (Jamesburg, NJ: 1995), 17(1), pp.18-20.
Zinelis, S., Tsetsekou, A. and Papadopoulos, T., 2003. Thermal expansion and microstructural analysis of experimental metal-ceramic titanium alloys. The Journal of prosthetic dentistry, 90(4), pp.332-338.

Biotechnological CommunicationBiosci. Biotech. Res. Comm. 10(3): 431-437 (2017)
Spatial and temporal ground water responses to
seasonal rainfall replenishment in an alluvial aquifer
Sourabh Nema1, M. K. Awasthi2 and R. K. Nema3
1Department of Soil & Water Conservation Engineering, JNKVV, Jabalpur2Professor, Department of Soil & Water Conservation Engineering, JNKVV, Jabalpur3Professor & Head, Department of Soil & Water Conservation Engineering, JNKVV, Jabalpur
ABSTRACT
Groundwater is an enormously vital water resource available on earth. Due to over exploitation of groundwater, especially in dry regions and in the water scares areas, has led to irretrievable consequences due to deterioration of water quality. The groundwater resources, which are found in shallow depth often have poor in water quality and in most cases the ground water are severely over-exploited. Therefore, the study has been planned to identify the spatial & temporal variation of aquifer responses of the study area to the natural recharge as well as Ground water level trend in last 15 years. This study is conducted in Tawa command area, which lies in Hoshangabad District of Madhya Pradesh. Also facing problem of water logging and shortage in the region. The study identifi ed the spatial behavior of ground water level in pre-monsoon and post monsoon. Insight of the current study, the spatial and temporal graphi-cal analysis for the observation sites of the unconfi ned aquifer indicated that there is a good hydraulic connection of groundwater level with the rainfall.
KEY WORDS: AQUIFER, GROUNDWATER RESOURCES, WATER LOGGING, WATER LEVEL FLUCTUATION
431
ARTICLE INFORMATION:
*Corresponding Author: Received 20th June, 2017Accepted after revision 27th Sep, 2017 BBRC Print ISSN: 0974-6455Online ISSN: 2321-4007 CODEN: USA BBRCBA
Thomson Reuters ISI ESC and Crossref Indexed Journal NAAS Journal Score 2017: 4.31 Cosmos IF: 4.006
© A Society of Science and Nature Publication, 2017. All rights reserved.Online Contents Available at: http//www.bbrc.in/DOI: 10.21786/bbrc/10.3/16

432 SPATIAL AND TEMPORAL GROUND WATER RESPONSES TO SEASONAL RAINFALL REPLENISHMENT BIOSCIENCE BIOTECHNOLOGY RESEARCH COMMUNICATIONS
Nema, Awasthi and Nema
INTRODUCTION
Water is the most vital resource of both biosphere and human society, without which no life can sustain on the earth. Over 95% of the earth’s useable freshwater is stored as groundwater, of which about 50% exists within the earth’s crust down to a depth of 800 m, while only 1.5% exists in rivers and lakes (World Bank, 2010). Over exploitation of groundwater for irrigation and other pur-poses, especially in dry climates and in areas which are facing water stress, has led to irreversible consequences. The water stress on different sessions leads to Groundwa-ter-level fl uctuations, which basically represent hydrau-lic responses to changes in groundwater storage due to aquifer recharge and drainage as well as to changes in stress that include water mass loading and unloading above the aquifer surface (Burgess et al., 2017).
In order to meet the requirement of fast growing popu-lation and industrialization, the water demand has been increased signifi cantly all over the globe. Overexploitation of groundwater in many part of the world has resulting a threatening condition of falling groundwater levels, saline water infringement, crop demand-supply gap, drying of the shallow aquifers, increasing power consumption due to increase in cost of lift, decrease in free fl ow and even local subsidence in some places (Singh and Singh, 2002).
In many regions there is a lack of surface water resource and the water bearing sub-surface zones are having severe water contamination. Shallow groundwa-ter resources are often of poor quality and above that they are severely over-exploited. In a recent study based on the analysis of GRACE satellite data revealed that the groundwater resources in the states of Rajasthan, Punjab and Haryana are being depleted at a mean rate of mean rate of 4.0+1 cm yr-1 (Rodell et al., 2009).
Thus, it is evident that the current patterns of water development and consumption are not sustainable in several countries of the world, including India. Impend-ing global/regional climate change, increasing popula-tion and growing socio economic changes are expected to exacerbate existing groundwater depletion through considerable rise in water demand (Sauer et al., 2010; Brown et al., 2013) and alterations in the spatio-tem-poral availability of freshwater resources (Healy, 2002; Elliott et al., 2014; Schewe et al., 2014; Bouwer, 2002; CGWB, 2012; Singh, 1997; Kumar, 2002; Vanderzalm et al. 2015 Nema 2017, and Smith et al., 2016).
Therefore, there is an urgent need for effi cient man-agement of freshwater resources in India in order to ensure sustainable management of our depleting fresh-water resources.In many parts of India, The water table is declining at a very fast rate. In few locations, it has been gone beyond to the depth where it is uneconomi-cal for pumping water for non-commercial and com-
mercial uses. In few states, the situation is so critical that Government has banned ground pumping to sta-bilize the ground water. Groundwater extraction rate is not only the one factor which is responsible for declin-ing water levels, the low rainfall resulting due to inad-equate monsoon is equally responsible. Majority of the ground water stress areas categorized as overexploited and critical units also lies in such states. Considering the importance of Groundwater, the issue of Ground water declination or waterlogging has to be taken with priority considering all the proved water management technolo-gies along with effi cient strategies shall be adopted that could help to reduce the prevailing disaster. This cur-rent study demonstrate a comprehensive analysis of the effects of spatial and temporal precipitation patterns on Ground water level fl uctuations.
MATERIAL AND METHODS
Hoshangabad District which is situated in Upper Narmada Region, M.P., lndia (Fig.1) was selected for this study. Nar-mada River, the other main river of Hoshangabad is Tawa River, which fl ows towards north and joins river Narmada near Hoshangabad.District Hoshangabad covers majority of Tawa command areas which are the primary sources of irrigation for entire district. The Hoshangabad district lies between north latitudes 22º 15’ and 23º 00’ and east longitudes 77º 15’ and 78º 42’ in part of survey of India topo sheet Nos, 55F & 55J. Hoshangabad is the district headquarter and Sohagpur, Piparia, Babai, Pachmarhi, Seoni Malwa and Bankheri are some of the major towns. The location map of study area is represented in Fig. 1. Soils of the area are characterized by black grey, red and yellow colors, often mixed with red and black alluvium and ferruginous red ravel or lateritic soils.
Northern part of the study area (i.e. Hoshangabad dis-trict), adjoining the Narmada river is covered with allu-vium, which makes for more than 50% of the entire district.
Deccan traps occur as lava fl ows in the west central part of the district. The southern part of the district is hilly and occupied by rocks belonging to Gondwanas. There are two aquifer systems present in the study area. The top phreatic aquifer range in thickness from 4 to 30m and is encountered in the depth range of 4 to 20 mbgl. The phreatic aquifer has intercalations of clay and silt, and at places also of coarse sand or gravel. The Deeper aquifer (i.e. confi ned aquifer) ranges varies from 30 m to 60 m.
WATER LEVEL FLUCTUATION IN THE STUDY AREA
Water table Declination in summer season is a common problem for many part of the state as well as for India. The current study has been done to observe the ground

BIOSCIENCE BIOTECHNOLOGY RESEARCH COMMUNICATIONS SPATIAL AND TEMPORAL GROUND WATER RESPONSES TO SEASONAL RAINFALL REPLENISHMENT 433
Nema, Awasthi and Nema
water level of study area with observing the rainfall (pre monsoon and post monsoon) and river gauge impact over ground water level for 16 years period from year 2000 to year 2015. The fl uctuations have been observed in relation to rainfall (pre monsoon and post monsoon). The water table fl uctuations have been infl uenced by many factors. The decline of groundwater level occurs when the outfl ow exceeds or less recharge over the area. The groundwater-level level data of 74 observation wells tapping unconfi ned aquifer were collected for 15 years (2000-2015) from the Central Ground Water Board (CGWB) and the Ground Water Survey and Investigation (GWS&I), Bhopal, Madhya Pradesh.
RESULTS AND DISCUSSION
SEASONAL WATER LEVEL FLUCTUATIONS DUE TO RAINFALL (YEAR 2000 TO 2015)
Monthly variations of rainfall in the study area over 16-year period (2000-2015) at eight rainfall/rain gauge stations along with the line graphs are shown in Fig. 4.2 It is apparent from Fig. 2 that though the rainfall events are somewhat distributed throughout the year, however the magnitude of rainfall is quite less or zero in some places. The rainy season usually starts from mid-June and lasts up to the end of October.
FIGURE 1. Location map of the study area
FIGURE 2. Monthly variations of rainfall in the study area over 16 years (2000-2015)

434 SPATIAL AND TEMPORAL GROUND WATER RESPONSES TO SEASONAL RAINFALL REPLENISHMENT BIOSCIENCE BIOTECHNOLOGY RESEARCH COMMUNICATIONS
Nema, Awasthi and Nema
FIGURE 3. Variations of Annual Rainfall during 2000-2015 Period at Eight Rainfall Stations
FIGURE 4. Spatial Variations of Mean Pre Monsoon Ground water Depth
Thus, the bulk of the annual rainfall is concentrated in a relatively short span of time and hence runoff and groundwater recharge are confi ned to these months. As suffi cient rainfall is available during July, August, Sep-tember and October, groundwater withdrawal is mini-mum during these months. The standard line graph indi-cate monthly variation of rainfall over 16-year period. The large standard line graph during May to October
indicated considerable temporal variation of rainfall in these months (Fig. 2). However, during November through April, the variation in monthly rainfall is very small. Furthermore, the rainfall of Pachmari station has the highest rainfall for month of August, followed by Hoshangabad & Seoni Malwa.
Long-term variations in the annual rainfall of the study area from 2000 to 20l5 are shown in Fig. 3 for the
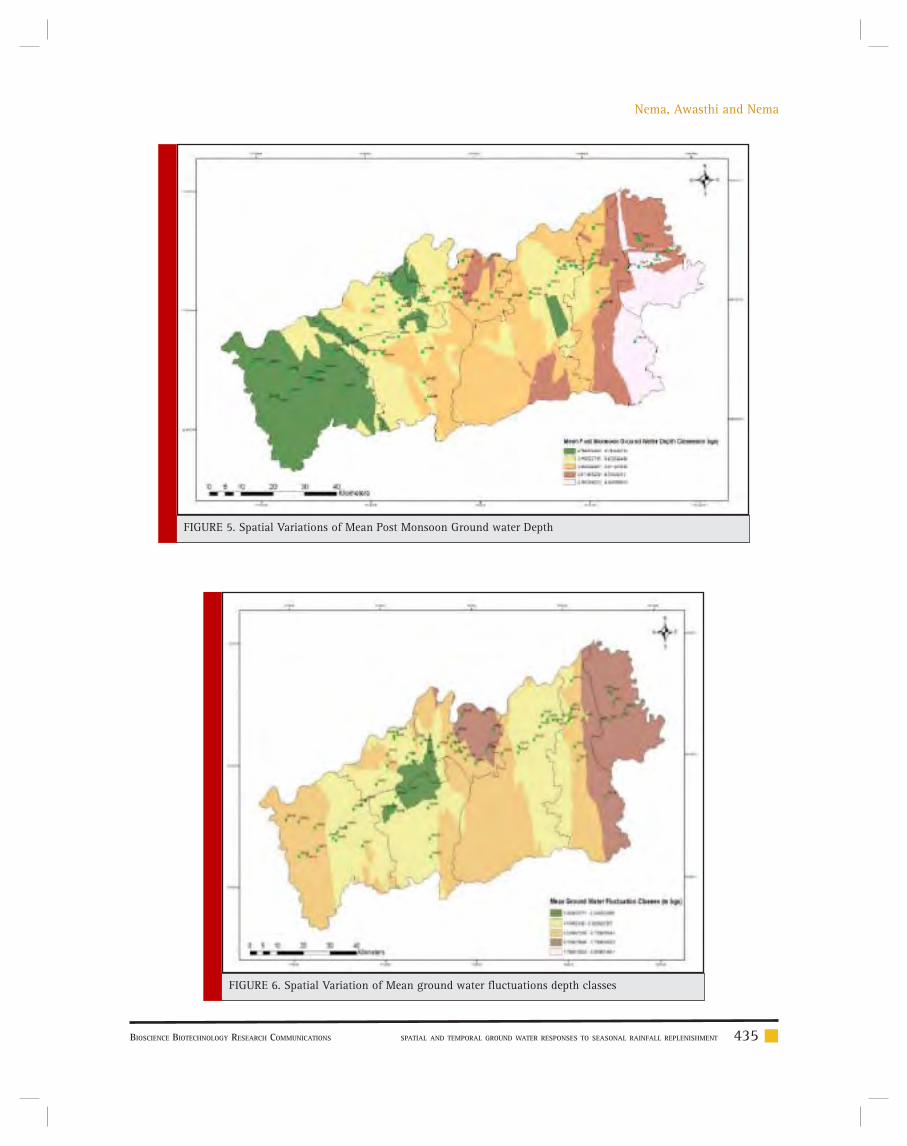
BIOSCIENCE BIOTECHNOLOGY RESEARCH COMMUNICATIONS SPATIAL AND TEMPORAL GROUND WATER RESPONSES TO SEASONAL RAINFALL REPLENISHMENT 435
Nema, Awasthi and Nema
FIGURE 5. Spatial Variations of Mean Post Monsoon Ground water Depth
FIGURE 6. Spatial Variation of Mean ground water fl uctuations depth classes

Nema, Awasthi and Nema
436 SPATIAL AND TEMPORAL GROUND WATER RESPONSES TO SEASONAL RAINFALL REPLENISHMENT BIOSCIENCE BIOTECHNOLOGY RESEARCH COMMUNICATIONS
eight rain gauge stations. The average annual rainfall over the study area is estimated at about 1099.24 mm based on 16 years (2000-2015) rainfall records. In con-trast, the rainfall at Pachmari station was found highest and found above than average annual rainfall for all years. The analysis were also done to fi nd out the spatial variation of mean ground water fl uctuation depth class (Mean of 2000-2015) over study area as shown in Fig.4., Fig. 5. & Fig. 6.
The minimum pre-post water fl uctuation was observed in Hoshangabad and Kesla Block. The fl uctua-tion of Pre-Post-monsoon groundwater depths (mean of 2000-2015) was maximum in Bankhedi followed by Babai, Sohagpur and Seoni Malwa block over the study area is shown in Fig. 5 & Fig. 6. It is clearly evident that the Bankhedi block of Hoshangabad showing the maximum water fl uctuation depth which may be due to the non-command area exist on Bankhedi (Nema, 2017)
The average annual water level at downstream site varies from 5.5 to 7.0 m in last 15 years. The rainfall amount and ground water level from mean sea level has been found inversely proposal similar to upstream and middle stream sites.
The analysis of groundwater-depth contour maps of pre- and post-monsoon seasons revealed that the mean seasonal groundwater fl uctuation in the study area ranges from 3.45 to 7.70 m, with a major portion of the study area having a mean groundwater fl uctuation of 4.50 to 6.70 m.
Temporal analysis of Ground water level had been done in to upstream, mid stram and down stram sites represented in Fig 7(a-c). It has been evident from Fig. 7.(a) that in upstream, mean ground water depth varied in the range of 10-13 m from mean sea level (MSL).
The ground water depth from MSL is seems to be inversely correlated with rainfall. As the rainfall amount increases the depth of water table from MSL has decreases. Fig 7.(b) indicated the similar kind of pattern of ground water behavious with respect to rainfall hav-ing avg. depth 6 to 7.8 m. The trend of ground water level wass also found increasing in middle region over the period of time.
The similar kind of pattern of ground water depth behaviour with respect to rainfall was found in down-stream region. The avg. depth to ground water from mean sea level is around 5.5 m to 7 m in last 15 years
CONCLUSION
Insight of the current study, the spatial and temporal graphical analysis for the observation sites of the uncon-fi ned aquifer indicated that there is a good hydraulic connection of groundwater level with the rainfall. It can also be revealed that the rainfall has reasonable correla-tions with the groundwater level of Aquifer and sug-gesting a signifi cant contribution of recharge from the rainfall sources to unconfi ned aquifer. The study also indicated that Bankeri block whichh lies in upstream fol-lowed by Babai block having maximium water fl uctua-tion and depth in pre-monsoon & post monsoon which needs to be addressed in future for arresting groundwa-ter declination further.
FIGURE 7a. Temporal Response of Average annual ground water level with respect to Rain-fall for upstream region
FIGURE 7b. Temporal Response of Average annual ground water level with respect to Rainfall for mid-stream region
FIGURE 7c. Temporal response of Average annual ground water level with respect to Rainfall for down-stream region

Nema, Awasthi and Nema
BIOSCIENCE BIOTECHNOLOGY RESEARCH COMMUNICATIONS SPATIAL AND TEMPORAL GROUND WATER RESPONSES TO SEASONAL RAINFALL REPLENISHMENT 437
REFRENCES
Bouwer, H. (2002). Artifi cial recharge of groundwater: hydro-geology and engineering. Hydrogeology Journal, 10:121-142.
Brown T.C., Foti R, and Ramirez I.A. (2013). Projected fresh-water withdrawals in the United States under a changing cli-mate, Water Resources Research, 49: 1259-1276, DOI: I 0.1002/wrcr.20076
Burgess, W. G., Shamsudduha, M., Taylor R. G., Zahid, A., Ahmed, K.M., Mukherjee, A., Lapworth, D.J. and Bense V.F. (2017). Terrestrial water load and groundwater fl uctua-tion in the Bengal Basin, Nature, Scientifi c Reports 7(3872), doi:10.1038/s41598-017-04159-w
CGWB. (2012). Dynamic Ground Water Resources of India (as on March, 2009). Ministry of Water Resources, Government of lndia, New Delhi.
Elliott J., Deryng D., Muller C., Frieler K., Konzmann M., Gerten D. and Wisser D. (2014). Constraints and potentials of future irrigation water availability on agricultural production under climate change. Proceedings of the National Academy of Sci-ences, 111(9): 3239-3244.
Healy, R. W. and Cook, P. G. (2002). Using groundwater levels to estimate recharge. Hydrogeology Journal, 10: 91–109.
Kumar, C.P. and Seethapathi, P.V. (2002). Assessment of nat-ural groundwater recharge in Upper Ganga Canal command area. Journal of Applied Hydrology,15: 13-20.
Nema S. (2017) Ground water utilization using simulation techniques in Tawa command area, Ph.D. thesis, JNKVV, Jabal-pur, 205 p
Rodell M., Velicogua I., and Famiglietti J.S. (2009). Satellite-based estimates of groundwater depletion in India, Nature 460: 999-1002.
Sauer T, Havlik P Schneider U.A., Schmid E Kindermann G. and Obersteiner M. (2010). Agriculture and resource availabil-ity in a changing world: The role of irrigation. Water Resources Research, 46(6), DOI: I0.1029/2009WR007729
Schewe J Heinke J Gerten D Haddeland I Arnell NW Clark DB and Kabat P. (2014) . Multimodel assessment of water scarcity under climate change. Proceedings of the National Academy of Sciences, 111(9): 3245-3250.
Singh, B. (1997).Water resources development in India - a perspective. In Proceedings of International Symposium on Emerging Trends in Hydrology, Department of Hydrology, Uni-versity of Roorkee, Roorkee, India 1: 1-17.
Singh, D. K. and Singh, A. K. (2002). Groundwater Situation in India: Problems and Perspective, International Journal of Water Resources Development, 18(4): 563-580
Smith, M, Cross, K, Paden, M & Laban, P (2016). Spring: Manag-ing groundwater sustainably, IUCN, Gland, Switzerland, 135 p.
Vanderzalm, JL, Dillon, PJ, Tapsuwan, S, Pickering, P, Arold, N, Bekele, EB, Barry, KE, Donn, MJ & McFarlane, D. (2015), Economics and Experiences of Managed Aquifer Recharge (MAR) with Recycled Water in Australia <http://vuir.vu.edu.au/32058/1/.
World Bank (2010). Deep wells and prudence: towards pro-grammatic action for addressing groundwater overexploitation in India. Washington DC, 120 p.

Environmental CommunicationBiosci. Biotech. Res. Comm. 10(3): 438-444 (2017)
Composition and quantity of cytotoxic waste
from oncology wards: A survey of environmental
characterization and source management of medical
cytotoxic waste
Y. Ghafuri1,2 and R. Nabizadeh3*1Department of Environmental Health Engineering, School of Public Health, International Campus, Tehran University of Medical Sciences, Tehran, Iran2Environmental Research Center, Qom University of Medical Science, Qom, Iran3Department of Environmental Health Engineering, School of Public Health. Tehran University of Medical Sciences, Tehran, Iran
ABSTRACT
Interest in waste drugs as a part of hospital waste in relation to their negative impact on the environment has increased during the past years. Cytotoxic drugs play an important role in the treatment of various neoplastic conditions and are most often used in specialized departments such as oncology and radiotherapy units. In this study an initial inventory of pharmaceuticals and unused pharmaceuticals including hazardous waste drugs and antineoplastic (cytotoxic) chemotherapeutics was provided. By providing a questionnaire, the rate of cytotoxic consumption, residuals of drugs, vial and syringes, needles, gloves and the other cytotoxic waste was measured during a 30-day period in two oncology wards of Qom hospitals in Iran. The results determined that mean production rate of medical waste in two hospital is 435 kg/d and equal to 1.73kg/bed/d, including: 97% infection waste (1.67 kg/bed/d), 2.5% sharp and syringe waste (43.25 g/bed/d) and 0.5% pharmaceutical waste (8.65 g/bed/d). The rate of cytotoxic waste in the investigated hospitals was 293.5(gr/d) and equal to 0.07 total medical waste. On the other hand the average rate of cytotoxic waste in the oncology departments was 21.5 gr/bed and 16.5 gr / patient. The results determined that over 66% of residuals cyto-toxic drug compounds can be converted in to nontoxic and no genotoxic by chemical degradation. Lack of awareness of health hazards, insuffi cient fi nancial and human resources and poor control of waste disposal are the most common problems connected with healthcare wastes.
KEY WORDS: CYTOTOXIC-WASTE-QOM-COMPOSITION
438
ARTICLE INFORMATION:
*Corresponding Author:Received 12th July, 2017Accepted after revision 28th Sep, 2017 BBRC Print ISSN: 0974-6455Online ISSN: 2321-4007 CODEN: USA BBRCBA
Thomson Reuters ISI ESC and Crossref Indexed Journal NAAS Journal Score 2017: 4.31 Cosmos IF: 4.006
© A Society of Science and Nature Publication, 2017. All rights reserved.Online Contents Available at: http//www.bbrc.in/DOI: 10.21786/bbrc/10.3/17

Ghafuri and Nabizadeh
BIOSCIENCE BIOTECHNOLOGY RESEARCH COMMUNICATIONS COMPOSITION AND QUANTITY OF CYTOTOXIC WASTE FROM ONCOLOGY WARDS 439
INTRODUCTION
Healthcare activities can lead to the generation of hazardous of wastes that may have adverse effects on human health and on the environment. Interest in waste drugs as a part of hospital waste in relation to their neg-ative impact on the environment has increased during the past years. Many of the chemicals and pharmaceu-ticals used in health care are hazardous. They are com-monly present in small quantities in health-care waste, whereas larger quantities may be found when unwanted or outdated chemicals and pharmaceuticals are sent for disposal, (Drug, 2015).
Considering the classifi cation of hazardous health-care waste by WHO the Categories of hazardous health-care waste are: sharps, Infectious, Pathological, Pharma-ceutical and cytotoxic, Chemical waste, and Radioactive waste. The types and nature of hospital waste depends upon the nature of the hospital and the service avail-able in hospital (WHO, 2014). Exposure to genotoxic substances in health care may also occur during the preparation of, or treatment with, particular drugs or chemicals. The main pathways of exposure are inhala-tion of dust or aerosols, absorption through the skin, ingestion of food accidentally contaminated with cyto-toxic drugs, ingestion as a result of bad practice, such as mouth pipetting, or from waste items. Exposure may also occur through contact with body fl uids and secre-tions of patients undergoing chemotherapy. Genotoxic waste is highly hazardous and may have mutagenic, teratogenic, or carcinogenic properties. Genotoxic waste may include certain cytostatic drugs, vomit, urine, or faeces from patients treated with cytostatic drugs, chem-icals, and radioactive material (Ansell, 2015).
Cytotoxic drugs (CDs) are primarily used as anti- can-cer drugs because they are toxic to cells. These drugs have been associated with human cancers at high (thera-peutic) levels of exposure and are carcinogens and ter-atogens in many animal species. They are most often used in specialized departments such as oncology units, whose main role is cancer treatment. Cytostatic drugs can be categorized as: alkylating agents which cause the alkylation of DNA nucleotides, leading to the cross-link-ing and miscoding of the genetic stock; antimetabolites which inhibit the biosynthesis of nucleic acids in the cell; and mitotic inhibitors which prevent cell replica-tion (Antell, 2013). Medical waste is incorrectly managed throughout the majority of hospitals in Iran. Healthcare workers are not trained to conceive that a large pro-portion of medical waste generated in hospitals is Non-infectious waste. A structured waste management strat-egy together with clear definitions and staff training will lead to a decrease in waste volumes, and consequently to a reduction of costs in healthcare settings. Generated
amounts of the health care waste are not available (for example Ireland) or the defi ned amount of wastes is too low (for example Bulgaria, Finland) or too high (in case of Belgium). Among other issues, this might be an indi-cation of improper waste management practice or poor data collection in the country; Askarian et al, 2010; Far-zadkia et al, 2009; Abduli, 2010 Nabizadeh, 2016).
In recent years, the rate of cancer disease and con-sumption of cytotoxic drugs in oncology wards of Qom hospital has increased. In this work composition, the quantity and possibility of chemical degradation of cytotoxic drug waste have been studied.
MATERIALS AND METHODS
This study was performed in 2015, in the oncology wards of two hospitals in Qom, Iran including Shahid Beheshti Hospital with 400 active beds and Hazrat Masoumeh Hospital with 120 active beds, located in the central part of Qom Province. The studied hospitals provide general medical, surgical, maternity, pediatric, and a range of specialist services.
Considering the methods of medical waste manage-ment and the main generation of medical waste in the two investigated hospitals, the total medical waste was classifi ed in three categories: infection, sharp and Phar-maceutical waste. Several methods were used to collect data, namely site visits, interviews, and questionnaires. An initial inventory of pharmaceuticals and unused pharmaceuticals including hazardous waste drugs and antineoplastic (cytotoxic) chemotherapeutics was pro-vided. Moreover, data collection consisting of health-care waste generation, separation, collection, storage, transportation, and disposal was performed during site visits to the hospitals. With the cooperation and coordi-nation of the personal and management of hospitals and using the questionnaire, the rate of cytotoxic consump-tion on, residuals of drugs, vial and syringes, needles, gloves and the other cytotoxic waste was measured in a 30 day period.
The Chemical degradability of cytotoxic waste was assessed with exposure to chemical oxidants (WHO, 2014). Specific physico-chemical properties such as: dissociation constant (pKa), solubility, octanol–water partition coeffi cient (Kow) and organic carbon parti-tion coeffi cient (Koc), bio-concentration factor (BCF), atmospheric hydroxyl radical reaction rate and photoly-sis tendency play critical roles in determining the envi-ronmental behaviors and fate of cytotoxic waste (Cheng et al, 2009; Andrew et al, 2008; Toolaram et al, 2014; Zhang et al, 2013; Besse et al, 2012). The Prediction of environmental fate and other physico-chemical proper-ties was carried by a theoretical model (EPI Suite 4.1)

Ghafuri and Nabizadeh
440 COMPOSITION AND QUANTITY OF CYTOTOXIC WASTE FROM ONCOLOGY WARDS BIOSCIENCE BIOTECHNOLOGY RESEARCH COMMUNICATIONS
(EPA, 2014). Two criteria contain octanol–water parti-tion coefficient (Kow) and solubility was considered. A logKow<1suggests that the compounds are highly mobile in an aquatic environment. About solubility, adding or existance of polar functional groups that increase of hyrophilicity of drug compound were considered (Zhang et al, 2013; Besse et al, 2012).
RESULTS AND DISCUSSION
QUANTITIES OF MEDICAL WASTE GENERATION
There were 120 active beds in the Hazrat Masoumeh Hospital and the rate of medical waste was identifi ed as 220 kg/d. Also there were 400 active beds in Sha-hid Beheshti Hospital with the medic production rate of 650 kg/d. Table 1 shows the average daily production of total medical in two hospitals. Medical waste from Haz-rat Masoumeh hospital equaled 1.83 kg/occupied bed/d, of which 96.36% was infectious, 3.1% sharp waste and 0.45% Pharmaceutical waste .Shahid Beheshti hospital medical waste was 1.62 kg/occupied bed/d of which 98% was infectious, 1.7% sharp and 0.3% pharmaceuti-cal waste.
Category of cytotoxic waste
The rate of cytotoxic waste was assessed in oncology wards of two hospitals separately. The results are shown in table 2.
Table 3 shows the mean production rate and category of cytotoxic drug waste in the hospitals under study.
Characteristics and chemical degradation of
cytotoxic drugs
Twelve chemical structures of conventional cytotoxic drug compounds used in the oncology wards of hospi-
tals under study were assessed. The results pertaining to the solubility and degradability of cytotoxic drug when exposed to chemical oxidants, the results are shown in Table 4.
Results of the present study determined that mean production rate of medical waste in the two hospitals was 435 kg/d and equal to 1.73kg/bed/d, including: 97% infection waste (1.67 kg/bed/d), 2.5% sharp and syringe waste (43.25 g/bed/d) and 0.5% pharmaceutical waste (8.65 g/bed/d). The results of study about hospital waste management status in Iran by farzadkia and at al showed that the waste generation rate was 2.5 to 3.01 kg bed(-1) day(-1), which included 85 to 90% of domestic waste and 10 to 15% of infectious waste. Waste genera-tion rate in the hospitals varied from 1.25 to 14.8 kg/bed/d (Zhang et al, 2013; Besse et al, 2012).
Medical waste production depends on factors such as type of hospital, number of beds, socio-economic and cultural status of patients and waste management processes (Cheng et al, 2009). In Thailand, Italy, USA, India, Peru, Vietnam, and Tanzania 1, 3–5, 5–7, 0.5–2, 0.76–2.6, 1.42, and 0.84 kg/bed/d, of medical waste are respectively generated, are generated (Dehghani, 2008). According to a study of the composition and production rate of pharmaceutical and chemical waste in Greece, the production rate for total pharmaceutical waste was 7.48 g/bed/d (Voudrias, 2012).
Results of Table 2 and 3 exhibited that the rate of cytotoxic waste in the investigated hospitals was 293.5(g/d) equal to 0.07 total medical waste. On the other hand the average rate of cytotoxic waste on the in the oncology departments was 21.5 g/bed equal to 16.5 g/patient. Moreover, the total amount of genera-tion waste from cytotoxic drug residuals was 120.2 mg/d (mean 4.92mg/d and standard deviation ±8.88mg/d for any cytotoxic drug) and the total amount other
Table 1. Estimated medical waste generation rate of hospital waste for two hospitals investigated
Name of hospitals
Number of active beds
Rate of total medical waste (kg/d)
Separation of medical waste
Infection waste (kg/d)
Sharp waste (kg/d)
Pharmaceutical waste(kg/d)
Hazratmasoumeh 120 220 212 7 1
Shahidbeheshti 400 650 637 11 2
Table 2. Rate of cytotoxic waste in the hospitals investigated
Name of hospitals
number of active beds in oncology department
rate of total cytotoxic waste
rate of cytotoxic waste
rate of cytotoxic waste
(gr/d) (gr/bed/d) (gr/patient/d)
Hazrat masoumh 12 337 22.5 18
Shahid beheshti 15 250 20 15

Ghafuri and Nabizadeh
BIOSCIENCE BIOTECHNOLOGY RESEARCH COMMUNICATIONS COMPOSITION AND QUANTITY OF CYTOTOXIC WASTE FROM ONCOLOGY WARDS 441
Table 3. Average production rate and category of cytotoxic drug waste in hospitals investigate
Rate of other cytotoxic waste that produced from expose to
cytotoxic drug (gr/d)
Waste from residual of cytotoxic drug
(mg/d)
Daily average dosage used
(mg/d)
Drug compoundNumber
258120Cytarabine1
186100Etoposide2
248170Vincristine3
28970Carboplatin4
62.727oxaliplatin5
121.515Fluorouracil (5-FU)6
83120Cisplatin7
1618170Cyclophosphamide8
20760bleomycin9
2613130Erinotekan10
3015200mesna11
10850Dacarbazine (DTIC)12
2510130Methotrexate13
10880L-asparaginase14
2517170Ifosfamide (Ifex)15
282120.21512Sum
Table 4. Characterization of solubility and degradability of conventional cytotoxic drug compounds in oncology departments
Hydrophilicity of cytotoxic drug with consider to(Kow)
Solubility of cytotoxic drugs with consider to polar
functional group
Chemical FormulaCytotoxic drug compound
++C15H18N4O3Carboplatin
++C46H56N4O1Vincristine
-+C7H15Cl2N2O2PCyclophosphamide
++H6Cl2N2PtCisplatin
_+C55H84N17O21S3Bleomycin
++C29H32O13Etoposide
++C9H13N3O5Cytarabine
++C33H38N4O6Erinotekan
__C2H5NaO3S2Mesna
+_C6H10N6ODacarbazine (DTIC)
+_C4H3FN2O2Fluorouracil (5-FU)
++C20H22N8O5Methotrexate
Notes: + sign exhibit that cytotoxic drug with log Kow <1 or cytotoxic drug has polar functional group
cytotoxic waste generated from contact was 282 g/d (mean 7.92g/d and standard deviation ±18.8g/d for any cytotoxic drug). Figure1 indicated that maximum production rate of daily average administrated dosage of cytotoxic drugs is related to Mesna (200 mg/d) and maximum production rate for waste from residuals is related to Cyclophosphamide (18mg/d)
Figure 2 with R2 = 0.59 and Figure 3 with R2 = 0.47exhibited a small correlation between daily average dosage and waste from residuals of cytotoxic drug and a smaller one daily average dosage and rate of other cytotoxic waste generated from contact.
The results of the by Tasakona showed that the rate of cytotoxic waste was 120 l/day and 0.03 from total

Ghafuri and Nabizadeh
442 COMPOSITION AND QUANTITY OF CYTOTOXIC WASTE FROM ONCOLOGY WARDS BIOSCIENCE BIOTECHNOLOGY RESEARCH COMMUNICATIONS
FIGURE 1. Comparison between daily average dosage and waste from residuals of cytotoxic drug waste
FIGURE 2. Daily average dosage versus waste from residuals of cytotoxic drug
amount of medical waste, was different (medical waste density in Iran is 170 kg/m3) but approve the Bill Brewer, Andrew Antel study that rate of cytotoxic waste from chemutraputic drug such as Cyclophosphamide (CP), Mitomycine, Mycophenolate was 0.08 ib/bed/day (Tsa-kona, 2010). Results of a survey by Evanglos Vondari-als, suggested that rate of pharmaceutical’s waste was 3.9% of hazardous waste in agreement with our results (Voudrias, 2012).
Cytotoxic waste residue as a source of cytotoxic drugs
in the Environmental
With survey of medical waste management in two hos-pitals, direct disposal as the municipal solid waste is still a common way for the unused pharmaceuticals. Four primary sources (hospital effl uent, household
wastewater, and production discharge and drug waste disposal) of cytostatic residues. Hospitals produce large quantities of chemically- and which carry high poten-tial ecotoxicity, and should not be considered as pos-sessing the same pollutant nature as urban wastewa-ter. The measured cytostatic levels in hospital sewage indeed correlated with the daily consumption and the pharmacokinetic excretion pattern (Zhang et al, 2013; Besse et al, 2012). At present study, results of predic-tion model (EPI Suite 4.1) was shown that, cytotoxic drug waste residue including: Carboplatin, Vincristine, Cyclophosphamide, Cisplatin, Bleomycine, Etoposide, Cytarabin, Erinotekan and Methoterexate with con-sidering excration pattern and discharge in to hospital sewage, have been increased toxicity of aquatic envi-ronment (EPA, 2013).

Ghafuri and Nabizadeh
BIOSCIENCE BIOTECHNOLOGY RESEARCH COMMUNICATIONS COMPOSITION AND QUANTITY OF CYTOTOXIC WASTE FROM ONCOLOGY WARDS 443
Implementation of cytotoxic waste management plan
and selection of treatment methods
Risk control measures for cytotoxic waste management including: identifi cation, containment and segregation. Other requirements contain handling or storage of cyto-toxic waste, disposal and treatment, in the process of waste management plan must be considered.
The choice of treatment system involves considera-tion of waste characteristics, technology capabilities and requirements, environmental and safety factors, and costs, many of which depend on local conditions. The results of study about solubility and degradability of conventional cytotoxic waste is depicted in Table 4. For decrease of environmental risks and degradation of these compounds by chemical degradation methods as an option that appropriate for developing countries were investigated. results determined that over 66% of residuals cytotoxic drug compounds can be converted in to nontoxic and no genotoxic by chemical degrada-tion including oxidation by potassium permanganate (KMNO4) or sodium hypochlorite (NaCLO,5.25%) readily available in Iran hospitals. It must be noted that this process is not suitable for other cytotoxic waste contain-ing vial, syringe, and gloves for which the appropriate process is handling (Drug, 2015).
CONCLUSION
The implementation of medical waste management is one of the most significant healthcare issues currently requiring attention in Iran. Hospital waste materials pose
FIGURE 3. Daily average dosage versus rate of other cytotoxic waste from contact
a wide variety of health and safety hazards for patients and healthcare workers. Many of hospitals in Iran have neither a satisfactory cytotoxic waste disposal system nor a waste management and disposal policy. Provision of a cytotoxic waste management planning and mon-itoring systems in hospitals is a prerequisite issue for effective reduction of health care waste associated risks.
ACKNOWLEDGEMENTS
This research has been carried by cooperation of Qom University of Medical Science and the authors express gratitude to all hospital staff of Qom University of Medi-cal Science for their support through this study.
REFERENCES
Abduli M.A., ET. Al, 2010. Municipal Waste Reduction Poten-tial and Related Strategies in Tehran, Int. J. Environ. Res., 4(4): 901-912, 1735-6865.
Almuneef, M., Memish, Z.A., 2003. Effective medical waste management: it can be Done, American Journal of Infection Control, 31, 188–192.
Andrew C. Johnson, Monika D. Ju rgens a, 2008. Richard J. Williams a, Kummerer. K, Kortenkamp. A, John P. S. ,Do cyto-toxic chemotherapy drugs discharged into rivers pose a risk to the environment and human health ? An overview and UK case study, Journal of Hydrology, 348, 167– 175
Anju Priya Toolaram, Klaus Ku¨mmerer.2014. Environmental risk assessment of anti-cancer drugs and their transformation products: A focus on their genotoxicity characterization-state

Ghafuri and Nabizadeh
444 COMPOSITION AND QUANTITY OF CYTOTOXIC WASTE FROM ONCOLOGY WARDS BIOSCIENCE BIOTECHNOLOGY RESEARCH COMMUNICATIONS
of knowledge and short comings. 2014- Mutation Research 760, 18–35
Ansell Healthcare Products LLC, 2015. Handling Cytotoxic Drugs; A HEALTH AND SAFETY REVIEW. www.ansellhealth-care.com
Bdour, A., Altrabsheh, B., Hadadin, N., Al-Shareif, M., 2007. Assessment of medical wastes management practice: a case study of the northern part of Jordan. Waste Management, 27, 46–759
Blenkharn, J.I, 2007. Standards of clinical waste management in hospitals – a second look. Public Health, 121, 540–545.
Blenkharn, J.I., 2007. Lowering standards of clinical waste management: do the hazardous waste regulations conflict with the CDC’s universal/standard precautions?, Journal of Hospital Infection 62, 467–472.
Brewer. B, Antell .A, 2013. A case study of the management of hazardous waste drugs in a large university hospital,http://dx.doi.org/10.1016/j.jchas.10.003
Bureau of National Health Insurance, National Health Insur-ance Annual Statistical Report ,Bureau of National Health Insurance,2003, Taiwan, ROC.
Cheng, Y.W., Sung, F.C., Yang, Y., Lo, Y.H., Chung, Y.T., Li, K.-C, 2009, Medical waste production at hospitals and associ-ated factors, Waste Management, 29: 440–444.
Cheng, Y.W., Sung, F.C., Yang, Y., Lo, Y.H., Chung, Y.T., Li, K.-C., 2009. Medical waste Production at hospitals and associ-ated factors. Waste Management, 29, 440– 444.
Clair N. Sawer, McCarty .Perryl, 2003. Chemistry for Environ-mental Engineering and Science, McGraw -Hill
Dehghani. M.H, Azam, K., Changani, F., DehghaniFard.E., 2008, Assessment of medical waste management in educa-tional hospitals of Tehran University Medical Sciences. Iranian Journal of Environmental Health Science and Engineering, 5(2): 131–136.
Drug and Related waste, 2015. Government of south Auster-alia Cytotoxic epa.gov/opptintr/exposure/pubs/episuitedl.htm (accessed 1.11.13.).
Farzadkia .M, Moradi.A, Shah Mohammadi.M., Jorfi .S, Hospi-tal waste management status in Iran: a case study in the teach-ing hospitals of Iran, 2009, University of Medical Sciences. Waste Management and Research, 27: 384–389.
Ferrando-Climent. L, S. Mozaz. R, Barcel. D, 2014. Incidence of anticancer drugs in an aquatic urban system: From hospital effl uents through urban wastewater to natural environment, Environmental Pollution 193, 216e223
Ferreira. V, Ribau Teixeira. S, 2010. Healthcare waste manage-ment practices and risk perceptions: Findings from hospitals in the Algarve region, Portugal, Waste Management 30. 2657–2663
Jang, Y.C., Lee, C., Yoon, O.S., Kim, H., 2006, Medical waste management In Korea. Journal of Environmental Manage-ment, 80: 107–115.
Jean-Philippe Besse, Jean-François Latour, Jeanne Garric. 2012. Anticancer drugs in surface waters, what can we say about the occurrence and environmental signifi cance of cyto-toxic, cytostatic and endocrine therapy drugs? 2012- Environ-ment International 39. 7386
Johannessen.L.M, Dijkman.M, Bartone.C, Hanrahan.D, Boyer.M.G, Chandra, C., 2000. Health Care Waste Management Guidance Note. The World Bank, Washington, DC.
Mehrdad Askarian, Peigham Heidarpoor, Ojan Assadian, 2010. A total quality management approach to healthcare waste management in Namazi Hospital, Iran. waste Management, 2010, 30, 2321-2326
Nussbaumer. S, Bonnabry. P, Jean-Luc Veuthey, Fleury-Sou-verain. S, 2011. Analysis of anticancer drugs: A review, Jour-nal home page: www.elsevier.com/locate/talanta, Talanta 85, 2265– 2289
Rafi ee. A, Nabizadeh. R. 2016. Infectious Waste Management in Imam Khomeini Hospital Complex in Tehran and Recom-mending Appropriate Managerial Solutions” Journal of Health, Vol. 7, No. 4, autumn, Pages 446-457
Tsakona. M, Anagnostopoulou. E, Gidarakos.E . 2010. Hospi-tal waste management and toxicity evaluation: A case study.Waste Management 27. 912–920
U.S. EPA, 2013. Exposure Assessment Tools and Models. EPI Suite v4.1. http://www.
Vijay R, Puneet G. and M C Joshi, Practical guidelines for dis-posing cytotoxic waste. India’s No.1 Weekly for the Pharma-ceutical Industry
Voudrias. E, Goudakou.L, Kermenidou. K, Softa. A, 2012. Com-position and production rate of pharmaceutical and chemical waste from Xanthi General Hospital in Greece, Waste Manage-ment 32. 1442–1452
WHO, 2014. Safe management of wastes from Health-care activities. 2nd edition.
Zhang.J, Victor .W.C, Chang, 2013. Removal of cytostatic drugs from aquatic environment: A review, 2013- Science of the Total Environment 445–446. 281–298

Biomedical CommunicationBiosci. Biotech. Res. Comm. 10(3): 445-454 (2017)
Fe3+-EDTA-zinc oxide nano-diagnostics: Synthesis and
in vitro cellular evaluation
Kimia Roshani1, Mazyar Etemadzade2, Ramin Farhoudi3, Seyed Esmaeil Sadat Ebrahimi4, Morteza Pirali Hamedani4, Artin Assadi5 and Mehdi Shafi ee Ardestani5*1Faculty of Pharmacy, International Campus, Tehran University of Medical Sciences, Tehran, Iran2Natioanl Institute for Genetic Engineering and Biotechnology (NIGEB)3Department of Laboratory Animal Science, Pasteur Institute of Iran, Karaj, Iran 4Department of Medicinal Chemistry, Faculty of Pharmacy, Tehran University of Medical Sciences, Tehran, Iran5Department of Radiopharmacy, Faculty of Pharmacy, Tehran University of Medical Sciences, Tehran, Iran
ABSTRACT
Resulting from many efforts in opportune recognizing and correct treating briefl y molecular imaging and therapy, some methods or molecules have been developed by now to overcome any unwanted defaults in imaging and therapy, specifi cally nanoparticles. Generally, synthesis new compounds, for example Zinc Oxide-Iron nano-complex consisting non-toxic paramagnetic ion [Fe3+] and its cellular uptake vehicle [zinc oxide] as a lowering risk of toxicity and increase in cellular uptake liability, could be useful and noticeable in molecular imaging purposes. The isolated nano-contrast was structurally analyzed by variety of techniques such as EDAX, AFM, Zeta and size measuring, SEM, FTIR and UV spectrums. Finally for monitoring the nano-complex toxicity and cellular uptake on human embryonic kidney cells named as HEK 293 was assessed respectively. The analytical result showed a very good promising size at nanoscale and zeta potential as well as iron content for the suggested ferric containing nano-complex as well as paramagnetic properties. Also outcome of cell study were resulted in no signifi cant cellular toxicity comparing to 62% toxicity of control drug Magnevist and higher cellular uptake of 56% comparing to 9% for that of Magnevist as well. In summary, it seems that the proposed ZnO-Fe nano-complex may be useful as a novel low risk contrast agent to increase resolution in molecular Imaging like MRI and improve the current situation with the minimum cost.
KEY WORDS: SYNTHESIS, CONTRAST AGENT, MOLECULAR IMAGING, ZNO-FE3+ NANOCOMPLEX, HUMAN EMBRYONIC KIDNEY CELL
445
ARTICLE INFORMATION:
*Corresponding Author: shafi [email protected] 10th July, 2017Accepted after revision 28th Sep, 2017 BBRC Print ISSN: 0974-6455Online ISSN: 2321-4007 CODEN: USA BBRCBA
Thomson Reuters ISI ESC and Crossref Indexed Journal NAAS Journal Score 2017: 4.31 Cosmos IF: 4.006
© A Society of Science and Nature Publication, 2017. All rights reserved.Online Contents Available at: http//www.bbrc.in/DOI: 10.21786/bbrc/10.3/18

446 CELLULAR EVALUATION OF ZINC OXIDE NANOPARTICLE CONTAINING IRON BIOSCIENCE BIOTECHNOLOGY RESEARCH COMMUNICATIONS
Kimia Roshani et al.
INTRODUCTION
As per numerous endeavors in perfect perceiving and right treating [early conclusion and treatment], expan-sive quantities of creating strategies have been utilized as of recently. One of the imperative one in this fi eld is sub-atomic imaging, an advanced innovation which gives legitimate component to the early recognition and portrayal of the ailments, checking of natural process in body, assessment of treatment and observing reaction, almost assessing drug pharmacokinetics. Atomic imag-ing as shows is the molecularly focused on, constant, and noninvasive imaging of wonders and procedures at cell and subcellular levels, (Meade et al. 2009). For upgraded determination execution imaging specialist as little particles, built protein nanoparticles has been per-formed, (James et al. 2012 Rameshwar et al. 2015 Langer et al. 2015).
At present there are a few imaging modalities usually utilized for atomic imaging like Magnetic Resonance which benefi ts balance operators with paramagnetic owing to properties and the others incorporate positron emission tomography (PET), single-photon emission computed tomography (SPECT), computerized tomogra-phy (CT), optical imaging [fl uorescence and biolumines-cence], photo acoustic imaging. Contrasted with other imaging modalities, the principle points of interest of attractive reverberation imaging is its great determina-tion which can enhance by upgrading contrast special-ist. The fi rst kind of clinically applied radio-opaque usu-ally known as contrast agents were salts of chemically designed complexes by paramagnetic diagnostics, such as Ferric (Fe III), gadolinium (III) and manganese (II) which their mechanisms show that such complexes of mentionedparamagnetic radio-metalsdecrease the longi-tudinal (T1) and transverse (T2) relaxation parameters of surrounded water molecules, (Lauffer et al.1987), (Toth et al. 2002) (Schwert et al. 2002).
Indeed it is notifying about paramagnetic compounds as chemically designed agents ready to go about as dif-ferentiation operators in the locales where they disperse in body and improve differentiate amid imaging. Among the difference operator the greater part of them are low sub-atomic weight metal edifi ces. Also the utilization of paramagnetic metal for this propose, nanomedicine for-mulation by employing different types of nanoparticles such as polymeric or metal based such as zinc oxide nanoparticles have been vastly used for imaging appli-cations beside for therapeutic goals. Little size of nano-particles encourage the auspicious identifi cation of little different changes furthermore give a high surface range to stacking different atoms. Attractive nanoparticles have additionally been utilized to convey medications to a sick range, (Barakat, 2009).
It is another test utilizing nanoparticle as a part of both indicative and restorative objectives. In such framework the name as theranostic has been more rec-ognizable in scientist’s mentality, nanoparticles assume an essential part as growing high fl ag force and limit with regards to various application, (Jain et al. 2008). The fundamental advantages of utilizing nanoparticle as a part of symptomatic and imaging are low lethal-ity, site-particular collection and hours of course time next to their wellbeing and biocompatibility, (Jesse et al. 2011). In spite of broadly utilization of difference oper-ator up to now, many looks into are progressing due symptoms and lethality of complexity specialist espe-cially in crucial organs, for example, kidney and here and there low determination that are the primary issues as dependably uncommonly in the individuals who uti-lize this strategy to catch up the treatment procedure forever. Even so, synthesis new compounds with all the ideal index have still been restricted and have no com-plete in vitro or in vivo data. Herein, we synthesis a new Compound including Zink Oxide nanoparticle in chelation with Fe3+-EDTA in optimal condition with the aim of creating low risk contrast agent and improving the current situation along with minimum cost. Briefl y in current experimental observations, stable complex of iron with a chelator was formed and then such complex loaded into zinc oxide nanoparticle for increase in cel-lular uptake liability of tumors.
MATERIAL AND METHODS
Zincsulfate hepta hydrate [ZnSO4.7H2O, Merck], Sodium Hydroxide [Merck], Deionized Water, EthyleneDiamin Tetra Acetic acid [99.5 %, Merck], Ferric-Cholorid hexa hydrate [FeCl2 .6H2O, Merck] were used for the synthesis of the materials. In the following, scanning electron microscope [SEM] with EDAX analysis was provided by Phenom-Prox model made in Holland Atomic-force microscopy[AFM] image was obtained by CP-RESEARCH[CP-R] model, VEECO Manufacturer Company made in America. Zeta potential and size on nanoparticle in water as a solvent and ultimate nano-complex in DMSO as a solvent were performed by Mal-vern Nano-Zetasizer from Pasteur Institute in Tehran. Fourier Transform Infrared spectroscopy [FTIR] result was measured by Perkin Elmer, Spectrum Two FT-IR and at the end ultraviolet-visible spectrum was measured on VARIAN, CARY 100 Bio UV-VIS. Cells and related medi-ums were provided from Pasteur Institute of Iran.
SYNTHESIS OF ZINC OXIDE NANOPARTICLE
In order to synthesize ZnO nanoparticle water based solution [0.2 M] of zinc nitrate as well as a prepared
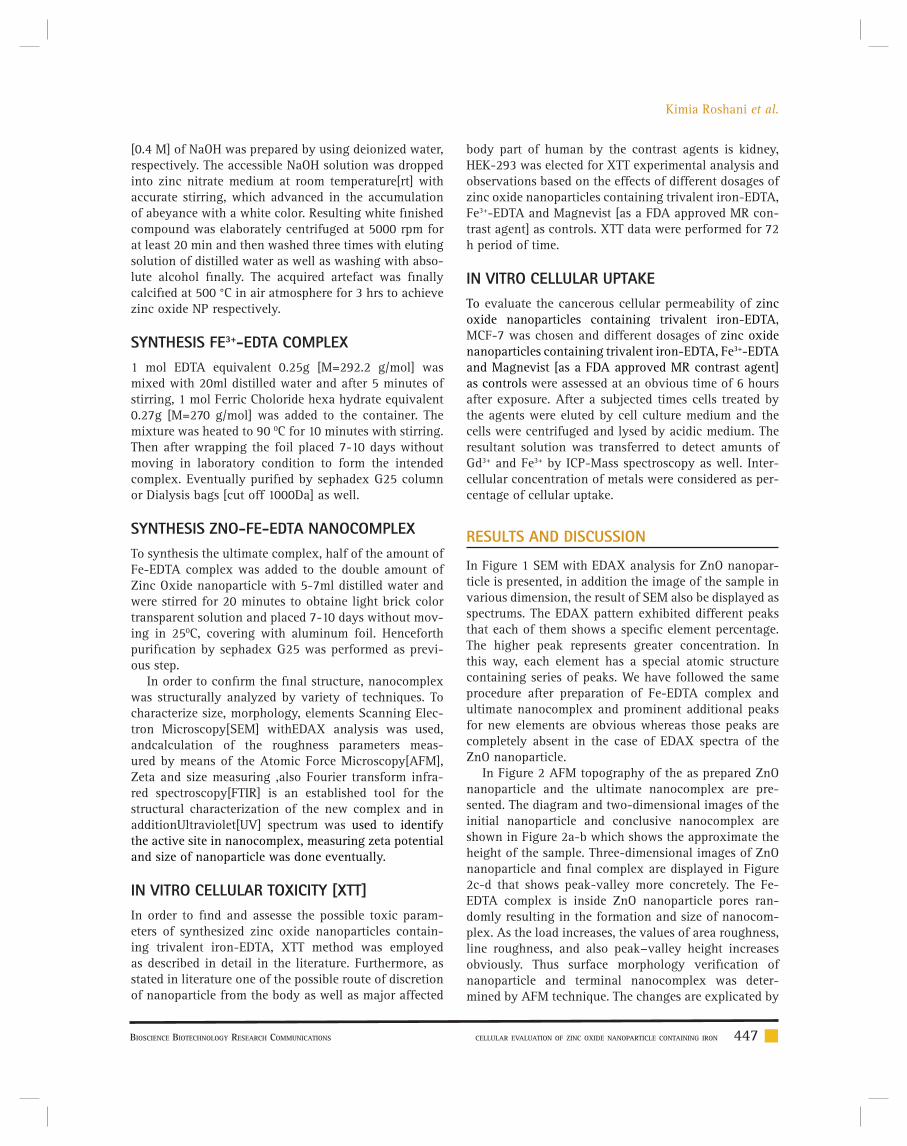
BIOSCIENCE BIOTECHNOLOGY RESEARCH COMMUNICATIONS CELLULAR EVALUATION OF ZINC OXIDE NANOPARTICLE CONTAINING IRON 447
Kimia Roshani et al.
[0.4 M] of NaOH was prepared by using deionized water, respectively. The accessible NaOH solution was dropped into zinc nitrate medium at room temperature[rt] with accurate stirring, which advanced in the accumulation of abeyance with a white color. Resulting white fi nished compound was elaborately centrifuged at 5000 rpm for at least 20 min and then washed three times with eluting solution of distilled water as well as washing with abso-lute alcohol fi nally. The acquired artefact was fi nally calcifi ed at 500 °C in air atmosphere for 3 hrs to achieve zinc oxide NP respectively.
SYNTHESIS FE3+-EDTA COMPLEX
1 mol EDTA equivalent 0.25g [M=292.2 g/mol] was mixed with 20ml distilled water and after 5 minutes of stirring, 1 mol Ferric Choloride hexa hydrate equivalent 0.27g [M=270 g/mol] was added to the container. The mixture was heated to 90 0C for 10 minutes with stirring. Then after wrapping the foil placed 7-10 days without moving in laboratory condition to form the intended complex. Eventually purifi ed by sephadex G25 column or Dialysis bags [cut off 1000Da] as well.
SYNTHESIS ZNO-FE-EDTA NANOCOMPLEX
To synthesis the ultimate complex, half of the amount of Fe-EDTA complex was added to the double amount of Zinc Oxide nanoparticle with 5-7ml distilled water and were stirred for 20 minutes to obtaine light brick color transparent solution and placed 7-10 days without mov-ing in 250C, covering with aluminum foil. Henceforth purifi cation by sephadex G25 was performed as previ-ous step.
In order to confi rm the fi nal structure, nanocomplex was structurally analyzed by variety of techniques. To characterize size, morphology, elements Scanning Elec-tron Microscopy[SEM] withEDAX analysis was used, andcalculation of the roughness parameters meas-ured by means of the Atomic Force Microscopy[AFM], Zeta and size measuring ,also Fourier transform infra-red spectroscopy[FTIR] is an established tool for the structural characterization of the new complex and in additionUltraviolet[UV] spectrum was used to identify the active site in nanocomplex, measuring zeta potential and size of nanoparticle was done eventually.
IN VITRO CELLULAR TOXICITY [XTT]
In order to fi nd and assesse the possible toxic param-eters of synthesized zinc oxide nanoparticles contain-ing trivalent iron-EDTA, XTT method was employed as described in detail in the literature. Furthermore, as stated in literature one of the possible route of discretion of nanoparticle from the body as well as major affected
body part of human by the contrast agents is kidney, HEK-293 was elected for XTT experimental analysis and observations based on the effects of different dosages of zinc oxide nanoparticles containing trivalent iron-EDTA, Fe3+-EDTA and Magnevist [as a FDA approved MR con-trast agent] as controls. XTT data were performed for 72 h period of time.
IN VITRO CELLULAR UPTAKE
To evaluate the cancerous cellular permeability of zinc oxide nanoparticles containing trivalent iron-EDTA, MCF-7 was chosen and different dosages of zinc oxide nanoparticles containing trivalent iron-EDTA, Fe3+-EDTA and Magnevist [as a FDA approved MR contrast agent] as controls were assessed at an obvious time of 6 hours after exposure. After a subjected times cells treated by the agents were eluted by cell culture medium and the cells were centrifuged and lysed by acidic medium. The resultant solution was transferred to detect amunts of Gd3+ and Fe3+ by ICP-Mass spectroscopy as well. Inter-cellular concentration of metals were considered as per-centage of cellular uptake.
RESULTS AND DISCUSSION
In Figure 1 SEM with EDAX analysis for ZnO nanopar-ticle is presented, in addition the image of the sample in various dimension, the result of SEM also be displayed as spectrums. The EDAX pattern exhibited different peaks that each of them shows a specifi c element percentage. The higher peak represents greater concentration. In this way, each element has a special atomic structure containing series of peaks. We have followed the same procedure after preparation of Fe-EDTA complex and ultimate nanocomplex and prominent additional peaks for new elements are obvious whereas those peaks are completely absent in the case of EDAX spectra of the ZnO nanoparticle.
In Figure 2 AFM topography of the as prepared ZnO nanoparticle and the ultimate nanocomplex are pre-sented. The diagram and two-dimensional images of the initial nanoparticle and conclusive nanocomplex are shown in Figure 2a-b which shows the approximate the height of the sample. Three-dimensional images of ZnO nanoparticle and fi nal complex are displayed in Figure 2c-d that shows peak-valley more concretely. The Fe-EDTA complex is inside ZnO nanoparticle pores ran-domly resulting in the formation and size of nanocom-plex. As the load increases, the values of area roughness, line roughness, and also peak−valley height increases obviously. Thus surface morphology verifi cation of nanoparticle and terminal nanocomplex was deter-mined by AFM technique. The changes are explicated by

448 CELLULAR EVALUATION OF ZINC OXIDE NANOPARTICLE CONTAINING IRON BIOSCIENCE BIOTECHNOLOGY RESEARCH COMMUNICATIONS
Kimia Roshani et al.
FIGURE 1. SEM with EDAX analysis, [A] EDAX of ZnO nanoparticle, [B] EDAX of Fe-EDTA complex, [C] EDAX of ZnO nanoparticle with Fe-EDTA as a nanocomplex.
comparing the graphs. Another physicochemical param-eter which has been investigated by Zetasizer is particle size and zeta potential. The average diameter, particle size distribution index, intercept of ZnO nanoparticle and fi nal nanocomplex is shown in Figure 3 and in addition the nanoparticles charge surface before and after reactionsare-7.31mv and -5.63mv respectively.
The FTIR spectrum support the result obtained from SEM, AFM, Zetasizer. After each reaction new peaks appear that proverecent atoms and links as an example a FTIR absorption band is observed at 3436 cm-1 which represents NH link related an amino group of EDTA or the peak in fi ngerprint zone, about 440 cm-1
reveals presence of halogen of FeCl3 in fi nal nanocomplex and background spectrum of ZnO nanoparticle including a peak at 2926 cm-1 confi rms the presence of zinc oxide
nanoparticle.Figure.4 give more explanation about spec-trums.
At the end UV-VIS spectra absorption is recorded between 200-800nm wavelengths. In Figure 5 there is a clear indication of Fe-EDTA complex in the absorp-tion spectrum after loading. The absorption spectrum of the Fe-EDTA complex shows two peaks with absorp-tion between 1.5-2.5 which the fi rst one is related to Carboxylic Acid group of EDTA and the second one demonstrates Ferric Choloride that because of its orbital properties is tended to long wavelengths or visible light. Also the fi nal nanocomplex dissolved in DMSO shows a sharp and narrow peak between 0.2-1nm comparably the previous one.
Moreover, as stated in Figure. 6 zinc oxide nanoparti-cles containing trivalent iron-EDTA, Fe3+-EDTA at all the

BIOSCIENCE BIOTECHNOLOGY RESEARCH COMMUNICATIONS CELLULAR EVALUATION OF ZINC OXIDE NANOPARTICLE CONTAINING IRON 449
Kimia Roshani et al.
FIGURE 2. [a] 2D image and diagram of ZnO nanoparticle, [b] 2D image and diagram of ultimate nanocomplex, [c] 3D image of ZnO nanoparticle at the previous zone, [d] 3D image of ultimate nanocomplex at the previous zone.
used dosages did not rise any signifi cant toxic effects on human kidney cells otherwise a signifi cant toxic effects was shown by Magnevist 100 μM [as a FDA approved MR contrast agent] as control caused 62% cellular mor-tality respectively. Additionally a very good promising cancer cell uptake was recorded for zinc oxide nanopar-ticles containing trivalent iron-EDTA 56% comparing to 9% for that of Magnevist and 5% for Fe-EDTA as well [more details Figure 7].
As it is clear utilizing contrast specialist as a part of sub-atomic imaging is a discussable subject in atomic
prescription, so profi ted a low dangerous balance opera-tor with ideal impact has dependably been a worry. Too Many diverse diagnosis of some targeted human body sections in molecular imaging methodology including Magnetic Resonance Imaging MRI showed noticeable drawbacks that could be considered as diffi culties to remain them also without other confi rmation techniques that mostly would be invasive or even defi ned as impos-sible, (Rameshwar et al. 2015).
Nephrotoxicity and unfavorably susceptible response of many difference operator are the other test because

Kimia Roshani et al.
450 CELLULAR EVALUATION OF ZINC OXIDE NANOPARTICLE CONTAINING IRON BIOSCIENCE BIOTECHNOLOGY RESEARCH COMMUNICATIONS
FIGURE 3. [a] size of ZnO nanparticle is shown at the left side, and the graph on the right related to fi nal nanocomplex. [b] ZP of ZnO nanoparticle is on the left and the right one is ZP of ultimate nanocomplex.
of their structure and phisico-concoction portrayal. In such cases FDA caution is not immaterial showing the improving shot of Nephrogenic Systemic Fibosis [NSF] and or Nephrogenic Fibrosing Dermopathy [NFD] for the determined patients confounded to have renal dis-appointment maladies. [Enzo et al. 2010] What’s more moderate discharge and high lethality of numerous mac-romolecular complex, for example, Gd III, are because of the digestion system which can discharge Gd III parti-cle in body, (Zheng-Rong et al. 2003). Magnetic nano-bio-materials like fe-EDTA-prepared zinc oxide NP nanocomplex using in MRI have been well offered for the next subsequent imaging such viable tumor places (Langer et al. 2015) then again different techniques which require keeps imaging amid treatment. However nano-drugs like nano-complex can defeat natural obstructions which can impact on conclusion and treatment because of passing particles. Then again this nano scale give a fast dissemination amid systemic conveyance further-more can be cleared up easily (Frank et al. 2008). These qualities gather least danger and time to get the most extreme impact and tissue aggregation. Numerous mol-ecule in view of nanotechnology have been considered to conform the pharmacokinetic properties furthermore upgrade the relaxivity which metal-based nanoparticle can be noted, (Enzo et al. 2010, Na et al. 2008).
In this work we have used FeCl3 chelating with EDTA, a six dentate ligand, and react the resulting complex to ZnO nanoparticle to be placed in its pores and structure properly. Ferric as main recognized paramagnetic iona-ble to provide adequate magnetic effects on surrounding water atoms and causes to reduce in T2 and or T1 relaxa-tion time quantities. Subsequently this decline makes a brighter picture in light of T1 relaxation time lessening and darker picture consequently diminishing T2 relaxa-tion time, (Brown et al. 2003) (Na et al. 2008). Contrast-ing with present difference operator, Gd buildings are delegated the specialists that impact on T1 relaxation time and can’t wide water proton resonance and also T2 specialist, for example, paramagnetic and superpara-magnetic specialist containing iron. [(Luca et al. 2012))(Na et al. 2008)]. So creating new compound by having both T1 and T2 diminishment can be so useful. There-for in this paper we synthesized ZnO-Fe nanocomplex besides EDTA as a safe FDA approved and low cost effective chelator in optimum condition.
The result of physico-chemical study showed a good and acceptable data and also low toxicity, at least cost and availability of the material needed are the other pos-itive aspects. The small size of nanocomplex and exist-ing Fe3+ as a paramagnetic agent in ultimate complex displayed a stable and appropriate complex in different

Kimia Roshani et al.
BIOSCIENCE BIOTECHNOLOGY RESEARCH COMMUNICATIONS CELLULAR EVALUATION OF ZINC OXIDE NANOPARTICLE CONTAINING IRON 451
FIGURE 4. FTIR spectrums regarding prepared nanoparticle containing Fe-EDTA [A], Zinc Oxide NP [B], Fe-EDTA [C], EDTA [D] as well as FeCl3 [E].
features such as size, surface charge, topography, func-tional groups and fundamental elements. Ease of entry and low risk of cytotoxicity make this nanocomplex as a novel carrier in loading some drugs and having thera-peutic effects in addition to diagnostic effects especially in tumor cells with prominent uptake.Consequently, based on these points and outcomes synthesized ZnO-Fe
nanocomplex can freely play an important and effective role in the replacement of present contrast agent in MR molecular imaging erelong.
A novel nanocomplex of ZnO-Fe along with EDTA has been prepared by a simple chemical approach as a low toxicMR contrast agent. Thus after chelating iron by EDTA, composed complex reacts with ZnO nanoparti-

Kimia Roshani et al.
452 CELLULAR EVALUATION OF ZINC OXIDE NANOPARTICLE CONTAINING IRON BIOSCIENCE BIOTECHNOLOGY RESEARCH COMMUNICATIONS
FIGURE 5. U.V spectroscopy data regarding prepared nanoparticle containing Fe-EDTA [A], Fe-EDTA [B], EDTA [C] as well as FeCl3 [D].
A B
D
C
FIGURE 4. (Continued)

Kimia Roshani et al.
BIOSCIENCE BIOTECHNOLOGY RESEARCH COMMUNICATIONS CELLULAR EVALUATION OF ZINC OXIDE NANOPARTICLE CONTAINING IRON 453
FIGURE 7. Depiction of competitive MCF-7 cellular uptake regarding Magnevist, Fe-EDTA and Fe-EDTA-Zinc Oxide NP respectively. Obtained data were recorded from a period of 6hr at the same concentration of 50 μM.
FIGURE 6. Illustrations of HEK-293 Cellular Toxicity resulting from 72 hrs. Exposure to different concentration of Magnevist, Fe-EDTA and Fe-EDTA-Zinc Oxide NP respectively. Potential signifi cant toxicity regarding to Magnevist was observed otherwise no toxic effects were recorded for proposed NP as well.

454 CELLULAR EVALUATION OF ZINC OXIDE NANOPARTICLE CONTAINING IRON BIOSCIENCE BIOTECHNOLOGY RESEARCH COMMUNICATIONS
Kimia Roshani et al.
cle and a new stable nanocomplex is formed. Small size of ZnO in nano scale helped to uptake more by cells. The presence of Ferric Chlorideas a valuable magnetic agent makes opportune recognizing easier in molecular imaging like Magnetic Resonance Imaging. The phys-icochemical characteristics were monitored by different analysis resulting in desired achievements that confi rm the fi nal nanocomplex without any structural damage. In conclusion, along the development of nanoparticles for targeted diagnosis and therapy for biomedical appli-cation, proposed ZnO-Fe nanocomplex may be useful as a novel low risk contrast agent to increase resolution in molecular Imaging like MRI and improve the current situation with the minimum cost. Considering lower normal human cellular toxicity as well as higher and promising cancerous human cellular uptake comparing to Magnevist it could be concluded that such iron con-taining nanoparticle marked as new target for future in vivo studies as well as clinical practice.
ACKNOWLEDGMENTS
The authors would to thank Tehran University of Medical Sciences as well as all laboratories and technicians who provided supported during within the course of the study.
CONFLICT OF INTEREST
The authors declared no confl ict of interest.
REFERENCES
Barakat, N. S. (2009). Magnetically modulated nano systems: a unique drug-delivery platform. Nanomedicine, 4 [7], 799–812.
Brown, M. A.; Semelka, R. C. (2003).MRI: Basic Principles and Applications; Wiley-Liss: New York.
Enzo T, Daniela D C, Alessandra V, Silvio A. (2010).Challenges for Molecular Magnetic Resonance Imaging. Chem. Rev, 110, 3019–3042.
Frank , Eric P, Linda K. M, Omid C. (2008).Factors Affecting the Clearance and Biodistribution of Polymeric Nanoparticles.Mol. Pharmaceutics, 5 [4], pp 505–515
Jain, P. K.; Huang, X.; El-Sayed, I. H.; El-Sayed, M. A. (2008) .Noble metals on the nanoscale: optical and photothermal properties and some applications in imaging, sensing, biology, and medicine. Acc. Chem. Res, 41 [12], 1578–1586.
James, M. L., and Gambhir, S. S. (2012) . A molecular imaging primer: modalities, imaging agents, and applications. Physiol. Rev. 92, 897−965
Jesse V. J, Sanjiv S. G. (2011).Molecular Imaging with Ther-anostic Nanoparticles. Acc. Chem.Res., 44 [10], pp 1050–1060
Langer, R. and Weissleder, R. (2015). Nanotechnology. JAMA. 313, 135-136
Lauffer, R. B. [1987]. Paramagnetic metal complexes as water proton relaxation agents for NMR imaging: theory and design. Chem. Rev. 87, 901−927.
Luca F, Junqing Z, Changning W, Chunying W, Robert H. M, Yanming W. (2012) Myelin Imaging Compound [MIC] Enhanced Magnetic Resonance Imaging of Myelination. J. Med. Chem., 55 [1], pp 94–105
Meade, T. J., and Aime, S. (2009). Chemistry of molecular imaging. Acc. Chem. Res. 42, 821−821.
Na, H. B.; Hyeon, T. (2009). Nanostructured T1 MRI contrast agents. J. Mater. Chem., 19, 6267.
Na, H. B.; Song, I. C.; Hyeon, T. (2009). Inorganic Nanoparticles for MRI Contrast Agents. Adv. Mater., 21, 2133–2148.
Rameshwar P, Alexander V. L, Pallavi R. G, Hui D, Jose P.A, Shawn W, Satoshi I, Bindu K, Arthur R, Alexandra C, Janet L. M, Vladimir A. L, Debiao L, Ravi S. P, Keith L. B, Eggehard H, and Julia Y. L. (2015). MRI Virtual Biopsy and Treatment of Brain Metastatic Tumors with Targeted Nanobioconjugates: Nanoclinic in the Brain.ACS Nano, 9 [5], pp 5594–5608
Schwert, D., Davies, J., and Richardson, N. (2002) NonGadolin-ium-Based MRI Contrast Agents [Krause, W., Ed.] pp 165−199, Springer, Berlin
Toth, E., Helm, L., and Merbach, A. (2002) Relaxivity of MRI Contrast Agents [Krause, W., Ed.] pp 61−101, Springer, Berlin.
Zheng-Rong L, Xinghe W, Dennis L. P, K. Craig G, Henry R. B. (2003). Poly [L-glutamic acid] Gd[III]-DOTA Conjugate with a Degradable Spacer for Magnetic Resonance Imaging. Biocon-jugate Chem, 14, 715−719

Medical CommunicationBiosci. Biotech. Res. Comm. 10(3): 455-462 (2017)
Comparison of stress distribution around implants with
three different attachments in overdenture supported by
four maxillary implants using fi nite element analysis method
Asadallah Ahmadzadeh1 and Ahmad Teimouri2*1Assistant Professor, Department of Prosthodontics, School of Dental Medicine, Ahvaz Jundishapur University of Medical Sciences Ahvaz Iran2Assistant Resident, Department of Prosthodontics, School of Dental Medicine, Ahvaz Jundishapur University of Medical Sciences Ahvaz Iran
ABSTRACT
As a general rule, the purpose of treatment planning should be minimization and evenly distribution of mechanical stress in the adjacent implant and bone system. Various experimental studies have examined the distribution of stress in the implant supporting bones, thus avoiding the dangers involved. But there is still controversy about biomechanical effects and stress distribution in differ-ent attachment designs. The purpose of this study was to compare the distribution of stress around the implant with three different attachments in overdenture based on four maxillary implants using fi nite element analysis method (FEA). In this experimental study, using the FEA method, a 3D model of maxilla, implant, attachment components and overdenture was fi rst prepared and then, using the ANSYS fi nite element software, the components of the model were superimposed on each other so that it can act as a component integrated with different materials. Implants are located in the anterior and posterior parts of the maxilla, with two implants placed in the two sides of the canine, one in the left central position and the other in the right second premolar. These implants were attached to the overdenture using three bar-clip, ball, and locator attachment designs. The 100N force used in this study and imposed verti-cally to the tooth 6 unilaterally and bilaterally and the stress level was investigated in each design. Among the three different designs examined, the highest stress was observed in the vertical force (22.87 MPa) imposed on the implant in the right second premolar on the right overdenture supported by the locator implant. In the second place, the highest stress was observed on the Ball-retained overdenture in the right side force, imposed on the implant in the right second premolar corresponding to 12.88 MPa. The least stress among these three designs was observed in the bar-clip-retained overdenture design, the maximum stress on which is in the vertical force imposed on the right side to the right second premolar implant at the size of 7.486MPa. Bar-clip-retained overdenture with the lowest stress caused by the 100 N force is the most appropriate design in the present study.
KEY WORDS: FINITE ELEMENT METHOD; STRESS TEST; BAR-CLIP ATTACHMENT; BALL ATTACHMENT; LOCATOR ATTACHMENT; OVERDENTURE
455
ARTICLE INFORMATION:
*Corresponding Author: [email protected] 12th July, 2017Accepted after revision 22nd Sep, 2017 BBRC Print ISSN: 0974-6455Online ISSN: 2321-4007 CODEN: USA BBRCBA
Thomson Reuters ISI ESC and Crossref Indexed Journal NAAS Journal Score 2017: 4.31 Cosmos IF: 4.006
© A Society of Science and Nature Publication, 2017. All rights reserved.Online Contents Available at: http//www.bbrc.in/DOI: 10.21786/bbrc/10.3/19

456 COMPARISON OF STRESS DISTRIBUTION AROUND IMPLANTS BIOSCIENCE BIOTECHNOLOGY RESEARCH COMMUNICATIONS
Ahmadzadeh and Teimouri
INTRODUCTION
Considering the aging of people in communities and consequently the increase in complete edentulousness, today edentulousness has become a public health prob-lem. Unfortunately, in Iran, edentulousness is not seen only in the elderly and many young people also suf-fer from complete edentulousness for a variety of rea-sons, including systemic diseases, non-compliance with oral and dental care, and absence of periodic visit to the dentist. Edentulousness can reduce the quality of life of patients both physically and psychologically. Recent studies have shown that tooth loss can affect the intake and absorption of nutrients due to reduced chew-ing ability, and increase the risk of multiple diseases. For this reason, dental implants are used to improve the chewing effi cacy in complete edentulous patients and have improved the quality of life of these patients to an optimum level, (MacEntee et al 2003, Abnet et al., 2005, Semba et al 2006, Goiato et al 2008, Pennington et al 2012, Cunha et al 2013 Cakir et al 2014, Dezhdar et al 2017 and Geerts 2017).
The treatment that is predominantly performed for edentulous patients is the use of complete denture hands. From a public health perspective, although this treat-ment is a simple and inexpensive treatment, it cannot, be a general remedy for all patients. One of the main problems in edentulousness patients is their low satisfac-tion in denture use. The main reason for this discontent is poor compliance, inadequate collision, ulceration and pain (Zarb et al 2004). Considering the problems men-tioned for ordinary complete dentures, a rational solu-tion must be sought to the problems. Two types of treat-ment are widely used for these patients: there are fi xed implant supported prostheses and implant-dependent overdenture that are widely used for complete edentu-lous patients (Dias et al 2013) and the use of any of these treatments depends on the patient’s characteristics and conditions, including the amount of bone remain-ing, intervertebral space, oral hygiene, cost, and patient satisfaction (Zafi ropoulos et al 2010).
Fixed implant-based prostheses may be one of the best ways to treat edentulousness and are implemented in case of suffi cient bone and mandibular space (Chee et al 2006). More implants are usually needed to support a fi xed prosthesis than an overdenture (Payne et al 2009). Since it is sometimes impossible to use a large number of implants for the patient, this issue limits the use of fi xed prostheses (Chee et al 2006). Other constraints on the use of fi xed prostheses is the loss of facial beauty due to the lack of lip support and soft tissue face, lack of access to hygiene, multiple and high cost surgical procedures (Vogel 2007). Using overdentures has greatly resolved the problems associated with the use of fi xed prosthe-
sis. Implant-based overdenture is a moving prosthesis that is placed on smaller number of implants per jaw, and has excellent attachment and stability. Overdenture is a simple, cost-effective, durable, less invasive treat-ment and a successful treatment option for edentulous patients and its use has recently become very common (Assunção et al 2008). Implant-based overdenture has improved the function of implant therapy (Awad et al 2003) due to the benefi ts of physical and natural beauty, and is superior to conventional dentures in many cases (Sadowsky 2001). Different studies have shown that this type of treatment has improved general health and qual-ity of life of patients (Awad et al 2003). So, although the patient wants a fi xed implant-based prosthesis, (s) he tends to use overdenture. Implant-based overdentures are connected to the implant by an interstitial part called attachment, which allows the prosthesis to resist against displacement forces (Locker 1998).
Many attachments such as rods, buttons, and mag-nets, are used to support implant-dependent overden-tures (Machado et al 2011). Clinical success and longev-ity of dental implants are affected by the distribution of stress transferred to the implant and surrounding bones (Jacques et al 2009). Also, the lack of suffi cient bio-compatibility between the implant and the surrounding bone can lead to implant failure (Berglundh et al 2002). Different attachment systems used in overdentures show different biomechanical characteristics and can be dan-gerous to implant supporting bones (Sadowsky 2007). Various experimental studies have examined the distri-bution of stress in the implant supporting bones, thus avoiding the dangers involved. But there is still contro-versy about biomechanical effects of stress distribution in different attachment designs (CHUN et al 2005) and (Baumeister 1978). Paying attention to the principles of biomechanics in implant-based prosthesis can provide a suitable treatment design for each patient and reduce the probability of functional problems or implant fail-ure (Baumeister 1978). Different methods are used to evaluate the stress and strain in the bone around the implant, which can be used for photoelastic analysis, strain gauge, and fi nite element analysis.
Fine Element Analysis (FEA) is a precise method for evaluating the amount and pattern of stress distribu-tion in dental structures which has many advantages over other methods. Precise geometric reconstruction of the structures involved in stresses acceptance and dis-tribution, ability to accept and receive different simply, showing the procedure of internal stresses and other mechanical quantities, rapid and simple repeatability of the tests are among the benefi ts of this study method. FEA is a numerical and quantitative method for analyz-ing stress in complex structures. In this method, sepa-rate structural elements are connected through points

BIOSCIENCE BIOTECHNOLOGY RESEARCH COMMUNICATIONS COMPARISON OF STRESS DISTRIBUTION AROUND IMPLANTS 457
Ahmadzadeh and Teimouri
or nodes. These components are created by dividing the primary structure into units of the proper shape. For each element, the physical properties are considered proportional to the simulated material (Powers 2006).
This method is also used in dental studies as an ideal method for preparing the correct tooth model and it’s supporting structures in three dimensional form. This method can provide measurement of partial mechanical responses towards the difference in mechanical param-eters and the evaluation of stress in dental materials and tissues at different levels (Motta et al 2006). Various stud-ies, using the FEA method, have shown that stress dis-tribution in maxillary and mandibular implant systems is signifi cantly affected by various attachment designs (CHUN et al 2005). The maxillary implant supported-overdentures are less predictable than mandibular over-dentures, and there is controversy over the use of dif-ferent designs and the number of implants used (Dudley 2014). One of the overdenture treatments in maxilla is the use of four implants, which has been studied in few studies. There are also few studies on maxillary over-denture than the mandibular one (Raghoebar et al 2014).
Some studies have shown that 4 or more than 4 max-illary implant-dependent overdentures are more stable and more durable than less than 4 implant-dependent overdentures (Raghoebar et al 2014). These implants can hold the overdenture with various attachments. Results of studies on the acceptance and use of various attach-ments showed that the bar and button attachments that have a good stability as well as locators that are newer, are at a higher level in terms of general acceptance and enjoy more clinical use (Büttel et al 2009) and (Loncar 2015). For this reason, these attachments will be used in a four-implant design to measure stress in the present study. The present study uses a FEA method to simulate the structure of various overdenture designs based on four maxillary implants, to investigate the distribution of Von Mises stress in the surface of all attachments and implant supporting bones so that the most suitable solu-tion for the treatment is identifi ed.
MATERIAL AND METHODS
The present study is an experimental study in which the distribution of stress is investigated and compared in 4 maxillary implant-dependent overdentures by FEA method. In this study, the CBCT-Scan (NewTom VGi; Finland) of a 30-year-old patient that was available in the radiology department of Ahwaz Dental Faculty was used to prepare the Maxilla model. Maxilla data were imported to the Mimics ver. 8.1.1 for digitalization of images. After transferring CBCT-Scan data to the Mim-ics software, other changes were made to this data, which included deleting the patient’s tooth data from
the initial data. The entire maxilla structure and root site of the teeth was reconstructed with cortical bone and 2 mm soft gum tissue was considered on it. The maxillary bone structure was considered isotopic and homogeneous, while the elasticity coeffi cient was lin-early assumed. The overdenture was constructed on the maxilla model that was obtained by a 3D printer of the existing model. It is essential to accurately measuring the implant for implant modeling. Hence, one specimen of SPI implant (Thommen Medical, Element, Switzer-land) with a diameter of 4x12.5 mm was measured by the Coordinate Measuring Machine (CMM; Mitutoyo-America Corporation) and the dimensions required for modeling were used in solid works 2014. In this study, Ball, Bar-clip, Locator (ThommenMedical, Switzerland) attachments were used. Overdenture and attachments were initially measured by CMM and turned into digi-tal images. The output fi le of the Mimics software was imported to the modeling software called Solid Works (SolidWorks® Offi ce Premium 2007 SP, Corporation, Concord, MA, USA) to turn into a geometric model. Geo-metric modeling in Solid Work software was performed automatically based on the surface detail specifi ed by the user. In the above model, implants were placed in the right second premolar, left and right canine and left central regions. One 4-mm long locator with housing with a diameter of 3.6 mm and a height of 2.3 mm was modeled. Also, ball with a width of 2.2 and a height of 4.3 mm and bar-clip with width and height of 2.2 and 3 mm respectively were modeled. In the Bar design, the abutment pattern was used and the outside part of the implant had height of 5.5 mm.
The next step in FEA modeling is to apply appropriate boundary conditions and loading. For this purpose, the geometric model was imported to ABAQUS / Standard software (Version 6.14/1, Pawtucket, IR) for fi nite analy-sis. ANSYS software was used to implement FEA mode-ling. The elements used in this study included SOLID187, CONTA174 and TARGE170, the fi rst of which was used to generate the grid in the geometric model components and the latter two elements for the attachments. In the loading stage, the 100N static forces were applied ver-tically to the center of the fi rst molar center and the stress distribution was demonstrated on the surface of all implant supporting attachments and bones based on computer graphic forms.
RESULTS AND DISCUSSION
Among the three different designs examined, the high-est stress was observed in the vertical force (22.87 MPa) imposed on the implant in the right second pre-molar on the right overdenture supported by the loca-tor implant. In the second place, the highest stress was

458 COMPARISON OF STRESS DISTRIBUTION AROUND IMPLANTS BIOSCIENCE BIOTECHNOLOGY RESEARCH COMMUNICATIONS
Ahmadzadeh and Teimouri
FIGURE 1. Distribution of stress caused by the bilateral force in ball attachment-based overdenture
FIGURE 2. Distribution of stress caused by the bilateral force in ball attachment-based overdenture
observed on the Ball-retained overdenture in the right side force, imposed on the implant in the right second premolar corresponding to 12.88 MPa. The least stress among these three designs was observed in the bar-clip-retained overdenture design, the maximum stress on which is in the vertical force imposed on the right side to the right second premolar implant at the size of 7.486MPa. In the working side of the bone, the most stress was induced to the nearest implant of the same side. The results for the highest levels of stress in dense
and sponge bones did not reach the fi nal bone resorp-tion in any of the treatment plans (Figures 1 to 4). Therefore, it can be concluded that overdenture based on the bar-clip implant with the least stress produced by the 100 N force, is the most suitable design, and the ball design has the least stress and is suitable in the second place (Tables 1 to 6).
In the working side of the bone, the most stress was imposed to the nearest implant of the same side. The results for the highest levels of stress in dense and

BIOSCIENCE BIOTECHNOLOGY RESEARCH COMMUNICATIONS COMPARISON OF STRESS DISTRIBUTION AROUND IMPLANTS 459
Ahmadzadeh and Teimouri
FIGURE 3. Distribution of stress caused by the bilateral force in bar-clip attachment-based overdenture
FIGURE 4. Distribution of stress caused by the bilateral force in locator attach-ment-based overdenture
sponge bones did not reach the ultimate bone resistance in any of the treatment designs (Figures 1 to 4).
Among the three different attachment designs studied in this study, the highest bone stress was observed around the implant of the second right premolar area (working) where locator attachment was used. In the present study, the locator attachment was not evaluated using the FEA method. After the locator attachment, the highest stress was observed in the bone around the implant of the sec-ond premolar area (working) using the ball attachment
and the result was consistent with the result of the study by Chun et al. with the difference that the vertical input force was 150 N was applied only bilaterally. In the pre-sent study, vertical forces were applied unilaterally and bilaterally with the highest concentration of stress in the working side of the bone near the nearest implant to the loading site in both cases.
According to the non-uniformity of force distribu-tion obtained in the study of Mejer et al., the highest the stress was seen in the working side of the bone and

Ahmadzadeh and Teimouri
460 COMPARISON OF STRESS DISTRIBUTION AROUND IMPLANTS BIOSCIENCE BIOTECHNOLOGY RESEARCH COMMUNICATIONS
Table 1. Maximum stress in implants in different treatment designs (Mpa) (bilateral force)
Treatment planRight second premolarTooth right caninTooth Left caninLeft central
Locator1/560/6740/6740/01
Ball0/6150/00710/00710/0071
Bar-clip1/30/0700/0700/070
Table 2. Maximum stress in implants in different treatment designs (MPa) (left force)
Treatment planRight second premolarTooth right caninTooth Left caninLeft central
Locator0/008010/008010/0170/017
Ball0/0400/0750/20330/075
Bar-clip0/0750/0140/32390/014
Table 3. Maximum stress in implants in different treatment designs (MPa) (right force)
Treatment planRight second premolarTooth right caninTooth Left caninLeft central
Locator0/48630/1680/0630/0012
Ball0/32180/1270/1270/0031
Bar-clip1/2020/48630/0310/031
Table 4. Maximum stress in bone around implants in different treatment designs (Mpa) (bilateral force)
Treatment planRight second premolarTooth right caninTooth Left caninLeft central
Locator22/870/0670/0670/067
Ball12/880/00710/00710/0071
Bar-clip7/4860/00780/00780/0078
Table 5. Maximum stress in the bone around the implants in different treatment designs (MPa) (left force)
Treatment planRight second premolarTooth right caninTooth Left caninLeft central
Locator0/36260/1701/4770/170
Ball0/0751/4770/36260/548
Bar-clip0/04037/3650/3230/114
Table 6. Maximum stress in the bone around the implants in different treatment designs (MPa) (right force)
Treatment planRight second premolarTooth right caninTooth Left caninLeft central
Locator22/870/4507/4860/168
Ball12/880/8090/8090/809
Bar-clip7/4860/4860/4500/0315
the nearest implant to the force insertion site, and the results confi rms the consistency of both studies. Accord-ing to the results, the lowest concentration of stress in the bone around the implant was observed when load-clip-based overdenture was used, which is inconsistent with the results obtained in the study of Menicucci et al. on two types of ball and bar attachments. They used a
vertical 35N force on the mandibular overdenture, and the results showed that ball attachment tends to trans-mit less stress than the bar-clip attachment in the bone around the implant.
In the present study, the vertical force input was investigated in maxilla and the resulting difference requires a review of similar studies in this area. In a

Ahmadzadeh and Teimouri
BIOSCIENCE BIOTECHNOLOGY RESEARCH COMMUNICATIONS COMPARISON OF STRESS DISTRIBUTION AROUND IMPLANTS 461
previous study, locator, ball and bar-clip attachments, respectively, caused the highest amount of stress to the bone around the implant in maxilla. Valentim et al. obtained similar results by investigating Ball & Bar, Ball and Bar attachments in the mandible by apply-ing a vertical force of 100 N and found that the high-est stress was fed through the Ball type attachment to the bone around the implant. In the present study, the highest level of stress in the bone around the implant was concentrated in the implant neck region, which was completely consistent with the results of the pre-vious studies. In the study of stress in metal parts in ball attachments, the stress concentration occurred in the cervical area of the attachment in the 5th tooth of the right implant area. The stress concentration for the bar-clip attachment was observed between the 5th and 3rd tooth right implants. In the locator attachment, the greatest stress in the housing area of the locator attachment was entered into the right side of the 5th tooth. Compared to the different treatment designs, the stress at the bar-clip attachments was higher than the other two. It is recommended to use the bar-clip treat-ment design in some cases where reducing stress in the bone around the implant is more important than over-denture stability and stress in the metal parts. If there is no necessity in these cases, you can use the Ball and Locator treatment designs as needed.
The greatest amount of bone stress in all treatment designs was concentrated in the cervical implants in the working side and a few upper threaded implants, and the stress rate didn’t reach to the ultimate bone strength in any of the treatment designs, thus, it seems that bone resorption will not occur in any none of the treatment designs. In clinical situations where overdenture is expected to undergo lot of force, it is recommended to use the Bar-Clip treatment design because less stress is transmitted to the bone around the implant. The maxi-mum stress induced in the implant-based overdenture model was observed in the locator attachment, and the implant overdenture supported by the Bar-clip attach-ment with less stress was the most appropriate design for the present study.
REFERENCES
Abnet, C.C., Qiao, Y.L., Dawsey, S.M., Dong, Z.W., Taylor, P.R. and Mark, S.D., 2005. Tooth loss is associated with increased risk of total death and death from upper gastrointestinal cancer, heart disease, and stroke in a Chinese population-based cohort. International journal of epidemiology, 34(2), pp.467-474.
Assunção, W.G., Tabata, L.F., Barao, V.A.R. and Rocha, E.P., 2008. Comparison of stress distribution between complete den-ture and implant‐retained overdenture‐2D FEA. Journal of oral rehabilitation, 35(10), pp.766-774.
Awad, M.A., Lund, J.P., Shapiro, S.H., Locker, D., Klemetti, E., Chehade, A., Savard, A. and Feine, J.S., 2003. Oral health sta-tus and treatment satisfaction with mandibular implant over-dentures and conventional dentures: a randomized clinical trial in a senior population. International Journal of Prostho-dontics, 16(4).
Baumeister, T., 1978. Standard Handbook for Mechanical Engi-neer. McGraw-Hill Interamericana.
Berglundh, T., Persson, L. and Klinge, B., 2002. A systematic review of the incidence of biological and technical complica-tions in implant dentistry reported in prospective longitudinal studies of at least 5 years. Journal of clinical periodontology, 29(s3), pp.197-212.
Bilhan, H., Mumcu, E. and Arat, S., 2011. The comparison of marginal bone loss around mandibular overdenture‐support-ing implants with two different attachment types in a loading period of 36 months. Gerodontology, 28(1), pp.49-57.
Büttel, A.E., Bühler, N.M. and Marinello, C.P., 2009. Locator or ball attachment: a guide for clinical decision making. Sch-weizer Monatsschrift fur Zahnmedizin= Revue mensuelle sui-sse d’odonto-stomatologie= Rivista mensile svizzera di odon-tologia e stomatologia, 119(9), pp.901-918.
Cakir, O., Kazancioglu, H.O., Celik, G., Deger, S. and Ak, G., 2014. Evaluation of the effi cacy of mandibular conventional and implant prostheses in a group of Turkish patients: A qual-ity of life study. Journal of Prosthodontics, 23(5), pp.390-396.
Chee, W. and Jivraj, S., 2006. Treatment planning of the eden-tulous mandible. British dental journal, 201(6), p.337.
Chun, H.J., Park, D.N., Han, C.H., Heo, S.J., Heo, M.S. And Koak, J.Y., 2005. Stress distributions in maxillary bone surrounding overdenture implants with different overdenture attachments. Journal of oral rehabilitation, 32(3), pp.193-205
Cunha, T.R., Della Vecchia, M.P., Regis, R.R., Ribeiro, A.B., Muglia, V.A., Mestriner, W. and De Souza, R.F., 2013. A ran-domised trial on simplifi ed and conventional methods for complete denture fabrication: masticatory performance and ability. Journal of dentistry, 41(2), pp.133-142.
Dezhdar, S., Fereidoonpoor, N., Mostaghni, E., Jahanpour, F. and Ravanipour, M., 2017. Transition from being OK to NOT OK with tooth loss among a selection of older people in Iran: a qualitative study. Gerodontology, 34(2), pp.215-226.
Dias, R., Moghadam, M., Kuyinu, E. and Jahangiri, L., 2013. Patient satisfaction survey of mandibular two-implant–retained overdentures in a predoctoral program. The Journal of prosthetic dentistry, 110(2), pp.76-81.
Dudley, J., 2014. The 2-implant maxillary overdenture: A clini-cal report. The Journal of prosthetic dentistry, 112(2), pp.104-107.
Geerts, G.A., 2017. Neutral zone or conventional mandibular complete dentures: a randomized cross‐over trial comparing oral‐health related quality of life. Journal of Oral Rehabilita-tion.
Goiato, M.C., Ribeiro, P.P., Garcia, A.R. and Dos Santos, D.M., 2008. Complete denture masticatory effi ciency: a literature

Ahmadzadeh and Teimouri
462 COMPARISON OF STRESS DISTRIBUTION AROUND IMPLANTS BIOSCIENCE BIOTECHNOLOGY RESEARCH COMMUNICATIONS
review. Journal of the California Dental Association, 36(9), pp.683-686.
Jacques, L.B., Moura, M.S., Suedam, V., Souza, E.A.C. and Rubo, J.H., 2009. Effect of cantilever length and framework alloy on the stress distribution of mandibular‐cantilevered implant‐supported prostheses. Clinical oral implants research, 20(7), pp.737-741.
Locker, D., 1998. Patient-based assessment of the outcomes of implant therapy: a review of the literature. International Jour-nal of Prosthodontics, 11(5).
Loncar, B., 2015. Konfekcijski pricvrsni sustavi pokrovnih pro-teza nošenih implantatima (Doctoral dissertation, University of Zagreb. School of Dental Medicine. Department of Removable Prosthodontics.).
MacEntee, M.I., 2003. The impact of edentulism on function and quality of life. Implant overdentures as the standard of care for edentulous patients. Chicago: Quintessence Interna-tional, pp.23-8.
Machado, A.C.M., Cardoso, L., Brandt, W.C., Henriques, G.E.P. and de Arruda Nóbilo, M.A., 2011. Photoelastic analysis of the distribution of stress in different systems of overdentures on osseous-integrated implants. Journal of Craniofacial Surgery, 22(6), pp.2332-2336.
Motta, A.B., Pereira, L.C. and da Cunha, A.R., 2006. Finite ele-ment analysis in 2D and 3D models for sound and restored teeth. In 2006 ABAQUS conference. ABAQUS Inc (pp. 329-43).
Payne, A., Walton, J., Alsabeeha, N., Worthington, H.V. and Esposito, M., 2009. Interventions for replacing missing teeth: attachment systems for implant overdentures in edentulous jaws. The Cochrane Library.
Pennington, J. and Parker, S., 2012. Improving quality of life using removable and fi xed implant prostheses. Compendium
of continuing education in dentistry (Jamesburg, NJ: 1995), 33(4), pp.268-70.
Powers, J.M. and Sakaguchi, R.L., 2006. Impression materials. Craig’s Restorative Dental Materials, 12, pp.269-312.
Raghoebar, G.M., Meijer, H.J., Slot, W., Slater, J.J. and Vissink, A., 2014. A systematic review of implant-supported overden-tures in the edentulous maxilla, compared to the mandible: how many implants. Eur J Oral Implantol, 7(Suppl 2), pp.S191-S201.
Sadowsky, S.J., 2001. Mandibular implant-retained overden-tures: a literature review. The Journal of prosthetic dentistry, 86(5), pp.468-473.
Sadowsky, S.J., 2007. Treatment considerations for maxillary implant overdentures: a systematic review. The Journal of prosthetic dentistry, 97(6), pp.340-348.
Semba, R.D., Blaum, C.S., Bartali, B. and Xue, Q.L., 2006. Denture use, malnutrition, frailty, and mortality among older women living in the community. The journal of nutrition, health & aging, 10(2), p.161.
Slot, W., Raghoebar, G.M., Vissink, A. and Meijer, H.J., 2013. Maxillary overdentures supported by four or six implants in the anterior region; 1‐year results from a randomized controlled trial. Journal of clinical periodontology, 40(3), pp.303-310.
Vogel, R.C., 2007. Implant Overdentures: A New Standard of Care for Edentulous Patients.
Zafi ropoulos, G.G. and Hoffman, O., 2010. Implant-retained dentures for full-arch rehabilitation: a case report compar-ing fi xed and removable restorations. General dentistry, 59(4), pp.e137-43.
Zarb, G.A., Bolender, C.L., Eckert, S.E., Fenton, A.H., Jacob, R.F. and Mericske-Stern, R., 2004. Prosthodontic treatment for edentulous patients. Mosby.

Biotechnological CommunicationBiosci. Biotech. Res. Comm. 10(3): 463-474 (2017)
In vitro anticariogenic activity of commercially existing
anticavity tooth pastes and tooth powders against
Lactobacillus acidophilus isolated from childhood caries
Vijayalakshmi S.*, Rajasekar S. and Mohankumar A Division of Microbial Technology, Post Graduate Research Department of Zoology, Chikkanna Government Arts College, Tirupur – 641 602, Tamilnadu, India
ABSTRACT
Primary childhood caries constitute a burden for the dental profession and public health administrators, as many authors report that the situation in primary dentition has not improved over the last decades, impacting children’s quality of life and future oral health. Biologi-cal as well as socio economic factors are related to the development of dental caries, and are both relevant in understanding the disease process and is the main reason the rural preschool children’s are admitted to hospitals. The early stages of invasion infection caused by Lactobacillus acidophilus also play major role in this process. This study was carried out to access the invitro antibacterial potential of the different tooth paste and tooth powders available in local market against the isolated oral micro fl ora Lactobacillus acidophilus from hundred different samples (including tooth scraping and swabs) collected from various dental clinics and from rural preschool children with different age group ranging from 5-17yrs. A total of hundred isolates were selected and screened for their ability to produce anti-microbial substance. The antimicrobial activity of eleven different tooth pastes such as Pepsodent, Colgate advance, Meswak, Vicco, S.V Namboodiri, K.P. Namboodiri’s, Babool, Dabur Red, Close up, Himalaya herbal complete care and Cheerio gel and four different tooth powders namely Herbal JM, Gopal, Pyorea and Injection were evaluated on cariogenic lactic acid bacteria. The antimicrobial properties of tooth paste were tested with cariogenic biofi lm producing microbial strain Lactobacillus acidophilus using well diffusion method. Each tooth paste was tested at different concentrations (2%, 4%, 6%, 8%, 10% and 12%). This investigation showed that all dentifrices selected for the study were effective against the entire test organisms but to varying degrees. Pepsodent – Germi Check tooth paste gave a reading of 45 mm at 10% concentration of tooth paste as the zone of inhibition which was highest amongst all of the test dentifrices followed by Colgate advance dentifrice recorded a larger maximum zone of inhibition, measuring 40 mm compared to other tooth pastes. All other dentifrices showed the zone of inhibition to be between 20 mm to 37.5 mm in 10% concentration of tooth paste respectively. The data obtained from the complete investigation showed that tooth paste formulations have more effective active ingredients to control the oral micro fl ora whereas, herbal based products are equally effective as the other formulations but are not superior to them, whereas the tooth powder formulations were 100% less effective in controlling the oral fl ora.
KEY WORDS: ANTICARIOGENIC ACTIVITY TOOTH PASTES LACTOBACILLUS ACIDOPHILUS
463
ARTICLE INFORMATION:
*Corresponding Author: [email protected] 10th July, 2017Accepted after revision 28th Sep, 2017 BBRC Print ISSN: 0974-6455Online ISSN: 2321-4007 CODEN: USA BBRCBA
Thomson Reuters ISI ESC and Crossref Indexed Journal NAAS Journal Score 2017: 4.31 Cosmos IF: 4.006
© A Society of Science and Nature Publication, 2017. All rights reserved.Online Contents Available at: http//www.bbrc.in/DOI: 10.21786/bbrc/10.3/20

464 IN VITRO ANTICARIOGENIC ACTIVITY OF COMMERCIALLY EXISTING ANTICAVITY BIOSCIENCE BIOTECHNOLOGY RESEARCH COMMUNICATIONS
Vijayalakshmi, Rajasekar and Mohankumar
INTRODUCTION
WHO declared that deprived oral health and its related diseases may have dreadful effect on common health as well as eminence of life. Dental caries is an infec-tious, communicable disease resulting in destruction of tooth structure by acid forming bacteria found in dental plaque, an intraoral biofi lm, in the presence of sugar. The infection results in loss of tooth minerals that begin on the outer surface of the tooth and can progress through the dentin to the pulp, ultimately compromising the vitality of the tooth. Various literature has proved that Streptococcus mutans and Lactobacillus acidophilus were the main causative agent for dental caries (Fitzger-ald and Keyes, 1960). The early manifestation of the car-ies process is a small patch of demineralised enamel at the tooth surface, often hidden from sight in the fi ssures of teeth or in between the teeth. The destruction spreads into the softer, sensitive part of the tooth beneath the enamel (Yadav and Prakash 2017 and Tasie et al., 2017).
These bacteria are strongly stimulated by sucrose and are known as the main organisms responsible for human tooth decay. Biofi lm formation is a natural process in the oral environment, but needs to be controlled through regular brushing in order to prevent the development of caries and periodontal diseases. Most of the people use toothpaste without knowing their potential effi cacy, bac-teria form an important group of microorganisms found in both healthy and diseased mouths. There have been more than 300 types of bacteria found in the mouth; it’s a very serious matter to select the effective toothpaste or powder to prevent teeth from microbial attack pre-venting the principle dental diseases like dental plaque, dental caries, gingivitis and periodontitis.
The purpose of oral hygiene using toothpaste is to reduce oral bacterial fl ora, mouth bacteria have been linked to plaque. Plaque is a complex biofi lm found on the tooth surface that is a major cause of the develop-ment of dental caries (Benson et al., 2004). The accu-mulation and development of plaque depends upon the outcome of the interactions between the adhesiveness of plaque to the tooth surface and the physical shear forces which serve to dislodge and remove the plaque (Roberts et al., 2005). Tooth paste is classifi ed as drug not as a cosmetic, different brands of tooth pastes and tooth powders contain effective antibacterial ingredients as broad spectrum antibacterial agents which effectively reduce oral bacteria and contribute to dental health (Regos et al., 1974). The common method for maintain-ing good oral hygiene is brushing the teeth with denti-frices that have antimicrobial properties and can prevent the degradation of tooth enamel (Vyas et al., 2017).
Tooth brushing with toothpaste is the most widely practiced form of oral hygiene in most countries (Pan-
nuti et al., 2003). The success of any toothpaste, in part, lies on its ability to eliminate pathogenic oral micro fl ora. Fluoride dentifrices have been widely used all over the world and extensive research has established their abilities in terms of caries resistance (Itthagarum and Wei, 1996). A wide range of chemicals, mainly antimi-crobial agents, have been added to tooth pastes in order to produce a direct inhibitory effect on plaque formation (Fine et al., 2006; Pannuti et al., 2003), clearly, most individuals fi nd it diffi cult to maintain an effective level of plaque control and this is refl ected in the levels of periodontal disease in the population. The addition of antimicrobial agents to tooth paste has been suggested as one possible method to improving the effi cacy of mechanical tooth-cleaning procedures (Fine et al., 2006; Moran et al., 1988), aiding the control of dental plaque and preventing dental caries and periodontal diseases (Ozaki et al., 2006; White et al., 2006).
When these substances are added to oral products, they kill microorganisms by disrupting their cell walls and inhibiting their enzymatic activity. They prevent bac-terial aggregation, slow multiplication and release endo-toxins (Bou-Chacra et al., 2005; Ozaki et al., 2006). Our day begins with the tooth paste, hence the objective of this current study has made an effort to argument out the components of conventional tooth pastes should be as safe as those of herbal tooth pastes and able to maintain the good dental hygiene by use of tooth paste because dental care is one of the aspects of human sanitation, which unfortunately receive scanty attention to provide effi cient protection against cariogenic microorganisms to enhance biofi lm control, and prevent dental caries.
MATERIALS AND METHODS
Fifty different dental clinical samples from various dental clinics and from the patients having dental car-ies who come for the dental treatment of different age groups ranging from 5-17 years were collected with the help of an excavator and immediately transferred to 3 ml of saline solution in sterile glass vials. Informa-tion of patient’s dental case history was also recorded along with his/her consent. After inoculation, vials were capped and sealed by Parafi lm. The packed vials were brought to the laboratory immediately and kept in incu-bator at 37°C for 24 hours for bacterial enrichment. he cariogenic biofi lm producing Lactobacillus acidophilus were screened, identifi ed and purifi ed by series of sub-culture on specifi c media such as Man Rogosa Sharpe agar and Nutrient agar were incubated aerobically at 37°C for 24 hours. The identifi cation of all the microbes was confi rmed by standard biochemical and staining methods (Aneja, 2003). All the pure cultures were stored and maintained in nutrient broth at 4˚C for further use.
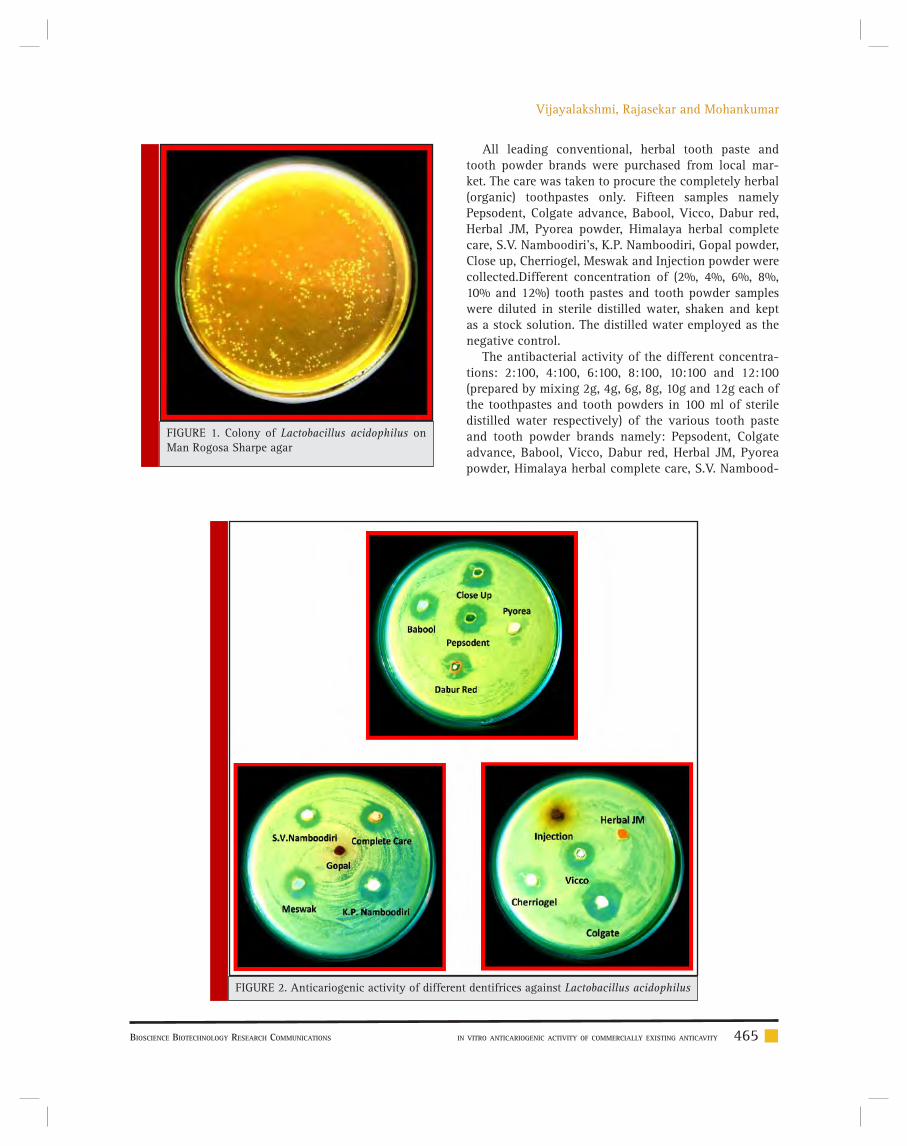
BIOSCIENCE BIOTECHNOLOGY RESEARCH COMMUNICATIONS IN VITRO ANTICARIOGENIC ACTIVITY OF COMMERCIALLY EXISTING ANTICAVITY 465
Vijayalakshmi, Rajasekar and Mohankumar
FIGURE 1. Colony of Lactobacillus acidophilus on Man Rogosa Sharpe agar
FIGURE 2. Anticariogenic activity of different dentifrices against Lactobacillus acidophilus
All leading conventional, herbal tooth paste and tooth powder brands were purchased from local mar-ket. The care was taken to procure the completely herbal (organic) toothpastes only. Fifteen samples namely Pepsodent, Colgate advance, Babool, Vicco, Dabur red, Herbal JM, Pyorea powder, Himalaya herbal complete care, S.V. Namboodiri’s, K.P. Namboodiri, Gopal powder, Close up, Cherriogel, Meswak and Injection powder were collected.Different concentration of (2%, 4%, 6%, 8%, 10% and 12%) tooth pastes and tooth powder samples were diluted in sterile distilled water, shaken and kept as a stock solution. The distilled water employed as the negative control.
The antibacterial activity of the different concentra-tions: 2:100, 4:100, 6:100, 8:100, 10:100 and 12:100 (prepared by mixing 2g, 4g, 6g, 8g, 10g and 12g each of the toothpastes and tooth powders in 100 ml of sterile distilled water respectively) of the various tooth paste and tooth powder brands namely: Pepsodent, Colgate advance, Babool, Vicco, Dabur red, Herbal JM, Pyorea powder, Himalaya herbal complete care, S.V. Nambood-

466 IN VITRO ANTICARIOGENIC ACTIVITY OF COMMERCIALLY EXISTING ANTICAVITY BIOSCIENCE BIOTECHNOLOGY RESEARCH COMMUNICATIONS
Vijayalakshmi, Rajasekar and Mohankumar
FIGURE 3. Dentifrices used in this study
iri’s, K.P. Namboodiri, Gopal powder, Close up, Cher-riogel, Meswak and Injection powder was determined by modifi ed agar well diffusion method as described by Prasanth, (2011). In this method Muller Hinton agar plates were seeded with 0.5ml of 0.5 McFarland stand-ards (approx., 108 cfu/ml) of cariogenic biofi lm produc-ing Lactobacillus acidophilus). The plates were allowed to solidify. A sterile 8mm cork-borer was used to cut one central and fi ve wells at equidistance of the plates. 0.2ml of the tooth paste and tooth powder dilutions was inocu-lated to each of the fi ve wells while the same amount of sterile distilled water was introduced in to the fi rst well as control. The effi cacy of anticariogenic tooth paste and tooth powder extracts against bacteria was compared with the broad spectrum antibiotics ampicillin, tetracy-cline and chloramphenicol (positive control). The same procedure was used for the broad spectrum antibiotics
and the plates were incubated at 37˚C for 24hours. The antimicrobial activity was evaluated by measuring the diameters of zone of inhibition (in mm). An organism was interpreted as highly susceptible if the diameter of inhibition zones was more than 30 mm, intermediate if diameter was 25 to 30 mm and resistant was less than 25 mm.
RESULTS AND DISCUSSION
Amongst 100 clinical decay samples, 100 positive Lac-tobacillus acidophilus were isolated from different age group ranging from 5-17yrs. All the decay samples were tested on Man Rogosa Sharpe agar (MRS) for the isolation of Lactobacillus acidophilus and confi rmed according to Bergy’s manual of Bacteriology. Isolated cariogenic Lactobacillus acidophilus isolates were tested invitro

BIOSCIENCE BIOTECHNOLOGY RESEARCH COMMUNICATIONS IN VITRO ANTICARIOGENIC ACTIVITY OF COMMERCIALLY EXISTING ANTICAVITY 467
Vijayalakshmi, Rajasekar and Mohankumar
to determine anticariogenic activity of tooth paste and tooth powder by well diffusion method. There are dif-ferent concentration (2%, 4%, 6%, 8%, 10% and 12%) of tooth paste and tooth powder were tested namely Pepsodent, Colgate advance, Babool, Vicco, Dabur red, Herbal JM, Pyorea powder, Himalaya herbal complete care, S.V. Namboodiri’s, K.P. Namboodiri, Gopal pow-der, Close up, Cherriogel, Meswak and Injection powder. Totally 12 tooth pastes and 3 tooth powders were used to identify the potential effi cacy of tooth pastes and tooth powders against the selected Lactobacillus acidophilus.
The results of antibacterial activity of different brands of anticavity tooth pastes and tooth powders against cariogenic bacteria are shown in Table 1 - 10. Among three brands, Brand – A Conventional tooth paste for-mulation include Colgate advance, Pepsodent, Close-up and Cherriogel was perceived maximum zone of inhi-bition (40, 47.5, 30 and 37.5 mm respectively) in 10% concentration followed by minimum zone of inhibition was scattered in 2% concentration of tooth paste.
In Brand – B, 7 dentifrices: Vicco, Dabur Red, Babool, Meswak, Himalaya herbal complete care, K.P. Namboodiri and S.V. Namboodiri were showed maxi-mum activity (20mm, 31mm, 30mm, 31.5mm, 27.5mm, 30.5mm and 25 mm) in 10 % concentration of herbal based tooth paste followed by minimum zone of inhibi-tion was dotted in 2% concentration of Vicco, Dabur
Red, Babool, Meswak, Himalaya herbal complete care, K.P. Namboodiri and S.V. Namboodiri was signifi cantly resistant against the tested cariogenic isolates get equally 0 mm zone of inhibition.
The fi ndings from the present study the Brand – C include four diverse tooth powders namely Herbal JM, Injection, Gopal and Pyorea was notably degree of resistant against test pathogen Lactobacillus acidophilus. Awareness of this research was investigated to choice the best tooth paste, were using every day to reduce prolif-eration microorganisms in mouth as well as bad smell of mouth because of presenting microorganism in mouth and were found food between teeth .In the present study, three different brands of tooth pastes designated as A, B and C was tested for antibacterial activity against ten dental pathogens. All type of different tooth paste and tooth powder were found to be effective against 10 cari-ogenic pathogens to varying degree.
Tooth paste brand A (Type – Conventional) was sig-nifi cant in controlling the Lactobacilli infection from low concentration of 2% it exhibit signifi cant degree of resist-ant against test pathogen showing there is no zone of inhibition observed in Strain No. 1 MTLACVG02 (Close up and Cherriogel), Strain No. 4 MTLACVG36 (Cherrio-gel), Strain No. 5 MTLACVG38 (Cherriogel), Strain No.10 MTLACVG100 (Close up) and increased with concentration showing 25 mm zone at 10 % in Strain No. MTLACVG100
FIGURE 3. (Continued)

Vijayalakshmi, Rajasekar and Mohankumar
468 IN VITRO ANTICARIOGENIC ACTIVITY OF COMMERCIALLY EXISTING ANTICAVITY BIOSCIENCE BIOTECHNOLOGY RESEARCH COMMUNICATIONS
Table 1. Antibacterial activity of tooth pastes and tooth powders against cariogenic strain MTLACVG02.
S. No. Test Dentifrices
Zone of inhibition (mm) at different concentration of tooth paste and tooth powder
2% 4% 6% 8% 10% 12%
Babool 0 14 15 17.5 19 15
Vicco 0 10 12.5 14.5 17 0
Dabur 0 15 16 20 22 0
Herbal JM powder 0 0 0 0 0 0
Pyorea powder 0 0 0 0 0 0
Himalaya herbal complete care 0 12 15 15.5 25 0
S.V. Namboodiri’s 0 16 17.5 20 20 0
Pepsodent 19.5 21 23 41.5 47.5 15
K.P. Namboodiri 0 14 15 16.5 25 0
Gopal powder 0 0 0 0 0 0
Close up 0 14 15 18 30 0
Meswak 0 12.5 13 17.5 31.5 13.5
Injection powder 0 0 0 0 0 0
Cherriogel 0 12.5 17 17.5 25 11
Colgate advance 21 22.5 23 24 30 21
Table 2. Antibacterial activity of tooth pastes and tooth powders against cariogenic strain MTLACVG06.
S. No. Test Dentifrices
Zone of inhibition (mm) at different concentration of tooth paste and tooth powder
2% 4% 6% 8% 10% 12%
Babool 15 15 15 16.5 20 15
Vicco 10 11 13 13 15 12
Dabur 14.5 15 15 16 20 14.5
Herbal JM powder 0 0 0 0 0 0
Pyorea powder 0 0 0 0 0 0
Himalaya herbal complete care 12 15 19 20 27.5 11.5
S.V. Namboodiri’s 12 14 15 20 22.5 11.5
Pepsodent 18 21 28.5 30 35 15
K.P. Namboodiri 11 12 13.5 14.5 15.5 14
Gopal powder 0 0 0 0 0 0
Close up 14 15 15.5 19 27.5 11
Meswak 10 10 13 13 21.5 13
Injection powder 0 0 0 0 0 0
Cherriogel 11 13 13 20 25 13
Colgate advance 21 22 26.5 29 36.5 18

Vijayalakshmi, Rajasekar and Mohankumar
BIOSCIENCE BIOTECHNOLOGY RESEARCH COMMUNICATIONS IN VITRO ANTICARIOGENIC ACTIVITY OF COMMERCIALLY EXISTING ANTICAVITY 469
Table 3. Antibacterial activity of tooth pastes and tooth powders against cariogenic strain MTLACVG17.
S. No. Test Dentifrices
Zone of inhibition (mm) at different concentration of tooth paste and tooth powder
2% 4% 6% 8% 10% 12%
Babool 12 13 14.5 15 17.5 12
Vicco 10 12 12.5 15 17.5 12
Dabur 10 12 16 16 30 10.5
Herbal JM powder 0 0 0 0 0 0
Pyorea powder 0 0 0 0 0 0
Himalaya herbal complete care 12 15 15.5 18 18.5 18
S.V. Namboodiri’s 12 14.5 15 18.5 23 8
Pepsodent 15 17.5 25 29.5 31 13.5
K.P. Namboodiri 12 12 12 15 15 10.5
Gopal powder 0 0 0 0 0 0
Close up 13 15 15 16 16 10
Meswak 9 10 14.5 15 17.5 15.5
Injection powder 0 0 0 0 0 0
Cherriogel 13 14.5 15 16.5 20 9
Colgate advance 16.5 20 23.5 24.5 27.5 11.5
Table 4. Antibacterial activity of tooth pastes and tooth powders against cariogenic strain MTLACVG36.
S. No. Test Dentifrices
Zone of inhibition (mm) at different concentration of tooth paste and tooth powder
2% 4% 6% 8% 10% 12%
Babool 0 13 19.5 20 20 0
Vicco 9 10 13 15.5 16 0
Dabur 10 14 17.5 21 30 0
Herbal JM powder 0 0 0 0 0 0
Pyorea powder 0 0 0 0 0 0
Himalaya herbal complete care 0 18 19 19.5 22.5 0
S.V. Namboodiri’s 0 14 16.5 18.5 22.5 0
Pepsodent 17 23.5 25 27.5 30 0
K.P. Namboodiri 11 12.5 14 15.5 16 0
Gopal powder 0 0 0 0 0 0
Close up 15 16.5 17 20 30 0
Meswak 11 12 15 18 20 0
Injection powder 0 0 0 0 0 0
Cherriogel 0 14 15 20 37.5 0
Colgate advance 18 18 27.5 27.5 40 16

Vijayalakshmi, Rajasekar and Mohankumar
470 IN VITRO ANTICARIOGENIC ACTIVITY OF COMMERCIALLY EXISTING ANTICAVITY BIOSCIENCE BIOTECHNOLOGY RESEARCH COMMUNICATIONS
Table 5. Antibacterial activity of tooth pastes and tooth powders against cariogenic strain MTLACVG38.
S. No. Test Dentifrices
Zone of inhibition (mm) at different concentration of tooth paste and tooth powder
2% 4% 6% 8% 10% 12%
Babool 10 15 16.5 19 22 13.5
Vicco 13 13 14 15 18 12
Dabur 13.5 14 15 17 20 15
Herbal JM powder 0 0 0 0 0 0
Pyorea powder 0 0 0 0 0 0
Himalaya herbal complete care 12 15.5 16 20 24 14.5
S.V. Namboodiri’s 0 15 17.5 18 20 12.5
Pepsodent 23 23 33.5 34.5 41.5 14
K.P. Namboodiri 0 11 14 15 25 13
Gopal powder 0 0 0 0 0 0
Close up 14 15.5 19.5 20 22 13.5
Meswak 12 13 13.5 14 17.5 13.5
Injection powder 0 0 0 0 0 0
Cherriogel 0 13.5 16.5 20 22 13.5
Colgate advance 20.5 22.5 25 25 30 18
Table 6. Antibacterial activity of tooth pastes and tooth powders against cariogenic strain MTLACVG75.
S. No. Test Dentifrices
Zone of inhibition (mm) at different concentration of tooth paste and tooth powder
2% 4% 6% 8% 10% 12%
Babool 12.5 14 14 18.5 30 14.5
Vicco 10 13 13 14 15 15
Dabur 13 15 15 19 31 15
Herbal JM powder 0 0 0 0 0 0
Pyorea powder 0 0 0 0 0 0
Himalaya herbal complete care 11 15 15 17.5 22.5 16
S.V. Namboodiri’s 9 14.5 15 17.5 20 14.5
Pepsodent 17.5 20 24 25.5 39 12.5
K.P. Namboodiri 11 13 14 15 15 13
Gopal powder 0 0 0 0 0 0
Close up 13 15 15 19 32.5 11
Meswak 10 12 12.5 15 16 13
Injection powder 0 0 0 0 0 0
Cherriogel 12 14 15 20 20 15
Colgate advance 18 21 25 25.5 30 15

Vijayalakshmi, Rajasekar and Mohankumar
BIOSCIENCE BIOTECHNOLOGY RESEARCH COMMUNICATIONS IN VITRO ANTICARIOGENIC ACTIVITY OF COMMERCIALLY EXISTING ANTICAVITY 471
Table 7. Antibacterial activity of tooth pastes and tooth powders against cariogenic strain MTLACVG85.
S. No. Test Dentifrices
Zone of inhibition (mm) at different concentration of tooth paste and tooth powder
2% 4% 6% 8% 10% 12%
Babool 14.5 17 19 20 25 11
Vicco 8 14 14 15 17 12
Dabur 12 14 15.5 17 19 14.5
Herbal JM powder 0 0 0 0 0 0
Pyorea powder 0 0 0 0 0 0
Himalaya herbal complete care 13 18.5 19 20 22 14.5
S.V. Namboodiri’s 11 15 17 17 17.5 14.5
Pepsodent 20 25.5 26 27.5 30 12
K.P. Namboodiri 12 14 16.5 20 20 12.5
Gopal powder 0 0 0 0 0 0
Close up 13 15 15.5 16.5 17 14.5
Meswak 0 13 13 13.5 17.5 14
Injection powder 0 0 0 0 0 0
Cherriogel 9 14 16.5 20 20 13.5
Colgate advance 17 19.5 25 26.5 27 20
Table 8. Antibacterial activity of tooth pastes and tooth powders against cariogenic strain MTLACVG95.
S. No. Test Dentifrices
Zone of inhibition (mm) at different concentration of tooth paste and tooth powder
2% 4% 6% 8% 10% 12%
Babool 14 15 16 20 24.5 15.5
Vicco 9 10 14 14 13.5 15
Dabur 10 18.5 20 20 20 18
Herbal JM powder 0 0 0 0 0 0
Pyorea powder 0 0 0 0 0 0
Himalaya herbal complete care 13 15 16.5 19 20 0
S.V. Namboodiri’s 15 17.5 18.5 19 25 15.5
Pepsodent 19 20 22.5 27.5 28 14.5
K.P. Namboodiri 10 12.5 15.5 17.5 18 14.5
Gopal powder 0 0 0 0 0 0
Close up 13 14 17 17 20 13.5
Meswak 7 12.5 15 16 17 14.5
Injection powder 0 0 0 0 0 0
Cherriogel 9 14 16.5 20 20 13.5
Colgate advance 17 19.5 25 26.5 27 20

Vijayalakshmi, Rajasekar and Mohankumar
472 IN VITRO ANTICARIOGENIC ACTIVITY OF COMMERCIALLY EXISTING ANTICAVITY BIOSCIENCE BIOTECHNOLOGY RESEARCH COMMUNICATIONS
Table 9. Antibacterial activity of tooth pastes and tooth powders against cariogenic strain MTLACVG97.
S. No. Test Dentifrices
Zone of inhibition (mm) at different concentration of tooth paste and tooth powder
2% 4% 6% 8% 10% 12%
Babool 13 15 17 18 19 14.5
Vicco 7 12.5 15 16 16.5 13.5
Dabur 14 17.5 18.5 20 23 15.5
Herbal JM powder 0 0 0 0 0 0
Pyorea powder 0 0 0 0 0 0
Himalaya herbal complete care 18 19 19.5 20 22 22
S.V. Namboodiri’s 14.5 15 16 16.5 18 13.5
Pepsodent 19 21 22.5 22.5 30.5 13.5
K.P. Namboodiri 19 21 22.5 22.5 30.5 13.5
Gopal powder 0 0 0 0 0 0
Close up 12 15 16.5 18 19 20
Meswak 11 13 15 17.5 17.5 15
Injection powder 0 0 0 0 0 0
Cherriogel 9 14.5 20 20.5 22.5 15
Colgate advance 0 18 25 35 40 16
Table 10. Antibacterial activity of tooth pastes and tooth powders against cariogenic strain MTLACVG100.
S. No. Test Dentifrices
Zone of inhibition (mm) at different concentration of tooth paste and tooth powder
2% 4% 6% 8% 10% 12%
Babool 0 13 14 20 22.5 0
Vicco 0 10 13 13 20 0
Dabur 0 12 15 17.5 24 0
Herbal JM powder 0 0 0 0 0 0
Pyorea powder 0 0 0 0 0 0
Himalaya herbal complete care 15.5 0 15 16.5 17 36.5
S.V. Namboodiri’s 0 15 15 19 25 0
Pepsodent 25 25 25.5 35.5 45 15
K.P. Namboodiri 0 12 15 15 17 0
Gopal powder 0 0 0 0 0 0
Close up 0 15 15.5 20 20 0
Meswak 0 12.5 13 16.5 18 0
Injection powder 0 0 0 0 0 0
Cherriogel 13.5 15 20 20 21 0
Colgate advance 20 24 24 32 15 0

Vijayalakshmi, Rajasekar and Mohankumar
BIOSCIENCE BIOTECHNOLOGY RESEARCH COMMUNICATIONS IN VITRO ANTICARIOGENIC ACTIVITY OF COMMERCIALLY EXISTING ANTICAVITY 473
Table 11. Tooth paste brands used in this study
S. No Brand Type Tooth Paste 1. Brand – A Conventional Colgate advance, Pepsodent germi check, Close up, Cherriogel.
2. Brand – B Herbal Vicco, Dabur Red, Babool, Meswak, Himalaya herbal complete care, K.P. Namboodiri and S.V. Namboodiri.
3. Brand - C Powder Gopal, Herbal JM, Pyorea and Injection
somewhat similar with dissimilar results was obtained in case of Lactobacillus spp., this results are in accordance with the results of (Sohail and Khan, 2013) they stated that some tooth paste shows better antibacterial activity against the fl ora and activity of tooth paste because of active ingredients such as fl uoride.
The results regarding the brand B (Type – Herbal) is Herbal based products and exhibited least effective-ness as compared to other test formulations. The decay pathogen shows maximum zone of inhibition against ten cariogenic Lactobacillus acidophilus it exhibit better results was shown in 8% and 10% concentration rather than the lowest concentration (2%, 4% and 6%). This may be due to the ingredients present, the herbal for-mulation studied appeared to be equally effective as the fl uoride formulations but not superior to them. Almas et al., (2001) reported that the antimicrobial activity of the herbs may be due to the presence of secondary metabo-lites such as alkaloids, fl avonoids, polyphenols and lec-tins. Using natural medicines to cure various diseases so, hence herbal medicine had made signifi cant contribu-tion to modern medical practice.
Formulation brand C (Type – Tooth powder) include some dentifrices are listed in (Table 11). Among 2% - 10% concentration of tooth powders are strongly exhibit sig-nifi cant degree of resistant against ten cariogenic isolates (MTLACVG02, MTLACVG06, MTLACVG17, MTLACVG36, MTLACVG38, MTLACVG75, MTLACVG85, MTLACVG95, MTLACVG97 and MTLACVG100) it shows there is no zone of inhibition observed in all cariogenic isolates. Similarly, Sohail and Khan, (2013) also stated that tooth powder for-mulation is less effective to control the oral microorgan-isms compare than other conventional and herbal tooth paste formulations. The data obtained from the complete investigation it had shown that tooth paste formula-tions having more effective active ingredients to control the oral micro fl ora whereas, herbal based products are equally effective as the other formulations but not supe-rior to them, whereas the tooth powder formulations was 100% less effective in controlling the oral fl ora.
CONCLUSION
The present study demonstrated that the antibacterial prop-erties of fi fteen dentifrices used against the dental pathogen and concluded that conventional tooth paste formulation
(Brand – A) has promising anticariogenic effects compare than other formulations (Brand – B and Brand – C) to some extent to benefi t anti plaque action. Further study is needed to determine the bioactive compounds which are responsible for this anticariogenic activity.
REFERENCES
Almas K, A. Dahlan and Mahmoud A. (2001) Propolis as a natural remedy: An update. Saudi Dental Society. Vol. 13, Issue 1, 45 - 49.
Aneja KR, (2003). Experiments in microbiology plant pathol-ogy and biotechnology. 4nd Ed, New Age International Pub-lishers, New Delhi. 608.
Benson P.E, Douglas C.W and Martin M.V. (2004). Fluori-dated elastomers: Effect on the microbiology of plaque. Am. J. Orthod. Dentofacial Orthop. 126: 325-330.
Bou-Chacra NA, S.S. Gobi, Ohara M.T. and Pinto T.J.A. (2005). Antimicrobial activity of four different dental gel formulas on cariogenic bacteria evaluated using the linear regression method. Revista Brasileira De Ciencias Farmaceuticas. Vol. 41, Issue 3, 323-31.
Fine DH, D. Furgang, K. Markowitz, P.K. Sreenivasan, Klimpel K. and De Vizio W. (2006). The antimicrobial effect of a tri-closan/copolymer dentifrice on oral microorganisms in vivo. J Am Dent Assoc. Vol.137, Issue 10, 1406-13.
Fitzgerald R.J. and Keyes P.H. (1960). Demonstration of the etiological role of streptococci in experimental caries in the hamster. J AM Dent Assoc. Vol. 61, 9 – 19.
Itthagarun A, and Wei SH. (1996). Analysis of fl uoride ion concentrations and in vitro fl uoride uptake from different commercial dentifrices. Int Dent J. Vol. 46, Issue 4, 357-361.
Yadav Khusbu and Satyam Prakash (2017). Dental Caries: A Microbiological Approach. Journal of Clinical Infectious Dis-eases & Practice. J Clin Infect Dis Pract. Vol., 2, 1-15.
Moran J, M. Addy and Newcombe R. (1988). The antibacterial effect of tooth pastes on the salivary fl ora. J Clin Periodontol. Vol. 15, Issue 3, 193-9.
Ozaki F, C.M. Pannuti, A.V. Imbronito, W. Pessotti, Saraiva, L. and de Freitas N M. (2006). Effi cacy of a herbal toothpaste on patients with established gingivitis a randomized controlled trial. Braz Oral Res. Vol. 20, Issue 2, 172-7.
Pannuti C.M, J.P. Mattos, P.N. Ranoya, A.M. Jesus, Lotufo R.F. and Romito G.A. (2003). Clinical effect of a herbal dentifrice on the control of plaque and gingivitis: a double-blind study. Pesqui Odontol Bras. Vol. 17, Issue 4, 314-8.

Vijayalakshmi, Rajasekar and Mohankumar
474 IN VITRO ANTICARIOGENIC ACTIVITY OF COMMERCIALLY EXISTING ANTICAVITY BIOSCIENCE BIOTECHNOLOGY RESEARCH COMMUNICATIONS
Prasanth M, (2011). Endontic bio fi lms their formation and degradation :A review Dent. Res. Vol. 8, Issue 2, 85-93.
Regos J, and Hitz H.R. (1974). Investigations on the mode of action of triclosan, a broad-spectrum antimicrobial agent”. Zentbl. Bakteriol Parasitenkd. Infektkrankh. Hyg. Abt. 1 Orig. Reihe A. Vol. 226, 390-401.
Roberts A, (2005). Bacteria in the mouth. Dent. Update. Vol. 32, 134-136, 139-140, 142.
Sohail S, and J. Khan. (2013). Assessment of antibacterial poten-tial of different tooth pastes and tooth powders against mouth fl ora. Indian Journal of Research. Vol. 2, Issue 9, 180–183.
Tasie, Florita O, Anunike, Irene A. and Nwankwo J. I. (2017). Antimicrobial Effects of Toothpastes on some Oral Organisms of Dental Caries Origin. IDOSR Journal of Experimental Sci-ences. Vol. 2, issue 1, 1-20.
White D.J, K.M. Kozak, R. Gibb, J. Dunavent, Klukowska M. and Sagel P.A. (2006). A 24-hour dental plaque prevention study with a stannous fl uoride dentifrice containing hexamet-aphosphate. J Contemp Dent Pract; 7(3): 1-11.
Vyas YK., Maheep Bhatnagar and Kanika Sharma (2017). In vitro evaluation of antibacterial activity of an herbal dentifrice against Streptococcus mutans and Lactobacillus acidophilus. Indian J Dent Res. Vol. 19. Issue 1, 26-28.

Medical CommunicationBiosci. Biotech. Res. Comm. 10(3): 475-480 (2017)
Comparison of the effects of IPS e.max heat press layered
and feldspathic porcelain on natural enamel tooth wear
Hedaiat Moradpoor1, Marjan Mardanpour2, Farnoush Golmohamadi2 and Sahar Raissi3* 1Assistant Professor, Prosthodontics Department, Faculty of Dentistry Kermanshah University of Medical Sciences, Iran 2Faculty of Dentistry, Kermanshah University of Medical Science, Kermanshah, Iran 3Assistant Professor, Prosthodontics Department, Faculty of Dentistry Kermanshah University of Medical Sciences, Iran
ABSTRACT
In an ideal situation, the tooth wear of a restorative material should be similar to dental enamel. Currently, All-ceramic restorations are widely used; But Enamel wear is among the main disadvantages of ceramic restorations. Thus, in this study compared the Effect of IPS e.max heat press layered and Feldspathic Porcelain on natural enamel Tooth Wear.In this study, 20 samples were prepared from normal human teeth. The natural teeth were photographed by a stereomicroscope in a fi xed position and the distance from the cusp tip to a reference point was measured. Next, 10 teeth opposed IPS e.max heat press layered and the remaining 10 opposed Feldspathic Porcelain in a chewing simulator and subjected to 120,000 masticatory cycles. The teeth were photographed again and the greatest difference between the before and after values was recorded. Finally data were analyzed by Independent samples T-test. The mean extent of wear on the restoration layered IPS e.max heat press and Feldspathic Porcelain were not signifi cant differences ( p-value= 0.118); although the average wear in Feldspathic Porcelain was less than layered IPS e.max heat press. the distance from the cusp tip to a reference point in layered IPS e.max heat Press was signifi cantly difference between before and after intervention (p-value<0.001). Also, the distance from the cusp tip to a reference point in FeldspathicPorcelain was signifi cantly difference between before and after intervention (p-value<0.001). According to the results obtained in vitro study, the mean extent of wear on the resto-ration layered IPS e.max heat press and Feldspathic Porcelain were not signifi cant differences. Also, it is recommended to have a closer look at the factors involved in tooth enamel wear in future studies.
KEY WORDS: FELDSPATHIC PORCELAIN, IPS E.MAX HEAT PRESS LAYERED, ENAMEL TOOTH WEAR
475
ARTICLE INFORMATION:
*Corresponding Author: [email protected] 2nd July, 2017Accepted after revision 29th Sep, 2017 BBRC Print ISSN: 0974-6455Online ISSN: 2321-4007 CODEN: USA BBRCBA
Thomson Reuters ISI ESC and Crossref Indexed Journal NAAS Journal Score 2017: 4.31 Cosmos IF: 4.006
© A Society of Science and Nature Publication, 2017. All rights reserved.Online Contents Available at: http//www.bbrc.in/DOI: 10.21786/bbrc/10.3/21
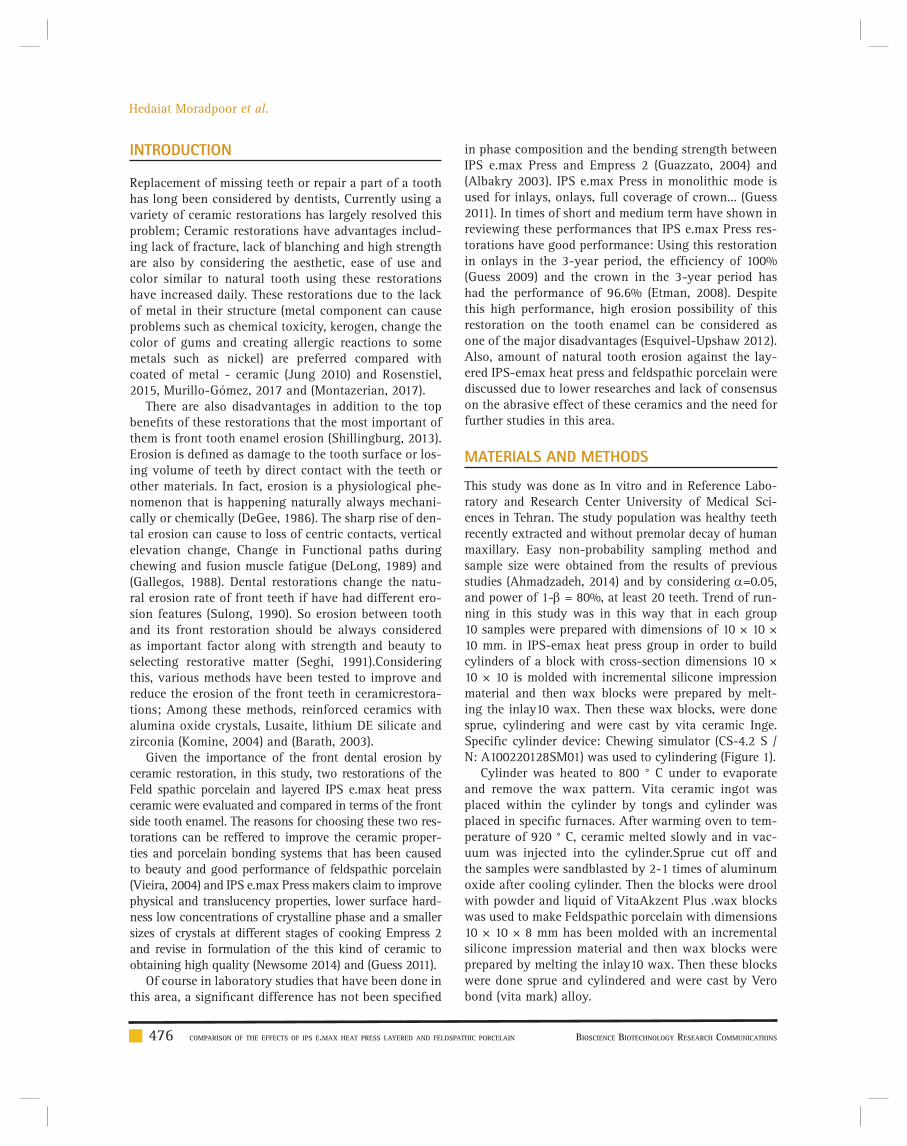
476 COMPARISON OF THE EFFECTS OF IPS E.MAX HEAT PRESS LAYERED AND FELDSPATHIC PORCELAIN BIOSCIENCE BIOTECHNOLOGY RESEARCH COMMUNICATIONS
Hedaiat Moradpoor et al.
INTRODUCTION
Replacement of missing teeth or repair a part of a tooth has long been considered by dentists, Currently using a variety of ceramic restorations has largely resolved this problem; Ceramic restorations have advantages includ-ing lack of fracture, lack of blanching and high strength are also by considering the aesthetic, ease of use and color similar to natural tooth using these restorations have increased daily. These restorations due to the lack of metal in their structure (metal component can cause problems such as chemical toxicity, kerogen, change the color of gums and creating allergic reactions to some metals such as nickel) are preferred compared with coated of metal - ceramic (Jung 2010) and Rosenstiel, 2015, Murillo-Gómez, 2017 and (Montazerian, 2017).
There are also disadvantages in addition to the top benefi ts of these restorations that the most important of them is front tooth enamel erosion (Shillingburg, 2013).Erosion is defi ned as damage to the tooth surface or los-ing volume of teeth by direct contact with the teeth or other materials. In fact, erosion is a physiological phe-nomenon that is happening naturally always mechani-cally or chemically (DeGee, 1986). The sharp rise of den-tal erosion can cause to loss of centric contacts, vertical elevation change, Change in Functional paths during chewing and fusion muscle fatigue (DeLong, 1989) and (Gallegos, 1988). Dental restorations change the natu-ral erosion rate of front teeth if have had different ero-sion features (Sulong, 1990). So erosion between tooth and its front restoration should be always considered as important factor along with strength and beauty to selecting restorative matter (Seghi, 1991).Considering this, various methods have been tested to improve and reduce the erosion of the front teeth in ceramicrestora-tions; Among these methods, reinforced ceramics with alumina oxide crystals, Lusaite, lithium DE silicate and zirconia (Komine, 2004) and (Barath, 2003).
Given the importance of the front dental erosion by ceramic restoration, in this study, two restorations of the Feld spathic porcelain and layered IPS e.max heat press ceramic were evaluated and compared in terms of the front side tooth enamel. The reasons for choosing these two res-torations can be reffered to improve the ceramic proper-ties and porcelain bonding systems that has been caused to beauty and good performance of feldspathic porcelain (Vieira, 2004) and IPS e.max Press makers claim to improve physical and translucency properties, lower surface hard-ness low concentrations of crystalline phase and a smaller sizes of crystals at different stages of cooking Empress 2 and revise in formulation of the this kind of ceramic to obtaining high quality (Newsome 2014) and (Guess 2011).
Of course in laboratory studies that have been done in this area, a signifi cant difference has not been specifi ed
in phase composition and the bending strength between IPS e.max Press and Empress 2 (Guazzato, 2004) and (Albakry 2003). IPS e.max Press in monolithic mode is used for inlays, onlays, full coverage of crown... (Guess 2011). In times of short and medium term have shown in reviewing these performances that IPS e.max Press res-torations have good performance: Using this restoration in onlays in the 3-year period, the effi ciency of 100% (Guess 2009) and the crown in the 3-year period has had the performance of 96.6% (Etman, 2008). Despite this high performance, high erosion possibility of this restoration on the tooth enamel can be considered as one of the major disadvantages (Esquivel-Upshaw 2012).Also, amount of natural tooth erosion against the lay-ered IPS-emax heat press and feldspathic porcelain were discussed due to lower researches and lack of consensus on the abrasive effect of these ceramics and the need for further studies in this area.
MATERIALS AND METHODS
This study was done as In vitro and in Reference Labo-ratory and Research Center University of Medical Sci-ences in Tehran. The study population was healthy teeth recently extracted and without premolar decay of human maxillary. Easy non-probability sampling method and sample size were obtained from the results of previous studies (Ahmadzadeh, 2014) and by considering =0.05, and power of 1- = 80%, at least 20 teeth. Trend of run-ning in this study was in this way that in each group 10 samples were prepared with dimensions of 10 × 10 × 10 mm. in IPS-emax heat press group in order to build cylinders of a block with cross-section dimensions 10 × 10 × 10 is molded with incremental silicone impression material and then wax blocks were prepared by melt-ing the inlay10 wax. Then these wax blocks, were done sprue, cylindering and were cast by vita ceramic Inge. Specifi c cylinder device: Chewing simulator (CS-4.2 S / N: A100220128SM01) was used to cylindering (Figure 1).
Cylinder was heated to 800 ° C under to evaporate and remove the wax pattern. Vita ceramic ingot was placed within the cylinder by tongs and cylinder was placed in specifi c furnaces. After warming oven to tem-perature of 920 ° C, ceramic melted slowly and in vac-uum was injected into the cylinder.Sprue cut off and the samples were sandblasted by 2-1 times of aluminum oxide after cooling cylinder. Then the blocks were drool with powder and liquid of VitaAkzent Plus .wax blocks was used to make Feldspathic porcelain with dimensions 10 × 10 × 8 mm has been molded with an incremental silicone impression material and then wax blocks were prepared by melting the inlay10 wax. Then these blocks were done sprue and cylindered and were cast by Vero bond (vita mark) alloy.

BIOSCIENCE BIOTECHNOLOGY RESEARCH COMMUNICATIONS COMPARISON OF THE EFFECTS OF IPS E.MAX HEAT PRESS LAYERED AND FELDSPATHIC PORCELAIN 477
Hedaiat Moradpoor et al.
Table 1. Mean and standard deviation the amount of wear before and after treatment in two different materials
The vertical height of the buccal cusp tip of the tooth surface before the intervention of the central Tafusay
The vertical height of the buccal cusp tip of the tooth surface after the intervention of the central Tafusayp-valuea
Wear rate
AverageStandard deviation
AverageStandard deviationAverageStandard deviation
layered IPS e.max heat press
2/59900/34821/91410/3506<0/0010/68490/0673
Feldspathic Porcelain
2/25150/47691/66560/4596<0/0010/58590/1731
p-valueb0/0790/1910/118acomparison before and after the intervention (paired t test)bcomparison between the two materials (independent samples t-test)
Porcelaining was done with VMK master (vita mark) porcelain by thickness of 2mm and external dimensions were measured by a gauge after cutting the sprue and sandblasting and grinding alloy with pink and white stone. Premolar healthy natural teeth of 4 human max-illary as well as were selected to the total number of samples and were stored in distilled water until erosion time. all samples were mounted by Survivor in a plas-tic mold in the shape of a half-cylinder in-hardening resin (Ivoclarvivadent) before testing. Then the photos were taken of dental teeth in Razi Metallurgical Research Center (Razi Metallurgical Research Center) by stereomi-croscope (VEGA II TESCAN) in fi xed position and a fi xed place was determined for each sample. Distance from the cusps tip to the desired location was measured by the Motic Image Plus software. Then natural teeth were placed in the front samples of feldspathic porcelain and layered ips-emax heat press in chewing simulator device. The samples were immersed in distilled water at all times of erosion. After the erosion test, the photos were taken of samples by stereomicroscope again in the same previ-ous position and due to mentioned method the meas-urement was done for each cusp again; the difference between the two amounts was recorded and the highest was recorded per micrometer. Data with SPSS software version 18 and by using statistical analysis Independent samples T test were used for statistical analysis. The sig-nifi cant level of 0.05 was considered in this study.
RESULTS AND DISCUSSION
In this study, with the help of Shapiro-Wilk test it was determined that the data are followed from a normal distribution (0.05 <p-value). Means of erosion rate
between the two materials of layered IPS e.max heat press and Feldspathic Porcelain was evaluated by inde-pendent samples t-test and erosion difference between the two restoration was not statistically signifi cant (p-value=0.118) although the mean of erosion rate in Feldspathic Porcelain was less than layered IPS e.max heat press (table 1).
As it is shown in Table 1; paired t-test showed that the difference between the mean difference of the verti-cal height of the tip of the buccal cusps to central fossa in tooth surface in IPS e.max heat press between before and after the intervention (0.001> p-value) and in Feld-spathic Porcelain between before and after the interven-tion (0.001> p-value) was signifi cant.
DISCUSSION
Ceramic materials made with respect to stiffness and strength of them are usually resistant to erosion, but erosion tighter than usual their front teeth is what is made problem in this type of restorations (Heintze, 2008). In the present study, there was no statistically signifi cant difference between the mean of erosion rate in two restorations of layered IPS e.max heat press and Feldspathic Porcelain (0.118 = p-value), although mean of erosion rate in Feldspathic Porcelain somewhat was lower than layered IPS e.max the heat press.
In a study by Tian et al. (2013) that the erosion rate of two groups of Porcelain Ceramics, and layered IPS e.max heat press were studied, the results showed that the erosion rate on in the layered IPS e.max heat press ceramic has been much more than Porcelain (Tian, B.M 2013) which is inconsistent with results of this study. In a study of Esquivel-Upshaw the rate of Front tooth
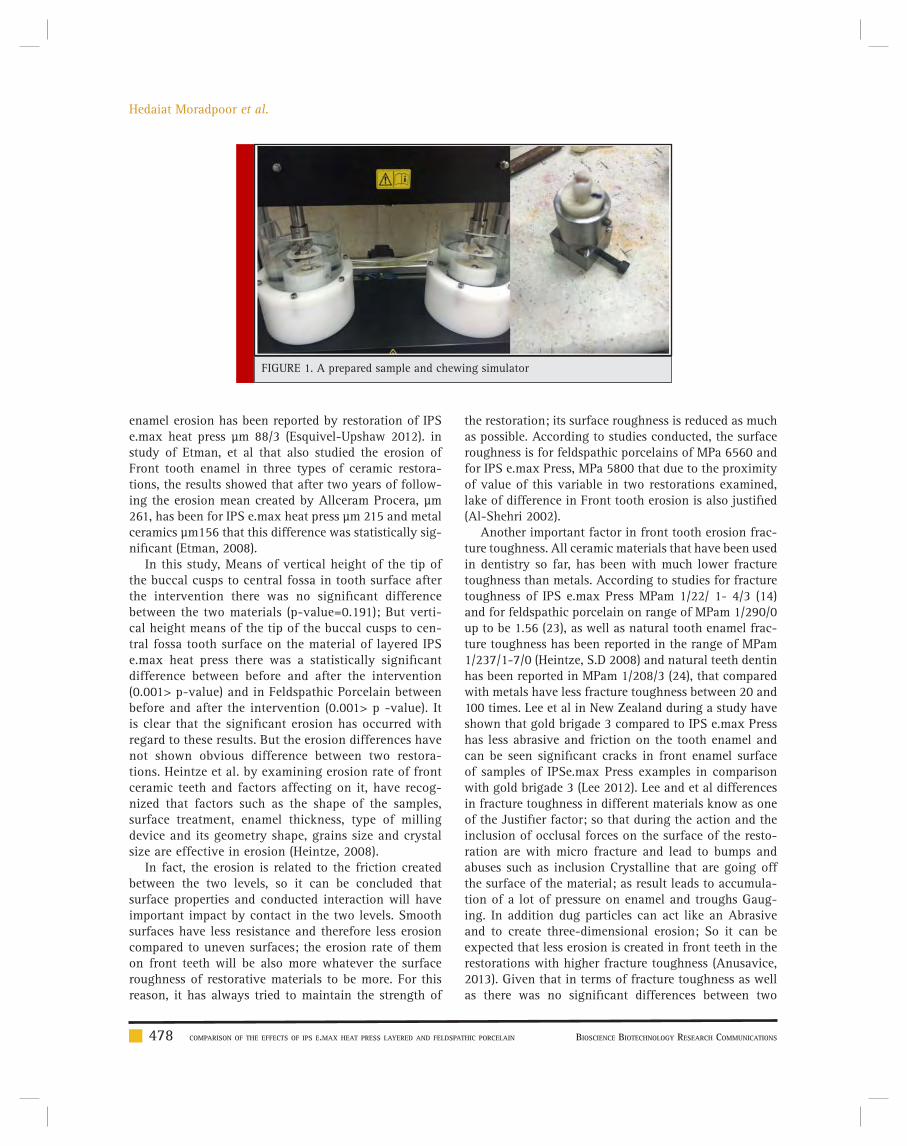
478 COMPARISON OF THE EFFECTS OF IPS E.MAX HEAT PRESS LAYERED AND FELDSPATHIC PORCELAIN BIOSCIENCE BIOTECHNOLOGY RESEARCH COMMUNICATIONS
Hedaiat Moradpoor et al.
enamel erosion has been reported by restoration of IPS e.max heat press μm 88/3 (Esquivel-Upshaw 2012). in study of Etman, et al that also studied the erosion of Front tooth enamel in three types of ceramic restora-tions, the results showed that after two years of follow-ing the erosion mean created by Allceram Procera, μm 261, has been for IPS e.max heat press μm 215 and metal ceramics μm156 that this difference was statistically sig-nifi cant (Etman, 2008).
In this study, Means of vertical height of the tip of the buccal cusps to central fossa in tooth surface after the intervention there was no signifi cant difference between the two materials (p-value=0.191); But verti-cal height means of the tip of the buccal cusps to cen-tral fossa tooth surface on the material of layered IPS e.max heat press there was a statistically signifi cant difference between before and after the intervention (0.001> p-value) and in Feldspathic Porcelain between before and after the intervention (0.001> p -value). It is clear that the signifi cant erosion has occurred with regard to these results. But the erosion differences have not shown obvious difference between two restora-tions. Heintze et al. by examining erosion rate of front ceramic teeth and factors affecting on it, have recog-nized that factors such as the shape of the samples, surface treatment, enamel thickness, type of milling device and its geometry shape, grains size and crystal size are effective in erosion (Heintze, 2008).
In fact, the erosion is related to the friction created between the two levels, so it can be concluded that surface properties and conducted interaction will have important impact by contact in the two levels. Smooth surfaces have less resistance and therefore less erosion compared to uneven surfaces; the erosion rate of them on front teeth will be also more whatever the surface roughness of restorative materials to be more. For this reason, it has always tried to maintain the strength of
the restoration; its surface roughness is reduced as much as possible. According to studies conducted, the surface roughness is for feldspathic porcelains of MPa 6560 and for IPS e.max Press, MPa 5800 that due to the proximity of value of this variable in two restorations examined, lake of difference in Front tooth erosion is also justifi ed (Al-Shehri 2002).
Another important factor in front tooth erosion frac-ture toughness. All ceramic materials that have been used in dentistry so far, has been with much lower fracture toughness than metals. According to studies for fracture toughness of IPS e.max Press MPam 1/22/ 1- 4/3 (14) and for feldspathic porcelain on range of MPam 1/290/0 up to be 1.56 (23), as well as natural tooth enamel frac-ture toughness has been reported in the range of MPam 1/237/1-7/0 (Heintze, S.D 2008) and natural teeth dentin has been reported in MPam 1/208/3 (24), that compared with metals have less fracture toughness between 20 and 100 times. Lee et al in New Zealand during a study have shown that gold brigade 3 compared to IPS e.max Press has less abrasive and friction on the tooth enamel and can be seen signifi cant cracks in front enamel surface of samples of IPSe.max Press examples in comparison with gold brigade 3 (Lee 2012). Lee and et al differences in fracture toughness in different materials know as one of the Justifi er factor; so that during the action and the inclusion of occlusal forces on the surface of the resto-ration are with micro fracture and lead to bumps and abuses such as inclusion Crystalline that are going off the surface of the material; as result leads to accumula-tion of a lot of pressure on enamel and troughs Gaug-ing. In addition dug particles can act like an Abrasive and to create three-dimensional erosion; So it can be expected that less erosion is created in front teeth in the restorations with higher fracture toughness (Anusavice, 2013). Given that in terms of fracture toughness as well as there was no signifi cant differences between two
FIGURE 1. A prepared sample and chewing simulator

BIOSCIENCE BIOTECHNOLOGY RESEARCH COMMUNICATIONS COMPARISON OF THE EFFECTS OF IPS E.MAX HEAT PRESS LAYERED AND FELDSPATHIC PORCELAIN 479
Hedaiat Moradpoor et al.
restorations evaluated in this study, so the same Front tooth erosion is justifi able.
CONCLUSION
According to the results obtained in present experimen-tal study, the means of erosion rate in two restorations of layered IPS e.max heat press and Feldspathic Porce-lain has no statistically signifi cant difference with each other, although mean of erosion rate in the Feldspathic Porcelain has been somewhat lower than layered IPS e.max heat the press; The results showed that the ero-sion on both the restorations after intervention has been signifi cant compared to before intervention; As a result, it can be concluded that these two restorations causes to signifi cant erosion of front tooth enamel, but have no signifi cant difference with each other.
SUGGESTIONS
It is suggested that in future research erosion caused be evaluated by natural tooth enamel and other high appli-cable restorations and also be compared by two restora-tions of layered IPS e.max heat press and Feldspathic Porcelain. It is also possible to design and carry out long-term laboratory studies of this kind, to provide the information necessary to assess the relationship between laboratory and clinical erosion data.
REFERENCES
Ahmadzadeh, A., Ashtiani, A.H., Epakchi, S., Pormehdi, M., Neshati, A., Golmohamadi, F. and Mousavi, N., 2014. Com-parison of the Effect of Feldspathic Porcelain and Zirconia on Natural Tooth Wear. Journal of Islamic Dental Association of IRAN (JIDAI), 26(3), p.3.
Albakry, M., Guazzato, M. and Swain, M.V., 2003. Fracture toughness and hardness evaluation of three pressable all-ceramic dental materials. Journal of dentistry, 31(3), pp.181-188.
Al-Shehri, S., 2002. Relative fracture toughness and hardness of dental ceramics. Saudi Dent J, 14(2), p.67.
Anusavice, K.J., Shen, C. and Rawls, H.R., 2013. Phillips’ sci-ence of dental materials. Elsevier Health Sciences.
Barath, V.S., Faber, F.J., Westland, S. and Niedermeier, W., 2003. Spectrophotometric analysis of all-ceramic materials and their interaction with luting agents and different back-grounds. Advances in Dental Research, 17(1), pp.55-60.
DeGee, A.J., Pallav, P. and Davidson, C.L., 1986. Effect of abra-sion medium on wear of stress-bearing composites and amal-gam in vitro. Journal of Dental Research, 65(5), pp.654-658.
DeLong, R., Sasik, C., Pintado, M.R. and Douglas, W.H., 1989. The wear of enamel when opposed by ceramic systems. Dental Materials, 5(4), pp.266-271.
El Mowafy, O.M. and Watts, D.C., 1986. Fracture toughness of human dentin. Journal of dental research, 65(5), pp.677-681.
Esquivel-Upshaw, J.F., Rose, W.F., Barrett, A.A., Oliveira, E.R., Yang, M.C., Clark, A.E. and Anusavice, K.J., 2012. Three years in vivo wear: core-ceramic, veneers, and enamel antagonists. Dental Materials, 28(6), pp.615-621.
Etman, M.K., Woolford, M. and Dunne, S., 2008. Quantitative measurement of tooth and ceramic wear: in vivo study. Inter-national Journal of Prosthodontics, 21(3).
Gallegos, L.I. and Nicholls, J.I., 1988. In vitro two-body wear of three veneering resins. The Journal of prosthetic dentistry, 60(2), pp.172-178.
Guazzato, M., Proos, K., Quach, L. and Swain, M.V., 2004. Strength, reliability and mode of fracture of bilayered por-celain/zirconia (Y-TZP) dental ceramics. Biomaterials, 25(20), pp.5045-5052.
Guess, P.C., Schultheis, S., Bonfante, E.A., Coelho, P.G., Fer-encz, J.L. and Silva, N.R., 2011. All-ceramic systems: labora-tory and clinical performance. Dental Clinics of North Amer-ica, 55(2), pp.333-352.
Guess, P.C., Strub, J.R., Steinhart, N., Wolkewitz, M. and Stap-pert, C.F., 2009. All-ceramic partial coverage restorations—midterm results of a 5-year prospective clinical splitmouth study. journal of dentistry, 37(8), pp.627-637.
Heintze, S.D., Cavalleri, A., Forjanic, M., Zellweger, G. and Rousson, V., 2008. Wear of ceramic and antagonist—a system-atic evaluation of infl uencing factors in vitro. dental materials, 24(4), pp.433-449.
Jung, Y.S., Lee, J.W., Choi, Y.J., Ahn, J.S., Shin, S.W. and Huh, J.B., 2010. A study on the in-vitro wear of the natural tooth structure by opposing zirconia or dental porcelain. The journal of advanced prosthodontics, 2(3), pp.111-115.
Komine, F., Tomic, M., Gerds, T. and Strub, J.R., 2004. Infl uence of different adhesive resin cements on the fracture strength of aluminum oxide ceramic posterior crowns. The Journal of prosthetic dentistry, 92(4), pp.359-364.
Lee, A., 2012. Wear behaviour of human enamel opposing lithium disilicate glass ceramic and type III gold (Doctoral dis-sertation, University of Otago).
Montazerian, M. and Zanotto, E.D., 2017. Restorative Dental Glass-Ceramics: Current Status and Trends. In Clinical Appli-cations of Biomaterials (pp. 313-336). Springer International Publishing.
Morena, R., Lockwood, P.E. and Fairhurst, C.W., 1986. Fracture toughness of commercial dental porcelains. Dental Materials, 2(2), pp.58-62.
Murillo-Gómez, F., Rueggeberg, F.A. and De Goes, M.F., 2017. Short-and Long-Term Bond Strength Between Resin Cement and Glass-Ceramic Using a Silane-Containing Universal Adhe-sive. Operative Dentistry.
Newsome, P., 2014. Use of ceramic materials in the restoration of posterior teeth. Primary dental journal, 3(2), p.42.
Rosenstiel, S.F., Land, M.F. and Fujimoto, J., 2015. Contem-porary Fixed Prosthodontics-E-Book. Elsevier Health Sciences.

Hedaiat Moradpoor et al.
480 COMPARISON OF THE EFFECTS OF IPS E.MAX HEAT PRESS LAYERED AND FELDSPATHIC PORCELAIN BIOSCIENCE BIOTECHNOLOGY RESEARCH COMMUNICATIONS
Seghi, R.R., Rosenstiel, S.F. and Bauer, P., 1991. Abrasion of human enamel by different dental ceramics in vitro. Journal of dental research, 70(3), pp.221-225.
Shillingburg, H.T., Sather, D.A., Wilson, E.L., Cain, J.R., Mitch-ell, D.L., Blanco, L.J. and Kessler, J.C., 2013. Fundamentals of fi xed prosthodontics. Acta stomatol Croat, 47(2), p.177.
Sulong, M.Z.A.M. and Aziz, R.A., 1990. Wear of materials used in dentistry: a review of the literature. The Journal of pros-thetic dentistry, 63(3), pp.342-349.
Tian, B.M., Zhang, S.F., He, L., Guo, J.W., Yu, J.T. and Wu, X.H., 2013. An experimental study of the wear behavior of dental feldspathic glass-ceramic and lithium disilicate glass-ceramic. Zhonghua kou qiang yi xue za zhi= Zhonghua kouqiang yixue zazhi= Chinese journal of stomatology, 48(11), pp.683-688.
Vieira, L.C.C., Araújo, É. and Monteiro Júnior, S., 2004. Effect of different ceramic surface treatments on resin microtensile bond strength. Journal of Prosthodontics, 13(1), pp.28-35.

Biotechnological CommunicationBiosci. Biotech. Res. Comm. 10(3): 481-489 (2017)
Ameliorative effect of salicylic acid in salinity
stressed Pisum sativum by improving growth
parameters, activating photosynthesis and
enhancing antioxidant defense system
Farhan Ahmad1, Ananya Singh2 and Aisha Kamal1*1Department of Bioengineering, Integral University, Lucknow, India2Department of Biosciences, Integral University, Lucknow-226026, India
ABSTRACT
Salt stress unfavorably disturbs the physiological processes and morphological organization of plants that limit plant growth and development. Salicylic acid (SA) is an important signal molecule, also acts as growth regulator that alleviates the hostile impact of salinity on plants. Pisum sativum L. (Fabaceae) is a salt-sensitive plant. This study was conducted to to explore the regulating mechanism of exogenous SA on the germination,growth, relative water content, chlorophyll content, ROS concentrations, and antioxidant activities of Pisum sativum sample under 50, 100 and 150 mM NaCl conditions. Pisum sativum showed reduced growth rate, dry weight, decreased photosynthetic Pigments, alteration in nutritional contents under 50 and 100 mM NaCl level of salinity. Severity of adverse effect was maximum at 150 mM of NaCl. However, presoaking application of SA effi ciently retains the growth parameters, photosynthetic effi ciency, and improved antioxidant defense system. However, at higher salinity levels i.e. at 150 mM NaCl saline condition, there was no noteworthy variance in the mitigation in terms of growth and other physiological responses were observed. We demonstrate that application of SA can meritoriously neutralize the adverse effect of moderate saline conditions on growth and development of Pisum sativum.
KEY WORDS: SALICYLIC ACID, SALT STRESS, ROS, ANTIOXIDANTS, PHOTOSYNTHESIS
481
ARTICLE INFORMATION:
*Corresponding Author: [email protected] 27th Nov, 2017Accepted after revision 26th Sep, 2017 BBRC Print ISSN: 0974-6455Online ISSN: 2321-4007 CODEN: USA BBRCBA
Thomson Reuters ISI ESC and Crossref Indexed Journal NAAS Journal Score 2017: 4.31 Cosmos IF: 4.006
© A Society of Science and Nature Publication, 2017. All rights reserved.Online Contents Available at: http//www.bbrc.in/DOI: 10.21786/bbrc/10.3/22

Farhan, Ananya and Aisha
INTRODUCTION
Being sessile in nature and increased anthropogenic activities in the advanced era, plant exposed to innu-merable abiotic stresses, such as heat cold stress, salin-ity, heavy metals, ultraviolet radiation, nutrient changes (Khan and Khan, 2013). Under natural conditions, salin-ity has a multiple effect on plant growth by reducing water absorption, creating ion imbalance or turbulence that leads to plant toxicity (Roussos et al., 2007). This negatively affects growth parameter viz germination effi ciency, leaf area, length and root and shoot dry weight, protein synthesis, photosynthesis and chloro-phyll, lipid breakdown, reactive oxygen species forma-tion (Munns, 2005; Parida and Das, 2005). Over-produc-tion of ROS caused and declining photosynthesis (Gunes et.al., 2007; Steduto et al 2000). To readdress the loss due to ROS generation, plants have an effective defense sys-tem composed of both, enzymatic (SOD, CAT, POD) and non-enzymatic (Proline, Phenol contents, carotenoids, and tocopherol) and antioxidants systems. However, plants showed different response to salinity according to the plant tolerance capability and developmental stage. The treatment with 150 mM NaCl level of salin-ity enhanced about 72% of POD activity in salt-toler-ant cotton (Gossett et al.,1994). Thus, it is important to enhance the salinity resistance of plants and endeavor different compound to reduce plant stress.
SA is a phenolic growth regulator that assumes con-spicuous and expanded role in biochemical and physi-ological reaction to abiotic stress (Hayat et al. 2012).It has been also revealed that exogenously applications of SA can signifi cantly enhanced overall growth of plant under both salinity and non-salinity by adjusting anti-oxidants scavenging system (Ismail 2013). Furthermore, SA also reduced the destructive effects of several abiotic stresses by regulating proline concentration and other osmolytes production (Pirasteh- Anosheh et al. 2014; Chandrakar et al. 2016 Ma et.al, 2017).
However, confi rmation regarding the lessening of salinity stress by exogenous SA is slightly questioned. Arfan et al. (2007) and Li et al. (2014), recounted that spraying SA could balance direct salt stress actuated development restraint, while no change happened at high convergences of salt stress. Therefore, the action of SA to suppress salt stress on concentration and plant species needto be further clarifi ed. Pea (Pisum sativum L.) second important leguminous crop belongs to family Fabaceae, grown throughout the world in winter to early summer, used both in human nutrition and as fodder. The nutritional value of pea plant cannot be neglected as it is an important source of major biomolecules protein, carbohydrate (Hussein et al; 2006), water-soluble fi b-ers, vitamins (vitamin B1), antioxidants (Mukerji 2004)
calcium, phosphorus, fi bers, minerals and lutein with a small quantity of iron. It also contains isofl avones which reduced the risk of cancer. It can be grown on a different soil texture but unfavorably infl uenced by different abi-otic burdens, for example, soil corrosiveness, aluminum toxicity and salinity stress. Field pea is extremely sensi-tive to salinity stress. Regrettably, insuffi cient studies are available on the growth and development of P. sativum under salinity stress. Additionally, the defensive role of phytohormones especially role of SA in ameliorating the detrimental effect of salt stress on P. sativum to increase its salt tolerance is mystical.
The aim of present study was to elucidate the allevi-ating effect of SA in P. sativum plants under different concentration of salt treatment by studying various mor-phological, physiological and biochemical parameters such as biomass yield, total protein and sugar, relative water and proline content. The analysis of antioxidant activities were also done to analyzed ROS generation.
MATERIALS AND METHODS
PLANT MATERIALS AND GROWTH CONDITIONS
The P. sativum L. (var. AP3) seeds were acquired from the local seed distributor. Viable and uninfected seeds were picked and washed at fi rst with 0.1% (v/v) sodium hypochlorite solution for 2– 5 min following thorough washing with Double Distilled water (DDW). Sterilized seeds were pre-soaked in different treatments of salin-ity sand salicylic acid for overnight as follows: T0 (dis-tilled water); T1 (1 mM SA solution); T2 (50 mM NaCl solution); T3 (50 mM NaCl with 1 mM SA); T4 (100mM NaCl solution); T5 (100 mM NaCl with 1 mM SA); T6 (150 mM NaCl solution); and T7 (150 mM NaCl with 1 mM SA). Healthy seeds were then placed for germina-tion in petriplates (15cm) having two layers of wet fi lter paper presoaked with DDW and kept in culture rooms at a light intensity of 100 μmol m-2s-1 and a 14/10 h (day/night) photoperiod for generation of complete plantlet. Irrigation was done twice in a week for different treat-ment plants with corresponding solution to keep the fi eld capacity at 70–75%. The experimental condition was maintained through-out the study period. Analyses were carried out after 3 days, when obvious external dif-ferences were observed between the plants subjected to different treatments.
ANALYSIS OF GROWTH AND BIOMASS
After the completion of experiment (30 days), one intact plantlet (roots, shoot, leaf) were indiscriminately selected from each treatments. The plantlet height, fresh and dry weight of roots and stems was obtained by elec-
482 AMELIORATIVE EFFECT OF SALICYLIC ACID ON SALINITY STRESSED PISUM SATIVUM BIOSCIENCE BIOTECHNOLOGY RESEARCH COMMUNICATIONS

BIOSCIENCE BIOTECHNOLOGY RESEARCH COMMUNICATIONS AMELIORATIVE EFFECT OF SALICYLIC ACID ON SALINITY STRESSED PISUM SATIVUM 483
Farhan, Ananya and Aisha
tronic scales. Total germination percent was calculated by using equation:
(TG) = (total number of germinated seeds/total seed) × 100.
RELATIVE WATER CONTENT
A 0.5 g of freshplant sample was weighed (fresh weight, WF) in the wake of rehydrating for 24 h oblivious (soaked saturated weight, WS) and after broiler drying at 85°C for 24 h to a steady weight (WD). The RWC was computed utilizing the equation:
RWC(%)=[(WF-WD)/(WS-WD)]
TOTAL FREE PROLINE CONTENT
Proline analysis was done by techniques portrayed by Bates et al (1973) with a few adjustments. The absorb-ance was measured at 520 nm utilizing toluene as a blank. The proline concentration was estimated utilizing proline standards (0-50 mg/mL).
Determinations of photosynthetic pigments (total
chlorophyll and total caretenoids)
The determination of chlorophyll pigments was done by Arnon (1949) method with some modifi cation. Absorb-ance were taken by uv-visible spectrophotometer at 645 nm for chlorophyll’a’and 663 nm for chlorophyll ‘b’ using 80% acetic acid as a blank. Calculation was done by using the following equations:
Chlorophyll a: 12.7(A663) – 2.69(A645)Chlorophyll b: 22.9(A645) – 4.68(A663)
The Carotenoid estimation was done by Kirk and Allen, 1965 by using equations
Carotenoids = A480 + (0.114 × A663) – (0.638 × A 645)
TOTAL PROTEIN CONTENT
Total protein content was estimated in each sample through the method of Lowry et al, (1951). The proteins were quantifi ed using the supernatants of samples with BSA as a standard.
Assessments of Antioxidant Activity
For enzyme extract, 0.3 g of plant sample was crushed in a chilled mortar with 8 mL of 50 mM phosphate buffer solution (pH 7.8) containing 1% polyethylene pyrrole (PVP) at 4°C. The homogenate was centrifuged at 10,000 rpm for 15 min at 4°C. Supernatant were used to quantify the activity. SOD activity was evaluated by monitoring its capability to obstruct the photochemical reduction of nitrobluetetrazolium salt (Giannopotitis and Ries, 1977). CAT activity was measured by degrading of H2O2 (Aebi
(1984). The POD activity was estimated using guaiacol as standard (Klapheck et al., 1990).
DATA ANALYSIS
Data were tested using analysis of variance (ANOVA) with Graphpad Prism version 5, and graph was plot-ted on MS tools version (10) Duncan’s multiple range tests was used to detect differences between means. The P-value was set at 0.05 and 0.01 for the ANOVA and Duncan’s multiple range tests, respectively.
RESULTS AND DISCUSSION
Salinity treatments signifi cantly decreased plant growth in terms of germination and plant height of Pisum-sativum. On comparison with the non-salt-treated P. sativum (T0), the salt treatment 50, 100,150 mM NaCl signifi cantly reduced the germination percentage and plant height by 16.09, 39.08 49.4% and 42.85%, 58.92% 60.71% respectively (Fig-2A). The SA treatment abridged the decrease in the germination and plant height of the salt-stressed sample. It was observed that salt treatment signifi cantly decreased the germination percentage and plant height in dose dependent manner. Moreover when compared with SA treated plants, signifi cant increase 9.58% and 26.4% in germination percentage and 53.3%, 34.2% in plant height under 50, 100 mM NaCl treat-ment were reported. In plant sample treated with salt concentration 150 mM (T6), plant height signifi cantly decreased by 22.3% (P<0.05). However, there was no substantial difference in treatment with and without SA under 150 mM NaCl (P<0.05, Fig-2B)
Salinity also showed pronounced reduction in the dry mass of the shoots and roots. Compared with non-salt treated P. sativum seedlings (T1), the 50, 100,150 mMNaCl salt treatment reduced the dry weight by19.04%, 38.09%, 61.09% in shoot and 26.6%, 40.1% and 66.6% in root (Table-1). The SA mitigated the adverse effect of salinity by improving growth of stressed plant.SA treat-ment signifi cantly increased the dry mass of the shoots, roots, and (shoot+roots) by 15.3%,22.3% and 37.5%, under 100 mM NaCl conditions, and 37.5%, 60% and 45% under 150 mM NaCl conditions (P<0.05). There were no noticeable changes observed in the dry mass of shoots and dry mass of roots between SA treatedand non-treated plants under 0 mM NaCl (T0) and (T1) con-dition i.e. in unstressed samples.
The RWC is an important parameter in estimating the physiological status of plants. When compared to con-trol (T0), the RWC decreased by 27.2% and 40% under 100 mM (T4) and 150 mM (T6) saline conditions respec-tively with a signifi cant level (P<0.05). SA treated plant showed reduced salinity effect on the RWC reduction in

Farhan, Ananya and Aisha
FIGURE 1. Effect of SA on seed germination of Pisumsativum under salinity stress.
FIGURE 2. Effects of SA on the germination percentage (A) and plant height (B) in Pisum sativum under salt stress (means ± SD). Different letters indicate signifi cant differences (P < 0.05); the same letter indicates no signifi cant differences between the treatments, n = 3.
the 0 mM and 50 mM NaCl saline condition; however, signifi cance level was found (P>0.05). Under, 100 mM NaCl level of salinity,a signifi cant improvement in RWC was recorded in plants treated with SA (P<0.05, Fig-3A). Salinity drastically prompted the deposition of free proline content in stressed plants. SA treatment signifi -cantly improved the proline content at all salinity levels (0, 50, 100 and 150 mM NaCl) by 4.8%, 24.4%, 12.7% and 11.7% respectively (P<0.05, Fig-3B).
Salt stress causeda decline in the photosynthetic pig-ments such as chlorophyll a, b, total chlorophyll and
carotenoid contents on compared with control. The chl’a’ content reduced by 36.3% under the 50 mM NaCl salin-ity level 54.5% under the 100 mM salt condition, and 72.7% under the 150 mM saline condition. Whereas SA ameliorated detrimental effect by reducing the decrease in chl’a’ content by 18.1%, 36.3% and 63.6% under 50, 100, 150 mM NaCl salinity respectively, when compared to non-SA treated plant (P<0.05). More drastic reduction in chl’b’ were found as salt concentration increased from 50, 100, 150 mM by 23.4%, 61.7%, 76.5% respectively (P<0.05). Under salt stress conditions, the SA treatment
484 AMELIORATIVE EFFECT OF SALICYLIC ACID ON SALINITY STRESSED PISUM SATIVUM BIOSCIENCE BIOTECHNOLOGY RESEARCH COMMUNICATIONS

BIOSCIENCE BIOTECHNOLOGY RESEARCH COMMUNICATIONS AMELIORATIVE EFFECT OF SALICYLIC ACID ON SALINITY STRESSED PISUM SATIVUM 485
Farhan, Ananya and Aisha
Table 1. Effects of SA on the dry matter of the shoots, roots, and roots + shoots in P sativum grown under salt stress (means ± SD). Different letters indicate signifi cant differences (P < 0.05), the same letter indicates no signifi cant differences between the treatments, n = 3.
Treatment Shoot(g) Root(g) Shoot+ Root(g)
T0 2.1 ± 1.15a 1.5 ± 0.68a 3.6 ± 0.49a
T1 2.3 ± 0.93a 1.6 ± 0.39a 3.9 ± 0.98a
T2 1.7 ± 1.17b 1.1 ± 0.37b 2.8 ± 1.52bc
T3 1.9 ± 1.3ab 1.3 ± .074ab 3.2 ± 1.62ab
T4 1.3 ± 0.92c 0.9 ± 0.56c 2.2 ± 1.47d
T5 1.5 ± 1.34b 1.1 ± 0.45b 2.6 ± 1.10d
T6 0.8 ± 0.74c 0.5 ± 0.61c 1.3 ± 0.92b
T7 1.1± 0.89a 0.8 ± 0.56b 1.9 ± 0.76c
FIGURE 3. Effects of SA on the RWC (A) and Proline Content (B) in Pisum sativum under salt stress (means ± SD). Different letters indi-cate signifi cant differences (P < 0.05); the same letter indicates no signifi cant differences between the treatments, n = 3.
resumed the decrease in the chl’b’ content by approxi-mately 12.3% under the 50 mMNa Clcondition, 49.3% under 10 mM NaCl, and by 70.3% under the 150 mM NaClcondition. Similar responses were also observed in carotenoid and total chlorophyll content. Reduction percentage of carotenoid and total chlorophyll content under 100 mM and 150 mM was recorded by 66.6, 50.1% and 75.5, 72.2% respectively when compared to control (T0). From the above results, it could be concluded that SA signifi cantly improved the photosynthetic effi ciency by improving the pigment contents under different level of salinity (Table-2).
TOTAL PROTEIN AND SUGAR CONTENT
The protein content in P. sativum signifi cantly (P<0.05) reduced in response to saline stress compared

486 AMELIORATIVE EFFECT OF SALICYLIC ACID ON SALINITY STRESSED PISUM SATIVUM BIOSCIENCE BIOTECHNOLOGY RESEARCH COMMUNICATIONS
Farhan, Ananya and Aisha
FIGURE 4. Effects of SA on the superoxide dismutase (A), peroxidase (B) and catalase (CAT) (C) in Pisum sativum under salt stress (means ± SD). Different letters indicate signifi cant differences (P < 0.05); the same letter indicates no signifi cant differences between the treat-ments, n = 3.
Table 2. Effects of SA on photosynthetic pigments in P sativum grown under salt stress (means ± SD). Different letters indicate signifi cant differences (P < 0.05), the same letter indicates no signifi cant differences between the treatments, n = 3.
Treatment Chl a Content(mg/g)
Chl b Content(mg/g)
Car Content(mg/g)
Total Content (mg/g)
T0 1.1 ±0.74b 0.81 ±0.41a 4.2 ±0.14b 1.8 ±0.035b
T1 1.6 ±0.62a 0.85 ±0.25a 5.9 ± 0.11a 2.4 ±0.014a
T2 0.7 ±0.32c 0.62 ±0.19c 3.5 ± 0.05c 1.2 ±0.002c
T3 0.9 ±0.64bc 0.71 ±0.23bc 3.9 ± 0.15bc 1.4 ±0.004bc
T4 0.5 ±0.15de 0.31 ±0.09d 1.5 ± 0.25d 0.9 ±0.006d
T5 0.7 ±0.23d 0.41 ±0.05d 2.2 ± 0.19d 0.7 ±0.009d
T6 0.3 ±0.63e 0.19 ±0.09d 1.1 ± 0.48d 0.5 ± 0.001d
T7 0.4 ±0.59de 0.24 ±0.08d 1.4 ± 0.25d 0.6 ±0.002d
to their controls (T1). The content of protein decreased by 29.1% under 50 Mm NaCl, 56.4% under 100 mM NaCland 74.8% under 150 mM level of salinity. The presoaking treatment of SA signifi cantly improved the protein content by 12.59%, 48.1% and 66.9% with
in 50, 100 and 150mM salinity levels respectively (P<0.05, Table-3). Interestingly, sugar content showed dramatic increase by 58.1%, 130.2% and 312.2% on increasing salinity level from 50, 100 and 150 mM NaCl. Here also SA signifi cantly improved the sugar

BIOSCIENCE BIOTECHNOLOGY RESEARCH COMMUNICATIONS AMELIORATIVE EFFECT OF SALICYLIC ACID ON SALINITY STRESSED PISUM SATIVUM 487
Farhan, Ananya and Aisha
content (P<0.05). But, no signifi cant differences were observed between treated and non-treated plants in non-saline condition.
Quantifi cation of Antioxidant enzymes SOD, CAT, POD
activity
The antioxidant activities SOD, CAT, POD in the P. sati-vum were pointedly affected by salt and SA treatment (Fig-4). SOD increased by 36.3% 50.3% and 48.3% under the 50, 100mM and 150 mM NaCl conditions, respectively (Fig-4A). Though, CAT increased by 34.2% and 63.4% under the 100 mM and 150 mM NaCl conditions, respec-tively, but no signifi cant difference was found between the non-salt condition (T1) and the 50 mM NaCl condition (T3). Further SA found to mitigate the adverse effect of salinity by signifi cantly enhancing the antioxidant activi-ties. SOD and CAT activity increased by 25.7%, 42.6% and 64.4%, 48.8% under respective 100 and 150 mM NaCl salinity when compared to non SA treated plant (P<0.05, Fig-4A and 4B). Similarly POD activity was also increased by 18.4% under 100 mM NaCl and 38.1% under 150 mM NaCl saline condition (Fig-4C). However, no signifi cant variation were observed in the (SOD, POD, and CAT activ-ity between the SA and non SA treated samples in control conditions (T1) (P>0.05).
Salt stress confi nes plant development and morphol-ogy by unfavorably affecting different parts of physiol-ogy and natural chemistry, for example, photosynthe-sis, superoxide ion homeostasis, antioxidant enzymes, osmolyte aggregation, and proline metabolism regulation (Misra and Saxena, 2009; Roussos et al., 2013). The pre-sent investigation clearly indicated that Pisumsativum is highly salt sensitive plant and presoaking treatment of SA mitigated the deleterious effect of salinity by improv-ing various morphological, physiological and biochemical parameters such as increasing germination percentage,
plantlet height, fresh and dry weight, activation of anti-oxidant activity and also photosynthetic process.
P. sativum under low salt stress (50 mM NaCl) exhib-ited no ostensible inadaptability due to the saline condi-tions. Additionally, to a certain degree, the exogenous SA responded the salt stress-prompted growth inhibition of P. sativum under 100 mM salinity; however no enhance-ment occurred under 150mM salinity. In current study, salt stress markedly reduced the drybiomass after treat-ment with 100 and 150mm NaCl subsequently 30 days of treatment (Table-1). The degree of severity in root was more as associated to shoot because root is the fi rst organ that faces the salinity stress. Besides, expanding indi-cation suggests that SA treatment fundamentally eases the harmful impacts of saltiness on plant development (Shakirova et al., 2003). Iqbal et al. (2006) demonstrated that SA enhanced the inimical impacts of salt stress on the development of wheat cultivars.It has likewise been accounted for that SA-treated maize plants had higher dried mass contrasted untreated plants that were addi-tionally developed under salt stress (Gunes et al., 2007). The variety in assignment of biomass to various organs might be vital to the accomplishment of a seedling to adjusting to another condition (Tang et al., 2015).
In the present investigation, increased RWC and accumulation of free proline in P. sativum seedlings fol-lowing 30 days of salt worry under SA treatment may be a versatile element in enhancing its succulence and keeping up the water adjust because of salinity actuated osmotic stress (Fig. 2A). These results are partially simi-lar to the other study conducted on plant showed that proline accumulation regulate osmotic balance at the cellular level, retain membrane integrity and therefore, combat the injurypersuaded by salt (Misra and Saxena 2009; Ma et.al, 2017),.
The diminishment of leaf chlorophyll under high salti-ness has been credited to the pulverization of pigments and the unsteadiness of the pigment protein complex (Jaleel et. al., 2009). The expansion of SA to NaCl-focused on plants particularly enhanced the photosynthetic con-tent, proposing that the upsurge in chlorophyllpigments on treatment withSA may be due to capability of SA to improve the movement of specifi c proteins, consequently animating chlorophyll biosynthesis or decreasing chlo-rophyll debasement, prompting expanded overall photo-synthesis process in salt stress resistance.
The decrease in chlorophyll because of osmotic stress attributed to the major harm to chloroplast lay-ers, which builds the membrane penetrability or loss of membrane uprightness (Tang et. al 2015). Studies have demonstrated that the serious harm caused by saltiness stretch is in part because of the era of responsive oxygen species (ROS, for example, hydrogen peroxide (Asada, 2006). The upsurge in ROS was slowed down in plants
Table 3. Effects of SA on the Total protein and sugar content in P sativum grown under salt stress (means ± SD). Different letters indicate signifi cant differences (P < 0.05), the same letter indicates no signifi cant differences between the treatments, n = 3.
Treatment Protein Content(μg g-1 FW)
Sugar Content(mg g-1 FW)
T0 67.56 ± 1.23b 39.13 ± 1.05h
T1 70.21 ± 1.06a 47.02 ± 0.45g
T2 47.80 ± 0.56c 62.14 ±1.41f
T3 59.01 ± 0.41bc 76.08 ± 0.89e
T4 29.40 ± 0.71d 90.21 ±0.77d
T5 35.60 ± 0.87cd 120.09±1.23c
T6 17.43 ± 1.65e 161.41±0.89b
T7 22.30 ± 1.67f 185.25±0.98a

488 AMELIORATIVE EFFECT OF SALICYLIC ACID ON SALINITY STRESSED PISUM SATIVUM BIOSCIENCE BIOTECHNOLOGY RESEARCH COMMUNICATIONS
Farhan, Ananya and Aisha
when presoaked with SA, proposing that SA possibly protect cells and sub-cellular systems from ROS cyto-toxicity. In fact, plants can protect their tissues from the toxic effects of salt-accumulated ROS by using enzymes such as superoxide dismutase (SOD), catalase (CAT) and peroxidase (POD) (Verhagen et al., 2004). SA found to persuade the activities of antioxidant enzymes in the P sativum under the salinity condition (Fig-3). Otherstudy alsostrongly support that the SA enhanced antioxidants-activity, which protect the plants from oxidative damage (e.g., Hayat et al., 2008). In recent times, studies have showed that SA also helps incontrolling antioxidant enzyme activities to withstand salinity-induced injury (Horvath et al., 2007; Harfouche et al., 2008).
CONCLUSION
From the results obtained in the present study, it could be concluded that P. sativum is a salt-sensitive leguminous crop and severely affected by salt stress that’s lead to the accumulation of ROS, debasement of photosynthetic pig-ments which resulted in reduced photosynthesis,growth inhibition and reduced biomass production.. However, SA curtailed the lethal effect of salt on the growth and adaptation of plant to saline environment, which was accredited to high activity of the antioxidant enzymes. However further extensive research required to elucidate the mitigating mechanism of SA in stressed plants.
ACKNOWLEDGEMENTS
The authors are grateful to the founder Vice Chancel-lor Dr. SW. Akhtar, Integral University, for providing all facilities required for study. The authors are also indebted to the Publication Cell, Integral University, Lucknow, for quick and crisp revision of manuscript, needful sugges-tion and for allotting manuscript number IU/R&D/2017-MCN000157.
REFERENCES
Aebi, H. (1984) Catalase in vitro. Methods in enzymology, 105, 121-126.
Anosheh, H. P., Ranjbar, G., Emam, Y., & Ashraf, M. (2014). Salicylic-acid-induced recovery ability in salt-stressed Hor-deum vulgare plants. Turkish Journal of Botany, 38(1), 112-121.
Arfan, M., Athar, H. R., & Ashraf, M. (2007). Does exogenous application of salicylic acid through the rooting medium mod-ulate growth and photosynthetic capacity in two differently adapted spring wheat cultivars under salt stress? Journal of Plant Physiology, 164(6), 685-694.
Arnon, D. I. (1949). Copper enzymes in isolated chloroplasts. Polyphenoloxidase in Beta vulgaris. Plant physiology, 24(1), 1.
Asada, K. (2006). Production and scavenging of reactive oxy-gen species in chloroplasts and their functions. Plant physiol-ogy, 141(2), 391-396.
Bates, L. S., Waldren, R. P., & Teare, I. D. (1973). Rapid deter-mination of free proline for water-stress studies. Plant and soil, 39(1), 205-207.
Chandrakar, V., Naithani, S. C., & Keshavkant, S. (2016). Arsenic-induced metabolic disturbances and their mitigation mechanisms in crop plants: A review. Biologia, 71(4), 367-377.
Giannopolitis, C. N., & Ries, S. K. (1977). Superoxide dis-mutases I. Occurrence in higher plants. Plant physiology, 59(2), 309-314.
Gossett, D. R., Millhollon, E. P., & Lucas, M. (1994). Antioxi-dant response to NaCl stress in salt-tolerant and salt-sensitive cultivars of cotton. Crop Science, 34(3), 706-714.
Gunes, A., Inal, A., Alpaslan, M., Eraslan, F., Bagci, E. G., & Cicek, N. (2007). Salicylic acid induced changes on some physiological parameters symptomatic for oxidative stress and mineral nutrition in maize (Zea mays L.) grown under salinity. Journal of Plant Physiology, 164(6), 728-736.
Gunes, A., Inal, A., Alpaslan, M., Eraslan, F., Bagci, E. G., & Cicek, N. (2007). Salicylic acid induced changes on some physiological parameters symptomatic for oxidative stress and mineral nutrition in maize (Zea mays L.) grown under salin-ity. Journal of Plant Physiology, 164(6), 728-736.
Harfouche, A. L., Rugini, E., Mencarelli, F., Botondi, R., & Muleo, R. (2008). Salicylic acid induces H 2 O 2 production and endochitinase gene expression but not ethylene biosynthesis in Castanea sativa in vitro model system. Journal of plant physi-ology, 165(7), 734-744.
Hayat, S., Hasan, S. A., Fariduddin, Q., & Ahmad, A. (2008). Growth of tomato (Lycopersiconesculentum) in response to salicylic acid under water stress. Journal of Plant Interac-tions, 3(4), 297-304.
Hayat, S., Maheshwari, P., Wani, A. S., Irfan, M., Alyemeni, M. N., & Ahmad, A. (2012). Comparative effect of 28 homobrassi-nolide and salicylic acid in the amelioration of NaCl stress in Brassica juncea L. Plant physiology and biochemistry, 53, 61-68.
Horváth, E., Szalai, G., & Janda, T. (2007). Induction of abiotic stress tolerance by salicylic acid signaling. Journal of Plant Growth Regulation, 26(3), 290-300.
Hussein, M. M., Nadia, E. L., Gereadly, H. M., & El-Desuki, M. (2006). Role of putrescine in resistance to salinity of pea plants (Pisumsativum L.). J ApplSci Res, 2, 598-604.
Iqbal, M., Ashraf, M., Jamil, A., & Ur‐Rehman, S. (2006). Does seed priming induce changes in the levels of some endog-enous plant hormones in hexaploid wheat plants under salt stress?. Journal of integrative plant Biology, 48(2), 181-189.
Ismail, M. A. (2013). Alleviation of salinity stress in white corn (Zea mays L.) plant by exogenous application of salicylic acid. Am J Life Sci, 1(6), 248-55.
Jaleel, C. A., Sankar, B., Sridharan, R., &Panneerselvam, R. (2008). Soil salinity alters growth, chlorophyll content,

BIOSCIENCE BIOTECHNOLOGY RESEARCH COMMUNICATIONS AMELIORATIVE EFFECT OF SALICYLIC ACID ON SALINITY STRESSED PISUM SATIVUM 489
Farhan, Ananya and Aisha
and secondary metabolite accumulation in Catharanthusro-seus. Turkish Journal of Biology, 32(2), 79-83.
Khan, M. I. R., & Khan, N. A. (2013). Salicylic acid and jas-monates: approaches in abiotic stress tolerance. Journal of plant Biochemistry and physiology, 1(4).
Kirk, J. T. O., & Allen, R. L. (1965). Dependence of chloroplast pig-ment synthesis on protein synthesis: effect of actidione. Biochem-ical and Biophysical Research Communications, 21(6), 523-530.
Klapheck, S., Zimmer, I., &Cosse, H. (1990). Scavenging of hydro-gen peroxide in the endosperm of Ricinuscommunis by ascorbate peroxidase. Plant and Cell Physiology, 31(7), 1005-1013.
Li, T., Hu, Y., Du, X., Tang, H., Shen, C., & Wu, J. (2014). Sal-icylic acid alleviates the adverse effects of salt stress in Torreyagrandis cv. Merrillii seedlings by activating photosynthe-sis and enhancing antioxidant systems. PLoS One, 9(10), e109492.
Lowry, O. H., Rosebrough, N. J., Farr, A. L., & Randall, R. J. (1951). Protein measurement with the Folin phenol rea-gent. Journal of biological chemistry, 193(1), 265-275.
Ma, X., Zheng, J., Zhang, X., Hu, Q., & Qian, R. (2017). Salicylic Acid Alleviates the Adverse Effects of Salt Stress on Dianthus superbus (Caryophyllaceae) by Activating Photosynthesis, Pro-tecting Morphological Structure, and Enhancing the Antioxi-dant System. Frontiers in plant science, 8.
Misra, N., & Saxena, P. (2009). Effect of salicylic acid on pro-line metabolism in lentil grown under salinity stress. Plant Sci-ence, 177(3), 181-189.
Mukerji, K.G., 2004. Fruit and vegetable diseases. Hingham, MA, USA: Kluwer Academic Publishers, p. 145.
Roussos, P. A., Gasparatos, D., Kyriakou, C., Tsichli, K., Tsantili, E., & Haidouti, C. (2013). Growth, Nutrient Status, and Bio-chemical Changes of Sour Orange Plants Subjected to Sodium Chloride Stress. Communications in soil science and plant analysis, 44(1-4), 805-816.
Roussos, P. A., Gasparatos, D., Tsantili, E., & Pontikis, C. A. (2007). Mineral nutrition of jojoba explants in vitro under sodium chloride salinity. ScientiaHorticulturae, 114(1), 59-66.
Shakirova, F. M., Sakhabutdinova, A. R., Bezrukova, M. V., Fat-khutdinova, R. A., & Fatkhutdinova, D. R. (2003). Changes in the hormonal status of wheat seedlings induced by salicylic acid and salinity. Plant science, 164(3), 317-322.
Steduto, P., Albrizio, R., Giorio, P., & Sorrentino, G. (2000). Gas-exchange response and stomatal and non-stomatal limita-tions to carbon assimilation of sunfl ower under salinity. Envi-ronmental and experimental botany, 44(3), 243-255.
Tang, H., Hu, Y. Y., Yu, W. W., Song, L. L., & Wu, J. S. (2015). Growth, photosynthetic and physiological responses of Tor-reyagrandis. Trees, 29(4), 1011-1022.
Verhagen, J., Put, M., Zaal, F., & van Keulen, H. (2004). Cli-mate change and drought risks for agriculture. In The Impact of Climate Change on Drylands(pp. 49-59). Springer Neth-erlands.

Medical CommunicationBiosci. Biotech. Res. Comm. 10(3): 490-496 (2017)
Evaluation of satisfaction rate of dental implants in
patients referred to private clinics of Kermanshah city
Hedaiat Moradpoor1, Amir Hossien Moradi2, Sara Taherzadeh3 and Sahar Raissi4*1Assistant Professor, Prosthodontics Department, Faculty of Dentistry Kermanshah University of Medical Sciences, Iran2Assistant Professor, Prosthodontics Department, Faculty of Dentistry Kermanshah University of Medical Sciences, Iran3Faculty of Dentistry Kermanshah University of Medical Sciences, Iran4Assistant Professor, Prosthodontics Department, Faculty of Dentistry Kermanshah University of Medical Sciences, Iran
ABSTRACT
The satisfaction of dental care has always been an important topic in the fi eld of dentistry. Several studies in the country from different parts of the dental patient satisfaction has been made. But few specifi c studies on the satisfac-tion of patients of the dental implant have been done. This study was aimed to assess the satisfaction of implantation done in the city of Kermanshah. Since the present study, is a retrospective study, 108 cases of dental implants placed in selected patients were asked to fi ll a questionnaire that included demographic information and questions related to the satisfaction of dental implants placed were asked. Data were collected and analyzed using software SPSS18 were analyzed. The results showed that the level of patient satisfaction in the satisfaction of the cost, 80%above the average and 9.7 is weak. Patients’ satisfaction with the performance of, and only 2.7 percent of the poor were good average 3/97. The fi ndings also showed that mental satisfaction and overall satisfaction of patients was 100%.But the satisfaction of performance including waiting time was less than the satisfaction rate of 51 percent good and 49 percent were poor.
KEY WORDS: FELDSPATHIC PORCELAIN, IPS E.MAX HEAT PRESS LAYERED, ENAMEL TOOTH WEAR
490
ARTICLE INFORMATION:
*Corresponding Author: [email protected] 27th June, 2017Accepted after revision 21st Sep, 2017 BBRC Print ISSN: 0974-6455Online ISSN: 2321-4007 CODEN: USA BBRCBA
Thomson Reuters ISI ESC and Crossref Indexed Journal NAAS Journal Score 2017: 4.31 Cosmos IF: 4.006
© A Society of Science and Nature Publication, 2017. All rights reserved.Online Contents Available at: http//www.bbrc.in/DOI: 10.21786/bbrc/10.3/23

Hedaiat Moradpoor et al.
INTRODUCTION
Despite the many advantages that conventional pros-thetics have in restoring the beauty and oral function of patients, their defi ciencies cause dissatisfaction of patients in many cases, and this leads patients to tend to use more durable and more satisfying treatments, one of which is dental implants. The lack of serious defects and the problems of moving and fi xed prosthesis, such as damage to adjacent teeth, Ridge jawbone fracture, unde-sirable beauty, and other defects in conventional pros-thesis by replacement of bone implants have increased their usage worldwide, so that the use of dental implants in the United States has grown ten times during 2002-1983 years (Annear et al 2005) and (Karoussis et al 2003) and (Behneke 2002). With the advent of the oste-ointegrationtheory in dentistry and proving that pure titanium in direct contact with the bone could provide a good support for replacing missing teeth, then it led to the introduction of dental implants (Wheeler 2003).
At fi rst, dental implants were used to maintain the function of the patients, but later it was added to the beauty. Along with the supply of various implant sys-tems, many clinical studies have been conducted to assess their durability rates. Edleau et al. (1981), in their 15-year review, reported success rates of 84% in upper jaw and 93% in mandibles (Adell et al 1981). High suc-cess and benefi ts such as the lack of need for adjoining tooth cuttin and the prevention of alveolar bone fraction have led to an increase in the use of dental implants (Hobo 1997) and (Lekholm 1999) and (Lindquist et al 1997).
Following the protocol provided by Branemark is often recommended to succeed in achieving success-ful osonetic secretion (De Bruyn et al 1995). Saha et al. (2013) in a study questioned 403 people to assess the awareness rate of dental implants whilethe results showed that half of them had completely no informa-tion about the implant (Saha et al 2013). These studies are consistent with recent studies of the low level of data about dental implants (Awad et al 2013). The lack of accurate and true information is one of the reasons that increase the unrealistic expectations of patients, which reduces their satisfaction (Satpathy et al 2011). The aim of this study was to evaluate the satisfaction of dental implants in patients treated with dental implants.
MATERIAL AND METHODS
In this analytical-descriptive study, in order to evalu-ate the satisfaction of implantation, 108 archival records of patients treated with dental implants were randomly selected using a randomized table referring to dental clinics in Kermanshah. In order to collect the research
data, the researcher completed a questionnaire includ-ing demographic data and researcher made questions to assess the satisfaction of dental implant implantation by calling the patients and inviting them to face-to-face interviews. The scores of the questionnaire were ranked based on three good/medium/bad grades, which 1-2 as weak, 3-6 as average and 7 to 10 as good were ranked. Also, 1-2questions evaluate cost satisfaction; 3-6 ques-tions evaluate satisfaction from implant function, and questions 7-10 assess mental satisfaction and satisfac-tion with the stages of work. Mental satisfaction is one of the modes of satisfaction (Levi et al 2003), which is calculated based on the score that a person received from the mental satisfaction questionnaire of the research questionnaire from questions 7 to 9.
The study population was selected from patients treated with dental implants who had undergone at least one year of treatment. The sample size was calculated based on a pilot study and considering the variables of satisfaction such that S=3.17 (standard deviation), = 0.05 (confi dence), and d = 0.6 (accuracy), while the minimum sample size was 108, which was selected as convenience.
The collected data was analyzed by SPSS software version 18. In descriptive statistics, mean and frequency distribution and in inferential statistics, Mann-Whitney test were used.
RESULTS
The level of the cost satisfaction of the people was assessed9.7% as weak, 47.8% moderate, and 42.5% as good.The satisfaction of individuals with implant function was evaluated as 2.7% weak, 4.4% moderate and 92.9% good. The mental satisfaction of individu-als was evaluated as 0% weak, 16.8% moderate and 83.2% good. The degree of satisfaction of the people from the stages of work was evaluated as 48.7% weak and 51.3% good (Table 4-6 and Fig. 4-8). The satis-faction of beauty was evaluated 15% were weak and 85% good. The satisfaction rate of the whole popu-lation was evaluated 0% weak, 10.6% moderate and 89.4% good. The total satisfaction of the individuals by gender was evaluated in men, 0% weak, 10.6% moder-ate and 89.4% % good and in women 0% weak, 10.8% moderate and 89.1% good.
In order to determine the relationship between satis-faction and age variables, implant loading years, gen-der and education level, Chi-square and Fisher’s exact tests were used. Chi-square test showed no signifi cant
BIOSCIENCE BIOTECHNOLOGY RESEARCH COMMUNICATIONS EVALUATION OF SATISFACTION RATE OF DENTAL IMPLANTS IN PATIENTS REFERRED 491

Hedaiat Moradpoor et al.
FIGURE 1. Distribution of Cost Satisfaction among Participants in the Study
FIGURE 2. A Distribution of satisfaction with implant function among participants in the study
relationship between satisfaction and age (forty-fi ve years or less - more than forty-fi ve years) (P-value = 33.93). Fisher’s exact test showed no signifi cant rela-tionship between satisfaction and implant loading years (three years or less, more than three years) (P-value = 513). Chi-square test showed no signifi cant relation-ship between satisfaction and gender (P-value = -0.96). Fisher’s exact test showed that there was no statistically
signifi cant relationship between satisfaction level and level of education (diploma and undergraduate - univer-sity degree) (P-value = 0.96).
DISCUSSION AND CONCLUSION
Research fi ndings in the area of satisfaction from the cost of implanting showed that almost ninety percent of
492 EVALUATION OF SATISFACTION RATE OF DENTAL IMPLANTS IN PATIENTS REFERRED BIOSCIENCE BIOTECHNOLOGY RESEARCH COMMUNICATIONS

BIOSCIENCE BIOTECHNOLOGY RESEARCH COMMUNICATIONS EVALUATION OF SATISFACTION RATE OF DENTAL IMPLANTS IN PATIENTS REFERRED 493
Hedaiat Moradpoor et al.
FIGURE 3. Distribution of mental satisfaction of participants in the study
FIGURE 4. Distribution of satisfaction from work stages among participants in the study
participants were satisfi ed with the cost of implanting. It is clear to everyone that the dental services in our country are expensive due to the cost of dental materials and its costs. Patients always expect the services to be satisfactory and cost-effective. The results of this study showed that the patients in this study were satisfi ed with the cost of implant implantation, which indicates that patients’ expectations have been met. This means that
although the inserted implant imposed cost on them, but it has been able to keep them satisfi ed with this action. The results of this study were consistent with the results of study by Rismanchian et al. (2007). The Rismanchian et al, in their study reported a satisfaction of over 90%. In their study, 107 male and female patients were evalu-ated. Their study was a two-year study, but the current study was a one-year study after implant implantation,
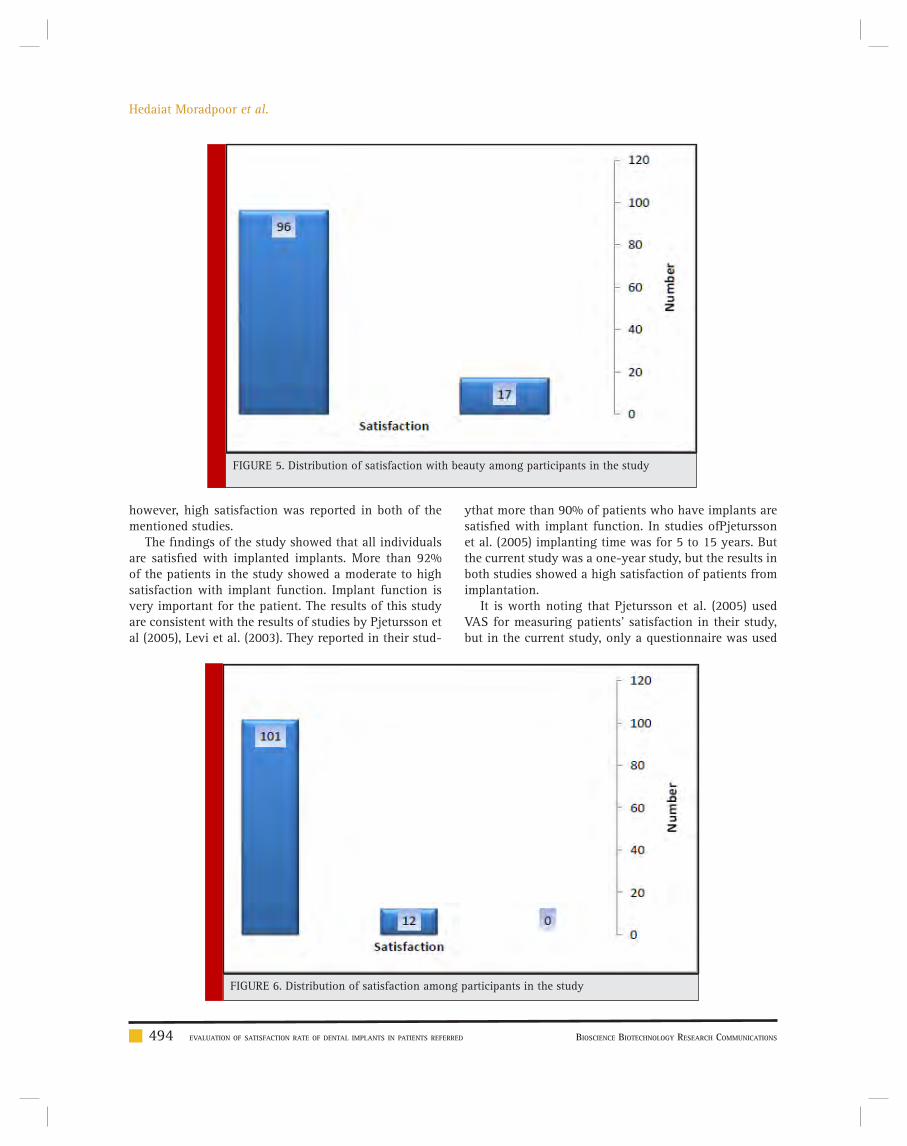
494 EVALUATION OF SATISFACTION RATE OF DENTAL IMPLANTS IN PATIENTS REFERRED BIOSCIENCE BIOTECHNOLOGY RESEARCH COMMUNICATIONS
Hedaiat Moradpoor et al.
FIGURE 5. Distribution of satisfaction with beauty among participants in the study
FIGURE 6. Distribution of satisfaction among participants in the study
however, high satisfaction was reported in both of the mentioned studies.
The fi ndings of the study showed that all individuals are satisfi ed with implanted implants. More than 92% of the patients in the study showed a moderate to high satisfaction with implant function. Implant function is very important for the patient. The results of this study are consistent with the results of studies by Pjetursson et al (2005), Levi et al. (2003). They reported in their stud-
ythat more than 90% of patients who have implants are satisfi ed with implant function. In studies ofPjetursson et al. (2005) implanting time was for 5 to 15 years. But the current study was a one-year study, but the results in both studies showed a high satisfaction of patients from implantation.
It is worth noting that Pjetursson et al. (2005) used VAS for measuring patients’ satisfaction in their study, but in the current study, only a questionnaire was used

BIOSCIENCE BIOTECHNOLOGY RESEARCH COMMUNICATIONS EVALUATION OF SATISFACTION RATE OF DENTAL IMPLANTS IN PATIENTS REFERRED 495
Hedaiat Moradpoor et al.
Pjetursson 2005). The primary purpose of the implant is to help the patient’s function, and this goal is still impor-tant for patients. An implant satisfaction survey shows that satisfaction with implants is high in patients and it has been able to meet patient expectations (Jie Yao et al 2014). In their study, patients were satisfi ed with the condition of the implant, shape, overall appearance, effect on the speech, and the ability of the function. The results of the current study also confi rm this satisfac-tion. Although satisfaction was used in their study using email, the degree of satisfaction in the current study was consistent with their study.
The fi ndings of the research in the area of mental satisfaction showed that more than 80% of the patients had a high satisfaction with the implants, while the fi nd-ings showed that only 16% of the patients had low men-tal dissatisfaction. Mental satisfaction is a condition in which a person is satisfi ed with the work done and has internal satisfaction (Levi et al2003), which is calculated, based on the score obtained from the mental satisfaction questionnaire of the research questionnaire, which are these questions 7-9. The results of this study were con-sistent with the results of Levi et al. (2003).
They reported in their study that patients who have dental implants had a high degree of mental satisfaction with their implants. Patient’s mental satisfaction can reveal a set of person’s satisfaction with cost, function, beauty. Patient mental satisfaction can be considered as the most important type of satisfaction, because if there is no mental satisfaction, it can be claimed that the work has failed. But given the fact that some patients have very high expectations from implants, their implant sat-isfaction is not provided after implantation. This can be argued that a dentist must reach the patient’s expecta-tions before implantation, and moderate the unreason-able mental expectations of the patient (Levi et al 2003). Patients are expecting miraculous treatments by refer-ring to dental centers and hearing some of the new tech-niques. Dentists can make the patient’s mental expecta-tions largely acceptable with a simple explanation of the stages of work and problems that may occur during work.
The fi ndings of the study showed that only half of the participants were satisfi ed with the stages of work, and the other half were completely dissatisfi ed with the work process. Dissatisfaction with the work process involved the waiting time until the layout of the cover. Dental services, and especially implants are usually time-con-suming due to the collaboration of several specialists and labs, but the patient expects to achieve the goal at a very short time. It is necessary to the dentist explain the required steps to increase the patient’s satisfaction, the need for collaboration of several specialists and the laboratory, and the time of implantation for the patient
prior to the implant implantation (Razmi et al 2010), which would increase the patient’s satisfaction. Dental services are always time-consuming due to the special circumstances. Implanting will naturally be more time consuming due to the collaboration of several specialists and lab. This is necessary to tell the patient at the begin-ning of treatment. Explaining the patient in addition to patients about the collaboration reduces their expecta-tions, can also increase patient satisfaction from work.
Also, the fi ndings showed that approximately 90% of total satisfaction in patients was well evaluated, and only 10% of the participants had a moderate overall satisfac-tion rate. The results of this study were consistent with the results of studies by Pjetursson et al. (2005), Levi et al. (2003), Yi et al. (2001) and Riesmannchian et al. (2007). In their studies, they reported total satisfaction in patients who had implants, including satisfaction with function, beauty, cost, and acceptable levels (Razmi et al 2010) and (Yi et al 2001) and (Rismanchian et al 2007) and (Haji et al 2010). The fi ndings also reported the equal over-all satisfaction in male patients and female patients, and did not show any difference between the satisfaction of women and men. It can be said that the most important issue at the end of dental care is the patient’s satisfaction. Although the work process and services provided by the dentist may be confi rmed, it is more important than the patient’s own satisfaction, and it should be noted that sat-isfaction is a mental issue. In the current study, the satis-faction of implant implants was reported, which indicates that dentists have been able to achieve a satisfactory level of satisfaction at all stages. In all studies, overall satisfac-tion has always been reported with high rates. This may lead to an increase in implant implants in Iran and other countries in recent years.
CONCLUSION
According to the mentioned materials, it can be said that dental services in the fi eld of implanting have been able to achieve satisfactory patient satisfaction. Implanting has been able to satisfy patients in the issue of satisfac-tion with performance, cost, and satisfaction. Only on the work process the patients were dissatisfi ed while it should be noted that the dentist needed to justify the patient from the beginning of the implant implantation timeli-ness, the steps required, the need for several specialists and the laboratory to work together, which could moder-ate the patient’s expectations. This will increase patient satisfaction. It should be noted that satisfaction is a men-tal issue and dentists have to meet the expectations of the patient, especially patients with unreasonable expec-tations and many expectations of implant implantation treatments, at the beginning of the treatment so that they can increase the level of satisfaction of the patient.

496 EVALUATION OF SATISFACTION RATE OF DENTAL IMPLANTS IN PATIENTS REFERRED BIOSCIENCE BIOTECHNOLOGY RESEARCH COMMUNICATIONS
Hedaiat Moradpoor et al.
REFERENCES
Adell, R., Lekholm, U., Rockler and Brånemark, P.I., 1981. A 15-year study of osseointegrated implants in the treatment of the edentulous jaw. International journal of oral surgery, 10(6), pp.387-416.
Anner, R., Better, H. and Chaushu, G., 2005. The clinical effec-tiveness of 6 mm diameter implants. Journal of periodontol-ogy, 76(6), pp.1013-1015.
Awad, M.A., Lund, J.P., Shapiro, S.H., Locker, D., Klemetti, E., Chehade, A., Savard, A. and Feine, J.S., 2003. Oral health sta-tus and treatment satisfaction with mandibular implant over-dentures and conventional dentures: a randomized clinical trial in a senior population. International Journal of Prostho-dontics, 16(4).
Behneke, A., Behneke, N. and d Hoedt, B., 2002. A 5-year lon-gitudinal study of the clinical effectiveness of ITI solid-screw implants in the treatment of mandibular edentulism. Inter-national Journal of Oral and Maxillofacial Implants, 17(6), pp.799-810.
De Bruyn, H. and Collaert, B., 1994. The effect of smoking on early implant failure. Clinical oral implants research, 5(4), pp.260-264.
Haji F, Rezaei M, provincial N, royal person, the name, auction, Afshin, Mhrshadyan, M., 2010. Patient satisfaction survey of dental clinics of Islamic Azad University in Tehran in 1387. Journal of Dental Science / Volume VII / No. III, pp: 26-32.
Hobo, S., Ichida, E. and Garcia, L.T., 1989. Osseointegration and occlusal rehabilitation. Quintessence Pub Co.
Jeon, J.H., Min, H.H. and Kim, Y.S., 2014. Relationship between satisfaction of dental service, value quality, and reuse inten-tion. Journal of Korean society of Dental Hygiene, 14(5), pp.765-773.
Karoussis, I.K., Salvi, G.E., Heitz‐Mayfi eld, L.J., Brägger, U., Häm-merle, C.H. and Lang, N.P., 2003. Long‐term implant prognosis in patients with and without a history of chronic periodontitis: a 10‐year prospective cohort study of the ITI® Dental Implant System. Clinical oral implants research, 14(3), pp.329-339.
Lekholm, U., Gunne, J., Henry, P., Higuchi, K., Lindén, U., Berg-strom, C. and Steenberghe, D.V., 1999. Survival of the Bråne-mark implant in partially edentulous jaws: a 10-year pro-spective multicenter study. International Journal of Oral and Maxillofacial Implants, 14(5), pp.639-645.
Lindquist, L.W., Carlsson, G.E. and Jemt, T., 1997. Association between marginal bone loss around osseointegrated mandibu-lar implants and smoking habits: a 10-year follow-up study. Journal of dental research, 76(10), pp.1667-1674.
Pjetursson, B.E., Karoussis, I., Bürgin, W., Brägger, U. and Lang, N.P., 2005. Patients’ satisfaction following implant therapy. Clinical oral implants research, 16(2), pp.185-193.
razmi, H., Talari, MJ., 1996. Assessment of patient satisfaction in the School of Dentistry, Tehran University of Medical Sci-ence Journal of Islamic Dental Association. Dandnpzshkan / Volume 17 / Issue 2, Summer 1384, pp: 82-89
Rismanchian, M, Akbar F., 2007. Clinical and radiographic evaluation of patients treated with ITI implants and assess their satisfaction. Journal of Isfahan Dental School, pp: 112-117.
Saha, A., Dutta, S., Vijaya, V. and Rajnikant, N., 2013. Aware-ness among patients regarding Implants as a treatment option for replacement of missing teeth in Chattisgarh. Journal of international oral health: JIOH, 5(5), p.48.
Satpathy, A., Porwal, A., Bhattacharya, A. and Sahu, P.K., 2011. Patient awareness, acceptance and perceived cost of dental Implants as a treatment modality for replacement of missing teeth: A survey in Bhubaneswar and Cuttack. International Journal of Public Health Dentistry, 2(1), pp.1-7.
Wheeler, S., 2003. Use of the Frialit-2 Implant System in pri-vate practice: a clinical report. International Journal of Oral & Maxillofacial Implants, 18(4).
Yao, J., Tang, H., McGrath, C.P.J., Gao, X. and Mattheos, N., 2014. Patients’ expectations to dental implant: a systematic review. Journal of Dental Research.
Yi, S.W., Carlsson, G.E., Ericsson, I. and Kim, C.K., 2001. Patient evaluation of treatment with fi xed implant‐supported partial dentures. Journal of oral rehabilitation, 28(11), pp.998-1002.

Psychological CommunicationBiosci. Biotech. Res. Comm. 10(3): 497-503 (2017)
Investigations on the relationship between perfectionism
and psychological needs with the perception of body
image in cosmetic surgery applicants
Soodabeh Yavari1* and Asghar Jafari2
1MA Student of Counseling and Guidance, Faculty of Human Science, Abhar Branch, Islamic Azad University, Abhar, Iran2PhD, Faculty Member of Shahid Beheshti University, Tehran, Iran
ABSTRACT
Physical appearance is an important part of the body image because it is the fi rst source of information which others use it for social interactions with that individual. Every year tens of thousands are doing cosmetic surgery in order to eliminate dissatis-faction with their appearance and sometimes to increase self-esteem. The aim of this research was to investigate the relation-ship between perfectionism and psychological needs with the perception of body image in cosmetic (plastic) surgery applicants. Research population consists of all the men and women who were applicants for cosmetic surgery and had recourse to beauty clinic of Imam Khomeini hospital, Tehran, Iran. 200 individual samples were selected by availability sampling method. The method of this paper was descriptive-analytical and data collection is done using questionnaire. data were analyzed using SPSS. Results showed that there was a relationship between perfectionism and psychological needs with the perception of body image of cos-metic surgery applicants. Psychological and perfectionism needs and also the perception of body image of women are different from men’s. In addition, the negative characteristics of perfectionism have a larger share in cosmetic surgery applicants’ prediction of body image perception.
KEY WORDS: PSYCHOLOGICAL NEEDS, PERFECTIONISM, THE PERCEPTION OF BODY IMAGE
497
ARTICLE INFORMATION:
*Corresponding Author: [email protected] 1st June, 2017Accepted after revision 25th Sep, 2017 BBRC Print ISSN: 0974-6455Online ISSN: 2321-4007 CODEN: USA BBRCBA
Thomson Reuters ISI ESC and Crossref Indexed Journal NAAS Journal Score 2017: 4.31 Cosmos IF: 4.006
© A Society of Science and Nature Publication, 2017. All rights reserved.Online Contents Available at: http//www.bbrc.in/DOI: 10.21786/bbrc/10.3/24
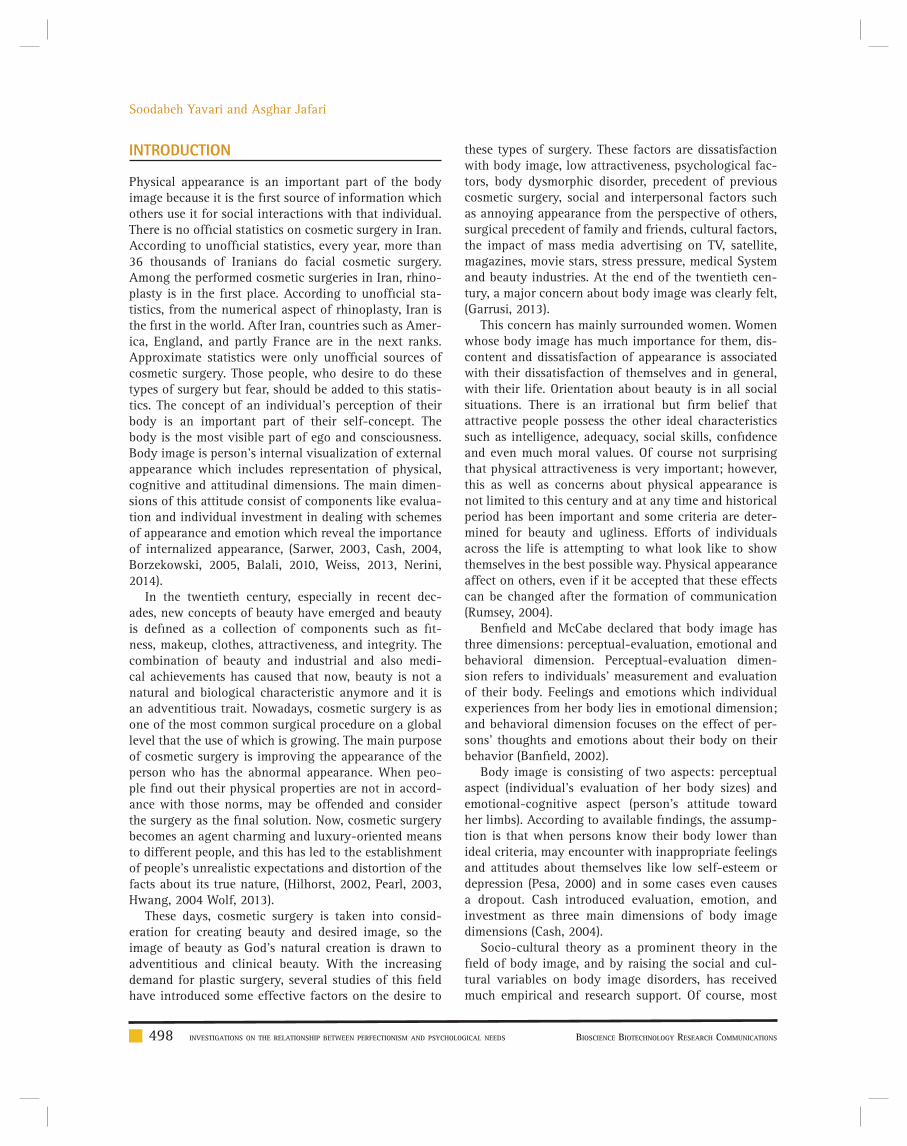
Soodabeh Yavari and Asghar Jafari
INTRODUCTION
Physical appearance is an important part of the body image because it is the fi rst source of information which others use it for social interactions with that individual. There is no offi cial statistics on cosmetic surgery in Iran. According to unoffi cial statistics, every year, more than 36 thousands of Iranians do facial cosmetic surgery. Among the performed cosmetic surgeries in Iran, rhino-plasty is in the fi rst place. According to unoffi cial sta-tistics, from the numerical aspect of rhinoplasty, Iran is the fi rst in the world. After Iran, countries such as Amer-ica, England, and partly France are in the next ranks. Approximate statistics were only unoffi cial sources of cosmetic surgery. Those people, who desire to do these types of surgery but fear, should be added to this statis-tics. The concept of an individual’s perception of their body is an important part of their self-concept. The body is the most visible part of ego and consciousness. Body image is person’s internal visualization of external appearance which includes representation of physical, cognitive and attitudinal dimensions. The main dimen-sions of this attitude consist of components like evalua-tion and individual investment in dealing with schemes of appearance and emotion which reveal the importance of internalized appearance, (Sarwer, 2003, Cash, 2004, Borzekowski, 2005, Balali, 2010, Weiss, 2013, Nerini, 2014).
In the twentieth century, especially in recent dec-ades, new concepts of beauty have emerged and beauty is defi ned as a collection of components such as fi t-ness, makeup, clothes, attractiveness, and integrity. The combination of beauty and industrial and also medi-cal achievements has caused that now, beauty is not a natural and biological characteristic anymore and it is an adventitious trait. Nowadays, cosmetic surgery is as one of the most common surgical procedure on a global level that the use of which is growing. The main purpose of cosmetic surgery is improving the appearance of the person who has the abnormal appearance. When peo-ple fi nd out their physical properties are not in accord-ance with those norms, may be offended and consider the surgery as the fi nal solution. Now, cosmetic surgery becomes an agent charming and luxury-oriented means to different people, and this has led to the establishment of people’s unrealistic expectations and distortion of the facts about its true nature, (Hilhorst, 2002, Pearl, 2003, Hwang, 2004 Wolf, 2013).
These days, cosmetic surgery is taken into consid-eration for creating beauty and desired image, so the image of beauty as God’s natural creation is drawn to adventitious and clinical beauty. With the increasing demand for plastic surgery, several studies of this fi eld have introduced some effective factors on the desire to
these types of surgery. These factors are dissatisfaction with body image, low attractiveness, psychological fac-tors, body dysmorphic disorder, precedent of previous cosmetic surgery, social and interpersonal factors such as annoying appearance from the perspective of others, surgical precedent of family and friends, cultural factors, the impact of mass media advertising on TV, satellite, magazines, movie stars, stress pressure, medical System and beauty industries. At the end of the twentieth cen-tury, a major concern about body image was clearly felt, (Garrusi, 2013).
This concern has mainly surrounded women. Women whose body image has much importance for them, dis-content and dissatisfaction of appearance is associated with their dissatisfaction of themselves and in general, with their life. Orientation about beauty is in all social situations. There is an irrational but fi rm belief that attractive people possess the other ideal characteristics such as intelligence, adequacy, social skills, confi dence and even much moral values. Of course not surprising that physical attractiveness is very important; however, this as well as concerns about physical appearance is not limited to this century and at any time and historical period has been important and some criteria are deter-mined for beauty and ugliness. Efforts of individuals across the life is attempting to what look like to show themselves in the best possible way. Physical appearance affect on others, even if it be accepted that these effects can be changed after the formation of communication (Rumsey, 2004).
Benfi eld and McCabe declared that body image has three dimensions: perceptual-evaluation, emotional and behavioral dimension. Perceptual-evaluation dimen-sion refers to individuals’ measurement and evaluation of their body. Feelings and emotions which individual experiences from her body lies in emotional dimension; and behavioral dimension focuses on the effect of per-sons’ thoughts and emotions about their body on their behavior (Banfi eld, 2002).
Body image is consisting of two aspects: perceptual aspect (individual’s evaluation of her body sizes) and emotional-cognitive aspect (person’s attitude toward her limbs). According to available fi ndings, the assump-tion is that when persons know their body lower than ideal criteria, may encounter with inappropriate feelings and attitudes about themselves like low self-esteem or depression (Pesa, 2000) and in some cases even causes a dropout. Cash introduced evaluation, emotion, and investment as three main dimensions of body image dimensions (Cash, 2004).
Socio-cultural theory as a prominent theory in the fi eld of body image, and by raising the social and cul-tural variables on body image disorders, has received much empirical and research support. Of course, most
498 INVESTIGATIONS ON THE RELATIONSHIP BETWEEN PERFECTIONISM AND PSYCHOLOGICAL NEEDS BIOSCIENCE BIOTECHNOLOGY RESEARCH COMMUNICATIONS

BIOSCIENCE BIOTECHNOLOGY RESEARCH COMMUNICATIONS INVESTIGATIONS ON THE RELATIONSHIP BETWEEN PERFECTIONISM AND PSYCHOLOGICAL NEEDS 499
Soodabeh Yavari and Asghar Jafari
of the studies have focused on women’s social and psy-chological variables. This focus probably is due to the high prevalence of body dissatisfaction and body image disorders in women and young girls. The investigation found that the incidence of physical ideal for women is associated with their increasing body dissatisfac-tion (Hargreaves, 2006). Studies show that awareness and internalization of women’s ideal are predictors of body dissatisfaction, body image, and a decrease of self-esteem. Cosmetic surgery includes carrying out all cos-metic surgery, including nose, eyelids, eyebrows, cheeks, forehead, neck and body beauty which may change (such as removing fat) or improve (e.g. dentures). Gen-erally, cosmetic surgery refers to surgeries without the special medical necessity that is done solely for cosmetic purposes (Tavassoli, 2012).
Surgical breast implants in the United States is eight times since 1992. Also in 2001, 1.6 million people have been surgery Botox injections therein. This rise of sta-tistics is also seen among the male population. In 2002, the number of men who use Botox injection for less showing their age has increased 88% and men who have undergone rhinoplasty surgery has increased 47% (Ibid). For years, the negative image of the body has known as one of the reasons for resorting to plastic surgery. But few types of research have studied body image after sur-gery longitudinally. Sarwar and his colleagues in 2002 evaluated body image of patients before and after of cosmetic surgery (Heyes, 2016). A signifi cant decrease of patients’ dissatisfaction of operated limb than before the cosmetic surgery was reported. They also suffer less embarrassment in front of others’ attention to that spe-cifi c limb or talking about it. But there was no change in studied women’s general body image. These results represented that people who undergo cosmetic surgery are rarely signifi cant changes in their general discon-tent. Therefore, cosmetic surgery is a therapeutic plan for people who are dissatisfi ed with just one part of their body and face (Sarwer, 2003).
Many factors can contribute to the negative image of the body, including physiological factors (such as body mass index), psychological factors (like perfection-ism, low self-esteem) and socio-cultural factors (such as family, peers, and media). In the contexts of perfec-tionism, both one-dimensional and multi-dimensional approach to perfectionism can be seen (McGee, 2005).Person-centered divisions of perfectionism are normal – neurotic, satisfying- dissatisfying, and negative or posi-tive perfectionism (Stoeber, 2007; Besharat, 2007). In the framework of person-centered approach, in addition to neurotic, abnormal and damaging roles of perfectionism which are more known, its normal and desirable and also positive effects are confi rmed and clarifi ed (Slade, 1998). According to this division, a normal perfectionist enjoys
effort and competition for superiority and perfection and at the same time accept personal limits, although neurotic perfectionist due to unrealistic expectations, do not be satisfi ed with her performance (McGee, 2005).
Positive perfectionism: positive perfectionism (strive for positive progress) is to Try to achieve high per-sonal standards without self-criticism. This aspect is not related to negative characteristics such as anxiety; positive perfectionism mainly focuses on expectations regarding progress, competition, capability, the excite-ment of a work and satisfaction. On the other hand, positive perfectionism is achieved by attaining positive and motivation to access a certain goal so that it has promising results (Haas, 2008). Despite the negative per-fectionists (neuroticism), positive perfectionists (normal) at the same time that impose high personal standards for themselves, they can accept personal and environmen-tal limitations and know their success, even if they do not meet their personal standards exactly. This group of perfectionists in an effort to succeed and achieving the goals, in terms of the ability to accept personal limita-tions and environmental barriers, can experience a sense of satisfaction more (Besharat, 2007).
Negative perfectionism: negative perfectionism dimension contains that form of perfectionism which explains perfectionism concerns such as too much attention to mistakes, doubts about negative actions and reactions. This dimension is associated with anxi-ety (Stoeber, 2007). Negative perfectionism is focused on emotions like not meeting expectations of the indi-vidual about herself and others, condemning, feeling guilty, shame and defeating (Haas, 2008). In addition, these persons strictly avoid failure and are vulnerable to criticism of others. This group of perfectionists treats the various spheres of social activity and relations as threat-ening, procrustean and not supportive (Besharat, 2007). The major difference between abnormal and dysfunc-tional perfectionism and positive and normal perfection-ism is that in the fi rst group despite confl icting evidence, perfectionist tendencies are continued (Figure 1).
The concept of basic psychological needs is com-pletely different with the theory of personal efforts and wishes. Although people know the motivations as a provision of basic needs, but it is clear that there are many incentives that do not comply with the standards of welfare; in fact, it may be harmful. In the other words, may some incentives mislead the people about what can resolve their requirements and it means misleading their deviation of welfare? Even when people can satisfy their motivations, again the motivation can be harmful to the welfare if it barricades satisfying the needs of autonomy and communication (Ryan, 2000; Sheldon, 2001). Unfor-tunately, from the past till now there is little consensus about the criteria of psychological needs, where they

Soodabeh Yavari and Asghar Jafari
originated, whether thy are result of learning in child-hood or cultural differences, whether they are inherent and universal and have been established by evolution in man; These are questions that need to be asked about (Sheldon, 2001). In this part, the importance of three psychological needs namely autonomy, competence, and relatedness are investigated. When people fi nd them-selves in an environment that helps them to develop their psychological needs and also fosters them, positive emotions, optimal experience, and healthy growth are its consequences. Psychological needs are important for the study of motivated behavior. The energy of psycho-logical needs is pioneering. Psychological requirements induce a desire to seek the environment that is expected to bring up our needs (Azin, 2014).
Autonomy (independency): independency means per-son’s need to electoral right and self-initiate for duties. For example, when people from the satisfaction and enthusiasm, spend their time and energy to study in order to feel autonomy (Ryan, 2000). Need to autonomy is a need to self-following and having the electoral right at the beginning maintenance and tuning the activities. Autonomy will happen when people feel the responsibil-ity for their behavior, and confi dent in their choices and also the ability of eligible performance, (Sheldon, 2001). Autonomy means feeling volition, having authority of doing things, innate tendency for self-organized behav-ioral experience (Sheldon, 2001). Autonomy is related to
freedom and experience of solidarity in personal behav-iors.
Competence (adequacy): all people try and want to be competent. All want to have fruitful interaction with their environment and this interest is expanded to all aspects of life such as school, workplace, relations, and at the time of recreation and sport. All like to develop some skills and enhance abilities and talents. When a challenge is faced, all attention is focused on it. When the opportunities to develop the skills and talents is given all would like to progress. In these circumstances, the result is a sense of satisfaction. In the other word, human needs to competence; need to competence means the ability of a person in doing duties and that person have how much ability to achieve the desired objectives (Mulder, 2007).
Relatedness (continuity): relatedness is a need to emo-tional bonding with others and this need also expresses the desire of being emotional and being involved in intimate relationships. The requirement to relatedness causes to leading to people who certainly care about the well-being of a person and eschewing of people who do not care about her welfare. Need to relatedness is defi ned as ensuring communication with others and need to make self-experience as an individual worthy of love and respect. In the other words, individual requires to have a relationship with others and be supported by them (Johnston, 2010).
FIGURE 1. Perfectionism features
500 INVESTIGATIONS ON THE RELATIONSHIP BETWEEN PERFECTIONISM AND PSYCHOLOGICAL NEEDS BIOSCIENCE BIOTECHNOLOGY RESEARCH COMMUNICATIONS

BIOSCIENCE BIOTECHNOLOGY RESEARCH COMMUNICATIONS INVESTIGATIONS ON THE RELATIONSHIP BETWEEN PERFECTIONISM AND PSYCHOLOGICAL NEEDS 501
Soodabeh Yavari and Asghar Jafari
Table 1. Summary of multiple regression analysis
Model R R2 Justifi ed R2R2 Standard error1 0.54 0.29 0.27 26.14
Table 2. Summary results of analysis of variance for signifi cance of regression model
Source of changes Sum of squares Degrees of freedom Mean square F Signifi cance levelRegression 49602.9 5 9920.58 14.51 0.001
remaining 116898.72 171 683.61
Total 166501.62 176
Table 3. Summary of regression coeffi cients for psychological and perfectionism needs
Final modelRegression
coeffi cient (B)Standard
errorStandard
coeffi cient (Beta) tSignifi cance
levelAutonomy 0.13 0.36 0.03 1.35 0.72
Competence 0.48 0.40 0.10 1.20 0.23
Dependence 0.56 0.31 0.13 1.81 0.07
Positive perfectionism
1.21 0.36 0.24 3.34 0.001
Negative perfectionism
-0.68 0.13 -0.37 -5 0.001
MATERIALS AND METHODS
The method of this paper is descriptive–analytical and data collection is done using questionnaire. For this pur-pose, 200 men and women who were an applicant of cosmetic surgery and had come to beauty clinic of Imam Khomeini hospital in Tehran and were chosen using availability sampling method. And also analyzing data is done using the SPSS19 software.
RESULTS AND DISCUSSION
In order to a comprehensive analysis of data, a statisti-cal method of multiple regressions was used and data was investigated based on fi ndings and hypotheses. First hypothesis: psychological and perfectionism needs pre-dict the cosmetic surgery applicants’ perception of body image. For determining the relationship between psy-chological and perfectionism needs and cosmetic sur-gery applicants’ perception of body image, multivariate regression is used whose digest is reported in Table 1.
explain 20% of changes in cosmetic surgery applicants’ perception of body image.
As it is shown in Table 2, in the regression model, psychological needs (autonomy, competence, and dependence) and perfection (positive and negative) has a signifi cant relationship (F=14.51, P<0.01) with cosmetic surgery applicants’ perception of body.The criterion variable: perception of body image.Results of the Table 3 indicate the share of each variable in the prediction of perception of body image model. As it is observable, positive and negative perfectionism factors have a sig-nifi cant share in the prediction of “body image percep-tion” and the largest coeffi cients of beta equal to -0.37 belongs to negative perfectionism. In the other words, “negative perfectionism” factor has a stronger role in the prediction of “body image perception” in cosmetic surgery applicants.
Second hypothesis: psychological needs, perfection-ism, and perception of body image of women and men who are an applicant of cosmetic surgery are different. At fi rst, the assumption of equality of variances for psy-chological needs, perfectionism, and perception of body image was examined. As it is shown in Table 4, there is an equal assumption for psychological needs, perfec-tionism, and perception of the body of men and women applicants of cosmetic surgery.
After determining variances equality assumption, for comparing scores of psychological needs, perfection-ism, and perception of body image of women samples, student’s t-test was used for groups apart which results are reported in the table. According to Table 5, because signifi cance level of “t” value (which is calculated by comparing psychological needs, perfectionism, and per-ception of image body of samples) is more than 0.05, the fourth hypothesis was not confi rmed. Therefore, it can
Predictor variables: psychological and perfectionism needs Criterion variable: perception of body image. As can be seen in the table, the intensity of the relationship between psychological needs (autonomy, competence, and dependence) and perfectionism (positive and nega-tive) and cosmetic surgery applicants’ perception of the body was calculated. Its value obtained 0.54 and they

502 INVESTIGATIONS ON THE RELATIONSHIP BETWEEN PERFECTIONISM AND PSYCHOLOGICAL NEEDS BIOSCIENCE BIOTECHNOLOGY RESEARCH COMMUNICATIONS
Soodabeh Yavari and Asghar Jafari
be said that there is no signifi cance relationship between men’s and women’s (applicants of cosmetic surgery) psy-chological needs, perfectionism, and perception of body.
DISCUSSION
According to the fi ndings of this research, the fi rst hypothesis was confi rmed, and it was concluded that there is a signifi cant relationship between psychological needs, perfectionism, and perception of body image of cosmetic surgery applicants. In addition, from predictive variables, “negative perfectionism” factor has a more effective role in the prediction of perception of body image in cosmetic surgery applicants. This result cor-responded with fi ndings of Hass, and Von Soest (2009) (Haas, 2008; Von Soest, 2009). Results of these studies have shown that there is a relationship among cosmetic surgery applicants’ psychological needs, perfectionism, and perception of body image. The same as this research that has shown that negative perfectionism feature has more share in the prediction of body image in cosmetic surgery applicants. Since perfectionism increases the anxiety level and negative perfectionism leads people to the ineffi cient and non-constructive behaviors, so it fur-ther strengthens the basic needs of the motivational and psychological tendency of people. In people who do not have a favorable understanding of their own appearance, choosing cosmetic surgery without a justifi able medical reason is a solution based on emotional copying style (Nerini, 2014). It seems that the main motivational factor for this action is a failure to satisfy basic psychological needs. Awareness of this discontent is possible with a focus on “self”. Intellectual challenges such as how peo-ple think about us and our belief about how they will behave have important implications on how we think about ourselves. When a person expects to be rejected for the sake of some of her features, she can choose between several different possible answers that choos-ing cosmetic surgery is one of these responses. Also in the second hypothesis, it was concluded that there are
differences between men’s and women’s (cosmetic sur-gery applicants) psychological needs, perfectionism, and perception of body.
On the basis of fi ndings of this research, the fourth hypothesis was not confi rmed and it was concluded that there is no signifi cant difference among psychological needs, perfectionism and perception of the body of sam-ples. This result corresponds with study results of Pasha, Naderi and Akbari (2009) and sarwer (2005) (Naderi, 2008; Sarwer, 2005). Basic psychological requirements and perfectionism characteristic of people, over time and in the process of mental transformation, leading to the formation and evolution of the cognitive, emotional and behavioral characteristics. Accordingly, these fac-tors will create ineffi cient perceptions of people toward themselves and their environment and will have con-cerns and confl icts about their appearance in the future. Therefore, men and women who were applicants of cosmetic surgery, in most cases did it infl uenced by the same motivational factors (Webb, 2015).
REFERENCES
Azin, A., Zhou, C., Jackson, T., Cassin, S., Sockalingam, S. and Hawa, R., 2014. Body contouring surgery after bariatric surgery: a study of cost as a barrier and impact on psycho-logical well-being. Plastic and reconstructive surgery, 133(6), pp.776e-782e.
Balali E., Afshar Kohan J. 2010. Beauty and Money, Makeup and Surgery, Women Strategic Studies. pp. 47: 99-140.
Banfi eld, S.S. and McCabe, M.P., 2002. An evaluation of the construct of body image. Adolescence, 37(146), p.373.
Besharat M. A., 2007 Scale Construction and Validation of Multidimensional Perfectionism in Tehran. Psychological Reports, , 2(10), pp. 49-67.
Borzekowski, D.L. and Bayer, A.M., 2005. Body image and media use among adolescents. Adolescent medicine clin-ics, 16(2), p.289.
Cash, T.F., Phillips, K.A., Santos, M.T. and Hrabosky, J.I., 2004. Measuring “negative body image”: validation of the Body Image Disturbance Questionnaire in a nonclinical popula-tion. Body image, 1(4), pp.363-372.
Garrusi, B., Garousi, S. and Baneshi, M.R., 2013. Body image and body change: predictive factors in an Iranian popula-tion. International journal of preventive medicine, 4(8).
Haas, C.F., 2008. Motivating factors for seeking cosmetic surgery: a synthesis of the literature. Plastic Surgical Nurs-ing, 28(4), pp.177-182.
Hargreaves, D.A. and Tiggemann, M., 2006. ‘Body Image is for Girls’ A Qualitative Study of Boys’ Body Image. Journal of Health Psychology, 11(4), pp.567-576.
Heyes, C.J., 2016. Cosmetic surgery: A feminist primer. Rout-ledge.
Table 4. Summary of results Levene test for equality of variances
Variables FSignifi cance
level
Psychological needs
Autonomy 0.16 0.68
Competence 0.33 0.56
Dependence 0.03 0.86
Perfectionism
Positive 0.58 0.29
Negative 0.17 1.85
Perception of body image
0.74 0.10

BIOSCIENCE BIOTECHNOLOGY RESEARCH COMMUNICATIONS INVESTIGATIONS ON THE RELATIONSHIP BETWEEN PERFECTIONISM AND PSYCHOLOGICAL NEEDS 503
Soodabeh Yavari and Asghar Jafari
Hilhorst, M.T., 2002. Philosophical pitfalls in cosmetic surgery: a case of rhinoplasty during adolescence. Medical humani-ties, 28(2), pp.61-65.
Hwang, Peter H. (2004) Surgical rhinology: recent advances and future directions.” Otolaryngologic Clinics of North Amer-ica 37, no. 2: 489-499.
Johnston, M.M. and Finney, S.J., 2010. Measuring basic needs satisfaction: Evaluating previous research and conducting new psychometric evaluations of the Basic Needs Satisfaction in General Scale. Contemporary Educational Psychology, 35(4), pp.280-296.
McGee, B.J., Hewitt, P.L., Sherry, S.B., Parkin, M. and Flett, G.L., 2005. Perfectionistic self-presentation, body image, and eating disorder symptoms. Body image, 2(1), pp.29-40.
Mulder, R. and Bayer, J., 2007. Trainers’ attitudes towards life-long learning in relation to their competencies and their needs for professional training. In Unpublished paper delivered at the International Conference on HRD Practice and Research across Europe, Oxford. June (pp. 27-29).
Naderi F., Akbari S., Pasha G. 2008 Comparison of body image, body mass index, general health and self-concept among peo-ple who had cosmetic surgery, applicants of cosmetic surgery and ordinary people in Behbahan city. New fi ndings in psy-chology. 2(7): 61-80
Nerini, A., Matera, C. and Stefanile, C., 2014. Psychoso-cial predictors in consideration of cosmetic surgery among women. Aesthetic plastic surgery, 38(2), pp.461-466.
Pearl, A. and Weston, J., 2003. Attitudes of adolescents about cosmetic surgery. Annals of plastic surgery, 50(6), pp.628-630.
Pesa, J.A., Syre, T.R. and Jones, E., 2000. Psychosocial dif-ferences associated with body weight among female adoles-cents: the importance of body image. Journal of Adolescent Health, 26(5), pp.330-337.
Rumsey, N. and Harcourt, D., 2004. Body image and disfi gure-ment: issues and interventions. Body image, 1(1), pp.83-97.
Ryan, R.M. and Deci, E.L., 2000. Intrinsic and extrinsic moti-vations: Classic defi nitions and new directions. Contemporary educational psychology, 25(1), pp.54-67.
Sarwer, D.B., Cash, T.F., Magee, L., Williams, E.F., Thompson, J.K., Roehrig, M., Tantleff-Dunn, S., Agliata, A.K., Wilfl ey, D.E., Ami-don, A.D. and Anderson, D.A., 2005. Female college students and cosmetic surgery: An investigation of experiences, attitudes, and body image. Plastic and reconstructive surgery, 115(3), pp.931-938.
Sarwer, D.B., Crerand, C.E. and Didie, E.R., 2003. Body dys-morphic disorder in cosmetic surgery patients. Facial plastic surgery, 19(01), pp.007-018.
Sheldon, K.M., Elliot, A.J., Kim, Y. and Kasser, T., 2001. What is satisfying about satisfying events? Testing 10 candidate psy-chological needs. Journal of personality and social psychol-ogy, 80(2), p.325.
Slade, P.D. and Owens, R.G., 1998. A dual process model of perfectionism based on reinforcement theory. Behavior modi-fi cation, 22(3), pp.372-390.
Stoeber, J., Harris, R.A. and Moon, P.S., 2007. Perfectionism and the experience of pride, shame, and guilt: Comparing healthy perfectionists, unhealthy perfectionists, and non-perfection-ists. Personality and Individual Differences, 43(1), pp.131-141.
Tavassoli G., Modiri F., 2012. Women’s Tendency toward Cos-metic Surgery in Tehran, Women’s Studies, 10(1), pp 61-80
Von Soest, T., Kvalem, I.L., Roald, H.E. and Skolleborg, K.C., 2009. The effects of cosmetic surgery on body image, self-esteem, and psychological problems. Journal of plastic, recon-structive & Aesthetic Surgery, 62(10), pp.1238-1244.
Webb, J.B., Wood-Barcalow, N.L. and Tylka, T.L., 2015. Assess-ing positive body image: Contemporary approaches and future directions. Body image, 14, pp.130-145.
Weiss, G., 2013. Body images: Embodiment as inter corpo real-ity. Routledge
Wolf, N., 2013. The beauty myth: How images of beauty are used against women. Random House.

Agricultural CommunicationBiosci. Biotech. Res. Comm. 10(3): 504-513 (2017)
Effect of water stress on gland function and some
qualitative traits of commercial cultivars and promising
potato clones
M. Ziachehreh1*, A. Tobeh2, D. Hassanpanah3, Sh. Jamaati4 and Y. Jahani5
1MSc Student of Agronomy, University of Mohaghegh Ardabili, Ardabil, Iran2Associate Professor, Departmant Agronomy, University of Mohaghegh Ardabili, Ardabil, Iran3Assistant Professor Ardabil Agriculture and Natural Resources Research and Education Centre (Moghan), Ardabil, Iran4Young Researchers Club, Ardabil Branch, Islamic Azad University, Ardabil, Iran 5Researcher, Ardabil Agriculture and Natural Resources Research and Education Centre (Moghan), Ardabil, Iran
ABSTRACT
In order to evaluate the effect of water stress on gland function and some of qualitative traits of commercial cultivars and potato clone, the experiment was performed as split-plot design based on randomized complete blocks with 3 replications in agricultural research and education station and natural resources of Ardabil in 2015. In order to determine the tolerance of cultivars and clone against water stress, susceptibility indexes and tolerance against water stress were used. The results of analysis of variance showed that the traits of total gland function, gland protein function, and percentage of dry mat-ter of the gland, under the effect of irrigation levels and all traits of interest, became signifi cant under the main effect of genotype. Also, the interaction of irrigation levels and cultivar was signifi cant for the percentage of the dry matter of the gland. In this study, substituting moderate water stress for normal irrigation lead to about 27% saving on irrigation water consumption. Agria and Marfona cultivars produced highest percentage and function of protein and gland methionine. Clone 397008-9 showed the highest function of total gland and according to GMP, MP, and SSI indexes, had higher toler-ance threshold relative to water stress. Also, Agria and Spirit cultivars had highest percentage of dry matter in severe and moderate water stress, respectively. STI showed signifi cant superiority in identifying resistant genotypes.
KEY WORDS: TOLERANCE INDEX, PROTEIN FUNCTION, DRY MATTER, METHIONINE
504
ARTICLE INFORMATION:
*Corresponding Author: Received 10th June, 2017Accepted after revision 13th Sep, 2017 BBRC Print ISSN: 0974-6455Online ISSN: 2321-4007 CODEN: USA BBRCBA
Thomson Reuters ISI ESC and Crossref Indexed Journal NAAS Journal Score 2017: 4.31 Cosmos IF: 4.006
© A Society of Science and Nature Publication, 2017. All rights reserved.Online Contents Available at: http//www.bbrc.in/DOI: 10.21786/bbrc/10.3/25

Ziachehreh et al.
INTRODUCTION
Potato (Solanum tuberosum L.) is a one-year plant from Solananceae family and after corn, rice, and wheat, is in the fourth place in global scale. In this scale, Iran is in the twelfth place regarding potato production and in the Asia, is in the third place, so that the cultivation area of this product during 92-93 was 159000 hectares (FAQ, 2014). Since the provision of food necessitates maximum utilization of limited resources, therefore, awareness of factors that infl uence the function of each plant and its effect on increased agricultural plants function is very important. Also, its provision is an important factor in increasing the quality and quantity of crops, especially potato. Water stress is one of the most important factors that limits crops production (Passioura, 2007). Numerous studies have shown that potato has high susceptibility to water stress in all stages (Rezazadeh et al., 2015; Shock et al., 2013, Li et al., 2016).
The results of studies by Haghighi et al. (2015) showed that the effect of water stress treatments on gland function is signifi cant and with increased irriga-tion water, the function increases. Water stress has a direct effect on proteinizaton process and water short-age in plant, in addition to hydrolyzing the available proteins, stops synthesis of new proteins (Kazemi, 1994). Since the function of crops under stress condition, due to genotype and environmental effects, is not considered as a suitable benchmark to select genotypes resistant against drought, various indexes are proposed to select plants based on function. In investigating the tolerance of water defi cit under in vitro and in vivo conditions, Hasanpanah (2010), based on MP, GMP, STI, and MSTI, selected Kaiser as the superior cultivar under normal and water stress conditions. Since a major part of lands are under arid and semi-arid conditions and rainfall are decreased in recent years, potato production has been faced by numerous problems. Therefore, accurate analy-sis as well as qualitative and quantitative assessments and determining to tolerance and susceptibility against water in different growth stages constitute one of the most important methods to decrease concerning effects of water defi cit. Therefore, this study aimed to use tol-erance and susceptibility against water stress in farm conditions.
MATERIAL AND METHODS
This study was conducted during 2014-2015 in agri-cultural research and education station and natural resources of Ardabil. Ardabil province has moderate and semi-temperate climate with very cool winters and springs and moderate summers. Average maximum and minimum annual temperature and maximum regional
temperature were 19.8, 15.18, and 21.58, respectively. Also, average rainfall has been reported as 310 mm (Unknown, 2016). Soil properties of the area are pre-sented in Table (1).
The experiment was performed as split-plot design based on randomized complete blocks with 3 replica-tions. Irrigation as the main plot was considered with three levels including provision of 100% water needs (control treatment), moderate water stress, and severe water stress. Also, cultivar was considered as the minor plot at six levels including Agria , Spirit, Marfona , Luca, Hermes, and promising clone. In the autumn of 2014, land preparation operation was performed as deep plowing, disc cutting, and land levelling the farm. At the beginning of May, stacking and plotting operation was performed and glands were cultivated. Treatments were implemented in experimental plots with the area of 22.5 square meter consisted of four 6-meter lines with the distances of 75 cm between two rows and 25 cm between two bushes. To prevent water penetration from adjacent plots, 3 m and 1.5 m were considered between the main plot and the minor plots as margin. To control Colorado beetle pest, confi dorous pesticide (250 ml) was used before fl owering of potato. Also, to prevent whippery, mancozeb was used (1 kg/ha) before fl owering stage. According to the results of soli analysis in the area of interest, 150 kg/ha ammo-nium phosphate was used in two turns (50% while cul-tivation and 50% in gland formation), urea (350 kg/ha) in three turns (25% while cultivation, 50% while emergence, and 25% immediately after gland forma-tion), and potassium sulfate (150 kg) in one turn (cul-tivation). Weed practices were performed in two turns before gland formation in all experimental plots. In Ardabil and neighborhood areas, water stress mainly occurs in July and August and for this reason, the pur-pose is to identify cultivars that are resistant against stress in the fi nal tension of the season. The implemen-tation of irrigation treatments was as follow:
Normal irrigation treatment was initiated one day after gland cultivation (Juan 6) and continued until October, 2 (harvesting) that was accompanied by two irrigations (5-7 days) with providing 100% water needs of the plant. In the plots under this treatment, irrigation times from cultivation to harvesting, included 11 times and water volume and applied water were 10950 and 11638 cubic meter, respectively.
Moderate water stress treatment was initiated one day after gland cultivation (Juan 6) and continued until July, 2 with irrigation period of 5-7 days and provi-sion of 100% water need. Then, the irrigation operation stopped after 15 days (two times of irrigation). After this period, irrigation operation followed normal condition until October, 2 with the provision of 100% water need.
BIOSCIENCE BIOTECHNOLOGY RESEARCH COMMUNICATIONS EFFECT OF WATER STRESS ON GLAND FUNCTION 505

Ziachehreh et al.
Therefore, in the plots of this treatment, the number of irrigations until cultivation was 9 and water volume and applied water were estimated as 8040 and 8728 cubic meter, respectively. Severe water stress was initiated one day after cultivation (Juan 6) and continued until July, 2 with the provision of 100% water need and irrigation period of 5-7 days in normal condition. Then, the irriga-tion operation continued until October, 2 win normal condition and provision of 100% water need. Therefore, in the plots of this treatment, the number of irrigations was 7 and irrigation water and applied water were 6600 and 7288 cubic meter, respectively.
The initiation of irrigation in the farm of interest in climatic condition of Ardabil was estimated based on evaporation of 28 mm water from pan evaporation sur-face (40% humidity discharge of available water). In other words, to estimate water in experimental plots, data related to evaporation from pan evaporation (Class A) were used. Also, Relationship (1) was used to estimate the required water for normal irrigation treatment (pro-vision of 100% required water).
Relationship 1: S × EP × 8/0 = IW
Here, IW is required water (cubic meter), 0.8 is pan coeffi cient (Moradi et al., 2000), EP is evaporation from pan evaporation (mm), and S is the area of experimental plot (square meter). Then, in each irrigation turn, the required water for plots was estimated and directed to the plots of interests. Irrigation operation was performed for all plots until 75 days after cultivation and after that, moderate and severe water stresses were implemented. To measure daily precipitation, rainfall meter device was installed at the pan evaporation and each day in certain time (12 PM), measurements were performed. Compari-son of the water required for each treatment and rainfall has been presented in Table (2).
Harvesting was performed by Octoer, 2. For this pur-pose, by the end of the season, to measure gland func-tion, sampling was done for 2 central row in each plot (5 m) and to remove marginal effects, to marginal rows were removed. Then, the harvested glands from each surface (5 ×1.5m) were weighted and the resulted num-ber was determined as the total gland function at the surface level (hectares). To determine the dry matter per-centage of the glands, fi rst, 10 glands were randomly selected and from each samples, 200g was sliced and after placing them within paper envelopes, they were placed inside the oven for 48h at the temperature of 72 C (Hasanpanah & Hoseinzadeh, 2007). After this period, samples were weighted by digital balance and the dry matter percentage was estimated using Relationship (2):
Relationship 2: dry matter percentage – (gland weight after drying/initial weight of glands) ×100
The multiplication of gland dry matter percentage and gland function has been considered as the gland dry matter function in hectares. To determine the weight of gland protein, Bradford method (1976) was used and to estimate protein function, relationship (3) was used:
Relationship 3: gland function×100/gland protein per-centage – protein function. Also, methionine function (having data related to gland protein percentage and function) was estimated using Relationship (4):Relation-ship 4: methionine function - protein function×gland methionine percentage/100
In this study, after harvesting and estimating geno-types in both stress and normal conditions, fi ve main indexes were used to determine tolerance and suscepti-bility of genotypes against water stress. To defi ne differ-ent indexes, following terms have been used:
Yp: potential function of each genotype in stress-free environment
Ys: potential function of each genotype in stress environment
Yp: average function of all genotypes in stress-free environment
Ys: average function of all genotypes in stress environment
Stress Susceptibility Index (SSI) was proposed by Fischer and Mourer (1978) as follow:
Relationship 5: SSI = [1- (Ys /Yp)] /SI
In this relationship, SI is estimated as follow:
SI =1- (Ys/Yp)
In genotype assessment using SSI, higher value of the index shows genotype susceptibility to stress. Therefore, genotype selection should be based on low SSI values.
Tolerance index (TOL) was defi ned Roseili and Ham-bline (1981) as function disorder in stress and stress-free environments:
Relationship 6: TOL = Yp – Ys
In genotype assessment using this index, higher index value shows susceptibility to stress; therefore, genotype selection should be based on low value of TOL.
Mean Productivity (MP) that was proposed by Ros-ielle and Hamblin (1981) as follow:
Relationship (7): MP = (YS + YP)/2
This index in the mean of genotype utilization in stress and stress-free conditions and selects genotypes that have high function in desirable conditions, but are in undesirable condition in term of function. Therefore,
506 EFFECT OF WATER STRESS ON GLAND FUNCTION BIOSCIENCE BIOTECHNOLOGY RESEARCH COMMUNICATIONS

Ziachehreh et al.
BIOSCIENCE BIOTECHNOLOGY RESEARCH COMMUNICATIONS EFFECT OF WATER STRESS ON GLAND FUNCTION 507
selection based in MP index is effi cient for genotypes with high potential.
Stress tolerance Index (STI) is estimated by Relation-ship (8) and Geometric Mean Productivity (GMP) is esti-mated by Relationship (9):
To perform statistical analyses and data estimations such as analysis of variance, correlation coeffi cient between assessment characteristics, and estimating tolerance indexes, SAS 9.1 was used. Also, to compare means, LSD test at the probability level of 5% was used.
levels and cultivars at the probability levels of 5% and 1% while the interaction of these two factors did not show any signifi cant difference (Table 4). Comparison of total gland function at different irrigation levels showed that normal irrigation treatment has highest function at the surface level (31290 kg/ha). Also, moderate water stress was placed in mutual statistical group and showed a signifi cant difference with severe water stress treat-ment (Table 5).
According to the economic importance of gland function as well as difference in two irrigation rounds between normal irrigation and moderate water stress, it seems that the implementation of moderate water stress in potato farms and replacing it by normal irrigation method, in addition to obtaining suitable total function, leads to relative saving on water consumption. Signifi -cance of the difference between genotypes shows the variety of genetic materials for the trait of interest, so
Table 1. Soil test results at the depth of 0 to 30 cm
Soil texture
Saturated moisture content
Electrical conductivity
pHOrganic carbon
percentage
Total percentage of neutralizing
material
Total nitrogen
percentage
Zinc (mg/kg)
Iron (mg/kg)
Manganese (mg/kg)
Copper (mg/kg)
Absorbable potassium (mg/kg)
Absorbable phosphorus
(mg/kg)
Lumi 43 0.874 0.797 1.03 6.5 0.1 10.1 5.18 16.2 7.52 318 5.8
Table 2. Comparing irrigation water volume of experimental plots
TreatmentIrrigation rounds (day)
Number of irrigations
Irrigation volume (cubic meter/ha)
Rainfall Effective rainfall (cubic meter/ha)
Applied water volume (cubic meter/ha)mm
Cubic meter/ha
Normal irrigation
5-7 11 10950 86 860 688 11638
Moderate stress
5-7 9 8040 86 860688
8728
Severe stress
5-7 7 6600 86 860688
7288
Table 3. Rainfall statistics of the area in 2015
Month Rainfall (mm) Month Rainfall (mm)April 35.7 October 58.3
May 26.5 November 46.6
Juan 7 December 13.9
July 3.6 January 6.4
August 0 February 24.9
September 48.9 March 36.7
RESULTS AND DISCUSSION
TOTAL GLAND FUNCTION
The results of analysis of variance for this trait showed that there is a signifi cant difference between irrigation
that the promising clone 397008-9 with including Agria, Spirit, Marfona, Luca, and Hermes shows the highest gland function mean and signifi cant different with other cultivars. Also, Spirit and Hermes cultivars produced minimum total mean of gland function (Table 6).
Correlation coeffi cient table showed that total gland function has a positive and signifi cant correlation with most of traits (Table 8). In moderate and severe water stress, a signifi cant and positive correlation was observed between total gland function and gland protein function (Tables 9 and 10). Also, a signifi cant and posi-tive correlation was observed between gland dry matter and total gland function under moderate water stress. Also, in moderate water stress, MP and GMP, in addition to having signifi cant and positive correlation with each other, showed the same correlation with STI (Table 11).

Ziachehreh et al.
508 EFFECT OF WATER STRESS ON GLAND FUNCTION BIOSCIENCE BIOTECHNOLOGY RESEARCH COMMUNICATIONS
Table 4. Square mean of traits in potato cultivars and irrigation levels
Change sourcesDegree of freedom
Total gland function
Gland protein
percentage
Gland protein function
Gland dry matter
percentage
Gland dry matter
function
Gland methionine
valueReplication 2 206.37 0.0003 2959.44 0.69 8.72 0.002
Irrigation levels 2 118.34* 0.00794** 619.92** 22.14** 1.02ns 0.00032ns
False 4 31.94 0.00017 330.04 0.43 1.11 0.002
Genotype 5 316.87** 0.01003** 4471.16** 26.32** 18.82** 0.032**
Cultivars × irrigation levels
10 35.83ns 0.00014ns 471.88ns 3.46** 1.36ns 0.001ns
False 30 41.15 0.0002 584.72 0.53 1.44 0.003
Change percentage (%)
22.59 3.99 23.38 3.75 21.59 29.10
Table 5. Comparing the mean of irrigation levels on some of potato traits
Gland total function (kg/ha)
Gland protein percentage (%)
Gland protein function (kg/ha)
Irrigation levels
a31290
b3.4b190.01Normal irrigation
ab27590a3.76a205.71Moderate stress
b26320a3.7b192.14Severe stress
Table 6. Comparing the mean of cultivar on some of potato traits
Gland function (kg/ha)
Gland protein percentage
(%)
Gland protein function (kg/ha)
Gland dry matter function
(kg/ha)
Gland methionine
(microgram/mg)Cultivars
a29647a4a253.21a6240a0.25Agria
a32403a4a252.46a6930a0.25Marfona
a33100b3.6a230.81a6370b0.16Luca
b22790d3.2b146.65b3900b0.12Spirit
b19303c3.4b119.95b3540b0.14Hermes
a33110b3.6a229.21a6360a0.23Clone 379008-9
In severe water stress, MP and GMP showed a signifi -cant and positive correlation at the probability level of 5% with STI and under these circumstances and proba-bility level of 1%, a signifi cant and positive relationship was observed between MP and GMP (Table 12). Accord-ing to the table of simple coeffi cients between indexes, correlation between potential function and stress in moderate stress (r=0.893) and severe stress (r=0.937) was signifi cant (Table 13 and 14). The function of genotypes in stress-free environment showed a positive correlation with STI, MP, and GMP. Also, correlation between the function of genotypes under moderate water stress and STI, MP, and GMP as well as under severe water stress with STI, MP, GMP, and TOL was positive. High correla-tion between STI and genotype function in stress and stress-free environments shows superiority of this index relative to the indexes of interest in the assessment of
genetic variety and screening tolerant genotypes as well as estimation of function resistance. Maralian et al. (2014) investigated the effect of low irrigation of gland function of different potato genotypes and found that 60% provision of water leads to decreased gland func-tion of potato genotypes from 754 g to 640 g (17.7%).
GLAND PROTEIN PERCENTAGE
The results of analysis of variance showed that there is a signifi cant difference between different irrigation levels and cultivars at the probability level of 1% while no signifi cant difference was observed in the interaction of these two factors for the traits of interest (Table 4). Comparing gland protein percentage at irrigation levels showed that moderate and severe water stress treatment have highest mean of gland protein percentage and

Ziachehreh et al.
BIOSCIENCE BIOTECHNOLOGY RESEARCH COMMUNICATIONS EFFECT OF WATER STRESS ON GLAND FUNCTION 509
showed a signifi cant difference with normal irrigation (Table 5). It seems that high values of protein in water stress treatments is the result of low gland function. Sig-nifi cance of the difference between genotypes showed genetic variation for traits, so that Agria and marfona cultivars showed highest percentage of gland protein (4%) and signifi cant difference with other cultivars. Also, the lowest gland protein percentage mean belonged to Spirit (Table 6). Correlation coeffi cients between assess-ment characteristics in normal irrigation showed that protein percentage has a signifi cant and positive cor-relation with most of traits (Table 8). Also, although no positive and signifi cant correlation was observed with other traits, under severe water stress, methionine level and gland dry matter percentage showed signifi cant and positive correlation at the probability levels of 1% and 5% with traits (Tables 9 and 10). With increased water stress severity, protein percentage increases; therefore, change in protein structure or its destruction is one of the metabolic stages that may be infl uenced by water stress (Ommen, 1999).
GLAND PROTEIN FUNCTION
The results of analysis of variance for this trait showed that there is a signifi cant relationship between irriga-tion levels and cultivars at the probability level of 1% while no signifi cant relationship was observed in the interaction between these factors (Table 4). According to the comparison between protein function mean at the
irrigation level, moderate water stress showed the high-est gland protein function (205.71 kg/ha) and showed a signifi cant difference with normal irrigation and severe water stress. Lowest gland protein function was observed under normal irrigation condition and severe water stress (Table 5). In other words, by replacing moderate water stress with normal irrigation, about 27% of water consumption was saved. Signifi cant difference between genotypes showed genetic variety between cultivars. Comparing the effect of genotype on gland protein function showed that the highest mean of gland protein function is related to Agria , Marfona , Luca, and prom-ising clone 379008-9. Lowest mean of protein function at the surface level belonged to Spirit and Hermes (Table 6). Correlation coeffi cient table about traits in normal irrigation showed that gland protein function has a sig-nifi cant and positive relationship with most of traits (Table 8). Also, under moderate and severe stress condi-tions, signifi cant and positive correlation was observed between this trait and gland function. Moreover, the trait and gland dry matter function in moderate and severe water stress conditions showed signifi cant and positive correlation at the probability levels of 5% and 1% (Tables 9 and 10).
GLAND DRY MATTER PERCENTAGE
The results of analysis of variance showed that there is a signifi cant different between different moisture con-tents, cultivars, and interaction between irrigation lev-
Table 7. Gland dry matter percentage of potato cultivars at different irrigation levels
AgriaMarfonaSpiritLucaHermesClone
397008-9Irrigation treatments
abc19.76bcd18.65bcd16.82bcd16.67bcd16.25bcd19Normal irrigation
ab21.42ab20.59a21.75bcd17.34bcd19.02bcd18.85Moderate water stress
a22.88bcd19.19bcd19.54bcd17.32bcd19.57bcd19.86Severe water stress
Table 8. Correlation coeffi cient between traits in normal irrigation conditions
Gland total
function
Gland dry matter
percentage
Gland dry matter
function
Protein percentage
Protein function
Methionine level
-Gland function
0.79*-Gland dry matter percentage
0.97**0.90**-Gland dry matter function
0.96**0.91**0.96**-Protein percentage
0.94**0.80*0.94**0.96**-Protein function
0.78*0.99**0.90**0.920.81*-Methionine
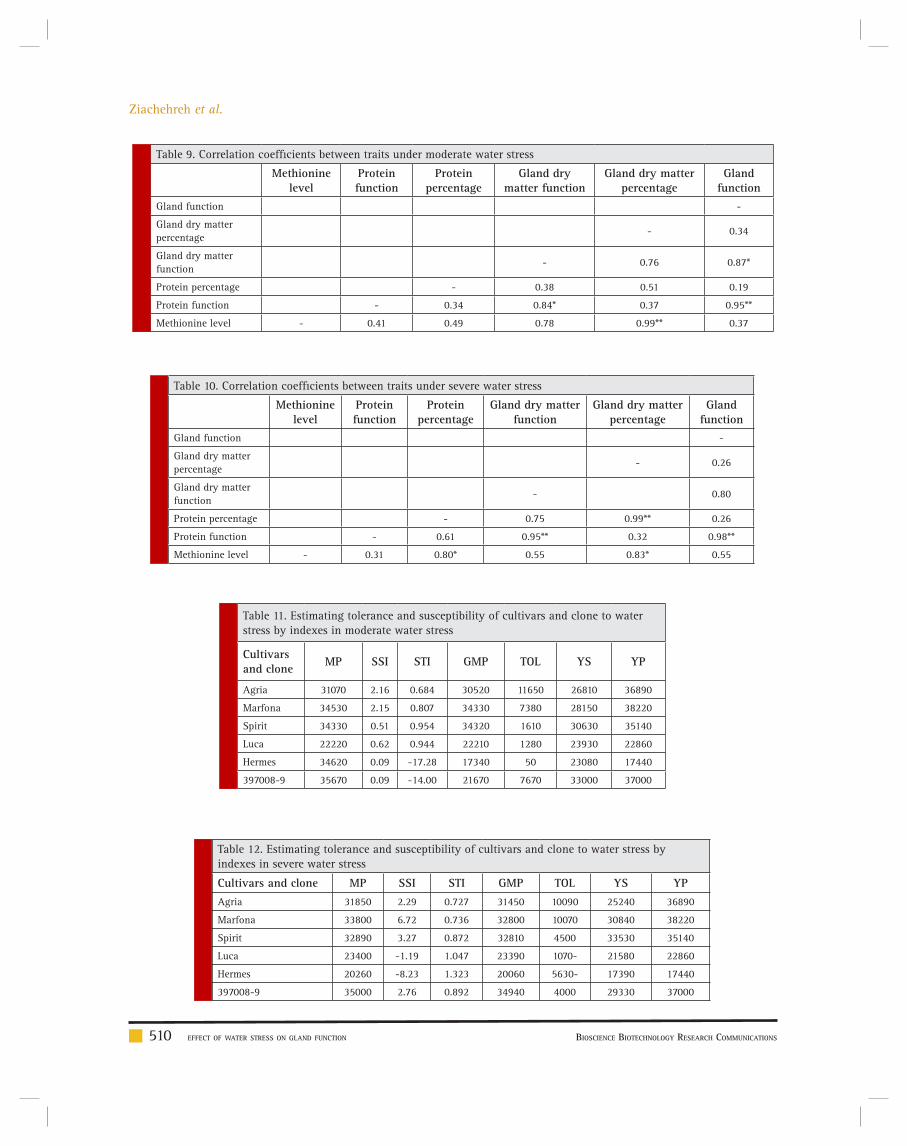
Ziachehreh et al.
510 EFFECT OF WATER STRESS ON GLAND FUNCTION BIOSCIENCE BIOTECHNOLOGY RESEARCH COMMUNICATIONS
Table 9. Correlation coeffi cients between traits under moderate water stress
Gland function
Gland dry matter percentage
Gland dry matter function
Protein percentage
Protein function
Methionine level
-Gland function
0.34-Gland dry matter percentage
0.87*0.76-Gland dry matter function
0.190.510.38-Protein percentage
0.95**0.370.84*0.34-Protein function
0.370.99**0.780.490.41-Methionine level
Table 10. Correlation coeffi cients between traits under severe water stress
Gland function
Gland dry matter percentage
Gland dry matter function
Protein percentage
Protein function
Methionine level
-Gland function
0.26-Gland dry matter percentage
0.80-Gland dry matter function
0.260.99**0.75-Protein percentage
0.98**0.320.95**0.61-Protein function
0.550.83*0.550.80*0.31-Methionine level
Table 11. Estimating tolerance and susceptibility of cultivars and clone to water stress by indexes in moderate water stress
YPYSTOLGMPSTISSIMPCultivars and clone
368902681011650305200.6842.1631070Agria
38220281507380343300.8072.1534530Marfona
35140306301610343200.9540.5134330Spirit
22860239301280222100.9440.6222220Luca
17440230805017340-17.280.0934620Hermes
3700033000767021670-14.000.0935670397008-9
Table 12. Estimating tolerance and susceptibility of cultivars and clone to water stress by indexes in severe water stress
YPYSTOLGMPSTISSIMPCultivars and clone
368902524010090314500.7272.2931850Agria
382203084010070328000.7366.7233800Marfona
35140335304500328100.8723.2732890Spirit
22860215801070-233901.047-1.1923400Luca
17440173905630-200601.323-8.2320260Hermes
37000293304000349400.8922.7635000397008-9

Ziachehreh et al.
BIOSCIENCE BIOTECHNOLOGY RESEARCH COMMUNICATIONS EFFECT OF WATER STRESS ON GLAND FUNCTION 511
Table 13. Correlation coeffi cients between susceptibility indexes and tolerance to drought and function in moderate water stress
YP YS TOL GMP STI SSI MP
YP 1
YS 0.893 1
TOL -0.051 -0.496 1
GMP 0.964 0.980 -0.315 1
STI 0.952 0.988 -0.353 0.999* 1
SSI 0.319 -0.712 0.963 -0.559* -0.593 1
MP 0.969 0.977 -0.297 1* 0.998* -0.544 1
Table 14. Correlation coeffi cient between susceptibility indexes and tolerance to drought and function in severe water stress
YP YS TOL GMP STI SSI MP
YP 1
YS 0.937 1
TOL -0.528 0.792 1
GMP 0.973 0.992 -0.710 1
STI 0.960 0.997* -0.745 0.999* 1
SSI 0.289 -0.972 0.912 -0.936** -0.953* 1
MP 0.978 0.989 0.695 1** 0.997* -0.928 1
els and cultivars at the probability level of 1% (Table 4). Comparing the effect of irrigation levels on gland dry matter percentage showed that the highest mean of gland dry matter is related to moderate and severe water stress conditions and these treatments were at the high-est level of statistical group and showed a signifi cant difference with normal irrigation treatment (Table 5). It seems that increased dry matter percentage of potato under water stress is resulted from low level of gland function. According to considering water stress treat-ments in the same group and necessity for savings on water consumption, moderate water stress is recom-mended for nutritional goals and potato processing (chips, franchise, etc.). Signifi cant difference between genotypes showed the existence of genetic variation between cultivars. Comparing the effect of this cultivar on this trait showed that Agria and Spirit have the high-est mean of gland dry matter and showed a signifi cant difference compared with other cultivars. Hermes with the lowest mean of gland dry matter was at the lowest position of the statistical group (Table 6).
Comparing the mean of interaction between irrigation levels and cultivar for this trait showed that Agria and Spirit have the highest percentage of gland dry matter under severe (22.8%) and moderate (21.75%) water stress conditions and it seems that it can be used as a suitable mixture to produce fried products and use in process-ing industry to save water consumption in agriculture.
Correlation coeffi cient table showed that gland dry mat-ter percentage has a signifi cant and positive correlation with most of traits (Table 8). Also, this trait under mod-erate water stress showed a signifi cant and positive cor-relation with methionine level and under severe stress condition, showed a signifi cant and positive correlation with methionine and gland protein percentage (Tables 9 and 10).
GLAND DRY MATTER FUNCTION
The results of analysis of variance for this trait showed that there is a signifi cant difference between cultivars at the probability level of 1% while irrigation levels and interaction between these factors did not show any signifi cant difference (Table 4). Signifi cant difference between genotypes shows the variety of genetic sub-stance of cultivars for the trait. Comparing the effect of cultivar on this trait showed that Marfona wit Luca, clone 397008-9, and Agria have the highest gland dry function mean and showed a signifi cant difference with other cultivars. In this study, Spirit and Hermes showed the lowest mean of gland dry matter function at the sur-face level (Table 6). Correlation coeffi cient table between traits in normal irrigation condition showed that gland dry matter percentage has a signifi cant and positive correlation with most of traits (Table 8). Also, this trait under moderate water stress showed a signifi cant and

Ziachehreh et al.
512 EFFECT OF WATER STRESS ON GLAND FUNCTION BIOSCIENCE BIOTECHNOLOGY RESEARCH COMMUNICATIONS
positive correlation with gland and protein function (Tables 9 and 10). The results of studies by Kumar et al. (2007) with different irrigation treatments showed that increased water stress decreases gland dry matter func-tion.
GLAND METHIONINE LEVEL
Analysis of variance for the trait of interest showed that there is not any signifi cant difference between different irrigation levels and interaction between irrigation and cultivar levels while cultivars for this trait showed a sig-nifi cant difference at the probability level of 1% (Table 4). Signifi cant difference between genotypes showed the variety of genetic substances for the trait of interest. Comparing the mean of the effect of cultivar on this trait showed that the highest methionine level belongs to Agria , Marfona , and clone 3977008-9 and showed a signifi cant difference with other cultivars. Luca, Hermes, and Spirit produced lowest level of gland methionine (Table 6). Correlation coeffi cient table between traits in normal irrigation condition showed that gland methio-nine has a signifi cant and positive correlation with most of traits (Table 8). Also, this trait, under moderate water stress, showed a signifi cant and positive correla-tion with gland dry matter percentage and under severe water stress, showed a signifi cant and positive correla-tion with gland dry matter percentage and gland protein percentage (Tables 9 and 10). Muttucumaru et al. (2015) by investigating 5 cultivars of potato resistant and sus-ceptible to drought found out that cultivars were signifi -cantly different in terms of methionine concentration. Also, methionine concentration of cultivars resistant to drought is higher than cases sensitive to drought.
CONCLUSION
Moderate water stress lead to the production of suitable gland function. Also, the highest percentage of gland pro-tein (3.76%), gland protein function, and highest dry mat-ter percentage (19.83) belonged to this treatment. There-fore, due to the economic importance of gland function and decreased levels of water consumption (2910 cubic meter) compared with normal treatment, the implemen-tation of moderate stress and replacing it with normal irrigation seems more economic. Agria and Marfona produced the highest protein percentage (4%) and gland methionine. Also, Agria and Spirit in severe (22.88%) and moderate (21.75%) water stress conditions showed high-est gland dry matter percentage and it seems that it can be introduced as a suitable treatment. The highest values of gland protein function belonged to Agria and Mar-fona . Clone 397008-9 produced the highest gland func-tion mean ((33100 kg/ha) and according to MP indexes
(severe and moderate water stress), SSI (moderate water stress), and GMP (severe water stress) showed higher tol-erance compared with water stress and it can be used for commercial purposes. High correlation between STI and genotype functions in stress and stress-free environments showed the superiority of this index in screening tolerant genotypes and function tolerance estimation.
REFERENCES
Ahmadi, R. (1996). Determining water consumption of potato. Final report of agricultural research and education station and natural resources of Ardabil.
Unknown. (2016). Meteorological statistics and information of Ardabil.
Hasanpanah, D., Hoseinzadeh, A. (2007). Methodology and assessment of sources resistant against drought in potato cul-tivars. Final report of agricultural research and education sta-tion and natural resources of Ardabil.
Haghighi, B., Boroomand, S., Naseri, A. (2015). The effect of irrigation on the function of some qualitative and quantitative characteristics of potato cultivars. Journal of plant physiologi-cal studies, Islamic Azad University of Ahwaz, 7 (28): 45-60.
Kazemi, H. (1994). Diligence principles, Tabriz University Pub-lications.
Bradford, M.M. 1976. A rapid and sensitive method for the quantitation of microgram quantities of protein utilizing the principle of protein-dye binding. Anal Biochem. 72: 248-254.
FAO. 2014. FAOSTAT database for agriculture. Available online at: http://faostat3.fao.org/faostat-gateway/go/to/download/Q/QC/E.
Fischer, R.A., and Mourer, R. 1978. Drought resistance in spring wheat cultivar. I: Grain yield responses. Australian Journal of Agricultural Research. 29: 897-912.
Hassanpanah, D. 2010a. Evaluation of potato advanced cul-tivars against water defi cit stress under in vitro and in vivo condition. Biotechnology. 92: 164-169.
Hassanpanah, D. 2010b. Effects of water defi cit and potassium humate on tuber yield and yield components of potato culti-vars in Ardabil region, Iran. Research Journal of Environment Science. 3: 351-356.
Kumar, R., Kang, G.S., and Pandey, S.K. 2007. Inheritance of resistance to late blight (Phytophthora infestans) in potato. Euphytica 155:183–191.
Li, W., Xiong, B., Wang, S., Deng, X., Yin, L., and Li, H. 2016. Regulation Effects of Water and Nitrogen on the Source-Sink Relationship in Potato during the Tuber Bulking Stage. PLoS ONE journal. 11: 1-18.
Moradi Dalini, A., Nishabori, M., Jahanbakhsh Asl, S., and Jafarzade, A. 2000. Determination and Evaluation of Pan Coef-fi cient Class a in Different Condition, Journal of soil & Water Sci., 14 (2), pp. 164-175.
Muttucumaru, N., Powers, S.J., Elmore, J.S., Mottram, D.S., and Halford, N.G. 2015. Effects of Water Availability on Free
Ziachehreh et al.
BIOSCIENCE BIOTECHNOLOGY RESEARCH COMMUNICATIONS EFFECT OF WATER STRESS ON GLAND FUNCTION 513
Amino Acids, Sugars, and Acrylamide-Forming Potential in Potato. Journal of Agricultural and Food Chemistry. 63: 2566-2575.
Ommen, O.E. 1999. Chlorophyll content of spring wheat fl ag leaves grown under elevated CO2 concentration and other environment stress within the ESPACE-wheat project. Euro-pean Journal of Agronomy. 10: 197-203.
Passioura, J.B. 2007. The drought environment: physical, bio-logical and agricultural perspectives. Journal of Experimental Botany. 58: 113-117.
Rezazadeh, A., Najafi Mood, M.H., Ramezani, Y., and Naghavi, H. 2015. Infl uence of irrigation method, drought stress, and fertilizer type on yield and yield components of potato . Applied Science Reports. 2: 134-142.
Rosielle, A.A., and Hamblin, J. 1981. Theoretical aspects of selection for yield in stress and nonstress environments. Crop Science. 21: 943-946.
Shock, C.C., Shock, B.M., and Welch, T. 2013. Strategies for Effi cient Irrigation Water Use. Sustainable Agriculture Tech-niques, Oregon State University.

Biotechnological CommunicationBiosci. Biotech. Res. Comm. 10(3): 514-517 (2017)
Interleukin-17 concentration as a biomarker in diagnosis
of exudative pleural effusion compared with benign
pleural effusion
Ali Arian Nia*1 and Saeid Mehrabi2
1Clinical Research Development Unit (CRDU) Golestan University of Medical Sciences Gorgan Iran 2MD Golestan University of Medical Sciences Gorgan Iran
ABSTRACT
Pleural effusion is one of signs and complications resulting from malignant disease such as lung and breast cancer, and also tuberculosis and infective lung disease by cytological analysis of pleural fl uid we can use of tumor marker and other biomarkers to better diagnose malignant pleural effusion.in this study we examined the concentration of interleukin-17 in pleural fl uid with causes of exudative pleural effusion in the patients referred to hospital of 2015-2016.This is a descriptive-analytical and case-control study and 130 patients with exudative pleural effusion were enrolled in the study after an informed consent samples collected from the patients divide into two main group including 88 patients with malignant pleural effusion and 42 patient with benign effusion. in the next step by using of the same previous pleural fl uid samples, the concentration of interleukin-17 was measured with ELISA by specifi c kit after entering to computer through SPSS-18 statistical software, description of data was done into frequency and percentage.Interleukin-17 concentration was (69.73±64.58) in patients with malignant causes and (55.32±43.60) in benign causes.The results showed that this differ-ent was statistically signifi cant (P=0.02) and interleukin -17 rate, is higher in the malignant pleural effusion.According to higher levels of interleukin-17 in malignant pleural effusion maybe we can achieve important result in differentiating between malignant and non-malignant pleural exudate, without the need for invasive procedures, by putting together the clinical symptoms, the interleukin-17 concentration in pleural fl uid and pleural fl uid cytology results.
KEY WORDS: INTERLEUKIN-17, EXUDATIVE PLEURAL EFFUSION, MALIGNANT PLEURAL EFFUSION, BENIGN PLEURAL EFFUSION, BIOMARKER
514
ARTICLE INFORMATION:
*Corresponding Author: [email protected] 27th Nov, 2017Accepted after revision 26th Sep, 2017 BBRC Print ISSN: 0974-6455Online ISSN: 2321-4007 CODEN: USA BBRCBA
Thomson Reuters ISI ESC and Crossref Indexed Journal NAAS Journal Score 2017: 4.31 Cosmos IF: 4.006
© A Society of Science and Nature Publication, 2017. All rights reserved.Online Contents Available at: http//www.bbrc.in/DOI: 10.21786/bbrc/10.3/26

Ali Arian Nia and Saeid Mehrabi
INTRODUCTION
Pleural effusion is an excessive accumulation of fl uid in the pleural space, which affects annually about one million people around the world. There are a range of causes for the disease; benign diseases such as infec-tions, heart and liver failures, rheumatic diseases and drugs on the one hand and fatal cancers of lung and other visceral organs on the other hand are placed in this spectrum (Esther et al 1997).
Plain chest pleurography is a simple diagnostic meas-ure to detect pleural effusion, which appears as fl at-tening and displacement between costophrenic angles. With the presence of less fl uid or abnormal localiza-tion, ultrasound or CT scan can be used to conduct pleu-ral tap (Heffner et al 1997, Light et al 1972, Ryland et al1998). Cytologic analysis of pleural fl uid is the most common method for diagnosis of malignancy; while the specifi city of cytologic fi ndings is 100%, unfortunately only about 60% of malignant effusions can be detected through this technique (Alema’n et al 2010). For undi-agnosed exudative effusions with suspicion of malig-nancy but negative cytology, more invasive approaches are necessary (Hooper et al 2010 Chun Hua et al., 2017).
Closed pleural biopsy has less additional diagnostic value and thoracoscopy is the preferred method, since it is diagnostic in 90% of patients (Light 2006, Roberts 2010 and Neragi-Miandoab 2006). However, there is no possibility of access to this invasive procedure in all centers. Many investigations have assessed the ability of tumor markers and other biomarkers to improve the diagnosis of MPE (Botana-Rial et al 2011, Kremer et al 2010).The combined use of different markers has also been proposed in some studies ( Kremer et al 2010, 2013).
Unfortunately, none of these markers has shown the sensitivity and specifi city enough to select as a diagnos-tic marker of MPE (Hooper et al 2010). In a study, a type of chemical safety approach has been used to search for non-invasive markers of lung cancer in PE (Porcel et al 2004). In this regard, several chemical biomark-ers of infl ammation were found that were differentially expressed in MPE vs. BPE. Among these biomarkers, IL-17 and CEA were expressed at higher quantities in MPE than BPE. Interleukin 17 is a potential infl amma-tory cytokine produced by Th17 cells; it is expected to be used as a marker for the diagnosis of pleural effusion. The aim of this study is to determine the concentra-tion of IL-17 in pleural fl uid to facilitate differentiation between MPE and BPE.
MATERIALS AND METHODS
The Deputy of Science and Technology of Golestan Uni-versity of Medical Sciences and Research Ethics Com-
mittee approved study design and implementation pro-tocol. All actions taken, had no physical, psychological or fi nancial losses for the participants in the research. This descriptive and analytical study was performed on 130 patients with exudative pleural effusion who were admitted to Shahid Sayyad Shirazi Teaching Hospital in Gorgan during 2015-2016, and enrolled in the study after obtaining informed consent.Routine diagnostic procedures such as X-ray, CT scan and ultrasound, if necessary, were performed for all patients before start-ing the study. After history taking and exact physical examination, thoracentesis was carried out to prepare pleural fl uid samples that were frozen at -20°C after cen-trifugation for 15 min.
The samples were analyzed for biochemical proper-ties, pH, glucose and proteins; accordingly, exudative pleural effusion was differentiated from transudative type and patients with transudative pleural effusion were excluded from the study. Malignancy of pleural effusion was diagnosed according to our and previous studies using VATS technique; such that, after insert-ing VATS instruments through 1 to 2 incisions and after viewing the parietal and visceral pleura as well as evi-dence of metastases, biopsy was performed from the parietal pleura and pleural fl uid for cytology testing. The samples were sent to the pathology laboratory for detecting malignancy and its type.
In terms of etiology and based on the fi ndings of the gold standard of pleural fl uid analysis (microbiology and cytology testing, including cell differential count), exudative pleural effusion were classifi ed into two main MPE and BPE groups. According to previous studies, since between 40 and 50 percent of the cases showed malignant exudative pleural effusion, so the samples were divided almost with the same proportion. At a later stage, by using the same previous pleural fl uid samples, the IL-17 levels were measured via ELISA kit accord-ing to the manufacturer’s protocol and the samples were stored at -80°C until testing.Having pleural effusion dis-ease was inclusion criterion. Exclusion criteria included transudative pleural effusion, diabetes, autoimmune dis-eases and rheumatic diseases.
Data were analyzed using statistical SPSS V.18 soft-ware. Normal distribution and data homogeneity were assessed using the Kolmogorov-Smirnov test.
In addition, the mean IL-17 level was compared between the two groups using independent t-test. Mann-Whitney test was applied for normal distribution of IL-17 concentration. Signifi cance level of the tests was 0.05.
RESULTS AND DISCUSSION
After examining, 130 patients were divided into two groups of malignant pleural effusion (n=88, 67.7%) and
BIOSCIENCE BIOTECHNOLOGY RESEARCH COMMUNICATIONS INTERLEUKIN-17 CONCENTRATION AS A BIOMARKER IN DIAGNOSIS OF EXUDATIVE PLEURAL EFFUSION 515

Ali Arian Nia and Saeid Mehrabi
benign pleural effusion (n=42, 32.3%) with a mean age of 57 and 59 years respectively. There was no statistically signifi cant difference between IL-17 level and age of the patients. The patients in MPE group included 44 males (50%) and 44 females (50%), but the patients in BPE group consisted of 26 males (61.9%) and 16 females (38.1%).
In the MPE and BPE groups, 41 and 21 people were smokers respectively. Among the patients in MPE group, 22 (25%) had primary lung cancer, 31 (35.2%) secondary breast cancer, 11 (12.5%) secondary esophageal cancer, 11 (12.5%) metastatic cancer and 13 (14.77 %) secondary stomach cancer.
The IL-17 level was 36.43±56.719 in males and 74.838±76.42 in females; and as a result of statistical analysis, no signifi cant difference was observed for IL-17 levels in pleural fl uid between males and female. Analysis of the mean pleural fl uid protein levels was respectively 4373.8± 419.3 mg and 4411.7 ± 493 mg in the patients of MPE and BPE groups. There was a correlation between IL-17 and pleural fl uid protein levels, but it was not statistically signifi cant (r = 0.15). The mean IL-17 level was compared in smokers and nonsmokers, and statisti-cal analysis showed no signifi cant difference (P = 0.35). The results showed that 66 patients (50.8%) had a history of previous malignancy; 31 (46.97%) secondary to breast cancer, 11 (16.67%) secondary to esophageal cancer, 11 (16.67%) secondary to metastasis due to other causes and 13 (19.7%) secondary to stomach cancer had experienced MPE, and the mean IL-17 level was 63.9±36.6 in these subjects. In people who had no history of previous malig-nancy, including 22 (34.38%) with primary lung cancer and 42 (65.63%) with TB (totally 64 patients, 49.2%), the mean IL-17 level was 66.2 ± 75.5 in these people. Con-sidering the higher mean IL-17 level in the group with no history of previous malignancy compared with the fi rst group as well as P= 0.001, no statistically signifi -cant difference was observed for IL-17 levels between the two groups. The IL-17 level in pleural fl uid of patients with MPE and BPE was respectively 69.73± 64.58 and 55.32±43.60; there was a statistically signifi cant differ-ence between the two groups (P = 0.02).
Differentiating between benign pleural effusion (BPE) and malignant pleural effusion (MPE) has remained controversial as a diagnostic issue. The majority of malignant pleural effusion (90% to 97%) is exudative type that occurs because of pleural membrane damage (Esther et al 1997). MPE can be seen as a complication in most malignancies, particularly in breast and lung cancer, while lung infections and tuberculosis cause the development of BPE.The gold standard for diagnosis of malignant pleural effusion is clinically the presence of malignant cells in pleural cells. Diffi culty in differentiat-ing between malignant and benign is the negative result of malignant cells in pleural fl uid cytology. In these cir-
cumstances, differentiation from benign is problematic and the need for invasive measures such as thoracentesis is essential for the patient.
Closed pleural biopsy has less additional diagnostic value and thoracoscopy is the preferred method, since it is diagnostic in 90% of patients. However, there is no possibility of access to this invasive procedure in all centers. According to this issue, 130 patients with exu-dative pleural effusions were examined in this study. In the present study, 88 patients with malignant pleural effusion were compared with 42 patients with benign pleural effusion in terms of pleural fl uid levels of IL-17. The patients were also evaluated for age, gender, his-tory of previous cancer, smoking and pleural fl uid pro-tein levels. The mean age of subjects was close to each other in two age groups and no signifi cant difference was found between the two groups. In addition, there was no statistically signifi cant difference between IL-17 level and age of the patients.
In 2014, Chun Hua et al. examined a new biomark-ers of interleukin 17 among 123 patients with exuda-tive pleural effusion to determine the causes of pleural effusion. They showed that IL-17 level was signifi cantly higher in MPE group compared with BPE group, similar to our results, and also stated that IL-17 can be used as a biomarker to differentiate MPE from BPE.
Since only one study has so far examined the level of IL-17 in pleural fl uid, in addition to our study; so in the following discussion, we will consider similar studies closer to the present study, (Chun Hua et al., 2017).
Wang et al. in 2013 examined the levels of superox-ide dismutase (SOD) in TPE and MPE, which was mark-edly higher in the TPE than the MPE. The results showed that SOD is not a suitable biomarker for these two types of pleural effusion (Xin-Feng Wang et al, 2013) In 2014, Chun Hua et al. examined serum levels of IL-17 in 128 patients with Non-small cell lung cancer (NSCLC). The results showed that higher levels of IL-17 in NSCLC group compared with the control group, which can be applied as diagnostic and prognostic value in patients with NSCLC.
Many studies have been conducted in the fi eld of diagnostic value of cytology and the diagnostic value for diagnosing malignancies have been reported up to 70% in Iran. More invasive procedures such as biopsy, thoracoscopy or thoracotomy despite high sensitivity are not accepted through patients and physicians for diagnosis of tuberculosis and malignancies.
Therefore, researches in recent decades have led to fi nd markers in pleural effusion and blood plasma to dif-ferentiate between tuberculosis and malignancies with-out invasion and with high-value and effectiveness of diagnosis and differentiation.
So far, only one study has examined the level of IL-17 in pleural effusion and high sensitivity has been
516 INTERLEUKIN-17 CONCENTRATION AS A BIOMARKER IN DIAGNOSIS OF EXUDATIVE PLEURAL EFFUSION BIOSCIENCE BIOTECHNOLOGY RESEARCH COMMUNICATIONS

BIOSCIENCE BIOTECHNOLOGY RESEARCH COMMUNICATIONS INTERLEUKIN-17 CONCENTRATION AS A BIOMARKER IN DIAGNOSIS OF EXUDATIVE PLEURAL EFFUSION 517
Ali Arian Nia and Saeid Mehrabi
able to differentiate MPE than BPE. Like what mentioned above, other studies have been done on other biomark-ers that some of them have been useful for the study. In our study, according to the signifi cant differences for IL-17 levels in the two groups, its usability can be seen to differentiate between MPE and BPE. In addition, since the patients with primary lung cancer were in the group with no history of previous malignancy and the mean IL-17 was higher in these patients than in patients with secondary cancer as well as than TB, so signifi cant dif-ference was found between the two groups regarding history of previous cancer, though given limited studies done in this area and the lack of defi ned cut-off points, it defi nitely cannot be used as the only reference and diagnostic methods. Nevertheless, due to the apparent signifi cant difference between the two groups, there is the possibility of using IL-17 beside other methods for differentiating malignant from benign diseases.
CONCLUSION
The results obtained from the present study demon-strated that age, gender, smoking, history of previous cancer and pleural effusion protein levels have no sig-nifi cant effect on IL-17 level. The IL-17 level was signif-icantly higher in pleural effusion caused by malignant diseases than in exudative pleural effusion caused by benign diseases, especially tuberculosis.
Since the differentiation between malignant pleural effusion and benign pleural effusion, especially tuber-culosis, sometimes needs to invasive procedures such as pleural biopsy or thoracoscopy, so it can be concluded that the IL-17 level regarding the signifi cant difference can be used as a diagnostic approach in differentiating between the two types of pleural effusion.
It is recommended that the similar study should be conducted in different centers with larger sample size, as well as a variety of malignant and benign diseases can be studied separately.
REFERENCES
Alema’n C, Sa’nchez L, Alegren J, Ruiz E, Va’ zquez A, Soriano T. 2010 The value of diagnostic procedures. QJM 100:351-359
Botana-Rial M, Casado-Rey P, Leiro-Ferna’ndez V, Andrade-Olivie’ M, Represas-Represas C, Ferna’ndez-viller A. 2011 Validity of procalcitonin and Creative Protein measurement when differentiating between benign and malignant pleural effusion. Clin Lab 57: 373-8.
Chunhua L, Huang Jian, Shen Fangrong, Huang Haitao, and Zhang Guangbo 2017 Th1 high in tumor micro-environment is an indicator of poor prognosis for patients with NSCLC Oncotarget. 2017 Feb 21; 8(8): 13116–13125.
Esther, San Jose. Alvorez, David, Valdes, Luis.1997 Utility of tumor markers in the diagnosis pleural effusion: Clinical Chimica Acta; (265): 193-205
Heffner JE, Brown LK, Barbieri CA. 1997 Diagnostic value of tests that discriminate between exudative and transuda-tive pleural effusions. Primary study Investigators Chest. Apr; 111(4): 970-80
Hooper C, Lee YC, Maskell N. 2010 Investigation of a unilateral pleural effusion in adults: Thoracic Society Disease Guideline Thorax 2010; 65(Suppl2): 4-17
Kremer R, Best LA, Savulescu D, Gavish M, Nagler RM. 2010 Pleural fl uid analysis of lung cancer vs benign infl ammatory disease patients. Br J Cancer 102: 1180-4.
Light RW, MacGregor MI, Ball WC Jr, Luchsinger PC.1973 Diagnostic signifi cance f pleural fl uid PH and PCO2. Chest Nov; 64(5): 591-6.
Light RW, Macgregor MI, Luchsinger PC, Ball WC Jr. 1972 Pleural effusions: the diagnostic separation of transudates and exudates. Ann Intern Med. Oct; 77(4): 507-13.
Light RW. 2006 The undiagnosed pleural effusion. Clin Chest Med 27:309-319.
Neragi-Miandoab S. 2006 Malignant pleural effusion, current and evolving approaches for its diagnosis and management. Lung Cancer 54: 1-9.
Porcel JM, Vives M, Esquerda A, Salud A, Pe’rez B, Rodri’ Guez-Panadero F. 2004 Use a panel of tumor markers (carci-noembryonic antigen, cancer antigen 125, carbohydrate anti-gen 15-3, and cytokeratin 19 fragments) in pleural fl uid for the differential diagnosis of benign and malignant Effusions. Chest 126: 1757-63.
Roberts ME, Neville E, Berrisford RG, Antunes G, Ali NJ, Pleu-ral BTS 2010 Management of a malignant pleural effusion: British Thoracic Society Pleural Disease Guideline Thorax 2010; 65(Suppl2): 32-40
Ryland P. Byrd Jr, Thomos M. 1998 Pleural fl uid PH determi-nation. ChestMay; 113(5): 1426-27.
Xin-Feng Wang, Yan-Hua Wu, Jin Jiao, Cui-Ping Guan, Xiao-Guang Yang, Mao-Shui Wang, 2013 Diagnostic Value of Superoxide Dismutase in Tuberculous and Malignant Pleural Effusions, Asian Pacifi c Journal of Cancer Prevention, Vol 14 34-46
ChunHua Xu, Like Yu, Ping Zhan and Yu Zhang. Eleveted pleural sffusion IL-17 is a diagnostic marker and outcome pre-dictor in lung cancer patients. European Journal of Medical Research 2014, 19:23.

Dental CommunicationBiosci. Biotech. Res. Comm. 10(3): 518-524 (2017)
Prevalence of osseous changes of the temporomandibular
joint in CBCT images of patients with and without
temporomandibular disorders
Shahriar Shahab1, Zeynab Azizi2, Farnaz Taghavi Damghani3*and Farnoosh Taghavi Damghani4 1Assistant Professor, Department of Oral & Maxillofacial Radiology, Shahed Dental School, Tehran, Iran2Assistant Professor, Department of Oral & Maxillofacial Radiology, Shahed Dental School, Tehran, Iran3Dentist, Shahed Dental School, Tehran, Iran4Assistant Professor, Department of Prosthodontics, Shahid Beheshti University of Medical Sciences, Dental School, Tehran, Iran
ABSTRACT
Radiographic examinations are a part of routine clinical examination of temporomandibular disorders (TMD) to verify degenerative bone changes in the joint structures. Assessment of the prevalence of osseous changes of the temporomandibular joint (TMJ) in CBCT images of the patients with and without temporomandibular disorders.CBCT images of temporomandibular joint were taken in 62 patients with temporomandibular disorders and 62 patients without TMD. The presence of bone changes including fl attening, erosion, subcortical sclerosis, osteophyte, subcortical cyst, condylar hyperplasia and condylar hypoplasia of temporomandibular joint were studied at left and right sides on CBCT images. Furthermore, clinical fi ndings in relation to temporomandibular disorders in patients were obtained from their records. The prevalence of bone changes and clinical fi ndings in the 2 group of patients were analyzed. Radiographic fi nd-ings in the right TMJ of TMD patients, included erosion (27.4%), osteophyte (17.7%), subcortical sclerosis (16.1%), condyle hyperplasia (6.5%) and fl attening (40.3%). The prevalence of these bone changes in the right TMJ of non-TMD patients were 35.5, 6.5, 3.2, 0 and 37.1%, respectively. In the left side of TMD group; erosion was found in 29.0%, osteophyte 12.9%, subcortical sclerosis 12.9%, condyle hyperplasia 6.5% and fl attening in 37.1% of the patients. The incidence of these changes in the same side of non- TMD group was 22.6, 3.2, 1.6, 0 and 32.3%, respectively. Signifi cant differences were found for osteophyte incidence in the left TMJ(P=0.04), subcortical sclerosis in the right TMJ(P=0.02), subcortical sclerosis in the left TMJ(P=0.02) and condylar hyperplasia in both joints (P=0.04) between TMD and non-TMD patients.The most prevalent bone changes related to temporomandibular disorders included fl attening, erosion and osteophyte. The changes were highly reported for temporomandibular disorders than healthy individuals and no signifi cant correlation was found between TMJ bone changes and the patients’ age and gender.
KEY WORDS: BONY CHANGES, CONDYLE, CONE BEAM COMPUTED TOMOGRAPHY, TEMPOROMANDIBULAR JOINT, TEMPOROMANDIBULAR JOINT DISORDERS
518
ARTICLE INFORMATION:
*Corresponding Author: [email protected] 12th June, 2017Accepted after revision 18th Sep, 2017 BBRC Print ISSN: 0974-6455Online ISSN: 2321-4007 CODEN: USA BBRCBA
Thomson Reuters ISI ESC and Crossref Indexed Journal NAAS Journal Score 2017: 4.31 Cosmos IF: 4.006
© A Society of Science and Nature Publication, 2017. All rights reserved.Online Contents Available at: http//www.bbrc.in/DOI: 10.21786/bbrc/10.3/27

Shahriar Shahab et al.
FIGURE 1. CBCT images of the changes in fl attening
INTRODUCTION
Temporomandibular disorders (TMD) are well defi ned as classifi cation of abnormality including masticatory muscles, osseous and ligamentous components of the temporomandibular joints (TMJ) and neurological dis-ease of this complex. The most common clinical signs of the TMDs are joint and muscle pain, mouth-opening limitation, crepitation and clicking. TMDs are frequently associated with degenerative bone changes involving the bone structures of the temporomandibular joint (TMJ) including fl attening, osteophyte, erosion, subcor-tical sclerosis and pseudocysts, (Dos Anjos Pontual et al. 2012 De Melo et al. 2014, Ladeira et al. 2015 and Kho-jastepour et al. 2017).
Knowledge about these bone changes is fundamen-tal for correctly diagnosing the dysfunctions associated with the disease and for appropriate treatment planning (Alexiou et al. 2009). Diagnostic procedure in patients with TMJ disorders includes the background, physical examination and other diagnostic processes such as imaging of the TMJ (Ludlow et al. 2008). A panoramic radiograph is often taken to assess the general condi-tion of the teeth and structures of the maxilla and the mandible. To obtain more detailed information about the bony structures of the TMJ, other radiographs including computed tomography (CT) scans, and magnetic reso-nance images (MRI) can be taken which the latter gives information about the articular disc and the surrounding soft tissues (Honey et al. 2007). A relatively new imaging technique is cone-beam computed tomography (CBCT) and enables 3D imaging of bony structures of the skull,
including the mandible and the TMJ (De Boer et al. 2014 Khojastepour et al. 2017).
The diagnostic accuracy of CBCT in detecting con-dylar osseous abnormalities was similar to CT images, while the sensitivity of CBCT in the detection of these abnormalities was higher (Wiese et al. 2011). The CBCT is more accurate than panoramic radiographs for the assessment of bone components of the TMJ (Ladeira et al. 2015). It is reported that the diagnostic properties of the CBCT in assessing bony conditions, is better than other existing imaging techniques. However, to date limited information exists on the role of CBCT in clinical decision-making in diagnosis or management of disor-ders of the TMJ (Krishnamoorthy et al. 2013). So, the aim of the current study was to determine the prevalence of osseous changes of the TMJ in CBCT images of the patients with and without TMD.
MATERIALS AND METHODS
In a descriptive cross-sectional trial, CBCT images of TMJ in 62 TMD-patients and 62 non-TMD patients (older than 17 years old) were obtained from 2 radiol-ogy centers and 3 dental clinics in Tehran, Iran during 2016-2017. The presence of bone changes of fl attening, erosion, subcortical sclerosis, osteophyte, subcortical cyst, condylar hyperplasia and hypoplasia of TMJ were studied at left and right sides on CBCT images. In the TMD group the clinical evidences, and their correlation with sex and age were determined. The CBCT images of changes in fl attening, osteophyte, erosion and sub-cortical cyst is presented in fi gures 1-4. Furthermore,
BIOSCIENCE BIOTECHNOLOGY RESEARCH COMMUNICATIONS PREVALENCE OF OSSEOUS CHANGES OF THE TEMPOROMANDIBULAR JOINT IN CBCT IMAGES OF PATIENTS 519

Shahriar Shahab et al.
FIGURE 2. CBCT images of the changes in osteophyte
FIGURE 3. CBCT images of the changes in erosion
clinical fi ndings in relation to TMD in TMD-patients were obtained from their records. The prevalence of bone changes and clinical fi ndings in 2 TMD and non-TMD patients were analyzed using SPSS statistical soft-ware ver. 22 by Mann-Whitney U test. The correlation between bone changes and factors of age and gender were also determined by Spearman correlation ratio. P<0.05 was considered as signifi cant difference.
The CBCT images of changes in fl attening, osteophyte, erosion and subcortical cyst is presented in fi gures 1-4.
RESULTS AND DISCUSSION
In this study in the right TMJ of TMD-patients; erosion has been found in 27.4% (17 patients), osteophyte in 17.7% (11 patients), subcortical sclerosis in 16.1% (10
520 PREVALENCE OF OSSEOUS CHANGES OF THE TEMPOROMANDIBULAR JOINT IN CBCT IMAGES OF PATIENTS BIOSCIENCE BIOTECHNOLOGY RESEARCH COMMUNICATIONS

BIOSCIENCE BIOTECHNOLOGY RESEARCH COMMUNICATIONS PREVALENCE OF OSSEOUS CHANGES OF THE TEMPOROMANDIBULAR JOINT IN CBCT IMAGES OF PATIENTS 521
Shahriar Shahab et al.
FIGURE 4. CBCT images of the changes in subcortical cyst
Table 1. the frequency and percentage of pain in TMD cases and control patients
Group Sex right leftMale 7 (50%) 5 (35.7%)
Case Female 23 (47.9%) 22 (45.8%)
Total 30 (48.4%) 27 (43.5%)
Male 0 (0%) 0 (0%)
Control Female 0 (0%) 0 (0%)
Total 0 (0%) 0 (0%)
Table 2. the frequency and percentage of joint tenderness in TMD cases and control patients
Group Sex rightMale 1 (7.1%)
Case Female 1 (2.1%)
Total 2 (3.2%)
Male 0 (0%)
Control Female 0 (0%)
Total 0 (0%)
Table 3. the frequency and percentage of muscle tenderness in TMD and control patients
Group Sex right leftMale 1 (7.1%) 1 (7.1%)
Case Female 3 (6.3%) 1 (2.1%)
Total 4 (6.5%) 2 (3.2%)
Male 0 (0%) 0 (0%)
Control Female 0 (0%) 0 (0%)
Total 0 (0%) 0 (0%)
patients), condylar hyperplasia in 6.5% (4 patients) and fl attening in 40.3% (25 patients). The prevalence of these bone changes in the right TMJ of non-TMD patients was 35.5% (22 patients), 6.5% (4 patients), 3.2% (2 patients), 0 and 37.1% (23 patients) respectively.
In the left TMJ of TMD-patients; erosion was reported in 29.0% (18 patients), osteophyte in 12.9% (8 patients), subcortical sclerosis in 12.9% (8 patients), condyle hyperplasia in 6.5% (4 patients) and fl attening in 37.1% (23 patients). The incidence of these changes in the left TMJ of non-TMD patients were also 22.6% (14 patients), 3.2% (2 patients), 1.6% (1 patients), 0 and 32.3% (20 patients), respectively.
Signifi cant differences were found regarding osteo-phyte incidence in the left TMJ (P=0.04), subcortical scle-rosis in the right TMJ (P=0.02), subcortical sclerosis in the left TMJ (P=0.02) and condyle hyperplasia in both left and right TMJs (both: p=0.04) in TMD and non-TMD patients.
As seen in tables 1and 2, in left TMJ pain was reported in 30 (48.4%) patient and in the right TMJ in 27 (43.5%), joint tenderness was also observed in 2 (3.2%) patients.
According to table 3, muscle tenderness was observed in 4 (6.5%) patients at the right side and in 2cases (3.2%) at left.
The deviation in opening in right and left sides were detected in 1 (1.6%) and 1 (1.6%) patients, respectively.

522 PREVALENCE OF OSSEOUS CHANGES OF THE TEMPOROMANDIBULAR JOINT IN CBCT IMAGES OF PATIENTS BIOSCIENCE BIOTECHNOLOGY RESEARCH COMMUNICATIONS
Shahriar Shahab et al.
Table 4. the frequency and percentage of deviation in opening in case and control patients
Group Sex right leftMale 0 (0%) 1 (7.1%)
Case Female 1 (2.1%) 0 (0%)
Total 1 (1.6%) 1 (1.6%)
Male 0 (0%) 0 (0%)
Control Female 0 (0%) 0 (0%)
Total 0 (0%) 0 (0%)
Table 5. the frequency and percentage of limitation in case and control patients
Group Sex right leftMale 4 (28.6%) 4 (28.6%)
Case Female 9 (18.8%) 9 (18.8%)
Total 13 (21%) 13 (21%)
Male 0 (0%) 0 (0%)
Control Female 0 (0%) 0 (0%)
Total 0 (0%) 0 (0%)
Table 6. the frequency and percentage of clicking in case and control patients
Group Sex right leftMale 5 (35.7%) 5 (35.7%)
Case Female 21 (43.8%) 25 (52.1%)
Total 26 (41.9%) 30 (48.4%)
Male 0 (0%) 0 (0%)
Control Female 0 (0%) 0 (0%)
Total 0 (0%) 0 (0%)
Table 7. the frequency and percentage of crepitus in case and control patients
Group Sex right leftMale 0 (0%) 0 (0%)
Case Female 1 (2.1%) 3 (6.3%)
Total 1 (1.6%) 3 (4.8%)
Male 0 (0%) 0 (0%)
Control Female 0 (0%) 0 (0%)
Total 0 (0%) 0 (0%)
Table 8. the frequency and percentage of locking in case and control patients
Group Sex right leftMale 1 (7.1%) 1 (7.1%)
Case Female 2 (4.2%) 2 (4.2%)
Total 3 (4.8%) 3 (4.8%)
Male 0 (0%) 0 (0%)
Control Female 0 (0%) 0 (0%)
Total 0 (0%) 0 (0%)
Table 9. the frequency and percentage of the subluxation in case and control patients
Group Sex right leftMale 1 (7.1%) 1 (7.1%)
Case Female 13 (27.1%) 14 (29.2%)
Total 14 (22.6%) 15 (24.2%)
Male 0 (0%) 0 (0%)
Control Female 0 (0%) 0 (0%)
Total 0 (0%) 0 (0%)
Limitation in right and left sides was observed in 13 (21%) patients (table 5).
Clicking in right and left sides was detected in 26 (41.9%) and 30 (48.4%) patients, respectively (table 6).
The crepitus occurrence in left and right sides in patients were 3 (4.8%) and 1 (1.6%), respectively.
The frequency and percentage of locking in both sides and subluxation in the right side were 3 (4.8%) and 14 (22.6%), respectively. The frequency of the subluxation in the left side was 15 (24.2%) patients.
The TMJ, which comprises the mandibular condyle, the inferior component, and the temporal bone form-ing the superior component, is one of the most complex joints in the body (Wu et al. 2012). TMDs are clinically manifested by craniofacial pain in masticatory muscles and other relevant structures, limited mouth opening, and click occurring in the TMJ. (Su et al. 2014). Approx-imately in 60% of the population some type of TMD including myofascial dysfunction, internal derangement or degenerative joint disease has been observed. TMD is epidemic in women between 20 and 40 years old (He et al., 2010). In the current study, in the right TMJ of TMD patients, erosion was (27.4%), osteophyte (17.7%), subcortical sclerosis (16.1%), condylar hyperplasia (6.5%) and fl attening (40.3%). The prevalence of these bone changes in the right TMJ of non-TMD patients was 35.5, 6.5, 3.2, 0 and 37.1%, respectively. In the left TMJ of the TMD group; erosion was 29.0%, osteophyte 12.9%, subcortical sclerosis 12.9%, condylar hyperplasia 6.5% and fl attening was 37.1%. The incidence of these bone changes in the left TMJ of non-TMD patients was 22.6, 3.2, 1.6, 0 and 32.3%, respectively. Signifi cant differences were found for osteophyte incidence in left TMJ, subcortical sclerosis in right TMJ, subcortical scle-rosis in left TMJ and condylar hyperplasia in both joints between TMD and non-TMD patients. CBCT provides

BIOSCIENCE BIOTECHNOLOGY RESEARCH COMMUNICATIONS PREVALENCE OF OSSEOUS CHANGES OF THE TEMPOROMANDIBULAR JOINT IN CBCT IMAGES OF PATIENTS 523
Shahriar Shahab et al.
accurate and reliable linear measurements of the dimen-sions of the mandible and the TMJ because of its nearly 1:1 reconstruction (Honda et al. 2006).
The diagnostic accuracy of CBCT in detecting corti-cal erosion of the mandibular condyle is greater than that of either linear tomography or panoramic radiog-raphy. Its diagnostic properties in assessing bony con-ditions, therefore, seem to be similar to, or better than other imaging techniques (Hilgers et al. 2005). Until now limited information exists on the role of the CBCT in clinical decision-making in diagnosis or management of disorders of the TMJ (Krishnamoorthy et al. 2013). CBCT has several advantages over CT, such as lower cost, bet-ter access to equipment, lower radiation, and diagnostic effi cacy as high as CT(but superior than panoramic radi-ography and linear tomography) (Barghan et al. 2012). CBCT better visualizes bony changes than CT in TMD patients, analyzing lateral slices in isolation and com-bining coronal and lateral slices (Honey et al. 2007). So, using CBCT imaging technique to assess condylar bone changes was considered for this study.
In a research on association between condylar bone changes revealed in CBCT and clinical dysfunction index in patients with or without TMD, Khojastepour et al. (2017) signifi cant difference reported for the prevalence of all types of bone changes between TMD and non-TMD groups. As well as their report, evaluation of CBCT images in the present study revealed signifi cant differ-ences between TMD and non-TMD condyles (Khojaste-pour et al. 2017). In a study by Moshfeghi et al. (2012) it was reported that Flattening was the most observed abnormal fi nding with 16.3% prevalence. Erosion, con-dylar hyperplasia, concavity, bifi d condyle, condylar hypoplasia and sclerosis were respectively the most common abnormal fi ndings in this study. There were no signifi cant differences in the prevalence of abnormal radiographic fi ndings regarding to the patient’s gender, dental status and occlusion, which was in agreement with our report.
Li et al. (2015) studied the characteristics of TMJ in patients with TMD complaints and reported that in the patients with unilateral TMJ pain or joint sounds, the vertical 60° joint space of the symptomatic side was sig-nifi cantly increased comparing with the asymptomatic side. It is important to note symptoms of TMJ disorders may be observed with normal TMJ and vice versa, which is possibly due to measuring method, age, gender, chew-ing habits and etc. The condyle and mandibular fossa might differ in shape in subjects with numerous TMD complaints, since shape and function are closely related (Li et al. 2015).
In a similar study, Honey et al. (2007) reported intra observer reliability was moderate (0.57±0.22; range, 0.34-0.78). Pan-N (0.72±0.15), CBCT (0.65±0.21) and
CBCT reliability was greater than corrected angle linear tomography. The diagnostic accuracy of CBCT inter-actively (0.95±0.05) and CBCT statically (0.77±0.17) was signifi cantly greater than all other modalities. CBCT interactively was also more accurate than CBCT statically, and Pan-N was more accurate than Pan-TM and corrected angle linear tomography. CBCT images provide superior reliability and greater accuracy than other modalities in the detection of condylar cortical erosion. The CBCT and spiral CT methods were highly reliable for evaluation of the bony mandibular con-dyle. In the several cases, the bone abnormalities of the autopsy specimens were found with both meth-ods by carefully analyzing all of the images (Honda et al. 2006). Being less expensive and with considerably lower radiation dose in patient examinations, CBCT is both a cost and a dose-effective alternative diagnostic method for examination of the bony components of the TMJ (Honda et al. 2006).
In this regard, Madani et al. (2015) in a recent study using 34 cases for evaluation of degenerative changes, condylar position and joint effusion in patients with TMD via MRI revealed about the condylar position in the fossa that 32 of the examined joints (47.1%) were in central position, 30 (44.1%) were in posterior position, and 6 joints (8.8%) were in the upper position. Moreover, 34 joints (70.8%) had clicks, and 14 joints (70%) didn’t show clicks or symptoms of osteoarthritis. Following that, grade-zero and grade-one effusions accounted for the highest number of examined joints, and there was no signifi cant relationship between effusion volume and type of clicking. 10 cases (14.7%) had premature clicks, 20 (29.4%) had intermediate clicks, and 18 joints (26.5%) had delayed clicks.
Several radiographic methods are used to assess the TMJ, a fi eld diffi cult to be imaged due to factors like superimposition of adjacent structures and morpho-logical variations. The complexity of the TMD however, demands a clear and precise image of the region for effective management of the patient. CBCT provides a defi nite advantage over other techniques due to its low radiation dose to patient, smaller equipment and ability to provide multi-planar reformation and 3D images and there are promising researches in the fi eld of CBCT in TMJ imaging (Krishnamoorthy et al. 2013).
In conclusion, the most prevalent bone changes related to TMD included fl attening, erosion and osteo-phyte. The changes were highly reported for TMD than healthy individuals and no signifi cant correlation was found between TMJ bone changes and the patients’ age and gender. Similar comparative studies are needed to demonstrate the full spectrum of TMJ articular dysmor-phology and determine whether the accuracy of CBCT remains high.

524 PREVALENCE OF OSSEOUS CHANGES OF THE TEMPOROMANDIBULAR JOINT IN CBCT IMAGES OF PATIENTS BIOSCIENCE BIOTECHNOLOGY RESEARCH COMMUNICATIONS
Shahriar Shahab et al.
REFERENCES
Alexiou KE, Stamatakis HC, Tsiklakis K.2009 Evaluation of the severity of temporomandibular joint osteoarthritic changes related to age using cone beam computed tomography. Den-tomaxillofacial Radiology 38: 141–147.
Barghan S, Tetradis S, Mallya SM: 2012 Application of cone beam computed tomography for assessment of the temporo-mandibular joints. Aust Dent J 57: 109 118
De Boer EWJ, et al. 2014 Value of cone-beam computed tomography in the process of diagnosis and management of disorders of the temporomandibular joint. Br J Oral Maxillofac Surg , http://dx.doi.org/10.1016/j.bjoms.2014.12.007
De Melo DP, Sousa Melo SL, de Andrade Freitas Oliveira LS, de Moraes Ramos-Perez FM, Flores Campos PS. 2014 Evaluation of temporo-mandibular joint disk displacement and its cor-relation with pain and osseous abnormalities in symptomatic young patients with magnetic resonance imaging. Oral Surg Oral Med Oral Pathol Oral Radiol :1-6
dos Anjos Pontual ML, Freire JSL, Barbosa JMN, Fraza˜o MAG, dos Anjos Pontual A, Fonseca da Silveira MM. 2012 Evaluation of bone changes in the temporomandibular joint using cone beam CT. Dentomaxillofacial Radiology 41, 24–29.
He SS, Deng X, Wamalwa P, Chen S: 2010 Correlation between centric relation-maximum intercuspation discrepancy and temporomandibular joint dysfunction. Acta Odontol Scand 68: 368 376
Hilgers ML, Scarfe WC, Scheetz JP, et al. 2005 Accuracy of lin-ear temporo-mandibular joint measurements with cone beam computed tomographyand digital cephalometric radiography. Am J Orthod Dentofacial Orthop128:803–11.10.
Honda K, Larheim TA, Maruhashi K, et al. 2006 Osseous abnor-mali-ties of the mandibular condyle: diagnostic reliability of cone beamcomputed tomography compared with helical com-puted tomogra-phy based on an autopsy material. Dentomax-illofac Radiol 35:152–7.9.
Honey OB, Scarfe WC, Hilgers MJ, et al.2007 Accuracy of cone-beam com-puted tomography imaging of the temporomandib-ular joint: comparisonswith panoramic radiology and linear tomography. Am J Orthod Dentofa-cial Orthop 132:429–38.
Khojastepour L, Vojdani M, Forghani M. 2017 The association between condylar bone changes revealed in cone beam com-
puted tomography and clinical dysfunction index in patients with or without temporomandibular joint disorders. Oral Surg Oral Med Oral Pathol Oral Radiol 123:600-605.
Krishnamoorthy B, Mamatha N, Kumar VA. 2013 TMJ imaging by CBCT:current scenario. Ann Maxillofac Surg 3:80–3.
Ladeira DBS, da Cruz AD, de Almeida SM. 2015 Digital pan-oramic radiography for diagnosis of the temporomandibu-lar joint: CBCT as the gold standard. Braz Oral Res [online]. 29(1):1-7
Li Y, Guo X, Sun X, Wang N, Xie M, Zhang J, Lv Y, Han W, Hu M, Liu H. 2015 Characteristics of temporomandibular joint in patients with temporomandibular joint complaint. Int J Clin Exp Med 8(9):16057-16063
Ludlow JB, Ivanovic M. 2008 Comparative dosimetry of den-tal CBCT devicesand 64-slice CT for oral and maxillofacial radiology. Oral Surg Oral MedOral Pathol Oral Radiol Endod 106:106–14.
Madani A.S., Taheri Heravi M., Imani Moghadam M., Chamani A., Javan A., Mirmortazavi A.2015 Evalua-tion of degenerative changes, condyle position and joint effu-sion in patients with temporomandibular joint disorder via MRI. Journal of Babol University of Medical Sciences(JBUMS) 17(11):13-20
Moshfeghi M, Amin Tavakoli M, Razaghi Kashani Z, Rafi eian N.2012 Abnormal Temporomandibular Joint radiographic fi ndings in patients referred to Department of Oral and Maxil-lofacial Radiology, Dental School, Shahid Beheshti University of Medical Sciences. J Dent Sch. 29 (5) :381-389.
Su N, Liu Y, Yang X, Luo Z, Shi Z, 2014 Correlation between bony changes measured with cone beam computed tomogra-phy and clinical dysfunction index in patients with temporo-mandibular joint osteoarthritis, Journal of Cranio-Maxillofa-cial Surgery doi: 10.1016/ j.jcms.2014.04.001.
Wiese M, Wenzel A, Hintze H 2011 Infl uence of cross-sectional temporo-mandibular joint tomography on diagnosis and man-agement decisionsof patients with temporomandibular joint disorders. J Orofac Pain 25:223–31.
Wu CK, Hsu JT, Shen YW, Chen JH, Shen WC, Fuh LJ: 2012 Assessments of inclinations of the mandibular fossa by com-puted tomography in an Asian population. Clin Oral Investig 16: 443 450,

Dental CommunicationBiosci. Biotech. Res. Comm. 10(3): 525-528 (2017)
Adhesion of Streptococcus mutans on glazed IPS e.max
press, glazed feldspatic and dental enamel
Ezzatollah Jalalian1, Fahimeh Sarzaeem2* and Mahkameh Koochaki Pourchafjiri3
1Associate Professor, Department of Fixed Prosthodontics, Member of Dental Material Research Center, Dental Branch, Islamic Azad University, Tehran, Iran2Postgraduate Student, Department of Fixed Prosthodontics, Islamic Azad University, Tehran, Iran3Dentist
ABSTRACT
Despite several researches done to determine accuracy of microbial growth in the restoration treatment, the mecha-nisms for these reports is still unclear.The aim of the study was to comparison adhesion of the Streptococcus mutans on glazed IPS e.max press, glazed feldspatic and dental enamel. The in vitro study was done on 15 samples: 5 glazed IPS e.max, 5 glazed feldspatic and 5 dental enamels for vicinity of the bacterial suspension containing Streptococcus mutans (10 × 106 cell/mLit). After 48 hours, Streptococcus mutans colonies were counted with the naked eye. The mean Streptococcus mutans attached to dental enamel was 24.4±8.44 (P<0.001). The Streptococcus mutans attached to glazed IPS e.max was 1.8±0.83. The Streptococcus mutans attached to glazed feldspatic was 1.4±0.54. No signifi -cant differences observed between the IPS e.max and feldspatic (P<0.8). The results showed Streptococcus mutans adhesion to enamel was higher than glazed IPS e.max and glazed feldspatic ceramic material.
KEY WORDS: IPS E.MAX, FELDSPATIC, STREPTOCOCCUS MUTANS
525
ARTICLE INFORMATION:
*Corresponding Author: [email protected] 12th June, 2017Accepted after revision 21st Sep, 2017 BBRC Print ISSN: 0974-6455Online ISSN: 2321-4007 CODEN: USA BBRCBA
Thomson Reuters ISI ESC and Crossref Indexed Journal NAAS Journal Score 2017: 4.31 Cosmos IF: 4.006
© A Society of Science and Nature Publication, 2017. All rights reserved.Online Contents Available at: http//www.bbrc.in/DOI: 10.21786/bbrc/10.3/28
INTRODUCTION
There is a rich ecosystem in the oral cavity, with a count-less number of microorganisms. Although both peri-odontal disease and dental caries are considered multi-factorial diseases, the bacteria in the dental plaque are the main factor in their onset and progression. Increased
oral microbiota of Streptococcus mutans and Lactoba-cillus is associated with the onset of tooth deminerali-zation and periodontal disease. This condition is much more frequent in orthodontic patients with greater risk of colonization by these microorganisms ( Brusca et al. 2007, Harikrishnan et al. 2013, Nascimento et al. 2014 Jalalian et al. 2015Duymus et al. 2016).

Fahimeh Sarzaeem et al.
Despite several researches done to determine accu-racy of microbial growth in the restoration treatment, the mechanisms for these reports is still unclear However the saliva composition and secretion rate also infl uence plaque formation (Gameiro et al. 2009).Porcelain has excellent esthetic properties and biocompatibility, and major emphasis in research have been directed toward the enhancement of its strength and aesthetic properties (Rashid, 2014).
Scarce reports exist on bacterial adhesion to por-celain restorations (Kamala and Annapurni, 2006). A previous research stated the best results were obtained through glazing, since it provided a surface topography with minimal bacterial affi nity (Sarac et al. 2006). Addi-tionally, it is demonstrated that polished surfaces had lower bacterial adhesion than glazed surfaces (Kawai et al. 2000). In a similar study, Jalalian et al. (2015) reported the adhesion of Streptococcus mutans to the enamel was higher than that to polished IPS e.max Press and polished feldspathic porcelain. However, there is no report comparing effect of porcelains with natural den-tal enamel. So, the aim of the current study was to deter-mine adhesion of the Streptococcus mutans on glazed IPS e.max press, glazed feldspatic and dental enamel adhesion using in vitro condition.
MATERIAL AND METHODS
The in vitro study was done on 15 samples: 5 glazed IPS e.max, 5 glazed feldspatic and 5 dental enamels for vicinity of the bacterial suspension containing Strepto-coccus mutans (109 cell/mLit). The samples had diameter 5× 2mm in laboratory, then phosphate base fabricated. The feldspatic samples fabricated using feldspatic pow-ders (lvocular, Germany) based on manufacture instruc-tions. Ito fabricate IPS e.max press samples, 2 × 5 mm were blocks produced. The dental enamels obtained from normal premolar using diamond disks. The samples glazed at 625ºC beginning temperature and increased each 20 minutes until fi nal 920ºC, then cooled in fresh air. Samples washed using distilled water then autoclave.
STUDY PROTOCOL
To increase hygiene condition, all samples were located into ultrasonic system for 15 min and then transferred into 70 % alcohol for 30 min. the being sterile of the samples was tested using BHI condition for 24 h. Saliva samples obtained from 2 healthy patients which had no medication for last 3 months without dental caries or periodontal disease. The saliva samples sterile using autoclave (Garcez et al. 2011). Then samples coated with saliva, put into glass vials and immersed in 2mL of Streptococcus mutans (PTCCI 683) suspension (×109
CFU) and incubated in 37 ºC and 5% CO2 for 24 h. Sam-ples washed 3 times with normal saline, immersed into 2 mL of normal saline and shacked for 2 min (Fournier et al. 1998). Obtained suspension cultured on blood agar and incubated in 37 ºC with 5% CO2 for 48h and the colonies counted (Kantoriski et al. 2006). After 48 hours, Streptococcus mutans colonies were counted with the naked eye.
STATISTICAL ANALYSIS
Data for bacteria load was analyzed by one way analy-sis of variance (ANOVA) using SPSS 16.0 for Windows and is presented as mean ± Sd. For treatments showing a main effect by ANOVA, means were compared using Tukey HSD test. P<0.05 was considered as signifi cant differences between treatments.
RESULTS AND DISCUSSION
As seen in table, the mean Streptococcus mutans attached to dental enamel was 24.4±8.44 (P<0.001). The Streptococcus mutans attached to glazed IPS e.max was 1.8±0.83. The Streptococcus mutans attached to glazed feldspatic was 1.4±0.54. No signifi cant differences observed between the IPS e.max and feldspatic (P<0.8).
Table 1. The adhesion of streptococcus mutans on different restoration
adhesion C.VFeldspatic 1.4±0.54 38.57
IPS e.max 1.8±0.83 46.11
Dental enamel 24.4±8.44 34.59
P value 0.001
As observed in the current study, Streptococcus mutans attached was lower in glazed feldspatic< IPS e.max¸ dental enamel. However, no signifi cant differ-ence observed between glazed feldspatic and IPS e.max. Bacteria-dental interactions typical of enamel or cemen-tum surfaces, in vivo biofi lm formation on restorative surfaces have physiochemical and biochemical interac-tions (Hara and Zero, 2010). Pathogenic communities involving Bifi dobacterium dentium, Scardovia wiggsiae, Bifi dobacterium longum, Bifi dobacterium adolecentis, Prevotella spp, Selenomonas spp and Lactobacilli spp have also been demonstrated to be complicit in the eti-ology of dental caries (Zhang et al. 2015). Streptococcus mutans has been demonstrated as the primary etiologic agent in caries initiation and reductionist approach can elucidate vital information regarding its interaction with restoration surfaces; however, additional studies may also use a more holistic approach (Wessel et al. 2014).
526 ADHESION OF STREPTOCOCCUS MUTANS ON GLAZED IPS BIOSCIENCE BIOTECHNOLOGY RESEARCH COMMUNICATIONS
BIOSCIENCE BIOTECHNOLOGY RESEARCH COMMUNICATIONS ADHESION OF STREPTOCOCCUS MUTANS ON GLAZED IPS 527
Fahimeh Sarzaeem et al.
The fi rst stage of colonization by an organism involves adherence of the organism to a host surface. From this viewpoint, evaluation of Streptococcus mutans adhesion and colonization to tooth surfaces and restorative mate-rials are of most importance for their success (Lassila et al. 2009). Eick et al. (2004) demonstrated that no cor-relation found between surface roughness and the num-ber of Streptococcus mutans. In the oral environment, the adsorption of salivary proteins to the tooth or restor-ative surface precedes and promotes bacterial adherence. They can form an acquired salivary pellicle to which bacteria and structural substrates may bind (Keulemans et al. 2009). Plaque accumulation was more infl uenced by the presence of a salivary pellicle than by material type. Viability, however, was infl uenced by material composition, in this case, differentiated by glass content (Dittmer et al. 2015).
Feldspathic porcelains are usually used as a veneer-ing material for metal ceramic restorations and provide excellent esthetics and compressive strength (Duymus et al. 2016). Otherwise, the rough porcelain surface is prone to adhesion and retention of oral microorganisms causing excessive plaque accumulation, gingival irrita-tion, increased surface staining and poor esthetics of the restored teeth and thereby increasing the risk of dental caries and periodontal disease (Hengtrakool et al. 2011).
The oral cavity is a complex, aqueous environment where the restorative material is in contact with saliva (Hengtrakool et al. 2011). Other factors such as low pH due to acidic foods and drinks may infl uence the mate-rial’s mechanical and physical characteristics (Honorio et al. 2008). The availability and long-term success of prosthesis, depends upon the protection of the polished surface. The degradation of surface fi nish will cause the formation of surface cracks and after a while, leaving the porcelain metal sub-structure. In addition, surface deterioration will facilitate the involvement of plaque and microorganisms (Honorio et al. 2008).
Karayazgan et al. (2010) reported that the level of adhesion of Candida albicans to the polished surface of feldspathic porcelain was 3.4 ± 0.25 colonies/mm2. In a similar study, enamel used as the control for assessment of the adhesion of Streptococcus mutans to uncoated and saliva-coated glass ceramics and composites (Kan-torski et al. 2008) and their report was consistent with the fi ndings of the current study. In a research on the adhesion to different the ceramics, composites and amalgam concluded the bacterial affi nity was equal in all groups of ceramics assessed (Kawai et al. 2000). In conclusion the results showed Streptococcus mutans adhesion to enamel was higher than glazed IPS e.max and glazed feldspatic ceramic material. According to the fi ndings of the present study, polished IPS e.max Press and polished feldspathic porcelain exhibit similar char-
acteristics in terms of bacterial adhesion and either one can be the choice material.
REFERENCES
Brusca MI, Chara O, Sterin-Borda L, Rosa AC.2007 Infl uence of different orthodontic brackets on Adherence of microorgan-isms in vitro. Angle Orthod. 77(2):331-6.
Dittmer MP, Hellemann CF, Grade S, Heuer W, Stiesch M, Schwestka-Polly R, Demling AP 2015 Comparative three-dimensional analysis of initial biofi lm formation on three orthodontic bracket materials. Head & Face Medicine 11:10 DOI 10.1186/s13005-015-0062-0
Eick S, Glockmann E, Brandl B, Pfi ster W. 2004 Adherence of Streptococcus mutans to various restorative materials in a con-tinuous fl ow system. J Oral Rehabil 2004; 31: 278-85.
Fournier A, Payant L, Bouclin R. 1998 Adherence of Strepto-coccus mutans to orthodontic brackets. Am J Orthod Dentofa-cial Orthop 114(4):414-7.
Gameiro GH, Nouer DF, Cenci MS, Cury JA. 2009 Enamel demineralization with two forms of archwire ligation investi-gated using an in situ caries model: a pilot study. Eur J Orthod. 31(5):542-6.
Garcez AS, Suzuki SS, Ribeiro MS, Mada EY, Freitas AZ, Suzuki H. 2011 Biofi lm retention by 3 methods of ligation on orthodontic brackets: A microbiologic and optical cohernce tomography analysis. American Journal of Orthodontics and Dentofacial Orthopedics 140 (4), 193-198.
Hara AT, Zero DT. 2010 The caries environment: saliva, pel-licle, diet, and hard tissue ultrastructure. Dent Clin North Am 54:455-67.
Harikrishnan P, SakuSubha T, Kavitha V, Gnanamani A. 2013 Microbial Adhesion on Orthodontic Ligating Materials: An in Vitro Assessment. Advances in Microbiology, 3: p- 108-114.
Hengtrakool C, Kukiattrakoon B, Kedjarune-Leggat U. (2011) Effect of Naturally Acidic Agents on Microhardness and Sur-face Micromorphology of Restorative Materials. European Journal of Dentistry, 5, 89-100.
Honorio, H.M., Rios, D., Francisconi, L.F., et al. (2008) Effect of Prolonged Erosive pH Cycling on Different Restorative Materi-als. Journal of Oral Rehabilitation, 35, 947-953.
Jalalian E, Mofrad GH, Rahbar M, Mohseni A, Mohebbi M. 2015 In vitro adhesion of streptococcus mutans to polished IPS e.max and Feldspathic porcelain. Journal of Islamic Dental Association of IRAN (JIDAI) 27(4):182-185.
Jalalian E, Mostofi SN, Shafi ee E, Nourizadeh A, Nargesi RA, Ayremlou S. 2015 Adhesion of Streptococcus mutans to Zirco-nia, Titanium Alloy and some other Restorative Materials:” An in-vitro Study”. Advances in Biosciences & Clinical Medicine. Jan 1;3(2):13-20.
Kamala KR, Annapurni H. 2006 Evaluation of surface rough-ness of glazed and polished ceramic surface on exposure to fl uoride gel, bleaching agent and aerated drink: An in vitro study. J of Indian Prosthod Soc. Jul; 6(3):128-32.
Fahimeh Sarzaeem et al.
Kantoriski KZ, Scotti R, Felipe L. 2006 Surface roughness and Bacterial Adherence.Cience Odontol bras. 9(4):12-17.
Kantorski KZ, Scotti R, Valandro LF, Bottino MA, Koga-Ito CY, Jorge AO. 2008 Adherence of Streptococcus mutans to uncoated and salivacoated glass-ceramicsand composites. Gen Dent. Nov-Dec;56(7):740-7.
Karayazgan B, Atay A, Saracli MA, Gunay Y. 2010 Evaluation of Candida albicans formation on feldspathic porcelain sub-jected to four surface treatment methods. Dent Mater J. Mar; 29(2): 147-53.
Kawai K, Urano M, Ebisu S.2000 Effect of surface roughness of porcelain on adhesion of bacteria and their synthesizing glucans. J Prosthet Dent. Jun;83(6):664-7.
Keulemans F, Lassila LV, Garoushi S, Vallittu PK, Kleverlaan CJ, Feilzer AJ. 2009 The infl uence of framework design on the load-bearing capacity of laboratory-made inlay-retained fi ber rein-forced composite fi xed dental prostheses. J Biomech 42: 844-9.
Lassila LVJ, Garoushi S, Tanner J, Vallittu PK, Söderling E. 2009 Adherence of Streptococcus mutans to fi ber-reinforced
fi lling composite and conventional restorative materials. The Open Dentistry Journal, 3, 227-232.
Nascimento LEAG, Souza MMG, Azevedo ARP, Maia LC.2014 Are self-ligating brackets related to less formation of Strepto-coccus mutans colonies? A systematic review. Dental Press J Orthod. 19(1):60-8.
Rashid H. 2014 The effect of surface roughness on ceramics used in dentistry: A review of literature. Eur J Dent 8:571-9.
Sarac D, Sarac YS, Kulunk S, Ural C, Kulunk T.2006 The effect of polishingtechniques on the surface roughness and color change of composite resins. J Prosthet Dent. Jul;96(1):33-40.
Wessel SW, Chen Y, Maitra A, van de Heuvel ER, Slomp AM, Busscher HJ, van der Mei HC. 2014 Adhesion forces and com-position of planktonic and adhering oral microbiomes. J Dent Res 93:84-8.
Zhang YF, Zheng J, Zheng L, Zhou ZR.2015 Effect of adsorp-tion time on the adhesion strength between salivary pelli-cle and human tooth enamel. J Mech Behav Biomed Mater 42:257-66.
528 ADHESION OF STREPTOCOCCUS MUTANS ON GLAZED IPS BIOSCIENCE BIOTECHNOLOGY RESEARCH COMMUNICATIONS

Medical CommunicationBiosci. Biotech. Res. Comm. 10(3): 529-535 (2017)
Comparison of surface roughness between CO2 laser and
typical glazing on two types of porcelain vita and ivoclar
Alireza Izadi, DDS, PhD1, Bijan Heidari, DDS, PhD1, Shahin Kasrai, DDS, PhD1 Alireza Soltanian, DDS, PhD1 and Sahar Raissi*, PhD2
1Department of Prosthodontics, Hamadan University of Medical Science, Hamadan, Iran2Assistant Professor, Prosthodontics Department, School of Dentistry, Kermanshah University of Medical Sciences, Iran
ABSTRACT
Existence defects in porcelain is directly related to the techniques of porcelain and fi ring cycles. Adjust glazed surface during clinical work to correct occlusal interferences surface and proximal are common, Which Leads to increased surface roughness. So do Glaze and polishing after Adjust process is essential. In this in vitro study evaluated two types of com-mercial porcelain with different crystalline content, VITA (Zahnfabrik, Bad Säckingen, Germany) and porcelain IPS d.Sign (Ivoclar Vivadent, Amherst, NY) each of the samples of porcelain were divided into 4 groups according to the two types of porcelain used, generally divided into 8 groups were divided. The laser co2 laser (ultra-dream pluse, Guro-Gu, Seoul, Korea) wavelength 10.6 (mμ) and with the 30W and the time of exposure 1 and 1/5 minutes was used. Standard polished group with sandy paper with a grit similar, According to the America Academy aesthetic dentistry was prepare. Surface roughness were evaluated using a profi lometer and the two-way ANOVA test and post hoc Tukey test was used for statistical analysis of the samples. The fi ndings of this study indicated that porcelain surface roughness by CO2 laser glazed signifi cantly less than typical Glaze, however, ANOVA test between average 5 groups length consecutive depth, did not show signifi cant differences, Also, the surface roughness of CO2 laser glazed porcelain were signifi cantly lower than the polished porcelain. The surface roughness of glazed porcelain by laser CO2 was less than of typical glaze.
529
ARTICLE INFORMATION:
*Corresponding Author: [email protected] Received 1st June, 2017Accepted after revision 2nd Sep, 2017 BBRC Print ISSN: 0974-6455Online ISSN: 2321-4007 CODEN: USA BBRCBA
Thomson Reuters ISI ESC and Crossref Indexed Journal NAAS Journal Score 2017: 4.31 Cosmos IF: 4.006
© A Society of Science and Nature Publication, 2017. All rights reserved.Online Contents Available at: http//www.bbrc.in/DOI: 10.21786/bbrc/10.3/29
INTRODUCTION
Dental porcelains have a signifi cant role in dentistry due to properties such as color stability and chemical stabil-ity and low thermal conductivity and high bio compat-
ibility but limited fracture strength of these materials limits their application. Presence of available defects in porcelain has a major effect on reducing life span of porcelain. Presence of available defects has direct rela-tionship with process technique and porcelain fi ring

530 COMPARISON OF SURFACE ROUGHNESS BETWEEN CO2 LASER AND TYPICAL GLAZING BIOSCIENCE BIOTECHNOLOGY RESEARCH COMMUNICATIONS
Alireza Izadi et al.
cycles. Surface roughness increases followed by porce-lain adjustment of surface pore, which acts as an impor-tant center of stress focus and often leads to catastrophic failure, (Morena 1986 Scherrer 1999, Griggs 1996, Kelly 1997, Raigrodski 2001 Raigrodski 2004, Gonzaga 2009, Garcia 2015, Alavi 2017 and Lohbauer 2017).
Glazing includes porcelain fi ringcycle near the sin-tering temperature (Chang 2011) and (Quinn 2012) por-celain surface melts during this cycle and Glassy Phase fi llsSurface irregularities, the glazing is done as auto glaze and over glaze that both of whichglazingtech-niques createsmoother surface with higher glass level and lower fl ows (Eppler 1983) and (Marshall 1993). Papers show that glazing has important role in reducing plaque accumulation in the porcelain surface (Brackett 1989) and (Motro 2012) and (Yilmaz 2010).
Using microwave techniques has been proposed as an alternative to typical glazing recently (Barghi 1976). Microwave leads to less surface defect and a smoother surface and requires lesstime. Using Co2 laser leads to reducing surface roughness in comparison with typical laser but just in laser with high power co2, better color has shown than typical glazing (Podshadley 1966). Por-celain surface density is created by different techniques in a wide range of ceramic materials which can be done by Thermal, mechanical and polished fi ring and putting a layer of porcelain with coeffi cient thermal expan-sion less than porcelain. CO2 laser is very convenient for improving the level of dental porcelain because the emitted wavelength by this laser is absorbed entirely by
porcelain (Fairhurst 1992). It was suggested that surface treatment of porcelain by laser prevents formation of micro cracks and leads to increased mechanical strength of porcelain. The present study reviews CO2 laser as a surface treatment for porcelain glaze and compares results with typical glazing.
MATERIALS AND METHODS
In this study which is empirical_Laboratory type, 2 types of commercial porcelain with different crystal-line content of VITA VM13 (Zahnfabrik, BadSäckingen, Germany) and porcelain IPS d.Sign (Ivoclar Vivadent, Amherst, NY) were selected (Barghi 1976) and (Bren-tel 2011), a brass generator was used to standardize the samples with 5 5 10 mm. Porcelain was placed in generator after mixing the powder and liquid. Extra humidity was taken by a handkerchief (Kleenex; Kim-berly-clark, Neenah, wis) and all samples were placed on wetness (honey comb mesh tray; American dental sup-ply; Allentown pa) andwere sintered in porcelain fur-nace (program at p 200; ivoclar vivadent) according to manufacturer’s instructions as described below;
First, the samples were dried for three minutes, after3 minutes ofstanding onpreheat stage with speed of 83 ° C per minute were reached to temperature of 913 degrees Cel-sius and were kept at this temperature for 30 seconds.For sample preparation, two fi ring cycles were performedfor wind porcelain and enamel and one cycle was performed for glazing. Typical cyclewas roughed by a diamond bur
FIGURE 1

BIOSCIENCE BIOTECHNOLOGY RESEARCH COMMUNICATIONS COMPARISON OF SURFACE ROUGHNESS BETWEEN CO2 LASER AND TYPICAL GLAZING 531
Alireza Izadi et al.
FIGURE 2
FIGURE 3
(2134F, KG Sorensen) with high speed along with water of samples surface (similar to clinical conditions of occlusal adjustment) and were divided into 4 groups that were divided into 8 groups generallybased on porcelain trade type. In this study, co2 laser (ultra-dream pluse, Guro-Gu, Seoul, Korea) was used with a wavelength 10.6 (mμ) and with power 30 W and exposure time 1 and 1/5 minutes. Co2 laser radiation is continuously and focuses directly on a samples that are placed on refractory base. Spot size of co2 laser was 5/0 cm.
Remaining sample of each type of porcelain was glazed in the usual way of furnace glazing and accord-
ing to glazing manufacturer’s instructions, also standard polished group was prepared with sandpaper bysame grits according to recommendation of American Acad-emy of Cosmetic Dentistry (P360, P400 and P1200) (Fairhurst 1992).To investigate surface roughness, a pro-fi lometer (Mitutoyo Surf Test 402 Analyser; Mitutoyo crop, Kawasaki, Japan) was used with a pen diameter 12.5 mμ, pen power 10mg (Prasad 2009) and movement speed of co2 laser on the surface was 10 mm /min (Sgura 2015) and manually, and the entire sample length was scanned by profi lometer (Mitutoyo Surf Test 402 Ana-lyser; Mitutoyo crop, Kawasaki, Japan).
To measure surface roughness of samples by profi lom-eterdevice, porcelains sample was placed in such a way that device indenter placed in middle part of sample in terms of width, then three times measurement were per-formed for each sample in this way, that average of three measured values for each sample was considered as an average of surface roughness for that sample. Parameters of the surface roughness were calculated by Ra (average of surface roughness heights that is obtained from divid-ing total area of roughness on sample length) and Rz (a fi fth of sum of 5 consecutive peaks of surface roughness or in other words the average of the tallest roughness peaks (heights) in 5 sequence length of the sample that is measured according to micrometer) and Rpm /rz (Rpm is the average of depth length of 5 samples subsequent length). Two-way ANOVA test and post hoc Tukey test was used for statistical analysis of the samples.
DISCUSSION
According to performed statistical tests in this study and obtained data from these tests, VITA porcelains group

532 COMPARISON OF SURFACE ROUGHNESS BETWEEN CO2 LASER AND TYPICAL GLAZING BIOSCIENCE BIOTECHNOLOGY RESEARCH COMMUNICATIONS
Alireza Izadi et al.
which had been typically glazed,had no signifi cant dif-ference with any group, but IVOCLAR porcelains group that was typically glazed had more surface roughness compared to VITA porcelains group which had been glazed with laser for 1.5 minutes. Although Vita porce-lains that had been typically glazed, had no signifi cant difference with any group, detection probability of this difference was existed in case of using more accurate methods such as SEM.
In particular, use of SEM could provide worthy help in detecting a difference of surface roughness in typical glaz-ing groups with groups that were glazed withCO2 laser. Also, porcelains Microstructure structure can be a reason for mechanical and apparent difference of porcelain, that this matter can be a justifi cation for providing different results, for example, in study of Sarac et al. (2005) dif-ference in samples harness had been expressed as an evi-dence for providing different results in similar methods of polishing, Also, inmentioned study has been stated that the difference in surface roughness of the samples can be due to differences in samples characteristics (Sarac 2006); therefore, it is advised to evaluate structure of porcelains Microstructure with using X-ray in future studies.
There is signifi cant difference between VITA porce-lains group that have been glazed with co2 laser for 1 minute with VITA porcelains group that have been glazed with co2 laser for 1.5 minutes, whichis demonstrator of effect of time of using CO2 laser for glazing. Regarding the
IVOCLAR porcelains, in case of using accurate methods to survey the surface roughness, it was possible that time of using co2 laser had signifi cant difference in surface roughness of samples in mentioned porcelain. Therefore, using more accurate methods of handling surface rough-ness such as use of SEM is suggested for further study.
Reham & coworkers in 2014 surveyed the roughness and surface properties of porcelain after typical glazing, glazing with xeclexcimer and CO2 laser. They observed-more smoother and a more uniform surface than typical glazing in the survey with electron microscope in high power of both laser (Reham et al., 2014), which is sec-onder of present study fi ndings.
ANOVA test also showed that there is signifi cant dif-ference between Rz of used porcelain groups in study that had been glazed typical with groups that had been glazed with co2 laser (Rzof groups that have been glazed with co2 laser is lower than groups that have been typi-cally glazed) but signifi cant difference was not observed between Ra and Rpm of groups. Ricardo and co workers considered CO2 laser with three different powers as an alternative to oven glaze on 2 types of porcelain in 2013. Results of this study showed that the amount of surface roughness had no signifi cant difference among various brands ofporcelain. They observed reduction of surface roughness in laser group with power 45w/cm2 compared to the control group but signifi cant difference was not observed between other groups (Ricardo et al., 2013).
FIGURE 4

BIOSCIENCE BIOTECHNOLOGY RESEARCH COMMUNICATIONS COMPARISON OF SURFACE ROUGHNESS BETWEEN CO2 LASER AND TYPICAL GLAZING 533
Alireza Izadi et al.
In present study, similar results of this study were obtained and was shown that, there is difference between two types of porcelain (2 brand types ) that was used in the study only when glazing method was used by CO2 laser in terms of surface roughness and other-wise, there is no signifi cant difference between the types of different not glazed (only were polished) porcelain (different brands), it should be noted here that a large number of studies only survey the Ra parameter (Prasad 2009) and (Yilmaz 2010) and (Güler 2009); while due to importance and impact of the Rz parameter, some differ-ences in this study can be justifi ed with other studies to this reason, also this problem is demonstrator of meas-urement necessity of the Rz parameter to identify sur-face roughness more accurately. Furthermore, surveying more parameters about surface roughness as was done in this study, can provide more useful information about surface morphology to us, it should be noted that the use of the Rz parameter and ratio Rpm / Rz was essential perfectly alongside Ra parameter and using mentioned parameters in present study is another reason for differ-ence of some fi ndings of this study with other studies and this is the strength of present study. Also, in present study, glazed groups that were only polished had no sig-nifi cant difference.
Byeong-Hoon and his colleagues performed a study in 2013 and surveyed the improvement of feldspathic porcelain surface roughness by a new rubber wheels which contained uniform particles of carbide silicon and small diamond particles on two sinterd and build por-celain in CAD-CAM method. The surface roughness of both porcelains in surface polishing methods was lower than glazing method (Huaw 2013), which reasons the differences between fi ndings of Byung-Hoonand his col-leagues with present study can be known in lack of our different polishingmethods usage, using different com-mercial brands of materials, different used methodolo-gies in the studies and different investigated variables.
In the present study, signifi cant difference was not observed in their surface roughness between different porcelains with same method of glazing, but a signifi -cant difference was observed between porcelains that had been glazed with co2 laser method with porce-lains that had beentypically glazed or with porcelains that had not been glazed. Sumitsethi and his colleagues surveyed and compared surface roughness inautogaze, reglaze and chair side polished method of porcelain surface in two vita vmk94 andivoclar classic porcelain in 2012. Their results showed that different types of porcelains (different brands) had no signifi cant differ-ence in terms of surface roughness in different glazing methods (Prasad 2009), which is confi rmation of present study. As mentioned in present study, no signifi cant dif-ference was not observed between control groups that
had been only polished in terms of surface roughness, but it was possible toobserve a similar result to study of Vieira et al, where different polishing methods were used (Vieira et al., 2013), because they observed that the lowest surface roughness is related to VM7 ceramics with polishing method with Shofu system between VM7 and VM13 ceramics that had been studied, in the study thatevaluate and surveythesurface roughness in differ-ent ways offi nishing and polishing dental ceramics that also had signifi cant difference with other groups and other methods of fi nishing and polishing statistically.
According to a study of Barghi and associates (1975) and study of Karaksi and associates (1993), the best mode of surface roughness that leads to smoother surface and increasedmechanical strength of the material Compared with different systems of polishing and fi nishing of using glazing (Barghi 1975) and ( El-Karaksi 1993), that their fi ndings areconfi rmation of the results of present study based onexistenceof a signifi cant difference between the glazed groups with not glazed groups. Fuzzi and cow-orkers (Fuzzi et al., 1996) also in a study that performed about evaluating surface roughness in different ways of polishing and glazing in 1996, concluded that glazing method is preferable to polishing method which their fi ndings are confi rmation of the results of present study. Also Brackett SE et al. (1989) preferred glazing method in a study that examined the effect of glazing method in porcelain strength and surface modifi cations (Brackett 1989). Also Al-Wahadni (2006) observed in his study that glazing causes creating a smoother surface and less surface roughness compared to different methods of fi n-ishing and polishing (Al-Wahadni 2006), although pre-sent study and many other studies are confi rmation of these fi ndings based on priority of glazing in reducing the surface roughness compared with different methods of polishing and fi nishing.
However, some studies, including Kelly and colleagues (1996) were presented different results, theydidn’t observe signifi cant difference about surface roughness in their study between glazing method with fi nishing and polishing in different ceramics (Kelly et al. 1996); demonstrated that results of these fi ndings can be found in type of used ceramics and used polishing, fi nishing and glazing methods instudy and used laboratory equip-ment. In contrast to our fi ndings, Sarac and coworkers (2006) demonstrated that there is no signifi cant statis-tical difference between surface roughness of glazed ceramicswith polished ceramic with different systems of polishing, Furthermore, there are studies that have been claimed that the surface roughness of polished ceram-icsare less than glazed ceramics, like the Hulterstro¨m et al. (1993) and NettoJu’nior et al. (2006) and Wright (2004); (Hulterström 1993) and (Wright 2004), but the fi ndings difference can be found in used ceramics, exist-

Alireza Izadi et al.
534 COMPARISON OF SURFACE ROUGHNESS BETWEEN CO2 LASER AND TYPICAL GLAZING BIOSCIENCE BIOTECHNOLOGY RESEARCH COMMUNICATIONS
ence of laboratory errors and used methods in glazing and polishing materials.
Also, we can claim based on mentioned studies that consensus is not available between researchers about the effects of glazing or different ways of fi nishing and pol-ishing to reduce the surface roughness of ceramic and porcelains, So, existence of different and even contradic-tory fi ndings in studies is not far, results can be differ-ent due to use of produced commercial different brands, different used methodologies in the studies and different investigated variables and way of porcelain preparation, for example, the temperature at which the samples are prepared in their presence can have big impact in surface roughness of samples,we should note that created tem-perature by thermocouple can’t alwaysbe demonstrator ofreal temperature, because the surrounding tempera-ture can cause the loss of some of these temperatures.If you have not considered this matter, it may provide different and even confl icting results about the surface roughness in different glazing methods.
Sarikaya and Güler (2010) addressed to effect of dif-ferent polishing techniques at the surfaces ofdental por-celains surface roughness in a study. Their fi ndings which is confi rmation ofpresent study fi ndings also wad showed that using glazing can reduce the surface roughness com-pared to other polishing methods (Sarikaya 2010). Also, Tholt et al. (2006) surveyed and measured the surface roughness of prepared dental ceramics with different fi n-ishing techniques by using Atomic Force Microscope and Profi lometer, (Tholt et al., 2006). They found that there are differences betweendifferent porcelains with different ways of polishing, as well as they found as present study that glazing method causes less surface roughness com-pared with other fi nishing and polishing methods. Speed of the used method in present study for porcelain glaz-ing, is the main advantage of this method compared to autoglazing techniques to typical method.
CONCLUSION
RZ item of porcelains surface roughness amount (Aver-age of maximum violence height)with typical glazing-was signifi cantly greatercompared to porcelains that were glazed by co2 laser, although the ANOVA test between Ra, Rpm groups didn’t show signifi cant differ-ence. Also, not glazed porcelains that had just polished, had more surface roughness signifi cantly compared to porcelains that were glazed by co2 laser.
REFERENCES
Alavi, A.A., Behroozi, Z. and Eghbal, F.N., 2017. The Shear Bond Strength of Porcelain Laminate to Prepared and Unpre-pared Anterior Teeth. Journal of Dentistry, 18(1), p.50.
Al-Wahadni, A., 2006. An in vitro investigation into the sur-face roughness of 2 glazed, unglazed, and refi nished ceramic materials. Quintessence international, 37(4).
Barghi, N., King, C.J. and Draughn, R.A., 1975. A study of por-celain surfaces as utilized in fi xed prosthodontics. The Journal of prosthetic dentistry, 34(3), pp.314-319.
Barghi, N., Alexander, L. and Draughn, R.A., 1976. When to glaze—an electron microscope study. The Journal of prosthetic dentistry, 35(6), pp.648-653.
Brackett, S.E., Leary, J.M., Turner, K.A. and Jordan, R.D., 1989. An evaluation of porcelain strength and the effect of surface treatment. The Journal of prosthetic dentistry, 61(4), pp.446-451.
Brentel, A.S., Kantorski, K.Z., Valandro, L.F., Fucio, S.B., Pup-pin-Rontani, R.M. and Bottino, M.A., 2011. Confocal laser microscopic analysis of biofi lm on newer feldspar ceramic. Operative dentistry, 36(1), pp.43-51.
el-Karaksi, A.O., Shehab, G.I. and Eskander, M.E., 1993. Effect of reglazing and of polishing on the surface roughness of new ceramic restorations (Hi-ceram). Egyptian dental journal, 39(3), pp.485-490.
Fuzzi, M., Zaccheroni, Z. and Vallania, G., 1996. Scanning electron microscopy and profi lometer evaluation of glazed and polished dental porcelain. International Journal of Pros-thodontics, 9(5).
Garcia, R.D.P., 2015. Efeitos citotóxicos e genotóxicos das ligas de solda de prata em ortodontia: revisão sistemática (Master’s thesis, Pontifícia Universidade Católica do Rio Grande do Sul).
Gonzaga, C.C., Okada, C.Y., Cesar, P.F., Miranda, W.G. and Yoshimura, H.N., 2009. Effect of processing induced particle alignment on the fracture toughness and fracture behavior of multiphase dental ceramics. dental materials, 25(11), pp.1293-1301.
Chang, C.W., Waddell, J.N., Lyons, K.M. and Swain, M.V., 2011. Cracking of porcelain surfaces arising from abrasive grind-ing with a dental air turbine. Journal of Prosthodontics, 20(8), pp.613-620.
Fairhurst CW, Lockwood P E, RingleRD, Thompson WO., 1992. The effect of glazeon porcelain strength.Dent.Mater, 8, pp. 203-207.
Giordano, R.A., Campbell, S. and Pober, R., 1994. Flexural strength of feldspathic porcelain treated with ion exchange, overglaze, and polishing. The Journal of prosthetic dentistry, 71(5), pp.468-472.
Griggs, J.A., Thompson, J.Y. and Anusavice, K.J., 1996. Effects of fl aw size and auto-glaze treatment on porcelain strength. Journal of dental research, 75(6), pp.1414-1417.
Güler, A.U., Sarikaya, I.B., Güler, E. and Yücel, A.Ç., 2009. Effect of fi ller ratio in adhesive systems on the shear bond strength of resin composite to porcelains. Operative dentistry, 34(3), pp.299-305.
Hulterström, A.K. and Bergman, M., 1993. Polishing systems for dental ceramics. Acta Odontologica Scandinavica, 51(4), pp.229-234.

Alireza Izadi et al.
BIOSCIENCE BIOTECHNOLOGY RESEARCH COMMUNICATIONS COMPARISON OF SURFACE ROUGHNESS BETWEEN CO2 LASER AND TYPICAL GLAZING 535
Kelly, J.R., Nishimura, I. and Campbell, S.D., 1996. Ceramics in dentistry: historical roots and current perspectives. The Jour-nal of prosthetic dentistry, 75(1), pp.18-32.
Kelly, J.R., 1997. Ceramics in restorative and prosthetic den-tistry. Annual Review of Materials Science, 27(1), pp.443-468.
Lohbauer, U., Scherrer, S.S., Della Bona, A., Tholey, M., van Noort, R., Vichi, A., Kelly, J.R. and Cesar, P.F., 2017. ADM guid-ance-Ceramics: all-ceramic multilayer interfaces in dentistry. Dental Materials, 33(6), pp.585-598.
Marshall, D.B., Evans, A.G., Yakub, B.K., Tien, J.W. and Kino, G.S., 1983, February. The nature of machining damage in brit-tle materials. In Proceedings of the Royal Society of London A: Mathematical, Physical and Engineering Sciences (Vol. 385, No. 1789, pp. 461-475). The Royal Society.
Morena, R., Lockwood, P.E. and Fairhurst, C.W., 1986. Fracture toughness of commercial dental porcelains. Dental Materials, 2(2), pp.58-62.
Motro, P.F.K., Kursoglu, P. and Kazazoglu, E., 2012. Effects of different surface treatments on stainability of ceramics. The Journal of prosthetic dentistry, 108(4), pp.231-237.
Prasad, S., Monaco, E.A., Kim, H., Davis, E.L. and Brewer, J.D., 2009. Comparison of porcelain surface and fl exural strength obtained by microwave and conventional oven glazing. The Journal of prosthetic dentistry, 101(1), pp.20-28.
Podshadley, A.G. and Harrison, J.D., 1966. Rat connective tis-sue response to pontic materials. The Journal of Prosthetic Dentistry, 16(1), pp.110-118.
Quinn, G.D., Hoffman, K. and Quinn, J.B., 2012. Strength and fracture origins of a feldspathic porcelain. Dental Materials, 28(5), pp.502-511.
Raigrodski, A.J. and Chiche, G.J., 2001. The safety and effi cacy of anterior ceramic fi xed partial dentures: a review of the lit-erature. The journal of prosthetic dentistry, 86(5), pp.520-525.
Raigrodski, A.J., 2004. Contemporary materials and technolo-gies for all-ceramic fi xed partial dentures: a review of the lit-erature. The Journal of prosthetic dentistry, 92(6), pp.557-562.
Reham M. Abdallah1, Ibrahim M. Hammouda, Mostafa Kamal Mohammed, OssamaB. Abouelatta and Abeer A., 2014. El Fallal Surface treatment of dental porcelain: CO2 laseras an
alternative to oven glaze(2014)Laser Glazing Interaction with DentalCeramics.BJR, pp. 090-104.
Sarac, D., Sarac, Y.S., Yuzbasioglu, E. and Bal, S., 2006. The effects of porcelain polishing systems on the color and surface texture of feldspathic porcelain. The Journal of prosthetic den-tistry, 96(2), pp.122-128.
Sarikaya, I. and Güler, A.U., 2010. Effects of different polish-ing techniques on the surface roughness of dental porcelains. Journal of Applied Oral Science, 18(1), pp.10-16.
Scherrer, S.S., Kelly, J.R., Quinn, G.D. and Xu, K., 1999. Frac-ture toughness (K IC) of a dental porcelain determined by frac-tographic analysis. Dental Materials, 15(5), pp.342-348.
Sgura, R., Reis, M.C., Hernandes, A.C., de Abreu Fantini, M.C., Andreeta, M.R.B. and Medeiros, I.S., 2015. Surface treatment of dental porcelain: CO2 laser as an alternative to oven glaze. Lasers in medical science, 30(2), pp.661-667.
Tholt, B., Miranda-Júnior, W.G., Prioli, R., Thompson, J. and Oda, M., 2006. Surface roughness in ceramics with different fi nishing techniques using atomic force microscope and pro-fi lometer. Operative dentistry, 31(4), pp.442-449.
Vieira, A.C., Oliveira, M.C., Lima, E.M., Rambob, I. and Leite, M., 2013. Evaluation of the surface roughness in dental ceram-ics submitted to different fi nishing and polishing methods. The Journal of Indian Prosthodontic Society, 13(3), pp.290-295.
Wright, M.D., Masri, R., Driscoll, C.F., Romberg, E., Thompson, G.A. and Runyan, D.A., 2004. Comparison of three systems for the polishing of an ultra-low fusing dental porcelain. The Journal of prosthetic dentistry, 92(5), pp.486-490.
Wu, H., Fan, J.W., Chao, M.J., Fu, L.J. and Chen, H., 2013. Laser Glazing of Peacock Blue Glaze on Porcelain. In Advanced Materials Research (Vol. 712, pp. 366-372). Trans Tech Publica-tions.
Yilmaz, K. and Ozkan, P., 2010. The methods for the generation of smoothness in dental ceramics. Compend Contin Educ Dent, 31(1), pp.30-2.
Yilmaz, K. and Özkan, P., 2010. Profi lometer evaluation of the effect of various polishing methods on the surface roughness in dental ceramics of different structures subjected to repeated fi rings. Quintessence International, 41(7).

Agricultural CommunicationBiosci. Biotech. Res. Comm. 10(3): 536-541 (2017)
Comparative studies on cooking qualities of aged
brown and polished rice, Oryza sativa
V. K. Tiwari1, Neha Pachlasiya2 and H. L. Sharma3
Department of Post-Harvest Process and Food Engineering, Faculty of Agricultural Engineering, Jawaharlal Nehru Krishi Vishwa Vidyalaya, Jabalpur 482004 (MP) India
ABSTRACT
A comparative study of cooking quality of brown rice and polished rice (i.e. volume, length, breadth, thickness expansion ratio, water uptake ratio and optimum cooking time) with respect to different time was carried out in the laboratory of Post-Harvest Process and Food Engineering College of Agricultural Engineering, JNKVV, Jabalpur. Brown rice and polished rice was procured from Singhai Rice Mill village Panagar, Jabalpur and kept for three months at ambient condition. Sample from aged raw and polished rice were withdrawn and cooked for 3, 5 and 7 minutes for evaluation of cooking quality. It was observed that the length expansion ratio (LER) of polished rice was maximum (1.46) as compared to brown rice for all type of cooking, breadth expansion ratio was maximum (1.45), thickness expansion ratio (TER-1.22), volume expansion ratio of polished rice (VER-2.6), the water uptake of polished rice was maximum (1.78) as compared to brown rice. However cooking time was minimum for polished rice when cooked for 3, 5 and 7 minutes as compared to brown rice.
KEY WORDS: BROWN RICE, POLISHED RICE LENGTH, BREADTH, VOLUME EXPANSION RATIO, WATER UPTAKE RATIO, OPTIMUM COOKING TIME
536
ARTICLE INFORMATION:
*Corresponding Author: [email protected] 21st July, 2017Accepted after revision 25th Sep, 2017 BBRC Print ISSN: 0974-6455Online ISSN: 2321-4007 CODEN: USA BBRCBA
Thomson Reuters ISI ESC and Crossref Indexed Journal NAAS Journal Score 2017: 4.31 Cosmos IF: 4.006
© A Society of Science and Nature Publication, 2017. All rights reserved.Online Contents Available at: http//www.bbrc.in/DOI: 10.21786/bbrc/10.3/30
INTRODUCTION
Rice (Oryza sativa L ) is a cereal grain and an important staple food for a large part of the world’s human popu-lation. Among cereals, rice is even more nutritious than wheat. India is the world’s largest producer of rice. India produced 105 million tonnes rice in the year 2017 (www.fci.gov.in). Brown rice is unpolished whole rice grain
that is produced by removing only the husk using the rubber rolls. Distinguish factor is its unpolished features and not the colour. Post-harvest researchers reported that the milling recovery in brown rice is 10% higher than polished rice. It contain minerals (prevents beriberi) and high fat (energy source). Also it has been reported that brown rice contains high phytic acid (antioxidant, anti-cancer); it decreases serum cholesterol (prevents

Tiwari, Pachlasiya and Sharma
BIOSCIENCE BIOTECHNOLOGY RESEARCH COMMUNICATIONS COMPARATIVE STUDIES ON COOKING QUALITIES OF AGED BROWN AND POLISHED RICE 537
cardio-vascular diseases) and is considered a low glyce-mic index food (low starch, high complex carbohydrates which decrease risk to type 2 diabetes). Moreover, brown rice contains large amount of insoluble fi bre, which may prevent a variety of cancers. There are many benefi ts of brown rice. The fuel savings in milling process is 50-60% because the polishing and whitening steps are eliminated. In this way the milling time is also shortened with less labour requirements, also, the enhancement in output volume and the economy in milling indicated the business opportunity in brown rice (Rogelio, 2003 Kumar et al., 2017).
Brown rice when being cooked, becomes a sticky or pasty mass, swells only slightly and leaves a thick gruel. All these cooking properties may not be accustomed to most consumers who prefer fl uffy and hard texture. The desired cooking properties can normally be obtained by storing freshly-harvested rice for at least 3-6 months (Swamy et al. 1978). Ageing involves changes in physi-cal and chemical properties of the rice grain. Starch, protein and lipids are the main grain components which affect cooking and eating quality (Villareal et al.1976). An unusual property of rice is that its cooking quality depends on its age after harvest. New rice swells poorly during cooking. This undesirable property gradually changes during storage for few months (Patindol, et al. 2005 and Sowbhagya 2001).
MATERIALS & METHODS
Brown rice and polished rice were procured from mod-ern rice mill. The rice was stored at ambient condition for four month in the laboratory Post Harvest Process and Food Engineering Department, College of Agricul-tural Engineering, JNKVV, Jabalpur. Then the samples were withdrawn from the stored rice stock and cooked in the laboratory for different time to evaluate the cooking quality including optimum cooking time.
MOISTURE CONTENT DETERMINATION
Moisture content of sample was determined by standard air oven method (AOAC method). The samples were dried in hot air oven maintained at 103±1ºC for 24 hours.
COOKING QUALITY
Rice expands length wise, breadth wise and thickness wise during cooking by absorbing water. To determine rice length after cooking and rice breadth after cooking 20 milled grains are pre-soaked to 10-30 minute and placed directly into boiling water by directly dropping
until its optimum cooking time .The length, breadth and thickness are measured and the average worked out. The experiment was aimed to determine cooking properties. Rice is considered to have good cooking quality if it has high length expansion ratio (VER), volume expan-sion ratio (LER), water uptake ratio (WUR) and minimum Cooking time (CT) (Juliano, 1985). Length and volume expansion ratio (VER) and water absorption are desir-able for the food service industry as they lead to a fuller plate for the same amount of rice. Length expansion ratio i.e. the ratio of the length of cooked rice to that of raw rice was calculated
Breadth expansion ratio i.e. the ratio of the breadth of cooked rice to that of raw rice was calculated
Thickness expansion ratio i.e. the ratio of the thickness of cooked rice to that of raw rice was calculated
VOLUME EXPANSION RATIO
Volume expansion ratio (VER) was calculated i.e. the ratio of the volume of the cooked rice to the initial vol-ume of the raw rice, using toluene displacement method.
WATER UPTAKE RATIO
Water uptake ratio (WUR) as ratio of water absorbed during cooking to cooked rice weight was calculated by weight of cooked rice and weight raw rice.
OPTIMUM COOKING TIME (OCT)
It is the time taken by a predetermined weight of rice to cook completely. Brown rice and polished rice (2g) samples were taken in test tube and cooked in 100ml distilled water in a hot water bath at 100ºC. The cook-ing time was determined by taking out 20 grains at dif-ferent time intervals during cooking and pressing them between two glass plates until atleast 90% of rice had no longer centres, which is considered as optimum cooking time.

Tiwari, Pachlasiya and Sharma
538 COMPARATIVE STUDIES ON COOKING QUALITIES OF AGED BROWN AND POLISHED RICE BIOSCIENCE BIOTECHNOLOGY RESEARCH COMMUNICATIONS
FIGURE 1. Length expansion ratio of Polished and Brown rice
RESULTS AND DISCUSSION
A comparative study of cooking quality of brown rice and polished rice was initiated to fi nd out signifi cance of polishing of rice. Three aged brown and polished rice was cooked for three minute and 1.135 times increases in length were observed with linear expansion. The graph reveals about the forecast value of length expansion of polished rice at the time of cooking. The linear relation line will always provide the best result for the relation between time of cooking and expansion of polished rice. The maximum value of R observed as 97% and this vari-ability was explained in the expansion of polished rice through the cooking time.It shows that the expansion of polished rice is certainly dependent on the cooking time means the cooking time is one of the best factor. The length expansion ratio for polished and brown rice is represented by models
Y= 0.0677x + 0.98 (1)
Y = 0.0286x + 0.99 (2)
The results of breadth expansion of polished rice (for 5 minute cooking) showed 1.42 times increase as shown in fi g. 2. It is observed that the polished rice expand at faster rate. The maximum value of R observed as 99% and this variability was explained in the expansion of polished rice through the cooking time and the breadth expansion ratio for polished rice and brown rice are rep-resented by models
Y = 0.0781x + 1.0013 (3)
Y = 0.054x + 0.9862 (4)
The graph shows thickness expansion of polished rice increases at faster rate for 7 minute cooking time with 1.22 times increase in thickness. The linear behaviour is shown in fi g. 3. The maximum value of Robserved as 99% and this variability was explained in the thickness expansion of polished rice through cooking time. The thickness expansion ratio for polished rice and brown rice are represented by models.
Y = 0.0318x + 0.9985 (5)
Y = 0.0221x + 0.9638 (6)
The volume expansion of polished rice was higher (for 3 minute cooking time) with1.8 times increase in volume as shown in fi g. 4. It is observed that the pol-ished rice expand at faster rate. The maximum value Robserved as 99% and this variability was explained in the expansion of polished rice through the cooking time. The expansion behaviour can be expressed by following models:
Y = 0.257x + 1.0112 (7)
Y = 0.1234x + 0.9989 (8)
The water uptake ratio increased linearly for polished rice (for 5 minute cooking time) with 1.58 times increase as shown in fi g. 5. The maximum value of R observed as 99% and this variability was explained in the expansion of polished rice and the water uptake ratio of polished and brown rice behaviour can be shown by following models
Y = 0.1066x + 1.0225 (9)
Y = 0.0916x + 0.9865 (10)

Tiwari, Pachlasiya and Sharma
BIOSCIENCE BIOTECHNOLOGY RESEARCH COMMUNICATIONS COMPARATIVE STUDIES ON COOKING QUALITIES OF AGED BROWN AND POLISHED RICE 539
FIGURE 2. Breadth expansion ratio of Polished and Brown rice
FIGURE 3. Thickness expansion ratio of Polished and Brown rice
Less expansion is observed in brown rice in all three dimensions (length. breadth and thickness) because the kernel is covered with thin layer of bran which con-tains oil so that expansion ratio was less in brown rice, Although the brown rice takes more time in cooking but water uptake ratio is high in polished rice. In this study length expansion ratio, width expansion ratio, thick-ness expansion ratio, volume expansion ratio and water uptake ratio of brown and polished rice were determined.
Rice is considered to have good cooking quality if it has high expansion ratio. Water to rice ratio affected chewi-ness of cooked rice. Ratio of water to rice also affected the eating quality rice (Daomukda 2011).
Length expansion ratio of brown and polished rice is shown in fi gure 1. Cooking time of rice varied from 3-7 minutes (with 2 min interval). Polished rice had highest LER as compared to brown rice. This shows the positive correlation of LER with time of cooking (Gujral 2003).

Tiwari, Pachlasiya and Sharma
540 COMPARATIVE STUDIES ON COOKING QUALITIES OF AGED BROWN AND POLISHED RICE BIOSCIENCE BIOTECHNOLOGY RESEARCH COMMUNICATIONS
FIGURE 4. Volume expansion ratio of Polished and Brown rice
FIGURE 5. Water uptake ratio expansion of Polished and Brown rice
Similar results of BER, VER and WUR were also obtained in brown and polished rice. A greater elongation ratio of polished rice is due to absence of bran layer which allows water to enter inside the kernel as compared to brown rice. The results are in agreement with Kumar et al. (2017).
REFERENCES
AOAC (1980) Association of Offi cial Analytical Chem-ists, Offi cial methods of analysis, 13th Edition, Washing-ton, DC, USA.
Juliano B.O. (1985) Rice: Chemistry and Technology. 2nd ed., American Association of cereal Chemists, St. Paul, M.N
Rogelio VC (2003) The National Campaign to Combat Hidden Hunger through Brown In: Consultative Meeting on Nutri-tional Aspect of Brown Rice, September 2003, Food and Nutri-tion Research Inst., Manila, Philippines .
Swamy YM, Sowbhagya CM and Bhattacharya KR (1978) Changes in the physiocochemical properties of rice with aging. Journal of the science of Food and Agriculture 29: 625-627.

Tiwari, Pachlasiya and Sharma
BIOSCIENCE BIOTECHNOLOGY RESEARCH COMMUNICATIONS COMPARATIVE STUDIES ON COOKING QUALITIES OF AGED BROWN AND POLISHED RICE 541
Villareal CP, Maranville JW and Juliano BO (1991).Nutrient content and retention during milling of brown rice from the international Rice Research Institute. Cereal Chem.68:437-440.
Patindol, J., Wang, Y.J. and Jane, J. I. 2005 Structure-function-ality changes in starch following rough rice storage. Starch/Starke, 2005,57,197e207.
Sowbhagya, C.M. and Bhattacharya, K.R. 2001 Changes in pasting behaviour of rice during ageing. Journal of Cereal Science.2001,34:115e124.
Daomukda, M., Moongngarm,A., Payakapol, L. and Noisu-wan, A. 2011 Effect of cooking methods on physicochemical
properties of brown rice. 2nd international conference on Envi-ronment Science and Technology, IACSIT Press, Singapore, 2011,6(2),1-4.
Gujral, H.S. and Kumar,V. Effect of accelerated ageing on the physicochemical and textural properties of brown and milled rice. Journal of Food Engineering, 2003,59,117-121.
Kumar, A.,Bhople,S.,Kumar,N.,and Tiwari,V.K.2017 Effect of ageing, moisture contents and storage structures on nutri-tional and cooking characteristics of brown rice during stor-age, J. Food Corporation of India 6 (22),793-800.www.fci.gov.in

Medical CommunicationBiosci. Biotech. Res. Comm. 10(3): 542-550 (2017)
Perceived challenges by the Iranian baccalaureate
surgical technology students in their clinical education:
A qualitative study
H. Karimi Moonaghi1, R. Zardosht2*, M. Etezad Razavi3 and S. Ahmady4
1Ph.D Nursing Education, Associate Professor, Evidence-Based Caring Research Center, Department of Medical-Surgical Nursing, School of Nursing and Midwifery, Department of Medical Education, School of Medicine, Mashhad University of Medical Sciences, Mashhad, Iran2Student Research Committee, School of Nursing and Midwifery, Mashhad University of Medical sciences, Mashhad, Iran3Eye Research Center, Khatam-al-Anbia Hospital, Faculty of Medicine, Mashhad University of Medical Sciences, Mashhad, Iran4Faculty of Medical Education, Shahid Beheshti University of Medical Sciences, Tehran, Iran
ABSTRACT
The operating room fi eld in Iran is a branch of medical sciences during this period, students became become familiar with the new principles of the operation room and modern surgical techniques in specialized and super specialized surgeries and they train the care and assistance to the patient’s administration before, during and after operation. The purpose of this qualitative study is to investigate how the students are taught, the effective factors and possible chal-lenges related to educational issues in the operating room. This is a qualitative content analysis which was performed in 2014-2015. The participants consisted of 35 benefi ciaries in the operating room fi eld, namely, students of different academic terms, matrons, educators (instructors), surgeons and operating room personnel in different academic cent-ers in Khorasan Razavi province who were rich in information and had a tendency to comment on their experience. In this study, sampling was fi rst carried out in a targeted way and then was continued with theoretical sampling and sampling was continued until data saturation. All interviews were recorded and then handwritten and analyzed using continuous comparative method and qualitative content analysis. The profound and deep descriptions of the participants led to the emergence of 13 subcategories and 3 main categories of the “unconventional educational atmosphere”, “the challenge of student admission to the surgical team,” the “operating room culture” and, fi nally,
542
ARTICLE INFORMATION:
*Corresponding Author:Received 21st June, 2017Accepted after revision 27th Sep, 2017 BBRC Print ISSN: 0974-6455Online ISSN: 2321-4007 CODEN: USA BBRCBA
Thomson Reuters ISI ESC and Crossref Indexed Journal NAAS Journal Score 2017: 4.31 Cosmos IF: 4.006
© A Society of Science and Nature Publication, 2017. All rights reserved.Online Contents Available at: http//www.bbrc.in/DOI: 10.21786/bbrc/10.3/31

H. Karimi Moonaghi et al.
BIOSCIENCE BIOTECHNOLOGY RESEARCH COMMUNICATIONS PERCEIVED CHALLENGES BY THE IRANIAN BACCALAUREATE SURGICAL TECHNOLOGY STUDENTS 543
one main theme of the “dynamic nature of the operating room”.The special educational environment in the operat-ing room environment, lack of acceptance of students in the surgical team as a training member and hierarchical culture of the operating room, has created problems for the training of these students. In fact, the clinical training of operating room students is based on teamwork and the members of the surgical team are, in some cases, instructors in the shade. Given the dynamic nature of the operating room, collaboration and participation between educational and clinical institutions can help improve the learning environment, acceptance students in the surgical team as a training member, and creating a dynamic, collaborative and fl exible culture.
KEY WORDS: PERCEIVED CHALLENGES IRANIAN BACCALAUREATE SURGICAL TECHNOLOGY STUDENTS
INTRODUCTION
Bachelor of Science in surgical technology in Iran is a branch of medical science during which the students become familiar with new principles of surgical tech-nologies in specialty and subspecialty surgeries and they learn how to care and help the patients before, during and after surgery (Operating Room and Anesthesia,2017).Training programs of operating rooms are offered in two ways worldwide: in the fi rst case, nursing gradu-ates (after achieving a bachelor’s degree) are trained in a period of 1-2 years to enter the operating room. In the second case, surgical technicians, after general training of the operating room, are prepared to act as a mobile and scrubs and then, if desired, they are prepared as the fi rst help of the surgeons in a period of 1/5 to 2/5 years. Standards of patient care in the community of operat-ing room nurses in America also show that students of operating room technician can pursue their education in specialized courses in higher education. The people of each period have their own duties and the role of these specialized people is different from the operating room technician. Operating room is a complex system that coordinates the individual, technology, and patients in a physical environment to achieve favorable out-comes in patients (Islamic Republic of Iran Ministry of Health and Treatment and Medical Education Supreme Council for Planning of Medical Sciences, 2007). Oper-ating room is considered as high-risk environment for patients, because in spite of the small number of cases, some potential problems of patients after the surgery are due to the mistakes of the operating room personnel that can lead to the death of the patients (Deyoung 2009).
In Iran, students of surgical technology are admitted directly based on the exam and with no relation to nurs-ing. This fi eld, in different colleges between the years 1987 to 2001 and it was launched at the undergraduate across the country, was launched in the associate degree level in 2009 (Operating Room and Anesthesia, 2017). Due to the fact that now in Iran there is no training courses in doctoral degree (Ph.D.) for surgical technol-ogy and its MA was launched only two years ago, MS nurses in internal injuries (with work experience in the
operating room or an associate degree in surgical tech-nology) take the responsibility of the practical and theo-retical training of this group of students in educational centers. Given that the fi eld is new and considering the volume increasing of training centers for students, it is not considered the required infrastructures such as spe-cialist human resources in clinical training and educa-tional facilities in proportion to the number of students. There is not enough number of teachers in the fi eld, so in many centers teaching this group, traditionally, is given to the supervisors and operating room person-nel. Subsequently, due to lack of necessary knowledge of educational affairs, students have faced with problems in their training (Bahrami et al 2014).
The purpose of the training is the optimal and effec-tive care of patients before, during and after the sur-gery especially in the specialized surgeries, control and prevention of nosocomial infections as well as creating the perfect mental conditions for patients and proper maintenance of devices and medical equipment (Islamic Republic of Iran Ministry of Health and Treatment and Medical Education Supreme Council for Planning of Medical Sciences 2007). However, some items such as technical approach to the fi eld, high expectation of the graduates in this fi eld to help surgeons, and sepa-ration from nursing have caused the graduates to not have enough knowledge of nursing care of patients before and after surgery as well as communication with patients. So, they have just learned the technical skills during the surgery (Bailey 2010).
Foreign countries’ researches have reported about training in the operating room which is connected with the collaboration (Silen-Lipponen et al., 2004) stress, communication failures (Laur et al., 2012), the effect of stress on other members and students (Kenton 2006) and to the development of the group of Skoczyl et al. (2005). The difference in the education of graduates of the sur-gical technology in Iran and other countries has caused the results of the studies in the fi eld to be inapplicable in the country. Unfortunately, there is not extensive and effi cient research in the surgical technology in the coun-try. Conducted researches are quantitative and investi-gate certain aspects of education in surgical study. So,

H. Karimi Moonaghi et al.
544 PERCEIVED CHALLENGES BY THE IRANIAN BACCALAUREATE SURGICAL TECHNOLOGY STUDENTS BIOSCIENCE BIOTECHNOLOGY RESEARCH COMMUNICATIONS
they are not able to analyze all aspects of education in the surgical technology (Bahrami et al., 2014; Khazaei et al., 2014, Tazakori et al., 2016).
However, qualitative approaches have holistic approach to the phenomenon and gain precious informa-tion about the training in the clinical environment. The aim of this qualitative content analysis is the evaluation of teaching the students, their required skills, effective factors and potential challenges associated with educa-tional issues in the operating room. Planning to elimi-nate the defects of the fi eld improves the knowledge and skills of students in this fi eld, provides better care for patients, and ultimately improves the health system.
MATERIAL AND METHODS
The study is a qualitative content analysis study (part of a larger study). It was conducted in 2014-2016 to reveal the problems and challenges of education in the fi eld of surgical technology in Iran. The environment includes all the operating rooms of educational hospi-tals of Khorasan Razavi (Mashhad, Nishabur, Torbat Hei-darieh and Gonabad). The interview was done in places that are accessible to participants or places they desired. The participants were 35 of benefi ciaries of education in surgical technology such as the students of differ-ent academic semesters, head nurses, teachers, surgeons and operating room personnel at various universities in Khorasan Razavi province. They have precious informa-tion and they were willing to recount their experiences. Sampling was done by using purposive sampling and continued by theoretical sampling. Some of the charac-teristics of the participants are as follows: willingness to participate in research and express their experiences, students who had spent at least one training courses, educators who had at least a year of training in the oper-ating room, and operating room personnel who had at least one year of work experience in the room.
Data were collected by using semi-structured indi-vidual interviews. The interview was started by general questions regarding the interview directory and was
guided by the responses of participants. After explaining the objectives of the plan to participants and obtaining informed consent, data collection was began. The main question were as follows: what makes you to call a day of the training as good and useful? Or feel the training is not of enough interest today? Mention a good expe-rience and a bad experience from your training in the operating room? What are the facilitating and impeding factors in your clinical training?
A total of 37 interviews was carried out (35 initial interview and two follow-up interviews). The study continued from Tir 93 to Azar 95 (Iranian year). The researchers tried to consider the maximum variation in the sampling; (14 students, 6 Operation room person-nel with associated degree or BS in surgical technology or BS in nursing, 4 operating room heads, 6 training teacher, one Dean of the Faculty, 3 surgical assistants and one surgical staff). Educational centers of Khorasan Razavi included Mashhad, Torbat Heydarieh, Gonabad and Nishabur. Data were analyzed according to conven-tional content analysis.
The data analysis was based on Graneheim and Lun-dman in seven steps (Graneheim and Lundman 2004). In the fi rst step, all interviews were recorded and tran-scribed. Then, the decision made about the analysis unit and before starting the coding process, text of interviews was read several times as the unit of analysis. Mean-ing Units were also read and reviewed several times and unrelated statements were deleted. First, some units were defi ned and relevant codes of each Meaning unit were written and then the codes were classifi ed inductively and based on common sense and meaning.
The process of data reduction was continued in all units of analysis and primary and secondary classes. In other words, subclasses with similar events are grouped together as classes and then primary classes formed and this trend continued up to the theme. It should be noted that during the analysis the necessary changes were done in the name of the classes which must show the content of the class. The analysis was continually conducted by adding up each interview and the classes were modifi ed. To simplify the process of data analysis,
ParticipantsNumberAgeGenderWork experience in the operation room
Student1422-2011 females/3 malesSemester 4 to 8
Training teacher648-355 females/1 male3-20 years
Operating room personnel655-325 females/1 male8-25 years
Dean of the Faculty152Male-
Assistant348-32Chanbge this year to
English Calender Male4-5 years
Staff153Male17 years
Operating room head455-32Male15- 29 years

H. Karimi Moonaghi et al.
BIOSCIENCE BIOTECHNOLOGY RESEARCH COMMUNICATIONS PERCEIVED CHALLENGES BY THE IRANIAN BACCALAUREATE SURGICAL TECHNOLOGY STUDENTS 545
coding, cataloging and classifi cation, comparing various data frequently and retrieving quotes, we used software MAXQDA 10 (Mayring 2000).
To increase the reliability and validity of the results, we used the methods used by Cuba and Lincoln that were quoted by Polit and Hungler. The two research-ers consider the four criteria of confi rm ability, cred-ibility, dependability and transferability as necessary for the consistency and strength of qualitative data (Burn and Grove 2007). Therefore, researchers have helped to validate data with continuous involvement with data, data verifi cation by the participants, allocation of suf-fi cient time to the study and open communication and empathy with the participants. In order to determine the dependability, two separate research teams coded the Interviews that there was a high degree of agreement (85%) between the comments. Also, great care was done in the collection, implementation and recording of data and allocating of enough time to collect the data. As for the transferability, manuscripts, interviews and units of analysis with extracted initial codes were provided to participants and the necessary corrections made and the proposed points were considered. In addition, three expert in the fi eld of qualitative research monitored the study. Using a combination of methods (interviews and fi eld notes) as well as sampling with maximum diversity (interviews with students of different academic semesters from different training centers, faculty-member educa-tors, non-faculty member educators, and surgeons with different expertise) have increased the confi rm ability and transferability of the data. In addition, describing the studied background, providing necessary explana-tions about the participants and using of their direct quotations was also done in this regard.
Ethical considerations in this study include: obtain-ing ethical permits from Committee for Medical Research
Ethics of Medical Sciences of Mashhad (ethical code 940548), explaining the purpose of the study and the use of tape recorder, explaining the way of collecting data for the participants and satisfying them to cooperate, obtaining consent in writing for conscious participation and paying attention to the basics including the research explanation, identifying the purpose of the study, stat-ing the criteria for sample selection, the benefi ts of participation in the research, ensuring the anonymity, answering questions, the right to refuse to continue the research, providing adequate information and assuring the participants to put the interviews in a safe place.
RESULTS AND DISCUSSION
Data analysis of participants’ statements and notes in the fi eld lead to the emergence of 12 subcategories and 3 main categories and eventually one main theme.
Main category: unconventional educational atmosphere
This category includes the following subcategories: lack of facilities and trainers, lack of balance between train-ings and goals, red lines, safety and sterility principals, the confrontation of the caring and technical roles of stu-dents and the simultaneous presence of other students.
Lack of facilities and teachers: learning environment has been considered as a key environment for education and training of students and for helping to link theory with the practice in the clinical setting. The data in this study showed that the participants are not satisfi ed with their learning environment. A training teacher with sev-eral years of experience in the operating room, says: ”In the classroom sometimes it is required to explain or draw a part of something and there is no whiteboard and facilities there. There is no place for equipment and
SubcategoryMain categoryMain theme
Lack of facilities and teachers
Unconventional educational environment
The
dyna
mic
nat
ure
of o
pera
ting
room
Lack of balance between training and goals
Red lines, safety and sterility principals
The confrontation of caring and technical roles of students
The simultaneous presence of other students
Annoying students and reduction of team speedChallenge to admit students to the surgical team
Lack of required knowledge and skills
The absence of the trainer and humiliation of the students
Teamwork
Operating room culture
Gender discrimination
Hierarchical structure (physicians governorship)
Paradox of Professional interactions and inappropriate interactions
Duality of behaviors and the absence of legalism

H. Karimi Moonaghi et al.
546 PERCEIVED CHALLENGES BY THE IRANIAN BACCALAUREATE SURGICAL TECHNOLOGY STUDENTS BIOSCIENCE BIOTECHNOLOGY RESEARCH COMMUNICATIONS
relaxation of students and it seems as though they do not have facilities for us”. The conversion of associate degree to bachelor and the increase of the number of students regardless of the required infrastructure have created problems. The operating room head who has been in charge of training courses says: “The teacher cannot afford to train the students due to the increas-ing number of students as well as the presence of stu-dents from semester 4, 6, 8,”. A student says:” teachers cannot teach us everything and do not have time to do so”.In educational centers of cities other than Tehran, students actually cannot see thoracic and cardiac sur-geries, advanced neurological and eye surgery. “Due to the low number of operating rooms and lack of variety in surgeries, the trainings in the cities are the same and students see the same surgeries in the semester 8 that had seen in semester 2”
Lack of trainers: it is hard to understand the routine and special procedures of hospitals for educators who temporarily go to the hospital with students. Absence of the trainer or the use of non-professional teachers or staff have affected the clinical training of surgical tech-nology students. A student says: “When we do not have any trainers, the only thing is the attendance. Then, they told us to go to the rooms and it is not important to learn or not to learn”. In multiple studies, students’ con-fusion and uncertainty in the absence of the trainer has been reported as factors causing problems.
“Of course, depending on the hospital, when we do not have trainer and the nurse is responsible for check-ing, there is no problem if we are late. I do not remember any washing. Because we do not have fi xed trainer, they do not have us to do morning washing.
Mismatch between educational objectives and training objectives: Data analysis showed that the stu-dents complain about the aimless trainings and they consider the lack of transparency in goals and evaluat-ing the training as a major problem. A senior student says: the lesson plan is originally for apprenticeship and they should it to students to understand what they do. In fact, I mean that we should be given a sheet based on which they evaluate us. I have not seen anything and most professors evaluate us based on scrub “Students considered as useless some training courses including recovery or management trainings. A student says: “We have weaknesses in fi le writing and recording of HIS and I personally cannot do this. At least they should include this in training courses. “A student told about the lack of training in Laparoscopy: “I went to the room for laparoscopic surgery and it was cholecystectomy. I did not know anything about laparoscopy even the the-ory. The personnel came and taught me quickly.
Red lines, safety and sterility principals: the operat-ing room is a complex system in which an individual
coordinates the technology and patients in a physical environment to achieve optimal outcomes in patients. Data analysis showed that the majority of operating room personnel are sensitive to safety and sterility prin-cipals of patients. A personnel says:
“If we told them to cover your hair, they would think it is because of Hijab but it is not and if the hair go to the sterile fi eld, it can cause infection and problems for patients. Although we notify them, they hate. The health is important here and you can be as you will out of here. And you have to comply with the rules and stand-ards here.” On the other hand, surgeons also have their own reasons for patient safety: “The patient has trusted the surgeon about his life and the decision maker is the surgery team. Survival is not interchangeable with any-thing. It is not acceptable to put the life of the patient in danger.”
Confrontation of caring roles and technical roles of students: in the operating room environment, compared to the other sectors, a specifi c aspect of care is mostly emphasized that is technical. One of the participants says:”If we look at it as a scientifi c discipline, we must go beyond the skills and consider it as theory-based thing. The problem here is that it seems most of the duties designated for the graduates of this fi eld is practi-cal, but this fi eld is subdivision of the Nursing Science. The thing that now is happening is the technical look at the graduates of the fi eld. So, they are expected to know the equipment and to help the surgeons in the surgery.
Simultaneous presence of students from other disciplines: the difference in the type of training and simultaneous activity of surgical technology and other students and operating team make the operating room training more different and diffi cult than other parts of the hospital. Faculty member trainer with 14 years of experience in training in the operating room says: “Simultaneous presence of students with different lev-els of training from freshmen to residents and even the professor himself in a place leads to different clinical experience in the place and the students cannot keep up with the situation and it is diffi cult to them.
Second category: the challenge of admitting the
students in the surgical team
This category includes annoying students and the reduc-tion of the team speed, lack of the required knowledge and skills of students, the absence of the trainer and the humiliation of students. Data analysis showed that the surgeon believes in the priority of patient safety and the life rather than the training and he/she seeks a surgery with minimal side effects for the patient.
Annoying students and the reduction of the team speed: an operating room personnel in this regard says:”The students are beginners and annoying. The

H. Karimi Moonaghi et al.
BIOSCIENCE BIOTECHNOLOGY RESEARCH COMMUNICATIONS PERCEIVED CHALLENGES BY THE IRANIAN BACCALAUREATE SURGICAL TECHNOLOGY STUDENTS 547
personnel’s works are rapid and easy, but it is not the same for students. They stand there without doing any-thing even when the assistant wants to move to the other place. Another trainer says:”Students in the oper-ating room are uninvited guests and physicians and sur-geons are sensitive to the students. Unfortunately, I’m concerned about the students and I permanently turn around in their room and it leads to sore feet because there is no place to sit.
Lack of required knowledge and skills of students: Interview with operating room assistants showed that admitting the students in the surgery team causes some problems.”We had a student that knew no equipment. In the middle of the surgery we had to change him because it was a two hour surgery and we were just cutting the area without doing anything. He had lowered our speed and we had to change him.
Absence of the trainer and the humiliation of students:
a student says:
“When we did not have the trainer, the personnel took the responsibility and the only important thing was the attendance. Then we were told to go to the rooms and it was up to us to learn or not to learn. “I thought that I am a useless creature that gets humiliated and the students were blamed for any mistakes.”
Or another student talks about the impact of every single person on the admission of the student in the team: “The surgery began and we wanted to go to the room, but the surgeon did not allow. As I said it depends on the surgeon and other factors and all of these are effective in our training.
Third category: The operating room culture
This category includes teamwork, gender discrimination, hierarchical structure (surgeon as the governor), paradox of professional interactions and inappropriate interac-tions, behavior duality and lack of rule of law.
Teamwork: Since the operating room environment is of interactive and dynamic nature, to make the surgery team more cooperative and to eliminate the confusion of the students in the room, the clinical education program of the students should be transparent for the operating room personnel. Some operating room personnel do not consider the participation in the training as a part of their duties and even disappoint the students and the trainers with inappropriate behavior and create an unfa-vorable atmosphere. However, some staff play the role of the trainer for the students. “Most guys say that the edu-cator plays an important role in the training. However, I say some personnel are the trainers of the students and they explain for you the techniques step by step in the operating room. Faculty member instructor with 14 years of work experience in training says: “See! It is a
teamwork and each and every member of the operating room can have clinical effect. Perhaps the least role is for the head nurse and the personnel in the room have the greatest role in training students.
Gender discrimination: One of the known causes of stress in operating room environment for students is the others’ behavior.”A senior student says: unfortunately, some personnel or male surgeons work with female stu-dents. I like justice not discrimination. It is not fair to dis-miss the female students earlier than males. If the female students cry, the personnel and the surgeon will change.
Hierarchical structure (doctor as the governor) researchers believe: a good clinical setting has non-hier-archical structure in which the works are done in teams or groups and there is good communication. A trainer says:”Look! When you have a pretentious assistant who does not know his work well and says I’m very good and am in a hurry, he does not let the students use the equip-ment correctly. He watches the student carefully. How-ever, a patient assistant says take your time we are not in hurry and even tells anesthesiologist that we need more time. Unfortunately, we don’t have many of this surgeons and you have to have a chance to work with them.
Paradox of professional interactions and inappro-priate interactions: To make a team work so effi cient, team members should be familiar with their capabilities. This leads to appropriate interactions between them and coordinates them. The trainer says:”Even students work more with good communicators. He might not be well in the knowledge, but he is good at communication. When he graduates, he is better than a good student with weak relationship and this is important. One of the operating room personnel in connection with the close interaction in the environment of operating rooms says: “some stu-dents abuse this open communication and some of them do not have the capacity of such communication.
Studies have shown that in a good clinical setting the interactions are not top-down and the work is done interactively. Data analysis and statements from stu-dents and educators in this study shows that surgeons have a top-down look to surgery team especially sur-gical technology students. This behavior is not in the framework of the operating room rules.”Unfortunately, in Iran the higher the education, the higher the immo-rality and higher education leads to higher immorality.
Behavior duality and lack of rule of law: in the status quo operating room personnel do not consider the coop-eration in training as their duty. And they do not have necessary cooperation with the trainer for providing the required facilities to students and transferring their experiences in the absence of the trainer.”The student is of no position and is blamed for everything wrong even it is the fault of the personnel. Another trainer about the ignorance of some surgeons says:”According to the

H. Karimi Moonaghi et al.
548 PERCEIVED CHALLENGES BY THE IRANIAN BACCALAUREATE SURGICAL TECHNOLOGY STUDENTS BIOSCIENCE BIOTECHNOLOGY RESEARCH COMMUNICATIONS
rules of the school we took a male student to the women operating room. The gynecologist of the room began to quarrel and said to force the student out. Another trainer in connection with the operation room atmos-phere says:”There is no law here. If there is a law, they can be persecuted. However, doctors are the governors and we cannot blame them.
Results of the study show that the challenges of clini-cal education in the operating room in Iran, due to the complex and dynamic nature of operating room, are as follows: special educational environment, problems of admission of the students as a member of the surgi-cal team in operating room, and different culture of the operating room. By comparing these, we can say that the certain circumstances, difference of the operating room, a shortage of faculty member in the department, and less control of the trainer in the clinical environment of the operating room have affected the training opportunities of students in this fi eld.
Operating room (OR) clinical practice involves special contextual elements related to the preoperative nursing process, practical OR nursing skills and teamwork in dif-ferent patient care situations. However, the OR is one of most inaccessible places in a hospital where the use of space is highly regulated. Areas of space are divided into unrestricted, semi restricted and restricted sections, and the physical activities performed within each of these designated areas are differentiated (Riley and Manias 2002). Working conditions for graduates of surgical technology is different than those of other nurses. He is forced to comply with a variety of procedures and high workload quickly and carefully. Due to the quick entry and exit of patients, his work is not expectable and in many cases he is faced with acute and emergency situ-ations and concurrent interactions with members of the surgical team. It can harden the clinical education of the students (Farneya et al 2013).
Because of the special atmosphere of the operating room compared to other sectors, it seems that there is more emphasis on the students of the fi eld in techni-cal skills and specifi c approaches of the care. In Khaz-ayi’s study (2015) about the clinical education of sur-gical technology, the students gave the highest points to the learning opportunities and the lowest points to the performance of educators and educational facilities (Khazaei et al 2014). The high point to learning oppor-tunities is due to the favorable reception in parts that were faced with shortage of human resources and the students played the role of assistance in these sectors. In the study of Ghorbanian et al.(2014), the most impor-tant weaknesses of clinical education of operating room are as follows lack of using teaching aids, inadequate number of patients for learning, lack of knowledge of students of clinical evaluation system, lack of adequate
oversight on the clinical education and lack of decision-making power of the student in planning the care of patients (Ghorbanian et al., 2014).
These are consistent with the contents obtained in our research. In the study of Dehqani et al (2007), the absence of proper scientifi c grounds, lack of interest in the students, confusion and uncertainty of the students in the absence of the trainer were mentioned as factors causing problem for training process (Dehghani et al., 2005). Omidvar et al in Babol University of Medical Sci-ences also considered the problems of clinical education related to health centers’ personnel and their knowledge (Omidvar et al. 2005).
In a similar study by Hadizadeh et al., it was found that the understanding and cooperation of the health centers staff is important in the educational process (Hadizadeh et al., 2005). Providing diverse learning opportunities, receiving proper feedback from trainers as well as clinical environment are the important and effective factors of clinical training in the other country’s studies (Andrews et al., 2006 and O’Driscoll et al., 2010). The results of this study showed that due to the special circumstances of the operating room, the admission of the students as a surgi-cal team member has faced with diffi culties.
Qualitative research of Lingard et al (2002) showed that the communication models in the operating room are complex and socially-motivated. The predominant themes include, time, security, sterilization, resources, roles and conditions. Often, every procedure had 1 to 4 stressful incidents and the stress transferred to other team mem-bers or the environment. In response to the tensions, the trainee of the operation was separated from the surgical team or began to mock. Both of these reactions are nega-tive indicators for the team communications. The results are consistent with the study of Lingard et al (2002).
Tanner and Timmons (2000) emphasized that behav-ior in the OR is different from that in other hospital areas, and that the OR could be described as a ‘backstage’ area. In a backstage area interaction includes joking, talking about aspects of private life and behaving in a famil-iar manner. It also includes gossiping and disrespectful talking, even about patients during narcosis, which was also mentioned in this study. Frontstage behavior is the absence or opposite of this and occurs in the or when the patients are conscious before anesthesia or in the recovery unit (Tanner and Timmons 2000).Perhaps this antagonism between backstage and frontstage behaviors explains the students’ excitement and frustration in the OR. Usually, before their OR placement period, students have spent time in frontstage areas, have dealt with staff more formally and have had closer caring relationships with patients. In addition, some nursing students have previous experience of patient care before enrolling in

H. Karimi Moonaghi et al.
BIOSCIENCE BIOTECHNOLOGY RESEARCH COMMUNICATIONS PERCEIVED CHALLENGES BY THE IRANIAN BACCALAUREATE SURGICAL TECHNOLOGY STUDENTS 549
the programme (Manninen 1998 (which probably makes their views about nursing more frontstage-oriented
In this study, participants have considered the admis-sion to the surgical team as a gateway to opportunities for learning clinical skills and using experience of team members. However, the admission has its own problems. In the study of Tazkori et al (2015), issues related to clinical education in the operating room are as follows, the lack of proper planning for training period, lack of trust in teachers, lack of fl exibility in the face of criti-cism and non-compliance with professional ethics and lack of taking time for clinical and educational consul-tation, lack of learning opportunities in hospitals, lack of familiarity with the described tasks of the students. In Liponen’s study (2004) which was conducted as descrip-tive phenomenology associated with the clinical set-ting of operation room, three types of teamwork were reported from the point of view of students:
Three types of teamwork emerged based on the stu-dents’ perceptions: functional manifestation of OR teamwork, gaining OR team membership and technical orientation of OR teamwork. The fi ndings are discussed in relation to OR practice, education and research on ways to improve teamwork while maintaining a satis-factory OR learning context and stimulating interest in perioperative nursing). (Silen-Lipponen, et al 2004) The implications of this study is consistent with the fi nd-ings of our study. In another study that was conducted in Bushehr University of Medical Sciences, the results showed that the students consider the lack of learning opportunities as one of the educational barriers (Abidi and Motamed 2011).
Although working in the operating room is a team-work and it needs participatory culture, the results of our study showed the hierarchical culture in the clini-cal setting of the operating room and the surgeon is the commander and decision maker and sometimes he/she loses the students’ learning opportunities. Sadeghi et al (2011) believe that a weak and infl exible culture in the organizational environments causes employees not to tend to the innovation, change and creating new ideas and they fear from knowledge sharing. However, a dynamic, collaborative, and fl exible culture reacts well to changes and leads to the progress (Sadeghi,,2011).
As studies show, participation and support from staff increase the learning opportunities for students (Heshmati et al2012). The results of another qualitative research (2004) showed that about 30 percent of the team transactions are faced with communication failure and cause problems. One-third of the cases associated with increased cognitive load (information processing in short-term and activated memory), interrupting the pro-cedure, increased tensions and jeopardizing the safety of the patients (Zeighami et al 2004). However, Heshmatis
study showed that nursing instructors use strategies like skills, realism, responsibility, determination, humility and using the experiences of nurses to attract the col-laboration of clinical staff in providing clinical trainings (Heshmati 2012). However, other studies in our country showed that the nursing teachers have problems in play-ing their educational role (Heshmati et al 2010).
As stated by participants in this study, despite the difference and stressfulness of the clinical setting and its effect on clinical education of the students, participa-tion and cooperation of every member of the surgical team can enhance the quality of the clinical skills of the students and this cannot be achieved unless in envi-ronments with supportive and participatory culture.This qualitative study was part of a larger study considering restriction of the studies with qualitative methodology; Such as: the subjective nature, fi eld-based and their low level of generalizability. Despite these limitations, the results of this study provide deep understanding about the nature of clinical environment of the operating room and the problems related to clinical education of stu-dents of surgical technology.
CONCLUSION
According to the fi ndings of this study, the unconven-tional educational environment in operating room, non-admission of the student in the surgical team as an edu-cational member, and hierarchical culture of operating room have caused problems for these students. Since the work in the operating room is collaborative and con-current, control of this clinical learning environment is diffi cult. In fact, clinical education of the surgical tech-nology students is team-based and all members of the surgical team are, somehow, trainers in the shadow. Due to the dynamic nature of the operating room, coopera-tion of educational and clinical institutions can improve educational environment, admission of the student as an educational member in the surgical team, and creating a dynamic, collaborative and fl exible culture.
ACKNOWLEDGEMENT
This study is part of a larger study and extracted from a doctoral dissertation. Writers appreciate all the great professors who provide the research facilities as well as Deputy Minister for Research and Technology of Mash-had University of Medical Sciences for fi nancial support.
REFERENCES
Abidi N, Motamed N. (2011). School of Allied Health and Nurs-ing students’ and teachers on the Bushehr University of Medi-cal Sciences and Clinical Education. Strides Dev Med Educ; 8(1): 88-93. (Persian)

H. Karimi Moonaghi et al.
550 PERCEIVED CHALLENGES BY THE IRANIAN BACCALAUREATE SURGICAL TECHNOLOGY STUDENTS BIOSCIENCE BIOTECHNOLOGY RESEARCH COMMUNICATIONS
Andrews GJ, Brodie DA, Andrews JP, Hillan E, Thomas BG, Wong J, Rixon L. (2006). Professional roles and communica-tions in clinical placements: a qualitative study of nursing stu-dents’ perceptions and some models for practice. International Journal Nurs Study; 43 (7):861-874.
Bahrami, T. Sadat, L. E. Mahmoudi. Golgini. E. (2014). Evalua-tion of the clinical training of students’ views in the operating room and anesthesia Alborz. University of medical scienes and health .Journal of Alborz University of Medical Sciences. Vol-ume 1, Number 3, summer 143-150, 139. [In Persian]
Bailey L. (2010). Strategies for decreasing patient anxiety in the perioperative setting. AORN J; 92(4): 445-57
Burns, N; Grove, SK.(2007). Understanding nursing research, building an evidence-based practice. 4th edition. St. Louis: Saunders Elsevier.
Dehghani H, Dehghani K, Fallahzadeh H. (2005). The edu-cational problems of clinical fi eld training based on nursing teachers and last year nursing student’s viewpoints. Iranian Journal of Medical Education; 5(1):24-33. [Persian]
Deyoung S. (2009). Teaching strategies for nurse educators. 2th Ed. New Jersey: Prentice Hall. P.222-223.
Silen-Lipponen, M; Tossavainen, K; Turunen, H; Smith, A. (2004). Learning about teamwork in operating room clinical placement. British Journal of Nursing; 13.5 (24); 244-253.
Farneya, F; Abbaszadeh. A; Borhanif, F. (2013). inhibiting fac-tors associated patient care in the operating room: a qualita-tive content analysis. Journal of Health Sciences Research; 2 (1): 90-7.
Ghorbanian N, Abdollahzadeh Mahlani F, Kazemi Haki B. (2014). Effective Factors on Clinical Education Quality; Anes-thesiology and Operating Room Students View. Bimonthly Educe Strategy Med Sic; 6 (4):235-239. [In Persian]
Graneheim UH, Lundman B. (2004). Qualitative content analy-sis in nursing research: concepts, procedures and measures to achieve trustworthiness. Nurse Educ Today; 24(2): 105-12.
Hadizadeh F, Firoozi M, Shamaeyanrazavi N. (2005). Gonabad’s nursing students’ views about clinical Education assessment. Iranian Journal of Medical Education; 5(1):70-8. [Persian}
Heshmati, Nabavi1, F. Vanaki, Z., Mohammadi, E. (2012). A Critical Review on Communication Paradigms Beteween Aca-demic and Clinical Service Institutions in Nursing. Iranian Journal of Medical Education: 11(6); 554-568
Heshmati-Nabavi F, Vanaki Z. (2010). Professional approach: the key feature of effective clinical educator in Iran.
Islamic Republic of Iran Ministry of Health and Treatment and Medical Education Supreme Council for Planning of Medi-cal Sciences, Educational programs of Baccalaureate Degree operating room, Profi le, program, curriculum and evaluation method. Adopted by 35 Th session of the Higher Council for Planning of Medical Sciences: 20 /12/2007.
Kenton, K. (2006). How to Teach and Evaluate Learners in the Operating Room. Obstetric Gynecology Cling N Am; 33; 325– 332.
Khazaei, J, Zarouj, H.Abbasi A. (2014). Qualifi cation of Clini-cal Education of operation room in Bachelor degree from the perspective of students and educators in this fi eld at the Uni-versity of Medical Sciences, in Semnan Journal of Education and Ethics in Nursing; Volume 3, Number 3, 39-46 [In Persian]
Khazaei, J, Zarouj, H.Abbasi A. (2014). Qualifi cation of Clini-cal Education of operation room in Bachelor degree from the perspective of students and educators in this fi eld at the Uni-versity of Medical Sciences, in Semnan Journal of Education and Ethics in Nursing; Volume 3, Number 3, 39-46 [In Persian]
Laura, C; Skoczylas, E B; Littleton, Steven, L; Kanter and Gary Sutkin. (2012). Teaching Techniques in the Operating Room: The Importance of Perceptual Motor Teaching. Academic Med-icine; 87(3).
Lingard, L; Reznick, R; Espin, S; More. (2002). Team Communi-cations in the Operating Room: Talk Patterns, Sites of Tension, and Implications for Novices. Academic Medicine; 77(3):232-237.
Manninen E (1998) Changes in nursing students’ perceptions of nursing as they progress through their education. J Adv Nurs 27: 390-8
Mayring p. (2000). Qualitative Content Analysis. Forum: Qual-itative Social research; 1(2): 25-30
Moussaoui, S. (2005). Professional problems from the perspec-tive of employees working in operating rooms. Hamedan Uni-versity of Medical Sciences Journal; 12(47)
O’Driscoll M, Allan H, Smith P. (2010). Still looking for leader-ship–Who is responsible for student nurses’ learning in prac-tice? Nurse Education Today; 30(3):212-7
Omidvar S, Bakouee F, Salmalian H. (2010). Clinical education problems: the viewpoints of midwifery students in Babol Uni-versity of Medical Sciences. Iranian Journal of Medical Educa-tion; 5(2):15-. [Persian]
Operating room and anesthesia, Introduction of operation room. Available from: URL; http:// www.mums.ac.ir/ornanesn/fa/historyOR. Accessed: 27/5/2017
Riley R, Manias E (2002) Foucault could have been an operat-ing room nurse. J Adv Nurs 39: 316-24 -15
Sadeghi A (2011). “A case study: the association between organizational culture with management knowledge in Hasheminezhad hospital – Tehran. Offi cial Journal of the organs of administration of the hospitals in Iran, Issue 2, sum-mer. No.37:1-8
Tanner J, Timmons S (2000) backstage in the theatre. J Adv Nurs 32: 975-80
Tazakori, Z. Mehri, S.Mobaraki, N.Dadash L. Ahmadi Y. Shokri, F.Hamrang, L. (2016). Factors Affecting on Quality of Clini-cal Education from Perspectives of Operating Room Students.Journal of Health and Care; 17 (2): 128 -136. [In Persian]
Zeighami R Faseleh M Jahanmiri Sh Ghodsbin F. (2004). Nurs-ing student’s viewpoint about problems of clinical teaching. The Journal of Ghazvin University of Medical Science; 8(30): 51-5. [Persian]
Medical CommunicationBiosci. Biotech. Res. Comm. 10(3): 551-556 (2017)
Effect of dynamic loading on removal torque value of
one-piece and two-piece abutments
Farnaz Firouz1, Bijan Heidari2, Sara Alijani3 and Sara Khazaei4* 1DDS, MS, Assistant Professor, Department of Prosthodontics, School of Dentistry, Hamadan University of Medical Sciences, Hamedan, Iran2DDS, MS, Assistant Professor, Department of Prosthodontics, School of Dentistry, Shahid Beheshti University of Medical Sciences, Evin, Tehran, Iran3DDS, MS, Assistant Professor, Department of Orthodontics, School of Dentistry, Hamadan University of Medical Sciences, Hamedan, Iran4*DDS, MS, Assistant Professor, Department of Prosthodontics, School of Dentistry, Hamadan University of Medical Sciences, Hamedan, Iran
ABSTRACT
The aim of this study was to assess the effect of dynamic loading and abutment type on removal torque value. Thirty-two analogs of fi xtures with internal taper connections were divided into two groups of 16. The one-piece (OP) group received solid (one-piece) abutments and the two-piece (TP) group received two-piece abutments. Each group was further subdivided into subgroups C (control) without mechanical loading and T (test) with mechanical loading. The screw of abutments in OPC and TPC groups, were tighten and then removed to record the removal torque value (RTV). In OPT and TPT groups, abutments were tighten, mechani-cally loaded (300,000 cycles), removed, and the RTV were recorded. Two-way ANOVA and Tukey’s HSD post-hoc testwere used for data analysis.The signifi cance threshold was set at 0.05. The mean torque loss of OPC group was signifi cantly lower than both TPC and OPT groups (P < 0.05). But there was not signifi cant different in torque lossvalues between abutments in TPC and TPT groups.Under mechanical loading, theremoval torque of both one-piece and two-piece groups decreased and this reduction was only signifi cant for one-piece group. Also, the abutment type has signifi cant effect on removal torque value.
KEY WORDS: TORQUE, DENTAL ABUTMENT, CYCLIC LOADING
551
ARTICLE INFORMATION:
*Corresponding Author: [email protected] 29th June, 2017Accepted after revision 19th Sep, 2017 BBRC Print ISSN: 0974-6455Online ISSN: 2321-4007 CODEN: USA BBRCBA
Thomson Reuters ISI ESC and Crossref Indexed Journal NAAS Journal Score 2017: 4.31 Cosmos IF: 4.006
© A Society of Science and Nature Publication, 2017. All rights reserved.Online Contents Available at: http//www.bbrc.in/DOI: 10.21786/bbrc/10.3/32
INTRODUCTION
Failure and complications with implant-supported pros-theses still occur, despite the high clinical success rates
in long-term. These complications include biological and mechanical problems. Screw loosening is the most commonly reported mechanical complication for sin-gle implant-supported prostheses. Different factors may

552 EFFECT OF DYNAMIC LOADING ON REMOVAL TORQUE VALUE BIOSCIENCE BIOTECHNOLOGY RESEARCH COMMUNICATIONS
Farnaz Firouz et al.
FIGURE 1. Brass mold
contribute to loss or decrease in abutment screw torque such as fatigue, inappropriate tightening torque, failure in screw retightening after initial placement, settling effect, vibrating micro movements and excessive bend-ing. The misfi t of abutment or implant-supported crown, occlusal loading and structural design of implant con-nection are among other factors playing a role in this respect (Norton (1997, Jörnéus et al., 1992, Coelho et al., 2007 De Boever et al., 2006, Theoharidou et al., 2008).
The implant-abutment interface design can be roughly divided into two groups namely (I) butt-joints or slip fi t joints with a passive fi t and (II) conical interface with fric-tional fi t between mating surfaces of abutment-implant complex; the latter type of interface also known as lock-ing or Mores taper connection. In most previous studies, internal taper connections showed superior performance and were thought to minimize screw loosening and frac-ture, which commonly occur external hexagon butt-joint connections. An internal tapered abutment, based on the specifi c system used, may be attached to implant body by an external screw, orwith threads machined directly on the abutment body itself, which are calledone-piece (solid abutment) and two-piece abutments, respectively, (Finger et al., 2003 Budynas et al., 2008, Hansson 2000, Dittmer et al., 2011, Ricciardi et al., 2009, Cehreli et al., 2004 Aguir-rebeitia et al., 2013 Rabelo et al., 2015).
It has been proven that both types are highly resist-ant to fatigue under dynamic loads and could function without any mechanical problems. One concern regarding the internal taper connection system is the possibility of cold welding of the abutment inside the implant. This was also mentioned by Sutter et al; whereas, other authors concluded that cold welding is presumably neutralized by a phenomenon called embedment relaxation. Clinically, it seems that One-piece abutments may be removed from the fi xture more easily than two piece abutments, due to the nature of their design,which may causeless problems during removal, (Bozkaya et al., 1995, Weiss et al., 2000, Pintinha et al., 2013, Rabelo et al., 2015).
As mentioned earlier, screw loosening is the most com-mon complication in single implant -supported restora-tions. This is important, particularly, incemented prosthesis, in which loosening or fracture of the abutment screw may lead to failure of prosthesis. Therefore, this study aimed to evaluate the effect of dynamic loading on removal torque value (RTV) of two types of internal taperabutments namely one-piece and two-piece abutments. The null hypothesis was that the RTV of one-piece and two-piece abutments would not decrease under dynamic loading.
MATERIALS AND METHODS
In this in vitro experimental study, 32 analogs of fi xtures (Ø 4.8 mm* 10 mm L, Simple line II, Dentium, Korea)
with internal taper hexagon were chosen. In addition, 32 abutments (11-degree taper, Ø 4.5 mm* 5.5 mm L, Simple line II, Dentium, Korea) of two different types (one-piece and two-pieces) were used. Each analog was mounted in a mold containing auto-polymerizing acrylic resin.The customized molds were fabricated from brass and measured 20 mm in height and 25 mm indiameter, in addition, their upper surfaces were cut so that this sur-face had 30˚ angle relative to the horizontal plane. Then, on the upper ramp, ahole was drilled perpendicular to the surface for placement of implant analog (Figure 1). This design of the mold allowed for the fatigue tester to apply load to the abutment at a 30 ° angle relative to the long axis. A wooden jig was used for correct positioning of the molds on the surveyor. The jig was a ramp with a 60 ˚ angle relative to the horizontal plane. Therefore, by assembling the mold on the jig its upper surface was positioned parallel to the horizon. Next, analogs were placed inside the hole perpendicular to the ramp of mold using a surveyor. The hole was fi lled with auto-polym-erizing acrylic resin in doughy stage right before analog insertion (Figure 2). Then, analogs were divided into two groups according to the type of abutment they would receive. The study groups were as follows:
OPC group: One-piece abutments that were not subjected to dynamic loading (control group, n=8).TPC group: Two-piece abutments that were not subjected to dynamic loading (control group, n=8).OPT group: One-piece abutments that were sub-jected to dynamic loading (test group, n=8).TPT group: Two-piece abutments that were sub-jected to dynamic loading (test group, n=8).
To measure the tightening and removal torques, a digital torque meter (TQ-8800; Lutron electronic, Tai-wan) with an accuracy of precision of 0.1 Ncm was used.

BIOSCIENCE BIOTECHNOLOGY RESEARCH COMMUNICATIONS EFFECT OF DYNAMIC LOADING ON REMOVAL TORQUE VALUE 553
Farnaz Firouz et al.
FIGURE 2. Wooden jig for correct positioning of molds on the surveyor
Torque meter was positioned on top of a torque delivery device and the cylinder-analog-abutment assembly was fi xed into a socket at the bottom of the device.
Before screw tightening, all abutments were lubri-cated with artifi cial saliva (Saliva Substitute; Roxane Laboratory Inc, USA). Then, all abutments in the con-trol groups were tightened to 35 Ncm torque. After a 10-minute interval, abutments were retightened to the same torque to compensate for the loss of preload due to settling of surface at the interface. Ten minutes later, the RTV of abutments in the control groups was meas-ured and recorded. For the test groups, 16 ceramic cop-ings (e.max*Zir CAD, ivoclarvivodent) were fabricated with the same size and shape by computer aided design/computer aided manufacturing (CAD/CAM) technology (Sirona in Lab MCXL, Germany).
Since these abutments were cement-retained, for measurement of the RTV, the copings had to be removed from the abutment. For this reason, the coping were designed such that they had a hole in place of the abut-ment screw. Therefore, we hada direct accessto the cop-ing hole, and there was no need to remove the crown after loading. Then, the adaptation of copings was veri-fi ed and confi rmed using light body silicone (Speedex, condensation polysiloxane, low consistency, Colten, Switzerland).
In the test groups, as well as the control groups, the abutments were torqued to 35 Ncmby digital torque meter in two cycles with 10-minutes intervals. Then, the crowns were placed on the abutments and cemented by a temporary cement (Temp bond, Kerr, Italy). During the experiment, the hole of crown was covered with com-posite. Afterward, each assembly of mold-analog-abut-ment-cap from the test groups was mounted and fi xed to the electromechanical fatigue testing machine (CS-4, SDM echatronik, Germany) (Figure 3). The device has two lever arms that simultaneously apply force. The arm of device was so that the force was applied to the upper most part of the coping (Figure 4).
The fatigue tester was calibrated so that the lever arm soperated for 300,000 cycles (nearly corresponding toone year of chewing function) at a speed of 1Hz (60 rpm) [19].the position of load was Oblique load (withan angle of 30˚) of 100±5N was applied to each coping [19].
FIGURE 3. Dynamic fatigue tester
FIGURE 4. Ceramic coping and position of apply-ing force

554 EFFECT OF DYNAMIC LOADING ON REMOVAL TORQUE VALUE BIOSCIENCE BIOTECHNOLOGY RESEARCH COMMUNICATIONS
Farnaz Firouz et al.
After each test, the specimens were transferred to the torque delivery device and the RTV was measured and recorded. The following formula was used to calculate the percentage of torque loss (Per tl):
SPSS software version 21 was used for statistical analysis. The Per tl were statistically analyzed by Two-way ANOVA and Tukey’s HSD post-hoc test. The signifi -cance threshold was set at 0.05.
RESULTS AND DISCUSSION
None of the tested samples showed abutment or screw fracture; there was no sign of crown loosening either after loading. Two-way ANOVA indicated that abut-ment types, dynamic loadingand their interaction had signifi cant effects (P<0.05) on Percentage of torque loss. Table 1 shows the mean and standard deviations of Pertl inall study groups. There moval torque of abutments decreased in both groups (control and test group). The-OPC group presented the lowest torque loss. The highest torque loss was observed in OPT group. Pair wise com-parisons of Pertl were then performed with Tukey’s HSD post-hoc test (Table 2). The mean Pertl in abutments of OPC group was signifi cantly lower than that in TPC and OPT groups (P<0.05). Also, the difference between OPT and TPT groups was signifi cant (P<0.05), But there was no signifi cant different in Per tl of abutments between
TPC and TPT groups (P>0.05). In our study, all abut-ments in both control and test groups showed reduc-tion in removal torque value compared to the insertion torque. Thisindicated that no cold welding occurred in any implant-abutment interface, which was consistent with the results of previous studies (Norton 1999, Ric-ciardi et al, 2009 Pintinha et al., 2013, Kim et al 2014).
Norton showed that cold welding occurs only at the highest level of torque, right before the component fail-ure and when plastic deformation is expected. In addi-tion, cold welding does not occurin clinical levels of torque, and the removal torque is expected to be 10 to 20 % less than the initial torque. However, Sutter and colleagues stated that following torque application, the removal torque increases from 10 to 15 % compared to the initial torque in internal taper connections. They argued that probably, the effect of axial component of the simulated occlusal force surpasses other oblique and tensile forces that interact negatively with retention of abutments. But, other authors have reported different results, indicating that the cold welding, if occurs, is compensated by the settling effect, (Ricciardi et al., 2009 Cehreli et al., 2004).
The results from One-piece abutments showed that the mean torque loss Inthe test group was signifi cantly higher than that in control group (8.93% in the control and 51.02 % in the test group). In One-piece systems, abutment serves asa screw; therefore, in the test group, with application of dynamic load, these forcesare directly transferred to the threads and decrease the removal torque. In addition, the bending and tensile stresses are produced at the interface andlead to greater reduction
Table 1. Mean and standard deviation of per tl for all groups (n=8)
Group NMean±standard
deviation95% confi dence interval for the mean
Lower boundUpper bound P valueOPC 8 8.93±4.76 4.9533 12.9167
.000OPT 8 51.02 ±4.61 47.1711 54.8839
TPC 8 22.8±8.00 16.1642 29.5408
TPT 8 23.2± 8.97 15.8487 30.5538
Table 2. Results of Tukey’s HSD post-hoc test for pairwise comparisonsper tl
Mean Difference (I-J)95% Confi dence Interval
Lower Bound Upper Bound P valueOPC& OPT -42.092* -51.3843 -32.8007 .000
OPC&TPC -13.917* -23.2093 -4.6257 .002
OPC&TPT -14.266* -23.5581 -4.9744 .001
OPT&TPC 28.175* 18.8832 37.4668 .000
OPT&TPT 27.826* 18.5344 37.1181 .000
TPC&TPT -0.34875 -8.9431 9.6406 1.000
*The mean difference is signifi cant at the 0.05 level.

BIOSCIENCE BIOTECHNOLOGY RESEARCH COMMUNICATIONS EFFECT OF DYNAMIC LOADING ON REMOVAL TORQUE VALUE 555
Farnaz Firouz et al.
oftorque. The results of a previous study showed various ranges of torque loss in One-piece abutments. Pinhata et al. reported the mean torque loss values of 18.35% for the control group and 15% for the test group, Pintinha et al. (2013). This value was between 15 and 20% in the study by Norton et al. and between 10.5 and 5.4% in the study by Ricciardi et al. (2013).
A mean torque reduction of 8% by Cehreli et al. (2004) and 25% by Seol et al. (2015) has been reported in test groups. Different results of studies can partly be related to differences in the types of implant systems used. In addition, differences in experimental condi-tions should be considered. There are signifi cant differ-ences between our study and others in number of cycles, intensity, position, angle and rate of applied force. In two-piece abutments, the difference between the con-trol (with 22.8% torque loss) and test group (with 23.2% torque loss) was not statistically signifi cant.
Pinhata et al. (2013) reported a mean torque loss of 36% and 40.85% for the control and test groups, respectively. Similarly, Ricciardi et al. 2013 found the mean values of 32% forthe control group and 37.2% for the test group.Also, Seol et al. (2015) reported a mean torque loss of 48% for test group.Based on the results of our study, in the control groups, one-piece abutments showed signifi cantly higher removal torque value than two-pieceabutments. When opening one-piece abutments, the retention caused by the tapered part of the abutment as well as retention caused by the threads should be overcome. But intwo-piece abutments, the removal torque recorded by torque meter is mainly spent to overcome the retention friction generated by the threads because in two-piece abutments, the abut-ment screw passes through the abutment andat the time of opening, this unit is removed from the abutment.Therefore, in these types of abutments, a large amount of torque required by the tapered part of the abutment is not registered by the torque meter (particularly inabut-ments that have anti-rotation feature). Thus, it seems logical that two-piece abutments show less removal torque than one-piece abutments.
After applying force, the torque loss of one-piece abut-ments was signifi cantly higher than that of two-piece abutments. In two-piece abutments, since the screw and abutment are in two distinct parts (yet related), smaller amount of force exerted on the abutment is transferred to thescrew; whereas, in one-piece abutments, as men-tioned earlier, the abutment serves as a screw and trans-fers dynamic forces directly to the threads and decreases the required removal torque.
In this study, we tried to establish conditions to simu-late clinical masticatory conditions. Each sample under went 300,000 cycles of dynamic force, which corre-sponded to one year of normal chewing function. Inad-
dition, the abutments were lubricated by artifi cial saliva before applying torque because it has been suggested that greater initial preload can be achieved underwet conditions, Jaarda et al., (1993). Siamos et al., 2002 Lee et al., 2002, Winkler et al., 2003)
Applying proper torque recommended by the manu-facturer is very important to prevent screw loosening and screw fracture. Jaarda et al. reported 15 to 48% error when closing the abutment screw by hand. Therefore, the abutments were tightened to 35 Ncm torque by a digital torque meter. Ten minutes later, the same torque was applied to compensate the loss of preload due to set-tling effect. Siamos et al. suggested that in order tomini-mize the loss of preload caused by the settling effect, the initial torque should beapplied again 10 minutes after initial tightening torque, (Siamos et al., 2002).
Considering the fact that biteforce actually acts on the super structure, it was appropriate to perform anex-periment in which dynamic forces are applied on the abutment after cementation of crown. Before cemen-tation, precise and passive fi t of caps was assessed by light-body silicon. Prostheses with active fi t or improper adaptation can exertun desirable forces on the abut-ment, (Lee et al. 2002).
The limitations of this study included small sample size and short-term loading. In addition, our study had an in vitro design and had the limitation of in vitro studies in simulating the complex nature of mastication cycles. In the oral environment, forces are applied in different directions and angles to the axis of abutments; moreover, the intensity of these forces is variable in dif-ferent situations. The maximum biting force has been-reported in the range of 200 to 3500 N, (Winkler et al. 2003). But in the present study, a force of 100 N was applied, which is at the low end of this range. Also, the rate of force in this study was one hit per second, which was continuously applied within 3 to 4 days, but in nor-mal oral function, 300,000 cycles of force are applied in a much longer period (aboutone year). All these factors can affect the behavior of screw and its loosening.
CONCLUSION
Under mechanical loading, RTV of both groups (one-piece and two-piece) decreased and this reduction was signifi cant for one-piece group. However, there was no signifi cant difference in RTV between one-piece and two-piece abutments under dynamic loading.
ACKNOWLEDGEMENTS
I would like to express my sincere gratitude to my sta-tistical advisor Dr. Saiid Mousavi for the continuous

Farnaz Firouz et al.
556 EFFECT OF DYNAMIC LOADING ON REMOVAL TORQUE VALUE BIOSCIENCE BIOTECHNOLOGY RESEARCH COMMUNICATIONS
support and immense knowledge. This research received no specifi c grant from any funding agency in the public, commercial, or not-for-profi t sectors.
Confl ict of Interest “None declared”
REFERENCES
Aguirrebeitia J, Abasolo M, Vallejo J, Ansola R. 2013 Dental implants with conical implant-abutment interface. Infl uence of the conical angle difference on the mechanical behavior of the implant. Int J Oral Maxillofac Implants Mar-Apr; 28(2): 72-82.
Bozkaya D, Müftü S. 1995 Mechanics of the taper integrated screwed-in (TIS) abutments used indental implants. J Prosthet Dent 74:270-8.
Budynas RG, Nisbett JK. 2008 Shigley’s mechanical engineer-ing design. 8th ed. New York McGraw-Hill, 2008: 830-1.
Cehreli M, Duyck J, De Cooman M, Puers R, NaertI.2004 Implant design and interface force transfer. A photoelastic and strain-gauge analysis. Clin Oral Implants Res 15:249–57.
Coelho AL, Suzuki M, Dibart S, DA Silva N, Coelho PG. 2007 Cross sectional analysis of the implant-abutment interface. J Oral Rehabil Jul;34:508–16.
De Boever AL, Keersmaekers K, Vanmaele G, Kerschbaum G, Theuniers G, De Boever JA. 2006 Prosthetic complications in fi xed endosseous implant-bone reconstructions after an obser-vation period of at least 40 months. J Oral Rehabil 33: 833–9.
Dittmer S, Dittmer MP, Kohorst P, Jendras M, Borchers L, Sti-esch M. 2011. Effect of implant-abutment connection design on load bearing capacity and failure mode of implants. J Pros-thodont 20:510-6.
Finger IM, Castellon P, Elian N. 2003 The evolution of external and internal implant/abutment connections. Pract Proced Aes-thet Dent 15(8):625–34.
Hansson S. 2000 Implant-abutment interface: biomechanical study of fl at top versus conical. Clin Implant Dent Relat Res 2:33-41.
Jaarda MJ, Razzoog ME, Gratton DG. 1993 Providing opti-mum torque to implant prostheses: A pilot study. Implant Dent 2:50-2.
Jörnéus L, Jemt T, Carlsson L. 1992 Loads and designs of screw joints for single crowns supported by osseo integrated implants. Int J Oral Maxillofac Implants 7:353-9.
Keating K. 2001 Connecting abutments to dental implants: “an engineer’s perspective”. Irish Dent: 43-6.
Khraisat A, Hashimoto A, Nomura S, Miyakawa O. 2004 Effect of lateral cyclic loading on abutment screw loosening of an external hexagon implant system. J Prosthet Dent 91:326–324.
Kim KS, Han JS, Lim YJ.2014 Settling of abutments into implants and changes in removal torque in fi ve different implant-abutment connections. Part 1: Cyclic loading. Int J Oral Maxillofac Implants. Sep-Oct; 29(5):1079-84.
Lee J, Kim YS, Kim CW, Han JS. 2002 Wave analysis of implant screw loosening using an air cylindrical cyclic loading device. J Prosthet Dent Oct; 88(4):402-8.
Nigro F, Sendyk CL, Francischone CE. 2010 Removal Torque of Zirconia Abutment Screws under Dry and Wet Conditions. Braz Dent J 21(3): 225-8.
Norton MR. 1997 An in vitro evaluation of the strength of an internal conical interface compared to a butt joint interface in implant design. Clin Oral Implants Res 1997; 8(4):290–8.
Norton MR. 2000 In vitro evaluation of the strength of the conical implant-toabutment joint in two commercially avail-able implant systems. J Prosthet Dent 83(5):567-71.
Norton MR.1999 Assessment of cold welding properties of the internal conical interface of two commercially available implant systems. J Prosthet Dent 81:159-66.
Pintinha M, Camarini ET, Sábio S, Pereira JR. 2013 ection abutments for dental implants. J Prosthet Dent 110:383-8.
RabeloSC, Omonte SV, Vieira SP, Jansen WC, Seraidarian PI2015. Morse taper internal connection implants: would abut-ment reseating infl uence retention? Braz. J. Oral Sci;14(3):2015.
Ricciardi Coppede A, Faria ACL, Shibli JA, de Mattos MGC, Ribeiro RF, Rodrigues RC. Mechanical Comparison of Experi-mental Conical-Head Abutment Screws with Conventional Flat-Head Abutment Screws for External-Hex and Internal Tri-Channel Implant Connections: An In Vitro Evaluation of Loos-ening Torque. Int J Oral Maxillofac Implants 2013; 28:321–9.
Ricciardi,Copeddê A, de Mattos Mda G, Rodrigues RC, Ribeiro RF. 2009 Effect of repeated torque/mechanical loading cycles on twodifferent abutment types in implants with internal tapered connections: an in vitro study. Clin Oral Implants Res Jun; 20(6):624-32.
Seol HW, Heo SJ, Koak JY, Kim SK, Kim SK. 2015 Axial dis-placement of external and internal implant-abutment con-nection evaluated by linear mixed model analysis. Nov-Dec; 30(6):1387-99
Siamos G, Winkler S, Boberick KG. 2002 The relationship between implant preload and screw loosening on implant-sup-ported prostheses. J Oral Implanto l28(2):67–73.
Sutter F, Weber HP, Sorensen J, Belser U. 1993 The new restor-ative concept of the ITI dental implant system: design and engineering. Int J Periodont Rest Dent13:409-31.
Theoharidou A, Petridis HP, Tzannas K, Garefi s P. 2008 Abut-ment screw loosening in single-implant restorations: A sys-tematic review. Int J Oral Maxillofac Implants Jul-Aug; 23:681–90.
Weiss EI, Kozak D, Gross MD. 2000 Effect ofrepeated closures on opening torque values in seven abutment-implant systems. J Prosthet Dent 84:194-9.
Winkler Sh, Ring K, Ring JD, Boberick K. 2003 Implant screw mechanics and the settling effect : An overview. Journal of Oral Implantology 29(5);242

Biotechnological CommunicationBiosci. Biotech. Res. Comm. 10(3): 557-563 (2017)
Assessment of location of anterior ethmoidal artery using
cone beam computed tomography (CBCT)
Shima Javdan1, Roshanak Ghaffari2* and Saeed Sohilipour3
1Postgraduate Student, Department of Oral Radiology, Dental School, Islamic Azad University, Isfahan Khorasgan Branch Isfahan Iran2Department of Oral and Maxillofacial Radiology, Dental Faculty, Isfahan Khorasgan Branch, Islamic Azad University3Otolaryngology, Isfahan University of Medical Sciences, Isfahan, Iran
ABSTRACT
Anterior ethmoidal artery (AEA) is an important landmark, which may be accidentally injured or traumatized during surgical procedures. This study aimed to determine the position of AEA on CBCTscans. In this descriptive analytical study, CBCT scans of 129 patients evaluated. The mean distance from AEA to anterior base of the skull, posterior frontal sinus wall, nasion, anterior nasal spine (ANS), orbital roof, inferior turbinate and the mean angle between AEA and ANS were evaluated using SIDEXIS 3D software. Independent and paired t-test and Fisher’s test were used for statistical analyses with P<0.05 level of signifi cance. The mean distance from AEA was 11.60±1.94 mm to orbital roof, 32.66±4.33 mm to inferior turbinate, 8.96±4.51 to posterior wall of the frontal sinus, 2.09 ±2.18mm to the anterior base of the skull, 18.01±3.90 mm to the nasion and 58.69±4.24 mm to the ANS. The angle between AEA and NS was 55.15±4.36°. The distances from AEA to orbital roof, inferior turbinate, nasion and ANS in men were signifi cantly greater than those in women (P<0.05). nasion. ( = 0/05) Surgical procedures in areas close to AEA are high-risk. Determination of the position of AEA prior to endoscopic surgery of the sinus is highly important. CBCT can help determine the location of AEA prior to surgery to prevent unwanted surgical complications.
KEY WORDS: CONE-BEAM COMPUTED TOMOGRAPHY; ETHMOID; ARTERY
557
ARTICLE INFORMATION:
*Corresponding Author: Roshanak GhaffariReceived 23rd June, 2017Accepted after revision 26th Sep, 2017 BBRC Print ISSN: 0974-6455Online ISSN: 2321-4007 CODEN: USA BBRCBA
Thomson Reuters ISI ESC and Crossref Indexed Journal NAAS Journal Score 2017: 4.31 Cosmos IF: 4.006
© A Society of Science and Nature Publication, 2017. All rights reserved.Online Contents Available at: http//www.bbrc.in/DOI: 10.21786/bbrc/10.3/33

558 ASSESSMENT OF LOCATION OF ANTERIOR ETHMOIDAL ARTERY USING (CBCT) BIOSCIENCE BIOTECHNOLOGY RESEARCH COMMUNICATIONS
Javdan, Ghaffari and Sohilipour
INTRODUCTION
Infl ammatory diseases of paranasal sinuses are a com-mon serious problem. In the recent decades, functional endoscopic sinus surgery (FESS) has revolutionized surgical treatment of paranasal sinuses. In this tech-nique, due to the proximity of paranasal sinuses to some important structures such as anterior base of skull, orbit and ethmoidal artery, unintentional injury to these anatomical structures may cause serious complications (Basak et al. 1998). Anterior ethmoidal artery (AEA) is an important landmark, which may be accidentally trau-matized or injured during surgical procedure of anterior ethmoidal sinus. Injury to AEA may cause severe nasal bleeding, intra-orbital hemorrhage, posterior orbital hematoma, spinal fl uid leak and intracranial bleeding in rare cases (Ding et al. 2012 Eren et al. 2016).
In FESS, superior lateral border of AEA and its infe-rior border in contact with inferior turbinate are marked (Rontal et al. 1991). The distance between AEA and the contact area with the inferior turbinate outlines the safe area for surgical manipulation. Since in FESS the width of ethmoid forceps is maximally 10mm when opened, the surgeon must have adequate knowledge about the space limitations in this area (Rontal et al. 1991; Basak et al. 1998). Knowledge about the anatomical location of AEA and its detection on images can help prevent unwanted complications during surgery (Ding et al. 2012). AEA is among the most important reference landmarks for endoscopic surgery since it determines the posterior location of recess. Its detection in frontoethmoidal suture determines the location of anterior base of skull (Monjas-Cánovas et al. 2012; Ko et al. 2014).
Ethmoidal artery originates from the orbital artery. Some branches of ethmoidal artery originate from supraclinoid portion of the internal carotid artery and pass through the optical foramen towards the orbit in a lateral position. In coronal plane, a conical groove in the medial orbital wall may be seen, which indicates the exit point of ethmoidal artery between the superior oblique muscle and medial rectus muscle. It indicates anterior ethmoidal foramen and can serve as a refer-ence anatomical landmark to determine the location of AEA (Monjas-Cánovas et al. 2012). The location of AEA relative to the ethmoidal air cells may be variable but it is often located between the second and third lamellae next to basal lamella (Ding et al. 2012).
Ko et al, in 2014 evaluated the effi cacy of AEA to determine the location of frontal sinus in endoscopic sinus surgery using computed tomography (CT) and offered a classifi cation for the position of AE. Guldner et al. provided a similar classifi cation in 2012 using CBCT (Guldner et al. 2012). At present, CBCT is increasingly used for implant imaging and endodontic treatments
and is a new technique in ENT for assessment of sinuses. It is superior to CT since it has lower cost and lower patient radiation dose compared to CT. Studies on deter-mination of location of AEA using CBCT are limited. Thus, this study has aimed to determine the position of AEA on CBCT scans.
MATERIALS AND METHODS
This descriptive analytical study was conducted on 129 CBCT scans of patients (70 females and 59 males) over 18 years of age presenting to the Oral and Maxillofacial Radiology Department of Isfahan University of Medi-cal Sciences, School of Dentistry. All CBCT scans had been taken with one CBCT unit (Galileos-Sirona Ben-sheim, Germany) with the exposure settings of 85 kVp and 21-35 mAs (depending on the patient’s weight). The inclusion criterion was age over 18 years. The exclusion criteria were history of surgery or trauma to parana-sal sinuses and skull base, congenital facial anomalies, malignancies or lesions causing opacity of frontal recess and anterior ethmoidal cells. Multiplanar (coronal, sag-ittal and oblique sagittal) reconstructed images were assessed using SIDEXIS 3D software. Next, notch in the medial orbital wall and bony sulcus of lateral wall of the olfactory fossa (anterior ethmoidal sulcus) on coronal sections which indicate the anterior ethmoidal foramen were used for detection of the AEA (Figure 1).
Due to the presence of variations in the path of artery, distance from the artery to the base of skull was meas-ured. In type I, the entry point of AEA is adjacent to the anterior base of the skull. In type II, it has less than 1mm distance from the base of the skull. In type III, AEA has a distance equal or more than 1mm from the anterior base of the skull (Guldner et al. 2012) (Figure 2). To determine the position of AEA relative to the frontal sinus in the sagittal plane, distance from the AEA to the posterior wall of the frontal sinus was measured (Monjas-Cánovas et al. 2011) (Figure 3). Distance from the AEA to the orbital roof and inferior turbinate (site of attachment
FIGURE 1. Anterior ethmoidal foramen notch in the medial orbital wall (arrow) and anterior ethmoidal sulcus (arrow head)

BIOSCIENCE BIOTECHNOLOGY RESEARCH COMMUNICATIONS ASSESSMENT OF LOCATION OF ANTERIOR ETHMOIDAL ARTERY USING (CBCT) 559
Javdan, Ghaffari and Sohilipour
FIGURE 2. Location of the AEA on the sagittal plane (up). Schematic views (down): (A) Attached to the base of skull; (B) distance less than 1 mm; (C) distance of 1 mm or more
FIGURE 3. Distance from the anterior ethmoidal foramen to the posterior wall of the frontal sinus on the sagittal plane
FIGURE 4. Distance from the anterior ethmoidal foramen to the orbital roof and inferior turbinate
of bony lamella of inferior concha with medial wall of the maxillary sinus) in the coronal plane (Figure 4) was measured. To estimate the distance from the AEA to the nasion and also the distance from the AEA to the ANS, the oblique sagittal plane was used. In this plane, the angle between the hypothetical line connecting the AEA and ANS and horizontal line passing through the hard palate and ANS was measured (Monjas-Canovas et al. 2011) (Figure 5). Independent and paired t-test were used for statistical analyses. P<0.05 was considered statisti-cally signifi cant.
RESULTS AND DISCUSSION
A total of 129 patients (59 males and 70 females) with a mean age of 41.59 years in males and 38.44 years in females were evaluated. Both sides were evaluated in each patient (n=258). Independent t-test showed that the mean age of males and females was not signifi cantly different (P=0.220). In most cases, the AEA was detect-
able on coronal sections of the anterior ethmoidal fora-men in the medial wall of the orbit (96.1%) in the form of a notch and anterior ethmoidal sulcus in the lateral wall of the olfactory fossa (94.2%). The Fisher’s exact test showed that the frequency distribution of pres-ence of the AEA in the medial orbital wall and ante-rior ethmoidal sulcus was not signifi cantly different in the right and left sides (P>0.05).The mean total distance from the AEA to the orbital roof on coronal sections was 11.601.94mm. This distance to the inferior turbinate was 32.664.33mm. As seen in Table 1, t-test showed no signifi cant difference between the distance from the AEA to the orbital roof and to the inferior turbinate in the two sides (P>0.05). The mean distance from the AEA to the posterior frontal sinus wall (8.964.51mm) and anterior base of the skull (2.092.18mm) on sagittal sec-tions is shown in Table 1; according to t-test, the differ-

560 ASSESSMENT OF LOCATION OF ANTERIOR ETHMOIDAL ARTERY USING (CBCT) BIOSCIENCE BIOTECHNOLOGY RESEARCH COMMUNICATIONS
Javdan, Ghaffari and Sohilipour
FIGURE 5. Distance from the AEA to the nasion and ANS; angle between the AEA and ANS and hard palate plane on oblique sag-ittal plane
Table 1. Mean distance from the AEA to the orbital roof, inferior turbinate, posterior wall of the frontal sinus and anterior base of the skull in millimeters
DistancesRight (mean±SD)
mmLeft (mean±SD)
mmTotal (mean±SD)
MmP value
Distance from AEA to orbital roof 11.73±2.03 11.48±1.85 11.60±1.94 0.13
Distance from AEA to inferior turbinate
32.42±4.46 32.90±4.21 32.66±4.330.20
Distance from AEA to posterior wall of frontal sinus
8.66±4.46 9.27±4.56 8.96±4.510.11
Distance from AEA to anterior base of skull
2.10±2.27 2.07±2.09 2.09±2.180.81
Table 2. Location of AEA relative to the anterior base of the skull on CBCT sagittal sections in millimeters
Right Left Total0 <1 ≥1 0 <1 ≥1 0 <1 ≥1
Number 58 1 70 50 2 77 108 3 147
Percentage 45% 8% 54.3% 38.8% 1.6% 59.7% 41.9% 1.2% 57%
ence in the mean distance from the AEA to the posterior wall of the frontal sinus and anterior base of the skull was not signifi cant (P>0.05).
Table 2 shows the position of the AEA relative to the anterior base of the skull on sagittal CBCT sections based on the presented classifi cation.
Table 3 shows the mean distance from the AEA rela-tive to the nasion and ANS and angle of AEA relative to ANS in oblique sagittal plane. As seen in Table 3, according to paired t-test, no signifi cant difference was noted in the mean variables in the right and left sides (P>0.05).
As demonstrated in Table 4, independent t-test showed that the distance from the AEA to the orbital roof and inferior turbinate and distance from the AEA to the nasion and ANS in males were signifi cantly greater than those in females (P<0.05) but no signifi cant differ-ence was noted between males and females in the AEA and ANS angle (P>0.05).
Many anatomical studies have assessed the location of the AEA and most of them used endoscopic meas-urements while some others used CT (Monjas-Canovas et al. 2012). On the other hand, studies on detection of AEA on CBCT scans are limited (Guldner et al. 2012).

BIOSCIENCE BIOTECHNOLOGY RESEARCH COMMUNICATIONS ASSESSMENT OF LOCATION OF ANTERIOR ETHMOIDAL ARTERY USING (CBCT) 561
Javdan, Ghaffari and Sohilipour
Table 3. Mean distance from the AEA to the nasion, ANS and AEA-ANS angle on oblique sagittal plane
Right (mean±SD) Left (mean±SD) Total (mean±SD) P value Distance between AEA and nasion
18.04±3.61 mm 17.95±4.17 mm 18.01±3.90 mm 0.78
Distance between AEA and ANS
58.58±4.09 mm 58.81±4.40 mm 58.69±4.24 mm 0.21
Angle between AEA and ANS
55.06±4.16 º 55.24±4.56 º 55.15±4.36º 0.53
Table 4. Mean and standard deviation of data based on gender
Distance Female (mean±SD) Male (mean±SD) P value
Distance to orbital Roof 11.97±1.80 mm 11.17±2.01 mm 0.001
Distance to inferior turbinate 31.51±4.27 mm 34.03±4.02 mm 0.000
Distance to anterior base of skull
2.17±2.12 mm 1.99±2.25 mm 0.50
Distance to inferior wall of frontal sinus
8.56±3.83 mm 9.44±5.18 mm 0.132
Distance to nasion 17.25±3.28 mm 18.91±4.38 mm 0.01
Distance to ANS 56.46±3.33 mm 61.33±3.66 mm 0.00
Angle between AEA and ANS 55.44±4.06º 54.79±4.69º 0.23
The AEA passes through three cavities namely the orbit, the ethmoidal labyrinth and the anterior cranial fossa. The AEA enters into the olfactory fossa from the anterior cranial base and then enters into the anterior ethmoi-dal sulcus through the lateral lamella of the cribriform plate, which is the weakest point of the anterior base of the skull. At this point, bone is dangerously thin and it is considered a high-risk area in nasal endoscopic sur-gery. Thus, the AEA is susceptible to traumatization and injury during surgical procedures (Stammberger et al. 1990; Bayram et al. 2001; Moon et al. 2001; White et al. 2005; Araujo Filho et al. 2006; Souza et al. 2009).
In most cases in our study, this artery was detect-able in the medial wall of the orbit (96.1%) and lateral wall of the olfactory fossa (94.2%). Similarly, Souza et al. detected AEA in the medial orbital wall (98%) and lateral wall of the olfactory fossa (100%) and stated that medial notch of the orbit and medial ethmoidal sulcus were reliable landmarks for detection of the AEA (Souza et al. 2009). Gotwald et al, similarly detected the orbital medial notch on coronal CT scans in 95% and medial ethmoidal sulcus in 84% of cases (Gotwald et al. 2004). Ding et al. used CT angiography and detected AEA in 100% of the cases in the notch in the medial orbital wall and in 98.4% in the ethmoidal sulcus (Ding et al. 2012). Considering the invasiveness of CT angiography and high dose of CT, low dose CBCT is more suitable for detection of AEA. In FESS, superior lateral border of the surgical site is determined based on the location of AEA and the inferior border is determined by the inferior tur-
binate (Rontal et al. 1991). Distance from the AEA to the attachment site of the inferior turbinate determines the suitable location for surgical procedure. Basak et al. considered the orbit as a fi xed reference point and based on this point, they determined the location of AEA. The mean distance from the AEA to the orbital roof on CT scans was reported to be 13.7 mm (Basak et al. 1998) while in our study, this distance was found to be 11.601.94 mm. Basak et al. measured the mean distance from the AEA to the inferior turbinate to be 30.05 mm (Basak et al. 1998) and Eren et al. found this distance to be 31.6 mm on CT scans (Eren et al. 2016); these values were close to our fi ndings (32.664.33 mm).
The distance from the AEA to the skull base is impor-tant because when AEA with mesenterium is located right beneath the skull, it has higher risk of traumatiza-tion during surgery. Basak et al. evaluated the location of AEA on coronal CT scans and reported that it was adjacent to the skull base in 57% of the cases and had a distance from it in 43%. In cases where AEA has a distance from the base of skull, risk of traumatization during FESS is higher (Basak et al. 1998). Moon et al. assessed both sagittal sections and cadaver dissection and reported that in 85.7% of cases, AEA was adjacent to the skull base; in the remaining cases, AEA had 2-3 mm distance from the skull base (Moon et al. 2001). Guldner et al. (2012) reported similar results. Araujo et al. reported that AEA was attached to the skull base in 83.3% of the cases (Araujo Filho et al. 2006). Kainz and Stammberger reported that in most cases, AEA had 5

Javdan, Ghaffari and Sohilipour
562 ASSESSMENT OF LOCATION OF ANTERIOR ETHMOIDAL ARTERY USING (CBCT) BIOSCIENCE BIOTECHNOLOGY RESEARCH COMMUNICATIONS
mm distance from the skull base. They also stated that when the roof of ethmoidal sinus is low, anterior ethmoi-dal canal may be attached to the skull base (Kainz et al. 1988). The same was stated by Becker et al, who deter-mined the location of foramen in endoscopic sections. Jang et al. reported this distance to be 1.32 1.51mm on CT scans (Jang et al. 2014) while in our study, this distance was 2.09 2.18mm. These differences may be due to racial differences or surgical technique. It seems that in patients with larger supraorbital ethmoid cell and optimal pneumatization of ethmoidal sinus (Jang et al. 2014), AEA is located right beneath the skull base; oth-erwise, it is at the same level of the skull base (Lisbona et al. 2010).
Young et al, in their study measured the distance from the AEA to the base of skull and categorized it in three groups of no distance [16%], distance less than 1 mm (33.7%) and equal or higher than 1 mm (50.5%) (Ko et al. 2014). In our study, 41.9% were categorized in no distance group, 1.2% were categorized in less than 1 mm group and 57% were categorized in 1 mm and higher group. In most cases in both studies, the distance from the AEA to the skull base was equal or more than 1 mm.
Frontal sinus is the most challenging sinus in endo-scopic surgery due to its anatomical complexity and variations. Many studies have suggested anatomical landmarks to help the surgeon in safe conduction of frontal sinus surgery (McLaughlin et a;. 1997; Lee et al. 1997; Kew et al. 2002). The AEA is known as a typical classic reference point for the frontal sinus. Some stud-ies showed that AEA is located right behind the fron-tal recess and can serve as an anatomical landmark for frontal sinus surgery (White et al. 2005). Thus, knowl-edge about the anatomy of this area is important and must be obtained prior to endoscopic sinus surgery. Young et al. reported the mean distance from the AEA to the posterior wall of the frontal sinus to be 8.585.56 mm, which was in line with our result (8.964.51 mm); whereas, Jang et al. measured the distance from the AEA to the anterior wall of the frontal sinus to be 17.362.19 mm [19]; this difference was due to the different refer-ence points selected. Statistically, similar to our study, Young et al. found no signifi cant association between the distance from the AEA to the frontal sinus and AEA to the base of skull (Ko et al. 2014).
In endoscopic surgery of the sinus, zero degree ANS angle complicates the detection of AEA [9]. Donemez et al. considered ANS as a fi xed landmark and measured its distance from the AEA on cadavers using an electronic caliper, and reported the value to be 553 mm (Donmez et al. 2005). However, Monjas-Cánovas et al. measured the distance from the AEA to ANS to be 55.515.52 mm and measured its angle with the horizontal line passing through the ANS to be 57.71.78; these values were
close to those of Moon et al.(2001), Lee et al. (2000) and Araujo et al. (2006). Our study reported this distance to be 58.694.26 mm and the angle was 55.144.37, which was in line with previous studies. Araujo et al. (2014) reported that the distance from the AEA to ANS was signifi cantly greater in males than in females; this difference was not statistically signifi cant in our study and that of Lee et al. (2000).
Nasion is used as a reference point in CT scan stud-ies for surgical resection of some tumors or manage-ment of uncontrollable arterial hemorrhage, which is endoscopically impossible; although external incision is made from the canthus and not directly on the nasion. Monjas-Cánovas et al. measured the mean distance from the AEA to the nasion to be 29.312.5 mm (2011), which is similar to the study by Cankal et al. (2004); whereas, the results of Eren et al. (2014)(17.993.91) were closer to ours (18.013.90 mm). In our study, a weak but signif-icant association was noted between the distance from the AEA to the ANS and the distance from the AEA to the nasion; whereas, Eren et al. (2014) found a signifi -cant association between the distance from the AEA to the nasion and the distance from the AEA to the inferior turbinate (Eren et al. 2014).
CONCLUSION
Inadequate knowledge about the anatomy of surgical site can cause serious iatrogenic surgical complications. To decrease these risks, a careful dissection must be done after thorough assessment of the area on CBCT scans. Therefore, adequate knowledge about the anatomy of the area and location of the AEA by use of CBCT can be helpful prior to FESS.
REFERENCES
Araujo Filho BC, Weber R, Pinheiro Neto CD, Lessa MM, Voegels RL, Butugan O. (2006) Endoscopic anatomy of the anterior ethmoidal artery: a cadaveric dissection study. Braz J Otorhinolaryngol 72(3):303-8.
Basak S, Karaman CZ, Akdilli A, Mutlu C, Odabasi O, Erpek G. (1998) Evaluation of some important anatomical variations and dangerous areas of the paranasal sinuses by CT for safer endonasal surgery. Rhinology 36(4):162-7.
Bayram M, Sirikci A, Bayazit YA. (2001) Important anatomic variations of the sinonasal anatomy in light of endoscopic sur-gery: a pictorial review. Eur Radiol 11(10):1991-7.
Becker SP. (1994) Applied anatomy of the paranasal sinuses with e9mphasis on endoscopic surgery. The Annals of otology, rhinology & laryngology Supplement 162:3
Cankal F, Apaydin N, Acar HI, Elhan A, Tekdemir I, Yurdakul M, et al. (2004) Evaluation of the anterior and posterior

Javdan, Ghaffari and Sohilipour
BIOSCIENCE BIOTECHNOLOGY RESEARCH COMMUNICATIONS ASSESSMENT OF LOCATION OF ANTERIOR ETHMOIDAL ARTERY USING (CBCT) 563
ethmoidal canal by computed tomography. Clinical radiology 59(11):1034-40.
Ding j, Sun G, Lu Y, Yu B-b, Li M, Li L, et al. (2012) Evalua-tion of Anterior Ethmoidal Artery by 320-Slice CT Angiog-raphy with Comparison to Three-Dimensional Spin Digital Subtraction Angiography . Initial Experiences, Korean J Radiol 13(6):667-73.
Donmez BO, Agirdir BV, Sindel MM. (2005) Important anatom-ical landmarks in the lateral nasal wall. Saudi medical journal 26(9):1403-8.
Eren E, Altay C, Arslanoglu S, Erdogan NK, Uluc ME, Onal K, et al. (2014) Searching for the cheese: does ethmoid pneumatiza-tion affect the location of the anterior ethmoid artery? EUFOS : affi liated with the German Society for Oto-Rhino-Laryngology - Head and Neck Surgery 271(2):281-5.
Gotwald TF, Menzler A, Beauchamp NJ, zur Nedden D, Zinre-ich SJ. (2003) Paranasal and orbital anatomy revisited: iden-tifi cation of the ethmoid arteries on coronal CT scans. Critical reviews in computed tomography 44(5):263-78.
Guldner C, P.Zimmermann A, Diogo I, Werner JA, Teymoortash A. (2012) Age-dependent differences of the anterior skull base. International Journal of Pediatric Otorhinolaryngology 76:822–8.
Jang DW, Lachanas VA, White LC, Kountakis SE. (2014) Supraorbital ethmoid cell: a consistent landmark for endo-scopic identifi cation of the anterior ethmoidal artery. Otolar-yngology-head and neck surgery : offi cial journal of Ameri-can Academy of Otolaryngology-Head and Neck Surgery 151(6):1073-7.
Kainz J, Stammberger H. (1988) The roof of the anterior ethmoid: a locus minoris resistentiae in the skull base. Laryn-gologie, Rhinologie, Otologie 67(4):142-9.
Kew J, Rees GL, Close D, Sdralis T, Sebben RA, Wormald PJ. (2002) Multiplanar reconstructed computed tomography images improves depiction and understanding of the anatomy of the frontal sinus and recess. American journal of rhinology 16(2):119-23.
Ko Y-B, Kim M-g, Jung YG. (2014) Anatomical Relationship between the Anterior Ethmoid Artery, Frontal Sinus, and Inter-vening Air Cells ; Can the Artery Be Useful Landmark? Korean J Otorhinolaryngol-Head Neck 57(10):687-91.
Lee D, Brody R, Har-El G. (1997) Frontal sinus outfl ow anat-omy. American journal of rhinology 11(4): 283- 5.
Lee WC, Ming Ku PK, van Hasselt CA. (2000) New guidelines for endoscopic localization of the anterior ethmoidal artery: a cadaveric study. Laryngoscope 110(7):1173-8.
Lisbona Alquezar MP, Fernandez Liesa R, Lorente Munoz A, Perez Delgado L, Herrera Tolosana S, Tejero-Garces Galve G, et al. (2010) Anterior ethmoidal artery at ethmoidal labyrinth: Bibliographical review of anatomical variants and references for endoscopic surgery. Acta Otorrinolaringol Esp 61(3):202-8.
McLaughlin RB, Jr., Rehl RM, Lanza DC. (2001) Clinically rel-evant frontal sinus anatomy and physiology. Otolaryngologic clinics of North America 34(1):1-22.
Monjas-Canovas I, Garcia-Garrigos E, Arenas-Jimenez JJ, Abarca-Olivas J, Sanchez-Del Campo F, Gras-Albert JR. (2011) Radiological anatomy of the ethmoidal arteries: CT cadaver study. Acta Otorrinolaringol Esp 62(5):367-74.
Monjas-Cánovas I, García-Garrigós E, Arenas-Jiménez JJ, Abarca-Olivas J, Campo Fs-D, Gras-Alberta JR. Radiological Anatomy of the Ethmoidal Arteries: CT Cadaver Study. Acta Otorrinolaringol Esp 2011;62(5):367-74.
Moon HJ, Kim HU, Lee JG, Chung IH, Yoon JH. (2001) Surgi-cal anatomy of the anterior ethmoidal canal in ethmoid roof. Laryngoscope 111(5):900-4.
Rontal M, Rontal E. (1991) Studying whole-mounted sections of the paranasal sinuses to understand the complications of endoscopic sinus surgery. The Laryngoscope 101(4 Pt 1):361-6.
Rontal M, Rontal E. (1991) Studying whole-mounted sections of the paranasal sinuses to understand the complications of endoscopic sinus surgery. The Laryngoscope 101(4 Pt 1):361-6.
Souza SA, Souza MMAd, Gregório LC, Ajzen S. (2009) Anterior Ethmoidal Artery Evaluation on Coronal CT Scans. . Braz J Otorhinolaryngol 101-6(1):101-6.
Stammberger H, Posawetz W. (1990) Functional endoscopic sinus surgery. Concept, indications and results of the Messerk-linger technique. EUFOS : affi liated with the German Society for Oto-Rhino-Laryngology - Head and Neck Surgery 247(2):63-76.
White DV, Sincoff EH, Abdulrauf SI. (2005) Anterior ethmoidal artery: microsurgical anatomy and technical considerations. Neurosurgery 56(2 Suppl):406-1.

Medical CommunicationBiosci. Biotech. Res. Comm. 10(3): 564-570 (2017)
Evaluation of two types of bleaching gel and light
source on whitening of teeth
Baharan Ranjbar Omidi1, Mohammad Nouri2 and Negin Farahmandpour*3
1Assistant Professor, Dental Caries Prevention Research Center, Qazvin University of Medical Sciences, Qazvin, Iran2Dentist, Tehran Iran3Restorative Dentistry Specialist, Kermanshah, Iran
ABSTRACT
Today, increasing desire for tooth brightening, make bleaching gel and light sources as a popular method for tooth whitening. The aim of this study was effect of combination of bleaching gel and light source on the teeth whitening. In this study 60 healthy human anterior teeth were randomly dividedin three groups (n=20). The fi rst groupwas with-outlight, the second one LED andon the third group QTH light was used. Each group was divided into two subgroups whichhad two types of hydrogen peroxide bleaching gelsincluding 37.5% Pola offi ce and 40% Opalescence Boost which were applied to them. The primary colors of teeth were measured, and then kept intea (200ml) for 7 days. After that each tooth color was measured for the second time. The teeth were bleached according to the protocol of each group: Immediately, after 3, 7 and 30 days they were measured by spectrophotometer. Data were analyzed by statisti-cal software SPSS 20 and One-way ANOVA and Tukey testin alpha 0.05. Bleaching effectiveness of QTH signifi cantly was increasedin both of bleaching gels as compared to LED and without using of light, at different times: instantly, 3 days and 7 days after bleaching, a month after bleaching, signifi cant differences between the different methods was not seen. The results of this study showed thatin-offi ce bleaching, with or without light is an effective method of beaching. QTH Light in the short term (one week) showed signifi cant impact on teethwhitening in both bleach gel. However, within a month therewere no signifi cant differences in all groups.
KEY WORDS: IN-OFFICE BLEACHING, HYDROGEN PEROXIDE, ACTIVATION LIGHT
564
ARTICLE INFORMATION:
*Corresponding Author: [email protected] 24th July, 2017Accepted after revision 26th Sep, 2017 BBRC Print ISSN: 0974-6455Online ISSN: 2321-4007 CODEN: USA BBRCBA
Thomson Reuters ISI ESC and Crossref Indexed Journal NAAS Journal Score 2017: 4.31 Cosmos IF: 4.006
© A Society of Science and Nature Publication, 2017. All rights reserved.Online Contents Available at: http//www.bbrc.in/DOI: 10.21786/bbrc/10.3/34

Baharan Ranjbar Omidi et al.
BIOSCIENCE BIOTECHNOLOGY RESEARCH COMMUNICATIONS EVALUATION OF TWO TYPES OF BLEACHING GEL AND LIGHT SOURCE 565
INTRODUCTION
In recent years, cosmetic dentistry has become an important part of restorative dentistry. In all ages,the teethappearances for patients are one of important aspects which infl uences on satisfaction of them.Desire of having a whiter tooth has increased due to attention of people to this novel that brighter teeth are healthier and morestylish (Barghi, 1998). The bleaching is very effective on teeth with high Hue and yellow tint (Ishi-kawa‐Nagai, Terui, Ishibashi, Weber, & Ferguson, 2004). In fact, dental bleaching materials are oxidizing materi-als which difference in various techniques still stay con-troversial (Izquierdo-Barba, Torres-Rodríguez, Matesanz, & Vallet-Regí, 2015) .
Today, several bleaching methods are used includ-ing: in-offi ce professional, in-home professional (dentist supervised take-home) and products without a prescrip-tion (over-the-counter) (Caneppele, 2013). To speed up the bleaching process, increasing the concentration of chemicals or use different light devices recommended, (Sulieman, Addy, MacDonald, & Rees, 2004), (Buchalla & Attin, 2007). Some advantages of in-offi ce techniques like prevention of swallowing and contacting with oral soft tissue, reducing treatment time and controlling of the healing process make it as a suitable technique for most patients compared to other techniques (Luk, Tam, & Hubert, 2004), (Tay, Kose, Loguercio, & Reis, 2009).
Two important factors in estimating the teeth whiten-ing product performance are peroxide concentration and the duration of its application. Studies have shown that higher concentrations of peroxide is required a smaller amount of gel (Sulieman et al., 2004). In today’s in-offi ce bleaching carbamide peroxide and hydrogen per-oxide are used mainly by heat or light-activated devices to accelerate the process of bleaching teeth (Sulieman et al., 2004), (Zhang et al., 2007). Most studies have sug-gested that light cure accelerated the degradation of per-oxide (by increasing temperature) which led to thefor-mations of higher free radicals(Sulieman et al., 2004), (Joiner, 2004), (Lima et al., 2009). today various light cure devices like Light-emitting diode(LED), halogen lamp, plasma arc lamp(PAC) are available, however, applica-tion of heat, light or laser devices should not be more than 5.5°C temperature due to preventing pulp chamber damage(Buchalla & Attin, 2007). Although, in recent years the use of laser bleaching is generally available as an energy source but LED require nearly low cost, and less energy (Kurachi, Tuboy, Magalhães, & Bagnato, 2001). There is controversy about the effectiveness of different light on teeth bleaching. although some researchers have reported benefi ts,however others showed no effects on bleaching, (Ishikawa‐Nagai et al., 2004, Lima et al., 2009, Polydorou, Wirsching, Wokewitz, & Hahn, 2013).
Polydorou et al. (2013) have reported that QTH is more effective than laser bleaching, while Hahn et al. (2013) did not investigate any improvement with LED and laser in bleaching teeth. In another study which evaluated six different light resulted that the diode laser, QTH and LED had a signifi cant impact on Teeth Whit-ening (Domínguez et al., 2011) Similarly, Kossatz et al., compared effect of LED and laser on 35% hydrogen per-oxide bleaching gel and reported no signifi cant differ-ences (Kossatz et al., 2011).
In another study where 35% hydrogen peroxide was used, LED, QTH, plasma arc lamp, argon laser was used and they have been reported no effect on tooth bleach-ing (Lima et al., 2009). Clinician should be aware of any risks regarding to bleaching process (Alqahtani, 2014). The aim of this study was to evaluate effect of LED and QTH light on teeth whitening, since using of any type of light as an additional device is questionable in-offi ce bleaching.
MATERIAL AND METHODS
In vitro experimental study, the 60 human anterior teeth were selected. First teeth were checked for any defects, cracks, decays or fi llings. Then selected teeth after scal-ing, brushing (for 10 seconds with pumice and water by prophylaxis rubber cup then cleaned with ultrasonic cleaner, and stored for one week in the solution0.1% Thymol at 4°C. While the entire of laboratory work used gloves, surgical masks and face shields (Kohn et al., 2003), (Kumar, Sequeira, Peter, & Bhat, 2005), (Lolayekar, Bhat, & Bhat, 2007). The teeth were fi xed in acrylic resin into the mold which the angle of light cure is perpendicular to the labial surface of the teeth. By creating four small holes (depth of about 0.5 mm) with bur (No#1) created square-shaped area (with dimensions of approximately 3 mm) in the middle third of the labial teeth (Figure 1).
Labial surface of teeth were cleansed and brushed. Then all the teeth stored in Ringer (Ringer’s Infu-sion, Shahid Ghazi Pharmaceutical Co., Tabriz-Iran).The teeth are completely dry with gauze and randomly divided into three groups (20 = n) with different bleach-ing protocols:The fi rst group without light, the second LED light cure system (Woodpecker Dental LED.D Cur-ing Light, China), the third group QTH light cure system (Coltolux 75 Curing Light-Coltene/Whaledent, USA). Each group divided into two subgroups of 10 teeth the fi rst subgroup, hydrogen peroxide 37.5% Polaoffi ce + (SDI, Australia) and in the second subgroup of hydrogen peroxide 40% Opalescence Boost (Ultradent Products Inc, South ordan, UT USA) was used (fi gure 1).
The samples were placed on holder plate, white paper Leneta. Light source positioned at an angle of 45 degrees

Baharan Ranjbar Omidi et al.
566 EVALUATION OF TWO TYPES OF BLEACHING GEL AND LIGHT SOURCE BIOSCIENCE BIOTECHNOLOGY RESEARCH COMMUNICATIONS
FIGURE 1. Preparation of tooth for bleaching
to a line perpendicular to the surface and spectropho-tometer device (KONIKA MINOLTA CS2000, Japan) with an approximate angle of zero degrees relative to a line perpendicular to the sample surface and they were placed approximately 70 cm.
The device was set at 0.2 degrees. This angle makes circular area with 2.4 mm in diameter in specimens. Three measurements were taken for each sample and average measurements were reported. Measurements were conducted under laboratory conditions at approxi-mately 25°C. The primary color of the teeth (M1) was measured by spectroradiometer. for changing the color, teeth were retained for 7 days in a mixture of tea (tea bags Golestan) obtained by the method Sulieman et al (Sulieman, Addy, & Rees, 2003). Teethwere brushed to remove pigments.
Then the teeth color was measured for the second time (M2). The teeth were bleached in all 3 groups according to the protocol set for each group, while the distance to the labial surface of the teeth were 5 mm to light tip. The intensity of light rays was measured before the start of each bleaching cycle using Radiometer (QTH = 370mw/cm2, LED = 380mw/cm2) to ensure constant light output is achieved at all stages of bleaching. In all three groups, the use of bleaching gel and light were performed exactly according to the manufacturer’s instructions. A thin layer of (1 mm) Polaoffi ce bleaching gel was placed on the labial surface of the teeth for 8 minutes, then using clean cotton it was cleansed by gel then was stained with fresh gel.
This process was repeated three times (according to the manufacturer’s instructions) and at the end all clear gel, rinsed with water and dried and the bleaching gel
Opalescence Boost, a thin layer (mm1) of gel on the labial surface of teeth put for 20 minutes (according to the manufacturer’s instructions) and at the end all clear gel, rinsed with water and dried. Light application in groups 2 and 3 were three 8-minute for Polaoffi ce and a 20-minute period to Opalescence Boost.
Tooth color was measured immediately after bleach-ing (M3). Samples were put on Ringer with 37 ° C which switching with new Ringer every day then he teeth color were measured after 72 hours (M4), 1 week (M5), one month (M6). All stages of tooth color measurement sys-tem were performed by spectrophotometer according to CIE L*a*b* (Commission Internationale de I’Eclairage’s)(Tavares et al., 2003). According to the ADA (American Dental Association) tooth color measurement, device located in the middle third of the labial surface of the teeth (fi gure 2).
Tooth bleaching ΔE values are directly infl uenced by the index tooth color difference between the initial measurement and other measurements are shown and using the formula: E = [(ΔL *) 2+ (Δa *) 2+ (Δb *) 2] 1 / 2Δ (Δa = a * post - a * baseline, Δb = b * post - b * baseline, ΔL = L * post - L * baseline) was achieved. Data were collected with 20 SPSS statistical software and ANOVA test value of P (P<0.05) were obtained and studied under Tukey test was used pairs of groups.
RESULTS AND DISCUSSION
ΔE averages and standard deviations for all groups and in all stages after bleaching compared to after being in tea shown in Table 1.

Baharan Ranjbar Omidi et al.
BIOSCIENCE BIOTECHNOLOGY RESEARCH COMMUNICATIONS EVALUATION OF TWO TYPES OF BLEACHING GEL AND LIGHT SOURCE 567
Signifi cant difference between ΔE of groups (at times immediately, three days and one week after white) one-way ANOVA test was observed ( P-Value <= 0.05). ΔE signifi cant difference between the groups was observed one after month the bleaching. (P = 0.57)
Comparing of pairs of groups by test Tukey, both of bleaching, a signifi cant difference in the effectiveness of bleaching (ΔE) with the use of light QTH compared to LED and without the use of light (in the time immedi-ately after bleaching, three days and 7 days after bleach-ing) showed that although a month later bleaching of teeth whitening showedsignifi cant difference in effi cacy between any of these groups (Table 2).
To achieve lightening of teeth in a short time, bleach-ing technique in the offi ce, using a high concentration hydrogen peroxide gel, with and without the use of light is recommended (Luk et al., 2004), (Roberto et al., 2011). Some studies have emphasized that light can be used to catalyze the hydrogen peroxide, thus accelerates the bleaching process (Dostalova et al., 2004), (Tavares et al., 2003). This issue is still discussed in articles and reviews.
In the present study, the teeth ΔE after tea, signifi cantly increased (ΔE in all groups was higher than 3.3 means the discoloration caused by tea in all groups were detect-able by eye) ΔE, difference before and after exposure to tea among all groups was not signifi cant.
In this study, ΔE changes in groups (immediately, three days and one week after bleaching), was signifi cant,so the applicationof Polaoffi ce with QTH showed whitening effect. In the present study, the Tukey test results showed that in both bleaching agent (Opalescence and Pola offi ce), QTH Light application signifi cantly increased the effectiveness of bleaching component compared to LED or without light, immediately after bleaching teeth, 3 days and 7 days after bleaching, Because QTH heat transfer capability to the teeth is more than LED. QTH produce more heat than light on the tooth surface which can form groups that cause more tooth dehydration (Liang et al., 2012). Also, previous studies which have examined differ-ent types of light reported that QTH effect was remarkably higher in immediately after bleaching (Sulieman et al., 2005, Polydorou et al., 2013 Liang et al., 2012).
FIGURE 2. Evaluation of samples by spectrophotometer
Table 1.
1 month after bleaching
7days after bleaching
3 days after bleaching
Immediately after bleaching
Groups
6/74 (1/12) 3/92 (0/82) 4/95 (0/9) 3/8 (0/57) Polaoffi ce+without light
9/83 (2/78) 3 (0/8) 3/82 (0/77) 2/89 (1) Opalescence Boost without light
7/25 (0/88) 4/78 (0/49) 5/39 (0/58) 3/57 (0/56) LED Polaoffi ce+
7/17 (1/08) 98/3 (0/53) 4/21 (0/37) 3/28 (0/54) LED Opalescence Boost
6/58 (1) 10/84 (1/11) 10/3 (1/09) 8/82 (1/21) QTH Polaoffi ce+
6/32 (0/81) 8/44 (0/45) 8/08 (0/45) 7/28 (0/4) QTH+Opalecensce Boost
Signifi cant difference between ΔE of all groups after being in tea using one-way ANOVA test was observed. (P = 0.47)

Baharan Ranjbar Omidi et al.
568 EVALUATION OF TWO TYPES OF BLEACHING GEL AND LIGHT SOURCE BIOSCIENCE BIOTECHNOLOGY RESEARCH COMMUNICATIONS
In this study, ΔE difference was not statistically sig-nifi cant a month after bleaching,in all groups, ΔE was more than 3.3 which teeth bleaching was still detectable after a month with eye. Tukey test results compare pairs of groups after one month however no signifi cant dif-ference was observed between ΔE. This means that after a month no statistically signifi cant differences between the different methods of bleaching as observed similar results from studies have concluded the same, (Poly-dorou et al., 2013) and (Alomari & El Daraa, 2010).
In this study, all groups showed obvious effect imme-diately after bleaching, though there is noconsiderably differences between one and three months. Although some studies have reported the effects of light on tooth whitening (Luk et al., 2004), (Domínguez et al., 2011), (Ontiveros & Paravina, 2009), (Wetter, Barroso, & Pelino, 2004), but many studies have focused Light extremely ineffectiveness on teeth whitening (Lima et al., 2009), (Polydorou et al., 2013), (Roberto et al., 2011),(Bernardon et al., 2010), (Marson, Sensi, Vieira, & Araújo, 2008), (Mondelli, Francisconi, Almeida, & Ishikiriama, 2012), (Hein et al., 2003), (Papathanasiou, Kastali, Perry, & Kugel, 2002).
Although, in this study QTH had greater effectiveness after 7 days, but after one month treatment relapse was observed. In Polydorous study, the use of QTH for each tooth was 4times in 8 minutes (Polydorou et al., 2013), while in Liangs study, two sessions with7 days interval 3 times of 10 minute were applied (Liang et al., 2012). So in both of these study groups, teeth were exposed longer to QTH light. Relapse in treatmentin the Poly-dorous study only occurred in a month after treatment QTH group (Polydorou et al., 2013), which is similar to the results of our study, while both groups in the Liangs
study showed relapse after a week with or without light cure system (Liang et al., 2012).
For other groupsin the Polydorous study, relapse occurred after 3 months (Polydorou et al., 2013), while in Liangs it happened sooner (Liang et al., 2012). These results can be explained by a lower concentration of bleaching agent used in study (32% Beyond II Advanced Formula Whitening Gel) compared with current study (37.5% Polaoffi ce and 40% Opalescence Boost) and Polydorou study (38% Opalescence Boost), although this difference is negligible. Tooth dehydration can cause brighter teeth immediately after bleaching so this can be increased by the heat transferred to the teeth (Luk et al., 2004). Tooth color becomes lighter during dehydration however returning to normal mode after rehydration. During in-offi ce bleaching, many factors could cause dehydration teeth, including teeth isolation, heat from the light (Liang et al., 2012).
According to the results of this study at any time after the teeth bleaching, a signifi cant difference in the effectiveness of the bleaching was observed regardless of light cure application, Which could be due to the concentration of these two bleaching gel (37.5% Pola offi ce + and 40% Opalescence Boost). Also, according to the manufacturer’s instructions, each of bleaching gel which hadless concentrations, longer exposure in the tooth surface (37.5% Polaoffi ce 3 times for 8 min-utes and 38% Opalescence Boost only 20 minutes)so the effectiveness of bleaching materials weresimilar. Scien-tifi c community believe that light cure bleaching effec-tiveness occurs due to reversible dehydration (Polydorou et al., 2013) so in long-term we should expect relapse of treatment. The results obtained in this study during a month is not only confi rmed the stability of tooth
Table 2.
GroupsP-valueImmediately
P-valueAfter3 days
P-valueAfter 7days
P-valueAfter one month
Polaoffi ce with Opalescence Boost Without light 0.450. 350. 440.31
Polaoffi ce with Opalescence Boost LED0.710.10. 280. 95
Polaoffi ce with Opalescence Boost QTH0.240.080. 080. 84
Without light Polaoffi ce + LED Polaoffi ce+0.980.930. 750. 93
Without light Polaoffi ce + QTH + Polaoffi ce*0.001*0.001*0.000. 99
Polaoffi ce + LED with QTH + Polaoffi ce +*0.00*0.002*0.000. 89
Without light + Opalescence Boost LED + Opalescence Boost0.920.870.50. 55
Whithout light + Opalescence Boost QTH + Opalescence Boost*0.001*0.00*0.000. 36
LED + Opalescence Boost QTH + Opalescence Boost*0.001*0.00*0.000. 94
ΔE Changes in groups at different times after bleach in arein Charts 1, 2 and 3.

Baharan Ranjbar Omidi et al.
BIOSCIENCE BIOTECHNOLOGY RESEARCH COMMUNICATIONS EVALUATION OF TWO TYPES OF BLEACHING GEL AND LIGHT SOURCE 569
color But also enhances the white color of the teeth in both LED and without light cure system. The Greenwall hypothesis is that during bleaching, teeth get aerated by oxygen and oxidation processes caused by dehydration change the visual characteristics of the teeth. This partly is explained why teeth become whiter in this study after a month. For this reason, after a two-week period, scat-tered oxygen rehydrate and teeth show their true colors (Greenwall, 2001).
While in current study, the majority of teeth bleached within a month except QTH group which heat lead to improve the effectiveness of treatment in few fi rst days,another parameter that can affect the outcome of the study is the viscosity of bleaching gel. Opalescence Boost was replaced with Opalescence Xtra Boost some time ago, although, manufacturer claim no chemi-cal change, but the foundation and consistency has changed; the new bleaching gel is more viscous than before. The composition and sticky bleaching gel affect on the release of hydrogen peroxide which impact on bleaching process (Christian Hannig, Weinhold, Becker, & Attin, 2011), (Hannig, Zech, Henze, Dreier, & Attin, 2005), (Thitinanthapan, Satamanont, & Vongsavan, 1999). high viscosity bleaching agents compared to low one shows higher peroxide emissions (Christian Hannig et al., 2011).
This change in viscosity after bleaching can cause different behavior because the viscosity of the material affects the free movement of peroxide (peroxide release kinetics). The clinical perspective, highlights light cure effect on the confi dence and satisfaction of patients to continue bleaching. After a month there was no signifi -cant difference between the three groups and this shows that bleaching by light relapse sooner and do not main-tain long-term effect.
CONCLUSION
According to data obtained from this study, the fol-lowing results can be obtained. In offi ce- bleaching, with and without light, is effective to bleach teeth.In both type of bleaching, bleaching effectiveness of QTH increases signifi cantly compared to LED and with-out the use of light, at times of instantly, 3 days and 7 days after bleaching.Light cure does not lead to increase effectiveness of bleachingwithin a month.
REFERENCES
Alomari Q, El Daraa E. 2010 A randomized clinical trial of in-offi ce dental bleaching with or without light activation. Con-temp Dent Pract. 11:17–24.
Barghi N. 1998 Making a clinical decision for vital tooth bleaching:At-home or in-offi ce? Compendium Continuing Educationin Dentistry 19(8): 831-838.
BernardonK,Sartori N, Ballarin A, Perdigão, Lopes GC, Bara-tieri LN. 2010 Clinical performance of vital bleaching tech-niques. Oper Dent. 35:3-10.
Buchalla W, Attin T.2007 External bleaching therapy with acti-vation by heat, light or laser: a systematic review. Dent Mat 23: 586- 96.
Domínguez A, García A, CostelaA,Gómez C. 2011 Infl uence of thelight source and bleaching gel on the effi cacy of the tooth whiteningprocess. Photomed Laser Surg 2011; 29: 53-9.
Dostalova T, Jelinkova H, Housova D, Sulc J, Nemec M, Miyagi M 2004 Diode laser activated bleaching. Braz Dent J 15:3-8.
Greenwall L. 2001 Bleaching Techniques in Restorative Den-tistry. London: Martin Duntz Ltd
Hahn P, Schondelmaier N, Wolkewitz M, Altenburger M, Poly-dorou O. 2013 Effi cacy of tooth bleaching with and without light activation and its effect on the pulp temperature. Odon-tology. 2013 Jan;101(1):67-74.
Hannig C, Weinhold HC, Becker K, Attin T. 2011 Diffusion of peroxi des through dentine in vitro with andwithout prior use of a desensitizing varnish. Clin Oral Investig 15(6) :863-868.
Hannig C, Zech R, Henze E, Dreier S, Attin T.2005 Peroxide release into saliva from fi ve different homebleaching systems in vivo. Am J Dent. 18(1): 13-18.
Hein DK, Ploeger B, Hartup K, Wagstaff RS, Palmer TM, Hansen LD.2003 In-offi ce vital tooth bleaching - what do lights add? CompendContinEduc Dent. 24:340-52.
Ishikaw-Nagai S,TeruiT,Ishibashi K, et.al. 2004 Prediction of optical effi cacy of vital tooth bleaching using regression anal-ysis. Color Research and Application 29:390-4
Joiner A. 2004 Tooth colour: a review of the literature. Den-tistry 32:3-12.
Kohn WG, Harte A, Malvitz DM, Collins AS, Cleveland L, Eklund K; Centers for Disease Control and Prevention. CDC.2004 Guidelines for Infection Control in Dental Health-Care Settings-2003. Am Dent Assoc. 2004 Jan;135(1):33-47.
Kossatz S, Dalanhol AP, Cunha T, Loguercio A, Reis A.2011 Effect ofl ight activation on tooth sensitivity after in-offi ce bleaching. OperDent 2011; 36: 251-7.
Kumar M, Sequeira PS, Peter S, Bhat GK. Sterilisation of Extracted Human Teeth for Educational Use. Indian J Med Microbiol 2005;23(4):256-258.
Kurachi C, Tuboy AM, Magalhães DV, Bagnato VS. 2001 Hard-ness evaluation of a dental composite polymerizedwith experi-mental LED-based devices. Dent Mater 2001; 17: 309–15.
Liang S., Y Sa, L Sun,X Ma, Z Wang, W Xing 2012 Effect of halogen light irradiation on hydrogen peroxide bleaching: an in vitro study. Australian Dental Journal. 57: 277–283.
Lima DA, Aguiar FH, Liporoni PC, Munin E, Ambrosano GM,Lovadino R. 2009 In vitro evaluation of the effectiveness of bleachingagents activated by different light sources. Pros-thodont 2009; 18: 249-54.

Baharan Ranjbar Omidi et al.
570 EVALUATION OF TWO TYPES OF BLEACHING GEL AND LIGHT SOURCE BIOSCIENCE BIOTECHNOLOGY RESEARCH COMMUNICATIONS
Luk K, Tam L, Hubert M. 2004 Effect of light energy on perox-ide tooth bleaching. Am Dent Assoc. 135:194-201.
Marson FC, Sensi LG, Vieira LC, Arauo E. 2008 Clinical evalu-ation of in-offi ce dental bleaching treatments with and with-out the use of light-activation sources. Oper Dent. Jan-Feb; 33(1):15-22.
Mondelli RF, Azevedo F, Francisconi AC, Almeida CM,Ishikiriama SK. 2012 Comparative clinical study of the effectiveness ofdifferent dental bleaching methods - two year follow-up. ApplOral Sci. 20(4):435-43.
Nikita V Lolayekar, Vidya Bhat S, Sham S Bhat. 2007 Distin-fection Methods of Extracted Human Teeth. Oral Health Comm Dent 2007;1(2):27-29.
Ontiveros C, ParavinaRD.2009 Color change of vital teeth exposed to bleaching perfomed with and without supplemen-tary light. Dent. 37:450-7.
Papathanasiou A, Kastali S, Perry RD, Kugel G.2002 Clinical evaluation of a 35% hydrogen peroxide in-offi ce whitening system.CompendContinEduc Dent. 23:335-8.
Polydorou O, Wirsching M, Wokewitz M, Hahn P. 2013 Three-monthevaluation of vital tooth bleaching using light units: a randomizedclinical study. Oper Dent. 2013 Jan-Feb; 38(1):21-32.
Roberto AR, Jasse FF, Boaventura JMC, Martinez TC, Rastelli ANS, Junior OB 2011 Evaluation of tooth color after bleach-ing with and without light-activation. Rev OdontoCienc. 26(3):247-252.
Sulieman M, Addy A, Rees JS. 2003 Development and eval-uation ofa method in vitro to study the effectiveness of toothbleaching. J Dent. 31:415-22.
Sulieman M, Addy M, MacDonald E, Rees S. 2004 The effect of hydrogen peroxide concentration on the outcome of tooth whitening: an in vitro study. Dentistry 32: 295-9.
Sulieman M, MacDonald E, Rees S, Addy M.2005 Comparison of three in-offi ce bleaching systems based on 35% hydrogen peroxide with different light activators. Am Dent.18:194-7.
Tavares M, Stultz J, Newman M, Smith V, Kent R, Carpino E 2003 Light augments tooth whitening with peroxide. J Am Dent Assoc 134:167-75.
Tay LY, Kose C, Loguercio AD , Reis A. 2009 Assessingthe effect of a desensitizing agent used before in-offi cetooth bleaching ournal of the American Dental Association 140(10):1245-1251.
Thitinanthapan W, Satamanont P, Vongsavan N 1999 In vitro penetration of the pulp chamber by three brandsof carbamide peroxide. J Esthet Dent. 11(5):259-264
Wetter NU, Barroso MC, Pelino EP. 2004 Dental bleaching effi -cacy with diode laser and LED irradiation: an in vitro study. Lasers Surg Med. 35:254-8.
Yap AU, Soh MS.2003 Thermal emission by different light curingunits. Oper Dent 2003; 28: 260–6.
Zhang C, Wang X, Kinoshita 2007 Effects of KTP laser irradia-tion, diode laser and LED on tooth bleaching: a comparative study.Photomed Laser Surg 2007; 25: 91-5.

Medical CommunicationBiosci. Biotech. Res. Comm. 10(3): 571-579 (2017)
Area-metric analysis of the quality of obturation of
four different techniques: An ex vivo study
Yazdan Shantiaee1, Setareh Rostami2, Shiva Shojaeeian3 and Sanaa Jabbari4 1Associate Professor, Dental School of Shahid Beheshti University of Medical Sciences, Tehran, Iran2Dentist, Shahid Beheshti University of Medical Scineces, Tehran, Iran3Assistant professor, Department of Endodontics, Dental school of Shahid Beheshti University of Medical Sciences, Tehran, Iran4Post Graduate Student, Department of Endodontics, Dental School of Shahid Beheshti University of Medical Sciences, Tehran, Iran
ABSTRACT
The aim of this study was to compare different obturation techniques in straight canals in term of the percentage of gutta-percha fi lled area (PGFA) and percentage of sealer fi lled area (PSFA) and voids. The obturation time was also compared. Straight root canals of 40 extracted human premolars were instrumented with Mtwo rotary fi les and fi lled as follows: Control: cold lateral compaction with standard master and accessory cones. CLS group: cold lateral com-paction with 0.04/35 master cone and standard accessory cones. CLNS group: cold lateral compaction with 0.04/35 master cone and non-standard medium-fi ne (MF) accessory cones. WLS group: warm lateral compaction with 0.04/35 master cone and standard accessory cones. AH26 sealer was used. The teeth were sectioned horizontally at 3, 6 and 9 mm from the apex. The total area of each section and the PGFA, PSFA and percentage of voids were calculated. Data were analyzed using repeated measures ANOVA and Kruskal-Wallis test.The CLNS was the fastest method with a signifi cant difference with the control group (P<0.05) while WLS required signifi cantly more time than all other techniques (P<0.05). In the apical and coronal thirds, CLNS yielded signifi cantly lower PGFA (P<0.05). In the middle third, WLS yielded signifi cantly higher PGFA than CLNS (P<0.05). Cold lateral compaction using gutta-percha master cone with 4% taper and MF accessory cones is not effi cient for obturation of canals. Also, warm lateral compaction has no superiority to cold lateral compaction in straight canals.
KEY WORDS: COLD LATERAL CONDENSATION, SEALER, WARM LATERAL COMPACTION, OBTURATION, GUTTA-PERCHA
571
ARTICLE INFORMATION:
*Corresponding Author: [email protected] 12th July, 2017Accepted after revision 27th Sep, 2017 BBRC Print ISSN: 0974-6455Online ISSN: 2321-4007 CODEN: USA BBRCBA
Thomson Reuters ISI ESC and Crossref Indexed Journal NAAS Journal Score 2017: 4.31 Cosmos IF: 4.006
© A Society of Science and Nature Publication, 2017. All rights reserved.Online Contents Available at: http//www.bbrc.in/DOI: 10.21786/bbrc/10.3/35

572 AREA-METRIC ANALYSIS OF THE QUALITY OF OBTURATION OF FOUR DIFFERENT TECHNIQUES BIOSCIENCE BIOTECHNOLOGY RESEARCH COMMUNICATIONS
Yazdan Shantiaee et al.
INTRODUCTION
Achieving a hermetic apical, lateral and coronal seal is an important factor to prevent entry of microorganisms into the canal and periapical tissues, and depends on proper cleaning and shaping and effi cient obturation of root canal system (Wu et al. 1993; Mollander et al. 1998; Schafer et al. 2012). Advances in formulations of root canal irrigating solutions and rotary devices have greatly enhanced proper cleaning and shaping of root canal system. Homogenous, three-dimensional fi lling of root canal space by gutta-percha and sealer can greatly increase the success of endodontic treatment (Wu et al. 2002). Gutta-percha cones must be compacted next to each other with a very thin layer of sealer between gutta-percha cones and canal wall to minimize voids (Gordon et al. 2005). Gutta-percha dimensions do not change over time (Wu et al. 2009) but sealer undergoes shrinkage and dissolution (Al-Hadlaq et al. 2010; Nica et al. 2012). Following dissolution of sealer over time, voids are created in the canal, which can compromise the seal and enable entry and accumulation of micro-organisms and subsequent development of periapical lesions and eventual treatment failure (Jarret et al. 2004; Schafer et al. 2012).
If the volume of gutta-percha mass compared to that of sealer increases, less voids will be created over time and coronal and apical seal will not be compromised. This would increase success of endodontic treatment (Kazemi et al. 1993; Kontakiotis et al. 1997; Wu et al. 2009). A systematic review reported that canals fi lled with adequate, homogenous gutta-percha mass showed primary endodontic success (Ng et al. 2008). Another study reported that homogeneity of gutta-percha mass had a signifi cant positive effect on periapical health and success of endodontic treatment (Lee et al. 2012).
Root canal fi lling length should be equal to the work-ing length to ensure that the entire prepared space is fi lled with gutta-percha (Kojima et al. 2004; Schaeffer et al. 2005). Thus, maximum penetration of master and accessory gutta-percha cones must be ensured. The taper of master and accessory gutta-percha cones is an impor-tant factor affecting the penetration depth of gutta-per-cha into the canal such that the greater the compatibil-ity of taper of gutta-percha with that of root canal, the more homogenous and regular their arrangement would be in the canal. Some authors believe that using a single gutta-percha cone that matches the taper and size of prepared canal would have the best adaptation to canal walls (Whitworth, 2005; Schafer et al. 2013).
Several methods have been suggested for root canal obturation such as lateral compaction, vertical con-densation, single-cone obturation with a gutta-percha cone that matches the size and taper of prepared canal
(Schafer et al. 2012), use of a solid core covered with gutta-percha, injection of soft, plasticized gutta-percha into the canal and use of physically and chemically modifi ed gutta-percha with higher adaptation (Skinner et al. 1987; Whitworth, 2005; Schafer et al. 2013). Each of these techniques has its own advantages and disad-vantages, and no consensus has been reached on the superiority of one technique over the others (Aqrabawi et al. 2006; Ng et al. 2007).
Lateral compaction is a commonly used root canal obturation method due to its simplicity (Cailleteau et al. 2009). This technique can be practiced in most clinical situations and enables length control during compac-tion (Gilhooly et al. 2001). However, its main drawback is that it cannot create a homogenous mono-block of gutta-percha. Master and accessory gutta-percha cones are placed next to each other but remain separate and the space between cones is expected to be fi lled with sealer, which undergoes shrinkage and dissolution over time. In thermoplastic methods such as warm vertical condensation and warm lateral compaction, heat is used to cause physical changes in gutta-percha and increase its plasticity and adaptation to the canal walls. Warm lateral compaction allows length control and at the same time, heat results in adherence of gutta-percha cones to each other and formation of a solid mass (Jacobsen et al. 1993).
Considering the need for decreasing working time in dental offi ce, gutta-percha cones with 4% and 6% tapers and non-standard medium fi ne (MF) and fi ne-fi ne gutta-percha cones were introduced to the market for faster obturation of root canals. However, deep penetration of accessory cones with greater taper is diffi cult. Stud-ies on penetration depth of spreader alongside a master cone with 2% taper and master cones with higher than 2% taper showed greater penetration depth of spreader next to master cone with 2% taper (Bal et al. 2001; Wil-son et al. 2003). Thus, complete penetration of accessory cones to the working length and obtaining an apical seal with the use of these gutta-percha cones is a matter of debate. This study has aimed to assess the quality of root canal fi lling by measuring the percentage of gutta-percha (PGFA) and sealer fi lled areas (PSFA) and voids in use of four different obturation techniques. Duration of obtura-tion was also compared among the four methods.
MATERIAL AND METHODS
This in vitro, experimental study was conducted on 40 single-canal maxillary and mandibular premolars with straight canals. The teeth were randomly divided into four groups (n=10). The highest mean difference expected for PGFA among the groups was considered to

BIOSCIENCE BIOTECHNOLOGY RESEARCH COMMUNICATIONS AREA-METRIC ANALYSIS OF THE QUALITY OF OBTURATION OF FOUR DIFFERENT TECHNIQUES 573
Yazdan Shantiaee et al.
be 0.13 with a standard deviation of 14% according to a study by Schafer et al. in 2012. Considering 80% power of study and type one error of 5%, sample size was cal-culated to be 10 in each group.
The inclusion criteria were single-rooted premolar teeth extracted for orthodontic or periodontal reasons with a straight canal and one apical foramen and no visible root caries, no fracture or crack and no internal/external root resorption or calcifi cation on radiographs. The teeth had mature apices.
The exclusion criteria were presence of voids after fi lling and incorrect working length. Teeth with no api-cal constriction or fracture during cleaning and shap-ing were also excluded. After collection, the teeth were immersed in 3% sodium hypochlorite solution (Rakh-shan, Tehran, Iran) at room temperature for two days. Calculus (if any) was removed using a universal curette (Hu-Friedy, USA) and the teeth were evaluated under a stereomicroscope (SZX9; Olympus, Tokyo, Japan) at 20 magnifi cation to ensure absence of root cracks. Paral-lel periapical radiographs were obtained in mesiodis-tal and buccolingual dimensions to assess root canal anatomy. After access cavity preparation using 836 fi s-sure and 801 round burs (SWS, Switzerland), a #15 K fi le (Mani, Tokyo, Japan) was introduced into the canal until its tip was visible at the apex. The teeth were then radiographed and canal curvature was determined. The selected 40 teeth had straight canals and #20 K fi le was the largest initial fi le compatible with their root canal. The crowns were then cut at the cementoenamel junc-tion using a diamond disc (D & Z, Germany).
To determine the working length, a #15 K fi le (Mani, Japan) was introduced into the canal such that its tip was visible at the apex; working length was determined 1mm short of this length. All canals were cleaned using #15 and #20 K fi les (Mani, Japan) and then by Mtwo rotary NiTi fi les (VDW, Germany) with an endodontic motor (NSK, Japan) with slow pull and push brushing motion to the working length as recommended by the manufacturer in the following order: 0.04/10, 0.05/15, 0.06/20, 0.06/25, 0.05/30, 0.04/35. A #10 K fi le (Mani, Japan) was used after each rotary fi le for patency and 17% EDTA gel (Calasept, Nordiska Dental) was used as chelator. Root canals were rinsed with 2cc of 1.5% sodium hypochlorite (Rkhshan, Tehran, Iran). Smear layer was removed by rinsing the canals with 5cc of 17% EDTA for one minute followed by a fi nal rinse with saline. The root canals were dried with paper points (Ari-adent, Tehran, Iran) and the teeth were randomly divided into four groups of 10 and fi lled with AH26 sealer (Dent-sply DeTrey-Germany) and gutta-percha (Metabiomed, Korea) as follows:Control group: #35 standard gutta-percha (2% taper) as master cone and standard accessory cones were used in cold lateral compaction technique.
CLS groups: #35 standard gutta-percha (4% taper) as master cone and standard accessory cones were used in cold lateral compaction technique (cold lateral com-paction with standard gutta-percha).CLNS group: #35 standard gutta-percha (4% taper) as master cone and non-standard MF accessory cones were used in cold lat-eral compaction technique (cold lateral compaction with non-standard gutta-percha).WLS group: #35 standard gutta-percha (2% taper) as master cone and standard accessory cones were used in warm lateral compaction technique (warm lateral compaction with standard gutta-percha).Root canal fi lling with cold lateral compaction technique was done as follows: Following root canal preparation and drying, a standard gutta-percha cone with 2% taper was used in the control group and with 4% taper in the CLS group to the working length. Api-cal third of master cone was dipped in sealer and placed into the canal, rotated in counter clockwise fashion and removed. A proper size spreader was also selected based on canal taper to reach 1mm of the working length with master cone in the canal. Accessory cones were placed and cut at the orifi ce. No pressure was applied for verti-cal condensation.
Cold lateral compaction in CLNS group was the same as in the control and CLS groups with the exception of 4% taper of master cone and selected spreader. Also, non-standard MF accessory cones were used. In WLS group, the same procedures were followed with the exception that after placement of master cone with 4% taper, the thinnest tip of Obtura (E & Q Master Meta Biomed-Korea) that could reach 2-4mm of the apex adjacent to master cone was chosen and inserted as deep as possible into the canal. After removal, #25 fi nger spreader was placed adjacent to the heated master cone, removed immediately and replaced with an accessory cone with 2% taper. This process was repeated until complete obturation. Time required for obturation of each canal was also calculated from the time of placement of the fi rst gutta-percha to completion of obturation using a chronometer (reported in minutes). A control radiograph was also obtained from the mesiodistal direction to ensure complete obturation.
The teeth were incubated at 37C and 100% mois-ture for 14 days for completion of setting of sealer. Using an endodontic motor, root surface was marked at 3, 6 and 9 mm from the apex and the teeth were fi xed to IsoMet cutting machine (Buehler IsoMet Low Speed Saw 11-1180) from the coronal part using glue. The roots were sectioned horizontally under copious water. The slices were immersed in sodium hypochlo-rite solution for one minute to eliminate dentin chips and were then rinsed with 17% EDTA (Calasept Nord-iska Dental) for one minute followed by a rinse with water. The slices were photographed at 40 magnifi ca-tion under a stereomicroscope (SZX9; Olympus, Japan).

574 AREA-METRIC ANALYSIS OF THE QUALITY OF OBTURATION OF FOUR DIFFERENT TECHNIQUES BIOSCIENCE BIOTECHNOLOGY RESEARCH COMMUNICATIONS
Yazdan Shantiaee et al.
Photographs were saved in TIF format and assessed in Adobe Photoshop CS6 1301.2 software. In this software, the total surface area of the canal in each section and the percentage of gutta-percha fi lled area (PGFA) and percentage of sealer-fi lled area (PSFA) were separately calculated on each image in pixels. The percentage of void areas [total area of section-(PSFA+PGFA)] was also calculated. These values were reported for each section. All measurements were made by an examiner blinded to the group allocation of teeth (Figure 1). The values were recorded in Microsoft Excel 2013.
The PGFA and PSFA data in different sections were analyzed using repeated measures ANOVA. Obturation time data were analyzed using ANOVA and data of per-centage of voids were analyzed using the Kruskal Wallis test. The mean and standard deviation of PGFA, PSFA and void area were reported. For the comparison of the mean PGFA and PSFA, repeated measures ANOVA was used (since data were normally distributed). The Kruskal Wallis test was used to compare the mean area of voids in different sections. Data were analyzed using SPSS version 21 (SPSS Inc., IL, USA).
RESULTS AND DISCUSSION
Table 1 shows the mean PSFA, PGFA and void area val-ues in apical, middle and coronal sections. Table 2 shows the mean time of obturation in the groups. Table 3 shows the P values for the comparisons. As seen in Table 3, in the apical section, CLNS group showed signifi cantly lower PGFA than other groups (P<0.05). PGFA of WLS group was signifi cantly higher than that of other groups followed by CLS, control and CLNS groups, respec-tively. The difference of WLS with CLNS was signifi -cant (P<0.05) but its difference with other groups was not signifi cant (P>0.05) in this respect. The CLS group showed higher PGFA than the control group but this dif-ference was not signifi cant (P>0.05).
In the middle section, WLS showed higher PGFA than other groups followed by CLS, control and CLNS groups, respectively but only the difference between WLS and CLNS was signifi cant (P<0.05). The CLNS group showed lower PGFA than other groups but this difference only for WLS was signifi cant (P<0.05). The CLS showed higher PGFA than the control group but this difference was not signifi cant (P>0.05).In the coronal section, the CLNS group showed signifi cantly lower PGFA than other groups (P<0.0001). The PGFA in WLS group was higher than that in other groups followed by CLS, control and CLNS groups. The difference between CLNS and WLS was signifi cant (P<0.0001) but other differences were not signifi cant (P>0.05). The CLS group showed higher PGFA than the control group but this difference was not signifi cant (P>0.05).
As seen in Table 4, in the apical section, the CLNS group showed signifi cantly higher PSFA than other groups (P<0.05). The PSFA in WLS group was lower than that in other groups followed by CLS, control and CLNS groups, respectively. The difference between WLS and CLNS was signifi cant (P<0.0001) but other differences were not statistically signifi cant (P>0.05). The CLS group showed lower PSFA than the control group but this dif-ference was not signifi cant (P>0.05). In the middle sec-tion, WLS group showed lower PSFA than other groups followed by CLS, control and CLNS groups, respectively. Only the difference between the WLS and CLNS groups was signifi cant (P<0.05). The CLNS group showed higher PSFA than other groups but this difference only with WLS was signifi cant (P<0.05). The CLS group showed lower PSFA than the control group but this difference was not signifi cant (P>0.05).
In the coronal section, the CLNS group showed sig-nifi cantly higher PSFA than other groups (P<0.0001). PSFA of WLS group was lower than that of other groups followed by CLS, control and CLNS groups, respec-tively. The difference of WLS and CLNS was signifi cant (P<0.0001) but the difference with other groups was not statistically signifi cant (P>0.05). In general, in all sec-tions, the WLS group showed higher PGFA and lower PSFA than other groups followed by CLS, control and CLNS groups, respectively. The difference between WLS and CLNS in terms of PGFA and PSFA only in the mid-dle third was statistically signifi cant (P<0.05). The CLNS group in all sections showed lower PGFA and higher PSFA than other groups and this difference in the api-cal and coronal section was statistically signifi cant. The CLS group compared to the control group showed higher PGFA and lower PSFA in all sections but these differ-ences were not statistically signifi cant (P>0.05).
No signifi cant difference was noted in apical, middle and coronal sections of the four groups in terms of voids (P>0.05).
As seen in Table 5, the mean time required for root canal obturation in WLS group was signifi cantly longer than that in other groups (P<0.0001) followed by the con-trol, CLS and CLNS groups, respectively. The mean time required for root canal obturation in CLNS group was sig-nifi cantly shorter than that in the control group (P<0.05).
Three-dimensional obturation of root canal system is necessary to prevent bacterial reentry and ensure long-term success of endodontic treatment (Raina et al. 2007; Michaud et al. 2008). Finding an effi cient technique with the greatest ability to provide a hermetic seal is impor-tant to guarantee the success of endodontic treatment (Haikei et al. 2006). This study compared the quality of obturation of straight root canals prepared with Mtwo rotary fi les and fi lled with four obturation techniques by measuring the surface area fi lled with gutta-percha and

Yazdan Shantiaee et al.
BIOSCIENCE BIOTECHNOLOGY RESEARCH COMMUNICATIONS AREA-METRIC ANALYSIS OF THE QUALITY OF OBTURATION OF FOUR DIFFERENT TECHNIQUES 575
Tabl
e 1.
Mea
n PS
FA, P
GFA
and
voi
d ar
ea in
the
api
cal,
mid
dle
and
coro
nal s
ectio
ns o
f th
e fo
ur g
roup
s
Mea
n (%
)St
anda
rd
devi
atio
nM
axim
umM
inim
umM
ean
(%)
Stan
dard
de
viat
ion
Max
imum
Min
imum
Mea
n (%
)St
anda
rd
devi
atio
nM
axim
umM
inim
um
Apical
cont
rol
6.08
2.37
9.67
2.61
92.8
52.
1896
.36
89.3
30.
060.
180.
60
CLS
6.09
2.25
9.62
2.56
93.9
02.
2597
.42
90.3
90
00
0
CLN
S16
.79
9.92
20.3
113
.26
83.2
09.
9279
.69
86.7
20
00
0
WLS
5.03
3.44
8.55
1.50
94.9
63.
4498
.48
91.4
50
00
0
Middle
cont
rol
4.43
2.33
7.07
2.73
95.0
92.
3397
.27
92.9
10.
470.
842.
200
CLS
3.96
3.17
6.36
2.02
95.8
03.
1797
.98
93.6
20.
501.
595.
050
CLN
S7.
784.
9810
.42
6.07
91.7
55.
0193
.92
89.5
70.
461.
454.
600
WLS
3.95
2.33
6.12
1.77
96.0
42.
3398
.22
93.8
60
00
0
Coronal
cont
rol
5.29
4.69
9.20
2.23
94.2
84.
6997
.75
90.8
10.
420.
902.
500
CLS
5.23
3.59
9.11
2.15
94.4
63.
4897
.93
90.9
90.
400.
812.
500
CLN
S19
.28.
5424
.13
17.1
679
.35
8.54
82.8
275
.88
1.44
1.84
4.56
0
WLS
4.39
3.14
8.21
1.24
95.2
63.
1498
.73
91.7
90.
340.
832.
680

Yazdan Shantiaee et al.
576 AREA-METRIC ANALYSIS OF THE QUALITY OF OBTURATION OF FOUR DIFFERENT TECHNIQUES BIOSCIENCE BIOTECHNOLOGY RESEARCH COMMUNICATIONS
Table 2. Obturation time in the four groups
MinimumMaximumStandard deviation
Mean (minutes)
Group
5.207.600.606.41Control
4.506.900.825.66CLS
3.906.200.825.03CLNS
6.5010.301.188.43WLS
Table 3. P values for the comparison of PGFA in the apical, middle and coronal sections of the four groups
WLS CLNS CLS Control
Coronal Middle apical coronal Middle apical coronal middle apical Coronal Middle Apical
Control 1 1 1 <0.0001* 0.203 0.001* 1 1 1
CLS 1 1 1 <0.0001* 0.067 0.001* 1 1 1
CLNS <0.0001* 0.045* <0.0001* <0.0001* 0.067 0.001* <0.0001* 0.203 0.001*
WLS <0.0001* 0.045* <0.0001* 1 1 1 1 1 1
*Signifi cant.
Table 4. P values for the comparison of PSFA in the apical, middle and coronal sections of the four groups
WLS CLNS CLS Control
Coronal middle apical coronal Middle apical coronal middle apical Coronal Middle Apical
control 1 1 1 <0.0001* 0.206 0.002* 1 1 1
CLS 1 1 1 <0.0001* 0.068 0.001* 1 1 1
CLNS <0.0001* 0.046* <0.0001* <0.0001* 0.068 0.001* <0.0001* 0.206 0.002*
WLS <0.0001* 0.046* <0.0001* 1 1 1 1 1 1
*Signifi cant.
Table 5. P values for the comparison of obturation time in the four groups
ControlCLSCLNSWLSGroup-0.280.01<0.0001Control
0.28-0.43<0.0001CLS
0.010.43-<0.0001CLNS
<0.0001<0.0001<0.0001-WLS
sealer using area-metric analysis. The results showed that root canal obturation with non-standard accessory cones and a master cone with 4% taper decreased the gutta-percha mass and increased the sealer area. Use of a master cone with 4% taper had no positive effect on quality of obturation or working time. Warm lateral compaction in straight canals had no superiority over cold lateral compaction and took longer to accomplish.
In our study, root canals were prepared using Mtwo rotary system since Schafer et al. (2016) in 2016 showed
that root canals fi lled with gutta-percha of Mtwo rotary system had higher quality of obturation compared to those fi lled with gutta-percha of Reciproc and WaveOne systems. Also, we wanted to compare the percentage of area fi lled with gutta-percha in case of using gutta-percha with 4% taper. Thus, Mtwo was a suitable choice for this purpose since #35 gutta-percha in Mtwo system has 4% taper. Although master cone in our study was #35 with 4% taper (matched single cone of Mtwo sys-tem), not all the prepared canals follow the shape and
taper of fi nal fi le after preparation with the fi nal rotary fi le, so we designed a group in which we placed acces-sory gutta-percha cones between single cone and canal walls to assess the possibility of improving the qual-ity of obturation. Apical seal is an important param-eter in success of endodontic treatment and improper apical seal results in development of periapical lesions. The results of our study showed that in the apical third, use of non-standard gutta-percha alongside the master cone with 4% taper signifi cantly decreased the apical seal and quality of obturation and decreased PGFA and increased PSFA. Also, our results showed that use of standard gutta-percha with 2% and 4% taper along with 2% accessory cones did not cause a signifi cant change in quality of obturation in the apical third. Although PGFA in 4% gutta-percha group was higher and PSFA was lower than that in other groups, these differences were not signifi cant and no difference in voids was noted either. Based on our results, warm lateral com-

Yazdan Shantiaee et al.
BIOSCIENCE BIOTECHNOLOGY RESEARCH COMMUNICATIONS AREA-METRIC ANALYSIS OF THE QUALITY OF OBTURATION OF FOUR DIFFERENT TECHNIQUES 577
paction had no superiority over cold lateral compaction since no difference was noted between the two groups in any of the assessed parameters.
Comparison of the mean time of obturation among the groups showed that the mean time of obturation was sig-nifi cantly longer in WLS group compared to other groups. This time in CLNS group was signifi cantly shorter than that in the control group. The CLS and control groups were not signifi cantly different in this regard. Schafer et al. in 2012 compared the quality of root canal obtura-tion with 2% and 4% taper gutta-percha cones by micro-scopic area-metric analysis and found no signifi cant dif-ference between the two types in the apical region. None of them provided a better apical seal. Romina et al.(2009) performed area-metric analysis of root fi lling and showed equal apical seal in use of gutta-percha cones with 2% and 4% taper. Our results were in agreement with those of the afore-mentioned studies.
We found no signifi cant difference in time of obtu-ration between the use of gutta-percha cones with 2% and 4% taper, which was in agreement with the results of Schafer et al.(2012). Our results regarding the use of non-standard MF gutta-percha cones in comparison with the use of standard gutta-percha showed that use of non-standard cones along with a master cone with 4% taper decreased PGFA and increased PSFA in all sec-tions and this difference in the apical and coronal thirds was signifi cant. Thus, use of MF accessory cones along with 4% gutta-percha does not provide suitable apical seal. In contrast to our results, VanGheluwe and Wilcox in 1996 found no signifi cant difference in apical seal of standard and non-standard gutta-percha cones. Differ-ence in the results of the two studies may be due to the use of curved roots in their study. Use of warm lateral compaction method in our study increased PGFA and decreased PSFA in all sections, although insignifi cantly. No difference was noted in terms of voids. No signifi cant difference between warm and cold lateral compaction techniques in our study may be due to our small sam-ple size and use of straight canals because cold lateral compaction in straight canals is much easier and yields better results than in curved canals.
Thus, future studies with larger sample sizes are required to compare these two methods in curved canals. Collins et al. (2006) compared warm and cold lateral compaction and warm vertical condensation and concluded that warm lateral compaction signifi cantly increases the volume of gutta-percha mass in the canal compared to cold lateral compaction. Difference between our results and theirs may be due to different methodology since we performed area-metric analysis while they used replication of canal irregularity. Moreover, they used D11T spreader in their study, which is very fi ne and made of stainless steel, and can penetrate to 1mm of the working length while we used
fi nger spreader penetrated to 2mm of the working length. Moreover, they used non-standard MF gutta-percha while we used standard cones with 2% taper.
Several methods are available for assessment of the quality of root canal fi lling such as dye penetration (McRobert et al. 997), microbial leakage models, repli-cation of canal irregularity (Jacobson et al. 2008) and three-dimensional analysis by micro-computed tomog-raphy (CT) (Hammad et al. 2009). These methods have advantages and limitations. Dye penetration and micro-bial leakage are more commonly used due to simplic-ity and acceptable accuracy; however, smaller size of dye particles than some bacteria (Nielsen et al. 1995) and complexity and time consuming nature of microbial leakage (Sequeira et al. 2000) are among the drawbacks of these techniques.
Area-metric analysis has been used by many research-ers for assessment of the success of endodontic treat-ment in vitro. Thus, this method was used in our study. The limitations of this method include two-dimensional analysis of the root canal fi lling and lower accuracy than micro-CT. Moreover, dentin chips and smear layer created during sectioning in this method may decrease the quality of images and cause erroneous determina-tion of borders between gutta-percha, sealer and voids. To overcome this limitation, we immersed the slices in sodium hypochlorite solution for one minute after sec-tioning followed by one minute in 17% EDTA and then rinsed them to eliminate the smear layer and dentin chips. Considering the higher accuracy of micro-CT for three-dimensional assessment of quality of obturation, further studies with the use of micro-CT on both straight and curved canals are required to obtain more accurate information on this topic.
CONCLUSION
Root canal obturation with non-standard accessory cones and a master cone with 4% taper decreases the gutta-percha mass and increases the sealer area and therefore, compromises the quality of root canal fi lling. Use of a master cone with 4% taper has no positive effect on quality of obturation or working time. Warm lateral compaction in straight canals has no superiority over cold lateral compaction and takes longer to accomplish.
REFERENCES
Al-Hadlaq SM, Al-Jamhan A, Alsaeed T. (2010) Comparison of the single cone and lateral compaction techniques in sealing 0.04 taper root canal preparation. Gen Dent 58:219-22.
Aqrabawi JA. (2006) Outcome of endodontic treatment of teeth fi lled using lateral condensation versus vertical compaction. J Contempt Dent Pract 7:17.

Yazdan Shantiaee et al.
578 AREA-METRIC ANALYSIS OF THE QUALITY OF OBTURATION OF FOUR DIFFERENT TECHNIQUES BIOSCIENCE BIOTECHNOLOGY RESEARCH COMMUNICATIONS
Bal AS, Hicks ML, Barnett F. (2001) Comparison of laterally condensed 0.06 and 0.02 tapered gutta-percha and sealer in vitro. J Endod 27:786-8.
Cailleteau JG, Mullaney TP. (1997) Prevalence of teaching api-cal patency and various instrumentation and obturation tech-niques in united states dental schools. J Endod 23:394.
Collins J, Walker MP, Kulild J, Lee C.A comparison of three gutta-percha obturation techniques to replicate canal irregu-larities. J Endod 2006;8:762-5.
Gilhooly RM, Hayes SJ, Bryant ST, Dummer PM. (2001) Com-pacted of lateral condensation and thermomechanically com-pacted warm alpha-phase gutta-percha with a single cone for obturating curved root canals. Oral Surg Oral Med Oral Pathol Oral Radiol Oral Endod 91:89.
Gordon MPJ, Love R, Chandler NP. (2005) An evaluation of 0.06 tapered gutta-percha cones for fi lling of 0.06 taper pre-pared curved root canals. Int Endod J38:87-96.
Haikei Y, Freymann M, Fanti V, Claisse A, Poumier F, Wat-son M. (2006) Apical microleakage of radiolabeled lysozyme over time in three techniques of root canal obturation. J Endod 26:148-52.
Hammad M, Qualtrough A, Silikas N. (2009) Evaluation of root canal obturation: a three dimensional in vitro study. J Endod 35:541-4.
Jacobsen EL, Begole EA.( 1992) A Comparison of four canal obturation methods employing gutta-percha: a computerized analysis of the internal structure. Endod Dent Traumatol 8:206.
Jacobson HLJ, Xia T, Mini-Kai W, Paul RW. (2008) Sealing ability of a new polydimethylsiloxane-based root canal fi lling materials. J Endod 34:204-7.
Jarret IS, Marx D, Covey D, Karmazin M, Lavin M, Gound T. (2004) Percentage of canals fi lled in apical cross sections. Int Endod J 37:392-8.
Kazemi RB, Safavi KE, Spangberg LSW. (1993) Dimensional changes of endodontic sealers. Oral Surg Oral Med Oral Pathol 76:766-71.
Kojima K, Inamoto K, Nagamatsu K. (2004) Success rate of endodontic treatment of teeth with vital and non-vital pulps: a meta-analysis. Oral Surg Oral Med Oral Pathol Oral Radiol Oral Endod 97:5-9.
Kontakiotis EG, Wu MK, Wesselink PR.( 1997) Effect of sealer thickness on long-term sealing ability: a 2-year following study. Int Endod J 30:307-12.
Lee AH, Cheung GS, Wong MC. (2012) Long term outcome of primery non-surgical root canal treatment. Clin Oral Invest 16:1607-17.
McRobert AS, Lumley PJ. An in vitro investigation of coronal leakage with three gutta-percha back fi lling techniques. Int Endod J 1997;30:413-7.
Michaud R, Burgess J, Barfi eld R, Cakir D, McNeal S, Eleazer P. (2008) Volumetric expansion of gutta-percha in contact with eugenol. J Endod 34:1528-32.
Mollander A, Reit C, Dahlen G, Kvist T. (1998) Microbiological status of root-fi lled teeth with apical periodontitis. Int Endod J31:1-7
Ng YL, Mann V, Rahbaran S. (2008) Outcome of primery root canal treatment: systematic review of the literature. Int Endod J 41:6-31.
Ng YL, Mnn V, Rahbaran S, Lewsey J, Gulabivala K. (2007) Outcome of primery root canal treatment: systematic review of the literature. Int Endod J 40:921.
Nica LM, Didilescu A, Rusu D, Bacila A, Stratul SI. (2012) Pho-tomicrographic evaluation of the apical sealing capacity of three types of gutta-percha master cones: an in vitro study. Odontology 100:54-60.
Nielsen RB, Alyassin AM, Peters DD. (1995) Micro computed tomography: an advanced system for detailed endodontic research. J Endod 21:561.
Raina R, Loushine RJ, Weller RN, Tay FR, Pashley DH. (2007) Evaluation of the quality of the apical seal in Resilon/Epiph-any and gutta-percha/AH plus-fi lled root canal by using fl uid fi ltration approach. J Endod 33:944-7.
Romina C, Beltes P, Boutsionkis C, Dandakis C. (2009) Ex-vivo area-metric analysis of root canal obturation using gutta-per-cha cones of different tapers. Int Endod J 42:491-8.
Schaeffer MA, White RR, Walton RE. (2005) Determining the optimal obturation length: a meta-analysis of literature. J Endod 31:271-4.
Schafer E, Koster M, Burklein S. (2013) Percentage of gutta-percha fi lled areas in canals instrumented with NiTi sys-tems and obturated with matching single cones. J Endod 39:924-4.
Schafer E, Neilus B, Burklein S. (2012P) A comparative evalua-tion of gutta-percha fi lled area in curved root canals obturated with different techniques. Clin Oral Invest 16:225-30.
Schafer E, Schrenker C, Zupanc J, Burklein S. (2016) Percent-age of gutta-percha fi lledarea in canals obturated with cross-linked gutta-percha core-carrier systems, single-cone and lat-eral compaction technique. J Endod 2:294-8.
Sequeira JF, Rocas IN, Favieri A, Amad EC, Castro AJR, Gahyva SM. (2000) Bacterial leakage in coronaly unsealed root canals obturated with 3 different techniques. Oral Surg Oral Med Oral Pathol 90:647-50.
Skinner RL, Himel VT. (1987) The sealing ability of injection-modeled thermoplasticized gutta-percha with and without the use of sealers. J Endod 13:315.
VanGheluwe J, Wilcox LR. (1996) Lateral condensation of small curved root canals root canals: comparison of two types of accessory cones. J Endod 22:540-42.
Whitworth J. Methods of fi lling root canals: principles and practices. Endod Topics. 2005;12:2-24.
Wilson J, Baumgartner JC. (2003) Comparison of spreader penetration during lateral compaction of 0.04 and 0.02 gutta-percha. J Endod 29:828-31.

Yazdan Shantiaee et al.
BIOSCIENCE BIOTECHNOLOGY RESEARCH COMMUNICATIONS AREA-METRIC ANALYSIS OF THE QUALITY OF OBTURATION OF FOUR DIFFERENT TECHNIQUES 579
Wu MK, Bud MG, Wesselink PR. (2009) The quality of single cone and laterally compacted gutta-percha fi llings in small and curved root canals as evidenced by bidirectional radio-graphs and fl uid transport measurements. Oral Surg Oral Med Oral Pathol Oral Radiol Endod 108:946-51.
Wu MK, Kast Akora A, Wesselink PR. (2002) Quality of cold and warm gutta-percha fi llings in oval canals in mandibular premolars. Int Endod J34: 485-91.
Wu MK, Wesselink PR. (1993) Endodontic leakage studies recon-sidered methodology, application and relevance. Int Endod J26:37.

Dental CommunicationBiosci. Biotech. Res. Comm. 10(3): 580-586 (2017)
Correlation of the maxillary sinus volume with gender
and some of craniofacial indices using cone beam
computed tomography
Shahab Etemadi1, Golnaz Seylavi*2 and Afshin Yadegari3
1Assistant Professor, Department of Oral and Maxillofacial Radiology, Isfahan (Khorasgan) Branch, Islamic Azad University, Isfahan, Iran2Post Graduate Student, Department of Oral and Maxillofacial Radiology, Isfahan (Khorasgan) branch, Islamic Azad University, Isfahan, Iran3Assistant Professor, Department of Oral and Maxillofacial Surgery, Isfahan (Khorasgan) Branch, Islamic Azad University, Isfahan, Iran
ABSTRACT
Maxillary sinus volume is variable and thus, is a topic of interest for surgeons performing endoscopic surgeries. Also, it may be helpful for sexual identifi cation. This study sought to measure the maxillary sinus volume using cone beam computed tomography (CBCT) and assess its correlation with gender and some craniofacial indices. In this descriptive, analytical, cross-sectional study, CBCT scans of 70 patients (35 males and 35 females) older than 18 years of age were evaluated. To measure the maxillary sinus volume, axial CBCT sections with 2mm slice thickness and Digimizer software were used. Sinus volume was calculated using the formula: volume=sum of the thickness of each slice multiplied by the surface area of each slice. The mean width and height of the palate in the coronal plane, anterior-posterior length of the palate in the sagittal plane and distance between the two zygomatic buttresses were measured on the axial CBCT sections in both males and females. The Pearson’s correlation coeffi cient, independent t-test and paired t-test were used for statistical analyses. The mean maxillary sinus volume was 15.9±6.05 cm3 and 13±2.85 cm3 in males and females, respectively. The mean volume of the maxillary sinus was larger in males, and a signifi cant correlation was noted between the mean volume of the maxillary sinus and width and height of the palate as well as the distance between the two zygomatic buttresses (P<0.05). Despite the larger volume of the maxillary sinus in males, this parameter cannot be used for sexual identifi cation because the area under the receiver operating curve (ROC) was 62.7%.
KEY WORDS: CONE-BEAM COMPUTED TOMOGRAPHY; SEXUAL IDENTIFICATION; MAXILLARY SINUS
580
ARTICLE INFORMATION:
*Corresponding Author:Received 19th July, 2017Accepted after revision 28th Sep, 2017 BBRC Print ISSN: 0974-6455Online ISSN: 2321-4007 CODEN: USA BBRCBA
Thomson Reuters ISI ESC and Crossref Indexed Journal NAAS Journal Score 2017: 4.31 Cosmos IF: 4.006
© A Society of Science and Nature Publication, 2017. All rights reserved.Online Contents Available at: http//www.bbrc.in/DOI: 10.21786/bbrc/10.3/36

Etemadi, Seylavi and Yadegari
BIOSCIENCE BIOTECHNOLOGY RESEARCH COMMUNICATIONS CORRELATION OF THE MAXILLARY SINUS VOLUME WITH GENDER 581
INTRODUCTION
Maxillary sinus is an irregular cavity within the maxil-lary bone, which develops under the orbit. Development of the maxillary sinus starts in the third week of preg-nancy and continues to the pubertal period (Wang et al. 1994). Accurate measurement of the maxillary sinus volume may be helpful prior to sinus fl oor augmenta-tion for implant placement (Gray et al.2000). Maxillary sinus volume is variable and thus, is a topic of interest for surgeons particularly the oral and maxillofacial sur-geons (Fernandes, 2004). Recently, demand for sexual identifi cation in forensic medicine has increased due to an increase in rate of crime (Saccucci et al.2015). The correlation of volumetric analyses of the maxillary sinus and sexual identifi cation has been a controversial topic (Ariji et al. 1994; Jasim et al. 2013; Vidya et al. 2013; Ekizoglu et al.2014; Möhlhenrich et al. 2015).
Conventional radiographs are not accurate for deter-mination of the volume of the maxillary sinus due to the superimposition of images of other paranasal sinuses and craniofacial skeleton on the superior part of the maxil-lary sinuses (Wolf et al.1993). Considering the complex structure of the sinus, magnetic resonance imaging and computed tomography (CT; gold standard) are used for three-dimensional visualization of the sinus anatomy. However, their use is limited due to high patient radi-ation dose (CT), limited access and high cost (Schwab et al.1998; Lenza et al.2010). Thus, this study aimed to measure the volume of the maxillary sinus using cone beam computed tomography (CBCT) and assess its asso-ciation with gender and some craniofacial indices.
MATERIAL AND METHODS
This study was conducted on CBCT scans of the right and left maxillary sinuses of 70 patients including 35 females and 35 males over 18 years of age, who pre-sented to the Oral and Maxillofacial Radiology Depart-ment of Islamic Azad University, Isfahan branch. Images with optimal quality were chosen. All images had been taken with the same CBCT unit (Galileos-Sirona, Ben-sheim, Germany) with high resolution and 0.1 mm voxel size and exposure settings of 85 kV and 21-35 mAs (based on the patient’s weight) and were analyzed using SIDEXIS software. Patients with a history of surgery or facial asymmetry, completely or partially edentulous patients, those with infl ammatory diseases of the sinus such as sinusitis, periodontal patients, those with tumors such as angioma, squamous cell carcinoma and lym-phoma, history of facial bone fracture, cysts, infection and sinus polyps were excluded.
Distance between the zygomatic buttresses: Distance between the zygomatic buttresses was calculated on
axial sections of the upper midface according to a study by Ariji et al. [9] and Waitzman et al.(1992). To calculate this distance, on axial sections visualizing the inferior border of the zygomaticomaxillary suture, a horizontal line was drawn connecting the outermost points of the zygomatic buttresses in the two sides and its length was measured in millimeters (Figure 1a).
Width and height of the palate: To calculate the pala-tal width on coronal sections according to Byasalet al.(2011), a horizontal line was drawn from the palatal margin of the crestal bone of the fi rst molar tooth in one side to the palatal margin of the crestal bone of the other side and its length was measured. To measure the height of the palate in this region on coronal sections, as shown in Figure 1b, a line was drawn from the palate perpendicular to the line connecting the alveolar crest borders of the two sides and its length was measured.
Length of the hard palate: To measure the length of the hard palate on sagittal sections, the distance between the anterior nasal spine and posterior nasal spine at the midline (where the anterior nasal spine was visible) was measured (Figure 3C).
Maxillary sinus volume: To measure the maxillary sinus volume, axial CBCT sections with 2mm slice thick-ness and 2mm intervals were used. The CBCT sections were subjected to Digimizer version 4.1.1 software and the surface area of the sinus was automatically meas-ured and stored in Excel format. The surface area of all sections of the sinus (about 20 to 25 sections) in both sides was calculated for each patient. Then, to calculate the volume of the sinus in cubic centimeters, the follow-ing formula was used: Sum of the surface area of the sinus in each section thickness of each section (Figure 2). Data were collected and analyzed using SPSS ver-sion 24.Independentt-test and paired t-test were used to compare differences in the right and left sides and in the mean size of variables.
RESULTS AND DISCUSSION
Two groups (n=35) of males and females in the age range of 18 to 74 years were evaluated. The mean age was 37.2 years in females and 34.3 years in males. Independent t-test showed that the mean age of males and females was not signifi cantly different (P=0.30). The mean vol-ume of the maxillary sinus was 14.452.71 cm3. Inde-pendent t-test showed that the mean volume of the sinus in the right (P=0.02), left (P=0.006) and both (P=0.01) sides was signifi cantly greater in males than females. In other words, a signifi cant association existed between gender and maxillary sinus volume in the right and left sides (P<0.05, Table 1).
The area under the ROC curve was 0.627 or 62.7% (smaller than 0.70) (Graph 1).

Etemadi, Seylavi and Yadegari
582 CORRELATION OF THE MAXILLARY SINUS VOLUME WITH GENDER BIOSCIENCE BIOTECHNOLOGY RESEARCH COMMUNICATIONS
FIGURE 1. (a) Distance between the two zygomatic buttresses. (b) Measurement of the width and height of the palate at the maxillary fi rst molar site. (C) Measurement of the anterior-pos-terior length of the hard palate
Table 1. Comparison of the mean volume of the maxillary sinus between males and females in the right and left sides (in cm3)
SideFemales Males Independent t-test
MeanStandard deviation
MeanStandard deviation
t P value
Righ t 13/1 2/9 15/8 6/3 2/31 0/02
Left 12/9 2/8 16/01 5/8 2/86 0/006
Total 13 2/85 15/9 6/05 2/58 0/01
Table 2. Comparison of the mean volume of the maxillary sinus in the right and left sides based on gender (in cm3)
GenderRight Left Independent t-test
MeanStandard deviation
Mean Standard deviation
t P value
Females 13/1 2/9 12/9 2/8 0/51 0/61
Males 15/8 6/3 16/01 5/8 0/41 0/68
Total 14/4 55/1 14/5 4/8 0/09 0/92
Paired t-test showed that the mean volume of the maxillary sinus in the right and left sides in females (P=0.61), males (P=0.68) and in total (P=0.92) was not signifi cantly different (Table 2).
Independent t-test showed that the mean anterior-pos-terior length of the palate in sagittal plane was not sig-nifi cantly different between males and females (P=0.23) but the mean distance between the two zygomatic but-tresses in the axial plane (P<0.001), palatal width in the
fi rst molar region in the coronal plane (P=0.007) and height of the palate in the fi rst molar region in the coro-nal plane (P=0.002) were signifi cantly greater in males than in females. Thus, no signifi cant association existed between gender and anterior-posterior length of the pal-ate in sagittal plane; but gender had a signifi cant associa-tion with the other three variables (Table 3).
The Pearson’s correlation coeffi cient showed that no signifi cant association existed between age and vol-

Etemadi, Seylavi and Yadegari
BIOSCIENCE BIOTECHNOLOGY RESEARCH COMMUNICATIONS CORRELATION OF THE MAXILLARY SINUS VOLUME WITH GENDER 583
Table 3. Comparison of the mean craniofacial parameters in males and females (in mm)
ParameterFemales Males Independent t-test
MeanStandard deviation
MeanStandard deviation
t P value
Distance between zygomatic buttresses in axial plane
85/2 4/2 88/9 4/1 3/70 <0/001
Anterior posterior length of the palate in sagittal plane
51/2 3/2 52/6 6/1 1/20 0/23
Width of the palate in fi rst molar site in coronal plane
33/2 2/6 34/9 2/8 2/79 0/007
Height of the palate in the fi rst molar site in coronal plane
11/8 1/7 13/8 3/3 3/25 0/002
Table 4. Pearson’s correlation coeffi cient for the correlation between the mean size of the maxillary sinus and age and craniofacial parameters
VariableMaxillary sinus volume
r P value
Age -0/182 0/18
Distance between zygomatic buttresses in axial plane 0/424 <0/001
Anterior posterior length of the palate in sagittal plane 0/119 0/33
Width of the palate in fi rst molar site in coronal plane 0/241 0/044
Height of the palate in the fi rst molar site in coronal plane
0/547 <0/001
FIGURE 2. Method of measurement of maxillary sinus surface area using Digimizer software
ume of the maxillary sinus (P=0.18). The anterior-pos-terior length of the palate in the sagittal plane had no signifi cant association with the maxillary sinus volume (P=0.33). But an association existed between the palatal width in the fi rst molar site in the coronal plane and the volume of the maxillary sinus (P=0.044). The Pearson’s correlation coeffi cient showed that a signifi cant associa-tion existed between the distance between the two zygo-
matic buttresses in the axial plane and also the height of the palate in the fi rst molar region in the coronal plane with the volume of the maxillary sinus (P<0.001, Table 4).
Maxillary sinus is the closest paranasal sinus to the oral cavity and since implant treatments along with open or closed sinus lift surgery (due to pneumatization of the maxillary sinus) have greatly increased, knowl-edge about the anatomy of the maxillary sinus is impor-

Etemadi, Seylavi and Yadegari
584 CORRELATION OF THE MAXILLARY SINUS VOLUME WITH GENDER BIOSCIENCE BIOTECHNOLOGY RESEARCH COMMUNICATIONS
tant (Gray et al. 2000). Sexual identifi cation is an impor-tant parameter in forensic medicine. Use of maxillary sinus dimensions measured on CT scans may help in this regard in cases where other methods fall short; however, this method has its own drawbacks as well (Lerno, 1983). Since a decade ago, CBCT is recommended as a modality for maxillofacial imaging (Farman et al. 2006; Moreira et al. 2009). This modality enables image reconstruction without superimposition and has lower patient radiation dose compared to CT (Moreira et al. 2009). It is believed that the quality of CBCT images is equal to that of con-ventional CT in visualization of maxillofacial structures (Silva et al. 2008; Loubele et al. 2009; Carrafi ello et al. 2010).
In our study, the mean volume of the right maxillary sinus was 14.45.1 cm3 and the mean volume of the left maxillary sinus was 14.54.8 cm3. Also, maxillary sinus volume in males was signifi cantly greater than that in females (P<0.05). In 2013, Jasim et al. measured the vol-ume and dimensions of the maxillary sinus and evalu-ated its association with age and gender using CT. They reported that the volume and dimensions of the maxil-lary sinus in males were greater than that in females and volume of the sinus decreased by an increase in age (Jasim et al. 2013). To calculate the volume of the maxil-lary sinus, they used a method similar to ours; however, in our study in contrast to theirs, no signifi cant associa-tion was found between age and volume of the maxil-lary sinus (P=0.30). This difference may be due to the age group of patients since Jasim et al. (2013) evaluated patients in older age group (40-69 years).
In 2016, Prabhat et al. evaluated the size and volume of the maxillary sinus and its association with sexual identifi cation using CT. They reported that volume of the maxillary sinus in males was signifi cantly greater than that in females. They stated that use of maxillary sinus volume increases the accuracy of sexual identi-fi cation by 83.3% (Prabhat et al. 2016). In our study, volume of the maxillary sinus in males was greater than that in females. However, since the area under the ROC curve was 62.7% (<70%), maxillary sinus volume cannot be used as a reliable indicator for sexual identifi cation. These differences in measurements may be due to ana-tomical differences of the sinus in different geographical areas and among different races. Another reason may be the difference in method of calculation of sinus volume and sample size, since our sample size was twice as big as that of Prabhat et al.(2016).
Senturk et al. in 2015 evaluated the effect of weather and altitude on volume of the paranasal sinuses and found no signifi cant association between the volume of the maxillary sinus and age or between the size of the sinus in the two sides (Sahlstrand-Johnson, 2011). In our study, no signifi cant difference was noted between the volume of the maxillary sinus and age or between the volume of the maxillary sinuses in the two sides (P>0.05). Ariji et al. in 1993 evaluated the correlation of the maxillary sinus volume and aging and found that the mean volume of the right and left maxillary sinuses was 14.646.32 cm3. They found no signifi cant differ-ence in the volume of the maxillary sinus between males and females. Sinus volume had an ascending trend to
GRAPH 1. ROC curve for sexual identifi cation using maxillary sinus volume in the right and left sides

Etemadi, Seylavi and Yadegari
BIOSCIENCE BIOTECHNOLOGY RESEARCH COMMUNICATIONS CORRELATION OF THE MAXILLARY SINUS VOLUME WITH GENDER 585
20 years of age and then decreased. They also reported that a signifi cant association exists between the volume of the maxillary sinuses and the distance between the two zygomatic buttresses and the zygomatic occipital distance (Ariji et al. 1994). The maxillary sinus volume reported by Arihi et al. (1994) was comparable to the value obtained in our study (14.452.71 cm3).
However, in our study, the volume of the maxil-lary sinus in males was signifi cantly higher than that in females and no signifi cant association was noted between the sinus volume and age. In our study, aside from the relationship of the maxillary sinus volume with age and sex, its correlation with some other craniofacial parameters such as width and height of the palate in the fi rst molar area in the coronal plane, anterior-posterior length of the palate in the sagittal plane and the distance between the two zygomatic buttresses in the axial plane was also eval uated and it was found that a correlation existed between the volume of the maxillary sinus and the distance between the two zygomatic buttresses; this fi nding was comparable to that of Ariji et al. Moreover, it was found that the greater the width and height of the palate, the greater the size of the maxillary sinus would be (P<0.05). But no signifi cant correlation was found between the sinus volume and the anterior-posterior length of the hard palate (P>0.05).
CONCLUSION
The current results showed that Despite the presence of a signifi cant association between gender and volume of the maxillary sinus (P<0.05), since the area under the ROC curve was 0.627 or 62.7% (smaller than 0.70), vol-ume of the maxillary sinus cannot serve as a defi nite and reliable indicator for sexual. Also, a correlation was noted between the maxillary sinus volume and width and height of the palate at the fi rst molar site and the distance between the two zygomatic buttresses.
REFERENCES
A riji Y, Kuroki T, Moriguchi S, Ariji E, Kanda S. (1994). Age changes in the volume of the human maxillary sinus: a study using computed tomography. Dentomaxillofacial radiology 23(3): 163-8.
Ba ysal A, Veli I, Ucar FI, Eruz M, Ozer T, Uysal T. (2011). Changes in mandibular transversal arch dimensions after rapid maxillary expansion procedure assessed through cone-beam computed tomography. Korean Journal of Orthodontics 41(3): 200-10.
Ca rrafi ello G, Dizonno M, Colli V, Strocchi S, Taubert SP, Leon-ardi A, et al. (2010). Comparative study of jaws with multislice computed tomography and cone-beam computed tomography. La radiologia medica 115(4): 600-11.
Ek izoglu O, Inci E, Hocaoglu E, Sayin I, Kayhan FT, Can IO. (2014). The use of maxillary sinus dimensions in gender deter-mination: a thin-slice multidetector computed tomography assisted morphometric study. Journal of Craniofacial Surgery 25(3): 957-60.
Fa rman AG, Scarfe WC. (2006). Development of imaging selec-tion criteria and procedures should precede cephalometric assessment with cone-beam computed tomography. American Journal of Orthodontics and Dentofacial Orthopedics 130(2): 257-65.
Fe rnandes C. (2004). Volumetric analysis of maxillary sinuses of Zulu and European crania by helical, multislice computed tomography. The Journal of Laryngology & Otology 118(11): 877-81.
Gr ay C, Staff R, Redpath T, Needham G, Renny N. (2000). Assessment of maxillary sinus volume for the sinus lift opera-tion by three-dimensional magnetic resonance imaging. Den-tomaxillofacial Radiology 29(3): 154-8.
Ja sim HH, Al-Taei JA. (2013). Computed tomographic meas-urement of maxillary sinus volume and dimension in correla-tion to the age and gender (comparative study among individ-uals with dentate and edentulous maxilla). Journal of Baghdad College of Dentistry 25(1): 87-93.
Le nza M, Lenza MdO, Dalstra M, Melsen B, Cattaneo P. (2010). An analysis of different approaches to the assessment of upper airway morphology: a CBCT study. Orthodontics & craniofacial research 13(2): 96-105.
Le rno P. (1983). Identifi cation par le sinus maxillaire. Odontol leg. 216:39-40.
Lo ubele M, Bogaerts R, Van Dijck E, Pauwels R, Vanheusden S, Suetens P, et al. (2009). Comparison between effective radia-tion dose of CBCT and MSCT scanners for dentomaxillofacial applications. European journal of radiology 71(3): 461-8.
Möhlhenrich SC, Heussen N, Peters F, Steiner T, Hölzle F, Mod-abber A. (2015). Is the Maxillary Sinus Really Suitable in Sex Determination? A Three-Dimensional Analysis of Maxillary Sinus Volume and Surface Depending on Sex and Dentition. Journal of Craniofacial Surgery 26(8) :723-6.
Moreira CR, Sales MA, Lopes PM, Cavalcanti MG. (2009). Assessment of linear and angular measurements on three-dimensional cone-beam computed tomographic images. Oral Surgery, Oral Medicine, Oral Pathology, Oral Radiology, and Endodontology 108(3): 430-6.
Prabhat M, Rai S, Kaur M, Pra bhat K, Bhatnagar P, Panjwani S. (2016). Computed tomography based forensic gender deter-mination by measuring the size and volume of the maxillary sinuses. Journal of forensic dental sciences 8(1): 40.
Saccucci M, Cipriani F, Carderi S, Di Carlo G, D’Atti lio M, Rodolfi no D, et al. (2015). Gender assessment through three-dimensional analysis of maxillary sinuses by means of Cone Beam Computed Tomography. European review for medical and pharmacological sciences19(2): 185-93.
Schwab RJ . (1998). Upper airway imaging. Clinics in chest medicine. 19(1):33-54.

Etemadi, Seylavi and Yadegari
586 CORRELATION OF THE MAXILLARY SINUS VOLUME WITH GENDER BIOSCIENCE BIOTECHNOLOGY RESEARCH COMMUNICATIONS
Sentürk M, Azgin I, Öcal R, Sakarya EU, Güler I. (2015). Volu-metric analysis of the maxillary sinus in pediatric patients with nasal septal deviation. ENT Updates 5(3): 107.
Silva MAG, Wolf U, Heinicke F , Bumann A, Visser H, Hirsch E. (2008). Cone-beam computed tomography for routine orthodontic treatment planning: a radiation dose evaluation. American Jour-nal of Orthodontics and Dentofacial Orthopedics 133(5): 640-5.
Vidya C, Shamasundar N, Manjunatha B, Raichurkar K. (2013). Evaluation of size and volume of maxillary sinus to determine gender by 3D computerized tomography scan method using dry skulls of South Indian origin. International Journal of Cur-rent Research and Review 5(3): 97.
Waitzman AA, Posnick JC, Armstrong DC, Pron GE. (1992). Craniofacial skeletal measurements based on computed tomography: Part II. Normal values and growth trends. The Cleft palate-cran iofacial journal 29(2): 118-28.
Wang R-G, Jiang S, Gu R. (1994). The cartilaginous nasal cap-sule and embryonic development of human paranasal sinuses. The Journal of otolaryngology 23(4): 239-43.
Wolf G, Anderhuber W, Kuhn F. (1993). Development of the paranasal sinuses in children: implications for paranasal sinus surgery. Annals of Otology, Rhinology & Laryngology 102(9): 705-11.

Medical CommunicationBiosci. Biotech. Res. Comm. 10(3): 587-591 (2017)
Comparison of interleukin 17 and 22 in saliva of oral
lichen planus patients with healthy people
Shiva Shirazian1, Farzaneh Aghahosseini2, Eisa Salehi3, Mehdi Vatanpour4, Seyede Niloofar Banijamali5 and Sara Pourshahidi6* 1Assistant Professor, Department of Oral Medicine, School of Dentistry, Tehran University of Medical Sciences, Tehran, Iran2Full Professor, Department of Oral Medicine, School of Dentistry, Tehran University of Medical Sciences, Tehran, Iran 3Assistant Professor, Department of Immunology and Biology, School of Medicine, Tehran University of Medical Sciences, Tehran, Iran4Assistant Professor, Department of Endodontics, Dental Branch, Islamic Azad University, Tehran, Iran 5Resident of Pediatric Dentistry, Dental Branch, Islamic Azad University, Tehran, Iran6Associated Professor, Department of Oral Medicine, School of Dentistry, Tehran University of Medical Sciences, Tehran, Iran
ABSTRACT
Lichen Planus (LP) is an infl ammatory chronic mucocutaneous disease. Since the etiology of OLP is unknown, efforts to under-stand the etiology and pathogenecity may lead to improve treatment modalities. Studies have shown the different levels of increase or decrease of various cytokines in saliva, serum or tissue culture of patients with OLP.As saliva originates from blood and its collection is an easy, non-invasive method, so it can be a diagnostic fl uid that has logistical advantages when compared with serum. The purpose of this study was to compare the salivary level of IL17 and IL22 in patients with and without OLP. Saliva of 52 patients with and without OLP was collected. The saliva level of IL17 and IL 22 was measured by using ELISA. Data were analyzed using independent T test, Mann-Whitney and Pearson Correlation test.The saliva concentration of IL 22 was signifi -cantly higher in control group than OLP but the difference was not signifi cant between reticular and atrophic-erosive type (P > 0.05).The difference between mean rank of IL17 for OLP and healthy cases and between reticular and erosive-atrophic form was not signifi cant (P > 0.05). There was no correlation between the level of IL17 and IL 22 (P > 0.05). Our fi ndings suggest that IL 22 may have an effect in the pathogenesis of OLP and its protective effect may be decreased in OLP patients.
KEY WORDS: INTERLEUKIN 17, INTERLEUKIN 22, ORAL LICHEN PLANUS, SALIVA
587
ARTICLE INFORMATION:
*Corresponding Author: [email protected] 21st July, 2017Accepted after revision 29th Sep, 2017 BBRC Print ISSN: 0974-6455Online ISSN: 2321-4007 CODEN: USA BBRCBA
Thomson Reuters ISI ESC and Crossref Indexed Journal NAAS Journal Score 2017: 4.31 Cosmos IF: 4.006
© A Society of Science and Nature Publication, 2017. All rights reserved.Online Contents Available at: http//www.bbrc.in/DOI: 10.21786/bbrc/10.3/37

588 COMPARISON OF INTERLEUKIN 17 AND 22 IN SALIVA OF ORAL LICHEN PLANUS PATIENTS BIOSCIENCE BIOTECHNOLOGY RESEARCH COMMUNICATIONS
Shiva Shirazian et al.
INTRODUCTION
Lichen Planus (LP) is an infl ammatory chronic mucocu-taneous disease that affects 1-2% of the general popula-tion, and is the non-infected mucosal disease causing the most referral to dental clinics (Pakfetrat et al. 2009). The oral cavity is the most common site of the disease. Oral Lichen Planus (OLP) usually affects middle aged women (30-60 years), children are rarely affected.World Health Organization (WHO) has considered OLP as a pre-cancer-ous disorder. Although OLP is considered an immunologi-cally mediated disease, its etiology is not known, yet. The involvement of both specifi c and non-specifi c antigens are considered to have roles in pathogenesis of OLP (van der Meij et al. 2003 Aghahosseini et al. 2006; Pourshahidi et al. 2011; Agha-Hosseini et al. 2015).
Alteration of the immune condition is not well known in OLP to date, but it is clear that cytokines exhibit immunoregulatory actions through a complex cytokine network consisting of paracrine and autocrine systems. Unbalanced cytokine actions are considered to play a role in the pathogenesis of autoimmune diseases. Numerous cytokines are secreted from oral mucosa or blood as locally or systemically that they have an important role in initiation and progression (courses) of OLP (Zhang et al. 2008).
Increased production of cytokine by keratinocytes that may be the result of stimulation by external stimu-lants is the initial event. Then infi ltration of monocytes followed by lymphocytes could be the next step. Studies have shown the different levels of increase or decrease of various cytokines in saliva or serum or tissue culture of patients with OLP (Yamamoto et al. 1990; Rhodus et al. 2005; Zhang et al. 2008).
Interleukin (IL) 17 A, also named IL17, is the most important IL from the IL17 family which is composed of 6 members (IL17A-IL17F). IL 22 is a member of IL10 family and it has a role in immune reaction against bacterial pathogens, especially in epithelium. IL17 and 22 are produced by T helper 17 and contribute in both innate and acquired immune responses against extra cellular pathogens (Lambiase et al. 2009). The role of Th17 and its cytokines (IL17 and 22) have been estab-lished in infl amed tissues in various autoimmune dis-eases such as psoriasis, multiple sclerosis, lupus ery-thematosus, rheumatoid arthritis, infl ammatory bowel disease (IBD) and pemphigus (Miossec et al. 2009).Saliva originates from blood. Saliva collection is an easy, non-invasive method, and it has been shown that various tumor markers are present in saliva. Therefore it can be a diagnostic fl uid that has logistical advantages when compared with serum (Agha-Hosseini et al. 2015). The purpose of this study was to compare the level of IL17 and IL22 in saliva in patients with and without OLP.
MATERIAL AND METHODS
Fifty two samples of referred patients to the Department of Oral Medicine, Faculty of Dentistry, Tehran Univer-sity of Medical Sciences included in this cross-sectional study (26 in each group).this study was approved by ethical committee and also all subjects provided writ-ten informed consent to participate in the study. OLP was diagnosed clinically and confi rmed histopathologi-cally according to the modifi ed WHO criteria in 2003 as below:Clinical criteria: presence of symmetric or bilat-eral reticular or papular lesions with or without erosive–atrophic components. Histological criteria: presence of well-defi ned band-like zones of infl ammatory infi ltra-tion confi ned to the superfi cial part of connective tis-sue, consisting mainly of mature lymphocytes; signs of “liquefaction degeneration” in basal cell layer, absence of epithelial dysplasia. Exclusion criteria: application of any local treatment for OLP lesions during the previous month; taking any drugs during the previous 3 months; history of allergy to foods or environmental factors, smoking; the existence of any oral lesions except OLP, systemic diseases (cardiovascular disease, kidney, hyper-tension), pregnancy. We also excluded patients whose lesion was nearby amalgam restorations. The unstimu-lated whole saliva (UWS) was collected between 10:00 a.m. and 12:00 p.m., and at least 90 minutes after the last intake of drink or food. All subjects were requested to swallow fi rst, tilt the head forward and then expecto-rate at least 5cc UWS into a sterile centrifugal tube with-out swallowing. The samples were centrifuged (2000g for 10 min), and the supernatants stored at -20 oC until analysis. The saliva level of IL was measured by using Enzyme-Linked Immunosorbent Assay (ELISA) kits, Human platiniumIL17A (BMS2017) and Human pluto-nium IL22 (88-7522-22) (bioscience, USA).
STATISTICAL ANALYSIS
Independent T test was used to compare the mean of IL22 between two groups; and Mann-Whitney for IL17. Pearson Correlation test was used for assessing the cor-relation between IL 17 and IL22 in each group. A P value less than 0.05 was considered statistically signifi cant and primary power of analysis was set at 80%.
RESULTS AND DISCUSSION
26 patients with OLP (22 females and 4 males) and 26 sex and aged matched healthy individuals were enrolled in this study. The mean age was 50.81±12.61 years, and 49.42±5.33 years in OLP and control groups respec-tively. 23% (6 patients) of OLP was reticular form, and 77% (20 patients) was atrophic-erosive form. The mean

BIOSCIENCE BIOTECHNOLOGY RESEARCH COMMUNICATIONS COMPARISON OF INTERLEUKIN 17 AND 22 IN SALIVA OF ORAL LICHEN PLANUS PATIENTS 589
Shiva Shirazian et al.
of IL22 was 184.48±4.58 pg/ml in OLP and 209.01±4.58 pg/ml in control group, there was signifi cant differ-ence between two groups (p=0.003). The mean of IL 22 was 176.5±9.40 pg/ml in reticular and 186.88±5.26 in atrophic-erosive type but the difference was not signifi -cant (p=0.35).
The mean of IL 17 was 5.24±2.709 pg/ml in OLP and 0.526±0.164 pg/ml in control. The mean rank of IL17 was 37.33 and 33.59 for OLP and healthy cases respec-tively. The difference was not signifi cant (p=0.436). The difference between the mean of IL17 in reticular and erosive-atrophic form was not signifi cant (p=0.25).
There was no correlation between the level of IL17 and IL22 (p=0.35, r=-0.19)in healthy patients. Although correlation analysis revealed no signifi cant correlation between IL17 and IL 22 in OLP group but it seems to be a reverse correlation between them according to the statistical fi ndings (p=0.054, r=- 0.049).
As the etiology of OLP is unknown and because it is one of the most common lesion referred to dental clin-ics, studies on the pathogenesis of the OLP are of high importance. In this study we evaluated the relevance of IL17 and IL22 with OLP. The saliva concentration of Interleukin 22 was signifi cantly higher in control group than OLP but the difference was not signifi cant between reticular and atrophic- erosive type (P>0.05). We couldn’t fi nd any studies on OLP patients’ salivary levels of IL22. But Chen et al and Shen et al studied on IL22 in the tissue samples from OLP patients and found it more than their control group (Chen et al. 2011; Shen et al. 2012). More expression of IL22 in the tissue may be due to the location of its receptors which is on the epithelial origin cells (Ouyang et al. 2008). On the other hand there are some researches on the role of IL22 and psoriasis (Zheng et al. 2007; Lowes et al. 2008). Zaba et al. (2007) in an animal study reported the higher expres-sion of IL17 and IL22 in skin lesions of mice with pso-riasis; but Zheng and Ma reported that defi ciency and limitation of IL22 can exaggerate skin lesion of psoriasis in mice (Zaba et al. 2007; Zheng et al. 2007; Ma et al. 2008). This controversy reveals that more studies should be done on the subject. The salivary level of IL17 in OLP patients of our study was higher than the control group but the difference was not statistically signifi cant (p=0.436). On the basis of our knowledge there is no study on salivary level of IL17 in OLP.
Zhang et al. (2007) compared the level of IL1, IL8 and TNF in serum and saliva in 30 OLP patients and 30 healthy controls. These IL were higher signifi cantly in saliva and serum in patients than control, and the level of IL8 was higher in saliva in erosive OLP than other types (Zhang et al. 2008). Xie et al. (2012) assessed Th1 and Th17 in tissue (by double immunofl uorescence staining) and in serum (by fl ow cytometry) of 40 patients
with OLP (22 cases with reticular type and 18 cases with erosive- atrophic type). Their results showed that the Th17 and Th1 cells were similar in tissue, but both were increased in serum. Th17 was higher in erosive- atrophic OLP than reticular. The level of IL 17 was signifi cantly higher in serum of OLP patients than controls and in erosive-atrophic OLP than reticular.
The role of IL17 has been assessed in other auto-immune diseases in previous studies (Moseley et al. 2003; Nistala et al. 2009; Caproni et al. 2009). Caporni and et al. (2009) evaluated the level of IL17 in serum of psoriasis patients before and after treatment, and compared with healthy controls. The level of IL17 was higher in patients than control and was reduced to a low level after treatment [21]. Ziolkowska et al measured the level of IL17 in serum and synovial fl uid of joints in 15 patients with rheumatoid arthritis, and compared with healthy controls. Their results showed higher level of IL17 in patients than control (Ziolkowska et al. 2000). Zhao et al studied the role of Th17 in asthma sensitiv-ity. Percentages of Th17 cells and the level of several cytokines including IL4, IL22, IL25, IL17 and INF were measured. Th17 cells and related cytokines had the most increasing; additionally, the amount of IL17 and IL22 and Th17 had a positive correlation with the severity of disease (Zhao et al. 2010).
A hypersensitivity reaction is considered in patho-genesis of OLP when cytokines are released by activated T cell, resulting in accumulation of infl ammatory cells, and the destruction of keratinocytes due to the cytotox-icity of cells (Sezer et al. 2007).
The immune mechanism with specifi c and non specifi c antigen are proposed in the pathogenesis of OLP (Suger-man et al. 2005). IL17 may up regulate various cytokines like IL1, IL8 and TNF (Hwang et al. 2004). In the study of Zhang et al (2008) the serum and salivary level of these cytokines was elevated in OLP patients such as other stud-ies (Sun et al. 2005; Rhodus et al. 2006; Janardhanam et al. 2007; Rhodus et al. 2007). Therefore, it may be pos-tulated that IL17 probably has a role in pathogenesis of OLP by increasing these infl ammatory cytokines. In non specifi c antigen, another mechanism may be degranula-tion of mast cells and activation of MMP (Sugerman et al. 2005). Jovanovic et al (2001) reported that IL17 acts as an up regulator of local infl ammatory factors, causing injury of extracellular matrix through MMP (in vitro). Therefore it may be an infl uence in pathogenesis of OLP. In present study the level of IL17 was ten times higher than the level of healthy control (5.24 pg/ml in patients and 0.516 pg/ml in healthy subjects), although the difference was not signifi cant statistically.
It is clear that IL22 has protection effects while IL 17 has not (Zenewicz et al. 2007; Sonnenberg et al. 2010). Consequently, with the lower level of IL22 and higher

590 COMPARISON OF INTERLEUKIN 17 AND 22 IN SALIVA OF ORAL LICHEN PLANUS PATIENTS BIOSCIENCE BIOTECHNOLOGY RESEARCH COMMUNICATIONS
Shiva Shirazian et al.
level of other infl ammatory cytokines, epithelial cells are disposed to destroy, and OLP lesions can appear. This hypothesis of the reverse correlation between IL17 and IL22 in patients with OLP is strengthened, but it needs more research.
CONCLUSION
Our fi ndings suggest that IL 22 may have an effect in the pathogenesis of OLP and its protective effect may be decreased in OLP patients.
ACKNOWLEDGEMENT
This research has been supported by Tehran University of Medical Sciences & health Services, Faculty of Den-tistry grant91-01-69-16665.
REFERENCES
Agha-Hosseini F, Mirzaii-Dizgah I, Mahboobi N, Shirazian S, Harirchi I. (2015) Serum and Saliva MMP-3 in Patients with OLP and Oral SCC. J Contemp Dent Pract. 1; 16(2):107-11.
Aghahosseini F, rbabi-Kalati F, Fashtami LA, Fateh M, Djavid GE. (2006) Treatment of oral lichen planus with photodynamic therapy mediated methylene blue: a case report. Med Oral Patol Oral Cir Bucal. (2):E126-E129.
Caproni M, Antiga E, Melani L, Volpi W, Del BE, Fabbri P. (2009) Serum levels of IL-17 and IL-22 are reduced by etaner-cept, but not by acitretin, in patients with psoriasis: a rand-omized-controlled trial. J Clin Immunol. 29(2):210-214.
Chen J, Feng J, Chen X,et al. (2013) Immunoexpression of Inter-leukin-22 and Interleukin-23 in Oral and Cutaneous Lichen Planus Lesions: A Preliminary Study. Mediators Infl amm 801974. doi: 10.1155/2013/801974. Hwang SY, Kim JY, Kim KW, Park MK, Moon Y, Kim WU,Kim YH. (2004) IL-17 induces production of IL-6 and IL-8 in rheumatoid arthritis synovial fi broblasts via NF-kappaB-and PI3-kinase/Akt-dependent pathways. Arthritis Res Ther . 6(2):120-128.
Janardhanam SB, Prakasam S, Swaminathan VT, Kodumudi KN, Zunt SL, Srinivasan M. (2012) Differential expression of TLR-2 and TLR-4 in the epithelial cells in oral lichen planus. Arch Oral Biol. 57(5):495-502.
Jovanovic DV, Di Battista JA, Martel-Pelletier J, Reboul P, He YULA, Jolicoeur FC, Pelletier JP. (2001) Modulation of TIMP-1 synthesis by antiinfl ammatory cytokines and prostaglandin E2 in interleukin 17 stimulated human monocytes/macrophages.J Rheumatol. 28(4):712-718.
Lambiase A, Micera A, Mantelli F, et al. (2009) T-helper 17 lymphocytes in ocular cicatricial pemphigoid. Mol Vis. 15:1449-1455.
Lowes MA, Kikuchi T, Fuentes-Duculan J, et al. (2008) Pso-riasis vulgaris lesions contain discrete populations of Th1 and Th17 T cells. J Inv Dermatol. 128(5):1207-1211.
Ma HL, Liang S, Li J, et al. (2008) IL-22 is required for Th17 cell-mediated pathology in a mouse model of psoriasis-like skin infl ammation. J Clin Invest. 118(2):597-607.
Miossec P, Korn T, Kuchroo VK. (2009) Interleukin-17 and type 17 helper T cells. N Engl J Med . 361(9):888-898.
Moseley TA, Haudenschild DR, Rose L, Reddi AH. (2003) Inter-leukin-17 family and IL-17 receptors. Cytokine Growth Factor Rev. 14(2):155-174.
Nistala K, Wedderburn LR. (2009) Th17 and regulatory T cells: rebalancing pro-and anti-infl ammatory forces in autoimmune arthritis. Rheumatology 48(6):602-606.
Ouyang W, Kolls JK, Zheng Y. (2008) The biological functions of T helper 17 cell effector cytokines in infl ammation. Immu-nity . 28(4):454-467.
Pakfetrat A, Javadzadeh-Bolouri A, Basir-Shabestari S, Falaki F. (2009) Oral Lichen Planus: a retrospective study of 420 Ira-nian patients. Med Oral Patol Oral Cir Bucal . 14(7):E315-E318.
Pourshahidi S, Ebrahimi H, Andisheh Tadbir A. (2011) Eval-uation of the Relationship between Oral Lichen Planus and Stress. Shiraz Univ Dent J 12(1): 43-47.
Rhodus NL, Cheng B, Bowles W, Myers S, Miller L, Ondrey F. (2006) Proinfl ammatory cytokine levels in saliva before and after treatment of (erosive) oral lichen planus with dexametha-sone. Oral Dis. 12(2):112-116.
Rhodus NL, Cheng B, Myers S, Bowles W, Ho V, Ondrey F. (2005) A comparison of the pro-infl ammatory, NF-kappaB-dependent cytokines: TNF-alpha, IL-1-alpha, IL-6, and IL-8 in different oral fl uids from oral lichen planus patients. Clin Immunol. 114(3):278-283.
Rhodus NL, Cheng B, Ondrey F. (2007) Th1/Th2 cytokine ratio in tissue transudates from patients with oral lichen planus. Mediators Infl amm. 19854.
Sezer E, Ozugurlu F, Ozyurt H, Sahin S, Etikan I. (2007) Lipid peroxidation and antioxidant status in lichen planus. Clin Exp Dermatol . 32(4):430-434.
Shen Zh, Du G, Zhou Z, Liu W, Shi L, Xu H. (2016) Aber-rant expression of interleukin-22 and its targeting microRNAs in oral lichen planus: a preliminary study.J Oral Pathol Med 45(7):523-527.
Sonnenberg GF, Nair MG, Kirn TJ, Zaph C, Fouser LA, Artis D. (2010) Pathological versus protective functions of IL-22 in airway infl ammation are regulated by IL-17A. J Exp Med. 207(6):1293-1305.
Sugerman PB, Savage NW, Walsh LJ, Zhao ZZ, Zhou XJ, Khan A, Seymour GJ, Bigby M. (2002) The pathogenesis of oral lichen planus. Crit Rev Oral Biol Med. 213(4):350-365.
Sun A , Wang JT, Chia JS, Chiang CP. (2005) Serum interleu-kin-8 level is a more sensitive marker than serum interleukin-6 level in monitoring the disease activity of oral lichen planus. Br J Dermatol. 152(6):1187-1192.
van der Meij EH, van der Waal. (2003) Lack of clinicopatho-logic correlation in the diagnosis of oral lichen planus based on the presently available diagnostic criteria and suggestions for modifi cations. J Oral Pathol Med. 32(9):507-512.
Shiva Shirazian et al.
BIOSCIENCE BIOTECHNOLOGY RESEARCH COMMUNICATIONS COMPARISON OF INTERLEUKIN 17 AND 22 IN SALIVA OF ORAL LICHEN PLANUS PATIENTS 591
Xie S, Ding L, Xiong Z, Zhu S. (2012) Implications of Th1 and Th17 cells in pathogenesis of oral lichen planus. J Huazhong Univ Sci Technolog Med Sci. 32(3):451-457.
Yamamoto T, Yoneda K, Ueta E, Osaki T. (1990) Cellular immunosuppression in oral lichen planus. J Oral Pathol Med. 19(10):464-470.
Zaba LC, Cardinale I, Gilleaudeau P, et al. (2007) Amelioration of epidermal hyperplasia by TNF inhibition is associated with reduced Th17 responses. J Exp Med. 204(13):3183-3194.
Zenewicz LA, Yancopoulos GD, Valenzuela DM, Murphy AJ, Karow M, Flavell RA. (2007) Interleukin-22 but not interleu-kin-17 provides protection to hepatocytes during acute liver infl ammation. Immunity. 27(4):647-659.
Zhang Y, Lin M, Zhang S, et al. (2008) NF-kappaB-dependent cytokines in saliva and serum from patients with oral lichen
planus: a study in an ethnic Chinese population. Cytokine. 41(2):144-149.
Zhao Y, Yang J, Gao Yd, Guo W. (2010) Th17 immunity in patients with allergic asthma. Int Arch Allergy Immunol. 151(4):297-307.
Zheng Y, Danilenko DM, Valdez P, Kasman I, Eastham-Ander-son J, Wu J, Ouyang W. (2007) Interleukin-22, a TH17 cytokine, mediates IL-23-induced dermal infl ammation and acanthosis. Nature. 445(7128):648-651.
Ziolkowska M, Koc A, Luszczykiewicz G, Ksiezopolska-Pietrzak K, Klimczak E, Chwalinska-Sadowska H, Maslin-ski W. (2000) High levels of IL-17 in rheumatoid arthritis patients: IL-15 triggers in vitro IL-17 production via cyclo-sporin A-sensitive mechanism. J Immunol . 164(5):2832-2838.

MedicalCommunicationBiosci. Biotech. Res. Comm. 10(3): 592-596 (2017)
On the prevalence of iron defi ciency in children and
adolescents with growth retardation
Arash Rahbar* and Arian HajianSchool of Medicine, Student Research Committee, Babol University of Medical Sciences, Babol, Iran
ABSTRACT
Iron is a fundamental micro-element in body. Iron defi ciency is the most prevalent nutritional defi ciency around world. Iron defi ciency can disarrange physical growth and neurocognitive development of children thorough different ways such as decreasing oxygen transport capacity, decreasing energy production and decreasing the appetite. The aim of this study was to evaluate iron defi ciency prevalence in children between 6-18months old in Babol, Iran. This cross sectional study was performed on 100 children and adolescents with growth retardation in Babol. Weight and height of children was measured and comparing with the growth curve indices, Hb and mid MCV of children in percentile Height and weight lesser than 3 was evaluated. In this study, prevalence of anemia in growth retarded children was 35.9% whereas prevalence of microcytic anemia was 20% followed by iron defi ciency prevalence of 1.6% and 25%. Average of ferritin level decreased with increasing of severity of growth disorder in children. The results of this study suggest that treatment of growth retarded children with iron supplements can improve their growth. Because data about prevalence of IDA in Iranian children is limited, we suggest further studies to be performed to defi ne an average range of iron concentrations in accordance with other micro-elements such as zinc and copper in children of this area.
KEY WORDS: GROWTH RETARDATION, CHILDREN AND ADOLESCENTS, IRON DEFICIENCY ANEMIA
592
ARTICLE INFORMATION:
*Corresponding Author: [email protected] 20th July, 2017Accepted after revision 29th Sep, 2017 BBRC Print ISSN: 0974-6455Online ISSN: 2321-4007 CODEN: USA BBRCBA
Thomson Reuters ISI ESC and Crossref Indexed Journal NAAS Journal Score 2017: 4.31 Cosmos IF: 4.006
© A Society of Science and Nature Publication, 2017. All rights reserved.Online Contents Available at: http//www.bbrc.in/DOI: 10.21786/bbrc/10.3/38
INTRODUCTION
Iron defi ciency is a worldwide problem during life, but infants are especially susceptible to development and complications of iron defi ciency (Akramipour et al., 2008). Iron defi ciency during fi rst two years of a child life can cause irrecoverable defi cits in cognitive devel-
opment, and also other potential adverse effects(Black et al., 2013, Victora et al., 2008) 2013, Victora et al., 2008. Iron requirements of infants under six months old, are generally not well determined, since it is diffi cult to estimate the demands in infants which exclusively eat breast milk (Bender, 2003) Assumed that most of new-born infants are greatly protected from iron defi ciency

Arash Rahbar and Arian Hajian
BIOSCIENCE BIOTECHNOLOGY RESEARCH COMMUNICATIONS PREVALENCE OF IRON DEFICIENCY IN CHILDREN AND ADOLESCENTS WITH GROWTH RETARDATION 593
by the birth iron stores, usually iron defi ciency is not considered in infants below six months old. However, iron defi ciency (ID) and iron defi ciency anemia (IDA) can be observed, in the range of 0%–15% (ID) and 0%–4% (IDA) in six-month-old infants around the world (Ziegler et al., 2009, Nguyen et al., 2017b).
Older infants (up to 24 months old) are at higher risk of ID and IDA than younger one. Infants are susceptible to the effects of low iron levels, even before the fi rst moments of birth: low iron stores at birth have been associated with iron defi ciency and also elevated risk of growth retardation and cognitive developmental dis-orders later in infancy (Ziegler et al., 2009, MacQueen et al., 2017).
Iron defi ciency developing in infancy and leads to IDA has similarly been associated with bad cognitive, behavioral and growth problems; the consequences of iron defi ciency without IDA are not clear (Kazal Jr, 2002 Domellöf et al., 2014, Mamabolo and Alberts, 2014, Ritu et al., 2017).
In Iran, there may be not an ordinary screening pro-gram for anemia and ID in children and population-based data on anemia, that includes ferritin concen-tration in children, continue to be limited. The aim of present study was to identify the prevalence of iron defi ciency and explores their associations with socio-economic parameters and it’s complications in growth failure in and adolescents of 1-18 years old in Babol, Iran.
MATERIAL AND METHODS
In this cross-sectional study blood samples were col-lected from 100 children and adolescents (56 boys and 44 girls). They aged 1 to 18 years with growth failure including small height, low weight or both of them whom referred to our Hospital during years 2015-2016 were investigated. The patients were divided to 3 cat-egories according to the place of life (urban, suburb, and rural). 70 individuals were urban patients (%70), 24 rural patients (24%) and 6 suburb patients (6%).
The patient’s weight and height were measured and compared according to growth curve indices (CDC) and patients with growth retardation (percentile of weight and height under 3%) were evaluated for iron defi ciency associated hematologic factors (blood hemoglobin level, MCV, and serum ferritin level). Other factors such as birth weight and the location of life were also evaluated in the patients. The exclusion criteria were patients with any associated disease such as heritable problems and liver-heart or kidney diseases, and also patients under treatment with iron were omitted from the study. Chil-dren with growth disorder having serum ferritin levels lower than normal (according to normal value associ-
ated with age and sex) regardless to presenting anemia or not are considered as positive cases of the study.
STATISTICAL ANALYSIS
The Hb concentrations were symmetrically distributed. The distribution of plasma ferritin was skewed regarding higher values. The descriptive statistics included means, medians, interquartile ranges, and 95% assurance inter-vals as appropriate. Student t-test or Chi-square tests were used to measure the dissimilarity between Hb and ferritin with clinical or other baseline features. Data sta-tistical analyses was performed via SPSS software ver-sion 18.
RESULTS AND DISCUSSION
Anemia in little children lower than 2 years of age is of ultimate concern since their fast growth needs a high iron consumption which can be regularly not covered by their food plan, (Kotecha, 2011, Nguyen et al., 2017a). It was not possible to estimate the anemia prevalence in this group separately due to the minimal records. How-ever, considering that approximately half the world wide population of preschool children are affl icted by ane-mia, with a prevalence as high as 64.6% in Africa and 47.7% in Asia, and that we know anemia prevalence is higher in the group of children less than two years old, we could possibly assume that anemia in this specifi c age group is an essential global public health problem, mainly in low income countries(Mamabolo and Alberts, 2014, Ritu et al., 2017). According to previous studies in Iran, the prevalence of anemia between children is 15% in this area (Sayyari et al., 2006).
Blood Hb levels were evaluated in patients to deter-mine anemia prevalence between children with growth retardation. Ferritin levels among patients were meas-ured to evaluate prevalence of iron defi ciency between children with growth failure. Mid cell volume (MCV) of the patients was measured to evaluate the prevalence rate of microcytic anemia in growth retarded chil-dren and adolescents. Table 1 shows data about these variables.
Also these variables were investigated according to cut off points which is present in table 2.
Anemia prevalence was defi ned between 4 different age groups and the results were shown in table 3.
According to Gomez et al., (1955) and Waterlow (1972) classifi cation of undernutrition in children is rearranged in table 4, the patients were divided in 3 categories (mild, intermediate and severe malnutri-tion). There was signifi cant relation between serum fer-ritin levels and undernutrition. Serum levels of ferritin decreases with increasing undernutrition.

Arash Rahbar and Arian Hajian
594 PREVALENCE OF IRON DEFICIENCY IN CHILDREN AND ADOLESCENTS WITH GROWTH RETARDATION BIOSCIENCE BIOTECHNOLOGY RESEARCH COMMUNICATIONS
Table 1. Blood Hb, ferritin and MCV maximum and minimum rates
Variable Maximum rate Minimum rate Average rate Standard deviationBlood Hb 13.9gr/dl 9.2 gr/dl 11.8 gr/dl 1.25
Ferritin 180 μg/L 5 μg/L 43 μg/L 36.6
MCV 83fm 69fm 70fm
Table 2. Variables according to cut off point
Variable Cut off point Number of patients with lower cut off point
percentage P value(between two sexes)
Hb <11.3 g/dL 37 37% 0.028
ferritin <15 μg/L 25 25% 0.06
MCV <80 29 29% 0.08
Table 3. Anemia prevalence in 4 different age groups
Age group Number of Patients
Percentage of patients showed anemia based
on normal Hb
Average μg/dL
Patients with ferritin lower than normal value
6months- 2 years old 11 42.8% 38 -
2-6 years old 31 35% 29.5 -
6-12years old 39 20% 52.44 -
12-18years old 19 8.3% 49.2 2(10.5%)
Table 4. Gomez and Waterlow malnutrition classifi cation in children
Grade of malnutrition Weight for age Height for weight Weight for height0 Normal ›90 ›95 ›90
1 Mild 75-90 90-95 81-90
2 Moderate 60-74 85-89 70-80
3 Severe < 60 <85 <70
Anemia prevalence according to age associated nor-mal Hb was 25% in boys and 41% in girls which was signifi cantly different.
In this study we resulted that the prevalence of ane-mia in growth retarded children was 35.9%. In a similar study, Anderson et al (Monchy et al., 2008) showed that the prevalence of anemia in children with growth failure in New Zealand was 71%. They also resulted that micro-cytic anemia prevalence between the patients was 20 % which matches with our results with 21% of prevalence. Anderson et al also resulted that 6% of children with growth retardation had lower ferritin levels than normal value. In the present study the prevalence of low fer-ritin levels was 1.6%. Socio-economic status, indicated by place of life was an essential factor determining the risk of anemia.
In our survey, anemia was detected in 41% of the girls compared to 25% of the boys. Similarly, Kara et al and Yavuz et al also noticed a higher prevalence of anemia
in girls compared with boys, (Kara et al., 2006, Yavuz et al., 2004). The lower incidence of anemia among puber-tal boys might possibly be explained by the physiologi-cal surge in hemoglobin level triggered by sexual matu-ration and consequently by lowering the requirements after passing of the growth spurt. In girls, the phenom-enon of menarche and menstrual irregularities reduce an expected age related increasing amount of hemoglobin concentration (Kara et al., 2006). The anemia found in this study was microcytic, hypochromic anemia, as showed by a low MCV. Anemia of this type has been known to be connected with iron defi ciency(Torabizadeh et al., 2004).
The prevalence of anemia and iron defi ciency in this study is much less than previous reports about normal kids from this age group in other regions of Iran as well as the reports of other developing countries (Akramipour et al., 2008, Hashizume et al., 2003), that indicates the important role of iron defi ciency in growth failure of

Arash Rahbar and Arian Hajian
BIOSCIENCE BIOTECHNOLOGY RESEARCH COMMUNICATIONS PREVALENCE OF IRON DEFICIENCY IN CHILDREN AND ADOLESCENTS WITH GROWTH RETARDATION 595
children. In addition, we cannot fi nd any considerable correlation between hemoglobin level and serum ferri-tin revealing that iron status was not likely an essential determinant agent of anemia in the evaluated popula-tion. These results are actually in opposition to Hashis-mue et als study (Gomez et al., 1955). Brined et als study in Bangladesh (Briend et al., 1990) evaluated growth rate of 694 children from rural regions. They resulted that children drinking water with iron values more than 1mg/lit, were signifi cantly higher than children drinking water containing less than 1mg/lit. They concluded that iron defi ciency causes growth retardation of children in poor societies which in conformity with our study.
CONCLUSION
Since iron defi ciency leads to growth failure in children through different ways such as decreasing oxygen trans-port capacity, decreasing energy production and decreas-ing appetite, blood iron levels monitoring in children is of great importance. The results of this study suggest that treatment of growth retarded children with iron supple-ments can improve their growth. Because data about prev-alence of IDA in Iranian children is limited, we suggest further studies to be performed to defi ne an average range of iron concentrations in accordance with other micro-elements such as zinc and copper in children in this area.
AUTHORS’ CONTRIBUTION
Whole authors were in the same.
FINANCIAL DISCLOSURE
There is no confl ict of interest.
FUNDING/SUPPORT
This study was fi nancially supported by Student Research Committee, Babol University of Medical Sciences, Babol, IR Iran
REFERENCES
Akramipour, R., Rezaei, M., & Rahimi, Z. (2008). Prevalence of iron defi ciency anemia among adolescent schoolgirls from Kermanshah, Western Iran. Hematology, 13(6), 352-355.
Bender, D. (2003). Do we really know vitamin and mineral requirements for infants and children? The journal of the Royal Society for the Promotion of Health, 123(3), 154-158.
Black, R. E., Victora, C. G., Walker, S. P., Bhutta, Z. A., Chris-tian, P., De Onis, M., . . . Martorell, R. (2013). Maternal and child undernutrition and overweight in low-income and mid-dle-income countries. The Lancet, 382(9890), 427-451.
Briend, A., Hoque, B., & Aziz, K. (1990). Iron in tubewell water and linear growth in rural Bangladesh. Archives of Disease in Childhood, 65(2), 224-225.
Domellöf, M., Braegger, C., Campoy, C., Colomb, V., Decsi, T., Fewtrell, M., . . . Shamir, R. (2014). Iron requirements of infants and toddlers. Journal of pediatric gastroenterology and nutri-tion, 58(1), 119-129.
Gomez, F., Galván, R. R., Cravioto, J., & Frenk, S. (1955). Mal-nutrition in infancy and childhood, with special reference to kwashiorkor. Advances in pediatrics, 7, 131.
Hashizume, M., Kunii, O., Sasaki, S., Shimoda, T., Wakai, S., Mazhitova, Z., . . . Farmer, A. (2003). Anemia and iron defi -ciency among schoolchildren in the Aral Sea region, Kazakh-stan. Journal of tropical pediatrics, 49(3), 172-177.
Kara, B., Çal, S., Aydogan, A., & Sarper, N. (2006). The preva-lence of anemia in adolescents: a study from Turkey. Journal of pediatric hematology/oncology, 28(5), 316-321.
Kazal Jr, L. A. (2002). Prevention of iron defi ciency in infants and toddlers. American family physician, 66(7), 1217-1224.
Kotecha, P. V. (2011). Nutritional anemia in young children with focus on Asia and India. Indian Journal of Community Medicine, 36(1), 8.
MacQueen, B., Christensen, R., Ward, D., Bennett, S., O’Brien, E., Sheffi eld, M., . . . Fleming, R. (2017). The iron status at birth of neonates with risk factors for developing iron defi ciency: a pilot study. Journal of perinatology: offi cial journal of the California Perinatal Association, 37(4), 436.
Mamabolo, R. L., & Alberts, M. (2014). Prevalence of anaemia and its associated factors in African children at one and three years residing in the Capricorn District of Limpopo Province, South Africa. curationis, 37(1), 1-9.
Monchy, D., Hem, N., & Hok, P. (2008). Co-existing micro-nutrient defi ciencies among stunted Cambodian infants and toddlers. Asia Pacifi c journal of clinical nutrition, 17(1), 72.
Nguyen, P. H., Gonzalez-Casanova, I., Young, M. F., Truong, T. V., Hoang, H., Nguyen, H., . . . Ramakrishnan, U. (2017). Preconception Micronutrient Supplementation with Iron and Folic Acid Compared with Folic Acid Alone Affects Linear Growth and Fine Motor Development at 2 Years of Age: A Randomized Controlled Trial in Vietnam. The Journal of Nutri-tion, jn250597.
Nguyen, V., Wuebbolt, D., Thomas, H., Murphy, K., & D’souza, R. (2017). Iron Defi ciency Anemia in Pregnancy and Treatment Options: A Patient-Preference Study [1L]. Obstetrics & Gyne-cology, 129, 122S.
Ritu, S., Ashok, D., Vithal, T. P., Shivani, R., & Rajaram, N. (2017). A Hospital Based Study on Anemia Prevalence in Chil-dren of an Indian Island. International Journal of Pediatrics.
Sayyari, A., Sheikhol Eslam, R., & Abdollahi, Z. (2006). Preva-lence of anaemia in 2-12-year-old Iranian children.
Torabizadeh, Z., Naghshvar, F., KOUSARIAN, M., & JAHAN-BAKHSH, R. (2004). The prevalence of iron defi ciency related anemia in guid school students in Sari, 2002-2003.

Arash Rahbar and Arian Hajian
596 PREVALENCE OF IRON DEFICIENCY IN CHILDREN AND ADOLESCENTS WITH GROWTH RETARDATION BIOSCIENCE BIOTECHNOLOGY RESEARCH COMMUNICATIONS
Victora, C., Adair, L., Fall, C., Hallal, P., Martorell, R., Rich-ter, L., & Sachdev, H. (2008). Maternal and child undernutri-tion: consequences for adult health and human capital. Lancet, 371(9609), 302.
Waterlow, J. (1972). Classifi cation and defi nition of pro-tein-calorie malnutrition. British medical journal, 3(5826), 566.
Yavuz, T., Korkut, S., Yavuz, Ö., & Kocabay, K. (2004). Preva-lence of anemia and iron defi ciency anemia among adoles-cents in the western black sea region. Turkiye Klinikleri Jour-nal of Pediatrics, 13(2), 711.
Ziegler, E. E., Nelson, S. E., & Jeter, J. M. (2009). Iron supple-mentation of breastfed infants from an early age. The Ameri-can journal of clinical nutrition, 89(2), 525-532.

Join Society For Science & Nature and Avail Multiple Benefi ts
1. Life members of Society of Science & Nature (MSSN), Bhopal, India will be entitled to receive free early on line issues of BBRC for life.
2. Selected life members on the basis of their academic and research contributions will be conferred with Honorary Fellowship of SSN (FSSN), who will be instrumental in scientifi c awareness programmes particularly encouragement and popularisa-tion of Science.
3. Life members will be invited to attend society sponsored conferences and seminars on invitation.
Subscription Form For MSSN Life (Fellow Member Society For Science & Nature, along with BBRC):Kindly complete the form and send it, together with the necessary payment to the Secretary of the Society on the address below (Photocopies will be accepted). Forms can also be downloaded from our website (http://www.bbrc.in/subscriptions.html).
(Crossed DD in favor of Treasurer, Society for Science and Nature, C-52, Housing Board Colony, Kohe-Fiza, Bhopal-462001, India, to be sent by Speed/Regd. Post.) Life Membership One Time Subscription (MSSN) including Life Member-ship of BBRC is Rs. 5000/- Direct NEFT can be also made on contacting the Managing Editor. Foreign Members will have to obtain separate invoices for mak-ing payment to the Society for Fellowship.
Name: Dr./Prof. (In capital letters):
Designation & Organization:
Qualifi cation & Specialization of Research:
Present and Past Academic Positions:
Research Publications Experience Enclose Biodata with full publications list:
Academic Achievements Memberships of Societies etc.:
Mailing Address (With tel./Mob./Email id):
I wish to become life Member / Fellow of Science And Nature. I have read the details and agree to abide by them.
SignatureDetails of Accompanying Payment DD No. Date
................................................................................................................................................
JOIN AS LIFE MEMBER BIOSCIENCE BIOTECHNOLOGY RESEARCH COMMUNICATIONS
SUBSCRIPTION FORM FOR BBRC (Only Journal)
Kindly complete this form if you want to become life member/annual member of BBRC only (Individual Life Member BBRC Rs. 4000/-)
I wish to subscribe to Bioscience Biotechnology Research Communications.
Name:
Address:
E-mail: Signature: Date:
Subscription: Annual/Life......................... Amount Rs.
*DD No. enclosed.
All payments by Demand draft should be made in favour of Treasurer, Bioscience Biotechnology Research Communications and sent to: Treasurer, C-52, Housing Board Colony, Kohe-Fiza, Bhopal-462001, India, by registered Post. Direct NEFT can be also made on contacting the Managing EditorE-mail: [email protected] or [email protected] Telephone No. +91-0755-4241662, +919893015818Website: www.bbrc.in
BBRC SUBCRIPTION RATES (INR)1. Life Member (BBRC) INR 4000/-2. Individual Annual Member INR 2000/-3. Institutional Annual Member Libraries INR 3000/-

Declaration about the ownership ofBioscience Biotechnology Research Communications
Form (IV) [See Rule 3]
1. Place of Publication : Bhopal, India
2. Periodicity of its Publication : Six Monthly
3. Printer’s Name : Faraz S. Ali On behalf of SocietyFor Science & Nature
(Whether Citizen of India) : Yes
Address : H. No. C-52, H.B. Colony, Kohefi zaBhopal-462001, India
4. Publisher’s Name : Faraz S. Ali on Behalf of SocietyFor Science & Nature
(Whether Citizen of India) : Yes
Address : H. No. C-52, H.B. Colony, Kohefi zaBhopal-462001, India
5. Editor’s Name : Dr. Sharique Ali
(Whether Citizen of India) : Yes
Address : H. No. C-52, H.B. Colony, Kohefi zaBhopal-462001, India
6. Name & Address of the individual/
: Faraz S. Ali
who own the newspaper & partners or share holders holding more than one percent of the total capital
: H. No. C-52, H.B.Colony, Kohefi za,Bhopal-462001, India
(Whether Citizen of India) : Yes
I, Faraz S. Ali hereby declare that the particulars given above are true to the best of my knowledge and belief.
Date : 30th September 2017 Place : Bhopal

Detailed instructions to authors for preparing and submitting manuscripts to Bioscience Biotechnology Research Communications (BBRC) Please see journal sample manuscript
Bioscience Biotechnology Research Communications (BBRC) is a broad based peer reviewed international open access journal that publishes original research papers, short communications and exciting reviews in all basic and applied fi elds of Life Sciences, including Biology & Medicine on a fast track. The journal is indexed in leading citation agencies of the world such as Thomson Reuters, Research Gate, CAS (USA), Uhrlich, Biobase, EBSCO, Copernicus Indicus, NISCAIR, NAAS, and many others and has a NAAS 2017 journal score of 4.31. It has recently got an Impact Factor of 4.006 and has been approved by University Grants Commission (UGC New Delhi) Ministry of HRD, Government of India, Journal No. 42929 www.ugc.ac.in.
On Ethical and Animal Welfare Issues: Bioscience Biotechnology Research Communications requires that the experimental conditions under which human and animal assays and tests are performed are as per standard protocols used worldwide. Studies on animals must comply with the prevailing standards of animal welfare according to Indian Council of Medical Research Guidelines in India and likewise following similar conditions elsewhere. Authors must make it clear that the procedures they used were as humane as possible and have been complied with the guidelines for animal care of their institutions or with national/ international guidelines. Studies involving human subjects/animals must be carried out with the formal approval of the relevant Ethical Committee and evidence of such approval must be provided as and when needed.
Submission Of Manuscript: Manuscripts should be in 12 point size, Times New Roman Font with one and half space on A4 size paper in MS Word in the given format and must be sent by e-mail as attachment to the editor ([email protected] and a copy to [email protected]). A cover letter signed by author(s) must be enclosed with the manuscript stating that the work is their own and has not been published earlier. Only online MS should be sent by email
Length of contributions: Papers should be ideally be no longer than 08 pages for short communications and 20 pages for full length papers, although we can publish longer papers.
SUBMISSION GUIDELINES: PLEASE PREPARE YOUR MS AS BELOW PLEASE SEE THE JOURNALS ANY SAMPLE MANUSCRIPT• Abstract: All Manuscripts should have an abstract and keywords with the following in the mind but without any sub heads: Objectives, Methods, Results and Conclusion of no more than 200 words. Key words: Up to fi ve key words should be included in italics in alphabetical order.
• Introduction: It should be concise, with what has been done and why, giving in brief the background, latest work done in the area with existing lacunae /controversies/contradictions and valid reasons for taking up the research problem. Review of literature should be brief pertinent and up-to-date. Recent references till-date be added. All references should be checked minutely, for their appearance in text as well as in References/Bibliography section. MS with incomplete references will not be accepted. Reference style of BBRC is Harvard Style ie author last name with year in bracket in the text.
• Material & Methods: Brief description of standard procedures adopted worldwide with standard references.
• Results & Discussion: Should be combined to avoid repetition. Sub-headings may be provided in this section if they improve the clarity. Latest references are a must with interpretational signifi cance in introduction and discussion.
• References: All references used in the text must be arranged alphabetically in the last section of References. Last names of authors with initials should be written with year of publication in bracket ( ) followed by full title of the article, the name of the journal, volume number, and the fi rst and last page numbers (see 1 below). Journal title should be given in full, or abbreviated according to the style of Index Medicus. Title of book should be followed by author(s), year of publication, the publisher and place. THERE SHOULD BE NO USE OF ITALICS IN THE REFERENCE, IE LAST SECTION EXCEPT FOR SCIENTIFIC/ZOOLOGI-CAL/BOTANICAL NAMES Examples of References in BBRC are as:
(1) Ali S.A., S. Salim, T. Sahni, Peter J. and Ali A. S. (2012c). Serotinergic receptors as novel target for optimizing skin pigmentary responses in Indian bull frog Hoplobatrachus tigerinus. British J. of Pharmacol. John Wiley The British Pharmacological Society Vol. 165, Issue 5, 1515-1525.(2) Book: Falconer DC (1960) Introduction to Quantitative Genetics. Oliver & Boyd, Edinburgh 165-185.(3) References to article in book: Simonsen B. (1989). In: Processing of poultry. Pp 221 250 (Ed) G. C. Mead, Elsevier Applied Science, London.(6) Tables and illustrations: Tables and fi gures should be numbered in Arabic numerals and given in separate pages with due reference in the text. Units of measurement should be metric units. Graphs and other line drawings should be drawn in India ink and individually identifi ed by Arabic numerals. Pho-tographs should have good contrast with numbers and explanation of fi gures. Please note that the fi gures/illustrations should be of minimum 300dpi (printable resolution with inside letters or captions clear in reproducible size.).
Peer review: All papers submitted to BBRC undergo a quick internal and external double blind peer review process. On the basis of the referees’ responses, papers will be rejected, accepted subject to minor or major revisions, or accepted unconditionally.
Acceptance of submission: On acceptance, the editors retain the right to make stylistic changes, decide on the date of publication and shorten material, as necessary.
Proofs: Authors will be sent an online copy of the galley on request. Corrections should be confi ned to typographical errors or matters of accuracy. Authors should return proofs within two days of receipt, along with a signed copy-right form downloaded from journals website.
Article Processing Charges (APC): Indian authors will have to bear the article processing cost of INR 4000/- per manuscript submitted, (US$ 300 per man-uscript submitted for foreign authors). In order to meet the rigorous academic standards on a fast track, the journal has some expenses, and for these reasons we charge a very modest article processing fee. Nevertheless, as we believe that lack of funds should not be a barrier to open access publication, Biosc.Biotech Res.Comm. has a policy to provide some waivers to deserving authors from middle and low income countries. Authors can request for a waiver in such cases.
Note: For any hard copies of journals and reprints additional amount will be charged. Please contact the Managing Editor for details.
Copyright: All materials received by BBRC are assumed to be submitted exclusively. It is understood that contributions have not been and will not be published elsewhere. A copy right letter downloaded from journals website duly, signed by all authors is to be submitted after acceptance of the MS.
Accuracy and liability: A contribution is accepted on the strict understanding that its author(s) is/are responsible for accuracy of all information contained in it. BBRC condemns the malice of plagiarism and strongly advocates the policy of out rightly condemning and reporting of any academic malpractice with regard to manipulation, copying, pilfering or pirating of any research material or data in practice and writing thereof.
On Plagiarism and Retraction Policy: Articles found with plagiarized material will be liable for immediate retraction from the issue and action will be taken against such authors as per standard norms.
For any information please contact: Managing Editor, BBRC, C-52, HOUSING BOARD COLONY, KOHE FIZA, Bhopal, (MP) 462001, India. Tel: +91-755-4241662 Mob: +919893015818
A soft copy (MS Word fi le) of the manuscript as attachment with a cover letter declaring originality of the research work and statement of no confl ict of the authors, should be sent to: [email protected] with a copy to [email protected] Journals Website: www.bbrc.in
New Delhi Offi ce: Dr. Mohd. Miraj, AIHMSGautam Nagar, Behind AIIMS New Delhi , LL: +91-11-41030907 Mob: +09560407405, Website: www.aihms.in

Name of Fellow/Member
Life Member, Fellow Society Science & Nature and Member BBRC Designation and Address
Dr. Sharique A. Ali SSN and BBRC Professor and Head, Department of Biotechnology Saifi a Science College, Bhopal
Dr. Ayesha S. Ali SSN and BBRC Professor, Department of Biotechnology & Zoology Saifi a Science College, Bhopal
Dr. J. Peter SSN and BBRC Associate Professor, RKDF University, Bhopal
Dr. M. Miraj SSN and BBRC Director, Institute of Health & Management Studies, New Delhi
Dr. Z.H. Khan SSN and BBRC Professor & Head Department of Biochemistry Shri Shivaji College of Science, Akola
Dr. G.N. Wankhede SSN and BBRC Professor & Head, Department of Zoology, SGB UniversityAmrawati (MS)
Dr. S. Shrivastava BBRC Professor of Chemistry, MVM, Bhopal
Dr. P.M. Makode BBRC Associate Professor of Zoology, Venue, Park, Shegaon Naka VMV Road, Amravati (MS)
Dr. S. Yadav BBRC Assistant Department of Zoology, Satya Sai College for Women BHEL, Bhopal
Dr. R. Singh BBRC Associate Professor,Department of Zoology, MLB Girls College, Bhopal
Dr. A. D. Lakha BBRC Associate Professor of Zoology, Nagazari Area, MIT Road, Ambajogai, Beed (MS) 431517
Dr. R. S. Virani BBRC Associate Professor Karimabad Society, Pandhar Kawada, District, Yeobtmal (MS)
Dr. M. Pal BBRC Assistant Professor, Department of Biotechnology Sadhu Vaswani College Bhopal
Dr. V.R. Wankhede BBRC Assistant Professor, Department of Zoology, Deccan College, Pune
Dr. Mrs. V. Ingole BBRC Department of Zoology Vidya Bharti Mahavidyalaya, Amravati
Dr. U.N. Bhale BBRC Associate Professor RTM University, Nagpur
Dr. A.P. Sawane BBRC Associate Professor RTM University, Nagpur
Dr. A.D. Bobde BBRC Associate Professor RTM University, Nagpur
Dr. R.G. Jadhaw BBRC SGB University, Amravati
Dr. O.N. Tiwari FSSN DBT Imphal, Manipur
Dr. R. K. Singh BBRC USDA Washington, USA
Dr. V. Meitei BBRC Jaipur University, Jaipur
Dr. T. Sultan BBRC Medical Genetics Department, Riyadh University, KSA
Dr. N. Qayyumi BBRC Assistant Professor of Zoology, Bhopal
Dr. M. Sajid BBRC Head Department of Biotechnology Bonnifi e College, Bhopal
Dr. L. Jakkala BBRC Director Macrocare, Macrocare Towers, Hyderabad, AP
Dr. V. Jaiswal BBRC Research Scholar, SGB University, Amravati
Dr. A. Kumar BBRC Associate Professor, Department of Biotechnology, SMD Teerth University, Haryana
Dr. A.S. Dighde BBRC SGB University, Amravati
Dr. P Babu BBRC Professor of Pomology, Horticulture University of Horticulture Science, Bagalkot
Dr. (Smt) S. Sinha BBRC Plot-18, Street-1, Ashish Nagar (East) Risalt, Bhilai, Durg, CG
Dr. R. Khalique BBRC Department of Zoology, University of Kashmir, Srinagar
Dr. A. Siddiqui FSSN Department of Zoology Holkar Science Colege, Indore
Dr. MM. Shrivastava FSSN Department of Biotechnology Holkar Science College, Indore
Dr. A. Eberle FSSN Basel Switzerland
Dr. S. Newton FSSN University of Virginia, USA
Dr. J Galgut BBRC Department of Biomedicine, Qatar
Dr. S. Salim BBRC Maryland, USA
Dr. Ruchi Shivle MSSN DAVV, Indore
Dr. Kirti Dubey MSSN DAVV, Indore
Dr. AT Kalse FSSN NEM University, Jalgaon (MS)
Dr. F Kabinwar FSSN University of California, Los Angeles, USA
Dr. Arjun Deb FSSN Professor of Zoology Lumding College Lumding Assam
Dr. Z.Pir FSSN University of Kashmir, Srinagar
Dr. Razia Sultan FSSN DAVV, Indore
Dr. Thingujam I. Devi FSSN Institute of Bioresources and Sustainable Development, Imphal, Manipur
Dr. I Onyesom
Dr. K. Sudhakar
FSSN
FSSN
Professor Abraska, Delta State Nigeria
Assistant Professor Energy Centre,Maulana Azad National Institute of Technology Bhopal, India.

Bioscience Biotechnology Research CommunicationsSociety For Science & Nature Bhopal, C-52 Housing Board Colony, Kohe – Fiza,
Bhopal 462001 INDIA, Phone no.: +91-755-4241662Website:www.bbrc.in Email:[email protected]
COPYRIGHT TRANSFER FORM:(This form is signed by all the authors or by the corresponding author on behalf of all of them)
1) I / (We) confi rm that the enclosed article entitled:
Authored by: 1. 2.
3. 4.
has not previously been published in whole or in part, is not currently being considered elsewhere for publication, and, if accepted for publication in the above Journal, will not be published elsewhere in any language, without the consent of the editor and the publisher.
2) I/We acknowledge that it is a condition of acceptance by the editor that the publisher, Society for Science & Nature/Biosc. Biotech.Res.Comm. acquires automatically the copyright in the manuscript throughout the world.3) I/We confi rm that I have obtained all the necessary permissions to include in the paper items such as quotations, fi gures, and the results of government sponsored research.4) I/We enclose where necessary written permission of authors and publishers to use any copyright material (e.g.previously published fi gures and tables).
We also certify that the research work carried out is original, and does not contain any plagiarized material. All due permis-sions / ethical clearances have been taken from concerned authorities.
We also understand that if our article is found with plagiarized material, it will be liable for immediate retraction from the issue and due action can be taken as per standard norms.
Author 1
Signature: Name: Date:Institution: Dept: Street: City: State:Zip: Country: Country Code:Phone: Fax: Email:
Author 2
Signature: Name: Date:Institution: Dept: Street: City: State:Zip: Country: Country Code:Phone: Fax: Email:
Author 3
Signature: Name: Date:Institution: Dept: Street: City: State:Zip: Country: Country Code:Phone: Fax: Email:
Author 4
Signature: Name: Date:Institution: Dept: Street: City: State:Zip: Country: Country Code:Phone: Fax: Email: