AN INTERACTIVE TEST OF SERIAL BEHAVIOR: AGE AND PRACTICE ALTER EXECUTIVE FUNCTION
27
Serial Behavior 1 Journal of Clinical and Experimental Neuropsychology, in press An interactive test of serial behavior: Age and practice alter executive function Andrew Kuhlman 1 , Deborah Little 2 , & Robert Sekuler 1 1 Volen Center, Brandeis University; Waltham, MA 2 Center for Stroke Research, University of Illinois, Chicago, IL Address correspondence: Robert Sekuler Volen Center for Complex Systems Brandeis University, MS 013 Waltham, MA 02454 Phone: 781-736-3277 Fax: 781-736-2398 e-mail: [email protected]
-
Upload
independent -
Category
Documents
-
view
5 -
download
0
Transcript of AN INTERACTIVE TEST OF SERIAL BEHAVIOR: AGE AND PRACTICE ALTER EXECUTIVE FUNCTION

Serial Behavior 1
Journal of Clinical and Experimental Neuropsychology, in press
An interactive test of serial behavior: Age and practice alter executive function
Andrew Kuhlman1, Deborah Little2, & Robert Sekuler1
1Volen Center, Brandeis University; Waltham, MA
2Center for Stroke Research, University of Illinois, Chicago, IL
Address correspondence:
Robert SekulerVolen Center for Complex SystemsBrandeis University, MS 013Waltham, MA 02454Phone: 781-736-3277Fax: 781-736-2398e-mail: [email protected]

Serial Behavior 2
ABSTRACT
We describe an interactive, computer-based test inspired by the Trail Making Test (TMT). Inthis new test, young (mean age=20.4 years) and older participants (mean age=74.9 years)used natural, pointing responses to order series of numbers, letters, or intermixed letters andnumbers. This interactive test, which avoids several deficiencies of TMT, assessesparticipants’ baseline speed for detecting and responding to individual items, captures thetime for each response, and segregates erroneous responses from correct ones. The inter-response times with intermixed letters and numbers showed that participants did not alwaysswitch between the two different ordering-tasks, but instead often recall letter-number pairsas single units. An additive factors analysis decomposed test times into functionalcomponents, including executive function, which took longer in older participants. Withmodest practice, both young and older participants sped up their ordering of intermixednumbers and letters, probably reflecting increased automaticity and reduced dependence uponexecutive function.

Serial Behavior 3
An interactive test of serial behavior: Age and practice alter executive function
The Trail Making Test (TMT), a mainstay of neuropsychological evaluation (Reitan,1958), requires participants to draw a single, continuous line (a trail) through randomly-located items on a sheet of paper. In TMT’s Form A, the trail is drawn through numbers,which are to be connected in increasing numerical order, 1, 2, 3, · · · 25. In form B, the trail isdrawn through spatially intermingled numbers and letters, alternating between the two kindsof items, 1, A, 2, B, 3, C, · · · 12, L, 13. The total time to complete each form is measured,and performance summarized by scoring each test separately, computing the differencebetween the two total times, or by their ratio (Arbuthnott & Frank, 2000; Drane, Yuspeh,Huthwaite, & Klingler, 2002).
In part, TMT’s wide use reflects its presumed sensitivity to executive function. Morespecifically, differential performance on TMT’s two forms has been linked to the ability tocomplete complex executive functions such as planning of actions and switching betweentasks. Because normal aging slows performance on TMT’s Form B relative to Form A(Davies, Spelman, & Davies, 1981; Hays, 1995), TMT might be a useful indicator for earlyage-related changes in the frontal lobe, particularly the dorsolateral prefrontal cortex, andother regions of the brain crucial for executive functions (Cowell et al., 1994; Gunning-Dixon& Raz, 2000). In fact, major accounts of cognitive aging emphasize behavioral changesthought to be associated with the frontal lobe, including reductions in working memory(Wingfield, Lindfield, & Kahana, 1998) and widespread weakening of inhibitory processes(Hasher & Zacks, 1988). Moreover, there is growing consensus that various aspects ofexecutive function depend crucially upon prefrontal cortex (Shallice, 2002).
In order to dissect age-related changes into functional components, Salthouse andcolleagues implemented two different variants of TMT. Both afforded the opportunity toanalyze the times associated with each individual response, which is not possible in theoriginal test. With one test variant, participants used a keyboard to navigate through a matrixof targets on a computer display (Salthouse & Fristoe, 1995). In the other, participants drew atrail through a simplified, paper and pencil version of TMT (Salthouse et al., 2000). Bothstudies showed age-related slowing on the mixed letter-number versions of TMT. Theapplication of a structural equation model suggested that the age effects might not come froma factor unique to Form B, but rather might have come from an exaggeration of some factorthat also influenced Form A. Specifically, Salthouse et al. (2000) proposed that age-relatedslowing on TMT was attributable to slowed perceptual processing, that is, in distinguishingamong visually similar items. They argued that there was little sign of age-related effects onexecutive function.
The apparent contradictions in the literature stimulated us to take a more directapproach to understanding the origin of age-related slowing on TMT, including possiblecontributions from age-related changes in visual perception (Salthouse et al., 2000). In thecourse of our work, we devised computer-based interactive tests, which in the aggregate wecall the Massachusetts Ordered Behavior test (MOBt). We then used MOBt to identify thebasic components of task switching operations in TMT, and examined the roots of age-relatedchanges in task switching. To examine the impact of age-related perceptual changes, wedirectly manipulated the visibility of target items, and measured how this manipulationaffected different ordering behaviors.
We were particularly interested in isolating the contribution of executive function toMOBt. In the literature, the term “executive function” has been used in various ways. Here,however, it refers to operations that are required to alternate between different tasks (Meyer& Kieras, 1997; Duncan, 1986; Norman & Shallice, 1986), e.g., searching for an item in anordered series of numbers versus searching for an item in an ordered series of letters. Task

Serial Behavior 4
switching has generally been investigated by having participants switch between two or morewell-learned and practiced tasks. Efficiency of task switching is generally reported as the cost(increased response time and/or increased errors) associated with having to switch betweenthe two tasks (Monsell, 2003). Although these costs are reduced when the switch ispredictable, residual negative impacts on behavior remain (Monsell, Sumner, & Waters,2003), and these impacts seem to correlate with performance on TMT (Arbuthnott & Frank,2000). The underlying assumption in TMT is that participants must maintain both strings ofwell learned information (letters and numbers) and switch between the two to identify thenext target required. It is believed that this switch between tasks lengthens response times inB relative to Form A. MOBt has a comparative advantage over TMT for determiningexecutive function’s contribution to age-related changes in performance because it allowsperformance to be evaluated from both the aggregate time to complete an entire set of items,as in TMT, and from the individual times collected for each target. Examining performanceon individual trials affords greater analytical and statistical power as compared to TMT. Inaddition, the collection of these individual trial times allow for the directed evaluation ofexecutive functions, and changes in executive function over time, that occur between items,such as the case in switching between letters and numbers.
In designing MOBt we sought to rectify various deficiencies in TMT (Spreen &Strauss, 1998), including several that seem not to have been discussed previously. Thefollowing paragraphs briefly describe the flaws we discerned in TMT that might exaggerateage-related effects on downstream measures of task-switching, and the steps MOBt took torectify these flaws. The goal was an uncontaminated estimate of the overhead associatedwith executive function.
Two classes of deficiencies were of special concern. The first class includedadministrative and methodological details; the second class included higher-order cognitivefunctions, aside from task-switching, which can affect performance on TMT. Thesecognitive functions include visual search, spatial memory, and learning.
Methodological FactorsOur primary concern with the interpretation of data collected from the TMT is that
erroneous responses can not be examined. In TMT, errors are made when the trail is drawnto an incorrect item. Participants are instructed to detect and then correct their own errors, or,failing that, the test administrator is supposed to guide necessary corrections. Althougherrors affect the time for completing a trail, frequency of errors is not included in the testscore. By recording each individual response, MOBt eliminates this problem. In addition toan automated error correction scheme, MOBt allows any error’s effects to be investigated,characterized, and expunged as appropriate.
However advantageous computerized administration may be, there is concern that thisapproach might negatively affect particular populations, such as older adults, who may havelimited access and experience with computers. To counteract any disadvantage that olderparticipants might experience with a test’s automated computer administration, responseswere made using a touch-sensitive screen fitted over the computer display. Participantsresponded by touching the screen with the index finger of their preferred hand, executing asimple, natural, and highly-practiced response. Moreover, before testing began eachparticipant had a comprehensive, automated practice tutorial on each of MOBt’s sub-tests. Anadditional brief practice session was offered before every test.
Finally, TMT’s original format does not allow for multiple administrations within ashort period of time. Successive administrations of TMT could be contaminated by implicitlearning of target locations (Chun & Jiang, 1998; Musen & Treisman, 1990), and theseeffects of learning might be different across individuals or groups. MOBt nullified the value

Serial Behavior 5
of learning particular sequences of locations: item locations were re-randomized after everyresponse. Repeated testing also allowed us to assess how practice might influence the variouscognitive components required by MOBt. Cognitive Factors
Of particular concern were aspects of TMT that might differentially affect young andolder participants in a way that would be mistaken for an age-related change in executivefunction. For example, it is known that the efficiency of visual search declines withincreasing age (Plude & Hoyer, 1981, 1996; Hasher, Stoltzfus, Zacks, & Rypma, 1991;Salthouse, 1993). Such age-related declines in search speed are magnified when potentialtargets cover relatively large areas (Burton-Danner, Owsley, & Jackson, 2001). At normalviewing distances, TMT requires visual search of an area of about 1200 square degrees ofvisual angle, and a recently introduced version of TMT-B requires search of an even largerarea (Delis, Kaplan, & Kramer, 2001). This search requires a series of saccadic eyemovements and fixations among items separated from one another by variable distances anddirections (Araujo, Kowler, & Pavel, 2001). As a result of its format, TMT’s results could bedistorted by individual differences in efficiency and speed of search (Crowe, 1998;Ehrenstein, Heister, & Cohen, 1982; Gaudino, Geisler, & Squires, 1995). In contrast,MOBt’s display spanned less than one-fourth the area covered by items in TMT, and MOBt’stargets occupied equidistant, consistent and well-separated locations. MOBt’s layout of itemscould also reduce age-related changes from visual clutter which older people find especiallytroublesome (Kline et al., 1992; Kosnik, Winslow, Kline, Rasinski, & Sekuler, 1988; Kosnik,Sekuler, & Kline, 1990; Sekuler & Ball, 1986).
It is also known that memory for spatial location declines with age (Newman &Kaszniak, 2000; Burton-Danner et al., 2001), and that encoding of location is obligatory,occurring even when such information is irrelevant to the goals of the current task (Hasher &Zacks, 1979). Because spatial memory of previously-seen item locations could direct andspeed search in TMT, individual differences in registering and retaining spatial informationcould produce individual differences in the speed and accuracy of TMT performance. MOBt
was designed to eliminate this confound. Two successive targets were never presented in thesame location. This greatly reduced the possibility that inhibition of return would affect theoutcome latencies (Bennett & Pratt, 2001). (Inhibition of return refers to the finding thatresponse times are typically slower for targets that appear at previously attended locationsthan for targets at novel locations.) Further, this control removed any effect of memory forspatial location with repeated presentations. However, this control also may have increasedthe working memory load in MOB. In TMT, while attempting to select the next item in asequence, a subject could see the last item chosen. By eliminating this potential externalreference, MOB forces subjects to retain the last item chosen in working memory, increasingthe load on working memory.
We also wanted to determine whether age-related differences in TMT performancearose from age-related changes in visual perception (Salthouse & Fristoe, 1995; Salthouse etal., 2000). Individual differences in one particular visual ability, contrast sensitivity, broadlyaffect visual perception (Sekuler & Sekuler, 2000), including the speed with which alphabeticcharacters are encoded (Groth, Gilmore, & Thomas, 2003). Because of well-documented age-related changes in contrast sensitivity (Higgins, Jaffe, Caruso, & deMonasterio, 1988;Owsley, Sekuler, & Siemsen, 1983), it seemed reasonable to hypothesize that some age-related changes in TMT might arise from age-related decreases in contrast sensitivity.
MOBt’s components allow for direct investigation of factors that might contribute toage-related changes in performance on the test. These putative factors include baselineresponse speed, executive function, contrast sensitivity, and familiarity with the task. MOBt
makes it possible to evaluate these factors while reducing the impact of other higher-order

Serial Behavior 6
cognitive functions, such as visual search or spatial memory.
METHODSParticipants
Fifteen young (11 female, 4 male, mean age= 20.4, SD=0.99, Range=18-22 years)and 15 older participants (5 female, 10 male, mean age = 74.9 SD=6.46, Range=68-92 years)served for pay. All were right handed, and none reported cognitive, visual, or motordeficiencies other than the need for corrective lenses. Each participant’s contrast sensitivitywas measured with the Pelli-Robson charts (Pelli, Robson, & Wilkins, 1988). Additionally,each participant’s Snellen distance acuity was measured with an Optec 2000 vision tester.The younger participants demonstrated better visual acuity (Range=20/18 - 20/100, M=20/17,SD=20/5.05) than the older participants (Range=20/17 - 20/50, M=20/28, SD=20/13.24).Contrast sensitivity was also better in the younger (Range=1.80-1.95, M=1.93, SD=0.053) ascompared to the older adults (Range=1.50-1.95, M=1.75, SD=0.15). (Note that the mean andstandard deviation for the younger subjects omits the acuity measure for one younger subjectwhose acuity, 20/100, appears to be an outlier.)
ProcedureParticipants were tested on each of MOBt’s four component tests, which were
presented in eight, randomized blocks. Testing was preceded by a computer-based tutorialand practice opportunities.
To evaluate contrast’s impact on performance, each of MOBt’s components was runwith all test items set to one of five different, logarithmically-spaced contrast levels, 0.14,0.23, 0.35, 0.59, and 0.96. Note that while the contrast of test items varied, the contrast of theeight squares was fixed at 0.96. This meant that although low contrasts might make targetsand distracter items more difficult to recognize, the surrounding, highly-visible squares madeit easy to localize items. Over eight blocks of tests, all of MOBt’s components were run fourtimes at the highest contrast, and once at each of the other four contrast levels.
For each participant, order of testing was randomized independently for variouscontrast levels and for various sub-tests. The extra replications at the highest contrastsenabled more detailed comparisons between the younger and older adults. Participants weretold to respond to each target as quickly as possible, bearing in mind that while accuracy wasimportant, speed was more important.
Test descriptionMOBt was comprised of four sub-tests: Speed control, Numbers only, Letters only,
and Numbers and Letters. Nineteen distinct display frames made up each sub-test. Eachsub-test was presented a total of 8 times. Four of these repetitions were conducted at highcontrast between the target and display. One additional presentation of each sub-test was alsocarried out at each of 4 additional, lower levels, of contrast. Thus the protocol consisted of 4sub-tests, each presented at 5 different levels of contrast. These manipulations produced atotal of 36 tests. To reduce fatigue, the tests were grouped into 8 blocks.
MOBt was implemented in Matlab (The Mathworks, Natick Massachusetts) on anApple iMac computer whose display had been fitted with a touch screen (Mass MultiMedia,Colorado Springs, Colorado). During testing, participants responded by touching a region onthe touch screen with the index finger of their preferred hand.
All of MOBt’s sub-tests shared the same visual format, which facilitated comparisonsamong the tests. This format comprised eight squares, spaced evenly around thecircumference of an imaginary circle. At the average viewing distance, 42 cm, the circle’sdiameter was 18.9 degrees visual angle. Eight squares, each 3.1 degrees, defined the locationswithin which test items were presented. The centers of neighboring squares were separated by

Serial Behavior 7
7.4 degrees. The display background was white (56 cd/m2), and unless otherwise indicated,squares, target and distracter items were high contrast, black (~0.3 cd/m2). The squares’consistent position and their high contrast were meant to aid visual search.
Nineteen successive display frames made up each of MOBt’s four sub-tests. A displayframe remained visible until the participant made the correct response on the touch screen.Then, with an imperceptible delay (< 2 msec), a new display frame replaced its predecessor.Each sub-test took approximately 30 seconds to complete. To minimize potentiallydisruptive transients (Yantis & Jonides, 1984), the monitor’s background luminance remainedconstant as one frame succeeded another.
In each of MOB’s component sub-tests, when a subject touched a square that did notcontain the target item, or touched some spot on the screen that was not in any of the squares,the computer immediately emitted a distinctive beep and highlighted the correct square, thatis the square that should have been touched. To highlight the correct item, the outline squarearound that correct item instantly tripled in thickness, a change that was highly visible. Afterthe correct item had been highlighted, the computer’s error correction routine prevented thepresentation of a new frame until the subject touched the correct square.
The following paragraphs give brief descriptions of MOBt’s four sub-tests. Figure 1shows sample displays for the first four frames for each sub-test. When looking over thesamples, it is important to keep in mind that every time a test was administered, thedistribution of items over the eight squares was randomized anew. As a result, the displaysactually presented were not identical to the samples in Figure 1.
<FIGURE 1>Speed Control test (SCt)
This sub-test assessed participants’ baseline response speed. As illustrated in Figure1A, a letter X was centered in one of the eight squares, chosen at random for each frame. Theparticipant had to touch anywhere in the square, or within 0.5 cm around the square. Becauseall other squares were empty, the lone target could be processed pre-attentively, that is, thetarget popped-out perceptually, eliminating the need for search or scrutiny (Treisman, 1988).
Numbers test (Nt)This sub-test, which is illustrated in Figure 1B, is analogous to Form A of TMT. On
display frame n, the numbers n to n+7 were presented, one inside each of the eight squares.On display frame n, the number n was the target, with the remaining seven numbers servingas distracters. The participant’s task on the nth frame was to touch the square that containedthe number n. In other words, on frame 1, the participant touched the square that contained 1,on frame 2, the participant touched the square that contained 2, etc. The distribution ofnumbers over the eight squares was randomized anew for each frame.
Letters test (Lt)This sub-test was like Nt, but substituted the letters A through S for the numbers 1
through 19 (see Figure 1C). Lt has no analogue in TMT; it provides a measure of the speedwith which letters could be ordered. As in Nt, the distribution of items over the eight squareswas randomized anew for each frame.
Numbers and Letters test (NLt)This sub-test was analogous to TMT’s Form B. As illustrated in Figure 1D, each
display frame comprised four letters and four numbers. From one display frame to the next,the target alternated between numbers and letters, that is 1, A, 2, B, 3, C, · · · I, 10. Accurateperformance is thought to require participants to switch between letters and numbers, andalso, as in Nt and Lt, to remember which letter or number came next in the target sequence.

Serial Behavior 8
General Characteristics of MOBt
In Nt , Lt, and NLt, once an item had been touched, that item and all accompanyingitems disappeared, and were replaced by the items for the next display frame. As a result,successive responses in all three of these tests required that participants remember which itemhad been most recently selected.
Within any display frame of Nt, Lt, or NLt, the non-target (distracter) items comprisedthe seven items that immediately followed the target in the appropriate sequence. Forexample, if 5 were the target on the fifth frame of an Nt sequence, the accompanyingdistracters would be 6 through 12. Similarly, on the third frame of a Lt series, C would be thetarget, and the accompanying distracters would be the letters D through J. Finally, in an NLt
series, when the target was C, it was accompanied by 4, D, 5, E, 6, F, and 7 as distracters.This was done to maintain comparability with TMT, where participants mark targets as theygo, and therefore no longer need to take account of such targets. However, unlike in TMTwhere physically marking “used” targets could reduce task difficulty as the test progressed bynarrowing the search possibilities, MOBt’s design makes for consistent levels of difficultythroughout a series.
The purpose of the current investigation was to address five main questionsthat arise from TMT. Our design of MOBt was meant to address these ongoing issues. First,although contrast sensitivity declines with advancing age we do not expect to find age-relatedswitching costs as a result of contrast sensitivity. Instead, we predict that contrast wouldhave to be greatly reduced before it would affect outcome performance. Second, based onthe TMT literature with older adults we predict that older adults will show a greater costassociated with switching between letters and numbers. As part of this increased cost, olderadults will show an increased tendency to perseverate, failing to switch between letter andnumber series. Third, rather than switching between letters and numbers during the NLt wewould predict that, at least early in the alphabet (with over-learned item pairs) subjects willrecall a number and its paired letter (e.g., 1-A, 2-B) as a single unit. This will result in achunking of items such that the latency to respond to the first item in the pair is greater thanthe latency to respond to the second item in the pair. Fourth, the difficulty of switchingbetween letters and numbers as measured by latency in MOB should vary over the number-letter series (differential familiarity and practice with order information early as compared tolate in the alphabet). Finally, we expect that practice will differentially affect various testsubcomponents. In particular, as task difficulty increases (SCt-Nt-Lt-NLt), we expect that theeffect of practice would increase. In the following section, the organization of results followsthe order of hypotheses presented here.
RESULTS & DISCUSSIONRelatively few responses were errors. For young participants, 2.1% of total responses
were errors and for the older participants, 4.7% of their responses were errors. A responsethat immediately followed an error was almost always correct, but tended to have anabnormally long latency. As a result, we eliminated from our analysis all response timesassociated with errors, as well as response times immediately following an error. Our mainmeasure of each participant’s performance was the mean response time per display frame,excluding (i) responses on which the participant made an error, and (ii) responses to the nexttarget in the series. These latencies are presented both as times averaged across each sub-test(average RT across all display frames) and as the averaged times for each serial position(averaged across repetition of each sub-test).

Serial Behavior 9
Overall effectsFigure 2 shows results from tests with the highest contrast targets and distracters. The
overall difference in times for older and young participants, which averaged more than half asecond per response, was significant F (1, 28)=90.37, p < .01; on every sub-test, youngerparticipants’ responses were faster than the responses of their older counterparts. Second,there was an overall interaction between age and type of sub-test, with older adults beingespecially slowed on NLt, F (3,84)=23.85, p<.01. In addition, for both age groups,performance on SCt was significantly faster than for any other test (p < .01); performance onNLt was significantly slower than for any other test (p < .01). Performance on Nt and on Lt
did not differ significantly from each other (p < .05).<FIGURE 2>
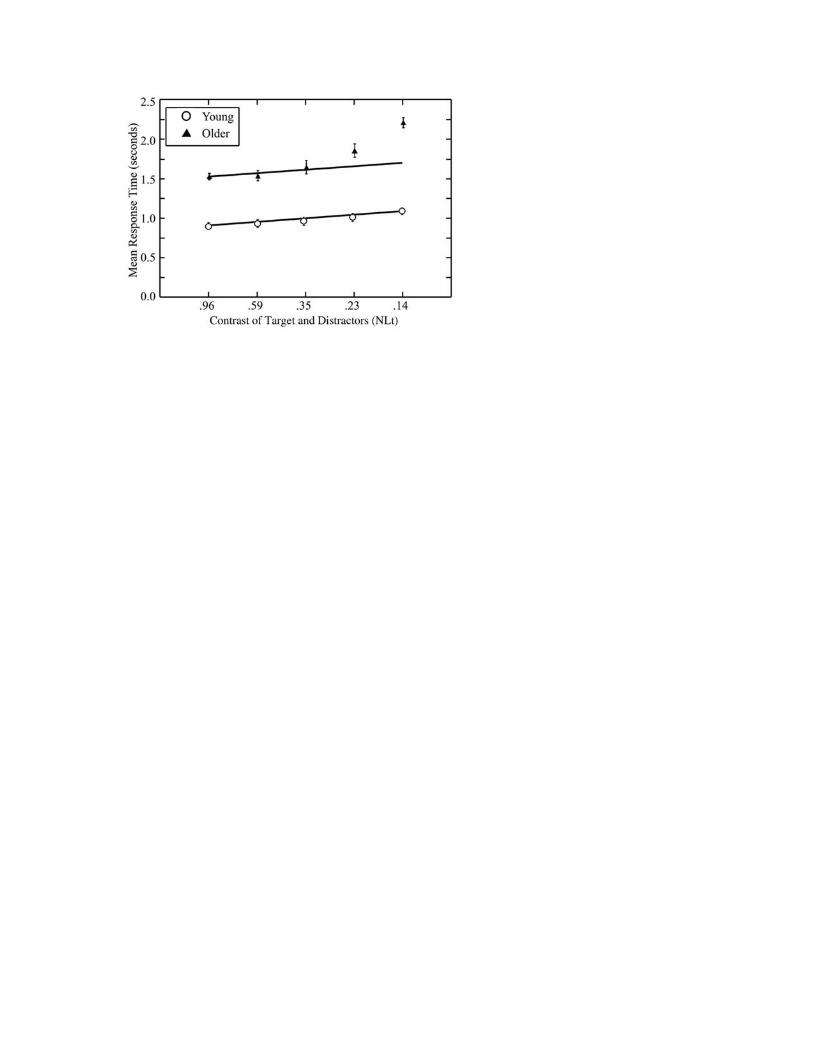
Contrast sensitivityThe effect of contrast variation does not notably differ among MOBt’s sub-tests, for
either young or older adults, F (12, 336) = 1.318, p > 0.20. As Figure 3 shows, contrastvariation has little effect until extremely low contrast values are reached. Young and olderparticipants’ mean response times as a function of the test items’ contrast, averaged overMOBt’s four sub-tests are presented in Figure 3. The results show that the overall meanresponse times increase with decreasing contrast, F (4, 112) = 33.98, p < .01. Moreover,contrast’s effect on older participants’ performance was considerably more powerful than itseffect on young participants’ performance, F (4, 112) = 12.14, p < .01.
<FIGURE 3>As a first step to evaluating age-related consequences of contrast variation, we used a
least squares criterion to find the line that best fit the young participants’ results (r2 =0.93).This line is drawn through the young participants’ data in Figure 3 for NLt only. That samebest-fitting line has been drawn also through the older participants’ data, but has been shiftedvertically by 0.63 seconds, which is the difference between the two groups’ mean times at thehighest contrast. If the difference between groups were entirely explained by their relativeresponse times at the highest contrast, all of the older participants’ mean response timeswould be well represented by this vertically shifted best-fitting line. Although the shiftedbest-fitting line adequately captures older participants’ data at the three highest contrasts, ascontrast decreases further, the data increasingly deviate from the line. This divergencesignifies that older participants’ response times are slowed more by very low contrast than arethe response times of their young counterparts.
The divergence just described suggests also that age-related differences on MOBt
cannot be explained by the modest difference between the two groups’ contrast sensitivity(see Participants). As expected, young and older participants differed in contrast sensitivity(Higgins et al., 1988; Owsley et al., 1983). Young participants’ mean contrast sensitivity was1.93; older participants’ mean contrast sensitivity was only 1.76. This difference of 0.17 log10
units means, on average, the older participants needed 48% more contrast to detect visualtargets (e.g., log10 1.48 = 0.17). As a result, age-related differences in contrast sensitivitycould be compensated for if older participants were given test items whose contrast was 48%higher than items presented to young participants. Figure 3 shows that this compensationwould fall far short of equating older and young participants’ performance on MOBt. In fact,a single step along the horizontal axis, from a contrast 0.96 to 0.59, represents a change incontrast (63%) larger than the age-related difference in contrast sensitivity. This supports theproposition that reduced contrast threshold cannot account for older participants’ slowedperformance on MOBt.
Analysis of errorsAll errors can be put into one of two categories. For all groups of participants and all

Serial Behavior 10
sub-tests (except the NLt), the most common errors were motor errors, in which theparticipant either touched the screen outside of any target location, or touched the same boxtwice in rapid succession (typically between 10 and 90 msec), suggesting that the fingermade, broke, and then quickly re-made contact with the screen. These errors have little to dowith cognitive function. Non-motor errors occurred when participants lost their way, eitherwithin a series of like items, for example, touching the number 7 when they should havetouched the number 5, or between series of different types of items, for example, touching aletter when they should have touched a number.
In Figure 4, motor and non-motor errors are displayed separately for each of the foursub-tests. Note that the only types of errors possible in the SCt were motor errors. Also, thenon-motor errors (other errors) in Figure 4 for both the Nt and Lt only represent within-serieserrors, whereas the non-motor errors for NLt are a composite of both within and betweenseries errors. On average, older participants made more errors than did young participants,and non-motor errors were relatively more frequent in NLt than in other sub-tests.
<FIGURE 4>As indicated above, two distinct types of mistakes comprised non-motor errors. The
first type involves within-category errors (even numbered display frames), which occur whenparticipants choose an incorrect target that is in the same category as the correct target (forexample, choosing the wrong number when the target was a number, or choosing the wrongletter when the target was a letter). The second type of non-motor error, Between-categoryerrors (odd numbered display frames), occurred with the choice of a target that is in adifferent category from the correct target (for example, choosing a letter when the target wasa number, or vice versa).
<FIGURE 5>Figure 5 shows the relative distributions of non-motor errors over the seven non-
targets (distracters) that shared the display frame with the target item for NLt. Thedistributions of these errors have been normalized for both younger and older adults. Notethat one particular ordinal position attracted more wrong choices than other positions did. Theconsistent predominance of errors at n+2 is evidence of perseveration. Such errors arosewhen participants neglected to switch tasks when choosing a target, mistakenly selecting thenext letter (when the previous target had been a letter), or the next number (when theprevious target had been a number). Interestingly, younger participants made only about halfas many errors overall as older participants, including errors of perseveration, failures toswitch tasks. Despite this substantial age-related difference in overall perseveration rates,Figure 5 shows that both groups showed the same relative propensity to perseverate.
Inter-response times (IRTs) and response burstingWhen participants attempt to recall a series of items, inter-response times (IRTs)
provide valuable clues to the way in which recalled items were stored in memory. Forexample, the pattern of IRTs may reveal clustering or chunking of items in memory (Kahana& Loftus, 1999). Successive items from a shared category tend to be recalled with shorterIRTs than items from different categories (Wingfield et al., 1998). This phenomenon,sometimes called response bursting, is not limited to free recall with verbal material; similarbursting, for example, is seen in the timing of successive moves through a previously learned,complex virtual environment (Kirschen, Kahana, Sekuler, & Burack, 2000) and in othersettings as well.
To examine the pattern of IRTs in MOBt, data from NLt were sorted according to thetarget’s serial position within the 19-item sequence of numbers and letters, where "1"occupied the first position, "A" the second, "2" the third, "B" the fourth, and so on. Figure 6shows participants’ mean response time for each of the 19 target items in NLt, from 1, A, 2, ·
Serial Behavior 11
· ·10. To facilitate comparisons between young and older participants, response times werenormalized by setting each group’s mean time to unity. Thus, in Figure 6, the value 1.2signifies a response time 20% above the series’ mean time. This analysis used data only withtargets of the highest contrast.
<FIGURE 6>The curves in Figure 6 exhibit several interesting features. First, response times
tended to be relatively short at the sequence’s start, and lengthen progressively throughout theseries. On average, relative response times change by about 50% over the course of the series.This slowing of response cannot be attributed to simple fatigue because no such slowing wasseen with sub-tests other than NLt. Instead, we believe that it reflects the additional cognitiveload imposed by switching operations unique to this sub-test.
Prior to testing, participants were already well familiar with letter series and numberseries, but when they had to shift back and forth between the two series a relativelyunfamiliar skill was required: participants had to track simultaneously targets drawn from twoseparate series. This additional challenge may be responsible for a second noteworthy featurein Figure 6, the distinct up-and-down, scalloping pattern in the middle portion of each curve.Note that responses for most of the letter target items are faster than they are for theimmediately preceding or immediately following number targets. These systematic swings inresponse time comprise about 10-20% of the total scaled times. We believe that thisscalloping shows that some pairs in NLt were encoded and retrieved as single combineditems, for example, “3-C,” “4-D,” and so on as opposed to switching between tasks, althoughthe task was presented in a serial, rather than parallel fashion. Note that this strategy, impliedby the pattern of inter-response times, is quite different from the usual depiction of the taskon Form B of TMT which is one of holding two streams of information in parallel andswitching between the two streams to complete the task. This result may require some re-thinking of how TMT-B’s task and results are conceptualized.
PracticeThe effects of multiple administrations were examined for both age groups. Each
subtest was presented 4 times across the experimental session. The presentation order for thesubtests was randomized so that the actual time between repetitions of any one subtest varied.Practice had no overall effect for either the young or the older adults for Nt and Lt. And theoverall effects of age were not significantly affected by multiple administrations, F(3,84)=2.429, p=.07. However, practice produced a significant, but small reduction inresponse times for the motor baseline (SCt; F(3,84)=3.159, p=.029), and exerted a moresubstantial effect on NLt (F(3,84)=11.517, p<.01). In fact, as Figure 7 suggests, by the fourthrepetition of that condition, performance on NLt has become very nearly as fast asperformance on either Nt or Lt for the younger adults and is greatly reduced for the olderadults. Although additional data would be required to establish this point with certainty, wehypothesize that practice with NLt allows participants to chunk additional pairs of responses(see Figure 6). This reduces the need to switch, making NLt’s series of targets more similar tothe well-learned series in Nt and Lt.
<FIGURE 7>Additive factors analysis
We took a simple additive factors approach to characterize executive function’scontribution to performance with NLt, (Sternberg, 1999). This approach seeks to describesome overall effect as a sum of the effects associated with several separable factors. Althoughindividual factor effects can be linear, quadratic, or higher order, cross product terms(interactions) involving two or more factors are assumed to be zero. We took this simpleapproach because it promised to account for the results with few free parameters. In addition,
Serial Behavior 12
this approach makes it easy to detect errors in predictions, which would be diagnostic of non-zero interactions that had been overlooked. The analysis rests on two assumptions.
1. The visual and motor operations demanded by SCt contribute equally to each ofMOBt’s three other tests. The time required by these operations can therefore be subtractedfrom the performance times of each of the other tests, leaving higher order cognitiveprocesses as a residual.
2. NLt includes the ordering or sequencing operations required by Nt and Lt but alsorecruits executive processes, which shift from one sequence to the other, and back.
These two assumptions lead to a simple quantitative account of the components ofresponse times in NLt. The average response time in NLt,
€
NLt , can be described as
€
NLt = SCt + 0.5 • Lt − SCt( ) + Nt − SCt( )[ ] + Exec [Eq.1]
Equation 1 assumes that each response time in NLt comprises, in addition to theunique cognitive demands posed by NLt, whatever time is required by SCt, 1/2 of the meanresponse time in Lt (because NLt presents only the letters A-I, but Lt uses twice as many), and1/2 of the mean response time in Nt (because NLt presents only the numbers 1-10, but Nt usestwice as many, 1-19). The time required by SCt was subtracted from each of the two othertests because that time had already been represented, by the first term in Equation 1. Theremaining term in Equation 1 represents NLt’s unique executive component.
Because of the near equality of times associated with Lt and Nt, and because Ntincludes all times associated with SCt, the terms in Equation 1 can be rearranged andsimplified to
€
Exec = NLt − Nt [Eq. 2]To facilitate comparisons among groups, we normalized Equation 1’s components
within each age group, expressing each as a percent of the total time in NLt. Table 1 showsthat the largest fraction of response times in NLt, from 39 to 44%, is consumed by simplevisual detection and execution of motor responses. Number and letter ordering and recall (theNt and Lt components) take up nearly equal fractions of response times for both groups. Mostinteresting is the suggestion that executive operations account for a small, consistent fractionof the response time in young participants (mean =17%, standard error = 1.9%), but aconsiderably larger fraction, (mean = 29%, standard error = 2.4%) with older participants.(The results in Figure 7 suggest that executive function’s contribution to NLt may diminishwith practice for both young and older adults. For the sake of simplicity, our model does notinclude such practice effects.)
<TABLE 1>Considering the relative age-related increases in reaction times, NLt’s unique
component increases far more than the visuomotor component or the components required toorder numbers or letters. The additive factors analysis confirms the idea that age bringsparticular changes in cognitive processes unique to NLt.
GENERAL DISCUSSIONIn addition to remediating various deficiencies in TMT, MOBt was meant to separate
component processes that likely contribute to performance on TMT. Although olderparticipants were slowed by reduced item contrast, contrast sensitivity differences cannotaccount for the significant age-related differences in performance on MOBt, or presumably,in TMT.
MOBt successfully isolated a distinct executive function component of reaction time,and implicated this component in the age-related differences in performance on MOBt (and

Serial Behavior 13
presumably, on TMT). This result appears to be inconsistent with the idea that age-relatedchanges in TMT and variants of that test arise from perceptual slowing, not from an alterationin efficiency of executive function. The results also showed that this executive componentwas reduced with practice. We hypothesize that this reduction resulted from the replacementof switching operations with learned encoding and retrieval of chunked letter-number pairs,as reflected in Figure 6.
Although our study used variants of TMT rather than TMT itself, our results haveimportant implications for that widely-used test. MOBt’s incorporation of an automated errordetection and correction scheme offers one example of such implications. Although errors onMOBt were not common (<5%), we believe it is valuable to have a consistent method thatimmediately detects any error, guides the participant to the correct response, and then makesappropriate adjustments to the resulting data. These important functions are missing fromTMT, as well as a recent update of that test (Delis, Kaplan, & Kramer, 2001). In MOBt
participants have unusually long latencies not only when they make an error, but on the nextcorrect response as well. If times associated with errors and times associated withimmediately succeeding, correct response were included in participants’ scores, those scoreswould spuriously exaggerate the difference between performance on TMT-A and TMT-B.Moreover, failure to censor data appropriately would generally produce an overestimate ofthe real magnitude of age-related differences in executive function. Because we have nottested other groups of participants that typically show abnormally large differences betweenTMT-A and TMT-B, we cannot say whether the same caveat would apply to them. However,this is a concern that should be borne in mind whenever TMT or related tests areadministered.
Although failure to identify and censor error-related responses may exaggerate thereal size of differences attributed to executive function, another factor may work in theopposite direction, causing such differences to be underestimated. Because MOBt capturesand analyzes individual responses, we could examine changes in performance on NLt acrossits entire series of test items. As Figure 6 shows, response times with NLt increasesystematically from the test series’ beginning (e.g., 1-A, 2-B) to its end (e.g., 9-I, 10-J).Because performance with Nt or Lt showed no such variation, differences between NLt, onone hand, and Nt and Lt, on the other hand, would be smallest early in the NLt series, andincrease thereafter. Because well-learned items, early in the series, extract only a modest costin switching between numbers and letters, TMT-B’s single aggregate score will includecomponent responses that are relatively quick (near the series’ start) and responses that arerelatively show (from the series’ end).
Throughout, we have adhered to a narrow definition of executive function, restrictingthe term to signify planning of actions and switching between tasks. Current models,however, tend to fractionate executive control into additional independent subprocesses (e. g.,Shallice, 2002), including subprocesses responsible for the ability detect and correct one’serrors. MOBt identifies and separates erroneous responses, but at the same time, MOBt’sautomated error handling routine eases the burden on participants to spot and then correcttheir own errors. As a result, the test does not allow full expression of individual differencesin executive processes that are specifically associated with error detection and correction.We believe that this potential drawback is more than compensated by the methodological andanalytical benefits from MOBt’s standardized error-handling procedure.
As noted earlier, one reason for TMT’s popularity is its ability to reflect changes inthe efficiency of executive function. There is growing consensus that several aspects ofexecutive function depend crucially upon prefrontal cortex (Shallice, 2002). Consistent withthis idea, Stuss and colleagues (2001) found that focal damage to the frontal lobe, particularly

Serial Behavior 14
damage to dorsolateral frontal areas, degrades performance on TMT Form B. (However, seeAnderson, Bigler & Blatter, 1995). Recent magnetic resonance studies have shown thatperformance on TMT’s form B, relative to form A, is strongly correlated with incidence ofwhite matter hyperintensities (Takahashi, Murata, Omori, Kosaka, Takahashi, Yonekura, &Wada, 2004), and more generally with decreases in cerebral volume (Coffey, Ratcliff,Saxton, Bryan, Fried, Lucke, 2001), which commonly accompany aging. We believe thatfuture research on structural correlates could benefit by using MOB as an index of executivefunction. The present study suggests that MOB’s item by item analysis would not onlyenable a more fine-grained picture of overall executive function, but also that MOB’s subtestswould enable the isolation and analysis of several subcomponents of that overall function.
Earlier, we commented on some attempts to update and improve TMT (Salthouse &Fristoe, 1995; Salthouse et al., 2000). Here, it is worth noting one other effort, which hasproduced a modified paper-and-pencil version of TMT. A new test battery by Delis, Kaplanand Kramer (2001), which is meant to assess executive function, includes an expandedversion of TMT. Their version provides separate tests of baseline motor speed and visualscanning. However, the paper-and-pencil format forecloses any chance of recording andanalyzing individual responses, whose importance is amply demonstrated by our results.
Finally, we look on MOBt as a promising, advanced prototype, rather than a finishedproduct. However promising the present results may be, MOBt must be validated with largersamples of other participants including participants of all ages, socioeconomic status, andeducational background must be examined. Additionally, the efficacy of using such ameasure in a clinical setting, for example, ease of scoring and interpretation, would have tobe examined directly. Whatever final form the test may take, we believe that the presentresults clearly demonstrate the importance of collecting and then analyzing individualresponse times and errors.

Serial Behavior 15
ACKNOWLEDGEMENTSWe thank Kelly Addis and Arye Elfenboim for contributions at the start of this project, andJon Peelle and Alice Cronin-Golomb for helpful comments on an early version of this report.Partially supported by NIH grant AG-04517. Address correspondence to R. Sekuler, VolenCenter, Brandeis University, MS 013, Waltham MA 02454 (e-mail: vision brandeis.edu).

Serial Behavior 16
REFERENCESAraujo, C., Kowler, E., & Pavel, M. (2001). Eye movements during visual search: the costs
of choosing the optimal path. Vision Research, 41 (25-26), 3613-3625.Arbuthnott, K. & Frank, J. (2000) Trail making test, Part B as a measure of executive control:
Validation using a set-switching paradigm. Journal of Clinical and ExperimentalNeuropsychology, 22, 518-528.
Anderson, C.V., Bigler, E.D., & Blatter, D.D. (1995). Frontal lobe lesions, diffuse damage,and neuropsychological functioning in traumatic brain-injured patients. Journal ofClinical and Experimental Neuropsychology, 17(6), 900-908.
Bennett, P. J., & Pratt, J. (2001). The spatial distribution of inhibition of return.Psychological Science, 12 (1), 76-80.
Burton-Danner, K., Owsley, C., & Jackson, G. (2001). Aging and feature search: the effect ofsearch area. Experimental Aging Research, 27 (1), 1-18.
Chun, M. M., & Jiang, Y. (1998). Contextual cueing: implicit learning and memory of visualcontext guides spatial attention. Cognitive Psychology, 36 (1), 28-71.
Coffey, C.E., Ratcliff, G., Saxton, J.A., Bryan R.N., Fried, L.P., & Lucke, J.F. (2001).Cognitive correlates of human brain aging: a quantitative magnetic resonance imaginginvestigation. Journal of Neuropsychiatry and Clinical Neuroscience, 13(4), 471-485.
Cowell, P. E., Turetsky, B. I., Gur, R. C., Grossman, R. I., Shtasel, D. L., & Gur, R. E.(1994). Sex differences in aging of the human frontal and temporal lobes. Journal ofNeuroscience, 14 (8), 4748-4755.
Crowe, S. F. (1998). The differential contribution of mental tracking, cognitive flexibility,visual search, and motor speed to performance on parts a and b of the trail making test.Journal of Clinical Psychology, 54 (5), 585-591.
Davies, D. M., Spelman, M. S., & Davies, M. G. (1981). Combining psychometric data onbrain damage and the influence of aging. Perceptual & Motor Skills, 52 (2), 583-592.
Delis, D.C., Kaplan, E., & Kramer, J.H. (2001). D-KEFS: Delis Kaplan Executive FunctionSystem. San Antonio: The Psychological Corporation.
Drane, D. L., Yuspeh, R. L., Huthwaite, J. S., & Klingler, L. K. (2002). Demographiccharacteristics and normative observations for derived trail making test indices.Neuropsychiatry, Neuropsychology & Behavioral Neurology, 15 (1), 39-43.
Duncan, J. (1986). Disorganization of behavior after frontal-lobe damage. CognitiveNeuropsychology, 3, 271-290.
Ehrenstein, W. H., Heister, G., & Cohen, R. (1982). Trail making test and visual search.Archiv fur Psychiatrie und Nervenkrankheit, 231 (4), 333-8.
Filley, C.M. (2000). Clinical neurology and executive dysfunction. Seminars in Speech andLanguage, 21(2), 95-108.
Gaudino, E. A., Geisler, M. W., & Squires, N. K. (1995). Construct validity in the trailmaking test: what makes Part B harder? Journal of Clinical and ExperimentalNeuropsychology, 17 (4), 529-35.
Groth, K., Gilmore, G. C., & Thomas, C. (2003). Impact of stimulus integrity on agedifferences in letter matching. Experimental Aging Research, 29 (2), 155-172.
Gunning-Dixon, F. M., & Raz, N. (2000). The cognitive correlates of white matterabnormalities in normal aging: a quantitative review. Neuropsychology, 14 (2), 224-232.
Hasher, L., Stoltzfus, E. R., Zacks, R. T., & Rypma, B. (1991). Age and inhibition. Journal ofExperimental Psychology: Learning, Memory & Cognition, 17 (1), 163-169.
Hasher, L., & Zacks, R. T. (1979). Automatic and effortful processes in memory. Journal ofExperimental Psychology: General, 108, 356-358.
Serial Behavior 17
Hasher, L., & Zacks, R. T. (1988). Working memory, comprehension, and aging: A reviewand a new view. In G. H. Bower (Ed.), The psychology of learning and motivation (Vol.22, p. 193-225). New York: Academic Press.
Hays, J. R. (1995). Trail making test norms for psychiatric patients. Perceptual & MotorSkills, 80 (1), 187-94.
Higgins, K. E., Jaffe, M. J., Caruso, R. C., & deMonasterio, F. M. (1988). Spatial contrastsensitivity: effects of age, test-retest, and psychophysical method. Journal of theOptical Society of America, A, 5 (12), 2173-80.
Kahana, M., & Loftus, G. (1999). Response time versus accuracy in human memory. In R. J.Sternberg (Ed.), The nature of cognition (p. 322-384). Cambridge: MIT Press.
Kirschen, M. P., Kahana, M. J., Sekuler, R., & Burack, B. (2000). Optic flow helps humanslearn to navigate through synthetic environments. Perception, 29 (7), 801-818.
Kline, D. W., Kline, T. J., Fozard, J. L., Kosnik, W., Schieber, F., & Sekuler, R. (1992).Vision, aging, and driving: the problems of older drivers. Journal of Gerontology, 47(1), P27-P34.
Kosnik, W., Winslow, L., Kline, D., Rasinski, K., & Sekuler, R. (1988). Visual changes indaily life throughout adulthood. Journal of Gerontology, 43 (3), P63-P70.
Kosnik, W. D., Sekuler, R., & Kline, D. W. (1990). Self-reported visual problems of olderdrivers. Human Factors, 32 (5), 597-608.
Kramer, A. F., & Atchley, P. (2000). Age-related effects in the marking of old objects invisual search. Psychology & Aging, 15 (June), 286-296.
Meyer, D. E., & Kieras, D. E. (1997). Epic: A computational theory of executive cognitiveprocesses and multiple-task performance: Part 1. Basic mechanisms. PsychologicalReview, 104, 3-65.
Monsell, S. (2003). Task switching. Trends in Cognitive Sciences, 7, 134-140.Monsell, S., Sumner, P., & Waters, H. (2003). Task-set reconfiguration with predictable and
unpredictable task switches. Memory & Cognition, 31 (3), 327-342.Musen, G., & Treisman, A. (1990). Implicit and explicit memory for visual patterns. Journal
of Experimental Psychology: Learning, Memory & Cognition, 16 (1), 127-137.Newman, M. C., & Kaszniak, A. W. (2000). Spatial memory and aging: Performance on a
human analog of the Morris water maze. Aging, Neuropsychology, & Cognition, 7 (2),86-93.
Norman, D. A., & Shallice, T. (1986). Attention to action: Willed and automatic control ofbehavior. In R. J. Davidson, G. E. Schwartz, & D. Shapiro (Eds.), Consciousness andself-regulation (p. 1-18). Plenum Press.
Owsley, C., Sekuler, R., & Siemsen, D. (1983). Contrast sensitivity throughout adulthood.Vision Research, 23 (7), 689-99.
Pelli, D. G., Robson, J. G., & Wilkins, A. J. (1988). The design of a new letter chart formeasuring contrast sensitivity. Clinical Vision Sciences, 2, 187-199.
Plude, D. J., & Hoyer, W. J. (1981). Adult age differences in visual search as a function ofstimulus mapping and processing load. Journal of Gerontology, 36 (5), 598-604.
Plude, D. J., & Hoyer, W. J. (1986). Age and the selectivity of visual information processing.Psychology & Aging, 1 (1), 4-10.
Reitan, R. M. (1958). Validity of the trail making test as an indicator of organic braindamage. Perceptual & Motor Skills, 8, 271-276.
Richardson, D. C., & Spivey, J. M. (2000). Representation, space and Hollywood squares:Looking at things that aren’t there anymore. Cognition, 76 (3), 269-295.
Salthouse, T. A. (1993). Attentional blocks are not responsible for age-related slowing.Journal of Gerontology, 48 (6), P263-P270.

Serial Behavior 18
Salthouse, T. A., & Fristoe, N. M. (1995). Process analysis of adult age effects on a computeradministered trail making test. Neuropsychology, 9 (4), 518-528.
Salthouse, T. A., Toth, J., Daniels, K., Parks, C., Pak, R., Wolbrette, M., & Hocking, K. J.(2000). Effects of aging on efficiency of task switching in a variant of the trail makingtest. Neuropsychology, 14 (1), 102-111.
Sekuler, R., & Ball, K. (1986). Visual localization: Age and practice. Journal of the OpticalSociety of America, A, 3 (6), 864-867.
Sekuler, R., & Sekuler, A. B. (2000). Visual perception and cognition. In J. G. Evans, T. F.Williams, J.-P. Beattie, B Land Michel, & G. K. Wilcock (Eds.), Oxford textbook ofgeriatric medicine (2 ed., p. 874-880). New York: Oxford.
Shallice, T. (1994) Multiple levels of control processes. In: C. Umilta & M. Moscovitch(Eds.) Attention and performance 15: Conscious and nonconscious informationprocessing (p. 395-420), Cambridge, MA: The MIT Press.
Shallice, T (2002) Fractionation of the supervisory system. In D. T. Stuss, & Knight, R. T.(Eds.), Principles of frontal lobe function (p.261-277), London : Oxford UniversityPress.
Spreen, O., & Strauss, E. (1998). A compendium of neuropsychological tests: administration,norms, and commentary. New York: Oxford University Press.
Sternberg, S. (1999). Discovering mental processing stages: The method of additive factors.In D. Scarborough & S. Sternberg (Eds.), An invitation to cognitive science (p. 703-786). New York: Oxford University Press.
Stuss, D.T., Bisschop, S. M., Alexander, M.P., Levine, B., Katz, D., & Izukawa, D. (2001).The Trail Making Test: a study in focal lesion patients. Psychological Assessment,13(2), 230-239.
Takahashi, T., Murata, T., Omori, M., Kosaka, H., Takahashi, K., Yonekura, Y., & Wada, Y.(2004). Quantitative evaluation of age-related white matter microstructural changeson MRI by multifractal analysis. Journal of Neurological Science, 225(1-2),33-37.
Treisman, A. (1988). Features and objects: the fourteenth Bartlett memorial lecture.Quarterly Journal of Experimental Psychology, 40A(2), 201-237.
Wingfield, A., Lindfield, K. C., & Kahana, M. J. (1998). Adult age differences in thetemporal characteristics of category free recall. Psychology & Aging, 13 (2), 256-266.
Yantis, S., & Jonides, J. (1984). Abrupt visual onsets and selective attention: evidence fromvisual search. Journal of Experimental Psychology: Human Perception & Performance,10 (5), 601-621.

Serial Behavior 19
TABLE & FIGURE CAPTIONSTable 1: Additive factors estimated for both younger and older adults.
Figure 1. Samples of four display frames for each of MOBt’s four sub-tests.
Figure 2. Mean response times for various sub-tests in MOBt for both younger and older
adults are presented for tests run at the highest contrast.
Figure 3. Mean response times as a function of stimulus contrast for young (lower symbols
and line) and older (upper symbols and line) participants. Results have been averaged over
all of MOBt‘s sub-tests. The least-squares fit for young participants is drawn through that
group’s data points; a second line for the older adults, with the same slope, but shifted
upwards by 0.63 seconds is also shown.
Figure 4. Percent of trials on which an error was made. Results are shown separately for
each of MOBt’s sub-tests.
Figure 5. Proportion of erroneous choices of various items in an NLt display frame. The
horizontal line at a proportion of 0.14 indicates the values expected if errors were uniformly
distributed across a display frame’s seven items.
Figure 6. Normalized response time as a function of target position in NLt series. Separate
curves are shown for young participants and for older participants.
Figure 7. Mean response times as a function of practice for various sub-tests in MOBt.
Results are shown for each of the 4 repetitions at the highest contrast. Panel A: results from
young participants; Panel B: results from older participants.

Subtest Unique Factor as a Percent of Total Time in NLt
SCt Nt Lt NLt
Young Adults 43 21 19 17Older Adults 39 16 16 29


![The Chanticleer [serial]](https://static.fdokumen.com/doc/165x107/632863a3051fac18490eb46f/the-chanticleer-serial.jpg)


![Yackety yack [serial]](https://static.fdokumen.com/doc/165x107/6328fdedcedd78c2b50e548e/yackety-yack-serial.jpg)