Flee, Fight or Fix: Managing Interpersonal Conflict - Gestalt ...
Upload
khangminh22Category
view
7download
0
For comments, suggestions or further inquiries please contact:
Philippine Institute for Development StudiesSurian sa mga Pag-aaral Pangkaunlaran ng Pilipinas
The PIDS Discussion Paper Seriesconstitutes studies that are preliminary andsubject to further revisions. They are be-ing circulated in a limited number of cop-ies only for purposes of soliciting com-ments and suggestions for further refine-ments. The studies under the Series areunedited and unreviewed.
The views and opinions expressedare those of the author(s) and do not neces-sarily reflect those of the Institute.
Not for quotation without permissionfrom the author(s) and the Institute.
DISCUSSION PAPER SERIES NO. 2004-48
An Initial Verdict on Our FightAgainst Poverty
Celia M. Reyes
December 2004
The Research Information Staff, Philippine Institute for Development Studies3rd Floor, NEDA sa Makati Building, 106 Amorsolo Street, Legaspi Village, Makati City, PhilippinesTel Nos: 8924059 and 8935705; Fax No: 8939589; E-mail: [email protected]
Or visit our website at http://www.pids.gov.ph
Celia M. Reyes
2004
This paper has been prepared with financial support from the Canadian
International Development Agency.
AN INITIAL VERDICT ON OUR FIGHT
AGAINST POVERTY
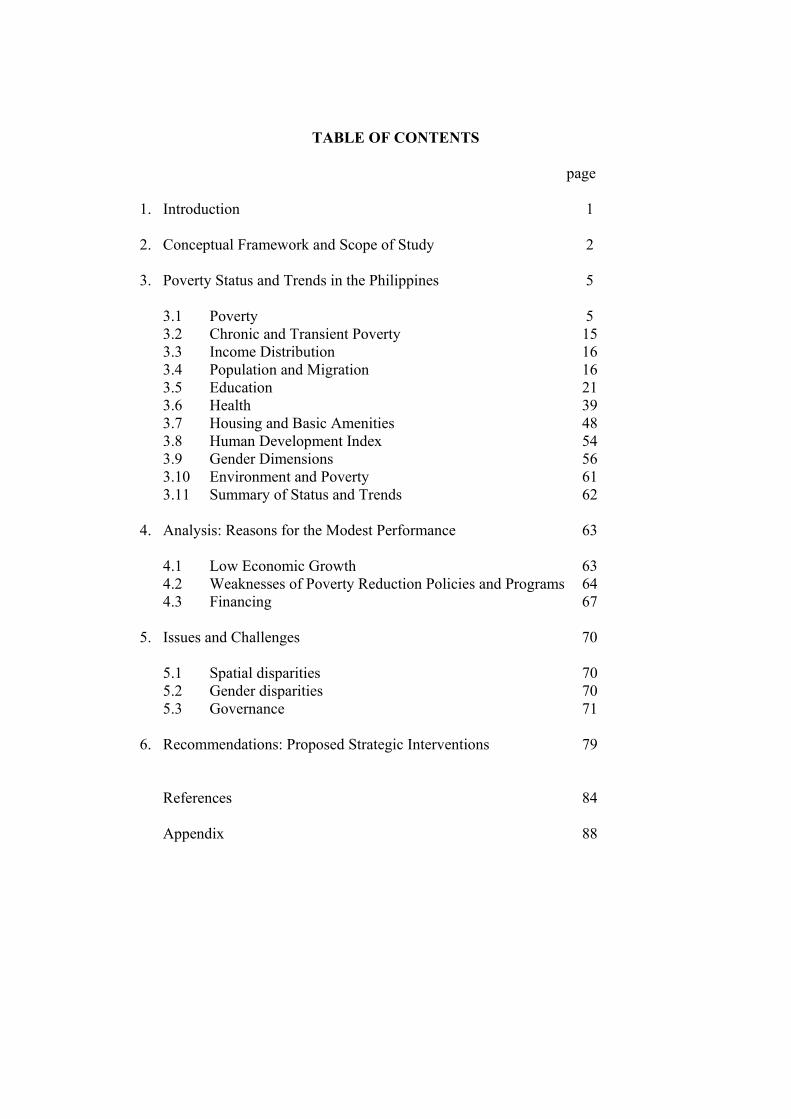
TABLE OF CONTENTS page
1. Introduction 1
2. Conceptual Framework and Scope of Study 2
3. Poverty Status and Trends in the Philippines 5
3.1 Poverty 5 3.2 Chronic and Transient Poverty 15 3.3 Income Distribution 16 3.4 Population and Migration 16 3.5 Education 21 3.6 Health 39 3.7 Housing and Basic Amenities 48 3.8 Human Development Index 54 3.9 Gender Dimensions 56 3.10 Environment and Poverty 61 3.11 Summary of Status and Trends 62
4. Analysis: Reasons for the Modest Performance 63
4.1 Low Economic Growth 63 4.2 Weaknesses of Poverty Reduction Policies and Programs 64 4.3 Financing 67
5. Issues and Challenges 70
5.1 Spatial disparities 70 5.2 Gender disparities 70 5.3 Governance 71
6. Recommendations: Proposed Strategic Interventions 79 References 84 Appendix 88
LIST OF TABLES
1 List of Provinces as of December 2002 2 Poverty Incidence Among Filipino Families, 1985-2000 3 Proportion of Population Below Poverty and Subsistence Thresholds, 1985 &
2000 (In Percent) 4 Number of Poor Families by Island Group, 2000 5 Decile Dispersion Ratio, 1985-2000 6 Gini Coefficient Ratios, 1985-2000 7 Poverty Incidence by size of family 8 Net Migration Rate by Region and Sex, 1985-1990 9 Elementary Participation Rate, by Sex 10 Secondary Participation Rate, by Sex 11 Elementary Cohort Survival Rate, by Sex 12 Secondary Cohort Survival Rate, by Sex 13 Dropout Rates, Elementary Level Philippines 14 Dropout Rates, Secondary Level Philippines 15 Dropout Rates By Sex, In Percent Both Private and Public 16 Enrolment in the Technical and Vocational Education and Training Sector, 2001
& 2002 17 Number of Madaris and Enrolment in Mindanao, 1997 18 Human Development Index: Philippines’ Rank 19 Human Development Index: Philippines’ Rank Among 97 Countries 20 Selected HDI Indicators 21 Gender-Related Development Index (GDI), Philippines 22 Gender Empowerment Measure (GEM) 23 Poverty Reduction Targets under Various Administrations 24 Special Poverty Alleviation Funds 25 20/20 Expenditures of the National Government By Major Component (All
Expenditure Classes[1]) 26 Total ODA Committed to the Philippines (In US$ million)
LIST OF FIGURES 1 Poverty Incidence Among Families, Philippines, 1985-2000 2 Poverty Incidence Among Families, 2000 3 Incidence of Poverty among Families, 2000 4 Magnitude of Poor Families, Philippines, 1985-2000 4 Magnitude of Poor Families By Region, 2000 5 Subsistence Incidence Among Families, Philippines 1985-2000 6 Subsistence Incidence Among Families By Region, 2000 7 Chronic and Transient Poverty 8 Annual Population Growth Rates, Philippines, 1960-2000 9 Population By Region, 2000 10 Distribution of Population by age group, 1980 and 2000 11 Elementary Participation Rate by Region, SY 2000-2001 12 Elementary Participation Rate by sector, Private/Public, Philippines 13 Secondary Participation Rate by Region, SY 2000-2001 14 Secondary Participation Rate by Sectors, SY 1999-2000 to SY 2001-2002 15 Elementary Cohort Survival Rate by Region, SY 2001-2002 16 Secondary Cohort Survival Rate by Region, SY 2001-2002 17 Elementary Dropout Rates by Region, SY 2000-2001 18 Secondary Dropout Rates by Region, SY 2000-2001 19 Simple Literacy Rate by Region, 2000 20 Infant Mortality Rate by Region, 1998 21 Prevalence of Malnutrition Among 0-5 Year-Old Children by Region
(International Standards), 2001 22 Prevalence of Malnutrition Among 0-5 Year-Old Children, Philippines
(International Standards), 1989-2001 23 Proportion of Families with Access to Safe Water, Philippines, 1985- 2000 24 Proportion of Families with Access to Safe Water by Region, 2000 25 Proportion of Families with Access to Sanitary Toilet Facilities, Philippines,
1985-2000 26 Proportion of Families with Access to Sanitary Toilet Facilities by Region, 2000 27 Proportion of Families with Electricity, Philippines, 1985-2000 28 Proportion of Families with Electricity, By Region, 2000 29 Proportion of Families Living in Makeshift Houses, Philippines, 1985-2000 30 Proportion of Families Living in Makeshift Houses by Region, 2000 31 Human Development Index: Philippines, 1975-2001 32 Growth rate of GNP: 1985 to 2002 33 Institutional Arrangements in Poverty Alleviation
Abstract
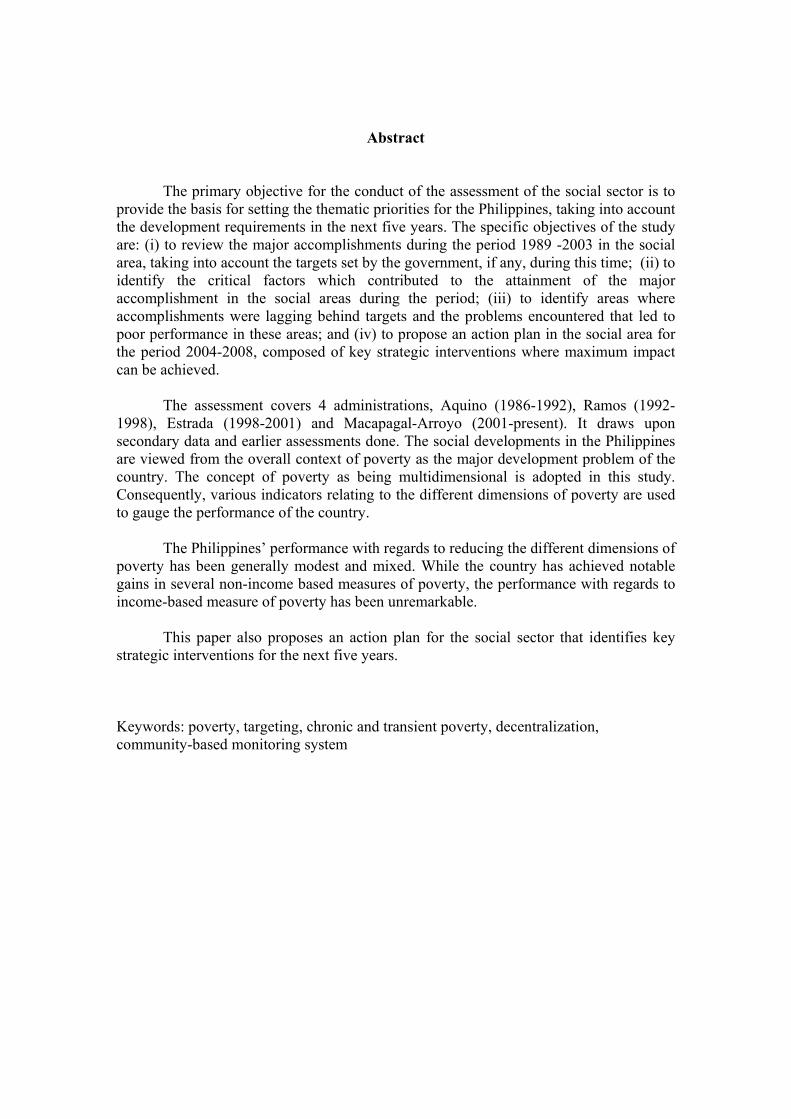
The primary objective for the conduct of the assessment of the social sector is to provide the basis for setting the thematic priorities for the Philippines, taking into account the development requirements in the next five years. The specific objectives of the study are: (i) to review the major accomplishments during the period 1989 -2003 in the social area, taking into account the targets set by the government, if any, during this time; (ii) to identify the critical factors which contributed to the attainment of the major accomplishment in the social areas during the period; (iii) to identify areas where accomplishments were lagging behind targets and the problems encountered that led to poor performance in these areas; and (iv) to propose an action plan in the social area for the period 2004-2008, composed of key strategic interventions where maximum impact can be achieved. The assessment covers 4 administrations, Aquino (1986-1992), Ramos (1992-1998), Estrada (1998-2001) and Macapagal-Arroyo (2001-present). It draws upon secondary data and earlier assessments done. The social developments in the Philippines are viewed from the overall context of poverty as the major development problem of the country. The concept of poverty as being multidimensional is adopted in this study. Consequently, various indicators relating to the different dimensions of poverty are used to gauge the performance of the country. The Philippines’ performance with regards to reducing the different dimensions of poverty has been generally modest and mixed. While the country has achieved notable gains in several non-income based measures of poverty, the performance with regards to income-based measure of poverty has been unremarkable.
This paper also proposes an action plan for the social sector that identifies key strategic interventions for the next five years.
Keywords: poverty, targeting, chronic and transient poverty, decentralization, community-based monitoring system
AN INITIAL VERDICT ON OUR FIGHT AGAINST POVERTY
EXECUTIVE SUMMARY
Performance in poverty reduction
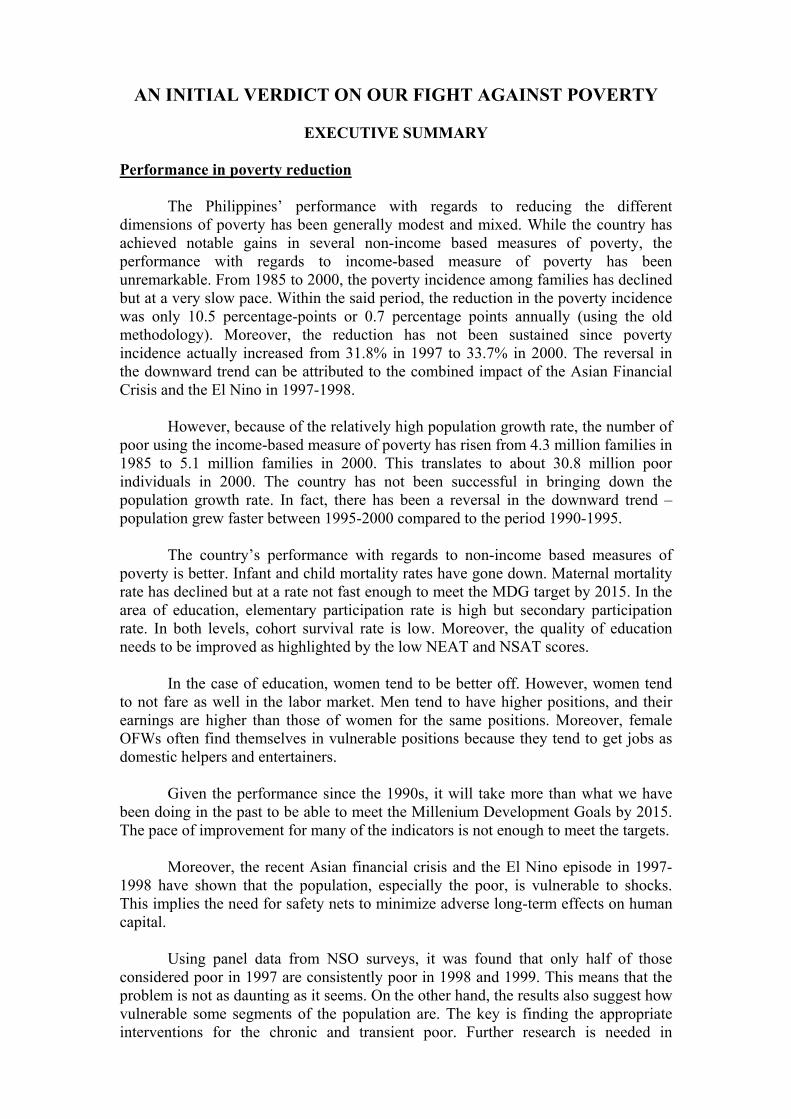
The Philippines’ performance with regards to reducing the different dimensions of poverty has been generally modest and mixed. While the country has achieved notable gains in several non-income based measures of poverty, the performance with regards to income-based measure of poverty has been unremarkable. From 1985 to 2000, the poverty incidence among families has declined but at a very slow pace. Within the said period, the reduction in the poverty incidence was only 10.5 percentage-points or 0.7 percentage points annually (using the old methodology). Moreover, the reduction has not been sustained since poverty incidence actually increased from 31.8% in 1997 to 33.7% in 2000. The reversal in the downward trend can be attributed to the combined impact of the Asian Financial Crisis and the El Nino in 1997-1998.
However, because of the relatively high population growth rate, the number of poor using the income-based measure of poverty has risen from 4.3 million families in 1985 to 5.1 million families in 2000. This translates to about 30.8 million poor individuals in 2000. The country has not been successful in bringing down the population growth rate. In fact, there has been a reversal in the downward trend – population grew faster between 1995-2000 compared to the period 1990-1995.
The country’s performance with regards to non-income based measures of poverty is better. Infant and child mortality rates have gone down. Maternal mortality rate has declined but at a rate not fast enough to meet the MDG target by 2015. In the area of education, elementary participation rate is high but secondary participation rate. In both levels, cohort survival rate is low. Moreover, the quality of education needs to be improved as highlighted by the low NEAT and NSAT scores. In the case of education, women tend to be better off. However, women tend to not fare as well in the labor market. Men tend to have higher positions, and their earnings are higher than those of women for the same positions. Moreover, female OFWs often find themselves in vulnerable positions because they tend to get jobs as domestic helpers and entertainers. Given the performance since the 1990s, it will take more than what we have been doing in the past to be able to meet the Millenium Development Goals by 2015. The pace of improvement for many of the indicators is not enough to meet the targets.
Moreover, the recent Asian financial crisis and the El Nino episode in 1997-1998 have shown that the population, especially the poor, is vulnerable to shocks. This implies the need for safety nets to minimize adverse long-term effects on human capital. Using panel data from NSO surveys, it was found that only half of those considered poor in 1997 are consistently poor in 1998 and 1999. This means that the problem is not as daunting as it seems. On the other hand, the results also suggest how vulnerable some segments of the population are. The key is finding the appropriate interventions for the chronic and transient poor. Further research is needed in
ii
identifying who are the chronic and transient poor and the causes of their poverty. Then appropriate interventions can be designed for the target groups.
Reasons for the modest performance in poverty reduction
There are several main reasons why the country has not managed to reduce the number of poor people. First is the low economic growth. The second reason is related to the poverty reduction policies and programs that have been implemented. These policies and programs are beset with problems of discontinuity, mistargeting and lack of capacity to implement. Another reason could be linked to political reasons, including the presence of armed conflict. Finally, the lack of resources and ineffective utilization of some of these meager resources
Insurgency and poverty are very much related. The discontented poor provides the base for the insurgency movement. Areas where insurgency is strong tend to limit economic activity, thereby worsening the poverty situation. This could perhaps be the reason why ARMM and Bicol are the top two poorest regions.
Proposed Strategic Interventions
1. Key to reducing poverty is broad-based economic growth
Key to the fight against poverty is economic growth. High and sustained
broad-based growth is needed to raise incomes and reduce inequality. There is a need to modernize agriculture and promote non-farm employment in the rural areas.
2. Ensure continuity of policies and programs
One of the reasons that the country’s performance with regards to reducing
poverty has been unremarkable is the poverty alleviation programs that we have. For one, there is lack of continuity in the government’s program to reduce poverty. Every administration comes up with its own poverty reduction strategy and programs. It is important to depoliticize the poverty reduction program so that programs are sustained. In the past, many programs are dropped even before their full effect could be felt, just because they are associated with the previous administration. Thus, some government agencies have been creative in naming their programs to survive changes in administration. The National Food Administration has been successful in renaming the Kadiwa rolling store during the Marcos Administration to ERAP (Enhanced Retail Access Program) store during the Estrada Administration to GMA (Greater Market Access) store during the current administration. The challenge for NAPC and other government agencies is to ensure that the current programs being implemented will outlast the present administration.
In the case of donor-assisted programs, there is a need to ensure that these
programs will be picked up by the local partners, be it the national or local government, or the community.
3. Well-targeted programs are necessary
In addition to the issue of continuity of programs, the programs have employed weak targeting schemes. During the Ramos administration, focus was given to the 20 priority provinces. However, only 11% of the poor are in these provinces.
iii
The targeting scheme was refined to focus on 5th and 6th class municipalities. The assumption here was that the poor would be found in poor municipalities. However, we know that not all the people in 5th and 6th class municipalities are poor. Furthermore, even in 1st class municipalities, there are poor. During the Estrada Administration this was refined to focusing on the 100 poorest families in each province and city. The local government units were tasked to identify them. However, in the absence of adequate information at the household level, it took two years to come up with the lists. By that time, a new administration has taken over.
Geographic targeting has been preferred because it is easy to implement. This
is useful but should not be used exclusively. For one, the official statistical system can only support targeting down to the provincial level at most. But Section 3 highlights the presence of wide spatial disparities across regions and provinces. And these dispartieis persist across municipalities/cities within provinces and barangays across municipalities/cities as indicated by data collected in Palawan and Camarines Norte using the MIMAP-CBMS.
The basic problem in the implementation of targeted programs is the lack of
information. Geographic targeting is the most attractive because it is easy to implement but the official statistical system can only provide data down to the regional and provincial levels. In connection with this, the development of community-based monitoring system can address the data gaps. This would allow for the generation of information that would enable us to identify who and where the poor are.
Programs that utilize self-targeting, which are easier to administer, have not
been used extensively. There is a need to improve design of programs. For instance, anyone can buy from NFA rolling stores although there are some efforts to locate them in the “poor areas.” In addition to choosing the areas, selling inferior goods might be more effective in ensuring that the buyers are poor.
There is a need to come up with more innovative programs and projects to
address the problems. For instance, to reach the MDG target of universal access to basic education, the traditional interventions may not be effective anymore given that the elementary participation rate is already very high. The CBMS results indicate that some of the reasons for not going to school include lack of money (out-of-pocket expenses for public schools may still be too high for very poor families), the long distance to the nearest school and preference of the families (indigenous peoples may find the formal system too restrictive). In these cases, innovative programs are needed to address the needs of these groups. For example, scholarship that covers school supplies, uniforms, meals and transport may be necessary to enable children from very poor families to enroll. Busing children to the nearest school or housing children in on-campus dormitories may be better than building schools in every barangay, especially when the student population may not be cost-effective. Insofar as the needs of indigenous peoples, more flexible systems such as mobile teachers or allowing students to continue in other schools may be helpful.
4. Regional disparities need to be addressed
The data indicate that there are significant disparities across regions and
provinces. While the provinces in Mindanao tend to be poorer than those in Luzon and the Visayas, there are provinces within the latter two island groups that are very
iv
poor. Thus, while there is basis for focusing assistance in Mindanao, particularly in ARMM, the study shows that the poor provinces within the not-so-poor regions should not be neglected.
While current donor assistance is focused on Mindanao, future donor
assistance should include other regions and provinces where poverty incidence is high. The Bicol and MIMAROPA regions are the next poorest regions. Poverty reduction efforts should also be directed towards the poor provinces in Luzon and Visayas such as Masbate, Ifugao, Romblon, Camarines Norte, Capiz, Mountain Province, Abra, Eastern Samar, Bohol, Marinduque, Catanduanes, Misamis Occidental, Oriental Mindoro, Camarines Sur, Negros Occidental, Occidental Mindoro, Sorsogon, Northern Samar, and Samar.
5. Gender-disparities need to be addressed
Gender disparities, particularly in the labor market, need to be addressed.
6. Chronic and transient poverty The recent Asian financial crisis and the El Nino episode in 1997-1998 have
shown that the population, especially the poor, are vulnerable to shocks. It was found that only half of those considered poor in 1997 are consistently poor in 1998 and 1999. This means that the problem is not as daunting as it seems. The key is finding the appropriate interventions for the chronic and transient poor. Further research is needed in identifying who are the chronic and transient poor and the causes of their poverty. Then appropriate interventions can be designed for the target groups.
7. Population management policy
There is a need for a stronger population management policy to be able to deal
with the population issue once and for all.
8. Decentralization and Capacity Building The passage of the Local Government Code in 1991 has devolved certain
function of the national government to local government units. The national government recognizes the importance of LGUs in fighting poverty. The Department of Interior and Local Government issued a circular enjoining all provinces and cities/municipalities to appoint Local Poverty Reduction Action Officers (LPRAOs) to help formulate action plans to reduce poverty. Planning and development officers, agricultural extension workers, social workers were among those who were designated. But there is a need to build capacity of these staff to carry out their functions. In particular, they need training on how to collect the information on which to base the plans, how to diagnose poverty, how to identify and design appropriate interventions, how to source funds for these, and how to monitor and evaluate impact of programs and projects.
Capacity building should be provided not just to the provincial official and
city/municipal officials but barangay officials as well. The barangay seems to be the weakest link in the chain. A large part of the budget of the barangays is spent on salaries of barangay officials. The rest is spent on projects that are identified by the
v
Barangay Development Council. Accountability for these funds needs to be strengthened.
9. Improve Local Level Monitoring and Evaluation System through
adoption of CBMS There is a need to improve monitoring and evaluation system. While there is
triennial monitoring of poverty incidence among regions and provinces, there is no regular monitoring of the welfare status of the population in all cities/municipalities and all barangays. Some LGUs have taken the initiative of institutionalizing community-based monitoring system at the local level (barangays, municipalities/cities and provinces) and incorporating the results of the monitoring in the annual development planning of these LGUs. This CBMS needs to be institutionalized in all LGUs. Such a system would improve local governance since they would provide the information necessary for identifying the unmet needs of the community and the appropriate interventions. The system, which calls for either the NAPC or DILG or NEDA as the repository of local data, would be useful for the national agencies in identifying beneficiaries for national programs.
For many of the implementing agencies and government units, there are no
evaluation systems in place that assesses the impact of the programs and projects. The evaluation of on-going projects would allow finetuning of these projects. In addition, evaluation of on-going and completed projects and programs would provide program implementers the basis to continue or discontinue these interventions. In practice, some of these interventions are allowed to continued without knowing if they are the most effective and cost-efficient ones. Incorporating an M&E system to all programs and projects are critical. This would also pave the way for coming up with a menu of interventions that are appropriate for the problem.
10. Strengthen Institutional Coordination and Collaboration
The NAPC is the government agency mandated to formulate poverty reduction
policy and coordinate poverty reduction programs and projects. It is a Commission where representatives of the basic sectors or vulnerable groups are represented together with government agencies. The composition of NAPC is intended to ensure representation of all sectors. There is a need to further improve mechanisms to bring about this desired representation to ensure that the concerns of the basic sectors are coherently incorporated in the policies and programs.
The main poverty reduction program, the KALAHI, utilizes the convergence
approach wherein all government agencies involved in the delivery of basic social services focus their efforts on KALAHI areas. This convergence strategy depends on the cooperation of the different agencies. The experience during the Social Reform Agenda was that the extent of cooperation of the different agencies varied significantly across municipalities/cities depending on the willingness of the local representatives of the concerned agencies. Coordination among the different agencies needs to be strengthened.
1
1. INTRODUCTION
The past three decades saw significant improvements in the developing world. Life expectancy increased by eight years. Illiteracy was cut in half to 25%. In East Asia, the number of people surviving on less than $1 a day was almost halved just in the 1990s (Human Development Report 2003).
Yet, one in every five persons in the world, or more than 1.2 billion people,
survive on less than $1 a day. During the 1990s the proportion of people suffering from extreme income poverty fell from 30% to 23%. But with a growing world population, the number fell by just 123 million – a small fraction of the poor. And excluding China, the number of the extremely poor actually increased by 28 million. South and East Asia contain the largest number of people in income poverty, although both regions have made substantial gains.
In the Philippines, poverty reduction remains to be the biggest challenge. Poverty incidence has declined modestly over the last 15 years but the magnitude of the poor has in fact risen. Progress has been noted in health and education, but there are still concerns about accelerating these improvements to meet the Millennium Development Goals.
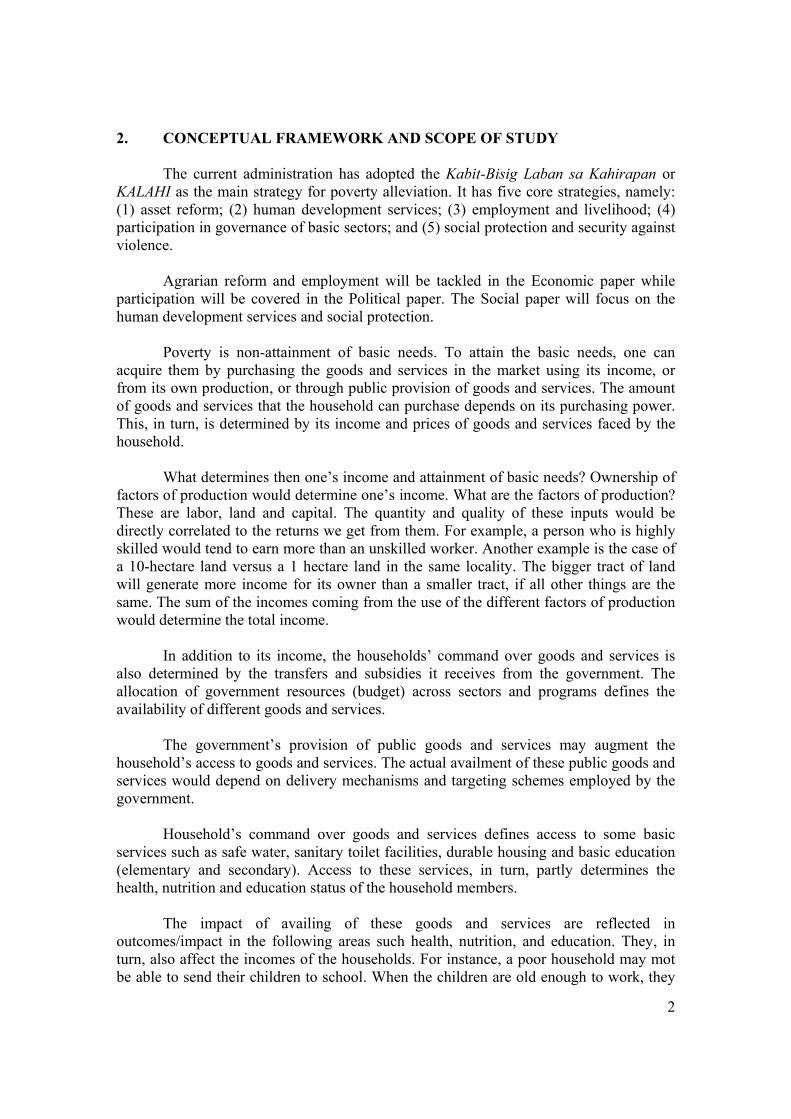
The primary objective for the conduct of the assessment of the social sector is to provide the basis for setting the thematic priorities for the Philippines, taking into account the development requirements in the next five years. The specific objectives of the study are:
i) To review the major accomplishments during the period 1989-2003 in
the social area, taking into account the targets set by the government, if any, during this time;
ii) To identify the critical factors which contributed to the attainment of the major accomplishment in the social areas during the period;
iii) To identify areas where accomplishments were lagging behind targets and the problems encountered that led to poor performance in these areas; and
iv) To propose an action plan in the social area for the period 2004-2008, composed of key strategic interventions where maximum impact can be achieved.
The assessment covers 4 administrations, Aquino (1986-1992), Ramos (1992-1998), Estrada (1998-2001) and Macapagal-Arroyo (2001-present). It will draw upon secondary data and earlier assessments done. The social developments in the Philippines will be viewed from the overall context of poverty as the major development problem of the country. The concept of poverty as being multidimensional will be adopted in this study. Consequently, various indicators relating to the different dimensions of poverty will be used to gauge the performance of the country.
2
2. CONCEPTUAL FRAMEWORK AND SCOPE OF STUDY
The current administration has adopted the Kabit-Bisig Laban sa Kahirapan or KALAHI as the main strategy for poverty alleviation. It has five core strategies, namely: (1) asset reform; (2) human development services; (3) employment and livelihood; (4) participation in governance of basic sectors; and (5) social protection and security against violence.
Agrarian reform and employment will be tackled in the Economic paper while
participation will be covered in the Political paper. The Social paper will focus on the human development services and social protection.
Poverty is non-attainment of basic needs. To attain the basic needs, one can
acquire them by purchasing the goods and services in the market using its income, or from its own production, or through public provision of goods and services. The amount of goods and services that the household can purchase depends on its purchasing power. This, in turn, is determined by its income and prices of goods and services faced by the household.
What determines then one’s income and attainment of basic needs? Ownership of factors of production would determine one’s income. What are the factors of production? These are labor, land and capital. The quantity and quality of these inputs would be directly correlated to the returns we get from them. For example, a person who is highly skilled would tend to earn more than an unskilled worker. Another example is the case of a 10-hectare land versus a 1 hectare land in the same locality. The bigger tract of land will generate more income for its owner than a smaller tract, if all other things are the same. The sum of the incomes coming from the use of the different factors of production would determine the total income.
In addition to its income, the households’ command over goods and services is also determined by the transfers and subsidies it receives from the government. The allocation of government resources (budget) across sectors and programs defines the availability of different goods and services.
The government’s provision of public goods and services may augment the household’s access to goods and services. The actual availment of these public goods and services would depend on delivery mechanisms and targeting schemes employed by the government.
Household’s command over goods and services defines access to some basic services such as safe water, sanitary toilet facilities, durable housing and basic education (elementary and secondary). Access to these services, in turn, partly determines the health, nutrition and education status of the household members.
The impact of availing of these goods and services are reflected in outcomes/impact in the following areas such health, nutrition, and education. They, in turn, also affect the incomes of the households. For instance, a poor household may mot be able to send their children to school. When the children are old enough to work, they
3
are likely to earn less than those who were able to graduate from college. This vicious cycle of poverty is then perpetuated unless there are interventions that will allow the poor children to get good education.
Data used in this assessment will be sourced from official statistics. Major sources
are the National Statistics Office and National Statistical Coordination Board. In some cases, further processing of the survey data were done to come up with the desired disaggregation.
Despite using official statistics, there are some problems with time series data presented in this study. There have been changes in the methodologies used in estimating some of the indicators. These are noted in the appropriate tables and figures. Moreover, there have been recent changes in the regional groupings, which spurred the need to re-estimate some of the data. The regions affected by the new regional grouping are Regions III, IV, IX, X, XI, XIII and the ARMM. Specifically, Lanao del Norte has been transferred from Region XII to X while Southern Tagalog Region has been divided into two namely CALABARZON and MIMAROPA. Aurora province has been transferred from Region IV to III and Basilan has moved from Western Mindanao to ARMM. Moreover, Saranggani and South Cotabato were transferred from Region XI to join SOCKKSARGEN. Breaking up Region IV into two regions is good for Region IV-B. The provinces in this region are less developed than Region IV-A and the regional figures for Region IV tend to mask the problems in MIMAROPA. The disparities are discussed extensively in the next section. Because of the good performance of Region IV, it was easy to overlook that there are some provinces within the region that are lagging behind. With the current grouping, more attention will likely be given to the MIMAROPA provinces.
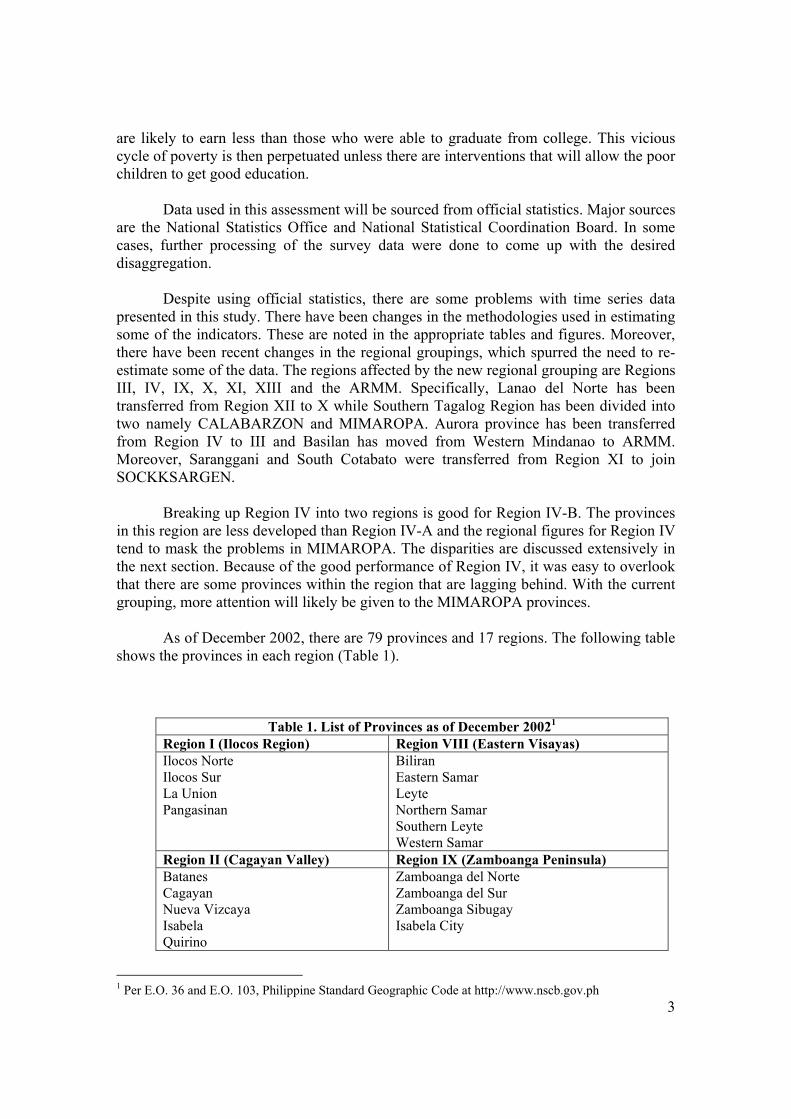
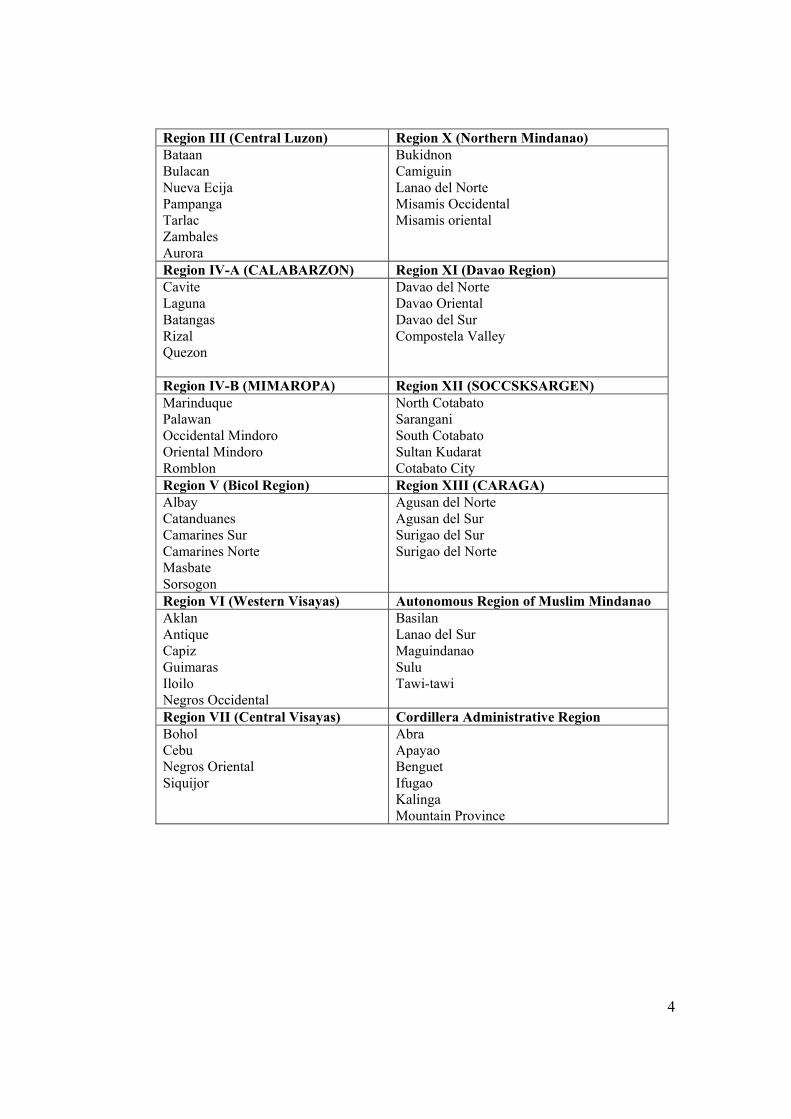
As of December 2002, there are 79 provinces and 17 regions. The following table shows the provinces in each region (Table 1).
Table 1. List of Provinces as of December 20021 Region I (Ilocos Region) Region VIII (Eastern Visayas) Ilocos Norte Ilocos Sur La Union Pangasinan
Biliran Eastern Samar Leyte Northern Samar Southern Leyte Western Samar
Region II (Cagayan Valley) Region IX (Zamboanga Peninsula) Batanes Cagayan Nueva Vizcaya Isabela Quirino
Zamboanga del Norte Zamboanga del Sur Zamboanga Sibugay Isabela City
1 Per E.O. 36 and E.O. 103, Philippine Standard Geographic Code at http://www.nscb.gov.ph
4
Region III (Central Luzon) Region X (Northern Mindanao) Bataan Bulacan Nueva Ecija Pampanga Tarlac Zambales Aurora
Bukidnon Camiguin Lanao del Norte Misamis Occidental Misamis oriental
Region IV-A (CALABARZON) Region XI (Davao Region) Cavite Laguna Batangas Rizal Quezon
Davao del Norte Davao Oriental Davao del Sur Compostela Valley
Region IV-B (MIMAROPA) Region XII (SOCCSKSARGEN) Marinduque Palawan Occidental Mindoro Oriental Mindoro Romblon
North Cotabato Sarangani South Cotabato Sultan Kudarat Cotabato City
Region V (Bicol Region) Region XIII (CARAGA) Albay Catanduanes Camarines Sur Camarines Norte Masbate Sorsogon
Agusan del Norte Agusan del Sur Surigao del Sur Surigao del Norte
Region VI (Western Visayas) Autonomous Region of Muslim Mindanao Aklan Antique Capiz Guimaras Iloilo Negros Occidental
Basilan Lanao del Sur Maguindanao Sulu Tawi-tawi
Region VII (Central Visayas) Cordillera Administrative Region Bohol Cebu Negros Oriental Siquijor
Abra Apayao Benguet Ifugao Kalinga Mountain Province
5
3. POVERTY STATUS AND TRENDS IN THE PHILIPPINES
3.1 Poverty This section presents the changes in the poverty situation over the last 12 years
using the Foster-Greer-Thorbecke measures of poverty. Data used came from the Family Income and Expenditure Surveys (FIES) conducted by the National Statistics Office (NSO) in 1988, 1991, 1994, 1997 and 2000.
This section also examines the movements in and out of poverty to distinguish
between chronic and transient poverty. Data from the 1997 FIES and Annual Poverty Indicators Surveys of 1998 and 1999 were used. This will attempt to look at who are the vulnerable groups. Alternative measures of poverty, such as the expenditure-based measure, are also examined.
3.1.1 Changes in Methodology for estimating poverty statistics
On January 15, 2003, the NSCB adopted the new methodology in estimating
poverty incidence. The new methodology provided for provincial poverty thresholds that can be used in estimating provincial poverty incidence. This is in response to the increasing demand for more disaggregated information that has been brought about by devolution and the need for information for better targeting. The poverty incidence estimates based on the new methodology are lower than the estimates derived using the old methodology. However, comparing the changes between 1997 and 2000, there were instances when the new methodology yielded a different trend than what the old methodology indicated. The details of the changes in the methodology are discussed in Appendix A.
For the analysis of the poverty situation over time, this paper uses the poverty
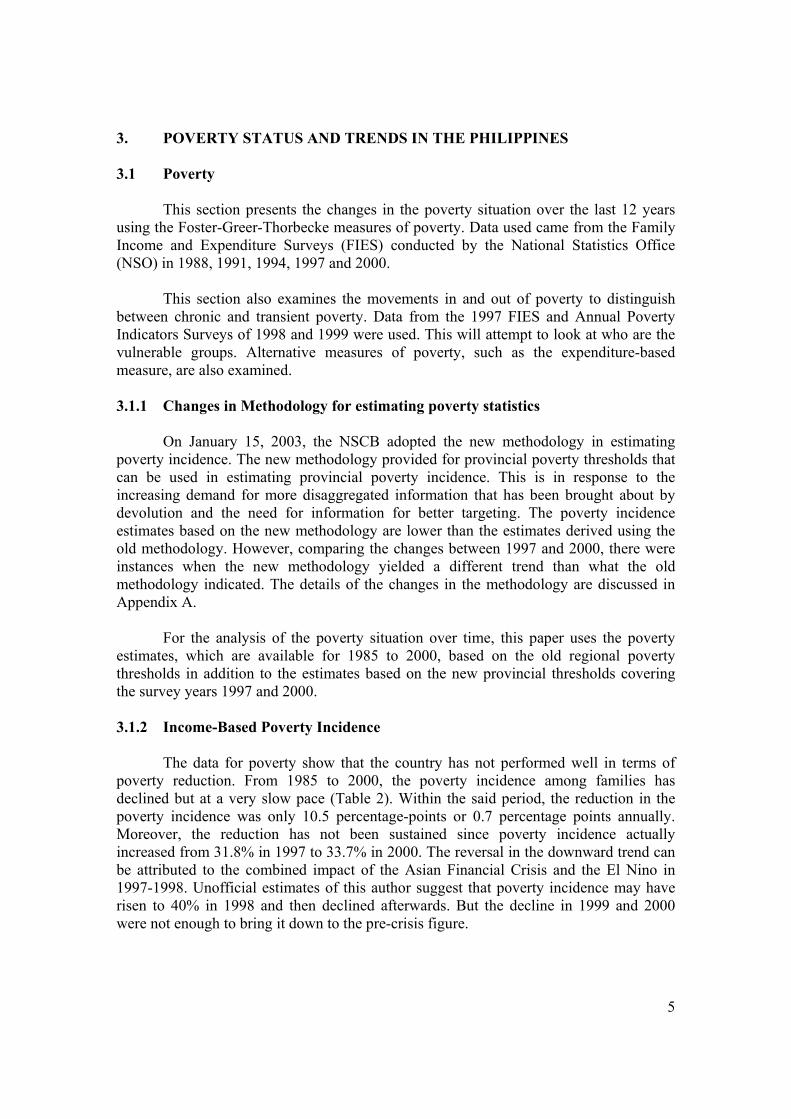
estimates, which are available for 1985 to 2000, based on the old regional poverty thresholds in addition to the estimates based on the new provincial thresholds covering the survey years 1997 and 2000. 3.1.2 Income-Based Poverty Incidence The data for poverty show that the country has not performed well in terms of poverty reduction. From 1985 to 2000, the poverty incidence among families has declined but at a very slow pace (Table 2). Within the said period, the reduction in the poverty incidence was only 10.5 percentage-points or 0.7 percentage points annually. Moreover, the reduction has not been sustained since poverty incidence actually increased from 31.8% in 1997 to 33.7% in 2000. The reversal in the downward trend can be attributed to the combined impact of the Asian Financial Crisis and the El Nino in 1997-1998. Unofficial estimates of this author suggest that poverty incidence may have risen to 40% in 1998 and then declined afterwards. But the decline in 1999 and 2000 were not enough to bring it down to the pre-crisis figure.
6
Table 2. Poverty Incidence Among Filipino Families, 1985-2000
Survey Year In Percent 1985 44.2 1988 40.2 1991 39.9 1994 35.5 1997 31.8 2000 33.7
Source: FIES (Using the Regional Thresholds)
Even under the new methodology of poverty monitoring, the country’s poverty reduction performance was indeed poor. From 28.1% in 1997, the poverty incidence went up to 28.4 % in year 2000. The new methodology of monitoring poverty uses the first-ever official poverty thresholds estimated at the provincial level by the National Statistical Coordination Board. Previous estimates were issued only at the national and regional levels. Under both methodologies of poverty monitoring, the poverty situation in the country has in fact worsened in 2000. The country’s failure to reduce poverty in recent years can be attributed to the series of economic and political crises the country suffered. In terms of the proportion of population below the national poverty line, poverty incidence has decreased by only 9.7 percentage points or an average of 0.65 percentage points annually during the period 1985 to 2000 (Table 3). Moreover, the percentage of those below the subsistence threshold has also decreased by only 7.4 percentage points for the same period or an average of 0.5 percentage points annually.
Figure 1. Poverty Incidence Among Families Philippines, 1985-2000 Source: FIES, NSO
7
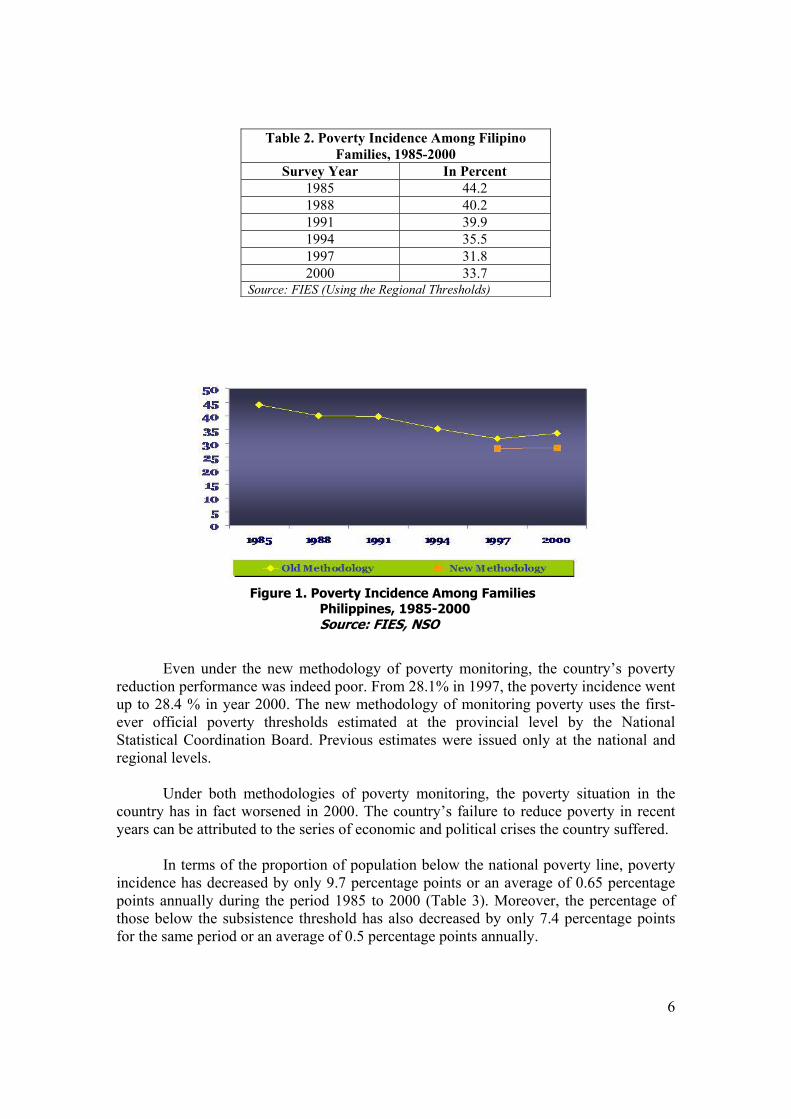
Table 3. Proportion of Population Below Poverty and Subsistence Thresholds, 1985 & 2000 (In Percent)
Indicator 1985 2000 Poverty Incidence 49.1 39.4 Subsistence Incidence 28.4 21.0 Source: FIES, NSO
Poverty was concentrated in certain areas in the country. Looking at the map of the poverty incidence by region for 2000 (using the new classification), there were wide disparities across the regions (Figure 2). For instance, there were only 6 out 100 families who were considered poor in Metro Manila (NCR) whereas more than half (or 55%) of those in the Autonomous Region of Muslim Mindanao were poor.
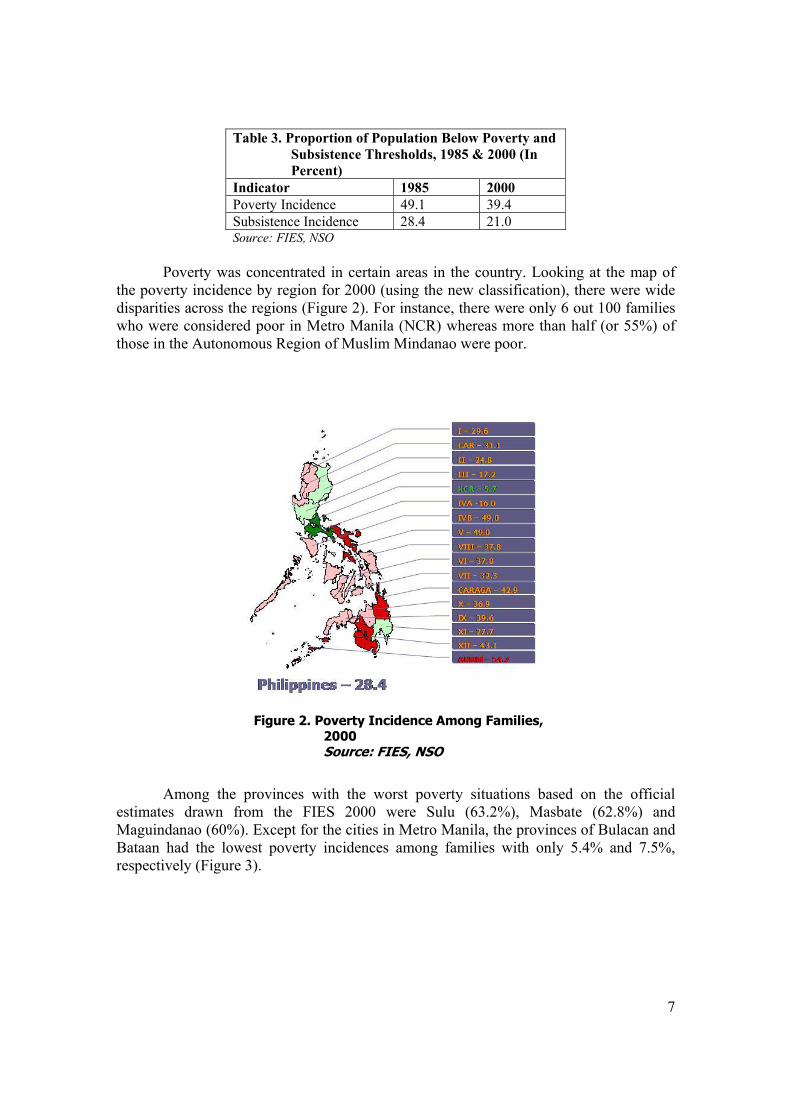
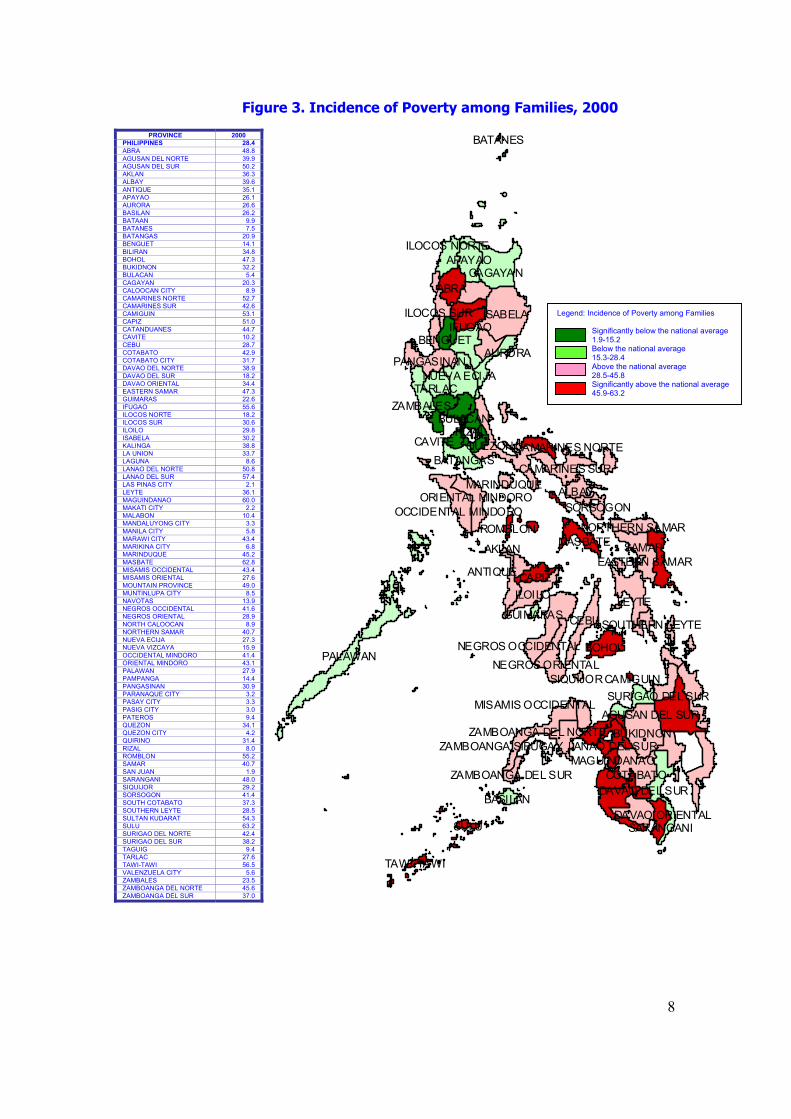
Among the provinces with the worst poverty situations based on the official estimates drawn from the FIES 2000 were Sulu (63.2%), Masbate (62.8%) and Maguindanao (60%). Except for the cities in Metro Manila, the provinces of Bulacan and Bataan had the lowest poverty incidences among families with only 5.4% and 7.5%, respectively (Figure 3).
Figure 2. Poverty Incidence Among Families, 2000
Source: FIES, NSO
8
ISABELA
PALAWAN
QUEZON
LEYTE
CAGAYAN
BUKIDNON
CEBU
ABRA
SAMAR
ILOILO
COTABATO
BOHOL
APAYAO
AGUSAN DEL SUR
CAPIZ
NUEVA ECIJAPANGASINAN
AURORA
TARLACZAMBALES
IFUGAO
NEGROS OCCIDENTAL
ALBAY
MASBATE
DAVAO DEL SUR
CAMARINES SURBATANGAS
ANTIQUE
DAVAO ORIENTAL
BULACAN
AKLAN
BENGUET
NEGROS ORIENTAL
ZAMBOANGA DEL NORTELANAO DEL SURMAGUINDANAO
OCCIDENTAL MINDORO
EASTERN SAMAR
SURIGAO DEL SUR
SARANGANI
ILOCOS NORTE
RIZAL
ILOCOS SUR
ORIENTAL MINDORO
CAVITE
SORSOGON
ZAMBOANGA DEL SUR
NORTHERN SAMAR
SULU
BASILAN
ZAMBOANGA SIBUGAY
CAMARINES NORTE
MISAMIS OCCIDENTAL
SOUTHERN LEYTE
MARINDUQUE
ROMBLON
GUIMARAS
TAWI-TAWI
SIQUIJORCAMIGUIN
BATANES
PROVINCE 2000 PHILIPPINES 28.4 ABRA 48.8 AGUSAN DEL NORTE 39.9 AGUSAN DEL SUR 50.2 AKLAN 36.3 ALBAY 39.6 ANTIQUE 35.1 APAYAO 26.1 AURORA 26.6 BASILAN 26.2 BATAAN 9.9 BATANES 7.5 BATANGAS 20.9 BENGUET 14.1 BILIRAN 34.8 BOHOL 47.3 BUKIDNON 32.2 BULACAN 5.4 CAGAYAN 20.3 CALOOCAN CITY 8.9 CAMARINES NORTE 52.7 CAMARINES SUR 42.6 CAMIGUIN 53.1 CAPIZ 51.0 CATANDUANES 44.7 CAVITE 10.2 CEBU 28.7 COTABATO 42.9 COTABATO CITY 31.7 DAVAO DEL NORTE 38.9 DAVAO DEL SUR 18.2 DAVAO ORIENTAL 34.4 EASTERN SAMAR 47.3 GUIMARAS 22.6 IFUGAO 55.6 ILOCOS NORTE 18.2 ILOCOS SUR 30.6 ILOILO 29.8 ISABELA 30.2 KALINGA 38.8 LA UNION 33.7 LAGUNA 8.6 LANAO DEL NORTE 50.8 LANAO DEL SUR 57.4 LAS PINAS CITY 2.1 LEYTE 36.1 MAGUINDANAO 60.0 MAKATI CITY 2.2 MALABON 10.4 MANDALUYONG CITY 3.3 MANILA CITY 5.8 MARAWI CITY 43.4 MARIKINA CITY 6.8 MARINDUQUE 45.2 MASBATE 62.8 MISAMIS OCCIDENTAL 43.4 MISAMIS ORIENTAL 27.6 MOUNTAIN PROVINCE 49.0 MUNTINLUPA CITY 8.5 NAVOTAS 13.9 NEGROS OCCIDENTAL 41.6 NEGROS ORIENTAL 28.9 NORTH CALOOCAN 8.9 NORTHERN SAMAR 40.7 NUEVA ECIJA 27.3 NUEVA VIZCAYA 15.9 OCCIDENTAL MINDORO 41.4 ORIENTAL MINDORO 43.1 PALAWAN 27.9 PAMPANGA 14.4 PANGASINAN 30.9 PARANAQUE CITY 3.2 PASAY CITY 3.3 PASIG CITY 3.0 PATEROS 9.4 QUEZON 34.1 QUEZON CITY 4.2 QUIRINO 31.4 RIZAL 8.0 ROMBLON 55.2 SAMAR 40.7 SAN JUAN 1.9 SARANGANI 48.0 SIQUIJOR 29.2 SORSOGON 41.4 SOUTH COTABATO 37.3 SOUTHERN LEYTE 28.5 SULTAN KUDARAT 54.3 SULU 63.2 SURIGAO DEL NORTE 42.4 SURIGAO DEL SUR 38.2 TAGUIG 9.4 TARLAC 27.6 TAWI-TAWI 56.5 VALENZUELA CITY 5.6 ZAMBALES 23.5 ZAMBOANGA DEL NORTE 45.6 ZAMBOANGA DEL SUR 37.0
Legend: Incidence of Poverty among Families
Significantly below the national average 1.9-15.2 Below the national average 15.3-28.4 Above the national average 28.5-45.8 Significantly above the national average 45.9-63.2
Figure 3. Incidence of Poverty among Families, 2000
9
Poverty in the country was largely rural in nature. Official estimates using the new provincial thresholds for the year 2000 show that nearly 75 percent of the poor live in the rural areas. Around half (or 41.4%) of all the families in the rural areas live below the poverty line while one-fifth (or 21.2%) of the rural families do not have sufficient income to provide even for their basic food needs. These percentages were higher for the year 2000 compared to the estimates in 1997, which means that the proportion of the poor in the rural areas has gone up despite government interventions in the rural areas. This can also be due to the poor performance of the agricultural sector, which is still the primary source of income for most of the poor in the rural sector. In 2002, the sector accounted for two-fifths of the total employment while contributing only one-fifth to the country’s output. Based on the old regional poverty thresholds, rural poverty has worsened in 2000 at 46.9% from 46.3% in 1988. On the other hand, significant improvements in the urban sector have been made as the poverty incidence has declined from 30.1% to 19.9% during the same period, reflecting the urban bias of Philippine development. Thus, the gap between the rural and urban areas has widened. Consequently, the incidence of rural poverty is now more than twice that of urban poverty. One cause of the rise in poverty is the worsening unemployment problem. The country’s unemployment rate has increased from 8.4 in 1995 to 9.4 in 1999 and to 10.1% in 2000. In 2001, 9.8% of the labor force had no jobs in 2001.
Poverty incidence is highest (55.5% in 2000) among families whose heads are engaged in agriculture (Reyes, 2002). The incidence has declined by only 1.5 percentage points from 1985 to 2000. Families headed by production and related workers, transport and equipment operators come in second (33.8%). In contrast, it is lowest among families headed by professional, technical and related workers (5.9%). During the same 15-year period, the proportion of the poor in this group has been reduced by almost half.
Since the poverty incidence has decreased by only 6.2 percentage points from
39.9% in 1991 to 33.7% in 2000, the government has to reduce this by almost the same magnitude in just four years to reach the national target of 28% in 2004. Moreover, to reach the MDG target of reducing by half the poverty incidence by 2015, the proportion of the population living below the poverty line has to be reduced over the next 15 years by around 17 percentage points, almost double that of the reduction of poverty (9.9 percentage points) in the last 15 years (1985-2000). This means the government must double its efforts to bring down the poverty incidence to the MDG target.
3.1.3 Magnitude of Poor Families
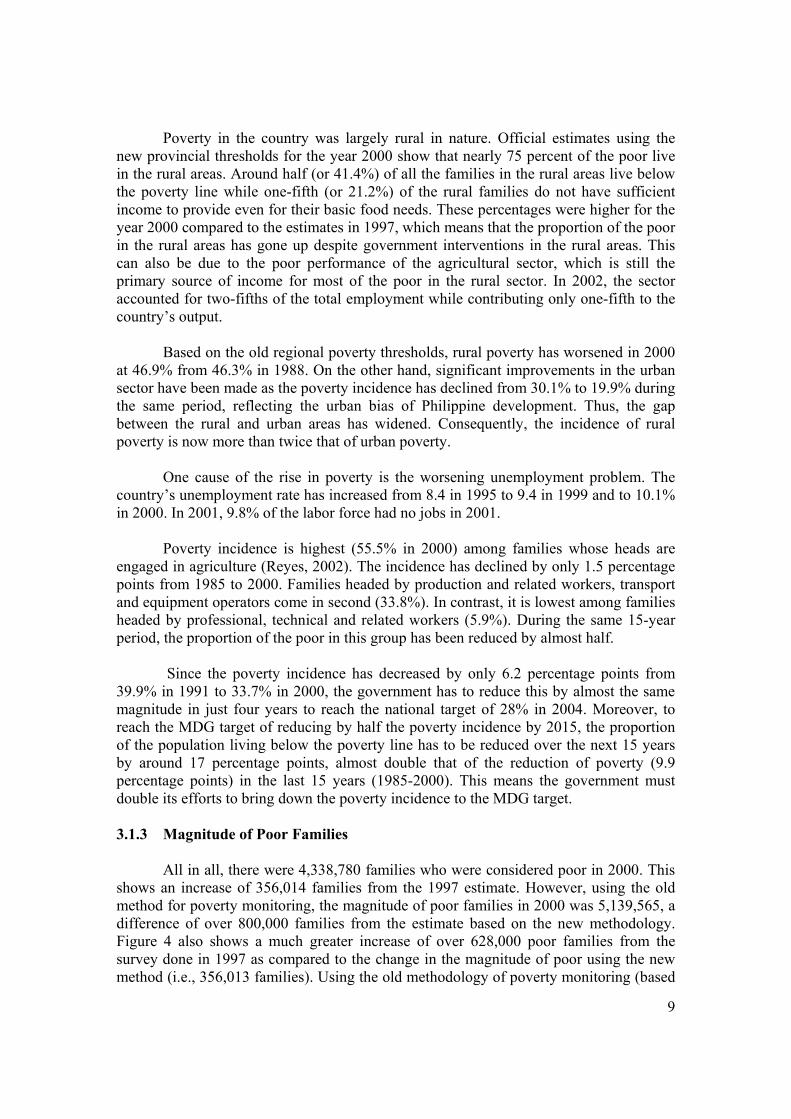
All in all, there were 4,338,780 families who were considered poor in 2000. This shows an increase of 356,014 families from the 1997 estimate. However, using the old method for poverty monitoring, the magnitude of poor families in 2000 was 5,139,565, a difference of over 800,000 families from the estimate based on the new methodology. Figure 4 also shows a much greater increase of over 628,000 poor families from the survey done in 1997 as compared to the change in the magnitude of poor using the new method (i.e., 356,013 families). Using the old methodology of poverty monitoring (based
10
on regional menus), it can easily be seen that the magnitude of the poor has been continuously increasing since 1991. Even with the new method, the magnitude of poor population increased from 1997 to 2000.
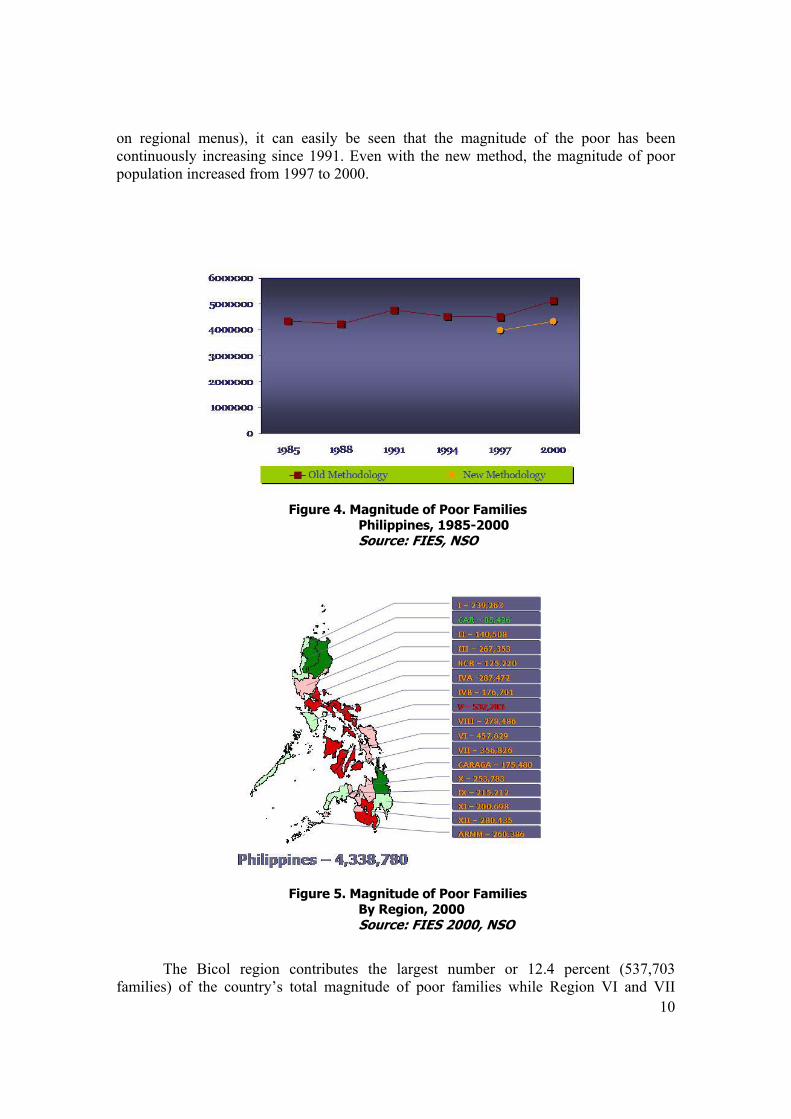
The Bicol region contributes the largest number or 12.4 percent (537,703
families) of the country’s total magnitude of poor families while Region VI and VII
Figure 4. Magnitude of Poor FamiliesPhilippines, 1985-2000 Source: FIES, NSO
Figure 5. Magnitude of Poor Families By Region, 2000 Source: FIES 2000, NSO
11
contribute 10.5 and 8.2 percentages (Figure 5). On the other hand, the CAR, NCR and Region II contribute 3 percent and below. Among the provinces, Negros Occidental, Masbate and Cebu have the largest magnitude of poor families each having around 200,000 poor families. The province of Batanes had the lowest number of poor with only 249 poor families. The cities of Metro Manila also had relatively low number of poor families.
By island group, Luzon has the largest number of poor families at 1.86 million
families, or 42.9 percent of the total number of poor families (Table 4). Mindanao is second with 1.39 million poor families. Visayas has 1.09 million poor families.
Table 4. Number of Poor Families by Island Group, 2000
Island Group Number of Poor Families Distribution
Philippines 4,338,780 100.0
Luzon 1,859,646 42.9 Visayas 1,093,140 25.2 Mindanao 1,385,993 31.9
Source: Basic data of the 2000 Family Income & Expenditures Survey, NSO.
3.1.4 Subsistence Incidence
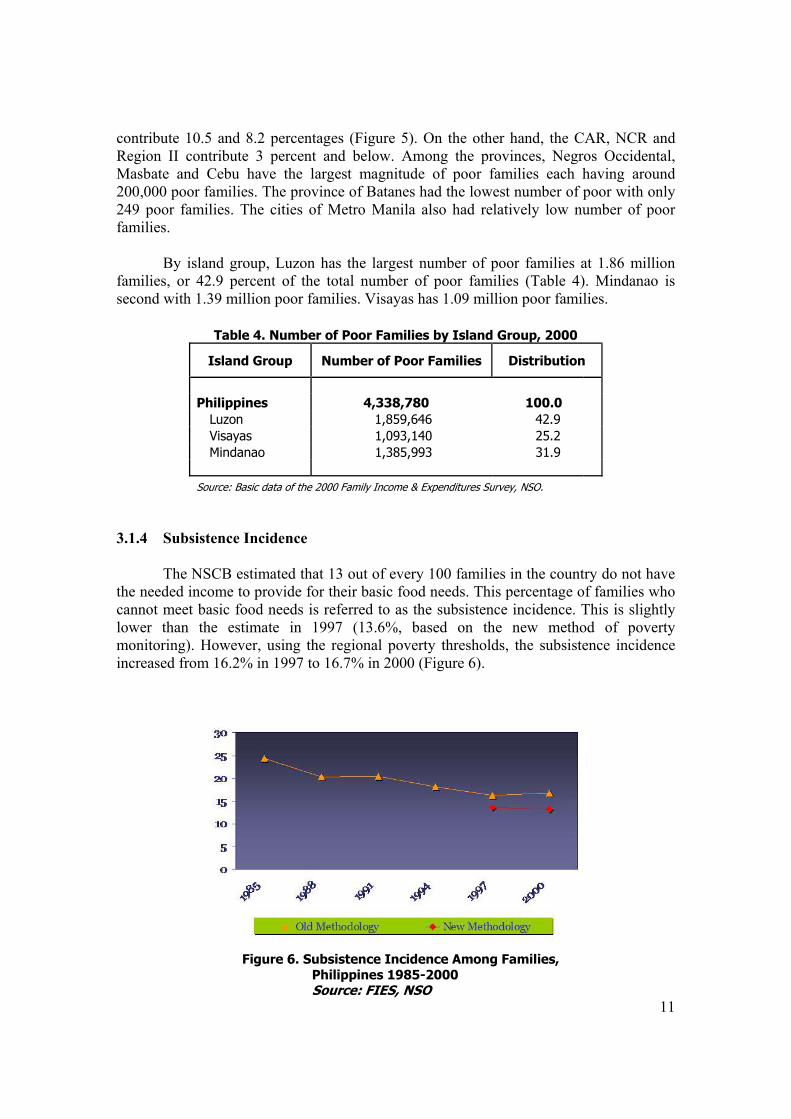
The NSCB estimated that 13 out of every 100 families in the country do not have the needed income to provide for their basic food needs. This percentage of families who cannot meet basic food needs is referred to as the subsistence incidence. This is slightly lower than the estimate in 1997 (13.6%, based on the new method of poverty monitoring). However, using the regional poverty thresholds, the subsistence incidence increased from 16.2% in 1997 to 16.7% in 2000 (Figure 6).
Figure 6. Subsistence Incidence Among Families,
Philippines 1985-2000 Source: FIES, NSO
12
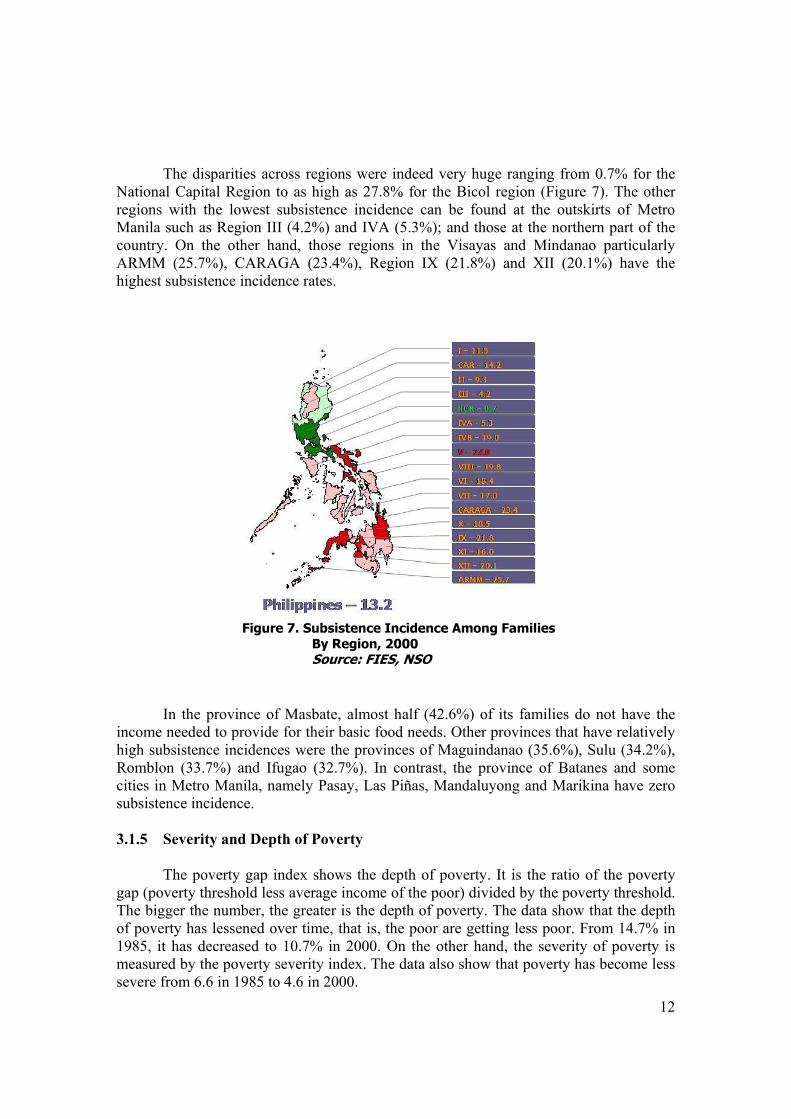
The disparities across regions were indeed very huge ranging from 0.7% for the National Capital Region to as high as 27.8% for the Bicol region (Figure 7). The other regions with the lowest subsistence incidence can be found at the outskirts of Metro Manila such as Region III (4.2%) and IVA (5.3%); and those at the northern part of the country. On the other hand, those regions in the Visayas and Mindanao particularly ARMM (25.7%), CARAGA (23.4%), Region IX (21.8%) and XII (20.1%) have the highest subsistence incidence rates.
In the province of Masbate, almost half (42.6%) of its families do not have the
income needed to provide for their basic food needs. Other provinces that have relatively high subsistence incidences were the provinces of Maguindanao (35.6%), Sulu (34.2%), Romblon (33.7%) and Ifugao (32.7%). In contrast, the province of Batanes and some cities in Metro Manila, namely Pasay, Las Piñas, Mandaluyong and Marikina have zero subsistence incidence. 3.1.5 Severity and Depth of Poverty
The poverty gap index shows the depth of poverty. It is the ratio of the poverty gap (poverty threshold less average income of the poor) divided by the poverty threshold. The bigger the number, the greater is the depth of poverty. The data show that the depth of poverty has lessened over time, that is, the poor are getting less poor. From 14.7% in 1985, it has decreased to 10.7% in 2000. On the other hand, the severity of poverty is measured by the poverty severity index. The data also show that poverty has become less severe from 6.6 in 1985 to 4.6 in 2000.
Figure 7. Subsistence Incidence Among Families By Region, 2000
Source: FIES, NSO
13
3.1.6 Expenditure-Based Poverty Incidence
There have been efforts by some researchers to estimate poverty incidence based on expenditures. Balisacan estimated that in 1997, 25% of the population had consumption below the poverty threshold. This is significantly lower than the official income-based measures of 36.9% using the old methodology and 33% using the new methodology. 3.1.7 International Poverty Line
While it is recognized that having a single poverty line across countries is not really appropriate, it is still used largely by international donor agencies to come up with some global estimate of poverty incidence and magnitude.
Using the international poverty line of $1 a day being used by the World Bank, the proportion of the population considered poor slightly decreased from 28.6 percent in 1991 to 26.9 in 1994.
3.1.8 Policies and programs
Poverty alleviation is the key tenet in the Medium-Term Philippine Development
Plan 2001-2004. The MTPDP incorporated the goal of reducing poverty incidence to 28% by 2004 for two million poor Filipinos. This will be achieved by increasing per capita incomes and expanding the job market. The government realizes that to attain sustained and equitable economic growth, it must formulate sound and consistent fiscal, monetary, external and financial sector policies.
The Kapit-Bisig Laban sa Kahirapan (KALAHI) is the Arroyo Administration’s
programme for an expanded, accelerated and focused strategy against poverty. It targets the poorest municipalities and barangays and ensures that stakeholders like non-government organizations (NGOs), local government units (LGUs), the private sector, and the academe are important partners. KALAHI’s programmes include human development services, livelihood and employment services, rural infrastructure services, and asset reform.
As of June 30, 2003, KALAHI programs and responses are being implemented in
371 barangays located in 159 municipalities/cities in 48 provinces. Five modes of KALAHI Special Projects serve as government’s vehicle to reach
out to the poor, respond to real needs and catalyze responses from other stakeholders. The KALAHI Rural Projects serve 90 priority rural barangays who now benefit from potable water systems, farm-to-market roads, multi-purpose or day care centers and micro-enterprise and livelihood activities. KALAHI Rural Projects have used 40 million peso allocation from the President’s Social Fund (PSF) that provides funds to fill the gaps or stimulate inflow of services and livelihood.
14
The KALAHI Urban Projects are present in 8 cities and urban centers offering human development services as well as crucial steps for land and housing security for urban poor families. These projects tap into a P20 million support from the PSF.
KALAHI Local Initiative Projects are proposed by other stakeholders from urban
or rural areas and aim to augment strong local, multi-stakeholder initiatives for asset reform, human development services, and livelihood and employment opportunities. Thirteen projects were approved in 2003, with a total funding of P4 million. Projects include animal dispersal, abaca plantation, water system installation, core shelter construction, and farm-to-market roads. The projects are scattered in 6 provinces covering 7 municipalities and 25 barangays. To date, 7 out of the 13 projects are already being implemented while the remaining 6 are being prepared.
KALAHI in Resettlement Areas serve 5,000 households in 6 underdeveloped
resettlement sites in Regions III, IV and NCR by bringing to them basic services such as water supply, electrification and drainage system. Forty million pesos was allocated for this purpose from the PSF. The President gave an additional P10 million for Livelihood Support Projects in 10 resettlement sites in the same regions. The package includes livelihood training, support facilities for enterprise start-up and micro-finance projects.
KALAHI in Conflict Areas will bring regional and local convergence groups
face-to-face with poverty in communities that have been further impoverished by the ravages of armed conflict and violence. The set of special projects are to be implemented in an estimated 100 communities utilizing again a focused fund of P40 million. Special task groups of regional and provincial offices have identified the communities and appropriate project interventions. Particular attention has been pledged to barangays where rebels and displaced families are returning to reestablish their homes and livelihoods.
In addition to the KALAHI programs, there is also the KALAHI-CIDSS which is
implemented by the Department of Social Welfare and Development and funded by the World Bank. It will bring focused and quick assistance to catalytic community projects in 5,125 barangays over the period 2003 to 2007.
The government fully realizes that for the poor to benefit from economic growth,
they must be empowered in mind, body and resources. Thus, there is a need for asset reforms, especially in land and credit, and the strengthening of human development services, particularly health and education. Agrarian reform is discussed in the Economic paper.
While the country’s failure to reduce poverty in recent years can be attributed mainly to the series of economic and political crises the country suffered, the discontinuity of programs brought about by the change in governments has also contributed to the poor performance. With every change in government, the poverty reduction strategy and accompanying programs are changed. Since it takes time to develop a strategy and implement it, there is no time for these programs to bear fruit before they are dumped by the new administration.
15
3.2 Chronic and Transient Poverty
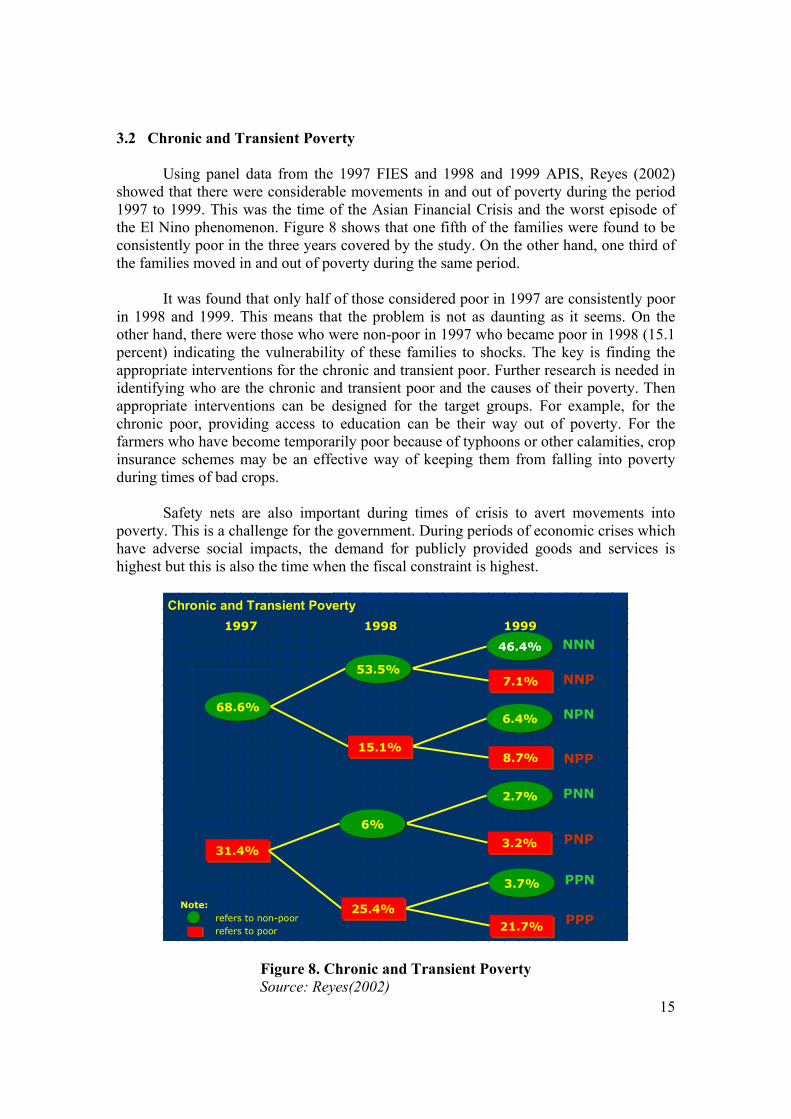
Using panel data from the 1997 FIES and 1998 and 1999 APIS, Reyes (2002) showed that there were considerable movements in and out of poverty during the period 1997 to 1999. This was the time of the Asian Financial Crisis and the worst episode of the El Nino phenomenon. Figure 8 shows that one fifth of the families were found to be consistently poor in the three years covered by the study. On the other hand, one third of the families moved in and out of poverty during the same period.
It was found that only half of those considered poor in 1997 are consistently poor
in 1998 and 1999. This means that the problem is not as daunting as it seems. On the other hand, there were those who were non-poor in 1997 who became poor in 1998 (15.1 percent) indicating the vulnerability of these families to shocks. The key is finding the appropriate interventions for the chronic and transient poor. Further research is needed in identifying who are the chronic and transient poor and the causes of their poverty. Then appropriate interventions can be designed for the target groups. For example, for the chronic poor, providing access to education can be their way out of poverty. For the farmers who have become temporarily poor because of typhoons or other calamities, crop insurance schemes may be an effective way of keeping them from falling into poverty during times of bad crops.
Safety nets are also important during times of crisis to avert movements into
poverty. This is a challenge for the government. During periods of economic crises which have adverse social impacts, the demand for publicly provided goods and services is highest but this is also the time when the fiscal constraint is highest.
68.6%68.6%
31.4%31.4%
46.4%46.4%
7.1%7.1%
6.4%6.4%
8.7%8.7%
2.7%2.7%
3.2%3.2%
3.7%3.7%
21.7%21.7%
Note:refers to non-poorrefers to poor
1997 1998 1999
NNN
NNP
NPN
NPP
PNN
PNP
PPN
PPP
53.5%53.5%
6%6%
15.1%15.1%
25.4%25.4%
Chronic and Transient Poverty
Figure 8. Chronic and Transient Poverty Source: Reyes(2002)
16
3.3 Income Distribution
Measures of income distribution such as the GINI coefficient, decile dispersion ratio and share of the richest quintile are used to assess the situation with regards to income inequality. Again FIES data for 1988, 1991, 1994, 1997 and 2000 are used to generate the required data.
In addition to low per capita incomes, the distribution of income is also a
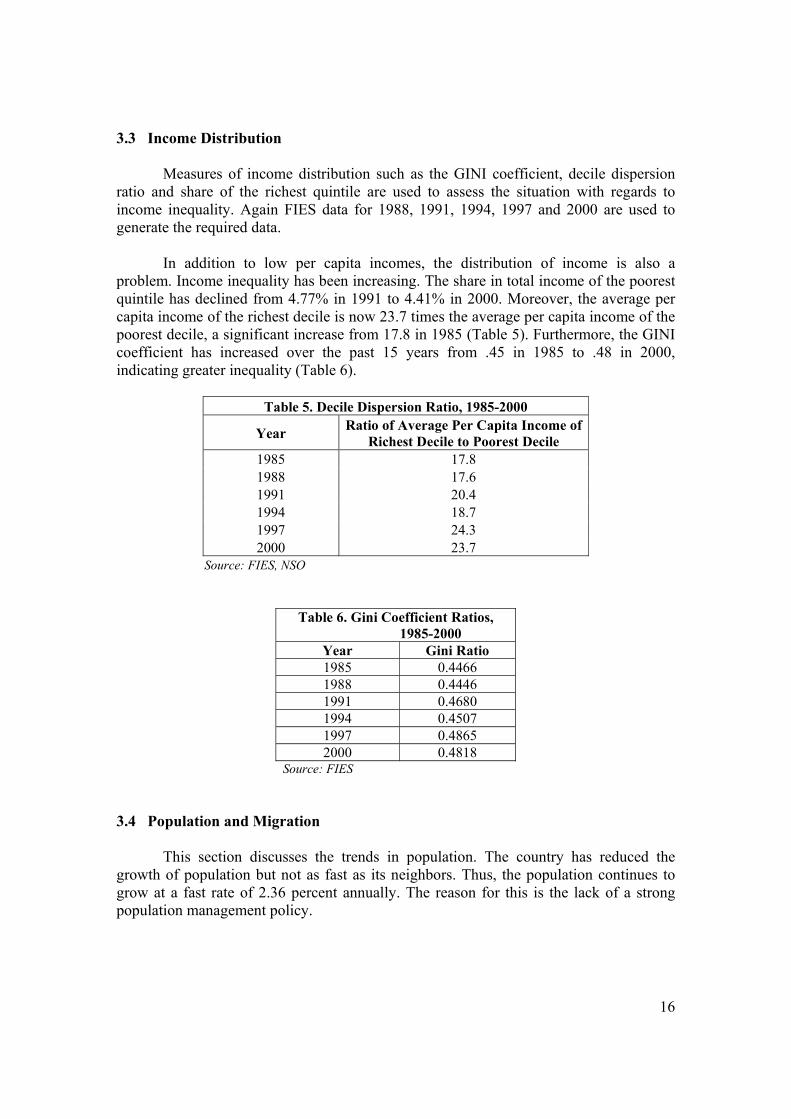
problem. Income inequality has been increasing. The share in total income of the poorest quintile has declined from 4.77% in 1991 to 4.41% in 2000. Moreover, the average per capita income of the richest decile is now 23.7 times the average per capita income of the poorest decile, a significant increase from 17.8 in 1985 (Table 5). Furthermore, the GINI coefficient has increased over the past 15 years from .45 in 1985 to .48 in 2000, indicating greater inequality (Table 6).
Table 5. Decile Dispersion Ratio, 1985-2000
Year Ratio of Average Per Capita Income of Richest Decile to Poorest Decile
1985 17.8 1988 17.6 1991 20.4 1994 18.7 1997 24.3 2000 23.7
Source: FIES, NSO
Table 6. Gini Coefficient Ratios,
1985-2000 Year Gini Ratio 1985 0.4466 1988 0.4446 1991 0.4680 1994 0.4507 1997 0.4865 2000 0.4818
Source: FIES
3.4 Population and Migration
This section discusses the trends in population. The country has reduced the growth of population but not as fast as its neighbors. Thus, the population continues to grow at a fast rate of 2.36 percent annually. The reason for this is the lack of a strong population management policy.
17
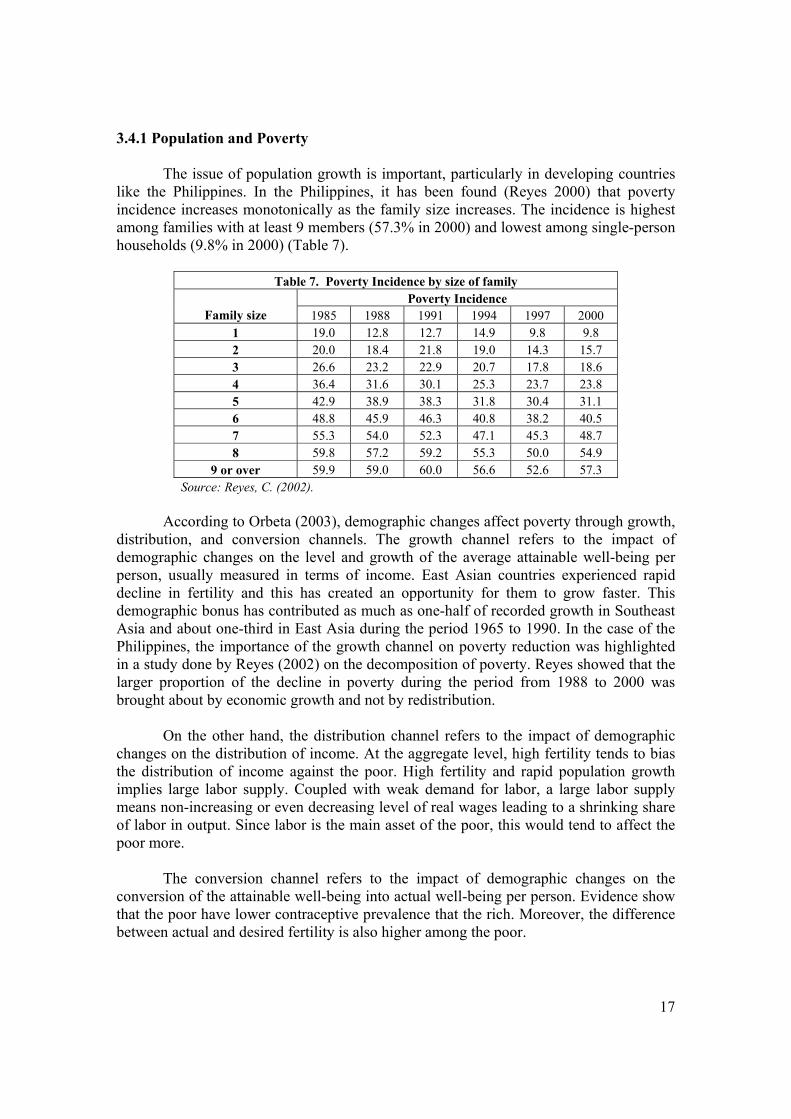
3.4.1 Population and Poverty
The issue of population growth is important, particularly in developing countries like the Philippines. In the Philippines, it has been found (Reyes 2000) that poverty incidence increases monotonically as the family size increases. The incidence is highest among families with at least 9 members (57.3% in 2000) and lowest among single-person households (9.8% in 2000) (Table 7).
Table 7. Poverty Incidence by size of family
Poverty Incidence Family size 1985 1988 1991 1994 1997 2000
1 19.0 12.8 12.7 14.9 9.8 9.8 2 20.0 18.4 21.8 19.0 14.3 15.7 3 26.6 23.2 22.9 20.7 17.8 18.6 4 36.4 31.6 30.1 25.3 23.7 23.8 5 42.9 38.9 38.3 31.8 30.4 31.1 6 48.8 45.9 46.3 40.8 38.2 40.5 7 55.3 54.0 52.3 47.1 45.3 48.7 8 59.8 57.2 59.2 55.3 50.0 54.9
9 or over 59.9 59.0 60.0 56.6 52.6 57.3 Source: Reyes, C. (2002).
According to Orbeta (2003), demographic changes affect poverty through growth,
distribution, and conversion channels. The growth channel refers to the impact of demographic changes on the level and growth of the average attainable well-being per person, usually measured in terms of income. East Asian countries experienced rapid decline in fertility and this has created an opportunity for them to grow faster. This demographic bonus has contributed as much as one-half of recorded growth in Southeast Asia and about one-third in East Asia during the period 1965 to 1990. In the case of the Philippines, the importance of the growth channel on poverty reduction was highlighted in a study done by Reyes (2002) on the decomposition of poverty. Reyes showed that the larger proportion of the decline in poverty during the period from 1988 to 2000 was brought about by economic growth and not by redistribution.
On the other hand, the distribution channel refers to the impact of demographic
changes on the distribution of income. At the aggregate level, high fertility tends to bias the distribution of income against the poor. High fertility and rapid population growth implies large labor supply. Coupled with weak demand for labor, a large labor supply means non-increasing or even decreasing level of real wages leading to a shrinking share of labor in output. Since labor is the main asset of the poor, this would tend to affect the poor more.
The conversion channel refers to the impact of demographic changes on the
conversion of the attainable well-being into actual well-being per person. Evidence show that the poor have lower contraceptive prevalence that the rich. Moreover, the difference between actual and desired fertility is also higher among the poor.
18
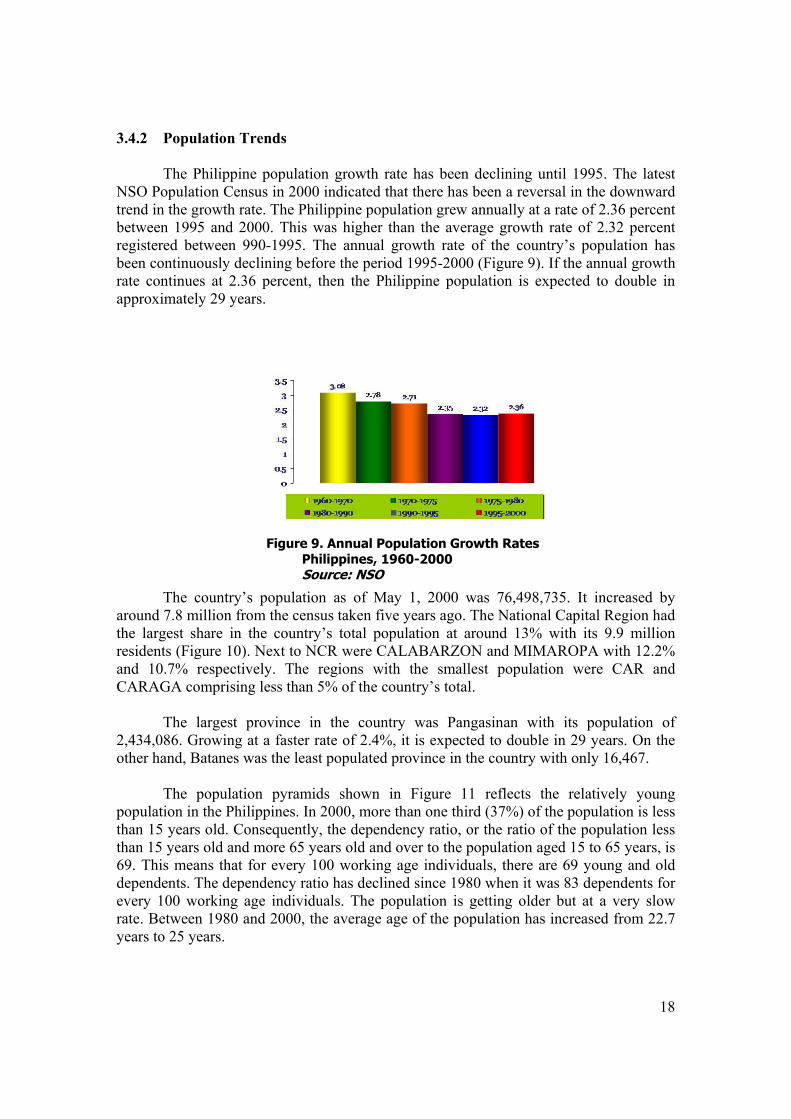
3.4.2 Population Trends The Philippine population growth rate has been declining until 1995. The latest
NSO Population Census in 2000 indicated that there has been a reversal in the downward trend in the growth rate. The Philippine population grew annually at a rate of 2.36 percent between 1995 and 2000. This was higher than the average growth rate of 2.32 percent registered between 990-1995. The annual growth rate of the country’s population has been continuously declining before the period 1995-2000 (Figure 9). If the annual growth rate continues at 2.36 percent, then the Philippine population is expected to double in approximately 29 years.
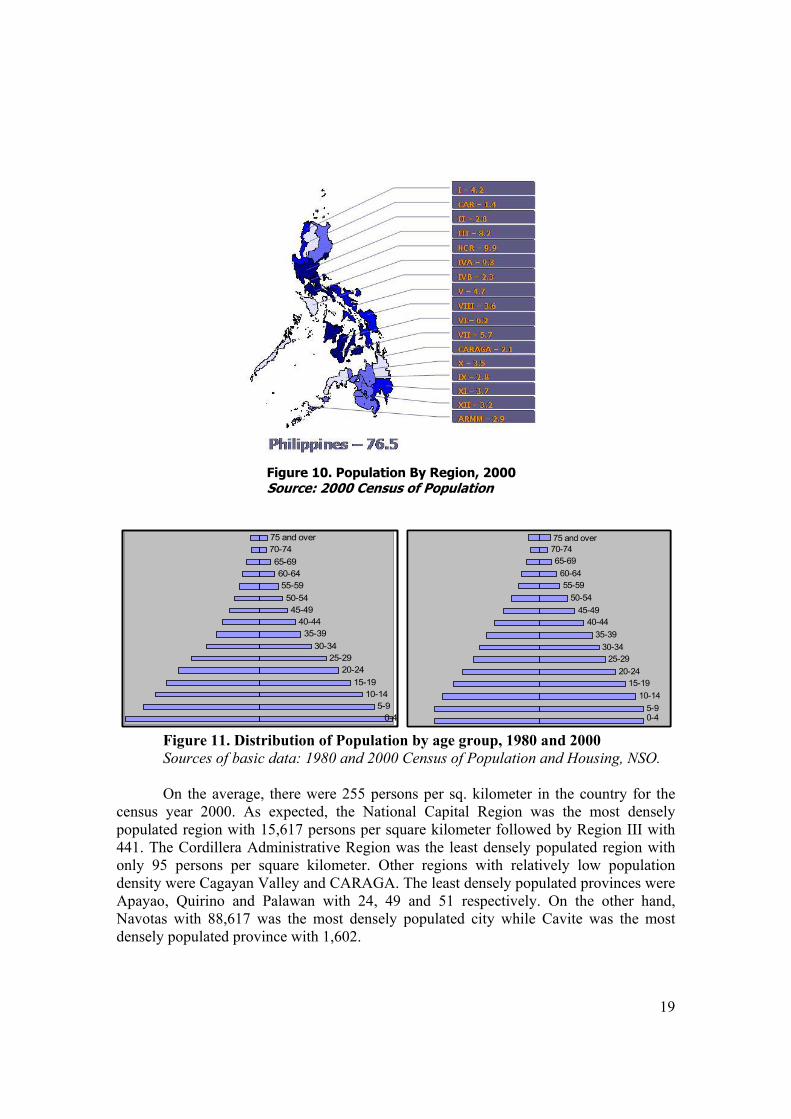
The country’s population as of May 1, 2000 was 76,498,735. It increased by
around 7.8 million from the census taken five years ago. The National Capital Region had the largest share in the country’s total population at around 13% with its 9.9 million residents (Figure 10). Next to NCR were CALABARZON and MIMAROPA with 12.2% and 10.7% respectively. The regions with the smallest population were CAR and CARAGA comprising less than 5% of the country’s total.
The largest province in the country was Pangasinan with its population of
2,434,086. Growing at a faster rate of 2.4%, it is expected to double in 29 years. On the other hand, Batanes was the least populated province in the country with only 16,467.
The population pyramids shown in Figure 11 reflects the relatively young population in the Philippines. In 2000, more than one third (37%) of the population is less than 15 years old. Consequently, the dependency ratio, or the ratio of the population less than 15 years old and more 65 years old and over to the population aged 15 to 65 years, is 69. This means that for every 100 working age individuals, there are 69 young and old dependents. The dependency ratio has declined since 1980 when it was 83 dependents for every 100 working age individuals. The population is getting older but at a very slow rate. Between 1980 and 2000, the average age of the population has increased from 22.7 years to 25 years.
Figure 9. Annual Population Growth RatesPhilippines, 1960-2000 Source: NSO
19
5-910-14
15-1920-24
25-2930-34
35-3940-44
45-4950-54
55-5960-64
65-6970-7475 and over
0-4
5-910-14
15-1920-24
25-2930-34
35-3940-44
45-4950-54
55-5960-64
65-6970-7475 and over
0-4
Figure 11. Distribution of Population by age group, 1980 and 2000 Sources of basic data: 1980 and 2000 Census of Population and Housing, NSO. On the average, there were 255 persons per sq. kilometer in the country for the
census year 2000. As expected, the National Capital Region was the most densely populated region with 15,617 persons per square kilometer followed by Region III with 441. The Cordillera Administrative Region was the least densely populated region with only 95 persons per square kilometer. Other regions with relatively low population density were Cagayan Valley and CARAGA. The least densely populated provinces were Apayao, Quirino and Palawan with 24, 49 and 51 respectively. On the other hand, Navotas with 88,617 was the most densely populated city while Cavite was the most densely populated province with 1,602.
Figure 10. Population By Region, 2000 Source: 2000 Census of Population
20
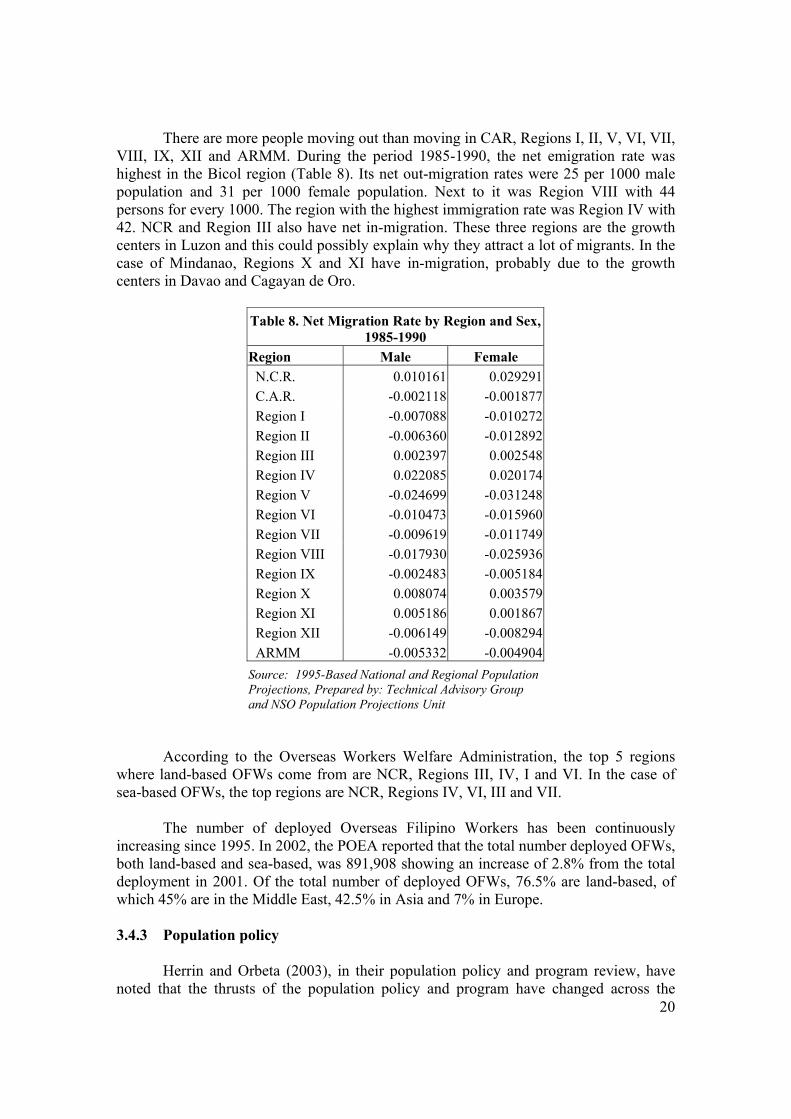
There are more people moving out than moving in CAR, Regions I, II, V, VI, VII, VIII, IX, XII and ARMM. During the period 1985-1990, the net emigration rate was highest in the Bicol region (Table 8). Its net out-migration rates were 25 per 1000 male population and 31 per 1000 female population. Next to it was Region VIII with 44 persons for every 1000. The region with the highest immigration rate was Region IV with 42. NCR and Region III also have net in-migration. These three regions are the growth centers in Luzon and this could possibly explain why they attract a lot of migrants. In the case of Mindanao, Regions X and XI have in-migration, probably due to the growth centers in Davao and Cagayan de Oro.
According to the Overseas Workers Welfare Administration, the top 5 regions
where land-based OFWs come from are NCR, Regions III, IV, I and VI. In the case of sea-based OFWs, the top regions are NCR, Regions IV, VI, III and VII. The number of deployed Overseas Filipino Workers has been continuously increasing since 1995. In 2002, the POEA reported that the total number deployed OFWs, both land-based and sea-based, was 891,908 showing an increase of 2.8% from the total deployment in 2001. Of the total number of deployed OFWs, 76.5% are land-based, of which 45% are in the Middle East, 42.5% in Asia and 7% in Europe.
3.4.3 Population policy
Herrin and Orbeta (2003), in their population policy and program review, have noted that the thrusts of the population policy and program have changed across the
Table 8. Net Migration Rate by Region and Sex, 1985-1990
Region Male Female N.C.R. 0.010161 0.029291 C.A.R. -0.002118 -0.001877 Region I -0.007088 -0.010272 Region II -0.006360 -0.012892 Region III 0.002397 0.002548 Region IV 0.022085 0.020174 Region V -0.024699 -0.031248 Region VI -0.010473 -0.015960 Region VII -0.009619 -0.011749 Region VIII -0.017930 -0.025936 Region IX -0.002483 -0.005184 Region X 0.008074 0.003579 Region XI 0.005186 0.001867 Region XII -0.006149 -0.008294 ARMM -0.005332 -0.004904Source: 1995-Based National and Regional Population Projections, Prepared by: Technical Advisory Group and NSO Population Projections Unit
21
different administrations. During the Marcos administration, the emphasis was on negative consequences of rapid population growth. It adopted the Family Planning Program that provided both information and services plus advocacy of a small family size norm. Under the Aquino Administration, the emphasis was on rights of couples to determine number of children. The Family Planning Program emphasized maternal and child health.
The Ramos Administration recognized the role of rapid population growth in
constraining socioeconomic progress. Under the Estrada Administration, the family planning program focused on assisting couples achieve their desired fertility and promoting health. It promoted contraceptive mix and looked at scenarios to achieve faster reduction in fertility.
The Family planning program of the Arroyo Administration emphasizes the
objective of assisting couples to achieve desired fertility and promote health. It gives emphasis on promoting modern Natural Family Planning. Moreover, it has declared that it will not fund purchase of contraceptives for distribution to public health facilities in the event bilateral and multilateral donors stop providing supplies.
Herrin and Orbeta concluded that there is a need to address rapid population
growth and fertility reduction once and for all. There is a need for clear and consistent statements of national policy to guide national and LGU programs – a need to forge a stable consensus. In formulating policy, the views of partner GOs and NGOs and the large, albeit unorganized and silent constituency, the married couples with unmet needs for contraception, need to be considered. 3.5 EDUCATION
3.5.1 Education and Poverty
The poverty status of the family is positively correlated with the educational attainment of the family head (Reyes 2000). Poverty incidence decreases monotonically as the educational attainment of the family head increases. Poverty incidence is highest among families whose head did not have any education (60.5% in 2000), while it is lowest among families headed by someone with at least a college degree (2.5%).
Previous studies have shown that the poor invest less on the human capital of their
children. Large family size is negatively related to school participation among older children and education expenditure per child. This has been identified as the main mechanism of the intergenerational transmission of poverty.
Thus, education is important in helping increase the capacities of the people to
meet their basic needs. It can break the vicious cycle of poverty. Moreover, literacy is also viewed as a basic need and being illiterate is considered as one of the dimensions of poverty.
This section examines the status and trends in the education sector. Key
performance indicators such as elementary and secondary school participation rates,
22
cohort survival rates, completion rates, drop-out rates, achievement tests, and literacy rate are analyzed. Performance of the technical and vocational education sub sector is also included. The role of the madrasah, particularly in Mindanao, is assessed to the extent that data will allow. Administrative records of the Department of Education are used to assess progress in the education sector over the last 12 years.
The various indicators show that literacy rate has increased owing to increased access to education. While elementary participation rate is high, there is a need to focus now on children in. remote areas, streetchildren, children living in extreme poverty, those in areas with armed conflict and children of indigenous peoples. Moreover, to reduce the number of dropouts, there is a need to focus on those in Grade 1, where the highest dropout rate occurs. Access to secondary schools has risen but could be further increased. On the other hand, the quality of education still needs to be improved considerably.
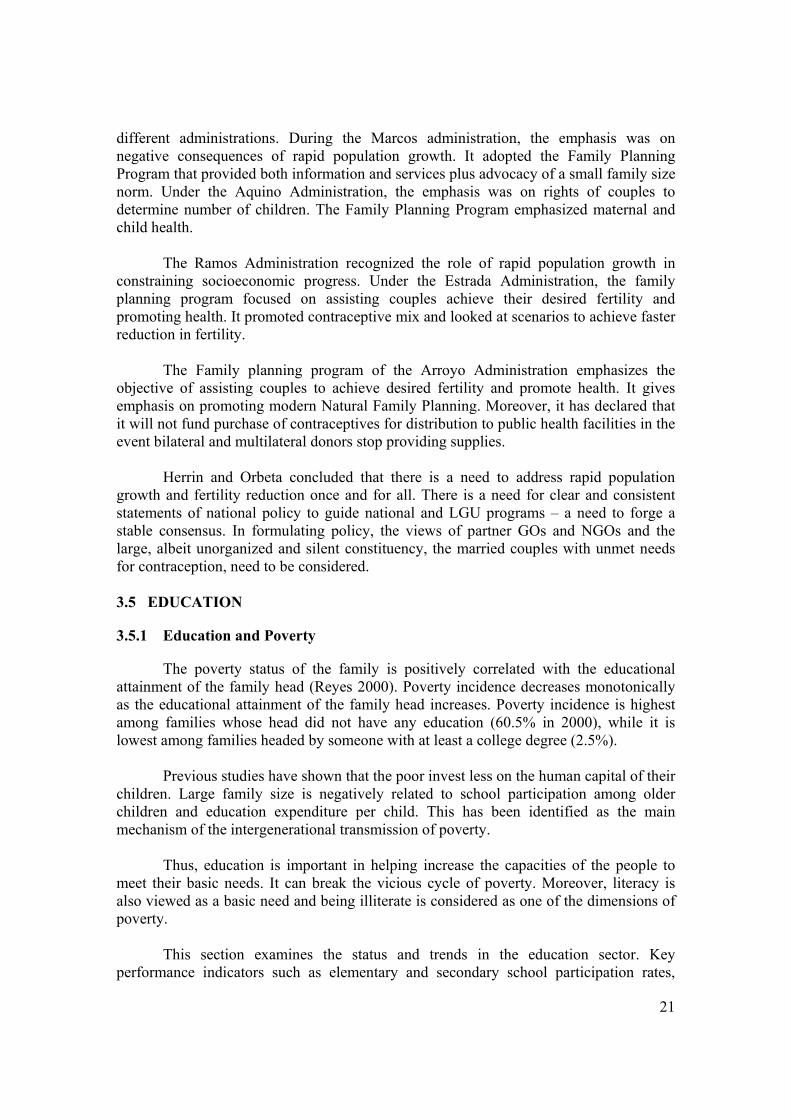
3.5.2 Elementary Participation Rate The elementary participation rate has been consistently increasing over time and is relatively high, compared to other developing countries. The challenge now is to reach children in remote areas, streetchildren, children living in extreme poverty, those in areas with armed conflict and children of indigenous peoples. In SY 2001-2002, 97% of all children in the elementary schooling age in fact went to elementary schools. This was higher than that of the previous school year (96.4%). From SY 1998-1999, the elementary participation rate increased by only 1.29 percentage points. (Note that while this set of data is the more recent one, it is not yet based on the 1995 Census like the one below. The map below is for the SY 2000-2001, which is based on the 1995 Census.)
Elementary participation rate is the net elementary enrolment rate, which is obtained by dividing the number of official elementary school aged enrollees (7-12) by the total population of children aged 7 to 12. (Recently, the DEPED has shifted the relevant age group to 6-11 years.) Below is a regional map on participation rates for the SY 2000-2001 (Figure 12). The data used for this map are still based on the old classification of regions. All regions have elementary participation rate higher than 90%. ARMM has the lowest rate at 91.3%, followed by CARAGA at 92.9%.
23
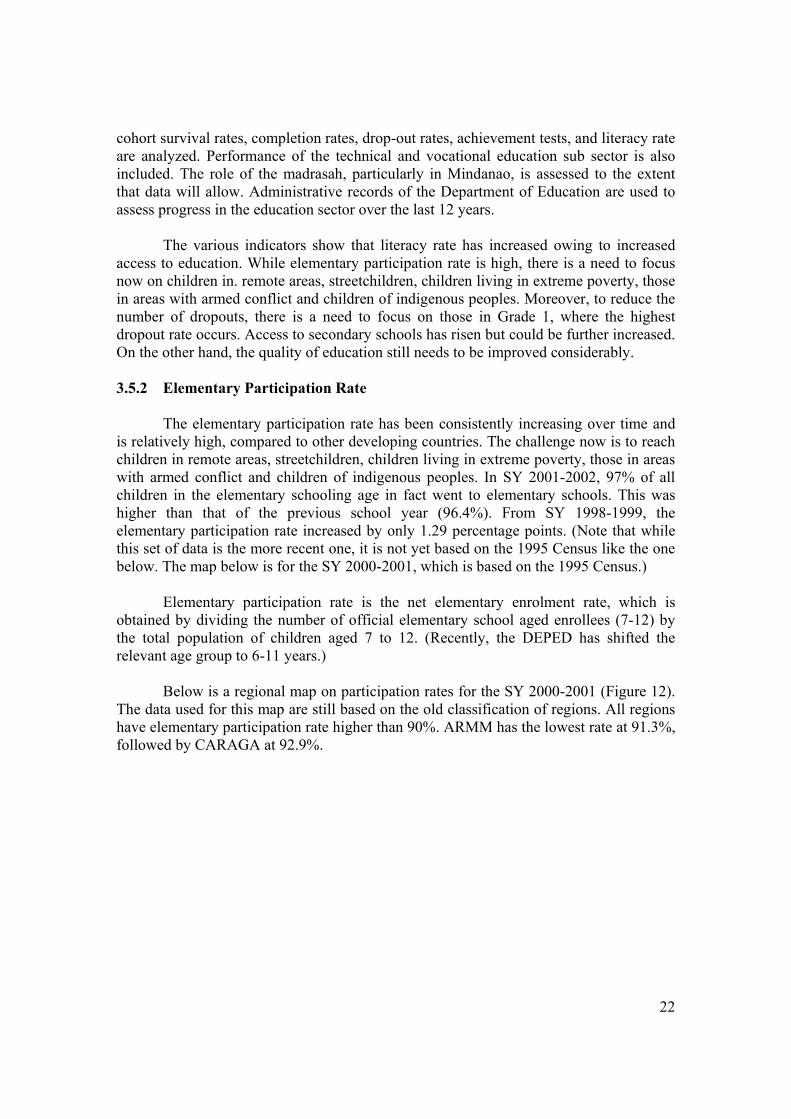
In SY 2000-2001, 92.3% of the elementary pupils attend public schools. The figure went up further to 92.9% in SY 2002-20002 indicating that the government is still the major provider of basic education to the Filipino children.
3.5.3 Secondary Participation Rate In SY 2001-2002, 73.4% of the population in the secondary schooling age actually went to secondary schools. This was higher than that of the previous school year.
Figure 12. Elementary Participation Rate by Region SY 2000-2001 Source: Planning Service, DepEd
Figure 13. Elementary Participation Rate by sector, Private/Public, Philippines Source: DepEd
24
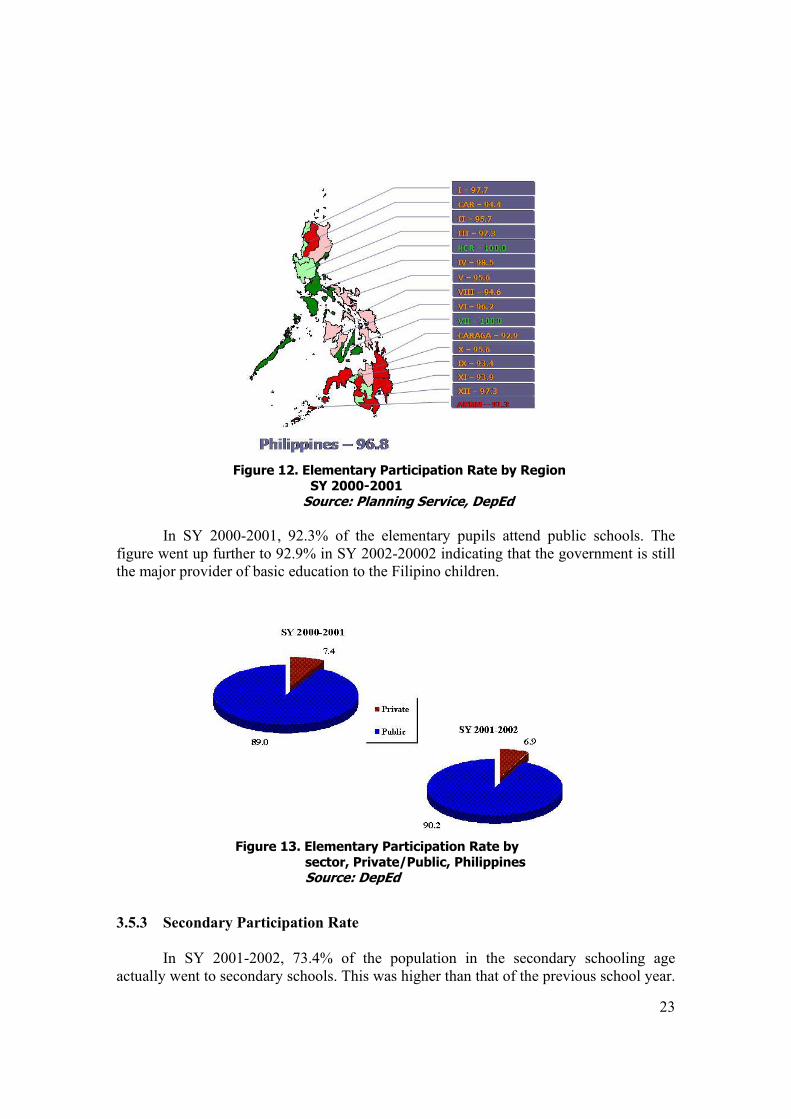
Over the years, this indicator has shown greater progress than the country’s elementary participation rate with 8.22 percentage point difference from SY 1998-1999 to SY 2001-2002. (Note that this set of data is not yet based on the 1995 Census. The map below is for the SY 2000-2001, which is based on the 1995 Census.) Participation rate is the net enrolment rate, which is obtained by dividing the number of official secondary school aged enrollees (13-16) by the total population of children aged 13-16. Below is a regional map on participation rates for the SY 2000-2001 (Figure 14). The data used for this map are still based on the old classification of regions, the one used by DepEd. For this school year, the country’s net enrollment ratio was 66.1%. This is higher than the participation rates in the last two school years averaging at over 65%. Secondary participation rate is highest in Region I at 87.5% and lowest in ARMM at 21.5%. In general, the secondary participation rates are higher in Luzon than in the Visayas and Mindanao. Except for Bicol, the rates are higher than 70% in all the regions in Luzon. Region VIII in the Visayas has the second lowest rate among all the regions in the country at 48.2%. In Mindanao, Region XII has the highest at 69.9%, higher than all the regions in Visayas.
The Department of Education (DepEd) has reported that in the same school year,
68.3% of the total female population aged 13-16 were actually enrolled in high schools compared to only 62.6% for the males.
The secondary participation rate in the public sector was higher than that of the
private one. The participation rate for the private sector has been constantly increasing while that of the public sector has somewhat stabilized during the last two school years.
Figure 14. Secondary Participation Rate by Region SY 2000-2001 Source: DepEd
25
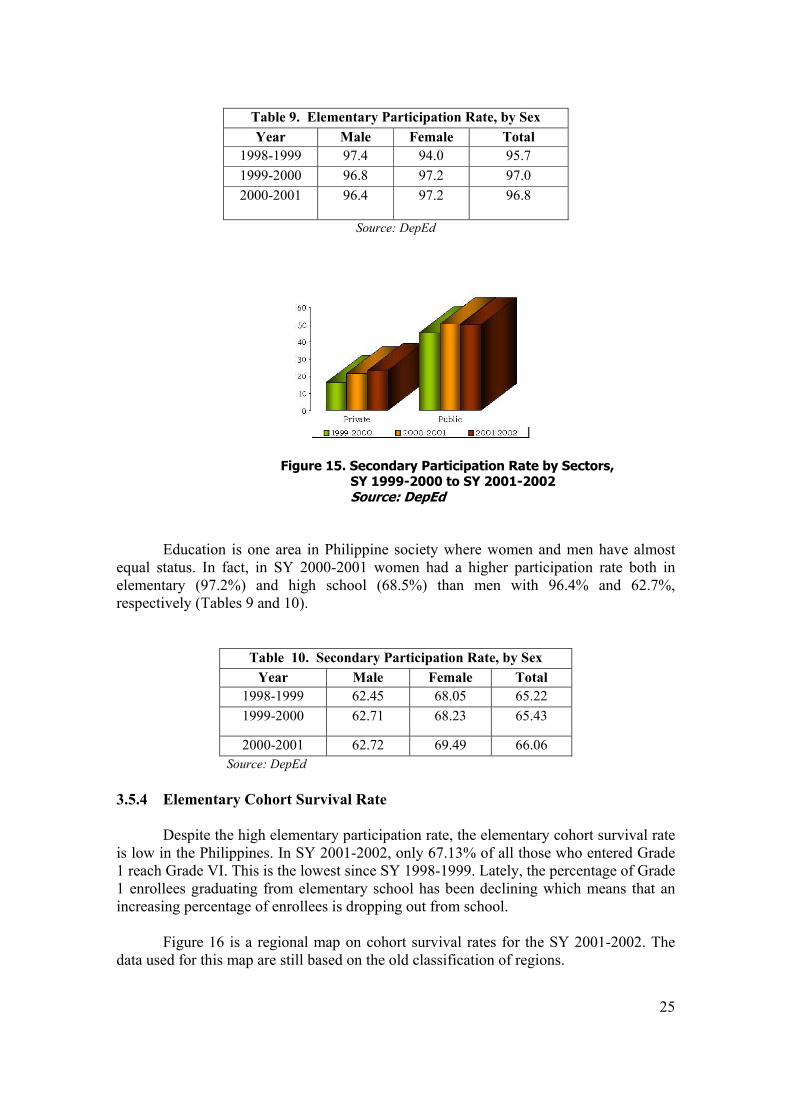
Education is one area in Philippine society where women and men have almost equal status. In fact, in SY 2000-2001 women had a higher participation rate both in elementary (97.2%) and high school (68.5%) than men with 96.4% and 62.7%, respectively (Tables 9 and 10).
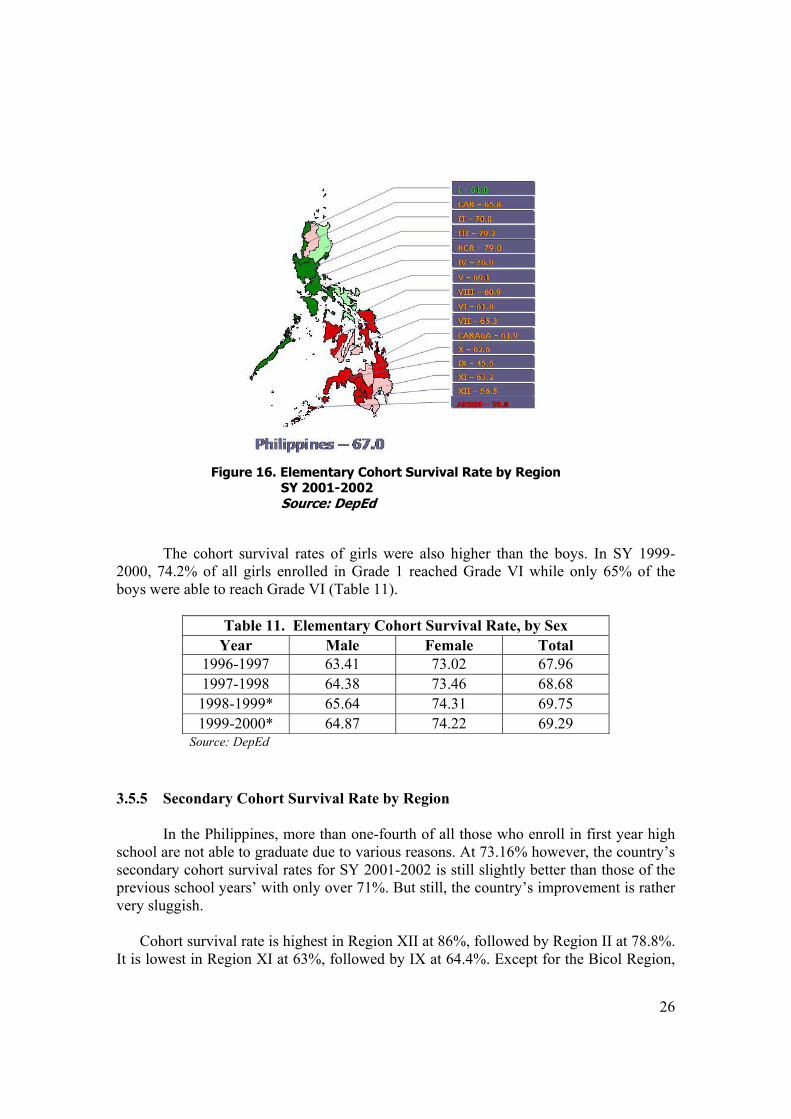
3.5.4 Elementary Cohort Survival Rate Despite the high elementary participation rate, the elementary cohort survival rate is low in the Philippines. In SY 2001-2002, only 67.13% of all those who entered Grade 1 reach Grade VI. This is the lowest since SY 1998-1999. Lately, the percentage of Grade 1 enrollees graduating from elementary school has been declining which means that an increasing percentage of enrollees is dropping out from school. Figure 16 is a regional map on cohort survival rates for the SY 2001-2002. The data used for this map are still based on the old classification of regions.
Table 9. Elementary Participation Rate, by Sex Year Male Female Total
1998-1999 97.4 94.0 95.7 1999-2000 96.8 97.2 97.0 2000-2001 96.4 97.2 96.8
Source: DepEd
Table 10. Secondary Participation Rate, by Sex Year Male Female Total
1998-1999 62.45 68.05 65.22 1999-2000 62.71 68.23 65.43
2000-2001 62.72 69.49 66.06 Source: DepEd
Figure 15. Secondary Participation Rate by Sectors, SY 1999-2000 to SY 2001-2002 Source: DepEd
26
The cohort survival rates of girls were also higher than the boys. In SY 1999-
2000, 74.2% of all girls enrolled in Grade 1 reached Grade VI while only 65% of the boys were able to reach Grade VI (Table 11).
Table 11. Elementary Cohort Survival Rate, by Sex
Year Male Female Total 1996-1997 63.41 73.02 67.96 1997-1998 64.38 73.46 68.68 1998-1999* 65.64 74.31 69.75 1999-2000* 64.87 74.22 69.29
Source: DepEd
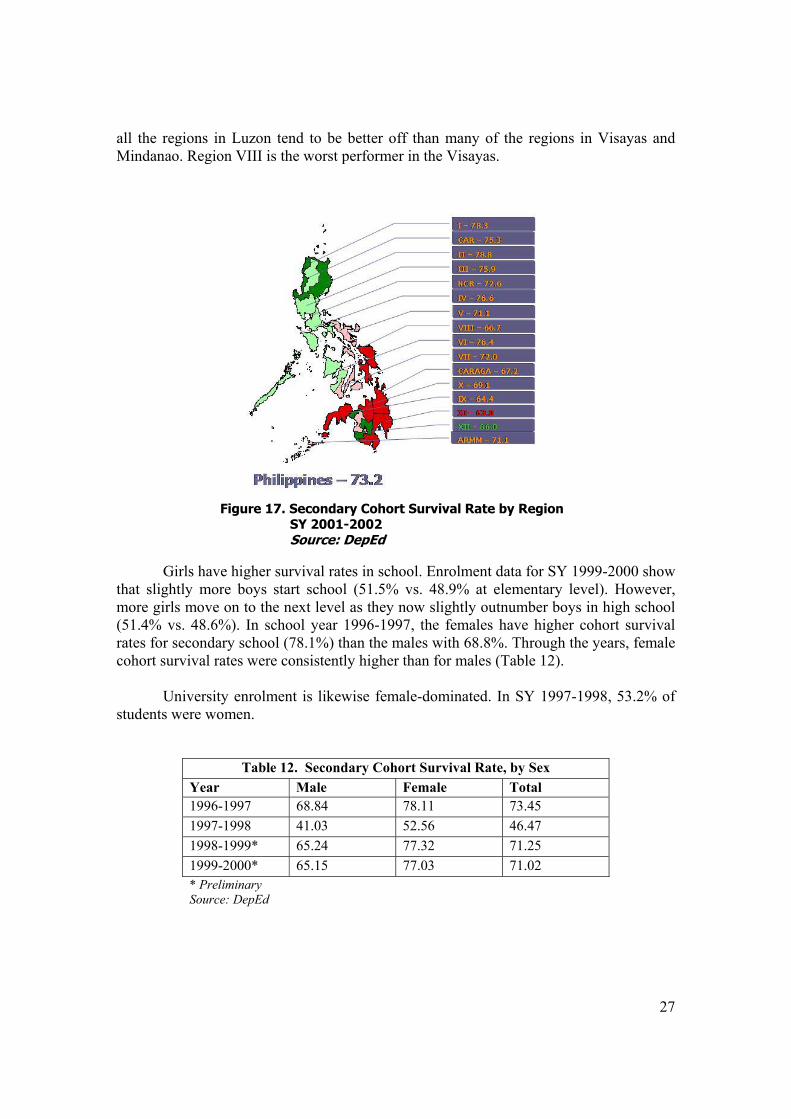
3.5.5 Secondary Cohort Survival Rate by Region In the Philippines, more than one-fourth of all those who enroll in first year high school are not able to graduate due to various reasons. At 73.16% however, the country’s secondary cohort survival rates for SY 2001-2002 is still slightly better than those of the previous school years’ with only over 71%. But still, the country’s improvement is rather very sluggish. Cohort survival rate is highest in Region XII at 86%, followed by Region II at 78.8%. It is lowest in Region XI at 63%, followed by IX at 64.4%. Except for the Bicol Region,
Figure 16. Elementary Cohort Survival Rate by Region SY 2001-2002 Source: DepEd
27
all the regions in Luzon tend to be better off than many of the regions in Visayas and Mindanao. Region VIII is the worst performer in the Visayas.
Girls have higher survival rates in school. Enrolment data for SY 1999-2000 show that slightly more boys start school (51.5% vs. 48.9% at elementary level). However, more girls move on to the next level as they now slightly outnumber boys in high school (51.4% vs. 48.6%). In school year 1996-1997, the females have higher cohort survival rates for secondary school (78.1%) than the males with 68.8%. Through the years, female cohort survival rates were consistently higher than for males (Table 12). University enrolment is likewise female-dominated. In SY 1997-1998, 53.2% of students were women.
Table 12. Secondary Cohort Survival Rate, by Sex Year Male Female Total 1996-1997 68.84 78.11 73.45 1997-1998 41.03 52.56 46.47 1998-1999* 65.24 77.32 71.25 1999-2000* 65.15 77.03 71.02 * Preliminary Source: DepEd
Figure 17. Secondary Cohort Survival Rate by Region SY 2001-2002 Source: DepEd
28
3.5.6 National Elementary Achievement Test2 While access to basic education has improved over time, the quality of education
is still low and consequently merits more attention. NEAT is the national examination that aims to measure learning outcomes in the
elementary level in response to the need of enhancing quality education as recommended by the Congressional Commission on Education. It is designed to assess abilities and skills of Grade VI pupils in all public and private elementary schools. (DECS) Percent Correct refers to the ratio between the number of correctly answered items and the total number of test questions or the percentage of correctly answered items in a test.
The average score in the NEAT of Grade VI students in the country was 51.73 percent for SY 2000-2001. This is a little bit higher than in 1999 (49.19) and in 1998 (50.08). The regional trend shows that majority of the regions have improving NEAT performance. Region XII has the worst performance in 2000 with only 44.91 percent. Region VIII, on the other hand, has outperformed other regions with 67.97 followed by Caraga (66.99). The three provinces with the highest NEAT average in 2000 were Eastern Samar with 71.38 percent, Agusan del Norte (70.95) and Agusan del Sur (70.05). Cotabato City, on the other hand, had the lowest with only 40.11 percent, followed by Apayao (40.36), and Davao Oriental (40.64). A score of 40 indicate that on the average students answer correctly only 4 out of every 10 questions. Moreover, the results in 2000 indicate that scores in Math, English and Science are all below 50 percent.
3.5.7 National Secondary Achievement Test 3 . NSAT is the national examination that aims to assess abilities and skills of Fourth (4th) year high school students in all public and private secondary schools. Percent Correct refers to the ratio between the number of correctly answered items and the total number of test questions or the percentage of correctly answered items in a test. The average score of senior high school students in the country was 53.39 percent in the SY 2000-2001 NSAT. This is lower than in 1999 (54.35 percent) but higher than in 1998 (46.12). Among the regions, Region VI has the lowest with only 48.89 percent. It has been performing below the national level for the last three school years. Region XII had the lowest rate for 1998 (39.1) and 1999 (48.64). Region VIII, on the other hand, had the highest NSAT average both in 2000 (63.89) and 1999 (62.66). Like the case of NEAT, Cotabato City is the worst performing area with only 44.75 percent while Eastern Samar has the highest percentage with 67.03 percent. The results for 2000 reveal low scores for Math, Science and English. Performance has consistently been lowest in Science. 3 Percent Correct
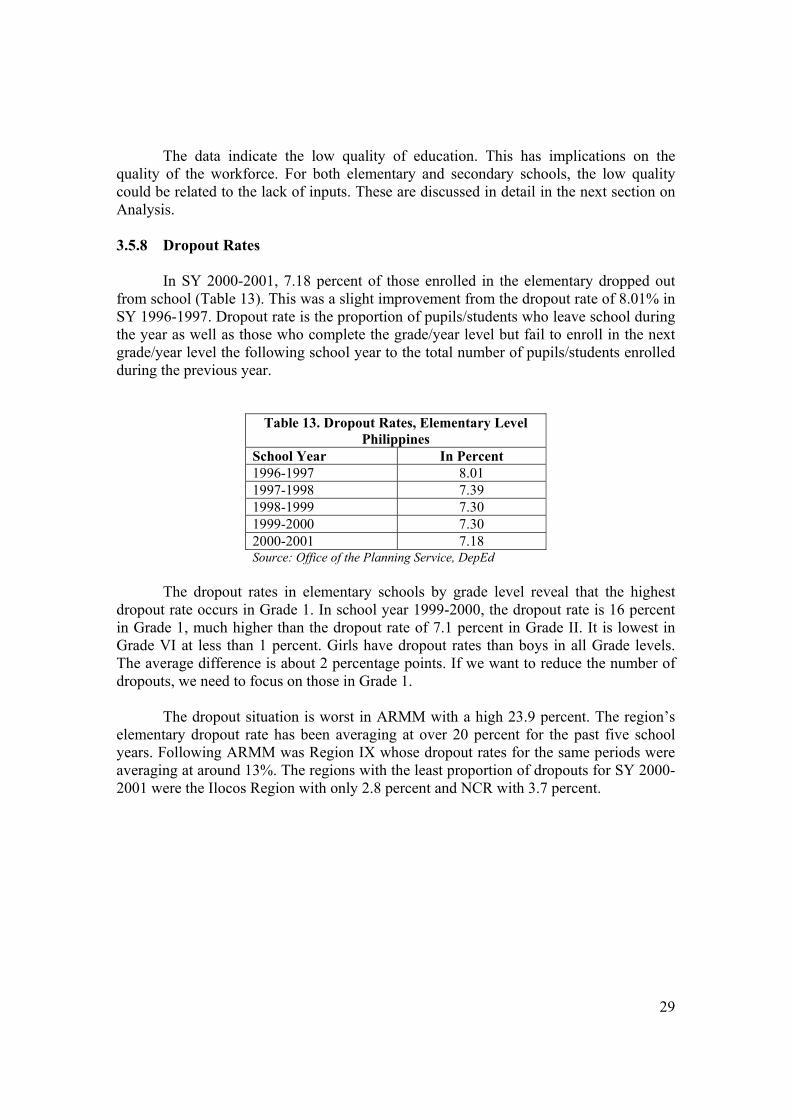
29
The data indicate the low quality of education. This has implications on the quality of the workforce. For both elementary and secondary schools, the low quality could be related to the lack of inputs. These are discussed in detail in the next section on Analysis. 3.5.8 Dropout Rates In SY 2000-2001, 7.18 percent of those enrolled in the elementary dropped out from school (Table 13). This was a slight improvement from the dropout rate of 8.01% in SY 1996-1997. Dropout rate is the proportion of pupils/students who leave school during the year as well as those who complete the grade/year level but fail to enroll in the next grade/year level the following school year to the total number of pupils/students enrolled during the previous year.
Table 13. Dropout Rates, Elementary Level Philippines
School Year In Percent 1996-1997 8.01 1997-1998 7.39 1998-1999 7.30 1999-2000 7.30 2000-2001 7.18 Source: Office of the Planning Service, DepEd
The dropout rates in elementary schools by grade level reveal that the highest dropout rate occurs in Grade 1. In school year 1999-2000, the dropout rate is 16 percent in Grade 1, much higher than the dropout rate of 7.1 percent in Grade II. It is lowest in Grade VI at less than 1 percent. Girls have dropout rates than boys in all Grade levels. The average difference is about 2 percentage points. If we want to reduce the number of dropouts, we need to focus on those in Grade 1. The dropout situation is worst in ARMM with a high 23.9 percent. The region’s elementary dropout rate has been averaging at over 20 percent for the past five school years. Following ARMM was Region IX whose dropout rates for the same periods were averaging at around 13%. The regions with the least proportion of dropouts for SY 2000-2001 were the Ilocos Region with only 2.8 percent and NCR with 3.7 percent.
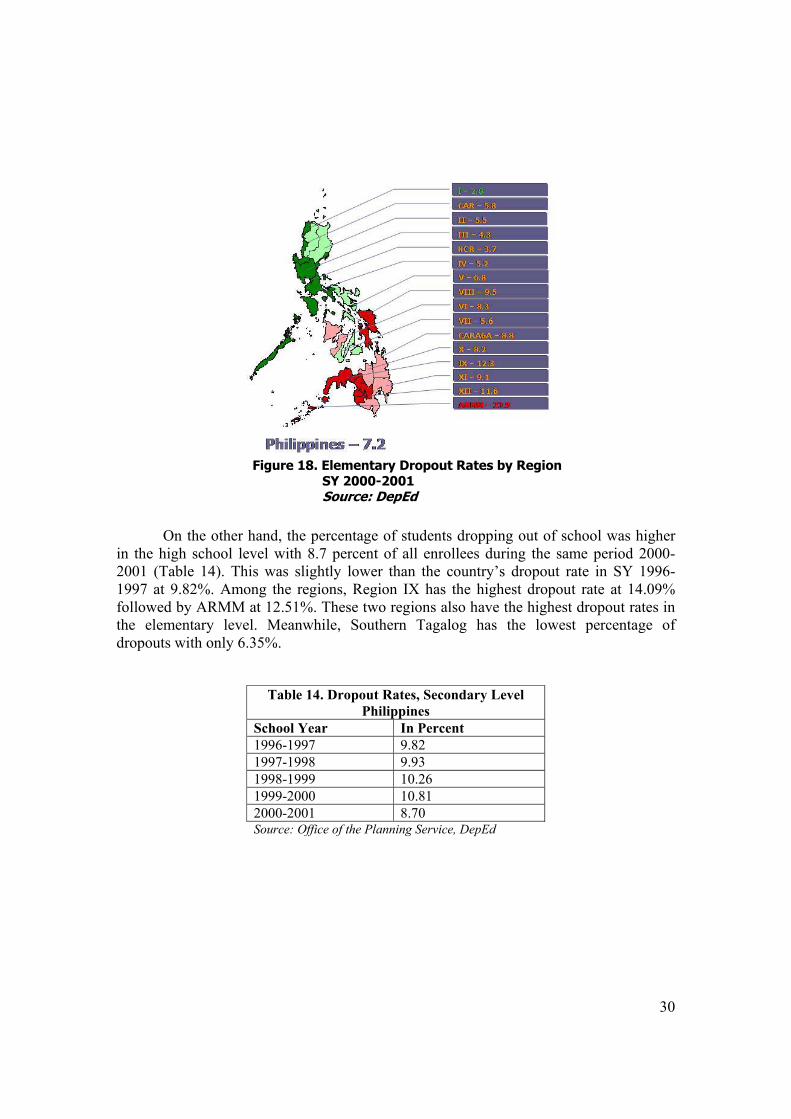
30
On the other hand, the percentage of students dropping out of school was higher
in the high school level with 8.7 percent of all enrollees during the same period 2000-2001 (Table 14). This was slightly lower than the country’s dropout rate in SY 1996-1997 at 9.82%. Among the regions, Region IX has the highest dropout rate at 14.09% followed by ARMM at 12.51%. These two regions also have the highest dropout rates in the elementary level. Meanwhile, Southern Tagalog has the lowest percentage of dropouts with only 6.35%.
Table 14. Dropout Rates, Secondary Level Philippines
School Year In Percent 1996-1997 9.82 1997-1998 9.93 1998-1999 10.26 1999-2000 10.81 2000-2001 8.70 Source: Office of the Planning Service, DepEd
Figure 18. Elementary Dropout Rates by Region SY 2000-2001 Source: DepEd
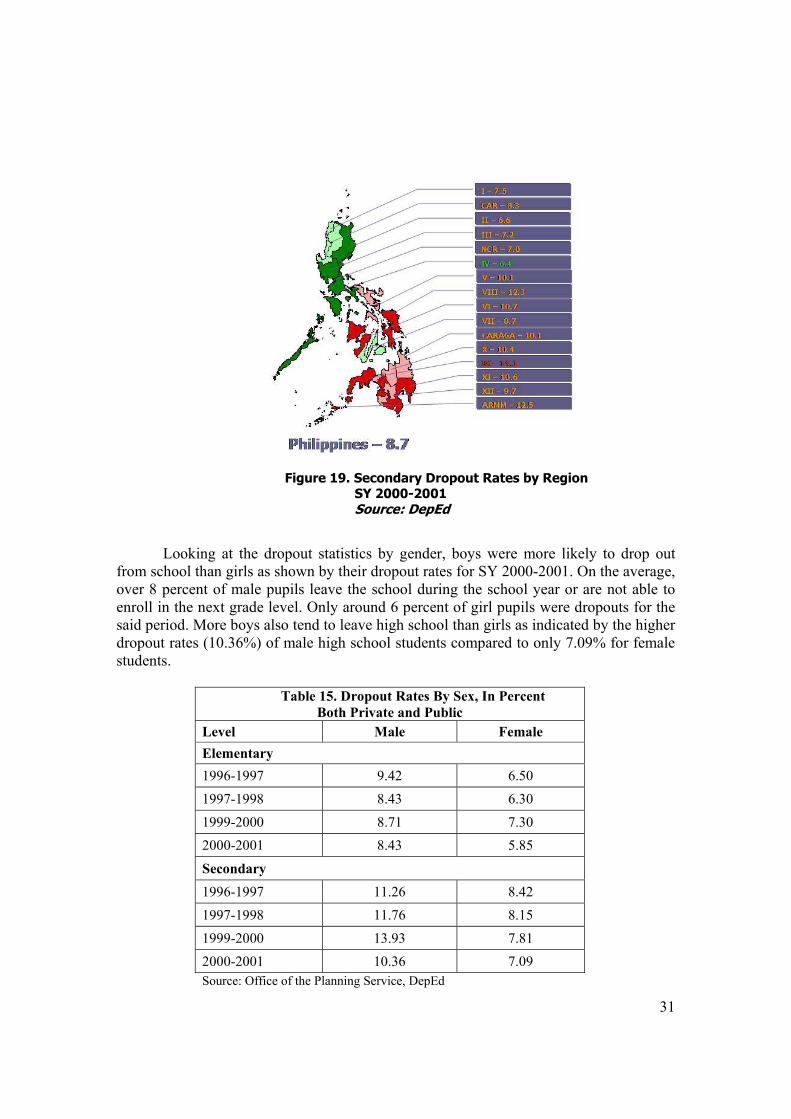
31
Looking at the dropout statistics by gender, boys were more likely to drop out
from school than girls as shown by their dropout rates for SY 2000-2001. On the average, over 8 percent of male pupils leave the school during the school year or are not able to enroll in the next grade level. Only around 6 percent of girl pupils were dropouts for the said period. More boys also tend to leave high school than girls as indicated by the higher dropout rates (10.36%) of male high school students compared to only 7.09% for female students.
Table 15. Dropout Rates By Sex, In Percent
Both Private and Public Level Male Female Elementary 1996-1997 9.42 6.50 1997-1998 8.43 6.30 1999-2000 8.71 7.30 2000-2001 8.43 5.85
Secondary 1996-1997 11.26 8.42 1997-1998 11.76 8.15 1999-2000 13.93 7.81 2000-2001 10.36 7.09 Source: Office of the Planning Service, DepEd
Figure 19. Secondary Dropout Rates by Region SY 2000-2001 Source: DepEd
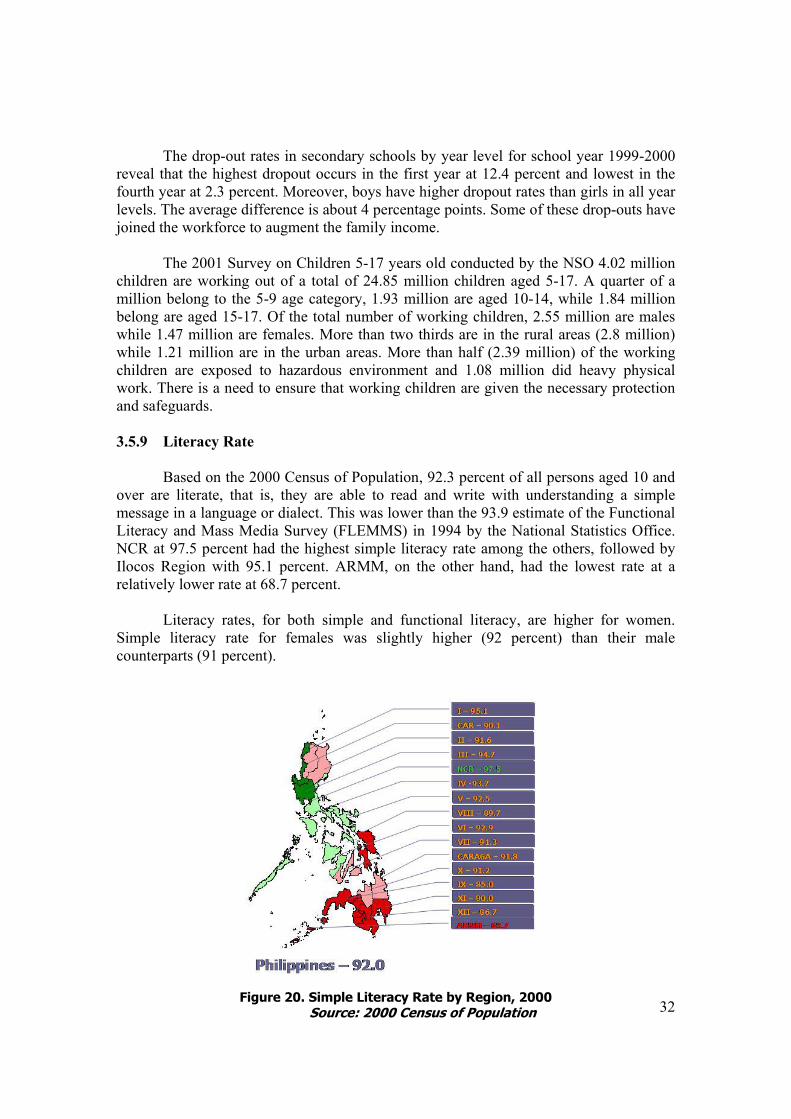
32
The drop-out rates in secondary schools by year level for school year 1999-2000 reveal that the highest dropout occurs in the first year at 12.4 percent and lowest in the fourth year at 2.3 percent. Moreover, boys have higher dropout rates than girls in all year levels. The average difference is about 4 percentage points. Some of these drop-outs have joined the workforce to augment the family income.
The 2001 Survey on Children 5-17 years old conducted by the NSO 4.02 million children are working out of a total of 24.85 million children aged 5-17. A quarter of a million belong to the 5-9 age category, 1.93 million are aged 10-14, while 1.84 million belong are aged 15-17. Of the total number of working children, 2.55 million are males while 1.47 million are females. More than two thirds are in the rural areas (2.8 million) while 1.21 million are in the urban areas. More than half (2.39 million) of the working children are exposed to hazardous environment and 1.08 million did heavy physical work. There is a need to ensure that working children are given the necessary protection and safeguards. 3.5.9 Literacy Rate
Based on the 2000 Census of Population, 92.3 percent of all persons aged 10 and over are literate, that is, they are able to read and write with understanding a simple message in a language or dialect. This was lower than the 93.9 estimate of the Functional Literacy and Mass Media Survey (FLEMMS) in 1994 by the National Statistics Office. NCR at 97.5 percent had the highest simple literacy rate among the others, followed by Ilocos Region with 95.1 percent. ARMM, on the other hand, had the lowest rate at a relatively lower rate at 68.7 percent.
Literacy rates, for both simple and functional literacy, are higher for women.
Simple literacy rate for females was slightly higher (92 percent) than their male counterparts (91 percent).
Figure 20. Simple Literacy Rate by Region, 2000 Source: 2000 Census of Population
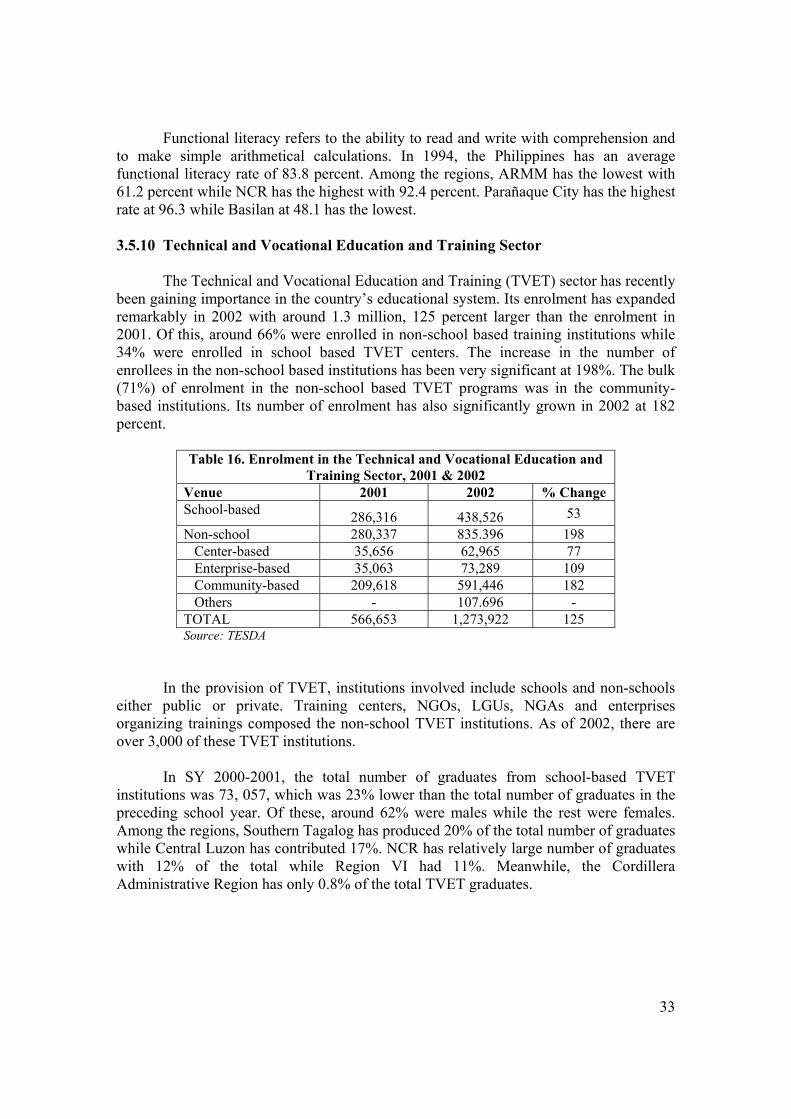
33
Functional literacy refers to the ability to read and write with comprehension and to make simple arithmetical calculations. In 1994, the Philippines has an average functional literacy rate of 83.8 percent. Among the regions, ARMM has the lowest with 61.2 percent while NCR has the highest with 92.4 percent. Parañaque City has the highest rate at 96.3 while Basilan at 48.1 has the lowest. 3.5.10 Technical and Vocational Education and Training Sector
The Technical and Vocational Education and Training (TVET) sector has recently
been gaining importance in the country’s educational system. Its enrolment has expanded remarkably in 2002 with around 1.3 million, 125 percent larger than the enrolment in 2001. Of this, around 66% were enrolled in non-school based training institutions while 34% were enrolled in school based TVET centers. The increase in the number of enrollees in the non-school based institutions has been very significant at 198%. The bulk (71%) of enrolment in the non-school based TVET programs was in the community-based institutions. Its number of enrolment has also significantly grown in 2002 at 182 percent.
Table 16. Enrolment in the Technical and Vocational Education and
Training Sector, 2001 & 2002 Venue 2001 2002 % Change School-based 286,316 438,526 53 Non-school 280,337 835.396 198 Center-based 35,656 62,965 77 Enterprise-based 35,063 73,289 109 Community-based 209,618 591,446 182 Others - 107.696 - TOTAL 566,653 1,273,922 125 Source: TESDA
In the provision of TVET, institutions involved include schools and non-schools
either public or private. Training centers, NGOs, LGUs, NGAs and enterprises organizing trainings composed the non-school TVET institutions. As of 2002, there are over 3,000 of these TVET institutions.
In SY 2000-2001, the total number of graduates from school-based TVET
institutions was 73, 057, which was 23% lower than the total number of graduates in the preceding school year. Of these, around 62% were males while the rest were females. Among the regions, Southern Tagalog has produced 20% of the total number of graduates while Central Luzon has contributed 17%. NCR has relatively large number of graduates with 12% of the total while Region VI had 11%. Meanwhile, the Cordillera Administrative Region has only 0.8% of the total TVET graduates.
34
3.5.11 MADRASAH SYSTEM4
Madrasah is an Arabic name for school, the plural form of which is madaris. It is a community-based and community managed school whose teachings are based on the Qur’an. The madrasah was first introduced in the Philippines in the 13th century by Makhdum Kharim, who built the first mosque in the country in Tubig, Indangan, Simunul, Tawi-Tawi.
In the Philippines, most of the madaris are located in Mindanao, where majority of the Muslim communities are located. They cater mostly to poor rural areas where parents appreciate their community-based approach, strict discipline, socio-cultural relevance and focus on Islam and moral education. The madaris have become an important part of the education system in Mindanao, enrolling 22 percent of the elementary school students and 2 percent of the secondary school students.5 However, while they play a significant role in the education of the Muslim Mindanao population, they are not recognized by the government, which, ironically, is mandated by the Constitution to provide relevant and accessible education to all its citizens, especially the poor and underprivileged. Instead, the government effectively deprives the Muslim population who undergo schooling exclusively in madaris with opportunities provided those who undergo schooling in DECS schools.
The delivery of basic education is the primary responsibility of the Department of
Education (DepEd) through its two (2) major structural components: the Central Office and field offices which consist of regional and sub-regional (division and district) offices. Higher education is the responsibility of the Commission on Higher Education (CHED), while technical education is provided through the Technical Education and Skills Development Authority (TESDA).
Education in the country is offered through the formal and non-formal systems, as follows: In the formal system, the educational ladder has a 6-4-4 structure, i.e., six (6) years of elementary or primary education, six (6) years of secondary or high school education, and four (4) years of higher education for a degree program (except for some courses like Engineering, Law and Medical sciences which require five (5) or more years of schooling. Pre-school education is optional; private organizations and some public schools offer nursery and kindergarten classes. Some private exclusive schools offer seven (7) years of elementary education, while others require pre-school or kindergarten education. The number of years for formal schooling is one of the shortest in the world. There are two (2) types of secondary schools according to curricular offerings: the general high school and vocational high school. General high schools offer the four-year general academic secondary curriculum, while vocational high schools offer the same secondary curriculum with additional courses. The tertiary education level comprise of degree and non-degree programs. Post-secondary or technical/vocational courses are non-creditable to degree programs and these cover one (1) month to three (3) years of 4 This section is taken from the paper “Integration of the Madrasah System of Education into the Philippine Educational System” by Castro and Ginete. 5 Basic data sourced from the project design of the Mindanao Basic Education Development Project (MBEDP).
35
schooling. The higher education degree programs normally require at least four (4) years of schooling.
Non-formal education is an alternative delivery system, which cater mostly to out-of-school youth and adults. It focuses on the development of literacy and employable/ productive skills coupled with citizenship training. The Madrasah System of Education6
Generally, the madrasah is a Muslim school that teaches Arabic and Islamic studies, especially Qur’anic reading and Arabic language. Some madaris also offer general courses such as math, science and health in addition to Islamic studies. In Muslim communities, it is considered not only as an institution of learning but also a symbol of Islam and regarded as the proper place to acquire knowledge in Arabic language and Islamic religious teaching. In most cases, Arabic is the medium of instruction and used for conversation with the teachers or among the students themselves.
The number of years to finish the two (2) levels of education in the madrasah system is 12 years: four (4) years for the primary level (Ibtida’i), four (4) years for the intermediate level (I’dade), and another four (4) years for high school (Thanawi). A madrasah offering a complete 12 years program is known as ma’ahad (plural is ma’ahid). If it offers only the primary or intermediate or both, it is simply called madrasah.
The Madrasah is a privately owned school whose administrative machinery is performed either by the community through an elected group or by a mosque-based organization. In most cases, it is managed personally by its owner(s) and supported by a head teacher or principal (senior ustadz). Financial support comes from the tuition fees and from donations from affluent persons in the community, and occasionally, from Muslim countries in the Middle East for infrastructure and teaching aids like books and other instructional materials. State of the Education Sector in Mindanao
The madaris are found in all political regions in Mindanao, where there are roughly 1,171 operating madaris (for basic education only) having a total enrolment of 92,088 students (DECS-ARMM and MBDEP estimates, 1997). Most of the madaris are concentrated in ARMM where correspondingly, the highest enrolment among all Mindanao regions is found (Table 17). This could probably explain why elementary and secondary enrolment in schools operated by the Department of Education is relatively low in ARMM.
6 A Madrasah General Education Program for Mindanao (Lolita Junio Damonsong-Rodriguez, Ph.D.)
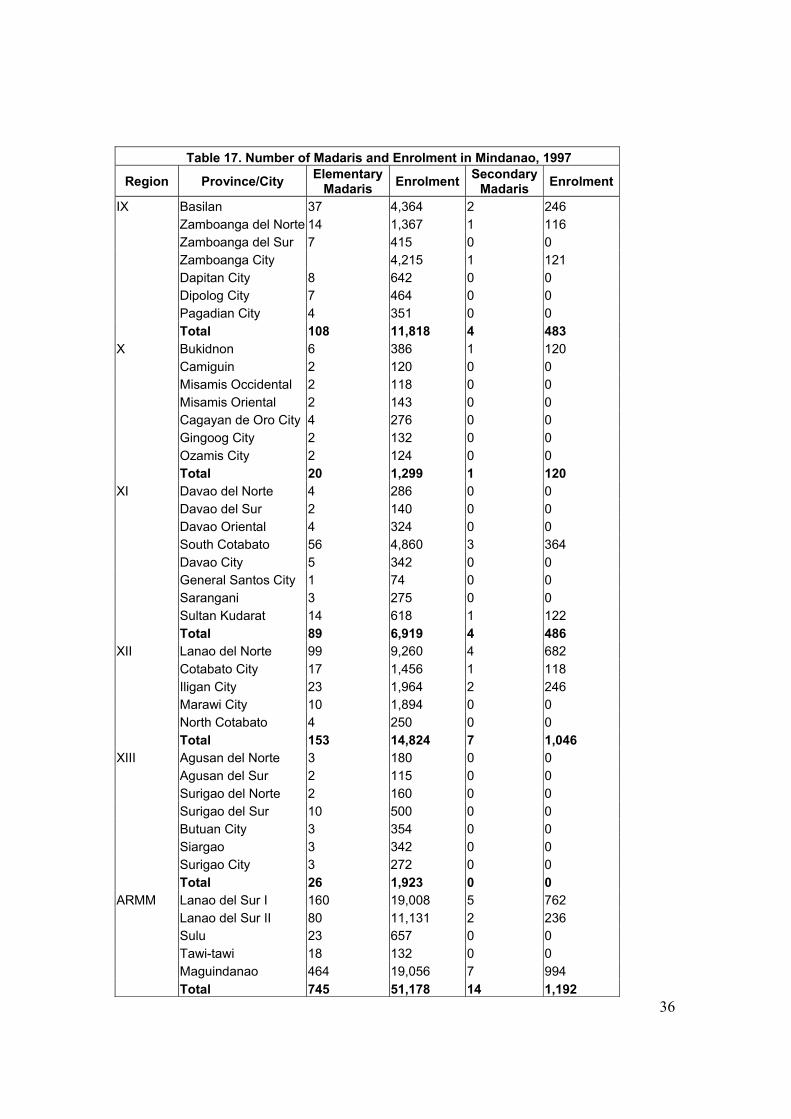
36
Table 17. Number of Madaris and Enrolment in Mindanao, 1997
Region Province/City Elementary Madaris Enrolment Secondary
Madaris Enrolment
IX Basilan 37 4,364 2 246 Zamboanga del Norte 14 1,367 1 116 Zamboanga del Sur 7 415 0 0 Zamboanga City 4,215 1 121 Dapitan City 8 642 0 0 Dipolog City 7 464 0 0 Pagadian City 4 351 0 0 Total 108 11,818 4 483 X Bukidnon 6 386 1 120 Camiguin 2 120 0 0 Misamis Occidental 2 118 0 0 Misamis Oriental 2 143 0 0 Cagayan de Oro City 4 276 0 0 Gingoog City 2 132 0 0 Ozamis City 2 124 0 0 Total 20 1,299 1 120 XI Davao del Norte 4 286 0 0 Davao del Sur 2 140 0 0 Davao Oriental 4 324 0 0 South Cotabato 56 4,860 3 364 Davao City 5 342 0 0 General Santos City 1 74 0 0 Sarangani 3 275 0 0 Sultan Kudarat 14 618 1 122 Total 89 6,919 4 486 XII Lanao del Norte 99 9,260 4 682 Cotabato City 17 1,456 1 118 Iligan City 23 1,964 2 246 Marawi City 10 1,894 0 0 North Cotabato 4 250 0 0 Total 153 14,824 7 1,046 XIII Agusan del Norte 3 180 0 0 Agusan del Sur 2 115 0 0 Surigao del Norte 2 160 0 0 Surigao del Sur 10 500 0 0 Butuan City 3 354 0 0 Siargao 3 342 0 0 Surigao City 3 272 0 0 Total 26 1,923 0 0 ARMM Lanao del Sur I 160 19,008 5 762 Lanao del Sur II 80 11,131 2 236 Sulu 23 657 0 0 Tawi-tawi 18 132 0 0 Maguindanao 464 19,056 7 994 Total 745 51,178 14 1,192
37
Curriculum Content of the Madrasah System vs. National Standard Curriculum
Not all madaris provide complete courses from kindergarten though high school. A madrasah may offer only one (1) or two (2) years of primary, intermediate, and/or secondary education. In addition, there is no standard curriculum for all madaris, instead, each madrasah adopts its own curriculum. However, in general, the primary and intermediate madrasah curriculum has eight (8) subjects: (1) Islamic Studies, (2) Character Building, (3) Arabic Language, (4) Social Studies, (5) Mathematics, (6) Science, (7) English Language, and (8) Military and P.E. The high school curriculum likewise has eight (8) subjects: the same as the previous list except that Charcter Builidng is replaced by Livelihood Education.
On the other hand, the national standard elementary curriculum has 10 subjects: (1) English, (2) Filipino, (3) Social Studies, (4) Science and Health, (5) Mathematics, (6) Technology, Livelihood and Home Economics, (7) Music, (8) Art, (9) Values Education, and (10) Physical Education. Of these ten subjects, three (3) are not taught in the madrasah, and these are: Filipino, Social Studies and Livelihood and Home Economics. According to Dr. Salippada Tamano, former Regional Secretary of the DECS-ARMM, the Social Studies subject in madrasah deals with Islamic history and geography, and that an enriched Social Studies curriculum of the madrasah which would encompass Filipino, History and Culture, could yield a madrasah curriculum that would well approximate the National Standard Curriculum for Elementary Schools.
The national standard secondary curriculum has eight (8) subjects: (1) Filipino, (2) Araling Panlipunan, (3) Edukasyong Pangkatawan, Kalusugan and Musika, (4) Edukasyon sa Pagpapahalaga, (5) English, (6) Science and Technology, (7) Mathematics, and (8) Technology and Home Economics.
The only subject in the National Standard Curriculum for Secondary Schools that is not offered in the thanawi (secondary madrasah) is Filipino. Hence, Dr. Tamano suggested that Filipino incorporated in the Social Studies course of the madrasah would lead to a curriculum that is parallel with the National Standard Curriculum for Secondary Schools.
DECS-ARMM has the following programs for the madrasah: (1) Accreditation, (2) Teachers Training, (3) Piloting, (4) Administrators in-service training, (5) Supervision, and (6) Offering of Arabic Language and Islamic Values as subjects in DECS schools in ARMM.
The LOI 1221 issued by President Ferdinand Marcos in 1982 directed the Prime Minister, Members of the Cabinet and the Minister of Education, Culture and Sports to: (1) Formulate and adopt a program for the development of madaris; (2) Strengthen the development of programs in Islamic Studies in state institutions especially in Mindanao; and (3) Establish and strengthen programs in the teaching and learning of the Arabic language.
38
Issued in September 1996, the Final Peace Agreement states that the integration of madaris into the Philippine educational system shall have an agreed priority agenda within the overall development plan of the Special Zone of Peace and Development (SZOPAD).
The most pressing problems confronting the madrasah system of education are the lack of financing assistance, lack of standardized/reconciliatory curriculum, and the absence of a DECS unit directly supervising it.
Castro and Ginete recommended the following courses of action on the integration of the madrasah system of education into the Philippine educational system: (1) accreditation of existing madaris; (2) formulation of a reconciliatory curriculum; (3) provision of allocation/funding assistance for madaris; and (4) organization of a body under the DECS-Central Office and Regional Offices in Mindanao to oversee the operations of the madaris.
3.5.12 Policies and Programmes7 The Department of Education (DEPED) continues to implement policies, programs and projects to improve the quality of Philippine education, making it accessible to all Filipinos and more responsive to the country’s twin goals of global competitiveness and people empowerment.
Access to basic education has been expanded through the twin strategies of establishing schools in school-less villages, and completing “incomplete” schools through multi-grade classes. Between 1995 and 2000, the 5,119 rural barangays without elementary schools was reduced to 4,569 out of 41,940 barangays. It was further established that of these remaining barangays, only 1,612 needed schools. The number of “incomplete” elementary schools decreased from 11,420 in 1993 to 8, 647 in 2000.
Several policy reforms were initiated to enhance access to basic education. Among these: (a) prioritize underserved or marginalized groups of areas; (b) broaden and deepen stakeholders’s involvement and participation (establish partnerships with other government agencies, LGUs, NGOs, businesses, parents and community groups) in establishing school/community based planning and adopting effective fund mobilization scheme; and (c) explore and maximize the utilization educational resources. In line with these, various programs were implemented, including the dropout intervention program, multi-grade program in Philippine education (MPPE), adopt-a-school-program, projects ease (easy and affordable secondary education), distance learning educational program, Balik-Paaralan for out-of-school adults program, government assistance to students and teachers in private education, third elementary education program, and the secondary education development and improvement project, and the school feeding program. The NGOs and private institutions also implemented the children in need of special protection (CNSP) and scholarship grants to poor but deserving students.
7 This section draws from the draft MDG Progress Report, Reyes 2002.
39
Literacy levels of the marginalized sectors are enhanced through the Philippine non-formal education project (PNFEP) with the NGOs as active partners. The NFE accreditation and equivalency system is its major program for those 15 years old and above that are unable to go to school, and for dropouts. The strict implementation of the Ganzon law (RA 5546) banning the collection of compulsory contributions and presentation of birth certificates for enrolment has led to an increase in enrolment in SY 2001-2002 by some 5%. The DEPED instituted measures to improve the quality of education by reformatting the curriculum, installing computers in public high schools, and providing pre-school and early childhood services. Several measures were set in place to promote good governance. The DepEd has formulated new bidding and procurement procedures for more transparency, resulting in cheaper textbooks and school desks/armchairs. Greater civil society participation in educational policy formulations was also encouraged. 3.6 HEALTH
Similar to education, health is viewed both as an enabling tool as well as a goal by
itself. Good health status is necessary to be able to participate productively in the labor market and earn income. At the same time, good health status is considered as a desired outcome.
The situation in the health sector are assessed using indicators relating to the key
areas of concern: life expectancy, infant and child mortality rates, maternal mortality rates, malnutrition prevalence, prevalence of selected diseases (TB, malaria and HIV AIDS). Data from various surveys and administrative records are used.
The various indicators reveal the improvements in the health status of the
population over the last fifteen years. Life expectancy has risen, infant and maternal mortality rates have fallen, and malnutrition prevalence has declined. However, the pace of improvement in some of these areas is not fast enough to meet the targets embodied in the Millennium Development Goals.
3.6.1 Life Expectancy
The life expectancy at birth has increased by about 10 years in a span of 15 years. Women expect to live longer than men. For the period 1995-2000, the average life expectancy for women is 71 years compared to only 66 years for men. The longer life expectancy of women is attributed to the higher survival rates of women at younger and older ages as indicated by the lower infant mortality rates of girls than boys and lower sex ratio among the elderly.
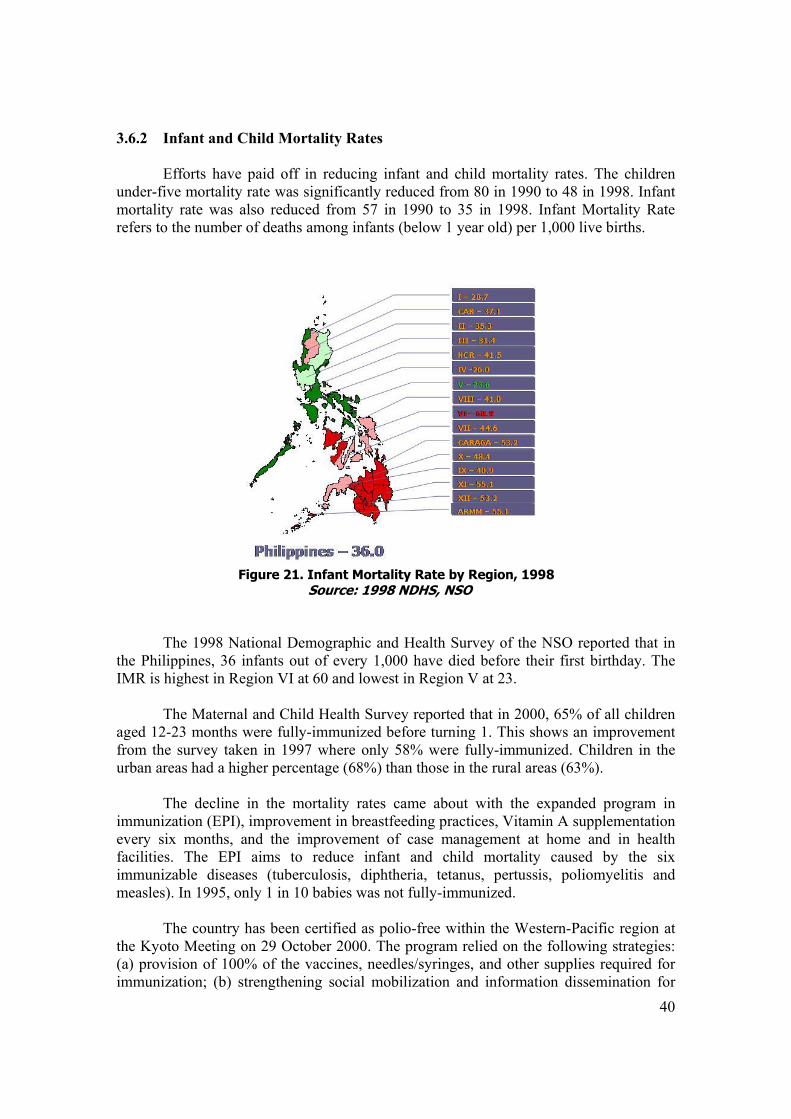
40
3.6.2 Infant and Child Mortality Rates
Efforts have paid off in reducing infant and child mortality rates. The children under-five mortality rate was significantly reduced from 80 in 1990 to 48 in 1998. Infant mortality rate was also reduced from 57 in 1990 to 35 in 1998. Infant Mortality Rate refers to the number of deaths among infants (below 1 year old) per 1,000 live births.
The 1998 National Demographic and Health Survey of the NSO reported that in
the Philippines, 36 infants out of every 1,000 have died before their first birthday. The IMR is highest in Region VI at 60 and lowest in Region V at 23.
The Maternal and Child Health Survey reported that in 2000, 65% of all children aged 12-23 months were fully-immunized before turning 1. This shows an improvement from the survey taken in 1997 where only 58% were fully-immunized. Children in the urban areas had a higher percentage (68%) than those in the rural areas (63%).
The decline in the mortality rates came about with the expanded program in immunization (EPI), improvement in breastfeeding practices, Vitamin A supplementation every six months, and the improvement of case management at home and in health facilities. The EPI aims to reduce infant and child mortality caused by the six immunizable diseases (tuberculosis, diphtheria, tetanus, pertussis, poliomyelitis and measles). In 1995, only 1 in 10 babies was not fully-immunized.
The country has been certified as polio-free within the Western-Pacific region at
the Kyoto Meeting on 29 October 2000. The program relied on the following strategies: (a) provision of 100% of the vaccines, needles/syringes, and other supplies required for immunization; (b) strengthening social mobilization and information dissemination for
Figure 21. Infant Mortality Rate by Region, 1998 Source: 1998 NDHS, NSO
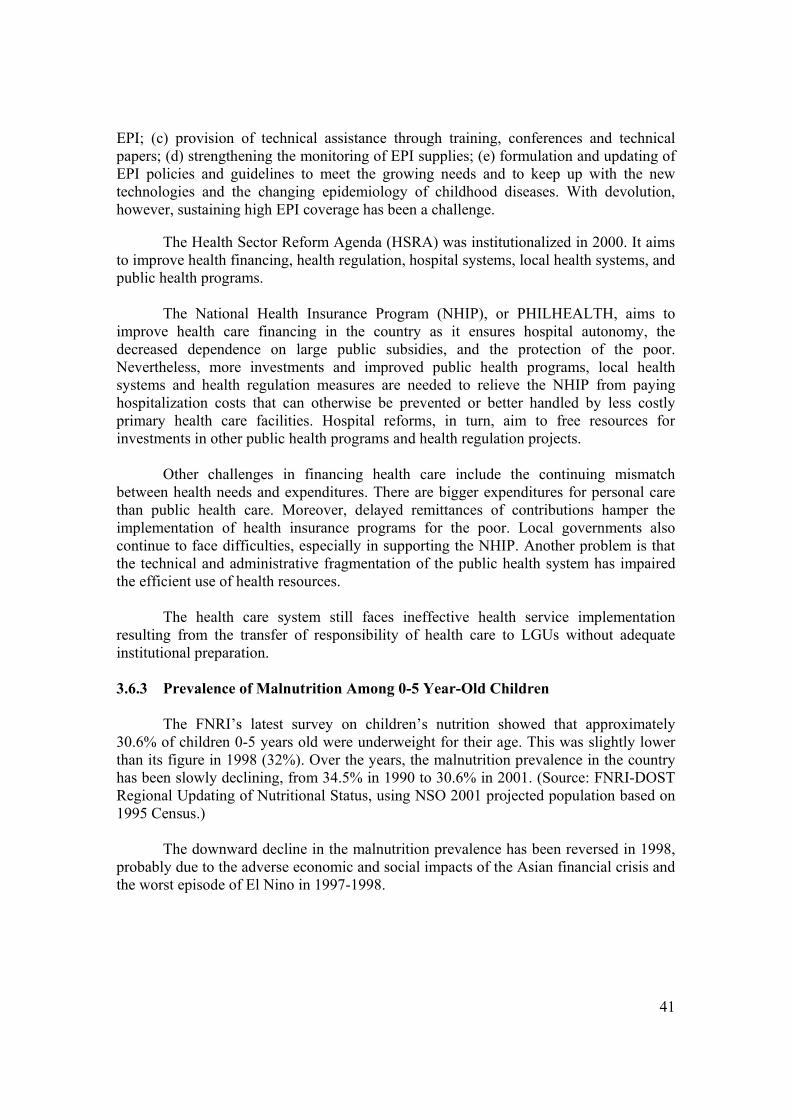
41
EPI; (c) provision of technical assistance through training, conferences and technical papers; (d) strengthening the monitoring of EPI supplies; (e) formulation and updating of EPI policies and guidelines to meet the growing needs and to keep up with the new technologies and the changing epidemiology of childhood diseases. With devolution, however, sustaining high EPI coverage has been a challenge.
The Health Sector Reform Agenda (HSRA) was institutionalized in 2000. It aims
to improve health financing, health regulation, hospital systems, local health systems, and public health programs.
The National Health Insurance Program (NHIP), or PHILHEALTH, aims to
improve health care financing in the country as it ensures hospital autonomy, the decreased dependence on large public subsidies, and the protection of the poor. Nevertheless, more investments and improved public health programs, local health systems and health regulation measures are needed to relieve the NHIP from paying hospitalization costs that can otherwise be prevented or better handled by less costly primary health care facilities. Hospital reforms, in turn, aim to free resources for investments in other public health programs and health regulation projects.
Other challenges in financing health care include the continuing mismatch
between health needs and expenditures. There are bigger expenditures for personal care than public health care. Moreover, delayed remittances of contributions hamper the implementation of health insurance programs for the poor. Local governments also continue to face difficulties, especially in supporting the NHIP. Another problem is that the technical and administrative fragmentation of the public health system has impaired the efficient use of health resources.
The health care system still faces ineffective health service implementation
resulting from the transfer of responsibility of health care to LGUs without adequate institutional preparation. 3.6.3 Prevalence of Malnutrition Among 0-5 Year-Old Children
The FNRI’s latest survey on children’s nutrition showed that approximately 30.6% of children 0-5 years old were underweight for their age. This was slightly lower than its figure in 1998 (32%). Over the years, the malnutrition prevalence in the country has been slowly declining, from 34.5% in 1990 to 30.6% in 2001. (Source: FNRI-DOST Regional Updating of Nutritional Status, using NSO 2001 projected population based on 1995 Census.)
The downward decline in the malnutrition prevalence has been reversed in 1998,
probably due to the adverse economic and social impacts of the Asian financial crisis and the worst episode of El Nino in 1997-1998.
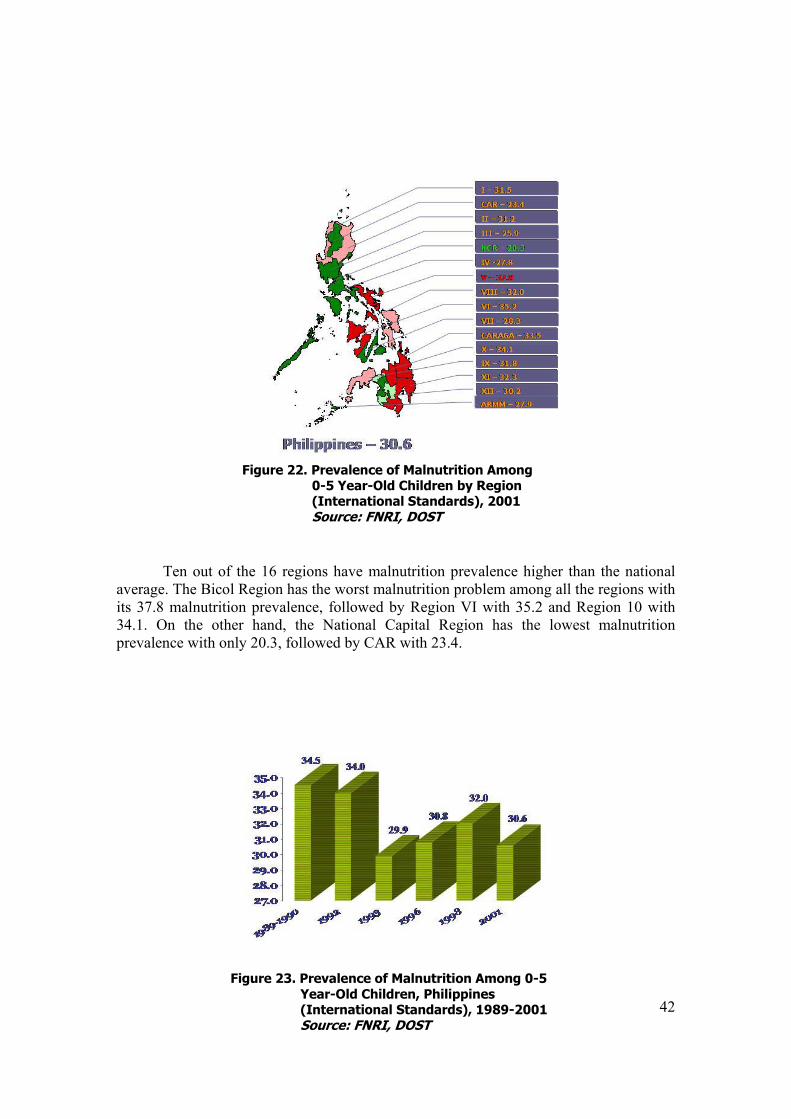
42
Ten out of the 16 regions have malnutrition prevalence higher than the national
average. The Bicol Region has the worst malnutrition problem among all the regions with its 37.8 malnutrition prevalence, followed by Region VI with 35.2 and Region 10 with 34.1. On the other hand, the National Capital Region has the lowest malnutrition prevalence with only 20.3, followed by CAR with 23.4.
Figure 22. Prevalence of Malnutrition Among 0-5 Year-Old Children by Region (International Standards), 2001 Source: FNRI, DOST
Figure 23. Prevalence of Malnutrition Among 0-5 Year-Old Children, Philippines (International Standards), 1989-2001
Source: FNRI, DOST
43
The 1993 National Nutrition Survey indicates that the average Filipino diet is
generally short of the recommended dietary allowances (RDAs).8 Trends in food consumption indicate a general decrease in the intake of various foods. The mean one-day per capita food consumption decreased from 869g in 1987 to 803g in 1993. The mean one-day per capita energy intake also went down from 1753 kcal to 1684 kcal in the same period. Most of the food groups show lower consumption levels in 1993 as compared to the 1987 figures. This means the vitamins and minerals intake remains grossly inadequate except for protein, which meets the corresponding RDA (106.2%) standard.
Malnutrition remains a major threat to the Filipino child’s survival. The
prevalence of moderately and severely underweight pre-school children 0-5 years old decreased from 34.5% in 1989-90 to 28.9% percent in 1996, only to rise to 32% percent in 1998. Figures for stunted growth, indicative of prolonged deprivation of food and susceptibility to frequent infections, decreased from 40% in 1989-90 to 31.8 % in 1996, but rose to 34% in 1998.
The increasing availability of food from both domestic and foreign sources
implies cheap prices affordable to low-income groups. The per capita available supply per day of calories exceeded the calorie intake by 30.7%. This is also true for the daily per capita availability of protein (31%) and fats (32.5%). But although readily available, many do not have enough money to buy the food they need. Poverty is a major cause of food inadequacy, particularly in rural areas.
Because of the severe consequences of micronutrient deficiencies and the more immediate and visible effects of interventions addressing micronutrient malnutrition, the inter-agency National Nutrition Council agreed to concentrate its efforts on the prevention and control of micronutrient deficiencies in 1993. The strategy involved heavy investments in short-term and relatively more expensive universal supplements specifically for Vitamin A and iodine from 1993-96.
More food-based strategies, i.e., food fortification, nutrition education, and food
production were emphasized later. Food fortification was private/business sector-led and focused on staple foods like rice, sugar, cooking oil, wheat flour, salt, and drinking water. Nutrition education was aimed at changing dietary behaviors consistent with the country’s nutritional guidelines, specifically increasing the consumption of foods rich in Vitamin A, iodine, and iron, prolonged breastfeeding and proper introduction of complementary foods to help prevent protein-energy malnutrition (PEM) and micronutrient deficiencies.
8 The discussion on malnutrition is drawn from the MDG Progress Report.
44
3.6.4 Maternal Mortality The maternal mortality rate (MMR) declined from 209 per 100,000 live births in
1993 to 172 per 100,000 live births in 1998. The disparities across provinces remain wide. In 1995, the MMR in Sulu province was almost three times the rate in Cavite province. In areas where maternal access to primary health care is limited by geography or political conflict, mothers double the risk of dying during childbirth as compared to those in areas where health care is more available.
Ten women die every day in the Philippines from causes related to pregnancy and
childbirth like hemorrhage, hypertension, complications from sepsis or widespread infection, obstructed labor, and complications arising from abortion. Most maternal complications and deaths point to shortcomings in access to reproductive health services.
Only 77% of mothers receive the minimum three pre-natal checkups and almost
half of these are performed during the first three months of pregnancy. Around three out of four pregnant women receive iron supplements. A little over half of the women or 57% receive iodine while about one-third receives tetanus toxoid immunization. Nearly 55% of the births in the country are delivered at home and only 56% of all deliveries are attended by health professionals. Moreover, only 57% of women receive post-partum care. This situation increases the risk of women dying during or after pregnancy. Not all individuals and couples have access to a range of safe and effective family planning methods.”
The contraceptive prevalence rate for the country has not improved at all. From
the 1995 Family Planning Survey, the use of contraceptives has in fact decreased from 50.7 to 49.5% in 2001 according to the Family Planning Survey. Improvements can be seen only if this figure is compared to the results of the 1993 National Demographic Survey of 40%. Although contraceptive use has tripled among married women since 1968, from 15 to 47%, data indicate that there has been a leveling-off in recent years. This could explain why the fertility rate has only declined slightly from 4.1% to 3.7% in the last five years. Although limited in recent years, the decline has been gradual since the 1960s and can be attributed, in part, to an increase in contraceptive use.
Married couples exceed their “wanted” fertility by 1 birth and this unintended
fertility is even higher in the rural areas. Only around 11% of married women who do not want more children use contraception methods. The incidence of unplanned pregnancies has a serious effect on the reproductive health especially among young women. Young mothers (15-24 years old) account for 30% of all birth and 74% of all illegitimate births.
Teenage pregnancy is a contributing factor to high MMR. Most teenage
pregnancies occur between the ages of 15 and 17. One in 25 adolescent females has a child before age 18. Adolescent pregnancy increases maternal and fetal complications. Fetal mortality rate for teenage pregnancies is 1.2 to 1.6 times higher than those of mothers 24-34 years old. Finally, there is a greater risk of premature births, or having babies with a low birth weight, in-born defects, mental retardation, and blindness.
45
One of the consequences of unplanned pregnancies is induced abortion. Although it is difficult to get accurate figure because abortion is illegal in the country, it has been estimated that there are around 400,000 abortion cases annually, with teenagers accounting for 17% of these cases.
Results from the 1998 National Demographic and Health Survey (NDHS) confirm
that while national fertility rate has declined to an average of 3.7 children per woman, this is still considerably higher than the rates prevailing in neighboring countries.
The 1994 International Conference on Population and Development (ICPD) emphasizes the link between population and sustainable development and recommends a comprehensive approach in formulating and implementing reproductive health policies and programs. Moreover, the 1995 International Conference on Women in Beijing stressed that empowering women is the key to a healthy and productive lives, and called for the promotion of a reproductive health approach.
The ICPD defines Reproductive Health (RH) as a “state of complete physical, mental and social well being and not merely the absence of disease or infirmity, in all matters relating to the reproductive system and to its functions and processes. Furthermore, Reproductive Health Care is defined as the constellation of methods, techniques and services that contribute to reproductive health and well being by preventing & solving RH problems. The services include Maternal & Child Health and Nutrition, Family Planning, Prevention & Treatment of Reproductive Tract Infections (RTI), Breast & Reproductive Tract Cancers & other Gynecological Conditions, Prevention & Treatment of Abortion Complications, Men’s & Adolescent Health, Violence Against Women and Children, Prevention and Treatment of Infertility & Sexual Dysfunction, Education & Counseling on Sexuality & Sexual Health.
The Philippines as signatory to the Programme of Action of the ICPD subscribes
to a consensus, which includes the broadening of population policies and programs beyond family planning and a much closer collaboration among development agencies, as the primary mechanism to attain the reproductive health approach objectives. In line with this, the DOH has created the Philippine Reproductive Health Program through an administrative order issued in 1998. . The Philippine Population Management Program (PPMP) envisions that by 2005, 60% of primary health care and family planning facilities should offer the widest achievable range of safe and effective family planning methods, essential obstetrics care, prevention and management of reproductive tract infections including STDs, and barrier methods to prevent infection. About 80% of the facilities should offer such services by 2010, and all should do so by 2015.
It also aims to reduce maternal mortality rate to half the 1990 levels by 2000 and by a further one half by 2015. Moreover, at least 40% of all births should be assisted by skilled attendants where the maternal mortality rate is very high, and 80% globally, by 2005: these figures should be 50% and 85% respectively, by 2010; and 60% and 90% by 2015. Any gap between the proportion of individuals using contraceptives and the proportion expressing a desire to space or limit their families should be reduced by half
46
by 2005, 75% by 2010, and 100& by 2015. Recruitment targets or quotas should not be used in attempting to reach this goal.
Maternal malnutrition is a major factor affecting the unborn child’s chances for
survival and normal fetal development. With the increasing recognition of the magnitude and urgency of the problem, the Philippines has given priority to women’s health and safe motherhood in recent years. Some of the initiatives that have been undertaken are: improving the access to maternal care through the deployment of midwives in the hard-to-reach and underserved areas in the country, and providing primary level health facilities with basic supplies and equipment and essential drugs including micronutrients. The institutional capacities of the Department of Health were strengthened and partnerships with LGUs, NGOs and the communities were forged to increase awareness, promote participation, and mobilize resources for women’s health and maternal care.
3.6.5 Prevalence of Selected Diseases
While major improvements were observed in the various health indicators,
infectious diseases persist at high rates along with chronic and degenerative diseases which have become prevalent. Malaria is still one of the 10 leading causes of morbidity in the country although it is no longer a leading cause of death. Tuberculosis is one of the ten leading causes of morbidity and mortality. Moreover, the country has to contend with the HIV/AIDS situation which has been regarded as a nascent epidemic.
Malaria Malaria is endemic in the rural areas, mainly in places where poverty, difficult access to health care, and to some extent, political unrest prevail. The World Health Organization has estimated the population at risk for malaria in the country to be around 11 million in year 2000. The high-risk groups are the indigenous peoples, upland subsistence farmers, forest-related workers, and settlers in frontier areas.
Malaria is still one of the 10 leading causes of morbidity in the country although it is no longer a leading cause of death. It remains a major public health issue in the Philippines and is present to some extent in the majority of provinces. The number of confirmed cases in the Philippines decreased from 110,400 in 1992 to 42,000 in 1997. There was an increase to 50,700 in 1998, followed by a decrease in confirmed cases to 36,596 by year 2000. It is likely that these fluctuations are related more to variations in surveillance practices (i.e., abandonment of active case detection) than to any reduction of the malaria burden. There was substantial decrease in malaria deaths from 864 in 1992 to 262 in 1996. However, morbidity increased thereafter, with reported malaria deaths of 755 in 1999 and 536 in 2000. Malaria incidence per 1000 population has remained relatively steady, and has been below 1.00/1000 since 1993. Although the Malaria Control Service has carried out numerous community education campaigns, effectiveness has been mixed in many rural areas. Even when rural residents associate malaria with mosquitoes, they are often unaware that mosquitoes are the sole vector. In remote rural areas, people often self-medicate or use traditional herbal
47
remedies; they only seek help from public sector clinics or district hospitals when their medical situation becomes severe. Recent experience in Mindanao suggests that targeted deployment of Insecticide Treated Nets (ITNs) and rapid diagnostic tests together with community mobilization can significantly reduce the problem. Plans are underway to expand this approach to other highly endemic areas. The population protected by ITNs according to 1998 data is around 600,000. Tuberculosis
Tuberculosis is one of the ten leading causes of morbidity and mortality in the country. The WHO reports that the Philippines has one of the highest rates of tuberculosis in the world. The 1997 Annual Report of the WHO estimated that around 22 million people, almost one out of three, in the Philippines are infected with tuberculosis, and about 270,000 a year are reported to develop tuberculosis. Everyday 68 Filipinos die of TB. Some studies suggest that the average Filipino has a 1 in a 40 chance of becoming infected with TB each year. The estimated incidence rate of new smear-positive cases was 141 per 100,000 in 1997, while the estimated case detection rate was 70% in 1998. The notification rate of all new smear-positive cases has decreased since 1996. However, this trend might have been influenced by the abolition of active case findings and constraints in drug availability during this period. A strength of the Philippines is that general health care is available even in rural village health units, or Barangay Health Stations through the health workers known as “midwives.” They are responsible for finding suspected cases of TB for diagnosis. The midwives also hand the TB patients drugs, working closely with each case. However, decentralization of health services from the central to local governments in recent years has broken down traditional lines of authority and accountability. Staff are not adequately trained for the DOTS (Directly Observed Treatment, Short-Course) strategy, and are unclear about their roles and responsibilities. DOTS is the most effective strategy available for controlling TB epidemic today. With inadequate supervision and with frequent lapses in supplies, some negative practices have surfaced. Diagnostic and treatment guidelines are often not followed. Drug supplies run out and patients are treated with whatever is available. There is no direct observation of treatment in the majority of cases and health workers typically say they are too busy to follow-up on defaulters or confirm that their patients have been cured. AIDS
The first AIDS case in the country was identified in 1984. From then on until December 2001, the HIV/AIDS Registry has recorded 1,611 HIV Ab seropositive cases, 543 of whom had AIDS; 238 deaths have been recorded at the time of the report. Of the 1,611 cases, 61% were men and 39% were women. The 30-39 age group has the highest number of infected men, while the 19-29 age group has the highest number of infected women. Of the 1,611 HIV cases, 442 or 28% are Overseas Filipino Workers; 38% of them are seafarers. The predominant mode of transmission is sexual intercourse.
48
Between 1984 and 1992, the annual number of confirmed cases reported remained below 100. In the last seven years, however, from 1993 to 1999, the number of cases per year had exceeded 100, but remained below 200. While the number of cases each year has been increasing, there seems to be no indication at present that the numbers are going to rise faster. Confirmed cases have been reported in eight cities all over the Philippines: Angeles, Quezon, and Pasay cities in Luzon; Cebu and Iloilo cities in the Visayas; Davao, Cagayan de Oro, and General Santos in Mindanao.
Various Philippine epidemiologists estimate the actual number of HIV cases at between a low of 5,000 to a high of 13,000. Even the high estimate would place the current national HIV prevalence rate of 0.02% of the total population. There are, however, some groups whose prevalence rates are significantly higher than the rest of the population. Among these groups with HIV prevalence higher than 1% are registered female sex workers in seven cities, freelance female sex workers in three cities, men who have sex with men in three cities, and drug users who use infected needles in one city. These groups, as well as others yet to be determined, are regarded as the likely primary pools of infection from which wider transmission to other population segments could occur. Using the available evidence in the country, international experts call the Philippines’ HIV/AIDS situation as a “nascent epidemic.” This is so since the number of confirmed cases of HIV/AIDS is low and the rate of increase in the number of cases is slow. Based on current levels of HIV infection and observed patterns of transmission in the country, the risks of a wider infection in the near to immediate future are related to: (a) unprotected sex, primarily in commercial sex settings and secondarily in casual sex as well as marital sex involving people who frequently participate in commercial sex; and (b) unsafe blood transfusion, mainly because of the proven efficiency of transmitting HIV infection through infected blood and blood products. The current medium term plan is targeting the long-term containment of HIV prevalence at less than 2% by the year 2004 through the full coverage of an essential package of preventive measures in selected areas of the country with the highest risks of a wider epidemic. Among the key measures is the prevention and control of STDs. The initial gains in terms of more information, greater awareness and wider availability of essential services for HIV-AIDS prevention, are expected to facilitate the containment of HIV-AIDS.
3.7 HOUSING AND BASIC AMENITIES
Access to basic goods and services such as safe housing, safe water, sanitary toilet
facilities and electricity constitute some of the basic needs. This section looks at the housing conditions of the population, specifically in
terms of tenure, housing materials, and access to basic amenities like electricity, safe water, and sanitary toilet facilities.
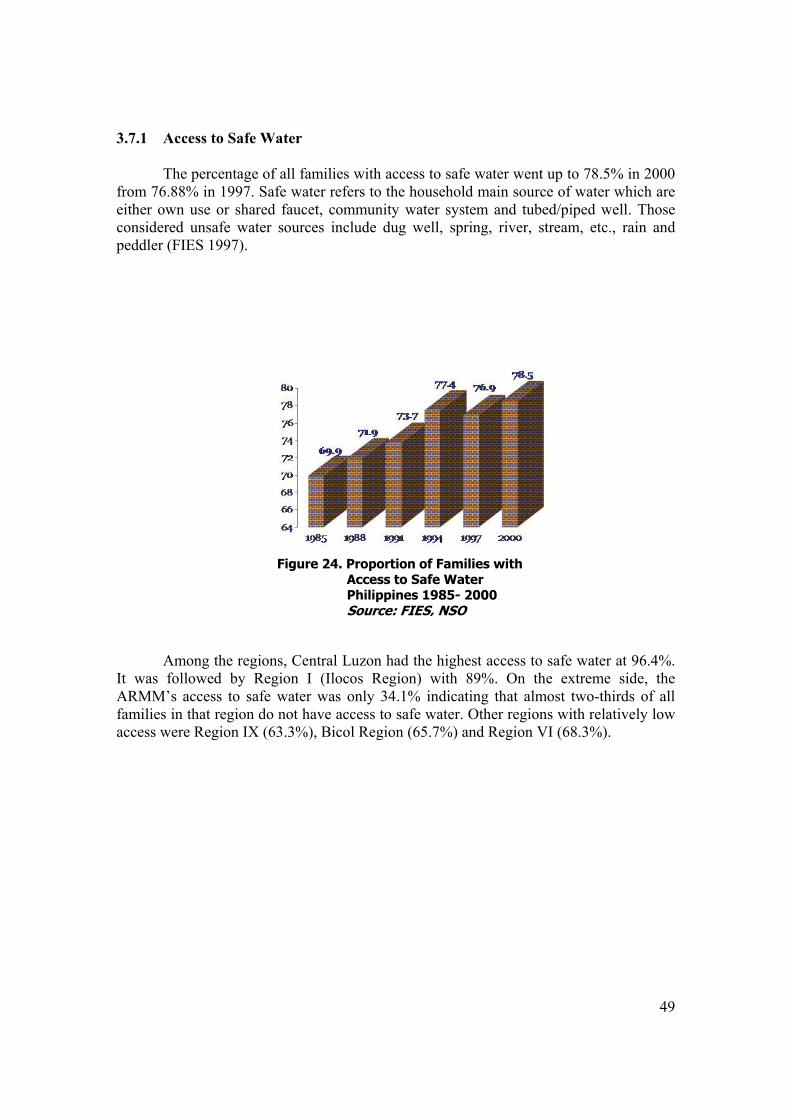
49
3.7.1 Access to Safe Water
The percentage of all families with access to safe water went up to 78.5% in 2000 from 76.88% in 1997. Safe water refers to the household main source of water which are either own use or shared faucet, community water system and tubed/piped well. Those considered unsafe water sources include dug well, spring, river, stream, etc., rain and peddler (FIES 1997).
Among the regions, Central Luzon had the highest access to safe water at 96.4%.
It was followed by Region I (Ilocos Region) with 89%. On the extreme side, the ARMM’s access to safe water was only 34.1% indicating that almost two-thirds of all families in that region do not have access to safe water. Other regions with relatively low access were Region IX (63.3%), Bicol Region (65.7%) and Region VI (68.3%).
Figure 24. Proportion of Families with Access to Safe Water Philippines 1985- 2000 Source: FIES, NSO
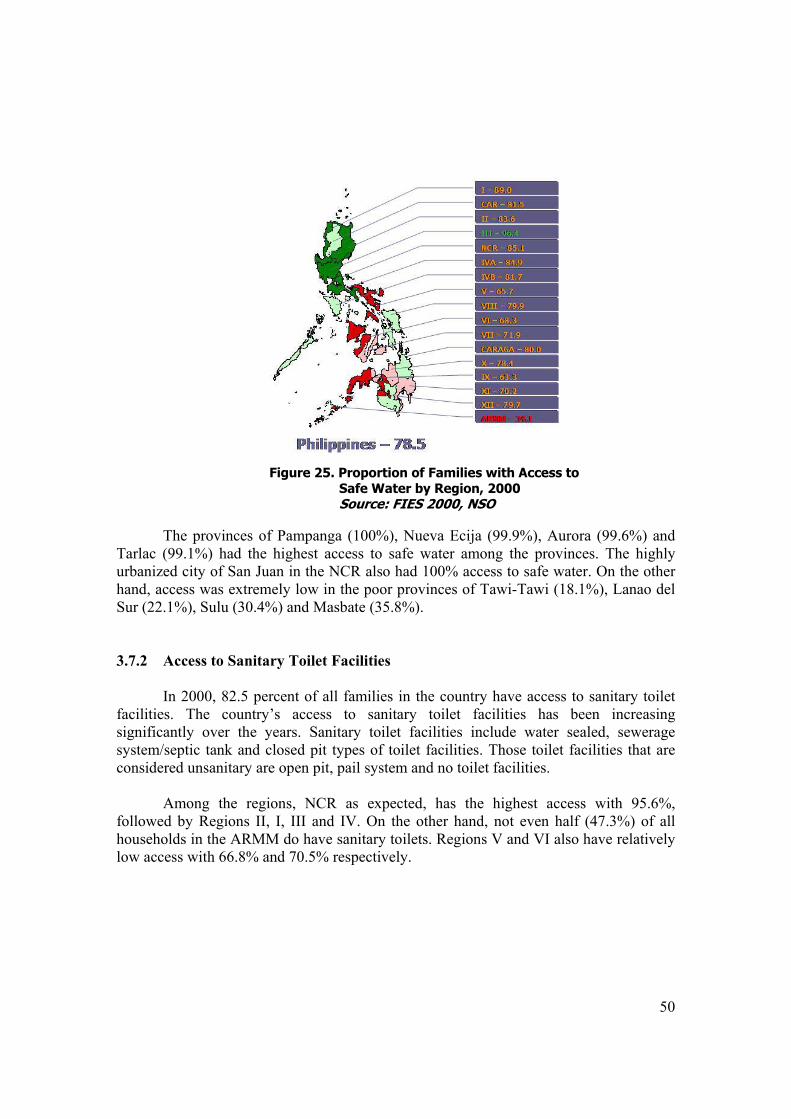
50
The provinces of Pampanga (100%), Nueva Ecija (99.9%), Aurora (99.6%) and
Tarlac (99.1%) had the highest access to safe water among the provinces. The highly urbanized city of San Juan in the NCR also had 100% access to safe water. On the other hand, access was extremely low in the poor provinces of Tawi-Tawi (18.1%), Lanao del Sur (22.1%), Sulu (30.4%) and Masbate (35.8%).
3.7.2 Access to Sanitary Toilet Facilities In 2000, 82.5 percent of all families in the country have access to sanitary toilet facilities. The country’s access to sanitary toilet facilities has been increasing significantly over the years. Sanitary toilet facilities include water sealed, sewerage system/septic tank and closed pit types of toilet facilities. Those toilet facilities that are considered unsanitary are open pit, pail system and no toilet facilities.
Among the regions, NCR as expected, has the highest access with 95.6%, followed by Regions II, I, III and IV. On the other hand, not even half (47.3%) of all households in the ARMM do have sanitary toilets. Regions V and VI also have relatively low access with 66.8% and 70.5% respectively.
Figure 25. Proportion of Families with Access to Safe Water by Region, 2000
Source: FIES 2000, NSO
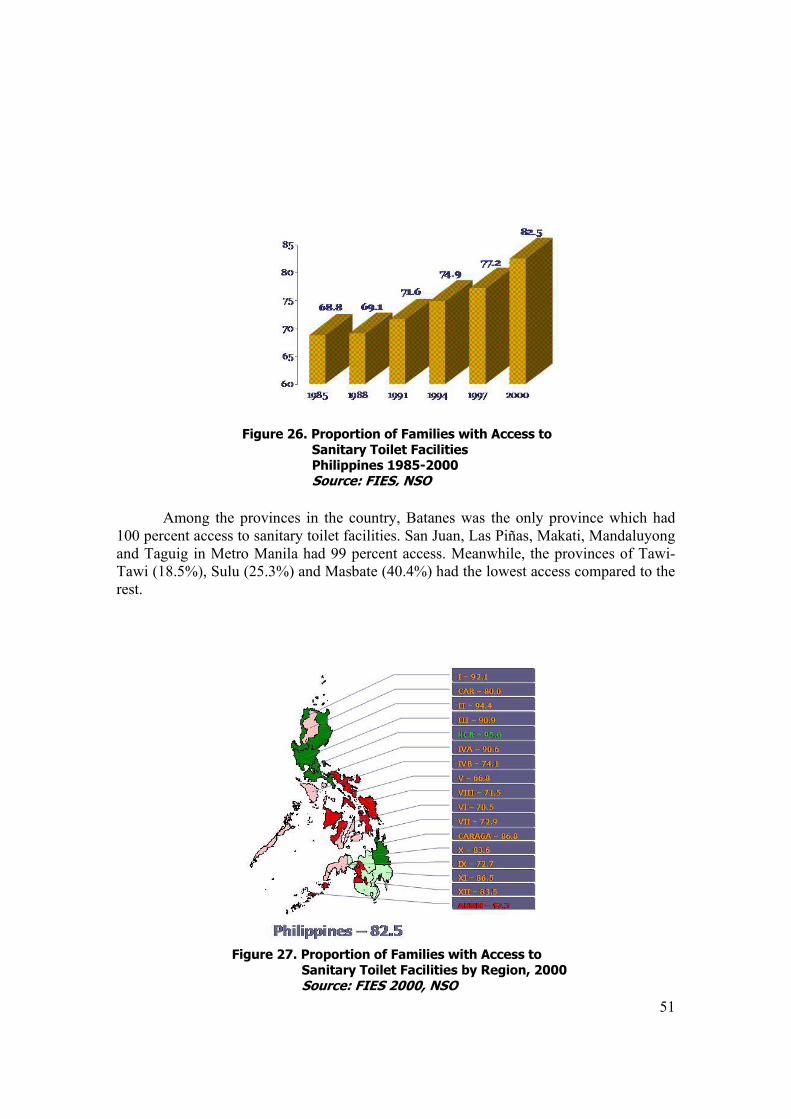
51
Among the provinces in the country, Batanes was the only province which had
100 percent access to sanitary toilet facilities. San Juan, Las Piñas, Makati, Mandaluyong and Taguig in Metro Manila had 99 percent access. Meanwhile, the provinces of Tawi-Tawi (18.5%), Sulu (25.3%) and Masbate (40.4%) had the lowest access compared to the rest.
Figure 26. Proportion of Families with Access to Sanitary Toilet Facilities Philippines 1985-2000 Source: FIES, NSO
Figure 27. Proportion of Families with Access to Sanitary Toilet Facilities by Region, 2000
Source: FIES 2000, NSO
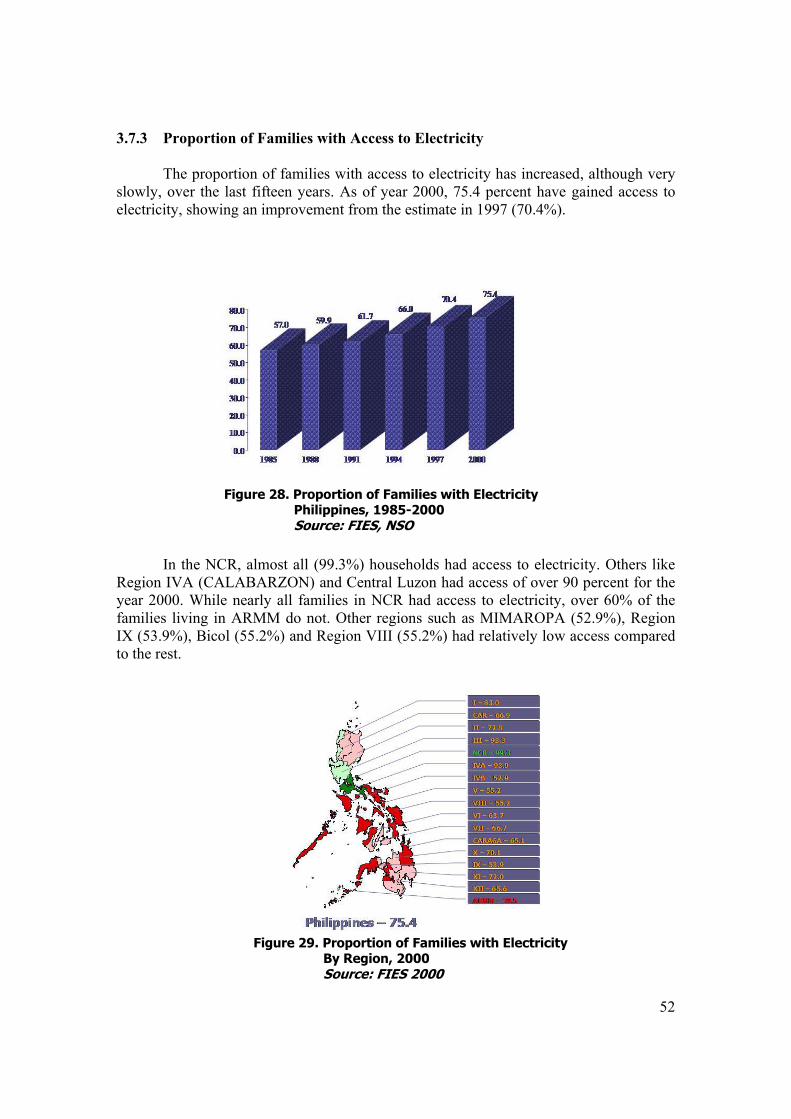
52
3.7.3 Proportion of Families with Access to Electricity
The proportion of families with access to electricity has increased, although very slowly, over the last fifteen years. As of year 2000, 75.4 percent have gained access to electricity, showing an improvement from the estimate in 1997 (70.4%).
In the NCR, almost all (99.3%) households had access to electricity. Others like
Region IVA (CALABARZON) and Central Luzon had access of over 90 percent for the year 2000. While nearly all families in NCR had access to electricity, over 60% of the families living in ARMM do not. Other regions such as MIMAROPA (52.9%), Region IX (53.9%), Bicol (55.2%) and Region VIII (55.2%) had relatively low access compared to the rest.
Figure 28. Proportion of Families with Electricity Philippines, 1985-2000 Source: FIES, NSO
Figure 29. Proportion of Families with Electricity By Region, 2000 Source: FIES 2000
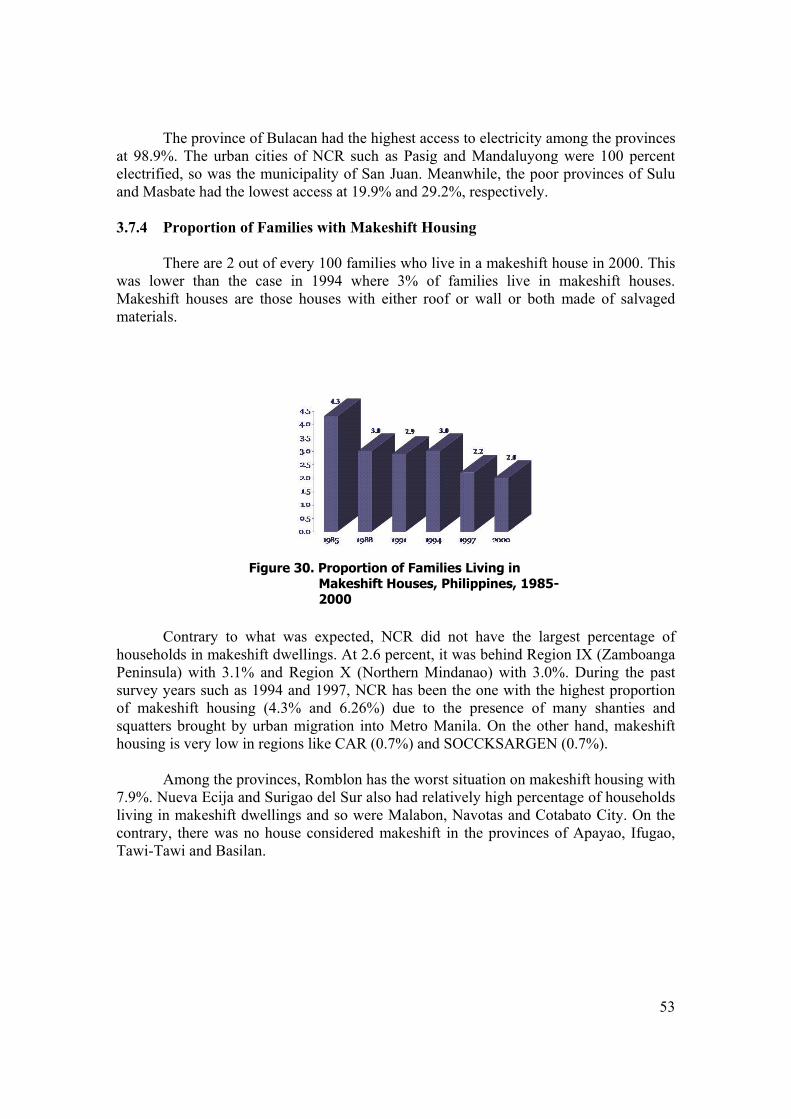
53
The province of Bulacan had the highest access to electricity among the provinces at 98.9%. The urban cities of NCR such as Pasig and Mandaluyong were 100 percent electrified, so was the municipality of San Juan. Meanwhile, the poor provinces of Sulu and Masbate had the lowest access at 19.9% and 29.2%, respectively. 3.7.4 Proportion of Families with Makeshift Housing
There are 2 out of every 100 families who live in a makeshift house in 2000. This was lower than the case in 1994 where 3% of families live in makeshift houses. Makeshift houses are those houses with either roof or wall or both made of salvaged materials.
Contrary to what was expected, NCR did not have the largest percentage of households in makeshift dwellings. At 2.6 percent, it was behind Region IX (Zamboanga Peninsula) with 3.1% and Region X (Northern Mindanao) with 3.0%. During the past survey years such as 1994 and 1997, NCR has been the one with the highest proportion of makeshift housing (4.3% and 6.26%) due to the presence of many shanties and squatters brought by urban migration into Metro Manila. On the other hand, makeshift housing is very low in regions like CAR (0.7%) and SOCCKSARGEN (0.7%).
Among the provinces, Romblon has the worst situation on makeshift housing with
7.9%. Nueva Ecija and Surigao del Sur also had relatively high percentage of households living in makeshift dwellings and so were Malabon, Navotas and Cotabato City. On the contrary, there was no house considered makeshift in the provinces of Apayao, Ifugao, Tawi-Tawi and Basilan.
Figure 30. Proportion of Families Living in Makeshift Houses, Philippines, 1985-2000
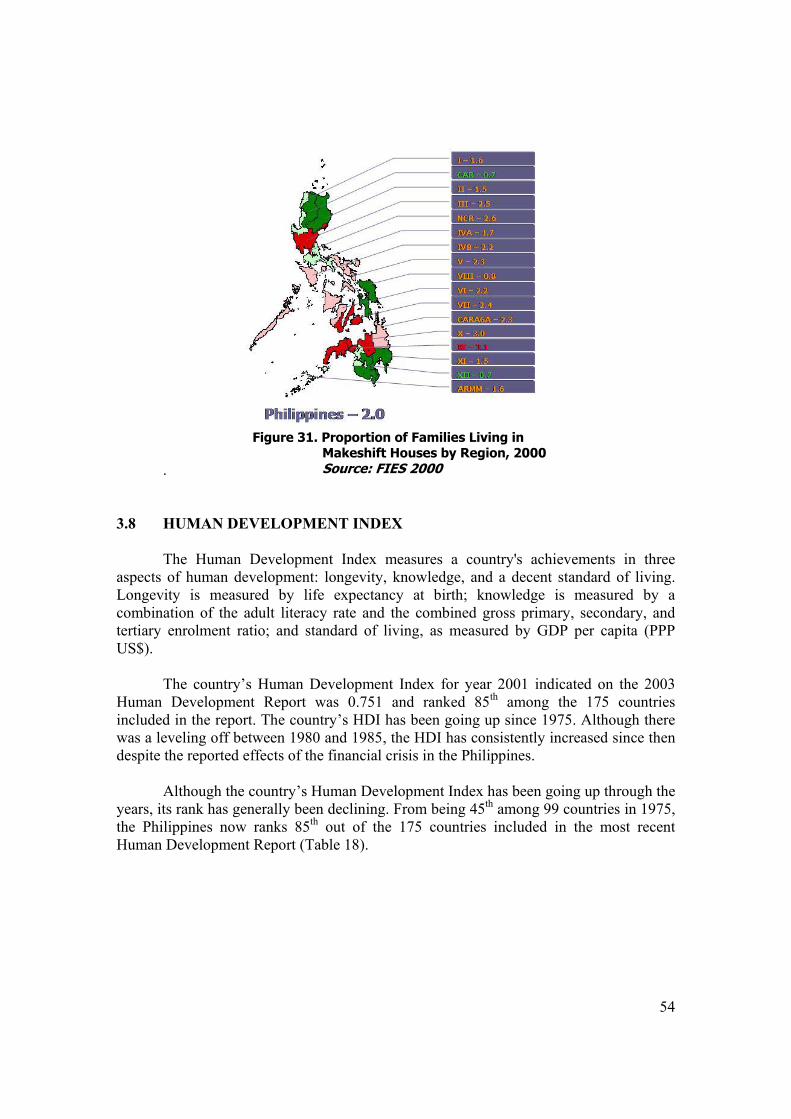
54
.
3.8 HUMAN DEVELOPMENT INDEX
The Human Development Index measures a country's achievements in three
aspects of human development: longevity, knowledge, and a decent standard of living. Longevity is measured by life expectancy at birth; knowledge is measured by a combination of the adult literacy rate and the combined gross primary, secondary, and tertiary enrolment ratio; and standard of living, as measured by GDP per capita (PPP US$).
The country’s Human Development Index for year 2001 indicated on the 2003
Human Development Report was 0.751 and ranked 85th among the 175 countries included in the report. The country’s HDI has been going up since 1975. Although there was a leveling off between 1980 and 1985, the HDI has consistently increased since then despite the reported effects of the financial crisis in the Philippines.
Although the country’s Human Development Index has been going up through the
years, its rank has generally been declining. From being 45th among 99 countries in 1975, the Philippines now ranks 85th out of the 175 countries included in the most recent Human Development Report (Table 18).
Figure 31. Proportion of Families Living in Makeshift Houses by Region, 2000
Source: FIES 2000
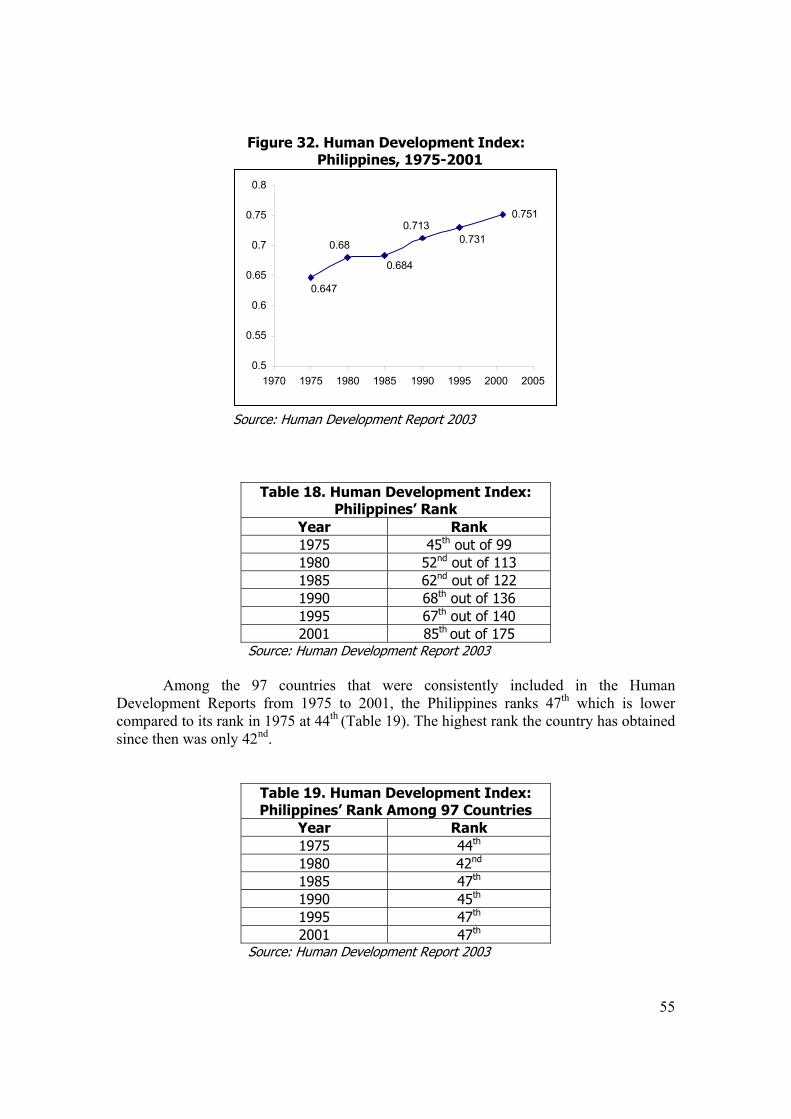
55
0.751
0.7310.713
0.684
0.68
0.647
0.5
0.55
0.6
0.65
0.7
0.75
0.8
1970 1975 1980 1985 1990 1995 2000 2005
Table 18. Human Development Index:
Philippines’ Rank Year Rank 1975 45th out of 99 1980 52nd out of 113 1985 62nd out of 122 1990 68th out of 136 1995 67th out of 140 2001 85th out of 175
Source: Human Development Report 2003
Among the 97 countries that were consistently included in the Human Development Reports from 1975 to 2001, the Philippines ranks 47th which is lower compared to its rank in 1975 at 44th (Table 19). The highest rank the country has obtained since then was only 42nd.
Table 19. Human Development Index: Philippines’ Rank Among 97 Countries
Year Rank 1975 44th 1980 42nd 1985 47th 1990 45th 1995 47th 2001 47th
Source: Human Development Report 2003
Source: Human Development Report 2003
Figure 32. Human Development Index: Philippines, 1975-2001
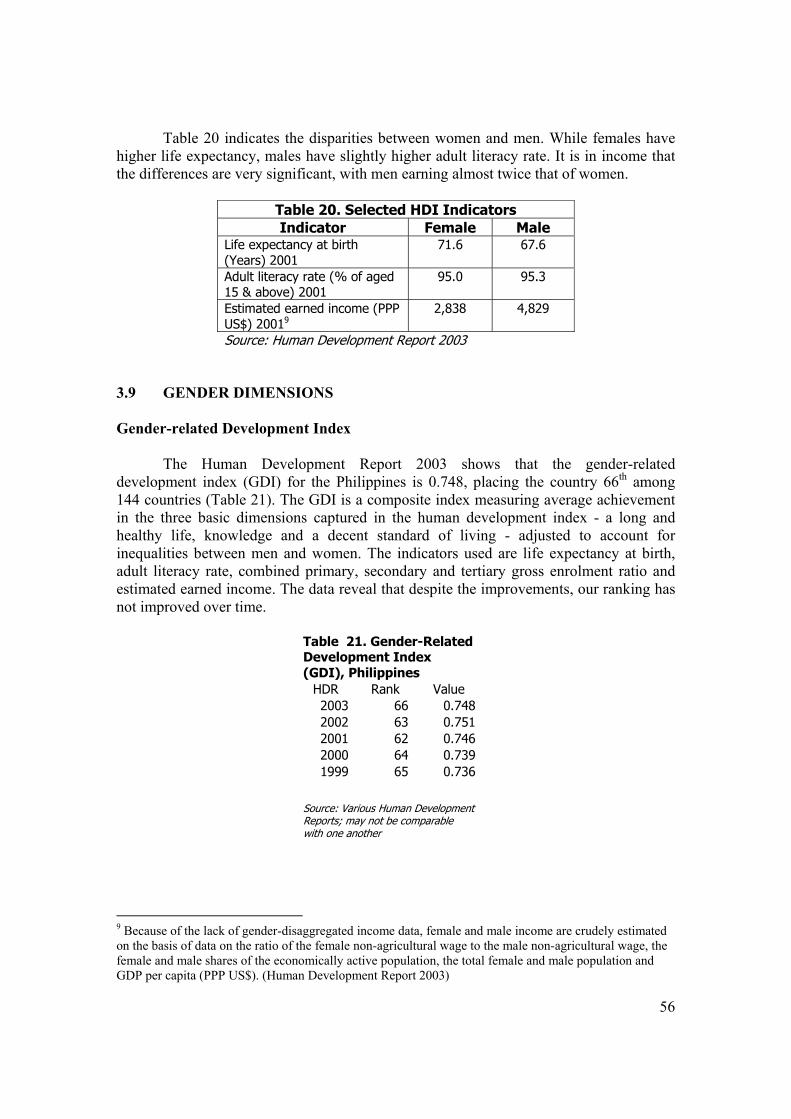
56
Table 20 indicates the disparities between women and men. While females have higher life expectancy, males have slightly higher adult literacy rate. It is in income that the differences are very significant, with men earning almost twice that of women.
Table 20. Selected HDI Indicators Indicator Female Male
Life expectancy at birth (Years) 2001
71.6 67.6
Adult literacy rate (% of aged 15 & above) 2001
95.0 95.3
Estimated earned income (PPP US$) 20019
2,838 4,829
Source: Human Development Report 2003
3.9 GENDER DIMENSIONS
Gender-related Development Index
The Human Development Report 2003 shows that the gender-related development index (GDI) for the Philippines is 0.748, placing the country 66th among 144 countries (Table 21). The GDI is a composite index measuring average achievement in the three basic dimensions captured in the human development index - a long and healthy life, knowledge and a decent standard of living - adjusted to account for inequalities between men and women. The indicators used are life expectancy at birth, adult literacy rate, combined primary, secondary and tertiary gross enrolment ratio and estimated earned income. The data reveal that despite the improvements, our ranking has not improved over time.
Table 21. Gender-Related Development Index (GDI), Philippines
HDR Rank Value 2003 66 0.7482002 63 0.7512001 62 0.7462000 64 0.7391999 65 0.736
Source: Various Human Development Reports; may not be comparable with one another
9 Because of the lack of gender-disaggregated income data, female and male income are crudely estimated on the basis of data on the ratio of the female non-agricultural wage to the male non-agricultural wage, the female and male shares of the economically active population, the total female and male population and GDP per capita (PPP US$). (Human Development Report 2003)
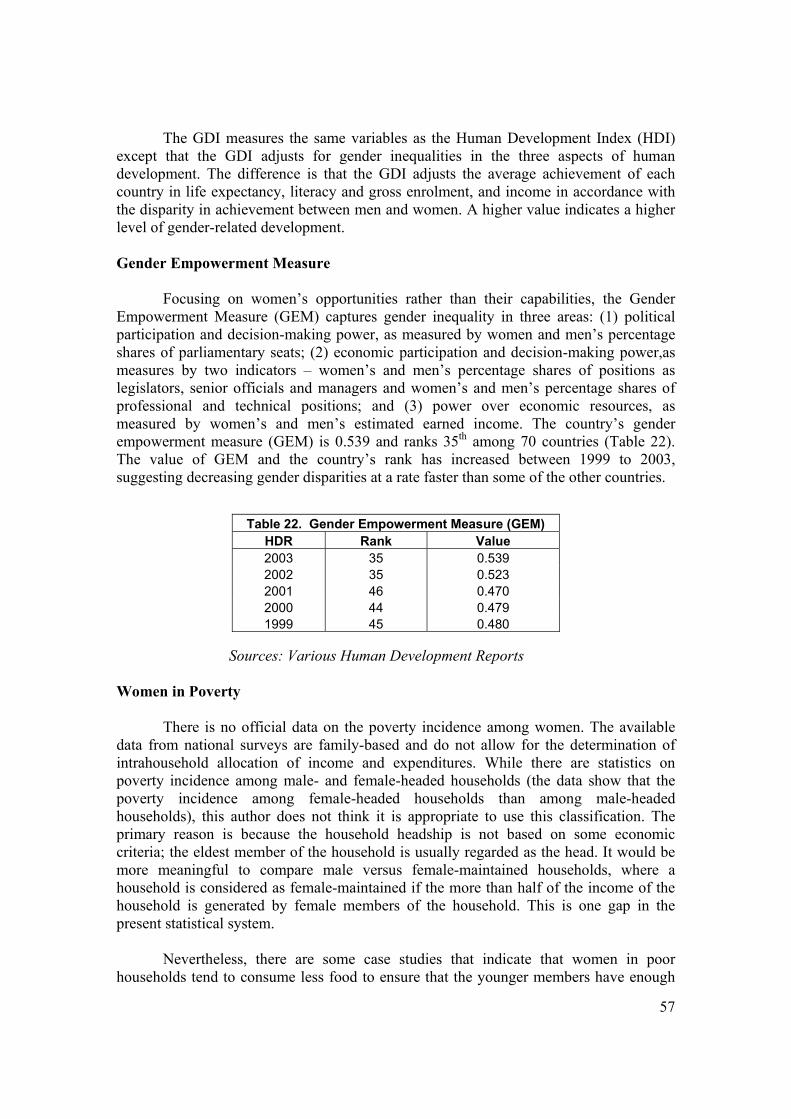
57
The GDI measures the same variables as the Human Development Index (HDI) except that the GDI adjusts for gender inequalities in the three aspects of human development. The difference is that the GDI adjusts the average achievement of each country in life expectancy, literacy and gross enrolment, and income in accordance with the disparity in achievement between men and women. A higher value indicates a higher level of gender-related development. Gender Empowerment Measure
Focusing on women’s opportunities rather than their capabilities, the Gender Empowerment Measure (GEM) captures gender inequality in three areas: (1) political participation and decision-making power, as measured by women and men’s percentage shares of parliamentary seats; (2) economic participation and decision-making power,as measures by two indicators – women’s and men’s percentage shares of positions as legislators, senior officials and managers and women’s and men’s percentage shares of professional and technical positions; and (3) power over economic resources, as measured by women’s and men’s estimated earned income. The country’s gender empowerment measure (GEM) is 0.539 and ranks 35th among 70 countries (Table 22). The value of GEM and the country’s rank has increased between 1999 to 2003, suggesting decreasing gender disparities at a rate faster than some of the other countries.
Sources: Various Human Development Reports Women in Poverty There is no official data on the poverty incidence among women. The available data from national surveys are family-based and do not allow for the determination of intrahousehold allocation of income and expenditures. While there are statistics on poverty incidence among male- and female-headed households (the data show that the poverty incidence among female-headed households than among male-headed households), this author does not think it is appropriate to use this classification. The primary reason is because the household headship is not based on some economic criteria; the eldest member of the household is usually regarded as the head. It would be more meaningful to compare male versus female-maintained households, where a household is considered as female-maintained if the more than half of the income of the household is generated by female members of the household. This is one gap in the present statistical system. Nevertheless, there are some case studies that indicate that women in poor households tend to consume less food to ensure that the younger members have enough
Table 22. Gender Empowerment Measure (GEM) HDR Rank Value 2003 35 0.539 2002 35 0.523 2001 46 0.470 2000 44 0.479 1999 45 0.480
58
to eat. Data on intrahousehold allocation and time budget study can provide the information to be able to do this. Gender and Education While gender typing of professions still exists, women are seen to increasingly invade traditional male domains. One indication is that women have managed to penetrate territory once traditionally lorded over by men like military schools. However, in the case of men, the reverse is not happening as they continue to stick to their traditional choices. This could narrow their career options in the future while women widen theirs. For instance, the fields of agriculture, forestry, fishery and veterinary medicine, once regarded as masculine enclaves, now admit female students, constituting 50.2% of the enrollees. Mathematics and computer science (55.1%) as well as tradecrafts and industrial courses (52.5%) are gradually being dominated by women (from MDG Progress Report).
One of the recent innovative approaches to education is a gender-sensitive
approach to instruction. Following the education department’s policy of providing equal access to education, the elementary education bureau integrated human rights and sex education subjects/modules into the curriculum. It evaluated new generation textbooks for use in the public schools to make them more gender sensitive and thereby help in improving the self-image, lives and work opportunities of girls, particularly in areas where women have traditionally been under-represented, such as mathematics, science and technology. The list of evaluated textbooks given by private publishers was used by children ages 6-12 years old in public schools from 1996 to 1999. Gender reforms in the educational system are continuously being pursued such as the revision of textbooks, curricula, instructional materials and teaching methods towards enhanced gender-responsiveness. These are being reviewed to eliminate gender biases and stereotyping.
Consistent with the vigorous efforts of government to continuously upgrade and
expand educational opportunities and resources for women and men, a law was passed in 1997 called the Science and Technology Scholarship Act (RA 8248). This law gives women and men equal opportunities to pursue careers in science and technology.
Another area where women have now begun to penetrate is military training. This
was made possible by the passage of RA 7192 in 1991 giving women “equal opportunity for appointment, admission, training, graduation, and commissioning in all military or similar schools of the Armed Forces of the Philippines and the Philippine National Police.”
Based on the Functional Literacy and Mass Media Survey (FLEMMS) in 1994 by the National Statistics Office, 83.9% of urban women were functionally literate while the figure for rural women was only 68.8%. This could be due to the lack of educational opportunities, the lack of access to schools, or the tendency of some parents to discourage their daughters from attending school.
59
To address the wide gender gap in the illiteracy rate of five more depressed provinces, the government adopted the female functional literacy program in Mindanao, home to a significant number of indigenous women. The program involved inter-agency collaboration in training and development of materials based on the needs of students and their cultural norms and practices. The bureau of non-formal education (BNFE) offers functional education and literacy programs (FELP) in 10 out of 16 regions of the country. Some regions conduct female functional literacy classes with maternal and child care as core topics. The government also expanded alternative non-formal education systems for indigenous communities such as Magbasa Kita (let us read) that teaches women and girls and parents of working children to read. School-based child-minding centers were also set up in the cultural communities so older children, mostly girls of school age who take care of younger siblings, can attend classes despite baby-sitting chores. The government also instituted in 1996 an affirmative action policy so that women can enroll in industrial courses traditionally dominated by men. In 1997, the country launched a technology-based education and training programme for women through the national vocational training and development center for women. The center seeks to improve the economic status of women through technical education and training. Women-friendly facilities are available at the center including a multi-purpose hall, dormitory, day-care center/nursery and space for networking of NGOs. The center adopts a holistic approach towards women’s economic empowerment through technical skills training, research, advocacy, career guidance/job placement assistance and counseling services.
Women in the Workforce
Women carry multiple burdens in many societies, including the Philippines. Women generally have to fulfill both home and market work responsibilities. While they are tasked with taking care of the house and child rearing, many are increasingly being drawn into the labor market to help augment the family income. Labor force participation rate stands at 53 percent as of July 2003. Majority are employed in the services sector, especially in trade services and other community, social and personal services. Many are also engaged in agriculture, mostly as unpaid family workers. The Economic paper discusses the employment issue in more detail.
Since 1993, females comprise the larger percentage of newly hired workers
deployed abroad. The POEA reported that in 2002, there were 288,155 newly hired OFWs deployed in various destinations. Of these, 69% were females while 31% were males. The report also indicated that there were 100,585 professional and technical workers deployed of which the much larger proportion or 85% were female. This shows an increase from 75% in 1992. Other skills category wherein the percentage of females deployed was higher those of males were clerical workers (63%) and service workers (90%). The latter include domestic workers and entertainers, jobs where women are in vulnerable positions. On the other hand, most of the newly hired production, agricultural, sales, administrative and managerial workers in 2002 were males.
60
Women in Conflict Areas Armed conflict has contributed to a worsening of the poverty situation in the affected areas. ARMM, in fact, has experienced the largest percentage point increase in poverty incidence from 1997 to 2000. Moreover, the conflict-affected areas in Mindanao are among the poorest provinces in the Philippines. These areas include Lanao del Sur, Maguindanao, Sulu, Tawi-tawi, Basilan, North Cotabato, Sultan Kudarat and Davao del Norte. In some affected communities, men were not around either because they were combatants, and so feared for their safety, or they left their families to avoid conscription. Thus, women take on the role of men within the household. Women encounter the absence of water and health facilities that they need in connection with their care-giving roles. In addition, the loss of productive assets, experienced by the households as a continuing income shock, will compel women including young mothers, to engage in directly compensated work. Gender and Development Budget In support of gender and development, the government is behind two resource mobilization strategies to promote women’s advancement and gender concerns. These strategies are the gender and development (gad) budget provision of the annual national government budget (general appropriations act) and RA 7192 (women in development and nation-building act), which provides the allocation of official development assistance of gender-related programs, projects and activities. The 1995 GAD Budget had a provision in the annual national government budget policy that directs all departments, bureaus, offices and agencies to set aside an amount of their annual appropriations for projects designed to address gender issues. The cost of the gender-related activities should not be lower than 5% of their total budget. To implement this, the government issued a memorandum circular outlining guidelines for integrating gender concerns in agency plans and budgets. In 1998, the GAD budget provision was expanded to cover not only government agencies and LGUs but also Government-owned and Controlled Corporations (GOCCs) and State Universities and Colleges (SUCs). A budget analysis reveals that the government-wide allocation stood at P2.7 billion in 1998. Most of the activities funded by the appropriations were in the area of human development. Philippine Plan for Gender Responsive Development
The Philippine Plan for Gender Responsive Development (PPGRD) 1995-2025 contains various programs and projects in response to issues concerning women’s welfare. Included in the Plan are sets of programs and policies that aim to improve women’s reproductive health. One of the most important projects included is a reproductive health program with the following components: family planning; maternal health care; prevention of abortion and management of its complications; prevention and treatment of STDs, infertility and sexual disorders; cancer of the breast and reproductive
61
systems; and counseling and education on sexuality, sexual health and adolescent reproductive health.
Also included in the Plan are programs on women’s health and safe motherhood
addressing women’s inaccessibility to access to health care and services; a family planning program enhanced by adopting a reproductive health care approach; and a nutrition education and program to address malnutrition among pregnant women and lactating mothers.
To address the continuing problem of women’s access to reproductive and other
health care services, the government vigorously implemented the Women’s Health and Safe Motherhood Project from 1995-1999. It addressed the basic needs of women especially at critical periods of the life cycle. Its major components were family health for the urban poor, sustainable community-based Family Planning/Maternal Care Unit project with special focus on women, and strengthening maternal and child health services project. The health needs of elderly women were also addressed through the National Program on Health for Elderly Women.
3.9 ENVIRONMENT AND POVERTY The state of our environment affects the level of well-being of the people. It can affect not only the health status of the population, it can also determine the incomes of the people, particular those whose income are resource-based.
Air pollution is a growing health hazard that can cause health problems such as asthma and lung infections. An August 2000 World Bank study cited that air pollution levels are rapidly increasing. In Metro Manila, the level of particulate matter smaller than 10 microns was found to exceed national air quality standards by a factor of two.
The data of the Environment Management Bureau indicate that the average
concentration of total suspended particulates (TSP) in the atmosphere in the selected monitoring stations has declined between 1990 and 2000. In Makati, for instance, the TSP was 184 in 1990, then it peaked at 302 in 1997 and is 129 in 2000. Perhaps the decline could be attributed to the measures that have been put in place to reduce pollution, including stricter monitoring of emissions from vehicles.
Despite the reduction in air pollution in some monitoring stations, the level is still
high enough in other areas to cause health problems. A recent World Bank report as cited in the January 24, 2003 issue of the Philippine Star said the prevalence of chronic obstructive pulmonary diseases (COPD) is highest among jeepney drivers, affecting 32.5 percent of them. The same study cited the study of the University of the Philippines’ College of Public Health that said that commuters had the lowest prevalence for COPD at 14.8 percent. Jeepney drivers are highly at risk of acquiring pulmonary tuberculosis (PTB) with 17.5 percent of them affected last year. Commuters come in second at 9 percent. Bus drivers, in their air-conditioned buses, ranked second among those affected by COPD at 16.4 percent.
62
COPD is the seventh leading cause of mortality in the country in 1998. Doctors say that COPD, such as emphysema and chronic bronchitis, can be aggravated by air pollution. Those with COPD are also more susceptible to PTB, which is caused by an airborne bacteria. Victims of COPD suffer from chronic cough with phlegm, wheezing, and shortness of breath. They also sustain irreversible damage to the lungs. At least 22 million Filipinos are suffering or exposed to various stages of TB.
Many of the vulnerable groups in the Philippines rely on the country’s natural
resources for their livelihood. Fisherfolk are suffering from reduced catch while the indigenous people have less forest products to gather. The economic role of the environment is discussed in the Economic paper.
An emerging policy issue concerns the utilization of natural resources by the residents where the natural resource is situated. The proportion of households with electricity is low in Lanao del Norte and Bicol. This is ironic considering that Lanao del Norte supplies power to Mindanao from its hydroelectric power plant in Maria Cristina Falls while Bicol supplies power to the Luzon grid from its geothermal plant. Natural gas has been found in Palawan but this is being piped to Batangas, bypassing Palawan. These three examples indicate that some areas are not benefiting from the exploitation of their natural resources. It would seem logical that these areas should be among the first to enjoy their natural resources but this is not happening. The policy governing this issue should be examined. 3.11 Summary of Status and Trends
The Philippines has achieved only modest success in reducing poverty primarily owing to the lackluster performance in the economic sector. The boom-bust cycle of the economy has not allowed the country to achieve sustained growth in incomes. Poverty incidence has declined from 1985 to 2000. However, because of the relatively high population growth rate, the number of poor using the income-based measure of poverty has risen. Moreover, the recent financial crisis and El Nino highlighted the country’s vulnerability to shocks. The 1997-1998 crisis wiped out the some of the gains in poverty reduction that was achieved before the crisis.
The country’s performance with regards to non-income based measures of
poverty is better. Infant and child mortality rates have gone down. Maternal mortality rate has declined but at a rate not fast enough to meet the MDG target by 2015. Life expectancy rates have increased. However, malnutrition remains a major threat to the Filipino child’s survival. While elementary and secondary participation rates have risen, cohort survival rates have not improved. Moreover, the quality of education being provided to the students still needs to be improved. Access to safe water, sanitary toilet facilities and electricity has gone up but at a modest, if not, slow rate.
Despite these improvements, the country’s rank in relation to other countries has
in fact fallen, indicating that we have not kept pace with the improvements in the other countries. In addition to the slow pace, there are wide spatial disparities for most of the indicators.
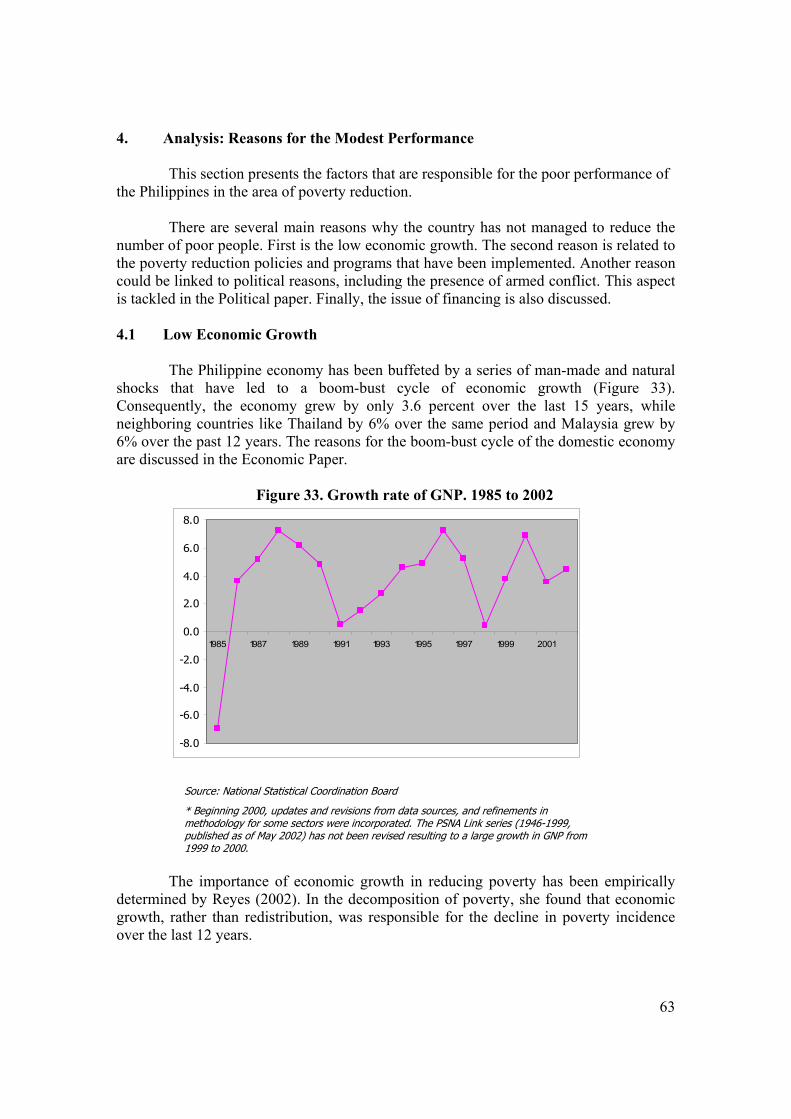
63
4. Analysis: Reasons for the Modest Performance
This section presents the factors that are responsible for the poor performance of the Philippines in the area of poverty reduction.
There are several main reasons why the country has not managed to reduce the
number of poor people. First is the low economic growth. The second reason is related to the poverty reduction policies and programs that have been implemented. Another reason could be linked to political reasons, including the presence of armed conflict. This aspect is tackled in the Political paper. Finally, the issue of financing is also discussed.
4.1 Low Economic Growth
The Philippine economy has been buffeted by a series of man-made and natural
shocks that have led to a boom-bust cycle of economic growth (Figure 33). Consequently, the economy grew by only 3.6 percent over the last 15 years, while neighboring countries like Thailand by 6% over the same period and Malaysia grew by 6% over the past 12 years. The reasons for the boom-bust cycle of the domestic economy are discussed in the Economic Paper.
Figure 33. Growth rate of GNP. 1985 to 2002
-8.0
-6.0
-4.0
-2.0
0.0
2.0
4.0
6.0
8.0
1985 1987 1989 1991 1993 1995 1997 1999 2001
Source: National Statistical Coordination Board
* Beginning 2000, updates and revisions from data sources, and refinements in methodology for some sectors were incorporated. The PSNA Link series (1946-1999, published as of May 2002) has not been revised resulting to a large growth in GNP from 1999 to 2000.
The importance of economic growth in reducing poverty has been empirically
determined by Reyes (2002). In the decomposition of poverty, she found that economic growth, rather than redistribution, was responsible for the decline in poverty incidence over the last 12 years.
64
4.2 Weaknesses of Poverty Reduction Policies and Programs
The other main reason for the poor performance in poverty reduction can be attributed to the poverty reduction policies and programs that have been implemented. Major weakness of these policies and programs are in the implementation.
4.2.1 Plans and Policies
The various development plans seem to have paid attention to the problem of poverty, although in varying degrees. The inclusion of poverty reduction strategies and targets seem to be an indication of the government’s commitment. We have seen poverty reduction targets incorporated for the first time in the 1987-1992 Development plan. Subsequent plans included poverty incidence targets. In the 1999-2004 MTPDP, regional targets were also included. However, the current plan for 2001-2004 does not include poverty reduction targets. There was also an obvious shift in the terminology used. While earlier plans talked of “alleviating” poverty, more recent pronouncements talk about “reducing” or “eradicating” poverty. Perhaps this reflects the new thrust of not just alleviating or “making it easier to endure” poverty but really reducing or “bringing down” and even eradicating or “removing absolutely” poverty. Programs directed towards eradicating poverty tend to occupy a prominent part, if not the centerpiece of an administration’s program. Consequently, programs tend to be identified with a specific administration and therefore, tend to be coterminous with the administration that initiated it. This practice of discontinuing programs associated with previous administrations has been disadvantageous to the poor. For instance, the Social Reform Agenda (SRA) was launched by the Ramos Administration. The SRA consisted of 10 flagship projects, namely: (1) agricultural development, (2) fisheries and aquatic resources management, (3) ancestral domains, (4) socialized housing, (5) comprehensive and integrated delivery of social services, (6) worker’s welfare and protection, (7) livelihood, (8) credit, and (9) institution-building and effective participation in governance. This was dropped after the term of the Ramos Administration. Many of the reforms that were put in place were institutional changes and therefore would take some time before their impact would be felt (Reyes and del Valle, 1998).
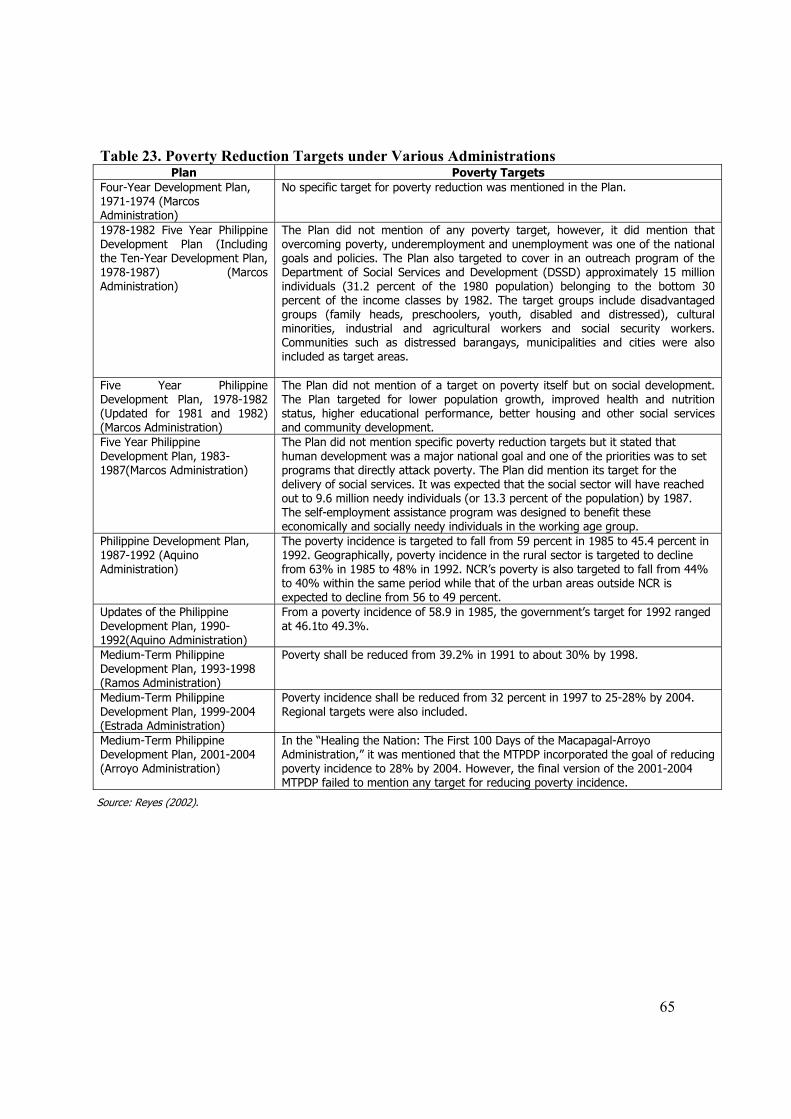
65
Table 23. Poverty Reduction Targets under Various Administrations
Plan Poverty Targets Four-Year Development Plan, 1971-1974 (Marcos Administration)
No specific target for poverty reduction was mentioned in the Plan.
1978-1982 Five Year Philippine Development Plan (Including the Ten-Year Development Plan, 1978-1987) (Marcos Administration)
The Plan did not mention of any poverty target, however, it did mention that overcoming poverty, underemployment and unemployment was one of the national goals and policies. The Plan also targeted to cover in an outreach program of the Department of Social Services and Development (DSSD) approximately 15 million individuals (31.2 percent of the 1980 population) belonging to the bottom 30 percent of the income classes by 1982. The target groups include disadvantaged groups (family heads, preschoolers, youth, disabled and distressed), cultural minorities, industrial and agricultural workers and social security workers. Communities such as distressed barangays, municipalities and cities were also included as target areas.
Five Year Philippine Development Plan, 1978-1982 (Updated for 1981 and 1982) (Marcos Administration)
The Plan did not mention of a target on poverty itself but on social development. The Plan targeted for lower population growth, improved health and nutrition status, higher educational performance, better housing and other social services and community development.
Five Year Philippine Development Plan, 1983-1987(Marcos Administration)
The Plan did not mention specific poverty reduction targets but it stated that human development was a major national goal and one of the priorities was to set programs that directly attack poverty. The Plan did mention its target for the delivery of social services. It was expected that the social sector will have reached out to 9.6 million needy individuals (or 13.3 percent of the population) by 1987. The self-employment assistance program was designed to benefit these economically and socially needy individuals in the working age group.
Philippine Development Plan, 1987-1992 (Aquino Administration)
The poverty incidence is targeted to fall from 59 percent in 1985 to 45.4 percent in 1992. Geographically, poverty incidence in the rural sector is targeted to decline from 63% in 1985 to 48% in 1992. NCR’s poverty is also targeted to fall from 44% to 40% within the same period while that of the urban areas outside NCR is expected to decline from 56 to 49 percent.
Updates of the Philippine Development Plan, 1990-1992(Aquino Administration)
From a poverty incidence of 58.9 in 1985, the government’s target for 1992 ranged at 46.1to 49.3%.
Medium-Term Philippine Development Plan, 1993-1998 (Ramos Administration)
Poverty shall be reduced from 39.2% in 1991 to about 30% by 1998.
Medium-Term Philippine Development Plan, 1999-2004 (Estrada Administration)
Poverty incidence shall be reduced from 32 percent in 1997 to 25-28% by 2004. Regional targets were also included.
Medium-Term Philippine Development Plan, 2001-2004 (Arroyo Administration)
In the “Healing the Nation: The First 100 Days of the Macapagal-Arroyo Administration,” it was mentioned that the MTPDP incorporated the goal of reducing poverty incidence to 28% by 2004. However, the final version of the 2001-2004 MTPDP failed to mention any target for reducing poverty incidence.
Source: Reyes (2002).

66
Aside from the “SRA-enrolled” regular agency budgets, three special funds totaling P6.1 billion were created to augment the regular resources to attain the objectives of the SRA. These are the 1996 Poverty Alleviation Fund (PAF-1), the 1996 Local Government Empowerment Fund (LGEF) and the 1997 Poverty Alleviation Fund (PAF-2) and the 1998 Poverty Alleviation Fund (PAF-3).
Table 24. Special Poverty Alleviation Funds
Name of Fund Amount (In Million Pesos)
Poverty Alleviation Fund – 1 (1996) 4,000
Local Government Empowerment Fund (1996) 1st Component 100 Poverty Alleviation Fund – 2 (1997) 2,000 Poverty Alleviation Fund – 3 (1998) 2,500 Lingap Para sa Mahirap Fund (2000) 2,500 KALAHI .
Source: GAA; MTPDP 2001-2004 and NAPC
In 1998, the Estrada Administration launched the Lingap Para sa Mahihirap (Caring for the Poor) Program. This program was granted a P2.5 billion allocation from the national budget to deliver medical assistance, livelihood, socialized housing, potable water supply, food subsidy and protective programs or services to the 100 poorest families in every city and province nationwide. Due to the absence of data at the household level, it took a long time to identify and validate the poorest families. The lists provided by the LGUs when subjected to validation showed the absence of uniform criteria across LGUs. Before the Lingap Para sa Mahihirap Program could be fully implemented, political events caused a change in administration.
The Lingap Program had several major weaknesses: (a) lack of program ownership by the LGUs which were not given adequate time to identify the 100 poorest families in their areas; (b) low targeting effectiveness and welfare impact which may be expected from a nationwide program that is spread over a wide area and to non-poor beneficiaries; (c) lack of beneficiary consultation and monitoring; and (d) politicized process of beneficiary selection.” (MTPDP 2001-2004)
In 2000, the Arroyo Administration launched its banner program for poverty reduction, the Kapit-Bisig Laban sa Kahirapan (KALAHI), a comprehensive and integrated convergence strategy to improve delivery of services for the poorest municipalities and provinces in the country. KALAHI has five strategies: (1) asset reform; (2) human development services; (3) employment and livelihood; (4) participation in governance of basic sectors; and (5) social protection and security against violence. KALAHI subscribes to the “convergence” approach earlier propagated in the Social Reform Agenda (SRA) while recognizing the need for “joint programming, implementation, and monitoring among national and local agencies, civil society sectors and people’s organizations in the poor communities.”
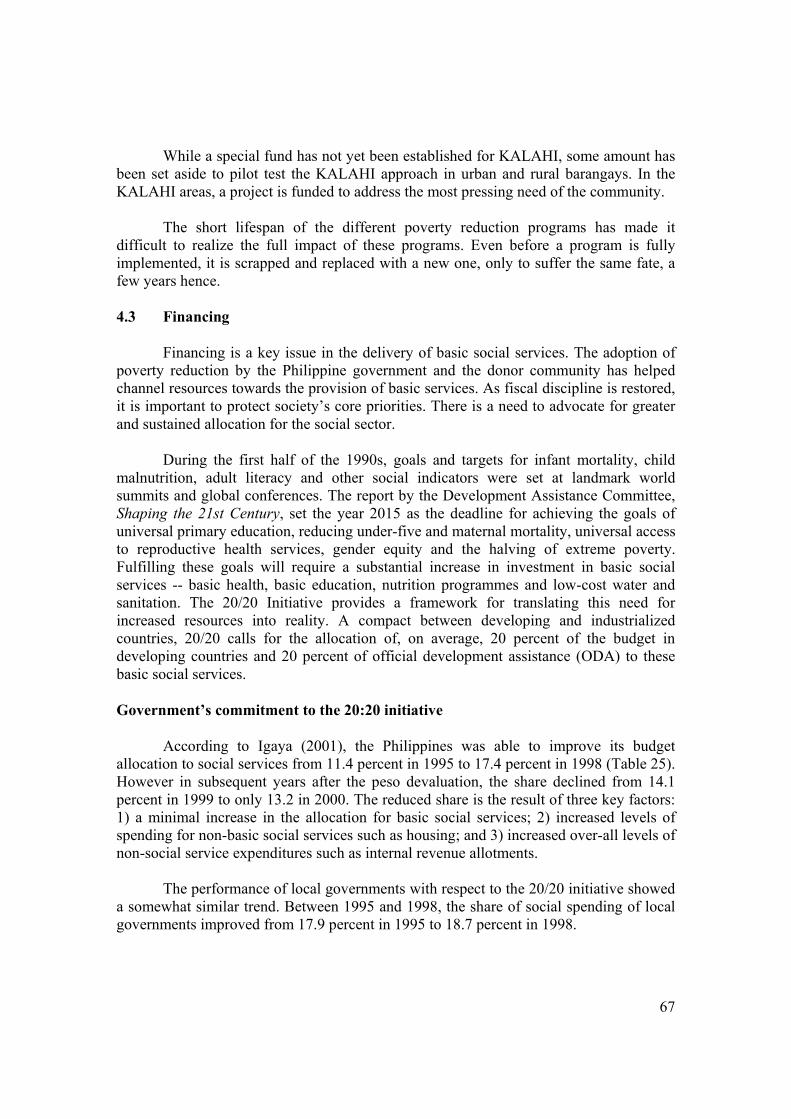
67
While a special fund has not yet been established for KALAHI, some amount has
been set aside to pilot test the KALAHI approach in urban and rural barangays. In the KALAHI areas, a project is funded to address the most pressing need of the community. The short lifespan of the different poverty reduction programs has made it difficult to realize the full impact of these programs. Even before a program is fully implemented, it is scrapped and replaced with a new one, only to suffer the same fate, a few years hence. 4.3 Financing
Financing is a key issue in the delivery of basic social services. The adoption of poverty reduction by the Philippine government and the donor community has helped channel resources towards the provision of basic services. As fiscal discipline is restored, it is important to protect society’s core priorities. There is a need to advocate for greater and sustained allocation for the social sector.
During the first half of the 1990s, goals and targets for infant mortality, child malnutrition, adult literacy and other social indicators were set at landmark world summits and global conferences. The report by the Development Assistance Committee, Shaping the 21st Century, set the year 2015 as the deadline for achieving the goals of universal primary education, reducing under-five and maternal mortality, universal access to reproductive health services, gender equity and the halving of extreme poverty. Fulfilling these goals will require a substantial increase in investment in basic social services -- basic health, basic education, nutrition programmes and low-cost water and sanitation. The 20/20 Initiative provides a framework for translating this need for increased resources into reality. A compact between developing and industrialized countries, 20/20 calls for the allocation of, on average, 20 percent of the budget in developing countries and 20 percent of official development assistance (ODA) to these basic social services.
Government’s commitment to the 20:20 initiative
According to Igaya (2001), the Philippines was able to improve its budget allocation to social services from 11.4 percent in 1995 to 17.4 percent in 1998 (Table 25). However in subsequent years after the peso devaluation, the share declined from 14.1 percent in 1999 to only 13.2 in 2000. The reduced share is the result of three key factors: 1) a minimal increase in the allocation for basic social services; 2) increased levels of spending for non-basic social services such as housing; and 3) increased over-all levels of non-social service expenditures such as internal revenue allotments.
The performance of local governments with respect to the 20/20 initiative showed a somewhat similar trend. Between 1995 and 1998, the share of social spending of local governments improved from 17.9 percent in 1995 to 18.7 percent in 1998.
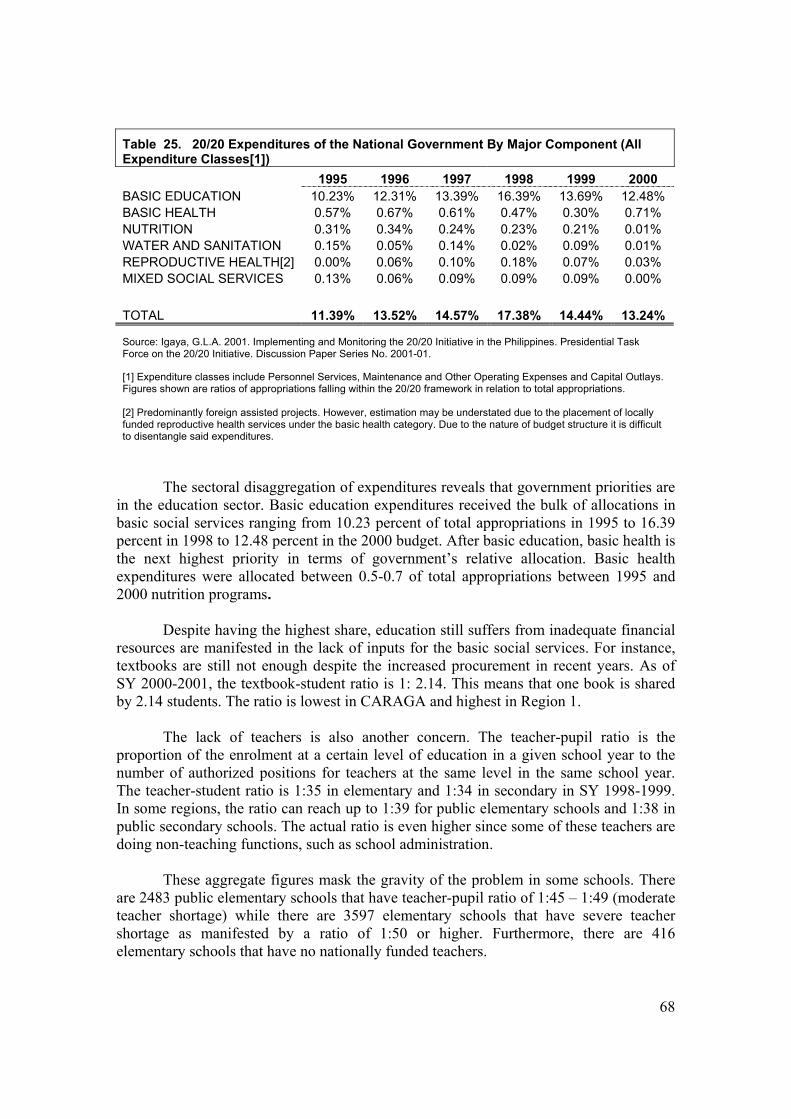
68
Table 25. 20/20 Expenditures of the National Government By Major Component (All Expenditure Classes[1])
1995 1996 1997 1998 1999 2000 BASIC EDUCATION 10.23% 12.31% 13.39% 16.39% 13.69% 12.48% BASIC HEALTH 0.57% 0.67% 0.61% 0.47% 0.30% 0.71% NUTRITION 0.31% 0.34% 0.24% 0.23% 0.21% 0.01% WATER AND SANITATION 0.15% 0.05% 0.14% 0.02% 0.09% 0.01% REPRODUCTIVE HEALTH[2] 0.00% 0.06% 0.10% 0.18% 0.07% 0.03% MIXED SOCIAL SERVICES 0.13% 0.06% 0.09% 0.09% 0.09% 0.00% TOTAL 11.39% 13.52% 14.57% 17.38% 14.44% 13.24%
Source: Igaya, G.L.A. 2001. Implementing and Monitoring the 20/20 Initiative in the Philippines. Presidential Task Force on the 20/20 Initiative. Discussion Paper Series No. 2001-01.
[1] Expenditure classes include Personnel Services, Maintenance and Other Operating Expenses and Capital Outlays. Figures shown are ratios of appropriations falling within the 20/20 framework in relation to total appropriations.
[2] Predominantly foreign assisted projects. However, estimation may be understated due to the placement of locally funded reproductive health services under the basic health category. Due to the nature of budget structure it is difficult to disentangle said expenditures.
The sectoral disaggregation of expenditures reveals that government priorities are in the education sector. Basic education expenditures received the bulk of allocations in basic social services ranging from 10.23 percent of total appropriations in 1995 to 16.39 percent in 1998 to 12.48 percent in the 2000 budget. After basic education, basic health is the next highest priority in terms of government’s relative allocation. Basic health expenditures were allocated between 0.5-0.7 of total appropriations between 1995 and 2000 nutrition programs.
Despite having the highest share, education still suffers from inadequate financial
resources are manifested in the lack of inputs for the basic social services. For instance, textbooks are still not enough despite the increased procurement in recent years. As of SY 2000-2001, the textbook-student ratio is 1: 2.14. This means that one book is shared by 2.14 students. The ratio is lowest in CARAGA and highest in Region 1. The lack of teachers is also another concern. The teacher-pupil ratio is the proportion of the enrolment at a certain level of education in a given school year to the number of authorized positions for teachers at the same level in the same school year. The teacher-student ratio is 1:35 in elementary and 1:34 in secondary in SY 1998-1999. In some regions, the ratio can reach up to 1:39 for public elementary schools and 1:38 in public secondary schools. The actual ratio is even higher since some of these teachers are doing non-teaching functions, such as school administration.
These aggregate figures mask the gravity of the problem in some schools. There are 2483 public elementary schools that have teacher-pupil ratio of 1:45 – 1:49 (moderate teacher shortage) while there are 3597 elementary schools that have severe teacher shortage as manifested by a ratio of 1:50 or higher. Furthermore, there are 416 elementary schools that have no nationally funded teachers.
69
A similar situation exists for public secondary schools. There are 171 secondary schools with no nationally funded teachers, 863 secondary schools with severe teacher shortage and 410 secondary schools with moderate teacher shortage. Classrooms are also not enough so that some schools have to have several shifts to accommodate all the enrollees. Average class size has declined from 41 in SY 1993-1994 to 39 in SY 1997-1998 in public elementary schools. The lowest class size is 32 in Region II and highest in NCR at 49. In the case of public secondary schools, the average class size has remained unchanged at 49. It is lowest at 40 in Regions VI and XII and highest in Region VII at 56. Among public elementary schools, there are 561 schools that have no existing instructional room, 2592 schools with classroom to pupil ratio of 1: 56 or more and 1136 schools with ratio of 1:51 -55.9. At the secondary level, there are 269 schools with no existing instructional room, 2047 with classroom to pupil ratio of 1: 56 or more and 576 schools with ratio of 1:51 -55.9. Official Development Assistance: the other side of the 20:20 ratio Using the data collected from NEDA, one can see that the donor community is trying to fulfill its commitment to the 20:20 initiative. The reorientation towards poverty reduction as the main goal of multilateral agencies has facilitated the flow of resources towards the social sectors. The data show a large increase in ODA commitments to social reform development from 2.8 percent in 2001 to 27.6 percent in 2002.
Total ODA Committed to the Philippines (In US$ million) 2001 2002
Sector Amount
% to total Amount
% to total
Agriculture, Agrarian Reform and Natural Resources 1/ 309.0 18.5 126.8 11.0Social Reform Development 2/ 46.7 2.8 318.6 27.6Infrastructure Development 3/ 902.7 54.0 662.3 57.5Governance and Institution Development 4/ 164.2 9.8 41.7 3.6Industry and Services 5/ 247.3 14.8 3.0 0.3Others 0.5 0.0 0.0 0.0TOTAL 1670.4 100.0 1152.3 100.0Source: public Investment Staff, NEDA Notes: 1/ Agriculture, Agrarian Reform and Environment and Natural resources 2/ Education and Manpower Development, Labor and Employment, Housing, Health, Nutrition and Population, Social Welfare and Community Development, and Social Infra 3/ Transportation, Water Resources, Energy, Power and Electrification and Communications 4/ Administrative Governance, Economic Governance, Political Governance 5/ Industry and Trade, Banking, relending and Microfinance, Science and Technology, Tourism
70
5. Issues and Challenges 5.1 Spatial Disparities
The presence of significant spatial disparities suggests the need to focus resources and interventions on certain areas.
The data indicate that there are significant disparities across regions and
provinces. While the poorest region is in Mindanao, the next two poorest regions are in Luzon. Moreover, while there are many poor provinces in Mindanao, there are provinces within the latter two island groups that are also very poor. Thus, while there is basis for focusing assistance in Mindanao, particularly in ARMM, the study shows that there are other poor regions needing assistance. In addition, there are also poor provinces within the not-so poor regions that should not be neglected. In fact, there are more poor families in Luzon than in Mindanao.
The regions which are the poorest are ARMM and the Bicol Region and
MIMAROPA. Using the income-based measure of poverty, the 10 poorest provinces are Sulu, Masbate, Maguindanao, Lanao del Sur, Tawi-tawi, Ifugao, Romblon, Sultan Kudarat, Camiguin and Camarines Norte. Considering the different indicators relating to the different dimensions of poverty, the 10 poorest provinces ar Maguindanao, Sulu, Masbate, Agusan del Sur, Camarines Norte, Zamboanga del Norte, Romblon, Lanao del Sur, Capiz and Lanao del Norte. While there are overlaps, there are some provinces which are not considered the poorest if only the income-based poverty incidence is used. This indicates the need to look at the different indicators when choosing the priority areas.
5.2 Gender Disparities
“Poverty is gendered because men and women experience poverty differently –
and unequally- and become poor through different, though related, processes” (Kabeer, 2003).
Various efforts seem to have positively reduced the bias against women. We now
find women in fields traditionally dominated by men. Moreover, health indicators show higher cohort survival rates and life expectancy ratios for women. However, maternal mortality rate remains high. In the case of education, women tend to be better off in terms of higher cohort survival rate. However, women tend to not fare as well in the labor market. Men tend to have higher positions, and earn more than women in the same position. Moreover, female OFWs are often employed as domestic workers or entertainers, placing them in vulnerable positions.
With the government’s thrust on gender mainstreaming, it is hoped that many of
the concerns of women will be addressed. However, as is true with many of the government’s programs, it is in the implementation that we are sadly lacking. Regular monitoring and evaluation of these programs are necessary to ensure that the laws, policies and programs are bringing about the desired outcomes. For instance, regular
71
monitoring and assessment of the GAD budget and greater advocacy at the local level are important to make this initiative effective.
Another issue is the availability of data that are gender-disaggregated. While there
have been efforts by the official statistical system to provide the necessary data, there are still many areas where there are data gaps. Data on contribution of women to family income would provide useful input in assessing the role of women as economic players. Furthermore, the administrative reporting system of some agencies has not adjusted their system to cope with the demand for gender-disaggregated data.
5.3 Governance
This section presents the issues relating to the different aspects of governance as
they affect the social sector developments. 5.3.1 Decentralization
How has decentralization affected the progress in the various sectors? Are there
gaps in the decentralization process? Some LGUs have mentioned that the devolution of functions has not been matched with devolution of funds for LGUs to carry out the devolved functions. While the internal revenue allotment (IRA) is not intended to be the primary source of revenue for the LGU, many LGUs are constrained in generating revenues either due to lack of capacity in designing and implementing revenue generating measures or the local economy is so small such that very little revenues could be generated. The lack of resources has been the most important constraint for the LGUs in carrying out poverty reduction programs.
In addition, many LGUs still need capacity building to be able to formulate and implement appropriate and effective programs. The first thing that is needed to be able to craft a local development plan that will be responsive to reducing poverty is information on the nature and extent of poverty in the locality. In many LGUs, there are no available information to provide the basis for policy formulation and program/project implementation. The national statistical system has not kept pace with the increasing demand for more disaggregated information that decentralization brought about. Consequently, community-based monitoring systems have been developed and adopted by LGUs to generate the information that they need. Capacity building of local government officials is made more difficult with the 3-year term of office. Turnover of officials require continuous capacity building programs. The Department of Interior and Local Governments can play an important role here. 5.3.2 Institutional arrangements and capacity
Do existing institutions have the capacity and mandate to carry out the tasks
needed to reduce poverty? The issue of multi-agency coordination is discussed in this section.
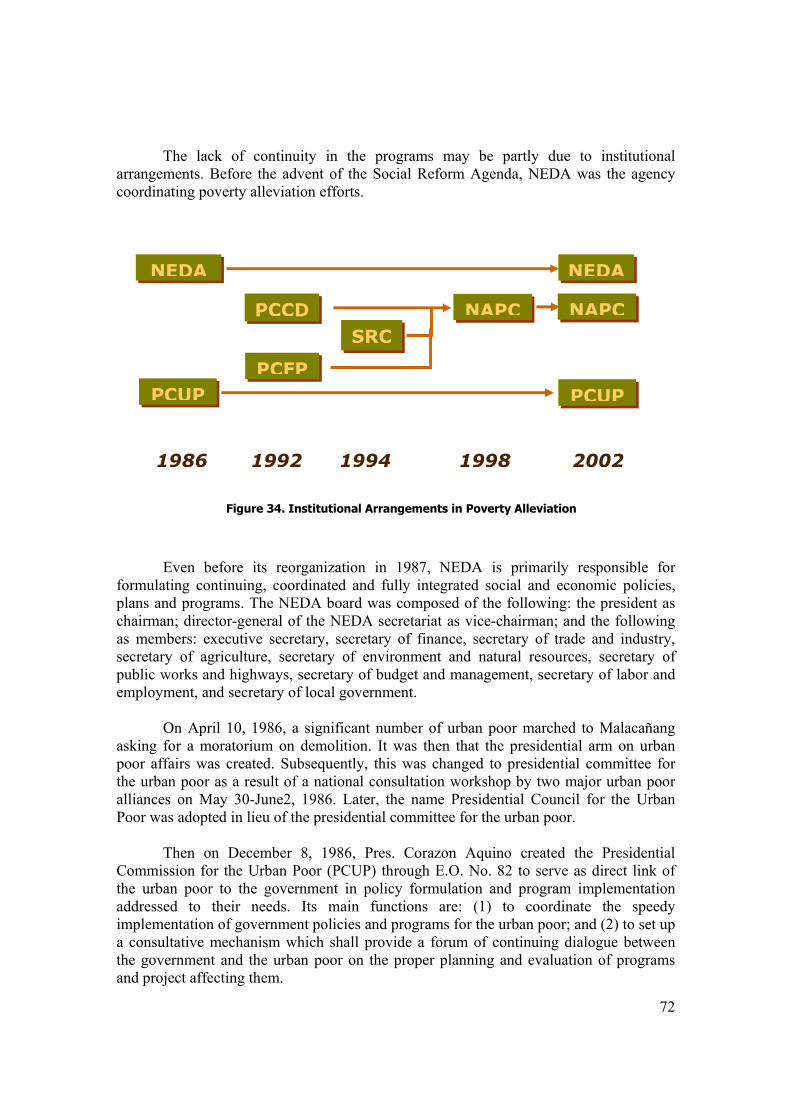
72
Figure 34. Institutional Arrangements in Poverty Alleviation
1986 1992 1994 1998 2002
PCUP PCUP
NEDA NEDA
PCFP
PCCD NAPC SRC
NAPC
The lack of continuity in the programs may be partly due to institutional arrangements. Before the advent of the Social Reform Agenda, NEDA was the agency coordinating poverty alleviation efforts.
Even before its reorganization in 1987, NEDA is primarily responsible for formulating continuing, coordinated and fully integrated social and economic policies, plans and programs. The NEDA board was composed of the following: the president as chairman; director-general of the NEDA secretariat as vice-chairman; and the following as members: executive secretary, secretary of finance, secretary of trade and industry, secretary of agriculture, secretary of environment and natural resources, secretary of public works and highways, secretary of budget and management, secretary of labor and employment, and secretary of local government.
On April 10, 1986, a significant number of urban poor marched to Malacañang
asking for a moratorium on demolition. It was then that the presidential arm on urban poor affairs was created. Subsequently, this was changed to presidential committee for the urban poor as a result of a national consultation workshop by two major urban poor alliances on May 30-June2, 1986. Later, the name Presidential Council for the Urban Poor was adopted in lieu of the presidential committee for the urban poor.
Then on December 8, 1986, Pres. Corazon Aquino created the Presidential
Commission for the Urban Poor (PCUP) through E.O. No. 82 to serve as direct link of the urban poor to the government in policy formulation and program implementation addressed to their needs. Its main functions are: (1) to coordinate the speedy implementation of government policies and programs for the urban poor; and (2) to set up a consultative mechanism which shall provide a forum of continuing dialogue between the government and the urban poor on the proper planning and evaluation of programs and project affecting them.
73
The Presidential Council for Countryside Development was established in 1992
by virtue of E.O. No. 6 to identify and address the socio-economic problems of regions, provinces and areas that have lagged behind terms of economic growth. The council assists in identifying opportunities for growth and development, and motivates regions and provinces to concentrate on development efforts that would accelerate the growth process. The PCCD also assists in the development of infrastructures by mobilizing resources for this purpose.
In 1992, the Presidential Commission to Fight Poverty (PCFP) was created to administer all government activities on poverty alleviation to ensure pro-poor bias, focus on the poorest of the poor and critical services, and fast implementation of programs and projects. The PCFP’s functions were to:
1. Prepare a blue print of action that shall embody the Administration’s poverty
alleviation framework and translate this into short, medium and long-term targets which shall reflect the priority action areas of the government;
2. Monitor the implementation and impact of government poverty alleviation programs, projects and activities;
3. Coordinate and integrate government poverty alleviation efforts; 4. Review and evaluate the level of performance of concerned agencies and
activities; 5. Prod and facilitate the implementation of poverty alleviation activities; 6. Communicate to the public government’s poverty alleviation activities and its
impact; 7. Provide the support and assistance needed by local government units to ensure
that they deliver the basic services to their respective constituencies; and 8. Ensure that all government pro-poor programs build the capability of our people
to be empowered and to be self-reliant.
In 1994, the Social Reform Council (SRC) was established to be the policy-making body behind the Social Reform Agenda. The Social Reform Council (SRC), chaired by the President, oversees and coordinates parallel networks at the national, regional and local levels, with a basic sector counterpart structure matching each level of the bureaucracy. The Council is referred to as an “expanded Cabinet”, since 13 Sectoral Representatives sit in the SRC as counterparts to the Cabinet members designated as Flagship Champions. The Council is supported by a National Technical Working Group and the SRC Secretariat.
The National Anti-Poverty Commission (NAPC) was created under the office of the president through republic act no. 8425 passed in to give support to the social reform and poverty alleviation program of the Ramos administration. It was created to serve as the coordinating and advisory body for the implementation of the social reform agenda. Republic act no. 8425 has abolished the presidential commission to fight poverty (PCFP), the social reform council (SRC), and the presidential council for countryside development (PCCD). The NAPC took over the functions of the three abolished commissions and councils. It is not clear, however, why the PCUP was not included in this reorganization.
74
The NAPC is composed of the chairperson (the president of the republic); lead convenor as the head of the NAPC secretariat (appointed by the president of the republic); vice-chairpersons, each for the government and basic sectors; and members which composed of the heads of the involved departments (DAR, DA, DOLE, DBM, DSWD, DOH, DECS, DILG, DENR, DOF, NEDA, PCFC AND PCUP), presidents of the leagues of local government units and representatives from each of the basic sectors (farmers and landless rural workers, artisan fisher folk, urban poor, indigenous cultural communities, workers in the informal sector, women, youth and students, persons with disabilities, victims of disasters and calamities, senior citizens, NGOs, children and cooperatives. This was the first time that the participation of the basic sectors in national policymaking and coordination was institutionalized.
The NAPC’s primary functions are coordinate with different national and local
government agencies and private sector to assure full implementation of all social reform and poverty alleviation programs as well as with local government units in the formulation of social reform and poverty alleviation programs for their respective areas in conformity with the national poverty action agenda; recommend policies and other measures to ensure the responsive implementation of the commitments under the SRA; ensure meaningful representation and active participation of the basic sectors; and oversee, monitor and recommend measures to ensure the effective formulation, implementation and evaluation of policies, programs and resource allocation and management of social reform and poverty alleviation programs.
It took more than a year to constitute the NAPC because of the process of
selecting representatives of basic sector representatives so that NAPC became operational in 1999. Unfortunately, while NAPC was “created to serve as the coordinating and advisory body for the implementation of the social reform agenda” the SRA has been dropped by the Estrada administration and replaced by the Lingap program.
With the change in administration in 2000, the NAPC also had changes in
personnel. Moreover, the first set of basic sector representatives ended their term in 2002 (they have 3 year terms) and a new set of representatives have been selected in May 2002. In addition, a new program was adopted. All these changes affected the pace at which NAPC could develop and implement programs aimed at reducing poverty.
At present, the NAPC coordinates the poverty reduction programs while NEDA
coordinates all economic and social policies and programs. PCUP continues to perform its mandate of coordinating policies and programs for the urban poor. The heads of NEDA and PCUP are members of the NAPC.
The challenge for these 3 agencies is to put in place a poverty reduction program
that will outlast any administration. We have seen programs that last only as long as the originators of the program. Some have managed to stay but partly because the agency responsible for that program has made the program politically relevant by changing the names of the program. One example is the Kadiwa stores of the NFA. This has survived various administrations by changing its name to NFA rolling stores to ERAP (enhanced retail access for the poor) and then to GMA (greater market access) stores.
75
One program that has managed to continue despite changes in administration is the CIDSS program, mainly because it is a regular program of the Department of Social Welfare and Development. This is being continued in the present administration with some modifications under the name KALAHI-CIDSS.
It has been recently recognized that LGUs could play a critical role in poverty
reduction. While policies and programs may be formulated at the national level, the implementation of many of these programs depends on the machinery of the LGUs. With devolution resulting from the local government code of 1991, LGUs are in a better position to prioritize the needs of the localities and identify the eligible program beneficiaries.
The importance of local level participation has been further strengthened with the
issuance of memorandum circular no. 2001-105 by the Department of Interior and Local Governments (DILG) on august 13, 2001 calling for the identification of local poverty reduction action (LPRAOS) in all municipalities, cities and provinces. The LPRAOS are tasked to oversee the poverty reduction efforts in their localities. In addition, DILG issued memorandum circular no. 2001-109 on august 21, 2001 to enjoin all local chief executives to undertake local programs on poverty reduction and local economic transformation. It also reiterated the need to designate LPRAOS and to formulate local poverty reduction action agenda. Furthermore, it provided for the inventory of poorest families, identification of local needs in the areas of food, shelter, employment and education as well as external and internal sources of assistance to implement the action agenda.
Given that the internal revenue allotment (IRA) received by LGUs represents
about 17 percent of the total budget, this represents a potentially large amount that can be used to address poverty at the local level. The challenge is to build capacity of LPRAOS to be able to carry out their tasks.
5.3.3 Delivery of services
Have programs been effective in attaining their objectives? What have been the major constraints? Programs Targeting Schemes of Poverty Reduction Programs and Social Safety Nets Given the magnitude of the poverty situation, significant resources are needed to address the problem. Under the present scenario of budget deficit, it becomes imperative to use targeted programs to assist the poor. Yet available data shows that some of our programs are not well targeted. Table 27 shows that for scholarships and housing programs, the poorer quintiles of the families are able to benefit less than the richer quintiles. In the case of scholarship
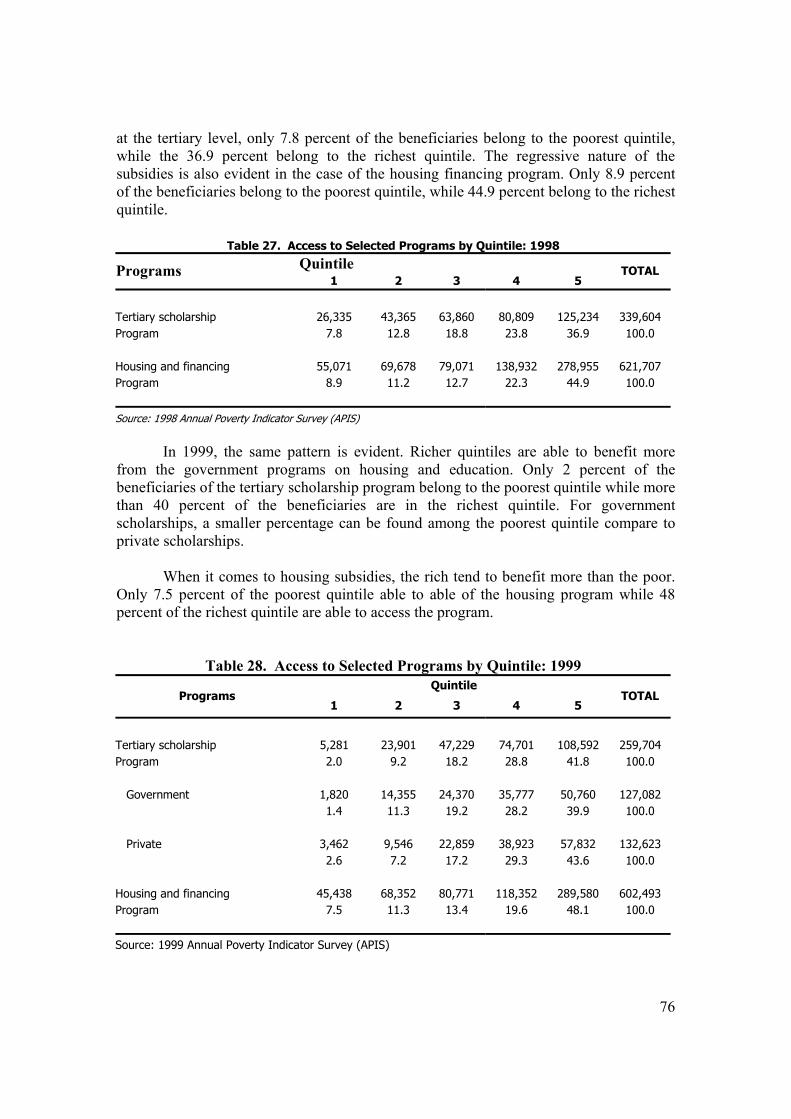
76
at the tertiary level, only 7.8 percent of the beneficiaries belong to the poorest quintile, while the 36.9 percent belong to the richest quintile. The regressive nature of the subsidies is also evident in the case of the housing financing program. Only 8.9 percent of the beneficiaries belong to the poorest quintile, while 44.9 percent belong to the richest quintile.
Table 27. Access to Selected Programs by Quintile: 1998
Quintile Programs 1 2 3 4 5
TOTAL
Tertiary scholarship 26,335 43,365 63,860 80,809 125,234 339,604 Program 7.8 12.8 18.8 23.8 36.9 100.0 Housing and financing 55,071 69,678 79,071 138,932 278,955 621,707 Program 8.9 11.2 12.7 22.3 44.9 100.0
Source: 1998 Annual Poverty Indicator Survey (APIS)
In 1999, the same pattern is evident. Richer quintiles are able to benefit more from the government programs on housing and education. Only 2 percent of the beneficiaries of the tertiary scholarship program belong to the poorest quintile while more than 40 percent of the beneficiaries are in the richest quintile. For government scholarships, a smaller percentage can be found among the poorest quintile compare to private scholarships. When it comes to housing subsidies, the rich tend to benefit more than the poor. Only 7.5 percent of the poorest quintile able to able of the housing program while 48 percent of the richest quintile are able to access the program.
Table 28. Access to Selected Programs by Quintile: 1999 Quintile
Programs 1 2 3 4 5
TOTAL
Tertiary scholarship 5,281 23,901 47,229 74,701 108,592 259,704 Program 2.0 9.2 18.2 28.8 41.8 100.0 Government 1,820 14,355 24,370 35,777 50,760 127,082 1.4 11.3 19.2 28.2 39.9 100.0 Private 3,462 9,546 22,859 38,923 57,832 132,623 2.6 7.2 17.2 29.3 43.6 100.0 Housing and financing 45,438 68,352 80,771 118,352 289,580 602,493 Program 7.5 11.3 13.4 19.6 48.1 100.0
Source: 1999 Annual Poverty Indicator Survey (APIS)
77
The problem of targeting is one of the major challenges faced by government agencies tasked with reducing poverty, more particularly the National Anti-Poverty Commission. Often, it is the precision (or imprecision) of targeting that determines the success (or failure) of any poverty reduction program. Leakages are brought about by the high costs of information necessary to distinguish the poor from the non-poor. The government’s Social Reform Agenda used geographical targeting in allocating funds to finance poverty alleviation programs. Unfortunately, this type of targeting which has the virtue of simplicity is susceptible to the problem of exclusion as well as leakages. A case in point is the 20 priority provinces that the government initially identified for the implementation of the SRA. Only 11 percent of the poor were in these areas.
The government then moved to focusing on 5th and 6th class municipalities, where
the class of the municipality depends not on the income of its residents, but on the income of the municipality. The latter is derived from the real estate tax and other revenues collected by the municipality.
For the Lingap Program, the targets for assistance were poor families in each of
the 78 provinces and 83 cities. The process of identifying the 100 poorest families in each locality was dropped before it was even completed.
The current government has modified this scheme by considering other factors in
choosing priority areas. For its KALAHI program, the government seeks to identify pilot municipalities and barangays. The criteria for identifying priority areas include the following:
• High poverty incidence • Communities experiencing or recovering from the crisis or armed conflict • Presence of asset reform problem or large gap in asset reform program • Presence of vulnerable poor sectors • Areas not included in major financial assistance projects
Since the official poverty statistics coming from the National Statistics Office are available only at the provincial level and not at the municipal and barangay levels, the NAPC has to rely on local government units to provide the necessary information. The importance of having a poverty monitoring system at the barangay level cannot be overemphasized to be able to carry out this program. Only with a CBMS can it be ensured that targeted programs can be carried out. Local level statistics are necessary national agencies for identifying priority areas and allocating resources while they are necessary for local government units and program implementers for identifying beneficiaries. To address the issue of cost, the poverty monitoring system can be integrated as part of the planning system of the LGU. Data collection and analysis can be done by the LGU in support of the preparation of their Annual Investment Plan. This has been given a boost with recent developments.
78
5.3.4 Monitoring and Evaluation
Are there monitoring and evaluation systems in place that allow policymakers, program implementers and the rest of the society to track outcomes and consequently fine tune programs?
To be able to determine the appropriate interventions, it is first necessary to
diagnose the poverty situation. The official statistical system, through national surveys and censuses, provide poverty indicators. However, many of these indicators are not collected frequently enough or too aggregated to be useful or are made available too long after the reference period.
With devolution, the demand for local level data has increased tremendously and
the official statistical system can not cope with this. Thus, there have been initiatives to develop community-based monitoring systems (CBMS). One such system is the CBMS developed by the MIMAP Project. Its basic features are: (1) LGU-based; (2) employs local monitors: (3) creates a database at each geopolitical level; (4) data used in local level planning and monitoring and evaluation; (5) participation by the various stakeholders in the community; and (6) utilizes GIS technology. CBMS has been adopted by Palawan, Camarines Norte and is being considered by the other MIMAROPA provinces.
The monitoring and evaluation component of programs is the weakest link. Many
programs are implemented without incorporating a M&E system. Thus, outcomes cannot be tracked. Consequently, many programs continue to be implemented without knowing whether these programs are effective or whether these programs have unintended results as well. Opportunities are lost for finetuning programs to achieve the best results.
79
6. RECOMMENDATIONS: PROPOSED STRATEGIC INTERVENTIONS
This section summarizes the conclusions from the analysis and proposes an action plan for the social sector. The latter identifies key strategic interventions for the social sector for the next five years.
6.1 Key to reducing poverty is broad-based economic growth
Key to the fight against poverty is economic growth. High and sustained broad-
based growth is needed to raise incomes and reduce inequality. There is a need to modernize agriculture and promote non-farm employment in the rural areas.
6.2 Ensure continuity of policies and programs
One of the reasons that the country’s performance with regards to reducing poverty has been unremarkable is the poverty alleviation programs that we have. For one, there is lack of continuity in the government’s program to reduce poverty. Every administration comes up with its own poverty reduction strategy and programs. It is important to depoliticize the poverty reduction program so that programs are sustained. In the past, many programs are dropped even before their full effect could be felt, just because they are associated with the previous administration. Thus, some government agencies have been creative in naming their programs to survive changes in administration. The National Food Administration has been successful in renaming the Kadiwa rolling store during the Marcos Administration to ERAP (Enhanced Retail Access Program) store during the Estrada Administration to GMA (Greater Market Access) store during the current administration. The challenge for NAPC and other government agencies is to ensure that the current programs being implemented will outlast the present administration.
In the case of donor-assisted programs, there is a need to ensure that these
programs will be picked up by the local partners, be it the national or local government, or the community. 6.3 Well-designed and well-targeted programs are necessary
In addition to the issue of continuity of programs, the programs have employed weak targeting schemes. During the Ramos administration, focus was given to the 20 priority provinces. However, only 11% of the poor are in these provinces. The targeting scheme was refined to focus on 5th and 6th class municipalities. The assumption here was that the poor would be found in poor municipalities. However, we know that not all the people in 5th and 6th class municipalities are poor. Furthermore, even in 1st class municipalities, there are poor. During the Estrada Administration this was refined to focusing on the 100 poorest families in each province and city. The local government units were tasked to identify them. However, in the absence of adequate information at the household level, it took two years to come up with the lists. By that time, a new administration has taken over.
80
Geographic targeting has been preferred because it is easy to implement. This is useful but should not be used exclusively. For one, the official statistical system can only support targeting down to the provincial level at most. But Section 3 highlights the presence of wide spatial disparities across regions and provinces. And these dispartieis persist across municipalities/cities within provinces and barangays across municipalities/ cities as indicated by data collected in Palawan and Camarines Norte using the MIMAP-CBMS.
The basic problem in the implementation of targeted programs is the lack of
information. Geographic targeting is the most attractive because it is easy to implement but the official statistical system can only provide data down to the regional and provincial levels. In connection with this, the development of community-based monitoring system can address the data gaps. This would allow for the generation of information that would enable us to identify who and where the poor are.
Programs that utilize self-targeting, which are easier to administer, have not been
used extensively. There is a need to improve design of programs. For instance, anyone can buy from NFA rolling stores although there are some efforts to locate them in the “poor areas.” In addition to choosing the areas, selling inferior goods might be more effective in ensuring that the buyers are poor.
There is a need to come up with more innovative programs and projects to address
the problems. For instance, to reach the MDG target of universal access to basic education, the traditional interventions may not be effective anymore given that the elementary participation rate is already very high. The CBMS results indicate that some of the reasons for not going to school include lack of money (out-of- pocket expenses for public schools may still be too high for very poor families), the long distance to the nearest school and preference of the families (indigenous peoples may find the formal system too restrictive). In these cases, innovative programs are needed to address the needs of these groups. For example, scholarship that covers school supplies, uniforms, meals and transport may be necessary to enable children from very poor families to enroll. Busing children to the nearest school or housing children in on-campus dormitories may be better than building schools in every barangay, especially when the student population may not be cost-effective. Insofar as the needs of indigenous peoples, more flexible systems such as mobile teachers or allowing students to continue in other schools may be helpful.
Programs have to be designed to do the following:
Reach out to out-of school children in remote places, indigenous peoples, street children, the poor
Increase cohort survival rate Increase quality of education Increase maternal mortality rate Reduce malnutrition prevalence Increase access to basic amenities
81
6.4 Regional disparities need to be addressed
The data indicate that there are significant disparities across regions and provinces. While the provinces in Mindanao tend to be poorer than those in Luzon and the Visayas, there are provinces within the latter two island groups that are very poor. Thus, while there is basis for focusing assistance in Mindanao, particularly in ARMM, the study shows that the poor provinces within the not-so-poor regions should not be neglected.
While current donor assistance is focused on Mindanao, future donor assistance
should include other regions and provinces where poverty incidence is high. The Bicol and MIMAROPA regions are the next poorest regions. Poverty reduction efforts should also be directed towards the poor provinces in Luzon and Visayas such as Masbate, Ifugao, Romblon, Camarines Norte, Capiz, Mountain Province, Abra, Eastern Samar, Bohol, Marinduque, Catanduanes, Misamis Occidental, Oriental Mindoro, Camarines Sur, Negros Occidental, Occidental Mindoro, Sorsogon, Northern Samar, and Samar.
6.5 Gender-disparities need to be addressed
Gender disparities, particularly in the labor market, need to be addressed.
6.6 Chronic and transient poverty The recent Asian financial crisis and the El Nino episode in 1997-1998 have
shown that the population, especially the poor, are vulnerable to shocks. It was found that only half of those considered poor in 1997 are consistently poor in 1998 and 1999. This means that the problem is not as daunting as it seems. The key is finding the appropriate interventions for the chronic and transient poor. Further research is needed in identifying who are the chronic and transient poor and the causes of their poverty. Then appropriate interventions can be designed for the target groups.
A menu of safety nets has to be developed so that they can be made available
quickly in times of crises. For example, assistance to keep poor children in school during times of crisis or a program to enable dropouts to go back to school after the crisis are necessary to avert long-term adverse impact on human capital.
6.7 Population management policy
There is a need for a stronger population management policy to be able to deal with the population issue once and for all.
6.8 Decentralization and Capacity Building
The passage of the Local Government Code in 1991 has devolved certain function
of the national government to local government units. The national government recognizes the importance of LGUs in fighting poverty. The Department of Interior and Local Government issued a circular enjoining all provinces and cities/municipalities to
82
appoint Local Poverty Reduction Action Officers (LPRAOs) to help formulate action plans to reduce poverty. Planning and development officers, agricultural extension workers, social workers were among those who were designated But there is a need to build capacity of these staff to carry out their functions.
Training for officials and staff of provinces, cities, municipalities on:
Collecting the information on which to base their plans Diagnosing poverty – nature and extent of poverty Identifying appropriate interventions Finding resources for these interventions Monitoring and evaluation of programs and projects
Capacity building should be provided not just to the provincial official and
city/municipal officials but barangay officials as well. The barangay seems to be the weakest link in the chain. A large part of the budget of the barangays is spent on salaries of barangay officials. The rest is spent on projects that are identified by the Barangay Development Council. Accountability for these funds needs to be strengthened.
6.9 Improve Local Level Monitoring and Evaluation System through adoption of
CBMS There is a need to improve monitoring and evaluation system. While there is
triennial monitoring of poverty incidence among regions and provinces, there is no regular monitoring of the welfare status of the population in all cities/municipalities and all barangays. Some LGUs have taken the initiative of institutionalizing community-based monitoring system at the local level (barangays, municipalities/cities and provinces) and incorporating the results of the monitoring in the annual development planning of these LGUs. This CBMS needs to be institutionalized in all LGUs. Such a system would improve local governance since they would provide the information necessary for identifying the unmet needs of the community and the appropriate interventions. The system, which calls for either the NAPC or DILG or NEDA as the repository of local data, would be useful for the national agencies in identifying benefiaries for national programs.
For many of the implementing agencies and government units, there are no
evaluation systems in place that assesses the impact of the programs and projects. The evaluation of on-going projects would allow finetuning of these projects. In addition, evaluation of on-going and completed projects and programs would provide program implementers the basis to continue or discontinue these interventions. In practice, some of these interventions are allowed to continued without knowing if they are the most effective and cost-efficient ones. Incorporating a M& E system to all programs and projects are critical. This would also pave the way for coming up with a menu of interventions that are appropriate for the problem.
83
6.10 Strengthen Institutional Coordination and Collaboration The NAPC is the government agency mandated to formulate poverty reduction
policy and coordinate poverty reduction programs and projects. It is a Commission where representatives of the basic sectors or vulnerable groups are represented together with government agencies. The composition of NAPC is intended to ensure representation of all sectors. There is a need to further improve mechanisms to bring about this desired representation to ensure that the concerns of the basic sectors are coherently incorporated in the policies and programs.
The main poverty reduction program, the KALAHI, utilizes the convergence
approach wherein all government agencies involved in the delivery of basic social services focus their efforts on KALAHI areas. This convergence strategy depends on the cooperation of the different agencies. The experience during the Social Reform Agenda was that the extent of cooperation of the different agencies varied significantly across municipalities/cities depending on the willingness of the local representatives of the concerned agencies. Coordination among the different agencies needs to be strengthened.
84
REFERENCES Asian Development Bank. 1999. Fighting Poverty in Asia and the Pacific: The Poverty
Reduction Strategy, Policy Papers [online]. Available from the World Wide Web: (http://www.adb.org/Documents/Policies/Poverty_Reduction/default.asp?p=poverty).
________. 1999. Reducing Poverty: Major Findings and Implications. (A Report Based
on Consultations in Selected Developing Member Countries of the Asian Development Bank [online]. Asian Development Bank Publication. Available from the World Wide Web: (http://www. adb.org/Documents/Brochures/Reducing_Poverty/reducing_poverty.pdf).
Balisacan, A.M. 2001. Poverty Comparison in the Philippines: Is What We Know About
the Poor Robust? Paper delivered at the Asia and Pacific Forum on Poverty: Reforming Policies and Institutions for Poverty Reduction, 5-9 February, Asian Development Bank, Manila, Philippines [online]. Available from the World Wide Web: (http://www.adb.org/scripts/rwisapi.dll)
Balisacan, A.M. and S. Fujisaki, ed.1998. Growth, Poverty and Income Inequality in the
Philippines. Tokyo: Institute of Development Economics. Bautista, V.A. 2001. A Critique of the KALAHI Program. A Paper Prepared for the
National Anti-Poverty Commission. Quezon City: UP National College of Public Administration and Governance.
De Castro, H. and M. C. L. Ginete. Integration of the Madrasah System of Education into
the Philippine Educational System. November 2001. Department of Social Welfare and Development. 2002. Programs/Projects [online].
Available from the World Wide Web: (http://www.dswd.gov.ph) Housing and Urban Development Coordinating Council. 2002. Housing Projects [online]
Available from the World Wide Web: (http://www.hudcc.gov.ph) Igaya, Gregorio Luis A. Implementing and Monitoring the 20/20 Initiative in the
Philippines. Discussion Paper Series No.2001-01. Presidential Task Force on the 20/20 Initiative.
Kabeer, N. Gender Mainstreaming in Poverty Eradication and the Millennium
Development Goals. 2003. London, United Kingdom: Commonwealth Secretariat.
Llanto, G.M. 1997. Using Micro finance Institutions in Poverty Alleviation: A Case of the
Blind Leading the Blind. PIDS Policy Notes No. 97-09. Makati City, Philippines: Philippine Institute for Development Studies.
85
Mangahas, M. 1999. Monitoring Philippine Poverty By Operational Social Indicators. [online] Social Weather Stations (cited August 2002). Available from the World Wide Web: (http://www.sws.org.ph/prem.htm)
___________. 1979. On How To Measure Poverty. UPSE Discussion Paper 79-05.
University of the Philippines School of Economics. University of the Philippines Diliman, Quezin City, Philippines.
___________. The Latest Trend in Poverty [online]. Social Climate. (cited August 2, 1999) Social Weather Stations. Available from the World Wide Web: (http://www.sws.org.ph).
Milo, M. Social Safety Net Programs in the Philippines. In Lamberte, M.B. ed. 2001.
Economics Crisis Once More. Makati City, Philippines: Philippine Institute for Development Studies.
National Anti-Poverty Commission, National Economic and Development Authority, and
Presidential Management Staff. Healing the Nation: The First 100 Days of the Macapagal-Arroyo Administration. (A Report of the Macapagal-Arroyo Administration). April 30, 2001. Manila, Philippines.
National Anti-Poverty Commission. 2001. Kapit-Bisig Laban sa Kahirapan (KALAHI)
Primer. Quezon City, Philippines: National Anti-Poverty Commission. National Economic Development Authority. Four-Year Development Plan 1971-1974.
Manila, Philippines ________. Four-Year Development Plan 1974-1977. Manila, Philippines ________. Five-Year Philippine Development Plan 1978-1982. 1977. Manila.
Philippines. ________. Philippine Development Plan, 1987-1992. Manila, Philippines ________. Updates of the Philippine Development Plan, 1990-1992. Manila, Philippines. ________. Medium-Term Philippine Development Plan 1993-1998. Manila, Philippines ________. Updated Medium-Term Philippine Development Plan, 1996-1998. Manila,
Philippines. ________. Medium-Term Philippine Development Plan 1999-2004. Manila, Philippines ________. Medium-Term Philippine Development Plan 2001-2004. November 2001.
Manila, Philippines. ________. Socioeconomic Report 2001. Pasig City, Philippines.
86
National Statistical Coordination Board. 2001 Philippine Statistical Yearbook. October 2001. Makati, Philippines
_______. 2002 Philippine Statistical Yearbook. October 2002. Makati, Philippines National Statistical Coordination Board [online]. NSCB Technical Notes: Human
Development Index. (cited August 2002). Available from the World Wide Web: (http://www.nscb.gov.ph/technotes/hdi_tech_human.htm ).
Orbeta, A. and M. Sanchez. 1996. Micro Interventions for Poverty Alleviation: The
Philippine Case. PIDS Discussion Paper Series No. 96-13. Makati City, Philippines: Philippine Institute for Development Studies.
Orbeta, A. C. 1996. Structural Adjustment and Poverty Alleviation in the Philippine.
PIDS Discussion Paper Series No. 96-04. Makati City, Philippines: Philippine Institute for Development Studies.
Pascual, C. 1987. Measuring the Intensity of Poverty in Metro Manila 1980-1985.
Undergraduate Thesis, University of the Philippines Diliman. Pineda, V. Impact of the East Asian Financial Crisis on Social Services Financing and
Delivery. In Lamberte, M.B. ed. 2001. Economic Crisis Once More. Makati City, Philippines: Philippine Institute for Development Studies.
Reyes, C. The Poverty Fight: Have We Made An Impact?”, PIDS Discussion Paper
Series 2002. Makati City: Philippine Institute for Development Studies. ______. Progress Report on the Millenium Development Goals (Draft version). April
2002. Reyes, C. and E. del Valle, 1998. Poverty Alleviation and Equity Promotion, PIDS
Discussion Paper Series 1998-06. Makati City: Philippine Institute for Development Studies.
Rola D. A. ed.1981. Integrated Rural Development: Problems and Issues, Management
Education Council. Quezon City: University of the Philippines. SOCIAL REFORM AND POVERTY ALLEVIATION ACT (REPUBLIC ACT NO.
8425), 1997. MANILA: PHILIPPINES Social Weather Stations [online]. Survey Indicators. Available from the World Wide
Web: (http://www.sws.org.ph). United Nations Development Programme. UNDP Poverty Related Publications: Poverty
Concepts and Poverty Lines. Available from the World Wide Web: (http://www.undp.org).
_________. Human Development Reports. Various years.
87
_________. 2002. Human Development Report: HDR Frequently Asked Questions
[online]. Available from the World Wide Web: (http://hdr.undp.org/statistics/faq.cfm#1)
_________. Poverty Report 2000: Overcoming Human Poverty [online]. United Nations
Development Programme (cited August 2002). Available from the World Wide Web: (http://www.undp.org)
United States of America Embassy [online]. Philippines Economic Wrap-Up (cited July
21-27, 2001). Available from the World Wide Web: (http://usembassy.state.gov/posts/rp1/wwwf5083.pdf)
Vanzi, S. J. [online] Philippine Headline News Online. Available from the World Wide
Web: (http://www.newsflash.org/2002/03/pe/pe002221.htm). Warr, P.G. nd. Poverty Reduction and Sectoral Growth: Evidence from Southeast Asia.
Australian National University. Canberra. Australia. World Bank. Social Assessment of Conflict-Affected Areas in Mindanao. Manila,
Philippines. The World Bank [online] Understanding Poverty. World Bank Poverty Net. Available
from the World Wide Web: (http://www.worldbank.org/poverty/mission/up1.htm)
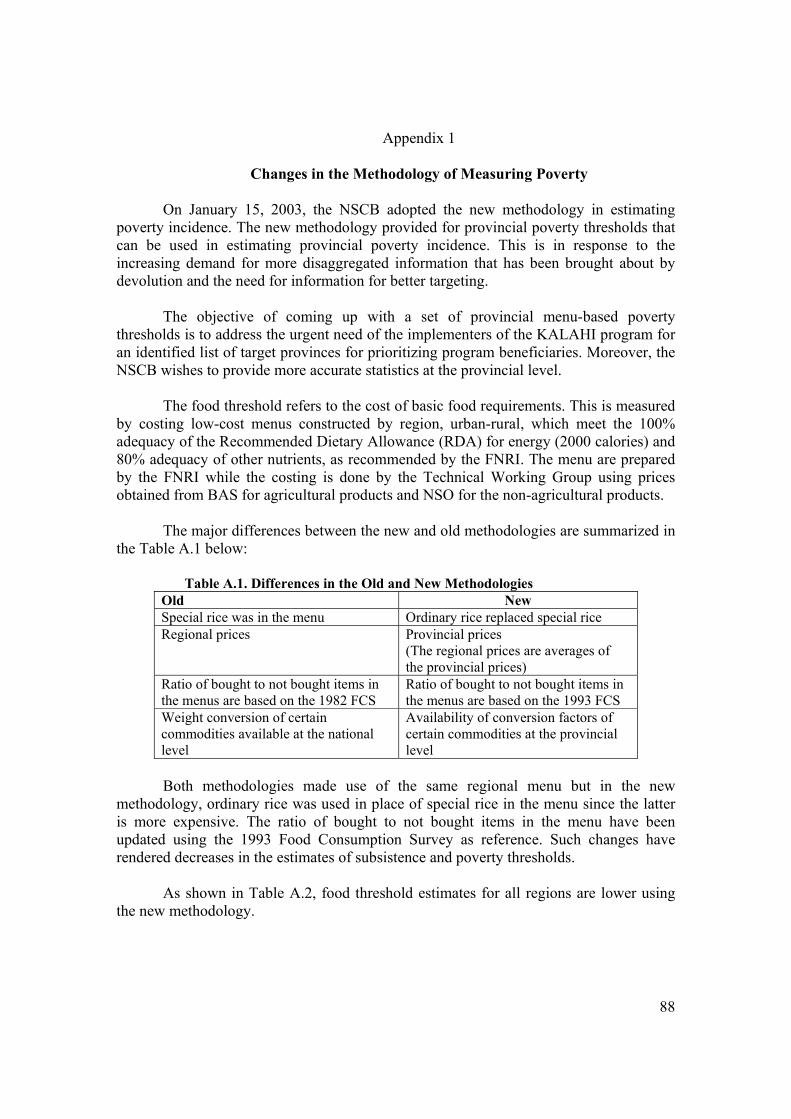
88
Appendix 1
Changes in the Methodology of Measuring Poverty On January 15, 2003, the NSCB adopted the new methodology in estimating poverty incidence. The new methodology provided for provincial poverty thresholds that can be used in estimating provincial poverty incidence. This is in response to the increasing demand for more disaggregated information that has been brought about by devolution and the need for information for better targeting.
The objective of coming up with a set of provincial menu-based poverty thresholds is to address the urgent need of the implementers of the KALAHI program for an identified list of target provinces for prioritizing program beneficiaries. Moreover, the NSCB wishes to provide more accurate statistics at the provincial level.
The food threshold refers to the cost of basic food requirements. This is measured by costing low-cost menus constructed by region, urban-rural, which meet the 100% adequacy of the Recommended Dietary Allowance (RDA) for energy (2000 calories) and 80% adequacy of other nutrients, as recommended by the FNRI. The menu are prepared by the FNRI while the costing is done by the Technical Working Group using prices obtained from BAS for agricultural products and NSO for the non-agricultural products.
The major differences between the new and old methodologies are summarized in the Table A.1 below:
Table A.1. Differences in the Old and New Methodologies Old New Special rice was in the menu Ordinary rice replaced special rice Regional prices Provincial prices
(The regional prices are averages of the provincial prices)
Ratio of bought to not bought items in the menus are based on the 1982 FCS
Ratio of bought to not bought items in the menus are based on the 1993 FCS
Weight conversion of certain commodities available at the national level
Availability of conversion factors of certain commodities at the provincial level
Both methodologies made use of the same regional menu but in the new methodology, ordinary rice was used in place of special rice in the menu since the latter is more expensive. The ratio of bought to not bought items in the menu have been updated using the 1993 Food Consumption Survey as reference. Such changes have rendered decreases in the estimates of subsistence and poverty thresholds.
As shown in Table A.2, food threshold estimates for all regions are lower using
the new methodology.
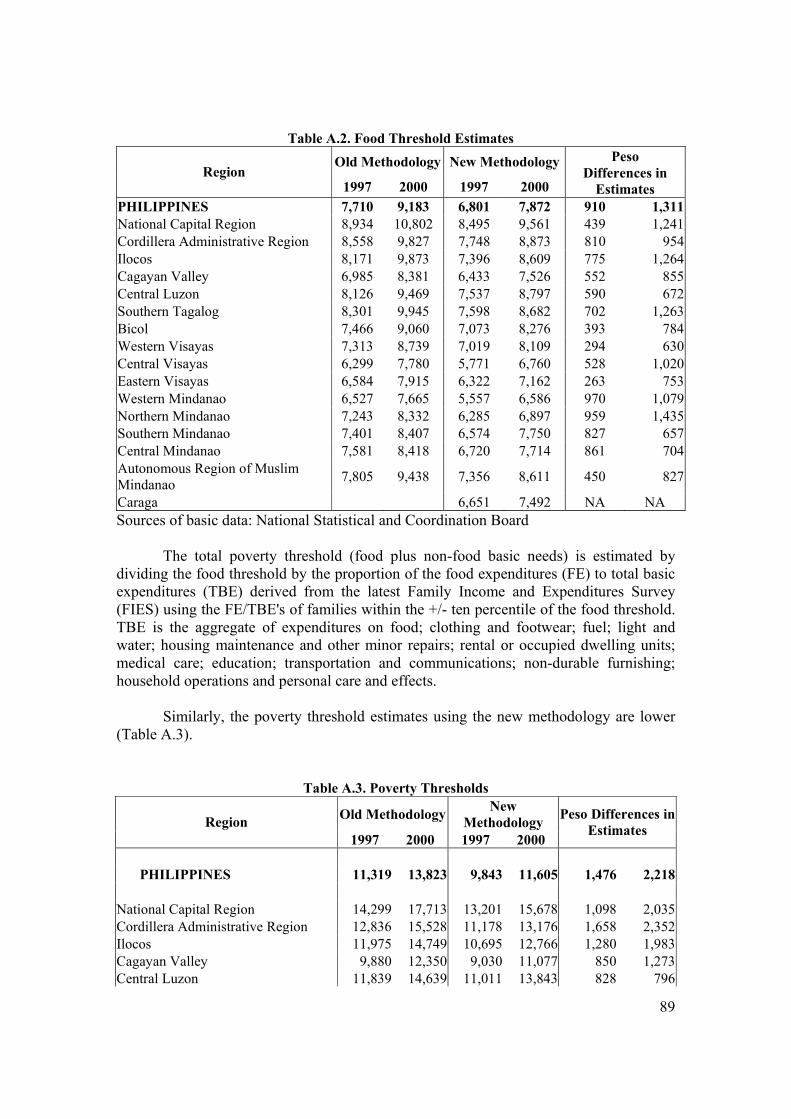
89
Table A.2. Food Threshold Estimates
Old Methodology New Methodology Region
1997 2000 1997 2000
Peso Differences in
Estimates PHILIPPINES 7,710 9,183 6,801 7,872 910 1,311National Capital Region 8,934 10,802 8,495 9,561 439 1,241Cordillera Administrative Region 8,558 9,827 7,748 8,873 810 954Ilocos 8,171 9,873 7,396 8,609 775 1,264Cagayan Valley 6,985 8,381 6,433 7,526 552 855Central Luzon 8,126 9,469 7,537 8,797 590 672Southern Tagalog 8,301 9,945 7,598 8,682 702 1,263Bicol 7,466 9,060 7,073 8,276 393 784Western Visayas 7,313 8,739 7,019 8,109 294 630Central Visayas 6,299 7,780 5,771 6,760 528 1,020Eastern Visayas 6,584 7,915 6,322 7,162 263 753Western Mindanao 6,527 7,665 5,557 6,586 970 1,079Northern Mindanao 7,243 8,332 6,285 6,897 959 1,435Southern Mindanao 7,401 8,407 6,574 7,750 827 657Central Mindanao 7,581 8,418 6,720 7,714 861 704Autonomous Region of Muslim Mindanao 7,805 9,438 7,356 8,611 450 827
Caraga 6,651 7,492 NA NA Sources of basic data: National Statistical and Coordination Board
The total poverty threshold (food plus non-food basic needs) is estimated by
dividing the food threshold by the proportion of the food expenditures (FE) to total basic expenditures (TBE) derived from the latest Family Income and Expenditures Survey (FIES) using the FE/TBE's of families within the +/- ten percentile of the food threshold. TBE is the aggregate of expenditures on food; clothing and footwear; fuel; light and water; housing maintenance and other minor repairs; rental or occupied dwelling units; medical care; education; transportation and communications; non-durable furnishing; household operations and personal care and effects.
Similarly, the poverty threshold estimates using the new methodology are lower (Table A.3).
Table A.3. Poverty Thresholds
Old Methodology New Methodology Region
1997 2000 1997 2000
Peso Differences in Estimates
PHILIPPINES 11,319 13,823 9,843 11,605 1,476 2,218
National Capital Region 14,299 17,713 13,201 15,678 1,098 2,035Cordillera Administrative Region 12,836 15,528 11,178 13,176 1,658 2,352Ilocos 11,975 14,749 10,695 12,766 1,280 1,983Cagayan Valley 9,880 12,350 9,030 11,077 850 1,273Central Luzon 11,839 14,639 11,011 13,843 828 796
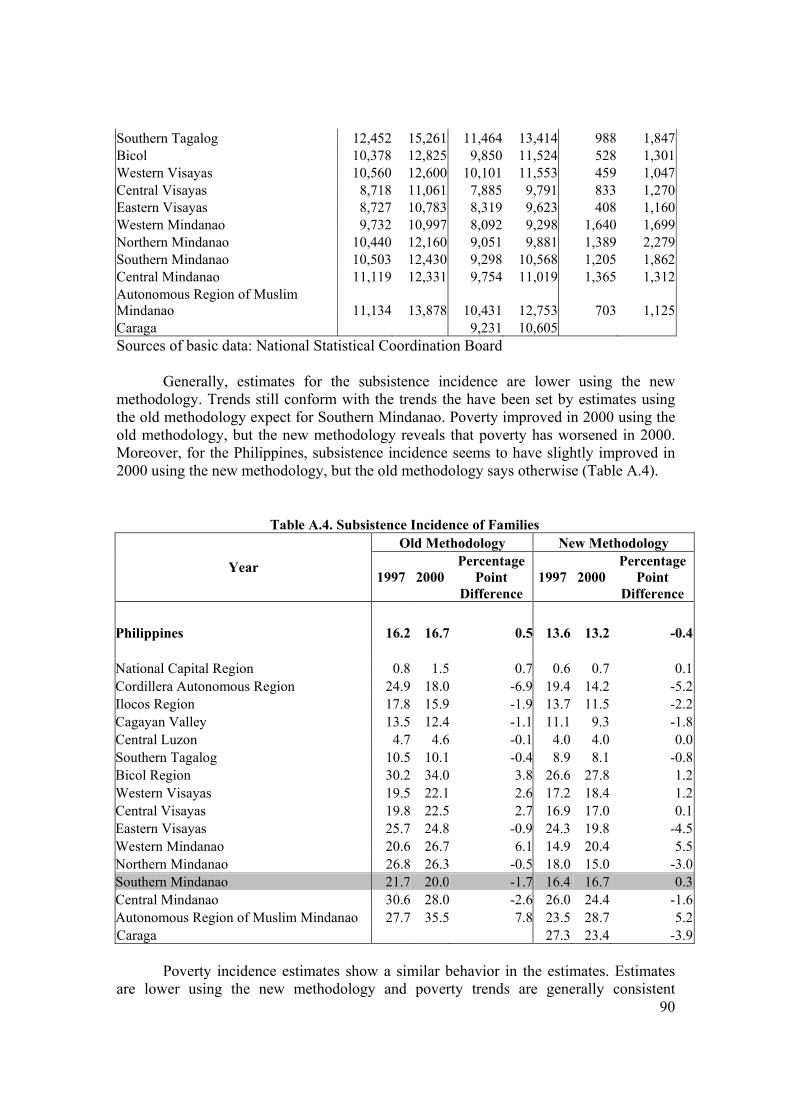
90
Southern Tagalog 12,452 15,261 11,464 13,414 988 1,847Bicol 10,378 12,825 9,850 11,524 528 1,301Western Visayas 10,560 12,600 10,101 11,553 459 1,047Central Visayas 8,718 11,061 7,885 9,791 833 1,270Eastern Visayas 8,727 10,783 8,319 9,623 408 1,160Western Mindanao 9,732 10,997 8,092 9,298 1,640 1,699Northern Mindanao 10,440 12,160 9,051 9,881 1,389 2,279Southern Mindanao 10,503 12,430 9,298 10,568 1,205 1,862Central Mindanao 11,119 12,331 9,754 11,019 1,365 1,312Autonomous Region of Muslim Mindanao 11,134 13,878 10,431 12,753 703 1,125Caraga 9,231 10,605 Sources of basic data: National Statistical Coordination Board
Generally, estimates for the subsistence incidence are lower using the new methodology. Trends still conform with the trends the have been set by estimates using the old methodology expect for Southern Mindanao. Poverty improved in 2000 using the old methodology, but the new methodology reveals that poverty has worsened in 2000. Moreover, for the Philippines, subsistence incidence seems to have slightly improved in 2000 using the new methodology, but the old methodology says otherwise (Table A.4).
Table A.4. Subsistence Incidence of Families Old Methodology New Methodology
Year 1997 2000
Percentage Point
Difference 1997 2000
Percentage Point
Difference Philippines 16.2 16.7 0.5 13.6 13.2 -0.4 National Capital Region 0.8 1.5 0.7 0.6 0.7 0.1Cordillera Autonomous Region 24.9 18.0 -6.9 19.4 14.2 -5.2Ilocos Region 17.8 15.9 -1.9 13.7 11.5 -2.2Cagayan Valley 13.5 12.4 -1.1 11.1 9.3 -1.8Central Luzon 4.7 4.6 -0.1 4.0 4.0 0.0Southern Tagalog 10.5 10.1 -0.4 8.9 8.1 -0.8Bicol Region 30.2 34.0 3.8 26.6 27.8 1.2Western Visayas 19.5 22.1 2.6 17.2 18.4 1.2Central Visayas 19.8 22.5 2.7 16.9 17.0 0.1Eastern Visayas 25.7 24.8 -0.9 24.3 19.8 -4.5Western Mindanao 20.6 26.7 6.1 14.9 20.4 5.5Northern Mindanao 26.8 26.3 -0.5 18.0 15.0 -3.0Southern Mindanao 21.7 20.0 -1.7 16.4 16.7 0.3Central Mindanao 30.6 28.0 -2.6 26.0 24.4 -1.6Autonomous Region of Muslim Mindanao 27.7 35.5 7.8 23.5 28.7 5.2Caraga 27.3 23.4 -3.9
Poverty incidence estimates show a similar behavior in the estimates. Estimates are lower using the new methodology and poverty trends are generally consistent
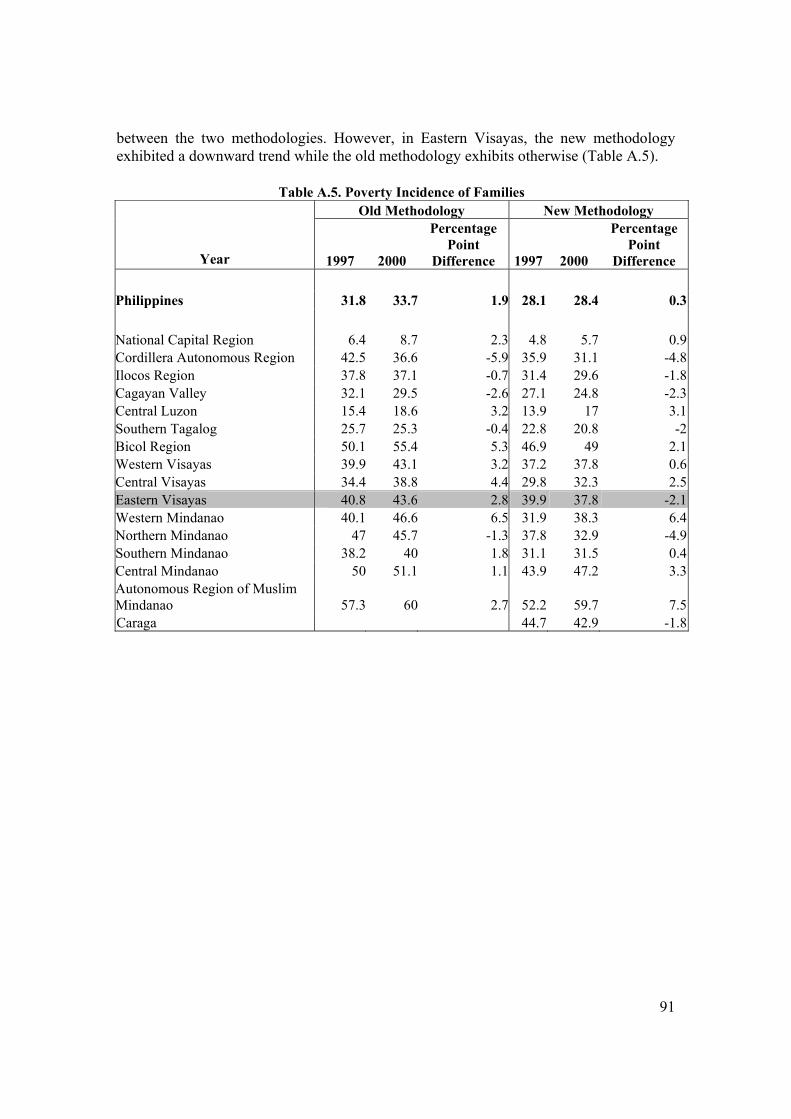
91
between the two methodologies. However, in Eastern Visayas, the new methodology exhibited a downward trend while the old methodology exhibits otherwise (Table A.5).
Table A.5. Poverty Incidence of Families Old Methodology New Methodology
Year 1997 2000
Percentage Point
Difference 1997 2000
Percentage Point
Difference Philippines 31.8 33.7 1.9 28.1 28.4 0.3 National Capital Region 6.4 8.7 2.3 4.8 5.7 0.9Cordillera Autonomous Region 42.5 36.6 -5.9 35.9 31.1 -4.8Ilocos Region 37.8 37.1 -0.7 31.4 29.6 -1.8Cagayan Valley 32.1 29.5 -2.6 27.1 24.8 -2.3Central Luzon 15.4 18.6 3.2 13.9 17 3.1Southern Tagalog 25.7 25.3 -0.4 22.8 20.8 -2Bicol Region 50.1 55.4 5.3 46.9 49 2.1Western Visayas 39.9 43.1 3.2 37.2 37.8 0.6Central Visayas 34.4 38.8 4.4 29.8 32.3 2.5Eastern Visayas 40.8 43.6 2.8 39.9 37.8 -2.1Western Mindanao 40.1 46.6 6.5 31.9 38.3 6.4Northern Mindanao 47 45.7 -1.3 37.8 32.9 -4.9Southern Mindanao 38.2 40 1.8 31.1 31.5 0.4Central Mindanao 50 51.1 1.1 43.9 47.2 3.3Autonomous Region of Muslim Mindanao 57.3 60 2.7 52.2 59.7 7.5Caraga 44.7 42.9 -1.8
Copyright © 2022 FDOKUMEN


![BiH - Zijad Kurtovic, first instance verdict, 2008 [ENG].pdf](https://static.fdokumen.com/doc/165x107/63208861eb38487f6b0faa00/bih-zijad-kurtovic-first-instance-verdict-2008-engpdf.jpg)