An In-Depth Study of Correlated Failures in Production SSD ...
13
An In-Depth Study of Correlated Failures in Production SSD-Based Data Centers Shujie Han 1 , Patrick P. C. Lee 1 , Fan Xu 2 , Yi Liu 2 , Cheng He 2 , and Jiongzhou Liu 2 1 The Chinese University of Hong Kong 2 Alibaba Group Abstract Flash-based solid-state drives (SSDs) are increasingly adopted as the mainstream storage media in modern data centers. However, little is known about how SSD failures in the field are correlated, both spatially and temporally. We ar- gue that characterizing correlated failures of SSDs is critical, especially for guiding the design of redundancy protection for high storage reliability. We present an in-depth data-driven analysis on the correlated failures in the SSD-based data cen- ters at Alibaba. We study nearly one million SSDs of 11 drive models based on a dataset of SMART logs, trouble tickets, physical locations, and applications. We show that correlated failures in the same node or rack are common, and study the possible impacting factors on those correlated failures. We also evaluate via trace-driven simulation how various redun- dancy schemes affect the storage reliability under correlated failures. To this end, we report 15 findings. Our dataset and source code are now released for public use. 1 Introduction Maintaining high storage reliability is undoubtedly impor- tant for modern data centers, yet it is often challenged by correlated failures, such as bursts of latent sector errors [25], correlated disk failures [5, 26], co-occurring node failures [5, 8, 11, 19], or correlated crashes of data and protocols [1]. Correlated failures complicate the design of redundancy pro- tection schemes, which may be sufficient for tolerating inde- pendent failures but not correlated failures [19]. Modern data centers now increasingly build on flash-based solid-state drives (SSDs), and their storage reliability guar- antees critically depend on the reliability of SSDs. Several field studies have characterized SSD failures in production environments, including Facebook [16], Google [2, 27], Mi- crosoft [18], Alibaba [30], and NetApp [15] (see §6 for de- tails). However, some of the studies [2, 15, 16, 27] analyze the proprietary customized attributes that are inapplicable for general production environments; others [18,30] leverage the SMART (Self-Monitoring, Analysis and Reporting Technol- ogy) attributes that are known to provide statistical details for disk drive failure symptoms, yet SMART attributes do not provide the location details of how multiple failures mani- fest across storage scopes (e.g., nodes and racks). Although correlated failures are reportedly found in SSD-based data centers [15, 16], little is known about the characteristics of correlated failures and their implications on storage reliability in production environments. To elaborate, the following questions on correlated failures remain unexplored: (i) How far are SSD failures spaced apart across different scopes in large-scale data centers? (ii) How likely does an SSD fail after another failure occurs in the same scope? (iii) How long is the time interval between two consecutive SSD failures in the same scope? (iv) Do SSD failures that are close in space imply that they are also close in time? (v) What are the factors that affect the correlated fail- ures? (vi) What should be the proper redundancy protection schemes in the presence of correlated failures? The answers to these questions can provide insights into achieving high storage reliability in production environments. In this paper, we present an in-depth data-driven analysis on the correlated failures, from both spatial and temporal perspectives, of SSD-based data centers at Alibaba, one of the largest Internet companies in the world. We present an extensive study on the correlated failures of nearly one million SSDs, belonging to 11 drive models from three vendors, over a span of two years. Our dataset covers the SMART logs, trouble tickets, physical locations of SSDs (e.g., nodes and racks), and the applications hosted by the underlying SSDs. Our analysis makes the following findings: • We characterize two main types of correlated failures in the same node and rack that occur within a short time (e.g., 30 minutes), referred to as intra-node failures and intra-rack failures, respectively. We observe a non-negligible fraction of intra-node and intra-rack failures, implying the existence of strong spatial and temporal correlations of SSD failures. • We analyze four impacting factors of drive characteristics on the correlated failures: drive models, lithography, age, and capacity. We show that such factors pose different effects on the spatial and temporal correlations of SSD failures. In particular, intra-node (intra-rack) failures likely occur in the nodes (racks) that are attached by many SSDs of the same drive model. Both intra-node and intra-rack failures of aged SSDs tend to occur within a short time. • We analyze the impact of SMART attributes and applica- tions on both intra-node and intra-rack failures. We find that SMART attributes have limited correlations with both intra-node and intra-rack failures and are not good indica- tors for detecting the existence of intra-node and intra-rack failures. Also, write-dominant applications lead to more intra-node and intra-rack failures than read-dominant ones. • We conduct trace-driven simulation using our dataset on the impact of different redundancy protection schemes on
-
Upload
khangminh22 -
Category
Documents
-
view
0 -
download
0
Transcript of An In-Depth Study of Correlated Failures in Production SSD ...

An In-Depth Study of Correlated Failures in Production SSD-Based Data CentersShujie Han1, Patrick P. C. Lee1, Fan Xu2, Yi Liu2, Cheng He2, and Jiongzhou Liu2
1The Chinese University of Hong Kong 2Alibaba Group
AbstractFlash-based solid-state drives (SSDs) are increasinglyadopted as the mainstream storage media in modern datacenters. However, little is known about how SSD failures inthe field are correlated, both spatially and temporally. We ar-gue that characterizing correlated failures of SSDs is critical,especially for guiding the design of redundancy protection forhigh storage reliability. We present an in-depth data-drivenanalysis on the correlated failures in the SSD-based data cen-ters at Alibaba. We study nearly one million SSDs of 11 drivemodels based on a dataset of SMART logs, trouble tickets,physical locations, and applications. We show that correlatedfailures in the same node or rack are common, and study thepossible impacting factors on those correlated failures. Wealso evaluate via trace-driven simulation how various redun-dancy schemes affect the storage reliability under correlatedfailures. To this end, we report 15 findings. Our dataset andsource code are now released for public use.
1 IntroductionMaintaining high storage reliability is undoubtedly impor-tant for modern data centers, yet it is often challenged bycorrelated failures, such as bursts of latent sector errors [25],correlated disk failures [5, 26], co-occurring node failures[5, 8, 11, 19], or correlated crashes of data and protocols [1].Correlated failures complicate the design of redundancy pro-tection schemes, which may be sufficient for tolerating inde-pendent failures but not correlated failures [19].
Modern data centers now increasingly build on flash-basedsolid-state drives (SSDs), and their storage reliability guar-antees critically depend on the reliability of SSDs. Severalfield studies have characterized SSD failures in productionenvironments, including Facebook [16], Google [2, 27], Mi-crosoft [18], Alibaba [30], and NetApp [15] (see §6 for de-tails). However, some of the studies [2, 15, 16, 27] analyzethe proprietary customized attributes that are inapplicable forgeneral production environments; others [18, 30] leverage theSMART (Self-Monitoring, Analysis and Reporting Technol-ogy) attributes that are known to provide statistical details fordisk drive failure symptoms, yet SMART attributes do notprovide the location details of how multiple failures mani-fest across storage scopes (e.g., nodes and racks). Althoughcorrelated failures are reportedly found in SSD-based datacenters [15, 16], little is known about the characteristics ofcorrelated failures and their implications on storage reliabilityin production environments.
To elaborate, the following questions on correlated failuresremain unexplored: (i) How far are SSD failures spaced apartacross different scopes in large-scale data centers? (ii) Howlikely does an SSD fail after another failure occurs in thesame scope? (iii) How long is the time interval between twoconsecutive SSD failures in the same scope? (iv) Do SSDfailures that are close in space imply that they are also closein time? (v) What are the factors that affect the correlated fail-ures? (vi) What should be the proper redundancy protectionschemes in the presence of correlated failures? The answersto these questions can provide insights into achieving highstorage reliability in production environments.
In this paper, we present an in-depth data-driven analysison the correlated failures, from both spatial and temporalperspectives, of SSD-based data centers at Alibaba, one ofthe largest Internet companies in the world. We present anextensive study on the correlated failures of nearly one millionSSDs, belonging to 11 drive models from three vendors, overa span of two years. Our dataset covers the SMART logs,trouble tickets, physical locations of SSDs (e.g., nodes andracks), and the applications hosted by the underlying SSDs.Our analysis makes the following findings:
• We characterize two main types of correlated failures in thesame node and rack that occur within a short time (e.g., 30minutes), referred to as intra-node failures and intra-rackfailures, respectively. We observe a non-negligible fractionof intra-node and intra-rack failures, implying the existenceof strong spatial and temporal correlations of SSD failures.
• We analyze four impacting factors of drive characteristicson the correlated failures: drive models, lithography, age,and capacity. We show that such factors pose differenteffects on the spatial and temporal correlations of SSDfailures. In particular, intra-node (intra-rack) failures likelyoccur in the nodes (racks) that are attached by many SSDsof the same drive model. Both intra-node and intra-rackfailures of aged SSDs tend to occur within a short time.
• We analyze the impact of SMART attributes and applica-tions on both intra-node and intra-rack failures. We findthat SMART attributes have limited correlations with bothintra-node and intra-rack failures and are not good indica-tors for detecting the existence of intra-node and intra-rackfailures. Also, write-dominant applications lead to moreintra-node and intra-rack failures than read-dominant ones.
• We conduct trace-driven simulation using our dataset onthe impact of different redundancy protection schemes on

storage reliability. We show that redundancy schemes withhigh fault tolerance are critical to storage reliability undercorrelated failures.
We release our dataset, including the SMART logs ofall failed SSDs, trouble tickets, locations, and applications,for the 11 drive models at https://github.com/alibaba-edu/dcbrain/tree/master/ssd open data. The communitycan leverage our dataset and findings to design effectivereliability solutions in production environments. We alsoopen-source our analysis scripts and simulator prototype athttp://adslab.cse.cuhk.edu.hk/software/ssdanalysis.
2 DatasetIn this section, we introduce the dataset for our analysis. Wedescribe our data collection methodology (§2.1) and study thedrive population and characteristics of our dataset (§2.2). Wealso discuss the limitations of our dataset (§2.3).
2.1 Data CollectionWe collected data from multiple SSD-based data centers atAlibaba. Each data center comprises multiple racks, each ofwhich holds multiple machines called nodes. Each node isfurther attached with one or multiple SSDs.
Our dataset spans two years from January 2018 to Decem-ber 2019. It covers a population of nearly one million SSDs of11 drive models from three vendors. The SSDs are deployedin 200 K nodes of 30 K racks. Note that the SSDs of the samedrive model were typically purchased from multiple batchesat different times, and the SSDs attached to each node may beheterogeneous in terms of vendors, models, capacities, anddeployment times. However, among the nodes with at leasttwo SSDs, 88.6% of them are attached to the SSDs of thesame drive model.
Our dataset includes multiple data types: SMART logs,trouble tickets, locations, and applications.
SMART logs. SMART is a widely adopted tool for moni-toring disk drive status. It periodically reports the numericalvalues of the performance and reliability statistics on dif-ferent dimensions, called attributes. Each SMART attributeincludes both the raw and normalized values. Our dataset con-tains daily collected SMART logs over the two-year span, andits collected SMART attributes are summarized in Table 1.Since the definitions of SMART attributes vary across ven-dors, for easy comparison, we focus on the SMART attributesthat are reported by more than half of SSDs (shown in the“Reported%” column). We categorize the SMART attributesby their monitoring types into five groups, namely internalerrors, spare blocks, wearout degree, workload, and power.Some SMART attributes have identical meanings but are as-signed different SMART IDs by vendors (e.g., S170/S180,S171/S181, and S172/S182). Also, some SMART attributeshave vendor-specific raw values (marked with an asterisk ‘*’in Table 1), so we only consider their normalized values.
Category ID Attribute name Reported%
Internalerrors
S5 Reallocated sector count 100.0%S183 SATA downshift error count 96.5%S184 End-to-end errors 100.0%S187 Reported uncorrectable errors 100.0%S195 Hardware ECC recovered 55.4%S197 Current pending sector count 87.5%S199 UltraDMA CRC error count 100.0%
S171/S181 Program failed count 100.0%S172/S182 Erase failed count 100.0%
Spareblocks*
S170/S180 Available reserved blocks 100.0%
Wearoutdegree*
S173 Wear leveling count100.0%S177 Wear range delta
S233 Media wearout indicator
WorkloadS241 Number of blocks written 68.8%S242 Number of blocks read 56.3%
Power
S9 Power on hours 100.0%S12 Power cycle count 99.1%
S174 Unexpected power loss count 78.5%S175* Power loss protection failure 57.0%
Table 1: Overview of SMART attributes in our dataset. “Reported%”is the percentage of SSDs with the corresponding SMART attribute.Only the normalized values are considered for the vendor-specificSMART attributes marked by an asterisk ‘*’.
Trouble tickets. Each node runs a background monitor-ing daemon that periodically collects SMART statistics andsystem-level logs/alerts from its attached SSDs and sendsthe collected data to a centralized maintenance system thatmonitors failures. The maintenance system applies rule-baseddetection, defined by administrators, to detect and report anyfailure behavior in the form of trouble tickets. Each troubleticket records the node ID, drive ID, timestamp, and failuredescription. Administrators further manually validate eachtrouble ticket to confirm the failure status. We use the troubletickets as the ground-truths for our failure analysis. Through-out the two-year span, we collected about 19 K trouble tickets(i.e., 19 K failed SSDs in total).
Our trouble tickets cover two main types of SSD failures:(i) whole drive failures, in which an SSD either cannot beaccessed or loses all data that is unrecoverable; and (ii) partialdrive failure, in which part of the data in an SSD either cannotbe accessed and is unrecoverable.Locations. Our dataset records the physical location of eachSSD, including the machine room ID, rack ID, node ID, driveID, and slot number. In particular, we can correlate an SSDto the SMART logs and trouble tickets by its drive ID.Applications. Our dataset covers hundreds of applications,including both internal (e.g., resource management, develop-ment, testing, etc.) and external services (e.g., web services,data analytics, etc.). Each node is configured to serve a singleapplication (note that the applications within a rack may bedifferent) and distributes a set of tasks to the attached SSDsas evenly as possible. We can correlate an SSD to its hosted

Applications Total% Failures%Web service management (WSM) 39.4% 48.5%Resource management (RM) 19.1% 16.4%Web proxy services (WPS) 4.6% 2.9%SQL services (SS) 3.4% 1.0%Database (DB) 2.8% 1.1%Web services (WS) 1.8% 1.3%Data analytics engine (DAE) 1.7% 6.6%Network attached storage (NAS) 1.5% 2.9%
Table 2: Overview of the top eight most widely used applicationswith more than hundreds of failed SSDs, including the percentageof deployed SSDs in the whole population (“Total%”) and the per-centage of SSD failures in the failed SSD population (“Failures%”).Note that SS and DB are two similar applications, but belong todifferent business units.
application via its node ID. Table 2 shows the top eight mostwidely used applications, each of which contains hundreds offailed SSDs in our dataset. Specifically, WSM covers 39.4%of all SSDs and 48.5% of all failed SSDs. WPS, SS, and DBcover 10.8% of all SSDs, while covering only 5.0% of allfailed SSDs. DAE and NAS have 3.2% of all SSDs, whilecovering 9.5% of all failed SSDs. We will give a detailedanalysis on the relationships between the failure patterns andworkload distributions of the eight applications (§4.4).
2.2 Summary of StatisticsWe first analyze the basic statistics and SSD characteristics inour dataset, as shown in Table 3.
Population statistics. We consider 11 drive models fromthree vendors. Each drive model is denoted by “Vendor”“k”,where “Vendor” is represented by a letter (‘A’, ‘B’, and ‘C’)for each of the three vendors, and “k” (1 to 6) refers to thek-th most numerous model in the same vendor. The first threecolumns in Table 3 show the percentages of each drive modelin the same vendor and the whole population. The 11 drivemodels together cover nearly one million SSDs.
Drive characteristics. The fourth to sixth columns in Table 3describe the key drive characteristics, including the flash tech-nology, lithography, and capacity. All 11 drive models use theSATA interface. The drive models in vendors A and B buildon enterprise-class MLC NAND cells, while those in vendorC build on 3D-TLC flash. These drive models have differentlithography parameters (bill-of-material (BOM) revision for3D-TLC) and capacities (ranging from 240 to 1920 GB).
Usage. The seventh to ninth columns in Table 3 showthe statistical summaries of SSD usage, including the over-provisioning (OP) factor (i.e., the fraction of dedicatedly re-served space in SSDs for internal garbage collection), theaverage power-on years computed from S9 (Table 1), andthe mean of rated life used (i.e., the percentage of erase cy-cles over the erase cycle limit) computed from the SMARTattributes related to the wearout degree (Table 1).
Reliability. The last three columns in Table 3 show threereliability metrics, including the mean percentage of spareblocks used, the mean number of bad sectors, and the annual-ized failure rate (AFR). We compute the percentage of spareblocks using the SMART attributes related to spare blocks(S170/S180), and the number of bad sectors using S5 in Ta-ble 1. We define the AFR by the following formula [13, 18]:
AFR(%) =f
n1 +n2 + . . .+ntwo−year×365×100,
where f is the total number of failed SSDs reported in ourtrouble tickets and ni is the number of operational SSDs onday i over the two-year span. The overall AFR of all MLCSSDs (A1 to A6 and B1 to B3) is 0.55%, and their AFRs rangefrom 0.16% to 2.52%, slightly lower than those reported forSSDs in Google’s data centers (1-2.5%) [27]. In contrast, theAFRs of 3D-TLC SSDs (C1 and C2) are higher than 3%. Theoverall AFR of all SSDs in our dataset is 1.16%.
2.3 LimitationsOur analysis has the following limitations, mainly due to theunavailable information in our dataset.Data missing. We expect that the SMART logs contain dailystatistics without loss, yet our dataset indeed contains incom-plete SMART data over time in both failed and healthy SSDs.Reasons of such data missing include network failures, soft-ware maintenance or upgrades, system crashes, etc. In thiswork, we mainly focus on analyzing the correlations of SSDfailures via trouble tickets, rather than the correlations ofSMART attributes over time. Thus, the data missing in theSMART logs does not compromise our analysis.Failure symptoms. Our dataset reports SSD failures via trou-ble tickets, but does not cover the failure symptoms at theoperating system level. Such failure symptoms can be foundin kernel syslogs, which are not collected in our dataset.Drive repair. Our dataset does not include the repair detailsfor failed SSDs. In practice, how long the data in a failedSSD is recovered depends on the importance of its storeddata to the upper-level applications. Administrators may notimmediately repair the failed SSDs that store less critical datato save operational overhead [2, 30]. Due to limited details,we assume that all SSDs store data with the same importance,and the repair time depends on the amount of data to bereconstructed (§5).Redundancy protection. Production storage systems useerasure coding for redundancy protection against failures[8, 12, 17]. In Alibaba production, 3-way replication is thecommonly used redundancy mechanism [30]. However, theredundancy parameters may also vary across applicationsand we do not have access to the redundancy parameters foreach application. In this work, we assume that all applicationsadopt the same redundancy parameters to drive our reliabilityanalysis (§5).

Population statistics Drive characteristics Usage Reliability
Model Ven- Total% Flash Litho- Capa- OP Power- Rated life Spare blocks # bad AFRdor% Tech. graphy city on years used (%) used (%) sectors (%)
A1 52.3% 29.8% MLC 20 nm 480 GB 7% 4.6 17.8 (±0.067) 0.18 (±0.0080) 9.3 (±0.60) 0.16%A2 21.8% 12.4% MLC 20 nm 800 GB 28% 4.5 17.2 (± 0.15) 0.19 (±0.013) 12.5 (±1.3) 0.46%A3 7.9% 4.5% MLC 20 nm 480 GB 7% 5.5 25.9 (±0.41) 0.022 (±0.012) 12.4 (±2.4) 2.36%A4 7.2% 4.1% MLC 16 nm 240 GB 7% 3.2 8.8 (±0.074) 0.064 (±0.013) 2.4 (±0.72) 0.64%A5 5.7% 3.3% MLC 16 nm 480 GB 7% 3.2 27.0 (±0.28) 0.087 (±0.015) 5.0 (±1.2) 0.45%A6 5.1% 2.9% MLC 20 nm 800 GB 28% 4.6 24.7 (±0.44) 0.018 (±0.013) 13.7 (±2.9) 0.49%B1 51.5% 10.3% MLC 21 nm 480 GB 7% 3.8 6.4 (±0.029) 0.0063 (±0.0010) 0.036 (±0.024) 0.21%B2 25.5% 5.1% MLC 19 nm 1920 GB 7% 3.3 2.0 (±0.014) 0.086 (±0.0092) 12.2 (±1.4) 0.71%B3 23.0% 4.6% MLC 24 nm 1920 GB 7% 2.1 3.6 (±0.028) 0.021 (±0.0041) 0.50 (±0.25) 2.52%C1 89.3% 20.6% 3D-TLC V1 1920 GB 7% 2.0 4.3 (±0.022) 0.064 (±0.0054) 10.1 (±0.74) 3.29%C2 10.7% 2.5% 3D-TLC V1 960 GB 7% 1.4 2.0 (±0.062) 0.0049 (±0.0047) 0.67 (±0.37) 3.92%
Table 3: Summary of statistics of collected dataset. The population statistics include the percentage of drives in the same vendor (“Vendor%”)and the percentage of drives in the whole drive population in the dataset (“Total%”). For the “Rated life used”, “Spare blocks used”, and “# badsectors” columns, each value in brackets denotes the 95% confidence interval.
3 Overview of Analysis MethodologyOur analysis studies the correlated failures of SSDs in ourdataset, and focuses on several dimensions.Spatial and temporal properties. We study how SSD fail-ures manifest within a scope, either a node or a rack, withina certain time period. We consider both intra-node failuresand intra-rack failures to refer to the failures co-occurringwithin a node and a rack, respectively. We also define theintra-node (intra-rack) failure time interval as the time in-terval between two consecutive failures that co-occur withinthe same node (rack). We refer to a failure as an intra-node(intra-rack) failure if its intra-node (intra-rack) failure timeinterval with its preceding or following failure in the samenode (rack) is smaller than a pre-specified threshold. Here,we set a default threshold as 30 minutes, assuming that thisis the minimum time for a failure to be detected before it isrepaired [12]. In other words, a node (rack) may contain morethan one active failure at a time under intra-node (intra-rack)failures. We define the intra-node (intra-rack) failure groupas a sequence of intra-node (intra-rack) failures starting froman intra-node (intra-rack) failure without a preceding one un-til an intra-node (intra-rack) failure without a following one.We also vary the thresholds of the intra-node and intra-rackfailure time interval in our analysis.Correlation properties. We use the Spearman’s Rank Cor-relation Coefficient (SRCC) [29] to measure the correlationof two variables. For example, to measure the correlationbetween an SSD failure and a SMART attribute using theSRCC, we use an indicator variable to represent if an SSD isfailed (i.e., 1 means failed; or 0 otherwise), and a numericalvariable to represent the value of a SMART attribute. TheSRCC calculates the Pearson Correlation Coefficient [21]between the rank values of two variables to measure theirmonotonic relationships. The SRCC ranges from -1 (i.e., highnegative correlation) to +1 (i.e., high positive correlation); azero SRCC means that the two variables are independent.
4 Correlation AnalysisWe analyze the correlated failures of SSDs in our dataset infour aspects: (i) spatial and temporal correlations among fail-ures (§4.1), (ii) the impacting factors on correlated failures,including the drive models, lithography, age, and capacity(§4.2), (iii) the impact of SMART attributes on correlated fail-ures (§4.3), and (iv) the impact of applications on correlatedfailures (§4.4). Finally, we discuss the implications of ourfindings (§4.5).
4.1 Correlations among FailuresWe first examine the severity of correlated failures by theintra-node and intra-rack failure group sizes (i.e., by count-ing the number of failures within a group). Figure 1 showsthe percentage of failures versus the intra-node or intra-rackfailure group sizes; note that for Figure 1(b), we omit theplots for the intra-rack failure group sizes that exceed 60 (themaximum is 89) due to the sparseness. We see that a non-negligible fraction of SSD failures belong to intra-node andintra-rack failures. In particular, 12.9% (18.3%) of failuresare intra-node (intra-rack) failures. Also, the intra-node andintra-rack failure group size can exceed the tolerable limitof some typical redundancy protection schemes (e.g., fourfailures) (see §5 for details).
Finding 1. A non-negligible fraction of SSD failures be-long to intra-node and intra-rack failures (12.9% and 18.3%in our dataset, respectively). Also, the intra-node and intra-rack failure group size can exceed the tolerable limit of sometypical redundancy protection schemes.
We further check whether the likelihood of an SSD failuredepends on the already existing SSD failures among the intra-node and intra-rack failures. Borrowing the idea by Mesa etal. [16], we compute the conditional probability of havingan additional SSD failure per intra-node (intra-rack) failuregroup given the existing intra-node (intra-rack) failures, bydividing the number of intra-node (intra-rack) failure groups

0
1
2
3
4
0 2 4 6 8 10 12
Failure group size
Fa
ilure
s (
%)
0
1
2
3
4
0 10 20 30 40 50 60
Failure group size
Fa
ilure
s (
%)
(a) Intra-node failures (b) Intra-rack failures
Figure 1: Finding 1. Percentages of failures for different intra-nodeand intra-rack failure group sizes.
0
20
40
60
80
100
0 2 4 6 8 10 12x
Pro
ba
bili
ty (
%)
0
20
40
60
80
100
0 2 4 6 8 10 12 14 16x
Pro
ba
bili
ty (
%)
(a) Intra-node failures (b) Intra-rack failures
Figure 2: Finding 2. Conditional probabilities of having an addi-tional SSD failure for different failure group sizes per intra-node orintra-rack failure group.
with a failure group size of x+1 by the number of intra-node(intra-rack) failure groups with a failure group size of x orx+1.
Figure 2 shows that the conditional probability of an ad-ditional SSD failure depends on the already existing SSDfailures among the intra-node and intra-rack failures. Theconditional probability of having an additional SSD failurein an intra-node (intra-rack) failure group ranges from 26.3%to 64.3% as x ranges from 2 to 11 (from 27.3% to 58.7% asx ranges from 2 to 88); note that we omit the plots for theintra-rack failure group size that exceeds 16 in Figure 2(b)due to the sparseness. If there is no correlation among intra-node (intra-rack) failures and the SSD failures are uniformlydistributed on nodes (racks), the conditional probability ofhaving an additional SSD failure given the existing intra-node(intra-rack) failures is similar to the AFR [16].
Finding 2. The likelihood of having an additional intra-node (intra-rack) failure in an intra-node (intra-rack) failuregroup depends on the already existing intra-node (intra-rack)failures.
We examine how the percentages of intra-node and intra-rack failures are affected by various thresholds of the intra-node and intra-rack failure time intervals, respectively. Fig-ure 3 shows that a non-negligible fraction of intra-node andintra-rack failures occur within a short period of time. Theintra-node (intra-rack) failures with one month as the thresh-old of the failure time interval account for 29.2% (63.0%).When the threshold of the failure time interval falls in oneminute, the intra-node (intra-rack) failures still account for10.0% (14.4%).
Finding 3. A non-negligible fraction of intra-node and
0
20
40
60
80
100
1 min
30 mins
1 hour1 day
1 week
1 month
1 year
Failure time interval
Fa
ilure
s (
%) Intra-node
Intra-rack
Figure 3: Finding 3. Percentages of intra-node (intra-rack) failuresbroken down by different thresholds of the intra-node (intra-rack)failure time intervals.
intra-rack failures occur within a short period of time, evenwithin one minute.
4.2 Impacting Factors on Correlated FailuresWe next study how various factors affect the spatial and tem-poral correlations of failures.
4.2.1 Drive Models
We analyze the impact of drive models on correlated fail-ures. Figure 4 shows that the relative percentages of failures(over all SSD failures of the same drive model) for differ-ent sets of intra-node and intra-rack failure group sizes varyhighly across the drive models. In particular, the relative per-centages of intra-node (intra-rack) failures range from 0% to33.4% (from 2.8% to 39.4%). Interestingly, A2 has only 3.7%of intra-node failures, but has 39.4% of intra-rack failures,among which 26.4% reside in the intra-rack failure groups ofsizes larger than 30.
We next examine the reason of high percentages of intra-node and intra-rack failures of some drive models, by ex-amining the average numbers of SSDs per node or rack fordifferent drive models. Figure 5 shows the distribution of theaverage number of SSDs per node and rack (each error barshows the 95% confidence interval). In general, putting moreSSDs from the same drive model in the same nodes (racks)leads to a higher percentage of intra-node (intra-rack) failures.
However, we observe some exceptions. A3 and A6 havethe same average number of SSDs per node (i.e., 12.0), but therelative percentage of intra-node failures for A3 is higher thanthat for A6 by 14.8%. One possible reason is that the AFR ofA3 (2.36%) is 5× that of A6 (0.49%). Note that the AFR is notalways the root cause of leading to high relative percentages ofintra-node and intra-rack failures. For example, one exceptionis that C1 has more average number of SSDs per node (rack)than B3 by 1.8 (20.7), but the relative percentage of intra-node(intra-rack) failures for C1 is lower than that for B3 by 13.7%(18.9%). Similar exceptions include the intra-rack failuresfor A2 and A3. However, the AFR of B3 (A2) is lower thanthat of C1 (A3) by 0.77% (1.9%). We further examine themachine rooms where intra-rack failures reside for A2 and B3.We observe that the relative percentages of intra-rack failures

Failure group size [2, 10] (10, 20] (20, 30] (30, 89]
0
10
20
30
40
50
A1A2A3A4A5A6B1B2B3C1C2
Drive models
Re
lativ
e p
erc
en
tag
eo
f fa
ilure
s (
%)
0
10
20
30
40
50
A1A2A3A4A5A6B1B2B3C1C2
Drive models
Re
lativ
e p
erc
en
tag
eo
f fa
ilure
s (
%)
(a) Intra-node failures (b) Intra-rack failures
Figure 4: Finding 4. Relative percentages of failures for differentsets of intra-node or intra-rack failure group sizes across the drivemodels.
02468
1012
A1A2A3A4A5A6B1B2B3C1C2
Drive models
Ave
rag
e n
um
be
ro
f S
SD
s
0
10
20
30
40
50
A1A2A3A4A5A6B1B2B3C1C2
Drive models
Ave
rag
e n
um
be
ro
f S
SD
s
(a) Per node (b) Per rack
Figure 5: Finding 4. Average numbers of SSDs per node or rack forthe drive models (with 95% confidence intervals as error bars).
from two machine rooms account for 29.6% and 15.3% forA2 and B3, respectively, and the intra-rack failure group sizesare larger than 20 and 30 for A2 and B3, respectively. Thus,the high relative percentages of intra-rack failures may alsobe attributed to the machine rooms (e.g., high temperature ina machine room can lead to more SSD failures [30]).
Finding 4. The relative percentages of intra-node and intra-rack failures vary across drive models. Putting too many SSDsfrom the same drive model in the same nodes (racks) leads toa high percentage of intra-node (intra-rack) failures. Also, theAFR and environmental factors (e.g., temperature) affect therelative percentages of intra-node and intra-rack failures.
We vary the thresholds of the intra-node and intra-rack fail-ure time intervals, broken down by the drive models. Figure 6shows that the intra-node and intra-rack failures with a shortfailure time interval account for non-negligible percentagesfor most drive models. In particular, the relative percentagesof intra-node (intra-rack) failures with a threshold of one dayrange from 4.4 to 34.3% (from 11.8 to 44.2%), except for A4and C2 due to their limited numbers of SSDs per node or rack.The relative percentages of intra-node (intra-rack) failureswith a threshold of one minute still account for 3.5-33.4%(7.8-37.1%) except for A4 and C2 (C2).
Finding 5. There exist non-negligible fractions of intra-node and intra-rack failures with a short failure time intervalfor most drive models (e.g., up to 33.4% and 37.1% witha failure time interval of within one minute in our dataset,respectively) .
Failure time interval[0, 1 minute] (1 minute, 30 minutes]
(30 minutes, 1 day] (1 day, 1 month]
0
10
20
30
40
50
A1A2A3A4A5A6B1B2B3C1C2
Drive models
Re
lativ
e p
erc
en
tag
eo
f fa
ilure
s (
%)
0
10
20
30
40
50
A1A2A3A4A5A6B1B2B3C1C2
Drive models
Re
lativ
e p
erc
en
tag
eo
f fa
ilure
s (
%)
(a) Intra-node failures (b) Intra-rack failures
Figure 6: Finding 5. Relative percentages of failures for differentthresholds of intra-node or intra-rack failure time intervals acrossthe drive models.
4.2.2 Lithography
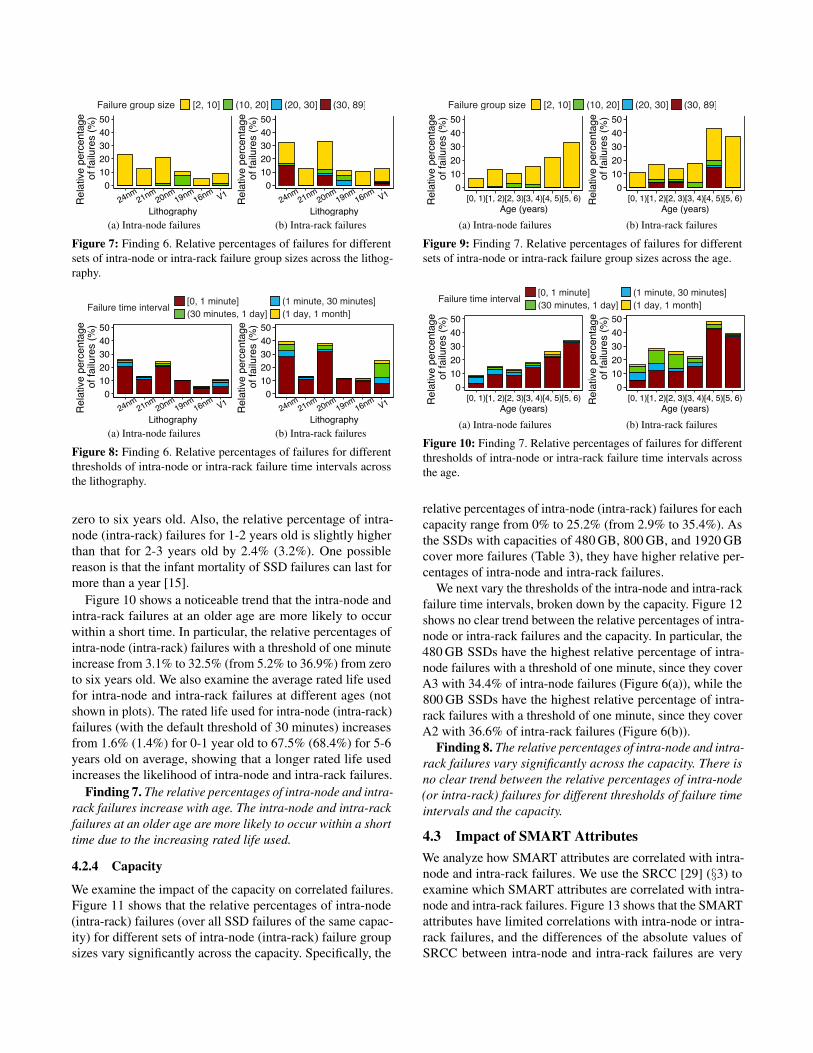
We analyze the impact of lithography on correlated failures.For MLC SSDs, a smaller lithography implies that the SSDshave a higher density. Also, 3D-TLC SSDs (C1 and C2) havehigher densities than those of the MLC SSDs. Figure 7 showsthat the SSDs of a smaller lithography (i.e., a higher density)generally have lower relative percentages of intra-node andintra-rack failures (over all SSD failures of the same lithogra-phy). In particular, for MLC SSDs, the relative percentages ofintra-node (intra-rack) failures decrease from 23.5% to 5.0%(from 32.3% to 10.1%) from 24 nm to 16 nm. An exceptionis 21 nm SSDs, due to its limited number of failures. For 3D-TLC SSDs, the relative percentages of both intra-node andintra-rack failures are close to 19 nm MLC SSDs.
We also vary the thresholds of the intra-node and intra-rack failure time intervals, broken down by the lithography.Figure 8 shows that the relative percentages of intra-node andintra-rack failures for different thresholds decrease generallywith a smaller lithography for MLC SSDs. In particular, therelative percentages of intra-node (intra-rack) failures with athreshold of one minute increase from 20.6% to 4.3% (28.0%to 9.3%) from 24 nm to 16 nm except for 21 nm SSDs dueto few failures. The intra-rack failures with a threshold ofone minute for 20 nm and 24 nm SSDs account for higherpercentages than other MLC SSDs by 18.7-22.4%, since theyinclude the intra-rack failures from A2 and B3, respectively(Figure 4(b)).
Finding 6. MLC SSDs with higher densities generally havelower relative percentages of intra-node and intra-rack fail-ures.
4.2.3 Age
We analyze the impact of the age of a failed SSD (e.g., thepower-on years until the failure occurs) on correlated failures.Figure 9 shows that the relative percentages of intra-node(intra-rack) failures (over all SSD failures of the same agegroup) for different sets of intra-node (intra-rack) group sizesincrease with age in general. In particular, the relative per-centages of intra-node (intra-rack) failures of each age groupincrease from 6.8% to 33.2% (from 11.0% to 37.6%) from
Failure group size [2, 10] (10, 20] (20, 30] (30, 89]
0
10
20
30
40
50
24nm21nm
20nm19nm
16nmV1
Lithography
Re
lativ
e p
erc
en
tag
eo
f fa
ilure
s (
%)
0
10
20
30
40
50
24nm21nm
20nm19nm
16nmV1
Lithography
Re
lativ
e p
erc
en
tag
eo
f fa
ilure
s (
%)
(a) Intra-node failures (b) Intra-rack failures
Figure 7: Finding 6. Relative percentages of failures for differentsets of intra-node or intra-rack failure group sizes across the lithog-raphy.
Failure time interval[0, 1 minute] (1 minute, 30 minutes]
(30 minutes, 1 day] (1 day, 1 month]
0
10
20
30
40
50
24nm21nm
20nm19nm
16nmV1
Lithography
Re
lativ
e p
erc
en
tag
eo
f fa
ilure
s (
%)
0
10
20
30
40
50
24nm21nm
20nm19nm
16nmV1
Lithography
Re
lativ
e p
erc
en
tag
eo
f fa
ilure
s (
%)
(a) Intra-node failures (b) Intra-rack failures
Figure 8: Finding 6. Relative percentages of failures for differentthresholds of intra-node or intra-rack failure time intervals acrossthe lithography.
zero to six years old. Also, the relative percentage of intra-node (intra-rack) failures for 1-2 years old is slightly higherthan that for 2-3 years old by 2.4% (3.2%). One possiblereason is that the infant mortality of SSD failures can last formore than a year [15].
Figure 10 shows a noticeable trend that the intra-node andintra-rack failures at an older age are more likely to occurwithin a short time. In particular, the relative percentages ofintra-node (intra-rack) failures with a threshold of one minuteincrease from 3.1% to 32.5% (from 5.2% to 36.9%) from zeroto six years old. We also examine the average rated life usedfor intra-node and intra-rack failures at different ages (notshown in plots). The rated life used for intra-node (intra-rack)failures (with the default threshold of 30 minutes) increasesfrom 1.6% (1.4%) for 0-1 year old to 67.5% (68.4%) for 5-6years old on average, showing that a longer rated life usedincreases the likelihood of intra-node and intra-rack failures.
Finding 7. The relative percentages of intra-node and intra-rack failures increase with age. The intra-node and intra-rackfailures at an older age are more likely to occur within a shorttime due to the increasing rated life used.
4.2.4 Capacity
We examine the impact of the capacity on correlated failures.Figure 11 shows that the relative percentages of intra-node(intra-rack) failures (over all SSD failures of the same capac-ity) for different sets of intra-node (intra-rack) failure groupsizes vary significantly across the capacity. Specifically, the
Failure group size [2, 10] (10, 20] (20, 30] (30, 89]
0
10
20
30
40
50
[0, 1)[1, 2)[2, 3)[3, 4)[4, 5)[5, 6)
Age (years)
Re
lativ
e p
erc
en
tag
eo
f fa
ilure
s (
%)
0
10
20
30
40
50
[0, 1)[1, 2)[2, 3)[3, 4)[4, 5)[5, 6)
Age (years)
Re
lativ
e p
erc
en
tag
eo
f fa
ilure
s (
%)
(a) Intra-node failures (b) Intra-rack failures
Figure 9: Finding 7. Relative percentages of failures for differentsets of intra-node or intra-rack failure group sizes across the age.
Failure time interval[0, 1 minute] (1 minute, 30 minutes]
(30 minutes, 1 day] (1 day, 1 month]
0
10
20
30
40
50
[0, 1)[1, 2)[2, 3)[3, 4)[4, 5)[5, 6)
Age (years)
Re
lativ
e p
erc
en
tag
eo
f fa
ilure
s (
%)
0
10
20
30
40
50
[0, 1)[1, 2)[2, 3)[3, 4)[4, 5)[5, 6)
Age (years)
Re
lativ
e p
erc
en
tag
eo
f fa
ilure
s (
%)
(a) Intra-node failures (b) Intra-rack failures
Figure 10: Finding 7. Relative percentages of failures for differentthresholds of intra-node or intra-rack failure time intervals acrossthe age.
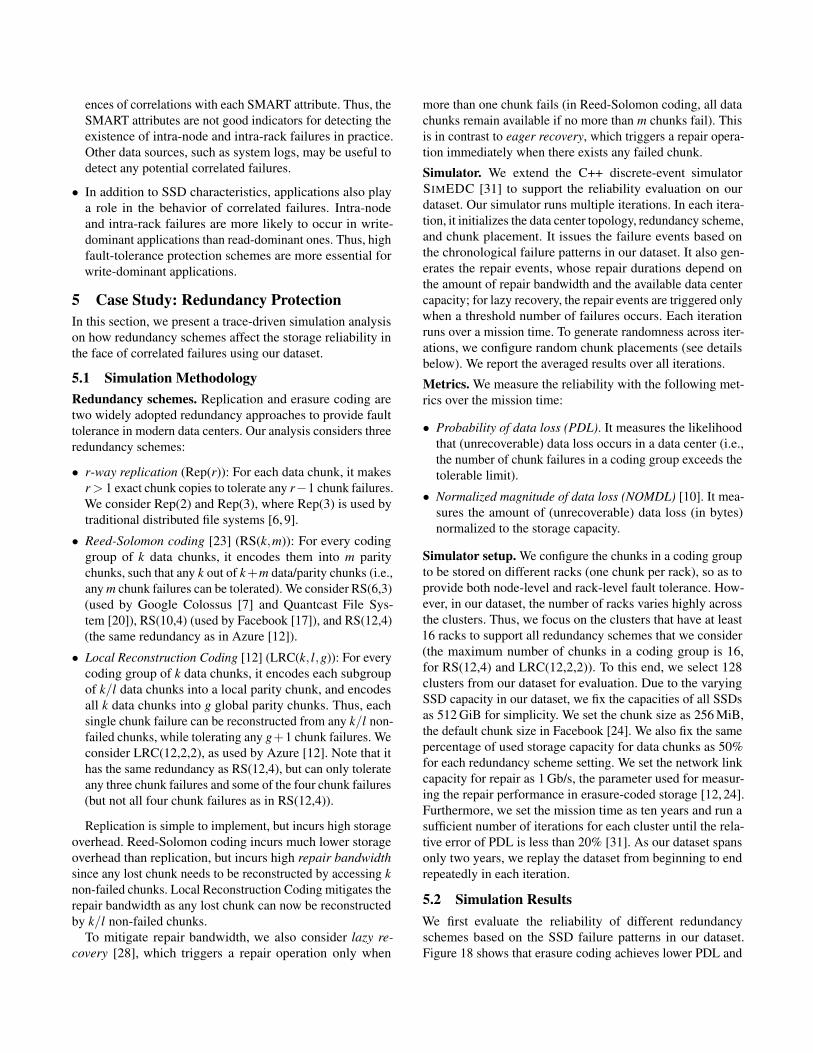
relative percentages of intra-node (intra-rack) failures for eachcapacity range from 0% to 25.2% (from 2.9% to 35.4%). Asthe SSDs with capacities of 480 GB, 800 GB, and 1920 GBcover more failures (Table 3), they have higher relative per-centages of intra-node and intra-rack failures.
We next vary the thresholds of the intra-node and intra-rackfailure time intervals, broken down by the capacity. Figure 12shows no clear trend between the relative percentages of intra-node or intra-rack failures and the capacity. In particular, the480 GB SSDs have the highest relative percentage of intra-node failures with a threshold of one minute, since they coverA3 with 34.4% of intra-node failures (Figure 6(a)), while the800 GB SSDs have the highest relative percentage of intra-rack failures with a threshold of one minute, since they coverA2 with 36.6% of intra-rack failures (Figure 6(b)).
Finding 8. The relative percentages of intra-node and intra-rack failures vary significantly across the capacity. There isno clear trend between the relative percentages of intra-node(or intra-rack) failures for different thresholds of failure timeintervals and the capacity.
4.3 Impact of SMART AttributesWe analyze how SMART attributes are correlated with intra-node and intra-rack failures. We use the SRCC [29] (§3) toexamine which SMART attributes are correlated with intra-node and intra-rack failures. Figure 13 shows that the SMARTattributes have limited correlations with intra-node or intra-rack failures, and the differences of the absolute values ofSRCC between intra-node and intra-rack failures are very

Failure group size [2, 10] (10, 20] (20, 30] (30, 89]
0
10
20
30
40
50
240 480 800 960 1920
Capacity (GB)
Re
lativ
e p
erc
en
tag
eo
f fa
ilure
s (
%)
0
10
20
30
40
50
240 480 800 960 1920
Capacity (GB)
Re
lativ
e p
erc
en
tag
eo
f fa
ilure
s (
%)
(a) Intra-node failures (b) Intra-rack failures
Figure 11: Finding 8. Relative percentages of failures for differentsets of intra-node or intra-rack failure group sizes across the capacity.
Failure time interval[0, 1 minute] (1 minute, 30 minutes]
(30 minutes, 1 day] (1 day, 1 month]
0
10
20
30
40
50
240 480 800 960 1920
Capacity (GB)
Re
lativ
e p
erc
en
tag
eo
f fa
ilure
s (
%)
0
10
20
30
40
50
240 480 800 960 1920
Capacity (GB)
Re
lativ
e p
erc
en
tag
eo
f fa
ilure
s (
%)
(a) Intra-node failures (b) Intra-rack failures
Figure 12: Finding 8. Relative percentages of failures for differentthresholds of intra-node or intra-rack failure time intervals acrossthe capacity.
small. In particular, the SMART attributes related to internalerrors (e.g., S187) are more correlated with intra-node andintra-rack failures, yet the highest SRCC values are only 0.23for both intra-node and intra-rack failures. This implies thatSMART attributes are not good indicators for detecting theexistence of intra-node and intra-rack failures. Furthermore,the differences of the absolute values of SRCC between intra-node and intra-rack failures are very small and less than 0.02.
Finding 9. The SMART attributes have limited correla-tions with intra-node and intra-rack failures, and the highestSRCC values (from S187) are only 0.23 for both intra-nodeand intra-rack failures. Thus, SMART attributes are not goodindicators for detecting the existence of intra-node and intra-rack failures. Also, intra-node and intra-rack failures have nosignificant difference of the absolute values of SRCC for eachSMART attribute.
4.4 Impact of ApplicationsWe analyze the relationships between the failure patterns andworkload distributions of the eight applications (Table 2), andstudy the impact of applications on correlated failures.
We first examine the relationships between the AFRs andworkload distributions of the eight applications. In particular,we use the raw values of SMART attributes S241 and S242to calculate the percentage of writes among the total work-loads of reads and writes, and determine if each SSD is read-dominant (i.e., more reads than writes) or write-dominant(i.e., more writes than reads). Figure 14(a) shows the averagepercentages of writes per SSD for the eight applications (each
-0.1
0
0.1
0.2
0.3
S5
S183
S184
S187
S195
Program
Blocks*
Wearout*
S241
S242
S9
S12
S174
S175*
SRCC
Intra-node
Intra-rack
Figure 13: Finding 9. SRCC values between each SMART attributeand intra-node or intra-rack failures. Note that we omit three SMARTattributes, including S197, S199, and erase failed counts, since theirabsolute SRCC values are less than 0.01 for both intra-node andintra-rack failures.
0
20
40
60
80
100
WSM RMWPS SS DB WS
DAENAS
Wri
tes (
%)
0
1
2
3
4
5
WSM RMWPS SS DB WS
DAENAS
AF
R (
%)
(a) Average percentages ofwrites per SSD
(b) AFRs
Figure 14: Finding 10. Average percentages of writes per SSD(with 95% confidence intervals as error bars) and AFRs for theapplications.
error bar shows the 95% confidence interval). Reads are dom-inant for WPS, SS, and DB, while writes are dominant for theremaining five applications. Figure 14(b) shows the AFRs forthe applications. The AFRs of write-dominant applications ingeneral are higher than those of read-dominant applications.This implies that write-dominant workloads lead to more SSDfailures overall, conforming to prior findings [18].
However, write-dominant workloads are not the only im-pacting factor on the AFRs. We see that DAE has the highestAFR (i.e., 4.9%), and it is mainly hosted on the drive modelC1, which has a high AFR (3.29% in Table 3). Also, WPShas a higher AFR than SS and DB by 0.29%, although it hasa lower percentage of writes than SS and DB. The reason isthat C1 is mainly used in WPS, while A1, which has a lowAFR (0.16% in Table 3), is the drive model mainly used inSS and DB.
Finding 10. Write-dominant workloads lead to more SSDfailures overall, but are not the only impacting factor on theAFRs. Other factors (e.g., drive models) can affect the AFRs.
We analyze the impact of applications on correlated failures.Figure 15 shows that the relative percentages of intra-node(intra-rack) failures (over all SSD failures of the same ap-plication) for different sets of intra-node (intra-rack) failuregroup sizes vary across the applications. In particular, therelative percentages of intra-node (intra-rack) failures for theapplications range from 2.1% to 33.6% (from 2.8% to 40.5%).

Failure group size [2, 10] (10, 20] (20, 30] (30, 89]
0
10
20
30
40
50
WSMRMWPS SS DB WS
DAENAS
Applications
Re
lativ
e p
erc
en
tag
eo
f fa
ilure
s (
%)
0
10
20
30
40
50
WSMRMWPS SS DB WS
DAENAS
Applications
Re
lativ
e p
erc
en
tag
eo
f fa
ilure
s (
%)
(a) Intra-node failures (b) Intra-rack failures
Figure 15: Finding 11. Relative percentages of failures for differ-ent sets of intra-node or intra-rack failure group sizes across theapplications.
02468
1012
WSMRMWPS SS DB WS
DAENAS
Applications
Ave
rag
e n
um
be
ro
f S
SD
s
0
10
20
30
40
50
WSMRMWPS SS DB WS
DAENAS
Applications
Ave
rag
e n
um
be
ro
f S
SD
s
(a) Per node (b) Per rack
Figure 16: Finding 11. Average numbers of SSDs per node or rackfor the applications (with 95% confidence intervals as error bars).
To explain these differences across the applications, weexamine the average number of SSDs per node or rack foreach application. Figure 16 shows that attaching more SSDson nodes and racks for applications tends to have a highpercentage of intra-node (intra-rack) failures. However, thereare some exceptions. The average number of SSDs per nodefor WSM (4.6) is close to that of WPS (5.0), yet the relativepercentage of intra-node failures for WSM is higher than thatof WPS by 5.0%. The reason is that WPS has read-dominantworkloads, while WSM has write-dominant workloads thatlead to more failures (Figure 14(a)). Similar observations alsohold for intra-rack failures. The average number of SSDs perrack for DAE (10.7) is much less than that for WPS (21.0),yet the relative percentage of intra-rack failures of DAE ishigher than that of WPS by 17.9%.
Finding 11. The applications with more SSDs per node(rack) and write-dominant workloads tend to have a highpercentage of intra-node (intra-rack) failures.
We further examine the impact of applications on correlatedfailures by varying the thresholds of the intra-node and intra-rack failure time intervals. Figure 17 shows that the relativepercentages of intra-node and intra-rack failures for differentthresholds of the failure time intervals vary across the appli-cations. In particular, the relative percentages of intra-node(intra-rack) failures with a threshold of one minute accountfor 1.9-22.0% (2.6-31.8%).
To explain these differences among the applications, weexamine the average ages of intra-node and intra-rack failuresfor the applications (not shown in plots). The average ages ofintra-node (intra-rack) failures with a threshold of one minutefor RM, SS, DB, and WS range from 3.2 to 3.9 years old
Failure time interval[0, 1 minute] (1 minute, 30 minutes]
(30 minutes, 1 day] (1 day, 1 month]
0
10
20
30
40
50
WSMRMWPS SS DB WS
DAENAS
Applications
Re
lativ
e p
erc
en
tag
eo
f fa
ilure
s (
%)
0
10
20
30
40
50
WSMRMWPS SS DB WS
DAENAS
Applications
Re
lativ
e p
erc
en
tag
eo
f fa
ilure
s (
%)
(a) Intra-node failures (b) Intra-rack failures
Figure 17: Finding 12. Relative percentages of failures for differentthresholds of intra-node or intra-rack failure time intervals acrossthe applications.
(from 3.2 to 4.1 years old), which are older than those of theremaining applications, i.e., from 1.3 to 2.5 years old (from1.2 to 2.2 years old). This conforms to Finding 7. However,there are two exceptions: (i) The average ages of intra-nodeand intra-rack failures for WS are younger than those for SSand DB by 0.48-0.65 years, while the relative percentage ofintra-node (intra-rack) failures with a threshold of one minutefor WS is higher than those for SS and DB by 2.3-4.5% (1.0-7.4%). (ii) The average age of intra-node (intra-rack) failuresfor NAS is younger than that for WPS by 1.0 (0.79) years,while the relative percentage of intra-node (intra-rack) failureswith a threshold of one minute for NAS is higher than thatfor WPS by 19.9% (29.1%). The reasons for these exceptionsare due to more write-dominant workloads for WS and NAS(Figure 14(a)).
Finding 12. Among individual applications, the intra-nodeand intra-rack failures at an older age and with more write-dominant workloads tend to occur in a short time.
4.5 DiscussionWe highlight the findings in the correlation analysis:
• Intra-node and intra-rack failures commonly exist in SSDfailures. Even worse, a non-negligible fraction of intra-nodeand intra-rack failures occur within a short time. In thepresence of intra-node and intra-rack failures, it is criticalto deploy the redundancy protection schemes with highfault tolerance to cope with such correlated failures.
• We analyze the effects of the four impacting factors, namelydrive models, lithography, age, and capacity, on intra-nodeand intra-rack failures. We find that drive models and agehave larger impacts on correlated failures than lithographyand capacity. Also, intra-node (intra-rack) failures tend tooccur with many SSDs from the same drive model on thesame node (rack), and the intra-node and intra-rack failuresof aged SSDs are more likely to occur within a short time.System operators should avoid putting such SSDs in thesame scope to limit the occurrences of correlated failures.
• Intra-node and intra-rack failures have limited correlationswith the SMART attributes and have no significant differ-
ences of correlations with each SMART attribute. Thus, theSMART attributes are not good indicators for detecting theexistence of intra-node and intra-rack failures in practice.Other data sources, such as system logs, may be useful todetect any potential correlated failures.
• In addition to SSD characteristics, applications also playa role in the behavior of correlated failures. Intra-nodeand intra-rack failures are more likely to occur in write-dominant applications than read-dominant ones. Thus, highfault-tolerance protection schemes are more essential forwrite-dominant applications.
5 Case Study: Redundancy ProtectionIn this section, we present a trace-driven simulation analysison how redundancy schemes affect the storage reliability inthe face of correlated failures using our dataset.
5.1 Simulation MethodologyRedundancy schemes. Replication and erasure coding aretwo widely adopted redundancy approaches to provide faulttolerance in modern data centers. Our analysis considers threeredundancy schemes:
• r-way replication (Rep(r)): For each data chunk, it makesr > 1 exact chunk copies to tolerate any r−1 chunk failures.We consider Rep(2) and Rep(3), where Rep(3) is used bytraditional distributed file systems [6, 9].
• Reed-Solomon coding [23] (RS(k,m)): For every codinggroup of k data chunks, it encodes them into m paritychunks, such that any k out of k+m data/parity chunks (i.e.,any m chunk failures can be tolerated). We consider RS(6,3)(used by Google Colossus [7] and Quantcast File Sys-tem [20]), RS(10,4) (used by Facebook [17]), and RS(12,4)(the same redundancy as in Azure [12]).
• Local Reconstruction Coding [12] (LRC(k, l,g)): For everycoding group of k data chunks, it encodes each subgroupof k/l data chunks into a local parity chunk, and encodesall k data chunks into g global parity chunks. Thus, eachsingle chunk failure can be reconstructed from any k/l non-failed chunks, while tolerating any g+1 chunk failures. Weconsider LRC(12,2,2), as used by Azure [12]. Note that ithas the same redundancy as RS(12,4), but can only tolerateany three chunk failures and some of the four chunk failures(but not all four chunk failures as in RS(12,4)).
Replication is simple to implement, but incurs high storageoverhead. Reed-Solomon coding incurs much lower storageoverhead than replication, but incurs high repair bandwidthsince any lost chunk needs to be reconstructed by accessing knon-failed chunks. Local Reconstruction Coding mitigates therepair bandwidth as any lost chunk can now be reconstructedby k/l non-failed chunks.
To mitigate repair bandwidth, we also consider lazy re-covery [28], which triggers a repair operation only when
more than one chunk fails (in Reed-Solomon coding, all datachunks remain available if no more than m chunks fail). Thisis in contrast to eager recovery, which triggers a repair opera-tion immediately when there exists any failed chunk.
Simulator. We extend the C++ discrete-event simulatorSIMEDC [31] to support the reliability evaluation on ourdataset. Our simulator runs multiple iterations. In each itera-tion, it initializes the data center topology, redundancy scheme,and chunk placement. It issues the failure events based onthe chronological failure patterns in our dataset. It also gen-erates the repair events, whose repair durations depend onthe amount of repair bandwidth and the available data centercapacity; for lazy recovery, the repair events are triggered onlywhen a threshold number of failures occurs. Each iterationruns over a mission time. To generate randomness across iter-ations, we configure random chunk placements (see detailsbelow). We report the averaged results over all iterations.
Metrics. We measure the reliability with the following met-rics over the mission time:
• Probability of data loss (PDL). It measures the likelihoodthat (unrecoverable) data loss occurs in a data center (i.e.,the number of chunk failures in a coding group exceeds thetolerable limit).
• Normalized magnitude of data loss (NOMDL) [10]. It mea-sures the amount of (unrecoverable) data loss (in bytes)normalized to the storage capacity.
Simulator setup. We configure the chunks in a coding groupto be stored on different racks (one chunk per rack), so as toprovide both node-level and rack-level fault tolerance. How-ever, in our dataset, the number of racks varies highly acrossthe clusters. Thus, we focus on the clusters that have at least16 racks to support all redundancy schemes that we consider(the maximum number of chunks in a coding group is 16,for RS(12,4) and LRC(12,2,2)). To this end, we select 128clusters from our dataset for evaluation. Due to the varyingSSD capacity in our dataset, we fix the capacities of all SSDsas 512 GiB for simplicity. We set the chunk size as 256 MiB,the default chunk size in Facebook [24]. We also fix the samepercentage of used storage capacity for data chunks as 50%for each redundancy scheme setting. We set the network linkcapacity for repair as 1 Gb/s, the parameter used for measur-ing the repair performance in erasure-coded storage [12, 24].Furthermore, we set the mission time as ten years and run asufficient number of iterations for each cluster until the rela-tive error of PDL is less than 20% [31]. As our dataset spansonly two years, we replay the dataset from beginning to endrepeatedly in each iteration.
5.2 Simulation ResultsWe first evaluate the reliability of different redundancyschemes based on the SSD failure patterns in our dataset.Figure 18 shows that erasure coding achieves lower PDL and

5.3 1.5 1.7 4.910.1
59.9
0102030405060
Rep(2)
Rep(3)
RS(6,3)
RS(10,4)
RS(12,4)
LRC(12,2,2)
PD
L (
%)
1e-09
1e-08
1e-07
1e-06
1e-05
1e-04
Rep(2)
Rep(3)
RS(6,3)
RS(10,4)
RS(12,4)
LRC(12,2,2)
NOMDL
(a) PDL (b) NOMDL
Figure 18: Finding 13. Comparison of the redundancy schemes.
NOMDL (i.e., higher reliability) than replication. In particu-lar, Rep(2) has the highest PDL (59.9%), indicating that twochunk copies are insufficient to tolerate failures. Also, Rep(3)is not good enough with a PDL of 10.1%. In contrast, RS(10,4)has the lowest PDL and NOMDL among all RS codes, sinceit tolerates more failures than RS(6,3) and has less repairbandwidth than RS(12,4). LRC(12,2,2) has slightly higherPDL and NOMDL than RS(12,4), since it cannot tolerate fourchunks at any time.
Finding 13. Erasure coding shows higher reliability thanreplication based on the failure patterns in our dataset.
We claim that the redundancy schemes that are sufficientfor tolerating independent failures may be insufficient forcorrelated failures. To justify this claim, we examine the re-liability under only independent failures (generated from amathematical failure model) and under the failure patterns inour dataset (including both independent and correlated ones).Specifically, we generate independent SSD failures followingan exponential distribution with the mean time between fail-ures (i.e., the number of hours in a year over the overall AFRin §2.2) in our dataset as the rate parameter, i.e., 8760
1.16% .Figure 19 shows the results of the PDL and NOMDL for
eager recovery under only independent failures and the failurepatterns in our dataset. The PDL and NOMDL under onlyindependent failures for Rep(3), RS(6,3), RS(10,4), RS(12,4),and LRC(12,2,2) are zero. However, the reliability of theseredundancy schemes degrades under the failure patterns inour dataset. The reason is that some correlated failures occurwithin a short time period (Finding 3) and additional failuresare likely to occur in a short time with the existing correlatedfailures on the same node or rack (Finding 2), leading to thecompetition for network bandwidth resources and a slowdownof the repair process. This increases the likelihood of dataloss. In addition, the PDL under only independent failures forRep(2) is higher than that under the failures in our dataset by13.8%. The reason is that the number of failures generated bythe mathematical failure model may be more than that in ourdataset for some clusters, leading to more failed chunks thatexceed the tolerable limit of Rep(2). This implies that Rep(2)is still insufficient under only independent failures.
Finding 14. Redundancy schemes that are sufficient for tol-erating independent failures may be insufficient for toleratingthe correlated failures as shown in our dataset.
We next evaluate the reliability of lazy recovery under only
0 0 0 0 00102030405060
Rep(2)
Rep(3)
RS(6,3)
RS(10,4)
RS(12,4)
LRC(12,2,2)
PD
L (
%)
Independent Correlated
0 0 0 0 00
20
40
60
80
Rep(2)
Rep(3)
RS(6,3)
RS(10,4)
RS(12,4)
LRC(12,2,2)
PD
L (
%)
0 0 0 0 01e-09
1e-08
1e-07
1e-06
1e-05
Rep(2)
Rep(3)
RS(6,3)
RS(10,4)
RS(12,4)
LRC(12,2,2)
NOMDL
(a) PDL (b) NOMDL
Figure 19: Finding 14. Comparison of the PDL and NOMDL ofeager recovery under independent failures (“Independent”) and thefailure patterns in our dataset (“Correlated”).
0510152025
1 2 3 4
Number of chunk failures
PD
L (
%)
Independent, RS(10,4) Independent, RS(12,4)
Correlated, RS(10,4) Correlated, RS(12,4)
0
5
10
15
20
25
1 2 3 4
Number of chunk failures
PD
L (
%)
0 0 01e-10
1e-09
1e-08
1e-07
1e-06
1 2 3 4
Number of chunk failures
NO
MD
L
(a) PDL (b) NOMDL
Figure 20: Finding 15. Comparison of the PDL and NOMDL forthe threshold number of chunk failures for recovery under only in-dependent failures (“Independent”) and the failure patterns in ourdataset (“Correlated”).
independent failures derived from the mathematical failuremodel and under the failure patterns in our dataset. For lazyrecovery, we vary the threshold of triggering recovery fromone to four failed chunks (note that four is the tolerable limitfor RS(10,4) and RS(12,4)); a threshold of one implies eagerrecovery.
Figure 20 shows that RS(10,4) and RS(12,4) achieve ahigh reliability under only independent failures, but their re-liability degrades under the failure patterns in our dataset asthe threshold increases. In particular, under only independentfailures, RS(10,4) and RS(12,4) can achieve a high reliabil-ity without data loss with a threshold of one to three failedchunks, conforming to the prior work [18]. They have a smallPDL (0.14-0.56%) with a threshold of four failed chunkssince having any additional failed chunk will lead to dataloss. However, under the failure patterns in our dataset, thePDL values for RS(10,4) and RS(12,4) increase by 0.98-1.5%when the threshold increases from one to two failed chunks,and continue to increase by more than 10% from two to fourfailed chunks. The reason of the reliability degradation oflazy recovery under the failures in our dataset is that when thenumber of failed chunks reaches a larger threshold of chunkfailures, additional correlated failures are also more likelyto occur in a short time (Findings 2 and 3). Thus, the mostproper threshold number of chunk failures is one, i.e., eagerrecovery, under the failure patterns in our dataset.
Finding 15. Lazy recovery is less suitable than eager re-covery for tolerating correlated failures in our dataset.

6 Related WorkSSD measurement. Field studies have analyzed the reliabil-ity of SSDs and characterized the correlations between SSDfailures and their symptoms [2,15,16,18,27,30]. For example,some studies [16, 18, 27] analyze the symptoms (e.g., uncor-rectable errors) reported by proprietary customized attributesand SMART attributes in SSD failures. Xu et al. [30] inves-tigate the effects of system-level symptoms on SSD failures.Alter et al. [2] exploit the failure patterns from the symptomsto predict future SSD failures. Maneas et al. [15] analyze howSSD replacements and other factors affect the replacementrates within a RAID system. Although some studies [15, 16]report the existence of correlated failures in SSD-based stor-age systems, they do not cover the location details of SSDfailures due to the limited information in their datasets. Ingeneral, the above studies mainly focus on how SSD failuresare correlated with different factors, while our work focuseson the correlations among the SSD failures. In particular, wecharacterize the correlated failures within a node or a rack.We study the impact of different factors on correlated failures,and the implications on storage reliability under correlatedfailures in SSD-based data centers.
HDD measurement. Field studies have analyzed the reliabil-ity of hard disk drives (HDDs) in production environments.Pinheiro et al. [22] analyze different factors that are corre-lated with HDD failures based on SMART logs at Google.Schroeder et al. [26] characterize the HDD replacement ratesstatistically. Also, prior studies present the patterns of latentsector errors [4, 25] and data corruptions [3] at NetApp. Inthe literature, Lu et al. [14] leverage the locations of HDDsto predict HDD failures. Instead, our work uses the locationsto study correlated failures of SSDs.
Correlated failures. Prior studies have characterized the cor-related failures on various storage scopes. Chun et al. [5] andNath et al. [19] investigate the correlated failures that threatenthe durability and availability of storage systems. Schroeder etal. [25, 26] provide a statistical analysis on correlated failuresof hard disks and the bursts of latent sector errors in disks.Ford et al. [8] characterize the statistical behavior of corre-lated node failures. In contrast, we focus on characterizingthe correlated failures in SSD-based data centers in a morecomprehensive manner.
7 ConclusionWe present an in-depth analysis on correlated failures of SSDsbased on the large-scale dataset at Alibaba. Our analysis in-cludes spatial and temporal correlations of SSD failures andthe impact of different factors on correlated failures. We alsoevaluate the reliability of various redundancy schemes undercorrelated failures via trace-driven simulation. We report 15findings, and release our dataset and source code for publicvalidation.
AcknowledgementWe thank our shepherd, Jiri Schindler, and the anonymousreviewers for their comments. We also thank Qiuping Wangand Jinhong Li for their feedback. This work was supported inpart by Alibaba Group via the Alibaba Innovation Research(AIR) program and the Research Grants Council of HongKong (AoE/P-404/18).
References[1] R. Alagappan, A. Ganesan, Y. Patel, T. S. Pillai, A. C.
Arpaci-Dusseau, and R. H. Arpaci-Dusseau. Correlatedcrash vulnerabilities. In Proc. of USENIX OSDI, 2016.
[2] J. Alter, J. Xue, A. Dimnaku, and E. Smirni. SSD fail-ures in the field: Symptoms, causes, and prediction mod-els. In Proc. of ACM/IEEE SC, 2019.
[3] L. N. Bairavasundaram, A. C. Arpaci-Dusseau, R. H.Arpaci-Dusseau, G. R. Goodson, and B. Schroeder. Ananalysis of data corruption in the storage stack. ACMTrans. on Storage, 4(3):8, Nov 2008.
[4] L. N. Bairavasundaram, G. R. Goodson, S. Pasupathy,and J. Schindler. An analysis of latent sector errors indisk drives. In Proc. of ACM SIGMETRICS, 2007.
[5] B.-G. Chun, F. Dabek, A. Haeberlen, E. Sit, H. Weather-spoon, M. F. Kaashoek, J. Kubiatowicz, and R. T. Morris.Efficient replica maintenance for distributed storage sys-tems. In Proc. of USENIX NSDI, 2006.
[6] G. DeCandia, D. Hastorun, M. Jampani, G. Kakula-pati, A. Lakshman, A. Pilchin, S. Sivasubramanian,P. Vosshall, and W. Vogels. Dynamo: Amazon’s highlyavailable key-value store. In Proc. of ACM SOSP, 2007.
[7] A. Fikes. Storage architecture and challenges. Talk atthe Google Faculty Summit, 2010.
[8] D. Ford, F. Labelle, F. Popovici, M. Stokely, V.-A.Truong, L. Barroso, C. Grimes, and S. Quinlan. Avail-ability in globally distributed storage systems. In Proc.of USENIX OSDI, 2010.
[9] S. Ghemawat, H. Gobioff, and S.-T. Leung. The Googlefile system. In Proc. of ACM SOSP, 2003.
[10] K. M. Greenan, J. S. Plank, J. J. Wylie, et al. Mean timeto meaningless: MTTDL, Markov models, and storagesystem reliability. In Proc. of USENIX HotStorage,2010.
[11] A. Haeberlen, A. Mislove, and P. Druschel. Glacier:Highly durable, decentralized storage despite massivecorrelated failures. In Proc. of USENIX NSDI, 2005.
[12] C. Huang, H. Simitci, Y. Xu, A. Ogus, B. Calder,P. Gopalan, J. Li, and S. Yekhanin. Erasure codingin windows azure storage. In Proc. of USENIX ATC,2012.

[13] S. Kadekodi, K. Rashmi, and G. R. Ganger. Clusterstorage systems gotta have HeART: improving storageefficiency by exploiting disk-reliability heterogeneity.In Proc. of USENIX FAST, 2019.
[14] S. Lu, B. Luo, T. Patel, Y. Yao, D. Tiwari, and W. Shi.Making disk failure predictions SMARTer! In Proc. ofUSENIX FAST, 2020.
[15] S. Maneas, K. Mahdaviani, T. Emami, and B. Schroeder.A study of SSD reliability in large scale enterprise stor-age deployments. In Proc. of USENIX FAST, 2020.
[16] J. Meza, Q. Wu, S. Kumar, and O. Mutlu. A large-scalestudy of flash memory failures in the field. In Proc. ofACM SIGMETRICS, 2015.
[17] S. Muralidhar, W. Lloyd, S. Roy, C. Hill, E. Lin, W. Liu,S. Pan, S. Shankar, V. Sivakumar, L. Tang, et al. f4:Facebook’s warm BLOB storage system. In Proc. ofUSENIX OSDI, 2014.
[18] I. Narayanan, D. Wang, M. Jeon, B. Sharma,L. Caulfield, A. Sivasubramaniam, B. Cutler, J. Liu,B. Khessib, and K. Vaid. SSD failures in datacenters:What? when? and why? In Proc. of ACM SYSTOR,2016.
[19] S. Nath, H. Yu, P. B. Gibbons, and S. Seshan. Subtletiesin tolerating correlated failures in wide-area storagesystems. In Proc. of USENIX NSDI, 2006.
[20] M. Ovsiannikov, S. Rus, D. Reeves, P. Sutter, S. Rao,and J. Kelly. The Quantcast file system. In Proc. of theVLDB Endowment, 2013.
[21] K. Pearson. Vii. note on regression and inheritance inthe case of two parents. Proc. of the Royal Society ofLondon, 58(347-352):240–242, 1895.
[22] E. Pinheiro, W.-D. Weber, and L. A. Barroso. FailureTrends in a Large Disk Drive Population. In Proc. ofUSENIX FAST, 2007.
[23] I. S. Reed and G. Solomon. Polynomial codes overcertain finite fields. Journal of the Society for Industrialand Applied Mathematics, 8(2):300–304, 1960.
[24] M. Sathiamoorthy, M. Asteris, D. Papailiopoulos, A. G.Dimakis, R. Vadali, S. Chen, and D. Borthakur. XORingElephants: Novel erasure codes for big data. In Proc. ofthe VLDB Endowment, 2013.
[25] B. Schroeder, S. Damouras, and P. Gill. Understandinglatent sector errors and how to protect against them.ACM Trans. on Storage, 6(3):1–23, 2010.
[26] B. Schroeder and G. A. Gibson. Understanding diskfailure rates: What does an MTTF of 1,000,000 hoursmean to you? ACM Trans. on Storage (TOS), 3(3):8–es,2007.
[27] B. Schroeder, R. Lagisetty, and A. Merchant. Flash reli-ability in production: The expected and the unexpected.In Proc. of USENIX FAST, 2016.
[28] M. Silberstein, L. Ganesh, Y. Wang, L. Alvisi, andM. Dahlin. Lazy means smart: Reducing repair band-width costs in erasure-coded distributed storage. In Proc.of ACM SYSTOR, 2014.
[29] C. Spearman. The proof and measurement of associ-ation between two things. The American Journal ofPsychology, 100(3/4):441–471, 1987.
[30] E. Xu, M. Zheng, F. Qin, Y. Xu, and J. Wu. Lessonsand actions: What we learned from 10K SSD-relatedstorage system failures. In Proc. of USENIX ATC, 2019.
[31] M. Zhang, S. Han, and P. P. Lee. SimEDC: A simulatorfor the reliability analysis of erasure-coded data cen-ters. IEEE Trans. on Parallel and Distributed Systems,30(12):2836–2848, 2019.