An identification procedure of soil profile characteristics from two free field acclerometer records
8
An identification procedure of soil profile characteristics from two free field acclerometer records Z. Harichane a , H. Afra b, * , S.M. Elachachi c a Civil Engineering Department, University of Chlef, Algeria b Building Research Center, CNERIB, Algiers, Algeria c Civil Engineering Department, University of Sciences and Technology of Oran, Algeria Accepted 11 April 2005 Abstract In this paper, an analytical, numerical and experimental approach for identifying soil profile characteristics by using system identification and free field records, is presented. First, a theoretical soil amplification function for two sites is defined and expressed in terms of the different parameters of the layers constituting the soil profiles (thickness, damping ratio, shear wave velocity and unit weight). Then, this function is smoothed with an analogous function obtained from experimental data by using the least squares minimization technique. The identification of the parameters is performed by solving, numerically, a non-linear optimisation problem. To demonstrate the numerical efficiency and the validity of this approach, two examples are treated. The first one consists in the identification of characteristics of a given uniform soil layer. The second example consists in the experimental validation of this approach with the data recorded within the Garner Valley Down Hole Array (GVDA). Finally, this approach is applied to identify, simultaneously, soil profile characteristics of sites from only a single soil acceleration record at free surface of each site. This procedure is utilised to identify soil profile characteristics of sites by using strong ground motions data recorded during the recent Boumerdes earthquake of May 21, 2003. q 2005 Elsevier Ltd. All rights reserved. Keywords: System identification; Soil profile characteristics; Amplification function; Strong ground motion 1. Introduction It has long been recognized that local site conditions and local effects are significant factors on earthquake ground motion on soft soil sites and the need of taking them into account becomes pronounced when an earthquake strikes a region [1]. In more recent years, the inclusion of site effects in code provisions has received a large attention by the engineering community [2–4]. Local site response may be evaluated by theoretical or empirical methods. The theoretical methods allow the use of detailed data on soil layers [5–8]. On the other hand, the empirical methods are based on seismic records on sites of different geological conditions which require a large number of records produced by real earthquakes [9–11]. It takes a long time to obtain a reasonably complete data set in regions with low seismicity. Mitigation of earthquake risk in regions with high seismicity requires detailed microzona- tion studies, which need the mechanical parameters of the soil strata. These parameters are obtained usually by in situ and/or laboratory testing methods [12,13]. In particular, analyses of down hole seismic array data can provide unique information on actual and overall site behaviour over a wide range of loading conditions that are not readily covered by in situ or laboratory experimental procedures [14]. How- ever, it is widely recognized in Ref. [11] that there are significant discrepancies between laboratory results and attenuations observed in situ. So, since these tests are generally costly, needing expensive equipment and highly qualified personnel, the main objective of this study is to present an analytical, numerical and experimental approach for identifying characteristics of soil profiles that reduces significantly the operational cost, by applying system identification techniques to free field records. System identification may be performed using two records: one on Soil Dynamics and Earthquake Engineering 25 (2005) 431–438 www.elsevier.com/locate/soildyn 0267-7261/$ - see front matter q 2005 Elsevier Ltd. All rights reserved. doi:10.1016/j.soildyn.2005.04.001 * Corresponding author. Address: Building Research Centre, CNERIB, Cite ´ Nouvelle EL MOKRANI Souidania, Algiers, Algeria. E-mail address: [email protected] (H. Afra).
Transcript of An identification procedure of soil profile characteristics from two free field acclerometer records

An identification procedure of soil profile characteristics
from two free field acclerometer records
Z. Harichanea, H. Afrab,*, S.M. Elachachic
aCivil Engineering Department, University of Chlef, AlgeriabBuilding Research Center, CNERIB, Algiers, Algeria
cCivil Engineering Department, University of Sciences and Technology of Oran, Algeria
Accepted 11 April 2005
Abstract
In this paper, an analytical, numerical and experimental approach for identifying soil profile characteristics by using system identification
and free field records, is presented. First, a theoretical soil amplification function for two sites is defined and expressed in terms of the
different parameters of the layers constituting the soil profiles (thickness, damping ratio, shear wave velocity and unit weight). Then, this
function is smoothed with an analogous function obtained from experimental data by using the least squares minimization technique. The
identification of the parameters is performed by solving, numerically, a non-linear optimisation problem. To demonstrate the numerical
efficiency and the validity of this approach, two examples are treated. The first one consists in the identification of characteristics of a given
uniform soil layer. The second example consists in the experimental validation of this approach with the data recorded within the Garner
Valley Down Hole Array (GVDA). Finally, this approach is applied to identify, simultaneously, soil profile characteristics of sites from only
a single soil acceleration record at free surface of each site. This procedure is utilised to identify soil profile characteristics of sites by using
strong ground motions data recorded during the recent Boumerdes earthquake of May 21, 2003.
q 2005 Elsevier Ltd. All rights reserved.
Keywords: System identification; Soil profile characteristics; Amplification function; Strong ground motion
1. Introduction
It has long been recognized that local site conditions and
local effects are significant factors on earthquake ground
motion on soft soil sites and the need of taking them into
account becomes pronounced when an earthquake strikes a
region [1]. In more recent years, the inclusion of site effects
in code provisions has received a large attention by the
engineering community [2–4].
Local site response may be evaluated by theoretical or
empirical methods. The theoretical methods allow the use of
detailed data on soil layers [5–8]. On the other hand, the
empirical methods are based on seismic records on sites of
different geological conditions which require a large
0267-7261/$ - see front matter q 2005 Elsevier Ltd. All rights reserved.
doi:10.1016/j.soildyn.2005.04.001
* Corresponding author. Address: Building Research Centre, CNERIB,
Cite Nouvelle EL MOKRANI Souidania, Algiers, Algeria.
E-mail address: [email protected] (H. Afra).
number of records produced by real earthquakes [9–11]. It
takes a long time to obtain a reasonably complete data set in
regions with low seismicity. Mitigation of earthquake risk in
regions with high seismicity requires detailed microzona-
tion studies, which need the mechanical parameters of the
soil strata. These parameters are obtained usually by in situ
and/or laboratory testing methods [12,13]. In particular,
analyses of down hole seismic array data can provide unique
information on actual and overall site behaviour over a wide
range of loading conditions that are not readily covered by
in situ or laboratory experimental procedures [14]. How-
ever, it is widely recognized in Ref. [11] that there are
significant discrepancies between laboratory results and
attenuations observed in situ. So, since these tests are
generally costly, needing expensive equipment and highly
qualified personnel, the main objective of this study is to
present an analytical, numerical and experimental approach
for identifying characteristics of soil profiles that reduces
significantly the operational cost, by applying system
identification techniques to free field records. System
identification may be performed using two records: one on
Soil Dynamics and Earthquake Engineering 25 (2005) 431–438
www.elsevier.com/locate/soildyn
Z. Harichane et al. / Soil Dynamics and Earthquake Engineering 25 (2005) 431–438432
a free surface and the another on outcropping rock, the case
corresponding to a rock under the soil profile is more rare, or
by using two records on the free surfaces of two sites
without the need of a record on outcropping bed rock or hard
layer.
System identification applied to soil response during
earthquakes has proved a useful tool for estimating in situ
characteristics of soils in previous researches [15–17]. Loh
et al. [18] have estimated the possible effects of the source
(corner frequency, high frequency decay rate of accelera-
tion) as well as the local soil characteristics (depth of soil
deposit, soil density and shear modulus) on the spectral
characteristics of ground motions by developing a stochastic
soil amplification function for a uniform soil layer and using
data recorded by SMART-1 array on Lotung site in Taiwan.
After that, a system identification method was applied to
identify the hysteretic behaviour of soil deposits [19]. Some
other previous studies on system identification carried out at
Lotung site are reviewed in Ref. [20]. In their study, Glaser
and Baise [20] have estimated dynamic properties (shear
stiffness and damping ratios) of the soils at Lotung site from
seismic vertical array measurements (input–output data
sets) using both time-invariant and time-variant parametric
modelling methods (system identification) and modelling
the soil system by a simple lumped mass.
In the present approach, a theoretical soil amplification
function for two sites is defined and expressed in terms of
the different parameters of the layers constituting the soil
profiles (thickness, damping ratio, shear wave velocity and
unit weight). Then, this function is smoothed with respect to
the one obtained from experimental data by using the least
squares minimization technique. The identification of the
parameters is performed by solving, numerically, a non-
linear optimisation problem.
To demonstrate the numerical efficiency and the validity
of this approach, two examples are treated. The first one
consists in the identification of characteristics of a given
uniform soil layer. The second example consists in the
experimental validation of this approach by using the data
recorded within the Garner Valley Down Hole Array
(GVDA) [21].
For more complete and rigorous characterisation of sites
and for more appropriate use in Earthquake Engineering
computations, this approach is applied to identify, simul-
taneously, soil profile characteristics of sites from only a
single soil acceleration record at free surface of each site.
This procedure is utilised to identify soil profile character-
istics of sites by using strong ground motions data recorded
during the recent Boumerdes earthquake of May 21, 2003.
2. Identification method
The present system identification method is based on the
least squares minimization technique described in more
details in Ref. [22] and applied in Ref. [23]. The error
function c2 is minimised according to the parameters vector
{g}, in frequency domain:
c2ðfgg;uÞ Z KXNP
iZ1
ðumax
0jyeiðuÞKydiðfgg;uÞj
2du (1)
where ydi({g},u) is the frequency response of the model and
yei(u) is the measured response on the Np considered points.
umax is the maximum frequency defining the measured
function and K is a normalization factor,
K ZXNP
iZ1
ðumax
0jyeiðuÞj
2du
!K1
:
The local minimum of c2 ({g},u) is obtained under two
conditions: the first one is the nil gradient condition and the
second one is the positive Hessien matrix condition.
3. Simultaneous identification of soil profilecharacteristics of two sites from single record
at the free surface of each site
3.1. Formulation of the equations
Having two records yA(t) et yB(t) at free surface of two
sites A and B (Fig. 1), respectively, their respective
frequency contents YA(u) and YB(u) can be obtained by
using the Fast Fourier Transform [24]. By assuming that the
frequency content is the same at the two bedrocks of sites A
and B, YBR(u)Za YAR(u) where a is a coefficient which can
be determined from the attenuation laws, the soil amplifica-
tion functions corresponding to the two sites A and B are
defined by assuming one dimensional model, by the two
respective equations TA;RðuÞZYAðuÞ=YARðuÞ and TB;RðuÞZYBðuÞ=YBRðuÞ. By considering the ratio between the two
amplification functions, the ‘measured’ function yei(u) can
be defined as:
yeiðuÞ Z aYAðuÞ
YBðuÞ(2)
The soil deposit of each site A and B is assumed to be
linear elastic and horizontally stratified and the distance
between record stations is assumed so long to satisfy the one
dimensional model assumption (Fig. 1). The governing
equation of motion for a vertically propagating shear wave
from bed rock to free surface in each layer of an non-
homogeneous soil deposit is:
v2uj zj;t
� �vt2
Z V2Sj
v2ujðzj;tÞ
vz2(3)
where VSj and zj (0%zj%hj) are, respectively, the shear
wave velocity and the depth in the jth layer of the soil deposit
(Fig. 1). hj is the thickness of the jth layer.
Eq. (3) is a linear partial differential equation of the
second order with constant coefficients. By assuming
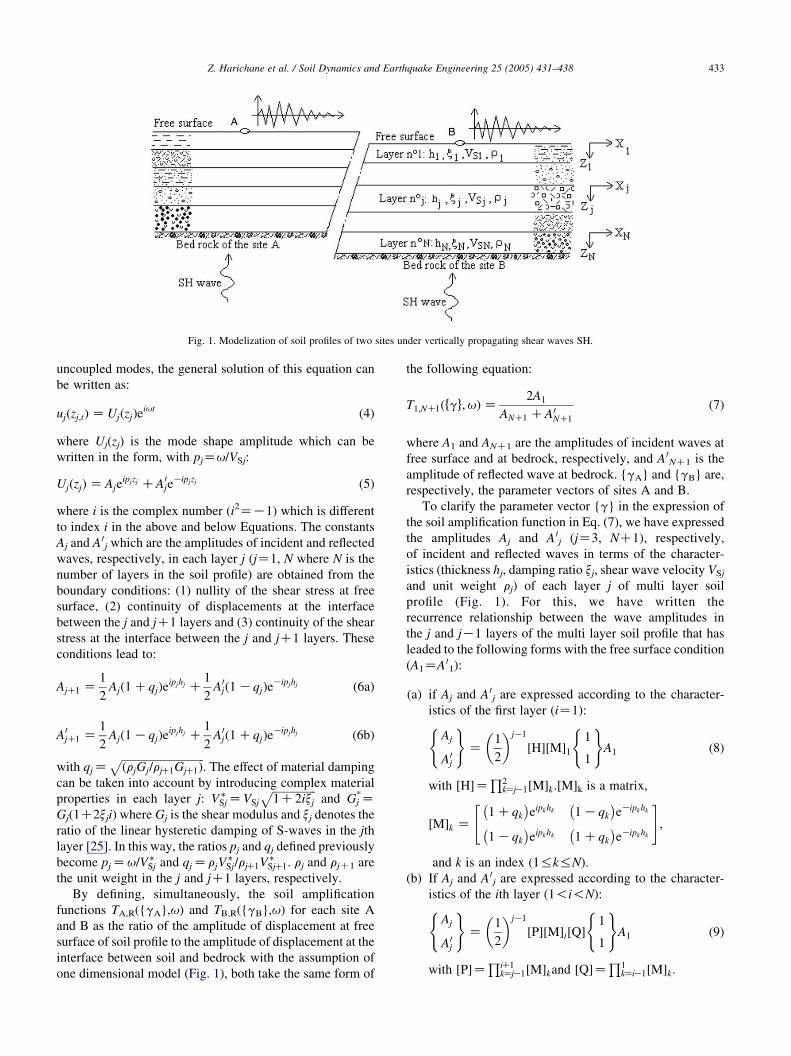
Fig. 1. Modelization of soil profiles of two sites under vertically propagating shear waves SH.
Z. Harichane et al. / Soil Dynamics and Earthquake Engineering 25 (2005) 431–438 433
uncoupled modes, the general solution of this equation can
be written as:
ujðzj;tÞ Z UjðzjÞeiut (4)
where Uj(zj) is the mode shape amplitude which can be
written in the form, with pjZu/VSj:
UjðzjÞ Z Ajeipjzj CA0
jeKipjzj (5)
where i is the complex number (i2ZK1) which is different
to index i in the above and below Equations. The constants
Aj and A 0j which are the amplitudes of incident and reflected
waves, respectively, in each layer j (jZ1, N where N is the
number of layers in the soil profile) are obtained from the
boundary conditions: (1) nullity of the shear stress at free
surface, (2) continuity of displacements at the interface
between the j and jC1 layers and (3) continuity of the shear
stress at the interface between the j and jC1 layers. These
conditions lead to:
AjC1 Z1
2Ajð1 CqjÞe
ipjhj C1
2A0
jð1 KqjÞeKipjhj (6a)
A0jC1 Z
1
2Ajð1 KqjÞe
ipjhj C1
2A0
jð1 CqjÞeKipjhj (6b)
with qjZffiffiffiffiffiffiffiffiffiffiffiffiffiffiffiffiffiffiffiffiffiffiffiffiffiffiffiffiffiffiðrjGj=rjC1GjC1Þ
p. The effect of material damping
can be taken into account by introducing complex material
properties in each layer j: V�SjZVSj
ffiffiffiffiffiffiffiffiffiffiffiffiffiffiffiffi1C2ixj
pand Gj
*ZGj(1C2xji) where Gj is the shear modulus and xj denotes the
ratio of the linear hysteretic damping of S-waves in the jth
layer [25]. In this way, the ratios pj and qj defined previously
become pjZu=V�Sj and qj ZrjV
�Sj=rjC1V�
SjC1. rj and rjC1 are
the unit weight in the j and jC1 layers, respectively.
By defining, simultaneously, the soil amplification
functions TA,R({gA},u) and TB,R({gB},u) for each site A
and B as the ratio of the amplitude of displacement at free
surface of soil profile to the amplitude of displacement at the
interface between soil and bedrock with the assumption of
one dimensional model (Fig. 1), both take the same form of
the following equation:
T1;NC1ðfgg;uÞ Z2A1
ANC1 CA0NC1
(7)
where A1 and ANC1 are the amplitudes of incident waves at
free surface and at bedrock, respectively, and A 0NC1 is the
amplitude of reflected wave at bedrock. {gA} and {gB} are,
respectively, the parameter vectors of sites A and B.
To clarify the parameter vector {g} in the expression of
the soil amplification function in Eq. (7), we have expressed
the amplitudes Aj and A 0j (jZ3, NC1), respectively,
of incident and reflected waves in terms of the character-
istics (thickness hj, damping ratio xj, shear wave velocity VSj
and unit weight rj) of each layer j of multi layer soil
profile (Fig. 1). For this, we have written the
recurrence relationship between the wave amplitudes in
the j and jK1 layers of the multi layer soil profile that has
leaded to the following forms with the free surface condition
(A1ZA 01):
(a)
if Aj and A 0j are expressed according to the character-istics of the first layer (iZ1):
Aj
A0j
( )Z
1
2
� �jK1
½H½M11
1
( )A1 (8)
with ½HZQ2
kZjK1½Mk.[M]k is a matrix,
½Mk Z1 Cqk
� �eipkhk 1 Kqk
� �eKipkhk
1 Kqk
� �eipkhk 1 Cqk
� �eKipkhk
" #;
and k is an index (1%k%N).
(b)
If Aj and A 0j are expressed according to the character-istics of the ith layer (1!i!N):
Aj
A0j
( )Z
1
2
� �jK1
½P½Mi½Q1
1
( )A1 (9)
with ½PZQiC1
kZjK1½Mkand ½QZQ1
kZiK1½Mk.

Z. Harichane et al. / Soil Dynamics and Earthquake Engineering 25 (2005) 431–438434
(c)
If Aj and A 0j are expressed according to the character-istics of the Nth layer:
Aj
A0j
( )Z
1
2
� �jK1
½MjK1½G1
1
( )A1 (10)
with ½GZQ1
kZjK2½Mk.
So, by distinguishing the different cases treated above, the
soil amplification function for a soil profile overlaying a rigid
bedrock can be expressed in the two following general forms:
(a)
According to the characteristics of the Nth layer:T1;NC1ðfgg;uÞ Z1
12
� �NVðfgg;uÞ
(11)
where the function V({g}, u) is given by:
Vðfgg;uÞ Z eip1h1 CeKip1h1 (12a)
for a mono layer soil profile, or by:
Vðfgg;uÞ Z eipN hN ðG11 CG12ÞCeKipN hN ðG21 CG22Þ
(12b)
in the case of multi layer soil profile (NO1).
(b)
According to the characteristics of the layer with index i(1%i!N) of the multi layer soil profile:
T1;NC1ðfgg;uÞ Z2
12
� �NVðfgg;uÞ
(13)
where V({g}, u) is in the form:
Vðfgg;uÞ Z ½ð1 Cq1Þeip1h1 C ð1 Kq1Þe
Kip1h1
!ðH11 CH21ÞC ½ð1 Kq1Þeip1h1
C ð1 Cq1ÞeKip1h1ðH12 CH22Þ (14a)
if it is expressed according to the characteristics of the first
layer (iZ1) or in the form:
Vðfgg;uÞ Z ½ð1 CqiÞeKipihi ðP11 CP21ÞC ð1 KqiÞe
Kipihi
ðP12 CP22ÞðQ11 CQ12ÞC ½ð1 KqiÞeipihiðP11 CP21Þ
C ð1 CqiÞeipihiðP12 CP22ÞðQ21 CQ22Þ (14b)
according to the characteristics of the layer with index i
(1!i!N).
The terms Hij, Pij, Qij and Gij (i, jZ1, 2) are the
components of [H], [P], [Q] and [G] matrixes, defined above,
respectively.
3.2. Definition of the model function and its gradient
The model function ydi({g}, u) in the present case of
simultaneous identification of two soil profiles of two sites,
which can be defined by Eq.
ydiðfgg;uÞ ZTA;RðfgAg;uÞ
TB;RðfgBg;uÞ
is rewritten in the following form:
ydiðfgg;uÞ ZT1;NAC1ðfgg;uÞ
T1;NBC1ðfgBg;uÞ(15)
NA and NB are the layer numbers constituting the soil profiles
of sites A and B, respectively. The parameter vector of the
model is defined as fggZ gAgB
n oand the partial derivatives
of the model function ydi({g}, u) with respect to any model
parameter gj (jZ1, mACmB), where mA and mB are the
number of components in vectors {gA} and {gB}, respect-
ively, are given by:
vydiðfgg;uÞ
vgj
Z1
T1;NBC1ðfgBg;uÞ
vT1;NAC1ðfgAg;uÞ
vgj
KT1;NAC1ðfgAg;uÞ
ðT1;NBC1ðfgBg;uÞÞ2:vT1;NBC1ðfgBg;uÞ
vgj
(16)
In the minimisation algorithm, the partial derivatives are
calculated in two steps:
ð1Þvydiðfgg;uÞ
vgjA
Z1
T1;NBC1ðfgBg;uÞ,
vT1;NAC1ðfgAg;uÞ
vgjA
;
jA Z 1;mA (17a)
ð2Þvydiðfgg;uÞ
vgjB
ZKydiðfgg;uÞ
T1;NBC1ðfgBg;uÞ
vT1;NBC1ðfgBg;uÞ
vgjB
;
jB Z mA;mA CmB (17b)
where vT1;NAC1ðfgAg;uÞ=vgjAand vT1;NBC1ðfgBg;uÞ=vgjB
are
the partial derivatives of amplification functions with respect
to parameters of sites A and B, respectively. In the case of soil
profile overlaying bedrock, the set of model parameters
(vector {g}) is equal to 4NK1 where N is the layers number
of considered soil profile for any site.
4. Validation and applications
4.1. Validation
In order to test the numerical efficiency and the validity of
the present minimisation method, we applied it to the
following two examples.
4.1.1. Identification of characteristics of uniform soil layer
This example consists in identification of characteristics
(thickness h1, damping ratio x1 and shear wave velocity VS1)
of uniform soil layer (Table 1) overlaying a rigid rock

Table 1
Characteristics of uniform soil layer
Parameter Actual Initial estimates Identified
h1(m) 10.0 08.0 08.7
x1(%) 10 15 10
VS1(m/s) 200 190 173
Fig. 4. Accelerations recorded at 22 m depth of Garner Valley site.
Z. Harichane et al. / Soil Dynamics and Earthquake Engineering 25 (2005) 431–438 435
(VS2Z1500 m/s and r2Z2400 kg/m3). In this case, the
identification can be done with respect to the complex form
or with respect to the moduli of the soil amplification function
between free surface and bedrock. To apply this method, it
must get an initial guess for the model parameters. These
estimations as well as the identification results are given in
Table 1. The soil amplification functions corresponding to
actual, initial and identified parameters are compared in
Fig. 2. This figure shows an extremely good agreement
between identified and actual amplification functions but the
identified parameters (h1, x1, VS1) are slightly different to the
actual ones. In other hand, the ratio h1/VS1, initially estimated
to the value 0.042, converges exactly to the actual value 0.05,
about ten iterations.
4.1.2. Experimental validation of the method
This example consists in the validation of the presented
method with experimental data recorded within the Garner
Valley Down Hole Array (GVDA) [21]. The recorded
accelerations at free surface and 22 m depth are plotted in
Figs. 3 and 4. The soil amplification function between free
surface and 22 m depth, computed by mean of spectral ratios
Fig. 2. Amplification function of uniform soil layer.
Fig. 3. Accelerations recorded at free surface of Garner Valley site.
technique is smoothed by a triangular window of 0.5 Hz
width. In Fig. 5, we compare the modulus of smoothed
spectral ratio, the amplification function corresponding to
initial estimates of parameters and the one corresponding to
identified parameters. The minimisation error is about 8%,
for frequencies interval between 0 and 20 Hz.
Fig. 5 shows that the identified amplification function is in
good agreement with the experimental one. The peak
amplitudes are influenced heavily by the damping ratio in
the soil strata. In fact, the damping ratio initially estimated at
3% between 1 and 6 m, 4% between 6 and 9 m and at 1% for
depth greater than 9 m leads to amplification functions for
which the peak amplitudes become flat progressively
according the frequency. The identification algorithm
corrects the values of damping ratio to 2.4% at 8 m depth,
11% at 11.65 m depth and to a value smaller than 0.1%
beyond theses depths. In a previous study on Garner Valley
site, Pecker [21] proposed a possibility to reduce the peak
amplitudes by increasing the damping ratio in the soil strata
which was not retained since it would lead to unrealistically
high values (7–10%), in view of the low input motions and
adopted the possibility of having a rate dependent damping
(xZ0.086f 0.68) for the soil. In return, the corrected values of
damping ratio by mean of the identification algorithm give
peak amplitudes of amplification as well as the corresponding
natural frequencies (error smaller than 2%) closer to the
actual values as illustrated in Table 2.
The identified shear wave velocities are plotted in Fig. 6
versus depth H below the ground surface. The identified
design velocity profile (VS(m/s)ZKH0.28(m), KZ117 for
H%14 m and KZ160 beyond 14 m) with an excellent
Fig. 5. Amplification function between 0 and 22 m of Garner Valley site.

Table 2
Comparison of peak amplitudes of amplification functions and corresponding natural frequencies of Garner Valley site
Frequency’s no Initial estimates Experimental Identified
f (Hz) Peaks Amplitude f (Hz) Peaks amplitude f (Hz) Peaks amplitude
1 3.2959 24.3589 2.7466 8.3251 2.9297 13.4036
2 8.4229 13.9359 8.8501 10.9124 8.7891 14.3918
3 13.4888 9.9006 13.6719 36.0179 13.6719 37.8450
4 18.2495 8.2616 18.0054 11.4693 18.0054 9.2198
Z. Harichane et al. / Soil Dynamics and Earthquake Engineering 25 (2005) 431–438436
coefficient of correlation (0.94) for H%14 m is also presented
in Fig. 6. The identified velocity profile has a similar form to
the Pecker’s [21] design profile (VS(m/s)ZKH0.25(m), KZ135 for H%14 m and KZ150 beyond 14 m) obtained by
matching the data (seismic refraction, SPT, laboratory tests).
Fig. 6 shows that identified velocities are in good correlation
with laboratory and in situ results for depth smaller than
14 m. Beyond this depth, the identified velocities are lightly
scattered with regard to the Pecker’s design profile.
In the identification of the different parameters of the
adopted model and the identification of the corresponding
amplification functions of Garner Valley site, we have used
single recorded component motion at free surface (0 m) and
the corresponding one at rock (22 m). Obviously, compi-
lation of dense recordings leads to better identified results. In
other hand, the identification approach seems to identify well
the ratios h/VS of the different layers of the strata and the
corresponding amplification functions (Fig. 2), nevertheless
its sensibility to the high number of parameters (35
parameters in this example).
Fig. 6. Shear wave velocity profiles of Garner Valley site.
Fig. 7. Accelerations recorded at free surface of site of Hussein Dey city.
4.2. Applications
On May 21, 2003, a 6.8 magnitude earthquake hit northern
Algeria, severely damaging the city of Boumerdes (about
50 km east of Algiers), the capital city of Algiers, and a
number of small cities in Algiers–Boumerdes region [1]. In
order to contribute in understanding earthquake hazard, we
aim, in the applications below, to determine the soil profile
characteristics that should be taken into consideration in
detailed microzonation studies in most of the northern
regions of Algeria, particularly the city of Algiers.
Since the mainshock, several records of strong ground
motions were recorded by the Algerian’s strong motion
instrumentation network that is operated and maintained by
the National Earthquake Engineering Research Centre (CGS)
in and around the epicentral region. Because the E–W
acceleration components were consistently larger than the N–
S components for all recording stations [1], those correspond-
ing to the city of Algiers (Figs. 7–9), are used in the
simultaneous identification of soil profile characteristics
(layer thickness, damping ratio, shear wave velocity and
unit weight) of two sites by minimizing on the modulus
Fig. 8. Accelerations recorded at free surface of site of Dar Elbeida city.
Fig. 9. Accelerations recorded at free surface of site of Kouba city.

Fig. 11. Comparison between the spectral ratio of the sites of Kouba and
Dar Elbeida cities and the corresponding identified amplification function
ratio.
Table 4
Soil profile Characteristics of the site of Dar Elbeida city
Layers
no
Depth
(m)
Layer (m)
Thickness
Damping
Ratio (%)
Shear Wave
Velocity
(m/s)
Unit
Weight
(kg/m3)
1 01.6 1.6 4.9 184 1211
2 06.4 4.8 3.7 291 1182
3 09.6 3.2 2.4 319 1273
4 16.7 7.1 3.4 395 1000
5 – Half-space 0.0 450 1500
Fig. 10. Comparison between the spectral ratio of the sites of Hussein Dey
and Dar Elbeida cities and the corresponding identified amplification
function ratio.
Table 3
Soil profile Characteristics of the site of Hussein Dey city
Layers
no
Depth
(m)
Layer (m)
thickness
Damping
ratio (%)
Shear wave
velocity (m/s)
Unit weight
(kg/m3)
1 01.9 1.9 2.7 261 758
2 05.9 4.0 1.9 306 1129
3 09.1 3.2 1.9 285 989
4 11.8 2.7 2.6 284 1442
5 17.6 5.8 2.2 408 1000
6 – Half-space 0.0 450 500
Z. Harichane et al. / Soil Dynamics and Earthquake Engineering 25 (2005) 431–438 437
of smoothed spectral ratios of three sites two by two
(Figs. 10–12). The results of identification of soil profile
characteristics of three sites are presented in Tables 3–5. The
parameter a is considered equal to the value 1.
5. Conclusion
In the present paper, an approach using system identifi-
cation and free field records, for determining soil profile
characteristics, is presented. A one-dimensional model is
used to develop theoretical soil amplification function for two
sites in terms of the different characteristics (thickness,
damping ratio, shear wave velocity and unit weight) of the
layers constituting the soil profiles. This function is then
smoothed with respect to the one obtained from experimental
Fig. 12. Comparison between the spectral ratio of the sites of Kouba and
Hussein Dey cities and the corresponding identified amplification function
ratio.
data by using the least squares minimization technique in the
frequency domain. The identification of the parameters is
performed by solving, numerically, a non linear optimisation
problem.
The validity of this method is demonstrated by using
experimental data recorded within the Garner Valley Down
Hole Array (GVDA).
The new approach was applied for identifying simul-
taneously soil profile characteristics of sites using only a
single soil acceleration record at the free surface of each site.
This procedure has permitted us to identify soil profile
characteristics of sites using strong ground motions data
recorded during the recent Boumerdes earthquake of May 21,
2003.
This approach offers the capability for more complete and
rigorous characterisation of sites serving as support for
constructions at reduced cost compared with the classical
approach using laboratory and in situ tests, when ground
motion data from previous earthquakes are available. The
results from identification also contribute to a better under-
standing of earthquake hazard.
Table 5
Soil profile Characteristics of the site of Kouba city
Layers
no
Depth
(m)
Layer (m)
thickness
Damping
ratio (%)
Shear wave
velocity
(m/s)
Unit
weight
(kg/m3)
1 01.8 1.8 1.5 222 1050
2 05.0 3.2 6.2 285 1373
3 07.9 2.9 3.9 343 993
4 11.8 3.9 7.4 355 1207
5 18.0 6.2 2.0 407 1000
6 – Half-space 0.0 450 1500
Z. Harichane et al. / Soil Dynamics and Earthquake Engineering 25 (2005) 431–438438
References
[1] Bendimerad F. The Boumerdes, Algeria, Earthquake of May 21, 2003,
EERI Learning from Earthquakes Reconnaissance Report 2003.
[2] Chavez-Garcia FJ, Faccioli E. Complex site effects and building codes:
making the leap. J Seismol 2000;4(1):23–40.
[3] Finn WDL, Wightma A. Ground motion amplification factors for the
proposed 2005 edition of the National Building Code of Canada. Can
J Civ Eng 2003;30:272–8.
[4] Adams J, Atkinson G. Development of seismic hazard maps for the
proposed 2005 edition of the National Building Code of Canada. Can
J Civ Eng 2003;30:255–71.
[5] Modaressi H, Mellal A, Bour M. Evaluation of seismic response spectra
using a unified numerical approach. Proceedings of the 11th European
Conference on Earthquake Engineering. Amsterdam: Balkema; 1998.
[6] Lussou P, Bard YP, Modaressi H, Gariel JC. Quantification of soil non-
linearity based on simulation. Soil Dyn Earthquake Eng 2000;20(5–8):
509–16.
[7] Sincraian MV, Oliveira CS. Nonlinear response of a volcanic hill using
the finite element method. Soil Dyn Earthquake Eng 2000;20(1–4):
145–54.
[8] Triantafyllidis P, Hatzidimitriou PM, Sahadolc P. 1-D theoretical
modelling for site effect estimations in Thessaloniki: comparison with
observations. Pure Geophy 2001;158:2333–47.
[9] Ojeda A, Escallon J. Comparison between different techniques for
evaluation of predominant periods using strong ground motion records
and microtemors in Pereira Colombia. Soil Dyn Earthquake Eng 2000;
20(1–4):137–43.
[10] Moya A, Schmidt V, Segura C, Boschini I, Atakan K. Empirical
evaluation of site effects in the metropolitan area of San Jose, Costa
Rica. Soil Dyn Earthquake Eng 2000;20(1–4):177–85.
[11] Dimitriu P, Theodulidis N, Hatzidimitriou P, Anastasiadis A. Sediment
non-linearity and attenuation of seismic waves: a study of accelero-
grams from Lefkas, western Greece. Soil Dyn Earthquake Eng 2001;
21(1):63–73.
[12] Ozudogru K, Hartikainen J, Kolisoja P. Combined laboratory testing
method to determine dynamic properties of geological material.
Proceedings of the 11th European conference on earthquake engineer-
ing. Amsterdam: Balkema; 1998.
[13] Vucetic M. Soil properties and seismic response. Proceedings of the
11th European conference on earthquake engineering. Amsterdam:
Balkema; 1998.
[14] Elgamal AW, Zeghal M, Tang HT, Stepp JC. Lotung downhole array. I:
evaluation of site dynamic properties. J Geotech Eng 1995;121(6):
350–62.
[15] Ghayamghamian MR, Motosaka M. Identification of dynamic soil
properties using vertical array recordings. Proceedings of the fourth
international conference on earthquake geotechnical engineering 2001.
[16] Kurita T, Matsui K. Sensitivity analysis on measurement noise in the
identification of soil properties from vertical array observation data.
Earthquake Eng Struct Dyn 1998;26(9):951–65.
[17] Mikami A, Sawada T, Ekawa T. Identification of non-linear and non-
stationary soil properties during the 1995 Hyogoken-nanbu earthquake.
Soil Dyn Earthquake Eng 2003;23(4):279–86.
[18] Loh CH, Su GW, Yeh CS. Development of Stochastic ground
movement: study of SMART-1 array data. Soil Dyn Earthquake Eng
1989;8(1):22–31.
[19] Loh CH, Yeh CS. Field evaluation and site response identification at
SMART-1 site. Soil Dyn Earthquake Eng 1992;11(6):347–56.
[20] Glaser SD, Baise LG. System identification estimation of soil properties
at the lotung site. Soil Dyn Earthquake Eng 2000;19(7):521–31.
[21] Pecker A. Validation of small strain properties from recorded weak
seismic motions. Soil Dyn Earthquake Eng 1995;14(6):399–408.
[22] Afra H. Identification du comportement sismique de batiments a partir
de leurs reponses accelerometriques, Thesis of Ecole Nationale des
Ponts et Chausses de Paris, France, 1991.
[23] Afra H, Pecker A. Calculation of free field response spectrum of a non-
homogeneous soil deposit from bed rock response spectrum. Soil Dyn
Earthquake Eng 2002;22(2):157–65.
[24] Press WH, Flannery BP, Teukolsky SA, Vetterling WT. Numerical
recipes, the art of scientific computing. Cambridge: Cambridge
University Press; 1992.
[25] Wolf JP. Dynamic soil-structure interaction. New Jersey: Prentice-Hall;
1985.