An Experimental Study of the Web Acceptance Model
296
Assessing the Effectiveness of Corporate Web Sites: An Experimental Study of the Web Acceptance Model A thesis submitted in fulfilment of the requirements for the award of the degree of DOCTOR OF PHILOSOPHY from THE UNIVERSITY OF WOLLONGONG by KOO-WON SUH MBA (Honours, Korea University) MA (University of Western Sydney) BBA (Honours, Korea University) SCHOOL OF MANAGEMENT, MARKETING, AND EMPLOYMENT RELATIONS 2003
-
Upload
khangminh22 -
Category
Documents
-
view
0 -
download
0
Transcript of An Experimental Study of the Web Acceptance Model
Assessing the Effectiveness of Corporate Web Sites: An
Experimental Study of the Web Acceptance Model
A thesis submitted in fulfilment of the requirements for the award of the degree of
DOCTOR OF PHILOSOPHY
from
THE UNIVERSITY OF WOLLONGONG
by
KOO-WON SUH
MBA (Honours, Korea University) MA (University of Western Sydney) BBA (Honours, Korea University)
SCHOOL OF MANAGEMENT, MARKETING, AND EMPLOYMENT RELATIONS
2003
ii
Certification
I, Koo-Won Suh, declare that this dissertation, submitted in fulfilment of the
requirements for the award of Doctor of Philosophy, in the School of Management,
Marketing, and Employment Relations, University of Wollongong, is wholly my own
work unless otherwise referenced or acknowledged. The document has not been
submitted for qualifications at any other academic institution.
Koo-Won Suh November 2003
iii
Abstract
There has been an ongoing need for designing and assessing corporate Web sites as
important marketing communication tools. Typically, most research on Web site
effectiveness has adopted traditional advertising evaluation models. A fundamental
shortcoming of this approach is that it does not provide much information about user
interaction. As corporate Web sites are new interactive media and Web user
characteristics are far different from those of traditional communication media, new
approaches should be developed.
To overcome the inherent shortcomings of previous research, this study has developed a
new theoretical framework, the Web Acceptance Model (WAM), which explores
customer acceptance and uses of corporate Web sites. This study took an
interdisciplinary approach involving theory derived from Marketing, Communication,
Information Systems (IS), Education, and Psychology.
The model is premised on two central phenomena of Web-Mediated Communication
(WMC): social interaction between Web sites and users, and the active participation of
users. In the model, the phenomenon of social interaction is captured by the inclusion of
moderating variables: affective and task-related interaction which can help explain
“why” a specific type of Web site is likely to be more effective. It is unlikely that a
particular type of Web site will be effective all of the time. Therefore, this model also
seeks to explain “when” a Web site is more likely to effective. Individual user
difference as a moderator can help explain “when” and reflects the active role of
iv
customers in WMC. Finally, the model addresses all three elements of consumer
attitudes i.e., affective, cognitive, and conative.
Specifically, the model includes predictor, moderator, mediator, and criterion variables.
The predictor (independent) variables are Web site content and structure. Content
analysis was used to identify Web site typology in terms of structure and content. It was
necessary to conduct an empirical study of Web site typology, as there was no published
research on this topic. Empirically derived typology may better explain real world
phenomena than a conceptually developed typology. Through content analysis of
around 386 corporate Web sites, this study identified two types of Web site structure
(“hypermedia” and “static image”) and two types of content (“integrated
communication” and “basic image”).
The criterion variables, which are the communication effects achieved by a Web site,
are measured in terms of overall attitude toward the Web site and revisit intention.
Among three mediators between the predictor and criterion variables, “social presence”
serves as an affective bridge, while “perceived usefulness” and “perceived ease of use”
serve as cognitive bridges. Finally, Web literacy serves as a moderator, which affects
the direction and strength of the relationships between the predictors and mediators.
The overall purpose of this study was to uncover the distinguishing features of effective
corporate Web sites (i.e., those sites which are seen by users to be attractive, user-
friendly and useful). To do this, the study sought to answer two exploratory questions
and test hypotheses derived from the model. The exploratory questions were: (1) What
content and structural elements are presented on corporate Web sites? and (2) How can
v
corporate Web sites be classified according to their content and structure? These
questions were answered through a preliminary content analysis of corporate Web sites.
Fourteen hypotheses were derived to answer the three experimental research questions:
(1) How do consumers respond to different types of Web site? (2) Do user attitudes
toward corporate Web sites vary according to Web literacy levels? and (3) What
features of corporate Web sites determine revisit intention amongst Web users? The first
five hypotheses addressed how customers respond to different types of Web sites. The
next five hypotheses examined what features of corporate Web sites determine revisit
intention amongst Web users. The final four hypotheses investigated whether user
attitudes toward corporate Web sites vary according to their Web literacy levels. These
hypotheses were tested through a laboratory experiment.
This study employed a 2 (Web site structure) × 2 (Web site content) between-subject
factorial design, with Web literacy serving as a co-variant. Each subject was allowed to
explore only one of four specially constructed Web sites. Subjects were randomly
assigned to each cell. The data was gathered through a self-report instrument, of which
validity and reliability were ensured by a rigorous two-stage pilot test. Empirical
evidence was gathered from one hundred and sixty students at the University of
Wollongong in Australia who were recruited for the experiment. The data was analysed
using the statistical methods of MANCOVA, ANCOVA, ANOVA, Multiple Linear
Regression, and Simple Linear Regression.
In terms of Web site content, it was found that the integrated communication type of
Web site was more effective than the basic information type. The integrated type had
higher social presence and perceived usefulness. In relation to Web site structure, it was
vi
found that the hypermedia type was more effective than the static image type,
generating higher social presence and perceived usefulness. The results of this
investigation suggest that social presence and perceived usefulness were critical factors
that explain “why” a specific type of Web site is more effective than the other type. The
more positive social presence and perceived usefulness were, the higher attitude toward
the Web site was, and in turn, the higher revisit intention was. However, there was no
significant relationship between perceived ease of use and attitude toward the Web site.
It was also concluded that Web literacy moderate the relationship between Web
structure and social presence. For example, people who with low Web literacy
experienced higher differences in social presence between static image type and
hypermedia type than those with high Web literacy.
These results imply that both Web site structure and content had effects on consumer
attitude and the two dimensions of social interaction (i.e., social presence and perceived
usefulness) are critical factors for identifying consumer responses to Web sites. One of
the interesting findings was the importance of an emotional response, meaning that it is
not possible to fully explain consumer behaviour without the understanding of
emotional responses to Web sites.
The Web Acceptance Model provides a new way of conceptualising social interaction,
which is central to WMC, and underlines the importance of an interdisciplinary research
to our understanding of WMC. Therefore, it is hoped that this study will make a
significant contribution to a burgeoning area of research that is of great and increasing
importance to both the discipline and the practice of marketing.
vii
Papers
The following papers and publications have been produced from the research reported in this thesis.
1. Suh, K. and Couchman, P. K. (2003). Measuring consumer responses to corporate Web sites: The development of an instrument. Paper presented at the 2003 Chartered Institute of Marketing (CIM) Inaugural Australian Conference, Sydney, Australia, August 20-22.
2. Suh, K., Couchman, P. K., and Hasan, H. (2003). Understanding Web-mediated
marketing communication: The Web acceptance model. Paper presented at the 2003 Chartered Institute of Marketing (CIM) Inaugural Australian Conference, Sydney, Australia, August 20-22.
3. Suh, K., Couchman, P. K., and Lee, D. (2002). Functions of a corporate Web
site: A cross-national comparison. Unpublished manuscript. Wollongong, Australia: University of Wollongong.
4. Suh, K., Couchman, P. K., and Lee, D. (2002). Empirical classification of Web
structure: A cross-national comparison of corporate Web sites. Unpublished manuscript. Wollongong, Australia: University of Wollongong.
5. Suh, K., Couchman, P. K., and Park, J. (2003). A Web-mediated communication
(WMC) model based on activity theory. Paper presented at the 7th World Multiconference on Systemics, Cybernetic and Informatics (SCI 2003), Orlando, Florida, July 27-29, and TT21C (Transformational Tools for 21st Century Minds), Gold Coast, QLD, Australia, July 27-29.
6. Suh, K., Hasan, H., and Couchman, P. K. (2003). Web-mediated communication
(WMC) and social interaction: A social psychological approach. Paper presented at the 7th World Multiconference on Systemics, Cybernetic and Informatics (SCI 2003), Orlando, Florida, July 27-29, and TT21C (Transformational Tools for 21st Century Minds), Gold Coast, QLD, Australia, July 27-29.
7. Suh, K., Hasan, H., Couchman, P. K., and Lee, D. (2003). Exploring social
interaction in Web-mediated communication. In H. Hasan, I. Verenikina, and E. Gould. (Eds.), Information systems and activity theory volume 3: Expanding the horizon (pp. 141-155). Wollongong, Australia: University of Wollongong Press.
8. Suh, K., Couchman, P. K., Park, J., and Hasan, H. (2003). The application of
activity theory to Web-mediated communication. In H. Hasan, I. Verenikina, and E. Gould. (Eds.), Information systems and activity theory volume 3: Expanding the horizon (pp. 122-140). Wollongong, Australia: University of Wollongong Press.
viii
Acknowledgements
I wish to express my deepest appreciation and gratitude to all the people that have
contributed to the completion of this dissertation. First of all, I had a great fortune to
study under the supervision of Associate Professors Paul K. Couchman and Helen
Hasan. I am very grateful to Associate Professor Paul K. Couchman for his guidance
and encouragement. His profound knowledge of research methodology and insights
enabled me to make significant progress.
I am also very grateful to Associate Professor Helen Hasan for her friendly support and
enthusiasm. Her broad knowledge of alternative perspectives of communication and
information communication technology provided the opportunity to broaden my
knowledge.
I also owe many thanks to Dr. Anne Porter. As my statistical adviser, she provided
statistical advice and alternatives for the analysis of the empirical data.
I also want to thank my former professors at the Korea University, Doo-Hee Lee and
Jong-Won Park, for their guidance and advice throughout the dissertation process.
Academic colleagues who attended a the 2003 Chartered Institute of Marketing (CIM)
Inaugural Australian Conference, the 7th World Multiconference on Systemics,
Cybernetic and Informatics (SCI 2003), Transformational Tools for 21st Century Minds
(TT21C), and the Workshop on Activity Theory and Information Systems, where some

ix
parts of this research were presented, also provided useful comments and suggestions
for this dissertation.
I also wish to thank the University of Wollongong, which has provided scholarship, a
stimulating environment, and friendly colleagues and staff.
A very special thanks goes to my wife, Myung-Sook Jo, for encouraging and supporting
me. I cannot forget to thank my children, Song-Yi and Dong-Jun, have understood and
respected me without complaints. I also would like to thank my mother, brothers,
sisters-in-law, and nieces, who have believed my ability and patiently waited for me.
Finally, I dedicate this dissertation to my father, who has always inspired me to
challenge myself.
x
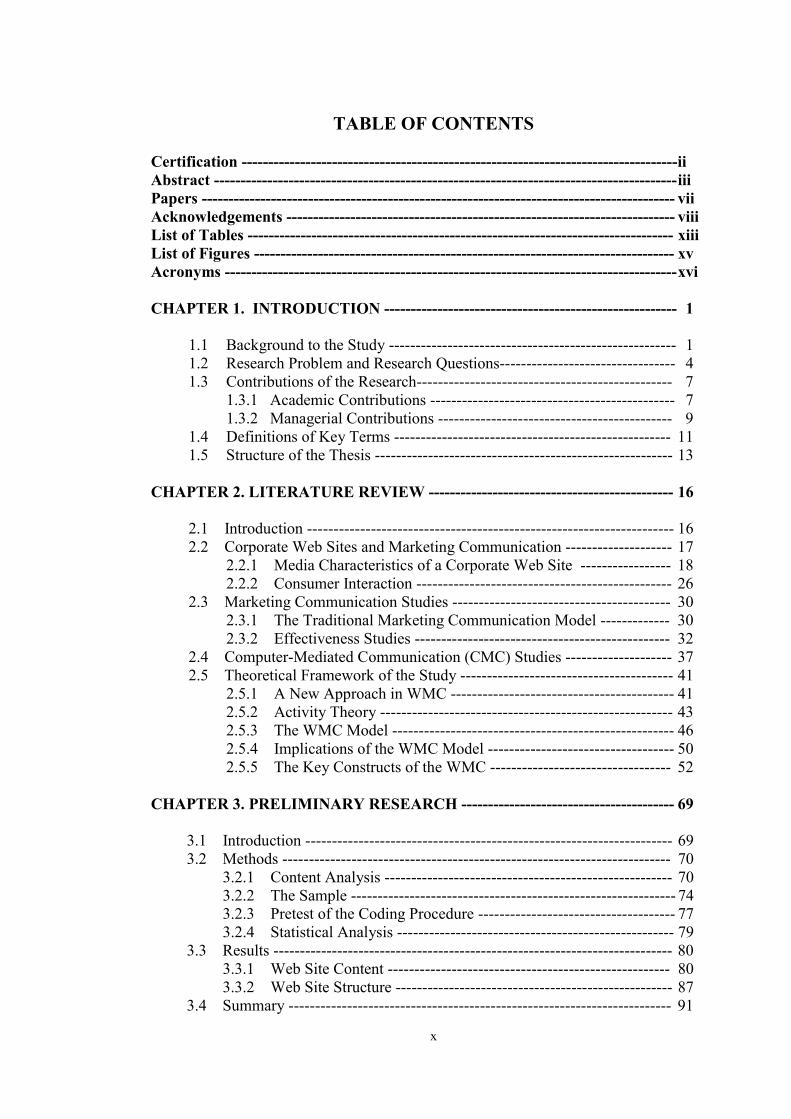
TABLE OF CONTENTS Certification ----------------------------------------------------------------------------------ii Abstract --------------------------------------------------------------------------------------- iii Papers ----------------------------------------------------------------------------------------- vii Acknowledgements ------------------------------------------------------------------------- viii List of Tables -------------------------------------------------------------------------------- xiii List of Figures ------------------------------------------------------------------------------- xv Acronyms ------------------------------------------------------------------------------------- xvi CHAPTER 1. INTRODUCTION ------------------------------------------------------- 1
1.1 Background to the Study ------------------------------------------------------ 1 1.2 Research Problem and Research Questions--------------------------------- 4 1.3 Contributions of the Research------------------------------------------------ 7
1.3.1 Academic Contributions ---------------------------------------------- 7 1.3.2 Managerial Contributions -------------------------------------------- 9
1.4 Definitions of Key Terms ---------------------------------------------------- 11 1.5 Structure of the Thesis -------------------------------------------------------- 13
CHAPTER 2. LITERATURE REVIEW ---------------------------------------------- 16
2.1 Introduction --------------------------------------------------------------------- 16 2.2 Corporate Web Sites and Marketing Communication -------------------- 17
2.2.1 Media Characteristics of a Corporate Web Site ----------------- 18 2.2.2 Consumer Interaction ------------------------------------------------ 26
2.3 Marketing Communication Studies ----------------------------------------- 30 2.3.1 The Traditional Marketing Communication Model ------------- 30 2.3.2 Effectiveness Studies ------------------------------------------------ 32
2.4 Computer-Mediated Communication (CMC) Studies -------------------- 37 2.5 Theoretical Framework of the Study ---------------------------------------- 41
2.5.1 A New Approach in WMC ------------------------------------------ 41 2.5.2 Activity Theory ------------------------------------------------------- 43 2.5.3 The WMC Model ----------------------------------------------------- 46 2.5.4 Implications of the WMC Model ----------------------------------- 50 2.5.5 The Key Constructs of the WMC ---------------------------------- 52
CHAPTER 3. PRELIMINARY RESEARCH ---------------------------------------- 69 3.1 Introduction --------------------------------------------------------------------- 69 3.2 Methods ------------------------------------------------------------------------- 70 3.2.1 Content Analysis ------------------------------------------------------ 70 3.2.2 The Sample ------------------------------------------------------------- 74 3.2.3 Pretest of the Coding Procedure ------------------------------------- 77 3.2.4 Statistical Analysis ---------------------------------------------------- 79
3.3 Results --------------------------------------------------------------------------- 80 3.3.1 Web Site Content ----------------------------------------------------- 80 3.3.2 Web Site Structure ---------------------------------------------------- 87
3.4 Summary ------------------------------------------------------------------------ 91
xi
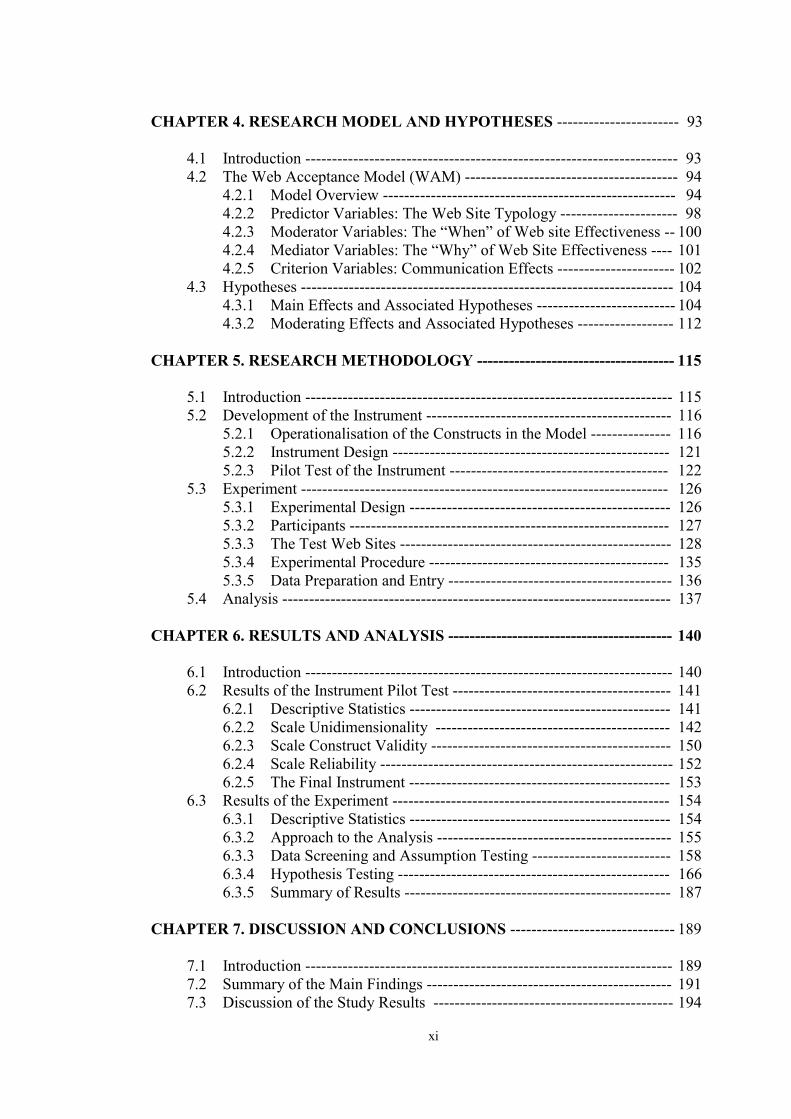
CHAPTER 4. RESEARCH MODEL AND HYPOTHESES ----------------------- 93 4.1 Introduction ---------------------------------------------------------------------- 93 4.2 The Web Acceptance Model (WAM) ---------------------------------------- 94 4.2.1 Model Overview ------------------------------------------------------- 94 4.2.2 Predictor Variables: The Web Site Typology ---------------------- 98 4.2.3 Moderator Variables: The “When” of Web site Effectiveness -- 100 4.2.4 Mediator Variables: The “Why” of Web Site Effectiveness ---- 101 4.2.5 Criterion Variables: Communication Effects ---------------------- 102 4.3 Hypotheses ---------------------------------------------------------------------- 104 4.3.1 Main Effects and Associated Hypotheses -------------------------- 104 4.3.2 Moderating Effects and Associated Hypotheses ------------------ 112 CHAPTER 5. RESEARCH METHODOLOGY ------------------------------------- 115 5.1 Introduction --------------------------------------------------------------------- 115 5.2 Development of the Instrument ---------------------------------------------- 116 5.2.1 Operationalisation of the Constructs in the Model --------------- 116 5.2.2 Instrument Design ---------------------------------------------------- 121 5.2.3 Pilot Test of the Instrument ----------------------------------------- 122 5.3 Experiment --------------------------------------------------------------------- 126 5.3.1 Experimental Design ------------------------------------------------- 126 5.3.2 Participants ------------------------------------------------------------ 127 5.3.3 The Test Web Sites --------------------------------------------------- 128 5.3.4 Experimental Procedure --------------------------------------------- 135 5.3.5 Data Preparation and Entry ------------------------------------------ 136 5.4 Analysis ------------------------------------------------------------------------- 137 CHAPTER 6. RESULTS AND ANALYSIS ------------------------------------------ 140 6.1 Introduction --------------------------------------------------------------------- 140 6.2 Results of the Instrument Pilot Test ----------------------------------------- 141 6.2.1 Descriptive Statistics ------------------------------------------------- 141 6.2.2 Scale Unidimensionality -------------------------------------------- 142 6.2.3 Scale Construct Validity --------------------------------------------- 150 6.2.4 Scale Reliability ------------------------------------------------------- 152 6.2.5 The Final Instrument ------------------------------------------------- 153
6.3 Results of the Experiment ---------------------------------------------------- 154 6.3.1 Descriptive Statistics ------------------------------------------------- 154 6.3.2 Approach to the Analysis -------------------------------------------- 155 6.3.3 Data Screening and Assumption Testing -------------------------- 158 6.3.4 Hypothesis Testing --------------------------------------------------- 166 6.3.5 Summary of Results -------------------------------------------------- 187 CHAPTER 7. DISCUSSION AND CONCLUSIONS ------------------------------- 189 7.1 Introduction --------------------------------------------------------------------- 189
7.2 Summary of the Main Findings ---------------------------------------------- 191 7.3 Discussion of the Study Results --------------------------------------------- 194
xii
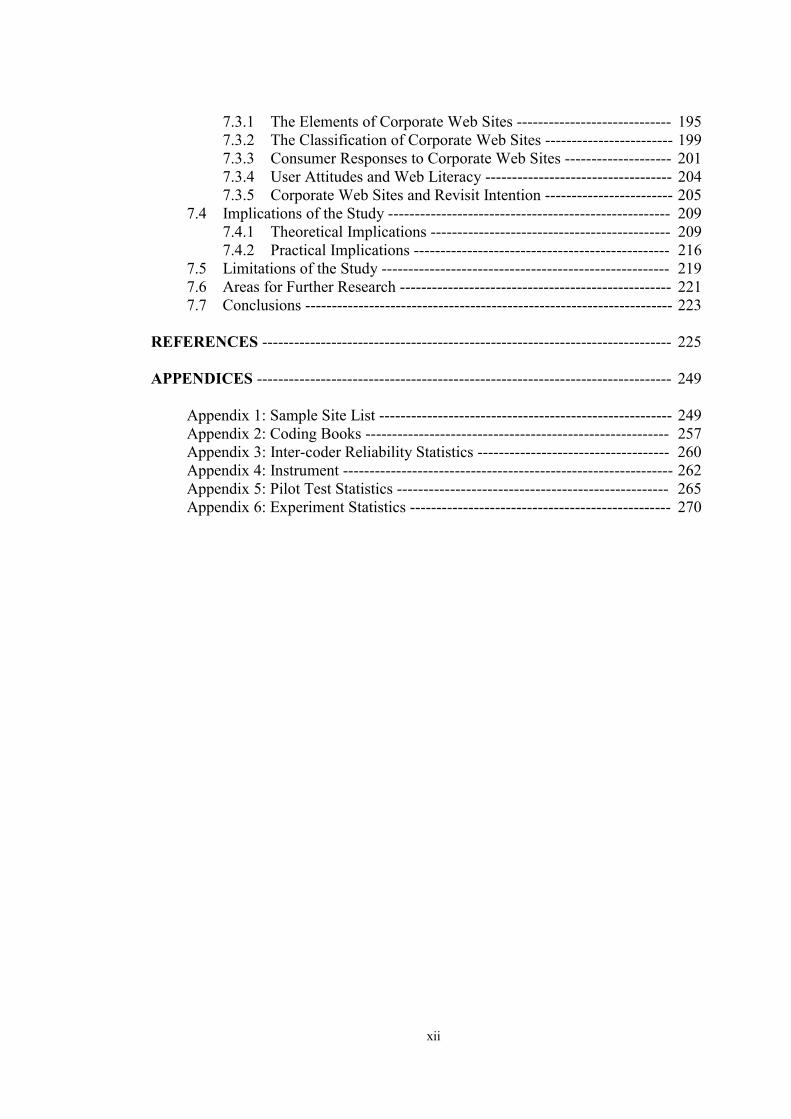
7.3.1 The Elements of Corporate Web Sites ----------------------------- 195 7.3.2 The Classification of Corporate Web Sites ------------------------ 199 7.3.3 Consumer Responses to Corporate Web Sites -------------------- 201 7.3.4 User Attitudes and Web Literacy ----------------------------------- 204 7.3.5 Corporate Web Sites and Revisit Intention ------------------------ 205 7.4 Implications of the Study ----------------------------------------------------- 209 7.4.1 Theoretical Implications --------------------------------------------- 209 7.4.2 Practical Implications ------------------------------------------------ 216 7.5 Limitations of the Study ------------------------------------------------------ 219 7.6 Areas for Further Research --------------------------------------------------- 221 7.7 Conclusions --------------------------------------------------------------------- 223 REFERENCES ----------------------------------------------------------------------------- 225 APPENDICES ------------------------------------------------------------------------------ 249 Appendix 1: Sample Site List ------------------------------------------------------- 249 Appendix 2: Coding Books --------------------------------------------------------- 257 Appendix 3: Inter-coder Reliability Statistics ------------------------------------ 260 Appendix 4: Instrument -------------------------------------------------------------- 262 Appendix 5: Pilot Test Statistics --------------------------------------------------- 265 Appendix 6: Experiment Statistics ------------------------------------------------- 270
xiii
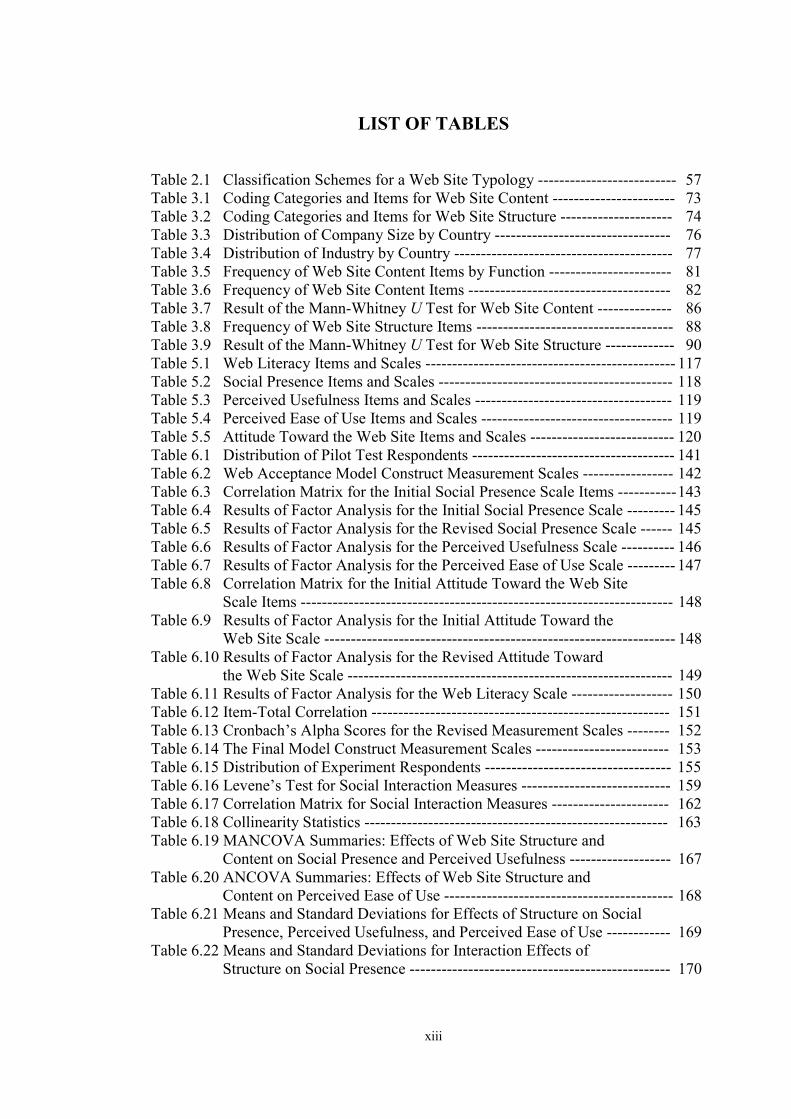
LIST OF TABLES Table 2.1 Classification Schemes for a Web Site Typology -------------------------- 57 Table 3.1 Coding Categories and Items for Web Site Content ----------------------- 73 Table 3.2 Coding Categories and Items for Web Site Structure --------------------- 74 Table 3.3 Distribution of Company Size by Country --------------------------------- 76 Table 3.4 Distribution of Industry by Country ----------------------------------------- 77 Table 3.5 Frequency of Web Site Content Items by Function ----------------------- 81 Table 3.6 Frequency of Web Site Content Items -------------------------------------- 82 Table 3.7 Result of the Mann-Whitney U Test for Web Site Content -------------- 86 Table 3.8 Frequency of Web Site Structure Items ------------------------------------- 88 Table 3.9 Result of the Mann-Whitney U Test for Web Site Structure ------------- 90 Table 5.1 Web Literacy Items and Scales ----------------------------------------------- 117 Table 5.2 Social Presence Items and Scales -------------------------------------------- 118 Table 5.3 Perceived Usefulness Items and Scales ------------------------------------- 119 Table 5.4 Perceived Ease of Use Items and Scales ------------------------------------ 119 Table 5.5 Attitude Toward the Web Site Items and Scales --------------------------- 120 Table 6.1 Distribution of Pilot Test Respondents -------------------------------------- 141 Table 6.2 Web Acceptance Model Construct Measurement Scales ----------------- 142 Table 6.3 Correlation Matrix for the Initial Social Presence Scale Items ----------- 143 Table 6.4 Results of Factor Analysis for the Initial Social Presence Scale --------- 145 Table 6.5 Results of Factor Analysis for the Revised Social Presence Scale ------ 145 Table 6.6 Results of Factor Analysis for the Perceived Usefulness Scale ---------- 146 Table 6.7 Results of Factor Analysis for the Perceived Ease of Use Scale --------- 147 Table 6.8 Correlation Matrix for the Initial Attitude Toward the Web Site Scale Items ---------------------------------------------------------------------- 148 Table 6.9 Results of Factor Analysis for the Initial Attitude Toward the Web Site Scale ------------------------------------------------------------------ 148 Table 6.10 Results of Factor Analysis for the Revised Attitude Toward the Web Site Scale ------------------------------------------------------------- 149 Table 6.11 Results of Factor Analysis for the Web Literacy Scale ------------------- 150 Table 6.12 Item-Total Correlation -------------------------------------------------------- 151 Table 6.13 Cronbach’s Alpha Scores for the Revised Measurement Scales -------- 152 Table 6.14 The Final Model Construct Measurement Scales ------------------------- 153 Table 6.15 Distribution of Experiment Respondents ----------------------------------- 155 Table 6.16 Levene’s Test for Social Interaction Measures ---------------------------- 159 Table 6.17 Correlation Matrix for Social Interaction Measures ---------------------- 162 Table 6.18 Collinearity Statistics --------------------------------------------------------- 163 Table 6.19 MANCOVA Summaries: Effects of Web Site Structure and Content on Social Presence and Perceived Usefulness ------------------- 167 Table 6.20 ANCOVA Summaries: Effects of Web Site Structure and Content on Perceived Ease of Use ------------------------------------------- 168 Table 6.21 Means and Standard Deviations for Effects of Structure on Social Presence, Perceived Usefulness, and Perceived Ease of Use ------------ 169 Table 6.22 Means and Standard Deviations for Interaction Effects of Structure on Social Presence ------------------------------------------------- 170
xiv
Table 6.23 Means and Deviations for Effects of Content on Social Presence, Perceived Usefulness, and Perceived Ease of Use ---------------------------------------------------------------------- 172 Table 6.24 Means and Standard Deviations for Interaction Effects of Content on Perceived Ease of Use ------------------------------------------- 173 Table 6.25 Results of Multiple Regression Analysis for Web Literacy -------------- 176 Table 6.26 Moderator Effects of Web Literacy ----------------------------------------- 177 Table 6.27 Interaction Effect of Web Literacy (High vs. Low) ----------------------- 179 Table 6.28 Means and Standard Deviations for Interaction Effect of Web Literacy on Social Presence -------------------------------------------- 180 Table 6.29 Means and Standard Deviations for Interaction Effect of Structure on Social Presence ---------------------------------------------- 181 Table 6.30 Results of Multiple Linear Regression: Social Interaction and Attitude Toward the Web Site ------------------------------------------- 183 Table 6.31 Results of Simple Linear Regression: Perceived Usefulness and Perceived Ease of Use ---------------------------------------------------- 186 Table 6.32 Results of Simple Linear Regression: Attitude Toward the Web Site and Revisit Intention ----------------------------------------------- 187 Table 7.1 Results of Hypothesis Tests -------------------------------------------------- 192
xv
LIST OF FIGURES Figure 1.1 Structure of the Thesis --------------------------------------------------------- 13 Figure 2.1 Multimedia Elements of a Web Site ----------------------------------------- 19 Figure 2.2 Shannon and Weaver’s Model of Communication ------------------------ 31 Figure 2.3 Basic Mediation Model -------------------------------------------------------- 45 Figure 2.4 Basic Elements of WMC ------------------------------------------------------ 47 Figure 2.5 The WMC Model -------------------------------------------------------------- 49 Figure 2.6 Process of Mediated Communication --------------------------------------- 63 Figure 3.1 Dendrogram Using Ward Method ------------------------------------------- 84 Figure 3.2 Dendrogram Using Average Linkage (Within Group) -------------------- 89 Figure 4.1 The proposed Web Acceptance Model (WAM) --------------------------- 96 Figure 4.2 Main Effects and Associated Hypotheses ---------------------------------- 105 Figure 4.3 Moderating Effects and Associated Hypotheses -------------------------- 112 Figure 5.1 Experimental Design ---------------------------------------------------------- 127 Figure 5.2 Design of Test Web Sites ----------------------------------------------------- 130 Figure 5.3 Unibel-1 Home Page ----------------------------------------------------------- 131 Figure 5.4 Unibel-2 Home Page ----------------------------------------------------------- 132 Figure 5.5 Unibel-3 Home Page ----------------------------------------------------------- 133 Figure 5.6 Unibel-4 Home Page ----------------------------------------------------------- 134 Figure 5.7 Experimental Procedure ------------------------------------------------------- 136 Figure 6.1 Two Phases of Analysis ------------------------------------------------------- 156 Figure 6.2 Research Model and Hypotheses -------------------------------------------- 166 Figure 6.3 Line Graph of Interaction Effect: Structure vs. Perceived Ease of Use --------------------------------------------------------- 171 Figure 6.4 Lind Graph of Interaction Effect: Content vs. Perceived Ease of Use --------------------------------------------------------- 174 Figure 6.5 Line Graph of Interaction Effect: Web Literacy x Content -------------- 178 Figure 6.6 Line Graph for Moderator Effect: Web Literacy (Two Levels) --------- 180 Figure 6.7 Line Graph of Interaction Effect: Web Literacy x Structure ------------- 181 Figure 7.1 Revised Web Acceptance Model (WAM) ---------------------------------- 194
xvi
ACRONYMS ANCOVA Analysis of Covariance ANOVA Analysis of Variance AWS Attitude Toward the Web Site CMC Computer-Mediated Communication HCI Human Computer Interaction IMC Integrated Marketing Communication IS Information Systems ISIC International Standard Industrial Classification MANCOVA Multiple Analysis of Covariance MANOVA Multiple Analysis of Variance PU Perceived Usefulness PEOU Perceived Ease of Use RI Revisit Intention SP Social Presence WAM Web Acceptance Model Web The World Wide Web WMC Web-Mediated Marketing Communication or Web-Mediated Communication
1
CHAPTER 1. INTRODUCTION
1.1 Background to the Study
The “World Wide Web” (usually abbreviated to simply “the Web”), the result of a
convergence between information technology and telecommunication technology, has
become an important marketing communication medium. The Web, which is accessible
through millions of networked computers around the world, is a medium which enables
communication among diverse communities of users. Given the extensive reach of this
new communication medium, the establishment of a presence on the Web through a
corporate Web site has increasingly become an important marketing tool for companies
today. The corporate Web site is a locus where a dynamic interaction can occur between
a firm and its actual or potential customers. There is no doubt that, in contrast to
traditional marketing communication media such as the mass media and television, the
corporate Web site offers major advantages by facilitating real-time, two-way
communication between firms and customers. Furthermore, the very nature of the Web
site – with its hyperlinks and multi-media capabilities – enables firms to perform
different marketing communication activities by delivering many types of information
in a readily-accessible form to a broader range of target audiences. Thus, it can be
argued that the Web has brought about a “new paradigm” for marketing
communication.
As a new and increasingly pervasive marketing communication medium, the Web has
two distinctive features. The first is its hyperlinks capability through which users
2
navigate and obtain information on the Web. It is because of this capability that
communication through the Web is characterised by interactivity, i.e. users do not just
receive information through this medium, rather they interact with the Web. Web users
can choose what information they access and where they access it, as well as their
viewing time. They can control the order in which they access information, for example
by deciding where to start and whether to skip a particular element of a page or site. In
other words, they can browse the Web at their own pace. As a result, Web users
experience the feeling that they are in control (Markham, 1998). The Web also provides
a real time feedback function. For instance, unlike traditional mass media, the Web
enables firms and consumers to reciprocally communicate through facilities like email
or bulletin boards. After all, Web users can control their communication environment.
A second distinctive feature of the Web is its multi-modality, i.e. its multi-media nature
involving the use of text, images, sound and moving images (including video) which
can provide richer means for the presentation of information. When marketing
information is presented using this multi-modality capability, customers can become
more interested in and engaged with the message.
The importance of the Web features of interactivity and multi-modality to marketing
communication is that they can enhance learning, understanding, mental engagement
and user satisfaction as many studies have shown (e.g., Clark, 1992; Dennis and
Kinney, 1998; Huang, 1999; Kiesler, Zubrow, Moses, and Geller, 1985, Walther, 1992).
Furthermore, these features help create a sense of community among users and
influence the social dynamics of communication within and across the diverse
communities so created. As a marketing communication medium, therefore, the Web
has the potential to create richly interconnected virtual communities or marketplaces,
3
where firms and consumers can engage in different forms of interaction, including
purchase transactions.
Another important aspect of the Web site as a marketing communication medium is its
versatility. A corporate Web site can fulfill a range of functions, including advertising,
public relations, sales promotions, customer service, and online selling. A number of
studies have found that corporate Web sites typically perform many functions other than
advertising (e.g., Cockburn and Wilson, 1996; Deans and McKinney, 1997; Perry and
Bodkin, 2000), and it has been claimed that the corporate Web site is an effective tool
for integrated marketing communication (e.g., Suh, Couchman, and Lee, 2002a). This
multiple function feature of corporate Web sites has important implications for the
assessment of their effectiveness. Different marketing communication tools have
different objectives (e.g., the short-term objectives of a sales promotion versus the
longer term objectives of a public relations exercise), they are aimed at different target
audiences (e.g., the focus of advertising on existing or potential customers versus the
broader audiences of public relations) and involve different types of message. Thus, to
assess a corporate Web site only in terms of traditional advertising effectiveness
measures can be misleading and often inadequate.
The increasing use of corporate Web sites as a marketing communication medium
indicates a need for more detailed studies of this phenomenon, a need that is being
addressed by a rapidly-growing field of research in marketing (e.g., Hoffman and
Novak, 1996; Huizingh, 2000; Perry and Bodkin, 2000). Contributing to this emerging
field, the study reported here introduces a new concept Web-mediated marketing
communication (WMC) to refer to the use of a corporate Web site as a marketing
4
communication tool. It is argued that, as the characteristics of the Web as a
communication medium are quite different from other mass media, WMC should be
treated as significantly different from traditional marketing communication media such
as television advertising. Furthermore, WMC is a distinctive form of computer-
mediated communication in that a corporate Web site delivers not only symbolic
content, such as multi-media and information, but also sensory content which is
experienced by users as a virtual reality (Fogg, 1999). Through such features as
animation, sound and real-time feedback, users can develop the perception that they are
communicating with other people and not just with an impersonal medium. Because of
these distinctive features, a new perspective is required to understand the WMC
phenomenon.
1.2 Research Problem and Research Question
Even though the Web has effected a fundamental paradigm shift in marketing
communication, much of the research on Web marketing communication to date has not
adequately reflected this shift. Therefore, in spite of the burgeoning interest in this
phenomenon, there remain many problems and issues to be addressed. There are two
major shortcomings in many existing studies of Web marketing communication. The
first is a tendency to treat corporate Web sites as just an advertising medium (e.g.,
Novak and Hoffman, 1997; Raman and Leckenby, 1998; Salam, Rao, and Pegels, 1998;
Singh and Dalal, 1999). This is not acceptable given the diversity of marketing
functions a corporate Web site can fulfil, as indicated above. The second shortcoming is
a failure to recognise that Web users are quite different from the audiences of traditional
marketing media. Web users are more active participants in the communication process

5
than in traditional mass media where consumers tend to be more passive recipients of
the communication messages to which they are exposed (Hoffman and Novak, 1996;
Wortring, Kayany, and Forrest, 1996). Firms develop Web sites to meet specific
purposes and consumers explore Web sites according to their own goals, motives and
capabilities (with respect to the latter, given the relative novelty of this medium,
experience and familiarity with the Web varies considerably among users as captured by
the notion of “Web literacy”). The convergence of firm and consumer at a corporate
Web site involves an active interaction, in which Web users have more power compared
to the audience of traditional media. As Wortring et al. (1996) have argued, the
resulting “active consumer” requires a change in perspective toward marketing
communication.
Acknowledging these shortcomings, it can be seen that there is a pressing need to
develop a systematic basis for understanding and assessing WMC. This need was
reinforced in a study by Bush, Bush, and Harris (1998) which revealed that marketing
practitioners build and maintain corporate Web sites without an adequate knowledge of
the Web and its distinctive features. Indeed, at present there is very little reliable
knowledge (i.e., as obtained from systematic empirical studies based on sound
theoretical frameworks) about the factors which determine Web site effectiveness or
even about how marketers interact with consumers via the Web. Exacerbating this
problem, there is also a deficiency of studies on the different types of corporate Web
sites (i.e., in terms of their content and structure) and how these are deployed by firms
to support or realise their marketing strategies. These are the issues and problems on
which this study focused, and the overall aim was to identify the features of effective
corporate Web sites (i.e., those sites which are seen by users to be attractive, user-
6
friendly and useful). To meet this aim, and address the identified shortcomings and
knowledge gaps in the existing research base on WMC, five specific research questions
were formulated for this thesis:
• What content and structural elements are presented on corporate Web sites?
• How can corporate Web sites be classified according to their content and
structure?
• How do consumers respond to different types of corporate Web site?
• Do user attitudes towards corporate Web sites vary according to Web literacy
levels?
• What features of corporate Web sites determine revisit intention among Web
users?
To answer these questions, the thesis adopted a two-phased approach: a preliminary
study addressing the first two questions (reported in Chapter 3) sought to develop a
Web site typology, and this was followed by the main experimental phase which -
through the formulation and testing of a theoretical model - addressed the other three
questions. The two-phased approach to addressing the research questions was adopted
for the following reasons. Firstly, with respect to the classification of corporate Web
sites, it was considered that an empirically-derived typology (i.e., based on a content
analysis of existing Web sites) was necessary given the major shortcomings of previous
7
studies in this area. Secondly, an experiment was chosen to test the theoretical model
because this method is widely accepted among social and behavioural scientists for its
ability to make robust claims about causal relationships (e.g., Boruch, 2001; Bryman,
1989).
1.3 Contributions of the Research
The study reported here makes both academic and managerial contributions, as
discussed in the following sections.
1.3.1 Academic Contributions
Within the academic discipline of Marketing, the study makes a number of significant
contributions to the growing body of research on Web-mediated marketing
communication (WMC). Firstly, despite a growing interest in new methods for
measuring the effectiveness of WMC, few studies have yet developed and empirically
tested a theoretical model as a basis for this assessment. This study proposes a
theoretical framework based on the concepts of activity theory which is a social
psychological approach to studying human activity. Activity theory has originated from
a Russian psychologist Les Vygotsky and it has been premised on the assumption that a
human being interacts with others through tools. Activity theory has been actively used
in the field of Information Systems (IS) for studying the interaction between
information technology and a human being. This Web Acceptance Model (WAM), used
for the first time in marketing-related research, has a number of significant implications
8
for the study of WMC. In contrast to more traditional models of communication (e.g.,
the information processing model; Shannon and Weaver, 1949) the model postulates
that WMC is a process of mutual exchange and social interaction between firms and
customers as active participants. From this perspective, corporate Web sites are not just
channels for the distribution of information, rather they form the basis for a virtual
community where firms and customers actively engage in exchange relationships. In
addition, the WAM identifies two dimensions of social interaction in WMC (i.e.,
affective and task-related), an approach which moves beyond the unidimensional
conceptualisation of human communication as simply a transfer of information from
sender to receiver. Thus, the WAM depicts WMC as the exchange of both information
and emotional responses and so provides a multi-dimensional basis for assessing the
communication performance of corporate Web sites.
Secondly, the study provides a more sophisticated conceptualisation of communication
then is generally provided in studies of consumer behaviour (e.g., the transmission of a
message or meaning; Mowen, 1990; Schiffman, Bednall, Watson, and Kanuk, 1997;
Solomon, 1994). Even though many communication theorists have emphasised that
social interaction is at the core of human communication (e.g., Cherry, 1966; Gerbner,
1977), to date most marketing communication models have failed to adequately reflect
this. Adopting social interaction as a central concept, the WAM indicates that WMC is a
process of mutual exchange carried out within specific culturally determined
frameworks of meaning and as such often involves an emotional component. From this
perspective, task-related interaction explains the process of information exchange, while
affective interaction accounts for the affective responses that also occur during the
process.
9
Thirdly, the study contributes to the development of theory within the discipline of
Marketing by drawing on theoretical concepts in the field of Information Systems and
Human Computer Interaction studies. It is clear that research from a number of
academic disciplines, including Marketing, Communication Studies, Information
Systems, Education and Psychology, can offer useful insights into user responses to
corporate Web sites. Each of these disparate areas of study can add to our understanding
of WMC, but none on its own is sufficient. By drawing on and integrating concepts
from other disciplines, this study sought to gain synergies and richer understandings
into the phenomenon of WMC.
Finally, this study contributes a measurement system for Web effectiveness. As typical
advertising typology cannot be applied to Web sites, the clear definition of Web
functions and the classification of Web sites derived from empirical research, can serve
as independent variables in the Web effectiveness study. Moreover, the instrument
filtered through a more rigorous pilot test, likely to be valid measures of the constructs
in the theoretical model.
1.3.2 Managerial Contributions
The study also makes managerial contributions for marketing and marketing
communication practitioners, in that it provides a basis for marketers and Web site
designers to better understand how to design, assess and increase the effectiveness of
their corporate Web sites. Firstly, the study moves beyond widely-used rules of thumb
and anecdotal guidelines by providing managers with informed insights into Web site
10
design through the classification schemes for Web site typology (i.e., Web site content
types and Web site structure types) proposed in Chapter 2.
Secondly, the results of the study indicate that a corporate Web site is not just an
advertising medium, but is rather a versatile tool of integrated marketing
communication which involves a range of marketing functions including online selling
and customer service. This study gives direction into how Web designers and markers
select and combines various marketing communication functions for more effective
Web design.
Thirdly, this study serves to warn Web site design practitioners not to follow
conventional wisdom, such as “simple is better” or “content is king”, without first
testing the veracity of such beliefs. The study provides empirical evidence that adding
so-called “bells and whistles” to a Web page (e.g., animation, sound, video and links)
can make a Web site more attractive to users, indicating that both content and structure
are important aspects to address in Web site design. This finding reinforces the need for
close collaboration between marketers and Web designers in the creation of corporate
Web sites.
Fourthly, the WAM proposed and tested in the study provides a basis to enable
marketers to assess and maximise the effectiveness of corporate Web sites. Of particular
note here, the two dimensions of social interaction in the model provide critical
indicators of consumer attitudes towards a Web site. These social interaction measures
can help explain consumers’ emotional and cognitive responses more precisely than
using more conventional broad-brush attitude measures.
11
Fifthly, the study showed that a Web site is both an emotional and a cognitive medium.
Accordingly, marketers should be aware that an effective Web site should not only
foster a perception of usefulness among users it should also create a feeling of social
presence. Finally, the study indicates that individual differences (e.g. in terms of Web
literacy, motives and culture) play an important role in user responses to Web sites. This
finding implies that a “one-size-fits-all” approach to Web site design is not appropriate
and that individual differences amongst consumers in target markets should be taken
into account when designing a corporate Web site.
1.4 Definitions of Key Terms
To facilitate a better understanding of this dissertation, several important terms are
defined below. These constructs will be further elaborated in Chapters 2 and 4.
Attitude toward the Web site: Attitude toward the Web site is defined as a learned
predisposition to respond to a Web site as a communication medium or partner, which
represents a Web user’s overall feelings toward the Web site (Belch and Belch, 1999).
Computer-Mediated Communication (CMC): CMC is defined as the process of human
communication through computers, both stand-alone computers and networked system
(Suh, Hasan, and Couchman, 2003).
Hypermedia: Hypermedia is defined as the executional elements of a Web site including
hyperlinks and multimedia (e.g., text, images, audio, and video).
12
Perceived Usefulness: Perceived usefulness is defined as the degree to which a user
believes that using a particular Web site would enhance task performance (Davis, 1989).
Perceived Ease of Use: Perceived ease of use is defined as the degree to which a user
believes that using a particular Web site would be free of effort (Davis, 1989).
Revisit Intention: Revisit intention is defined as a consumer’s propensity to revisit a
particular Web site.
Social Presence: Social presence is defined as a user’s feeling that he or she is
interacting or communicating with other people (Suh, Hasan, and Couchman, 2003). In
Web communication this can be experienced as a feeling that a user is communicating
via the Web site with other human beings (Suh, Couchman, and Hasan, 2003).
Web Literacy: Web literacy refers to a user’s ability to manage the distinctive features
of the Web, including hypermedia and interactivity. Hence, Web literacy encompasses a
complex set of factors including experience, confidence, and familiarity that determine
an individual ability to navigate the Web and manage their interaction with Web sites.
Web-Mediated Marketing Communication (WMC): A firm’s use of the Web for
marketing purposes or a use of a corporate Web site as a marketing communication tool
(Suh, Couchman, and Park, 2003).
Web Site Content: Web site content refers to the information presented on a Web site
(Suh, Couchman, and Hasan, 2003).
13
Web Site Structure: Web site structure refers to the combination or organisation of the
executable elements of a Web site, encompassing text, graphics, audio, video, and
hyperlinks (Suh, Couchman, and Hasan, 2003).
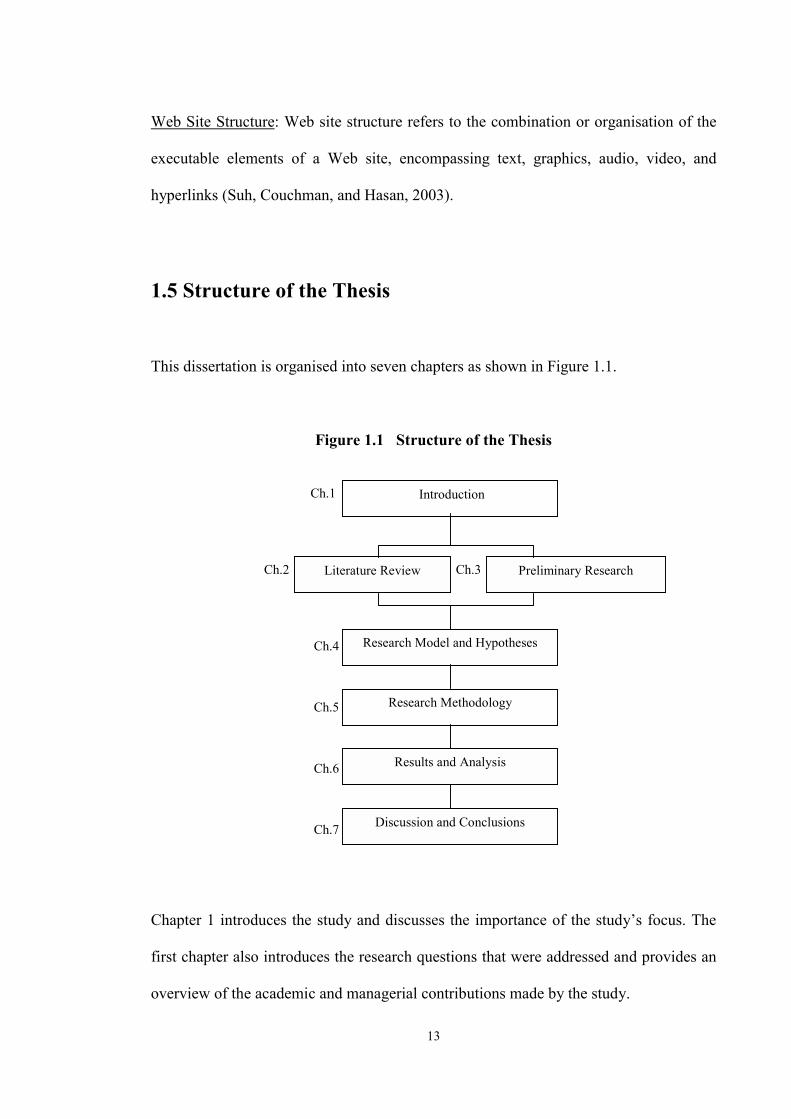
1.5 Structure of the Thesis This dissertation is organised into seven chapters as shown in Figure 1.1.
Figure 1.1 Structure of the Thesis
Ch.1 Ch.2 Ch.3 Ch.4 Ch.5 Ch.6 Ch.7
Chapter 1 introduces the study and discusses the importance of the study’s focus. The
first chapter also introduces the research questions that were addressed and provides an
overview of the academic and managerial contributions made by the study.
Research Model and Hypotheses
Literature Review Preliminary Research
Introduction
Research Methodology
Results and Analysis
Discussion and Conclusions
14
Chapter 2 provides a critical review of the relevant literature relating to the study’s
focus, i.e., corporate Web sites and marketing communication, marketing
communication studies, and computer-mediated communication (CMC). On the basis of
this review, a theoretical framework was developed. The key constructs of the
theoretical framework discussed in this chapter are WMC (Web-mediated marketing
communication or Web-mediated communication), Web site typology (i.e., Web site
content and structure), social interaction, individual differences (i.e., Web literacy and
motives) and communication effects (i.e., attitude toward the Web site and revisit
intention).
Chapter 3 discusses the results of the preliminary research. An empirical study of
corporate Web sites identified a Web site typology (i.e., Web site content and structure)
derived from a content analysis. The Web site typology resulting from the preliminary
research served as a theoretical basis for the study. The findings from the preliminary
research were used for generating test Web sites in the subsequent experimental study.
Chapter 4 proposes a research model, and research hypotheses derived from this, which
developed from a literature review and preliminary research. The proposed research
model, called the Web Acceptance Model, seeks to explain consumer behaviour on the
Web. The proposed model consists of four groups of variables, i.e., predictor,
moderator, mediator, and criterion variables.
Chapter 5 presents the research methodology used in this study. The first section
describes the development of the research instrument, including operationalisation of
the constructs in the model, instrument design and a pilot test of the instrument. The
15
second section describes the experimental methodology for testing the research
hypotheses. It covers the experimental design, participants, the test Web sites,
experimental procedure, and data entry. Finally, the statistical methods used for data
analysis are discussed.
Chapter 6 reports the results of the pilot test of the instrument and the hypothesis tests.
In the first section, the results of the pilot test are presented, which involved three main
analyses, i.e., a factor analysis for unidimensionality, the corrected-total correlation
analysis for construct validity, and Cronbach’s alphas for scale reliability. The second
section discusses the results of the main experiment, which involved assumption testing
and hypothesis testing.
Finally, Chapter 7 summarises the results of the hypothesis tests, discussing the
implications for academics and practitioners. It presents answers to the research
questions of the study. The limitations of the study are described along with suggestions
for further research.
16
CHAPTER 2. LITERATURE REVIEW
2.1 Introduction
Web-mediated marketing communication (WMC) is a relatively new phenomenon, and
to date little research within the discipline of marketing has been published on this
topic. As indicated in the previous chapter, the overall aim of the study related in this
thesis was to investigate the features of effective corporate Web sites. Accordingly, the
purpose of this chapter is to critically review the existing marketing literature in order to
determine what is known about this phenomenon and to identify any knowledge gaps or
problems with the current body of marketing knowledge. This critical review of the
marketing literature is extended with a review of literature in social psychology which
offers useful insights into the nature of WMC.
This chapter begins with the media characteristics of the Web as a marketing
communication medium for firms. Then, some of the issues addressed by marketing
communication research are discussed. It is argued that existing marketing
communication and consumer behaviour models are not well suited to WMC. Given the
deficiencies and limitations in the existing marketing literature, a new theoretical
framework is proposed. This framework is based on Activity Theory, a theory originally
developed within school of social psychology. The important constructs of this
framework are Web site typology, social interaction, individual differences and Web
communication effects.
17
2.2 Corporate Web Sites and Marketing Communication Web-mediated Marketing Communication (WMC) is a new phenomenon and is
different from other communication mediated via the Internet. Generally WMC refers to
the “use of a Web site for marketing purposes” (Suh, Couchman, and Park, 2003; Suh,
Hasan, Couchman, and Park, in press). Web sites can be classified into five main
groups: (1) personal Web sites run by individuals or groups of people, (2) corporate
Web sites for profit-oriented firms, (3) public sector Web sites run by government
agencies, (4) non-profit organisation Web sites for Universities, and (5) Web sites for
voluntary organisations such as the Salvation Army. This study particularly focuses on
corporate Web sites, which have unique addresses or uniform resource locators (URLs)
such as “.com” or “.co”. Corporate Web sites deliver a variety of information relating
to companies, products, and services. The term “mediated communication” emphasises
human communication that uses media such as the Web rather than direct face-to-face
interaction (Richards and Curran, 2002). Leiss, Kline, and Jhlly (1986) explain that the
term “mediated communication” has two implications. First, it emphasises the
interaction mediated by communication media (e.g., the Web or mass media rather than
face-to-face). The different characteristics of communication technologies will have an
influence on the patterns of the communication process and interaction. The second
implication refers to the role of firms and consumers in the communication process. In
mass-mediated marketing communication (e.g., advertising), firms and communication
organisations have more power to control the channels and messages. By contrast, in
WMC it is argued that consumers have more power to control the channels and
messages. Therefore, this study uses the term “Web-mediated marketing
communication” to emphasise the active role of consumers and their interaction. WMC
18
involves interaction between firms and consumers mediated via corporate Web sites. In
this section the characteristics of a corporate Web site and consumers interaction with a
Web site will be discussed in order to provide a background for understanding WMC.
2.2.1 Media Characteristics of a Corporate Web Site
(1) Hypermedia
Hypermedia is the most distinctive feature of a Web site. Here hypermedia is defined as
the dynamic elements of a Web site, which include hyperlinks and multimedia.
Although there have been many studies on hypermedia (e.g., Bouvin, 2000; Cockburn
and Wilson, 1996; Deans and McKinney, 1997; Dholakia and Rego, 1998; Palmer and
Griffith, 1998; Lowe and Hall, 1999), there has been some confusion about the term.
Hence, it is useful here to more clearly define the elements of hypermedia.
First of all, for the categorisation of multimedia, three dimensions are considered: (1)
linguistic or non-linguistic, (2) auditory or visual, and (3) dynamic or static properties.
Advertising and psychology research (e.g., Littlejohn, 1983; Krech and Crutchfield,
1965; Moriarty, 1994; Rada and Tochtermann, 1995; Ross, 1973) indicate that these
three dimensions can facilitate an understanding of consumer’s perception and feelings.
Based on these criteria four categories of Web-based multimedia are identified (see
Figure 2.1). Text, as the written language, including letters and numbers, is expressed in
static and visual forms. Audio is any kind of sound, which is a dynamic, auditory
medium. An image refers to a non-lingual, static, and visual element of a Web site. It
includes photographs, paintings, drawings, graphics, etc. Video refers to dynamic visual
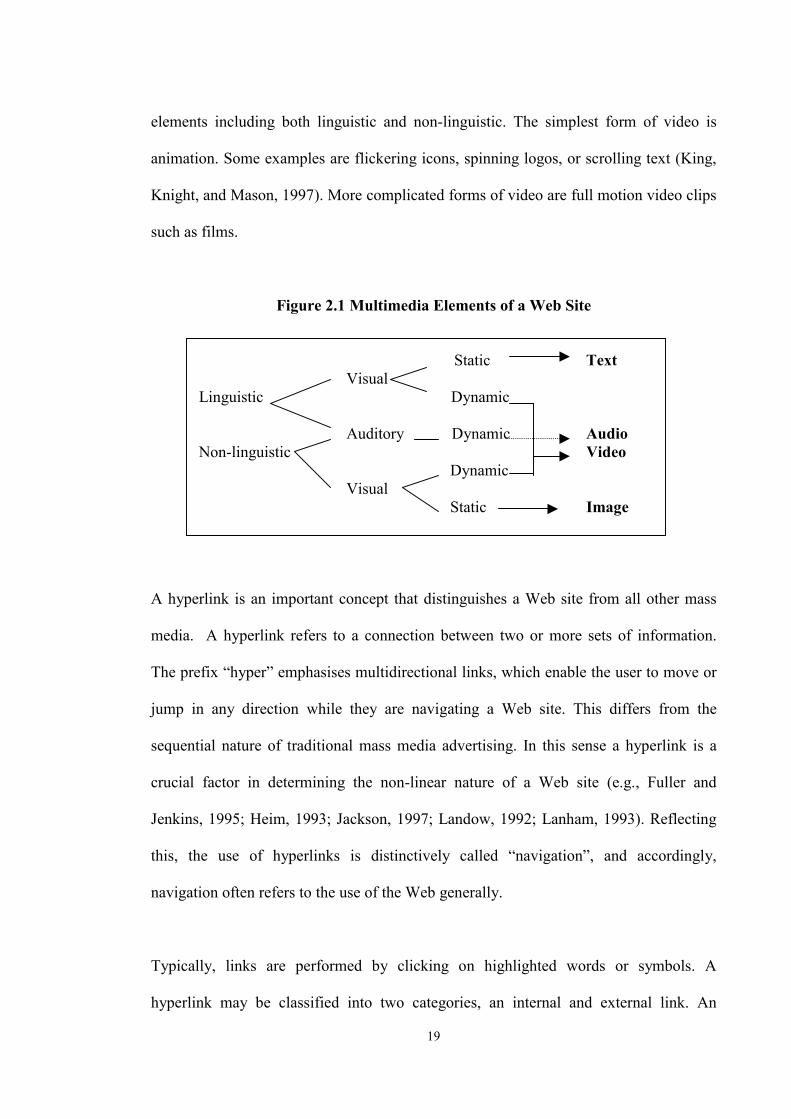
19
elements including both linguistic and non-linguistic. The simplest form of video is
animation. Some examples are flickering icons, spinning logos, or scrolling text (King,
Knight, and Mason, 1997). More complicated forms of video are full motion video clips
such as films.
Figure 2.1 Multimedia Elements of a Web Site
Static Text Visual Linguistic Dynamic Auditory Dynamic Audio Non-linguistic Video Dynamic Visual Static Image
A hyperlink is an important concept that distinguishes a Web site from all other mass
media. A hyperlink refers to a connection between two or more sets of information.
The prefix “hyper” emphasises multidirectional links, which enable the user to move or
jump in any direction while they are navigating a Web site. This differs from the
sequential nature of traditional mass media advertising. In this sense a hyperlink is a
crucial factor in determining the non-linear nature of a Web site (e.g., Fuller and
Jenkins, 1995; Heim, 1993; Jackson, 1997; Landow, 1992; Lanham, 1993). Reflecting
this, the use of hyperlinks is distinctively called “navigation”, and accordingly,
navigation often refers to the use of the Web generally.
Typically, links are performed by clicking on highlighted words or symbols. A
hyperlink may be classified into two categories, an internal and external link. An
20
internal link allows the user to move to another place within the same Web site or even
on the same page. An external link takes users to another Web site. External links are
created for various purposes. For instance, linking to external resources, a company can
provide users with additional information related to the industry. Some sites facilitate
external links to affiliated companies to enhance brand and corporate image.
(2) The potential of Hypermedia for Marketing Communication
The potential advantages of hypermedia to marketing communication can be explored
by identifying its unique characteristics. Firstly, hypermedia can enrich the quality of
information and its presentation. Hypermedia involves the use of more than one sense in
communication. This multi-modality stimulates sensory perception in a synergistic way
and enhances the experience of accessing information (e.g., Nisbett and Ross, 1980).
Hyperlinks also can improve the quality of information by leading users to more
relevant data.
Secondly, as discussed above, hypermedia is non-linear and non-sequential, hence, there
is no single predetermined path that users follow. Users can select the page they want to
read, and decide which direction they want to go. Thus, users can control the order and
sequence of presentation while they are navigating a Web site (Burton, Moore, and
Holmes, 1995). User control when accessing a Web site involves a shift of power to
control information from firms to consumers (Pavlou and Stewart, 2000; Vandermerwe,
2000). This shift emphasises the importance of taking a consumer-centric approach to
Web site design, central to the concept of marketing.
21
Finally, as many researchers have argued (Bates, 1994; Blumberg and Galyean, 1995;
Granieri, Becket, Reich, Crabtree, and Badler, 1995; Kurlander and Ling, 1995; Maes,
Blumburg, Darrell, and Pentland, 1995; Tu and Terzopoulos, 1994), the ultimate goal of
using hypermedia is to enhance perceived reality through rich interaction. When users
feel they are navigating where they want to go, and they get what they want, a Web site
is seen as an interaction-rich virtual space (Suh, Couchman, and Park, 2003). This
implies that Web users have more power to control information process than traditional
mass media.
Although hypermedia has many advantages, there are also drawbacks that need to be
considered. For instance, multi-modality itself does not automatically guarantee its
effectiveness. Sometimes a Web site, with the hypermedia element, can take more time
as it takes a long time to download and this can cause irritation. A Web site can also
distract user’s attention due to its complexity.
(3) Web Site Functions
In traditional marketing communication, personal selling is the dominant marketing
communication tool in industrial marketing, while mass media advertising is the most
frequently used tool for consumer markets (Dickson, 1994). Firms cannot perform more
than one function on the same media. However, a corporate Web site delivers more than
one function at the same time (e.g., Ainscough and Luckett, 1996; Cockburn and
Wilson, 1996; Esrock and Leichty, 2000; Perry and Bodkin, 2000). Some scholars (e.g.,
Berthon, 1996) argue that a Web site is a combination of direct selling and advertising.
Others (e.g., Cockburn and Wilson, 1996) identify corporate Web sites perform several
22
functions including public relations (PR), advertising, online selling, and customer
service. These facts imply that a corporate Web site can be an effective marketing
communication medium for firms due to its multi-functionality.
However, the problem in the field is that there has been some confusion with the terms
and definitions of the functions of marketing communication. These problems call for
new criteria for the classification of marketing communication tools. This thesis more
clearly defines the functions of marketing communication. This process begins with an
investigation of the traditional functions of marketing communication.
Although the terminology and definitions are not standardised (Anderson and Rubin,
1986), advertising, public relations (PR), sales promotion, and personal selling are the
four common elements of the traditional marketing communication mix (e.g., Boone
and Kurtz, 1992; Boyd, Walker, and Rarreche, 1995; Fill, 1995; Rix and Stanton, 1998;
Stanton, Miller, and Layton, 1991). The traditional criteria for the classification of these
marketing communication tools are whether they use paid or unpaid media, whether
they use product-specific or company-specific messages, whether they are personal or
non-personal, and whether sponsors are identified or unidentified (e.g., Belch and
Belch, 1999; Shimp, 1997).
However, the traditional classification schemes for the marketing communication mix
have been criticised by many scholars. For example, van Waterschoot and van den
Bulte (1992) have pointed out the vagueness of the classification criteria. Overall, two
main problems can be identified. The first is related to the definition of sales promotion.
As van Waterschoot and van den Bulte (1992) argue, there is no standard definition.
23
Moreover, following the American Marketing Association’s definition, many authors
define sales promotion as activities other than advertising, public relations, and personal
selling (e.g., Cateora, 1993; Morrison, 2002; Perreault and McCarthy, 1996; Ray, 1982).
The lack of clear definition of sales promotion often causes confusion with promotion,
another general term for marketing communication. Therefore, sales promotion should
be more clearly defined for Web marketing communication.
The second problem is the blurring of functions amongst marketing communication
tools. Sales promotion activities basically overlap with advertising and personal selling
(van Waterschoot and van den Bulte, 1992). Moreover, advertising activities also
overlap with sales promotion and public relations. Corporate image advertising, also
called corporate advertising or institutional advertising, is a hybrid form of advertising
and public relations in that it emphasises corporate-related messages rather than
particular products or services (Boyd et al., 1995; Kotler, 1994; Perreault and
McCarthy, 1996; Shimp, 1997). On the other hand, promotional advertising and direct
response advertising, which include sales promotional content or attempts to induce
direct responses (Engel, Warshaw, and Kinnear, 1991; Kotler, 1994; Shimp, 1997), are
hybrid forms of advertising and sales promotion. Hence, the criteria for the advertising,
public relations, and sales promotion functions should be made clearer for Web
marketing communication.
Drawing on previous studies on the functions (e.g., Ainscough and Luckett, 1996;
Angehrn, 1997; Cockburn and Wilson, 1996; Deans and McKinney, 1997; Dholakia
and Rego, 1998; Esrock and Leichty, 2000; Hoger, Cappel, and Myerscough, 1998;
Huizingh, 2000; Leong, Huang, and Stanners, 1998; Liu, Arnett, Capella, and Beatty,
24
1997; McNaughton, 2001; Perry and Bodkin, 2000; Simeon, 1999; Spiller and Lohse,
1997-8; Zeff and Arronson, 1999), five marketing communication functions of a
corporate Web site can be identified: advertising, public relations, sales promotion,
online selling, and customer service. The functions of advertising, public relations, and
sales promotion through corporate Web sites are basically the same as those in
traditional marketing communication. Online selling can be regarded as an online
version of personal selling in traditional marketing communication. However, customer
service is a new function of a corporate Web site.
In WMC, advertising refers to messages related to a product or service to persuade
potential customers to choose a specific product or service. Familiar advertising
activities of a corporate Web site are product information, brochures, catalogues,
packaging, signs, posters, and so forth (Boyd et al., 1995; Kotler, 1999). Hence,
advertising is similar to typical brand advertising in traditional marketing
communication.
Public relations (PR) can be defined as activities that use corporate-related information
to enhance corporate image or goodwill with broad publics including employees,
stockholders, financial communities, the government, and even general publics (Boone
and Kurtz, 1992; Engel et al., 1991; Griffith and Krampf, 1998; Kitchen, 1993; Lamb,
Hair, and McDaniel, 1996; Patti and McDonald, 1985). Popular activities of public
relations in Web marketing communication are general news about a company, annual
reports, contributions, speeches, seminars, newsletters, sponsorships, charitable
donations, press kits, company magazines, favourable news, and so on (Boyd et al.,
1995; Kotler, 1999; Mercer, 1999; Rix and Stanton, 1998; Uva, 2000). In traditional
25
marketing communication, both corporate advertising (also called institutional, image,
or public relations advertising) and PR put an emphasis on corporate image rather than
sales of specific products or services (Burnett, 1993). The only difference between
corporate advertising and PR is whether they use paid or unpaid media. In the Web,
however, this criterion is not appropriate any more. Therefore, here corporate
advertising is included in public relations.
Sales promotion refers to an attempt to induce a customer to perform a specific action
within a short period of time (Boone and Kurtz, 1992; Davis, 1981; Dickson, 1994;
Kotler, 1994; Morrison, 2002; Runyon, 1984; Shimp, 1997; Zikmund and D’Amico,
1996). Activities of sales promotion include coupons, sweepstakes, contests, samples,
rebates, low-interest financing, free offer, price reduction, etc. (Bolen, 1981; Boyd et al,
1995; Davis, 1981; Griffith and Krampf, 1998; Kotler, 1999; McDonalds, 1984; Rix
and Stanton, 1998).
Online selling is defined as an online transaction, that is, direct selling and buying
products or services over the Web (e.g., Esrock and Leichty, 2000; Griffith and Krampf,
1998; Lamb et al., 1996; Stewart, Pavlou, and Ward, 2002). Online selling aims at
providing facilities for buyers to purchase products or services. The ordering process
and payment system through the Web are examples of online selling activities.
Although usage of this function remains low (Chaudhury, Mallick, and Rao, 2001),
online selling is an important capability of corporate Web sites.
Customer service refers to all the activities of answering customers, responding to
customers, and solving customer problems. Accordingly, activities of customer service
26
include after sales, handling of repair or installation, dealing with complaints, technical
advice, contacts, answers, and so on (e.g., Kotler, 1999; Lovelock, 1991). Customer
service has played an important role in competitive marketing environments. As the
quality of products becomes very similar, customer service is perceived to be a critical
attribute for many companies (Boyd et al., 1995; Jain, 1993).
2.2.2 Consumer Interaction
In traditional advertising situations, consumers are accidentally or inadvertently exposed
to advertisements while they are watching television. The viewers are regarded as
passive recipients of advertising messages. However, Web users voluntarily access
corporate Web sites and actively communicate with firms. In the WMC process
consumers should be regarded as active participants (Fiske and Hartley, 1978; Hall,
1980; Pitt, Berthon, and Watson, 1996; Rogers, 1986). The concept of “active
participants” provides new perspectives to understand WMC. Active consumers are
more involved and feel a sense of community via social interaction, which is an
important feature of WMC. This section explores how interactivity has an effect on
consumer interaction, and how interaction creates a virtual community in WMC. This
will provide a basis for developing a new approach for WMC.
(1) Interactivity
A Web site is called an “interactive medium” to emphasise its capability for
interactivity. In the marketing context, a corporate Web site can be understood as a
medium of interactive advertising or interactive marketing communication because it
27
enables consumers to control marketing information and to engage in communication
(Shimp, 1997). The key assumption behind the concept of interactivity is that Web users
are active participants in the communication process. Although there is no standard
definition of interactivity, it is generally understood as a property of communication
process rather than a media characteristic (Rafaeli and Sudweeks, 1997). Here
interactivity can be defined as “the extent to which users can participate in modifying
the form and content of a mediated environment in real time” (Steuer, 1992).
Feedback and immediacy are important concepts in relation to interactivity. Unlike
traditional advertising, a Web site facilitates real-time feedback functions, which
provide mutual understanding, enhance involvement (Clark, 1992; Clark and Brennan,
1991; Dennis and Kinney, 1998; Huang, 1999; Luo, 2002; Walther, 1992; Zack, 1993).
There are feedback functions in traditional marketing communication. Consumer survey
or monitoring sales data are some examples. In this context consumers are passive or
reactive and feedback time is very delayed. Ultimately these sorts of feedback functions
cannot increase interactivity in marketing communication. Beside, interactive
communication means continuous exchanges of information (Zack, 1993). A corporate
Web site is not a one-time advertisement. Web users can come back again any time, 24
hours a day, 7 days a week, whenever they want.
The importance of interactivity for marketing communication is that it ultimately
influences a consumer’s affect and creates social relationships (Duncan and Moriety,
1998; Ghose and Dou, 1998; Kiesler, Zubrow, Moses, and Geller, 1985; Rafaeli and
Sudweeks, 1997). Marketing scholars (e.g., Duncan and Moriety, 1998) argue that
relationship building is the critical task in WMC.
28
(2) Interaction and Virtual Community
The concept of “interaction” is a property of human actors in a communication system
such as consumers, marketers, and firms. From marketing communication perspectives,
interaction refers to “mutual exchange of information and emotion between consumers
and firms”. Emotion differentiates interaction from “action-reaction” or “stimulus-
response” which does not involve interrelationship. Hence, interaction is regarded as the
ideal of human communication (Berlo, 1960). Reciprocity or mutuality is also an
important concept. Interaction occurs between more than two or more people. When
consumers and marketers interact, they influence each other (Lauer and Handel, 1977).
A corporate Web site allows a high degree of interaction. Web users can send feedback
and email to marketers any time. Further they can receive a response from marketers in
a short time. Through this process Web users are involved in the marketing
communication process. They exchange information and emotion. Amor (1999) insists
that a corporate Web site creates tight relationships and a sense of teamwork between
consumers and firms. Traditional advertising viewers, on the contrary, cannot do this.
They just receive information while they are watching television or reading newspapers.
There is generally no interaction between consumers and firms. This is the difference
between traditional advertising and WMC. The concept of interaction has made
marketing communication scholars re-think the communication concept. Therefore, it is
claimed that consumer interaction in the marketing process should be explored and
evaluated.
29
Further, consumer interaction creates a virtual community. Rheingold (1993) defines
virtual communities as:
“social aggregations that emerge from the Net when enough people carry on those
public discussions large enough, with sufficient human feelings, to form webs of
personal relationships in cyberspace (p. 5).”
In short, the definition emphasises the human feelings between people. While there are
many processes or elements of human feelings, the ability to create a sense of presence
online is one important factor (Palloff and Pratt, 1999). When consumers navigate Web
sites they feel that they are communicating or interacting with others. This feeling is
called social presence (Suh, Hasan, and Couchman, 2003; Suh, Hasan, Couchman, and
Lee, in press). Therefore, social presence is an important indication of a virtual
community. For example, a high degree of social presence generates a virtual
community. Several studies have found that interactive media create virtual
communities (e.g., Papacharissi and Rubin, 2000).
In WMC a corporate Web site is a place, consumers and firms are members, and they
share information. Hoffman and Novak (1996) have proposed a conceptual model,
which highlights the role of a sense of presence in the marketing context. Advertising
scholars (e.g., Choi, 2000; Choi, Miracle, and Biocca, 2001) have recently begun to
include the concept of presence in empirical studies. They found that a high level of
presence created a high level of positive attitude toward the advertisement, brand
attitude, and intention to revisit the Web site.
30
When firms provide better interactive social environments (e.g., online forums,
feedback functions, bulletin boards, etc.), consumers and firms can build better
relationships. Many marketing scholars (e.g., Hoey, 2000; Hoffman and Novak, 1996;
Rayport and Sviokla, 1995) argue that understanding a virtual community or
marketspace is critical to the success of WMC.
2.3 Marketing Communication Studies
Although most marketing and advertising scholars acknowledge the importance of a
corporate Web site as a marketing communication tool, to date little systematic research
has been carried out into the nature of WMC and the means of assessing WMC
effectiveness. Furthermore, most WMC research has been undertaken using traditional
marketing communication models. Hence, there is a need to examine existing marketing
communication models and the study of marketing communication effectiveness. This
will provide a basis for developing a new marketing communication model for
application to corporate Web sites.
2.3.1 The Traditional Marketing Communication Model
Marketing communication consists of advertising, public relations (PR), sales
promotion, and personal selling. Marketing communication studies have mainly focused
on advertising through traditional mass media such as television, newspaper, radio, and
magazine (Watson, Zinkhan, and Pitt, 2000). Accordingly, in this study traditional
marketing communication means traditional advertising.
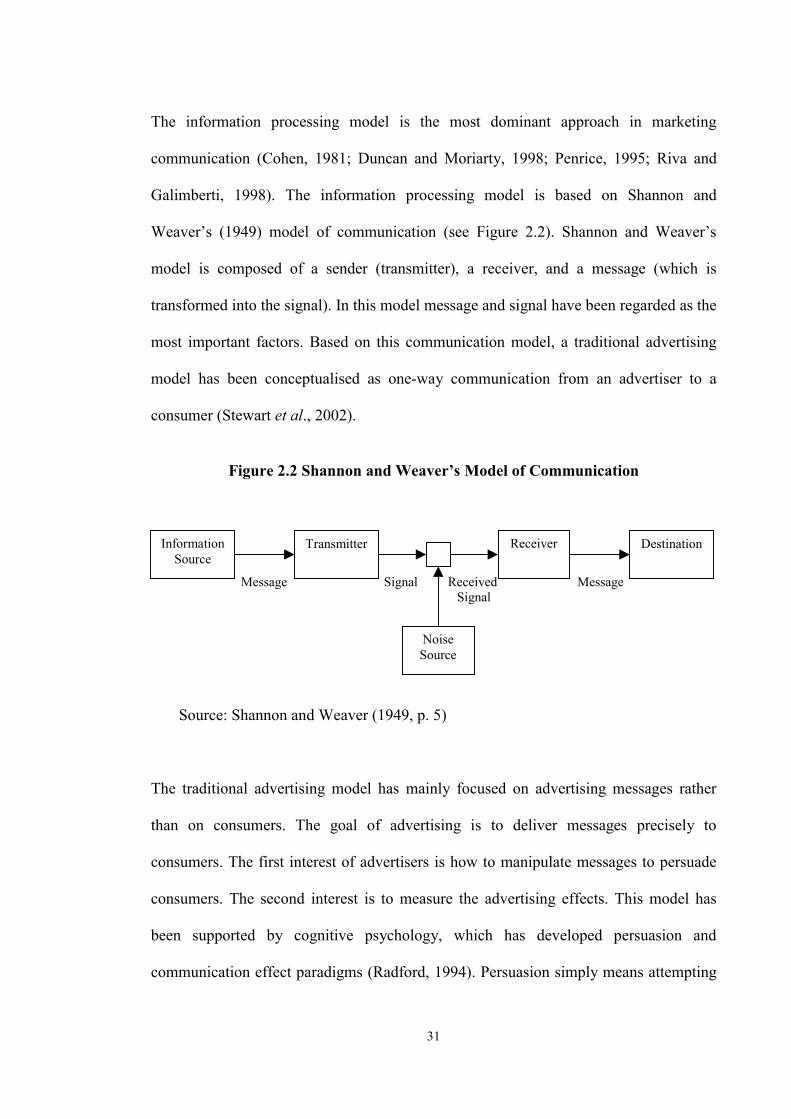
31
The information processing model is the most dominant approach in marketing
communication (Cohen, 1981; Duncan and Moriarty, 1998; Penrice, 1995; Riva and
Galimberti, 1998). The information processing model is based on Shannon and
Weaver’s (1949) model of communication (see Figure 2.2). Shannon and Weaver’s
model is composed of a sender (transmitter), a receiver, and a message (which is
transformed into the signal). In this model message and signal have been regarded as the
most important factors. Based on this communication model, a traditional advertising
model has been conceptualised as one-way communication from an advertiser to a
consumer (Stewart et al., 2002).
Figure 2.2 Shannon and Weaver’s Model of Communication
Message Signal Received Message Signal Source: Shannon and Weaver (1949, p. 5) The traditional advertising model has mainly focused on advertising messages rather
than on consumers. The goal of advertising is to deliver messages precisely to
consumers. The first interest of advertisers is how to manipulate messages to persuade
consumers. The second interest is to measure the advertising effects. This model has
been supported by cognitive psychology, which has developed persuasion and
communication effect paradigms (Radford, 1994). Persuasion simply means attempting
Transmitter Receiver
Destination
Noise Source
Information Source
32
to change consumer attitude and behaviour. Effective measures involve concepts such
as perception, thinking, beliefs, meanings, or intention (Losee, 1999).
Although scholars insist that feedback is important, in the traditional linear model of
advertising, feedback functions are very limited. For instance, in the marketing setting,
the only way to get consumer information is to ask consumers through a survey
questionnaire or telephone “hotline”(e.g., customer service 1-800). The shortcomings of
these types of feedback are a lack of interaction between consumers and firms, and
substantial time gaps between advertising implementation and consumer response. For
this reason a reciprocal relationship between consumers and firms has been largely
ignored. However, it is argued here that reciprocity of WMC should be considered
(Stewart et al., 2002).
Furthermore, many scholars (e.g., Peter and Olson, 1990; Rogers, 1986) have argued
that the traditional advertising model has long neglected the emotional aspects and
experiences of consumers. Recently many researchers (Gunawardena and Zittle, 1997;
Kuehn, 1993; Mantovani, 2001; Choi, 2000; Choi et al., 2001) have found that a Web
site can generate rich emotional interaction. To fully understand the nature of the new
phenomenon, new marketing communication models should be developed.
2.3.2 Effectiveness Studies
The study of advertising effectiveness has been conducted in consumer behaviour,
which focuses on “the processes involved when individuals or groups select, purchase,
use, or dispose of products, services, ideas, or experiences to satisfy needs and desires”
33
(Solomon, 1994, p.7). In other words, consumer behaviour involves the study of
interaction amongst consumers and firms in the marketing environment. While
consumer behaviour utilises concepts and models from other scientific disciplines such
as psychology, sociology, anthropology and economics, most consumer behaviour
theories have been modeled on cognitive psychology (Liefield, 2003; Stewart et al.,
2002). Accordingly, the study of advertising effectiveness has been heavily influenced
by cognitive psychology.
The basic premise of advertising effectiveness is that consumers are passively exposed
to advertisements, then, they process advertising messages. As a result, brand beliefs are
formed, which lead to brand attitudes and intentions to purchase the brand. These
psychological responses finally influence the consumer’s decision to choose a particular
brand. Thus, the information about consumer beliefs, perceptions, attitudes, and
intentions are very important for assessing traditional advertising effects because these
measures predict a consumer’s final choice of a particular brand (Liefield, 2003).
(1) Attitude Measures
Typically, the effectiveness of advertising has been assessed by an approach called
“communication effects” (e.g., Olson, Toy, and Dover, 1982; Shimp, 1997; Sirgy,
1998). The most widely used measures of advertising effects are attitude toward the
advertisement (Aad), attitude toward the brand (Ab), and purchase intention (PI)
(Goldsmith, Lafferty, and Newell, 2000). In accordance with Gordon Allport’s (1935)
classical definition of attitude, attitude toward the advertisement (Aad) is defined as a
general predisposition to respond to a particular advertisement in a favourable or

34
unfavourable way (e.g., Belch and Belch, 1999; Cacioppo, Harkins, and Petty, 1981;
Lutz, 1985; Mitchell and Olson, 1981; Solomon, 1994). Similarly, attitude toward the
brand (Ab) is defined as a general predisposition to respond to a particular brand in a
favourable or unfavourable way. Purchase intention (PI) refers to a consumer’s
expressed propensity to buy a particular product. Previous studies on advertising
effectiveness have demonstrated a consistent causal relationship amongst the three
measures. Attitude toward the advertisement can have an effect on attitude toward the
brand, which in turn determines purchase intention (Brown and Stayman, 1992; Heath
and Gaeth, 1994; Kalwani and Silk, 1982; MacKenzie, Lutz, and Belch, 1986). The
framework is still dominantly used for the study of Web site effectiveness (e.g., Bruner
and Kumar, 2000; Choi, 2000; Choi et al, 2002; Hamilton and Luo, 1999; Pho and
Adam, 2002; Stevenson, Bruner, and Kumar, 2000).
However, the advent of Web sites as an interactive marketing communication brings
new challenges with regard to measures of effectiveness. The traditional communication
effect measures have flaws in that they do not reflect two important features of WMC:
emotional aspects of interaction and multi-functionality (e.g., advertising, PR, sales
promotion, online selling, and customer service) of Web sites (e.g., Pavlou and Stewart,
2000; Suh, Couchman, and Lee, 2002a; Suh, Couchman, and Hasan, 2003).
Firstly, as the measures of conventional advertising effects are premised on the concepts
of a passive audience and the linear communication model, a consumer’s cognitive
attitude is the main concern. Although attitude toward the advertisement has frequently
utilised affective responses (e.g., like/dislike, good/bad, etc), the general feelings about
the advertisement do not fully illustrate consumer attitude nor do they reflect the
35
concept of active participants. These measures, while useful, are only parts of the
potential measures of WMC (Pavlou and Stewart, 2000). To overcome these
shortcomings, new measures for identifying consumer interaction should be explored.
Alternative models should include affect, experiences, individual characteristics, and so
forth (Stewart et al., 2002; Warden, Lai, and Wu, 2002).
Furthermore, as Lavidge and Steiner (1961) emphasised, measures of Web site
effectiveness should be linked to the functions of a corporate Web site. Different from
traditional advertising, corporate Web sites perform several functions including
advertising, public relations, sales promotion, customer service, and online selling for
broader target audiences (Suh, Couchman, and Lee, 2002a). In other words, corporate
Web sites focus more on building relationships with a wide range of consumer groups
rather than short-term transactions (Hoffman, Novak, and Chatterjee, 1995; Wen, Chen,
and Hwang, 2001). Accordingly, typical measures of brand advertising such as attitude
toward the brand and purchase intention do not seem to be adequate measures of Web
site effectiveness. Reflecting this fact, many marketing communication scholars have
developed new communication measures such as attitude toward the Web site (Aws)
and revisit intention (RI) for Web site effectiveness (e.g., Bruner and Kumar, 2000;
Chen and Wells, 1999; Choi, 2000; Choi et al., 2001; Davis, 1999; Loiacono, Chen, and
Goodhue, 2002; Luo, 2002; O'Neill, Palmer, Charters, and Fitz, 2001; Stevenson et al.,
2000; Suh and Couchman, 2003; Suh, Couchman, and Hasan, 2003; Yoo and Donthu,
2001).
36
(2) Attention Measures
New measures of Web site effectiveness have been proposed by many researchers (e.g.,
Hofacker and Murphy, 1998; Hoffman and Novak, 2000; Raman and Leckenby, 1998).
Some of the most commonly-used methods of assessing Web site effectiveness are the
“click-through rate” (or “click-through ratio”, “hit rate”, “hit ratio”) and “duration of
visit” (or “visit duration”, “duration time”), which reflect the level of attention given to
a Web site or a banner ad. A click-through rate is simply calculated by counting the
number of times a Web site is clicked within a given period time. On the other hand,
duration of visit refers to the amount of time each visitor spent navigating a specific
Web site. Even though these measures have an advantage in that they are easy to obtain,
there are a few potential shortcomings.
First of all, it is frequently argued that the click-through rate can be inflated or deflated
because of technological limitations (e.g., Berthon, Pitt, and Prendergast, 1997; Zeff and
Aronson, 1999). For instance, when several users access a Web site through the same
proxy server, a Web publisher may recognise them as only one user due to the same
address. The same problem may happen when several people share a computer or the
same IP address.
Secondly, proponents of “duration of visit” argue that a user who spends more time on a
Web page gets more involved in information processing, which in turn leads to a
positive attitude toward the Web site (cf. Olney, Holbrook, and Batra, 1991; Thorson,
Chi, and Leavitt, 1992). However, recent studies on the Web have yielded contradictory
results (e.g., Balabanis and Reynolds, 2001). One possible explanation is that the
37
relationship between them is influenced by other factors, such as Web experiences, user
characteristics, and types of Web sites (e.g., Raman and Leckenby, 1998; Bezjian-
Avery, Calder, and Iacobucci, 1998).
Furthermore, many researchers have raised an objection to adopting an attention
measure such as the click-through rate and duration of visit as a sole measure of Web
site effectiveness. While information about how many users come and how long they
stay on a Web site is easy to check, it does not give any further information about
consumer attitudes (Briggs and Hollis, 1997; Day, 1997; Tierney, 2000). Alternatively,
many researchers have suggested and adopted attitude measures such as “attitude
toward the Web site” and “revisit intention” (e.g., Chen, Clifford, and Wells, 2002;
Chen and Wells, 1999; Li and Bukovac, 1999; Luo, 2002; Wu, 1999; Yoo and Donthu,
2001).
2.4 Computer–Mediated Communication (CMC) Studies
Long before the advent of the Internet, research on mediated communication has been
conducted in the field of CMC studies. Generally the term computer-mediated
communication (CMC) is defined as the process of human communication through
computers, both stand-alone computers and networked system (Suh, Hasan, and
Couchman, 2003). Here mediated communication emphasises human communication
that uses media such as computers, email, video conferencing, a Web site, etc. rather
than direct face-to-face contacts (Richards and Curran, 2002). Recently, CMC research
has influenced the marketing communication field, and many scholars (e.g., Choi et al.,
2001; Hoffman and Novak, 1996; Hoey, 2000; Rafaeli and Sudweeks, 1997; Rafaeli
38
and Noy, 2002) have developed and tested new models. Accordingly, CMC research
provides useful insights into WMC.
CMC studies began in the 1970’s, mainly focusing on personal interaction in group
work situations (Rice and Love, 1987). However, after the 1990’s CMC research has
focused on social interaction in an Internet environment and has been pursued by
various disciplines including information systems, education, library sciences, and
marketing. Social Presence Theory (e.g., Short, Williams, and Christie, 1976) and
Media Richness Theory (e.g., Daft and Lengel, 1986) have been the most frequently
adopted approaches by CMC researchers.
CMC researchers have argued that the effects of communication are dependent upon the
specific characteristics of the communication media. They have insisted that
communication media vary in their capacities to deliver social cues in human
communication, and CMC media are less likely to convey social interaction (Huang,
1999). Their assumption is that face-to-face is the ideal communication in group
situations (Siegel, Dubrovsky, Kiesler, and McGuire, 1986; Sproull and Kiesler, 1986).
Accordingly, CMC media are substitutes for face-to-face communication. However,
many other researchers have shown that there are social, emotional aspects in CMC
communication such as a sense of online community or friendship (e.g., Boudourides,
1995; Hiltz and Turoff, 1978; Steinfield, 1986; Williams, Strover, and Grant, 1994).
Regardless of these contradictory arguments, CMC research has developed many useful
concepts including “interactivity”, “social interaction”, “social presence”, “a virtual
community”, which are utilised in this study. In the marketing context, Hoffman and

39
Novak (1996) identify unique characteristics of CMC media and propose a useful
research framework for computer-mediated environments (CMEs), which encompasses
important concepts such as mediated-communication, interactivity, a sense of presence,
etc. While Hoffman and Novak’s conceptual model provides guidelines for CMC in
general, it cannot speculate on unique influences of different media on human
behaviour. Hence, more elaborate models for WMC should further be explored.
Furthermore, Hoey (2000) applies CMC concepts for testing the marketing
communication effectiveness of electronic publishing. He emphasised that interpersonal
interaction facilitated by online conferencing and forums, is an important factor for Web
site success.
Although CMC studies have provided useful insights into mediated communication,
they have inherent shortcomings. Firstly, as most research has been conducted at the
very early stage of the Internet era (e.g., Miltenoff, 1999), they have focused on a very
narrow range of communication media such as email and computer conferencing, and
have neglected differences among communication media such as email, Multiple User
Dimension (MUD), Internet Relay Chat (IRC), Newsgroups, and the World Wide Web
(the Web). As a result, CMC media have been regarded as just text-based media
(Boudourides, 1995; Kreijns and Gerrissen, 1999; Walther, 1992). Secondly, the study
of CMC has focused on the medium itself rather than on the user. Both Social Presence
Theory (e.g., Short et al., 1976) and Media Richness Theory (e.g., Daft and Lengel,
1986) have emphasised the importance of the inherent characteristics of communication
media. In these areas of study, researchers have argued that the use of communication
media is dependent upon the different characteristics of the communication media
40
regardless of user-related factors (e.g., motives, education, and usage) and the social
context at use (Dennis and Valacich, 1999). Finally, CMC researchers do not consider
the diverse purposes of communication. Most CMC researchers to date typically have
focused on task-related communication in the work situation. Hence, it is questionable
whether the results of studies on CMC can be applied to WMC.
The shortcomings of CMC studies provide some useful guidelines for the study of
WMC. To begin with, the differences of the media should be considered because the
types of CMC vary widely according to media characteristics and purposes of
communication. For example, email is text-based, whereas the Web is a hypermedia-
based medium encompassing links, text, audio, video, images, etc. It can be generally
assumed that user responses to the Web will be different from those to email.
Accordingly, the result of studies on email research cannot be generalised to all CMC
media.
In addition, theories of human behaviour such as Activity Theory (e.g., Vygotsky, 1962,
1981) have insisted that human activities involve tool mediation and human interaction
(Suh, Couchman, and Park, 2003). Communication media are only mediating artefacts
through which human beings interact with other human beings. Researchers have begun
to investigate the human side of CMC and the resulting studies have suggested that a
computer can create social responses such as a sense of presence or interpersonal
feelings (e.g., Boudourides, 1995; Hiltz and Turoff, 1978; Steinfield, 1986; Williams et
al., 1994). Thus, WMC, as a form of CMC, should not be treated simply as a process of
human-computer interaction. Rather, it should be seen as mediated human-human
communication (e.g., Riva and Galimberti, 1997; Tourangeau, Couper, and Steiger,
41
2001). For this reason, theories derived from the social psychology of communication
can help us better understand the nature and dynamics of WMC.
2.5 Theoretical Framework of the Study
On the basis of the literature review it was concluded that conventional approaches to
the evaluation of marketing communication media are not appropriate to WMC given
the distinctive characteristics of this new medium. Particularly, in the marketing context
the role of the consumer, and the communication concept have been questioned.
Nevertheless, to date little systematic, empirical research has been carried out. The lack
of an appropriate framework, which can be applied to WMC, gives rise to the need for a
new approach (Hoffman and Novak, 1996; McDowell and Sutherland, 2000; Stewart et
al., 2002). This chapter suggests a new approach for WMC and introduces Activity
Theory. Then the WMC model and the important features of the model are discussed.
2.5.1 A New Approach in WMC
Drawing on existing literature and research findings, three shifts in focus for WMC
studies have been identified:
(1) The focus of research: from the medium (message) to the consumer
(2) The concept of communication: from information to interaction
(3) Theories derived: from cognitive psychology to social psychology
42
First of all, the focus of research needs to shift from the media (messages) to the
consumer. This also means a shift from the firm (marketer) to the consumer (Ray,
1982). In traditional advertising model, the mass media or the advertising message is the
focus. Consumers are simply recipients of messages, which are highly manipulated by
advertisers. Hence, the effectiveness of advertising depends solely upon the advertiser’s
skills to manipulate advertising messages (e.g., advertising creativity). The interest of
advertisers is to know whether the message is delivered to the consumer accurately or
not. On the contrary, in WMC consumers are at the centre of the communication
process. Consumers and firms are participants in communication mediated by a Web
site. Consumers actively access the Web and interact with firms. While consumers are
surfing a corporate Web site, they feel that they are interacting with someone from
firms. The level of interaction depends on both the characteristics of a Web site and
consumer characteristics such as experience, motives, etc (e.g., Jackson, 1997).
Secondly, the concept of communication should shift from information to interaction. In
traditional advertising models communication is defined as the process of transmission
of information (e.g., Schramm, 1954; Ross, 1973; Shannon and Weaver, 1949). This
view has been radically challenged because it does not take into account reciprocal
interaction (Riva and Galimberti, 1998). In WMC, communication refers to a process of
exchanging both information and emotions between firms and consumers, which is
conceptualised as interaction (Craig, 1999; Suh, Hasan, and Couchman, 2003). Rich
interaction on a corporate Web site is provided by reciprocal communication via various
feedback functions and hyperlinks (Riva and Galimberti, 1998). It is worth noting that it
is mediated human-human interaction (e.g., Riva and Galimberti, 1997; Tourangeau et
43
al., 2001). This implies that consumer interaction is the determinant of assessing WMC
effectiveness.
Finally, there is a need to shift from theories derived from cognitive psychology to those
derived from social psychology. Traditional advertising effect measures have focused
on consumer’s reactive responses to advertising stimuli. As advertisers’ interests have
been accurate message delivery, cognitive psychology has been very helpful in
assessing consumer attitudes and behaviour. However, existing consumer behavioural
models are not well suited for assessing the social aspects of human interaction.
Traditional behavioural models based on cognitive psychology have been challenged
and criticised by many marketing communication scholars (e.g., Craig, 1999; Stewart et
al., 2002; Peter and Olson, 1990). For this reason, theories derived from the social
psychology of communication can help us better understand the nature and dynamics of
WMC.
In conclusion, a new WMC model should integrate three major shifts and it should also
focus on both outcomes and process of marketing communication.
2.5.2 Activity Theory
Activity Theory has been built on the premise that a human being interacts with others
through tools. Mediated interaction provides a basis for investigating human activity
(Vygotsky, 1981). Activity Theory incorporates concepts of mediation, interaction,
community, etc. and these aspects have drawn attention amongst scholars in the field
(Uden and Willis, 2001). Accordingly, Activity Theory provides a solid theoretical basis
44
for understanding mediation and interaction of Web-mediated communication (e.g.,
Hasan, 1998; Mwanza, 2000; Ryder, 1998).
Activity Theory originated from a Russian psychologist Les Vygotsky in the 1920’s,
and was introduced to the West in the 1980’s. Activity Theory has well-established
theoretical foundations and has been applied in various disciplines such as Social
Psychology, Education, Human-Computer Interaction (HCI), Information System (IS),
and so forth (Hasan, 1999). Recently Activity Theory has been applied to the marketing
communication area (e.g., Chaudhury et al., 2001; Suh, Couchman, and Park, 2003; Suh,
Hasan, and Couchman, 2003).
Activity Theory investigates human interaction with others through an “activity”, which
is a basic unit of analysis for understanding human behaviour. Activity theorists have
argued that human activity is not an isolated entity (Bannon, 1997). Rather it is structure
composed of three basic elements: a subject, an object, and a tool. An agent who
engages in an activity is called a “subject”. A subject can be an individual or a group of
people. More than one subject constitutes a community when they share an object. All
human activities are driven by a certain purpose or motive, which is called an “object”.
Vygotsky (1978) has emphasised that a human being does not directly react to others,
but interacts with others through the use of tools and signs. An activity is usually
mediated by one or more artefacts (a tool). The basic mediation model (Figure 2.3)
illustrates the simplest form of Activity Theory.
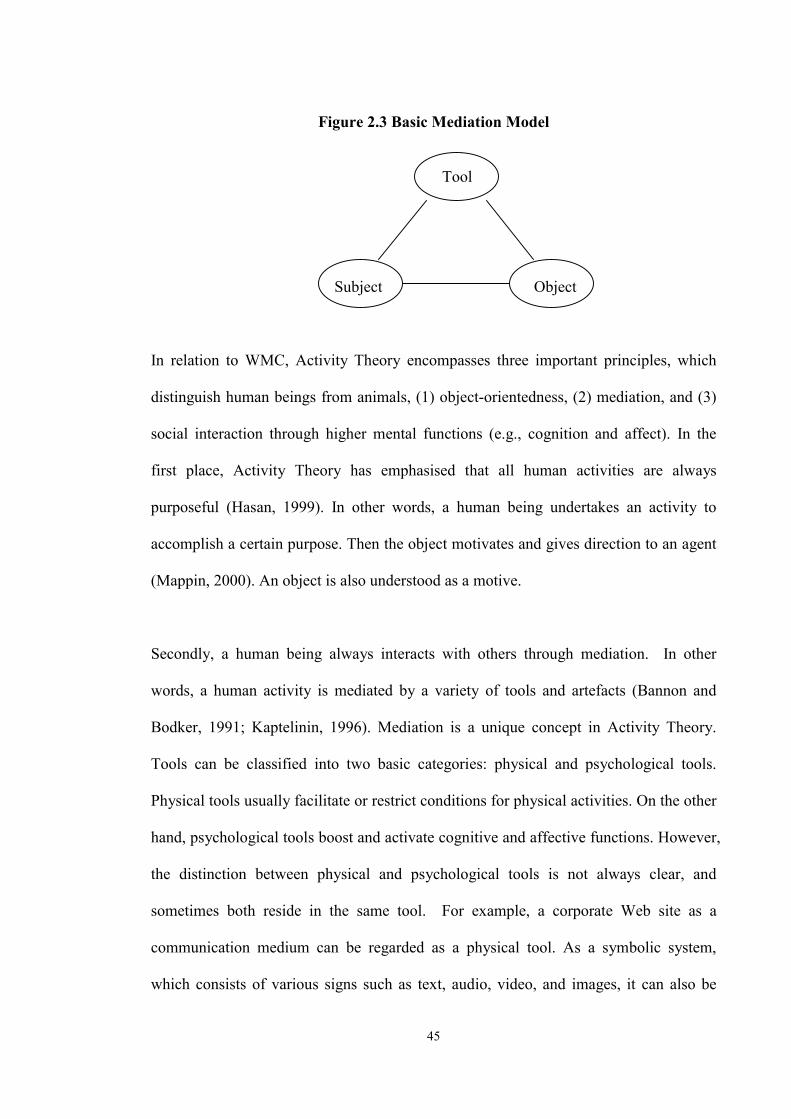
45
Figure 2.3 Basic Mediation Model Tool Subject Object In relation to WMC, Activity Theory encompasses three important principles, which
distinguish human beings from animals, (1) object-orientedness, (2) mediation, and (3)
social interaction through higher mental functions (e.g., cognition and affect). In the
first place, Activity Theory has emphasised that all human activities are always
purposeful (Hasan, 1999). In other words, a human being undertakes an activity to
accomplish a certain purpose. Then the object motivates and gives direction to an agent
(Mappin, 2000). An object is also understood as a motive.
Secondly, a human being always interacts with others through mediation. In other
words, a human activity is mediated by a variety of tools and artefacts (Bannon and
Bodker, 1991; Kaptelinin, 1996). Mediation is a unique concept in Activity Theory.
Tools can be classified into two basic categories: physical and psychological tools.
Physical tools usually facilitate or restrict conditions for physical activities. On the other
hand, psychological tools boost and activate cognitive and affective functions. However,
the distinction between physical and psychological tools is not always clear, and
sometimes both reside in the same tool. For example, a corporate Web site as a
communication medium can be regarded as a physical tool. As a symbolic system,
which consists of various signs such as text, audio, video, and images, it can also be
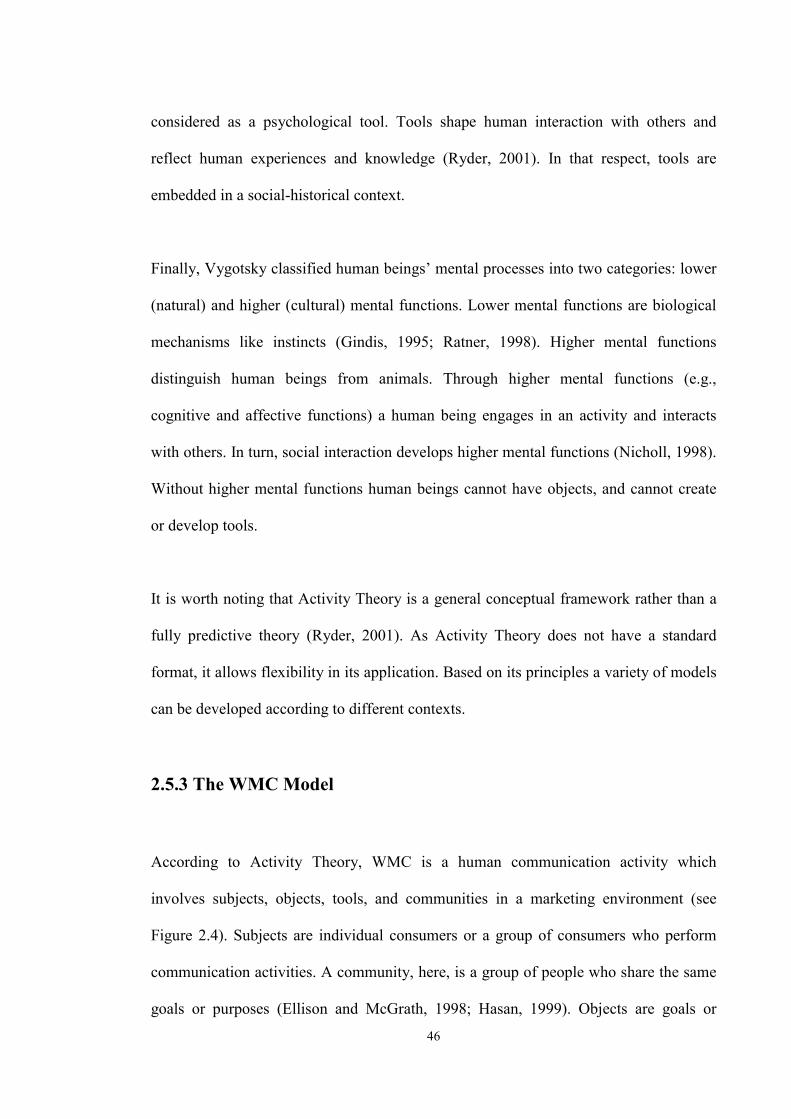
46
considered as a psychological tool. Tools shape human interaction with others and
reflect human experiences and knowledge (Ryder, 2001). In that respect, tools are
embedded in a social-historical context.
Finally, Vygotsky classified human beings’ mental processes into two categories: lower
(natural) and higher (cultural) mental functions. Lower mental functions are biological
mechanisms like instincts (Gindis, 1995; Ratner, 1998). Higher mental functions
distinguish human beings from animals. Through higher mental functions (e.g.,
cognitive and affective functions) a human being engages in an activity and interacts
with others. In turn, social interaction develops higher mental functions (Nicholl, 1998).
Without higher mental functions human beings cannot have objects, and cannot create
or develop tools.
It is worth noting that Activity Theory is a general conceptual framework rather than a
fully predictive theory (Ryder, 2001). As Activity Theory does not have a standard
format, it allows flexibility in its application. Based on its principles a variety of models
can be developed according to different contexts.
2.5.3 The WMC Model
According to Activity Theory, WMC is a human communication activity which
involves subjects, objects, tools, and communities in a marketing environment (see
Figure 2.4). Subjects are individual consumers or a group of consumers who perform
communication activities. A community, here, is a group of people who share the same
goals or purposes (Ellison and McGrath, 1998; Hasan, 1999). Objects are goals or
47
motives that drive consumers to act. And tools are Web sites that mediate the
communication activity. More specifically, WMC is a communication activity
undertaken between firms and consumers, which is oriented by particular objectives and
mediated by corporate Web sites, towards a certain object and mediated by a corporate
Web site and a community. In a marketing situation, subjects are firms and consumers.
Consumers include a wide variety of target audiences ranging from dealers to
stockholders, government, and general publics. Firms and consumers share similar
interests and common goals, and therefore they constitute a community.
Figure 2.4 Basic Elements of WMC Web sites Firms & Information Consumers Community Through a survey of 279 college students, Papacharissi and Rubin (2000) have found
that browsing a Web site to obtain information has been the most conspicuous predictor
of Web use. This result has been supported by a Web user survey (GVU, 1998). From a
firm’s point of view, informing is a universal purpose of marketing communication
(e.g., Kotler, 2000; Shimp, 1997), and a corporate Web site seeks to perform this
function (Suh, Couchman, and Lee, 2002a). In other words, firms try to deliver a wide
range of marketing information to consumers via their Web sites. On the other hand,
48
consumers access corporate Web sites to collect product information (see Figure 2.5).
Thus, it can be concluded that the exchange of information is a common motive of the
Web community.
In the WMC model social interaction plays an important role. Social interaction is
defined as a “process or outcome of continuous interchange between people in a social
context such as conversation, attending a lecture, conducting an interview, etc (Cairns,
1979; Vygotsky, 1978). Human interaction in mediated communication has two
conspicuous characteristics, that is, it is social and reciprocal. Many researchers suggest
that people respond to computers just as they are interacting with other humans (e.g.,
Picard, 1997, Cassell and Bickmore, 2002; Nass, Moon, Fogg, Reeves, and Dryer,
1995; Nass, Steuer, and Tauber, 1994; Reeves and Nass, 1996). This notion implies that
communication interaction is social. Another characteristic of interaction in mediated
communication is reciprocity. Reciprocity refers to mutual understanding, exchanging
information. Reciprocity or mutual interchange is a critical element of community
because humans cannot share social rules and reality without reciprocity (Fernyhough,
1996; Gouldner, 1960; Riva and Galimberti, 1998; Saito, 1996).
Another important concept here is that of virtual community. Basically, a community is
a group of people who have common interests and goals. A corporate Web site, utilising
reciprocal communication facilities (e.g., feedback and email), creates a sense of space
where subjects can communicate. This is a social phenomenon, arising from interaction
among people (e.g., Fernyhough, 1996; Riva and Galimberti, 1998; Saito, 1996).
Generally, it is assumed that the higher the degree of social interaction involved in
accessing a Web site, the more the Web site is perceived as a constituting a community
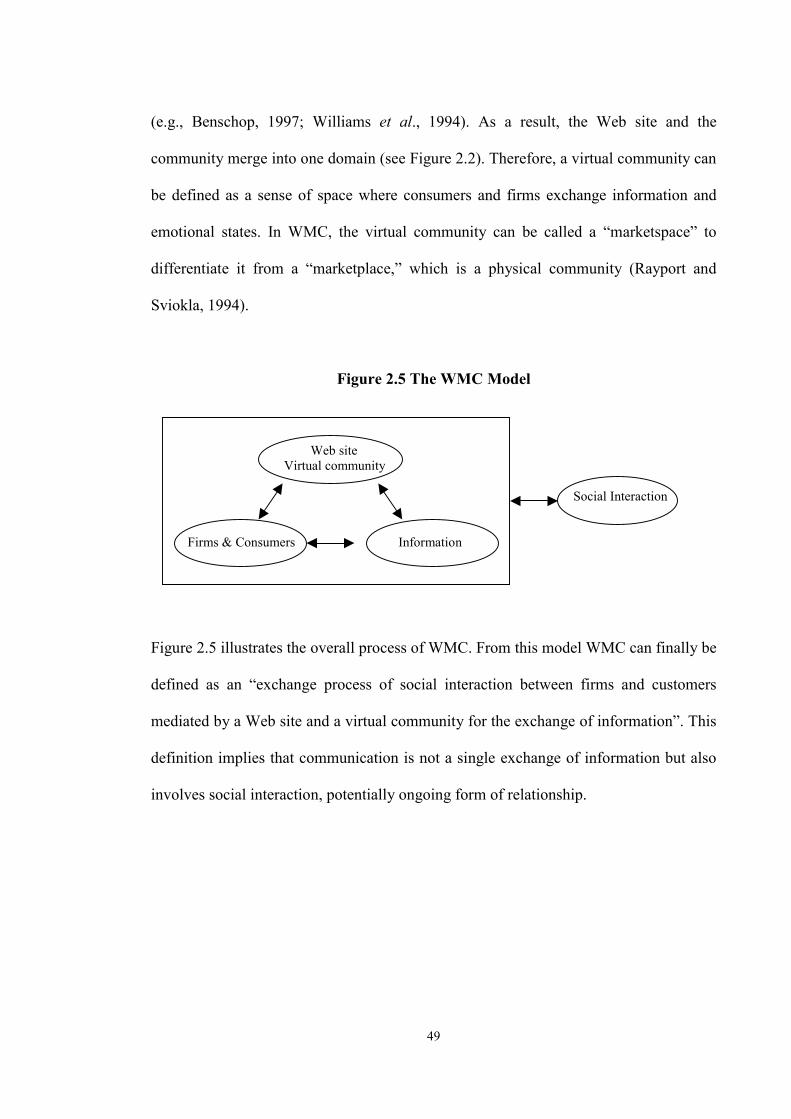
49
(e.g., Benschop, 1997; Williams et al., 1994). As a result, the Web site and the
community merge into one domain (see Figure 2.2). Therefore, a virtual community can
be defined as a sense of space where consumers and firms exchange information and
emotional states. In WMC, the virtual community can be called a “marketspace” to
differentiate it from a “marketplace,” which is a physical community (Rayport and
Sviokla, 1994).
Figure 2.5 The WMC Model Web site Virtual community Social Interaction Firms & Consumers Information Figure 2.5 illustrates the overall process of WMC. From this model WMC can finally be
defined as an “exchange process of social interaction between firms and customers
mediated by a Web site and a virtual community for the exchange of information”. This
definition implies that communication is not a single exchange of information but also
involves social interaction, potentially ongoing form of relationship.
50
2.5.4 Implications of the WMC Model
The conceptual model this study proposes aims at complementing the conventional
marketing communication model by filling gaps in our knowledge in relation to the
evaluation of WMC effectiveness. This model has significant implications for the study
of the Web.
Firstly, the WMC model contrasts with traditional communication models, which
defines communication as a message transmission process (e.g., Shannon and Weaver,
1949; Schramm, 1954). In traditional communication models, the direction of
transmission is always from the sender (firms) to the receiver (consumers).
Furthermore, although there is a feedback loop, it is asynchronous and performed
through other media like telephone and consumer surveys. On the contrary, the WMC
model suggests that communication is the process of social interaction between firms
and consumers. Consumers are not simply passive recipients but are “participants” in a
communication process.
Secondly, the Web design process is not a simple allocation of hypermedia elements but
an activity informed by particular objectives. The comparison between a simple
allocation and an activity can be described by the term “informative” and
“communicative” (Gahagan, 1975). The former refers to a simple allocation of
information without intention. On the contrary, the communicative design of a Web site
is an intended and planned behaviour of firms aimed at influencing consumers. The
contrast with conventional media (e.g., TV) a Web site delivers multi-functions (e.g.,
advertising, PR, sales promotion, online selling, and customer service) and involves a
51
hypermedia structure. Hence, Web site design requires well-prepared communicative
plans for selecting and combining various design elements and modes of presentation.
Television commercials are of thirty-second duration or fifteen-second and can only tell
one thing about a product or service (Leiss et al., 1986). Once TV commercials are
broadcast, consumers cannot access them again. By contrast, a corporate Web site is
able to deliver high volumes of information with unlimited storage. In this sense, Web
design is much more complex than traditional advertising.
Thirdly, the model indicates the important role of individual differences. As Activity
Theory has argued, different objects drive different activities and people have different
capabilities (Vygotsky, 1978). As a result, different motives for accessing Web sites and
different capabilities (e.g., Web literacy) should be considered in the study of WMC.
The Web is a new medium, and use of the Web can be seen as a learning situation. It is
undoubted that individual differences have an effect on consumers’ activities and social
interaction. Accordingly, individual factors, such as motivation and Web literacy should
be included in any study of WMC.
Finally, the model emphasises that a corporate Web site creates a virtual community,
where firms and consumers interact. Many studies have shown that CMC media can
generate emotional relations with an online community (e.g., Ogan, 1993; Rheingold,
1993). However, the affective side of human interaction has long been neglected in
communication studies (e.g., Aboulafia, Gould, and Spyrou, 1995; Craig, 1999; Peter
and Olson, 1990). To address this shortcoming, Activity theorists have postulated that
human cognition cannot be understood without considering human affect or emotion.
52
As a critical feature of any human activity, the emotional aspects of social interaction
should be included (Suh, Couchman, and Park, 2003).
2.5.5 The Key Constructs of the WMC
This section discusses about the important constructs of the WMC derived from the
literature, which leads in to the research model and hypotheses in Chapter 4. Web site
typology, social interaction, individual differences (e.g., Web literacy, motives, and
gender), and attitude and behavioural measures (e.g., attitude toward the Web site and
revisit intention) are included. Web site typology will be a predictor, social interaction
as a mediator, and individual difference as a moderator, while attitude and behavioural
measures will be used as criterion variables. Each construct is defined and the marketing
application of these constructs is discussed.
(1) Web Site Typology
Content and structure are two basic elements that determine the type of Web site (e.g.,
Huizingh, 2000; McCready, 1997). In a marketing communication context, it is
frequently said that content is “what is said” and structure is “how it is said”. In other
words, content refers to the communication message and structure means a manner of
organisation of a Web site. As a Web site utilises a wider range of content and structural
elements than traditional advertising, a typical advertising typology (e.g., slice-of-life,
comparison, and demonstration) cannot be applied to a Web site. In this section, the
traditional advertising literature as well as the WMC literature will be drawn on to
develop a systematic basis for formulating a Web site typology.
53
It is argued that different types of Web site content (i.e., what is said) and Web site
structure (i.e., how it is said) will create different effects on consumer’s interaction with
a corporate Web site (e.g., Escalas, Jain, and Strebel, 1994). Thus, several WMC
scholars have focused on the effectiveness of a Web site type (e.g., Bruner and Kumar,
2000; Choi, 2000; Choi et al., 2001; Dalal, Quible, and Wyatt, 2000; Escalas et al.,
1994; Huizing, 2000; Li and Bukovac, 1999). Generally different Web site types have
yielded different effects on consumer attitudes. For example, Escalas et al. (1994) have
reported that a well-organised Web site increased consumer satisfaction. Dalal et al.
(2000) overall regardless of a Web site is graphic-based vs. text-based design. Choi
(2000) has found that a Web site with an animated human character generated higher
social presence than a Web site without an animated character.
For the last two decades, the effect of advertisement types has been the main interest of
marketing scholars. Traditional advertising effectiveness studies have dominantly
focused on whether a specific element is present or absent in advertisements (e.g.,
McQuarrie and Mick, 1999; Scott, 1994; Stewart and Koslow, 1989). However,
previous research on traditional advertising often has yielded different conclusions
about the effectiveness of a particular element (Laskey, Fox, and Crask, 1994).
Accordingly, many researchers (e.g., Dyer, 1982; Laskey et al., 1994) have argued that
the traditional approach (i.e., atomistic) is problematic and have suggested adopting a
holist approach for classifying advertising types. Here it would be beneficial to examine
the difference between two approaches.

54
There are two competing approaches to investigate a typology of Web sites: atomistic
(or mechanistic) and holistic approaches (e.g., Schutt, 1996). First of all, an atomistic
approach has emphasised the presence or absence of a particular element of a Web site
(such as text, sound, images, etc.). Many of the advertising effectiveness studies to date
have been based on the atomistic approach, and verbal (or text-based) versus visual (or
graphic-based) message types have been very popular. Using this approach, traditional
advertising studies have generally found that a visual type is more effective than a
verbal type (e.g., Landoni and Gibb, 2000; McQuarrie and Mick, 1999; Scott, 1994;
Stewart and Koslow, 1989), although there have been some controversies. This
approach has recently been applied to a Web site typology study (e.g., Choi, 2000; Li
and Bukovac, 1999).
By contrast, the holistic approach has been based on the Gestalt psychology, which has
asserted that people understand the universe as an organised whole, not an elementary
part (Gray, 1991). This approach, therefore, seeks to identify the pattern of a Web site,
which is a group of elements as a whole (e.g., Mardrazo, 1996). Laskey et al. (1994,
p.9) explain that
“Rather than focusing on individual elements of a commercial, one could
examine types of commercials identified by their dominant executional focus.
The distinction between studying these basic executional styles, instead of
executional elements, is an analogous to examining personality types rather than
personal traits. Focusing on executional styles would allow advertisers to assess
the effectiveness of a small number of basic executional types, defined by a
commercial’s dominant executional focus, instead of being concerned about the
55
individual building blocks of a commercial”.
Recently many researchers have adopted this approach in classifying advertising types
(e.g., Laskey et al., 1994; Suh, 1995). Based on this approach they have classified
televisional commercials into many different categories such as narration,
demonstration, fantasy, and so forth. While several researchers (e.g., Berners-Lee, 1989;
Jackson, 1997) have suggested adopting a holistic approach in WMC, there are only few
studies which have applied a holistic approach (e.g., Cappel and Myerscough, 1997;
Huizing, 2000; Koehler, 1999). Regarding Web site structure, Koehler (1999) has
classified a Web site into five types: text dominant, graphic dominant, multimedia
dominant, file retrieval dominant, and E-mail dominant. Huizing (2000) has classified
Web site content, based on the functions of a Web site, into information (e.g.,
background company, specific products, and non-commercial), transaction (e.g., request
for proposals, and ordering feature), and entertainment types. Cappel and Myerscough
(1997) have suggested five Web site content types such as marketplace awareness,
customer support, sales, advertising, and electronic information services. However,
these studies generally have lacked systematic investigation of Web sites. Furthermore,
the hybrid nature of Web sites (i.e., a Web site can include various hypermedia elements
and functions at the same time) has been neglected (Cappel and Myerscough, 1997).
(2) Classification Schemes for a Web Site Typology
Unlike traditional mass media advertising, a Web site delivers hypermedia (e.g.,
hyperlinks and multimedia) and multi-functions (e.g., advertising, PR, sales promotion,
online selling, and customer service), which are potential capabilities of a corporate
56
Web site as a marketing communication tool (Palmer and Griffith, 1998). Therefore, the
way in which to organise a Web site is one of the important marketing activities for
firms (e.g., Berthon, Pitt, Katsikeas, and Berthon, 1999).
Based on the distinctive characteristics of a Web site, as discussed in Section 2.1.1, this
study proposes a Web site typology in terms of structure and content (Table 2.1). The
items of a Web site structure include five elements of hypermedia: text, images, audio,
video, and hyperlinks. Each element has included items. For instance, items for text are
headline and descriptive text, while images include company logos and photographs.
Web site content contains five elements of the Web function: advertising, PR, sales
promotion, online selling, and customer service. Each element includes specific items.
This study attempts to adopt a holistic approach to classify Web sites. Based on
classification schemes the researcher can identify the dominant focus of Web site
structure and content. For instance, this classification scheme can be used as a basis of
Content Analysis, which is discussed in Chapter 3 of this thesis. The study of Web site
typology is still in its infancy. Many scholars have argued that one hindrance is a lack of
any guidelines to manage effective Web sites (e.g., Bieber and Isakowski, 1995). This
classification scheme could provide a strong basis for the study of Web site
effectiveness.
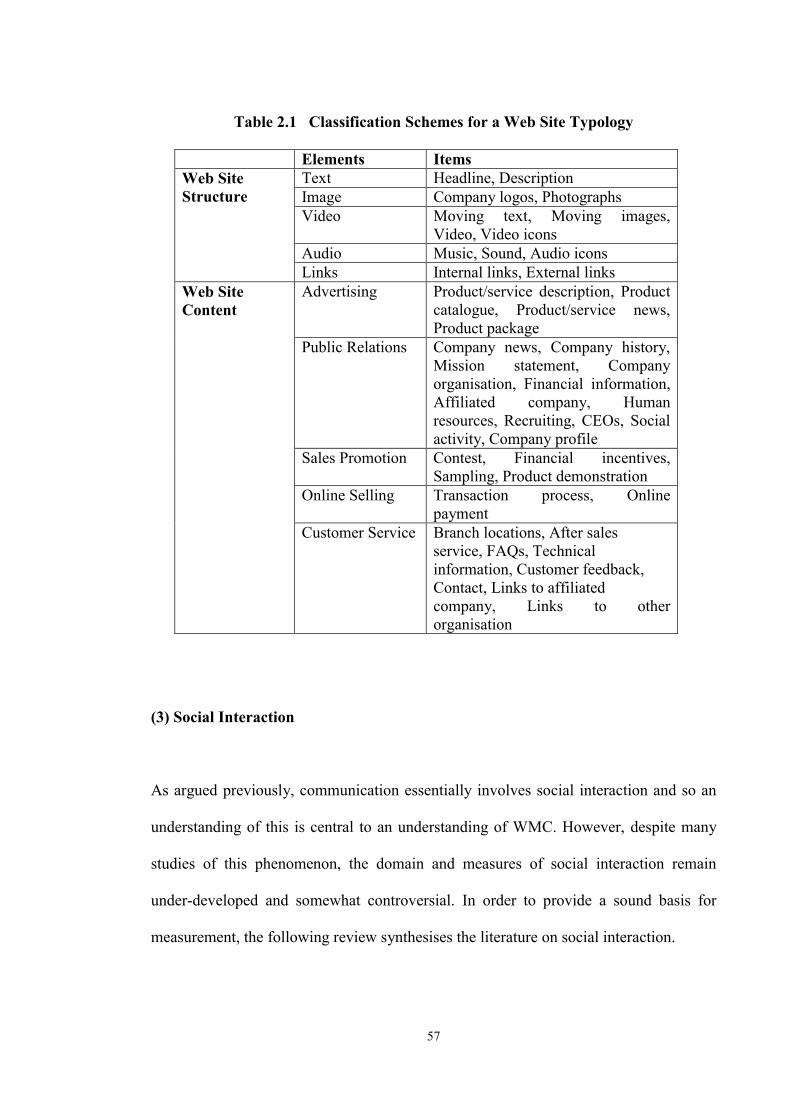
57
Table 2.1 Classification Schemes for a Web Site Typology
Elements Items Text Headline, Description Image Company logos, Photographs Video Moving text, Moving images,
Video, Video icons Audio Music, Sound, Audio icons
Web Site Structure
Links Internal links, External links Advertising Product/service description, Product
catalogue, Product/service news, Product package
Public Relations Company news, Company history, Mission statement, Company organisation, Financial information, Affiliated company, Human resources, Recruiting, CEOs, Social activity, Company profile
Sales Promotion Contest, Financial incentives, Sampling, Product demonstration
Online Selling Transaction process, Online payment
Web Site Content
Customer Service Branch locations, After sales service, FAQs, Technical information, Customer feedback, Contact, Links to affiliated company, Links to other organisation
(3) Social Interaction
As argued previously, communication essentially involves social interaction and so an
understanding of this is central to an understanding of WMC. However, despite many
studies of this phenomenon, the domain and measures of social interaction remain
under-developed and somewhat controversial. In order to provide a sound basis for
measurement, the following review synthesises the literature on social interaction.
58
From the 1950’s, many researchers have developed classification schemes of social
interaction in communication. Commonly there have been two key aspects of social
interaction: the task and affective dimension (e.g., Andres, 1996; Bales, 1950, Hare,
1960, Champness, 1973b; Hiltz and Johnson, 1990; McGrath, 1991; Van Dulmen,
1998; Walls, 1993). Particularly, as these dimensions have been developed and applied
to mediated communication situations, they will also serve as rigorous measures for
WMC.
The task dimension of social interaction refers to the achievement of the communication
task. The task domain is regarded as a cognitive function of human interaction.
Therefore, it is measured by a subjective perception in relation to communication
quality (e.g., Hiltz and Turoff, 1978; Olaniran, 1993; Rice and Love, 1987). The most
frequently utilised measures for communication quality are perceived usefulness and
perceived ease of use (Davis, 1989). Perceived usefulness refers to the extent to which a
user believes that using the communication medium will enhance task performance
(Davis, 1989). Perceived ease of use of a medium refers to the extent to which users
believe that using the communicating medium will be free of effort (Davis, 1989).
Many researchers argue that task-related interaction measures are strongly relate to the
acceptance and use of communication media (e.g., El-Shinnawy and Markus, 1998,
Davis, 1989; Swanson, 1987). Many studies have applied these measures in assessing
Web site effectiveness. These studies have found that both perceived usefulness and
perceived ease of use are strong predictors of attitude and behavioural intention. For
instance, Gefen and Straub (2000) have identified that the more users perceived a Web
59
site as useful, the higher their purchase intention is. Such measures can be will be
applied in this study as cognitive measures of social interaction.
The affective dimension of social interaction refers to the emotional aspects including
positive and negative feelings. This domain is an affective function of social interaction.
Accordingly, it is assessed by consumers’ feelings in relation to communication (e.g.,
Biocca, 1997; Burgoon and Hale, 1987; Champness, 1973a and b; Culter, 1995;
Garrison, Anderson, and Archer, 2001; Mason, 1994; Mclassac and Gunawardena,
1996; McLellan, 1996; Nowak, 2001; Rourke, Anderson, Garrison, and Archer, 1999;
Spears and Lea, 1992; Sproull and Kiesler, 1986; Storck and Sproll, 1995; Walther,
1992). Social presence is one of the commonly-used measures for the affective domain
of social interaction. Social presence is defined as “the user’s feeling that she or he is
interacting with others (e.g., Biocca, 1997; Champness, 19731, Short et al., 1976; Suh,
Hasan, and Couchman, 2003; Suh, Hasan, Couchman, and Lee, in press). Recently
social presence has been applied to marketing communication (e.g., Choi, 2000; Choi et
al., 2001; De Greef and Ijsselsteijn, 2000). Choi (2000) found that there were positive
relationships between social presence and communication effect measures (e.g., attitude
toward the advertisement, revisit intention, and attitude toward the brand). De Greef and
Ijsselsteijn (2000) also identified that both measures are correlated. Social presence can
be regarded as a precedent of the attitude toward the Web site. This measure will be
utilised in this study as an affective measure of social interaction.
60
(4) Individual Differences
The Web is premised on the non-linear nature of hypermedia so it allows the users a
great deal of control (Jonassen and Grabinger, 1990; Reed and Oughton, 1997).
However, the level of control is dependent upon the users’ navigation ability. In other
words, while experienced users would fully utilise the hypermedia capability of a Web
site, those with little experience would not fully navigate a Web site. The user’s ability
is a very important concept in that it ultimately shapes the nature of the consumer-
marketer interaction (Stewart and Pavlou, 2002). Accordingly, it is crucial for Web
designers and marketers to understand consumer ability and cultural factors.
Unfortunately, although many researchers (e.g., Jonassen, 1988) have advocated the
necessity of studies of individual differences, only a handful of researchers to date have
explored the effect of individual differences in WMC (Chen and Ford, 1999).
Here individual differences refer to the dissimilarities in individual characteristics of
consumers, which affect communication process and outcomes (e.g., Agarwal and
Prasad, 1999; Zahedi, van Pelt, and Song, 2001). Consumers differ in their abilities,
skills, culture and they interpret marketing information in different ways based on these
differences. Individual differences have a diverse range of factors including
demographic, behavioural, psychological and cultural. For instance, some researchers
(e.g., Abdul-Gader, 1996; Schumitz and Fulk, 1991) have identified that usage,
experience and skills influence the use of new media.
Other researchers (e.g., Gilroy and Desai, 1986; Thorson, 1990) suggest that motivation
is also an important factor as well as skills and ability. The most frequently investigated
61
individual differences in terms of mediated communication situations are sex, usage
(length of time using a specific medium), prior experience, learning, knowledge, skills,
self-efficacy, motives (or motivations) and culture (e.g., Agarwal and Prasad, 1999;
Canary and Hause, 1993; Chu, 1999; Compeau, Higgins, and Huff, 1999; Escalas et al.,
2001; Huizingh, 2000; Ju-Pak, 1999; Kayany and Yelsma, 2000; Papacharissi and
Rubin, 2000; Stewart et al., 2001; Tripp, 2001; Zahedi et al., 2001; Zhang and Gelb,
1996).
This study focuses on three distinctive individual characteristics of consumers: Web
literacy, and motives. This section reviews what is known about each of the individual
characteristics with respect to WMC.
(5) Web Literacy
Web literacy can be defined as an ability to actively explore and obtain information
from a Web site (Suh and Couchman, 2003), which encompasses a complex set of
factors including experience, knowledge, and skills that determine an individual ability
to navigate the Web and manage their interaction with Web sites. Web literacy reflects a
users ability to manage the distinctive features of the Web, including hypermedia and
interactivity. The results of many studies indicate that Web literacy is closely related to
experience, usage levels, and self-efficacy (Abdul-Gader, 1996; Cassidy and Eachus,
2001; Schmitz and Fulk, 1991). For example, Lazonder, Biemans, and Wopereis (2000)
demonstrated that people who have more Web experience were better able to search the
Web. Many other studies supported this finding (e.g., Carlson and Zmud, 1999;

62
Fenichel, 1981; Hirsch, 1997; Jacobson and Fusani, 1992; McDonald and Stevenson,
1998; Patel, Drury, and Shalin, 1998; Reed and Oughton, 1997).
In addition, prior usage of and familiarity with the medium, which include not only the
specific medium (e.g., a Web site) but also other related technologies such as personal
computers, or their peripherals is also positively related to the ability (e.g., Agarwal and
Prasad, 1999; Escalas et al, 2001). Finally, self-efficacy, a person’s belief or confidence
about their ability to manage the Web (e.g., Bandura, 1977, 1982, and 1994), is closely
related to Web literacy. For example, Staples, Hulland, and Higgins (1998) have proved
that self-efficacy is positively related to online performance, a finding has been
supported by several studies (e.g., Nahl, 1996 and 1997; Ren, 1999).
Many studies have shown that various constructs such as literacy, experience, skills,
self-efficacy, familiarity, training, and knowledge are positively related to each other
and they represent the same construct which is “individual ability” (e.g., Agarwal,
Sambamurthy, and Stair, 2000; Cassidy and Eachus, 2001; Compeau and Higgins,
1995; Dishaw, Strong, and Bandy, 2002; Eastin and LaRose, 2000; Marcolin, Compeau,
Munro, and Huff, 2000). Accordingly, it can be concluded that Web literacy
encompasses a complex set of factors including experience, confidence, and familiarity
that determines a person’s ability to interact with Web sites.
(6) Motive
In a marketing communication context, “Uses and Gratifications Theory” is one useful
approach to study consumers’ media use. “Uses and Gratifications” scholars have
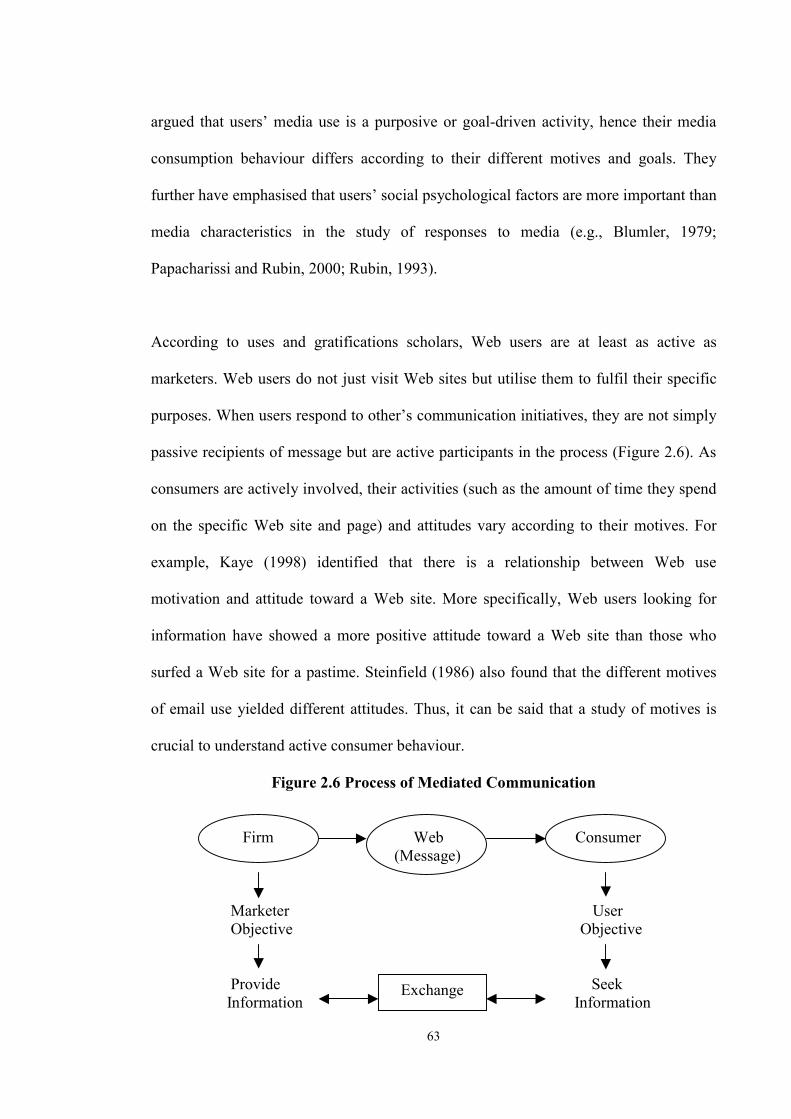
63
argued that users’ media use is a purposive or goal-driven activity, hence their media
consumption behaviour differs according to their different motives and goals. They
further have emphasised that users’ social psychological factors are more important than
media characteristics in the study of responses to media (e.g., Blumler, 1979;
Papacharissi and Rubin, 2000; Rubin, 1993).
According to uses and gratifications scholars, Web users are at least as active as
marketers. Web users do not just visit Web sites but utilise them to fulfil their specific
purposes. When users respond to other’s communication initiatives, they are not simply
passive recipients of message but are active participants in the process (Figure 2.6). As
consumers are actively involved, their activities (such as the amount of time they spend
on the specific Web site and page) and attitudes vary according to their motives. For
example, Kaye (1998) identified that there is a relationship between Web use
motivation and attitude toward a Web site. More specifically, Web users looking for
information have showed a more positive attitude toward a Web site than those who
surfed a Web site for a pastime. Steinfield (1986) also found that the different motives
of email use yielded different attitudes. Thus, it can be said that a study of motives is
crucial to understand active consumer behaviour.
Figure 2.6 Process of Mediated Communication Firm Web Consumer (Message) Marketer User Objective Objective Provide Seek Information Information
Exchange
64
An extensive review of the uses and gratifications literature has suggested that the most
robust dimensions of mass media use include entertainment, information, and irritation
(Luo, 2002). This classification is based on studies of traditional communication media.
As the Web is different from traditional mass media, motives for media use are also
likely to be different. Recently, many researchers have investigated the motivations of
Web use. For instance, December (1996) identified communication, interaction, and
information-seeking as three motives for Internet use. Similarly, Charney (1996) found
that information, entertainment, and communication were most conspicuous motives of
Web use through a study of university students. A user survey (GVU, 1998) also found
that three most important categories were information, entertainment, and shopping. On
the contrary, Kaye (1998) and Ebersole (2000) suggested more broad categories
including information, communication, entertainment, etc. Although definitions and
categories are somewhat different, it can be concluded that two most prominent
categories are gaining access to information and entertainment, which are common to
both the Web and traditional media. In a marketing communication setting, as
discussed before (see Section 2.4.3), a common motive of consumers and forms are the
exchange of information. Thus, this study will be conducted in an information-seeking
setting.
(7) Gender
Over the past several decades, numerous studies have focused on gender differences in
many areas including marketing, psychology, and communication. However, the
majority of the studies have found no significant gender differences. For instance,
through a meta-analysis of hundreds of studies, Canary and Hause (1993) concluded
65
that fifty years of research have yielded no significant differences between males and
females on communication effects. Several studies on email and the Web use also have
reported similar results (Li, Kuo, and Russell, 1999; Steinfield, 1986). Usually, the
presence of small gender differences can be explained by other socio-cultural factors
such as experience and education (e.g., Canary and Hause, 1993; Hamilton, 1995;
Kayany and Yelsma, 2000). On the basis of these findings, it was decided not to use
gender as an independent variable in the study (e.g., Canary and Hause, 1993; Tannen,
1990; Tripp, 2001).
(8) Attitude and Behavioural Measures
The ultimate goal of traditional advertising is usually to enhance transactions between
firms and consumers (e.g., selling products and services). Accordingly, marketers are
interested in sales volume or market share, which are frequently called “sales effects”.
However, these outcomes are often not accurate enough to measure the results of
marketing communication activities because they are influenced not only by marketing
communication variables but also by other marketing mix variables such as price or
product quality. Therefore, the use of sales effect measures has been little used for
assessing special marketing communication activities such as sales promotion, direct-
response advertising, or retail advertising (e.g., Belch and Belch, 1999; McDonald,
1993; Simon, 2001). Besides, they do not explain the underlying meanings behind
transactions. In other words, sales volume or market share do not tell why consumers
purchase certain products or services. However, the measurement of consumer attitudes
does. Different measures of consumer attitudes can explore various aspects of consumer
responses to marketing communication (McDonald, 1993). Traditionally, consumer

66
attitudes have been used to assess marketing communication effectiveness, an approach
which is called “communication effects” (e.g., Olson et al., 1982; Shimp, 1997).
However, the advent of Web sites as interactive marketing communication tools bring
new challenges with regard to measures of effectiveness. As Lavidge and Steiner (1961)
emphasised, measures of Web site effectiveness should be linked to the functions of a
corporate Web site. Different from traditional advertising, most corporate Web sites
perform multi-functions including advertising, public relations, sales promotion,
customer service, and online selling for broader target audiences (Suh, Couchman, and
Lee, 2002a). Accordingly, typical measures of brand advertising such as attitude toward
the brand (Ab) and purchase intention (PI) do not seem to be proper measures of Web
site effectiveness. Reflecting this trend, many researchers recommend attitude toward
the Web site (Aws) and revisit intention (RI) as new measures of Web site effectiveness
(e.g., Bruner and Kumar, 2000; Chen and Wells, 1999; Choi, 2000; Choi et al., 2001;
Davis, 1999; Loiacono, Chen, and Goodhue, 2002; Luo, 2002; O'Neill et al., 2001;
Stevenson et al., 2000; Suh and Couchman, 2003; Suh, Couchman, and Hasan, 2003;
Yoo and Donthu, 2001).
Attitude Toward the Web Site (Aws)
The basic logic of attitude toward the Web site (Aws) is analogous to attitude toward
the advertisement. Attitude has been a key construct in marketing communication and
consumer behaviour over the past 40 years. The most popularly cited definition of
attitude is as a “learned predisposition to respond to an object” (Allport, 1935, p. 810).
An attitude has been widely regarded as a “relatively stable and enduring predisposition
67
to behave,” hence it can be a “useful predictor of consumer behaviour toward a product
and service” (Mitchell and Olson, 1981, p. 318). Based on a widely-used definition of
attitude, attitude toward the Web site can be defined as “a predisposition to respond to a
Web site as a communication medium or partner”.
In a marketing context, it is generally agreed that attitude toward the object (e.g.,
attitude toward the advertisement, attitude toward the brand, and attitude toward the
Web site) have been treated as consumers’ overall feelings (e.g., Holbrook, 1978; Batra
and Ray, 1986; Mitchell and Olson, 1981). Thus, attitude toward the Web site can be
broadly defined as a multidimensional construct including affective and cognitive
dimensions. It is worth noting that attitude toward the Web site should be interpreted as
consumers’ overall evaluation of the Web site, but not as an objective quality of a Web
site (Arnold, 1960; Batra and Ray, 1986; Derbaix, 1995; Lutz, 1985; Mitchell and
Olson, 1981; Suh, Hasan, and Couchman, 2003). Many marketing communication
scholars (e.g., Bruner and Kumar, 2000; Chen and Wells, 1999; Choi, 2000; Choi et al.,
2001; Stevenson et al., 2000) have adopted this measure for assessing a Web site. Choi
(2000) found that there is a positive relationship between attitude toward the Web site
and revisit intention. This measure will be utilised as a criterion variable in this study.
Revisit Intention (RI)
Basically, behavioural intention measures a consumer’s expressed propensity to take
further action such as purchase, use, visit, consumption, inquiry, etc. (e.g., Aaker, Batra,
and Myers, 1992; Mowen, 1990). The most frequently used measure of behavioural
intention is purchase intention (PI). As mentioned before, whilst purchase intention is
68
appropriate when the main goal of a Web site is to encourage transaction (e.g., shopping
mall sites), this measure is less appropriate for corporate Web sites (Wansink and Ray,
1992). Recently many researchers argue that a universal goal of a corporate Web site is
building relationships with consumers, and to maintain good relationships and consumer
loyalty by attracting consumers to the Web site is essential (e.g., Brassington and Pettitt,
1997; Choi, 2000; Choi et al., 2001; Novak, Hoffman, and Yung, 2000; Suh,
Couchman, and Park, 2003; Suh, Hasan, and Couchman, 2003; Suh Hasan, Couchman,
and Park, in press). Therefore, attracting users to revisit the Web site seems to be a
critical factor in Web site effectiveness. Here revisit intention can be defined as a
consumer’s propensity to revisit a particular Web site.
Moreover, many advertising researchers have found that attitude toward the
advertisement has a positive effect on purchase intention (Batra and Ray, 1986;
Chaiken, 1980; Petty, Cacioppo, and Goldman, 1981; Cox and Locander, 1987; Mehta
and Purvis, 1997). Similarly, it has been found that attitude toward the Web site will
positively influence revisit intension (Bruner and Kumar, 2000, Choi, 2000, Choi et al.
2001). Thus, it is expected that attitude toward the Web site (Aws) would precede revisit
intention (RI). This measure will serve as a criterion variable in this study.
69
CHAPTER 3. PRELIMINARY RESEARCH
3.1 Introduction
The previous chapter discussed the distinctive features of a corporate Web site. As a
Web site is quite different from more traditional media, current methods for developing
a typology, based on traditional communication theories, may not work well in
predicting dynamic interaction between firms and consumers. It is clear that, despite
continued research efforts on the Web, to date systematic empirical research on a Web
site typology has been deficient. To address this issue, preliminary empirical research
was conducted. Accordingly, the purpose of this chapter is to describe a scheme for
classifying corporate Web sites into meaningful groups in terms of content and
structure.
This chapter describes an empirical investigation on a Web site typology based on
classification schemes this study explored in the previous chapter. This chapter
commences by discussing the methods used to classify Web sites including a general
description of content analysis, the sample, pretesting of the coding procedure, and
statistical analysis. Then, the results of the content analysis and the non-parametric
Mann-Whitney U test are discussed.
70
3.2 Methods
3.2.1 Content Analysis
To develop the typology, the Web sites of a sample of Australian and Korean
companies were content analysed. A corporate Web site is an outcome of a firm’s effort
to communicate with customers, so a study of the Web site can provide useful insights
into how marketing communication activities are used to provide information for
customers.
Content analysis is a purely descriptive technique that enables the systematic evaluation
of communication contents (Aaker, Kumar, and Day, 2001; Berelson, 1952; Cartwright,
1953; Holsti, 1969; Palmer and Griffith, 1998). It is one of the most widely used
methods for evaluating communication media including advertising (e.g., Yale and
Gilly, 1988). As Rourke and Anderson (2002) argue, content analysis is:
“systematic in the sense that a theoretical, a priori set of categories is constructed
into which communication content is classified. It is objective in the sense that
classification is rule-based and the reliability of classification is tested by having
multiple coders classify the same content. Its quantitative character is evident in
the process of converting communication content into discrete units and
calculating the frequency of occurrence of each unit “ (p.7).

71
Understanding what kinds of messages are presented and the hypermedia used on
corporate Web sites is a necessary step toward the evaluation of consumer attitudes
toward these marketing activities. Therefore, content analysis can provide a solid
foundation for theoretical development in marketing communication.
As Web sites range in size from one page to thousands of pages (Nowak, Shamp,
Hollander, and Cameron, 1999; Shneiderman, 1997), this study has focused on the
home page (i.e., the first page of a Web site that users encounter) because this is the
“gateway” to a Web site and as such plays a critical role for users much like an index or
a table of contents for a book (Dalal et al., 2000; Esrock and Leichty, 2000; Shiva,
1997). Focusing on the home page allows the standardised comparison of Web sites of
different companies.
In addition, the inclusion of both Australian and Korean Web site home pages of
companies, which were enlisted in the international financial resources directory (e.g.,
Wright Investors’ Service), not only reflects the international nature of the Web, but
also allowed the study to encompass a wide range of industries and company sizes.
Furthermore, the two countries play important roles in the Asia Pacific region and they
represent different perspectives on culture and industry structure, so the inclusion of
both countries enhanced the quality of the total sample frame helping to eliminate any
unintentional biases in the selection process.
Each Web site was evaluated by two judges who were experienced Web users and
bilingual Korean-English speakers. One judge was trained by the other to increase inter-
72
coder reliability (e.g., Kolbe and Burnett, 1991). The two judges coded the sampled
sites independently. Inter-coder reliability was determined through pre-testing.
On the basis of a literature review of Web-mediated marketing studies (e.g., Cockburn
and Wilson, 1996; Dholakia and Rego, 1998; Huizingh, 2000; McNaughton, 2001;
Palmer and Griffith, 1998; Perry and Bodkin, 2000; Simeon, 1999), a coding frame of
categories covering both Web site content (i.e., advertising, public relations, sales
promotion, online selling, and customer service) and Web site structure (i.e., text,
images, video, audio, and links) was generated as shown in Table 3.1 and 3.2. All
categories were mutually exclusive, with precise and unambiguous definitions (e.g.,
Holsti, 1969). As discussed in the previous chapter, advertising was defined as
messages related to a product or service to persuade potential customers to choose a
specific product or service. Public relations was defined as activities that use corporate-
related information to enhance corporate image or goodwill with broad publics. Sales
promotion was defined as an attempt to induce a customer to perform a specific action
within a short period of time. Online selling was defined as an online transaction such as
direct selling and buying products or services via a Web site. Customer service was
defined as the activities of answering customers, responding to customers, and solving
customer problems.
As shown in Table 3.1, the Web site content typology included five general categories
(i.e., advertising, public relations, sales promotion, online selling, and customer service)
with 27 items. The Web site structure typology encompassed five general categories
(i.e., text, images, video, audio, and links) with 13 items (Table 3.2). The coding of Web
site content was carried out between September and October 2001 (384 sites were
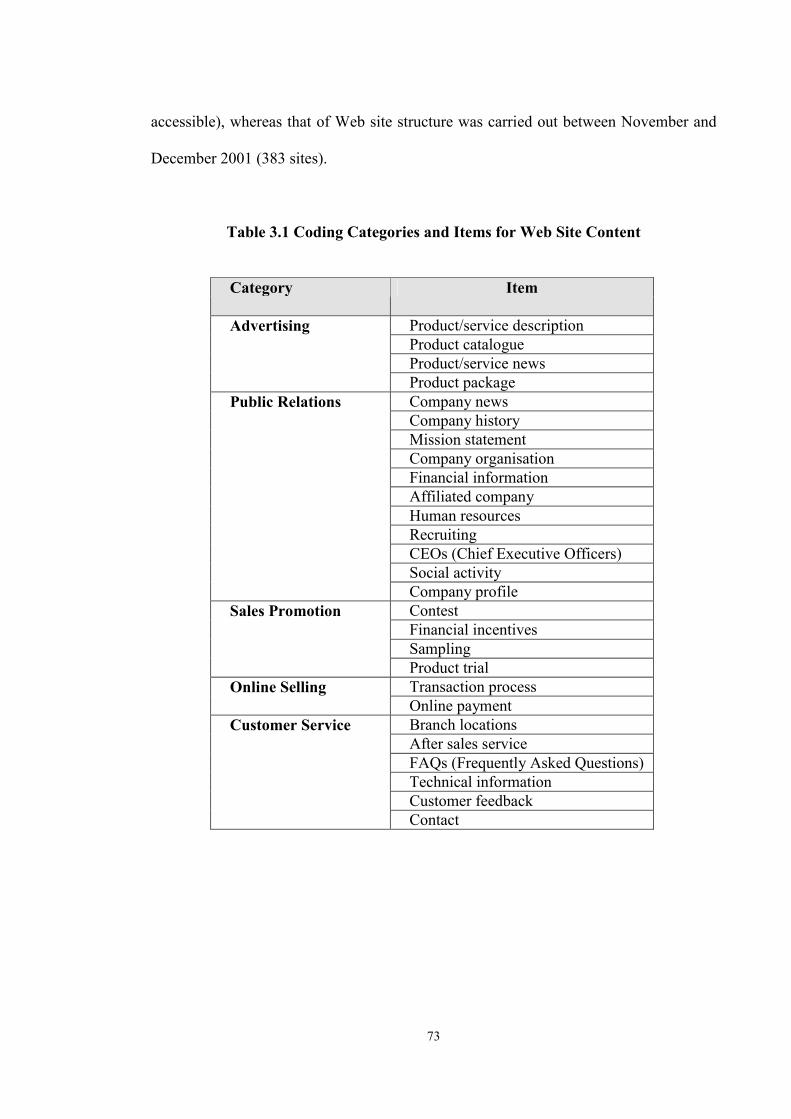
73
accessible), whereas that of Web site structure was carried out between November and
December 2001 (383 sites).
Table 3.1 Coding Categories and Items for Web Site Content
Category Item
Product/service description Product catalogue Product/service news
Advertising
Product package Company news Company history Mission statement Company organisation Financial information Affiliated company Human resources Recruiting CEOs (Chief Executive Officers) Social activity
Public Relations
Company profile Contest Financial incentives Sampling
Sales Promotion
Product trial Transaction process Online Selling Online payment Branch locations After sales service FAQs (Frequently Asked Questions) Technical information Customer feedback
Customer Service
Contact
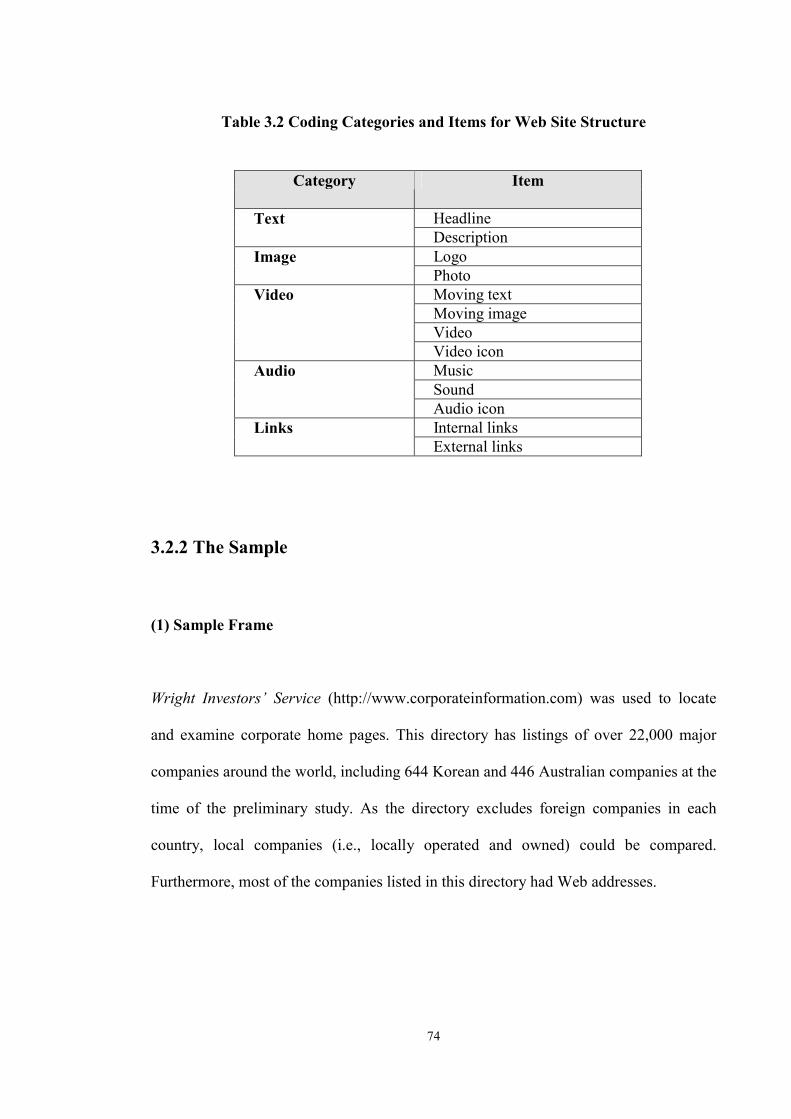
74
Table 3.2 Coding Categories and Items for Web Site Structure
Category Item
Headline Text Description Logo Image Photo Moving text Moving image Video
Video
Video icon Music Sound
Audio
Audio icon Internal links Links External links
3.2.2 The Sample
(1) Sample Frame
Wright Investors’ Service (http://www.corporateinformation.com) was used to locate
and examine corporate home pages. This directory has listings of over 22,000 major
companies around the world, including 644 Korean and 446 Australian companies at the
time of the preliminary study. As the directory excludes foreign companies in each
country, local companies (i.e., locally operated and owned) could be compared.
Furthermore, most of the companies listed in this directory had Web addresses.
75
(2) Sampling Procedure and Sample Size
The preliminary study utilised cluster analysis, which involves a large sample with more
than 100 units (Malhotra, 1996). To ensure a wide variation in company sizes and types
of industries, approximately 200 Web sites were selected from each country with equal
numbers of Australian and Korean companies (e.g., Berelson, 1952; Carney, 1972). 408
companies were selected by systematic sampling (every second company was selected
from the Australian list and every third from the Korean list). For the companies that
had no Web site addresses (URLs) in the Wright Investors’ Service directory, local
search engines were used to try to find their corporate Web sites. The Australian search
engines used were Webwombat (http://www.webwombat.com.au) and OzSearch
(http://www.ozsearch.com.au), whereas the Korean search engines were Simmani
(http://www.simmani.com) and Yahoo! Korea (http://kr.yahoo.com). As can be seen in
Appendix 3.1, a total of 386 Web site homepages were identified, including 190
Australian (43% of the Australian companies) and 196 Korean Web sites (30% of the
Korean companies). All Web sites were treated as one sample in cluster analysis.
(3) Sample Profile
Table 3.3 and 3.4 shows the distribution of company size and industry. First of all,
company size was measured by annual sales, which varied from under US $1,000 to
over $1 billion. Around half of the Australian firms had annual sales of over $50
million, compared with 83.6 % of the Korean companies (Table 3.3). In terms of
industry classification, the International Standard Industrial Classification (ISIC) was
adopted. More of the firms in the Korean sample were in the manufacturing sectors than
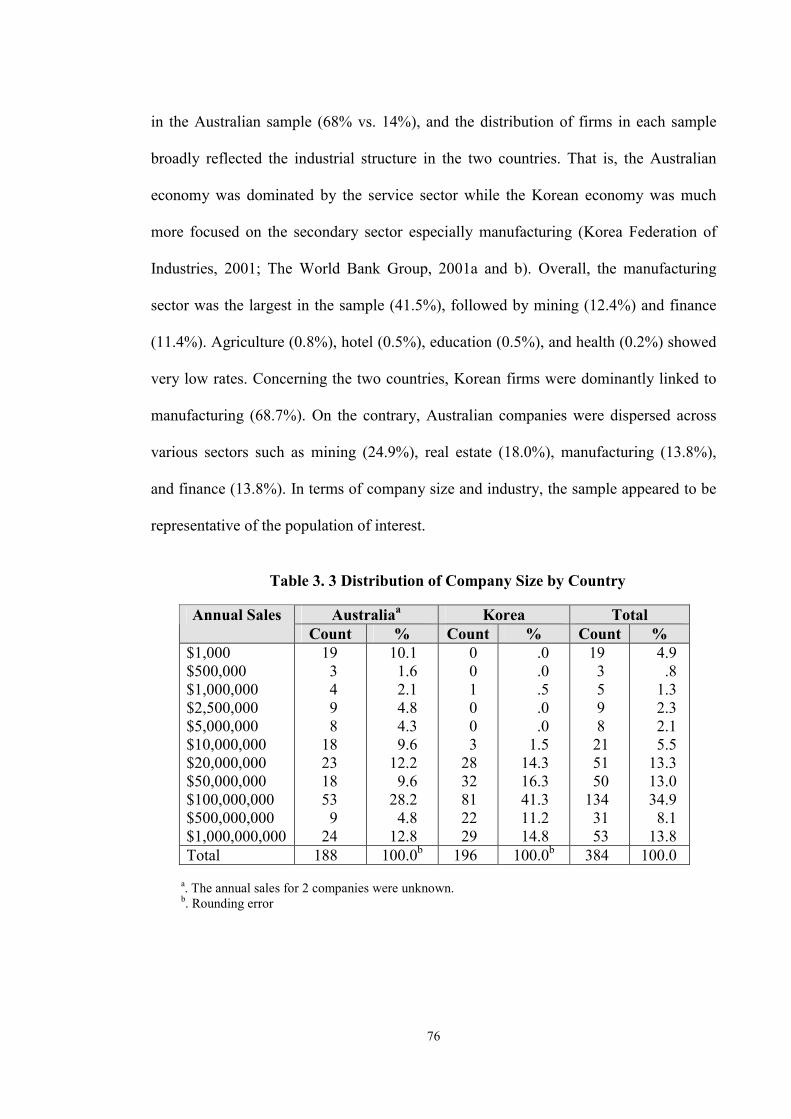
76
in the Australian sample (68% vs. 14%), and the distribution of firms in each sample
broadly reflected the industrial structure in the two countries. That is, the Australian
economy was dominated by the service sector while the Korean economy was much
more focused on the secondary sector especially manufacturing (Korea Federation of
Industries, 2001; The World Bank Group, 2001a and b). Overall, the manufacturing
sector was the largest in the sample (41.5%), followed by mining (12.4%) and finance
(11.4%). Agriculture (0.8%), hotel (0.5%), education (0.5%), and health (0.2%) showed
very low rates. Concerning the two countries, Korean firms were dominantly linked to
manufacturing (68.7%). On the contrary, Australian companies were dispersed across
various sectors such as mining (24.9%), real estate (18.0%), manufacturing (13.8%),
and finance (13.8%). In terms of company size and industry, the sample appeared to be
representative of the population of interest.
Table 3. 3 Distribution of Company Size by Country
Australiaa Korea Total Annual Sales
Count % Count % Count % $1,000 $500,000 $1,000,000 $2,500,000 $5,000,000 $10,000,000 $20,000,000 $50,000,000 $100,000,000 $500,000,000 $1,000,000,000
19 3 4 9 8 18 23 18 53 9 24
10.1 1.6 2.1 4.8 4.3 9.6 12.2 9.6 28.2 4.8 12.8
0 0 1 0 0 3 28 32 81 22 29
.0 .0 .5 .0 .0 1.5 14.3 16.3 41.3 11.2 14.8
19 3 5 9 8 21 51 50 134 31 53
4.9 .8 1.3 2.3 2.1 5.5 13.3 13.0 34.9 8.1 13.8
Total 188 100.0b 196 100.0b 384 100.0 a. The annual sales for 2 companies were unknown. b. Rounding error
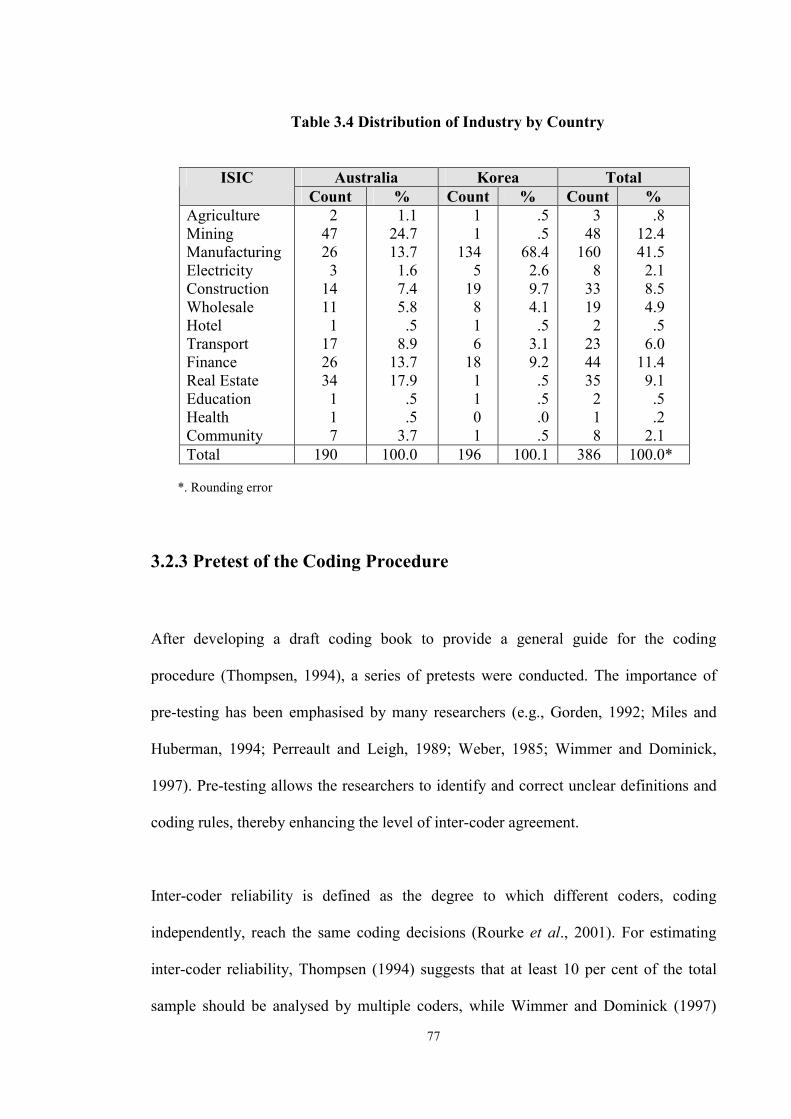
77
Table 3.4 Distribution of Industry by Country
Australia Korea Total ISIC Count % Count % Count %
Agriculture Mining Manufacturing Electricity Construction Wholesale Hotel Transport Finance Real Estate Education Health Community
2 47 26 3 14 11 1 17 26 34 1 1 7
1.1 24.7 13.7 1.6 7.4 5.8 .5 8.9 13.7 17.9 .5 .5 3.7
1 1 134 5 19 8 1 6 18 1 1 0 1
.5 .5 68.4 2.6 9.7 4.1 .5 3.1 9.2 .5 .5 .0 .5
3 48 160 8 33 19 2 23 44 35 2 1 8
.8 12.4 41.5 2.1 8.5 4.9 .5 6.0 11.4 9.1 .5 .2 2.1
Total 190 100.0 196 100.1 386 100.0* *. Rounding error 3.2.3 Pretest of the Coding Procedure
After developing a draft coding book to provide a general guide for the coding
procedure (Thompsen, 1994), a series of pretests were conducted. The importance of
pre-testing has been emphasised by many researchers (e.g., Gorden, 1992; Miles and
Huberman, 1994; Perreault and Leigh, 1989; Weber, 1985; Wimmer and Dominick,
1997). Pre-testing allows the researchers to identify and correct unclear definitions and
coding rules, thereby enhancing the level of inter-coder agreement.
Inter-coder reliability is defined as the degree to which different coders, coding
independently, reach the same coding decisions (Rourke et al., 2001). For estimating
inter-coder reliability, Thompsen (1994) suggests that at least 10 per cent of the total
sample should be analysed by multiple coders, while Wimmer and Dominick (1997)
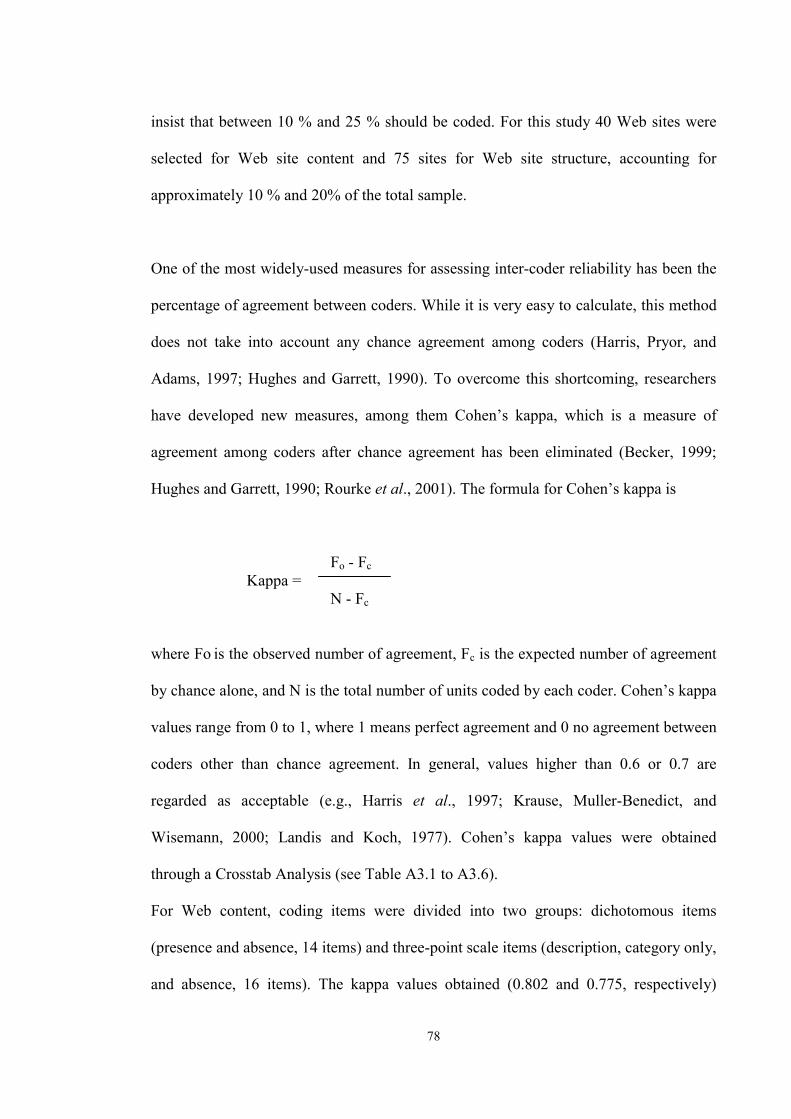
78
insist that between 10 % and 25 % should be coded. For this study 40 Web sites were
selected for Web site content and 75 sites for Web site structure, accounting for
approximately 10 % and 20% of the total sample.
One of the most widely-used measures for assessing inter-coder reliability has been the
percentage of agreement between coders. While it is very easy to calculate, this method
does not take into account any chance agreement among coders (Harris, Pryor, and
Adams, 1997; Hughes and Garrett, 1990). To overcome this shortcoming, researchers
have developed new measures, among them Cohen’s kappa, which is a measure of
agreement among coders after chance agreement has been eliminated (Becker, 1999;
Hughes and Garrett, 1990; Rourke et al., 2001). The formula for Cohen’s kappa is
Fo - Fc Kappa = N - Fc
where Fo is the observed number of agreement, Fc is the expected number of agreement
by chance alone, and N is the total number of units coded by each coder. Cohen’s kappa
values range from 0 to 1, where 1 means perfect agreement and 0 no agreement between
coders other than chance agreement. In general, values higher than 0.6 or 0.7 are
regarded as acceptable (e.g., Harris et al., 1997; Krause, Muller-Benedict, and
Wisemann, 2000; Landis and Koch, 1977). Cohen’s kappa values were obtained
through a Crosstab Analysis (see Table A3.1 to A3.6).
For Web content, coding items were divided into two groups: dichotomous items
(presence and absence, 14 items) and three-point scale items (description, category only,
and absence, 16 items). The kappa values obtained (0.802 and 0.775, respectively)
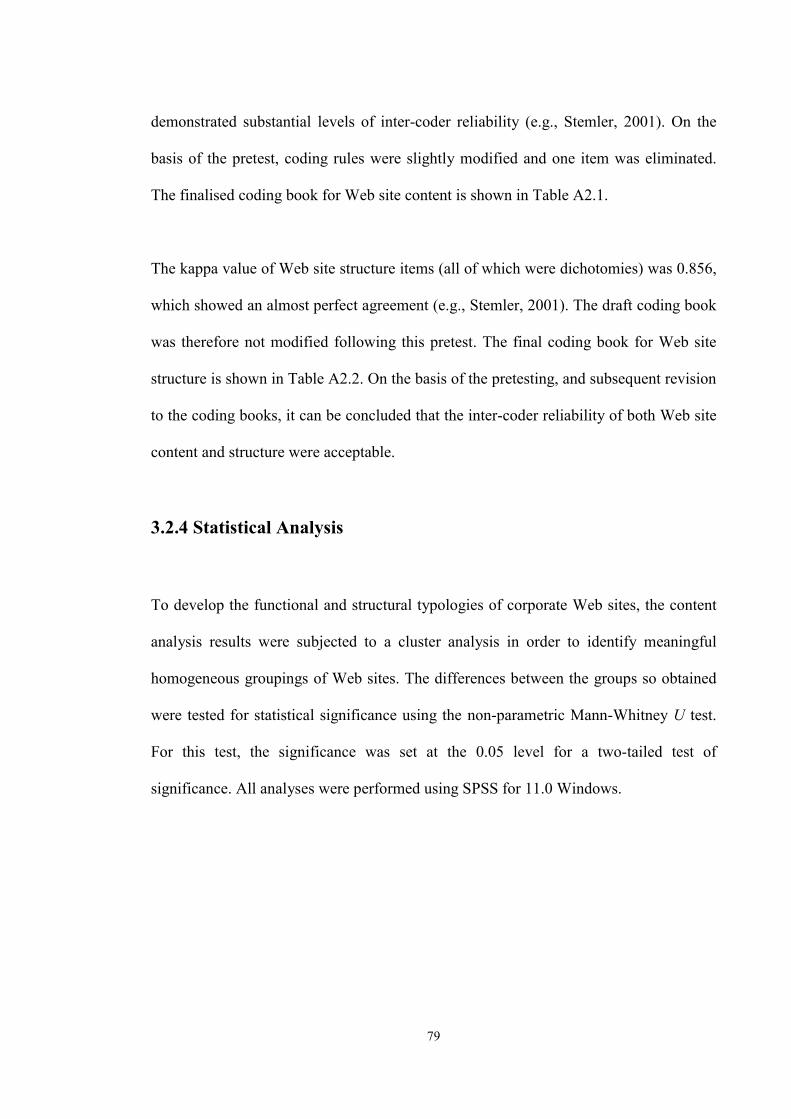
79
demonstrated substantial levels of inter-coder reliability (e.g., Stemler, 2001). On the
basis of the pretest, coding rules were slightly modified and one item was eliminated.
The finalised coding book for Web site content is shown in Table A2.1.
The kappa value of Web site structure items (all of which were dichotomies) was 0.856,
which showed an almost perfect agreement (e.g., Stemler, 2001). The draft coding book
was therefore not modified following this pretest. The final coding book for Web site
structure is shown in Table A2.2. On the basis of the pretesting, and subsequent revision
to the coding books, it can be concluded that the inter-coder reliability of both Web site
content and structure were acceptable.
3.2.4 Statistical Analysis
To develop the functional and structural typologies of corporate Web sites, the content
analysis results were subjected to a cluster analysis in order to identify meaningful
homogeneous groupings of Web sites. The differences between the groups so obtained
were tested for statistical significance using the non-parametric Mann-Whitney U test.
For this test, the significance was set at the 0.05 level for a two-tailed test of
significance. All analyses were performed using SPSS for 11.0 Windows.

80
3.3 Results
3.3.1 Web Site Content
(1) Functions of a Corporate Web Site
In general, corporate Web sites were found to deliver five functions of marketing
communication: advertising, public relations, sales promotion, online selling, and
customer service. The analysis of home page functions found that while advertising,
public relations, and customer service were frequently used, online selling, and sales
promotion functions were much less frequently used. As shown in Table 3.5, public
relations (97.4% of the home pages sampled used more than 1 item) was the most
frequently used function, followed by customer service (94.5%) and advertising
(83.6%). In contrast, online selling (21.1%) and sale promotion (13.3%) were still used
infrequently. In the category of public relations, there were more individual items than
for any other functions; that is, around 60% of corporate Web sites used more than four
items.
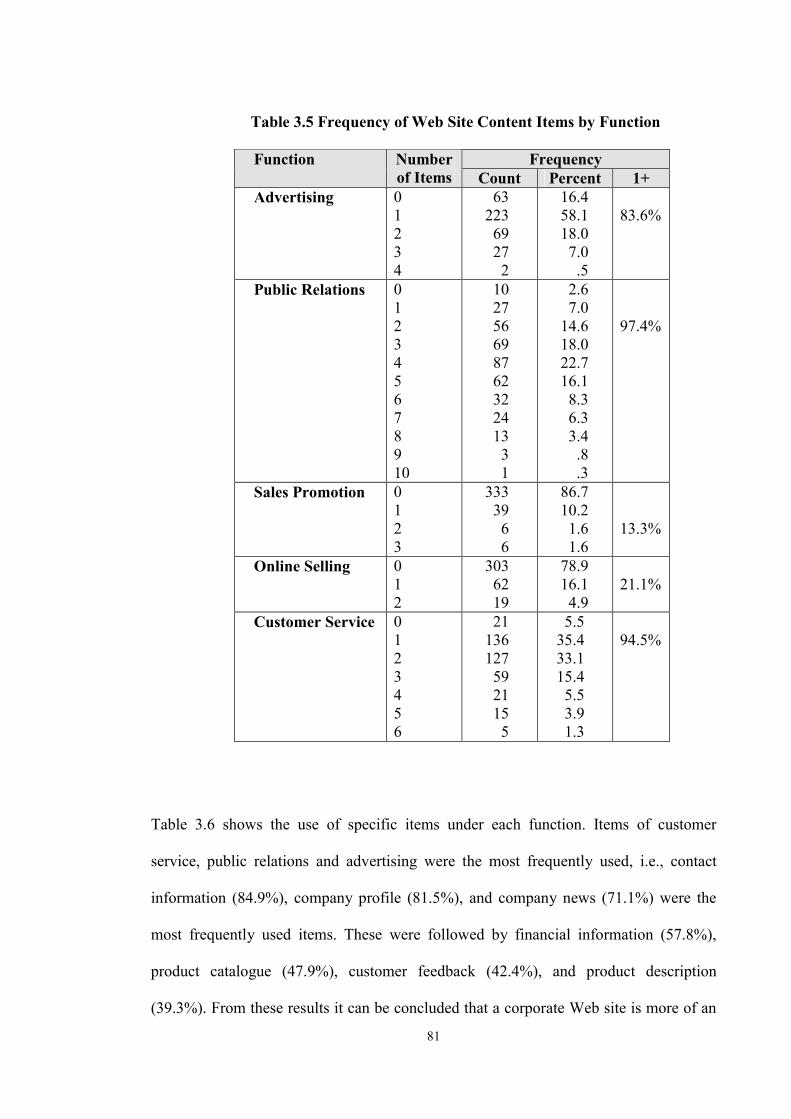
81
Table 3.5 Frequency of Web Site Content Items by Function
Frequency Function Number of Items Count Percent 1+
Advertising 0 1 2 3 4
63 223 69 27 2
16.4 58.1 18.0 7.0 .5
83.6%
Public Relations 0 1 2 3 4 5 6 7 8 9 10
10 27 56 69 87 62 32 24 13 3 1
2.6 7.0 14.6 18.0 22.7 16.1 8.3 6.3 3.4 .8 .3
97.4%
Sales Promotion 0 1 2 3
333 39 6 6
86.7 10.2 1.6 1.6
13.3%
Online Selling 0 1 2
303 62 19
78.9 16.1 4.9
21.1%
Customer Service 0 1 2 3 4 5 6
21 136 127 59 21 15 5
5.5 35.4 33.1 15.4 5.5 3.9 1.3
94.5%
Table 3.6 shows the use of specific items under each function. Items of customer
service, public relations and advertising were the most frequently used, i.e., contact
information (84.9%), company profile (81.5%), and company news (71.1%) were the
most frequently used items. These were followed by financial information (57.8%),
product catalogue (47.9%), customer feedback (42.4%), and product description
(39.3%). From these results it can be concluded that a corporate Web site is more of an
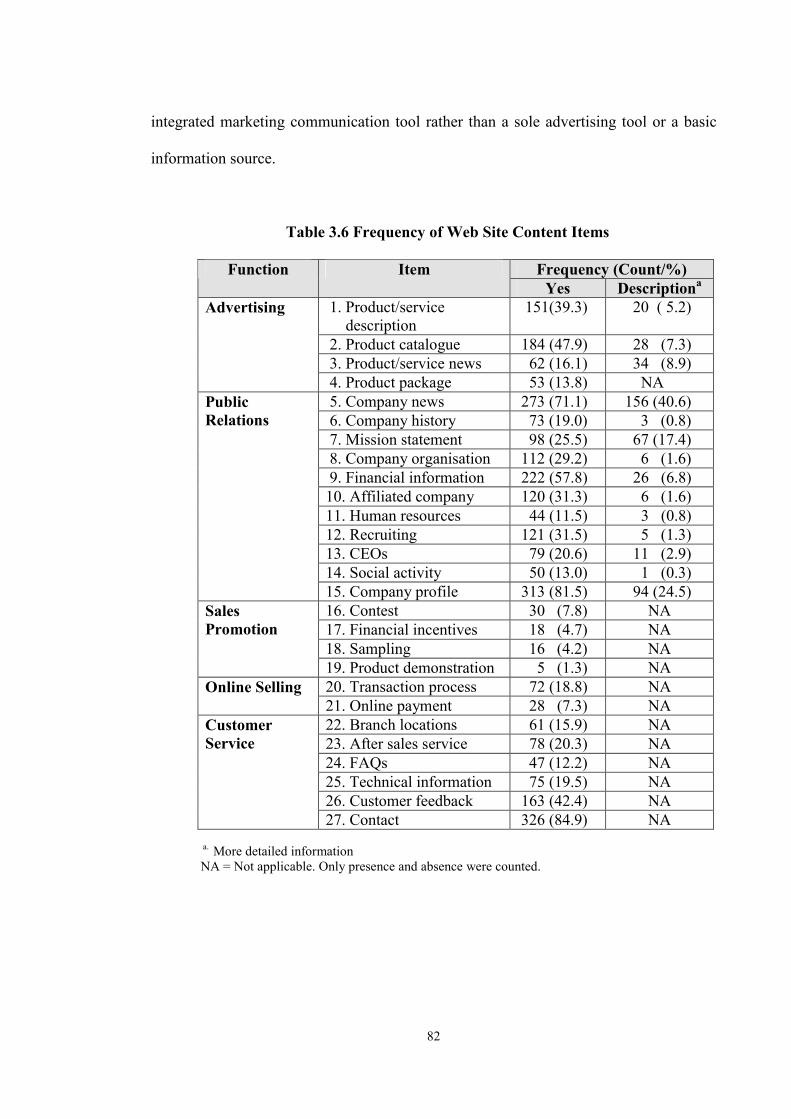
82
integrated marketing communication tool rather than a sole advertising tool or a basic
information source.
Table 3.6 Frequency of Web Site Content Items
Frequency (Count/%) Function Item Yes Descriptiona
1. Product/service description
151(39.3) 20 ( 5.2)
2. Product catalogue 184 (47.9) 28 (7.3) 3. Product/service news 62 (16.1) 34 (8.9)
Advertising
4. Product package 53 (13.8) NA 5. Company news 273 (71.1) 156 (40.6) 6. Company history 73 (19.0) 3 (0.8) 7. Mission statement 98 (25.5) 67 (17.4) 8. Company organisation 112 (29.2) 6 (1.6) 9. Financial information 222 (57.8) 26 (6.8) 10. Affiliated company 120 (31.3) 6 (1.6) 11. Human resources 44 (11.5) 3 (0.8) 12. Recruiting 121 (31.5) 5 (1.3) 13. CEOs 79 (20.6) 11 (2.9) 14. Social activity 50 (13.0) 1 (0.3)
Public Relations
15. Company profile 313 (81.5) 94 (24.5) 16. Contest 30 (7.8) NA 17. Financial incentives 18 (4.7) NA 18. Sampling 16 (4.2) NA
Sales Promotion
19. Product demonstration 5 (1.3) NA 20. Transaction process 72 (18.8) NA Online Selling 21. Online payment 28 (7.3) NA 22. Branch locations 61 (15.9) NA 23. After sales service 78 (20.3) NA 24. FAQs 47 (12.2) NA 25. Technical information 75 (19.5) NA 26. Customer feedback 163 (42.4) NA
Customer Service
27. Contact 326 (84.9) NA a. More detailed information NA = Not applicable. Only presence and absence were counted.
83
(2) Classification of the Web Site Content
The grouping of the corporate Web sites was performed by cluster analysis, based on 27
Web site content variables. For the cluster analysis all items were coded using a
dichotomy; i.e., 1 for presence and 0 for absence of a feature. A number of hierarchical
and non-hierarchical clustering methods were explored (e.g., Ward method, average
linkage, single linkage, centroid method, and k-means clustering). As this study did not
set a predetermined number of clusters, an hierarchical method was preferred (Malhotra
et al., 1996; Punj and Stewart, 1983). It was found that the hierarchical Ward’s
procedure produced the more stable and useable cluster solution (see also Klastorin,
1983; Punj and Stewart, 1983), so it was decided to use this method based on the
squared Euclidean distance between the variables. A two-cluster solution was selected
as most appropriate because, as shown in Figure 3.1, a dendrogram demonstrated a big
jump in the distance between clusters (Hair et al., 1995; Malhotra et al., 1996). The
larger cluster included mainly the public relations criterion such as company profile
(PRO), contact (CTC), company news (NWS), and financial information (FIN), on the
contrary, the smaller group included integrated information such as advertising (i.e.,
DES, CAT, and PAC), public relations (i.e., HIS, AFF, REC, etc.), sales promotion (i.e.,
CON, INC, etc.), online selling (i.e., TRA and PAY), and customer service (i.e., FEE,
ASS, etc.).
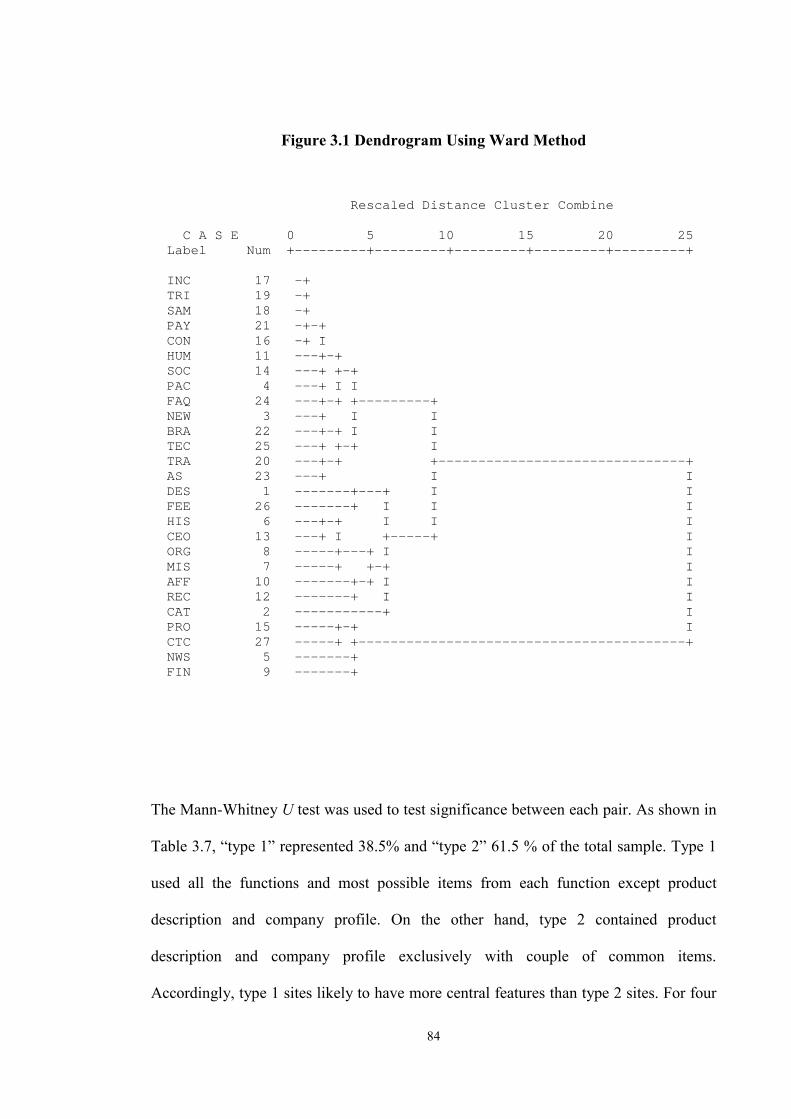
84
Figure 3.1 Dendrogram Using Ward Method
The Mann-Whitney U test was used to test significance between each pair. As shown in
Table 3.7, “type 1” represented 38.5% and “type 2” 61.5 % of the total sample. Type 1
used all the functions and most possible items from each function except product
description and company profile. On the other hand, type 2 contained product
description and company profile exclusively with couple of common items.
Accordingly, type 1 sites likely to have more central features than type 2 sites. For four
Rescaled Distance Cluster Combine
C A S E 0 5 10 15 20 25Label Num +---------+---------+---------+---------+---------+
INC 17 -+TRI 19 -+SAM 18 -+PAY 21 -+-+CON 16 -+ IHUM 11 ---+-+SOC 14 ---+ +-+PAC 4 ---+ I IFAQ 24 ---+-+ +---------+NEW 3 ---+ I IBRA 22 ---+-+ I ITEC 25 ---+ +-+ ITRA 20 ---+-+ +-------------------------------+AS 23 ---+ I IDES 1 -------+---+ I IFEE 26 -------+ I I IHIS 6 ---+-+ I I ICEO 13 ---+ I +-----+ IORG 8 -----+---+ I IMIS 7 -----+ +-+ IAFF 10 -------+-+ I IREC 12 -------+ I ICAT 2 -----------+ IPRO 15 -----+-+ ICTC 27 -----+ +-----------------------------------------+NWS 5 -------+FIN 9 -------+

85
items (i.e., company news, financial information, human resources, and contact
information) there was no statistically significant difference in usage between the two
clusters.
Based on the results of the Mann-Whitney U test, type 1 was named the “integrated
communication” type, which used more items of all the functions (i.e., advertising,
public relations, sales promotion, online selling, and customer service) excluding
product/service description and company profile. Type 2 was titled the “basic
information” type, which used more items in advertising (i.e., product/service
description) and public relations (i.e., company news, financial information, human
resources, and company profile from public relations). Company news, financial
information, and contact were commonly included in both types. Specific categories and
items of each type are as follows:
� Type 1 = “Integrated communication” type (38.5%): This type included
advertising (i.e., product catalogue, product/service news, and product package),
public relations (i.e., company news, company history, mission statement,
company organisation, financial information, affiliated company, human
resources, recruiting, CEOs, and social activity), sales promotion (i.e., contest,
financial incentives, sampling, and product demonstration), online selling (i.e.,
transaction process and online payment), and customer service (i.e., branch
locations, after sales service, FAQs, technical information, customer feedback,
and contact).
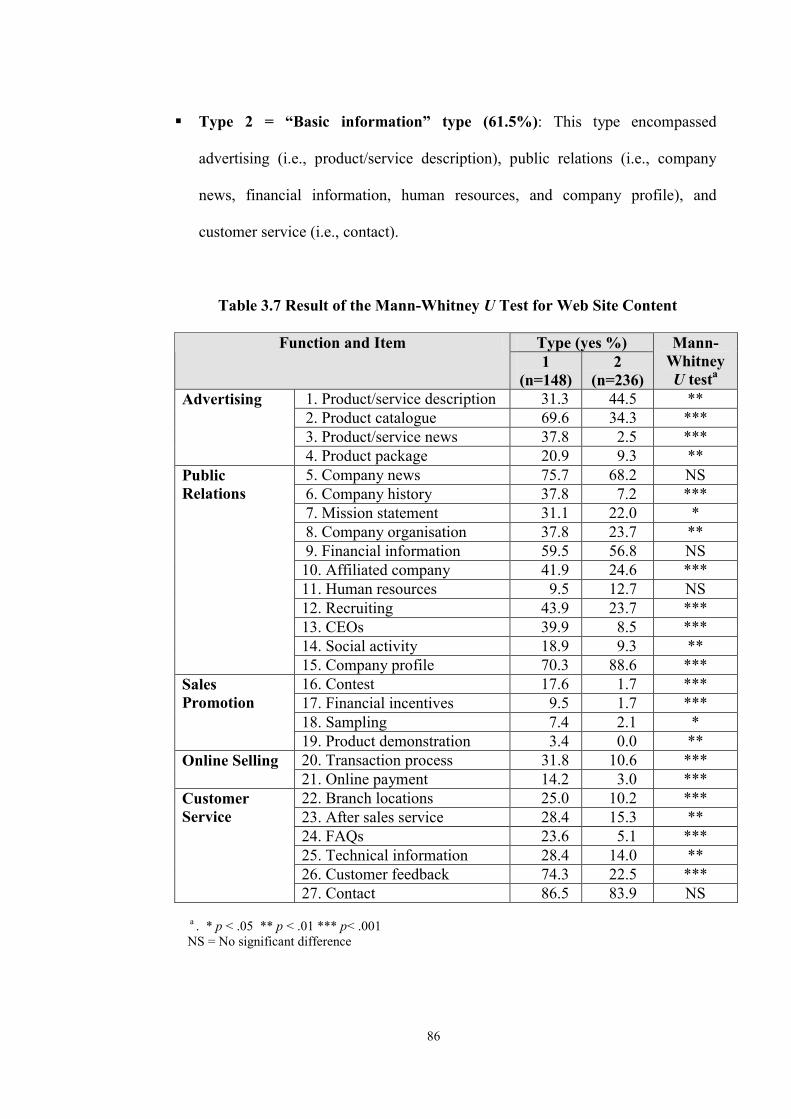
86
� Type 2 = “Basic information” type (61.5%): This type encompassed
advertising (i.e., product/service description), public relations (i.e., company
news, financial information, human resources, and company profile), and
customer service (i.e., contact).
Table 3.7 Result of the Mann-Whitney U Test for Web Site Content
Type (yes %) Function and Item 1
(n=148) 2
(n=236)
Mann-Whitney U testa
1. Product/service description 31.3 44.5 ** 2. Product catalogue 69.6 34.3 *** 3. Product/service news 37.8 2.5 ***
Advertising
4. Product package 20.9 9.3 ** 5. Company news 75.7 68.2 NS 6. Company history 37.8 7.2 *** 7. Mission statement 31.1 22.0 * 8. Company organisation 37.8 23.7 ** 9. Financial information 59.5 56.8 NS 10. Affiliated company 41.9 24.6 *** 11. Human resources 9.5 12.7 NS 12. Recruiting 43.9 23.7 *** 13. CEOs 39.9 8.5 *** 14. Social activity 18.9 9.3 **
Public Relations
15. Company profile 70.3 88.6 *** 16. Contest 17.6 1.7 *** 17. Financial incentives 9.5 1.7 *** 18. Sampling 7.4 2.1 *
Sales Promotion
19. Product demonstration 3.4 0.0 ** 20. Transaction process 31.8 10.6 *** Online Selling 21. Online payment 14.2 3.0 *** 22. Branch locations 25.0 10.2 *** 23. After sales service 28.4 15.3 ** 24. FAQs 23.6 5.1 *** 25. Technical information 28.4 14.0 ** 26. Customer feedback 74.3 22.5 ***
Customer Service
27. Contact 86.5 83.9 NS a . * p < .05 ** p < .01 *** p< .001 NS = No significant difference
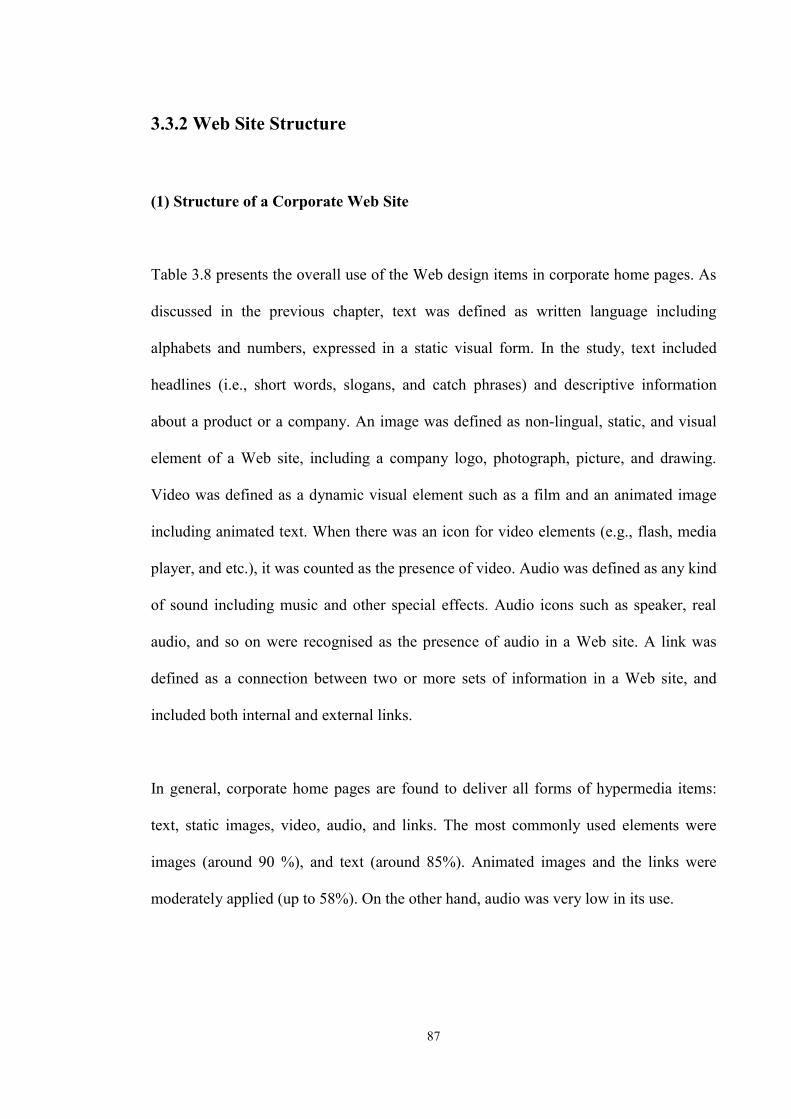
87
3.3.2 Web Site Structure
(1) Structure of a Corporate Web Site
Table 3.8 presents the overall use of the Web design items in corporate home pages. As
discussed in the previous chapter, text was defined as written language including
alphabets and numbers, expressed in a static visual form. In the study, text included
headlines (i.e., short words, slogans, and catch phrases) and descriptive information
about a product or a company. An image was defined as non-lingual, static, and visual
element of a Web site, including a company logo, photograph, picture, and drawing.
Video was defined as a dynamic visual element such as a film and an animated image
including animated text. When there was an icon for video elements (e.g., flash, media
player, and etc.), it was counted as the presence of video. Audio was defined as any kind
of sound including music and other special effects. Audio icons such as speaker, real
audio, and so on were recognised as the presence of audio in a Web site. A link was
defined as a connection between two or more sets of information in a Web site, and
included both internal and external links.
In general, corporate home pages are found to deliver all forms of hypermedia items:
text, static images, video, audio, and links. The most commonly used elements were
images (around 90 %), and text (around 85%). Animated images and the links were
moderately applied (up to 58%). On the other hand, audio was very low in its use.
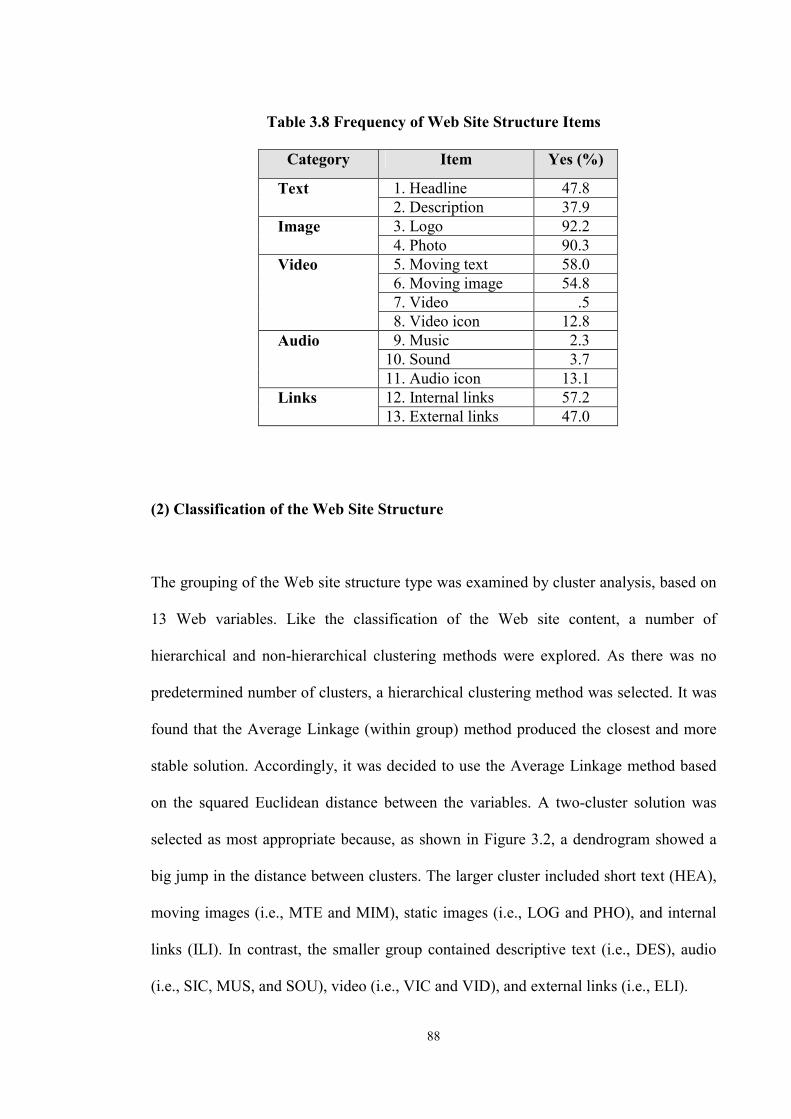
88
Table 3.8 Frequency of Web Site Structure Items
Category Item Yes (%)
1. Headline 47.8 Text 2. Description 37.9 3. Logo 92.2 Image 4. Photo 90.3 5. Moving text 58.0 6. Moving image 54.8 7. Video .5
Video
8. Video icon 12.8 9. Music 2.3 10. Sound 3.7
Audio
11. Audio icon 13.1 12. Internal links 57.2 Links 13. External links 47.0
(2) Classification of the Web Site Structure
The grouping of the Web site structure type was examined by cluster analysis, based on
13 Web variables. Like the classification of the Web site content, a number of
hierarchical and non-hierarchical clustering methods were explored. As there was no
predetermined number of clusters, a hierarchical clustering method was selected. It was
found that the Average Linkage (within group) method produced the closest and more
stable solution. Accordingly, it was decided to use the Average Linkage method based
on the squared Euclidean distance between the variables. A two-cluster solution was
selected as most appropriate because, as shown in Figure 3.2, a dendrogram showed a
big jump in the distance between clusters. The larger cluster included short text (HEA),
moving images (i.e., MTE and MIM), static images (i.e., LOG and PHO), and internal
links (ILI). In contrast, the smaller group contained descriptive text (i.e., DES), audio
(i.e., SIC, MUS, and SOU), video (i.e., VIC and VID), and external links (i.e., ELI).
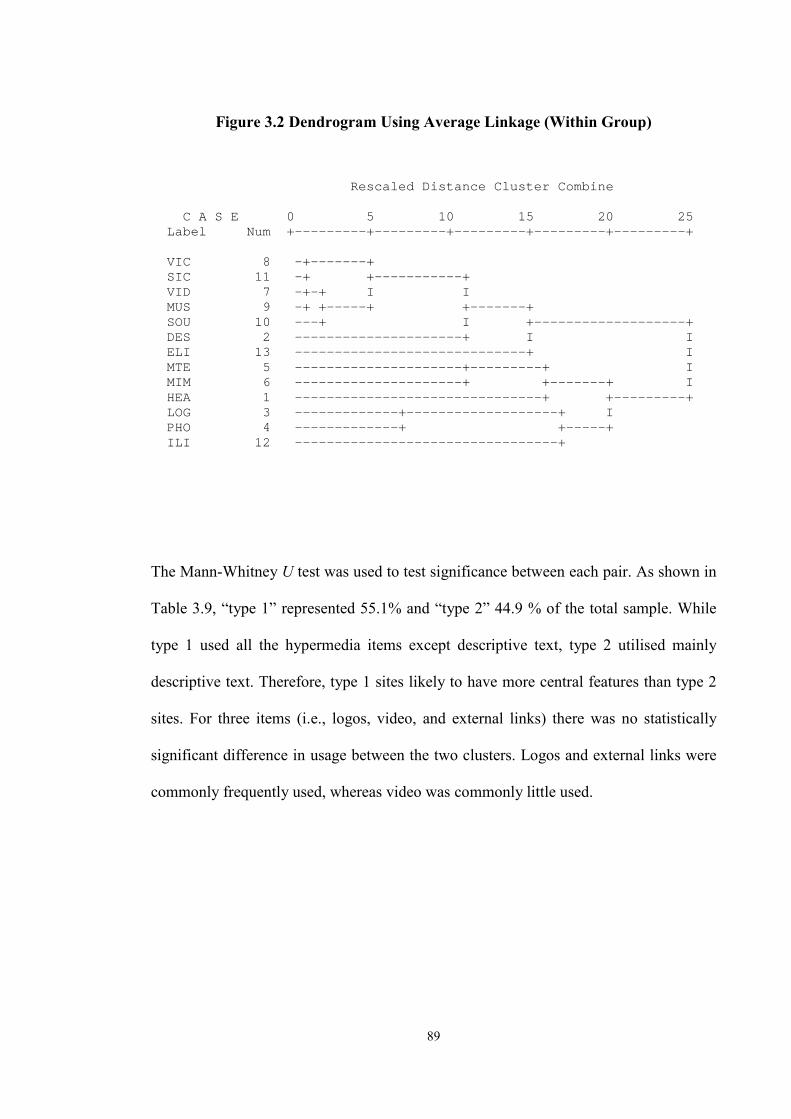
89
Figure 3.2 Dendrogram Using Average Linkage (Within Group)
The Mann-Whitney U test was used to test significance between each pair. As shown in
Table 3.9, “type 1” represented 55.1% and “type 2” 44.9 % of the total sample. While
type 1 used all the hypermedia items except descriptive text, type 2 utilised mainly
descriptive text. Therefore, type 1 sites likely to have more central features than type 2
sites. For three items (i.e., logos, video, and external links) there was no statistically
significant difference in usage between the two clusters. Logos and external links were
commonly frequently used, whereas video was commonly little used.
Rescaled Distance Cluster Combine
C A S E 0 5 10 15 20 25Label Num +---------+---------+---------+---------+---------+
VIC 8 -+-------+SIC 11 -+ +-----------+VID 7 -+-+ I IMUS 9 -+ +-----+ +-------+SOU 10 ---+ I +-------------------+DES 2 ---------------------+ I IELI 13 -----------------------------+ IMTE 5 ---------------------+---------+ IMIM 6 ---------------------+ +-------+ IHEA 1 -------------------------------+ +---------+LOG 3 -------------+-------------------+ IPHO 4 -------------+ +-----+ILI 12 ---------------------------------+
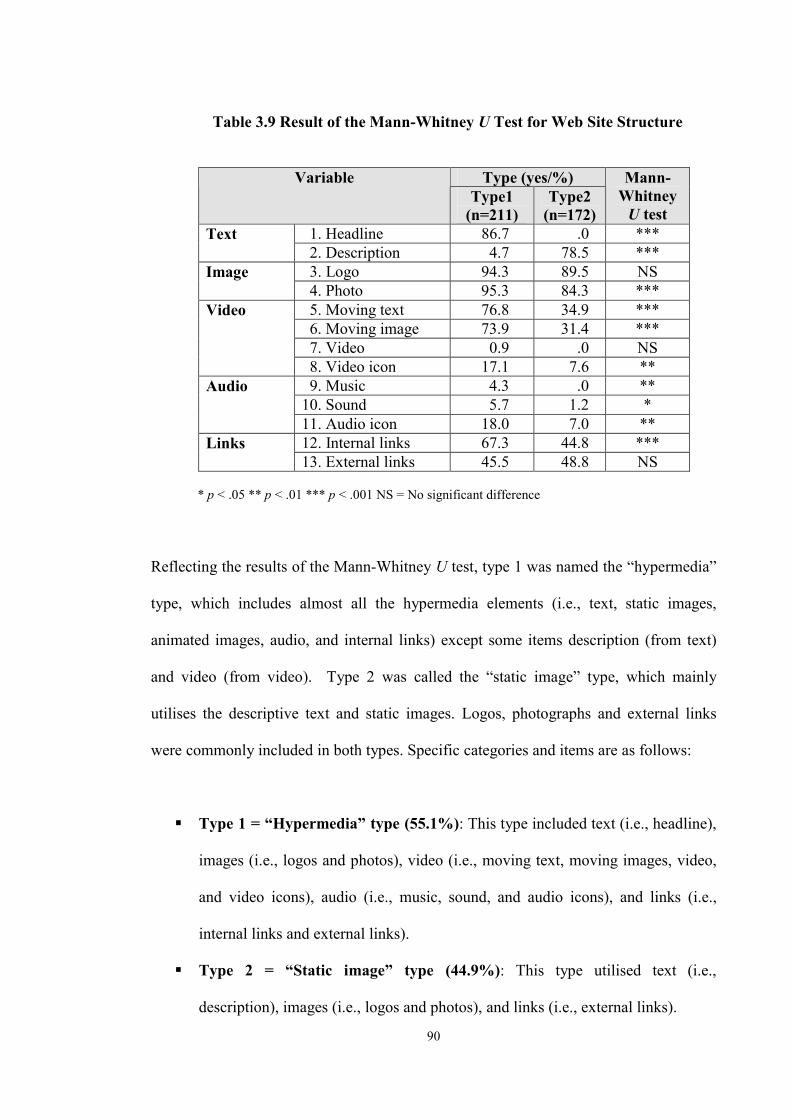
90
Table 3.9 Result of the Mann-Whitney U Test for Web Site Structure
Type (yes/%) Variable Type1
(n=211) Type2
(n=172)
Mann-Whitney
U test 1. Headline 86.7 .0 *** Text 2. Description 4.7 78.5 *** 3. Logo 94.3 89.5 NS Image 4. Photo 95.3 84.3 *** 5. Moving text 76.8 34.9 *** 6. Moving image 73.9 31.4 *** 7. Video 0.9 .0 NS
Video
8. Video icon 17.1 7.6 ** 9. Music 4.3 .0 ** 10. Sound 5.7 1.2 *
Audio
11. Audio icon 18.0 7.0 ** 12. Internal links 67.3 44.8 *** Links 13. External links 45.5 48.8 NS
* p < .05 ** p < .01 *** p < .001 NS = No significant difference Reflecting the results of the Mann-Whitney U test, type 1 was named the “hypermedia”
type, which includes almost all the hypermedia elements (i.e., text, static images,
animated images, audio, and internal links) except some items description (from text)
and video (from video). Type 2 was called the “static image” type, which mainly
utilises the descriptive text and static images. Logos, photographs and external links
were commonly included in both types. Specific categories and items are as follows:
� Type 1 = “Hypermedia” type (55.1%): This type included text (i.e., headline),
images (i.e., logos and photos), video (i.e., moving text, moving images, video,
and video icons), audio (i.e., music, sound, and audio icons), and links (i.e.,
internal links and external links).
� Type 2 = “Static image” type (44.9%): This type utilised text (i.e.,
description), images (i.e., logos and photos), and links (i.e., external links).
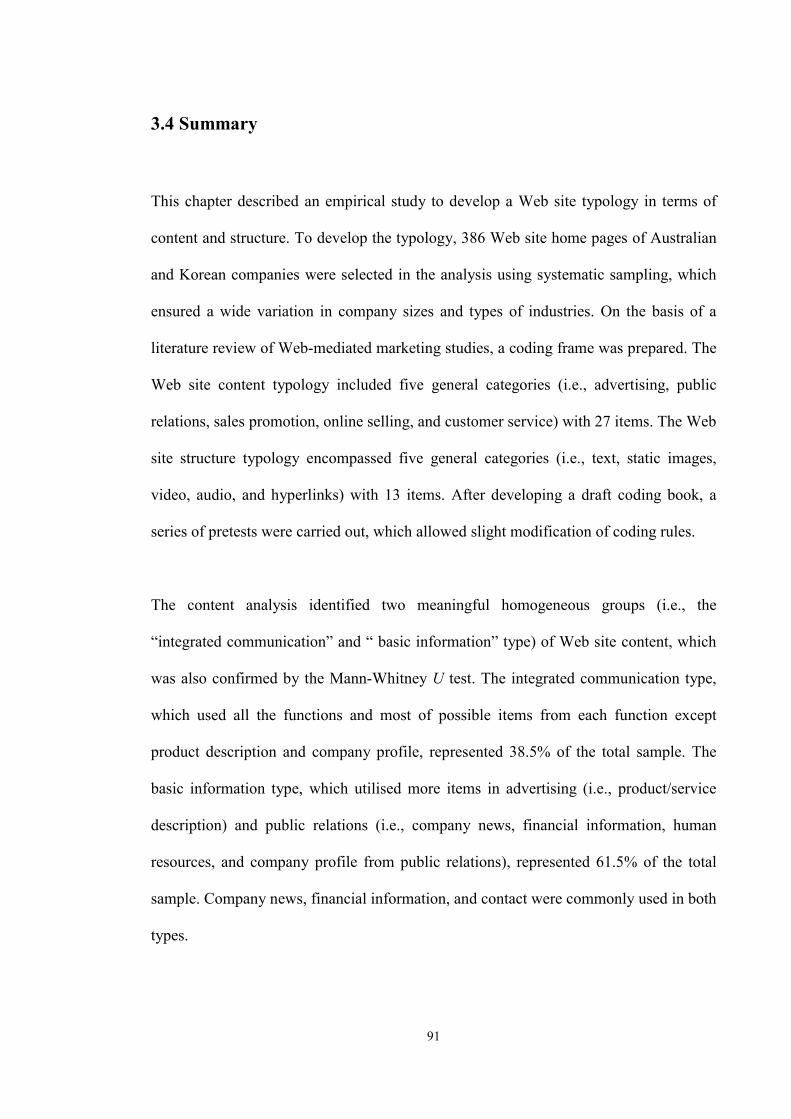
91
3.4 Summary
This chapter described an empirical study to develop a Web site typology in terms of
content and structure. To develop the typology, 386 Web site home pages of Australian
and Korean companies were selected in the analysis using systematic sampling, which
ensured a wide variation in company sizes and types of industries. On the basis of a
literature review of Web-mediated marketing studies, a coding frame was prepared. The
Web site content typology included five general categories (i.e., advertising, public
relations, sales promotion, online selling, and customer service) with 27 items. The Web
site structure typology encompassed five general categories (i.e., text, static images,
video, audio, and hyperlinks) with 13 items. After developing a draft coding book, a
series of pretests were carried out, which allowed slight modification of coding rules.
The content analysis identified two meaningful homogeneous groups (i.e., the
“integrated communication” and “ basic information” type) of Web site content, which
was also confirmed by the Mann-Whitney U test. The integrated communication type,
which used all the functions and most of possible items from each function except
product description and company profile, represented 38.5% of the total sample. The
basic information type, which utilised more items in advertising (i.e., product/service
description) and public relations (i.e., company news, financial information, human
resources, and company profile from public relations), represented 61.5% of the total
sample. Company news, financial information, and contact were commonly used in both
types.
92
Web site structure was classified into two types: “hypermedia” and “static image”. The
hypermedia type, which included almost all the hypermedia elements (i.e., text, static
images, animated images, audio, and internal links) except some items (i.e., descriptive
text and video), represented 55.1%. Whereas, the static image type, which mainly used
descriptive text and static images, represented 44.9%. Company logos, photos and
external links were commonly included in both types.
Based on this typology, four-types of Web site (2 content x 2 structure types) will be
created and used to investigate the effects of the Web site typology on communication
through social interaction in the second part of the study.
93
CHAPTER 4. RESEARCH MODEL AND
HYPOTHESES
4.1 Introduction
Despite the growing interest in WMC among marketing researchers and practitioners
(e.g., Dholakia and Rego, 1998; Stevenson et al., 2000; Loiacono, Watson and
Goodhue, 2002), we still have much to learn about this medium. An initial priority is to
develop a comprehensive method for understanding and assessing WMC. The
importance of this has been reinforced in a study by Bush, Bush, and Harris (1998)
which revealed that marketing practitioners often build, develop and maintain their
corporate Web sites without adequate Web-related knowledge and competencies.
Exacerbating this trend is that currently very little is known about what contributes to
Web site effectiveness, or even about how marketers interact with consumers via the
Web. Contributing to this knowledge gap, this chapter presents a new conceptual model,
the “Web Acceptance Model (WAM)”, for understanding and measuring consumer
acceptance and use of corporate Web sites.
This chapter is composed of two sections: Research model and hypotheses. First of all,
this chapter commences with general description of the model structure. Given that
conventional advertising evaluation models are not suited to WMC, the WAM model
put an emphasis on social interaction and the active participation of Web users. The
WAM includes four groups of variables: predictor, mediator, moderator and criterion
variables. This chapter explains the role of each variable. Finally, the hypotheses
94
derived from the model are discussed. The hypotheses will be empirically tested
through an experiment, as well be discussed in Chapter 6.
4.2 The Web Acceptance Model (WAM)
4.2.1 Model Overview
Recently, there have been many attempts at assessing corporate Web sites as tools for
marketing communication. Much of the research on Web site marketing effectiveness to
date has focused on the Web as an advertising medium and so has adopted conventional
advertising evaluation models (e.g., Bruner and Kumar, 2000; Choi et al., 2001; Luo,
2002; Goldsmith and Lafferty, 2002). A fundamental shortcoming of this approach is
that it does not adequately address the reciprocal social interaction provided by Web-
mediated communication (Suh, Couchman, and Park, 2003). Neither does it adequately
address the active role that users play in interacting with this medium. It is argued that,
as Web sites are new interactive media very different from traditional marketing
communication media, new approaches to their assessment should be employed.
To address the limitations of previous studies, a new theoretical model, the “Web
Acceptance Model (WAM),” was developed to explain consumer responses to corporate
Web sites. As noted previously, this model is premised on two central phenomena of
WMC: social interaction between a Web site and users, and the active participation of
users. In the model, the phenomenon of social interaction is captured by mediating
variables, and the active participation of users by the inclusion of a moderating variable.
95
Two dimensions of social interaction, emotional and task-related, are invoked to explain
why a particular type of Web site causes a certain type of outcome. In other words,
emotional and task-related interaction can help explain “why” a specific type of Web
site is likely to be more effective. But it is unlikely that a particular type of Web site
(e.g., one which has high information intensity and full hypermedia content) will be
effective all of the time. For example, under certain conditions with particular types of
users, a simple type of Web site may well be more effective. Therefore, this study
developed a conceptual framework that seeks to explain “when” a Web site is more
likely to be effective. Introducing individual user differences as a moderator can help
explain “who does what” (Baron and Kenny, 1986), and reflects the active role of
customers in WMC systems. On the basis of this contingency approach, this study
examines the moderating role of individual differences to identify the conditions under
which a Web site is more effective. Finally, the model addresses all three elements of
consumer attitudes, i.e., affective, cognitive, and conative. In the model, Web site
acceptance is conceptualised not only in terms of behavioural (i.e., behavioural
intention) and cognitive (i.e., perceptual) dimensions, but also in terms of the affective
(e.g., feeling or emotional) element of consumer attitudes. The Web Acceptance Model
is depicted in Figure 4.1 below.
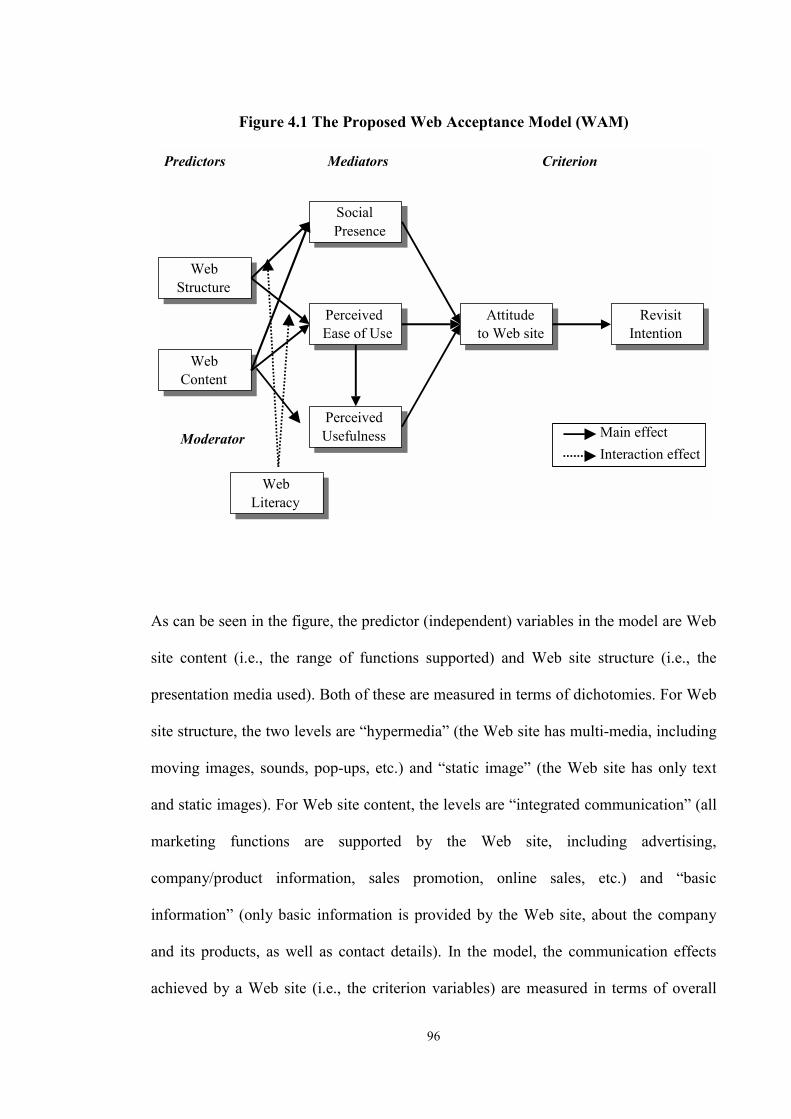
96
Figure 4.1 The Proposed Web Acceptance Model (WAM)
Web Structure
Web Structure
Web ContentWeb
Content
PerceivedUsefulness
Perceived Usefulness
PerceivedEase of UsePerceived
Ease of Use
SocialPrescenceSocial Presence
AttitudeTo Website
Attitudeto Web site
RevisitIntentionRevisit
Intention
Web Literacy
Web Literacy
Predictors Mediators Criterion
Moderator Main effect Interaction effect
As can be seen in the figure, the predictor (independent) variables in the model are Web
site content (i.e., the range of functions supported) and Web site structure (i.e., the
presentation media used). Both of these are measured in terms of dichotomies. For Web
site structure, the two levels are “hypermedia” (the Web site has multi-media, including
moving images, sounds, pop-ups, etc.) and “static image” (the Web site has only text
and static images). For Web site content, the levels are “integrated communication” (all
marketing functions are supported by the Web site, including advertising,
company/product information, sales promotion, online sales, etc.) and “basic
information” (only basic information is provided by the Web site, about the company
and its products, as well as contact details). In the model, the communication effects
achieved by a Web site (i.e., the criterion variables) are measured in terms of overall
97
attitude towards the Web site and the intention to revisit it. But the model also has three
mediators between the predictor and criterion variables. Thus, social presence serves as
an affective bridge, while perceived ease of use and perceived usefulness serve as
cognitive bridges between the predictor and criterion variables. Finally, a moderator
affects the direction or strength of the relationships between the predictors and
mediators, and this study postulates that degree of social interaction will vary according
to the levels of Web literacy (which is the moderating variable in the model).
In brief, the Web Acceptance Model proposes that Web site structure and Web site
content, together determine users’ affective responses to a Web site and their ability to
perform tasks using it (e.g., access required information). Affective responses to a Web
site are captured in the model through the construct of “social presence” (Short et al.,
1976), the feeling that a user is communicating via the Web site with other human
beings. This study postulates that corporate Web sites with hypermedia and integrated
communication will have a higher social presence. Task-related interaction in the model
is assessed according to two inter-related constructs: perceived ease of use and
perceived usefulness. This study postulates that static image Web sites will be easier to
use than those with hypermedia, and that integrated communication Web sites will be
seen as more useful than those which provide basic information only. According to the
model, the greater the social presence of a Web site, the easier it is to use and the greater
its perceived usefulness, the more positive the attitude of users towards it will be. In
turn, the more positive the attitude toward the Web site, the greater will be the revisit
intention. Web literacy will moderate the relationships between the predictor and
mediating variables, for example users who are more Web experienced will see
integrated communication Web sites to be higher in social presence than Web sites with
98
basic information only; conversely, inexperienced users will see basic information Web
sites as having a higher social presence.
4.2.2 Predictor Variables: The Web Site Typology
Content and structure are the basic units for the analysis of communication messages.
Simply speaking, content refers to what is communicated and structure to how it is
communicated. Two major differences of the Web compared to traditional advertising
media are its multi-functional content and its multi-modal structure (Suh, Couchman,
and Lee, 2002a and b). Content is important in marketing because different types of
content have different purposes and aim at different target audiences. The content of
corporate Web sites can be very diverse, and reach beyond the basic communication of
information. Also with Web sites, various structural features such as animation,
graphics, and sound can elicit different consumer responses. To date, there has been no
study that considers both the content and structure of Web sites, and the model seeks to
address this knowledge gap. Furthermore, the model adopts an holistic rather than an
atomistic approach. Most Web studies to date have been based on an atomistic
approach, in that they focus on the presence or absence of particular elements of a Web
site (e.g., Bezjian-Avery et al., 1998; Dholakia and Rego, 1998; Li and Bukovac, 1999).
A major shortcoming of the atomistic or mechanical view is that it ignores interaction
effects between the individual elements. On the other hand, an holistic approach treats a
Web site as an organised whole (Zanden, 1984), and is therefore centrally concerned
with relationships among elements.
99
Structure refers to the combination or organisation of the executable elements of a Web
site, encompassing text, graphics, audio, video and hyperlinks. There have been only a
few studies on the overall organisation of Web sites (e.g., Chen and Wells, 1999), and
these do not clearly define what “organisation” is, how it is classified, and how
marketers can organise the elements to create good Web sites. Although previous
studies on the individual elements of a Web site can partially explain the effects
achieved, they cannot provide comprehensive guidelines for good Web site design. As
reported in the previous chapter, to address this issue, an analysis of existing corporate
Web sites was conducted. On the basis of this study, Web site structure was classified
into two types: “hypermedia” and the “static image”. The hypermedia type deployed all
multimedia elements (such as graphics, audio, and video) as well as internal links (such
as a site map or search function). By contrast, the static image type was restricted to
descriptive text and some static images. Both types commonly included external links to
other Web sites.
Content refers to the information or message presented in a medium. One way of
classifying Web site content is the functional approach, which focuses on the different
activities of companies (McQuail, 1989). In the analysis of corporate Web sites, five
distinctive functions performed by a site were identified: advertising, public relations,
sales promotion, online selling, and customer service. Usually, a corporate Web site
does not serve a single function, rather it is intended to perform multiple functions.
Hence, the traditional method of grouping message content based on the presence or
absence of specific elements may fail to provide a rich understanding of the complex
characteristics of Web site content. For the model, this study reduced corporate Web
site content to two main types: “integrated communication” and “basic information”.

100
These categories were determined by the range of functions supported by a site. For
example, the integrated communication type included more extensive content serving
all five functions, while the basic information type provided only minimal information
for advertising and customer service (e.g., product descriptions, company news,
financial information, a company profile, and contact information).
4.2.3 Moderator Variables: The “When” of Web Site Effectiveness
Only a few empirical studies of Web site effectiveness to date have taken into account
individual user differences (e.g., Bruner and Kumar, 2000; Palmquist and Kim, 2000;
Raman and Leckenby, 1998). A review of the information technology literature (e.g.,
Abdul-Gader, 1996; Agarwal and Prasad, 1999; Raman and Leckenby, 1998; Bruner
and Kumar, 2000; Palmquist and Kim, 2000; Venkatesh and Davis, 2000) confirmed
that previous experience and skills are critical factors influencing Web interaction
performance. The Web, as a hypermedia tool, provides an enormous amount of user
control (e.g., Horton, 1990; Nielsen 1993). It is generally considered that if users have
high levels of control, they can achieve a great deal of interaction with a Web site, and
in turn they will be able to derive a high level of satisfaction. But the degree of a user’s
Web literacy, the ability to actively explore and obtain information from the Web
(December 1996), will influence the experience of interaction and so will affect the
direction or strength of the relationship between the type of Web site and its perceived
effectiveness.
101
4.2.4 Mediator Variables: The “Why” of Web Site Effectiveness
Almost all marketing studies of Web site effectiveness to date have examined the
relationship between specific Web site features and measures of advertising effect such
as attitude toward the ad, attitude toward a brand, or purchase intention (among the few
exceptions are Choi, 2000, Choi et al., 2001). But while this type of study can tell us
“what” type of Web site is more effective in terms of affective or behavioural responses,
they cannot explain “why” a specific type of Web site is more effective than other types.
To answer this question, the nature of attitudes needs to be examined more closely.
From a social psychological point of view, attitudes have three dimensions: cognitive,
affective, and conative. While the three dimensions of attitudes are not separable, it is
generally accepted that there is a need to distinguish between them to gain a better
understanding of a particular attitude (e.g., Eagly and Chaiken, 1993; Vygotsky, 1962).
The conative dimension is related to the behavioural propensity or action associated
with an attitude object, and it can only be explained in terms of the cognitive and
affective dimensions. So, without understanding the cognitive and affective dimensions
of an attitude, we cannot fully understand the behaviour associated with it.
Furthermore, as Morris, Woo, Geason, and Kim (2002) have emphasised, rather than
simply measure an overall affective response, such as attitude toward the ad, more
specific affective responses need to be examined in order to gain a better understanding
of behavioural intentions.
Suh, Hasan, and Couchman (2003) have argued that two dimensions of social
interaction, task-related (a cognitive dimension) and emotional (an affective dimension),
are key indicators for consumer attitudes towards a company or brand. These two
102
dimensions are incorporated as mediating variables in the model, and they help explain
the “why” of the relationship between Web site characteristics and consumer responses
to them (i.e., why a given feature is associated with a particular response). The specific
constructs that are deployed in the model to represent these two dimensions, and hence
play a mediating role, are the social presence of a Web site (affective dimension), as
well as a Web site’s perceived usefulness and perceived ease of use (cognitive
dimension). A widely used measure of affective interaction is social presence, which
can be defined as “a user’s feeling that she or he is interacting with others” (Champness,
1973a; Short et al., 1976), so this construct was incorporated. Both perceived usefulness
and perceived ease of use of a Web site are popular measures of task-related interaction.
Perceived usefulness is defined as “the degree to which a user believes that using a
particular Web site would increase task performance” (Davis, 1989). Perceived ease of
use is defined as “the degree to which a user believes that using a particular Web site
would be free of effort” (Davis, 1989).
4.2.5 Criterion Variables: Communication Effects
As typical brand advertising usually aims at delivering messages to persuade potential
customers to choose a specific brand, the communication effects of attitude toward the
ad, attitude toward the brand, and purchase intention, the communication effects, have
been utilised as the main measures of advertising effectiveness (Kalwani and Silk, 1982;
MacKenzie et al., 1986; Heath and Gaeth, 1994). However, as has been noted, a
corporate Web site differs from traditional advertising media in its multi-functionality.
Corporate Web sites can perform multiple functions, including advertising, public
relations, sales promotion, customer service, and even online selling for more specific
103
target audiences. Accordingly, the purpose of a corporate Web site can extend beyond
the creation of a favourable brand attitude or the facilitation of on-line purchasing to the
building and maintenance of relationships with customers.
Reflecting this potential, two main measures of communication effect have been
adopted for this new marketing medium. For example, attitude toward the Web site has
been widely adopted as a useful indicator of Web site effectiveness (e.g., Bruner and
Kumar, 2000; Chen and Wells, 1999; Choi, 2000; Yoo and Donthu, 2001; Luo 2002).
Attitude toward the Web site can be defined as “a learned predisposition to respond to
the attitude object in a consistently favourable or unfavourable way”, which represents a
Web user’s overall feelings toward the Web site (Belch and Belch, 1999).
Complementing this has been a behavioural measure, revisit intention, which is also
widely regarded as a further criterion of Web site effectiveness (the more the positive
response to a Web site, and the more it is seen as useful and easy to use, the more likely
a user will be to revisit it). In the model both attitude toward the Web site and revisit
intention have been adopted as criterion variables, equivalent to the communication
effects arising from more traditional media. Many advertising evaluation studies have
found a consistent pattern that follows a path of attitude towards an advertisement
determines the attitude towards a brand, which, in turn determines purchase intention,
and a similar pattern of cause and effect has been found in Web site effectiveness
studies (e.g., Bruner and Kumar; 2000; Choi, 2000; Choi et al., 2001). Thus, in this
model it is postulated that the attitude toward the Web site will precede a behavioural
decision, revisit intention, about it.
104
In sum, this chapter proposes the Web Acceptance Model (WAM) as a conceptual
framework for understanding consumer acceptance and use of a corporate Web site, and
which includes predictor, criterion, mediator, and moderator variables. Like a traditional
advertising study, the Web site typology serves as a predictor and communication
effects are criterion variables. Meanwhile, individual differences, as moderators, explain
“when” the effectiveness of a Web site is different. Finally, both affective and cognitive
dimensions of social interaction, as mediators, describe “why” certain behaviour occurs.
It is argued that, using this framework, marketers will be able to better understand the
relevant consumer attitudes and so assess Web site effectiveness from a user
perspective.
4.3 Hypotheses
4.3.1 Main Effects and Associated Hypotheses
Figure 4.2 illustrates the effects of the Web site typology (e.g., Web site structure and
content) on communication effects through social interaction. As specific affective and
cognitive responses to the Web site typology, the social interaction constructs (e.g.,
social presence, perceived ease of use, and perceived usefulness) play a diagnostic role
in explaining “why”, that is the reasons behind communication effects. Accordingly,
hypotheses derived from these relationships reflect the research question, “What
satisfies Web users and make them revisit a corporate Web site?”
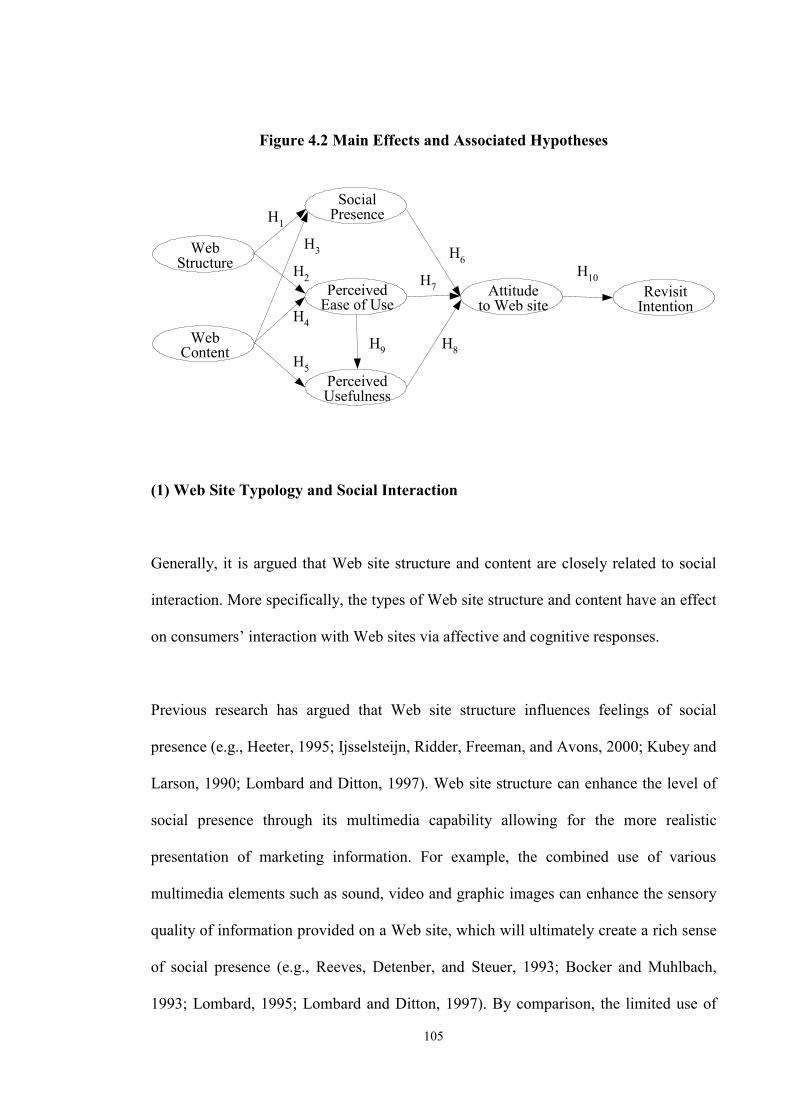
105
Figure 4.2 Main Effects and Associated Hypotheses
Attitudeto Web site
RevisitIntention
SocialPresence
PerceivedEase of Use
PerceivedUsefulness
WebContent
WebStructure
H1
H2
H3
H4
H5
H6
H7
H8H9
H10
(1) Web Site Typology and Social Interaction
Generally, it is argued that Web site structure and content are closely related to social
interaction. More specifically, the types of Web site structure and content have an effect
on consumers’ interaction with Web sites via affective and cognitive responses.
Previous research has argued that Web site structure influences feelings of social
presence (e.g., Heeter, 1995; Ijsselsteijn, Ridder, Freeman, and Avons, 2000; Kubey and
Larson, 1990; Lombard and Ditton, 1997). Web site structure can enhance the level of
social presence through its multimedia capability allowing for the more realistic
presentation of marketing information. For example, the combined use of various
multimedia elements such as sound, video and graphic images can enhance the sensory
quality of information provided on a Web site, which will ultimately create a rich sense
of social presence (e.g., Reeves, Detenber, and Steuer, 1993; Bocker and Muhlbach,
1993; Lombard, 1995; Lombard and Ditton, 1997). By comparison, the limited use of
106
dynamic elements on a Web site results in comparatively poor sensory quality.
Furthermore, multimedia techniques can also create profound emotional experiences
through bodily and physical expressions such as facial, vocal, gestural and postural
cues. In other words, the use of full range of multimedia elements can deliver more
social context cues, which increase social presence (e.g., Choi et al., 2001).
The use of hypermedia implies not merely multi-modal representation of information,
but also interactivity. Although there is no uniform definition, feedback and control are
generally considered as two essential elements of interactivity. When consumers are in
control of their communication environments and can exchange feedback with each
other through the hyperlink facility of the communication media, they feel a sense of
online community (e.g., Choi et al., 2001; Suh, Hasan, and Couchman, 2003).
Therefore, through interactivity and realistic representation, the use of hypermedia
elements can enhance a higher level of social presence (e.g., Choi et al., 2001; Schubert,
Friedmann, and Regenbrecht, 2001; Suh, Hasan, and Couchman, 2003). Recent studies
support this proposition. De Greef and Ijsselsteijn (2000) found that the inclusion of
video and audio in a communication channel created higher social presence than an
audio-only environment. Similarly, Choi (2000) and Choi et al., (2001) revealed that a
Web site with a voice-activated animated character generated a higher level of presence
than a Web site without a character.
107
Thus, it is expected that:
H11: The "hypermedia" type of Web site will have higher social presence
than the "static image" type.
Web site structure also has an effect on consumers’ cognitive responses, notably on
perceived ease of use. While the use of dynamic multimedia (e.g., audio, animation and
video) facilitates realistic presentation of marketing information, it usually takes more
time to download, which can cause a negative effect on consumer attitudes (Chen and
Ford, 1997). Another negative effect comes from the concepts of interactivity and user
control. As a Web site is inherently an interactive medium, users need basic skills to
control the medium. When full hypermedia elements are adopted, users can get
distracted or lost in cyberspace.
As a result, the following hypothesis is also proposed:
H2: The "static image" type of Web site will have higher perceived ease of use
than the "hypermedia" type.
The primary function of Web site content is to fulfil users’ needs (Hallahan, 2001).
Different content serves different needs. Therefore, it is expected that consumers’
attitudes toward the Web site will depend on the content a Web site provides. However,
no attempts have yet been made to identify the influence of Web site content on social
interaction. Nevertheless there are some indications that it plays an important role in
affecting social presence. Bone and Ellen (1993, p. 94) argue that “the more available
108
the information is at the time of the judgement, the stronger will be its effect on
attitudes and behavioural estimates.” For instance, Singh, Balasubramanian, and
Chakraborty (2000) found that a hybrid form of marketing communication and direct
experience is more effective than a conventional advertising format. More specifically,
they compared three dimensions of communication content: advertising, “infomercials”
(or informational commercials), and direct experience. The infomercial was defined as a
long commercial message (15 and 30 minute) that contains a detailed description and
demonstration of a particular product like television program content. Direct experience
was defined as the “trial use of exercise equipment on display at a store while
considering its purchase” (p. 59). For direct experience, product messages were
provided to respondents in audio and text formats. The results showed that infomercials
and direct experiences were more effective in television commercials.
The inclusion of sales promotion (e.g., trial and demonstration) and public relations
functions (e.g., corporate/product news) can enhance Web site effectiveness. One of the
advantages of a Web site is the ability to deliver a variety of marketing information
through one communication channel. This means that a Web site provides more
opportunities for consumers to access information to meet their needs. A Web site also
allows more detailed messages to be provided for users. These features of Web site
marketing communication can create an impression of more support by marketers or
sales representatives and the information can be seen as more useful. Given these
features, it is expected that more integrated information on a Web site results in higher
social presence and perceived ease of use. On the other hand, if more information is
provided on a Web site, it may become harder for users to manage.
109
Thus, it is hypothesised that:
H3: The "integrated communication" type of Web site will have higher
social presence than the "basic information" type.
H4: The "basic information" type of Web site will have higher perceived
ease of use than the "integrated communication" type.
H5: The "integrated communication" type of Web site will have
higher perceived usefulness than the "basic information" type.
(2) Social Interaction and Communication Effects
Before the advent of the Web, many researchers asserted that consumer interaction with
communication media (e.g., imagery, vividness, presence, etc.) had a tendency to
increase positive attitudes and behavioural intentions (e.g., Bone and Ellen, 1992;
Huang, 1999; Kim and Biocca, 1997). For example, Bone and Ellen (1992) argued that
when consumers had more vivid images after exposure to an advertisement, they would
have a more positive attitude toward the ad and behavioural intention to purchase the
advertised product.
The study of the relationship between social presence and communication effects of a
Web site is an underdeveloped area. To date, only a few studies have been conducted
and they have revealed that social presence has a positive influence on attitudes toward
a Web site and revisit intention (e.g., Choi, 2000; Choi et al., 2001). Some studies have
110
also shown that consumers’ cognitive responses to a Web site have a positive impact on
their attitudes (e.g., Agarwal and Prasad, 1999; Davis, Bagozzi, and Warshaw, 1989;
Hong, Thong, Wong, and Tam, 2001-2002; Hu, Chau, Sheng, and Tam, 1999). For
instance, Gefen and Straub (2000) found that the more people perceived a Web site as
useful, the greater their purchase intention was. Pavlou (2003) identified a positive
relationship between user’s perception of a Web site (in terms of perceived usefulness
and perceived ease of use) and intention to conduct transactions online. Moon and Kim
(2001) also have supported this finding; that is, when consumers perceive the Web to be
more useful and easier to use, their attitudes and intentions to use are correspondingly
high.
In terms of the relationship between the cognitive responses of perceived usefulness and
ease of use, almost all studies have suggested a positive association (e.g., Hong et al.,
2001-2002; Moon and Kim, 2001; Pavlou, 2003). In other words, if people perceive a
Web site to be easy to use, they also perceive it as useful.
Given the findings discussed above, it is posited that:
H6: The more positive the social presence of a Web site is, the more positive
the attitude toward the Web site will be.
H7: The more positive the perceived ease of use of a Web site is, the more
positive the attitude toward the Web site will be.
111
H8: The more positive the perceived usefulness of a Web site is, the more
positive the attitude toward the Web site will be.
H9: The more positive the perceived ease of use of a Web site is, the
greater the perceived usefulness will be.
Advertising studies have found a positive relationship between the attitude toward the
ad and purchase intention. Similarly, Web advertising studies have revealed a similar
effect (e.g., Bruner and Kumar, 2000; Choi, 2000; Choi et al., 2001; Stevenson et al.,
2000). In particular, Bruner and his colleagues (Bruner and Kumar, 2000; Stevenson et
al., 2000) found that people who had a positive attitude toward the Web site showed a
high level of intention to purchase the advertised product. Choi and his colleagues
(Choi, 2000; Choi et al., 2001) also discovered that when users’ attitudes toward a Web
site was high, the intention to revisit the Web site was also high.
Consequently, the following hypothesis is proposed:
H10: The more positive the attitude toward the Web site is, the higher the
revisit intention will be.
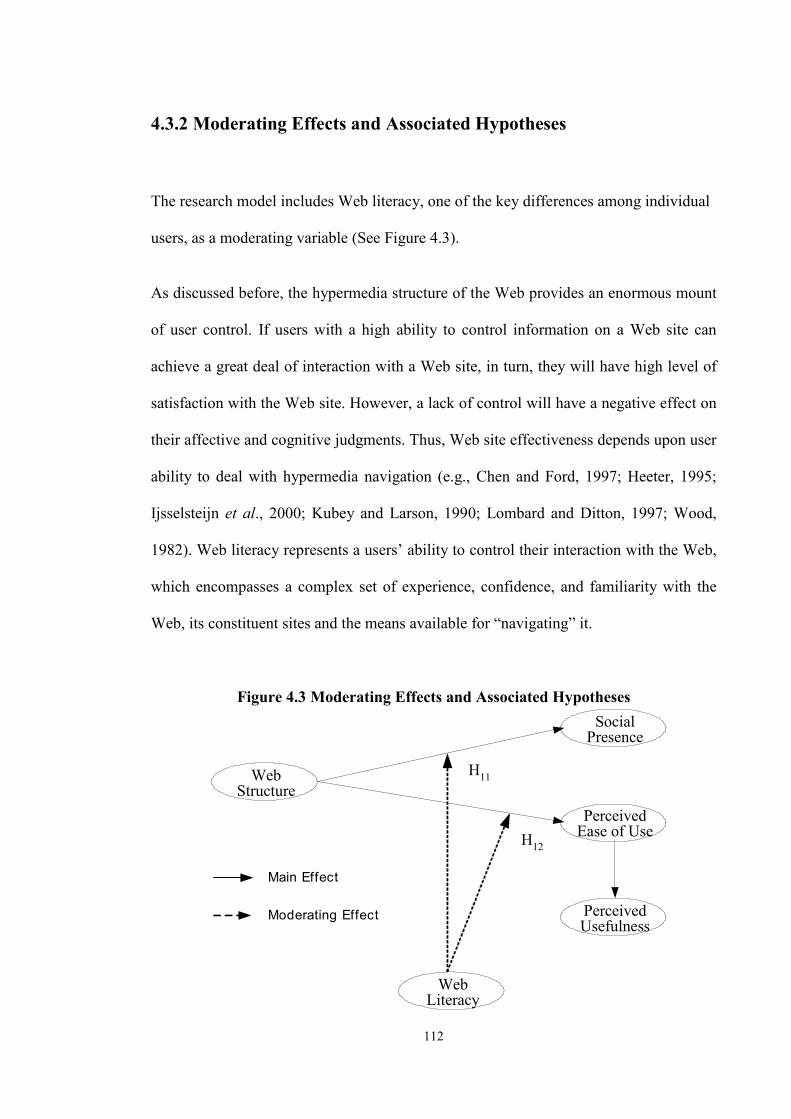
112
4.3.2 Moderating Effects and Associated Hypotheses
The research model includes Web literacy, one of the key differences among individual
users, as a moderating variable (See Figure 4.3).
As discussed before, the hypermedia structure of the Web provides an enormous mount
of user control. If users with a high ability to control information on a Web site can
achieve a great deal of interaction with a Web site, in turn, they will have high level of
satisfaction with the Web site. However, a lack of control will have a negative effect on
their affective and cognitive judgments. Thus, Web site effectiveness depends upon user
ability to deal with hypermedia navigation (e.g., Chen and Ford, 1997; Heeter, 1995;
Ijsselsteijn et al., 2000; Kubey and Larson, 1990; Lombard and Ditton, 1997; Wood,
1982). Web literacy represents a users’ ability to control their interaction with the Web,
which encompasses a complex set of experience, confidence, and familiarity with the
Web, its constituent sites and the means available for “navigating” it.
Figure 4.3 Moderating Effects and Associated Hypotheses Social
Presence
PerceivedEase of Use
PerceivedUsefulness
WebStructure
H12
H11
WebLiteracy
Main Effect
Moderating Effect
113
Although many researchers assert that individual differences such as Web literacy
should be included in any study of Web site effectiveness, at present only a few studies
have been conducted (e.g., Bruner and Kumar, 2000; Raman and Leckenby, 1998).
Given the limited numbers of studies to date, this study has only addressed the role of
Web literacy in the formation of attitudes towards the Web site. First of all, in terms of
social presence, Bruner and Kumar (2000) identified that users’ Web experiences have a
positive influence on communication effects. Similarly, Steinfield (1986) found that
prior experience with electronic E-mail was positively associated with the social uses of
E-mail. From the results of these studies it can be concluded that unfamiliarity with
hypermedia frustrates novices and discourages a sense of social presence. Conversely,
for experts who are familiar with hypermedia, the new technology will encourage a
sense of social presence (e.g., Bone and Ellen, 1992; Lombard and Ditton, 1997).
Based on these findings, it is hypothesised that:
H11a: People with high Web literacy will feel the “hypermedia” type of Web
site to be higher in social presence than the “static image” type.
H11b: People with low Web literacy will feel the “static image” type of Web
site to be higher in social presence than the “hypermedia” type.
Consistent with previous findings, recent studies on the relationship between Web
literacy and search performance revealed that people with high Web literacy spent less
time to navigate a Web site, whereas people with low literacy surf a longer time on a
Web site (Lazonder et al., 2000; Raman and Leckenby, 1998). One possible reason for
114
this is that the lack of prior experience or knowledge might cause navigation problems
so it took more time for beginners to meet their needs (McDonald and Stevenson, 1998).
Accordingly it is assumed that people with low literacy will consider a simple Web site
to be easier to use than are with a complex hypermedia format. On the other hand, users
with high literacy will not face as many difficulties in searching any type of Web site
because they are familiar with hypermedia features.
Consequently, the following hypotheses are proposed:
H12a: People with high Web literacy will perceive no difference in ease of use
between the “hypermedia” type and the “static image” type of Web site.
H12b: People with low Web literacy will perceive the “static image” type of Web
site to be easier to use than the “hypermedia” type.
115
CHAPTER 5. RESEARCH METHODOLOGY
5.1 Introduction
This chapter describes the methodology applied in this study to empirically test the
hypotheses derived from the research model as discussed in the previous chapter. In
order to test the research hypotheses, this study employed an experiment because of the
ability of this method, widely recognised among social and behavioural scientists
(Boruch, 2001; Bryman, 1989), to establish cause and effect relationships as proposed
in the theoretical model and formalised in the research hypotheses. One of the primary
advantages of an experiment is that it allows researchers to manipulate or control
variables, and by doing so the influence of extraneous factors can be minimised or
eliminated (e.g., Malhotra, Hall, Shaw, and Crisp, 1996; Shaughnessy and Zechmeister,
1994; Zikmund, 1991). This experimental study involved three stages: (1) the
development of the instrument, (2) the main experiment, and (3) statistical analysis.
This chapter describes these three stages in detail.
This chapter begins with the development of the instrument. Each of the variables in
the proposed model was operationalised. The instrument format is discussed. Then, a
two-stage pilot testing procedure to refine the measurement instrument and the
experimental procedures is discussed. The second stage involved the main experiment
in which participants rated their responses to a test Web site. This chapter describes the
experiment along with the research design, participants, test Web sites, and
116
experimental procedure. Finally, statistical techniques for analysing the data gathered
from the experiment are discussed.
5.2 Development of the Instrument
Development of the instrument involves three stages: operationalisation of the
constructs, instrument design, and the pilot test of the instrument used to measure
consumer reactions to corporate Web sites.
5.2.1 Operationalisation of the Constructs in the Model
As discussed in the previous chapter, the research model has eight constructs: Web site
structure, Web site content, social presence, perceived usefulness, perceived ease of use,
Web literacy, attitude toward the Web site, and revisit intention. This section discusses
each of the scale items for measuring the constructs used in this study. The measures
were drawn from preliminary research (e.g., Web site structure and content) and
existing measurement scales through a review of relevant literature (e.g., social
presence, perceived usefulness, perceived ease of use, Web literacy, attitude toward the
Web site, and revisit intention). These measures were used for designing a self-report
instrument to assess Web site effectiveness.
(1) Predictor Variables
As discussed in Chapter 3, the two predictors in the model, Web site structure (i.e.,
presentation media used) and Web site content (i.e., the range of functions supported),
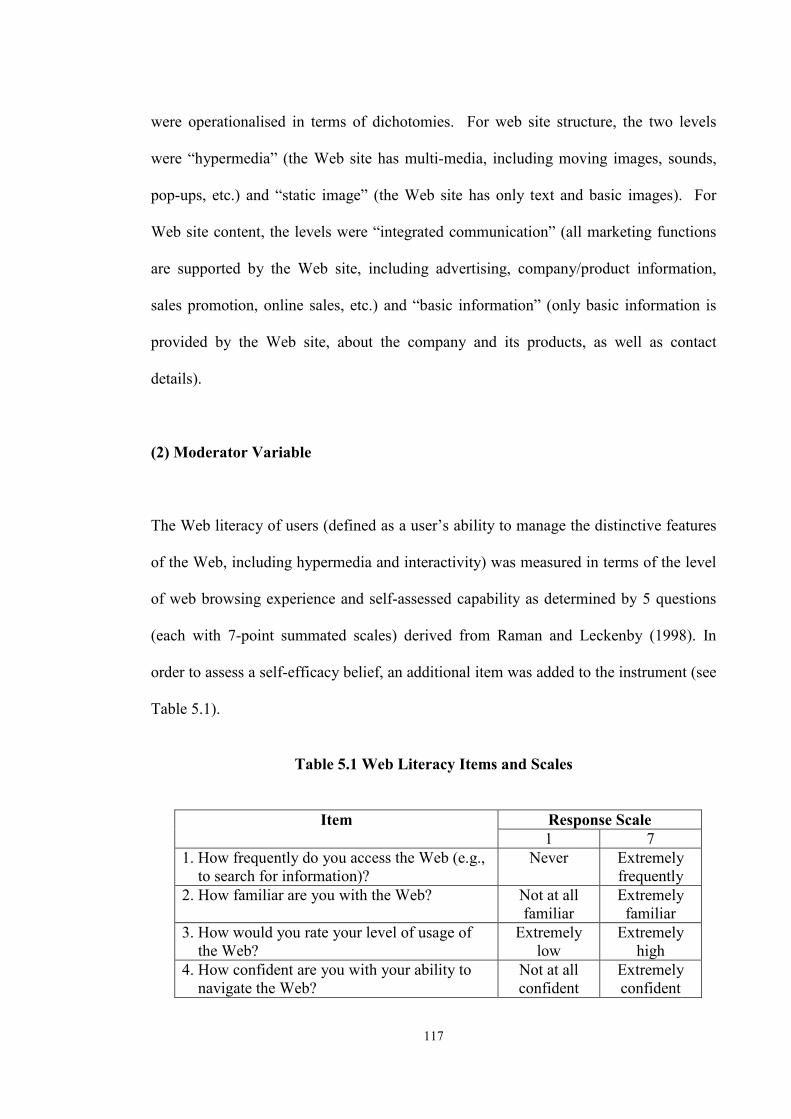
117
were operationalised in terms of dichotomies. For web site structure, the two levels
were “hypermedia” (the Web site has multi-media, including moving images, sounds,
pop-ups, etc.) and “static image” (the Web site has only text and basic images). For
Web site content, the levels were “integrated communication” (all marketing functions
are supported by the Web site, including advertising, company/product information,
sales promotion, online sales, etc.) and “basic information” (only basic information is
provided by the Web site, about the company and its products, as well as contact
details).
(2) Moderator Variable
The Web literacy of users (defined as a user’s ability to manage the distinctive features
of the Web, including hypermedia and interactivity) was measured in terms of the level
of web browsing experience and self-assessed capability as determined by 5 questions
(each with 7-point summated scales) derived from Raman and Leckenby (1998). In
order to assess a self-efficacy belief, an additional item was added to the instrument (see
Table 5.1).
Table 5.1 Web Literacy Items and Scales
Response Scale Item 1 7
1. How frequently do you access the Web (e.g., to search for information)?
Never Extremely frequently
2. How familiar are you with the Web? Not at all familiar
Extremely familiar
3. How would you rate your level of usage of the Web?
Extremely low
Extremely high
4. How confident are you with your ability to navigate the Web?
Not at all confident
Extremely confident
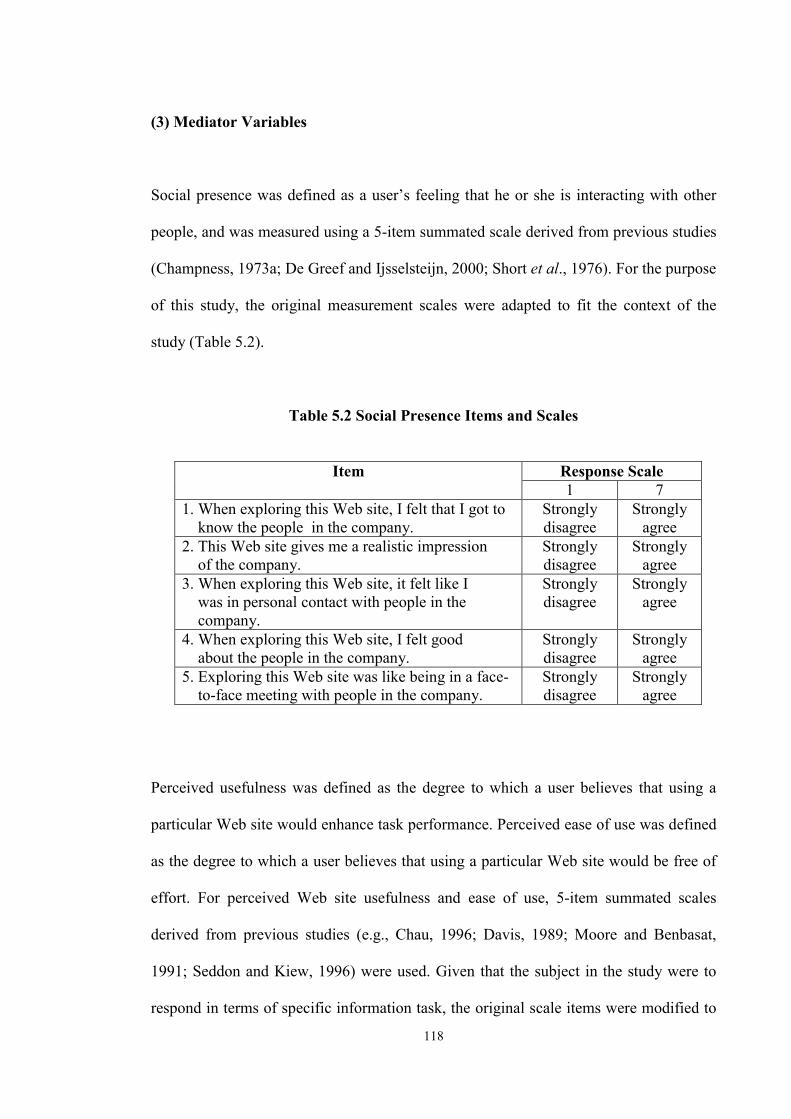
118
(3) Mediator Variables
Social presence was defined as a user’s feeling that he or she is interacting with other
people, and was measured using a 5-item summated scale derived from previous studies
(Champness, 1973a; De Greef and Ijsselsteijn, 2000; Short et al., 1976). For the purpose
of this study, the original measurement scales were adapted to fit the context of the
study (Table 5.2).
Table 5.2 Social Presence Items and Scales
Response Scale Item 1 7
1. When exploring this Web site, I felt that I got to know the people in the company.
Strongly disagree
Strongly agree
2. This Web site gives me a realistic impression of the company.
Strongly disagree
Strongly agree
3. When exploring this Web site, it felt like I was in personal contact with people in the company.
Strongly disagree
Strongly agree
4. When exploring this Web site, I felt good about the people in the company.
Strongly disagree
Strongly agree
5. Exploring this Web site was like being in a face- to-face meeting with people in the company.
Strongly disagree
Strongly agree
Perceived usefulness was defined as the degree to which a user believes that using a
particular Web site would enhance task performance. Perceived ease of use was defined
as the degree to which a user believes that using a particular Web site would be free of
effort. For perceived Web site usefulness and ease of use, 5-item summated scales
derived from previous studies (e.g., Chau, 1996; Davis, 1989; Moore and Benbasat,
1991; Seddon and Kiew, 1996) were used. Given that the subject in the study were to
respond in terms of specific information task, the original scale items were modified to
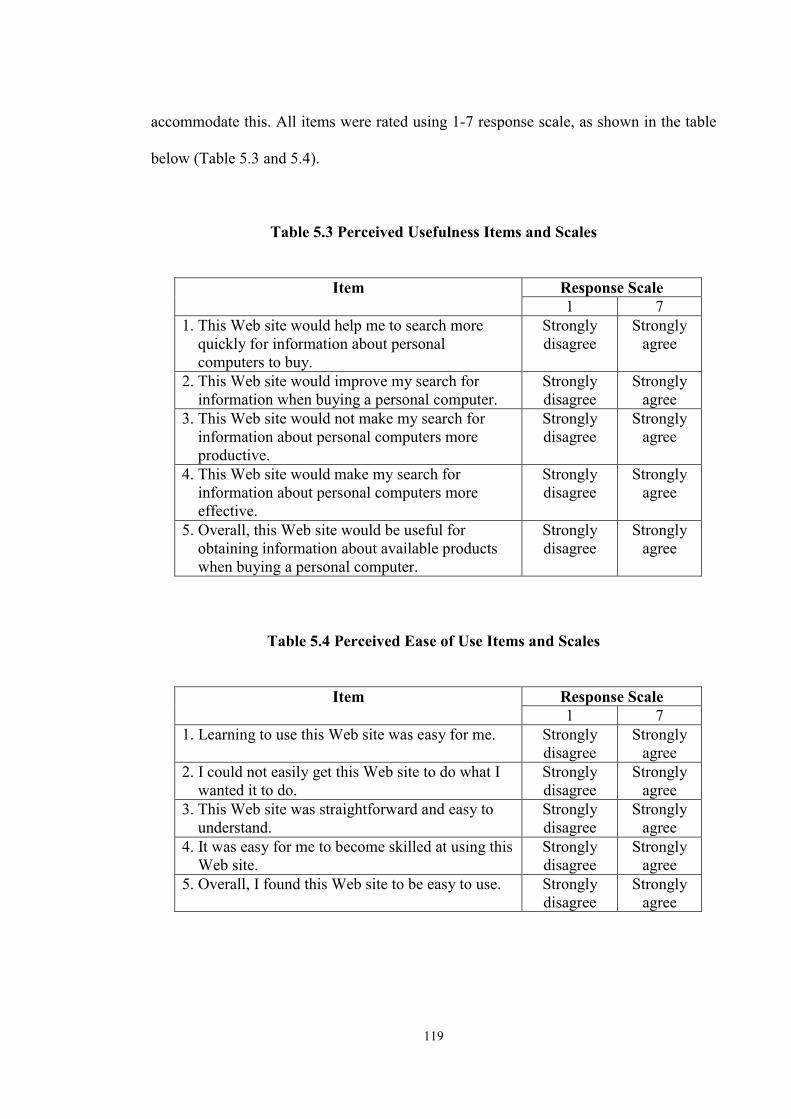
119
accommodate this. All items were rated using 1-7 response scale, as shown in the table
below (Table 5.3 and 5.4).
Table 5.3 Perceived Usefulness Items and Scales
Response Scale Item 1 7
1. This Web site would help me to search more quickly for information about personal computers to buy.
Strongly disagree
Strongly agree
2. This Web site would improve my search for information when buying a personal computer.
Strongly disagree
Strongly agree
3. This Web site would not make my search for information about personal computers more productive.
Strongly disagree
Strongly agree
4. This Web site would make my search for information about personal computers more effective.
Strongly disagree
Strongly agree
5. Overall, this Web site would be useful for obtaining information about available products when buying a personal computer.
Strongly disagree
Strongly agree
Table 5.4 Perceived Ease of Use Items and Scales
Response Scale Item 1 7
1. Learning to use this Web site was easy for me. Strongly disagree
Strongly agree
2. I could not easily get this Web site to do what I wanted it to do.
Strongly disagree
Strongly agree
3. This Web site was straightforward and easy to understand.
Strongly disagree
Strongly agree
4. It was easy for me to become skilled at using this Web site.
Strongly disagree
Strongly agree
5. Overall, I found this Web site to be easy to use. Strongly disagree
Strongly agree
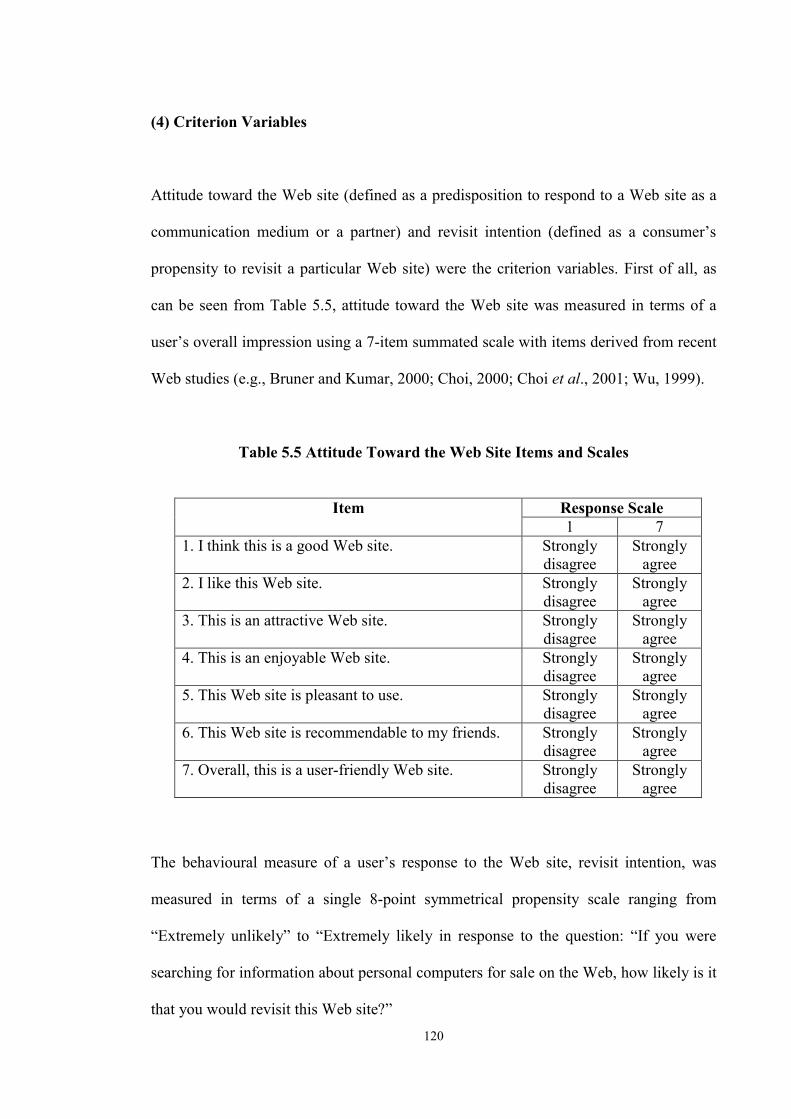
120
(4) Criterion Variables
Attitude toward the Web site (defined as a predisposition to respond to a Web site as a
communication medium or a partner) and revisit intention (defined as a consumer’s
propensity to revisit a particular Web site) were the criterion variables. First of all, as
can be seen from Table 5.5, attitude toward the Web site was measured in terms of a
user’s overall impression using a 7-item summated scale with items derived from recent
Web studies (e.g., Bruner and Kumar, 2000; Choi, 2000; Choi et al., 2001; Wu, 1999).
Table 5.5 Attitude Toward the Web Site Items and Scales
Response Scale Item 1 7
1. I think this is a good Web site. Strongly disagree
Strongly agree
2. I like this Web site. Strongly disagree
Strongly agree
3. This is an attractive Web site. Strongly disagree
Strongly agree
4. This is an enjoyable Web site. Strongly disagree
Strongly agree
5. This Web site is pleasant to use. Strongly disagree
Strongly agree
6. This Web site is recommendable to my friends. Strongly disagree
Strongly agree
7. Overall, this is a user-friendly Web site. Strongly disagree
Strongly agree
The behavioural measure of a user’s response to the Web site, revisit intention, was
measured in terms of a single 8-point symmetrical propensity scale ranging from
“Extremely unlikely” to “Extremely likely in response to the question: “If you were
searching for information about personal computers for sale on the Web, how likely is it
that you would revisit this Web site?”
121
5.2.2 Instrument Design
As the measures have already been discussed in Chapter 4, this section explains the
instrument format. As shown in Appendix 4, the instrument consisted of three sections:
(1) participants’ reaction to the Web site, (2) Web experience measures, and (3)
participant background information. The first section was developed to obtain measures
of the mediator (e.g., social presence, perceived ease of use, and perceived usefulness)
and criterion variables (attitude toward the Web site and revisit intention). The second
section collected data on the moderator variable (e.g., Web literacy). The final section
collected demographic information about the participants.
In order to avoid response bias and acquiescence bias among the subjects, the
instrument included both positive and negative items in each of the scales (e.g.,
Anastasi, 1988; Dillon, Madden, and Firtle, 1993; Guy, Edgley, Arafat, and Allen,
1987; Kerlinger, 1964; Zikmund, 1991).
Those questions were “When exploring this Web site, I did not feel good about the
people in the company” (for social presence), “This Web would not make may search
for information about personal computers more productive” (for perceived usefulness),
“I could not easily get this Web site to do what I wanted it to do” (for perceived ease of
use), and “This is not a good Web site” (for attitude toward the Web site).
122
5.2.3 Pilot Test of the Instrument
This section describes the pilot test of the instrument to measure consumer reactions to
corporate Web sites, an instrument called the “Web Acceptance Model (WAM)
Questionnaire”. The development of this questionnaire was part of a larger experimental
study investigating the determinants of corporate Web site effectiveness.
(1) Rationale for the Pilot Test
The pilot testing of questionnaires is universally considered to be essential because
responses to what may be misunderstood, ambiguous or incomprehensible questions can
lead to problems of interpretation in data analysis as well as concerns about instrument
validity and reliability (e.g., De Vaus, 1991, Churchill, 1999). Therefore, the pilot
testing of the draft questionnaire was an important part of this experimental study (e.g.,
Straub, 1989; Sethi and King, 1991). The concern was to ensure that the instrument
used would be both reliable and valid. The issue of instrument rigour was addressed in
two ways. Firstly, this study employed measurement scales that had been used in
previous studies and which already had known levels of reliability and validity.
Secondly, and responding to the lament of Hunt, Sparkman, and Wilcox (1982, p. 269)
that “Despite the generally accepted importance of pretesting, the pretesting process is
given short shrift in both the marketing research literature and marketing research
practice”, this study subjected the initial draft instrument to a two-stage pilot testing
procedure.
123
(2) The Pre-Pilot Test
For the pre-pilot test a panel of 10 “experts”, including research students and academics
in the disciplines of Marketing and Information Systems at the University of
Wollongong, was asked to review the draft questionnaire. Panel members were then
interviewed and asked to comment on the questionnaire in terms of its ease of use,
comprehensibility, meaningfulness, likely effectiveness, content validity (i.e., that the
scale items appeared to measure what they were intended to measure) and overall
suitability. As a result of the feedback received, some minor modifications were made
(e.g., to individual questions and to the instructions for subjects) and the revised
questionnaire was then submitted to the next stage of the pilot test. On the basis of the
expert assessment, it was concluded that the measurement scales in the draft
questionnaire had an acceptable level of content or face validity.
(3) The Pilot Test
In the second stage, a quantitative approach was used to assess the reliability and
validity of the instrument. Although there is no widely agreed upon sample size for a
pilot test, between 12 and 30 subjects is generally recommended (e.g., Hunt et al.,
1982). Therefore, a convenience sample of n = 37 was obtained (through word of mouth
and other calls for volunteers at the University) from the population of interest for the
study, i.e., university students. Following a pre-defined experimental protocol, the pilot
test participants were taken to a testing laboratory and asked to explore a fictitious
computer company Web site in terms of a hypothetical task (i.e., to obtain information
to help make a decision about a possible personal computer purchase). Personal
124
computers were chosen as the focus for the experimental task because university
students constitute a major market segment for this product, and the hypothetical task
was well within the recent experience of most students. A fictitious company Web site
was created to avoid any potential confounding effects due to prior knowledge and
experience with existing brands (Zhang and Gelb, 1996; Choi, 2000).
Each participant was randomly assigned to one of four variants of the company Web
site, where the variants were the four combinations of the Web site structure and Web
site content levels (i.e., from a “simple” variant which had only static images and basic
information, to a “complex” variant with hypermedia and integrated communication).
After completing the information search task at their own pace, participants were then
asked to complete the draft questionnaire. When they had done so, they were debriefed
on the experiment and given the opportunity to comment on the questionnaire. No
problems were reported, and all participants considered that the questionnaire was
comprehensible, meaningful and easy to complete. Data from the completed
questionnaires was entered into the statistics program SPSS. The data file so created
was checked for accuracy, and then analysed to assess the reliability and validity of the
piloted draft questionnaire.
(4) Statistical Analysis
Data from the completed questionnaires was entered into a personal computer and
statistical analysis was performed using SPSS 11.0 for Windows. Basic frequencies
were calculated for descriptive purposes. The validity and internal consistency of the
instrument were assessed through a statistical analysis.
125
The statistical analysis procedure involved three main analyses (e.g., Hair et al., 1998).
Firstly, a factor analysis was conducted to determine whether each summated scale was
unidimensional. In other words, a factor analysis on the multi-item measures was
conducted in order to identify whether these items represent only one dimension of a
construct or whether there are several dimensions within a set of questions (Anderson,
1987; Gebotys, 2001). This analysis commenced with the creation of a correlation
matrix for the items in each scale to ensure that there were a substantial number of
significant correlation coefficients in the matrix. The extraction of factors was carried
out using Principal Components Analysis. Only factors with eigenvalues of 1.0 or
higher were extracted, and this was confirmed with a scree plot. The factorability of the
correlation matrices was assessed using the Kaiser-Meyer-Olkin (KMO) Measure of
Sampling Accuracy and Bartlett’s Test of Sphericity (Coakes and Steed, 1999).
Secondly, the construct validity of each scale was assessed by examining the
correlations between a total scale score and each of its constituent item scores. To avoid
spurious part-whole correlation, the total score was corrected by subtracting an item’s
score before examining the correlation between it and the total (Doll and Torkzadeh,
1988; Xiao and Dasgupta, 2002). Correlation analysis determined whether scale items
were associated with each other.
Thirdly, reliability analysis was conducted to test internal consistency. Reliability refers
to the degree which a measure yields consistent results when the same instrument is
measured repeatedly. Although there are three different approaches (e.g., the test-retest,
alternative (equivalent) forms, and the internal consistency) for assessing reliability, the
internal consistency using Cronbach’s alpha is the most popular approach (Anastasi,
126
1988; Aron and Aron, 1994; Guy et al., 1987; Kubiszyn and Borich, 1990; Malhotra et
al., 1996; McDaniel and Gates, 1993; Zikmund, 1991). The internal consistency test
was performed only once to a group of subjects.
5.3 The Experiment
5.3.1 Experimental Design
The hypotheses were tested on the basis of a 2 x 2 between subject factorial design
(having a total of 4 cells), which allowed all possible combinations and conditions of
the Web site design factors, Web site content (integrated communication vs. basic
information) and Web site structure (hypermedia vs. static image), as shown in Figure
5.1. Therefore, the experiment investigated not only main effects of Web site content
and structure, but also the effect of their interaction. There were three mediating
variables: social presence, perceived ease of use, and perceived usefulness. Attitude
toward the Web site and revisit intention were proposed as criterion variables. For the
experiment, culture (Australian) and motivation (search for information) were held
constant (control variables).
Each subject was allowed to navigate only one of the four Web sites. Subjects were
randomly assigned to a cell using a Random Number Generator Program (Graziano and
Raulin, 1999). As the total sample was 160, the random number table had 40 blocks,
each of which contained 4 numbers. The block randomisation ensured that equal
numbers of subjects were allocated to each experimental condition.
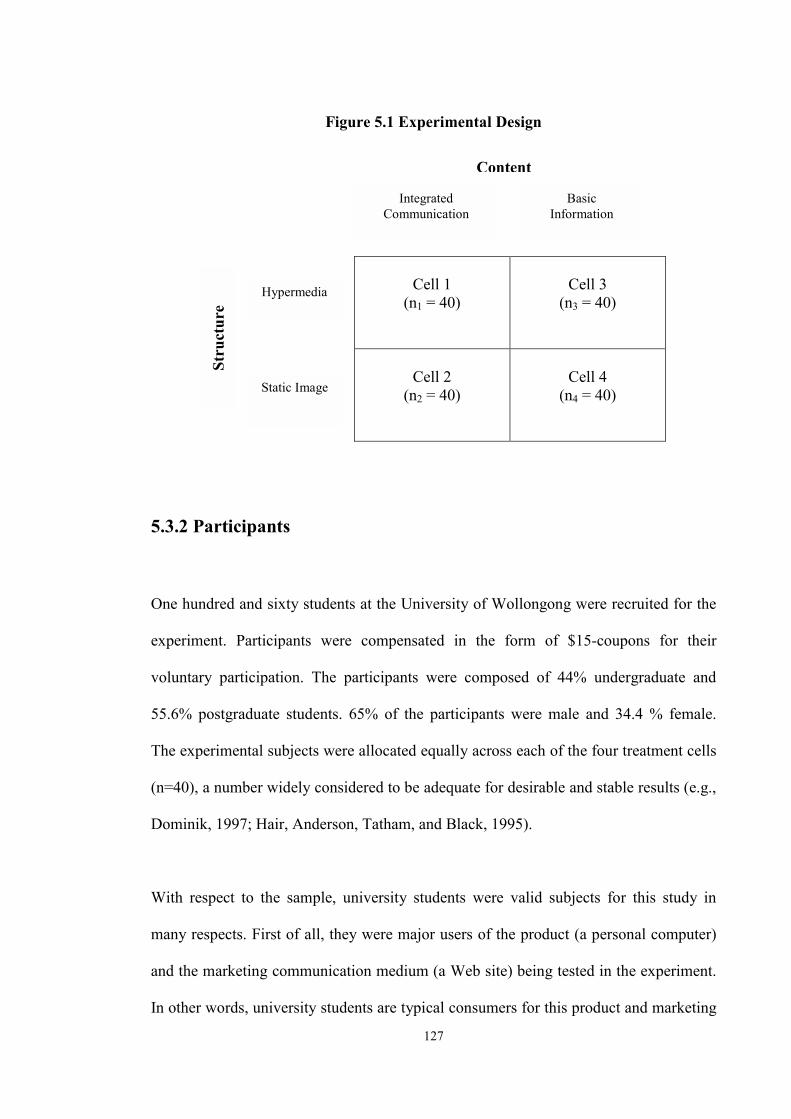
127
Figure 5.1 Experimental Design
Cell 1
(n1 = 40)
Cell 3
(n3 = 40)
Cell 2
(n2 = 40)
Cell 4
(n4 = 40)
5.3.2 Participants
One hundred and sixty students at the University of Wollongong were recruited for the
experiment. Participants were compensated in the form of $15-coupons for their
voluntary participation. The participants were composed of 44% undergraduate and
55.6% postgraduate students. 65% of the participants were male and 34.4 % female.
The experimental subjects were allocated equally across each of the four treatment cells
(n=40), a number widely considered to be adequate for desirable and stable results (e.g.,
Dominik, 1997; Hair, Anderson, Tatham, and Black, 1995).
With respect to the sample, university students were valid subjects for this study in
many respects. First of all, they were major users of the product (a personal computer)
and the marketing communication medium (a Web site) being tested in the experiment.
In other words, university students are typical consumers for this product and marketing
Stru
ctur
e
Content
Integrated Communication
Basic Information
Hypermedia
Static Image
Stru
ctur
e
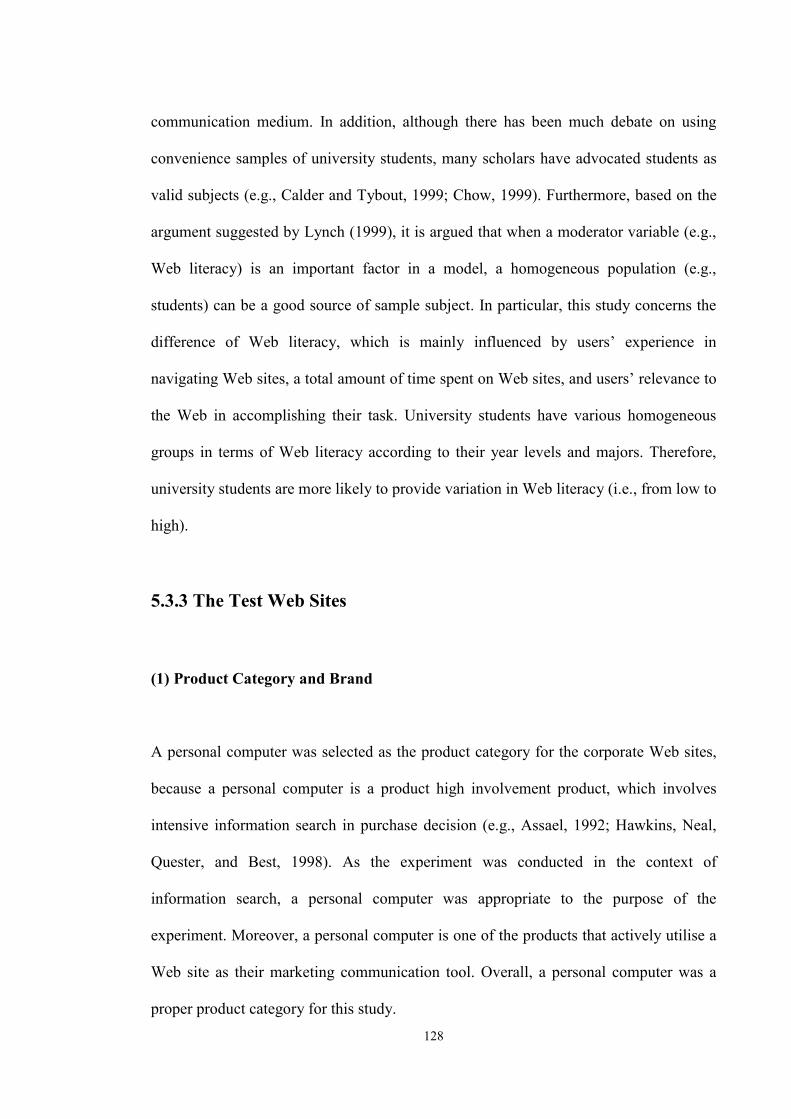
128
communication medium. In addition, although there has been much debate on using
convenience samples of university students, many scholars have advocated students as
valid subjects (e.g., Calder and Tybout, 1999; Chow, 1999). Furthermore, based on the
argument suggested by Lynch (1999), it is argued that when a moderator variable (e.g.,
Web literacy) is an important factor in a model, a homogeneous population (e.g.,
students) can be a good source of sample subject. In particular, this study concerns the
difference of Web literacy, which is mainly influenced by users’ experience in
navigating Web sites, a total amount of time spent on Web sites, and users’ relevance to
the Web in accomplishing their task. University students have various homogeneous
groups in terms of Web literacy according to their year levels and majors. Therefore,
university students are more likely to provide variation in Web literacy (i.e., from low to
high).
5.3.3 The Test Web Sites
(1) Product Category and Brand
A personal computer was selected as the product category for the corporate Web sites,
because a personal computer is a product high involvement product, which involves
intensive information search in purchase decision (e.g., Assael, 1992; Hawkins, Neal,
Quester, and Best, 1998). As the experiment was conducted in the context of
information search, a personal computer was appropriate to the purpose of the
experiment. Moreover, a personal computer is one of the products that actively utilise a
Web site as their marketing communication tool. Overall, a personal computer was a
proper product category for this study.
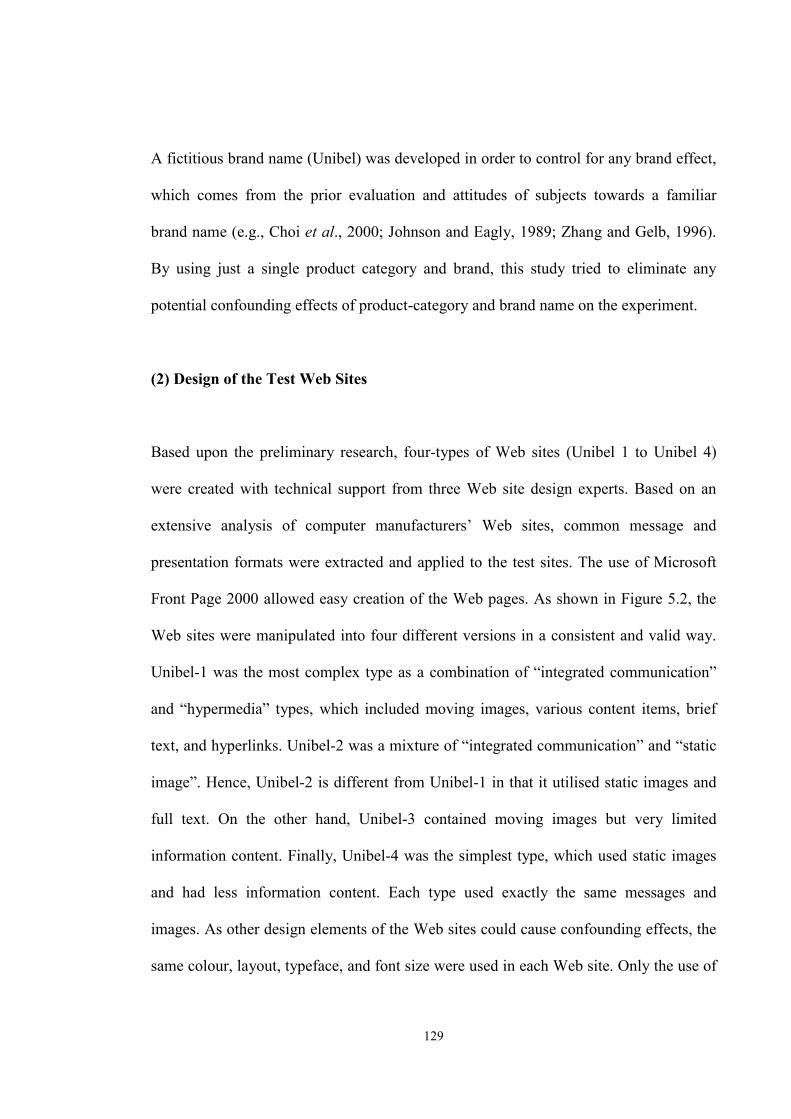
129
A fictitious brand name (Unibel) was developed in order to control for any brand effect,
which comes from the prior evaluation and attitudes of subjects towards a familiar
brand name (e.g., Choi et al., 2000; Johnson and Eagly, 1989; Zhang and Gelb, 1996).
By using just a single product category and brand, this study tried to eliminate any
potential confounding effects of product-category and brand name on the experiment.
(2) Design of the Test Web Sites
Based upon the preliminary research, four-types of Web sites (Unibel 1 to Unibel 4)
were created with technical support from three Web site design experts. Based on an
extensive analysis of computer manufacturers’ Web sites, common message and
presentation formats were extracted and applied to the test sites. The use of Microsoft
Front Page 2000 allowed easy creation of the Web pages. As shown in Figure 5.2, the
Web sites were manipulated into four different versions in a consistent and valid way.
Unibel-1 was the most complex type as a combination of “integrated communication”
and “hypermedia” types, which included moving images, various content items, brief
text, and hyperlinks. Unibel-2 was a mixture of “integrated communication” and “static
image”. Hence, Unibel-2 is different from Unibel-1 in that it utilised static images and
full text. On the other hand, Unibel-3 contained moving images but very limited
information content. Finally, Unibel-4 was the simplest type, which used static images
and had less information content. Each type used exactly the same messages and
images. As other design elements of the Web sites could cause confounding effects, the
same colour, layout, typeface, and font size were used in each Web site. Only the use of
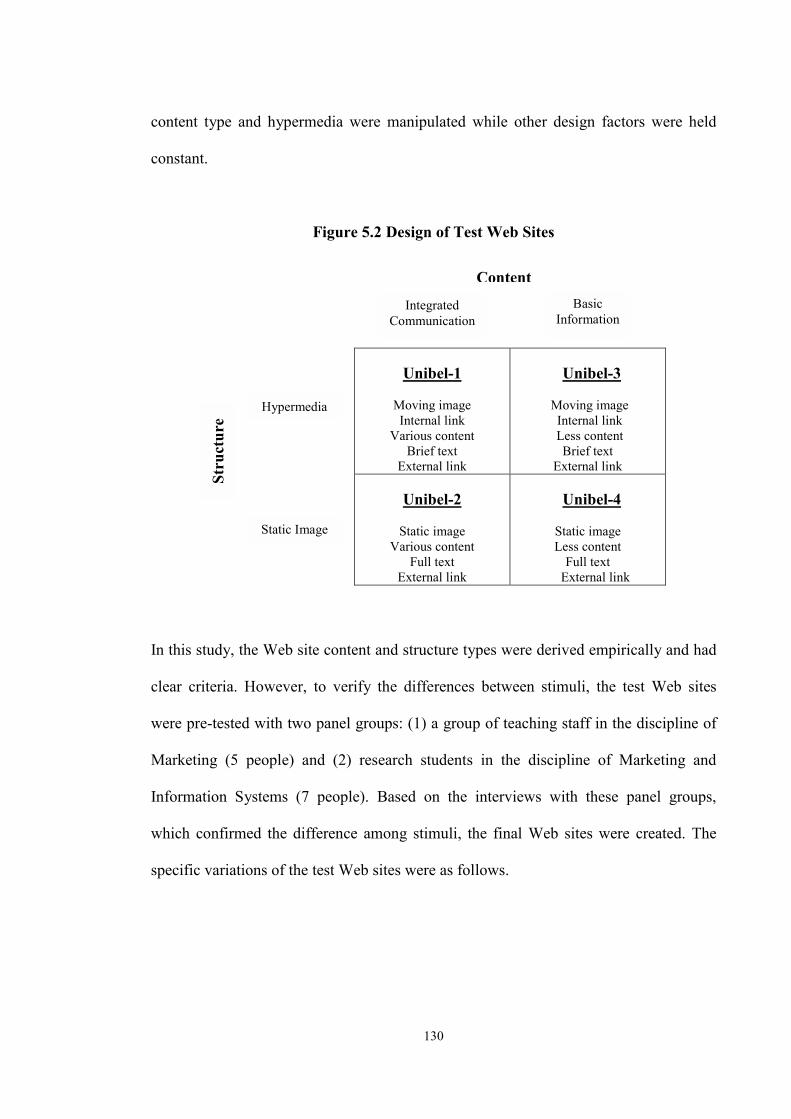
130
content type and hypermedia were manipulated while other design factors were held
constant.
Figure 5.2 Design of Test Web Sites
Unibel-1
Moving image Internal link
Various content Brief text
External link
Unibel-3
Moving image Internal link Less content Brief text
External link
Unibel-2
Static image Various content
Full text External link
Unibel-4
Static image Less content
Full text External link
In this study, the Web site content and structure types were derived empirically and had
clear criteria. However, to verify the differences between stimuli, the test Web sites
were pre-tested with two panel groups: (1) a group of teaching staff in the discipline of
Marketing (5 people) and (2) research students in the discipline of Marketing and
Information Systems (7 people). Based on the interviews with these panel groups,
which confirmed the difference among stimuli, the final Web sites were created. The
specific variations of the test Web sites were as follows.
Stru
ctur
e
Content
Integrated Communication
Basic Information
Hypermedia
Static Image
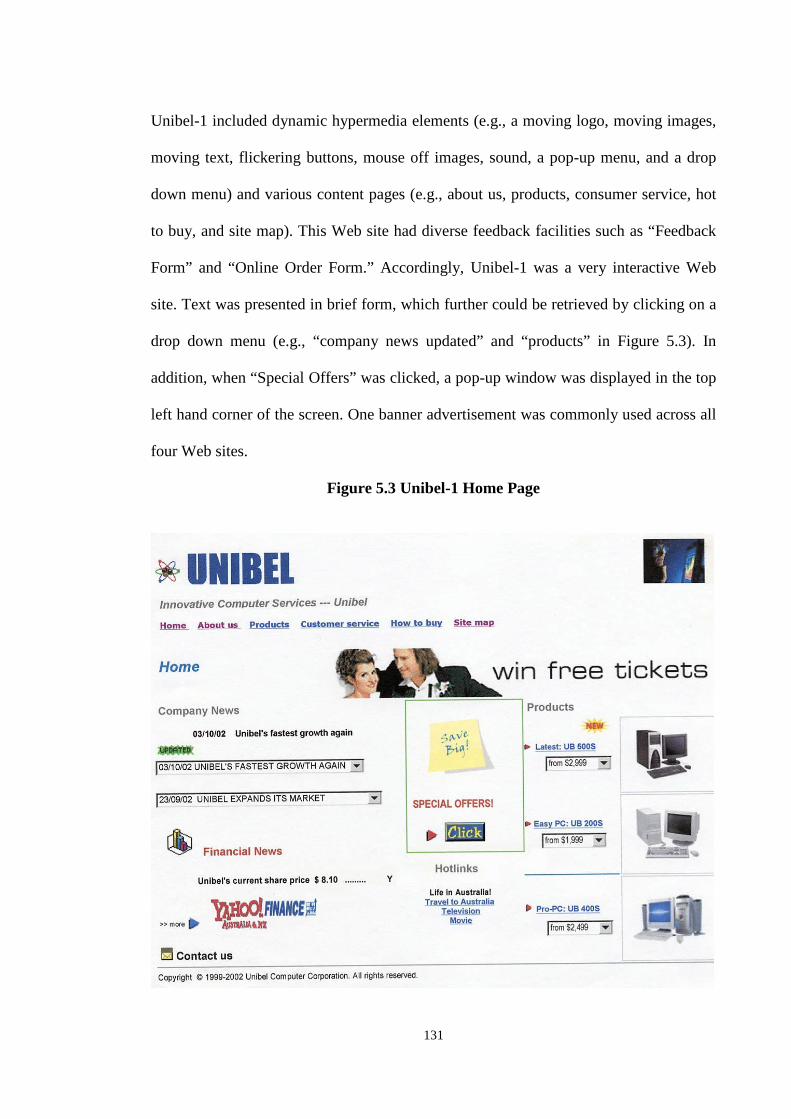
131
Unibel-1 included dynamic hypermedia elements (e.g., a moving logo, moving images,
moving text, flickering buttons, mouse off images, sound, a pop-up menu, and a drop
down menu) and various content pages (e.g., about us, products, consumer service, hot
to buy, and site map). This Web site had diverse feedback facilities such as “Feedback
Form” and “Online Order Form.” Accordingly, Unibel-1 was a very interactive Web
site. Text was presented in brief form, which further could be retrieved by clicking on a
drop down menu (e.g., “company news updated” and “products” in Figure 5.3). In
addition, when “Special Offers” was clicked, a pop-up window was displayed in the top
left hand corner of the screen. One banner advertisement was commonly used across all
four Web sites.
Figure 5.3 Unibel-1 Home Page
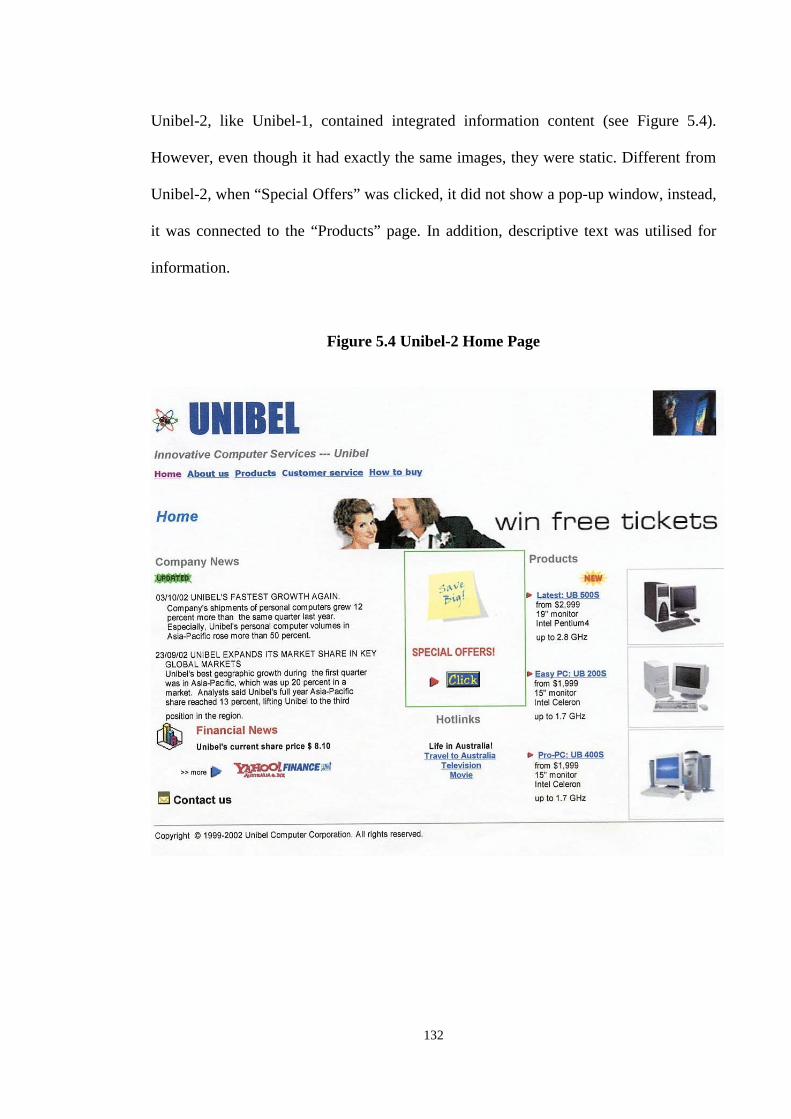
132
Unibel-2, like Unibel-1, contained integrated information content (see Figure 5.4).
However, even though it had exactly the same images, they were static. Different from
Unibel-2, when “Special Offers” was clicked, it did not show a pop-up window, instead,
it was connected to the “Products” page. In addition, descriptive text was utilised for
information.
Figure 5.4 Unibel-2 Home Page
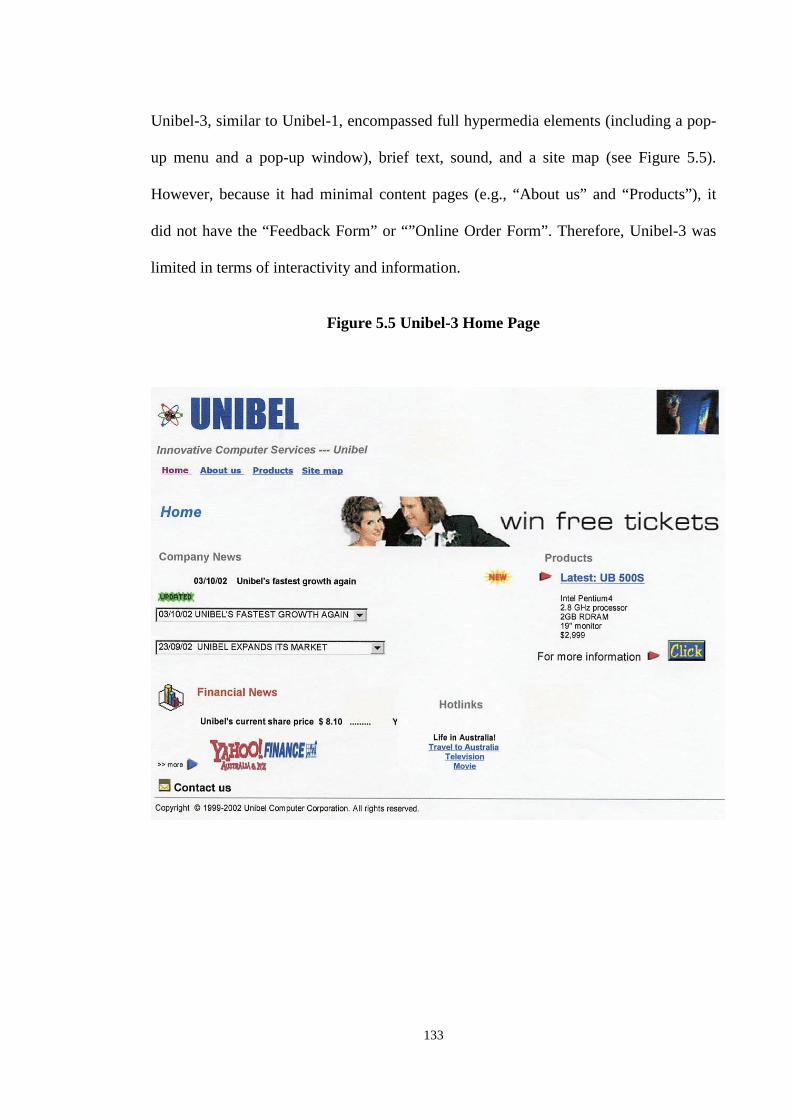
133
Unibel-3, similar to Unibel-1, encompassed full hypermedia elements (including a pop-
up menu and a pop-up window), brief text, sound, and a site map (see Figure 5.5).
However, because it had minimal content pages (e.g., “About us” and “Products”), it
did not have the “Feedback Form” or “”Online Order Form”. Therefore, Unibel-3 was
limited in terms of interactivity and information.
Figure 5.5 Unibel-3 Home Page
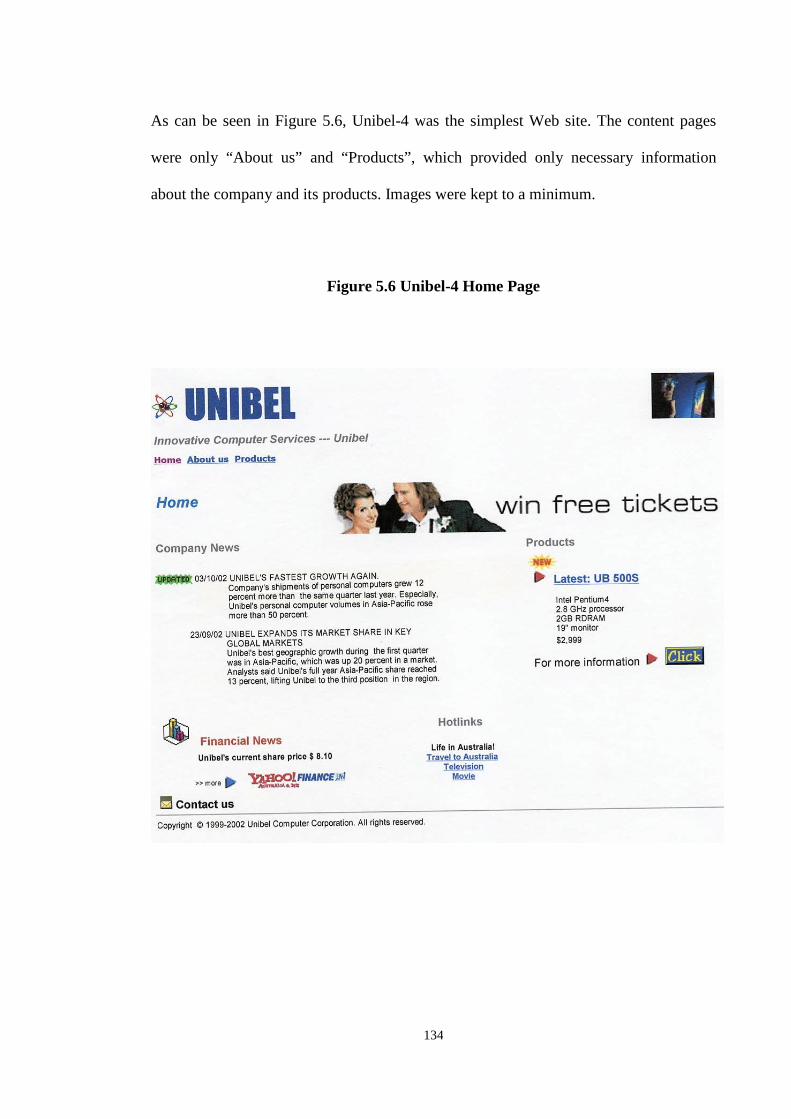
134
As can be seen in Figure 5.6, Unibel-4 was the simplest Web site. The content pages
were only “About us” and “Products”, which provided only necessary information
about the company and its products. Images were kept to a minimum.
Figure 5.6 Unibel-4 Home Page
135
5.3.4 Experimental Procedure
The experiment was conducted in the Activity Theory Usability Laboratory at the
University of Wollongong. Two standard Pentium III personal computers (each
computer had a 15” monitor, standard keyboard, mouse, and Internet connection) were
provided. Internet Explorer 5.0 was used for access to the test Web sites. The test was
administered under the same conditions between December 2002 and January 2003.
The experiment was carried out according to a pre-determined protocol. Before the
participants arrived, it was ensured that all necessary hardware was set up and working.
After the participants were seated, they were asked to read the information sheet and
sign the consent form. They were also informed that they had the right to withdraw
from the experiment at any time they chose to and their responses would remain strictly
confidential. Participants were given a specific task of searching information about the
company (Unibel) and its products to purchase a personal computer in the near future.
Then, participants explored one of Unibel’s Web sites in their own time to explore the
information. If they had any questions or problems, they were able to ask the researcher.
After browsing the Web site, they were requested to a complete questionnaire. Finally,
after the questionnaire had been completed, a debriefing session followed, where the
participants were informed about the study and were given a contact address for further
questions and complaints. The overall procedure of the experiment is depicted in Figure
5.7.
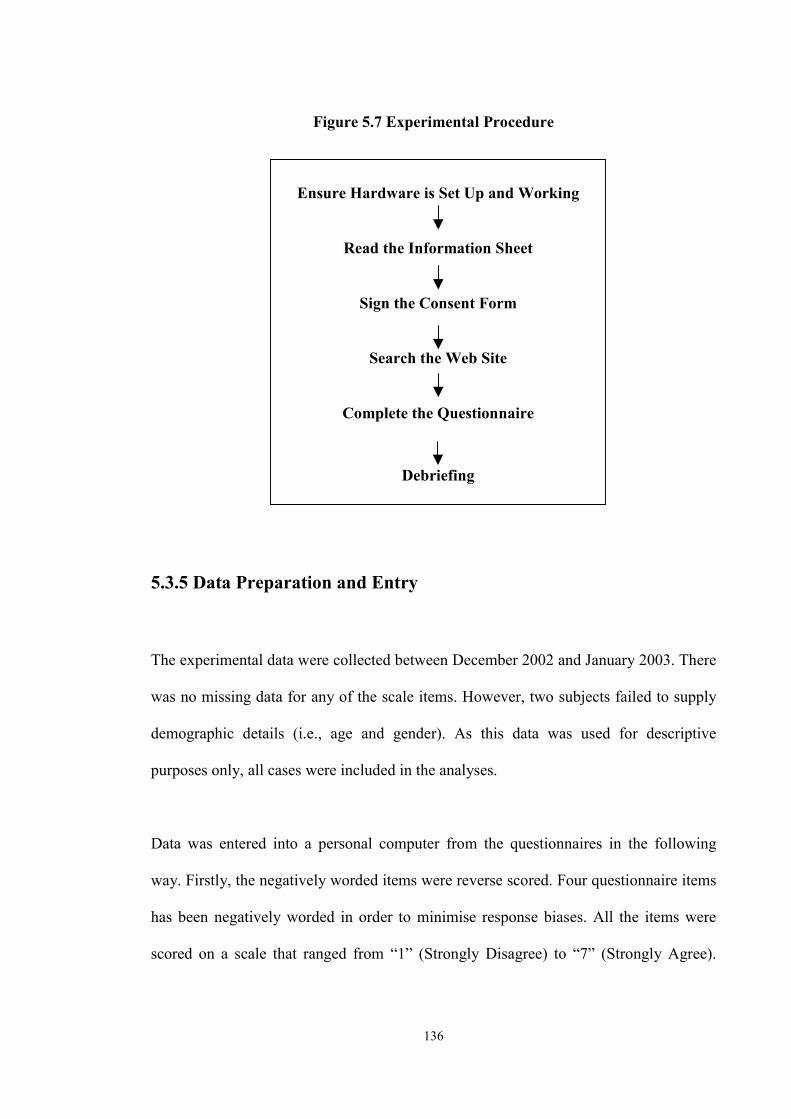
136
Figure 5.7 Experimental Procedure 5.3.5 Data Preparation and Entry
The experimental data were collected between December 2002 and January 2003. There
was no missing data for any of the scale items. However, two subjects failed to supply
demographic details (i.e., age and gender). As this data was used for descriptive
purposes only, all cases were included in the analyses.
Data was entered into a personal computer from the questionnaires in the following
way. Firstly, the negatively worded items were reverse scored. Four questionnaire items
has been negatively worded in order to minimise response biases. All the items were
scored on a scale that ranged from “1” (Strongly Disagree) to “7” (Strongly Agree).
Ensure Hardware is Set Up and Working
Read the Information Sheet
Sign the Consent Form
Search the Web Site
Complete the Questionnaire
Debriefing
137
Item was recoded so that a value of “7” on the negatively worded item was re-coded to
a value of “1”, a value of “6” was re-coded to a value of “2”, and so on.
Secondly, two coders checked whether any coding errors had been introduced during
the data entry process. All coded data entered in the personal computer were double-
checked against the original questionnaires and any incorrect codes were corrected. This
process was repeated twice until no incorrect information was found. When data entry
and checking were completed, statistical analysis was performed using SPSS 11.0 for
Windows.
5.4 Analysis
Data analysis involved two distinct phases. The first phase analysed the relationships
between Web site typology (i.e., Web site structure and content) and the social
interaction measures (i.e., social presence, perceived usefulness, and perceived ease of
use). In addition, moderator effects of Web literacy on the relationships between Web
site typology and social interaction were included. Next, the second phase involved the
analysis of relationships between social interaction (i.e., social presence, perceived
usefulness, and perceived ease of use) and attitude toward the Web site, including the
relationship between two communication measures: attitude toward the Web site and
revisit intention.
In the first phase, a series of variance approaches (i.e., MANCOVA and ANCOVA)
were performed to test hypotheses 1 to 5. Based on a 2x2 factorial design, a
Multivariate Analysis of Variance test with Web literacy as a covariate (Multivariate
138
Analysis of Covariance Analysis: MANCOVA) was performed. A MANCOVA was
utilised to eliminate bias in the analysis by statistically controlling the influence of an
extraneous variable (i.e., Web literacy) on the dependent variables (Coakes and Steed,
1999). Subsequently, when there was an interaction effect of Web site typology on
individual variables, a separate univariate Analysis of Covariance Analysis (ANCOVA)
was performed. On the other hand, when there was no interaction effect, a separate
MANCOVA was conducted.
To test hypotheses 11 and 12, Multiple Regression Analysis and Analysis of Variance
(ANOVA) were performed. Based on the Baron and Kenny’s (1986) approach, first of
all, functions of Web literacy on social interaction measures were examined through
Multiple Regression Analysis, which determined the level of Web literacy (i.e., low and
high). Then, a 2x2 ANOVA test was conducted to investigate the moderator effects of
the two levels of Web literacy.
The variance approaches (e.g., MANCOVA, ANCOVA, and ANOVA) determined
whether different levels of the predictor variables (e.g., Web site structure and content)
and moderator variable (e.g., Web literacy) were the same with regard to mediator
variables (e.g., social presence, perceived ease of use, and perceived usefulness). When
there was a significant difference (at a significance level of 0.05) the null hypothesis
was rejected and the alternative hypothesis accepted.
In the second phase, a multiple linear regression analysis was used to test hypotheses 6
to 10, while a simple regression analysis was employed to test hypothesis regarding
attitude toward the Web site and revisit intention. Linear regression analysis identified

139
the relationships between the mediator variables (e.g., social presence, perceived ease of
use, and perceived usefulness) and the criterion variables (e.g., attitude towards the Web
site and revisit intention). Again the significance level was set at 0.05.
140
CHAPTER 6. RESULTS AND ANALYSIS
6.1 Introduction
In Chapter 4, the research model and a set of hypotheses were developed. To test the
hypotheses, this research employed an experiment, which best explains causal
relationships in the model. Chapter 5 presented the process of the experimental study,
which involved three stages: (1) the development of the instrument, (2) the main
experiment, and (3) statistical analysis. This chapter describes the results of the
statistical analysis of the instrument pilot test and that of the main experiment.
This chapter begins with the results of the instrument pilot test, which involved three
main analyses: (1) a factor analysis for unidimensionality, (2) the corrected-total
correlation analysis for construct validity, and (3) Cronbach’s alphas for scale
reliability. The following section describes the results of each analysis in detail, and the
final instrument is presented.
The last section of this chapter explains the results of the experiment, which involved
assumption testing and hypothesis testing. As a series of variance and linear regression
analysis were applied, the assumptions of the statistical methods were tested. Then, the
results of the hypothesis tests are reported in three parts: (1) Web site typology and
social interaction, (2) moderator effects of Web literacy, and (3) social interaction and
communication effects.
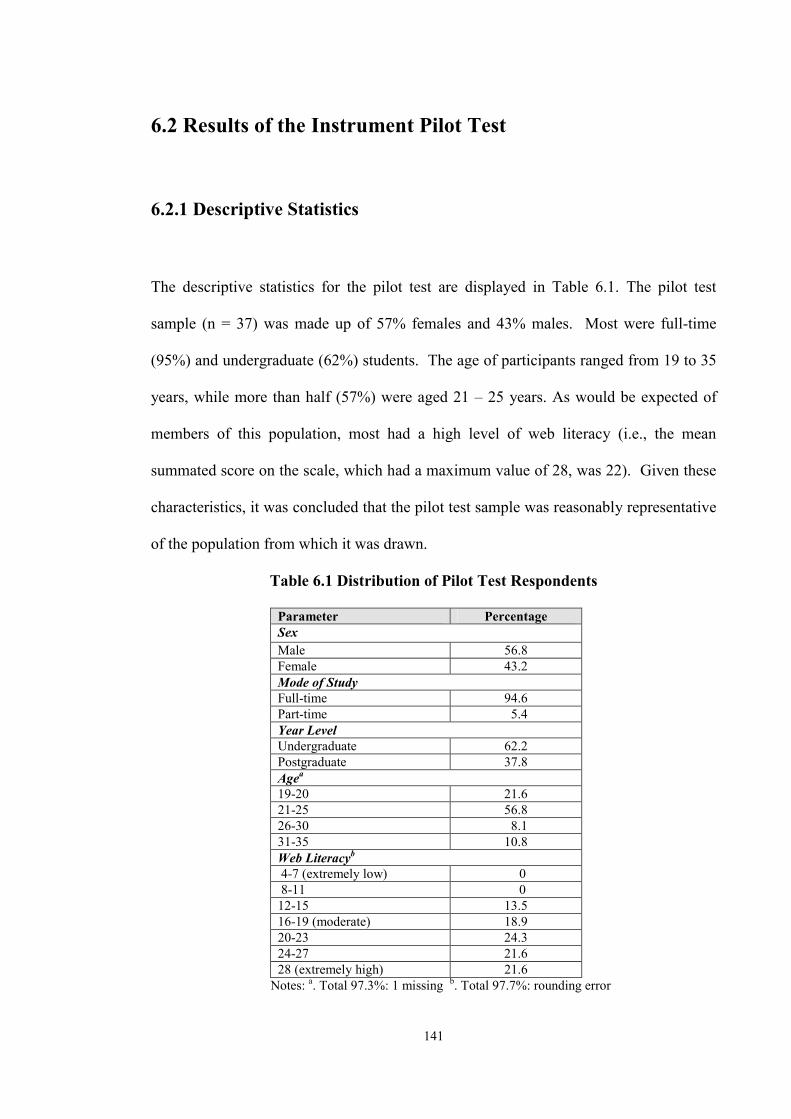
141
6.2 Results of the Instrument Pilot Test
6.2.1 Descriptive Statistics
The descriptive statistics for the pilot test are displayed in Table 6.1. The pilot test
sample (n = 37) was made up of 57% females and 43% males. Most were full-time
(95%) and undergraduate (62%) students. The age of participants ranged from 19 to 35
years, while more than half (57%) were aged 21 – 25 years. As would be expected of
members of this population, most had a high level of web literacy (i.e., the mean
summated score on the scale, which had a maximum value of 28, was 22). Given these
characteristics, it was concluded that the pilot test sample was reasonably representative
of the population from which it was drawn.
Table 6.1 Distribution of Pilot Test Respondents
Parameter Percentage Sex Male 56.8 Female 43.2 Mode of Study Full-time 94.6 Part-time 5.4 Year Level Undergraduate 62.2 Postgraduate 37.8 Agea 19-20 21.6 21-25 56.8 26-30 8.1 31-35 10.8 Web Literacyb 4-7 (extremely low) 0 8-11 0 12-15 13.5 16-19 (moderate) 18.9 20-23 24.3 24-27 21.6 28 (extremely high) 21.6
Notes: a. Total 97.3%: 1 missing b. Total 97.7%: rounding error
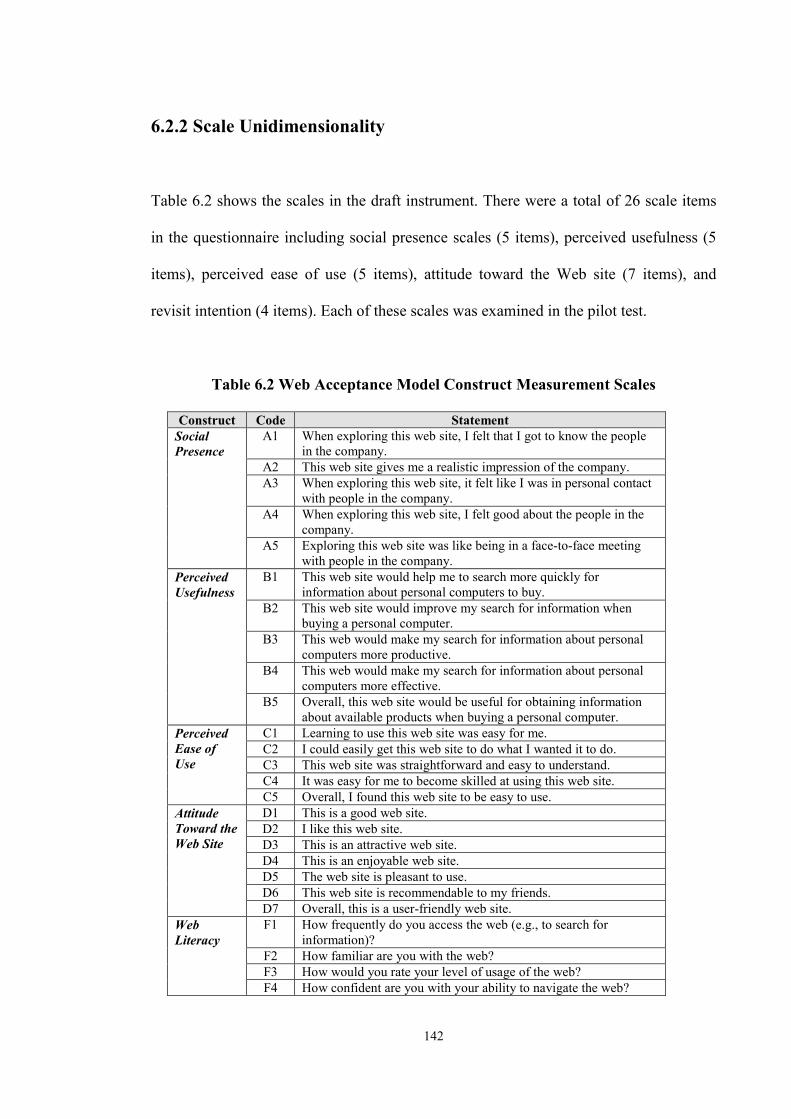
142
6.2.2 Scale Unidimensionality Table 6.2 shows the scales in the draft instrument. There were a total of 26 scale items
in the questionnaire including social presence scales (5 items), perceived usefulness (5
items), perceived ease of use (5 items), attitude toward the Web site (7 items), and
revisit intention (4 items). Each of these scales was examined in the pilot test.
Table 6.2 Web Acceptance Model Construct Measurement Scales Construct Code Statement
A1 When exploring this web site, I felt that I got to know the people in the company.
A2 This web site gives me a realistic impression of the company. A3 When exploring this web site, it felt like I was in personal contact
with people in the company. A4 When exploring this web site, I felt good about the people in the
company.
Social Presence
A5 Exploring this web site was like being in a face-to-face meeting with people in the company.
B1 This web site would help me to search more quickly for information about personal computers to buy.
B2 This web site would improve my search for information when buying a personal computer.
B3 This web would make my search for information about personal computers more productive.
B4 This web would make my search for information about personal computers more effective.
Perceived Usefulness
B5 Overall, this web site would be useful for obtaining information about available products when buying a personal computer.
C1 Learning to use this web site was easy for me. C2 I could easily get this web site to do what I wanted it to do. C3 This web site was straightforward and easy to understand. C4 It was easy for me to become skilled at using this web site.
Perceived Ease of Use
C5 Overall, I found this web site to be easy to use. D1 This is a good web site. D2 I like this web site. D3 This is an attractive web site. D4 This is an enjoyable web site. D5 The web site is pleasant to use. D6 This web site is recommendable to my friends.
Attitude Toward the Web Site
D7 Overall, this is a user-friendly web site. F1 How frequently do you access the web (e.g., to search for
information)? F2 How familiar are you with the web? F3 How would you rate your level of usage of the web?
Web Literacy
F4 How confident are you with your ability to navigate the web?
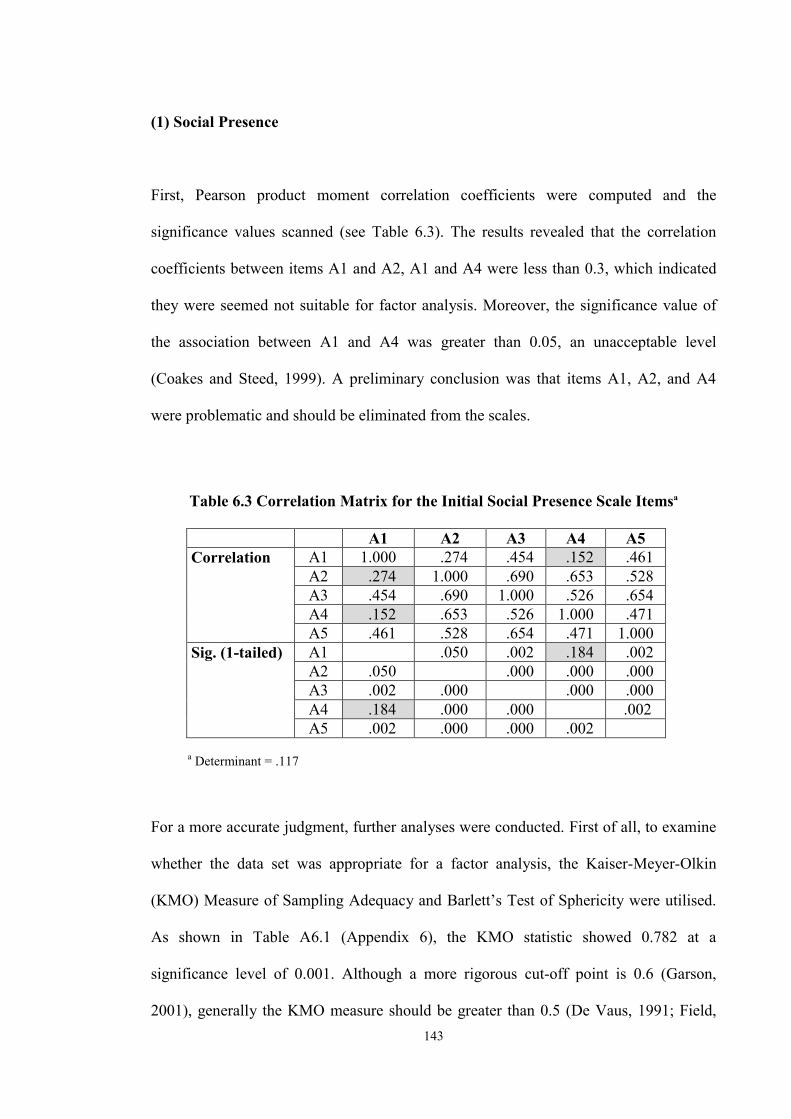
143
(1) Social Presence
First, Pearson product moment correlation coefficients were computed and the
significance values scanned (see Table 6.3). The results revealed that the correlation
coefficients between items A1 and A2, A1 and A4 were less than 0.3, which indicated
they were seemed not suitable for factor analysis. Moreover, the significance value of
the association between A1 and A4 was greater than 0.05, an unacceptable level
(Coakes and Steed, 1999). A preliminary conclusion was that items A1, A2, and A4
were problematic and should be eliminated from the scales.
Table 6.3 Correlation Matrix for the Initial Social Presence Scale Itemsa
A1 A2 A3 A4 A5 A1 1.000 .274 .454 .152 .461 A2 .274 1.000 .690 .653 .528 A3 .454 .690 1.000 .526 .654 A4 .152 .653 .526 1.000 .471
Correlation A5 .461 .528 .654 .471 1.000
A1 .050 .002 .184 .002 A2 .050 .000 .000 .000 A3 .002 .000 .000 .000 A4 .184 .000 .000 .002
Sig. (1-tailed) A5 .002 .000 .000 .002
a Determinant = .117 For a more accurate judgment, further analyses were conducted. First of all, to examine
whether the data set was appropriate for a factor analysis, the Kaiser-Meyer-Olkin
(KMO) Measure of Sampling Adequacy and Barlett’s Test of Sphericity were utilised.
As shown in Table A6.1 (Appendix 6), the KMO statistic showed 0.782 at a
significance level of 0.001. Although a more rigorous cut-off point is 0.6 (Garson,
2001), generally the KMO measure should be greater than 0.5 (De Vaus, 1991; Field,
144
2000). In comparison with these cut-off levels, the KMO result was very high. Barlett’s
Test of Sphericity was also highly significant (chi-square = 71.9 with 10 degree of
freedom, at p < 0.001). Therefore, it was concluded that a factor analysis of the scale
items would be appropriate.
Next, the eigenvalue and the scree plot were investigated to determine the number of
factors. An initial Principal Component Analysis for the five-item social presence scales
generated one component with an eigenvalue of 2.996. As shown in Figure A5.1
(Appendix 5), the scree plot also identified one component resulting in a distinct break
between the first component and other components (Gebotys, 2001).
Finally, factor loadings (component loadings in PCA) and communalities were
investigated. Generally, factor loadings below 0.4 are considered low, and low-loading
items should be suppressed (e.g., De Vaus, 1991; Field, 2000; Garson, 2001; Hair et al.,
1995; Stevens, 1992). However, a more rigorous cut-off score is 0.6 (e.g., McCroskey
and Young, 1979; Sankaranarayanan, Bhor, and Murawski, 2002). In this pilot study,
the factor loading for item A1 (0.559) was slightly lower than the strict cut-off, but the
other items were higher than 0.7 (see Table 6.4). Communality is also a useful measure
for examining the interrelations between items. A good factor should have a minimum
communality value of 0.4 (De Vaus, 1991; Field, 2000; Miles and Huberman, 1994).
The result showed that, while communality values of most of the items exceeded the
cut-off level, the value of A1 was below the generally accepted minimum of 0.4 (i.e., it
was 0.313).
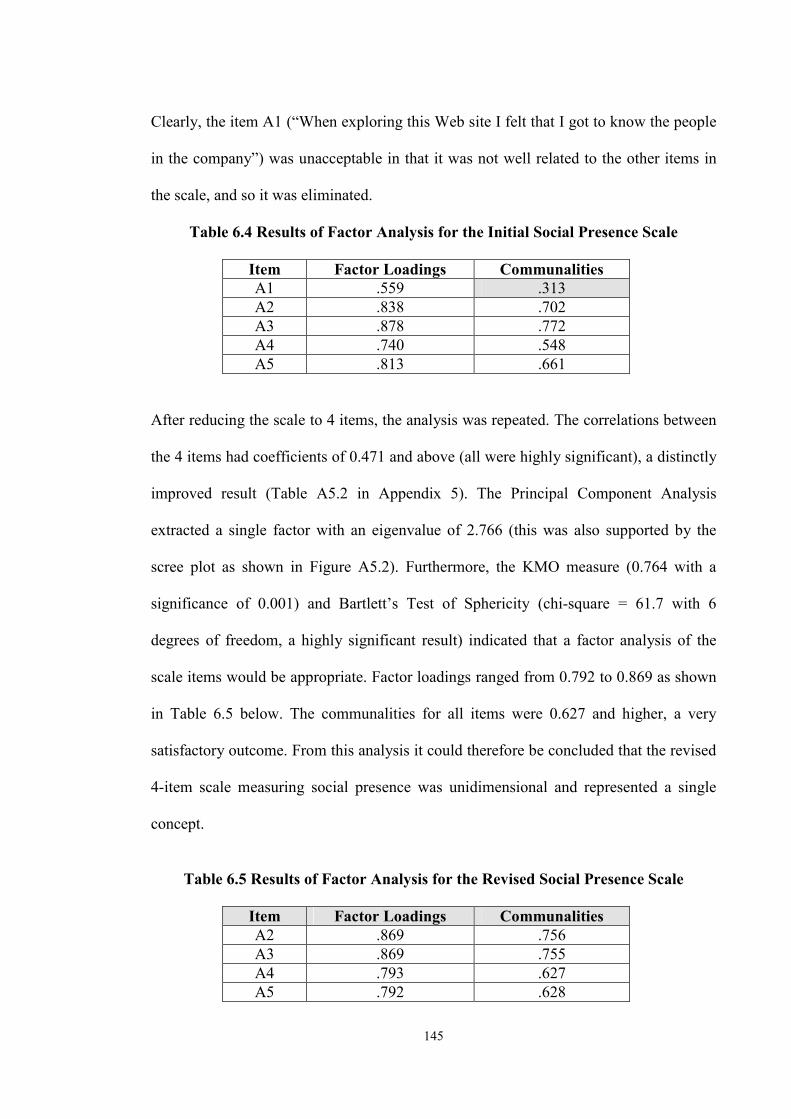
145
Clearly, the item A1 (“When exploring this Web site I felt that I got to know the people
in the company”) was unacceptable in that it was not well related to the other items in
the scale, and so it was eliminated.
Table 6.4 Results of Factor Analysis for the Initial Social Presence Scale
Item Factor Loadings Communalities A1 .559 .313 A2 .838 .702 A3 .878 .772 A4 .740 .548 A5 .813 .661
After reducing the scale to 4 items, the analysis was repeated. The correlations between
the 4 items had coefficients of 0.471 and above (all were highly significant), a distinctly
improved result (Table A5.2 in Appendix 5). The Principal Component Analysis
extracted a single factor with an eigenvalue of 2.766 (this was also supported by the
scree plot as shown in Figure A5.2). Furthermore, the KMO measure (0.764 with a
significance of 0.001) and Bartlett’s Test of Sphericity (chi-square = 61.7 with 6
degrees of freedom, a highly significant result) indicated that a factor analysis of the
scale items would be appropriate. Factor loadings ranged from 0.792 to 0.869 as shown
in Table 6.5 below. The communalities for all items were 0.627 and higher, a very
satisfactory outcome. From this analysis it could therefore be concluded that the revised
4-item scale measuring social presence was unidimensional and represented a single
concept.
Table 6.5 Results of Factor Analysis for the Revised Social Presence Scale
Item Factor Loadings Communalities A2 .869 .756 A3 .869 .755 A4 .793 .627 A5 .792 .628
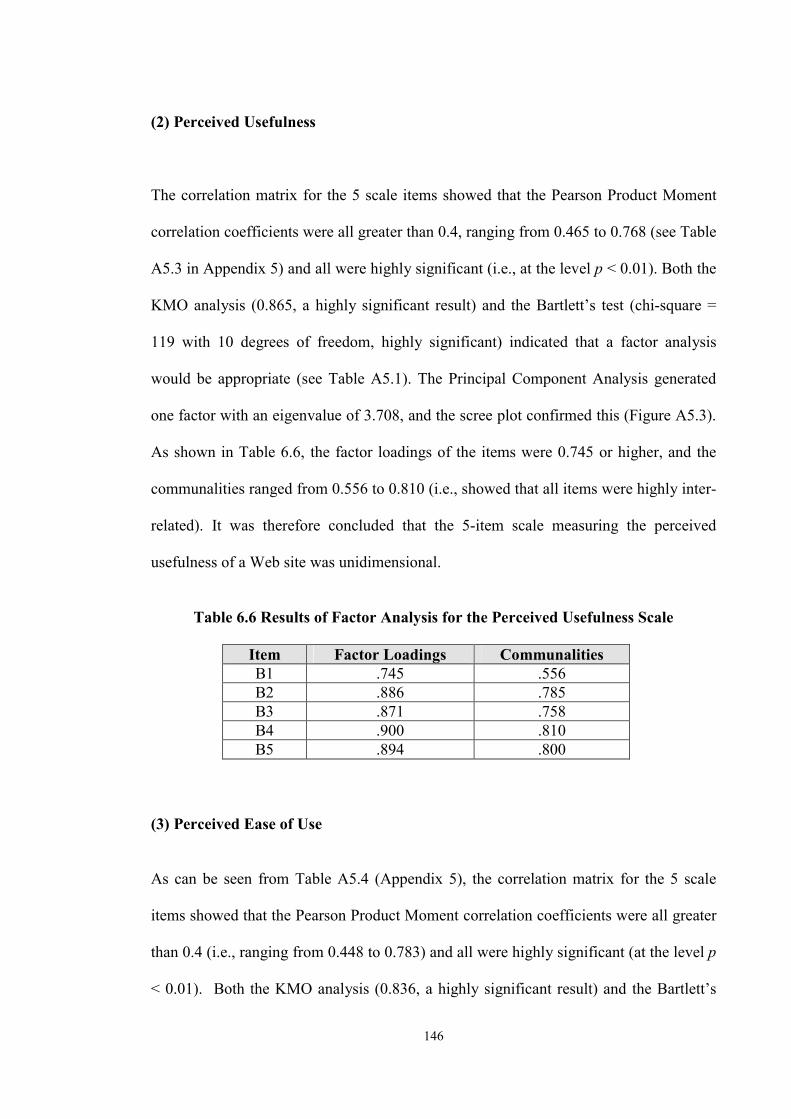
146
(2) Perceived Usefulness
The correlation matrix for the 5 scale items showed that the Pearson Product Moment
correlation coefficients were all greater than 0.4, ranging from 0.465 to 0.768 (see Table
A5.3 in Appendix 5) and all were highly significant (i.e., at the level p < 0.01). Both the
KMO analysis (0.865, a highly significant result) and the Bartlett’s test (chi-square =
119 with 10 degrees of freedom, highly significant) indicated that a factor analysis
would be appropriate (see Table A5.1). The Principal Component Analysis generated
one factor with an eigenvalue of 3.708, and the scree plot confirmed this (Figure A5.3).
As shown in Table 6.6, the factor loadings of the items were 0.745 or higher, and the
communalities ranged from 0.556 to 0.810 (i.e., showed that all items were highly inter-
related). It was therefore concluded that the 5-item scale measuring the perceived
usefulness of a Web site was unidimensional.
Table 6.6 Results of Factor Analysis for the Perceived Usefulness Scale
Item Factor Loadings Communalities B1 .745 .556 B2 .886 .785 B3 .871 .758 B4 .900 .810 B5 .894 .800
(3) Perceived Ease of Use
As can be seen from Table A5.4 (Appendix 5), the correlation matrix for the 5 scale
items showed that the Pearson Product Moment correlation coefficients were all greater
than 0.4 (i.e., ranging from 0.448 to 0.783) and all were highly significant (at the level p
< 0.01). Both the KMO analysis (0.836, a highly significant result) and the Bartlett’s

147
test (chi-square = 107 with 10 degrees of freedom, highly significant) indicated that a
factor analysis would be appropriate (see Table A5.1). The Principal Component
Analysis generated one factor with an eigenvalue of 3.530, and the scree plot confirmed
this (Figure A5.4). As can be seen from Table 6.7, the factor loadings of the items were
0.736 or higher, and the communalities ranged from 0.542 to 0.814. As a result, it was
concluded that the 5-item scale measuring the perceived ease of use of a Web site was
unidimensional.
Table 6.7 Results of Factor Analysis for the Perceived Ease of Use Scale
Item Factor Loadings Communalities C1 .897 .804 C2 .808 .653 C3 .902 .814 C4 .736 .542 C5 .847 .717
(4) Attitude Toward the Web Site
The correlation matrix for the 7 scale items revealed some problems with this measure.
As shown in Table 6.8, two of the correlations had coefficients of less than 0.3 (i.e.,
0.262 and 0.148), and neither association was significant at the 0.05 level. At least one
of the scale items seemed to be unacceptable. The KMO analysis (0.779, highly
significant) and the Bartlett’s test (chi-square = 131 with 21 degrees of freedom, highly
significant) indicated that a factor analysis would be appropriate (see Table A5.1). An
initial Principal Component Analysis of all scale items identified two components with
eigenvalues of 3.956 and 1.174, a result which was confirmed by the scree plot (Figure
A5.5). As can be seen from Table 6.9, communalities of all items were higher than the
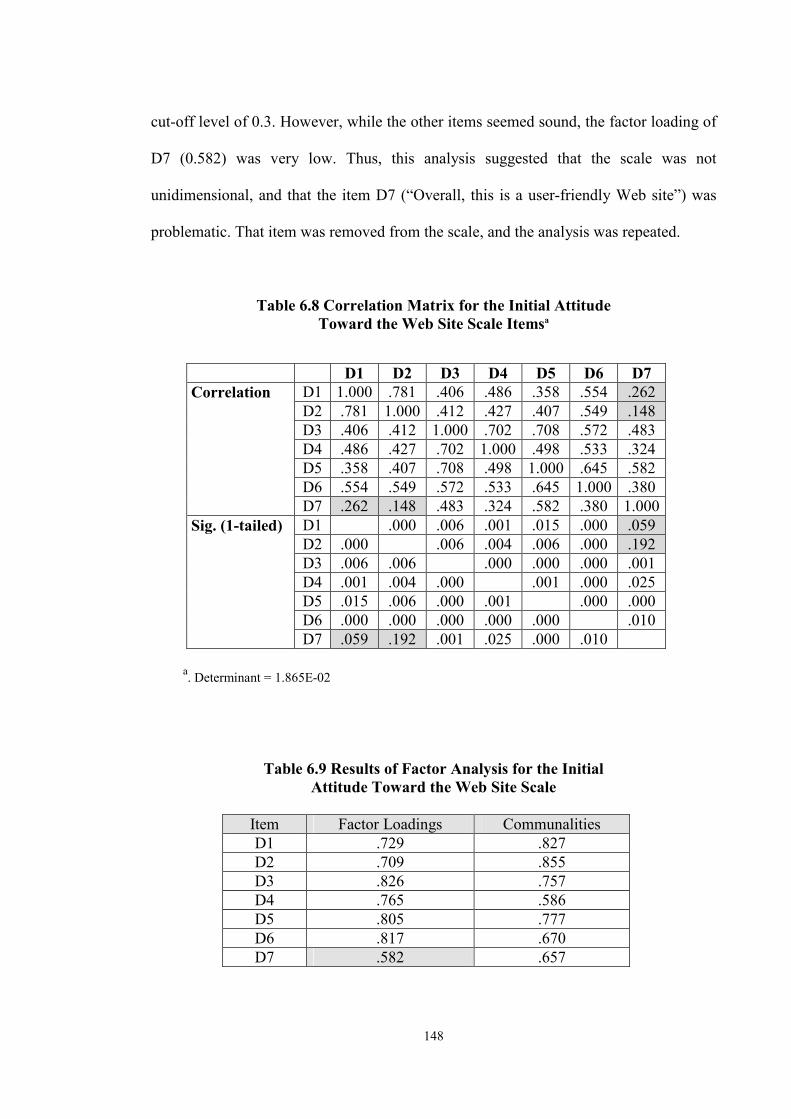
148
cut-off level of 0.3. However, while the other items seemed sound, the factor loading of
D7 (0.582) was very low. Thus, this analysis suggested that the scale was not
unidimensional, and that the item D7 (“Overall, this is a user-friendly Web site”) was
problematic. That item was removed from the scale, and the analysis was repeated.
Table 6.8 Correlation Matrix for the Initial Attitude Toward the Web Site Scale Itemsa
D1 D2 D3 D4 D5 D6 D7 D1 1.000 .781 .406 .486 .358 .554 .262 D2 .781 1.000 .412 .427 .407 .549 .148 D3 .406 .412 1.000 .702 .708 .572 .483 D4 .486 .427 .702 1.000 .498 .533 .324 D5 .358 .407 .708 .498 1.000 .645 .582 D6 .554 .549 .572 .533 .645 1.000 .380
Correlation D7 .262 .148 .483 .324 .582 .380 1.000
D1 .000 .006 .001 .015 .000 .059 D2 .000 .006 .004 .006 .000 .192 D3 .006 .006 .000 .000 .000 .001 D4 .001 .004 .000 .001 .000 .025 D5 .015 .006 .000 .001 .000 .000 D6 .000 .000 .000 .000 .000 .010
Sig. (1-tailed) D7 .059 .192 .001 .025 .000 .010
a. Determinant = 1.865E-02
Table 6.9 Results of Factor Analysis for the Initial Attitude Toward the Web Site Scale
Item Factor Loadings Communalities D1 .729 .827 D2 .709 .855 D3 .826 .757 D4 .765 .586 D5 .805 .777 D6 .817 .670 D7 .582 .657
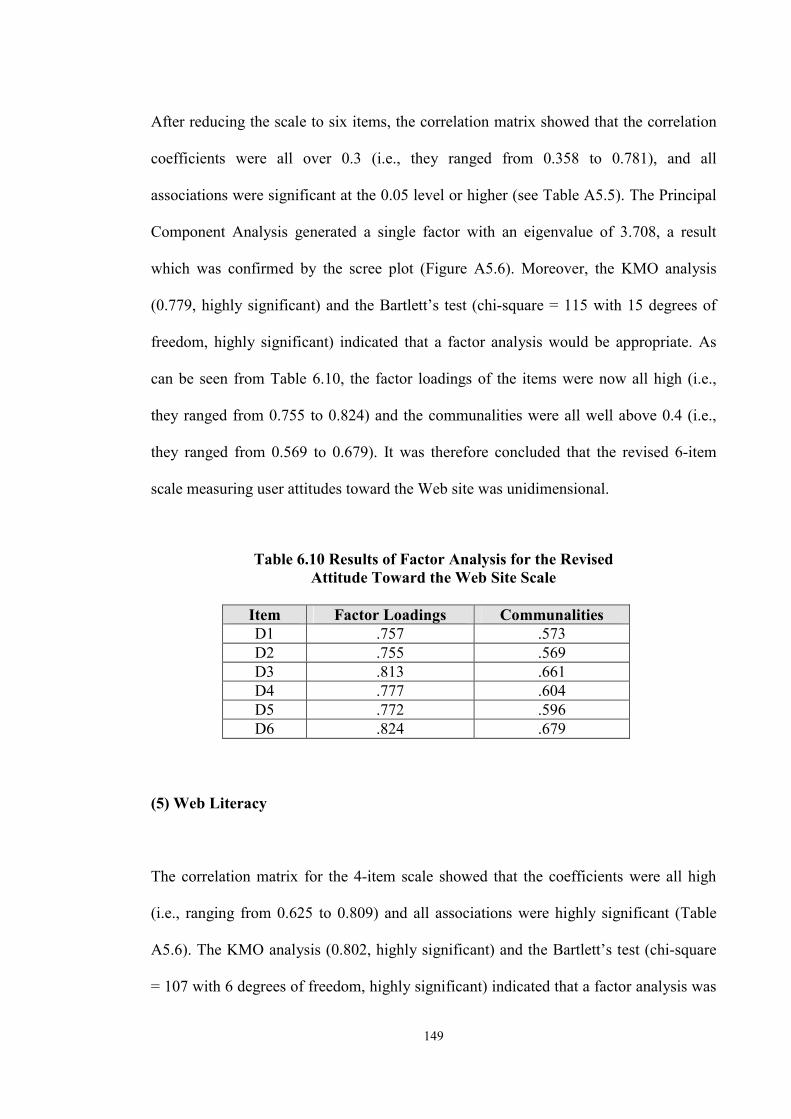
149
After reducing the scale to six items, the correlation matrix showed that the correlation
coefficients were all over 0.3 (i.e., they ranged from 0.358 to 0.781), and all
associations were significant at the 0.05 level or higher (see Table A5.5). The Principal
Component Analysis generated a single factor with an eigenvalue of 3.708, a result
which was confirmed by the scree plot (Figure A5.6). Moreover, the KMO analysis
(0.779, highly significant) and the Bartlett’s test (chi-square = 115 with 15 degrees of
freedom, highly significant) indicated that a factor analysis would be appropriate. As
can be seen from Table 6.10, the factor loadings of the items were now all high (i.e.,
they ranged from 0.755 to 0.824) and the communalities were all well above 0.4 (i.e.,
they ranged from 0.569 to 0.679). It was therefore concluded that the revised 6-item
scale measuring user attitudes toward the Web site was unidimensional.
Table 6.10 Results of Factor Analysis for the Revised Attitude Toward the Web Site Scale
Item Factor Loadings Communalities D1 .757 .573 D2 .755 .569 D3 .813 .661 D4 .777 .604 D5 .772 .596 D6 .824 .679
(5) Web Literacy
The correlation matrix for the 4-item scale showed that the coefficients were all high
(i.e., ranging from 0.625 to 0.809) and all associations were highly significant (Table
A5.6). The KMO analysis (0.802, highly significant) and the Bartlett’s test (chi-square
= 107 with 6 degrees of freedom, highly significant) indicated that a factor analysis was

150
appropriate (Table A5.1). The Principal Component Analysis generated one factor with
an eigenvalue of 3.708, a result confirmed by the scree plot (Figure A5.7). As shown in
Table 6.11, factor loadings were all high (i.e., they ranged from 0.868 to 0.924), as were
the communalities (i.e., ranging from 0.754 to 0.854). This analysis indicated that the 4-
item scale measuring web literacy was unidimensional.
Table 6.11 Results of Factor Analysis for the Web Literacy Scale
Item Factor Loadings Communalities F1 .868 .754 F2 .918 .843 F3 .887 .788 F4 .924 .854
6.2.3 Scale Construct Validity
To test for construct validity, the corrected item-total correlation was utilised. In other
words, this study examined the correlations of each item’s score with the total scale
score in order to investigate whether the items measured the same construct. This
method usually subtracts each item score from the total score to eliminate a spurious
part-whole correlation (Doll and Torkzadeh, 1988; Xiao and Dasgupta, 2002). Each
item’s score is then compared with the corrected total score. Although there is no
universally agreed cut-off point, the most widely adopted threshold is 0.05 (e.g.,
Bearden, Netemeyer, and Teel, 1989; Doll and Torkzadeh, 1988; Momani, Odedina,
Rosenbluth, and Madhavan, 2000; Xiao and Dasgupta, 2002).
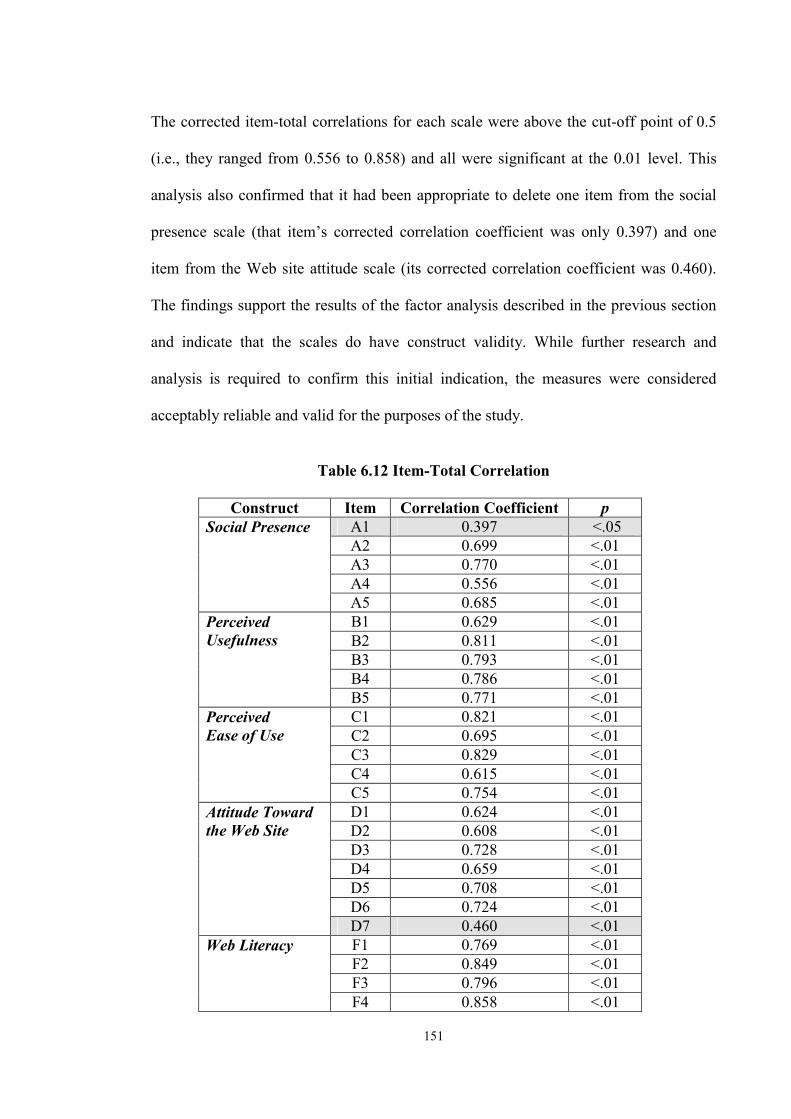
151
The corrected item-total correlations for each scale were above the cut-off point of 0.5
(i.e., they ranged from 0.556 to 0.858) and all were significant at the 0.01 level. This
analysis also confirmed that it had been appropriate to delete one item from the social
presence scale (that item’s corrected correlation coefficient was only 0.397) and one
item from the Web site attitude scale (its corrected correlation coefficient was 0.460).
The findings support the results of the factor analysis described in the previous section
and indicate that the scales do have construct validity. While further research and
analysis is required to confirm this initial indication, the measures were considered
acceptably reliable and valid for the purposes of the study.
Table 6.12 Item-Total Correlation
Construct Item Correlation Coefficient p
A1 0.397 <.05 A2 0.699 <.01 A3 0.770 <.01 A4 0.556 <.01
Social Presence
A5 0.685 <.01 B1 0.629 <.01 B2 0.811 <.01 B3 0.793 <.01 B4 0.786 <.01
Perceived Usefulness
B5 0.771 <.01 C1 0.821 <.01 C2 0.695 <.01 C3 0.829 <.01 C4 0.615 <.01
Perceived Ease of Use
C5 0.754 <.01 D1 0.624 <.01 D2 0.608 <.01 D3 0.728 <.01 D4 0.659 <.01 D5 0.708 <.01 D6 0.724 <.01
Attitude Toward the Web Site
D7 0.460 <.01 F1 0.769 <.01 F2 0.849 <.01 F3 0.796 <.01
Web Literacy
F4 0.858 <.01

152
6.2.4 Scale Reliability
After deleting two items from the original scales, Cronbach’s alphas were calculated in
order to assess the internal consistency of the resulting scales. Although some
researchers suggest 0.7 as the accepted cut-off (Hair et al, 1995), a value more than 0.6
is regarded as a satisfactory level (Dinev and Hart, 2002; Hair, Bush, and Ortinau, 2000;
Malhotra et al., 1996; Nunnally, 1978; Van de Ven and Ferry, 1980). As can be seen
from Table 6.13, all of the scales had very high alpha scores, ranging from 0.8289 to
0.9206, and were well above the generally accepted lower limit of 0.7. From this
finding we conclude that the scales have high levels of internal consistency and so may
be considered to be suitably reliable.
Table 6.13 Cronbach’s Alpha Scores for the Revised Measurement Scales
Measurement Scale No. Items Cronbach’s alpha
Social Presence 4 .8289 Perceived Usefulness 5 .9097 Perceived Ease of Use 5 .8945 Attitude Towards Web Site 6 .8720 Web Literacy 4 .9206
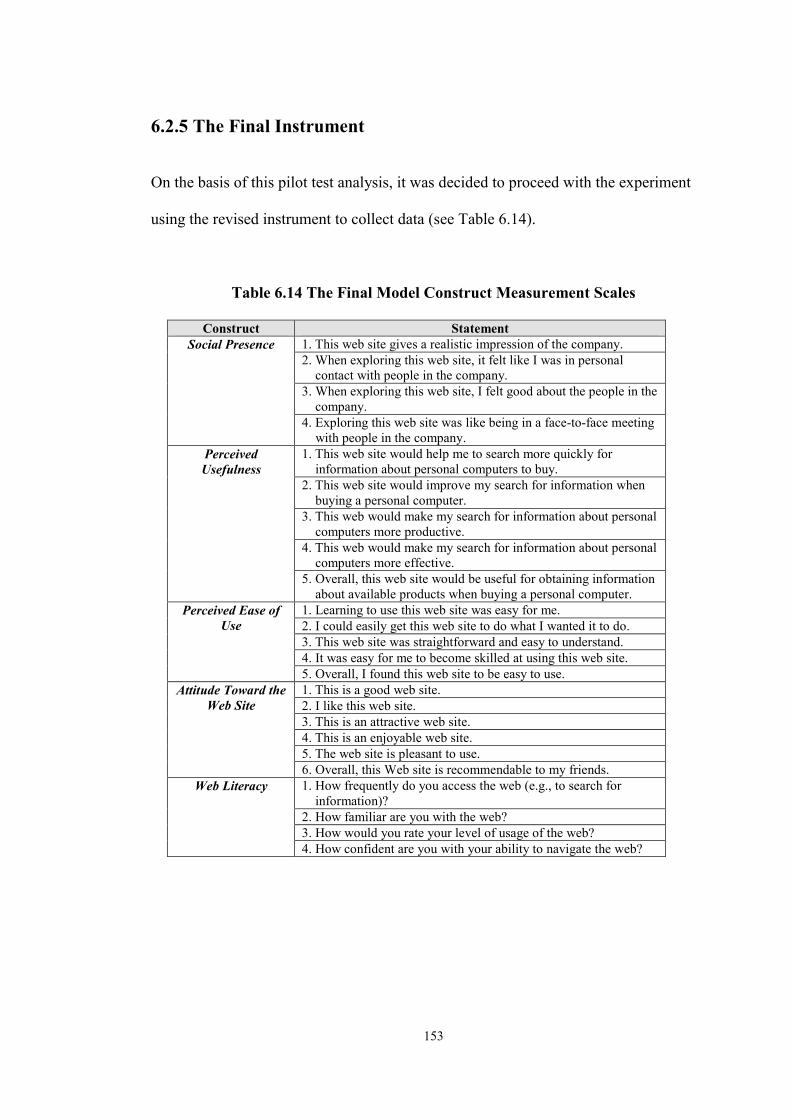
153
6.2.5 The Final Instrument On the basis of this pilot test analysis, it was decided to proceed with the experiment
using the revised instrument to collect data (see Table 6.14).
Table 6.14 The Final Model Construct Measurement Scales
Construct Statement 1. This web site gives a realistic impression of the company. 2. When exploring this web site, it felt like I was in personal contact with people in the company. 3. When exploring this web site, I felt good about the people in the company.
Social Presence
4. Exploring this web site was like being in a face-to-face meeting with people in the company. 1. This web site would help me to search more quickly for information about personal computers to buy. 2. This web site would improve my search for information when buying a personal computer. 3. This web would make my search for information about personal computers more productive. 4. This web would make my search for information about personal computers more effective.
Perceived Usefulness
5. Overall, this web site would be useful for obtaining information about available products when buying a personal computer. 1. Learning to use this web site was easy for me. 2. I could easily get this web site to do what I wanted it to do. 3. This web site was straightforward and easy to understand. 4. It was easy for me to become skilled at using this web site.
Perceived Ease of Use
5. Overall, I found this web site to be easy to use. 1. This is a good web site. 2. I like this web site. 3. This is an attractive web site. 4. This is an enjoyable web site. 5. The web site is pleasant to use.
Attitude Toward the Web Site
6. Overall, this Web site is recommendable to my friends. 1. How frequently do you access the web (e.g., to search for information)? 2. How familiar are you with the web? 3. How would you rate your level of usage of the web?
Web Literacy
4. How confident are you with your ability to navigate the web?
154
6.3 Results of the Experiment 6.3.1 Descriptive Statistics
The descriptive statistics for the experiment are displayed in Table 6.15. The experiment
sample (n = 160) was made up of 65% males and 35% females. While most were full-
time (93%), there were 56% postgraduate and 44 % undergraduate students. The age of
subjects ranged from 17 to 45 years, while around 40% were aged between 21 and 25
years. As would be expected of members of this population, most had a high level of
web literacy (i.e., the mean summated score on the scale, which had a maximum value
of 28, was 21). As shown in the table, a comparison of the demographic characteristics
of the experiment sample and the study population indicates that the sample had
significantly more male, full-time, and undergraduate students. The results of chi-square
goodness-of-fit tests showed that there were statistically significant differences in
distribution of subjects in each category (i.e., gender, mode of study, year level, and
age) between the sample and population. Therefore, some caution is needed in
generalizing the results of the study to the population.

155
Table 6.15 Distribution of Experiment Respondents
Chi-square test Parameter Samplea
(%) Populationb
(%) χ2 P Genderc 16.988 .000 Male 65.0 51.2 Female 34.4 48.8 Mode of study 163.259 .000 Full-time 93.1 56.7 Part-time 6.3 43.3 Year levelc 15.346 .000 Undergraduate Year 1 and 2 Year 3 and over
44.0 (24.5) (19.5)
70.5
Postgraduate 55.6 29.5 Aged 77.151 .000 Less than 20 16.9 19.5 21-25 40.6 44.4 26-30 25.0 15.9 More than 31 16.3 20.2 Web experience NA NA 4 (extremely low) 0.6 NAe 5-8 1.3 NA 9-12 7.5 NA 13-16 (moderate) 8.8 NA 17-20 28.1 NA 21-24 33.1 NA 25-28 (extremely high)
20.6 NA
Notes: a. Total 160, percentages based on the total b. Total 19,267, percentages based on the total c. Total 99.4%: 1 missing d. Total 98.9%: 2 missing e. NA = Not Applicable
6.2.3 Approach to the Analysis
As discussed in the previous chapter, this study involved two different statistical
approaches. To test hypotheses associated with the relation ships between predictors,
mediators, and moderators, a series of variance approaches (i.e., MANCOVA,
ANCOVA, and ANOVA) were conducted. Whereas, a series of linear regression
analysis were carried out to assess hypotheses associated with the relationships between
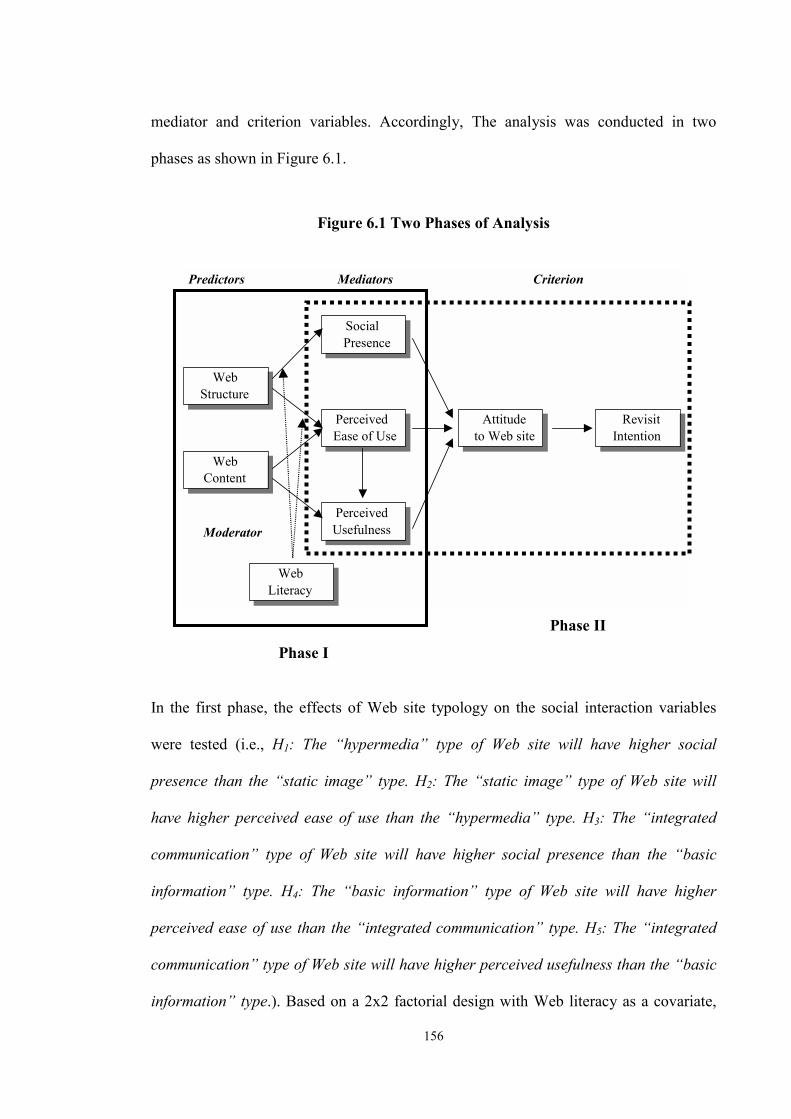
156
mediator and criterion variables. Accordingly, The analysis was conducted in two
phases as shown in Figure 6.1.
Figure 6.1 Two Phases of Analysis
WebStructure
Web Structure
WebContent Web
Content
PerceivedUsefulness
Perceived Usefulness
PerceivedEase of UsePerceived
Ease of Use
SocialPrescenceSocial Presence
AttitudeTo Website
Attitudeto Web site
RevisitIntentionRevisit
Intention
Web Literacy
Web Literacy
Predictors Mediators Criterion
Moderator
Phase II
Phase I
In the first phase, the effects of Web site typology on the social interaction variables
were tested (i.e., H1: The “hypermedia” type of Web site will have higher social
presence than the “static image” type. H2: The “static image” type of Web site will
have higher perceived ease of use than the “hypermedia” type. H3: The “integrated
communication” type of Web site will have higher social presence than the “basic
information” type. H4: The “basic information” type of Web site will have higher
perceived ease of use than the “integrated communication” type. H5: The “integrated
communication” type of Web site will have higher perceived usefulness than the “basic
information” type.). Based on a 2x2 factorial design with Web literacy as a covariate,
157
Multivariate Analysis of Covariance Analysis (MANCOVA) was performed. A
MANCOVA was utilised to eliminate any bias in the analysis by statistically controlling
the influence of an extraneous variable (i.e., the covariate Web literacy) on the
dependent variables (Coakes and Steed, 1999). Subsequently, for understanding the
effects of Web site typology on individual variables, a separate univariate 2x2
ANCOVA was performed.
Additionally, to test the moderator effects of Web literacy on the relationships between
Web site typology and social interaction measures (i.e., H11a: People with high Web
literacy will feel the “hypermedia” type of Web site to be higher in social presence than
the “static image” type. H11b: People with low Web literacy will feel the “static image”
type of Web site to be higher in social presence than the “hypermedia” type. H12a:
People with high Web literacy will perceive no difference in ease of use between the
“hypermedia” type and the “static image” type of Web site. H12b: People with low Web
literacy will perceive the “static image” type of Web site to be easier to use than the
“hypermedia” type.), Baron and Kenny’s (1986) approach was adopted. They argued
that when the independent variable is a categorical variable and the moderator is a
continuous metric variable, it is impossible to measure moderator effects precisely
because the moderator has many levels. Hence, they suggested that before measuring
moderator effects, the researcher should find the level “in which the moderator changes
the effect of the independent variable on the dependent variable” (Baron and Kenny,
1986, p. 1175).
As the independent variables were categorical and the moderator variable was a
continuous variable, the effect of Web literacy on the social interaction measures (i.e.,
158
social presence, perceived usefulness, and perceived ease of use) were examined. A
close investigation of the shapes of the relationships indicated that transformation of
moderator variable from continuous to dichotomous (i.e., high vs. low) was necessary.
Finally, a 2x2 ANOVA (Univariate Analysis of Variance) test was conducted to
investigate the moderator effects of the two levels on social presence.
In the second phase, as all variable were continuous, a series of linear regression
analyses were performed. In particular, multiple regression was used to examine the
hypotheses in relation to the relationships between social interaction and
communication effect measures (i.e., H6: The more positive the social presence of a
Web site is, the more positive the attitude toward the Web site will be. H7: The more
positive the perceived ease of use of a Web site is, the more positive the attitude toward
the Web site will be. H8: The more positive the perceived usefulness of a Web site is, the
more positive the attitude toward the Web site will be. H9: The more positive the
perceived ease of use of a Web site is, the greater the perceived usefulness will be.). A
simple regression analysis was employed to test the hypothesis regarding attitude
toward the Web site and revisit intention (i.e., H10: The more positive attitude toward
the Web site is, the higher revisit intention will be.).
6.3.3 Data Screening and Assumption Testing
As MANCOVA, ANOVA, and linear regression are parametric analyses involving
multivariate data, a data set should be explored to see if it meets the assumptions of the
statistical methods applied to this study (i.e., MANCOVA, ANCOVA, ANOVA, and
Linear Regression). The test statistics are reported in Appendix 6.
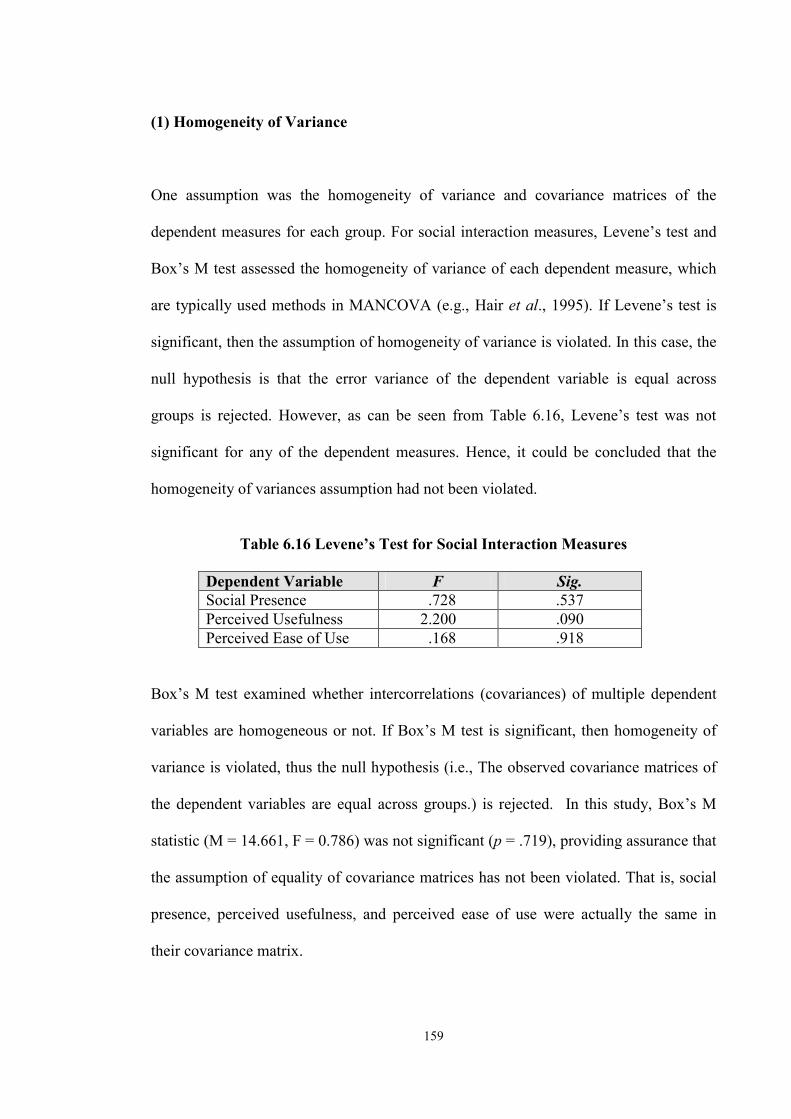
159
(1) Homogeneity of Variance
One assumption was the homogeneity of variance and covariance matrices of the
dependent measures for each group. For social interaction measures, Levene’s test and
Box’s M test assessed the homogeneity of variance of each dependent measure, which
are typically used methods in MANCOVA (e.g., Hair et al., 1995). If Levene’s test is
significant, then the assumption of homogeneity of variance is violated. In this case, the
null hypothesis is that the error variance of the dependent variable is equal across
groups is rejected. However, as can be seen from Table 6.16, Levene’s test was not
significant for any of the dependent measures. Hence, it could be concluded that the
homogeneity of variances assumption had not been violated.
Table 6.16 Levene’s Test for Social Interaction Measures
Dependent Variable F Sig. Social Presence .728 .537 Perceived Usefulness 2.200 .090 Perceived Ease of Use .168 .918
Box’s M test examined whether intercorrelations (covariances) of multiple dependent
variables are homogeneous or not. If Box’s M test is significant, then homogeneity of
variance is violated, thus the null hypothesis (i.e., The observed covariance matrices of
the dependent variables are equal across groups.) is rejected. In this study, Box’s M
statistic (M = 14.661, F = 0.786) was not significant (p = .719), providing assurance that
the assumption of equality of covariance matrices has not been violated. That is, social
presence, perceived usefulness, and perceived ease of use were actually the same in
their covariance matrix.
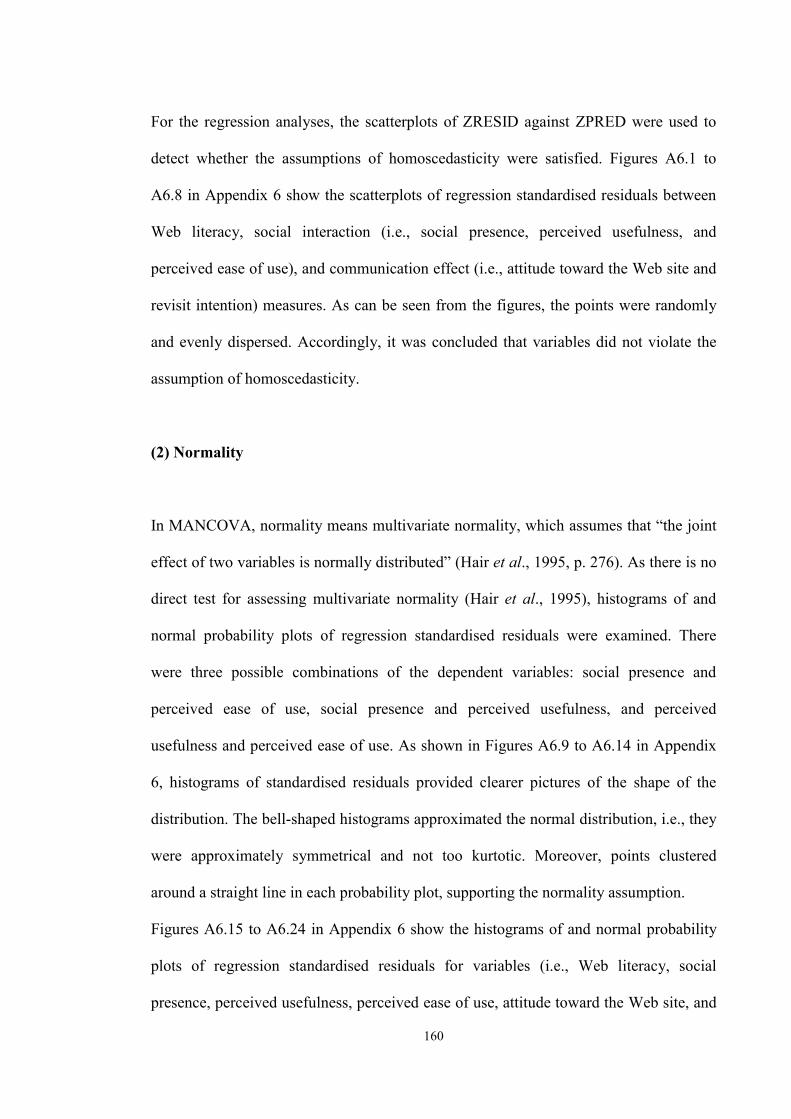
160
For the regression analyses, the scatterplots of ZRESID against ZPRED were used to
detect whether the assumptions of homoscedasticity were satisfied. Figures A6.1 to
A6.8 in Appendix 6 show the scatterplots of regression standardised residuals between
Web literacy, social interaction (i.e., social presence, perceived usefulness, and
perceived ease of use), and communication effect (i.e., attitude toward the Web site and
revisit intention) measures. As can be seen from the figures, the points were randomly
and evenly dispersed. Accordingly, it was concluded that variables did not violate the
assumption of homoscedasticity.
(2) Normality
In MANCOVA, normality means multivariate normality, which assumes that “the joint
effect of two variables is normally distributed” (Hair et al., 1995, p. 276). As there is no
direct test for assessing multivariate normality (Hair et al., 1995), histograms of and
normal probability plots of regression standardised residuals were examined. There
were three possible combinations of the dependent variables: social presence and
perceived ease of use, social presence and perceived usefulness, and perceived
usefulness and perceived ease of use. As shown in Figures A6.9 to A6.14 in Appendix
6, histograms of standardised residuals provided clearer pictures of the shape of the
distribution. The bell-shaped histograms approximated the normal distribution, i.e., they
were approximately symmetrical and not too kurtotic. Moreover, points clustered
around a straight line in each probability plot, supporting the normality assumption.
Figures A6.15 to A6.24 in Appendix 6 show the histograms of and normal probability
plots of regression standardised residuals for variables (i.e., Web literacy, social
presence, perceived usefulness, perceived ease of use, attitude toward the Web site, and
161
revisit intention) used in the linear regression analyses. As shown in the figures, all the
histograms were bell-shaped and approximately symmetrical, and all points in the
normal P-P plots were on straight line. These results confirmed a normal distribution of
errors in testing the model.
(3) Linearity
Linearity between each pair of dependent variables was examined via scatterplots of
three combinations: perceived usefulness vs. social presence, perceived ease of use vs.
social presence, and perceived usefulness vs. perceived ease of use. If the residuals are
randomly and evenly dispersed throughout the scatterplot, assumptions of linearity are
met (Hair et al., 1995). It was obvious from the scatterplots (see Figures A6.25 to
A6.27) that the dependent variables did not violate the assumption of linearity.
Figures A6.1 to A6.8 and A6.28 to A6.30 in Appendix 6 show the scatterplots of each
pair of the variables (i.e., Web literacy, social presence, perceived usefulness, perceived
ease of use, attitude toward the Web site, and revisit intention) used in the linear
regression analyses. As shown in the figures, the points were randomly and evenly
dispersed throughout the scatterplots, and any non-linear pattern (e.g., a curvilinear
pattern or a funnel shape) was not found. It was obvious that variables did not violate
the assumption of linearity.
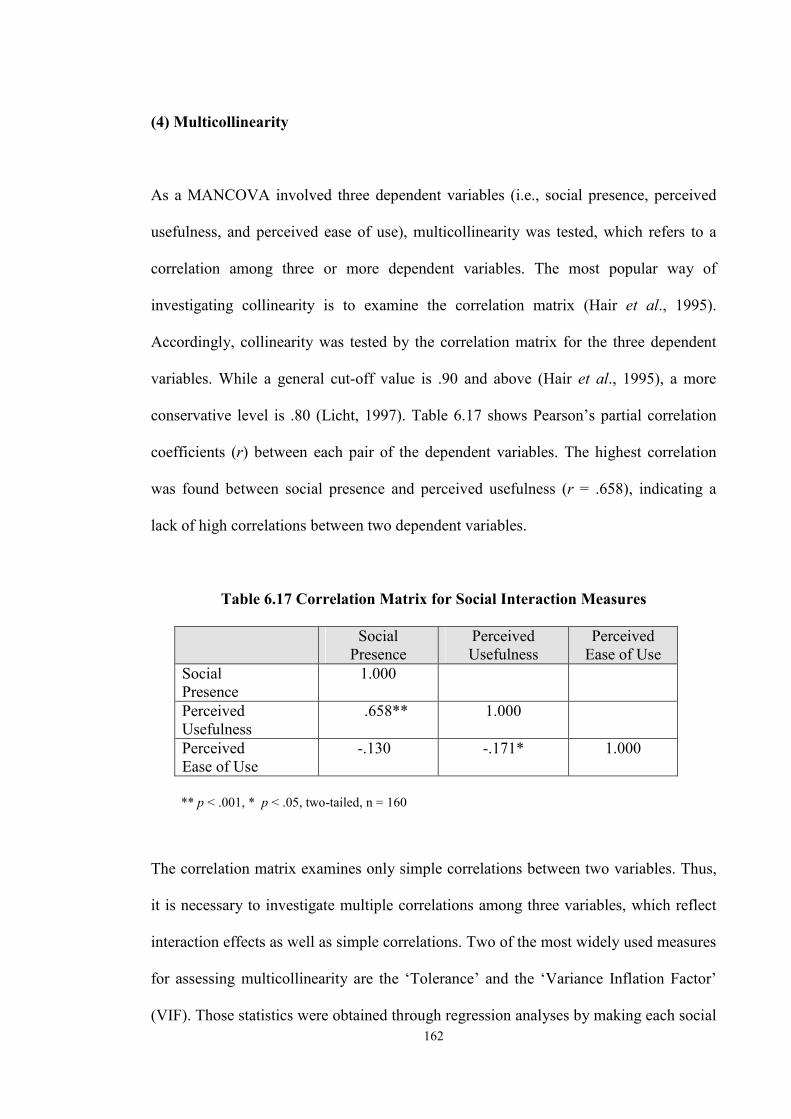
162
(4) Multicollinearity
As a MANCOVA involved three dependent variables (i.e., social presence, perceived
usefulness, and perceived ease of use), multicollinearity was tested, which refers to a
correlation among three or more dependent variables. The most popular way of
investigating collinearity is to examine the correlation matrix (Hair et al., 1995).
Accordingly, collinearity was tested by the correlation matrix for the three dependent
variables. While a general cut-off value is .90 and above (Hair et al., 1995), a more
conservative level is .80 (Licht, 1997). Table 6.17 shows Pearson’s partial correlation
coefficients (r) between each pair of the dependent variables. The highest correlation
was found between social presence and perceived usefulness (r = .658), indicating a
lack of high correlations between two dependent variables.
Table 6.17 Correlation Matrix for Social Interaction Measures
Social Presence
Perceived Usefulness
Perceived Ease of Use
Social Presence
1.000
Perceived Usefulness
.658** 1.000
Perceived Ease of Use
-.130 -.171* 1.000
** p < .001, * p < .05, two-tailed, n = 160
The correlation matrix examines only simple correlations between two variables. Thus,
it is necessary to investigate multiple correlations among three variables, which reflect
interaction effects as well as simple correlations. Two of the most widely used measures
for assessing multicollinearity are the ‘Tolerance’ and the ‘Variance Inflation Factor’
(VIF). Those statistics were obtained through regression analyses by making each social
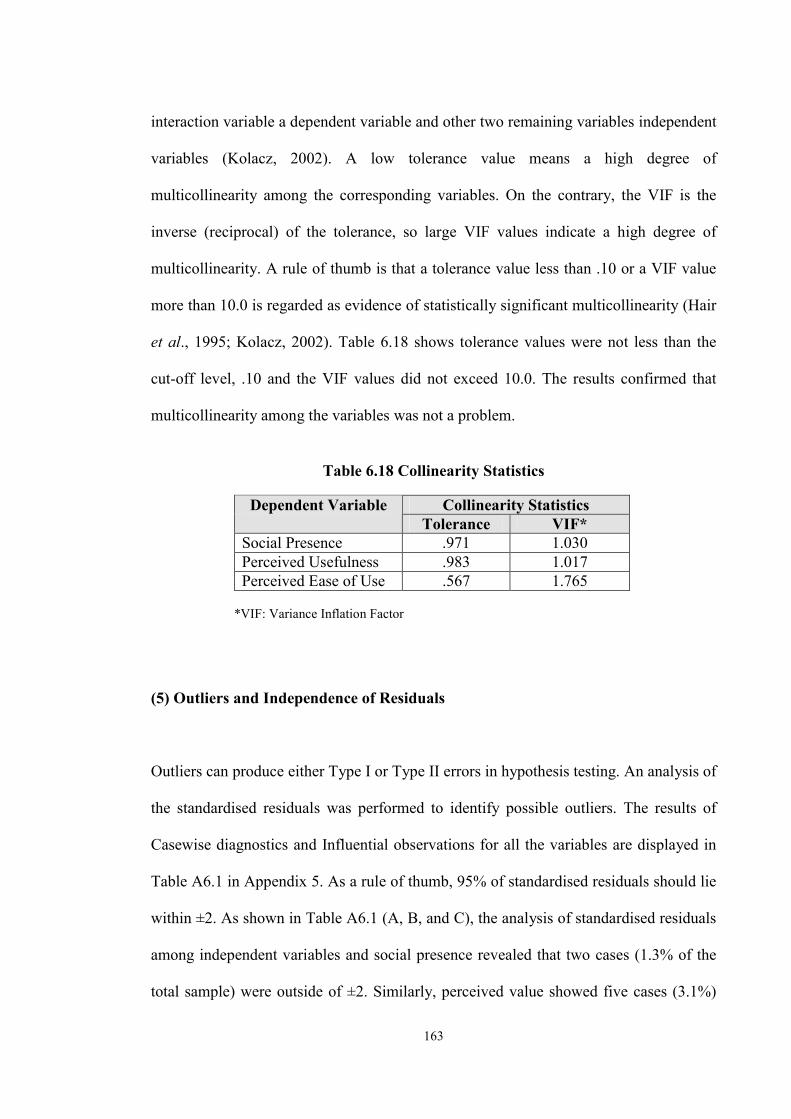
163
interaction variable a dependent variable and other two remaining variables independent
variables (Kolacz, 2002). A low tolerance value means a high degree of
multicollinearity among the corresponding variables. On the contrary, the VIF is the
inverse (reciprocal) of the tolerance, so large VIF values indicate a high degree of
multicollinearity. A rule of thumb is that a tolerance value less than .10 or a VIF value
more than 10.0 is regarded as evidence of statistically significant multicollinearity (Hair
et al., 1995; Kolacz, 2002). Table 6.18 shows tolerance values were not less than the
cut-off level, .10 and the VIF values did not exceed 10.0. The results confirmed that
multicollinearity among the variables was not a problem.
Table 6.18 Collinearity Statistics
Collinearity Statistics Dependent Variable Tolerance VIF*
Social Presence .971 1.030 Perceived Usefulness .983 1.017 Perceived Ease of Use .567 1.765
*VIF: Variance Inflation Factor
(5) Outliers and Independence of Residuals
Outliers can produce either Type I or Type II errors in hypothesis testing. An analysis of
the standardised residuals was performed to identify possible outliers. The results of
Casewise diagnostics and Influential observations for all the variables are displayed in
Table A6.1 in Appendix 5. As a rule of thumb, 95% of standardised residuals should lie
within ±2. As shown in Table A6.1 (A, B, and C), the analysis of standardised residuals
among independent variables and social presence revealed that two cases (1.3% of the
total sample) were outside of ±2. Similarly, perceived value showed five cases (3.1%)
164
and perceived ease of use had six cases (3.8%) were outside of ±2. These results
suggested that the proportion of outliers in the sample was small, indicating that all
cases could be included in the analysis.
Next, an outlier analysis was performed to identify influential observations for predictor
(i.e., Web site structure and content), moderator (i.e., Web literacy), and mediator (i.e.,
social presence, perceived usefulness, and perceived ease of use) variables. Table A6.1
(D, E, and F) shows the results of Casewise diagnostics and Influential observations.
The analysis of standardised residuals found that six cases (3.8% of the total sample)
were outside of ±2. Similarly, perceived value showed five cases (3.1%) and perceived
ease of use had seven cases (4.4%). In addition, Cook’s D was utilised for examining
the influence of the outliers. As shown in Table A6.1 (D, E, and F), all cases had a
Cook’s distance statistic smaller than 1. Hence, it could be concluded that the cases had
no influence on the overall results.
In addition, the outlier analysis was performed for mediator variables (i.e., social
presence, perceived usefulness, and perceived ease of use) and attitude toward the Web
site. The analysis of standardised residuals among independent variables and the
dependent variable revealed that only seven cases (4.4% of the total sample) were
outside of ±2 (see Table A6.1, G). Furthermore, all seven cases had a Cook’s distance
statistic smaller than 1, indicating no influence of outliers on the overall results.
Further, Cook’s distance was utilised for detecting the influence of the multivariate
outliers. Cook’s distance is regarded as the most representative diagnostic for the
overall quality of the analysis regarding the model fit to the data. The general cutoff
165
value Cook’s distance is below 1 (Field, 2000; Hair et al., 1995; Kolacz, 2002). As
shown in Table A6.1, all the cases that had standardised residuals outside of ±2 had a
Cook’s distance statistic smaller than 1.0.
Independence of residuals for variables used in the linear regression analyses was
examined via the Durbin-Watson coefficient. The Durbin-Watson D statistic close to 2
indicates that the residuals are uncorrelated (Field, 2000). The Durbin-Watson statistics
for social presence, perceived usefulness, and perceived ease of use were 1.969, 1.801,
and 1.702 at p < .001, respectively, that for social interaction measures and attitude
toward the Web site was 1.882, and that for attitude toward the Web site and revisit
intension was 1.768 at a significant level. Hence, it was concluded that the assumption
of independence of residuals was satisfied.
(6) Conclusions
The results of the assumption tests identified that there was no violation of assumptions,
so there was no need for any data transformation. As data was suitable for the analyses,
all the cases were included.
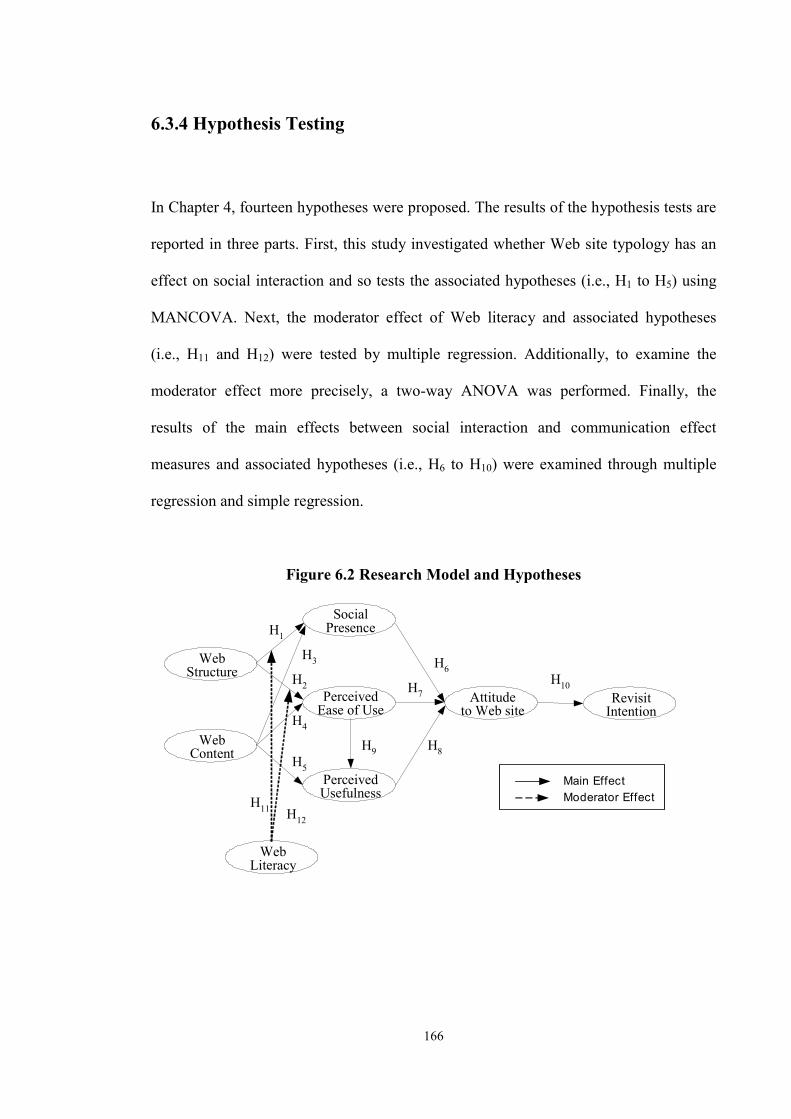
166
6.3.4 Hypothesis Testing
In Chapter 4, fourteen hypotheses were proposed. The results of the hypothesis tests are
reported in three parts. First, this study investigated whether Web site typology has an
effect on social interaction and so tests the associated hypotheses (i.e., H1 to H5) using
MANCOVA. Next, the moderator effect of Web literacy and associated hypotheses
(i.e., H11 and H12) were tested by multiple regression. Additionally, to examine the
moderator effect more precisely, a two-way ANOVA was performed. Finally, the
results of the main effects between social interaction and communication effect
measures and associated hypotheses (i.e., H6 to H10) were examined through multiple
regression and simple regression.
Figure 6.2 Research Model and Hypotheses
Attitudeto Web site
RevisitIntention
SocialPresence
PerceivedEase of Use
PerceivedUsefulness
WebContent
WebStructure
H1
H2
H3
H4
H5
H6
H7
H8H9
H10
H11
WebLiteracy
Main EffectModerator Effect
H12
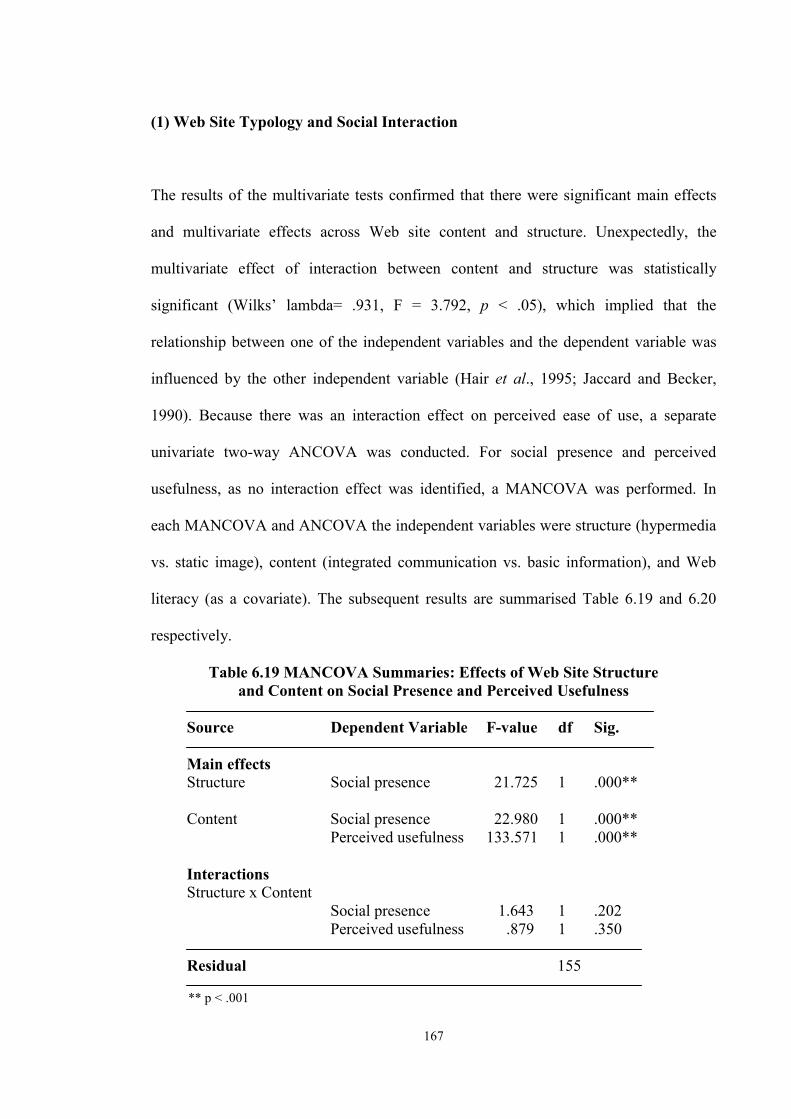
167
(1) Web Site Typology and Social Interaction
The results of the multivariate tests confirmed that there were significant main effects
and multivariate effects across Web site content and structure. Unexpectedly, the
multivariate effect of interaction between content and structure was statistically
significant (Wilks’ lambda= .931, F = 3.792, p < .05), which implied that the
relationship between one of the independent variables and the dependent variable was
influenced by the other independent variable (Hair et al., 1995; Jaccard and Becker,
1990). Because there was an interaction effect on perceived ease of use, a separate
univariate two-way ANCOVA was conducted. For social presence and perceived
usefulness, as no interaction effect was identified, a MANCOVA was performed. In
each MANCOVA and ANCOVA the independent variables were structure (hypermedia
vs. static image), content (integrated communication vs. basic information), and Web
literacy (as a covariate). The subsequent results are summarised Table 6.19 and 6.20
respectively.
Table 6.19 MANCOVA Summaries: Effects of Web Site Structure and Content on Social Presence and Perceived Usefulness
Source Dependent Variable F-value df Sig. Main effects Structure Social presence 21.725 1 .000** Content Social presence 22.980 1 .000** Perceived usefulness 133.571 1 .000**
Interactions
Structure x Content Social presence 1.643 1 .202 Perceived usefulness .879 1 .350 Residual 155
** p < .001
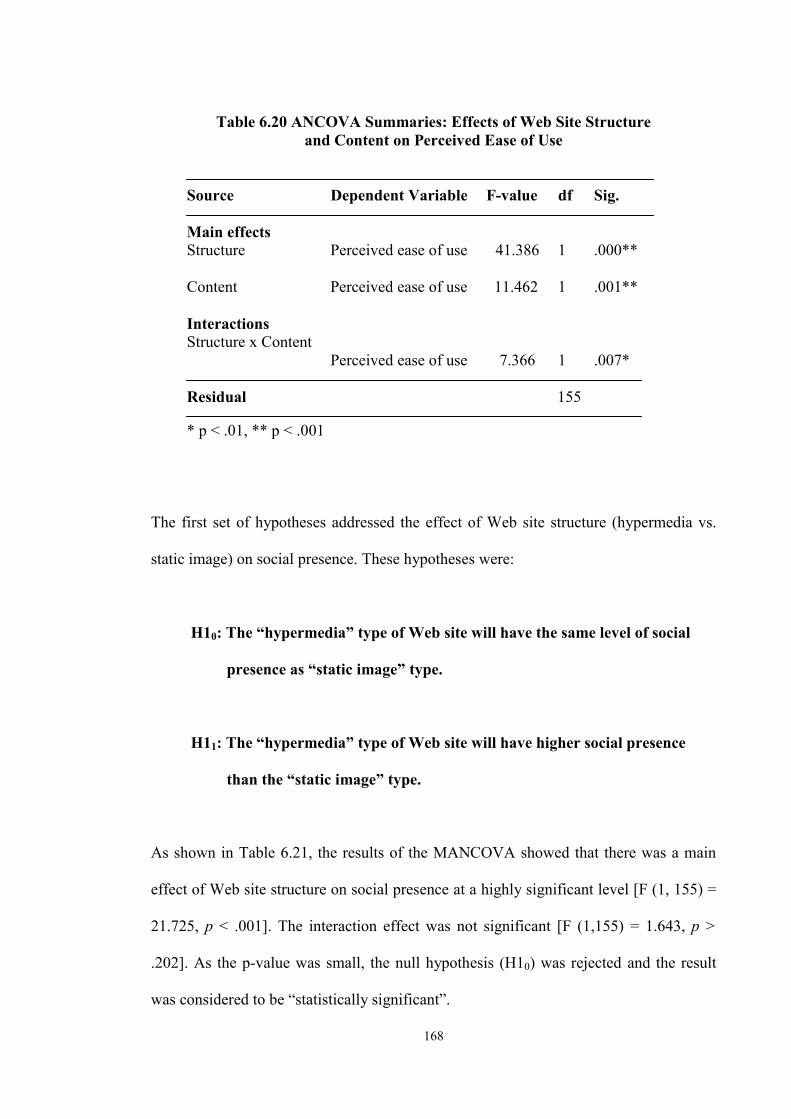
168
Table 6.20 ANCOVA Summaries: Effects of Web Site Structure and Content on Perceived Ease of Use
Source Dependent Variable F-value df Sig. Main effects Structure Perceived ease of use 41.386 1 .000** Content Perceived ease of use 11.462 1 .001** Interactions Structure x Content Perceived ease of use 7.366 1 .007* Residual 155
* p < .01, ** p < .001 The first set of hypotheses addressed the effect of Web site structure (hypermedia vs.
static image) on social presence. These hypotheses were:
H10: The “hypermedia” type of Web site will have the same level of social
presence as “static image” type.
H11: The “hypermedia” type of Web site will have higher social presence
than the “static image” type.
As shown in Table 6.21, the results of the MANCOVA showed that there was a main
effect of Web site structure on social presence at a highly significant level [F (1, 155) =
21.725, p < .001]. The interaction effect was not significant [F (1,155) = 1.643, p >
.202]. As the p-value was small, the null hypothesis (H10) was rejected and the result
was considered to be “statistically significant”.
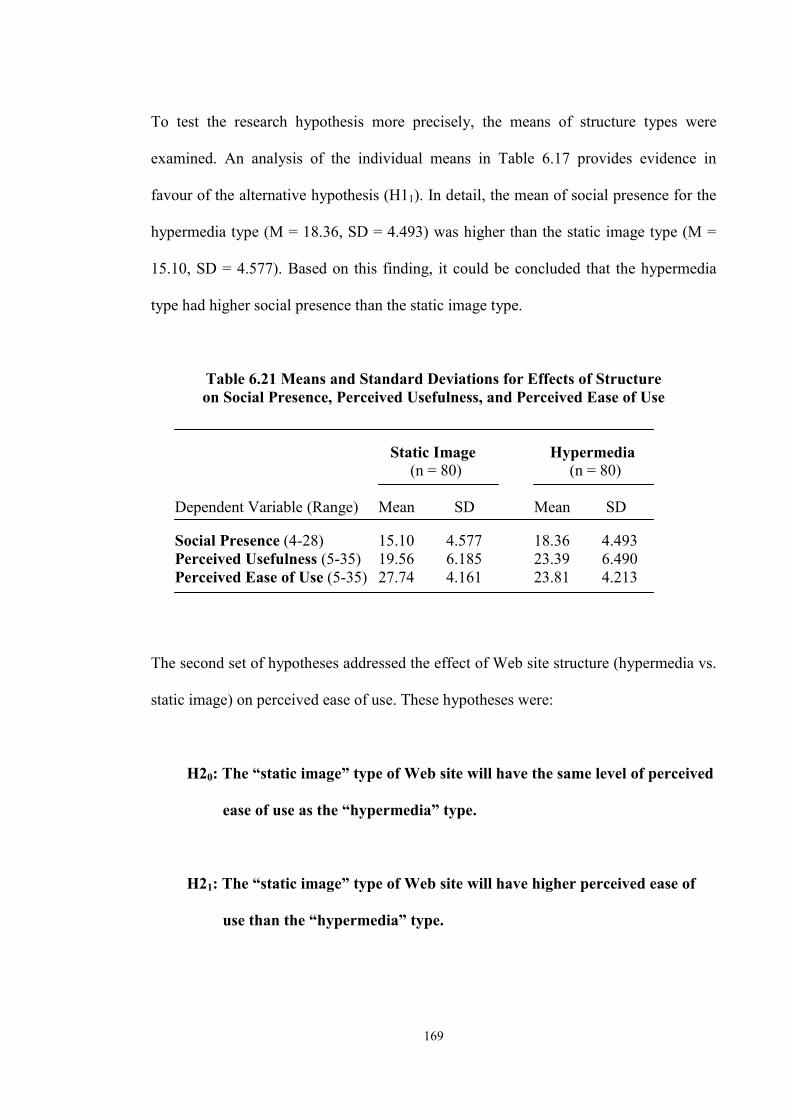
169
To test the research hypothesis more precisely, the means of structure types were
examined. An analysis of the individual means in Table 6.17 provides evidence in
favour of the alternative hypothesis (H11). In detail, the mean of social presence for the
hypermedia type (M = 18.36, SD = 4.493) was higher than the static image type (M =
15.10, SD = 4.577). Based on this finding, it could be concluded that the hypermedia
type had higher social presence than the static image type.
Table 6.21 Means and Standard Deviations for Effects of Structure on Social Presence, Perceived Usefulness, and Perceived Ease of Use
Static Image Hypermedia (n = 80) (n = 80)
Dependent Variable (Range) Mean SD Mean SD Social Presence (4-28) 15.10 4.577 18.36 4.493 Perceived Usefulness (5-35) 19.56 6.185 23.39 6.490 Perceived Ease of Use (5-35) 27.74 4.161 23.81 4.213
The second set of hypotheses addressed the effect of Web site structure (hypermedia vs.
static image) on perceived ease of use. These hypotheses were:
H20: The “static image” type of Web site will have the same level of perceived
ease of use as the “hypermedia” type.
H21: The “static image” type of Web site will have higher perceived ease of
use than the “hypermedia” type.
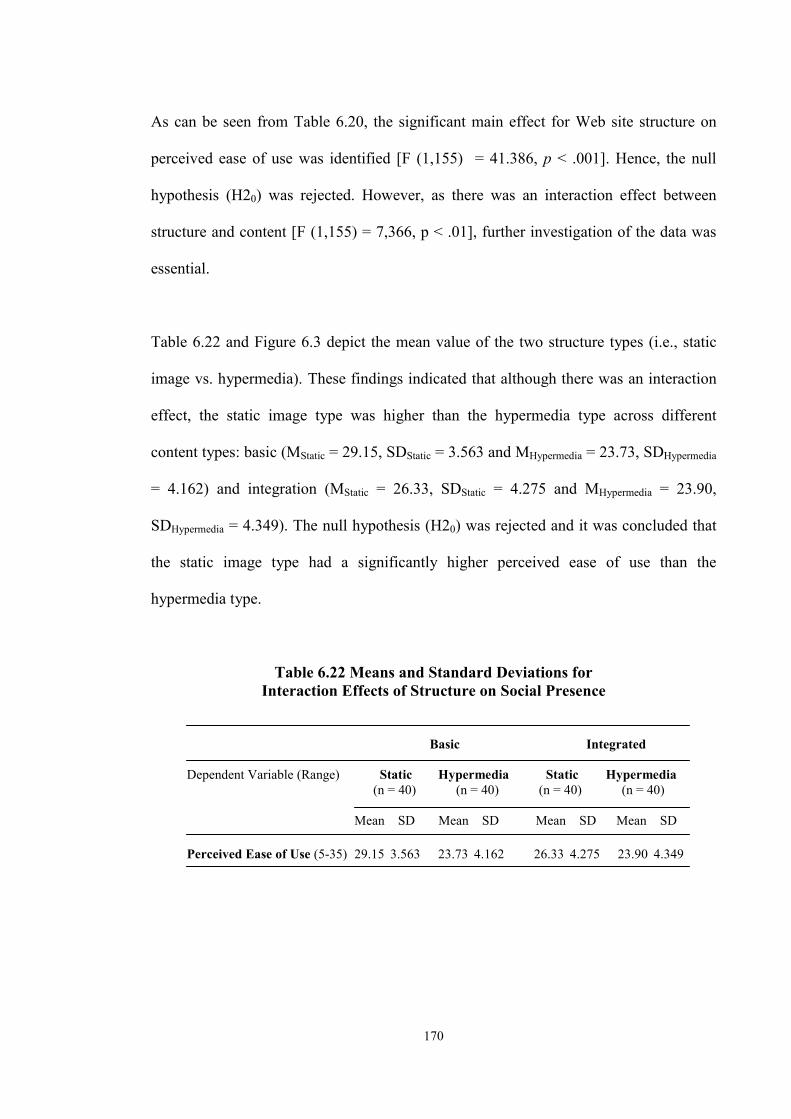
170
As can be seen from Table 6.20, the significant main effect for Web site structure on
perceived ease of use was identified [F (1,155) = 41.386, p < .001]. Hence, the null
hypothesis (H20) was rejected. However, as there was an interaction effect between
structure and content [F (1,155) = 7,366, p < .01], further investigation of the data was
essential.
Table 6.22 and Figure 6.3 depict the mean value of the two structure types (i.e., static
image vs. hypermedia). These findings indicated that although there was an interaction
effect, the static image type was higher than the hypermedia type across different
content types: basic (MStatic = 29.15, SDStatic = 3.563 and MHypermedia = 23.73, SDHypermedia
= 4.162) and integration (MStatic = 26.33, SDStatic = 4.275 and MHypermedia = 23.90,
SDHypermedia = 4.349). The null hypothesis (H20) was rejected and it was concluded that
the static image type had a significantly higher perceived ease of use than the
hypermedia type.
Table 6.22 Means and Standard Deviations for Interaction Effects of Structure on Social Presence
Basic Integrated
Dependent Variable (Range) Static Hypermedia Static Hypermedia (n = 40) (n = 40) (n = 40) (n = 40) Mean SD Mean SD Mean SD Mean SD Perceived Ease of Use (5-35) 29.15 3.563 23.73 4.162 26.33 4.275 23.90 4.349
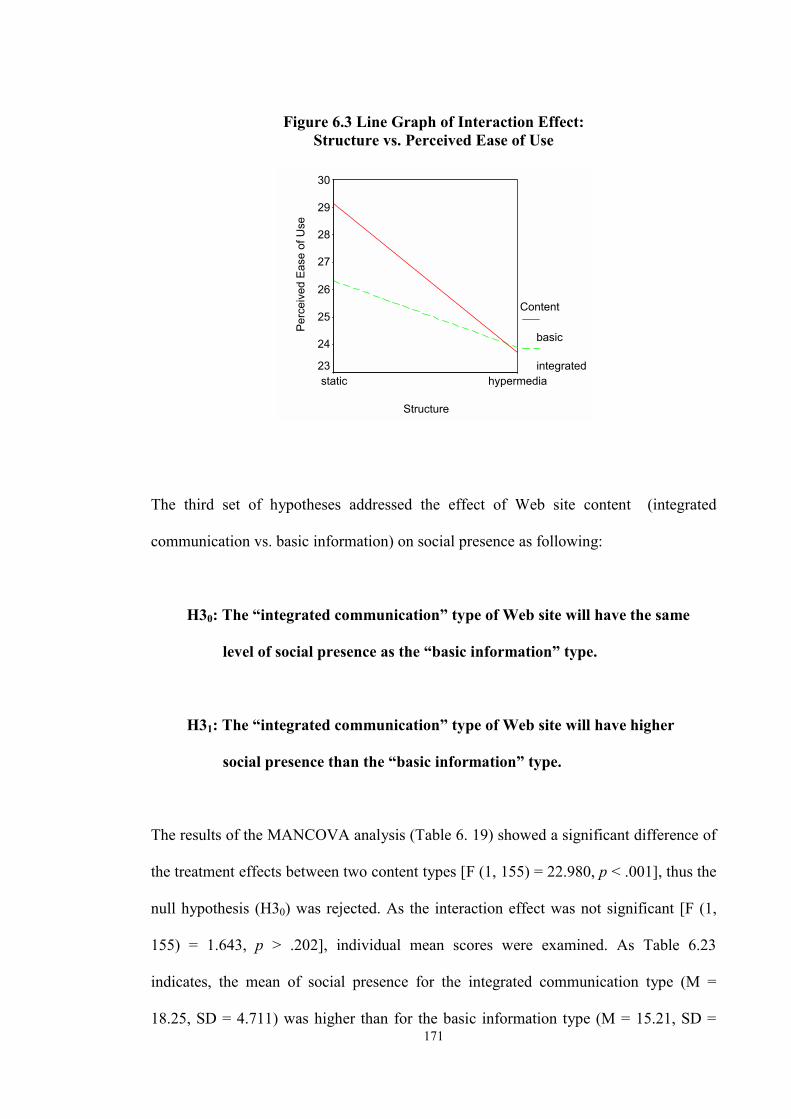
171
Figure 6.3 Line Graph of Interaction Effect: Structure vs. Perceived Ease of Use
Structure
hypermediastatic
Perc
eive
d Ea
se o
f Use
30
29
28
27
26
25
24
23
Content
basic
integrated
The third set of hypotheses addressed the effect of Web site content (integrated
communication vs. basic information) on social presence as following:
H30: The “integrated communication” type of Web site will have the same
level of social presence as the “basic information” type.
H31: The “integrated communication” type of Web site will have higher
social presence than the “basic information” type.
The results of the MANCOVA analysis (Table 6. 19) showed a significant difference of
the treatment effects between two content types [F (1, 155) = 22.980, p < .001], thus the
null hypothesis (H30) was rejected. As the interaction effect was not significant [F (1,
155) = 1.643, p > .202], individual mean scores were examined. As Table 6.23
indicates, the mean of social presence for the integrated communication type (M =
18.25, SD = 4.711) was higher than for the basic information type (M = 15.21, SD =
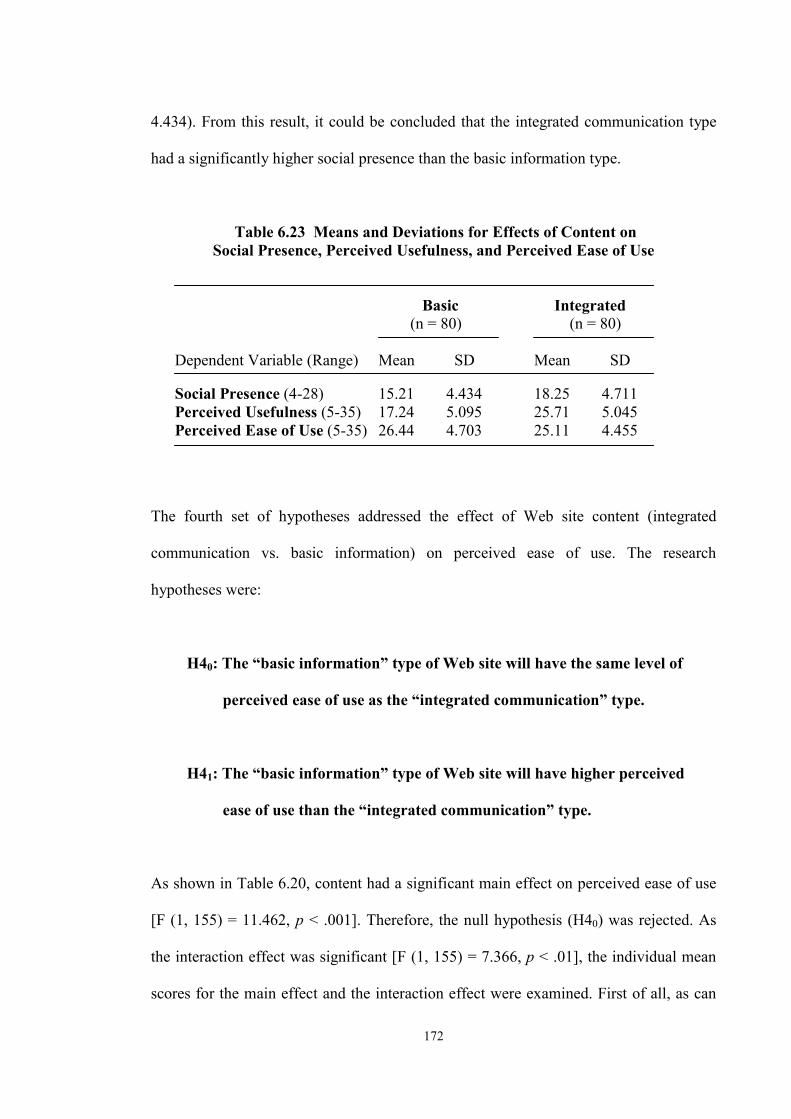
172
4.434). From this result, it could be concluded that the integrated communication type
had a significantly higher social presence than the basic information type.
Table 6.23 Means and Deviations for Effects of Content on Social Presence, Perceived Usefulness, and Perceived Ease of Use
Basic Integrated (n = 80) (n = 80)
Dependent Variable (Range) Mean SD Mean SD Social Presence (4-28) 15.21 4.434 18.25 4.711 Perceived Usefulness (5-35) 17.24 5.095 25.71 5.045 Perceived Ease of Use (5-35) 26.44 4.703 25.11 4.455
The fourth set of hypotheses addressed the effect of Web site content (integrated
communication vs. basic information) on perceived ease of use. The research
hypotheses were:
H40: The “basic information” type of Web site will have the same level of
perceived ease of use as the “integrated communication” type.
H41: The “basic information” type of Web site will have higher perceived
ease of use than the “integrated communication” type.
As shown in Table 6.20, content had a significant main effect on perceived ease of use
[F (1, 155) = 11.462, p < .001]. Therefore, the null hypothesis (H40) was rejected. As
the interaction effect was significant [F (1, 155) = 7.366, p < .01], the individual mean
scores for the main effect and the interaction effect were examined. First of all, as can
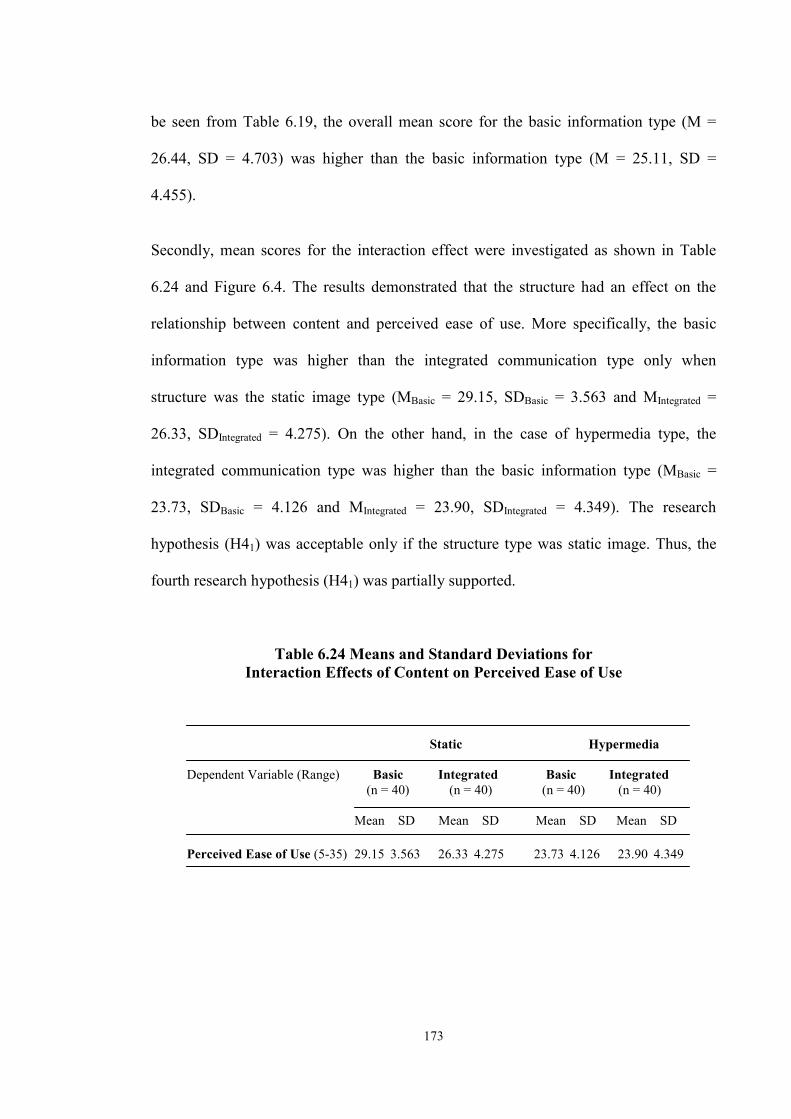
173
be seen from Table 6.19, the overall mean score for the basic information type (M =
26.44, SD = 4.703) was higher than the basic information type (M = 25.11, SD =
4.455).
Secondly, mean scores for the interaction effect were investigated as shown in Table
6.24 and Figure 6.4. The results demonstrated that the structure had an effect on the
relationship between content and perceived ease of use. More specifically, the basic
information type was higher than the integrated communication type only when
structure was the static image type (MBasic = 29.15, SDBasic = 3.563 and MIntegrated =
26.33, SDIntegrated = 4.275). On the other hand, in the case of hypermedia type, the
integrated communication type was higher than the basic information type (MBasic =
23.73, SDBasic = 4.126 and MIntegrated = 23.90, SDIntegrated = 4.349). The research
hypothesis (H41) was acceptable only if the structure type was static image. Thus, the
fourth research hypothesis (H41) was partially supported.
Table 6.24 Means and Standard Deviations for Interaction Effects of Content on Perceived Ease of Use
Static Hypermedia
Dependent Variable (Range) Basic Integrated Basic Integrated (n = 40) (n = 40) (n = 40) (n = 40) Mean SD Mean SD Mean SD Mean SD Perceived Ease of Use (5-35) 29.15 3.563 26.33 4.275 23.73 4.126 23.90 4.349
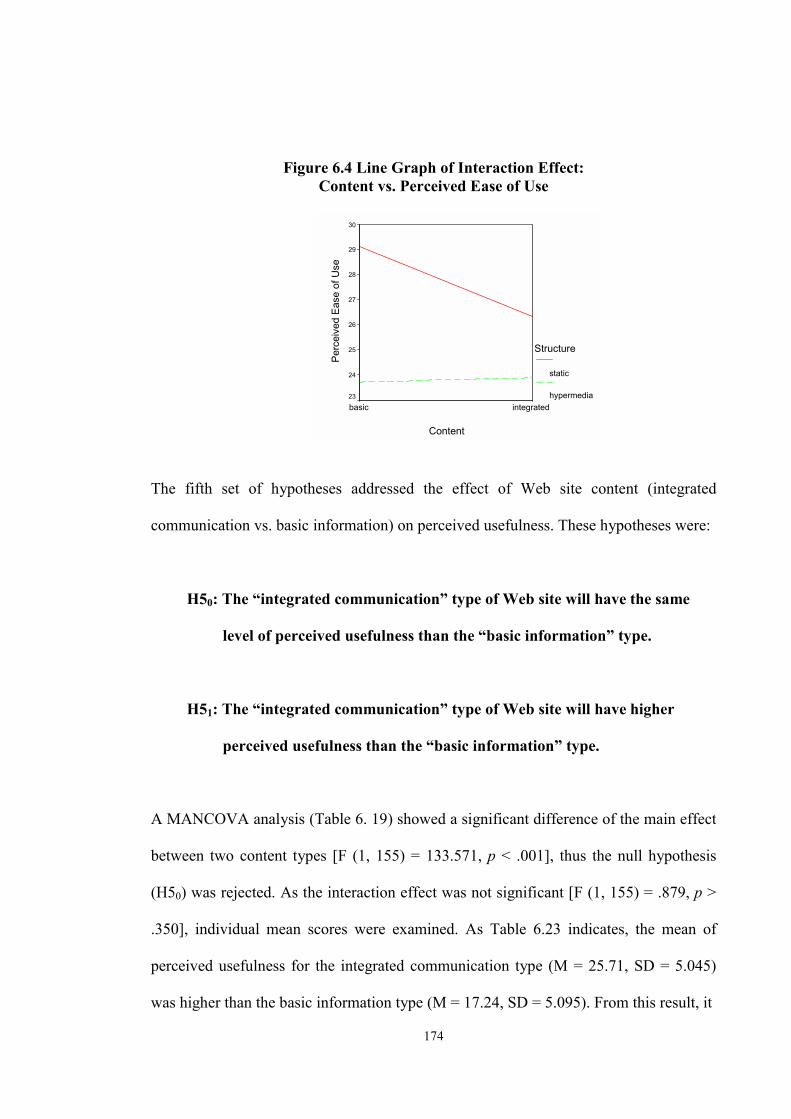
174
Figure 6.4 Line Graph of Interaction Effect: Content vs. Perceived Ease of Use
Content
integratedbasic
Perc
eive
d Ea
se o
f Use
30
29
28
27
26
25
24
23
Structure
static
hypermedia
The fifth set of hypotheses addressed the effect of Web site content (integrated
communication vs. basic information) on perceived usefulness. These hypotheses were:
H50: The “integrated communication” type of Web site will have the same
level of perceived usefulness than the “basic information” type.
H51: The “integrated communication” type of Web site will have higher
perceived usefulness than the “basic information” type.
A MANCOVA analysis (Table 6. 19) showed a significant difference of the main effect
between two content types [F (1, 155) = 133.571, p < .001], thus the null hypothesis
(H50) was rejected. As the interaction effect was not significant [F (1, 155) = .879, p >
.350], individual mean scores were examined. As Table 6.23 indicates, the mean of
perceived usefulness for the integrated communication type (M = 25.71, SD = 5.045)
was higher than the basic information type (M = 17.24, SD = 5.095). From this result, it
175
could be concluded that the “integrated communication” type will have a significantly
higher perceived usefulness than the “basic information” type.
It is worth noting that the results of the MANCOVA (see Table 6.19) revealed that Web
site structure had a significant main effect on perceived usefulness [F (1, 155) =
133.571, p < .001]. On the other hand, the interaction effect was not significant [F (1,
155) = .879, p = .350]. As can be seen from Table 6.21, an examination of the mean
scores indicated that the mean of perceived usefulness for the hypermedia type was
higher than the static image type (MHypermedia = 23.39, SDHypermedia = 6.490 and MStatic =
19.56, SDStatic = 6.185). Accordingly, it was concluded that the “hypermedia” type had a
significantly higher perceived usefulness than the “static image” type.
(2) Moderator Effects of Web Literacy
The last two hypotheses were associated with the effects of Web site typology on the
relationships between the Web site typology measures (i.e., structure and content) and
social interaction measures (i.e., social presence, perceived usefulness, and perceived
ease of use). A multiple regression analysis with three compound variables tested these
hypotheses (e.g., Hair et al., 1995). The three compound variables were generated by
multiplying structure by Web literacy, content by Web literacy, and multiplying all
predictors (i.e., content, structure, and Web literacy). Using a two-step hierarchical
linear regression analysis, the three predictor variables were entered into the regression
equation first, and then a compound variable was added hierarchically.
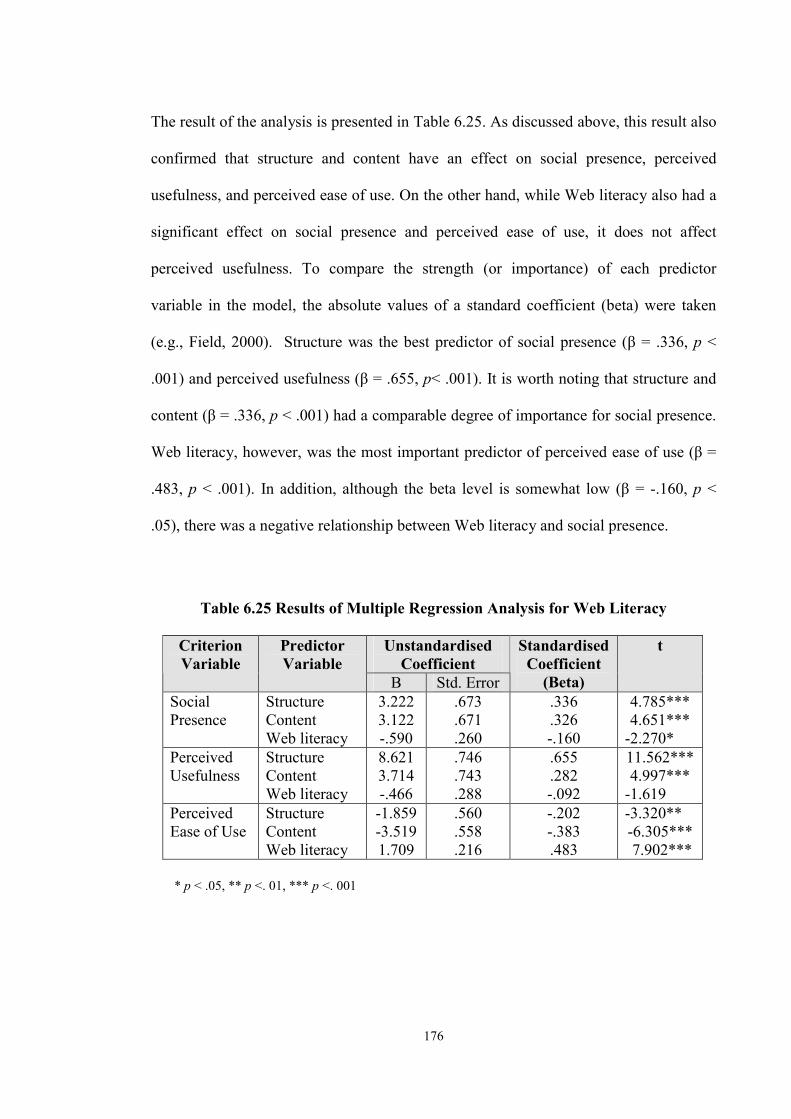
176
The result of the analysis is presented in Table 6.25. As discussed above, this result also
confirmed that structure and content have an effect on social presence, perceived
usefulness, and perceived ease of use. On the other hand, while Web literacy also had a
significant effect on social presence and perceived ease of use, it does not affect
perceived usefulness. To compare the strength (or importance) of each predictor
variable in the model, the absolute values of a standard coefficient (beta) were taken
(e.g., Field, 2000). Structure was the best predictor of social presence (β = .336, p <
.001) and perceived usefulness (β = .655, p< .001). It is worth noting that structure and
content (β = .336, p < .001) had a comparable degree of importance for social presence.
Web literacy, however, was the most important predictor of perceived ease of use (β =
.483, p < .001). In addition, although the beta level is somewhat low (β = -.160, p <
.05), there was a negative relationship between Web literacy and social presence.
Table 6.25 Results of Multiple Regression Analysis for Web Literacy
Unstandardised Coefficient
Criterion Variable
Predictor Variable
B Std. Error
Standardised Coefficient
(Beta)
t
Social Presence
Structure Content Web literacy
3.222 3.122 -.590
.673
.671
.260
.336
.326 -.160
4.785*** 4.651***
-2.270* Perceived Usefulness
Structure Content Web literacy
8.621 3.714 -.466
.746
.743
.288
.655
.282 -.092
11.562*** 4.997***
-1.619 Perceived Ease of Use
Structure Content Web literacy
-1.859 -3.519 1.709
.560
.558
.216
-.202 -.383 .483
-3.320** -6.305*** 7.902***
* p < .05, ** p <. 01, *** p <. 001
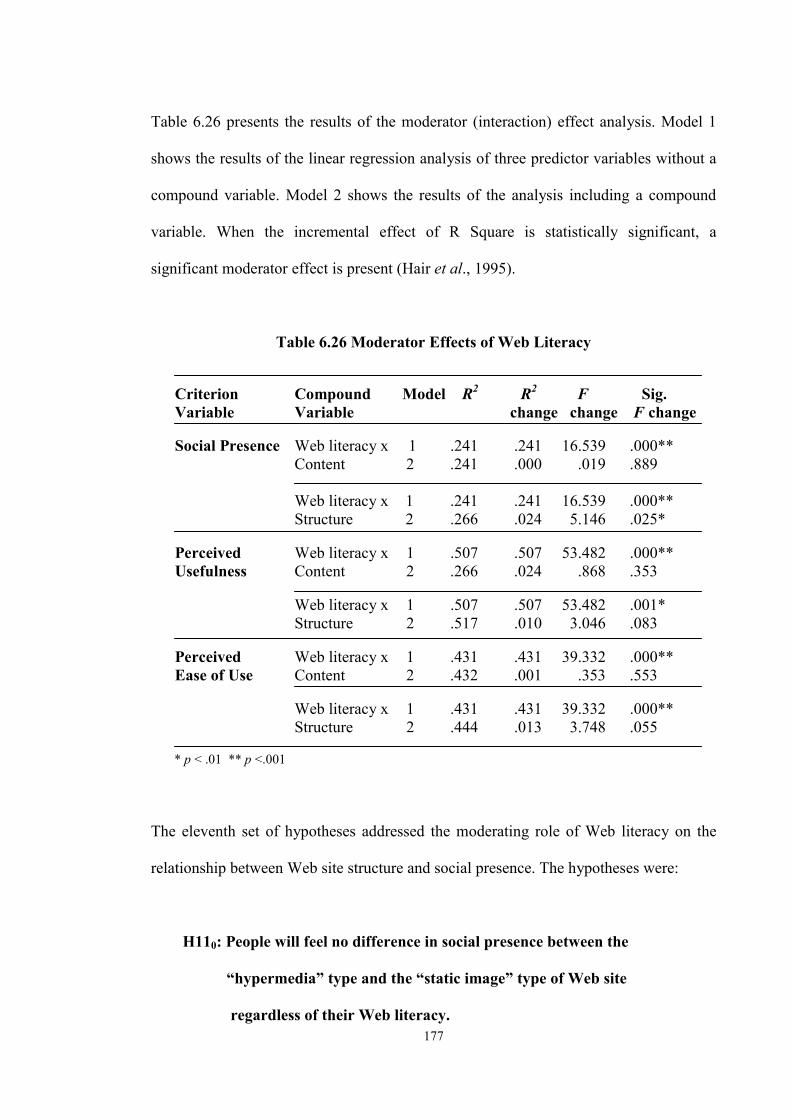
177
Table 6.26 presents the results of the moderator (interaction) effect analysis. Model 1
shows the results of the linear regression analysis of three predictor variables without a
compound variable. Model 2 shows the results of the analysis including a compound
variable. When the incremental effect of R Square is statistically significant, a
significant moderator effect is present (Hair et al., 1995).
Table 6.26 Moderator Effects of Web Literacy
Criterion Compound Model R2 R2 F Sig. Variable Variable change change F change Social Presence Web literacy x 1 .241 .241 16.539 .000** Content 2 .241 .000 .019 .889 Web literacy x 1 .241 .241 16.539 .000** Structure 2 .266 .024 5.146 .025* Perceived Web literacy x 1 .507 .507 53.482 .000** Usefulness Content 2 .266 .024 .868 .353 Web literacy x 1 .507 .507 53.482 .001* Structure 2 .517 .010 3.046 .083 Perceived Web literacy x 1 .431 .431 39.332 .000** Ease of Use Content 2 .432 .001 .353 .553 Web literacy x 1 .431 .431 39.332 .000** Structure 2 .444 .013 3.748 .055
* p < .01 ** p <.001
The eleventh set of hypotheses addressed the moderating role of Web literacy on the
relationship between Web site structure and social presence. The hypotheses were:
H110: People will feel no difference in social presence between the
“hypermedia” type and the “static image” type of Web site
regardless of their Web literacy.
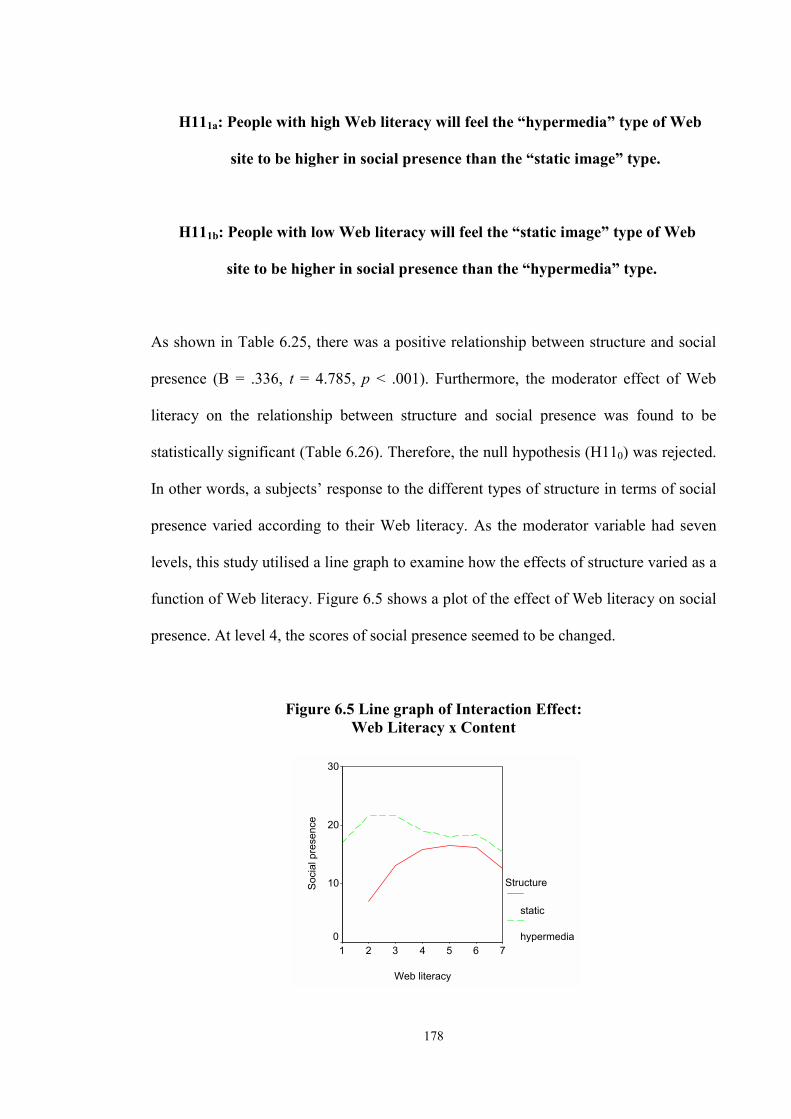
178
H111a: People with high Web literacy will feel the “hypermedia” type of Web
site to be higher in social presence than the “static image” type.
H111b: People with low Web literacy will feel the “static image” type of Web
site to be higher in social presence than the “hypermedia” type.
As shown in Table 6.25, there was a positive relationship between structure and social
presence (B = .336, t = 4.785, p < .001). Furthermore, the moderator effect of Web
literacy on the relationship between structure and social presence was found to be
statistically significant (Table 6.26). Therefore, the null hypothesis (H110) was rejected.
In other words, a subjects’ response to the different types of structure in terms of social
presence varied according to their Web literacy. As the moderator variable had seven
levels, this study utilised a line graph to examine how the effects of structure varied as a
function of Web literacy. Figure 6.5 shows a plot of the effect of Web literacy on social
presence. At level 4, the scores of social presence seemed to be changed.
Figure 6.5 Line graph of Interaction Effect: Web Literacy x Content
Web literacy
7654321
Soc
ial p
rese
nce
30
20
10
0
Structure
static
hypermedia
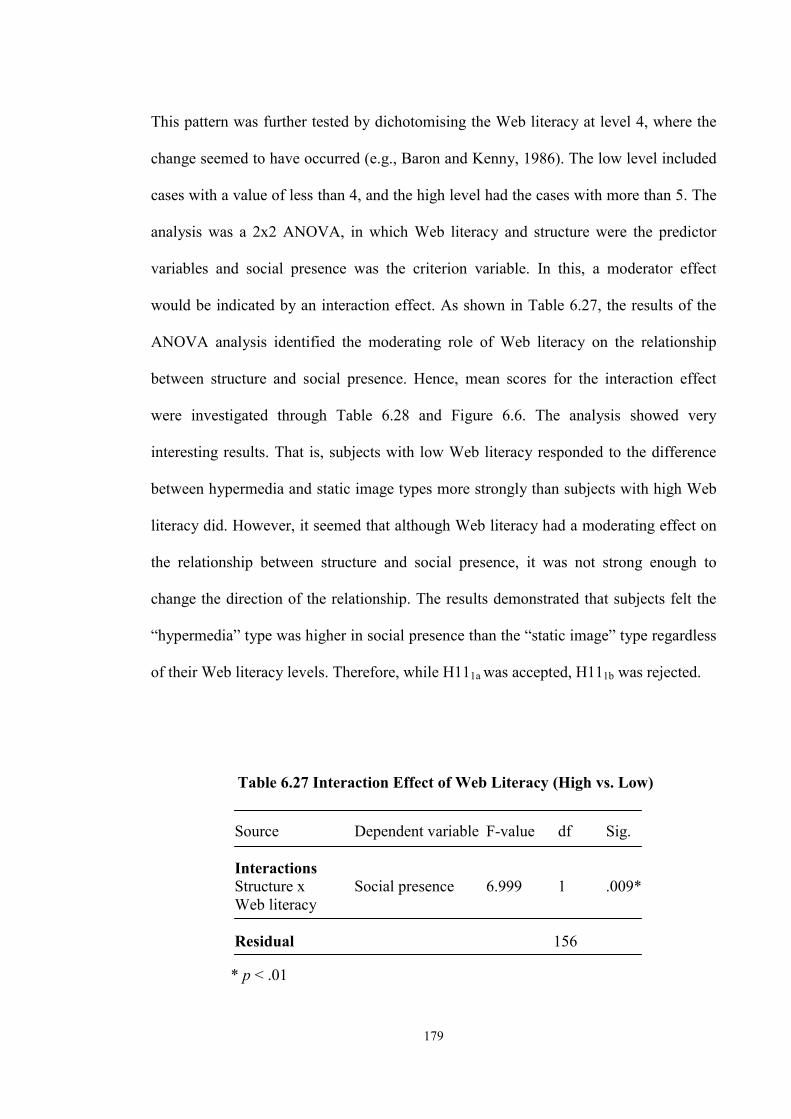
179
This pattern was further tested by dichotomising the Web literacy at level 4, where the
change seemed to have occurred (e.g., Baron and Kenny, 1986). The low level included
cases with a value of less than 4, and the high level had the cases with more than 5. The
analysis was a 2x2 ANOVA, in which Web literacy and structure were the predictor
variables and social presence was the criterion variable. In this, a moderator effect
would be indicated by an interaction effect. As shown in Table 6.27, the results of the
ANOVA analysis identified the moderating role of Web literacy on the relationship
between structure and social presence. Hence, mean scores for the interaction effect
were investigated through Table 6.28 and Figure 6.6. The analysis showed very
interesting results. That is, subjects with low Web literacy responded to the difference
between hypermedia and static image types more strongly than subjects with high Web
literacy did. However, it seemed that although Web literacy had a moderating effect on
the relationship between structure and social presence, it was not strong enough to
change the direction of the relationship. The results demonstrated that subjects felt the
“hypermedia” type was higher in social presence than the “static image” type regardless
of their Web literacy levels. Therefore, while H111a was accepted, H111b was rejected.
Table 6.27 Interaction Effect of Web Literacy (High vs. Low)
Source Dependent variable F-value df Sig. Interactions Structure x Social presence 6.999 1 .009* Web literacy Residual 156
* p < .01

180
Table 6.28 Means and Standard Deviations for Interaction Effect of Web Literacy on Social Presence
Low High
Dependent Variable (Range) Static Hypermedia Static Hypermedia (n = 18) (n = 18) (n = 62) (n = 62) Mean SD Mean SD Mean SD Mean SD Social Presence (4-28) 13.89 5.005 20.61 3.928 15.45 4.427 17.71 4.463
Figure 6.6 Line Graph for Moderator Effect: Web Literacy (Two Levels)
Web Literacy
highlow
Soc
ial P
rese
nce
22
20
18
16
14
12
Strucutre
static
hypermedia
The results of the univariate ANOVA indicated that a subject’s feeling of social
presence for different structure types varied according to their Web literacy (see Table
6.29 and Figure 6.7). For instance, the static image type was felt to have a higher social
presence by subjects with high Web literacy than those with low Web literacy. On the
contrary, the hypermedia type was felt to have a higher social presence by subjects with
low Web literacy than those with high Web literacy. In other words, it could be said that
subjects with low Web literacy responded to differences between the static image type
and the hypermedia type more strongly than those with high Web literacy did.
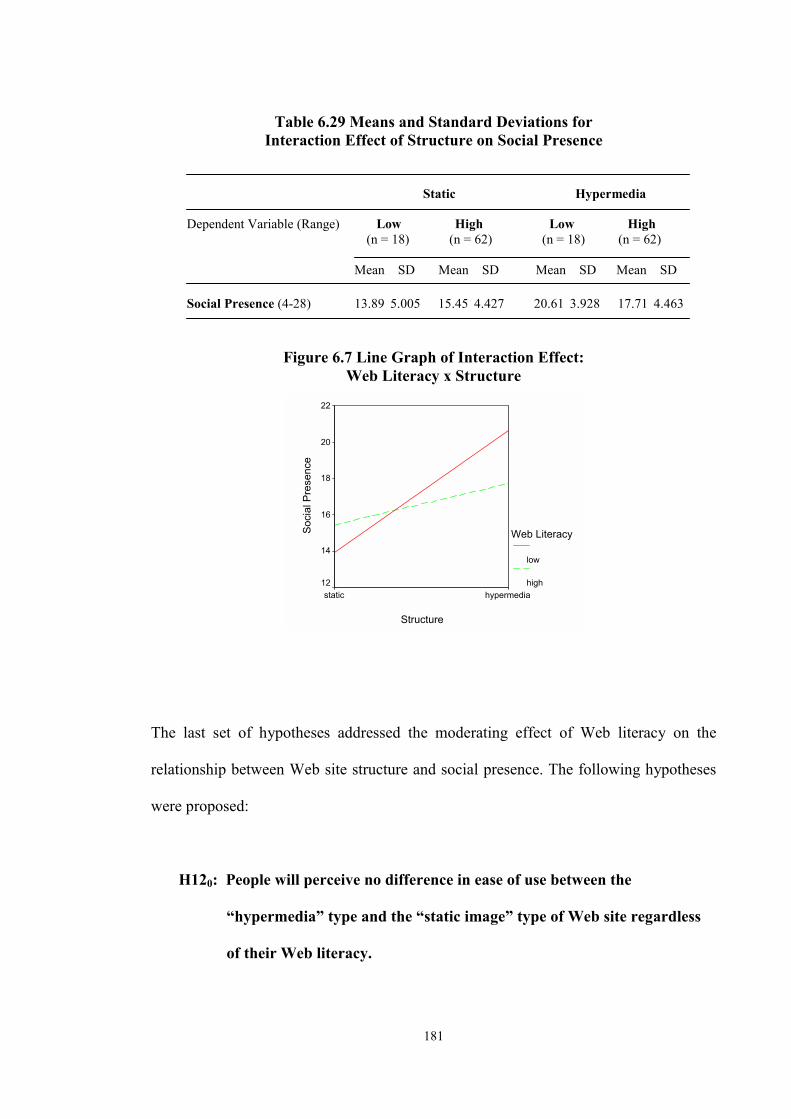
181
Table 6.29 Means and Standard Deviations for Interaction Effect of Structure on Social Presence
Static Hypermedia
Dependent Variable (Range) Low High Low High (n = 18) (n = 62) (n = 18) (n = 62) Mean SD Mean SD Mean SD Mean SD Social Presence (4-28) 13.89 5.005 15.45 4.427 20.61 3.928 17.71 4.463
Figure 6.7 Line Graph of Interaction Effect: Web Literacy x Structure
Structure
hypermediastatic
Soc
ial P
rese
nce
22
20
18
16
14
12
Web Literacy
low
high
The last set of hypotheses addressed the moderating effect of Web literacy on the
relationship between Web site structure and social presence. The following hypotheses
were proposed:
H120: People will perceive no difference in ease of use between the
“hypermedia” type and the “static image” type of Web site regardless
of their Web literacy.
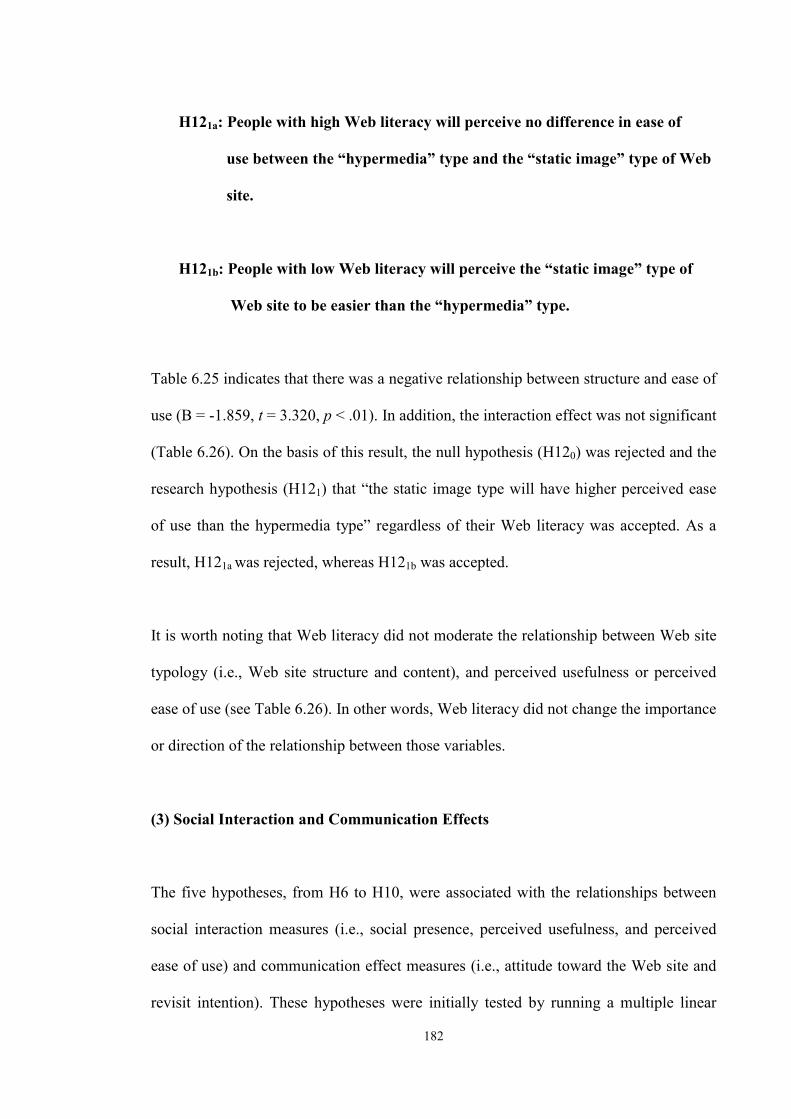
182
H121a: People with high Web literacy will perceive no difference in ease of
use between the “hypermedia” type and the “static image” type of Web
site.
H121b: People with low Web literacy will perceive the “static image” type of
Web site to be easier than the “hypermedia” type.
Table 6.25 indicates that there was a negative relationship between structure and ease of
use (B = -1.859, t = 3.320, p < .01). In addition, the interaction effect was not significant
(Table 6.26). On the basis of this result, the null hypothesis (H120) was rejected and the
research hypothesis (H121) that “the static image type will have higher perceived ease
of use than the hypermedia type” regardless of their Web literacy was accepted. As a
result, H121a was rejected, whereas H121b was accepted.
It is worth noting that Web literacy did not moderate the relationship between Web site
typology (i.e., Web site structure and content), and perceived usefulness or perceived
ease of use (see Table 6.26). In other words, Web literacy did not change the importance
or direction of the relationship between those variables.
(3) Social Interaction and Communication Effects
The five hypotheses, from H6 to H10, were associated with the relationships between
social interaction measures (i.e., social presence, perceived usefulness, and perceived
ease of use) and communication effect measures (i.e., attitude toward the Web site and
revisit intention). These hypotheses were initially tested by running a multiple linear
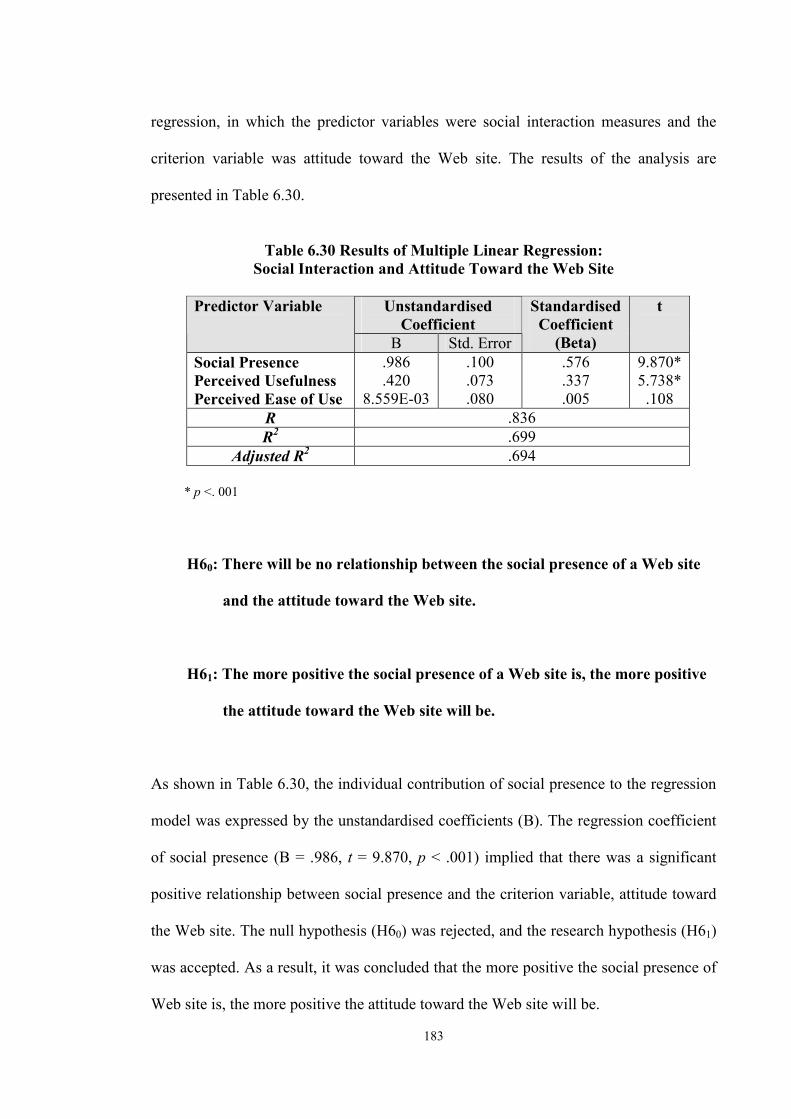
183
regression, in which the predictor variables were social interaction measures and the
criterion variable was attitude toward the Web site. The results of the analysis are
presented in Table 6.30.
Table 6.30 Results of Multiple Linear Regression:
Social Interaction and Attitude Toward the Web Site
Unstandardised Coefficient
Predictor Variable
B Std. Error
Standardised Coefficient
(Beta)
t
Social Presence Perceived Usefulness Perceived Ease of Use
.986
.420 8.559E-03
.100
.073
.080
.576
.337
.005
9.870* 5.738* .108
R .836 R2 .699
Adjusted R2 .694 * p <. 001
H60: There will be no relationship between the social presence of a Web site
and the attitude toward the Web site.
H61: The more positive the social presence of a Web site is, the more positive
the attitude toward the Web site will be.
As shown in Table 6.30, the individual contribution of social presence to the regression
model was expressed by the unstandardised coefficients (B). The regression coefficient
of social presence (B = .986, t = 9.870, p < .001) implied that there was a significant
positive relationship between social presence and the criterion variable, attitude toward
the Web site. The null hypothesis (H60) was rejected, and the research hypothesis (H61)
was accepted. As a result, it was concluded that the more positive the social presence of
Web site is, the more positive the attitude toward the Web site will be.
184
H70: There will be no relationship between the perceived ease of use of a Web
site and the attitude toward the Web site.
H71: The more positive the perceived ease of use of a Web site is, the more
positive the attitude toward the Web site will be.
As can be seen from Table 6.30, the regression coefficient of perceived ease of use (B =
8.559E-03, t = 9.870, p = .108) was very low and not statistically significant. Therefore,
the null hypothesis (H70) was accepted. Accordingly, it could be asserted that there was
no relationship between perceived ease of use and attitude toward the Web site.
H80: There will be no relationship between the perceived usefulness of a Web
site and the attitude toward the Web site.
H81: The more positive the perceived usefulness of a Web site is, the more
positive the attitude toward the Web site will be.
From the results of a multiple regression analysis (see Table 6.30), it was found that
there was a significant positive relationship between social presence and attitude toward
the Web site (B = .420, t = 5.738, p < .001). Hence, the null hypothesis (H80) was
rejected, while the research hypothesis (H81) was accepted. In conclusion, it was argued
that the more positive the perceived usefulness of a Web site is, the more positive the
attitude toward the Web site will be.
185
Further examination of the data related to the relative contribution of the predictor
measures was carried out using the standardised coefficients (β) of each predictor. The
results indicated that social presence (β = .576, p < .001) was the best predictor of the
attitude toward the Web site. Moreover, perceived usefulness (β = .337, p < .001) was
also a strong predictor in the regression model. However, perceived ease of use (β =
.005, p = .108) was not a significant predictor.
H90: There will be no relationship between the perceived usefulness of a Web
site and the perceived ease of use.
H91: The more positive the perceived ease of use of a Web site, the greater the
perceived usefulness will be.
To investigate these hypotheses, a simple linear regression analysis was conducted, in
which perceived ease of use was the predictor variable and perceived usefulness was the
criterion variable. As can be seen from Table 6.31, the negative regression coefficient of
perceived ease of use (B = -.245, p < .05) implied that as the score of perceived ease of
use increases by one, the score of perceived usefulness decreases by .245. From this
result, it was concluded that the more positive the perceived ease of use of a Web site is,
the lower the perceived usefulness will be.
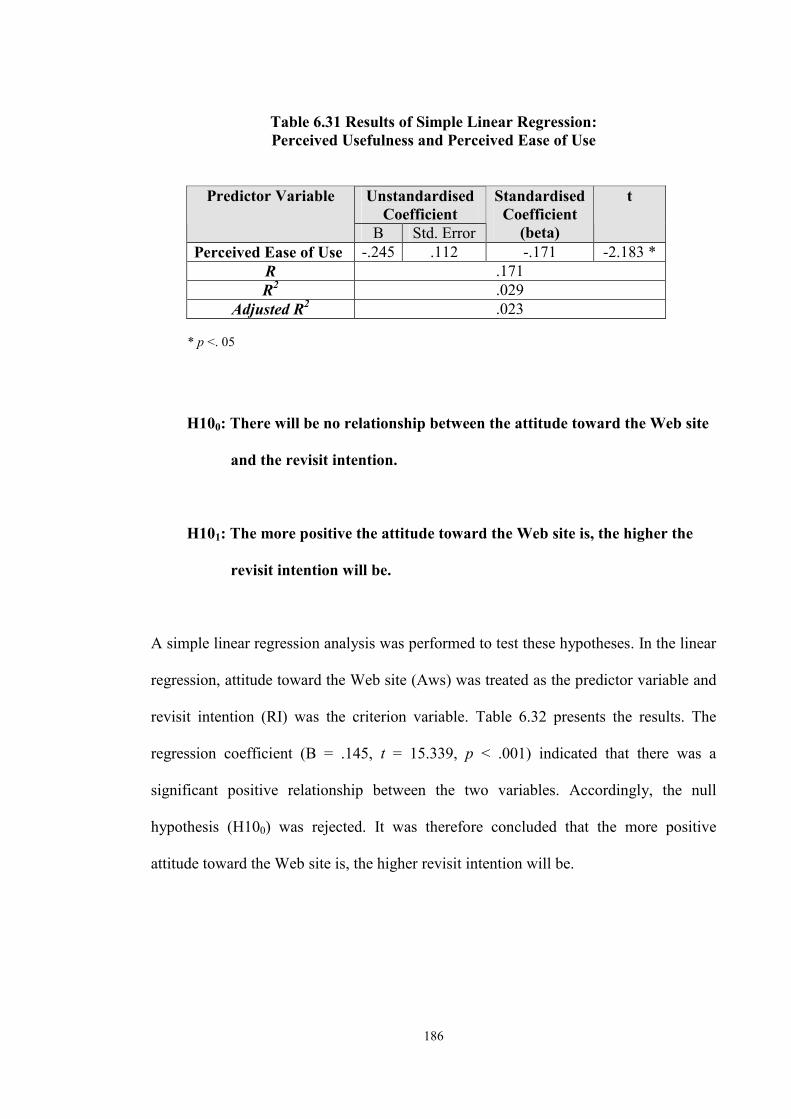
186
Table 6.31 Results of Simple Linear Regression: Perceived Usefulness and Perceived Ease of Use
Unstandardised Coefficient
Predictor Variable
B Std. Error
Standardised Coefficient
(beta)
t
Perceived Ease of Use -.245 .112 -.171 -2.183 * R .171 R2 .029
Adjusted R2 .023 * p <. 05
H100: There will be no relationship between the attitude toward the Web site
and the revisit intention.
H101: The more positive the attitude toward the Web site is, the higher the
revisit intention will be.
A simple linear regression analysis was performed to test these hypotheses. In the linear
regression, attitude toward the Web site (Aws) was treated as the predictor variable and
revisit intention (RI) was the criterion variable. Table 6.32 presents the results. The
regression coefficient (B = .145, t = 15.339, p < .001) indicated that there was a
significant positive relationship between the two variables. Accordingly, the null
hypothesis (H100) was rejected. It was therefore concluded that the more positive
attitude toward the Web site is, the higher revisit intention will be.
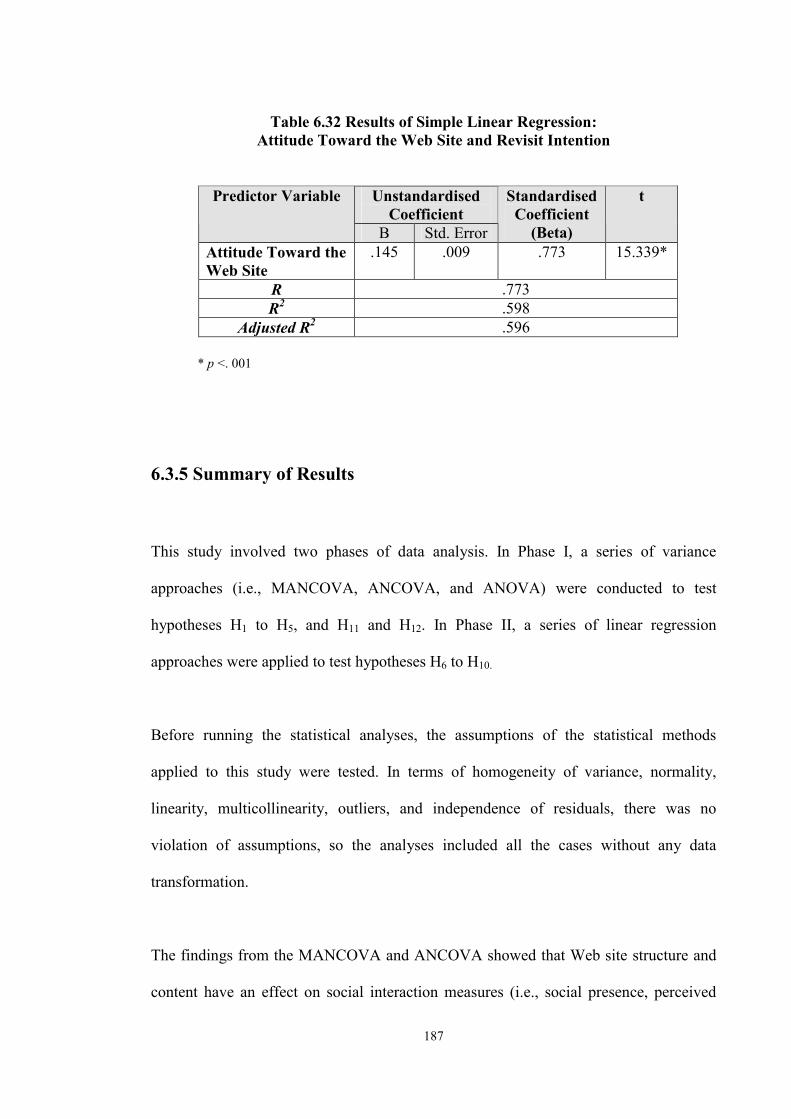
187
Table 6.32 Results of Simple Linear Regression: Attitude Toward the Web Site and Revisit Intention
Unstandardised Coefficient
Predictor Variable
B Std. Error
Standardised Coefficient
(Beta)
t
Attitude Toward the Web Site
.145 .009 .773 15.339*
R .773 R2 .598
Adjusted R2 .596 * p <. 001
6.3.5 Summary of Results
This study involved two phases of data analysis. In Phase I, a series of variance
approaches (i.e., MANCOVA, ANCOVA, and ANOVA) were conducted to test
hypotheses H1 to H5, and H11 and H12. In Phase II, a series of linear regression
approaches were applied to test hypotheses H6 to H10.
Before running the statistical analyses, the assumptions of the statistical methods
applied to this study were tested. In terms of homogeneity of variance, normality,
linearity, multicollinearity, outliers, and independence of residuals, there was no
violation of assumptions, so the analyses included all the cases without any data
transformation.
The findings from the MANCOVA and ANCOVA showed that Web site structure and
content have an effect on social interaction measures (i.e., social presence, perceived

188
usefulness, and perceived ease of use). In other words, different types of Web site
structure and content created different levels of social presence, perceived usefulness,
and perceived ease of use.
An ANOVA analysis assessed the moderator effect of Web literacy on the relationship
between Web site structure and social presence. For instance, subjects with low Web
literacy responded to the difference between hypermedia and static image types more
strongly than subjects with high Web literacy. However, the moderating effect was not
strong enough to change the direction of the relationship between Web site structure and
social presence.
The findings from the series of linear regression analyses showed that there were
positive relationships between social presence and attitude toward the Web site,
perceived usefulness and attitude toward the Web site. However, it was found that there
was no relationship between perceived ease of use and attitude toward the Web site.
Interestingly, social presence was the best predictor of the attitude toward the Web site.
Finally, it was found that there was a positive relationship between attitude toward the
Web site and revisit intention. More detailed discussion about the findings will be
provided in the following chapter.
189
CHAPTER 7. DISCUSSION AND CONCLUSIONS
7.1 Introduction
The Web is a new phenomenon in marketing communication. Although most marketing
and advertising scholars acknowledge the importance of a corporate Web site as a
marketing communication medium, to date little systematic research within the
discipline of marketing has been carried out the nature of WMC and assessment of
WMC effectiveness. Accordingly the overall aim of the study was to investigate the
features of effective corporate Web sites. There were five research questions addressed
by this study: (1) What content and structural elements are presented on corporate Web
sites?, (2) How can corporate Web sites be classified according to their content and
structure?, (3) How do consumers respond to different types of corporate Web site?, (4)
Do user attitudes towards corporate Web sites vary according to Web literacy levels?,
and (5) What features of corporate Web sites determine revisit intention among Web
users?
Through a critical review of the existing marketing literature, this study identified
knowledge gaps and problems with the current body of marketing knowledge. The lack
of an appropriate framework, which can be applied to this new communication medium,
calls for a new approach to studying WMC (e.g., Hoffman and Novak, 1996; McDowell
and Sutherland, 2000: Stewart et al., 2002). Given the distinctive characteristics of the
Web and the limitations of conventional approaches to the evaluation of marketing
communication media, this study developed the WMC model based on Activity Theory.
190
Furthermore, despite continued research on the Web, to date systematic empirical
research on a Web site typology has been deficient. To address this issue, a preliminary
study of 386 Web site home pages of Australian and Korean companies was conducted
and the findings discussed in Chapter 3. The content analysis identified two meaningful
homogeneous groups of Web site content (i.e., the “integrated communication” and
“basic information” type) and Web site structure (i.e., the “hypermedia” and static
image” type).
Based on a critical review of literature and the preliminary research on Web site
typology, a new conceptual model, the Web Acceptance Model (WAM)”, was
developed for understanding and measuring consumer acceptance and use of corporate
Web sites. Fourteen hypotheses were derived from the model. The WAM proposed that
Web site structure and content, together determined users’ affective responses to a Web
site and their ability to perform tasks using it (e.g., access required information). While
affective responses to a Web site were captured in the model through the construct of
“social presence”, task-related interaction in the model was assessed according to inter-
related constructs: perceived usefulness and perceived ease of use. It was also
hypothesised that Web literacy would moderate the relationship between Web site
typology and users’ responses to a Web site. These hypotheses were tested through an
experimental study.
This chapter discusses the results of both the preliminary research on the typology of
corporate Web sites and the experimental study which researched the WAM. These
findings provide answers to the research questions rosed in this study.
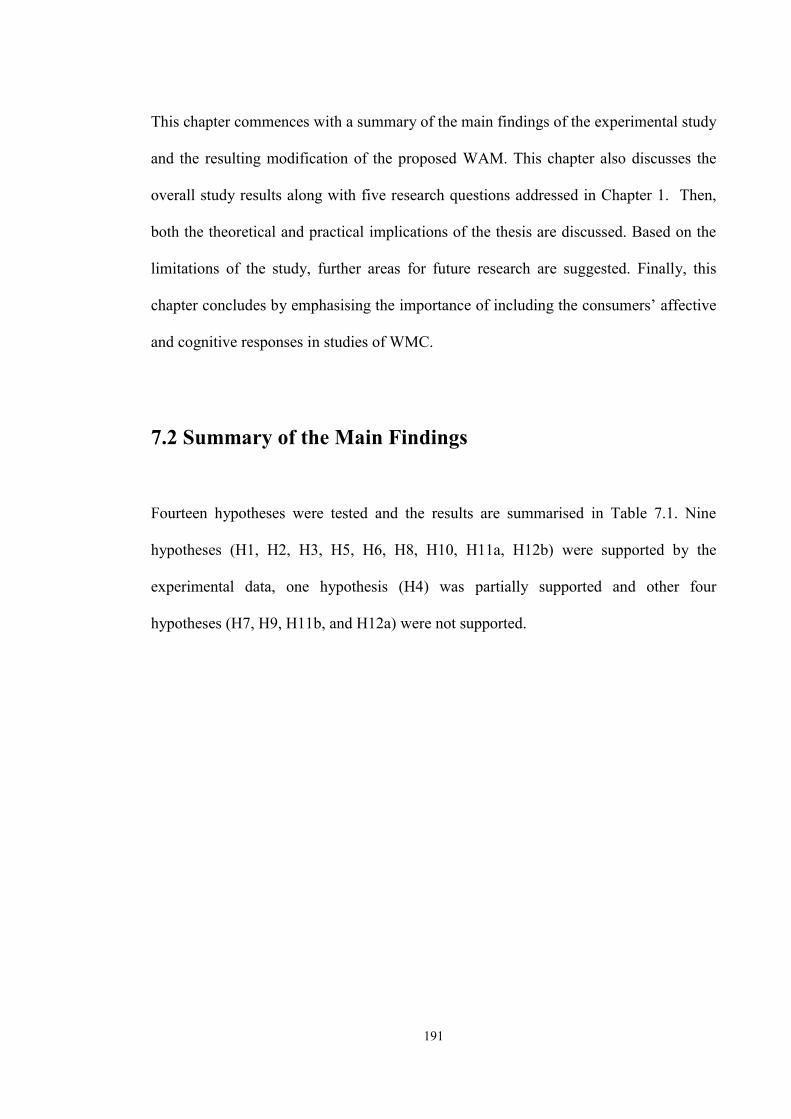
191
This chapter commences with a summary of the main findings of the experimental study
and the resulting modification of the proposed WAM. This chapter also discusses the
overall study results along with five research questions addressed in Chapter 1. Then,
both the theoretical and practical implications of the thesis are discussed. Based on the
limitations of the study, further areas for future research are suggested. Finally, this
chapter concludes by emphasising the importance of including the consumers’ affective
and cognitive responses in studies of WMC.
7.2 Summary of the Main Findings Fourteen hypotheses were tested and the results are summarised in Table 7.1. Nine
hypotheses (H1, H2, H3, H5, H6, H8, H10, H11a, H12b) were supported by the
experimental data, one hypothesis (H4) was partially supported and other four
hypotheses (H7, H9, H11b, and H12a) were not supported.
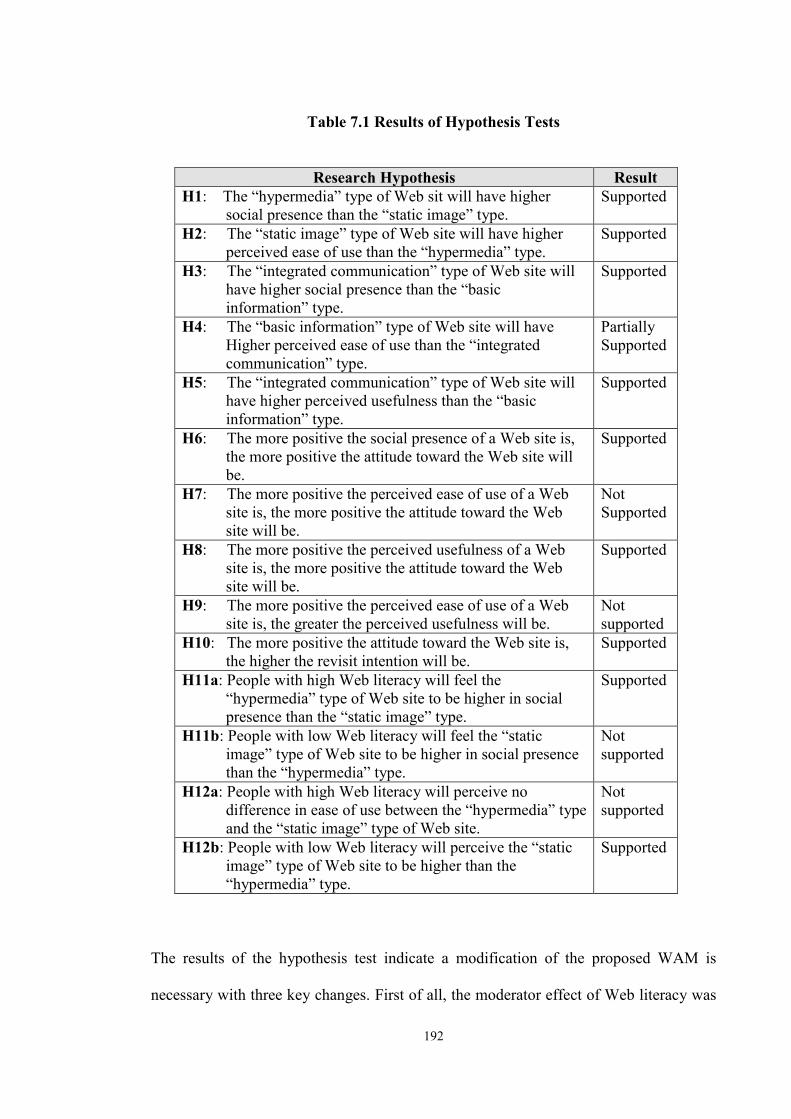
192
Table 7.1 Results of Hypothesis Tests
Research Hypothesis Result H1: The “hypermedia” type of Web sit will have higher social presence than the “static image” type.
Supported
H2: The “static image” type of Web site will have higher perceived ease of use than the “hypermedia” type.
Supported
H3: The “integrated communication” type of Web site will have higher social presence than the “basic information” type.
Supported
H4: The “basic information” type of Web site will have Higher perceived ease of use than the “integrated communication” type.
Partially Supported
H5: The “integrated communication” type of Web site will have higher perceived usefulness than the “basic information” type.
Supported
H6: The more positive the social presence of a Web site is, the more positive the attitude toward the Web site will be.
Supported
H7: The more positive the perceived ease of use of a Web site is, the more positive the attitude toward the Web site will be.
Not Supported
H8: The more positive the perceived usefulness of a Web site is, the more positive the attitude toward the Web site will be.
Supported
H9: The more positive the perceived ease of use of a Web site is, the greater the perceived usefulness will be.
Not supported
H10: The more positive the attitude toward the Web site is, the higher the revisit intention will be.
Supported
H11a: People with high Web literacy will feel the “hypermedia” type of Web site to be higher in social presence than the “static image” type.
Supported
H11b: People with low Web literacy will feel the “static image” type of Web site to be higher in social presence than the “hypermedia” type.
Not supported
H12a: People with high Web literacy will perceive no difference in ease of use between the “hypermedia” type and the “static image” type of Web site.
Not supported
H12b: People with low Web literacy will perceive the “static image” type of Web site to be higher than the “hypermedia” type.
Supported
The results of the hypothesis test indicate a modification of the proposed WAM is
necessary with three key changes. First of all, the moderator effect of Web literacy was
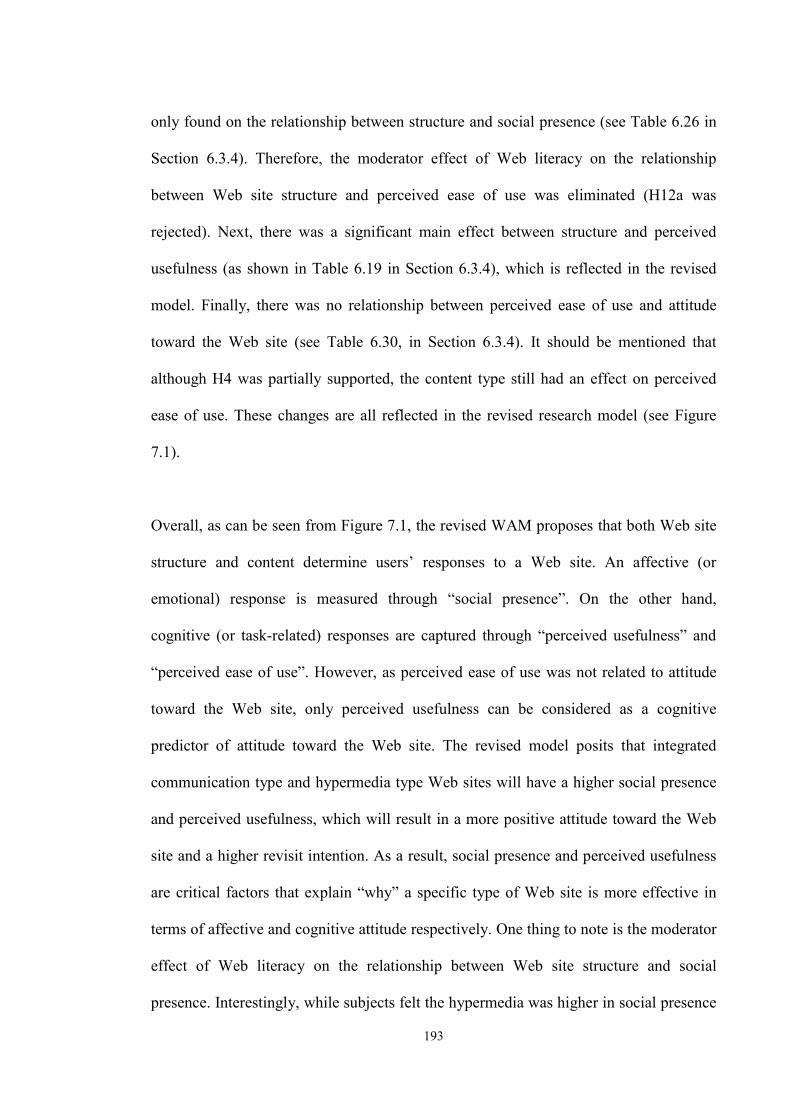
193
only found on the relationship between structure and social presence (see Table 6.26 in
Section 6.3.4). Therefore, the moderator effect of Web literacy on the relationship
between Web site structure and perceived ease of use was eliminated (H12a was
rejected). Next, there was a significant main effect between structure and perceived
usefulness (as shown in Table 6.19 in Section 6.3.4), which is reflected in the revised
model. Finally, there was no relationship between perceived ease of use and attitude
toward the Web site (see Table 6.30, in Section 6.3.4). It should be mentioned that
although H4 was partially supported, the content type still had an effect on perceived
ease of use. These changes are all reflected in the revised research model (see Figure
7.1).
Overall, as can be seen from Figure 7.1, the revised WAM proposes that both Web site
structure and content determine users’ responses to a Web site. An affective (or
emotional) response is measured through “social presence”. On the other hand,
cognitive (or task-related) responses are captured through “perceived usefulness” and
“perceived ease of use”. However, as perceived ease of use was not related to attitude
toward the Web site, only perceived usefulness can be considered as a cognitive
predictor of attitude toward the Web site. The revised model posits that integrated
communication type and hypermedia type Web sites will have a higher social presence
and perceived usefulness, which will result in a more positive attitude toward the Web
site and a higher revisit intention. As a result, social presence and perceived usefulness
are critical factors that explain “why” a specific type of Web site is more effective in
terms of affective and cognitive attitude respectively. One thing to note is the moderator
effect of Web literacy on the relationship between Web site structure and social
presence. Interestingly, while subjects felt the hypermedia was higher in social presence
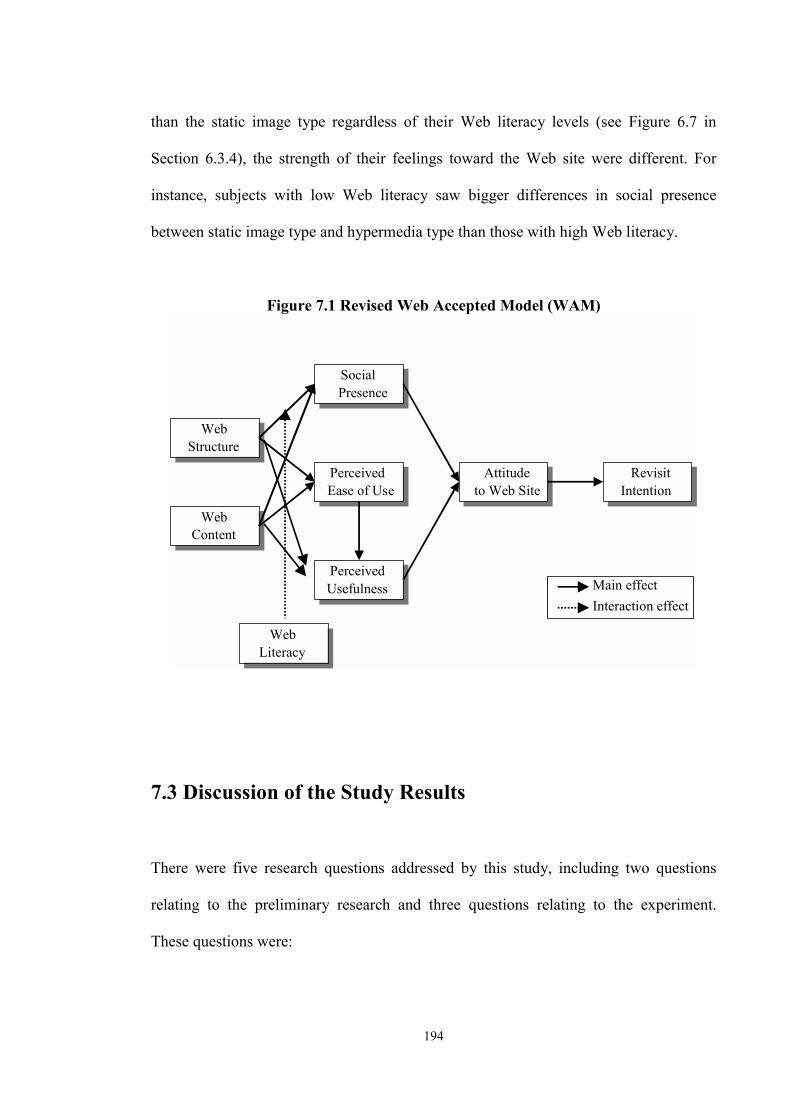
194
than the static image type regardless of their Web literacy levels (see Figure 6.7 in
Section 6.3.4), the strength of their feelings toward the Web site were different. For
instance, subjects with low Web literacy saw bigger differences in social presence
between static image type and hypermedia type than those with high Web literacy.
Figure 7.1 Revised Web Accepted Model (WAM)
WebStructure
Web Structure
WebContentWeb
Content
PerceivedUsefulness
Perceived Usefulness
PerceivedEase of UsePerceived
Ease of Use
SocialPrescenceSocial Presence
AttitudeTo Website
Attitudeto Web Site
RevisitIntentionRevisit
Intention
Web Literacy
Web Literacy
Main effect Interaction effect
7.3 Discussion of the Study Results There were five research questions addressed by this study, including two questions
relating to the preliminary research and three questions relating to the experiment.
These questions were:
195
� Preliminary Research Questions
1. What content and structural elements are presented on corporate Web sites?
2. How can corporate Web sites be classified according to their content and
structure?
� Experimental Research Questions
3. How do consumers respond to different types of Web sites?
4. Do user attitudes toward corporate Web sites vary according to Web literacy
levels?
5. What features of corporate Web sites determine revisit intention among Web
users?
7.3.1 The Elements of Corporate Web Sites
The first research question addressed the elements of corporate Web sites in terms of
their content and structure. In this study, content is defined as the information or
message presented on a Web site, whereas structure referred to the combination or
organisation of the executable elements of a Web site. Accordingly, the research
question focused on the types of messages and hypermedia elements that were presented
on corporate Web sites. This question was answered through an exploration of corporate
Web sites, as discussed in Chapter 3.
196
(1) Web Content
First of all, this study investigated the message content of corporate Web sites. Rust and
Oliver (1994) emphasised the importance of information content in the Internet era, and
foresaw a new form of communication different from traditional communication media.
Further, while some scholars (e.g., Novak and Hoffman, 1997; Raman and Leckenby,
1998; Salam et al., 1998; Singh and Dalal, 1999) have regarded Web sites as a form of
advertising, others (e.g., Ainscough and Luckett, 1996; Angehrn, 1997; Cappel and
Myerscough, 1997; Cockburn and Wilson, 1996; Deans and McKinney, 1997;
Ellsworth and Ellsworth, 1997; Esrock and Leichty, 2000; Hoger et al., 1998; Leong et
al., 1998; McNaughton, 2001; Palmer and Griffith, 1998; Perry and Bodkin, 2000; Pitt
et al., 1996; Simeon, 1999; Zeff and Aronson, 1999) have treated it as more than
advertising in its function. Therefore, in reply to the need for more research on Web
function, this study investigated the unique characteristics of the content of corporate
Web sites.
Content was related to five functions of marketing communication (i.e., advertising,
public relations, sales promotion, online selling, and customer service). This study
found that corporate home pages delivered all of the marketing communication
functions. This is consonant with other empirical studies, which have reported that Web
sites are more than advertising in their functions (e.g., Ainscough and Luckett, 1996;
Cappel and Myerscough, 1997; Cockburn and Wilson, 1996; Deans and McKinney,
1997; Esrock and Leichty, 2000; Hoger et al., 1998; Griffith and Krampf, 1998; Leong
et al., 1998; McNaughton, 2001; Perry and Bodkin, 2000; Simeon, 1999).
197
The study also revealed that advertising, public relations, and customer service were the
most frequently utilised functions of corporate Web site, whereas online selling and
sales promotions were used much less often. This result is consistent with the findings
from previous studies on Web pages. For example, through a content analysis of 300
corporate Web sites Cockburn and Wilson (1996) found that a mixed form of public
relations and advertising was most common (71.3 %), followed by online selling
(22.4%). On the other hand, the use of sales promotion was of a low incidence (3.0%).
Deans and McKinney’s (1997) study in New Zealand showed similar results. They
found that advertising (70%) and promotion (75%) were the two main functions, and
online selling (35%) and customer support (20%) were also considerably common.
Through a content analysis of the Fortune 500 Web sites, Liu et al., (1997),
demonstrated that product/service information (93.2%), company information (86.1%),
customer service (44.9%), online selling (26.2 %) were common features of these Web
sites.
It is of particular interest to note that customer service is one of the most important
functions of a corporate Web site. Some studies (e.g., Deans and McKinney, 1997,
Griffith and Krampf, 1998, Liu et al., 1997) have identified the important role of the
customer service function in a corporate Web site. This implies that a corporate Web
site can substitute for the more traditional way of dealing with customer inquiries and
problems, which was mostly carried out done by telephone (e.g., using a 1-800
number).
In general, it can be argued that corporate Web sites are capable of delivering more
diverse types of marketing information to broader target audiences than traditional
198
marketing communication media. Although online selling and customer service is still
not widely used, there is no doubt that the corporate Web site enables a hybrid form of
marketing communication which includes advertising, public relations, sales promotion,
online selling and customer service. Accordingly, a Web site should not simply be
treated as just another advertising medium.
(2) Web Site Structure
In terms of Web site structure, the current study proves that corporate Web sites utilise
all forms of hypermedia such as text, static images, video, audio and hyperlinks. While
a static image (e.g., company logo or a photograph) is the most common element of
Web site design, the use of audio is still low. On the other hand, text, and video are
moderately used. Among video options, simple animation techniques such as moving
text and images (e.g., continuous moving or blinking of visual images) are most
common rather than complex and advanced techniques such as video clips. This finding
supports previous studies. For example, Cockburn and Wilson (1996) found that Web
sites are mainly composed of text and images (89.3%), while the use of sound and video
was very rare (5.3.%). A likely explanation for this finding is that audio and video clip
files are relatively large and so take more time to download. Hence, companies prefer
simple animation types which tend to be more user-friendly.
The use of links on corporate Web sites is also an interesting finding. The study
revealed that around 60% of Web sites utilised internal links such as a “site map” or a
“search” function. This result indicates that many companies try to give their consumers
more control over accessing the company information on the Web site. This differs
199
markedly from traditional marketing communication tools such as television, radio,
newspapers and magazines, where consumers have much less control over how they
obtain information. In other words, a Web site provides consumers more “power to
decide which Web pages to surf, for how long, and how much information to obtain”
(Dholakia and Rego, 1998, p. 725). Furthermore, this study found that 47% of the sites
sampled had external links to other Web sites. According to Dholakia and Rego (1998),
the number of external links is one factor that influences the popularity of a Web site.
Therefore, it can be argued that by providing more information through links to
affiliated companies or other organisations, companies can enhance customer
satisfaction.
7.3.2 The Classification of Corporate Web Sites
The second research question aimed at identifying a possible typology of corporate Web
sites in terms of content and structure. Previous research has generally neglected the
systematic study of different Web site types. In other words, there has been no previous
empirical study on Web site typology in terms of content and structure. This question
was addressed through the development of a classification scheme in the preliminary
research described in Chapter 3.
(1) Web Site Content
On the basis of the preliminary research, Web site content was classified into two types:
“integrated marketing communication” and “basic information”. The integrated
marketing communication type contains all of the functions of marketing
200
communication, including advertising, public relations, sales promotion, and customer
service. On the other hand, the basic information type is composed of minimal
information and is limited to the functions of advertising, public relations customer
service. The study found that the majority of Web sites (61.5%) fall into the basic
information type, whereas only 38.5% were of the integrated communication type.
Although previous studies differ in their classification schemes and cannot be directly
compared, Cockburn and Wilson’s (1996) study yielded similar results i.e., the basic
information category was 74.3% and the more integrated communication type including
online selling function and sales promotion was 25.7%. This finding could be due to a
tendency for companies to treat their Web sites mainly as a medium for advertising and
public relations. Also, issues of security and the management of payment systems
remain obstacles to the widespread adoption of online selling (Cockburn and Wilson,
1996). Hence, at present the integrated communication type seems to be generally less
preferred.
(2) Web Site Structure
On the basis of the previous research, Web site structure was divided into two mutually
exclusive groups: “hypermedia” and “static image” types. While the hypermedia type
utilises full hypermedia capabilities of the Web such as text, images, video, audio, and
hyperlinks, the static image type mainly relies on descriptive text and static image. The
result showed a similar incidence of use between the two types. The hypermedia type
(55.1%) was used slightly more often than the static image type (44.9%). This is in
contrast to a previous study conducted by Cockburn and Wilson (1996). They found
that the vast majority (94.3%) of Web sites were of the static image type, whereas only
201
5.3% belonged to the hypermedia type. The finding of the current study implies that
unlike in an earlier stage of the Web’s development, nowadays more companies have a
tendency to adopt the hypermedia type than the static image type.
7.3.3 Consumer Responses to Corporate Web Sites
The third research question addressed the issues of “what” type of Web site is more
effective and “why” a particular type of a Web site is more effective than other types.
This question was addressed in the experiment by an exploration of the relationships
between Web typologies and two dimensions of social interaction, affective and
cognitive. The measure of the affective dimension was social presence, which is defined
as a user’s feeling that he or she is communicating via a Web site with other human
beings. The measures of the cognitive dimension were perceived usefulness, which is
defined as the degree to which a user believes that using a particular Web site would
increase job performance, and perceived ease of use, which is defined as the degree to
which a user believes that using a particular Web site would be free of physical and
mental effort.
(1) Web Site Structure and Social Interaction
This study found strong empirical support for first two hypotheses that different types of
Web site structure would generate different levels of social interaction in terms of
affective (H1) and cognitive (H2) dimensions. First, the hypermedia type resulted in
higher social presence than the static image type (H1). This finding confirms previous
studies in the communication literature showing that the use of more complex
202
multimedia increased the believability (Choi, 2000; Choi et al., 2001; Gale, 1990; De
Greef and Ijsselsteijn, 2000). The result of the present study implies that the use of full
hypermedia elements provides a rich sense of emotional experience (e.g., Bocker and
Muhlbach, 1993; Lombard, 1995; Lombard and Ditton, 1997; Lester, Voerman, Towns,
and Callaway, 1999; Reeves et al., 1993), which ultimately creates a sense of online
community (Suh, Hasan, and Couchman, 2003).
Second, the static image type had a higher perceived ease of use than the hypermedia
type (H2). Although there was an interaction effect between structure and content, it did
not affect the direction of the relationship between Web site structure and perceived
ease of use. Therefore, it may be concluded that as the static image type is much simpler
than the hypermedia type, Web users see the static image type as easier to use than the
hypermedia type. Additionally, this study found that there was a relationship between
Web site structure and perceived usefulness, i.e., the hypermedia type resulted in higher
perceived usefulness than the static image type. Although this relationship was not
expected, the result supported a previous study which found that multimedia use yielded
a higher perception of utility (Lester et al., 1999). One possible explanation of this
result is that the realistic representation of information in combination with interactivity
(e.g., the use of hypermedia elements) might increase the perceived quality of
information provided on a Web site. This implies that Web site structure has an effect
on perceived usefulness.

203
(2) Web Site Content and Social Interaction
As mentioned before, no attempts have yet been made to examine the relationships
between Web site content and the two dimensions of social interaction. In response to
the need for more research on these relationships, it was hypothesised that the different
types of Web site content would yield different levels of social interaction in terms of
affective (H3) and cognitive (H4 and H5) dimensions. The current study provided
strong support for H3 and H5, and partial support for H4. More precisely, the integrated
communication type had higher social presence (H3) and perceived usefulness (H5)
than the basic information type. These results confirm earlier findings that providing
more diverse information can enhance the effectiveness of marketing communication in
terms of usefulness, imagery vividness, overall attitude and behavioural intention (Bone
and Ellen, 1992; Davis, 1999; Hallahan, 2001; Singh et al., 2000). Davis (1999)
suggests the inclusion of content in which consumers can actively participate (e.g.,
entering a contest, making a recipe, ordering a brochure, joining a club, etc.) will make
a Web site more effective. This implies that integrated marketing communication via a
Web site, providing relevant and interactive content, can make consumers feel that they
are interacting with firms and so perceive that the information provided is useful to
them.
Furthermore, it was found that the relationship between Web site content and perceived
ease of use (H4) was influenced by Web site structure. That is, in the case of the static
image type, the basic information type was perceived to be easier to use than the
integrated communication type. By contrast, when structure was the hypermedia type,
the integrated communication type was perceived to be easier to use than the basic
204
information type. The results imply that when structure is simple (i.e., there is less use
of hypermedia elements) users consider that the simple content type is easier to use than
the more complex content type. However, in a more complex structure (with more use
of hypermedia elements) users perceive little difference between content types. To our
knowledge, this is the first study that has considered Web site structure and content
simultaneously in the study of consumer responses to Web sites.
7.3.4. User Attitudes and Web Literacy
The fourth research question sought to determine “when” a web site is more likely to be
effective. This question was addressed by an exploration of the moderator effect of Web
literacy on the relationships between Web site structure and the two dimensions of
social interaction, as expressed by four research hypotheses (H11a, H11b, H12a, and
H12b). Web literacy is defined as the user ability to manage the distinctive
characteristics of a Web site such as hypermedia and interactivity. This study provided
partial support for the hypotheses, supporting H11a and H12a but rejecting H11b and
H12b. First, there was a moderator effect of Web literacy on social presence, which
changed its value but did not change its direction. Subjects felt the hypermedia type to
be higher in social presence than the static image type regardless of their Web literacy.
However, as shown in Table 6.28 and Figure 6.12, there was a difference in subjects’
feelings of social presence for the different structure types. Subjects with low Web
literacy found more differences between the two structure types than those with high
Web literacy. One possible explanation is that previous experience and familiarity with
a Web site decreases the sense of social presence. On the other hand, a lack of
experience increases user sensitivity to the feeling of social presence, so novices or
205
inexperienced users notice the difference between the static image type and the
hypermedia type more than experts or experienced users. To our knowledge, this is also
the first study to explore the different user attitude toward the Web site according to
their Web literacy.
In contrast, it was found that there was no moderator effect on perceived usefulness and
perceived ease of use (see Table 6.22). This means that Web literacy does not change
the direction or value of the relationship between structure and the cognitive dimension
of social interaction (e.g., perceived usefulness and perceived ease of use).
7.3.5. Corporate Web Sites and Revisit Intention
The fifth research question was addressed by exploring the relationships between the
mediator variables (i.e., social presence, perceived usefulness, and perceived ease of
use) and the criterion variables (i.e., attitude toward the Web site and revisit intention).
This was specifically addressed by five hypotheses. The criterion measures were
attitude toward the Web site (Aws) and revisit intention (RI). Attitude toward the Web
site (Aws) is defined as a learned predisposition to respond to the attitude object in a
consistently favourable or unfavourable way, which represents a Web user’s overall
feelings toward the Web site. Revisit intention (RI) is defined as a consumer’s
willingness to revisit a particular Web site.
206
(1) Social Interaction and Attitude Toward the Web Site
In Chapter 4, this study hypothesised that there would be a positive relationship
between attitude toward the Web site and social presence (H6), and perceived
usefulness (H7), and perceived usefulness (H8). While this study found strong empirical
support for hypotheses H6 and H8, there was no evidence to support hypothesis H7.
First of all, higher levels of social presence led to a more positive attitude toward the
Web site (Aws). This is consistent with the findings from previous studies on Web site
effectiveness (Choi, 2000; Choi et al., 2001). In addition, higher levels of perceived
usefulness also resulted in a more positive attitude toward the Web site (Aws). This
finding is in accordance with previous empirical findings concerning the acceptance of
new technologies (Agawal and Prasad, 1999; Davis, 1993; Hu et al., 1999; Moon and
Kim, 2001). Hence, these results indicate that both the affective (i.e., social presence)
and cognitive (i.e., perceived usefulness) dimensions of social interaction are important
factors influencing users’ attitudes towards the Web site. Consumers tend to have a
more positive attitude toward the Web site when a Web site is seen as having more
social presence and perceived to be more useful.
Contrary to the expectation that there would be a positive relationship between
perceived ease of use and attitude toward the Web site, no significant relationship was
identified. This result contrasts with much previous research that has focused on the
acceptance or use of new technology (e.g., Agawal and Prasad, 1999; Davis, 1993;
Moon and Kim, 2001). Previous studies in the field have reported contradictory results
about the relationship between ease of use and attitude (e.g., attitude toward the
technology or attitude toward the use of the technology) or behavioural intention (e.g.,
207
intention to use), including findings of no relationship (Chau, 1996; Goldschmidt and
Tan, 1999; Hu et al., 1999), negative relationships (Griffith, Tansik, and Benson, 2002),
and mixed results (Adams, Nelson, and Todd, 1992; Davis et al., 1989; Gefen and
Straub, 2000). Moreover, the current study also revealed that there was a negative
relationship between perceived usefulness and perceived ease of use. Previous studies
have reported different results, including a positive relationship (Agawal and Prasad,
1999; Chau, 1996; Venkatesh and Davis, 2000), a negative relationship (Griffith et al.,
2002), and no relationship (Hu et al., 1999).
Chau (1996) explains that the relationship between perceived ease of use and attitude
toward the technology is dependent upon the stage of technology diffusion or
technology life cycle. In other words, in the early stage of diffusion, users need some
skills to handle the technology, hence perceived ease of use will show a positive
relationship with attitude toward the technology or behavioural intention to use.
However, in the late stage users will have much less difficulty in using the technology.
Accordingly, there will be no relationship, which seems to be a plausible explanation
for the inconsistent results.
As many researchers have argued (e.g., Adams et al., 1992; Chau, 1996; Davis, 1989;
Keil, Beranek, and Konsynski, 1995), perceived ease of use may not be an important
variable for explaining user acceptance of technology but there are some factors that
have an influence on the relationship between perceived ease of use and attitude or
behavioural intention. Those factors encompass technology characteristics (e.g.,
functions, technology life cycle, and technology category) and user characteristics (e.g.,
technology literacy, motivation, and culture). Therefore, this study indicates that the

208
study of technology acceptance should be guided by a more sophisticate theoretical
framework that reflects broad influential factors including technology characteristics
and user characteristics.
(2) Relative Importance of the Affect (Social Presence)
This study investigated the two dimensions of social interaction, namely affective socio-
emotional and cognitive task-related. The results showed that social presence was the
better indicator of consumer attitudes towards the Web site than perceived usefulness.
This result strongly supports Morris et al.’s (2002) advertising effectiveness study,
which found that an emotional response to marketing communication stimuli was more
a powerful predictor of purchase intention) than a cognitive response. Moreover, Morris
et al., (2002) insisted that unlike overall evaluation of consumer attitude (e.g., attitude
toward the ad), more specific affective responses (e.g., pleasure) offer a direct method
of analysing the complex feelings that comprise human reactions to marketing
communication stimuli. While attitude toward the Web site measures overall affective
responses to Web site, social presence can explore more complex and specific feelings
towards Web sites. The current study implies that, although the usefulness of the
information presented in a Web site (measured by perceived usefulness) is still
important, a user’s specific feeling towards Web sites (measured by social presence) is
more important.
209
(3) Attitude Toward the Web Site and Revisit Intention
Finally, this study hypothesised that “the more positive the attitude toward the Web site
is, the higher the revisit intention will be” (H10). The study revealed a significant,
positive relationship between the attitude toward the Web site and revisit intention. This
finding is in accordance with previous empirical findings concerning advertising, Web
site effectiveness, and user acceptance of technology (Agawal and Prasad, 1999; Bruner
and Kumar, 2000; Choi, 2000; Choi et al., 2001; Davis, 1993; Gefen and Straub, 2000;
Hu et al., 1999; Moon and Kim, 2001; Stevenson et al., 2000). Choi and his colleagues
(Choi, 2000; Choi et al., 2001) found that when a user’s attitude toward a Web site was
high, users’ intention to revisit the Web site was high. This study indicates that
consumers intend to revisit a Web site when they have more favourable attitude toward
it.
7.4 Implications of the Study
7.4.1 Theoretical Implications
The Web is a new phenomenon in marketing communication. For instance, Web users
are more active than traditional television viewers. The Web uses hypermedia and
delivers various content such as advertising, public relations, sales promotion, online
selling, and customer service simultaneously. Two central concepts of Web-mediated
marketing communication are mediation and social interaction. Given the distinctive
characteristics of this new medium, conventional approaches to the evaluation of a Web
210
site have been questioned. Activity Theory best explains this new phenomenon. This
study proposes a conceptual framework for understanding WMC based on Activity
Theory. This conceptual model has many important implications for the study of the
Web. To begin with, the WMC model provides different perspectives compared to
traditional communication models. The most popular communication model is the
information processing model, which defines communication as the cognitive process of
message transmission. Many scholars (e.g., Allen, Machleit, and Kleine, 1992; Krech
and Crutchfield, 1948; Vygotsky, 1962 and 1994) warn that without an understanding
of the affective attitude of subjects, we cannot fully understand behaviour. Hence, this
model has been criticised for ignoring this important aspect of behaviour (e.g.,
Aboulafia et al., 1995; Craig, 1999; Peter and Olson, 1990). In addition, the direction of
transmission in the model is always from the sender (firms) to the receiver (consumers,
or as they are often called “recipients”). Furthermore, although there is a feedback loop
in the information processing model, it is asynchronous and performed through other
media like the telephone and customer surveys.
By contrast, the WMC model suggests that communication is a process of mutual
exchange and social interaction between firms and customers. There is no distinction
between the sender and the receiver, and consumers are “participants” in the
communication process. In other words, a corporate Web site is not a simple
information distribution channel, rather it is a virtual community where firms and
customers actively exchange information and build relationships. Therefore, WMC is
not simply human-computer interaction but is more like human-human interaction.
Papacharissi and Rubin (2000) argue that a Web site is a socio-cultural network for
informational and social interaction. This notion implies that Web studies should be
211
conducted in relation to both information needs and social relationships. Thus, effective
Web design should be aimed at persuading and building relationships with customers
through a virtual community. It is claimed here that the WMC model, with its
fundamental premise of Web-mediated marketing communication as an interactive
process, overcomes the shortcomings of the information processing approach. In this
respect, the WMC model is a more useful and powerful alternative to the traditional
communication model.
The identification of two dimensions of social interaction provides a new insight into
theories of human communication. Traditionally, communication is defined as the
transfer of information from a sender to a receiver (e.g., Shannon and Weaver, 1949).
Accordingly, the concern of a sender is to deliver a message accurately. Effectiveness,
efficiency, and functionality are frequently used concepts for assessing the performance
of communication. Accordingly, researchers have focused on identifying the cognitive
or rational aspect of human communication and information processing. Alternatively,
the WAM emphasises the exchange of both information and emotional responses.
Especially, emotional responses express anticipated action, which ultimately underlies
forthcoming behaviour (Arnold, 1960; Frijda, 1970 and 1986). Therefore, understanding
consumers’ emotional responses (e.g., social presence) helps to understand consumers’
action tendencies toward the firms’ communication activities. The dual functions of the
WAM are reflected in the two dimensions of social interaction (affective and cognitive),
which help explain the conative or behavioural component of consumer attitude. This
also implies that the WAM mainly focuses on identifying user’s responses to messages
(or media) rather than messages (or media) themselves. Therefore, it can be concluded
that this trend should be reflected in future studies of the Web. It is expected that this
212
study will provide a sound foundation for building theoretical models and assessing the
communication performance of Web sites.
Recently, there have been many attempts at assessing corporate Web sites as tools for
marketing communication. Much of the research on Web site marketing effectiveness to
date has focused on a Web site as an advertising medium and so has adopted
conventional advertising evaluation models (e.g., Bruner and Kumar, 2000; Choi et al.,
2001; Luo, 2002; Goldsmith and Lafferty, 2002). A fundamental shortcoming of this
approach is that it does not adequately address the reciprocal social interaction provided
by Web-mediated marketing communication (Suh, Couchman and Park, 2002a).
Neither does it adequately address the active role that users play in interacting with this
medium. It is argued that, as Web sites are new interactive media very different from
traditional marketing communication media, new approaches to their assessment should
be employed.
The current study suggests that in addition to traditional communication effect
measures, social interaction measures should be added as mediator variables in any
model that aims to explain Web site effectiveness. This claim reflects the argument that
a more sophisticated multi-dimensional view of attitudes is required when studying
responses to Web sites. Only assessing the cognitive and affective dimensions of an
attitude can help understand the underlying meanings of the behavioural intention
associated with an attitude object such as a Web site. Thus, social interaction variables
can help explain the key dimensions of an attitude. Because of this, social interaction
measures can play a critical role in the development of Web-based marketing
communication. They do so by helping marketers to better understand not only those

213
factors that influence Web site acceptance, but also the processes by which consumer
attitudes are shaped and changed. Moreover, social interaction is influenced by Web
characteristics (i.e., structure and content) and user characteristics (e.g., experience,
culture, motivation, and so on). Accordingly, researchers should not ignore their role in
studies of Web site effectiveness (Stewart and Pavlou, 2002).
Furthermore, this study provides a more sophisticated concept of communication than is
generally provided in studies of consumer behaviour. Even though many
communication theorists have asserted that social interaction is at the core of human
communication (e.g., Cherry, 1966; Gerbner, 1977), to date most marketing
communication models have failed to adequately reflect this. Adopting social
interaction as a central concept, the WAM indicates that the communication act is not
simply a linear transfer of information between a transmitter and a receiver, but a
mutual exchange of information carried out within specific socially and culturally-
determined frameworks of meaning and often involving an emotional component. In
other words, human communication is rarely just an instrumental act and therefore
requires a multi-dimensional approach to adequately describe and explain its socio-
cultural nuances. Thus, in the model, task-related interaction explains the process of
information exchange, while the construct of socio-emotional interaction accounts for
the emotional exchange that occurs.
The development of the model has made clear that in studies of user responses to
corporate Web sites there needs be a close collaboration among different disciplines and
their associated fields of research, including Marketing, Communication Studies,
Information Systems (and especially the field of Human Computer Interaction),
214
Education and Psychology. Each of these adds to an understanding of this new
phenomenon, and all have an interest in it. A Web site is not just a marketing medium,
it is also a very useful tool for other practical areas such as education, computer
networking, and collaborative activities in a wide range of domains. As such, it is a
legitimate object of study and theoretical development in the disciplines associated with
these practices. Furthermore, the study of user interactions with a Web site involves
developing an understanding of user psychology. Each of these disparate areas of study
adds to our understanding of web-mediated marketing communication, but none on its
own is sufficient. When the results of the research in each of these areas are integrated,
synergies and richer understandings are the result, which is why so many
interdisciplinary studies are currently being conducted in this area. One of the main
contributions of the model presented here to the development of theory on WMC is that
it integrates knowledge from a number of different disciplines, most notably from
Marketing and Information Systems.
It is worth noting that the definition of Web functions and the classification of Web sites
are important issues in the study of the Web. Immediately after the advent of a Web site
as a marketing communication medium, existing definitions did not capture the
distinctive role of Web marketing communication. Moreover, an integrated use of the
communication functions of a Web site can blur boundaries between functions.
Furthermore, as a Web design involves a wider range of structural elements than
traditional marketing communication media (e.g., television, radio, newspaper, and
magazine), a typical advertising typology cannot be applied to a Web site design. This
study identified the empirical typology of a corporate Web site based on a new
classification scheme (i.e., structural and functional). Therefore, the Web site typology
215
proposed in this study provides a conceptual base for establishing and developing
theories related to marketing communication and information systems.
The clear definition of Web functions and hypermedia structure can also play a critical
role in establishing a measurement system for Web site effectiveness. At present one of
most urgent problems to be solved is an assessment of the effectiveness of a Web site.
The empirical typologies can serve as independent variables in a measurement system.
In addition, although there have been many empirical studies on the Web, the results of
these cannot be compared due to the different terms and definitions used. Inconsistent
definition is also a big hindrance to the development of theory. In this respect, the
classification schemes and definitions in this study can be a cornerstone for building
sound marketing communication theories.
A major methodological theme throughout the behavioural and social sciences since at
least the late-20th century has been the need for researchers to pay more attention to
instrumentation. But in marketing research (and notably in the genre of applied
marketing research) questionnaire design is often driven by pragmatism and
expediency, and so issues of instrument validation tend to receive scant attention. This
also applies to the pilot testing of questionnaires, which as Hunt et al., (1982) point out
“… is often done in a hurried, non-systematic fashion” (p. 269). While researchers can
deploy previously-used scales in the confidence that these may have been assessed
(often over many independent studies) as reliable and valid, this may not be sufficient
because of variations in language and sense-making across populations and even across
cohorts or cultures within populations. This study has centred the discussion on the
216
procedures through which the draft questionnaire was pilot tested, which had been
constructed by appropriating and modifying previously-used scales.
Four main benefits were derived from a more rigorous pilot test of the instrument.
Firstly, the two-stage process ensured that appropriate language was used for scale
items and that the questionnaire was both meaningful and comprehensible to members
of the population of interest in the study. In doing so, the possibility of obtaining
“noise” in the data collected was minimised and the researcher could be more confident
that the responses to the questions were authentic. Secondly, the pilot testing enabled
the researcher to “de-bug” the experimental procedure used in the study. For instance, it
was able to determine that the test Web sites appeared and performed as planned in the
experiment, that there were no problems in managing the experimental situation, and
that the information task set for subjects was appropriate for the experiment. Thirdly,
the pilot test ensured that the measuring instruments used were, after some necessary
modifications (a process often referred to as measure “purification”), internally
consistent and reliable. Finally, the pilot testing enabled the researcher to conclude that
the multi-item scales were indeed unidimensional and likely to be valid measures of the
constructs in the theoretical model. These latter findings were consistent with the results
of the various studies from which the different scales had been derived.
7.4.2 Practical Implications
To begin with, the study provides managers with insights into Web site design. The
study implies that the Web design process is not a simple allocation of hypermedia
elements, but a purposeful activity. The comparison of these two approaches can be
217
described by informative and communicative concepts (Gahagan, 1975). The former
refers to a simple allocation of information without intention. On the contrary,
communicative design is the intended and planned behaviour of firms aimed at
influencing customers. Web design requires well-prepared plans to influence customers.
Hence, it involves selecting and combining various content and structural elements of
representation. As content and structure are interdependent, a holistic view is essential
in designing Web sites (Barton and Barton, 1985; Kostelnick, 1988). This study
provides managers with a holistic view for designing Web sites through the
classification schemes of Web typologies developed in Chapter 2.
Second, the study found that a corporate Web site is an efficient tool for integrated
marketing communication. In other words, a Web site is more than an advertising
medium in its function. Although advertising, public relations, and customer service are
dominant functions, online selling and customer service are also important functions of
corporate Web site. Many scholars insist that integrating marketing communication
functions into one medium is a critical activity for business success (e.g., Blattberg and
Deighton, 1991; Clark, 1997; Rao, Salam, and DosSantos, 1998; Strauss and Frost,
1999). Therefore, one of the important jobs of marketers is to select and integrate
relevant information on a Web site.
Third, this empirical study warns practitioners not to accept conventional wisdom
without systematic investigation. Some popular examples of the conventional wisdom
in relation to Web design are “Simple is better” and “Content is king”. Although the
meaning of “simple” is not clearly defined, generally simple can be understood as
simple design (less complicated) or simple content (less information). Contrary to

218
industry wisdom, the results of this study showed that the hypermedia type, and the
integrated communication type of Web site were more effective than the static image
type and the basic information type, respectively. This implies that consumers prefer
more information and interactive Web sites, which ultimately helps consumers feel that
they are interacting with firms, and perceive that the information provided is useful.
Perceived ease of use was not a critical factor in understanding consumer attitude on a
Web site. For Web designers, it appears that the use of dynamic hypermedia (e.g.,
animation, audio, video, and links) will enhance the effectiveness of a corporate Web
site (Blumberg and Galyean, 1995; Cockburn and Wilson, 1996; Hamilton and Luo,
1999). The study also showed that the belief “content is king” is not in fact the case. As
discussed before, it was found that both content and structure are critical factors of
consumer attitude and both seem to contribute equally to enhance positive attitude.
Accordingly, the study result indicates that ‘both content and structure are king’. This
strongly emphasises the need for close collaboration between marketers and Web
designers.
Fourth, to overcome the limitations of traditional methods of assessing Web site
effectiveness, the WAM was developed. In the model, a critical predictor of consumer
behaviour is social interaction between a Web site (or a firm) and a user. Unlike attitude
toward the Web site, social interaction measures can examine more precise emotional
and cognitive responses to the marketing environment. The use of socio-emotional and
task-related interaction gives practitioners the opportunity to closely investigate
consumer attitudes. Understanding how consumers feel toward a specific type of Web
site enables marketers or Web designers to forecast consumer behaviour, which in turn
can help maximise the effectiveness of the Web site (Shimp, 1997).
219
Fifth, it has been often argued that a Web site is a rational medium and so the
communication process with a Web site has been mainly studied from the cognitive
point of view. However, this study found that a Web site is an emotional and cognitive
medium. The results demonstrated the superiority of the emotional component (i.e.,
social presence) over the cognitive component (i.e., perceived usefulness) for
forecasting overall attitude. Therefore, marketers should keep in mind that a good Web
site should foster not only the perception of usefulness but also the feeling that the user
is fully interacting with a Web site. To some extent, these factors are controllable by
marketers and Web designers.
Finally, the study indicates the important role of individual user differences. As already
discussed, Web literacy had an impact on a consumer’s feeling of social presence. This
result indicates that a so-called one-size-fits-all design does not seem to work well
(Egan, 1988; Nielsen, 1993; Palmquist and Kim, 2000). Besides, although they were
controlled in this study, consumers’ motives and culture seem to influence consumer
attitudes. As a result, those factors should be considered in the design of corporate Web
sites.
7.5 Limitations of the Study
There were several limitations of the research methods use in this study. Firstly, the
current study adopted a cross-sectional design, which was conducted at one point in
time. While it provided a useful “snapshot” of consumer data help to understand the
phenomenon under study, it could not explain possible changes in consumer attitudes
over time. It is generally recognised that longitudinal studies (or at least a series of
220
cross-sectional studies) can detect attitude changes over time and allow stronger
inferences to be drawn about the dynamic elements of behaviour (De Wulf, 1999).
Secondly, there were limitations arising from the sample used in this study. First, the
sample size was relatively small (n = 160). Given the relatively small sample size, more
versatile and powerful statistical techniques such as Structural Equation Model (SEM),
which is optimised for large samples of 200 to 400 subjects (Muehling and Laczniak,
1992), could not be run. Instead this study utilised the conventional ordinary least
square (OLS) regression to analyse data gathered from the experiment.
Moreover, the subjects were not taken from a probability sample. Although there
appeared not to be any sample biases, compared to the population from which it was
drawn, this possibility cannot be categorically ruled out. A related problem was that of
the population of interest for the overall study, university students. As in many
marketing and psychology studies, students were treated as representative of a broader
national population (young adults, aged 18 – 30 years), but it could be questioned
whether this was a valid assumption (e.g., it is likely that university students are not
representative of the broader population on a number of variables which are relevant to
the study, such as Web literacy).
Thirdly, another limitation was the procedure used to validate the summated scales in
the questionnaire. Although the researcher was reasonably confident that the scales were
reliable, unidimensional, had good item analysis coefficients and expert-determined
face validity, there was no rigorous assessment of the construct validity of the scales
(i.e., in terms of convergent, discriminant or nomological validity). In other words, it
221
cannot be conclusively stated that the scales did indeed accurately measure the
constructs in the research model. Further validation studies are required to confirm that
the measures accurately measured the constructs, for example by using such techniques
as multi-trait, multi-method (MTMM) matrices and structural equation modelling (e.g.,
Campbell and Fiske, 1959; Peter, 1981).
Finally, this study controlled some important variables such as motives for Web use and
culture. For example, even though there were many motives for Web use (e.g.,
information, entertainment, communication, and so forth), the experiment was
conducted in the context of “search for information”. In addition, it was carried out only
in Australia. Therefore, the results of this study may not be generalisable to other
situations and contexts.
Despite these limitations, the present study provides valuable insights into the study of
Web-based or Internet marketing. The acknowledged limitations of this study have led
to suggestions for further research.
7.6 Areas for Further Research
In the preceding section, the limitation of using a cross-sectional research design was
raised. As the Web is growing and evolving very quickly, the nature of Web sites is not
fixed (Feldman, 1997; Koehler, 1999). Furthermore, over time consumers’ levels of
Web literacy are also changing. Accordingly, a “snapshot” experiment cannot fully
explain the new phenomena in WMC. Alternatively, further research employing
longitudinal methods, which assess the same subjects over time, would allow more
222
precise investigation of cause and effect relationships between Web site typology and
consumer attitudes. In addition, more sophisticated experimental methods such as a
within-subject design may improve our understanding of the phenomenon studied. In a
within-subject design each subject experiences every experimental condition (i.e., all
the test Web sites), therefore differences in response to a Web site by the same subject
under different conditions can be detected (Shaughnessy and Zechmeister, 1994).
In terms of the sample, future studies should involve larger samples with greater
diversity in age groups, levels of Web literacy, and educational background, and so on.
Even though university students may be a typical consumer group, it can be assumed
that their levels of Web literacy would be comparatively higher than those of the general
public. This study showed that Web literacy has an impact on the relationship between
Web site structure and social presence. Accordingly, in order to generate more
generalisable results, larger and more diverse samples are recommended.
As discussed in Chapter 4, culture is widely believed to influence consumer behaviour.
There are several reasons why culture should be considered in studies of WMC. First of
all, a Web site is inherently an international communication medium. Secondly,
previous research on the Internet and the Web has found significant differences across
industries and countries (e.g., Huizingh, 2000; Ju-Pak, 1999; McBride, 1997; Perry and
Bodkin, 2000; Suh, Couchman, and Lee, 2002a and b). As a result, it is expected that
consumers living in different countries would respond to a Web site differently. More
importantly, the theoretical framework of this study was developed using evidence from
Western cultures and conducted only in Australia. Hence, this model should be tested in
the context of different cultures (Aaker and Maheswaran, 1997). Given that different
223
countries have not only large cultural differences but also different industry structures, it
seems that a cross-national study would be appropriate and highly desirable (Suh,
Couchman, and Lee, 2002a). Further studies in different countries, with different
cultures, would strengthen the model’s explanatory and predictive power.
Human communication is not a simple process of information transmission, but a more
complex process involving interaction among subjects, tools, and objects. In terms of
objects, or purposes, this study has investigated only one aspect, namely that of
“information search”. How are other purposes (e.g., entertainment, communication,
education, and so on) used in the WAM? The inclusion of a variety of tasks would
provide greater insights in studies of WMC.
7.7 Conclusions
The use of Web-based or Internet marketing is growing rapidly in today’s increasingly
globalise “networked economy”, and associated with this has been an increase in the
importance of corporate Web sites (Mohammed, Fisher, Jaworski and Cahill, 2002). But
while more and more companies are establishing a presence on the World-Wide-Web
through their Web sites, our understanding of the effectiveness of such corporate Web
sites is still at a rudimentary stage. This is despite a recent proliferation of studies in the
discipline of Marketing on the responses of customers to Web-based advertising, in the
discipline of Communication on Computer-Mediated Communication, and in the
discipline of Information Systems on the determinants of Web page usability. To help
advance our understanding of Web site effectiveness, this study has constructed a new
224
theoretical model which seeks to explain Web site acceptance by different types of
users.
This study proposes the WAM as a conceptual framework, which includes predictor,
criterion, mediator, and moderator variables, for understanding consumer acceptance
and use of a corporate Web site. Like a traditional advertising study, Web site
typologies serve as predictors and communication effects are criterion variables.
Meanwhile, individual differences, as moderators, explain “when” the effectiveness of a
Web site is different. Finally, both affective and cognitive dimensions of social
interaction, as mediators, describe “why” certain behaviour occurs. The current study
has constructed this model by drawing on recent research developments in the areas of
Marketing, Communication, and Information Systems. The model moves beyond
previous frameworks used to assess conventional marketing media, to address the
central feature of this new medium: users can actively interact with corporate Web sites.
On the basis of this framework, an experiment was conducted. Few Web site
effectiveness studies have examined social interaction as a consumer-defined variable,
and none of these have identified the consumers’ socio-emotional and task-related
responses toward the communication medium as important factors influencing overall
consumer attitude and revisit intention. The current study clearly demonstrates the
importance of these constructs when evaluating effectiveness of a Web site.
Accordingly, it is hoped that this study makes a significant contribution to a burgeoning
area of research that is of great and increasing importance to both the discipline and the
practice of marketing.
225
REFERENCES Aaker, D. A., Batra, R., and Myers, J. G. (1992). Advertising management (4th ed.).
Englewood Cliffs, NJ: Prentice Hall. Aaker, D. A., Kumar, V., and Day, G. S. (2001). Marketing research (7th ed.). New
York: John Wiley & Sons. Aaker, J. L., and Maheswaran, D. (1997). The effect of cultural orientation on
persuasion. Journal of Consumer Research, 24(December), 315-328. Abdul-Gader, A. (1996). The impact of user satisfaction on computer-mediated communication acceptance: A causal path model. Information Resources Management Journal, 9(1), 17-26. Aboulafia, A., Gould, E., and Spyrou, T. (1995). Activity theory vs cognitive science in the study of human-computer interaction. Paper presented at the IRIS (Information Systems Research Seminar in Scandinavia) Conference, Gjern, Denmark, August 11-13. Adams, D. A., Nelson, R. R., and Todd, P. A. (1992). Perceived usefulness, ease of use,
and usage of information technology: A replication. MIS Quarterly, June, 227-247.
Agarwal, P. and Prasad, J. (1999). Are individual differences germane to the acceptance of new information technologies? Decision Sciences, 30(2), 361- 391. Agarwal, J., Sambamurthy, V., and Stair, R. M. (2000). Research report: The evolving relationship between general and specific computer self-efficacy: An empirical assessment. Information Systems Research, 11(4), 418-430. Ainscough, T. L., and Luckett, M. G. (1996). The Internet for the rest of us: Marketing on the World Wide Web. Journal of Consumer Marketing, 13(2), 34-67. Allen, C. T., Machleit, K. A., and Kleine, S. (1992). A comparison of attitudes and
emotions as predictors of behavior at diverse levels of behavioral experience. Journal of Consumer Research, 18(4), 493-504.
Allport, G. W. (1935). Attitudes. In C. A. Murchinson (Ed.), A handbook of social psychology (pp. 798-844). Worcester, MA: Clark University Press.
Amor, D. (1999). The e-business (r)evolution: Living and working in an interconnected world. Upper Saddle River, NJ: Prentice Hall.
Anastasi, A. (1988). Psychological testing (6th ed.). New York: Macmillan Publishing. Anderson, J. C. (1987). An approach for confirmatory measurement and structural
equation modeling of organizational properties. Management Science, 33, 525-541.
Anderson, P. A. and Rubin, L. G. (1986). Marketing communications. Sydney: Prentice Hall.
Andres, H. P. (1996). The impact of communication medium on software development performance: A comparison of face-to-face and virtual teams. Paper presented at the Second Americas Conference on Information Systems, Phoenix, Arizona, August 16-18. Angehrn, A. (1997). The strategic implications of the Internet. [Online]. Available at. http://www.insead.fr/CALT/publication/icdt/strategicimplication.htm. Arnold, M. B. (1960). Emotion and personality. Volume 1. Psychological aspects. New
York: Columbia University Press.
226
Aron, A. and Aron, E. N. (1994). Statistics for psychology. Sydney: Prentice Hall. Balabanis, G. and Reynolds, N. L. (2001). Consumer attitudes towards multi-channel retailers' Web sites: The role of involvement, brand attitude, Internet knowledge and visit duration. Journal of Business Strategies, 18(2), 105-131. Bales, R. F. (1950). Interaction process analysis. Reading, MA: Addison-Wesley. Bandura, A. (1977). Self-efficacy: Toward a unifying theory of behavioral change. Psychological Review, 84(2), 191-215. Bandura, A. (1982). Self-efficacy mechanism in human agency. American Psychologist, 37(2), 122-147. Bandura, A. (1994). Self-efficacy. In V. S. Ramachaudran (Ed.), Encyclopedia of Human Behavior (Vol. 4, pp. 71-81). New York: Academic Press. Bannon, L. (1997). Activity theory. [Online]. Available at. http://www-sv.cict.fr/cotcos/ pjs/TheoreticalApproaches/Activity/ActivitypaperBannon.htm. Bannon, L. J. and Bodker, S. (1991). Beyond the interface: Encountering artifacts in use. In J. Carroll (Ed.), Designing interaction: Psychology at the human- computer interface (pp. 227-253). New York: Cambridge University Press. Baron, R. M. and Kenny, D. A. (1986). The moderator-mediator distinction in social psychological research: Conceptual, strategic, and statistical considerations. Journal of Personality and Social Psychology, 51(6), 1173-1182. Barton, B. F. and Barton, M. S. (1985). Toward a rhetoric of visuals for the computer
era. The Technical Writing Teacher, 12(2), 126-145. Bates, J. (1994). The role of emotion in believable agents. Communications of the ACM, 37(7), 122-125. Batra, R. and Ray, M. L. (1986). Affective responses mediating acceptance of
advertising. Journal of Consumer Research, 13(September), 234-249. Bearden, W. O., Netemeyer, R. G., and Teel, J. E. (1989). Measurement of consumer
susceptibility to interpersonal influence. Journal of Consumer Research, 15(March), 473-481.
Becker, L. A. (1999). Crosstab: Kappa. [Online]. Available at. http://www.uccs.edu/becker/spss/ctabk.htm.
Belch, G. E. and Belch, M. A. (1999). Advertising and promotion: An integrated marketing communications perspective (4th ed.). New York: Irwin McGraw- Hill. Benschop, A. (1997). Peculiarities of cyberspace: Building blocks for an Internet Sociology. [Online]. Available at. http://www2.fmg.uva.nl/sociosite/websoc/indexE.html. Berelson, B. (1952). Content analysis in communication research. New York: Hafner
Press. Berners-Lee, T. (1989). Information management: A proposal. [Online]. Available at. http://www.w3.org/History/1989/proposal.html. Berlo, D. K. (1960). The process of communication: An introduction to theory and practice. New York: Holt, Rinehart and Winston. Berthon, P. (1996). The World Wide Web as an advertising medium: Toward an understanding of conversion efficiency. Journal of Advertising Research, 36(1), 43-54. Berthon, P., Pitt, L., Katsikeas, C. S., and Berthon, J. P. (1999). Virtual services go International: International services in the marketspace. Journal of International Marketing, 7(3), 84-105.
227
Berthon, P., Pitt, L., and Prendergast, G. (1997). Visits, hits, caching and counting on the World Wide Web: Old wine in new bottles? Internet Research: Electronic Networking Applications and Policy, 7(1), 5-8. Bezjian-Avery, A., Calder, B., and Iacobucci, D. (1998). New media interactive advertising vs. traditional advertising. Journal of Advertising Research, 38(4), 23-32. Bieber, M. and Isakowitz, T. (1995). Designing hypermedia applications. Communications of the ACM, 38(8), 26-29. Biocca, F. (1997). Cyborg's dilemma: Progressive embodiment in virtual environments. Journal of Computer-Mediated Communication, 3(3), [Online]. Available at. http://www.ascusc.org/jcmc/vol3/issue2/biocca2.html. Blattberg, R. C. and Deighton, J. (1991). Interactive marketing: Exploring the age of
addressibility. Sloan Management Review, 33(1), 5-14. Blumberg, B. and Galyean, T. (1995.). Multi-level control of autonomous animated creatures for real-time virtual environments. Paper presented at the SIGGRAPH '95, Los Angeles, CA, August 6-11. Blumler, J. G. (1979). The role of theory in uses and gratifications studies. Communication Research, 6(1), 9-36. Bocker, M. and Muhlbach, L. (1993). Communicative presence in
videocommunications. Paper presented at the Human Factors and Ergonomics Society 37th Annual Meeting, Santa Monica, CA, October 11-15.
Bolen, W. H. (1981). Advertising. New York: John Wiley & Sons. Bone, P. F. and Ellen, P. S. (1992). The generation and consequences of
communication-evoked imagery. Journal of Consumer Research, 19(June), 93-104.
Boone, L. E. and Kurtz, D. C. (1992). Contemporary marketing (7th ed.). Sydney: The Dryden Press. Boruch, R. F. (2001). Experimental design: Randomization and social experiments. The International Encyclopedia of the Social and Behavioral Sciences. [Online]. Available at. http://www.iesbs.com. Boudourides, M. A. (1995). Social and psychological effects in computer-mediated communication. Paper presented at the 2nd Workshop/Conference Neties '95, Greece, October 12-13. Bouvin, D. D. (2000). Web site design: A comparison of perceptions for a simulated university's Web-based intranet. Unpublished Doctoral Dissertation, University of Sarasota. Boyd, H. W., Walker, O. C., and Rarreche, J. (1995). Marketing management: A strategic approach with a global orientation (2nd ed.). Sydney: Irwin. Brassington, F. and Pettitt, S. (1997). Principles of marketing. Harlow, England:
Financial Times/Prentice Hall. Briggs, R. and Hollis, N. (1997). Advertising on the Web: Is there response before click through? Journal of Advertising Research, 37(2), 33-45. Brown, S. P. and Stayman, D. M. (1992). Antecedents and consequences of attitude
toward the ad: A meta-analysis. Journal of Consumer Research, 19(June), 34-51.
Bruner, II. G. C. and Kumar, A. (2000). Web commercials and advertising hierarchy- of-effects. Journal of Advertising Research, 40(1), 35-42. Bryman, A. (1989). Research methods and organization studies. Sydney: Unwin Hyman.
228
Burgoon, J. and Hale, J. (1987). Validation and measurement of the fundamental themes of relational communication. Communication Monographs, 54, 19-41. Burnett, J. J. (1993). Promotion management. Boston, MA: Houghton Mifflin Company. Burton, J., Moore, M., and Holmes, G. (1995). Hypermedia concepts and research: An overview. Computers and Human Behavior, 11(3-4), 345-369. Bush, A. J., Bush, V., and Harris, S. (1998). Advertiser perceptions of the Internet as a marketing communications tool. Journal of Advertising Research, 38(2), 17- 27. Cacioppo, J. T., Harkins, S. G., and Petty, R. E. (1981). Attitude, cognitive response and
behavior. In R. E. Petty, T. M., Ostrom, and T. C. Brock (Eds.), Cognitive responses in persuasion (pp. 31-77). New Jersey: Hillsdale.
Cairns, R. B. (1979). Social interactional methods: An introduction. In R. B. Cairns (Ed.), The analysis of social interactions: Methods, issues, and illustrations (pp. 1-9). Hillsdale, N J: Lawrence Erlbaum. Calder, B. J. and Tybout, A. M. (1999). A vision of theory, research, and the future of
business schools. Journal of the Academy of Marketing Science, 27(3), 359-366. Campbell, D. T., and Fiske, D. (1959). Convergent and discriminant validation by the
multitrait-multimethod matrix. Psychological Bulletin, 56(2), 81-105. Canary, D. J. and Hause, K. S. (1993). Is there any reason to research sex differences in communication? Communication Quarterly, 41(2), 129-145. Cappel, J. J. and Myerscough, M. A. (1997). Using the World Wide Web to gain a competitive advantage. Information Strategy: The Executive's Journal, Spring, 6-13. Carlson, J. R. and Zmud, R. W. (1999). Channel expansion theory and the experiential nature of media richness perceptions. Academy of Management Journal, 42(2), 153-170. Cartwright, D. (1953). Analysis of qualitative material. In L. Festinger and D. Katz
(Eds.), Research methods in the behavioral sciences (pp. 421-470). New York: Holt, Rinehart and Winston.
Cassell, J. and Bickmore, T. (2002). Negotiated collusion: Modeling social language and its relationship effects in intelligent agents. User Modeling and Adaptive Interfaces, 12, 1-44. Cassidy, S. and Eachus, P. (2001). Developing the computer self-efficacy (CSE) scale: Investigating the relationship between CSE, gender and experience with computers. [Online]. Available at. http://www.chssc.salford.ac.uk/healthSci/selfeff/selfeff.htm. Cateora, P. R. (1993). International marketing (8th ed.). Burr Ridge, IL: Irwin. Chaiken, S. (1980). Heuristic versus systematic information processing and the use of
source versus message cues in persuasion. Journal of Personality and Social Psychology, 39, 752-766.
Champness, B. G. (1973a). The assessment of user reactions to confravision: II. Analysis and conclusions (Communication Studies Group Report E/73250/CH). London: University College London. Champness, B. G. (1973b). Attitude toward person-person communications media. Human Factors, 15(5), 437-447. Charney, T. R. (1996). Uses and gratifications of the Internet. Unpublished Masters Thesis, Michigan State University.
229
Chau, P. Y. K. (1996). An empirical assessment of a modified technology acceptance model. Journal of Management Information Systems, 13(2), 185-204.
Chaudhury, A., Mallick, D. N., and Rao, H. R. (2001). Web channels in e-commerce. Communications of the ACM, 44(1), 99-104. Chen, Q., Clifford, S. J., and Wells, W. D. (2002). Attitude toward the site II: New
information. Journal of Advertising Research, 42(2), 33-45. Chen, Q. and Wells, W. D. (1999). Attitude toward the site. Journal of Advertising
Research, 39(5), 27-37. Chen, S. Y. and Ford, N. J. (1997). Towards adaptive information systems: Individual
differences and hypermedia. Information Research, 3(2), [Online]. Available at. http://informationr.net/ir/3-2/paper37.html.
Chen, S. Y. and Ford, N. J. (1999). The role of individual differences and levels of learner control in hypermedia. Paper presented at the Third Human Centered Technology Postgraduate Workshop, University of Sussex, UK.
Cherry, C. (1966). On human communication: A review, survey, and a criticism (2nd ed.). Cambridge, MA: The MIT Press. Choi, Y. K. (2000). Effects of presence on the effectiveness of Web site advertising.
Unpublished Doctoral Dissertation, Michigan State University. Choi, Y. K., Miracle, G. E., and Biocca, F. (2001). The effects of anthropomorphic
agents on advertising effectiveness and the mediating role of presence. Journal of Interactive Advertising, 2(1), [Online]. Available at. http://jiad.org/vol2/no1/choi.
Chow, S. L. (1999). Convenience sample, random subject-assignment and contrast group. [Online]. Available at. http://uregina.ca/~chowsl/pub_papers/Wilcomm.htm.
Chu, S. W. (1999). Challenges and strategies of developing a Chinese/English bilingual Web site. Technical Communication, Second Quarter, 206-219. Churchill, G. A. J. (1999). Marketing research: Methodological foundations (7th ed.).
New York: The Dryden Press. Clark, B. H. (1997). Welcome to my parlor... Marketing Management, 5(4), 12. Clark, H. H. (1992). Arenas of language use. Chicago, IL: The University of Chicago Press. Clark, H. H. and Brennan, S. E. (1991). Grounding in communication. In L. B. Resnick, J. Lewine, and S. D. Teasley (Eds.), Perspectives on socially shared cognition (pp. 127-149). Washington, DC: American Psychological Association Press. Coakes, S. J. and Steed, L. G. (1999). SPSS: Analysis without anguish: versions 7.0,
7.5, 8.0 for Windows. Milton, Qld, Australia: John Wiley & Sons Australia. Cockburn, C. and Wilson, T. D. (1996). Business use of the World-Wide Web. International Journal of Information Management, 16(2), 83-102. Cohen, D. (1981). Consumer behavior. New York: Random House. Compeau, D. and Higgins, C. A. (1995). Computer self-efficacy: Development of a measure and initial test. MIS Quarterly, 19(2), 189-211. Compeau, D., Higgins, C. A., and Huff, S. (1999). Social cognitive theory and individual reactions to computing technology: A longitudinal study. MIS Quarterly, 23(2), 145-158. Cox, D. S. and Locander, W. B. (1987). Product Novelty: Does It Moderate the
Relationship Between Ad Attitudes and Brand Attitudes? The Journal of Advertising, 16(3), 39-45.
230
Craig, R. T. (1999). Communication theory as a field. Communication Theory, 9(2), 119-161. Culter, R. H. (1995). Distributed presence and community in cyberspace. Interpersonal Computing and Technology, 3(2), 12-32. Daft, R. L. and Lengel, R. H. (1986). Organizational information requirements, media richness and structural design. Management Science, 32, 554-571. Dalal, N. P., Quible, Z., and Wyatt, K. (2000). Cognitive design of home pages: An experimental study of comprehension on the World Wide Web. Information Processing and Management, 36, 607-621. Davis, F. D. (1989). Perceived usefulness, perceived ease of use, and user acceptance of information technology. MIS Quarterly, 13(3), 319-340. Davis, F. D. (1993). User acceptance of information technology: System characteristics,
user perceptions and behavioral impacts. International Journal of Man-Machine Studies, 38(3), 475-487.
Davis, J. F. (1999). Effectiveness of Internet advertising by learning national advertisers. In D. W. Schumann and E. Thorson (Eds.), Advertising and the World Wide Web (pp. 81-97). Mahwah, NJ: Lawrence Erlbaum.
Davis, K. R. (1981). Marketing management (4th ed.). New York: John Wiley & Sons. Davis, F. D., Bagozzi, R. P., and Warshaw, P. R. (1989). User acceptance of computer technology: A comparison of two theoretical models. Management Science, 35(8), 982-1003. Day, A. (1997). A model for monitoring Web site effectiveness. Internet Research: Electronic Networking Applications and Policy, 7(2), 109-115. Deans, K. R. and McKinney, S. (1997). A presence on the Internet: The New Zealand perspective. Paper presented at the Australia and New Zealand Marketing Educators Conference (ANZMEC), Melbourne, December 1-3. December, J. (1996). A mediation on Web literacy. Computer-Mediated Communication Magazine, 3(10), [Online]. Available at. http:www.december.com/cmc/mag/1996/oct/last.html. De Greef, P. and Ijsselsteijn, W. (2000). Social presence in the PhotoShare tele- application. Paper presented at the Presence 2000 - 3rd International Workshop on Presence, Delft, The Netherlands, March 27-28. Dennis, A. R. and Kinney, S. T. (1998). Testing media richness theory in the new media: The effects of cues, feedback and task equivocality. Information Systems Research, 9(3), 256-274. Dennis, A. R. and Valacich, J. S. (1999). Rethinking media richness: Towards a theory of media synchronicity. Paper presented at the 32nd Annual Hawaii International Conference on System Sciences, Maui, Hawaii, January 3-6. Derbaix, C. M. (1995). The impact of affective reactions on attitudes toward the
advertisement and the brand: A step toward ecological validity. Journal of Marketing Research, 32(November), 470-479.
De Vaus, D. A. (1991). Surveys in social research (3rd ed.). Sydney: Allen & Unwin. De Wulf, K. (1999). The role of the seller in enhancing buyer-seller relationships:
Empirical studies in a retail context. Unpublished Doctoral Dissertation, Vlerick Leuven Gent Management School, Leuven and Gent, Belgium.
Dholakia, U. M. and Rego, L. L. (1998). What makes commercial Web pages popular?: An empirical investigation of Web page effectiveness. European Journal of Marketing, 32(7/8), 724-736.
231
Dickson, P. R. (1994). Marketing Management. Sydney: The Dryden Press. Dillon, W. R., Madden, T. J., and Firtle, N. H. (1993). Essentials of marketing research.
Homewood, IL: Irwin. Dishaw, M. T., Strong, D. M., and Bandy, D. B. (2002). Extending task-technology fit model with self-efficacy constructs. Paper presented at the 8th Americas Conference on Information Systems (AMCIS2002), Dallas, TX, August 8-11. Doll, W. J. and Torkzadeh, G. (1988). The measurement of end-user computing
satisfaction. MIS Quarterly, (June), 259-274. Duncan, T. and Moriarty, S. E. (1998). A communication-based marketing model for managing relationships. Journal of Marketing, 62(2), 1-13. Dyer, G. (1982). Advertising as communication. London: Routledge. Eagly, A. H. and Chaiken, S. (1993). The psychology of attitudes. New York: Harcourt
Brace Jovanovich College Publishers. Eastin, M. S. and LaRose, R. (2000). Internet self-efficacy and the psychology of the digital divide. Journal of Computer-Mediated Communication, 6(1), [Online]. Available at. http://www.ascusc.org/jcmc/vol6/issue1/eastin.html. Ebersole, S. (2000). Uses and gratifications of the Web among students. Journal of Computer-Mediated Communication, 6(1). Egan, D. E. (1988). Individual differences in human-computer interaction. In M.
Helander (Ed.), Handbook of human-computer interaction (pp. 543-568). Amsterdam, Holland: Elsevier.
Ellison, M. and McGrath, G. M. (1998). Activity theory and process modelling. Paper presented at the 1998 Information Resources Management Association (International) Conference, Boston, MA, May 17-20. Ellsworth, J. H. and Ellsworth, M. V. (1997). Marketing on the Internet (2nd ed.). Brisbane: John Willey & Sons. El-Shinnawy, M. and Markus, M. L. (1998). Acceptance of communication media in organizations: Richness or feature? IEEE Transactions on Professional Communication, 41(4), 242-253. Engel, J. F., Warshaw, M. R., and Kinnear, T. C. (1991). Promotional strategy: Managing the marketing communications process (7th ed.). Burr Ridge, IL:
Irwin. Escalas, J. E., Jain, K., and Strebel, J. E. (2001). Satisfaction, frustration, and delight: A framework for understanding how consumers interact with Web sites. In O. Lee (Ed.), Internet marketing research: Theory and practice (pp. 231-251). Melbourne: IDEA Group Publishing. Esrock, S. L. and Leichty, G. B. (2000). Organization of corporate Web pages: Publics and functions. Public Relations Review, 26(3), 327-344. Fenichel, C. H. (1981). Online searching measures that discriminate among users with different types of experiences. Journal of the American Society for Information Science, 32, 23-32. Fernyhough, C. (1996). The dialogic mind: A Dialogic approach to the higher mental functions. New Ideas in Psychology, 14(1), 47-62. Field, A. (2000). Discovering statistics using SPSS for Windows. Thousand Oaks, CA:
SAGE. Fill, C. (1995). Marketing communications: Frameworks, theories and applications. Sydney: Prentice Hall. Fiske, J. and Hartley, J. (1978). Readings television. London: Methuen.
232
Fogg, B. J. (1999). Persuasive technologies. Communication of the ACM, 42(5), 26- 29. Frijda, N. H. (1970). Emotion and recognition of emotion: The Loyola symposium. In
M. B. Arnold (Ed.), Feelings and emotions (pp. 241-250). New York: Academic Press.
Frijda, N. H. (1986). The emotions. New York: Cambridge University Press. Fuller, M. and Jenkins, H. (1995). Nintendo and new world travel writing: A dialogue. In S. G. Jones (Ed.), Cybersociety: Computer-Mediated Communication and Community (pp. 52-72). Thousand Oaks, CA: Sage. Gahagan, J. (1975). Interpersonal and group behaviour. London: Methuen. Garrison, D. R., Anderson, T., and Archer, W. (2001). Critical thinking, cognitive presence, and computer conferencing in distance education. The American Journal of Distance Education, 15(1), 7-23. Garson, G. D. (2001). Factor analysis. [Online]. Available at.
http://www2.chass.ncsu.edu/garson/pa765/factor.htm. Gebotys, R. (2001). Handout on validity. [Online]. Available at.
http://www.wlu.ca/~wwwpsych/gebotys/book/newvalidity.pdf. Gefen, D. and Straub, D. (2000). The relative importance of perceived ease-of-use in IS
adoption: A study of e-commerce adoption. Journal of the Association for Information Systems, 1(October), 1-28.
Gerbner, G. (1977). Comparative cultural indicators. In G. Gerbner (Ed.), Mass media policies in changing cultures (pp. 199-205). New York: John Wiley & Sons. Ghose, S. and Dou, W. (1998). Interactive functions and their impacts on the appeal of Internet presence sites. Journal of Advertising Research, 38(2), 29-43. Gilroy, F. D. and Desai, H. B. (1986). Computer anxiety: Sex, race, and age. International Journal of Man-Machine Studies, 25, 711-719. Gindis, B. (1995). Disabled child in the sociocultural milieu: Vygotsky's quest. School Psychology International, 16(2), 155-166. Goldschmidt, P. and Tan, C. (1999). A model for the adoption of agent technology. Paper presented at the 2nd Western Australian Workshop on Information Systems Research (WAWISR 1999), Perth, Australia, November 27. Goldsmith, R. E. and Lafferty, B. A. (2002). Consumer response to Web sites and their
influence on advertising effectiveness. Internet Research: Electronic Networking Applications and Policy, 12(4), 318-328.
Goldsmith, R. E., Lafferty, B. A., and Newell, S. J. (2000). The impact of corporate credibility and celebrity credibility on consumer reaction to advertisements and brands. The Journal of Advertising, 26(3), 44-54.
Gorden, R. (1992). Basic interviewing skills. Itasca, IL: F. E. Peacock. Gouldner, A. W. (1960). The norm of reciprocity: A preliminary statement. American Sociological Review, 25(2), 161-178. Granieri, J. P., Becket, W., Reich, B. D., Crabtree, J., and Badler, N. I. (1995). Behavioral control for real-time simulated human agents. Paper presented at the Symposium on Interactive 3D Graphics, Monterrey, CA, April 9-12. Graziano, A. M. and Raulin, M. L. (1999). Random number generator program.
[Online]. Available at. http://www.uwinnipeg.ca/~mhalldor/ 2102%20CD20Supplement/handouts/random.htm. Gray, P. (1991). Psychology. New York: Worth Publishers.
233
Griffith, D. A. and Krampf, R. F. (1998). An examination of the Web-based strategies of the top 100 U.S. retailers. Journal of Marketing Theory and Practice, 6(3), 12-23. Griffith, T. L., Tansik, D. A., and Benson, L. I. (2002). Negotiating technology implication: An empirical investigation of a World Wide Web. Group Decision and Negotiation, 11, 1-22. Guy, R. F., Edgley, C. E., Arafat, I., and Allen, D. E. (1987). Social research methods: Puzzles and solutions. Sydney: Allyn and Bacon. GVU (Georgia Tech Graphics, Visualization, and Usability Center). (1998). GVU's 10th WWW user survey. [Online]. Available at. http://www.gvu.gatech.edu/user_surveys/survey-1998-10. Hair, J. F. J., Anderson, R. E., Tatham, R. L., and Black, W. C. (1995). Multivariate
data analysis with readings (4th ed.). Sydney: Prentice Hall. Hair, J. F. J., Bush, R. P., and Ortinau, D. J. (2000). Marketing research: A practical
approach for the new millennium. Sydney: Irwin McGraw-Hill. Hall, S. (1980). Encoding/decoding. In S. Hall (Ed.), Culture, media, language: Working papers in cultural studies, 1972-79 (pp. 129-138). Sydney: Hutchinson. Hallahan, K. (2001). Improving public relations web sites through usability research. Public Relations Review, 27, 223-239. Hamilton, C. J. (1995). Beyond sex differences in visuo-spatial processing: The impact of gender trait possession. British Journal of Psychology, 86(1), 1-20. Hamilton, M. and Luo, R. (1999). Impact of animation and complexity on Web site effectiveness. Paper presented at the Third International Cognitive Technology Conference, CT '99, San Francisco/Sillicon Valley, August 11-14. Hare, A. P. (1960). The dimensions of social interaction. Behavioral Science, 5, 211- 215. Harris, J., Pryor, J., and Adams, S. (1997). The challenge of intercoder agreement in qualitative inquiry [Online]. Available at. http://emissary.ots.utexas.edu/emissary/publications.html. Hasan, H. (1998). Integrating and HCI using activity theory as a philosophical and theoretical basis. The Australian Journal of Information Systems, 6(2). Hasan, H. (1999). The mediating role of technology in making sense of information in a knowledge-intensive industry. Knowledge and Process Management, 6, 72-82. Hawkins, D., Neal, C., Quester, P., and Best, R. (1998). Consumer behaviour: Implications for marketing strategy. Sydney: McGraw-Hill. Heath, T. B. and Gaeth, G. J. (1994). Theory and method in the study of ad and brand attitudes: Toward a systemic model. In E. M. Clark, T. C. Brock, and D. W. Stewart (Eds.), Attention, attitude, and affect in response to advertising (pp. 125 - 148). Hillsdale, NJ: Erlbaum. Heeter, C. (1995). Communication research on consumer VR. In F. Biocca and M. R. Levy (Eds.), Communication in the age of virtual reality (pp. 191-218). Hillsdale, NJ: Lawrence Erlbaum Associates. Heim, M. (1993). The metaphysics of virtual reality. New York: Oxford University Press. Hiltz, S. R. and Johnson, K. (1990). User satisfaction with computer-mediated communication systems. Management Science, 36(6), 739-751.
234
Hiltz, S. R. and Turoff, M. (1978). The networked nation. Reading, MA: Addison Wesley. Hirsh, S. G. (1997). How do children find information on different types of tasks? Children's use of the science library catalog. Library Trends, 45(4), 725-745. Hofacker, C. F., & Murphy, J. (1998). World Wide Web banner advertising copy testing. European Journal of Marketing, 32(7/8), 703-712. Hoffman, D. L. and Novak, T. P. (1996). Marketing in hypermedia computer-mediated environments: Conceptual foundations. Journal of Marketing, 60(3), 50-68. Hoffman, D. L., & Novak, T. P. (2000). How to acquire customers on the Web. Harvard Business Review, May/June, 179-188. Hoffman, D. L., Novak, T. P., and Chatterjee, P. (1995). Commercial scenarios for the Web: Opportunities and challenges. Journal of Computer-mediated Communication, 1(Special Issue on Electronic Commerce). Hoger, E. A., Cappel, J. J., and Myerscough, M. A. (1998). Navigating the Web with a typology of corporate uses. Business Communication Quarterly, 61(2), 39-47. Holbrook, M. B. (1978). Beyond attitude structure: Toward the informational
determinants of attitude. Journal of Marketing Research, 4(15), 545-556. Holsti, O. R. (1969). Content analysis for the social sciences and humanities. Sydney:
Addison-Wesley Publishing. Hong, W., Thong, J. Y. L., Wong, W., and Tam, K. (2001-2002). Determinants of user
acceptance of digital libraries: An empirical examination of individual differences and system characteristics. Journal of Management Information Systems, 18(3), 97-124.
Horton, W. K. (1990). Designing and writing online documentation: Help files to hypertext. New York: Wiley Sons. Hoey, C. (2000). Maximizing marketing effectiveness through computer-mediated communication. In B. Bruce, M. Cross, T. Duncan, C. Hoey, and M. Wills (Eds.), e-volution.com: Prestoungrange University Press. Hu, P. J., Chau, P. Y. K., Sheng, O. R. L., and Tam, K. Y. (1999). Examining the
technology acceptance model using physician acceptance of telemedicine technology. Journal of Management Information Systems, 16(2), 91-112.
Huang, H. (1999). The persuasion, memory and social presence effects of believable agents in human-agent communication. Paper presented at the Third International Cognitive Technology Conference, CT'99, San Francisco/ Silicon Valley, August 11-14. Hughes, M. A. and Garrett, D. E. (1990). Intercoder reliability estimation approaches in
marketing: A generalizability theory framework for quantitative data. Journal of Marketing Research, 27(2), 185-195.
Huizingh, E. K. R. E. (2000). The content and design of Web sites: An empirical study. Information & Management, 37, 123-134. Hunt, S. D., Sparkman, R. D., and Wilcox, J. B. (1982). The pretest in survey research: Issues and preliminary findings. Journal of Marketing Research, 19(May), 269- 273. Ijsselsteijn, W., Ridder, H. d., Freeman, J., and Avons, S. E. (2000). Presence: Concept,
determinants and measurement. Paper presented at the SPIE, Human Vision and Electronic Imaging V, 3959-76, San Jose, CA, January 23-28.
Jaccard, J. and Becker, M. A. (1990). Statistics for the behavioral sciences. Belmont, CA: Wadworth.
235
Jackson, M. H. (1997). Assessing the structure of communication on the World Wide Web. Journal of Computer-Mediated Communication, 3(1). Jacobson, T. and Fusani, D. (1992). Computer, system, and subject knowledge in novice searching of a full-text, multifile database. Library and Information Science Research, 14, 97-106. Jain, S. C. (1993). Marketing planning & strategy (4th ed.). Cincinnati, OH: South- Western Publishing Co. Johnson, B. T. and Eagly, A. H. (1989). Effects of involvement on persuasion: A meta-
analysis. Psychological Bulletin, 106, 290-314. Jonassen, D. H. (1988). Designing structured hypertext, and structuring access to hypertext. Educational Technology, 28(11), 13-16. Jonassen, D. H. and Grabinger, R. (1990). Problems and issues in designing hypertext/hypermedia for learning. In D. H. Jonassen and H. Mandel (Eds.), Designing hypermedia for learning (pp. 3-26). London: Springer-Verlag. Ju-Pak, K. H. (1999). Content dimension of Web advertising: A cross-national comparison. International Journal of Advertising, 18, 207-231. Kalwani, M. U. and Silk, A. J. (1982). On the Reliability and Predictive Validity of
Purchase Intention Measures. Marketing Science, 1(3), 243-286. Kaptelinin, V. (1996). Activity theory: Implications for human-computer interaction. In
B. Nardi (Ed.), Context and consciousness: Activity theory and human-computer interaction (pp. 107-110). Cambridge, MA: MIT Press.
Kayany, J. M. and Yelsma, P. (2000). Displacement effects of online media in the socio-technical contexts of households. Journal of Broadcasting & Electronic Media, 44(2), 215-229. Kaye, B. K. (1998). Uses and gratifications of the World Wide Web: From couch potato to Web potato. The New Jersey Journal of Communication, 6(1), 21-40. Keil, M., Beranek, P. M., and Konsynski, B. R. (1995). Usefulness and ease of use:
Field study evidence regarding task considerations. Decision Support Systems, 13, 75-91.
Kerlinger, F. N. (1964). Foundations of behavioral research: Educational and psychological inquiry. New York: Holt, Rinehart and Winston. Kiesler, S., Zubrow, D., Moses, A. M., and Geller, V. (1985). Affect in computer- mediated communication: An experiment in synchronous terminal-to-terminal discussion. Human Computer Interaction, 1(1), 77-104. Kim, T. and Biocca, F. (1997). Telepresence via television: Two dimensions of
telepresence may have different connections to memory and persuasion. Journal of Computer-Mediated Communication, 3(2), [Online]. Available at. http://www.ascusc.org/jcmc/vol3/issue2/kim.html.
King, J. M., Knight, P., and Mason, J. H. (1997). Web marketing cookbook. New York: Wiley Computer Publishing. Kitchen, P. J. (1993). Towards the integration of marketing and public relations. Marketing Intelligence & Planning, 11(11), 15-21. Klastorin, T. D. (1983). Assessing cluster analysis results. Journal of Marketing Research, 20(February), 92-98. Koehler, W. (1999). An analysis of Web page and Web site constancy and permanence.
Journal of the American Society for Information Science, 50(2), 162-180. Kolacz, H. (2002). Statistics 252: Multiple regression. [Online]. Available at.
http://www.stat.ualberta.ca/~kolacz/stat252/childmupage.html.
236
Kolbe, R. H. and Burnett, M. S. (1991). Content-analysis research: An examination of applications with directives for improving research reliability and objectivity. Journal of Consumer Research, 18(September), 243-250.
Korea Federation of Industries (KFI). (2001). Korean economic yearbook 2001. Seoul, Korea: FKI Media.
Kotler, P. (1994). Marketing management: Analysis, planning, implementation, and control (8th ed.). Englewood Cliffs, NJ: Prentice Hall. Kotler, P. (1999). Kotler on marketing: How to create win, and dominate markets. New York: The Free Press. Kotler, P. (2000). Marketing management: Analysis, planning, implementation, and control (10th ed.). Englewood Cliffs, NJ: Prentice Hall. Krause, C., Muller-Benedict, V., and Wisemann, U. (2000). Small children - big data.
Possible links between qualitative and quantitative methods in the analysis of self-reports. Forum: Qualitative Social Research. [Online]. Available at. http://qualitative-research.net/fqs/fqs-e/2-00inhalt_e.htm.
Krech, D. and Crutchfield, R. S. (1948). Theory and problems of social psychology. New York: McGraw-Hill. Krech, D. and Crutchfield, R. S. (1965). Elements of psychology. New York: Alfred A. Knopf. Kreijns, K. and Gerrissen, J. (1999). Presence and awareness support in virtualbusiness teams. Paper presented at the 29th ASEE/IEEE Frontiers in Education Conference, San Juan, Puerto Rico, November 10-13. Kubey, R. and Larson, R. (1990). The use and experience of the new video media
among children and young adolescents. Communication Research, 17(1), 107-130.
Kubiszyn, T. and Borich, G. (1990). Educational testing and measurement: Classroom application and practice (3rd ed.). Glenview, IL: Scott, Foresman and Company.
Kuehn, T. (1993). Communication innovation on a BBS: A content analysis. International Computing and Technology: An Electronic Journal for the 21st Century, 1(2), [Online]. Available at. http://jan.ucc.nau.edu/~ipct/1993/n1992/kuehn.txt. Kurlander, D. and Ling, D. T. (1995). Planning-based control of interface animation. Paper presented at the CHI '95 Conference, Denver, Colorado, May 7-11. Lamb, C. W., Hair, J. F. J., and McDaniel, C. (1996). Marketing (3rd ed.). Cincinnati, OH: South-Western Publishing. Landis, J. R. and Koch, G. G. (1977). The measurement of observer agreement for
categorical data. Biometrics, 33(March), 159-174. Landoni, M. and Gibb, F. (2000). The role of visual rhetoric in the design and production of electronic books: The visual book. The Electronic Library, 18(3), 190-201. Landow, G. P. (1992). Hyper text: The convergence of contemporary critical theory and technology. Baltimore, MD: The Johns Hopkins University Press. Lanham, R. A. (1993). The Electronic Word: Democracy, technology, and the arts. Chicago, IL: University of Chicago Press. Laskey, H. A., Fox, R. J., and Crask, M. R. (1994). Investigating the impact of executional style on television commercial effectiveness. Journal of Advertising Research, 34(6), 9-16.
237
Lauer, R. H. and Handel, W. H. (1977). Social psychology: The theory and application of symbolic interactionism. Boston: Houghton Mifflin Company. Lavidge, R. J. and Steiner, G. A. (1961). A model for predictive measurements of advertising effectiveness. Journal of Marketing, 25(October), 59-62. Lazonder, A. W., Biemans, J. A., and Wopereis, I. G. J. H. (2000). Differences between novice and experienced users in searching information on the World Wide Web. Journal of the American Society for Information Science, 51(6), 576- 581. Leiss, W., Kline, S., and Jhally, S. (1986). Social communication in advertising. Sydney: Methuen. Leong, E. K. F., Huang, X., and Stanners, P. (1998). Comparing the effectiveness of the Web site with traditional media. Journal of Advertising Research, 38(5), 44- 51. Lester, J. C., Voerman, J. L., Towns, S. G., and Callaway, C. B. (1999). Deictic
believability: Coordinated gesture, locomotion, and speech in lifelike pedagogical agents. Applied Artificial Intelligence, 13, 383-414.
Li, H. and Bukovac, J. L. (1999). Cognitive impact of banner ad characteristics: An experimental study. Journalism & Mass Communication Quarterly, 76(2), 341-353.
Li, H., Kuo, C., and Russell, M. G. (1999). The impact of perceived channel utilities, shopping orientations, and demographics on the consumer's online buying behavior. Journal of Computer-Mediated Communication, 5(2). Licht, M. H. (1997). Multiple regression and correlation. In L. G. Grimm and P. R.
Yarnold (Eds.), Readings and understanding multivariate statistics (pp. 19-64). Washington, DC: American Psychological Association.
Littlejohn, S. W. (1983). Theories of human communication (2nd ed.). Belmont, CA: Wadsworth Publishing. Liu, C., Arnett, K. P., Capella, L. M., and Beatty, R. C. (1997). Web sites of the Fortunes 500 companies: Facing customers through home pages. Information & Management, 31, 335-345. Loiacono, E. T., Chen, D. Q., and Goodhue, D. L. (2002). WebQual revisited:
Predicting the intent to revisit a Web site. Paper presented at the 8th Americas Conference on Information Systems (AMCIS), Dallas, TX, August 9-11.
Loiacono, E. T., Watson, R. T., and Goodhue, D. L. (2002). Webqual: A measure of Website quallity. Paper presented at the American Marketing Association: Winter Marketing Educators' Conference, Austin, Texas.
Lombard, M. (1995). Direct responses to people on the screen: Television and personal space. Communication Research, 22(3), 288-324. Lombard, M. and Ditton, T. (1997). At the heart of it all: The concept of presence. Journal of Computer-Mediated Communication, 3(2), [Online]. Available at. http://www.ascusc.org/jcmc/vol3/issue2/lombard.html. Losee, R. M. (1999). Communication defined as complementary informative processes. Journal of Information, Communication and Library Science, 5(3), 1-15. Lovelock, C. H. (1991). Service Marketing (2nd ed.). Englewood Cliffs, NJ: Prentice Hall. Lowe, D. and Hall, W. (1999). Hypermedia and the Web: An engineering approach. Chichester: John Wiley. Luo, X. (2002). Uses and gratifications theory and e-consumer behaviors: A structural
238
equation modeling study. Journal of Interactive Advertising, 2(2). Lutz, R. J. (1985). Affective and cognitive antecedents of attitude toward the ad: A
conceptual framework. In L. F. Alwitt and A. A. Mitchell (Eds.), Psychological processes and advertising effects: Theory, Research and Application (pp. 45-63). Hillsdale, NJ: Lawrence Erlbaum Associates.
Lynch, J. G. J. (1999). Theory and external validity. Journal of the Academy of Marketing Science, 27(3), 367-376.
MacKenzie, S. B., Lutz, R. J., and Belch, G. E. (1986). The role of attitude toward the ad as a mediator of advertising effectiveness: A test of competing explanations. Journal of Marketing Research, 23(2), 130-144.
Maes, P., Blumburg, B., Darrell, T., and Pentland, A. (1995). The ALIVE system: Full- body interaction with autonomous agents. Paper presented at the IEEE Computer Animation `95, Geneva, Switzerland, April 19-21. Malhotra, N. K., Hall, J., Shaw, M., and Crisp, M. (1996). Marketing research: An
applied orientation. Sydney: Prentice Hall. Mantovani, F. (2001). Cyber-attraction: The emergence of computer-mediated communication in the development of interpersonal relationships. In L. Anolli, R. Ciceri and G. Riva (Eds.), Say not to say: New perspectives on miscommunication (pp. 236-252). Amsterdam: IOS Press. Mappin, D. A. (2000). EDPY 597: Advanced instructional design. [Online]. Available at. http://www.quasar.ualberta.ca/edpy597/Modules.module15.html. Marcolin, B. L., Compeau, D. R., Munro, M. C., and Huff, S. L. (2000). Assessing user competence: Conceptualization and measurement. Information Systems Research, 11(1), 37-60. Markham, A. (1998). Life online: Researching real experience in virtual space. Walnut Creek, CA: Altamira Press. Mason, R. (1994). Using communications media in open and flexible learning. London: Cogan Page. McBride, N. (1997). Business use of the Internet: Strategic decision or another bandwagon? European Management Journal, 15(1), 58-67. McCready, K. (1997). Designing and redesigning: Marquette libraries' Web site. Library Hi Tech, 15(3-4), 83-89. McCroskey, M. and Young, T. (1979). The use and abuse of factor analysis in
communication research. Human Communication Research, 4, 375-382. McDaniel, C. J. and Gates, R. (1993). Contemporary marketing research (2nd ed.).
New York: West Publishing. McDonald, C. (1993). The key is to understand consumer response. Journal of
Advertising Research, 33(5), 63-69. McDonald, M. H. B. (1984). Marketing plans: How to prepare them, hot to use them. London: Heinemann. McDonald, S. and Stevenson, R. J. (1998). Navigation in hyperspace: An evaluation of the effects of navigation tools and subject matter expertise on browsing and information retrieval in hypertext. Interacting with Computers, 10, 129-142. McDowell, W. and Sutherland, J. (2000). Choice versus chance: Using brand equity theory to explore TV audience lead-in effects, A case study. The Journal of Media Economics, 13(4), 233-247. McGrath, G. M. (1991). Time , interaction, and performance (TIP): A theory of groups. Small Group Research, 22(2), 147-174.
239
Mclassac, M. S. and Gunawardena, C. N. (1996). Distance education. In D. H. Jonassen (Ed.), Handbook of research for educational communications and technology (pp. 457-487). New York: Macmillan Library Reference. McLellan, H. (1996). Virtual realities. In D. H. Jonassen (Ed.), Handbook of research for educational communications and technology (pp. 457-487). New York: Macmillan Library Reference. McNaughton, R. B. (2001). A typology of the Web site objectives in high technology business markets. Marketing Intelligence & Planning, 19(2), 82-87. McQuail, D. (1989). Functions of communication: A nonfunctionalist overview. In C. R. Berger and S. H. Chaffee (Eds.), Handbook of communication science (pp. 327-349). Newbury Park, CA: Sage. McQuarrie, E. F., and Mick, D. G. (1999). Visual rhetoric in advertising: Text- interpretive, experimental, and reader-response analyses. Journal of Consumer Research, 26(June), 37-54. Mehta, A. and Purvis, S. C. (1997). Evaluating advertising effectiveness through
advertising response modeling. In W. D. Wells (Ed.), Measuring advertising effectiveness (pp. 325-334). Mahwah, NJ: Lawrence Erlbaum.
Mercer, D. (1999). Marketing: The encyclopedic dictionary. Oxford: Blackwell Business. Miles, M. B. and Huberman, A. M. (1994). Qualitative data analysis (2nd ed.).
Thousand Oaks, CA: Sage Publications. Miltenoff, P. (1999). Computer-mediated communication. [Online]. Available at.
http://tigger.stcloudstate.edu/~pmiltenoff/class420/page4.html. Mitchell, A. A. and Olson, J. C. (1981). Are product attribute beliefs the only mediator
of advertising effects on brand attitude? Journal of Marketing Research, 18(August), 318-332.
Momani, A., Odedina, F., Rosenbluth, S., and Madhavan, S. (2000). Drug-management strategies: Consumers' perspectives. Journal of Managed Care Pharmacy, 6(2), 122-128.
Moon, J. and Kim, Y. (2001). Extending the TAM for a World-Wide-Web context. Information & Management, 38, 217-230.
Moore, G. C. and Benbasat, I. (1991). Development of an instrument to measure the perceptions of adopting an information technology innovation. Information Systems Research, 2(3), 192-222.
Moriarty, S. (1994). Visual communication as a primary system. Journal of Visual Literacy, 14(2), 11-21. Morris, J. D., Woo, C., Geason, J. A., and Kim, J. (2002). The power of affect:
Predicting intention. Journal of Advertising Research, May/June, 7-17. Morrison, A. (2002). Hospitality and travel marketing (3rd ed.). Albany, NY: Delmar Thompson Learning. Mowen, J. C. (1990). Consumer Behavior (2nd ed.). New York: Macmillan. Muehling, D. D. and Laczniak, R. N. (1992). An examination of factors mediating and
moderating advertising's effect on brand attitude formation. Journal of Current Issues and Research in Advertising, 14(1), 23-34.
Mwanza, D. (2000). Mind the gap: Activity theory and design. Paper presented at the CSCW 2000 Conference, Philadelphia, Penn, December 2-6. Nahl, D. (1996). Affective monitoring of Internet learners: Perceived self-efficacy and success. Journal of American Society for Information Sciences, 33, 100-109.
240
Nahl, D. (1997). User-centered assessment of two Web browsers: Errors, perceived self-efficacy, and success. Journal of American Society for Information Sciences, 34, 89-97. Nass, C., Moon, Y., Fogg, B. J., Reeves, B., and Dryer, D. C. (1995). Can computer personalities be human personalities? International Journal of Human- Computer Studies, 43(2), 223-239. Nass, C., Steuer, J., and Tauber, E. R. (1994). Computers are social actors. Proceedings of CHI '94, Boston, MA, April 24-28. Nicholl, T. (1998). Vygotsky. [online]. Available at. http://www.massey.ac.nz/~alock/virtual/trishvyg.htm. Nielsen, J. (1993). Hypertext and hypermedia. Sydney: Academic Press Professional. Nisbett, R. and Ross, L. (1980). Human inference: Strategies and shortcomings of social judgment. Englewood Cliffs, NJ: Prentice Hall. Novak, T. P. and Hoffman, D. L. (1997). New Metrics for new media: Toward the development of Web measurement standards. World Wide Web, 2(1), 213-246. Novak, T. P., Hoffman, D. L., and Yung, Y. (2000). Measuring the customer
experiences in online environments: A structural modeling approach. Marketing Science, 19(1), 22-44.
Nowak, K. (2001). Defining and differentiating copresence, social presence and presence as transportation. Paper presented at the Presence 2001 - The Fourth Annual International Workshop, Philadelphia, PA, May 21-23. Nowak, G. J., Shamp, S., Hollander, B., and Cameron, G. T. (1999). Interactive media:
A means for more meaningful advertising? In D. W. Schumann and E. Thorson (Eds.), Advertising and the World Wide Web (pp. 99-117). Manhwah, NJ: Lawrence Erlbaum Associates Publishers.
Nunnally, J. C. (1978). Psychometric theory (2nd ed.). New York: McGraw-Hill. Ogan, C. (1993). Listserver communication during the Gulf War: What kind of medium is the electronic bulletin board? Journal of Broadcasting and Electronic Media, 37(2), 177-196. Olaniran, B. A. (1993). Individual differences and computer mediated communication: The role of perception. The Electronic Journal of Communication, 3(2). Olney, T. J., Holbrook, M. B., and Batra, R. (1991). Consumer responses to advertising: The effects of ad content, emotions, and attitude toward the ad on viewing time. Journal of Consumer Research, 17(March), 440-453. Olson, J. C., Toy, D. R., and Dover, P. A. (1982). Do cognitive responses mediate the
effects of advertising content on cognitive structure? Journal of the Consumer Research, 9(3), 245-262.
O'Neill, M., Palmer, A., Charters, S., and Fitz, F. (2001). Service quality and consumer behavioural intention: An exploratory study from the Australian wine tourism sector. Paper presented at the Australia New Zealand Marketing Academy Conference (ANZMAC), Albany, New Zealand, December 1-5.
Palloff, R. and Pratt, K. (1999). Learning communities in cyberspace: Effective strategies for the online classroom. In R. Palloff and K. Pratt (Eds.), Defining and redefining community (pp. 21-32). San Franscisco, LA: Jossey-Bass. Palmer, J. W. and Griffith, D. A. (1998). An emerging model of Web site design for marketing. Communications of the ACM, 41(3), 45-51.
241
Palmquist, R. A. and Kim, K. (2000). Cognitive style and on-line database search experience as predictors of Web search performance. Journal of the American Society for Information Science, 51(6), 558-566. Papacharissi, Z. and Rubin, A. M. (2000). Predictors of Internet use. Journal of Broadcasting & Electronic Media, 44(2), 175-196. Patel, s. C., Drury, C. G., and Shalin, V. L. (1998). Effectiveness of expert semantic knowledge as a navigational aid within hypertext. Behavior and Information Technology, 17(6), 313-324. Patti, C. H. and McDonald, J. P. (1985). Corporate advertising: Progress, practice, and perspectives (1970-1989). The Journal of Advertising, 14(1), 42-49. Pavlou, P. A. (2003). Consumer acceptance of electronic commerce: Integrating trust and risk with the technology acceptance model. International Journal of Electronic Commerce, 7(3), 69-103. Pavlou, P. A. and Stewart, D. W. (2000). Measuring the effectiveness of interactive advertising: A research agenda. Journal of Interactive Advertising, 1(1). Penrice, D. (1995). Brand marketing - An Information-Processing Perspective. Harvard Business Review, 73(May), 13-14. Perreault, W. D. and McCarthy, E. J. (1996). Basic marketing: A global-managerial approach (12th ed.). Sydney: Irwin. Perreault, W. D. J. and Leigh, L. E. (1989). Reliability of nominal data based on qualitative judgments. Journal of Marketing Research, 26(2), 135-148. Perry, M. and Bodkin, C. (2000). Content analysis of Fortune 100 company Web sites. Corporate Communications: An International Journal, 5(2), 87-96. Peter, J. P. (1981). Construct validity: A review of basic issues and marketing practices. Journal of Marketing Research, 18, 737-748. Peter, J. P. and Olson, J. C. (1990). Consumer behavior and marketing strategy (2nd ed.). Homewood, IL: Irwin. Petty, R. E., Cacioppo, J. T., and Goldman, R. (1981). Personal involvement as a
determinant of argument-based persuasion. Journal of Personality and Social Psychology, 41, 847-855.
Pho, D. M. H. and Adam, S. (2002). An exploratory investigation of attitude toward the Web site and the advertising hierarchy of effects. Paper presented at the The Eighth Australian World Wide Web Conference, Sunshine Coast, Australia, July 6-10. Picard, R. W. (1997). Affective computing. Cambridge, MA: MIT Press. Pitt, L., Berthon, P., and Watson, R. T. (1996). From surfer to buyer on the WWW: What marketing managers might want to know. Journal of General Management, 22(1), 1-13. Punj, G. and Stewart, D. W. (1983). Cluster analysis in marketing research: Review and
suggestions for application. Journal of Marketing Research, 20 (May), 134-148. Rada, R. and Tochtermann, K. (1995). Introduction to expertmedia. In R. Rada and K. Tochtermann (Eds.), Expertmedia: Expert systems and hypermedia (pp. 3-27). London: World Scientific. Radford, G. P. (1994). Overcoming Dewey's "false psychology": Reclaiming communication for communication studies. Paper presented at the 80th Annual Meeting of the Speech Communication Association, New Orleans, Louisiana, November 19-22.
242
Rafaeli, S. and Noy, A. (2002). Online auctions, messaging, communication and social facilitation: A simulation and experimental evidence. European Journal of Information Systems, 11, 196-207. Rafaeli, S. and Sudweeks, F. (1997). Networked interactivity. Journal of Computer- Mediated Communication, 2(4), http://jcmc.huji.ac.il/vol2/issue4/rafaeli.sudweeks.html. Raman, N. V. and Leckenby, J. D. (1998). Factors affecting consumers' "Webad" visits. European Journal of Marketing, 32(7/8), 737-748. Rao, H. R., Salam, A. F., and DosSantos, B. (1998). Marketing and the Internet.
Communications of the ACM, 41(3), 32-34. Ratner, C. (1998). Historical and contemporary significance of Vygotsky's
sociohistorical psychology. In R. Riever and K. Salzinger (Eds.), Psychology: Theoretical-historical perspectives (pp. 455-473). Washington DC: American Psychological Association.
Ray, M. L. (1982). Advertising and communication management. Englewood Cliffs, NJ: Prentice Hall. Rayport, J. F. and Sviokla, J. J. (1994). Managing in the marketspace. Harvard Business Review, 72(November-December), 141-150. Rayport, J. F. and Sviokla, J. J. (1995). Exploiting the virtual value chain. Harvard Business Review, 73(November-December), 75-85. Reed, W. M. and Oughton, J. M. (1997). Computer experience and interval-based hypermedia navigation. Journal of Research on Computing in Education, 30(1), 38-52. Reeves, B. R., Detenber, B., and Steuer, J. (1993). New televisions: The effects of big
pictures and big sound on viewer responses to the screen. Paper presented at the Conference of the International Communication Association, Washington, DC, May 25.
Reeves, B. and Nass, C. (1996). The media equation: How people treat computers, televisions, and new media like real people and places. New York: Cambridge University Press. Ren, W. (1999). Self-efficacy and the search for government information. Reference & User Service Quarterly, 38, 283-291. Rheingold, H. (1993). The virtual community: Homesteading on the electronic frontier. Reading, MA: Addison-Wesley. Rice, R. E. and Love, G. (1987). Electronic emotion: Socioemotional content in a computer mediated communication network. Communication Research, 14(1), 85-108. Richards, J. I. And Curran, C. M. (2002). Oracles on advertising: Searching for a definition. The Journal of Advertising, 31(2), 63-77. Riva, G. and Galimberti, C. (1997). The psychology of cyberspace: A socio-cognitive framework to computer-mediated communication. New Ideas in Psychology, 15(2), 141-158. Riva, G. and Galimberti, C. (1998). Computer-mediated communication: Identity and social interaction in an electronic environment. Genetic, Social and General Psychology Monographs, 124, 434-464. Rix, P. and Stanton, W. J. (1998). Marketing: A practical approach. Sydney: McGraw- Hill. Rogers, E. M. (1986). Communication technology: The new media in society. New
243
York: The Free Press. Ross, R. (1973). Communication, symbols, and society. In J. D. Cardwell (Ed.), Readings in social psychology: A symbolic interaction perspective (pp. 3-18). Philadelphia: F. A. Davis Company. Rourke, L. and Anderson, T. (2002). Using peer teams to lead online discussions.
Journal of Interactive Media in Education, 1, 1-21 Available at http://www-jime.open.ac.uk.
Rourke, L., Anderson, T., Garrison, D. R., and Archer, W. (1999). Assessing social presence in asynchronous text-based computer conferencing. Journal of Distance Education, 14(2), 51-70. Rourke, L., Anderson, T., Garrison, D. R., and Archer, W. (2001). Methodological issues in the content analysis of computer conference transcripts. International Journal of Artificial Intelligence in Education, 12, 8-22. Rubin, A. M. (1993). Audience activity and media use. Communication Monographs, 60(1), 98-105. Runyon, K. E. (1984). Advertising (3rd ed.). New York: Charles E. Merrill Publishing. Rust, R. T. and Oliver, R. W. (1994). The death of advertising. The Journal of
Advertising, 23(4), 71-77. Ryder, M. (1998). The World Wide Web and the dialectics of consciousness. Paper
presented at the 4th Congress of the International Society for Cultural Research and Activity Theory, Aarhus, Denmark, June 7-11.
Ryder, M. (2001). What is activity theory? [Online]. Available at. http://carbon.cudenver.edu/~mryderlitic_data/act_dff.html.
Saito, A. (1996). Social origins of cognition: Bartlett, evolutionary perspective and embodied mind approach. Journal for the Theory of Social Behaviour, 26(4), 399-422. Salam, A. F., Rao, H. R., and Pegels, C. C. (1998). Content of corporate Web pages as advertising media. Communications of the ACM, 41(3), 76-77. Sankaranarayanan, J. B., Bhor, M., and Murawski, M. (2002). Item reduction of a new
pharmaceutical therapy related quality of life (PTRQOL) instrument: Factor analysis method or clinical impact method? Paper presented at the Seventh ISPOR Annual International Meeting, Crystal City, Arlington, VA, May 19-22.
Schmitz, J. and Fulk, J. (1991). Organizational colleagues, media richness, and electronic mail: A test of the social influence model of technology use. Communication Research, 18(4), 487-523. Schramm, W. (1954). How communication works. In W. Schramm (Ed.), The process and effects of mass communication (pp. 3-10). Urbana, IL: University of Illinois Press. Schubert, T., Friedmann, F., and Regenbrecht, H. (2001). The experience of presence:
Factor analytic insights. Presence: Teleoperators Virtual Environments, 10(3), 266-281.
Schutt, C. (1996). The architectonics of nature [Online]. Available at. http://www.princeton.edu/~freshman.
Scott, L. M. (1994). Images in advertising: The need for a theory of visual rhetoric. Journal of Consumer Research, 21(December), 461-480. Seddon, P. B. and Kiew, M. (1996). A partial test and development of DeLone and
McLean's model of IS success. Australian Journal of Information Systems, September, 90-109.
244
Sethi, V. and King, W. R. (1991). Construct measurement in information systems research: An illustration in strategic systems. Decision Sciences, 22(3), 455-472.
Shannon, C. and Weaver, W. (1949). The mathematical theory of communication. Urbana, IL: University of Illinois Press. Shaughnessy, J. J. and Zechmeister, E. B. (1994). Research methods in psychology (3rd
ed.). New York: McGraw-Hill. Shimp, T. A. (1997). Advertising, promotion, and supplemental aspects of integrated marketing communications (4th ed.). New York: The Dryden Press. Shiva, V. A. (1997). The Internet publicity guide: How to maximize your marketing and
promotion in cyberspace. New York: Allworth Press. Shneiderman, B. (1997). Designing information-abundant Web sites: Issues and
recommendations. International Journal of Human-Computer Studies, 47, 5-29. Short, J., Williams, E., and Christie, B. (1976). The social psychology of telecommunications. London: John Wiley & Sons. Siegel, J., Dubrovsky, V., Kiesler, S., and McGuire, T. (1986). Group processes in computer-mediated communication. Organizational Behavior and Human Decision Processes, 37, 157-187. Simeon, R. (1999). Evaluating domestic and international Web-site strategies. Internet Research: Electronic Networking Applications and Policy, 9(4), 297- 308. Simon, S. J. (2001). The impact of culture and gender on Web sites: An empirical study.
The DATA BASE for Advances in Information Systems, 32(1), 18-37. Singh, M., Balasubramanian, K., and Charkraborty, G. (2000). A comparative analysis
of three communication formats: Advertising, infomercial, and direct experience. The Journal of Advertising, 24(4), 59-75.
Singh, S. N. and Dalal, N. P. (1999). Web home pages as advertisements. Communications of the ACM, 42(8), 91-98. Sirgy, M. J. (1998). Integrated marketing communications. Upper Saddle, NJ: Prentice Hall. Solomon, M. R. (1994). Consumer behavior (2nd ed.). Sydney: Allyn and Bacon. Spears, R., & Lea, M. (1992). Social influence and the influence of the 'social' in
computer-mediated communication. In M. Lea (Ed.), Contexts of computer-mediated communication (pp. 30-65). New York: Harvester Wheatsheaf.
Spiller, P. and Lohse, G. L. (1997-8). A classification of Internet retail stores. International Journal of Electronic Commerce, 2(2), 29-56. Sproull, L. and Kiesler, S. B. (1986). Reducing social context cues: Electronic mail in organizational communication. Management Science, 32(11), 1492-1512. Stanton, W. J., Miller, K. E., and Layton, R. A. (1991). Fundamentals of marketing (2nd Australian ed.). Sydney: McGraw-Hill. Staples, D. S., Hulland, J. S., and Higgins, C. A. (1998). A self-efficacy theory explanation for the management of remote workers in virtual organizations. Journal of Computer-Mediated Communication, 3(4), [Online]. Available at. http://ascuse.org/jcmc/vol3/issue4/staples.html. Steinfield, C. W. (1986). Computer-mediated communication in an organizational setting: Explaining task-related and socioemitional uses. In M. L. McLaughlin (Ed.), Communication Yearbook 9 (pp. 777-804). Newbury Park, CA: Sage. Stemler, S. E. (2001). An Overview of Content Analysis. Practical Assessment,
Research, and Evaluation, 7(17), [Online]. Available at. http://ericae.net/pare/getvn.asp?v=7&n=17.
245
Stevens, J. P. (1992). Applied multivariate statistics for social sciences (2nd ed.). Hillsdale, NJ: Erlbaum.
Stevenson, J. S., Bruner, I., G. C., and Kumar, A. (2000). Webpage background and viewer attitudes. Journal of Advertising Research, 40(1), 29-34. Stewart, D. W. and Koslow, S. (1989). Executional factors and advertising effectiveness: A replication. The Journal of Advertising, 18(3), 21-32. Stewart, D. W. and Pavlou, P. A. (2002). From consumer response to active consumer: Measuring the effectiveness of interactive media. Journal of the Academy of Marketing Science, 30(4), 376-396. Stewart, D. W., Pavlou, P., and Ward, S. (2002). Media influences on marketing communications. In J. Bryant and D. Zillmann (Eds.), Media effects: Advances in theory and research (rev. ed., pp. 353-396). Hillsdale, NJ: Erlbaum. Storck, J. and Sproull, L. (1995). Through a glass darkly: What do people learn in videoconferences? Human Communication Research, 22(2), 197-219. Straub, D. W. (1989). Validating instruments in MIS research. MIS Quarterly, 13(2),
147-169. Strauss, J. and Frost, R. (1999). Marketing on the Internet: Principles of online
marketing. Sydney: Prentice Hall. Suh, K. (1994). The influence of claim types and execution types on advertising effect. Unpublished Masters Thesis, Korea University, Seoul, Korea. Suh, K. and Couchman, P. K. (2003). Measuring consumer responses to corporate Web sites: The development of an instrument. Paper presented at the 2003 Chartered Institute of Marketing (CIM) Inaugural Australian Conference, Sydney, Australia, August 20-22. Suh, K., Couchman, P. K., and Hasan, H. (2003). Understanding Web-mediated marketing communication: The Web acceptance model. Paper presented at the 2003 Chartered Institute of Marketing (CIM) Inaugural Australian Conference, Sydney, Australia, August 20-22. Suh, K., Couchman, P. K., and Lee, D. (2002a). Functions of a corporate Web site: A cross-national comparison. Unpublished manuscript, University of Wollongong. Suh, K., Couchman, P. K., and Lee, D. (2002b). Empirical classification of Web structure: A cross-national comparison of corporate Web sites. Unpublished manuscript, University of Wollongong. Suh, K., Couchman, P. K., and Park, J. (2002). Application of activity theory to Web- mediated marketing communications (WMC). Paper presented at the 7th Workshop on Activity Theory and Information Systems, Wollongong, Australia, September 23. Suh, K., Couchman, P. K., and Park, J. (2003). A Web-Mediated Communication (WMC) Model Based on Activity Theory. Paper presented at the 7th World Multiconference on Systemics, Cybernetic and Informatics (SCI 2003), Orlando, Florida, July 27-29, and TT21C (Transformational Tools for 21st Century Minds), Gold Coast, QLD, Australia, July 27-29.
246
Suh, K., Hasan, H., and Couchman, P. K. (2003). Web-mediated communication (WMC) and social interaction: A social psychological approach. Paper presented at the 7th World Multiconference on Systemics, Cybernetic and Informatics (SCI 2003), Orlando, Florida, July 27-29, and TT21C (Transformational Tools for 21st Century Minds), Gold Coast, QLD, Australia, July 27-29. Suh, K., Hasan, H., Couchman, P. K., and Lee D. (2003). Exploring social interaction in Web-mediated communication. In H. Hasan, I. Verenikina, and E. Gould. (Eds.), Activity theory and information systems volume 3: Expanding the horizon (pp. 141-155). Wollongong, Australia: University of Wollongong Press. Suh, K., Couchman, P. K., Park, J., and Hasan, H. (2003). The application of activity theory to Web-mediated communication. In H. Hasan, I. Verenikina, and E. Gould. (Eds.), Activity theory and systems volume 3: Expanding the horizon (pp. 122-140). Wollongong, Australia: University of Wollongong Press. Swanson, E. B. (1987). Information channel disposition and use. Decision Sciences, 18(1), 131-145. Tannen, D. (1990). You just don’t understand: Women and men in conversion. New York: William Morrow. The World Bank Group. (2001a). Australia at a glance [Online]. Available at.
http://www.worldbank.org/data/countrydata/aag/aus_aag.pdf. The World Bank Group. (2001b). Korea, Rep. at a glance [Online]. Available at.
http://www.worldbank.org/data/countrydata/aag/kor_aag.pdf. Thompsen, P. A. (1994). Toward a public lane on the information superhighway: A
media performance analysis of the community-wide education and information service initiative. Unpublished Doctoral Dissertation, The University of Utah.
Thorson, E. B. (1990). Consumer processing of advertising. Current Issues and Research in Advertising, 12, 197-230.
Thorson, E., Chi, A. and Leavitt, C. (1992). Attention, memory, attitude, and conation: A test of the advertising hierarchy. Advances in Consumer Research, 19, 366- 379. Tierney, P. (2000). Internet-based evaluation of tourism Web site effectiveness:
Methodological issues and survey results. Journal of Travel Research, 39(November), 212-219.
Tourangeau, R., Couper, M. P., and Steiger, D. M. (2001). Social presence in Web surveys. Paper presented at the 2001 FCSM Research Conference, November 14-16. Tripp, M. A. (2001). Gender differences in communication. [Online]. Available at. http://www.umm.maine.edu/BEX/students/MarkTipp/mt320.html. Tu, X. and Terzopoulos, D. (1994). Artificial fishes: Physics, locomotion, perception, behavior. Paper presented at the SIGGRAPH 94, Orlando, FL, July 24-29. Uden, L. and Willis, N. (2001). Designing user interfaces using activity theory. Paper presented at the 34th Hawaii International Conference on System Sciences, Maui, Hawaii, January 03 - 06. Uva, W. (2000). Develop a successful promotion program. [Online]. Available at. http://www.uvm.edu/~wagn/archive/dcdec00.html. Vandermerwe, S. (2000). How increasing value to customers improves business results. Sloan Management Review, Fall, 27-37. Van de Ven, A. H. and Ferry, D. L. (1980). Measuring and assessing organization.
New York: John Wiley & Sons.
247
Van Dulmen, A. M. (1998). Children's contributions to pediatric outpatient encounters. Pediatrics, 102(3), 563-568. Van Waterschoot, W. and van den Bulte, C. (1992). The 4P classification of the marketing mix revisited. Journal of Marketing, 56(4), 83-93. Venkatesh, V. and Davis, F. D. (2000). A theoretical extension of the technology
acceptance model: Four longitudinal field studies. Management Science, 46(2), 186-204.
Vygotsky, L. S. (1962). Thought and language. Cambridge, MA: MIT Press. Vygotsky, L. S. (1978). Mind in society: The development of higher psychological processes. Cambridge: Harvard University Press. Vygotsky, L. S. (1981). The instrumental method in psychology. In J. V. Wertsch (Ed.), The concept of activity in Soviet psychology (pp. 134-143). Armonk, NY: M. E. Sharpe. Vygotsky, L. S. (1994). The problem of the environment. In R. van der Veer and J. Valsiner (Eds.), The Vygotsky reader (pp. 338-354). Cambridge, MA: Blackwell. Walls, J. (1993). Global networking for local development: Task focus and relationship focus in cross-cultural communication. In L. M. Harasim (Ed.), Global networks (pp. 153-166). Cambridge, Mass: MIT Press. Walther, J. B. (1992). Interpersonal effects in computer-mediated interaction: A relational perspective. Communication Research, 19(1), 52-90. Wansink, B. and Ray, M. L. (1992). Estimating an advertisement's impact on one's
consumption of a brand. Journal of Advertising Research, 32(3), 9-16. Warden, C. A., Lai, M., and Wu, W. (2002). How World-Wide is marketing communication on the World Wide Web? Journal of Advertising Research, 42(5), 72-84. Watson, R. T., Zinkhan, G. M., & Pitt, L. F. (2000). Integrated Internet marketing.
Communications of the ACM, 43(6), 97-102. Wen, H. J., Chen, H., and Hwang, H. (2001). E-commerce Web site design: Strategies
and models. Information Management & Computer Security, 9(1), 5-12. Weber, R. P. (1985). Basic content analysis. London: Sage Publications. Williams, F., Strover, S., and Grant, A. E. (1994). Social aspects of new media technologies. In J. Bryant and D. Zillmann (Eds.), Media effects: Advances in theory and research (pp. 463-482). Hillsdale, NJ: Erlbaum. Wimmer, R. D. and Dominick, J. R. (1997). Mass media research: An introduction (5th
ed.). New York: Wadsworth Publishing Company. Wood, J. T. (1982). Human communication: A symbolic interactionist perspective.
Sydney: Holt, Rinehart and Winston. Wortring, C. E., Kayany, J. M., and Forrest, E. J. (1996). Consuming technologies at home: New consumer research techniques. In E. Forrest and R. Mizerski (Eds.), Interactive marketing: The future present (pp. 269-281). Chicago: NTC Business Books. Wu, G. (1999). Perceived interactivity and attitude toward Website. Paper presented at the 1999 Annual Conference of American Academy of Advertising, Gainesville, Florida. [Online]. Available at. http://www.utexas.edu/coc.admedium/Ivory/perceived_interactivity.html.
248
Xiao, L. and Dasgupta, S. (2002). Measurement of user satisfaction with Web-based information systems: An empirical study. Paper presented at the Eighth Americas Conference on Information Systems (AMCIS2002), Dallas, TX, August 9-11.
Yale, L. and Gilly, M. C. (1988). Trends in advertising research: A look at the content of marketing-oriented journals from 1976 to 1985. The Journal of Advertising, 17(1), 12-22.
Yoo, B. and Donthu, N. (2001). Developing a scale to measure the perceived quality of an Internet shopping site (SITEQUAL). Quarterly Journal of Electronic Commerce, 2(1), 31-45.
Zack, M. H. (1993). Interactivity and communication mode choice in ongoing management groups. Information Systems Research, 4(3), 207-239.
Zahedi, F. M., van Pelt, W. V., and Song, J. (2001). A conceptual framework for international Web design. IEEE Transactions on Professional Communication, 44(2), 83-103. Zanden, J. W. V. (1984). Social psychology (3rd ed.). New York: Random House. Zeff, R. and Aronson, B. (1999). Advertising on the Internet (2nd ed.). New York: Wiley. Zhang, Y. and Gelb, B. D. (1996). Matching advertising appeals to culture: The influence of products' use conditions. The Journal of Advertising, 25(3), 29-46. Zikmund, W. G. (1991). Exploring marketing research (4th ed.). Sydney: The Dryden
Press. Zikmund, W. G. and D'Amico, M. (1996). Marketing (5th ed.). New York: West Publishing Company.
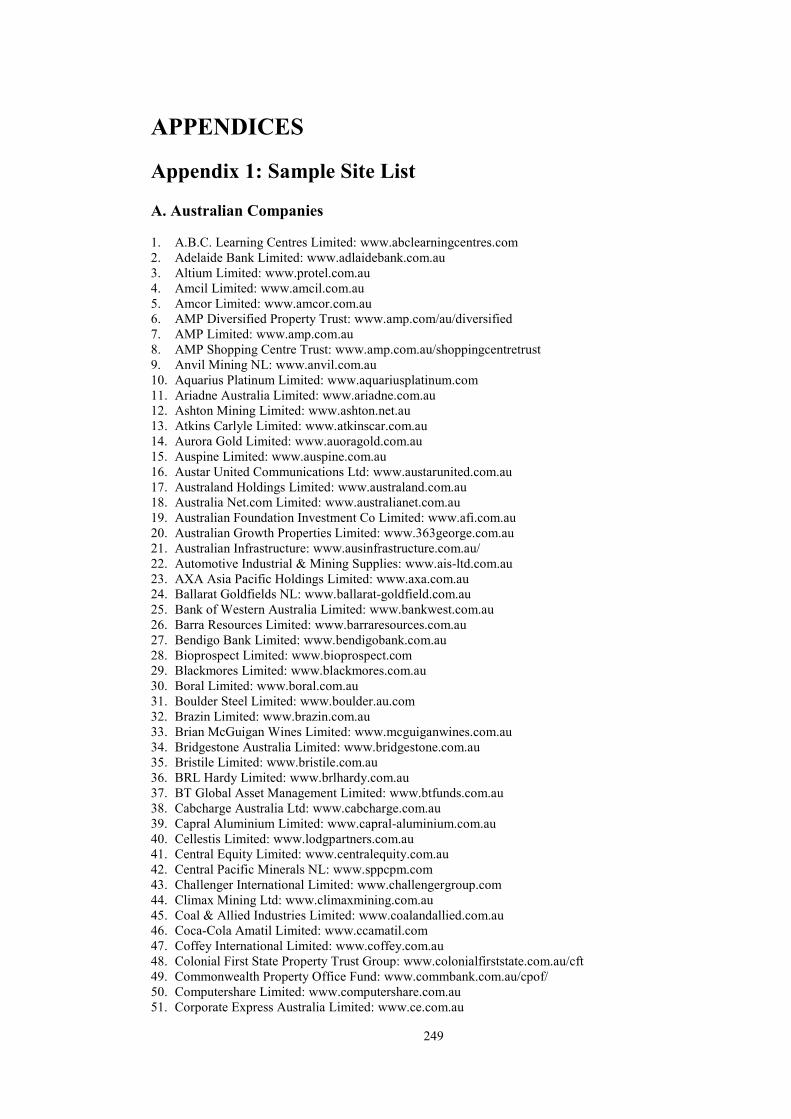
249
APPENDICES Appendix 1: Sample Site List A. Australian Companies 1. A.B.C. Learning Centres Limited: www.abclearningcentres.com 2. Adelaide Bank Limited: www.adlaidebank.com.au 3. Altium Limited: www.protel.com.au 4. Amcil Limited: www.amcil.com.au 5. Amcor Limited: www.amcor.com.au 6. AMP Diversified Property Trust: www.amp.com/au/diversified 7. AMP Limited: www.amp.com.au 8. AMP Shopping Centre Trust: www.amp.com.au/shoppingcentretrust 9. Anvil Mining NL: www.anvil.com.au 10. Aquarius Platinum Limited: www.aquariusplatinum.com 11. Ariadne Australia Limited: www.ariadne.com.au 12. Ashton Mining Limited: www.ashton.net.au 13. Atkins Carlyle Limited: www.atkinscar.com.au 14. Aurora Gold Limited: www.auoragold.com.au 15. Auspine Limited: www.auspine.com.au 16. Austar United Communications Ltd: www.austarunited.com.au 17. Australand Holdings Limited: www.australand.com.au 18. Australia Net.com Limited: www.australianet.com.au 19. Australian Foundation Investment Co Limited: www.afi.com.au 20. Australian Growth Properties Limited: www.363george.com.au 21. Australian Infrastructure: www.ausinfrastructure.com.au/ 22. Automotive Industrial & Mining Supplies: www.ais-ltd.com.au 23. AXA Asia Pacific Holdings Limited: www.axa.com.au 24. Ballarat Goldfields NL: www.ballarat-goldfield.com.au 25. Bank of Western Australia Limited: www.bankwest.com.au 26. Barra Resources Limited: www.barraresources.com.au 27. Bendigo Bank Limited: www.bendigobank.com.au 28. Bioprospect Limited: www.bioprospect.com 29. Blackmores Limited: www.blackmores.com.au 30. Boral Limited: www.boral.com.au 31. Boulder Steel Limited: www.boulder.au.com 32. Brazin Limited: www.brazin.com.au 33. Brian McGuigan Wines Limited: www.mcguiganwines.com.au 34. Bridgestone Australia Limited: www.bridgestone.com.au 35. Bristile Limited: www.bristile.com.au 36. BRL Hardy Limited: www.brlhardy.com.au 37. BT Global Asset Management Limited: www.btfunds.com.au 38. Cabcharge Australia Ltd: www.cabcharge.com.au 39. Capral Aluminium Limited: www.capral-aluminium.com.au 40. Cellestis Limited: www.lodgpartners.com.au 41. Central Equity Limited: www.centralequity.com.au 42. Central Pacific Minerals NL: www.sppcpm.com 43. Challenger International Limited: www.challengergroup.com 44. Climax Mining Ltd: www.climaxmining.com.au 45. Coal & Allied Industries Limited: www.coalandallied.com.au 46. Coca-Cola Amatil Limited: www.ccamatil.com 47. Coffey International Limited: www.coffey.com.au 48. Colonial First State Property Trust Group: www.colonialfirststate.com.au/cft 49. Commonwealth Property Office Fund: www.commbank.com.au/cpof/ 50. Computershare Limited: www.computershare.com.au 51. Corporate Express Australia Limited: www.ce.com.au
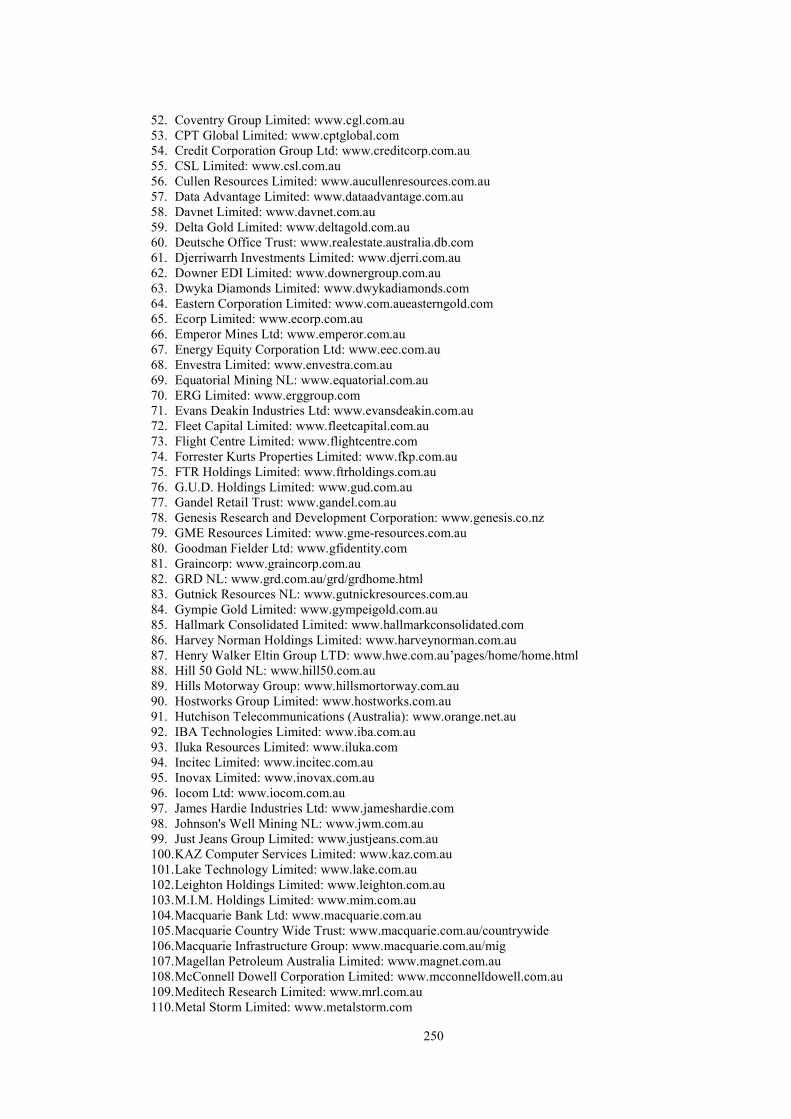
250
52. Coventry Group Limited: www.cgl.com.au 53. CPT Global Limited: www.cptglobal.com 54. Credit Corporation Group Ltd: www.creditcorp.com.au 55. CSL Limited: www.csl.com.au 56. Cullen Resources Limited: www.aucullenresources.com.au 57. Data Advantage Limited: www.dataadvantage.com.au 58. Davnet Limited: www.davnet.com.au 59. Delta Gold Limited: www.deltagold.com.au 60. Deutsche Office Trust: www.realestate.australia.db.com 61. Djerriwarrh Investments Limited: www.djerri.com.au 62. Downer EDI Limited: www.downergroup.com.au 63. Dwyka Diamonds Limited: www.dwykadiamonds.com 64. Eastern Corporation Limited: www.com.aueasterngold.com 65. Ecorp Limited: www.ecorp.com.au 66. Emperor Mines Ltd: www.emperor.com.au 67. Energy Equity Corporation Ltd: www.eec.com.au 68. Envestra Limited: www.envestra.com.au 69. Equatorial Mining NL: www.equatorial.com.au 70. ERG Limited: www.erggroup.com 71. Evans Deakin Industries Ltd: www.evansdeakin.com.au 72. Fleet Capital Limited: www.fleetcapital.com.au 73. Flight Centre Limited: www.flightcentre.com 74. Forrester Kurts Properties Limited: www.fkp.com.au 75. FTR Holdings Limited: www.ftrholdings.com.au 76. G.U.D. Holdings Limited: www.gud.com.au 77. Gandel Retail Trust: www.gandel.com.au 78. Genesis Research and Development Corporation: www.genesis.co.nz 79. GME Resources Limited: www.gme-resources.com.au 80. Goodman Fielder Ltd: www.gfidentity.com 81. Graincorp: www.graincorp.com.au 82. GRD NL: www.grd.com.au/grd/grdhome.html 83. Gutnick Resources NL: www.gutnickresources.com.au 84. Gympie Gold Limited: www.gympeigold.com.au 85. Hallmark Consolidated Limited: www.hallmarkconsolidated.com 86. Harvey Norman Holdings Limited: www.harveynorman.com.au 87. Henry Walker Eltin Group LTD: www.hwe.com.au’pages/home/home.html 88. Hill 50 Gold NL: www.hill50.com.au 89. Hills Motorway Group: www.hillsmortorway.com.au 90. Hostworks Group Limited: www.hostworks.com.au 91. Hutchison Telecommunications (Australia): www.orange.net.au 92. IBA Technologies Limited: www.iba.com.au 93. Iluka Resources Limited: www.iluka.com 94. Incitec Limited: www.incitec.com.au 95. Inovax Limited: www.inovax.com.au 96. Iocom Ltd: www.iocom.com.au 97. James Hardie Industries Ltd: www.jameshardie.com 98. Johnson's Well Mining NL: www.jwm.com.au 99. Just Jeans Group Limited: www.justjeans.com.au 100. KAZ Computer Services Limited: www.kaz.com.au 101. Lake Technology Limited: www.lake.com.au 102. Leighton Holdings Limited: www.leighton.com.au 103. M.I.M. Holdings Limited: www.mim.com.au 104. Macquarie Bank Ltd: www.macquarie.com.au 105. Macquarie Country Wide Trust: www.macquarie.com.au/countrywide 106. Macquarie Infrastructure Group: www.macquarie.com.au/mig 107. Magellan Petroleum Australia Limited: www.magnet.com.au 108. McConnell Dowell Corporation Limited: www.mcconnelldowell.com.au 109. Meditech Research Limited: www.mrl.com.au 110. Metal Storm Limited: www.metalstorm.com
251
111. Miller's Retail Ltd: www.retailclub.com.au 112. Mirvac Group: www.mirvac.com.au 113. Monadelphous Group Limited: www.monadel.com.au 114. Namakwa Diamond Company NL: www.namakwadiamondco.com.au 115. National Can Industries Limited: www.natcan.com.au 116. National Telecoms Group Limited: www.ntgroup.com.au 117. Neverfail Springwater Limited: www.neverfail.com.au 118. New Tel Limited: www.newtel-limited.com 119. News Corporation Limited (The): www.newscorp.com 120. Normandy Mining Limited: www.normandy.com.au 121. Novus Petroleum Limited: www.nvs.com.au 122. Oamps Limited: www.oamps.com.au 123. Oil Search Limited: www.oilsearch.com.au 124. OneSteel Limited: www.onesteel.com 125. OPSM Protector Limited: www.opsmprotector.com 126. Orica Limited: www.orogen.com 127. Pacific Dunlop Limited: www.pacdun.com.au 128. PacMin Mining Corporation Limited: www.pacmin.com.au 129. PaperlinX Limited: www.paperlinx.com.au 130. Peptech Limited: www.peptech.com.au 131. Permanent Trustee Company Limited: www.permanentgroup.com.au 132. Petaluma Limited: www.ozwine/petalumaltd 133. Petroz N.L.: www.petroz.com.au 134. Platinum Capital Limited: www.platinum.com.au 135. Poltech International Limited: www.poltech.com.au 136. Portman Limited: www.portman.com.au 137. Pracom Limited: www.pracom.com.au 138. Primary Health Care Limited: www.primelife.com.au 139. Publishing and Broadcasting Limited: www.pbl.com.au 140. QBE Insurance Group Limited: www.qbe.com.au 141. QPSX Limited: www.qpsx.com.au 142. Reckon Limited: www.reckon.com.au 143. Reef Casino Trust: www.cairns.directory.citysearch.com.au/e/v/cairn/0033/32/60/3.html 144. Reinsurance Australia Corporation Limited: www.reac.com.au 145. Resolute Limited: www.resolute-ltd.com.au 146. Rio Tinto Limited: www.riotinto.com 147. Santos Limited: www.santos.com.au 148. Securenet Limited: www.securenet.com.au 149. Seven Network Limited: www.i7.com.au 150. Sigma Co Limited: www.sigmaco.com.au 151. Simeon Wines Limited: www.simeon.com.au 152. Singleton Group Limited: www.jsa.com.au or www.singo.com.au 153. Smorgon Steel Group Ltd: www.smorgonsteel.com.au 154. Solution 6 Holdings Limited: www.solution6.com 155. Sons of Gwalia Limited: www.sog.com.au 156. Southern Cross Broadcasting (Aus) Limited: www.southercrossbroadcasting.com.au 157. SP Telecommunications Limited: www.kooee.com.au 158. Spicers Paper Limited: www.spicers.com.au 159. ST Synergy Limited: www.stsynergy.com 160. St. George Bank Limited: www.stgeorge.com.au 161. Straits Resources Limited: www.straits.com.au 162. Striker Resources NL: www.striker.com.au 163. Sunraysia Television Limited: http://local.abc.net.au/sunraysis 164. Sydney Aquarium Limited: www.sydneyaquarium.com.au 165. Sylvania Resources Limited: www.sylvaniaresources.com.au 166. Tab Queensland Limited: www.tabq.com.au 167. Tap Oil Limited: www.tapoil.com.au 168. Techstar Ltd: www.techstar.com.au 169. Telemedia Networks International Limited: www.telemedianet.com.au
252
170. Telstra Corporation Limited: www.telstra.com 171. Tempo Services Limited: www.temposervices.com.au 172. Thakral Holdings Limited: www.thakral.com.au 173. The Franked Income Fund: www.gresham.com.au 174. Thundelarra Exploration Limited: www.thundelarra.com 175. Timbercorp Limited: www.timbercorp.com.au 176. Tomato Technologies Limited: www.tomatotechnologies.com.au 177. Tourism Asset Holdings Limited: www.tahl.com.au 178. Transurban City Link: www.transurban.com.au 179. Tyndall Meridian Trust: www.tyndall.com.au 180. Union Capital Limited: www.unioncapital.com.au 181. United Group Limited: www.unitedgroup.com.au 182. Village Roadshow Limited: www.villageroadshow.com.au 183. Vision Systems Limited: www.vsl.com.au 184. Wesfarmers Limited: www.wesfarmers.com.au 185. Westel Group Limited: www.westel.com.au 186. Westfield America Trust: www.westfield.com.au 187. Westfield Trust: www.westel.com.au 188. Westpac Banking Corporation: www.westpac.com.au 189. WMC Limited: www.wmc.com.au 190. Woolworths Limited: www.woolworthslimited.com.au
253
B. Korean Companies 1. Asia Cement Manufacturing: www.asiacement.co.kr 2. Baek Kwang Mineral Products: www.bkmp.co.kr 3. Bing-Grae Company Limited: www.bing.co.kr 4. Bong Shin Co., Ltd.: www.bong-shin.co.kr 5. Boryung Pharmaceutical Company Limited: www.boryung.co.kr 6. Bum Yang Food Co., Ltd.: www.bumyang.co.kr 7. Byuck San Corporation: www.byucksan.com 8. Capro Corporation: www.hcccapro.co.kr 9. Century Corporation: www.gocentury.co.kr 10. Cheil Communications Incorporated: www.cheil.co.kr 11. Cheju Bank Ltd.: www.chejubank.co.kr 12. Cho Hung Bank: www.chb.co.kr 13. Choil Aluminium Manufacturing Company Ltd: www.choilal.co.kr 14. Chokwang Paint Ltd.: www.chokwangpaint.com 15. Chonggu Company Limited: www.chonggu.co.kr 16. Choong Wae Pharmaceutical: www.cwp.co.kr 17. Chun Ji Industrial Co., Ltd.: www.chunji.co.kr 18. Chungho Elcom: www.chelcom.co.kr 19. Crown Confectionery Co., Ltd.: www.crown.co.kr 20. Dae Chang Industrial Company: www.brasone.co.kr 21. Dae Ho Corporation: www.daehocon.co.kr 22. Daeduck GDS Company Limited: www.daeduckgds.com 23. Daehan City Gas Co., Ltd.: www.daehancitygas.com 24. Daeil Chemical Co., Ltd.: www.daeilchem.co.kr 25. Daelim Industrial: www.dic.co.kr 26. Daewon Chemical Company Limited: www.daewon21.co.kr 27. Daewoo Electronics Company Limited: www.dwe.co.kr 28. Daewoo Telecom Company Limited: www.dwt.co.kr 29. Dahaam e-TEC Company Limited: www.shp.co.kr 30. Daihan Eunpakgy Company Limited: www.dhe.co.kr 31. Daou Technology Incorporated: www.daou.co.kr 32. Digital Power Communications Company Ltd.: www.dpc.co.kr 33. Dong Il Corp: www.dong-il.com/dic.asp 34. Dong Sung Pharm Corporation: www.dongsungpharm.co.kr 35. Dong Yang Elevator Co., Ltd.: www.dongyang-elevator.com 36. Dongbang Agro Corporation: www.dongbangagro.co.kr 37. Dongbu Hannong Chemical Company Limited: www.dongbuchem.com 38. Dongbu Steel Company Limited: www.dbstl.co.kr 39. Dongil Rubber Belt Co., Ltd.: www.dongilbelt.co.kr 40. Dongsu Industrial Company Limited: www.dongsu.co.kr 41. Dongwon Fisheries Co., Ltd.: www.dongwonfish.co.kr 42. Dongwon Securities Company Limited: www.choiceup.com 43. Dongyang Gangchul Company Limited: www.dygc.co.kr 44. Dongyang Tin Plate Co., Ltd.: www.dongyangtp.co.kr 45. Doosan Corporation: www.soosan.co.kr 46. Duck Yang Industry Company Limited: www.duckyang.co.kr 47. ENEX Company Limited: www.enex.co.kr 48. Eusung Industrial Co., Ltd.: http://esic.koreasme.com 49. First Mutual Savings & Finance Co., Ltd.: www.jeilbank.co.kr 50. Future Systems Incorporated: www.future.co.kr 51. Gold Mutual Savings & Finance Co., Ltd.: www.goldbanking.co.kr 52. Haansoft Inc: www.haansoft.com 53. Haitai Confectionary: www.ht.co.kr 54. Halla Engineering & Construction Co.: www.halla.co.kr 55. Han Il E Wha Co., Ltd.: www.hanileh.co.kr 56. Han Kuk Carbon Company Limited: www.fiber-x.com 57. Hana Securities Company Limited: www.hanastock.co.kr
254
58. Hanchang Corporation: www.hanchang.co.kr 59. Hanil Iron & Steel Co., Ltd.: www.hanilsteel.co.kr 60. Hanjin Shipping Company Limited: www.hanjin.com 61. Hankook Cosmetics: www.ihkcos.co.kr 62. Hankuk Paper Manufacturing Company Limited: www.gopaper.co.kr 63. Hanshin Construction Co., Ltd.: www.hanshinc.com 64. Hansol CSN Company Limited: www.hansolcsn.com 65. Hansol Telecom Co., Ltd.: www.hansoltelecom.co.kr 66. Hanvit Securities Company Limited: www.hanvitsec.co.kr 67. Hanwha Securities Company Limited: www.koreastock.co.kr 68. Heung Ah Corporation: www.heungah.co.kr 69. Hi-Tron Systems: www.hitron.co.kr 70. Hotel Shilla Co: www.shilla.samsung.co.kr 71. HS R&A: www.hwaseunghk.com/dir.htm 72. Hung Chang Company Limited: www.hungchang.co.kr 73. Hwa Sung Industrial Company: www.hwasung.co.kr 74. Hynix Semiconductor Incorporated: www.hei.co.kr 75. Hyundae Metal Co., Ltd.: www.hyundaelock.com or www.hdlock.co.kr 76. Hyundai Department Store Company Limited: www.e-hyundai.com 77. Hyundai HYSCO: www.hysco.com 78. Hyundai Mobis: www.mobis.co.kr 79. Hyundai Securities Company Limited: www.stockmarket.co.kr 80. Il Dong Pharmaceutical Company Limited: www.ildong.com 81. IL Jin Electric Company: www.iljin.co.kr 82. Ileun Securities Company Limited: www.powerstock.co.kr 83. Ilyang Pharmacetutical Co., Ltd: www.ilyang.co.kr 84. INI Steel Company: www.iisc.co.kr 85. INZI Controls Company Limited: www.inzi.co.kr 86. Jindo Corporation: www.jindo.co.kr 87. Kedcom Company Limited: www.kedcom.co.kr 88. Keun Wha Pharmaceutical Co., Ltd.: www.kunwha.com 89. Kia Steel Company Limited: www.kss.co.kr 90. Kirin Co., Ltd.: www.kirin.co.kr 91. Kohap Ltd.: www.kohap.co.kr 92. Kolon Industries Inc: www.ikolon.co.kr 93. Koram Bank: www.goodbank.com 94. Korea Circuit Company Limited: www.kcg.co.kr 95. Korea Cottrell Co., Ltd.: www.cottrell.co.kr 96. Korea Developement Corporation: www.kdc.co.kr 97. Korea Electric Terminal Co.: www.ket.co.kr 98. Korea Fine Chemical Company Limited: www.finechem.co.kr 99. Korea Gas Corporation: www.kogas.co.kr 100. Korea Industrial Development Co.: www.hdkid.com 101. Korea Kumho Petrochemical Company: www.kkpc.co.kr 102. Korea Network Corporation: www.knc.co.kr 103. Korea Polyol Company Limited: www.polyol.co.kr 104. Korea Tobacco & Ginseng Corporation: www.ktg.co.kr 105. Korean Gingseng Products Co., Ltd.: www.koje.co.kr 106. KT Freetel Company Limited: www.kt.co.kr 107. Kuk-Dong Corporation: www.kd.co.kr 108. Kukdong City Gas Co., Ltd.: www.naturalgasnet.co.kr or www.gaspia.com 109. Kukje Corporation: www.kukje.co.kr 110. Kum Kang Industrial: www.kumkangind.co.kr 111. Kumgang Korea Chemical Company Limited: www.kcc.co.kr 112. Kumho Tire Co., Ltd.: www.kumhotire.com 113. Kwang Dong Pharmaceutical Company Limited: www.kwang-dong.co.kr 114. Kyeryong Construction Industrial Co. Ltd: www.krcon.co.kr 115. Kyung In Electronics Co., Ltd.: www.kei.co.kr 116. Kyung Nong Corporation: www.knco.co.kr/kyungnong/kn.htm
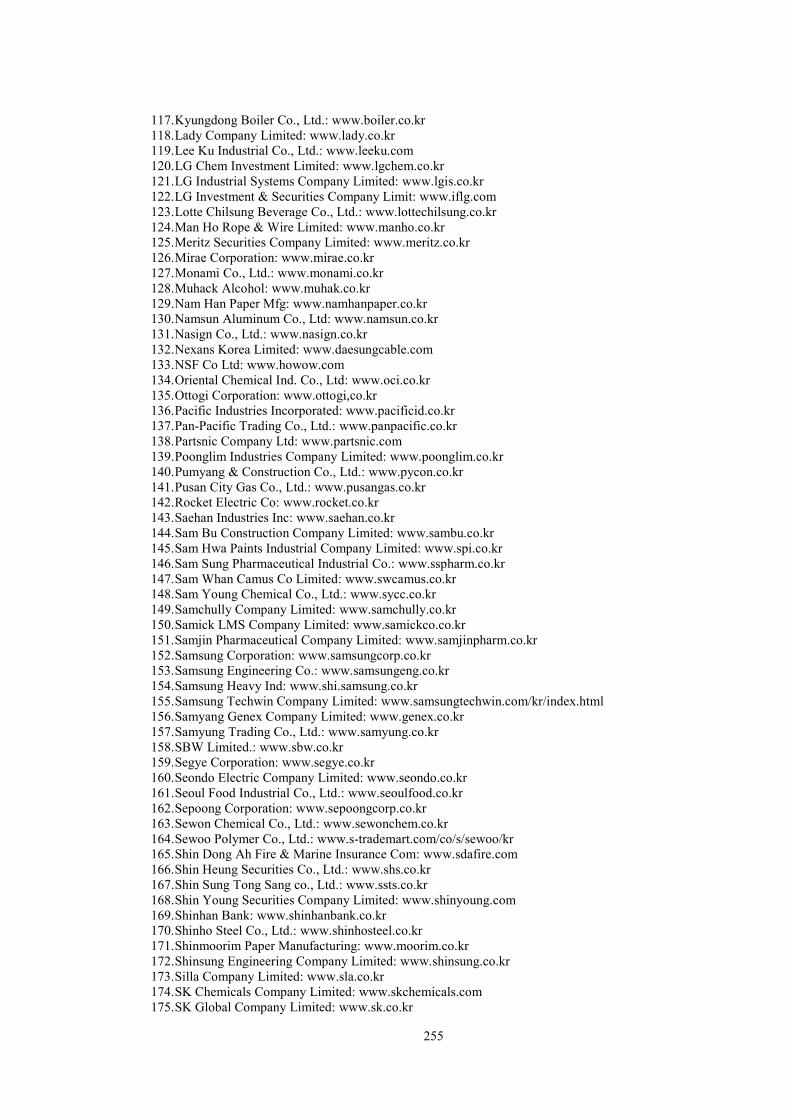
255
117. Kyungdong Boiler Co., Ltd.: www.boiler.co.kr 118. Lady Company Limited: www.lady.co.kr 119. Lee Ku Industrial Co., Ltd.: www.leeku.com 120. LG Chem Investment Limited: www.lgchem.co.kr 121. LG Industrial Systems Company Limited: www.lgis.co.kr 122. LG Investment & Securities Company Limit: www.iflg.com 123. Lotte Chilsung Beverage Co., Ltd.: www.lottechilsung.co.kr 124. Man Ho Rope & Wire Limited: www.manho.co.kr 125. Meritz Securities Company Limited: www.meritz.co.kr 126. Mirae Corporation: www.mirae.co.kr 127. Monami Co., Ltd.: www.monami.co.kr 128. Muhack Alcohol: www.muhak.co.kr 129. Nam Han Paper Mfg: www.namhanpaper.co.kr 130. Namsun Aluminum Co., Ltd: www.namsun.co.kr 131. Nasign Co., Ltd.: www.nasign.co.kr 132. Nexans Korea Limited: www.daesungcable.com 133. NSF Co Ltd: www.howow.com 134. Oriental Chemical Ind. Co., Ltd: www.oci.co.kr 135. Ottogi Corporation: www.ottogi,co.kr 136. Pacific Industries Incorporated: www.pacificid.co.kr 137. Pan-Pacific Trading Co., Ltd.: www.panpacific.co.kr 138. Partsnic Company Ltd: www.partsnic.com 139. Poonglim Industries Company Limited: www.poonglim.co.kr 140. Pumyang & Construction Co., Ltd.: www.pycon.co.kr 141. Pusan City Gas Co., Ltd.: www.pusangas.co.kr 142. Rocket Electric Co: www.rocket.co.kr 143. Saehan Industries Inc: www.saehan.co.kr 144. Sam Bu Construction Company Limited: www.sambu.co.kr 145. Sam Hwa Paints Industrial Company Limited: www.spi.co.kr 146. Sam Sung Pharmaceutical Industrial Co.: www.sspharm.co.kr 147. Sam Whan Camus Co Limited: www.swcamus.co.kr 148. Sam Young Chemical Co., Ltd.: www.sycc.co.kr 149. Samchully Company Limited: www.samchully.co.kr 150. Samick LMS Company Limited: www.samickco.co.kr 151. Samjin Pharmaceutical Company Limited: www.samjinpharm.co.kr 152. Samsung Corporation: www.samsungcorp.co.kr 153. Samsung Engineering Co.: www.samsungeng.co.kr 154. Samsung Heavy Ind: www.shi.samsung.co.kr 155. Samsung Techwin Company Limited: www.samsungtechwin.com/kr/index.html 156. Samyang Genex Company Limited: www.genex.co.kr 157. Samyung Trading Co., Ltd.: www.samyung.co.kr 158. SBW Limited.: www.sbw.co.kr 159. Segye Corporation: www.segye.co.kr 160. Seondo Electric Company Limited: www.seondo.co.kr 161. Seoul Food Industrial Co., Ltd.: www.seoulfood.co.kr 162. Sepoong Corporation: www.sepoongcorp.co.kr 163. Sewon Chemical Co., Ltd.: www.sewonchem.co.kr 164. Sewoo Polymer Co., Ltd.: www.s-trademart.com/co/s/sewoo/kr 165. Shin Dong Ah Fire & Marine Insurance Com: www.sdafire.com 166. Shin Heung Securities Co., Ltd.: www.shs.co.kr 167. Shin Sung Tong Sang co., Ltd.: www.ssts.co.kr 168. Shin Young Securities Company Limited: www.shinyoung.com 169. Shinhan Bank: www.shinhanbank.co.kr 170. Shinho Steel Co., Ltd.: www.shinhosteel.co.kr 171. Shinmoorim Paper Manufacturing: www.moorim.co.kr 172. Shinsung Engineering Company Limited: www.shinsung.co.kr 173. Silla Company Limited: www.sla.co.kr 174. SK Chemicals Company Limited: www.skchemicals.com 175. SK Global Company Limited: www.sk.co.kr
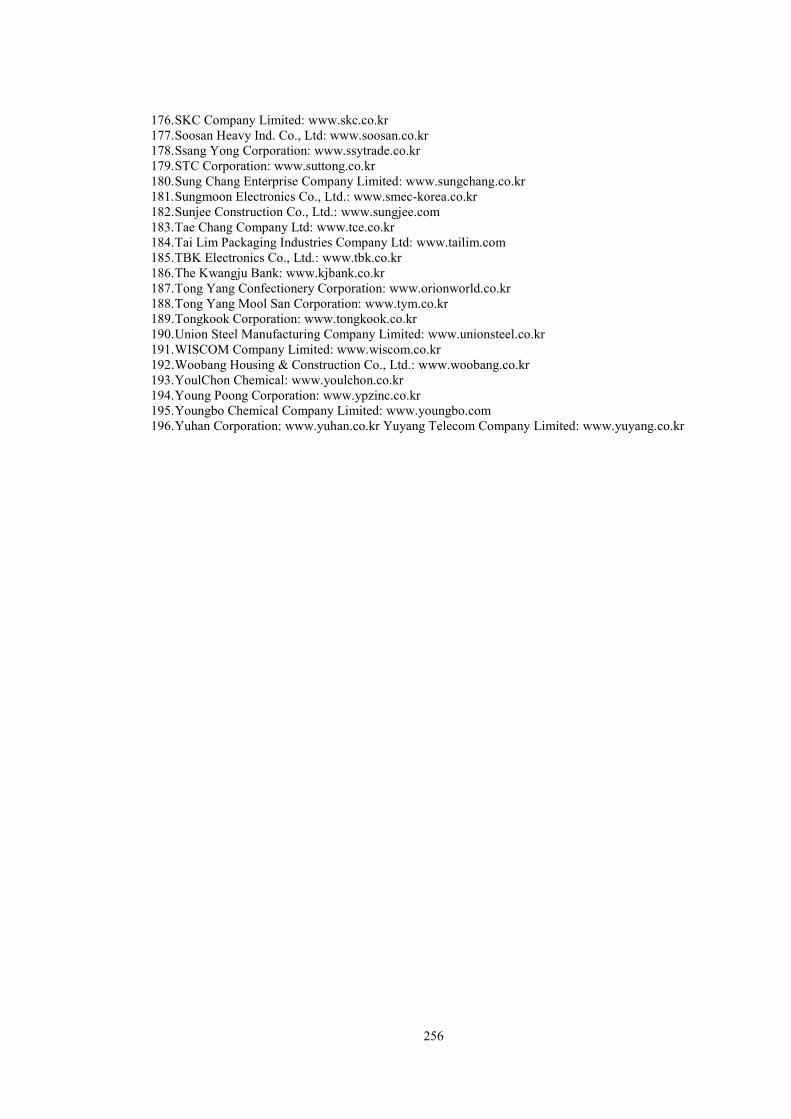
256
176. SKC Company Limited: www.skc.co.kr 177. Soosan Heavy Ind. Co., Ltd: www.soosan.co.kr 178. Ssang Yong Corporation: www.ssytrade.co.kr 179. STC Corporation: www.suttong.co.kr 180. Sung Chang Enterprise Company Limited: www.sungchang.co.kr 181. Sungmoon Electronics Co., Ltd.: www.smec-korea.co.kr 182. Sunjee Construction Co., Ltd.: www.sungjee.com 183. Tae Chang Company Ltd: www.tce.co.kr 184. Tai Lim Packaging Industries Company Ltd: www.tailim.com 185. TBK Electronics Co., Ltd.: www.tbk.co.kr 186. The Kwangju Bank: www.kjbank.co.kr 187. Tong Yang Confectionery Corporation: www.orionworld.co.kr 188. Tong Yang Mool San Corporation: www.tym.co.kr 189. Tongkook Corporation: www.tongkook.co.kr 190. Union Steel Manufacturing Company Limited: www.unionsteel.co.kr 191. WISCOM Company Limited: www.wiscom.co.kr 192. Woobang Housing & Construction Co., Ltd.: www.woobang.co.kr 193. YoulChon Chemical: www.youlchon.co.kr 194. Young Poong Corporation: www.ypzinc.co.kr 195. Youngbo Chemical Company Limited: www.youngbo.com 196. Yuhan Corporation: www.yuhan.co.kr Yuyang Telecom Company Limited: www.yuyang.co.kr
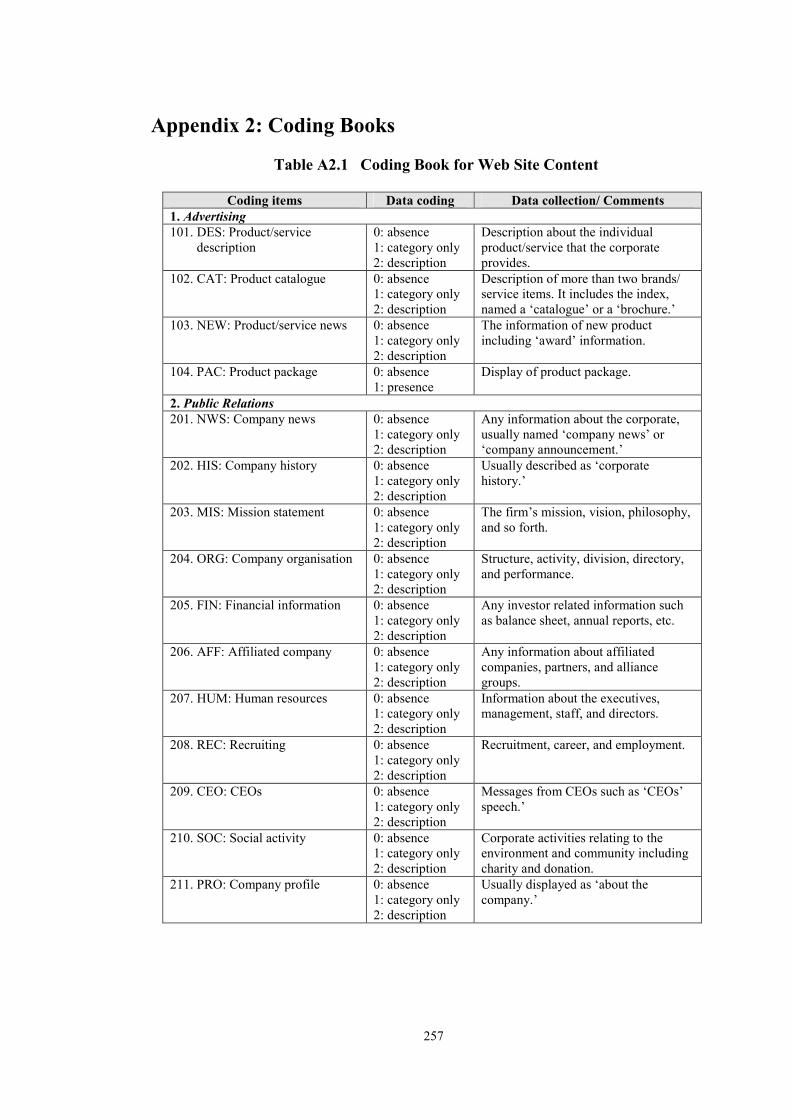
257
Appendix 2: Coding Books
Table A2.1 Coding Book for Web Site Content
Coding items Data coding Data collection/ Comments 1. Advertising 101. DES: Product/service description
0: absence 1: category only 2: description
Description about the individual product/service that the corporate provides.
102. CAT: Product catalogue 0: absence 1: category only 2: description
Description of more than two brands/ service items. It includes the index, named a ‘catalogue’ or a ‘brochure.’
103. NEW: Product/service news 0: absence 1: category only 2: description
The information of new product including ‘award’ information.
104. PAC: Product package 0: absence 1: presence
Display of product package.
2. Public Relations 201. NWS: Company news 0: absence
1: category only 2: description
Any information about the corporate, usually named ‘company news’ or ‘company announcement.’
202. HIS: Company history 0: absence 1: category only 2: description
Usually described as ‘corporate history.’
203. MIS: Mission statement 0: absence 1: category only 2: description
The firm’s mission, vision, philosophy, and so forth.
204. ORG: Company organisation 0: absence 1: category only 2: description
Structure, activity, division, directory, and performance.
205. FIN: Financial information 0: absence 1: category only 2: description
Any investor related information such as balance sheet, annual reports, etc.
206. AFF: Affiliated company 0: absence 1: category only 2: description
Any information about affiliated companies, partners, and alliance groups.
207. HUM: Human resources 0: absence 1: category only 2: description
Information about the executives, management, staff, and directors.
208. REC: Recruiting 0: absence 1: category only 2: description
Recruitment, career, and employment.
209. CEO: CEOs 0: absence 1: category only 2: description
Messages from CEOs such as ‘CEOs’ speech.’
210. SOC: Social activity 0: absence 1: category only 2: description
Corporate activities relating to the environment and community including charity and donation.
211. PRO: Company profile 0: absence 1: category only 2: description
Usually displayed as ‘about the company.’
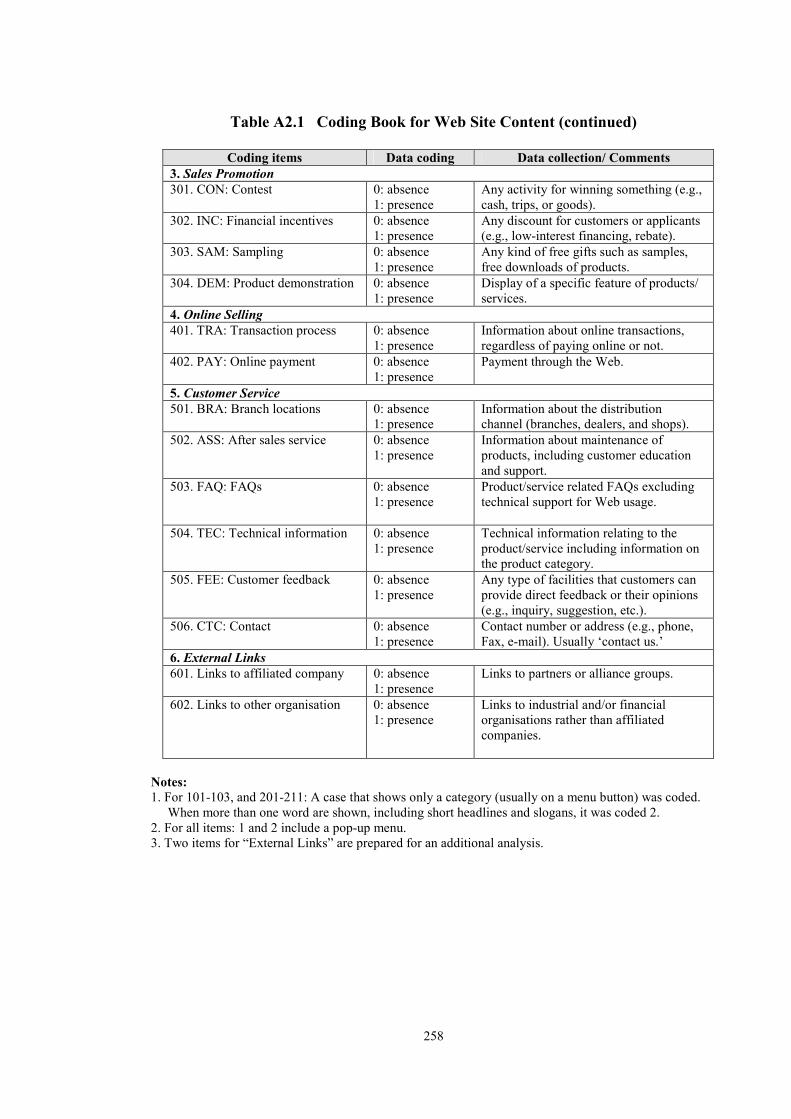
258
Table A2.1 Coding Book for Web Site Content (continued)
Coding items Data coding Data collection/ Comments 3. Sales Promotion 301. CON: Contest 0: absence
1: presence Any activity for winning something (e.g., cash, trips, or goods).
302. INC: Financial incentives 0: absence 1: presence
Any discount for customers or applicants (e.g., low-interest financing, rebate).
303. SAM: Sampling 0: absence 1: presence
Any kind of free gifts such as samples, free downloads of products.
304. DEM: Product demonstration 0: absence 1: presence
Display of a specific feature of products/ services.
4. Online Selling 401. TRA: Transaction process 0: absence
1: presence Information about online transactions, regardless of paying online or not.
402. PAY: Online payment 0: absence 1: presence
Payment through the Web.
5. Customer Service 501. BRA: Branch locations 0: absence
1: presence Information about the distribution channel (branches, dealers, and shops).
502. ASS: After sales service 0: absence 1: presence
Information about maintenance of products, including customer education and support.
503. FAQ: FAQs 0: absence 1: presence
Product/service related FAQs excluding technical support for Web usage.
504. TEC: Technical information 0: absence 1: presence
Technical information relating to the product/service including information on the product category.
505. FEE: Customer feedback 0: absence 1: presence
Any type of facilities that customers can provide direct feedback or their opinions (e.g., inquiry, suggestion, etc.).
506. CTC: Contact 0: absence 1: presence
Contact number or address (e.g., phone, Fax, e-mail). Usually ‘contact us.’
6. External Links 601. Links to affiliated company 0: absence
1: presence Links to partners or alliance groups.
602. Links to other organisation 0: absence 1: presence
Links to industrial and/or financial organisations rather than affiliated companies.
Notes: 1. For 101-103, and 201-211: A case that shows only a category (usually on a menu button) was coded. When more than one word are shown, including short headlines and slogans, it was coded 2. 2. For all items: 1 and 2 include a pop-up menu. 3. Two items for “External Links” are prepared for an additional analysis.
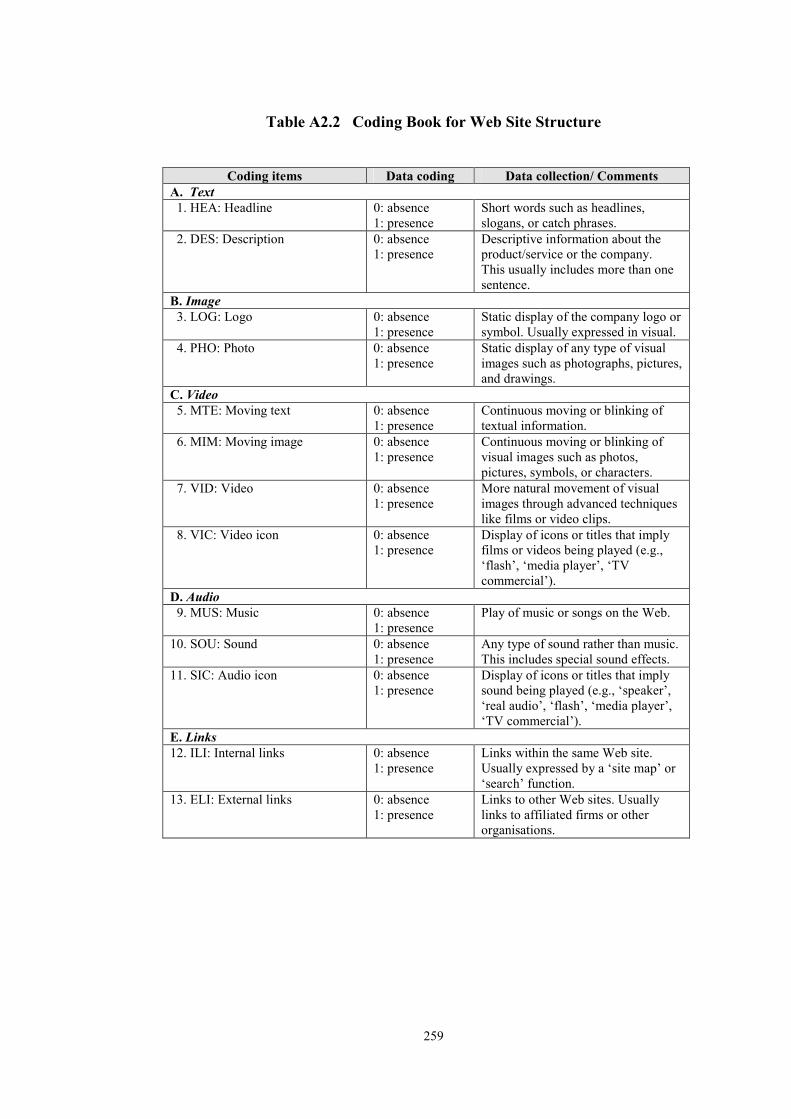
259
Table A2.2 Coding Book for Web Site Structure
Coding items Data coding Data collection/ Comments A. Text 1. HEA: Headline 0: absence
1: presence Short words such as headlines, slogans, or catch phrases.
2. DES: Description 0: absence 1: presence
Descriptive information about the product/service or the company. This usually includes more than one sentence.
B. Image 3. LOG: Logo 0: absence
1: presence Static display of the company logo or symbol. Usually expressed in visual.
4. PHO: Photo 0: absence 1: presence
Static display of any type of visual images such as photographs, pictures, and drawings.
C. Video 5. MTE: Moving text 0: absence
1: presence Continuous moving or blinking of textual information.
6. MIM: Moving image 0: absence 1: presence
Continuous moving or blinking of visual images such as photos, pictures, symbols, or characters.
7. VID: Video 0: absence 1: presence
More natural movement of visual images through advanced techniques like films or video clips.
8. VIC: Video icon 0: absence 1: presence
Display of icons or titles that imply films or videos being played (e.g., ‘flash’, ‘media player’, ‘TV commercial’).
D. Audio 9. MUS: Music 0: absence
1: presence Play of music or songs on the Web.
10. SOU: Sound 0: absence 1: presence
Any type of sound rather than music. This includes special sound effects.
11. SIC: Audio icon 0: absence 1: presence
Display of icons or titles that imply sound being played (e.g., ‘speaker’, ‘real audio’, ‘flash’, ‘media player’, ‘TV commercial’).
E. Links 12. ILI: Internal links 0: absence
1: presence Links within the same Web site. Usually expressed by a ‘site map’ or ‘search’ function.
13. ELI: External links 0: absence 1: presence
Links to other Web sites. Usually links to affiliated firms or other organisations.
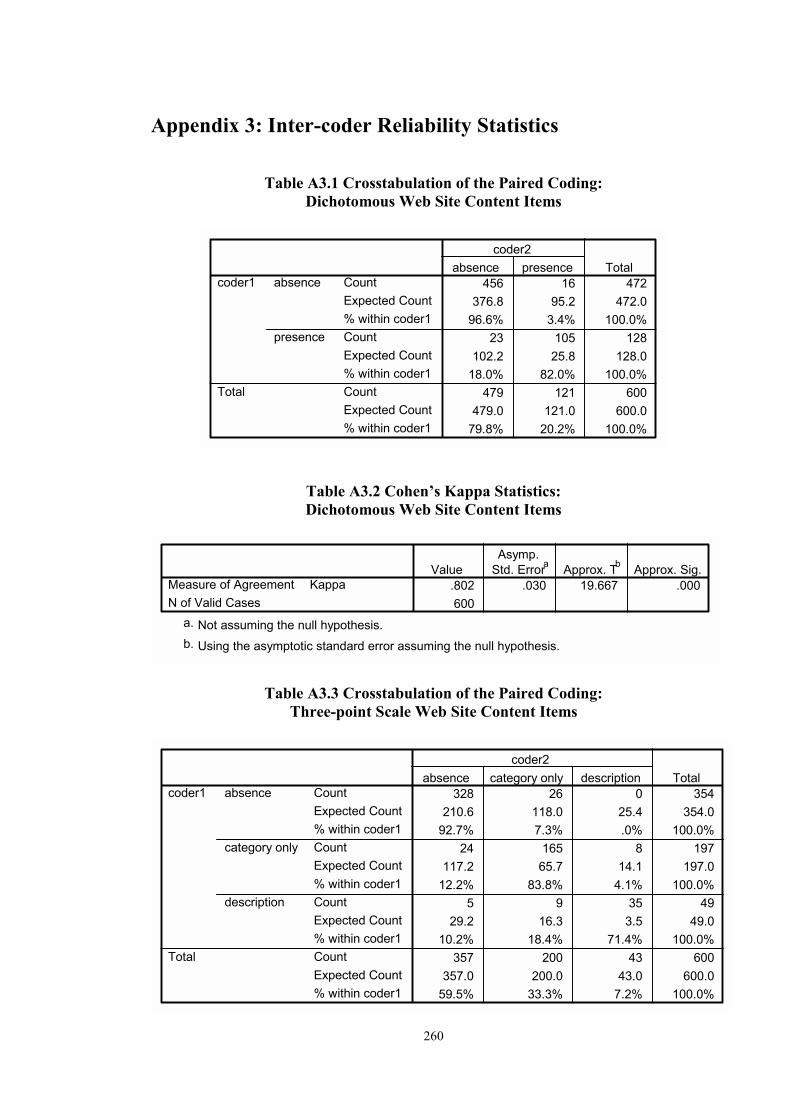
260
Appendix 3: Inter-coder Reliability Statistics
Table A3.1 Crosstabulation of the Paired Coding: Dichotomous Web Site Content Items
456 16 472376.8 95.2 472.0
96.6% 3.4% 100.0%23 105 128
102.2 25.8 128.018.0% 82.0% 100.0%
479 121 600479.0 121.0 600.0
79.8% 20.2% 100.0%
CountExpected Count% within coder1CountExpected Count% within coder1CountExpected Count% within coder1
absence
presence
coder1
Total
absence presencecoder2
Total
Table A3.2 Cohen’s Kappa Statistics: Dichotomous Web Site Content Items
.802 .030 19.667 .000600
KappaMeasure of AgreementN of Valid Cases
ValueAsymp.
Std. Errora Approx. Tb Approx. Sig.
Not assuming the null hypothesis.a.
Using the asymptotic standard error assuming the null hypothesis.b.
Table A3.3 Crosstabulation of the Paired Coding:
Three-point Scale Web Site Content Items
328 26 0 354210.6 118.0 25.4 354.0
92.7% 7.3% .0% 100.0%24 165 8 197
117.2 65.7 14.1 197.012.2% 83.8% 4.1% 100.0%
5 9 35 4929.2 16.3 3.5 49.0
10.2% 18.4% 71.4% 100.0%357 200 43 600
357.0 200.0 43.0 600.059.5% 33.3% 7.2% 100.0%
CountExpected Count% within coder1CountExpected Count% within coder1CountExpected Count% within coder1CountExpected Count% within coder1
absence
category only
description
coder1
Total
absence category only descriptioncoder2
Total
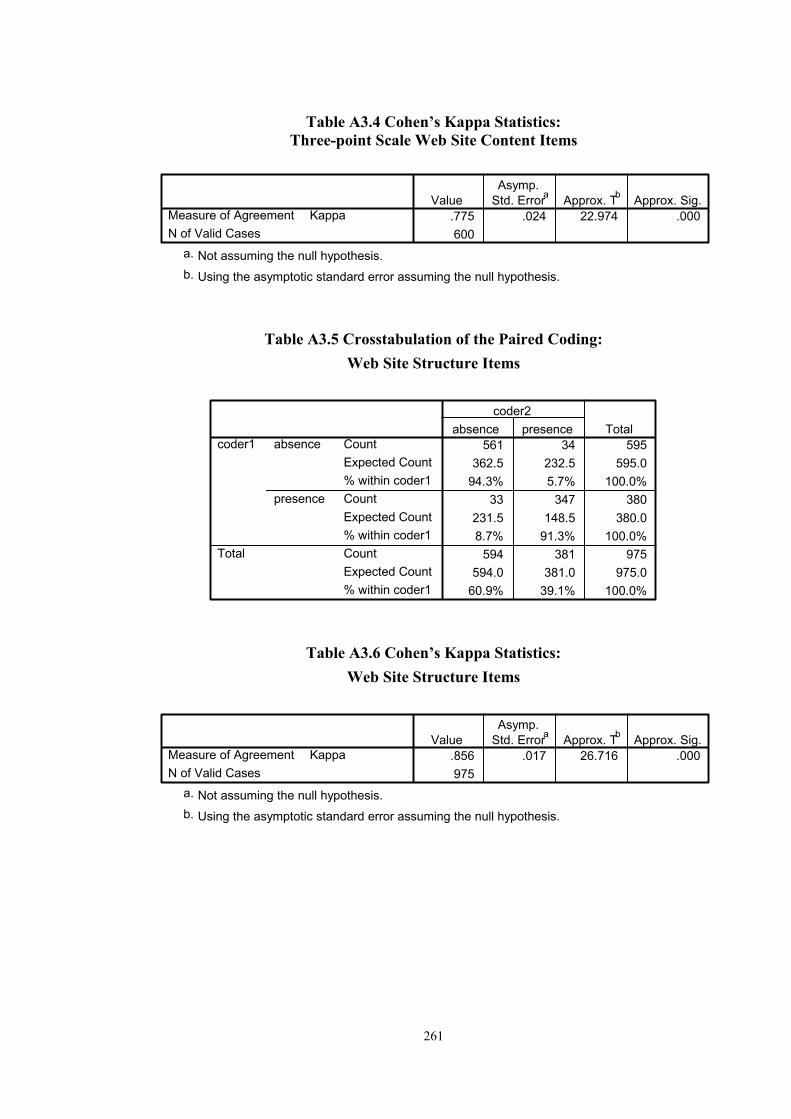
261
Table A3.4 Cohen’s Kappa Statistics: Three-point Scale Web Site Content Items
.775 .024 22.974 .000600
KappaMeasure of AgreementN of Valid Cases
ValueAsymp.
Std. Errora Approx. Tb Approx. Sig.
Not assuming the null hypothesis.a.
Using the asymptotic standard error assuming the null hypothesis.b.
Table A3.5 Crosstabulation of the Paired Coding: Web Site Structure Items
561 34 595362.5 232.5 595.0
94.3% 5.7% 100.0%33 347 380
231.5 148.5 380.08.7% 91.3% 100.0%
594 381 975594.0 381.0 975.0
60.9% 39.1% 100.0%
CountExpected Count% within coder1CountExpected Count% within coder1CountExpected Count% within coder1
absence
presence
coder1
Total
absence presencecoder2
Total
Table A3.6 Cohen’s Kappa Statistics: Web Site Structure Items
.856 .017 26.716 .000975
KappaMeasure of AgreementN of Valid Cases
ValueAsymp.
Std. Errora Approx. Tb Approx. Sig.
Not assuming the null hypothesis.a.
Using the asymptotic standard error assuming the null hypothesis.b.
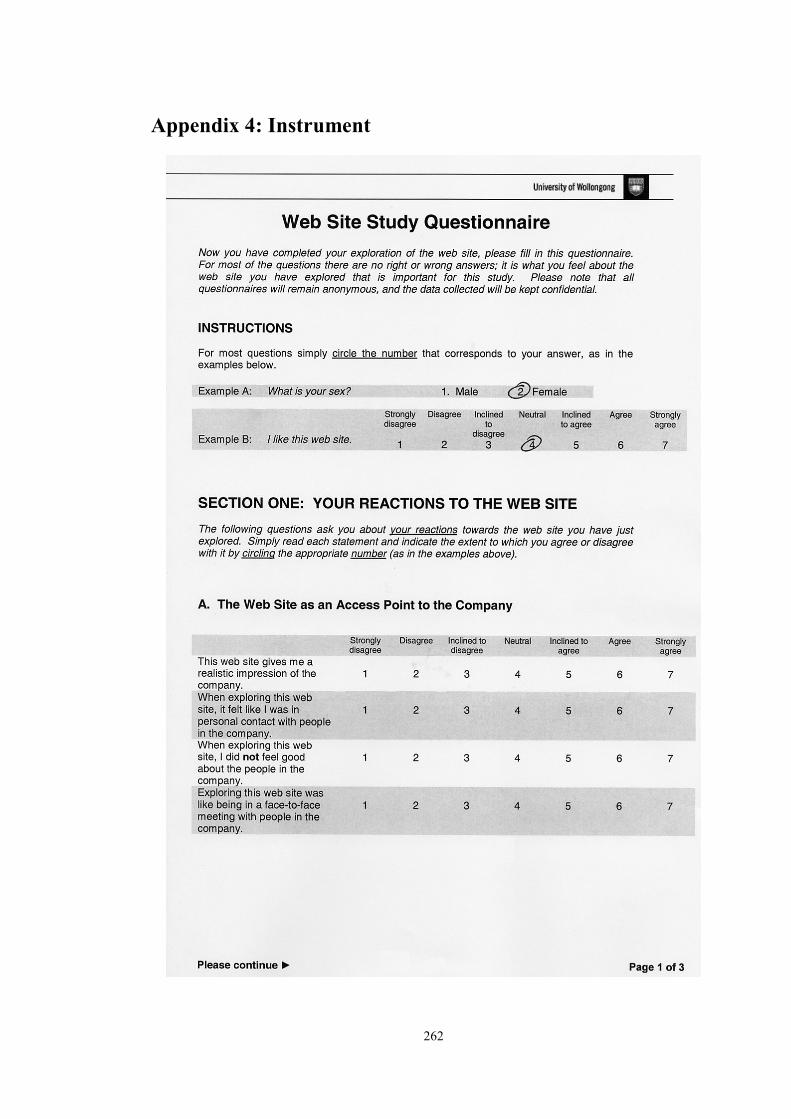
262
Appendix 4: Instrument
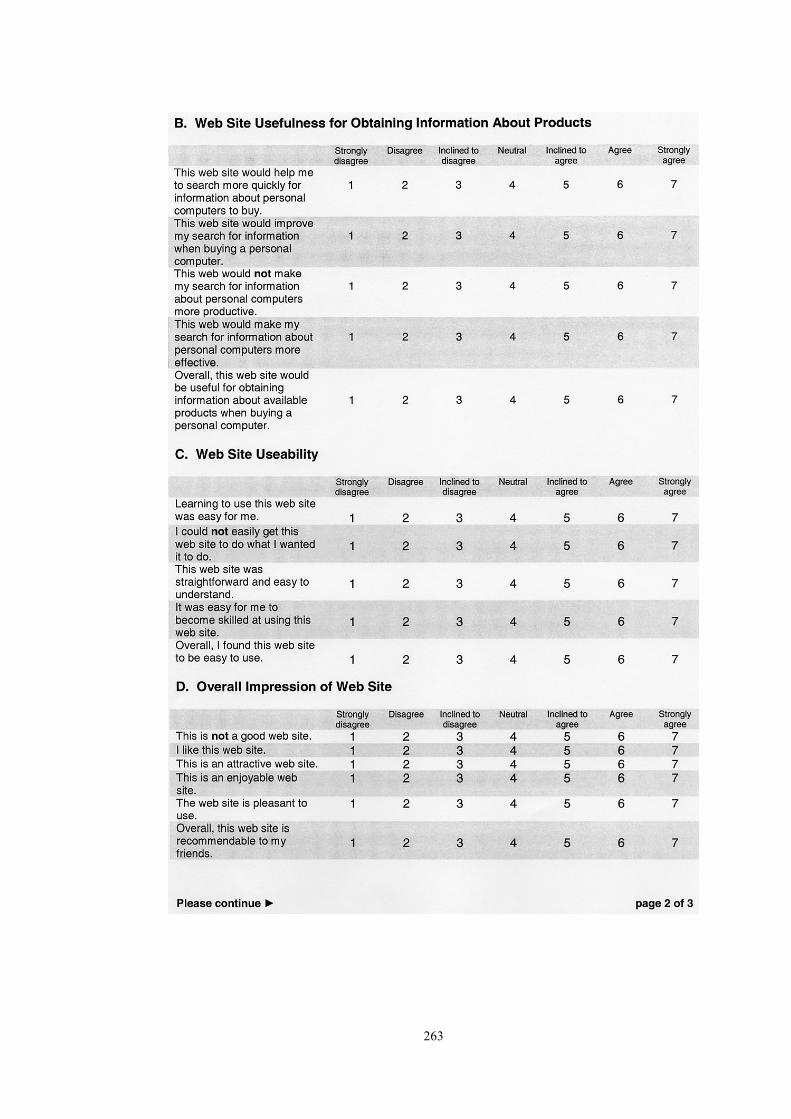
263

264
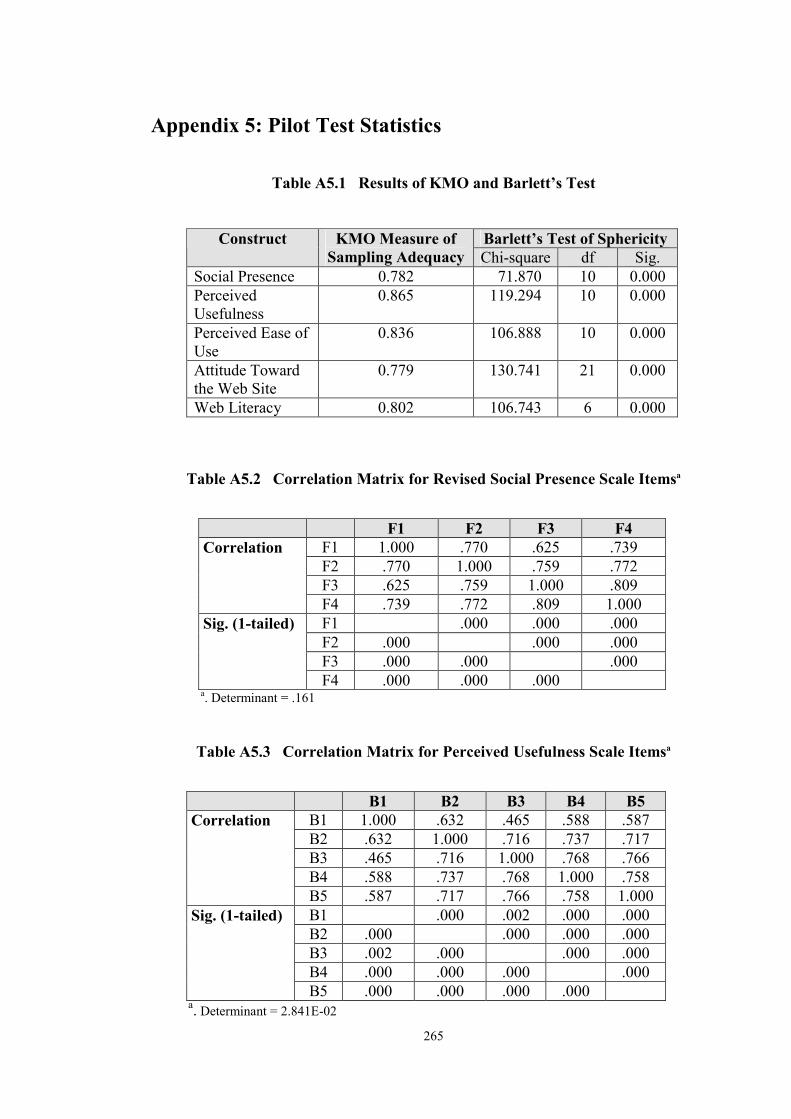
265
Appendix 5: Pilot Test Statistics
Table A5.1 Results of KMO and Barlett’s Test
Barlett’s Test of Sphericity Construct KMO Measure of Sampling Adequacy Chi-square df Sig.
Social Presence 0.782 71.870 10 0.000 Perceived Usefulness
0.865 119.294 10 0.000
Perceived Ease of Use
0.836 106.888 10 0.000
Attitude Toward the Web Site
0.779 130.741 21 0.000
Web Literacy 0.802 106.743 6 0.000
Table A5.2 Correlation Matrix for Revised Social Presence Scale Itemsa
F1 F2 F3 F4 F1 1.000 .770 .625 .739 F2 .770 1.000 .759 .772 F3 .625 .759 1.000 .809
Correlation
F4 .739 .772 .809 1.000 F1 .000 .000 .000 F2 .000 .000 .000 F3 .000 .000 .000
Sig. (1-tailed)
F4 .000 .000 .000 a. Determinant = .161
Table A5.3 Correlation Matrix for Perceived Usefulness Scale Itemsa
B1 B2 B3 B4 B5 B1 1.000 .632 .465 .588 .587 B2 .632 1.000 .716 .737 .717 B3 .465 .716 1.000 .768 .766 B4 .588 .737 .768 1.000 .758
Correlation B5 .587 .717 .766 .758 1.000
B1 .000 .002 .000 .000 B2 .000 .000 .000 .000 B3 .002 .000 .000 .000 B4 .000 .000 .000 .000
Sig. (1-tailed)
B5 .000 .000 .000 .000 a. Determinant = 2.841E-02
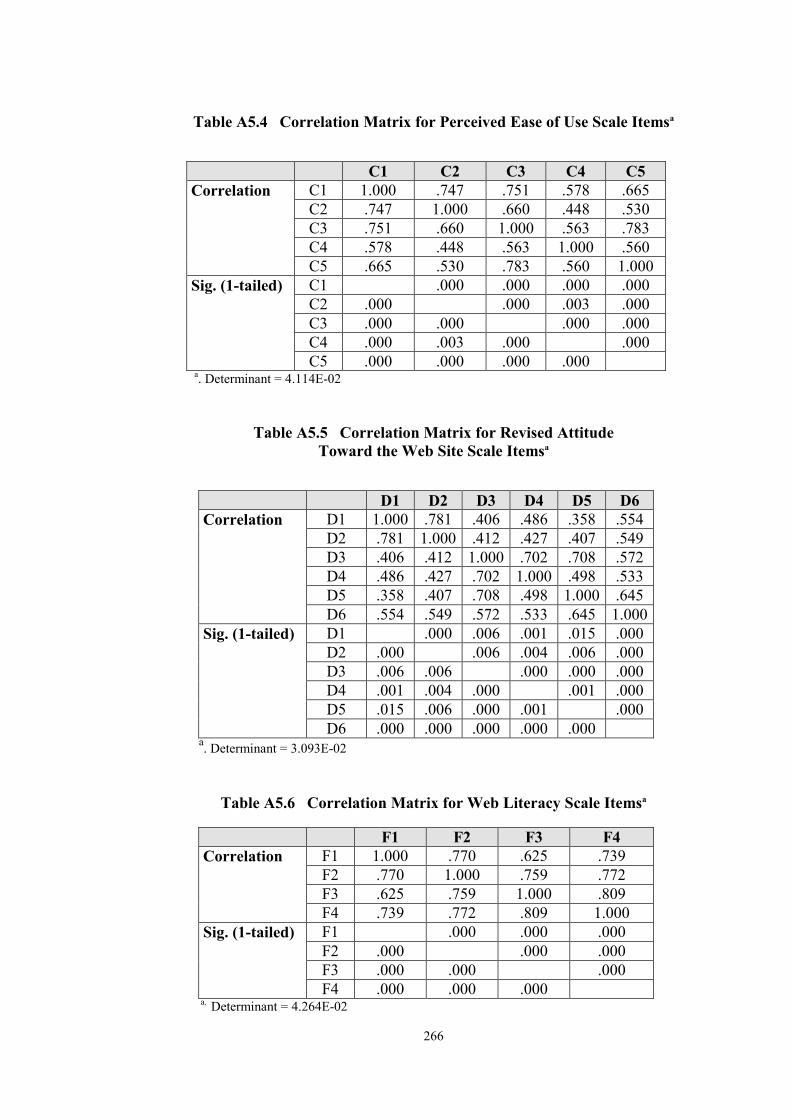
266
Table A5.4 Correlation Matrix for Perceived Ease of Use Scale Itemsa
C1 C2 C3 C4 C5 C1 1.000 .747 .751 .578 .665 C2 .747 1.000 .660 .448 .530 C3 .751 .660 1.000 .563 .783 C4 .578 .448 .563 1.000 .560
Correlation C5 .665 .530 .783 .560 1.000
C1 .000 .000 .000 .000 C2 .000 .000 .003 .000 C3 .000 .000 .000 .000 C4 .000 .003 .000 .000
Sig. (1-tailed)
C5 .000 .000 .000 .000 a. Determinant = 4.114E-02
Table A5.5 Correlation Matrix for Revised Attitude Toward the Web Site Scale Itemsa
D1 D2 D3 D4 D5 D6 D1 1.000 .781 .406 .486 .358 .554 D2 .781 1.000 .412 .427 .407 .549 D3 .406 .412 1.000 .702 .708 .572 D4 .486 .427 .702 1.000 .498 .533 D5 .358 .407 .708 .498 1.000 .645
Correlation D6 .554 .549 .572 .533 .645 1.000
D1 .000 .006 .001 .015 .000 D2 .000 .006 .004 .006 .000 D3 .006 .006 .000 .000 .000 D4 .001 .004 .000 .001 .000 D5 .015 .006 .000 .001 .000
Sig. (1-tailed)
D6 .000 .000 .000 .000 .000 a. Determinant = 3.093E-02
Table A5.6 Correlation Matrix for Web Literacy Scale Itemsa
F1 F2 F3 F4
F1 1.000 .770 .625 .739 F2 .770 1.000 .759 .772 F3 .625 .759 1.000 .809
Correlation
F4 .739 .772 .809 1.000 F1 .000 .000 .000 F2 .000 .000 .000 F3 .000 .000 .000
Sig. (1-tailed)
F4 .000 .000 .000 a. Determinant = 4.264E-02
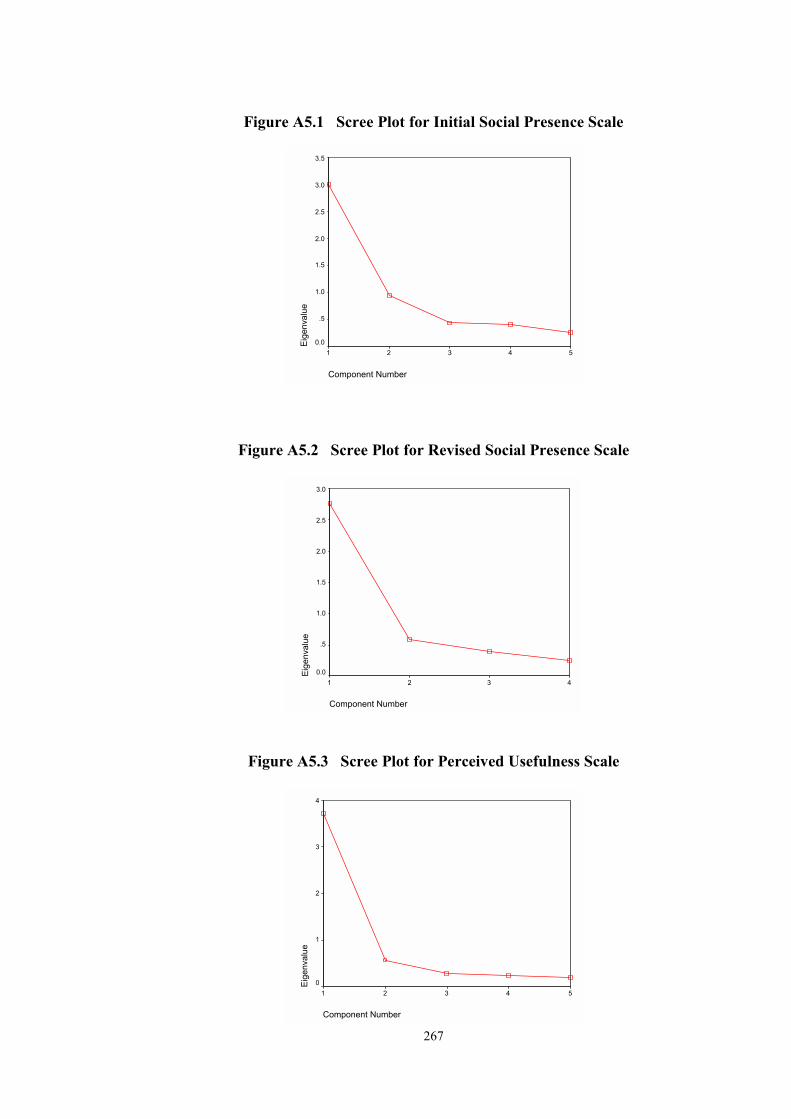
267
Figure A5.1 Scree Plot for Initial Social Presence Scale
Component Number
54321
Eig
enva
lue
3.5
3.0
2.5
2.0
1.5
1.0
.5
0.0
Figure A5.2 Scree Plot for Revised Social Presence Scale
Component Number
4321
Eige
nval
ue
3.0
2.5
2.0
1.5
1.0
.5
0.0
Figure A5.3 Scree Plot for Perceived Usefulness Scale
Component Number
54321
Eige
nval
ue
4
3
2
1
0
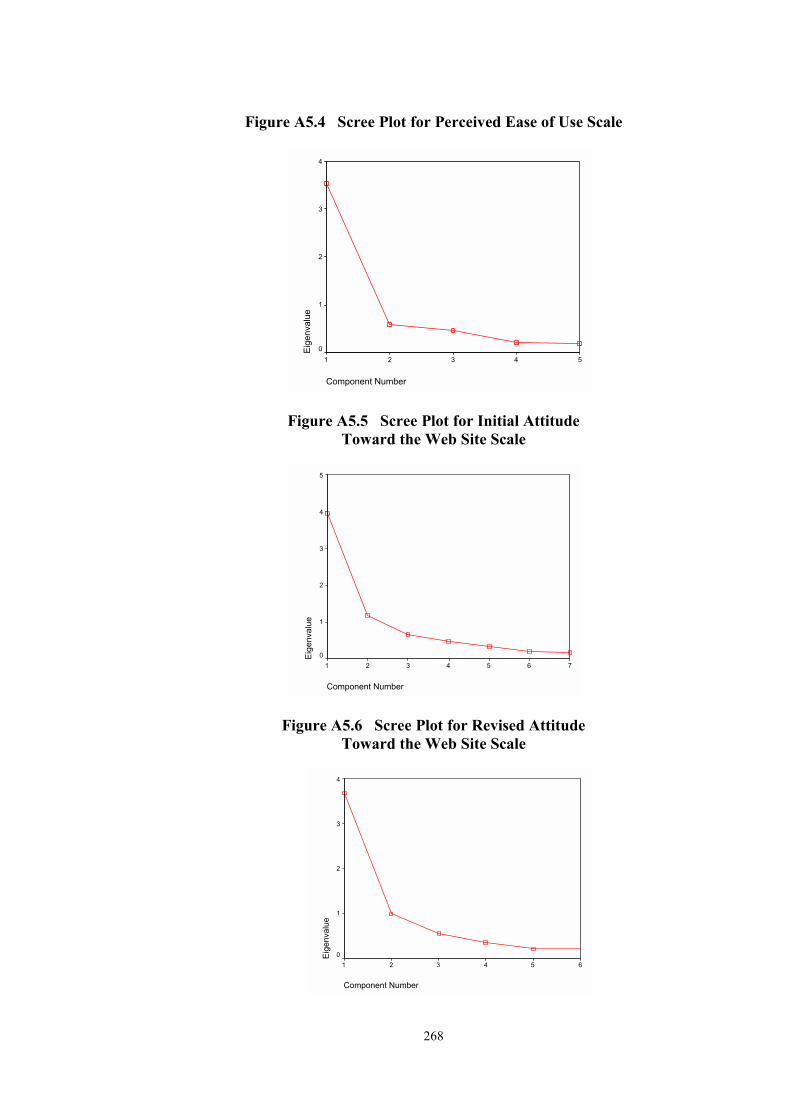
268
Figure A5.4 Scree Plot for Perceived Ease of Use Scale
Component Number
54321
Eig
enva
lue
4
3
2
1
0
Figure A5.5 Scree Plot for Initial Attitude Toward the Web Site Scale
Component Number
7654321
Eig
enva
lue
5
4
3
2
1
0
Figure A5.6 Scree Plot for Revised Attitude Toward the Web Site Scale
Component Number
654321
Eig
enva
lue
4
3
2
1
0
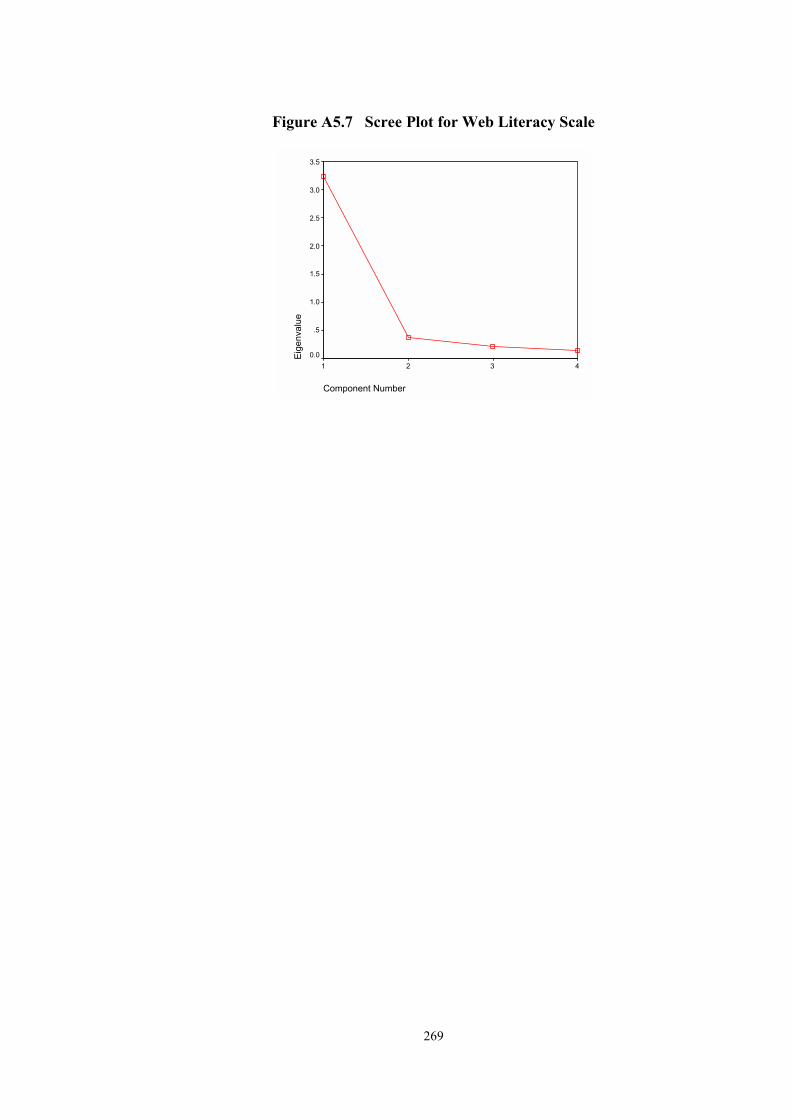
269
Figure A5.7 Scree Plot for Web Literacy Scale
Component Number
4321
Eige
nval
ue
3.5
3.0
2.5
2.0
1.5
1.0
.5
0.0
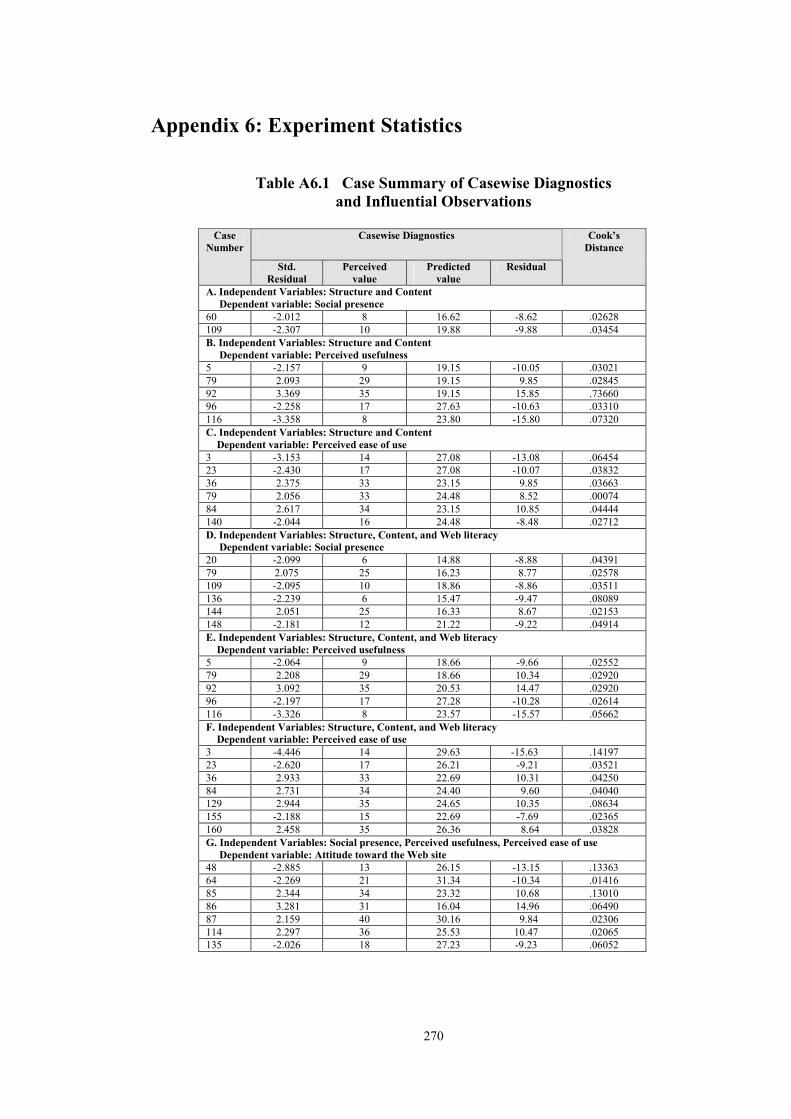
270
Appendix 6: Experiment Statistics
Table A6.1 Case Summary of Casewise Diagnostics and Influential Observations
Casewise Diagnostics Case
Number
Std. Residual
Perceived value
Predicted value
Residual
Cook’s Distance
A. Independent Variables: Structure and Content Dependent variable: Social presence 60 -2.012 8 16.62 -8.62 .02628 109 -2.307 10 19.88 -9.88 .03454 B. Independent Variables: Structure and Content Dependent variable: Perceived usefulness 5 -2.157 9 19.15 -10.05 .03021 79 2.093 29 19.15 9.85 .02845 92 3.369 35 19.15 15.85 .73660 96 -2.258 17 27.63 -10.63 .03310 116 -3.358 8 23.80 -15.80 .07320 C. Independent Variables: Structure and Content Dependent variable: Perceived ease of use 3 -3.153 14 27.08 -13.08 .06454 23 -2.430 17 27.08 -10.07 .03832 36 2.375 33 23.15 9.85 .03663 79 2.056 33 24.48 8.52 .00074 84 2.617 34 23.15 10.85 .04444 140 -2.044 16 24.48 -8.48 .02712 D. Independent Variables: Structure, Content, and Web literacy Dependent variable: Social presence 20 -2.099 6 14.88 -8.88 .04391 79 2.075 25 16.23 8.77 .02578 109 -2.095 10 18.86 -8.86 .03511 136 -2.239 6 15.47 -9.47 .08089 144 2.051 25 16.33 8.67 .02153 148 -2.181 12 21.22 -9.22 .04914 E. Independent Variables: Structure, Content, and Web literacy Dependent variable: Perceived usefulness 5 -2.064 9 18.66 -9.66 .02552 79 2.208 29 18.66 10.34 .02920 92 3.092 35 20.53 14.47 .02920 96 -2.197 17 27.28 -10.28 .02614 116 -3.326 8 23.57 -15.57 .05662 F. Independent Variables: Structure, Content, and Web literacy Dependent variable: Perceived ease of use 3 -4.446 14 29.63 -15.63 .14197 23 -2.620 17 26.21 -9.21 .03521 36 2.933 33 22.69 10.31 .04250 84 2.731 34 24.40 9.60 .04040 129 2.944 35 24.65 10.35 .08634 155 -2.188 15 22.69 -7.69 .02365 160 2.458 35 26.36 8.64 .03828 G. Independent Variables: Social presence, Perceived usefulness, Perceived ease of use Dependent variable: Attitude toward the Web site 48 -2.885 13 26.15 -13.15 .13363 64 -2.269 21 31.34 -10.34 .01416 85 2.344 34 23.32 10.68 .13010 86 3.281 31 16.04 14.96 .06490 87 2.159 40 30.16 9.84 .02306 114 2.297 36 25.53 10.47 .02065 135 -2.026 18 27.23 -9.23 .06052
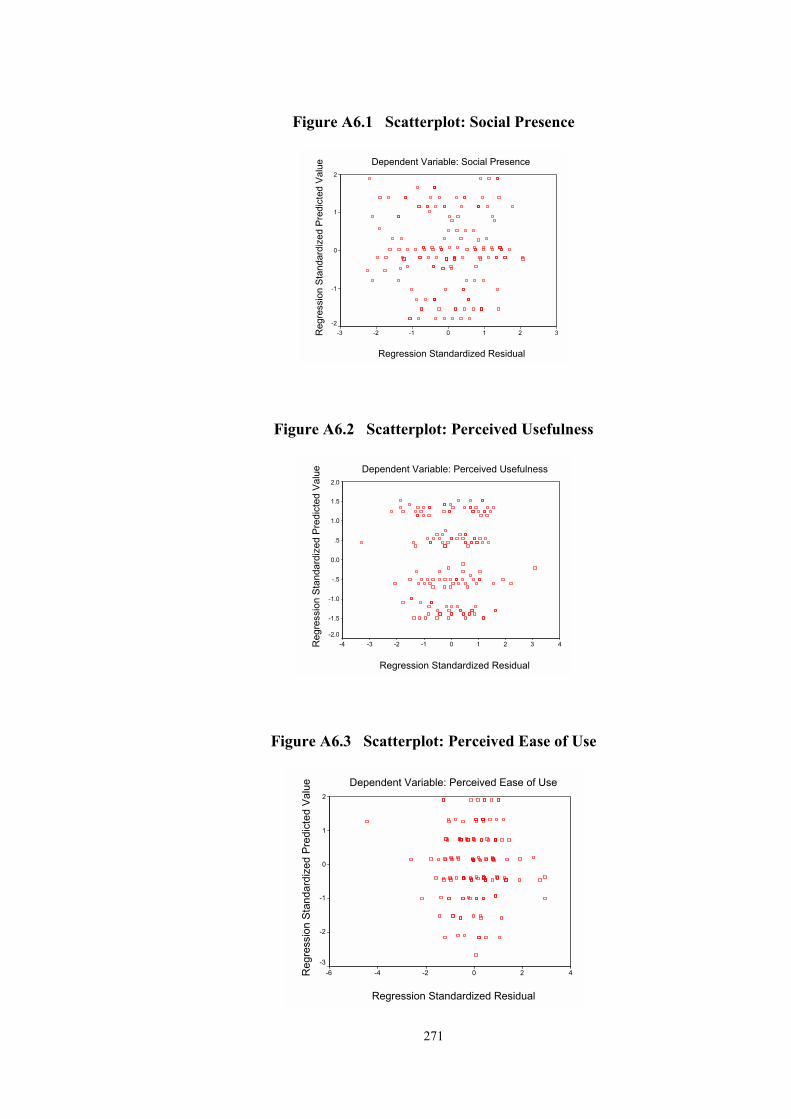
271
Figure A6.1 Scatterplot: Social Presence
Dependent Variable: Social Presence
Regression Standardized Residual
3210-1-2-3Reg
ress
ion
Sta
ndar
dize
d P
redi
cted
Val
ue
2
1
0
-1
-2
Figure A6.2 Scatterplot: Perceived Usefulness
Dependent Variable: Perceived Usefulness
Regression Standardized Residual
43210-1-2-3-4Reg
ress
ion
Sta
ndar
dize
d P
redi
cted
Val
ue
2.0
1.5
1.0
.5
0.0
-.5
-1.0
-1.5
-2.0
Figure A6.3 Scatterplot: Perceived Ease of Use
Dependent Variable: Perceived Ease of Use
Regression Standardized Residual
420-2-4-6Reg
ress
ion
Stan
dard
ized
Pre
dict
ed V
alue
2
1
0
-1
-2
-3

272
Figure A6.4 Scatterplot: Attitude Toward the Web Site
Dependent Variable: Attitude Toward the Web Site
Regression Standardized Residual
43210-1-2-3Reg
ress
ion
Sta
ndar
dize
d P
redi
cted
Val
ue
3
2
1
0
-1
-2
-3
Figure A6.5 Partial Regression Plot: Social Presence vs. Attitude Toward the Web Site
Social Presence
100-10
Attit
ude
Tow
ard
the
Web
Site
20
10
0
-10
-20
-30
Figure A6.6 Partial Regression Plot: Perceived Usefulness vs. Attitude Toward the Web Site
Perceived Usefulness
20100-10-20
Atti
tude
Tow
ard
the
Web
Site
20
10
0
-10
-20
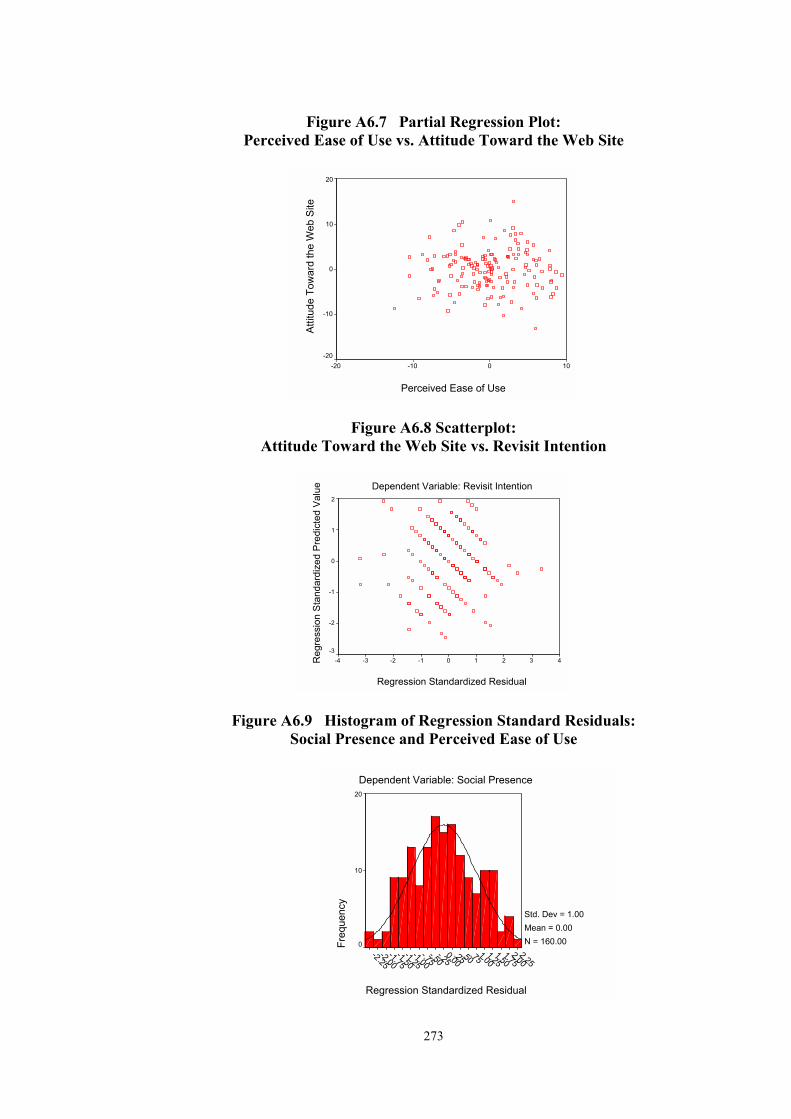
273
Figure A6.7 Partial Regression Plot: Perceived Ease of Use vs. Attitude Toward the Web Site
Perceived Ease of Use
100-10-20
Atti
tude
Tow
ard
the
Web
Site
20
10
0
-10
-20
Figure A6.8 Scatterplot: Attitude Toward the Web Site vs. Revisit Intention
Dependent Variable: Revisit Intention
Regression Standardized Residual
43210-1-2-3-4Reg
ress
ion
Sta
ndar
dize
d P
redi
cted
Val
ue
2
1
0
-1
-2
-3
Figure A6.9 Histogram of Regression Standard Residuals: Social Presence and Perceived Ease of Use
Regression Standardized Residual
2.252.00
1.751.50
1.251.00
.75.50.250.00-.25
-.50-.75
-1.00-1.25
-1.50-1.75
-2.00-2.25
Dependent Variable: Social Presence
Freq
uenc
y
20
10
0
Std. Dev = 1.00 Mean = 0.00N = 160.00
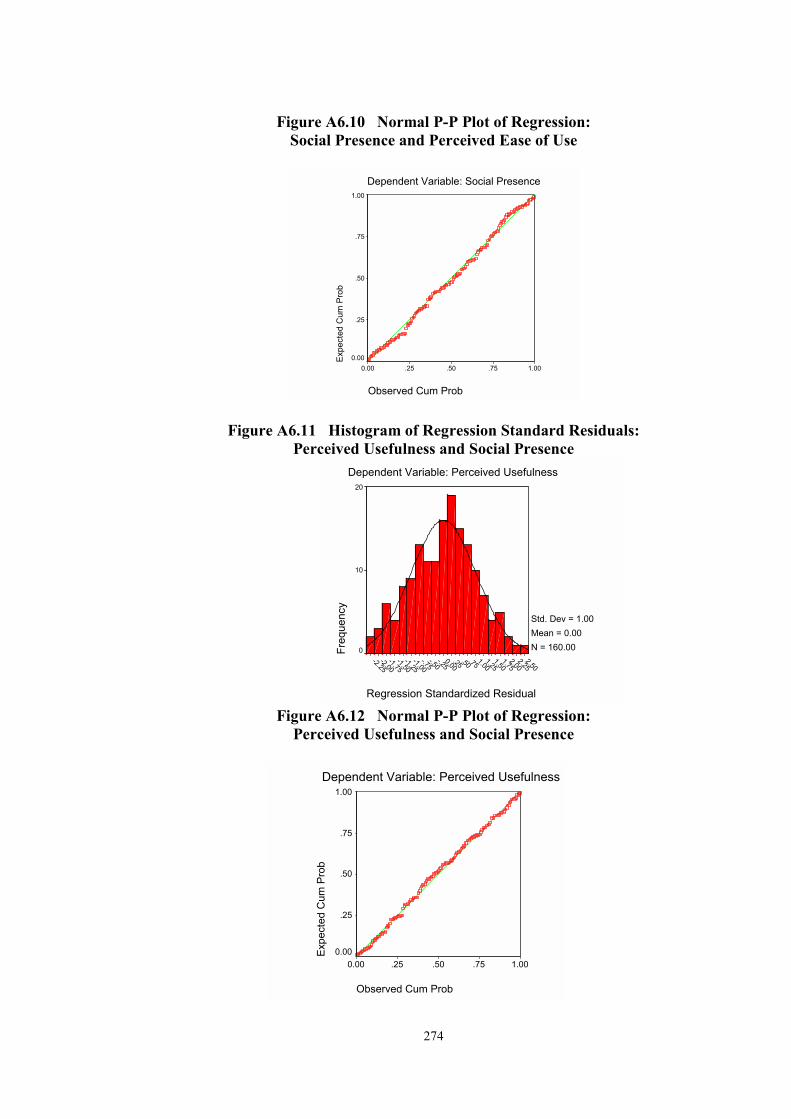
274
Figure A6.10 Normal P-P Plot of Regression: Social Presence and Perceived Ease of Use
Dependent Variable: Social Presence
Observed Cum Prob
1.00.75.50.250.00
Exp
ecte
d C
um P
rob
1.00
.75
.50
.25
0.00
Figure A6.11 Histogram of Regression Standard Residuals: Perceived Usefulness and Social Presence
Regression Standardized Residual
2.502.25
2.001.75
1.501.25
1.00.75.50.250.00
-.25-.50
-.75-1.00
-1.25-1.50
-1.75-2.00
-2.25
Dependent Variable: Perceived Usefulness
Freq
uenc
y
20
10
0
Std. Dev = 1.00 Mean = 0.00N = 160.00
Figure A6.12 Normal P-P Plot of Regression:
Perceived Usefulness and Social Presence
Dependent Variable: Perceived Usefulness
Observed Cum Prob
1.00.75.50.250.00
Expe
cted
Cum
Pro
b
1.00
.75
.50
.25
0.00
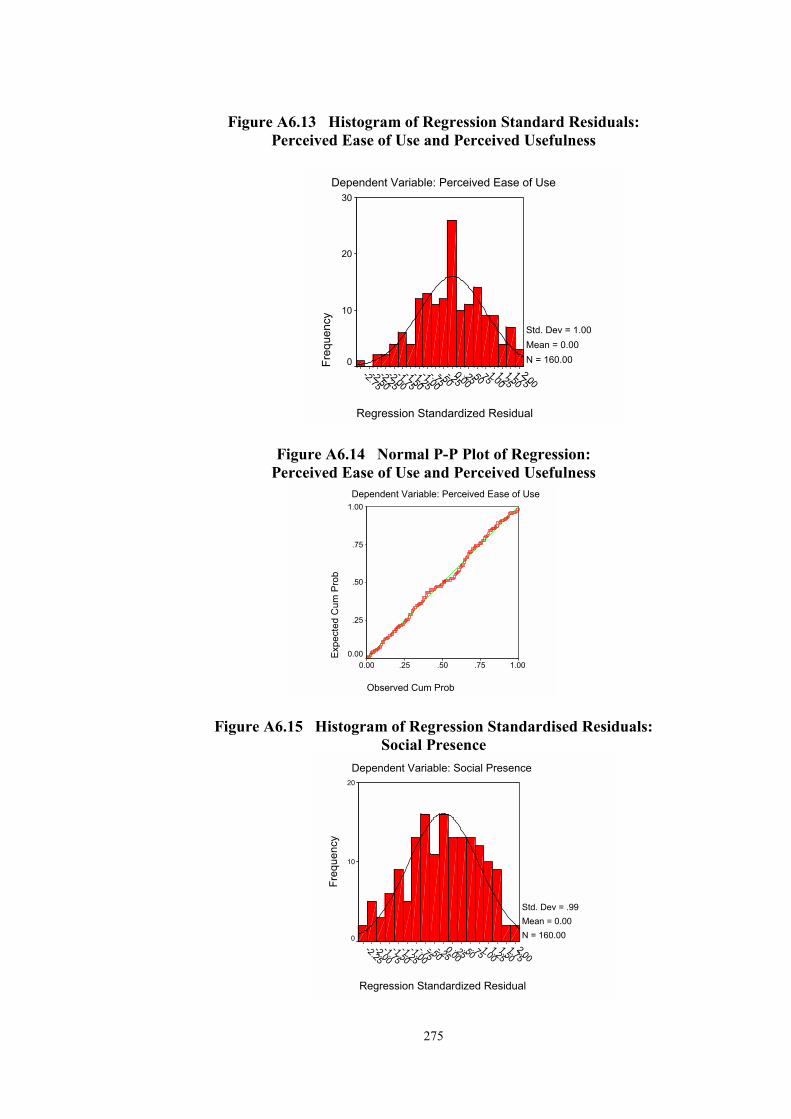
275
Figure A6.13 Histogram of Regression Standard Residuals: Perceived Ease of Use and Perceived Usefulness
Regression Standardized Residual
2.001.75
1.501.25
1.00.75.50.250.00
-.25-.50
-.75-1.00
-1.25-1.50
-1.75-2.00
-2.25-2.50
-2.75
Dependent Variable: Perceived Ease of Use
Freq
uenc
y
30
20
10
0
Std. Dev = 1.00 Mean = 0.00N = 160.00
Figure A6.14 Normal P-P Plot of Regression: Perceived Ease of Use and Perceived Usefulness
Dependent Variable: Perceived Ease of Use
Observed Cum Prob
1.00.75.50.250.00
Expe
cted
Cum
Pro
b
1.00
.75
.50
.25
0.00
Figure A6.15 Histogram of Regression Standardised Residuals: Social Presence
Regression Standardized Residual
2.001.75
1.501.25
1.00.75.50.250.00
-.25-.50
-.75-1.00
-1.25-1.50
-1.75-2.00
-2.25
Dependent Variable: Social Presence
Freq
uenc
y
20
10
0
Std. Dev = .99 Mean = 0.00N = 160.00
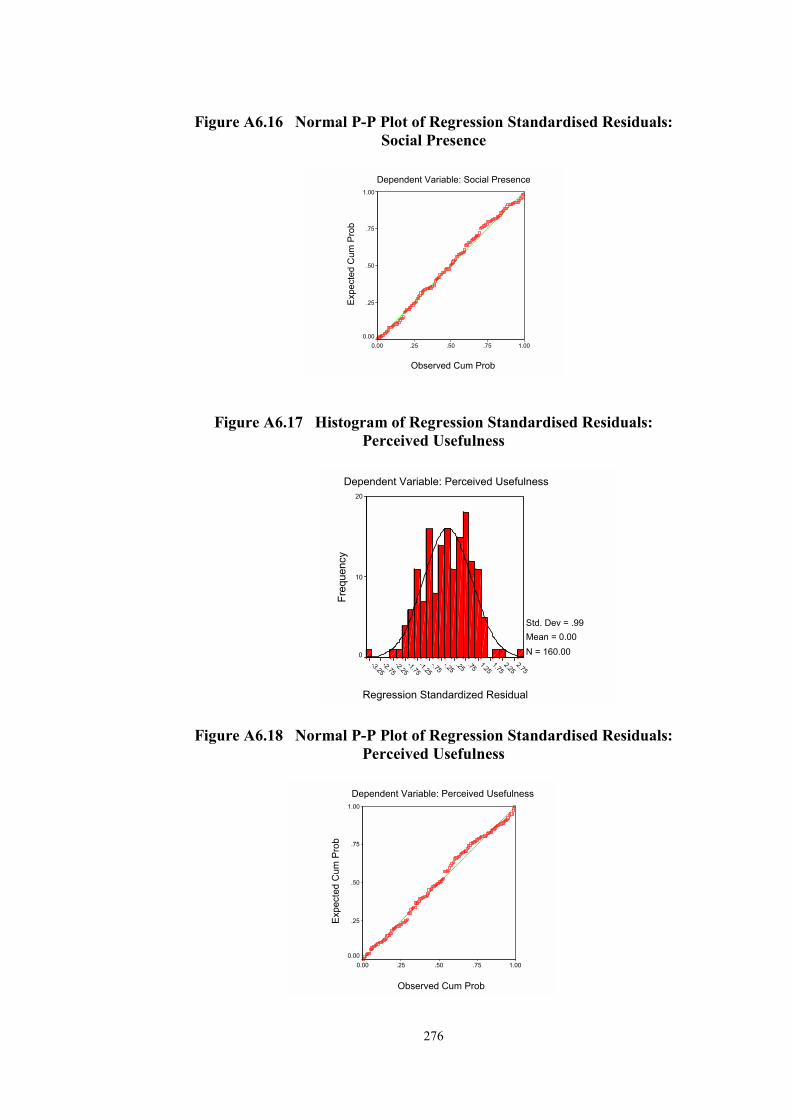
276
Figure A6.16 Normal P-P Plot of Regression Standardised Residuals: Social Presence
Dependent Variable: Social Presence
Observed Cum Prob
1.00.75.50.250.00E
xpec
ted
Cum
Pro
b
1.00
.75
.50
.25
0.00
Figure A6.17 Histogram of Regression Standardised Residuals: Perceived Usefulness
Regression Standardized Residual
2.752.25
1.751.25
.75.25-.25-.75
-1.25-1.75
-2.25-2.75
-3.25
Dependent Variable: Perceived Usefulness
Freq
uenc
y
20
10
0
Std. Dev = .99 Mean = 0.00N = 160.00
Figure A6.18 Normal P-P Plot of Regression Standardised Residuals: Perceived Usefulness
Dependent Variable: Perceived Usefulness
Observed Cum Prob
1.00.75.50.250.00
Exp
ecte
d C
um P
rob
1.00
.75
.50
.25
0.00
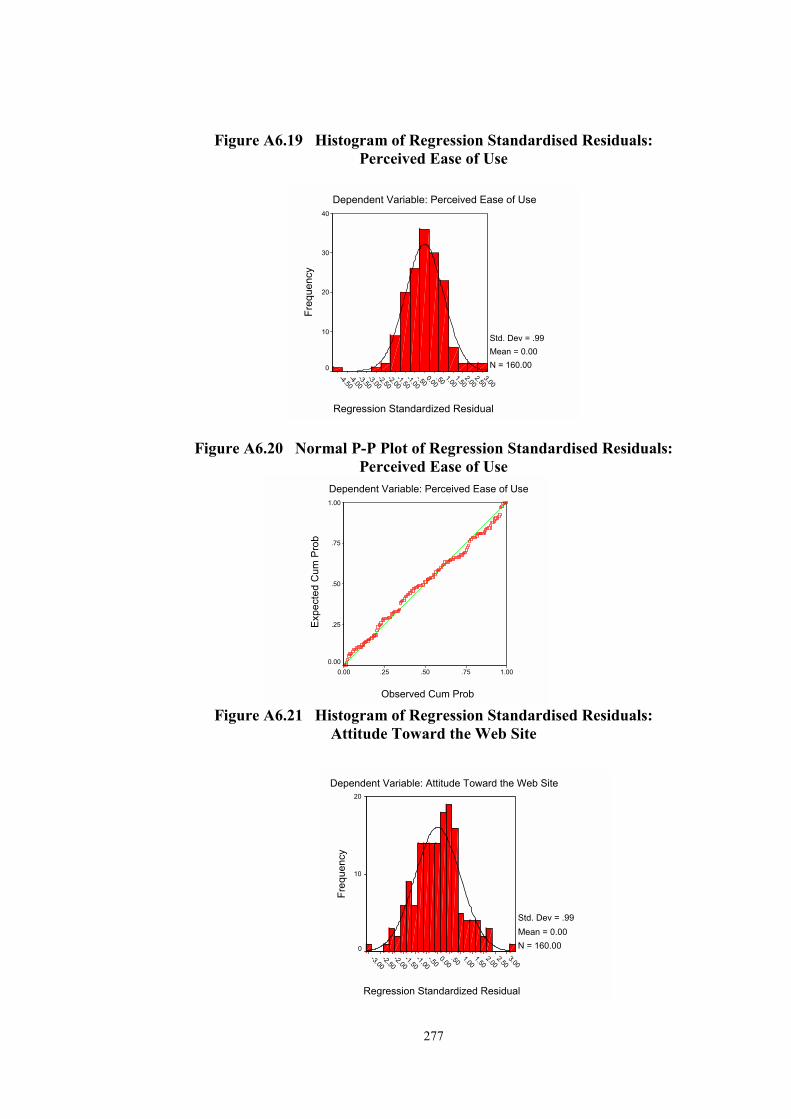
277
Figure A6.19 Histogram of Regression Standardised Residuals:
Perceived Ease of Use
Regression Standardized Residual
3.002.50
2.001.50
1.00.500.00
-.50-1.00
-1.50-2.00
-2.50-3.00
-3.50-4.00
-4.50
Dependent Variable: Perceived Ease of Use
Freq
uenc
y
40
30
20
10
0
Std. Dev = .99 Mean = 0.00N = 160.00
Figure A6.20 Normal P-P Plot of Regression Standardised Residuals: Perceived Ease of Use
Dependent Variable: Perceived Ease of Use
Observed Cum Prob
1.00.75.50.250.00
Exp
ecte
d C
um P
rob
1.00
.75
.50
.25
0.00
Figure A6.21 Histogram of Regression Standardised Residuals:
Attitude Toward the Web Site
Regression Standardized Residual
3.002.50
2.001.50
1.00.500.00
-.50-1.00
-1.50-2.00
-2.50-3.00
Dependent Variable: Attitude Toward the Web Site
Freq
uenc
y
20
10
0
Std. Dev = .99 Mean = 0.00N = 160.00
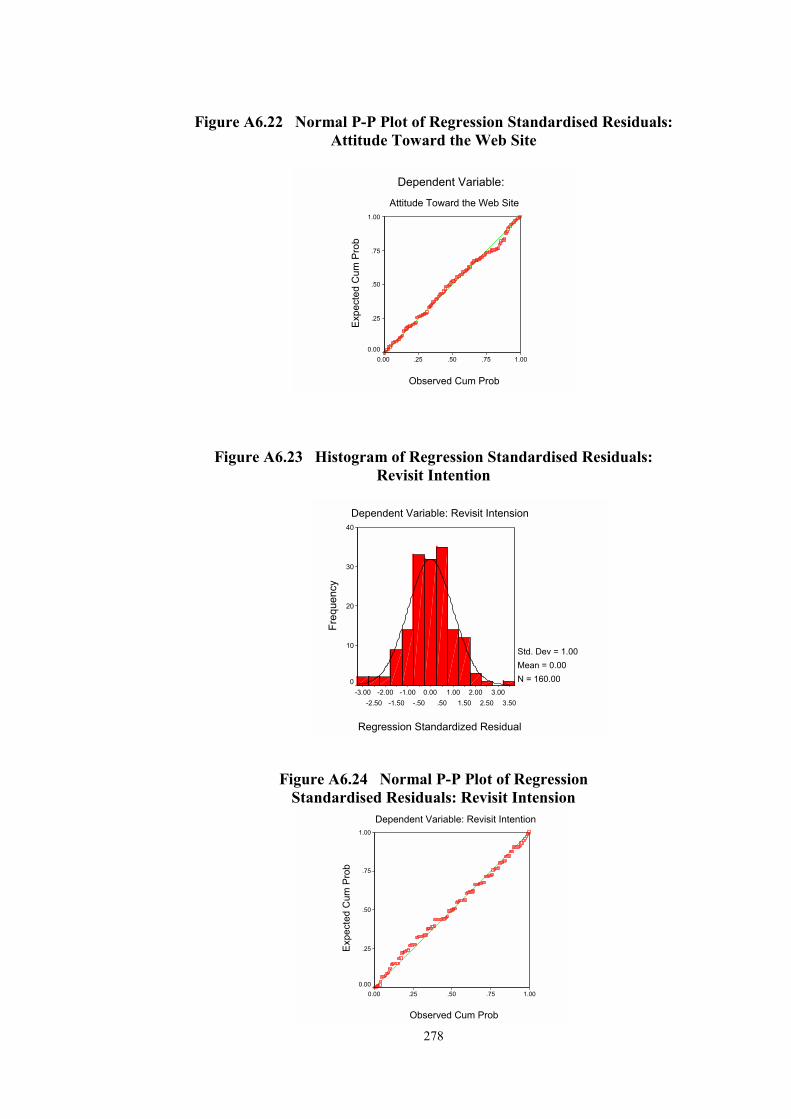
278
Figure A6.22 Normal P-P Plot of Regression Standardised Residuals: Attitude Toward the Web Site
Dependent Variable:
Attitude Toward the Web Site
Observed Cum Prob
1.00.75.50.250.00E
xpec
ted
Cum
Pro
b
1.00
.75
.50
.25
0.00
Figure A6.23 Histogram of Regression Standardised Residuals: Revisit Intention
Regression Standardized Residual
3.503.00
2.502.00
1.501.00
.500.00
-.50-1.00
-1.50-2.00
-2.50-3.00
Dependent Variable: Revisit Intension
Freq
uenc
y
40
30
20
10
0
Std. Dev = 1.00 Mean = 0.00N = 160.00
Figure A6.24 Normal P-P Plot of Regression Standardised Residuals: Revisit Intension
Dependent Variable: Revisit Intention
Observed Cum Prob
1.00.75.50.250.00
Exp
ecte
d C
um P
rob
1.00
.75
.50
.25
0.00
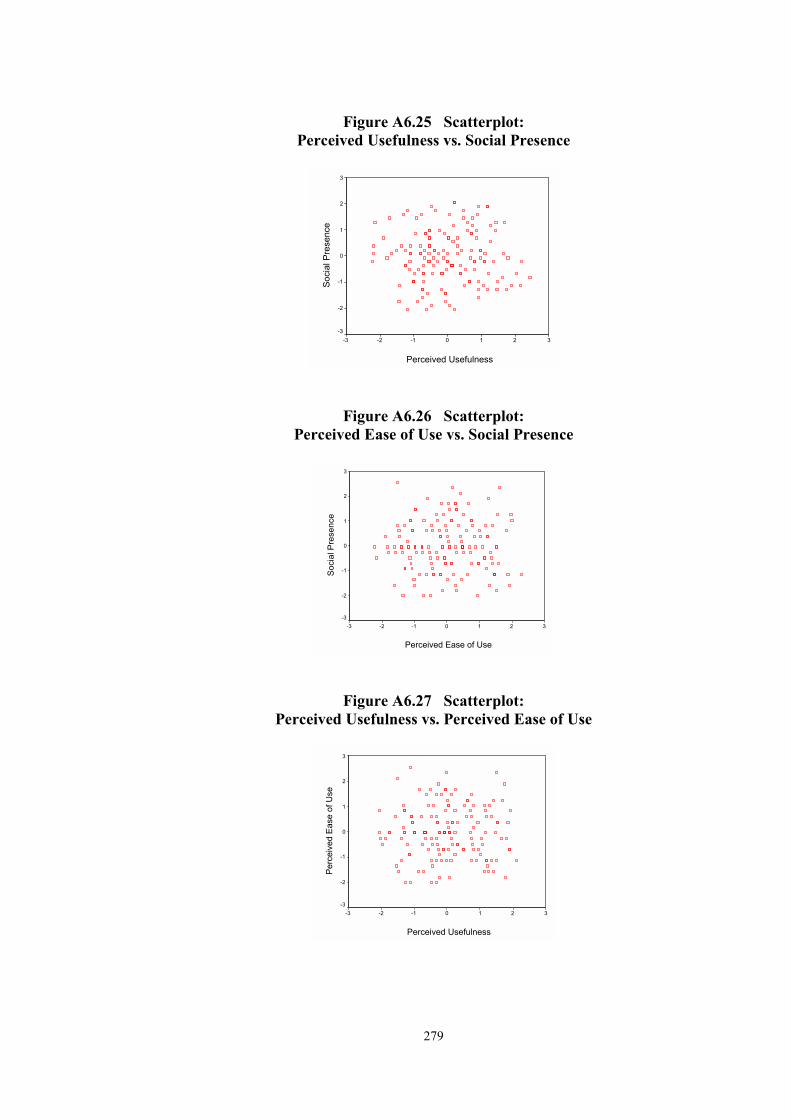
279
Figure A6.25 Scatterplot: Perceived Usefulness vs. Social Presence
Perceived Usefulness
3210-1-2-3
Soci
al P
rese
nce
3
2
1
0
-1
-2
-3
Figure A6.26 Scatterplot: Perceived Ease of Use vs. Social Presence
Perceived Ease of Use
3210-1-2-3
Soc
ial P
rese
nce
3
2
1
0
-1
-2
-3
Figure A6.27 Scatterplot: Perceived Usefulness vs. Perceived Ease of Use
Perceived Usefulness
3210-1-2-3
Perc
eive
d Ea
se o
f Use
3
2
1
0
-1
-2
-3
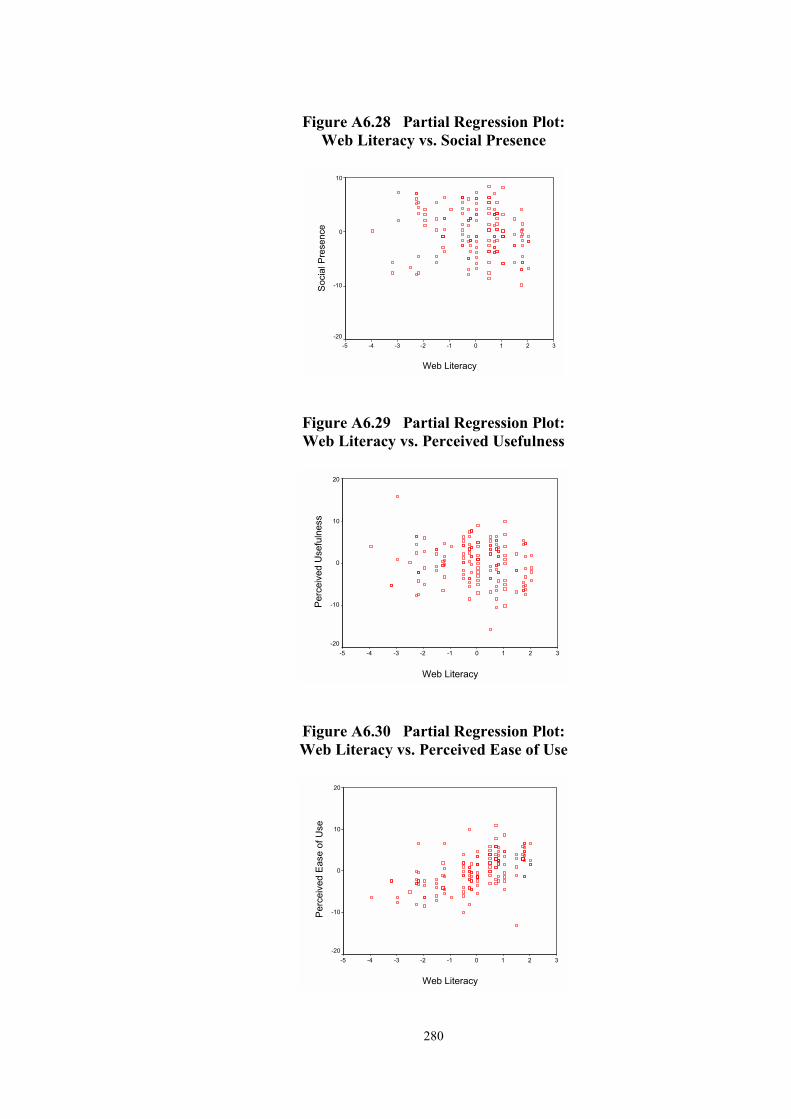
280
Figure A6.28 Partial Regression Plot: Web Literacy vs. Social Presence
Web Literacy
3210-1-2-3-4-5
Soc
ial P
rese
nce
10
0
-10
-20
Figure A6.29 Partial Regression Plot: Web Literacy vs. Perceived Usefulness
Web Literacy
3210-1-2-3-4-5
Perc
eive
d U
sefu
lnes
s
20
10
0
-10
-20
Figure A6.30 Partial Regression Plot: Web Literacy vs. Perceived Ease of Use
Web Literacy
3210-1-2-3-4-5
Per
ceiv
ed E
ase
of U
se
20
10
0
-10
-20