An examination of the job market for entrepreneurship faculty from 1989 to 2014
55
AN EXAMINATION OF THE JOB MARKET FOR ENTREPRENEURSHIP FACULTY FROM 1989 TO 2014 Todd A. Finkle, Gonzaga University ABSTRACT Utilizing institutional theory this article examines data based on the trends in the market for entrepreneurship faculty over the past 25 years. Data is provided from June, 1989 through June, 2014 on advertised candidates and positions throughout the world. There were several significant findings in this study. During the most recent year, 2013/14, there were 258 advertised positions (both tenure track and non tenure track) for entrepreneurship faculty in Schools of Business and Management. During the same time frame, the number of advertised candidates was 147. The ratio of total jobs per candidate during 2013/14 was 1.76. This ratio is favorable to candidates seeking employment, however it must be noted that these positions included full-time tenure track, visiting professorships, instructors, adjuncts or part-time positions. The number of candidates (147) dropped to a level that we have not seen since 2005/06 and 84% below its peak in 2008/09 (270). Some
Transcript of An examination of the job market for entrepreneurship faculty from 1989 to 2014

AN EXAMINATION OF THE JOB MARKET FOR
ENTREPRENEURSHIP FACULTY FROM 1989 TO 2014
Todd A. Finkle, Gonzaga University
ABSTRACT
Utilizing institutional theory this article examines data based on
the trends in the market for entrepreneurship faculty over the past 25
years. Data is provided from June, 1989 through June, 2014 on advertised
candidates and positions throughout the world. There were several
significant findings in this study. During the most recent year, 2013/14,
there were 258 advertised positions (both tenure track and non tenure
track) for entrepreneurship faculty in Schools of Business and
Management. During the same time frame, the number of advertised
candidates was 147. The ratio of total jobs per candidate during 2013/14
was 1.76. This ratio is favorable to candidates seeking employment,
however it must be noted that these positions included full-time tenure
track, visiting professorships, instructors, adjuncts or part-time positions.
The number of candidates (147) dropped to a level that we have
not seen since 2005/06 and 84% below its peak in 2008/09 (270). Some

possible explanations for this trend may be related to the economy,
commitment, and supply versus demand. There could be a hangover
effect from earlier years where candidates had problems finding tenure
track positions. For example, in 2008/09 there were almost 100 more
tenure track candidates than tenure track positions (260 versus 165). In
2010/11 and 2011/12 there were another 50 candidates more than
tenure track openings. Furthermore, if we go back four to five years, the
typical amount of time to earn a Ph.D., we were in the middle of the
financial crisis. It could be that potential doctoral students were afraid
to make a long-term commitment due to the global economic crisis.
Related issues may be that potential doctoral students were afraid of
leaving their current jobs or they may have been afraid of their inability
to sell their houses during a housing depression. Another reason might
be a reduction in doctoral admissions as doctoral programs can be
costly to run. The same thing can be said for international candidates in
2013/14 as those numbers dropped to 44 from a peak of 81 in 2011/12.
During 2013/14, the number of tenure track positions (150) was
slightly higher than the number of tenure track candidates (138). The

findings show that the number of tenure track candidates in 2013/14
dropped to the second lowest level since 2005/06. Senior positions
continue to be in high demand with 52% of tenure track jobs advertising
for senior level positions. Schools are also recruiting more candidates
with a primary area in entrepreneurship.
INTRODUCTION
This article examines faculty trends within the
field of entrepreneurship. It comes at a very
important time to candidates and Schools of Business
and Management. Entrepreneurship is no longer a young
and emerging academic discipline. It has become
increasingly popular and more competitive. As such,
it is vital that faculty seeking jobs in the global
market understand the past and current trends that are
happening so they can maximize their career paths.
Likewise, Schools of Business and Management should
take notice of the findings to understand the

competitive landscape when they seek candidates and
potential doctoral candidates.
This study comes during a time of slow recovery
from the worst economic event since the Great
Depression of 1929. The world is now in its five year
of recovery since the bottom of the Great Recession in
March, 2009. Globally, we are still undergoing
deleveraging, which could last anywhere from 10-15
years since 2009.
The trends within higher education are
troublesome. The cost of higher education is enormous
with students coming out of schools with a huge debt
burden. According to CnnMoney.com, the average amount
of student loan debt for those leaving a US college
with an undergraduate degree in 2012 was $29,400
(Ellis, 2013). Mitchell (2014) reported that the
median debt for graduate students at the end of 2012
was $57,600, 43% higher than 2004. As of April, 2014

the US debt clock (see http://www.usdebtclock.org/)
showed that the total amount of student loan debt owed
in the US was approximately $1.286 trillion and
student loan debt has surpassed both credit card and
auto debt in the US. Furthermore, state funding for
higher education has decreased by 28% from 2008 to
2013.
Combine this with the potential disruption of the
traditional college model by online education or
Massive Open Online Courses (MOOCs). A few professors
have suggested that traditional, slow moving colleges
will lose out to quicker and nimbler colleges that
offer these types of educational opportunities.
Clayton M. Christensen, a Harvard professor of
business strategy, stated in a New York Times that the
"bottom 25 percent of every tier" of colleges will
disappear or merge in the next 10 to 15 years”
(Selingo, 2013). More recently, Richard Lyons, Dean

of the University of California-Berkeley School of
Business, stated that if the top MBA programs were to
put their programs online, up to 50% of all business
schools could fail within 5-10 years (Clark, 2014).
Under the backdrop of the changes in higher
education, this article investigates changes in the
number, level and priority of entrepreneurship
positions and candidates from all over the world from
1989/90 to 2013/14. This study examines the
institutionalization of the field of entrepreneurship
by examining the change in the number and level of
entrepreneurship positions, as well as the number,
level and training of entrepreneurship candidates from
1989-2014. One measure of institutional acceptance
within the field of entrepreneurship would be the
level of demand and supply for tenure track faculty in
the field. This study will address the question of
the institutionalization of the field by examining the

changes in the market for entrepreneurship faculty
between the academic years 1989/90 and 2013/14.
Institutional theory argues that organizations
operating in institutionalized environments
demonstrate that they are acting in a legitimate
manner adopting the structures and activities that are
perceived to be legitimate by their critical external
resource providers (Finkle & Deeds, 2001). In essence
by adopting the appropriate structures (institutions)
the organization increases its legitimacy and is able
to use this legitimacy to increase its support and
ensure its survival (Dowling & Pfeffer, 1975; Meyer &
Rowan, 1977).
I examine the global faculty trends in the field
of entrepreneurship by examining the entire sample of
advertised candidates and jobs from 1989-2014. This
study will answer the following research question: Is
the field of entrepreneurship becoming increasingly

institutionalized within Schools of Business and
Management? To answer this research question I will
examine the current trends in the global job market
for faculty in entrepreneurship. I will also examine
the percentage of current candidates and positions
that are tenure track.
EXTANT RESEARCH
Finkle and Deeds (2001; 2002) pioneered the first
study of trends of entrepreneurship faculty using
institutional theory (Meyer & Rowan, 1977). They
concluded that the field made significant progress
towards being institutionalized. However, it was
still not fully institutionalized because most of the
positions had been either non tenure track or
untenured assistant professorships. However, it was
still too soon to conclude that the commitment to
entrepreneurship by Schools of Business and
Management. One clear indication of the tenuous status

was that, unlike strategy, there was no mandate from
the AACSB that entrepreneurship be incorporated into
the curriculum of all accredited schools.
Entrepreneurship remained an elective subject in most
schools and therefore dependent on student interest.
Furthermore, the hiring of tenured faculty in
entrepreneurship and the creation of departments of
entrepreneurship were rare.
Finkle and Deeds (1991) found that the demand and
the supply of entrepreneurship faculty increased from
1989 to 1998. Between 1989/90 and 1997/98 the number
of entrepreneurship positions increased 253% while the
number of candidates increased by 94%. During this
period the number of positions that listed
entrepreneurship as the primary field increased
tenfold from 5 to 50 and the number of candidates that
listed entrepreneurship as their primary field
increased fourfold from 5 to 20. During the same

period the number of secondary and tertiary positions
increased 116% and 78% respectively and the number of
secondary and tertiary candidates increased by 67% and
53%. The percentage of entrepreneurship positions
listing entrepreneurship as the primary field has
increased from 19% in 89/90 to 54% in 1997/98.
Since Finkle and Deeds (2001), the field has seen
a significant increase in the number of
entrepreneurship programs in Schools of Business and
Management. Entrepreneurship has become increasingly
institutionalized at universities as evidence by the
rise in the number of centers (see Finkle, 2008;
Finkle, 2007a; Finkle & Kuratko, 2004; 2006; Finkle,
Kuratko & Goldsby, 2006a; 2006b; Finkle, Menzies,
Kuratko & Goldsby, 2010; 2012; 2013) and tenure in the
field of entrepreneurship (Finkle, Stetz & Deeds,
2004; Finkle, Stetz & Mallin, 2007).

Several studies that have built upon Finkle and
Deed’s (2001) initial findings (see Finkle 2006;
2007b; 2008; 2010; 2012a; 2012b; 2013a; 2013b; Finkle
& Thomas, 2008). Finkle (2007b) concluded that the
field was becoming increasingly institutionalized. He
noted that Schools of Business and Management had
committed more resources to hiring a larger number of
tenured or tenure track faculty. Finkle also found
that the ratio of tenure track positions per candidate
improved from a low of .43 positions per candidate in
1994/95 to 1.78 positions per candidate in 2004/05
(+314%).
Finkle’s (2010) findings showed that
entrepreneurship was being institutionalized on a
global basis. He found that entrepreneurship was one
of the fastest growing areas in higher education. The
findings showed 366 job openings at schools and 231
candidates in 2007/08. International positions and

candidates showed the biggest increase. From 2006/2007
to 2007/08, the number of international positions
nearly doubled while the number of international
candidates grew from 44 to 62.
Finkle (2012a; 2012b) examined data from June,
1989 through June, 2010. The findings showed that the
field had matured in regards to the number of tenure
track and non tenure track positions. In 2009/10 there
were 1.1 tenure track jobs per tenure track candidate.
Due to the lackluster economy, the decrease in the
number of candidates seeking positions in 2009/10 may
have been partially caused by fear. The economic
crisis may have caused people to remain conservative;
not willing to sell their house and make a move. As a
result, in 2008/09 there were 260 candidates and in
2009/10 there were only 169 candidates. He concluded
that, in that volatile environment, savvy candidates
could take risks and apply for desirable jobs. This

was especially true for senior level faculty where the
demand remained very strong. Overall, his study
showed that the number of positions (including tenure
track) peaked in 2007/08, right before the economic
crisis.
In Finkle’s (2013a; 2013b) studies, examined the
changes in the market for entrepreneurship faculty
from 1989 to 2012/13. During the academic year
2011/12 there were 319 total advertised
entrepreneurship positions of which 202 (63%) sought a
candidate with a primary interest in entrepreneurship.
This was the highest number of primary positions in
the history of the study. Furthermore, in 2011/12
there were 203 tenure track positions, which was the
largest number since the beginning of the Great
Recession in 2007. The number of tenure track
candidates was higher at 231, however the studied
found that schools were seeking senior faculty

(Associate, Full, and Endowed Professors) at the
highest rate ever. Advertisements for full professors
were at their highest level ever at 23. Associate
professors were in the highest demand since 2007/08
and endowed chairs were at the fourth highest level
over the life-time of this study. Overall, 87 percent
of all of the tenure track the positions targeted
senior level faculty.
Finkle’s (2013a; 2013b) findings showed that
entrepreneurship was continuing to become increasingly
institutionalized within Schools of Business and
Management all over the world. Schools were
recruiting more candidates, especially ones with a
primary area in entrepreneurship. This showed that
schools were valuing entrepreneurship and committing
more resources as they recruited an ever increasing
number of candidates with a primary area in
entrepreneurship.

METHODOLOGY
Data for this study initiated 25 years ago. In
the early parts of this study, data for jobs and
candidates was sent to members in a small Academy of
Management Placement booklet. To make sure that all of
the advertisements were included data was also
collected by hand through Chronicle of Higher Education
microfiche located at the library. Over time, the
booklets turned into more of a newspaper format.
After this format, the Internet was introduced and
most advertisements were done online on a variety of
sites.
Data for this study was collected continuously
over a 25 year period. In addition to the
aforementioned sources, these web sites were used in
this study: United States Association for Small
Business and Entrepreneurship (USASBE)
(http://usasbe.org/); Academic Keys for Business

Education
(http://business.academickeys.com/seeker_job.php);
University 500 (http://www.university500.com/););
American Marketing Association
(http://academicplacement.marketingpower.com/search/);
Financial Management Association
(http://www.fma.org/); Mid Atlantic Higher Education
Consortium (http://www.midatlanticherc.org/home/);
Academic Careers Online
(http://www.academiccareers.com/); Academic Employment
Network (http://www.academploy.com); University
Affairs (http://www.universityaffairs.ca);
HigherEdJobs.com (http://www.higheredjobs.com/);
Jobs.ac.uk http://www.jobs.ac.uk; Times Higher
Education Supplement
(http://www.timeshighereducation.co.uk); Career.edu
(http://www.career.edu); and UniJobs.com.au
(http://www.UniJobs.com.au).

There were a few new web sites that were used in
this study: indeed (http://indeed.com); Academy of
International Business (http://www.aib.msu.edu);
Academic Jobs EU.com (http://academicjobseu.com); and
Campus Review (http://campusreview.com.au). Data was
also collected through direct e-mails on a variety of
networks and directly from universities themselves.
It must be noted that only jobs within schools of
business were included in this study.
The methodology in the study was similar to
Finkle and Deeds (2001: 2002), Finkle (2006; 2007b;
2008; 2010; 2012a; 2012b; 2013a; 2013b) and Finkle &
Thomas (2008). The data was split into academic years
(e.g., 2013/14). Two categories were then created;
January through June (spring) and July through
December (fall). Overlapping candidates and positions
found in each subset were dropped. For example, if

Ted Baker advertised for a job in fall 2013 and spring
2014 he would be counted only once.
RESULTS & DISCUSSION
To evaluate the trends in the job market for
entrepreneurship faculty over the past 25 years, three
tables were created. Table 1 examines the number of
candidates and positions from June, 1989 through June,
2014. The table also examines the desired interest
level of a candidate or school (e.g., Primary,
Secondary, or Tertiary) and the current number of
international jobs and candidates. Table 2 evaluates
tenure track positions and candidates only.
Additionally, it calculates the percentage of jobs and
candidates that are tenure track. Table 2 also breaks
down the table into the type of position the candidate
or school is seeking (Assistant, Associate, Full,
Endowed, or Open). Table 3 breaks down the schools
and candidates specialties that are cross-listed with

entrepreneurship. For example, let’s say Indiana
University is seeking a candidate with a primary area
in Entrepreneurship, but it seeks a person with a
secondary area in Business Policy and a tertiary area
in International Business. This table evaluates the
percentage of schools and candidates that are
advertising in the different areas.
Table 1: Number & Level of Interest in
Entrepreneurship for Candidates & Positions, June,
1989-June, 2014
Table 1 shows that the total number of jobs
(tenure track and non tenure track) over the past 25
years. The total number of jobs peaked during 2012/13
academic year at 441. The lowest number of jobs came
during the initial stages of the study in 1991/92 at
18. Since the 1991/92 academic year, the total number
of advertised positions has increased 2450%. On an
annualized basis, this is equivalent to a growth rate

on average of 116% per year. However, in the most
recent academic year the number of jobs decreased to
258.
Table 1 also shows that the total number of
candidates (tenure track and non tenure track) over
the past 25 years. That number peaked during 2008/09
academic year at 270. The lowest number of candidates
came during the first year of the study in 1989/90 at
35. Since the 1989/90 academic year, the total number
of candidates has increased 771% at its high point.
On an annualized basis, this is equivalent to a growth
rate on average of 41% per year. However, in the most
recent academic year, 2013/14, the number of
candidates dropped to 147.
Table 1Number & Level of Interest in Entrepreneurship for
Candidates & Positions 1989-June 2014
Candidates
Positions
Candidates
Positions
Candidates
Positions
Int'lCandi
Int'l
TotalCandi
Total

w/PrimaryInterest
w/PrimaryAssignment
w/2 nd Interest
w/2 nd Assignment
w/TertiaryInterest
w/TertiaryAssignment
dates Positions
dates Positions
AcademicYr. 89-90
5 5 15 12 15 9 3 0 35 26
AcademicYr. 90-91
3 9 23 6 20 12 2 2 46 27
AcademicYr. 91-92
7 12 20 3 13 3 1 2 40 18
AcademicYr.92-93
6 16 23 3 27 9 2 3 56 28
AcademicYr. 93-94
10 18 32 6 25 3 3 1 67 27
AcademicYr. 94-95
15 20 45 4 29 6 3 5 89 30
AcademicYr. 95-96
24 20 50 9 35 9 9 7 109 38
Academic
19 36 35 18 31 6 4 12 85 60

Yr. 96-97
AcademicYr. 97-98
20 50 25 26 23 16 6 13 68 92
AcademicYr. 98-99
16 58 10 45 28 46 9 22 54 149
AcademicYr. 99-00
17 92 17 67 27 69 10 21 61 228
AcademicYr. 00-01
15 82 25 56 27 59 5 26 67 197
AcademicYr. 01-02
24 54 28 65 24 56 12 16 74 175
AcademicYr. 02-03
31 83 19 50 29 57 6 19 79 190
AcademicYr. 03-04
35 74 33 67 30 44 22 20 98 185
Academic
33 94 40 65 33 53 15 17 106 212

Yr. 04-05
AcademicYr. 05-06
33 141 59 104 49 82 25 36 141 316
AcademicYr. 06-07
62 111 63 82 57 64 44 34 184 263
AcademicYr. 07-08
90 165 87 90 54 111 62 76 231 366
AcademicYr. 08-09
57 128 106 63 107 74 61 66 270 265
AcademicYr. 09-10
42 153 48 68 91 85 48 75 181 306
AcademicYr. 10-11
45 149 47 41 121 93 58 60 213 283
AcademicYr. 11-12
51 202 54 66 139 51 81 104 245 319
Academic
82 302 87 78 50 61 65 118 219 441

Yr. 12-13
AcademicYr. 13-14
63 168 49 53 35 37 44 81 147 258

89/90
91/92
93/94
95/96
97/98
99/00
01/02
03/04
05/06
07/08
09/10
11/12
13/14
0200400600
Figure 1Candidates and Positions
Total Candid...
Academic Year
89/90
91/92
93/94
95/96
97/98
99/00
01/02
03/04
05/06
07/08
09/10
11/12
13/14
0
Figure 2International
Entrepreneurship Applicants and Positions Int'l Candidates
Int'l Positions
Academic Year

89/90
92/93
95/96
98/99
01/02
04/05
07/08
10/11
13/14
0
200
400
Figure 3Entrepreneurship Positions by
Level of Interest Primary Positions Secondary Positions Tertiary Positions
Academic Year
89/90
91/92
93/94
95/96
97/98
99/00
01/02
03/04
05/06
07/08
09/10
11/12
13/14
0
50
100
150
Figure 4Entrepreneurship Candidates by Level of Preference
Primary InterestSecondary InterestTertiary Interest
Academic Year

During the latest year of the study, the ratio of
total jobs per candidate was 1.76. This ratio is
favorable to candidates seeking employment. However,
this number includes adjunct, visiting, and instructor
positions along with tenure track jobs.
International Market
One of the more significant findings of this
study is the growth in the number of international
jobs. Table 1 shows that the number of international
positions peaked at 118 during 2012/13. In the most
recent year, it decreased to 81. The largest number of
international candidates in the study was 104 in
2011/12. The ratio of the total number of
international positions per international candidate
during 2013/14 was 1.82 jobs per candidate.
Level of Interest
Table 1 also shows the number of positions and
candidates by their level of interest (e.g., Primary,

Secondary and Tertiary). The number and percentage of
jobs with entrepreneurship as their primary field of
expertise in 2013/14 was 168 (65%). Secondary and
tertiary numbers were 53 (21%) and 37 (14%),
respectively.
The number of candidates in 2013/14 that sought
positions with entrepreneurship as their primary field
of expertise was 63 (43%). Secondary and tertiary
numbers were 49 (33%) and 35 (24%), respectively.
There were approximately 2.7 primary jobs for
each primary candidate. These numbers indicate
opportunities for candidates specializing in
entrepreneurship as their primary area of expertise.
This has been a trend in analyzing the numbers over
the years as candidates look to hedge their risk by
focusing on more established academic areas like
Strategy or Organizational Behavior.
Table 2: Rank of Tenure Track Candidates & Positions,

June, 1989-June, 2014
Table 2 evaluates only tenure track candidates
and positions as advertised by academic rank from
June, 1989 through June, 2014. As a result, all non
tenure track positions and candidates were dropped.
Table 2
Rank of Tenure Track Candidates & Positions, 1989-June2014
Candidates Positions
AcademicYear
Assistant
Associate
Full
Endowed
Open
Total
%Assistant
Associate
Full
Endowed
Open
Total
%
89/90 24 4 2 0 5 35
100
19 0 0 3 4 26100
90/91 34 4 1 0 3 42 9
1 19 0 0 3 3 25 93
91/92 29 5 1 0 5 40
100
10 1 0 3 1 15 83
92/93 29 4 2 0 7 42 7
5 15 0 0 4 4 23 82
93/94 30 4 1 0 5 40 6
0 18 0 1 3 1 23 85
94/95 46 2 0 0 5 53 6
0 14 2 0 2 5 23 77

95/96 51 1 0 0 3 55 5
0 22 2 1 5 4 34 89
96/97 48 1 0 0 5 49 5
8 23 6 0 8 14 51 85
97/98 63 0 0 0 4 67 9
9 41 4 3 5 7 60 65
98/99 37 3 0 0 9 49 9
1 58 17 5 10 51 141
95
99/00 47 1 1 1 5 58 9
5 88 21 3 23 81 216
95
00/01 49 1 0 0 12 62 8
4 52 16 4 18 97 187
95
01/02 60 4 1 0 9 74
100
81 34 4 3 38 160
91
02/03 56 12 4 0 5 77 9
7 81 33 14 12 41 18
195
03/04 66 11 6 2 11 96 9
8 63 40 8 13 47 171
92
04/05 75 8 4 0 15 10
296 64 59 9 17 35 18
487
05/06 87 24 0 2 24 13
797 71 110 1
4 24 73 292
92
06-07 98 52 3 1 29 18
399 71 55 8 13 36 18
369
07-08 185 20 6 4 7 22
296 84 107 1
2 17 68 288
79
08-09 209 34 1
0 5 2 260
96 69 46 1
2 22 16 165
66

09-10 144 18 6 0 1 16
993 74 47 1
4 17 33 185
60
10-11 181 17 3 0 0 20
194 66 59 1
8 16 23 182
65
11-12 195 19 9 2 6 23
194 54 67 2
3 20 39 203
64
12-13 198 9 2 0 1 21
096 119 46 2
7 23 30 245
56
13-14 122 11 3 0 2 13
894 72 29 1
0 16 23 150
58
89/90
91/92
93/94
95/96
97/98
99/00
01/02
03/04
05/06
07/08
09/10
11/12
13/14
050100150200250300350
Figure 5Tenure Track Candidates and
Positions Tenure Track Candidates
Academic Year

89/90
91/92
93/94
95/96
97/98
99/00
01/02
03/04
05/06
07/08
09/10
11/12
13/14
0%
Figure 6Percentage Entrepreneurship Candidates Cross Listing By
SpecializationENT OnlyCross BPSCross IMCross OB/HR
Academic Year
The largest number of tenure track positions
(292) occurred in 2005/06 right before the financial
crisis. Those 292 tenure track positions were 92% of
the total positions advertised that year. Since its
peak, the number of tenure track positions has dropped
to 150 in 2013/14. Even worse, the percentage of
total positions that are now tenure track is 58%.
This is the second lowest percentage in the study with
56% being the low point in 2012/13.
The field of entrepreneurship is not immune to
the trend of non tenure track positions at
universities. There may be a few reasons for this

trend. First, the increasing cost structure at
universities. By hiring part-time, adjuncts,
instructors, or visiting professors universities can
reduce their costs. Secondly, there is a trend in
academia to offer fewer and fewer tenure track
positions. It appears that the field of
entrepreneurship is not immune to this. Thirdly, the
field of entrepreneurship is unique in the sense that
an ideal candidate to teach entrepreneurship would be
someone who has been an entrepreneur or is currently
an entrepreneur and has a PhD in Entrepreneurship or a
related discipline that has the ability to produce
traditional academic research. In reality, there are
few faculty with these qualifications; as a result,
schools may try to hire a traditional faculty member
in entrepreneurship and hire a part-time non tenure
track faculty member for the practical side of the

field. Or some schools may just focus on hiring a
practitioner.
In regards to the rank of the advertised tenure
track positions, in 2013/14, there were 72 (48%)
assistant, 29 (19%) associate, 10 (7%) full, 16 (11%)
endowed chair, and 23 (15%) open positions. Over one-
half of the positions were seeking senior level
faculty. Similar to previous studies, there are still
many opportunities for senior level faculty,
especially those that have experience in building
centers and programs.
The largest number of tenure track candidates
(260) occurred in 2008/09. Those 260 tenure track
candidates were 96% of the total candidates advertised
that year. Since its peak, the number of tenure track
candidates has dropped to138 in 2013/14. In 2013/14,
the rank of the advertised candidates was: 122 (88%)
assistant, 11 (8%) associate, 3 (2%) full, 0 (0%)

endowed chair, and 2 (2%) open. In 2013/14, the ratio
of tenure track positions (150) per tenure track
candidates (138) was 1.09.
Table 3: Percentage of Applicants & Positions Cross-
Listed by Field, June, 1989-June, 2014
Table 3 shows the positions and candidates and
their respective areas that they advertise on their
profile. For instance, if Don Kuratko was advertising
for an entrepreneurship only position he would place
that on his profile. If Indiana University was
seeking a candidate with areas in Business Policy,
OB/HR and Technology and Innovation Management, it
would list these in its profile.
Studying this area is vital so the field of
entrepreneurship can examine the trends that are
occurring within the marketplace. The candidates can
then be more proactive and study the appropriate areas
that are needed.

Table 3
Percentage of Applicants & Positions Cross-Listed byField, 1989-June 2014

CANDIDATES POSITIONS
AcademicYear
Entrepreneurship Only
Strategy
International
OB/HR
TIM
Entrepreneurship Only
Strategy
International
OB/HR
TIM
89/90 0% 63% 14% 23
%3% 15% 69% 38% 7% 0
%
90/91 0% 80% 17% 15
%2% 28% 40% 12% 12
%0%
91/92 0% 68% 33% 30
%3% 67% 40% 0% 0% 0
%
92/93 0% 73% 25% 21
%
13%
65% 30% 26% 13%
0%
93/94 0% 73% 30% 16
%
10%
61% 22% 13% 4% 4%
94/95 0% 71% 35% 19
%7% 74% 17% 9% 26
%0%
95/96 3% 65% 32% 28
%8% 35% 21% 15% 18
%3%
96/97 1% 73% 33% 26
%6% 37% 41% 22% 33
%8%
97/98 1% 79% 40% 43
%9% 48% 65% 27% 27
%8%
98/99 0% 74% 35% 15
%
11%
47% 56% 27% 33%
15%
99/00 1% 60% 30% 21
%
16%
24% 37% 15% 18%
14%
00/01 0% 76% 33% 19
%
25%
26% 38% 18% 19%
16%
01/02 3% 80% 28% 16
%
20%
18% 50% 21% 19%
12%
02/0 0% 72% 33% 25 15 25% 48% 16% 17 9

Similar to Finkle (2007; 2010; 2012a; 2012b;
2013a; 2013b), the table is broken down into five
categories: Entrepreneurship only, Strategy,
International, OB/HR (Organizational Behavior/Human
Resources Management), and TIM (Technology and
Innovation Management). Each category has a
percentage, which indicates the percentage of jobs or
candidates in that were listed on that advertisement.
The respective percentages advertised in the
position categories for 2013/14 were: Entrepreneurship
Only (51%), Strategy (25%), International Management
(10%), OB/HR (10%), and Technology and Innovation
Management (5%).
The respective percentages advertised for the
candidate categories for 2013/14 were:
Entrepreneurship Only (5%), Strategy (62%),
International Management (20%), OB/HR (24%), and
Technology and Innovation Management (23%).

This study examined the topics a little more in-
depth than previous studies. In addition to the five
areas above, which were included in Table 3, the
following areas were also examined and tabulated:
Management, Marketing, Business Ethics/Business
Society, Finance, and Accounting. The percentage of
jobs that advertised these areas, which were not
included in Table 3 were: Management (9.7%), Marketing
(8.2%), Business Ethics/Business Society (4.3%),
Finance (2.7%), and Accounting (.4%).
This was also done for candidates. The areas
changed a little: Organzational Theory (16%),
Management (6%), Marketing (0%), Business
Ethics/Business Society (8.2%), Operations (2%), and
Finance (0%).
The data for the jobs indicate the strong need
for applicants with a primary in entrepreneurship.
Strategy was the second most popular area advertised.
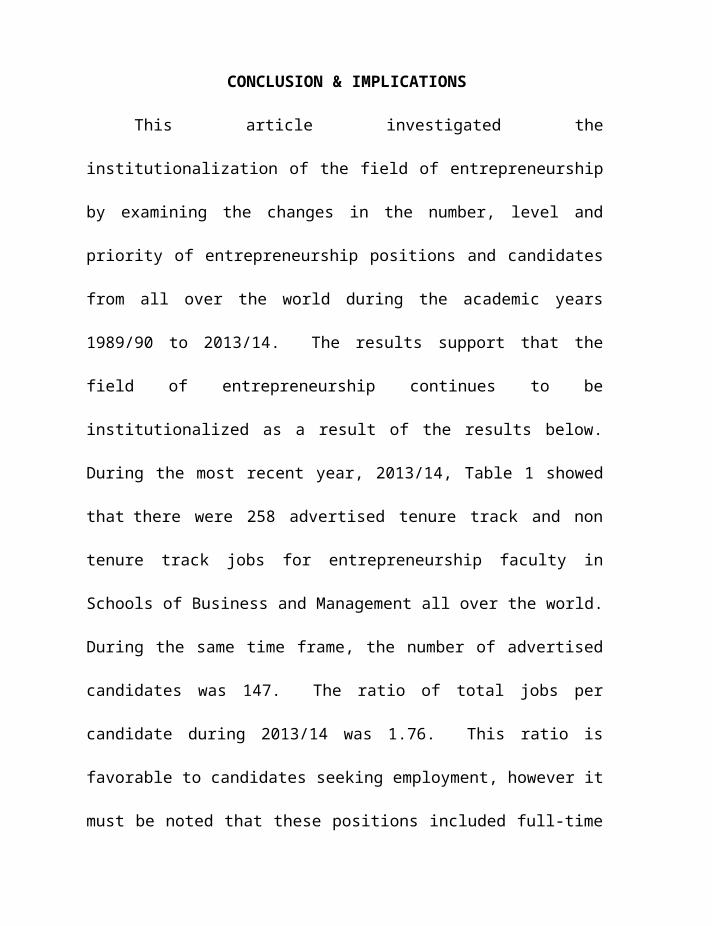
CONCLUSION & IMPLICATIONS
This article investigated the
institutionalization of the field of entrepreneurship
by examining the changes in the number, level and
priority of entrepreneurship positions and candidates
from all over the world during the academic years
1989/90 to 2013/14. The results support that the
field of entrepreneurship continues to be
institutionalized as a result of the results below.
During the most recent year, 2013/14, Table 1 showed
that there were 258 advertised tenure track and non
tenure track jobs for entrepreneurship faculty in
Schools of Business and Management all over the world.
During the same time frame, the number of advertised
candidates was 147. The ratio of total jobs per
candidate during 2013/14 was 1.76. This ratio is
favorable to candidates seeking employment, however it
must be noted that these positions included full-time

tenure track, visiting professorships, instructors,
adjuncts or part-time positions.
In 2013/14, the number of candidates (147)
dropped significantly to a level that we have not seen
since 2005/06 and 84% below its peak in 2008/09 (270).
Some possible explanations for this trend may be
related to the economy, commitment and supply versus
demand. There could be a hangover effect from earlier
years where candidates had problems finding tenure
track positions. For example, in 2008/09 there were
almost 100 more tenure track candidates than tenure
track positions (260 versus 165). In 2010/11 and
2011/12 there we another 50 candidates more than
tenure track openings. Furthermore, if we go back
four to five years (The typical amount of time to earn
a Ph.D.), we see that we would have been right in the
middle of the financial crisis. It could be that
potential doctoral students were afraid to make a

long-term commitment due to the global economic
crisis. Related issues may be related to resources
(e.g., leaving their current job, failure to sell
their house during a housing depression, and/or simply
not having the money). Another reason might be that
universities may have reduced the admissions of
doctoral students as doctoral programs can be costly
to run. The same thing can be said for international
candidates in 2013/14 as they dropped to 44 from a
peak of 81 in 2011/12.
Table 1 also examined the desired interest level
of both candidates and schools (e.g., Primary,
Secondary, or Tertiary). In 2013/14 there were 168
schools seeking candidates with a primary area in
entrepreneurship. However, there were only 63
candidates available with a primary area. This is a
ratio of 2.59 primary jobs per primary candidate.
Candidates that are considering a career in

entrepreneurship education should seriously consider
specializing entrepreneurship as their primary area as
65% of all jobs advertised were for candidates with a
primary area. The table also examined international
candidates and jobs. In 2013/14, there were 81
international jobs and 44 international candidates.
The ratio of international jobs to international
candidates was 1.84. The numbers indicate that there
are strong opportunities for candidates seeking
entrepreneurship positions.
Table 2 was broken down into tenure track
faculty seeking tenure track positions. The table also
breaks down the tenure track candidates and positions
as advertised by academic rank. In 2013/14 there were
150 tenure track positions available or 58% of the
total number of advertised positions in
entrepreneurship. This is the second lowest percentage
of tenure track jobs since 1989. The rank of the

advertised tenure track positions was: 72 (48%)
assistant, 29 (19%) associate, 10 (7%) full, 16 (11%)
endowed chair, and 23 (15%) open. Fifty-two percent of
the tenure track jobs were for senior faculty
positions. This is evidence that there are ample
opportunities for senior, experienced faculty in the
field to move.
The number of tenure track candidates was 138 in
2013/14. The advertised rank of the candidates was:
122 (88%) assistant, 11 (8%) associate, 3 (2%) full, 0
(0%) endowed chair, and 2 (2%) open. In 2013/14, the
overall ratio of tenure track positions (150) versus
tenure track candidates (138) was 1.09. Similar to
the findings of Finkle (2010; 2012; 2013), senior
positions continue to be in high demand. Recruiting
experienced faculty can bring instant credibility and
brand name recognition to entrepreneurship programs.
This can enhance the ranking of the university.

The final table, Table 3, shows the positions and
candidates and their respective areas that they
advertise on their profile. The table is broken down
into five categories: Entrepreneurship only, Strategy,
International, OB/HR (Organizational Behavior/Human
Resources Management), and TIM (Technology and
Innovation Management). Each category has a
percentage, which indicates the percentage of jobs or
candidates in that were listed on that advertisement.
The respective percentages advertised in the position
categories for 2013/14 were: Entrepreneurship Only
(51%), Strategy (25%), International Management (10%),
OB/HR (10%), and Technology and Innovation Management
(5%). The respective percentages advertised for the
candidate categories for 2013/14 were:
Entrepreneurship Only (5%), Strategy (62%),
International Management (20%), OB/HR (24%), and
Technology and Innovation Management (23%).

As stated in the results section, this study also
tabulated additional areas in addition to the
traditional five. The following areas were also
tabulated even though they were not included in the
table for 2013/14: Management, Marketing, Business
Ethics/Business Society, Finance, and Accounting. The
percentage of jobs that advertised these areas were:
Management (9.7%), Marketing (8.2%), Business
Ethics/Business Society (4.3%), Finance (2.7%), and
Accounting (.4%). I also did the same thing for
candidates, although the areas were slightly
different: Organzational Theory (16%), Management
(6%), Marketing (0%), Business Ethics/Business Society
(8.2%), Operations (2%), and Finance (0%).
An overview of the data continues to support the
strong notion of a need for faculty with a primary
area in entrepreneurship. Strategy continues to be
ranked as the second most advertised position with

International and OB/HR tied for third. Management
and Marketing both outranked Technology and Innovation
Management.
LIMITATIONS
There are a few limitations that need to be
pointed out. First, just because a school advertises
a position does not mean that they actually hire a
candidate. There may be a few reasons why they decide
not to hire a candidate such as the inability to find
a qualified applicant or their budget for the position
has been taken away. As a result, a job opportunity
may overlap from one year to the next. Another
limitation is that I may not have captured all of the
candidates and positions. There may be some sites
that I am not aware of that advertise positions and/or
candidates. Therefore, I cannot say with 100%
certainty that I have captured everything happening in
the job market.

FUTURE RESEARCH
Future research can investigate a number of areas
that will be beneficial to future candidates seeking
employment at universities. For example, average
salaries for entrepreneurship faculty at level (Full,
Associate, Assistant, and Lecturer), type of school
(Public versus Private), and sex (Male versus Female).
These figures are not necessarily readably available
to candidates unless they have access to AACSB data.
Once this data is collected then we compare the
salaries to the other business areas to see if the
field has become legitimized within Schools of
Business and Management.
Research also needs to go into more depth into
the current profiles of candidates and track them over
the long-term. A longitudinal study following
candidates will be critical to examine whether or not
entrepreneurship is becoming institutionalized within

Schools of Business and Management. Are these
candidates actually getting tenure track positions in
entrepreneurship? And if so, are they earning tenure?
Finkle, Stetz, and Mallin (2007) examined the research
records and perceptions of tenure requirements of 108
faculty members who taught entrepreneurship and earned
tenure between 1964 and 2002. However, there is still
a lack of research on recent decisions and the
respective faculty records.
REFERENCES
Academy of Management Placement Roster. Academy ofManagement
Placement Service. Auburn University, AL. Used allvolumes from 1989-2014.
Clark, P. (2014, March 3). Half of U.S. businessschools might be gone by 2020.
Business Week.com. Retrieved March 14, 2014, fromhttp://www.businessweek.com/articles/2014-03-14/online-programs-could-erase half-of-u-dot-s-dot-business-schools-by-2020
Ellis, B. (2013). Average student loan debt: $29,400.CnnMoney.com. Retrieved
December 18, 2013, from http://money.cnn.com/2013/12/04/pf/college/student

loan-debt/
Festinger, L. (1954). A Theory of Social ComparisonProcesses. Human
Relations, 7(2), 117-140.
Finkle, T.A. (2007a). A Comparative Analysis of U.S.versus International
Entrepreneurship Centers,” 21st Proceedings of the AnnualNational United
States Association for Small Business & Entrepreneurship Conference,125.
Finkle, T.A. (2006). A Review of Trends in the Marketfor Entrepreneurship
Faculty From 1989-2004. Frontiers of Entrepreneurship Research2005:
Proceedings of the Twenty-Fifth Annual Frontiers of EntrepreneurshipResearch
Conference, Edited by Shaker Zahra, Candida Brush, PerDavidson, Patricia
Greene, R. Harrison, James O. Feit, Miri Lerner,Jeffrey Sohl, & Dean Shepherd,
Johan Wiklund, & M. Wright. Babson College: MA, 168.
Finkle, T.A. (2010). Entrepreneurship EducationTrends. Research in Business
& Economics Journal, February, 1, 35-53.
Finkle, T.A. (2008). Global Trends in the Job Marketfor Faculty and Schools in
the Field of Entrepreneurship. Proceedings of the 2008Annual American Society
of Business & Behavioral Sciences National Conference, (ASBSS),803-810.

Finkle, T.A. (2013a). Job opportunities for facultyin the field of
entrepreneurship. Journal of Applied Management &Entrepreneurship, 18, 3,
94-112.
Finkle, T.A. (1998). The Relationship Between Boardsof Directors and Initial
Public Offerings in the Biotechnology Industry.Entrepreneurship Theory and
Practice, 22(3), 5-29.
Finkle, T.A. (2012a). Trends in the Market forEntrepreneurship Faculty during
the Period 1989-2010. Journal of Entrepreneurship Education,15, 21-40.
Finkle, T.A. (2007b). Trends in the Market forEntrepreneurship Faculty from
1989-2005. Journal of Entrepreneurship Education, 10, 1-25.
Finkle, T.A. (2012b). Trends in the field ofentrepreneurship from 1989-2011.
26th Proceedings of the Annual National United States Association forSmall
Business & Entrepreneurship Conference. 1042-1055.
Finkle, T.A. (2013b). Trends in the market forentrepreneurship faculty from
1989-2011. Journal of Entrepreneurship Education, 16, SpecialIssue, 59-76.
Finkle, T.A. and Deeds, D. (2002). Trends in theMarket for Entrepreneurship
Faculty from 1989-2001. 16th Proceedings of the Annual NationalUnited States

Association for Small Business & Entrepreneurship Conference, 121.
Finkle, T.A. and Deeds, D. (2001). Trends in theMarket for Entrepreneurship
Faculty during the Period 1989-1998. Journal of BusinessVenturing, 16(6), 613
630.
Finkle, T.A. and Kuratko, D.F. (2006). An Examinationof Entrepreneurship
Centers in the United States: A National Survey.Proceedings of the 2005
International Conference for Small Business.
Finkle, T.A. and Kuratko, D.F. (2004). Characteristicsof the Top Ranked
Entrepreneurship Centers. Frontiers of EntrepreneurshipResearch 2003:
Proceedings of the Twenty-Third Annual Frontiers of EntrepreneurshipResearch Conference, Edited by William D. Bygrave, Candida
Brush, PerDavidson, Patricia Greene, R. Harrison, James O. Feit,
Miri Lerner, G. DaleMeyer, Jeffrey Sohl, & A. Zacharackis. Babson College:
MA.
Finkle, T.A., and Thomas, A. (2008). Entrepreneurship in international markets.
Proceedings of the 2008 Annual American Society of Business & Behavioral
Sciences National Conference (ASBSS), 970-973.
Finkle, T.A., Kuratko, D.F., and Goldsby, M. (2006a).The State of
Entrepreneurship Centers in the United States: ANationwide Survey. Journal of

Small Business Management (50th Anniversary Issue), 44(2), 184-206.
Finkle, T.A., Kuratko, D.F., and Goldsby, M. (2006b).The State of
Entrepreneurship Centers in the United States: ANationwide Survey.
Proceedings of the 2005 International Conference for Small Business(ICSB).
Finkle, T.A., Menzies, T.V., Kuratko, D.F. andGoldsby, M. (2013). An
examination of the financial challenges ofentrepreneurship centers throughout
the world. Journal of Small Business and Entrepreneurship, 26, 1,67-85.
Finkle, T.A., Menzies, T.V., Kuratko, D.F., andGoldsby, M. (2012). Financing
activities of entrepreneurship centers in the UnitedStates. Journal of Business
and Entrepreneurship, 23(2), 48-64.
Finkle, T.A., Menzies, T.V., Goldsby, M., and Kuratko,D.F. (2010). A GlobalExamination of the Financial Challenges of
Entrepreneurship Centers.Proceedings of the 2010 International Conference for Small Business
(ICSB), 139.
Finkle, T.A., Stetz, P., and Deeds, D. (2004). Anexamination of tenure decisions
for the field of Entrepreneurship Frontiers ofEntrepreneurship Research 2003:
Proceedings of the Twenty-Third Annual Frontiers of Entrepreneurship

Research Conference, Edited by William D. Bygrave, CandidaBrush, Per
Davidson, Patricia Greene, R. Harrison, James O. Feit,Miri Lerner, G. Dale
Meyer, Jeffrey Sohl, & A. Zacharakis. Babson College:MA.
http://www.babson.edu/entrep/fer/BABSON2003/IX/Ix-S3/IX-S3.html
Finkle, T.A., Stetz, P., and Mallin, M. (2007c).Perceptions of tenure
requirements & research records of entrepreneurshipfaculty earning tenure:
1964-2002. Journal of Entrepreneurship Education, 10, 101-125.
Goethals, G.R. and Darley, J.M. (1977). SocialComparison Theory: An
Attributional Approach. In J.M. Suls & R.L. Miller(Eds.), Social Comparison
Processes: Theoretical and Empirical Perspectives, 259–278.Washington, DC:
Hemisphere.
Harari, O. (2007). Break from the Pack: How to Compete in aCopycat Economy.
FT Press, Upper Saddle River, NJ.
Meyer, J.W. and Rowan, B. (1977). Institutionalizedorganizations: Formal
structure as myth and ceremony. American Journal ofSociology, 83(2), 340
363.
Mitchell, J. (2014, March 25). Grad students’ loanssurge. Wall Street Journal, pp. A2

Scott, W.R. (1987). The adolescence of institutionaltheory. Administrative Science Quarterly, 32, 493-511.
Scott, W.R. (1995). Institutions and Organizations. SagePublications, Thousand
Oaks, CA.
Selingo, J. (2013, December 2). Colleges Can StillSave Themselves. Here's
How. The Chronicle of Higher Education. Retrieved February 4,2014, from
http://chronicle.com/article/Colleges-Can-Still-Save/143305?cid=megamenu
The Chronicle of Higher Education. Washington, D.C. Used allvolumes from
1989-2014.