
An epidemiological approach for the estimation of disease onset in Central Europe in central and...
10
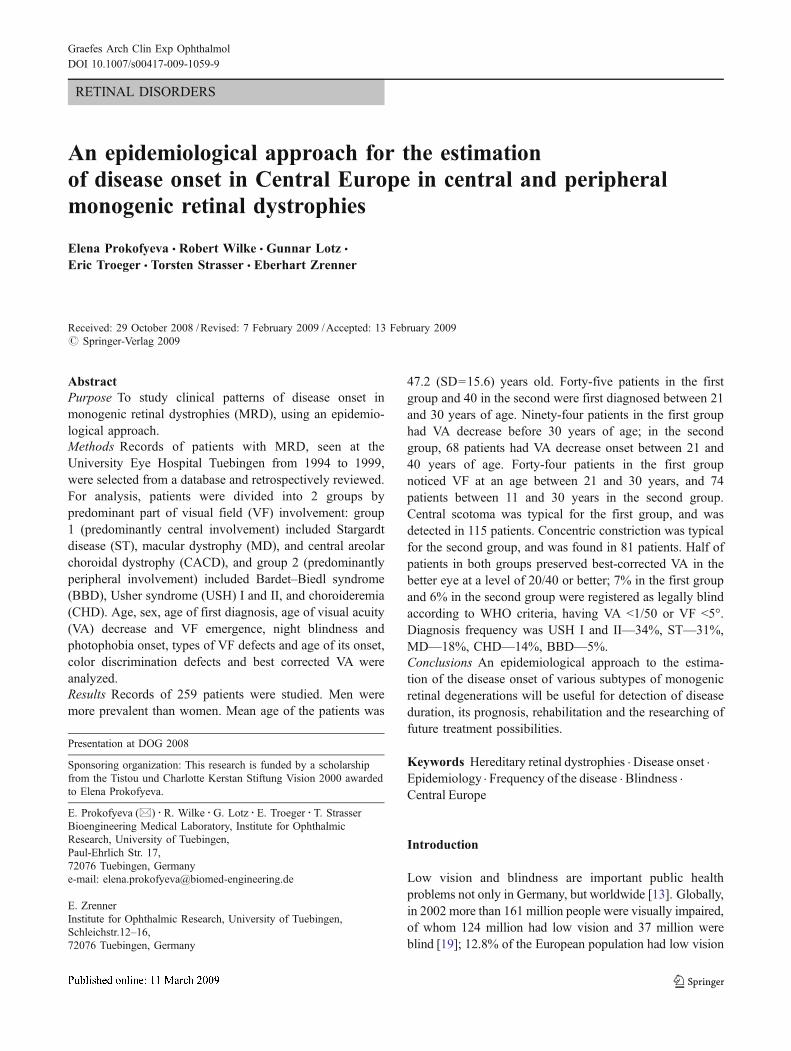
RETINAL DISORDERS An epidemiological approach for the estimation of disease onset in Central Europe in central and peripheral monogenic retinal dystrophies Elena Prokofyeva & Robert Wilke & Gunnar Lotz & Eric Troeger & Torsten Strasser & Eberhart Zrenner Received: 29 October 2008 / Revised: 7 February 2009 / Accepted: 13 February 2009 # Springer-Verlag 2009 Abstract Purpose To study clinical patterns of disease onset in monogenic retinal dystrophies (MRD), using an epidemio- logical approach. Methods Records of patients with MRD, seen at the University Eye Hospital Tuebingen from 1994 to 1999, were selected from a database and retrospectively reviewed. For analysis, patients were divided into 2 groups by predominant part of visual field (VF) involvement: group 1 (predominantly central involvement) included Stargardt disease (ST), macular dystrophy (MD), and central areolar choroidal dystrophy (CACD), and group 2 (predominantly peripheral involvement) included Bardet–Biedl syndrome (BBD), Usher syndrome (USH) I and II, and choroideremia (CHD). Age, sex, age of first diagnosis, age of visual acuity (VA) decrease and VF emergence, night blindness and photophobia onset, types of VF defects and age of its onset, color discrimination defects and best corrected VA were analyzed. Results Records of 259 patients were studied. Men were more prevalent than women. Mean age of the patients was 47.2 (SD=15.6) years old. Forty-five patients in the first group and 40 in the second were first diagnosed between 21 and 30 years of age. Ninety-four patients in the first group had VA decrease before 30 years of age; in the second group, 68 patients had VA decrease onset between 21 and 40 years of age. Forty-four patients in the first group noticed VF at an age between 21 and 30 years, and 74 patients between 11 and 30 years in the second group. Central scotoma was typical for the first group, and was detected in 115 patients. Concentric constriction was typical for the second group, and was found in 81 patients. Half of patients in both groups preserved best-corrected VA in the better eye at a level of 20/40 or better; 7% in the first group and 6% in the second group were registered as legally blind according to WHO criteria, having VA <1/50 or VF <5°. Diagnosis frequency was USH I and II—34%, ST—31%, MD—18%, CHD—14%, BBD—5%. Conclusions An epidemiological approach to the estima- tion of the disease onset of various subtypes of monogenic retinal degenerations will be useful for detection of disease duration, its prognosis, rehabilitation and the researching of future treatment possibilities. Keywords Hereditary retinal dystrophies . Disease onset . Epidemiology . Frequency of the disease . Blindness . Central Europe Introduction Low vision and blindness are important public health problems not only in Germany, but worldwide [13]. Globally, in 2002 more than 161 million people were visually impaired, of whom 124 million had low vision and 37 million were blind [19]; 12.8% of the European population had low vision Graefes Arch Clin Exp Ophthalmol DOI 10.1007/s00417-009-1059-9 Presentation at DOG 2008 Sponsoring organization: This research is funded by a scholarship from the Tistou und Charlotte Kerstan Stiftung Vision 2000 awarded to Elena Prokofyeva. E. Prokofyeva (*) : R. Wilke : G. Lotz : E. Troeger : T. Strasser Bioengineering Medical Laboratory, Institute for Ophthalmic Research, University of Tuebingen, Paul-Ehrlich Str. 17, 72076 Tuebingen, Germany e-mail: [email protected] E. Zrenner Institute for Ophthalmic Research, University of Tuebingen, Schleichstr.12–16, 72076 Tuebingen, Germany
-
Upload
independent -
Category
Documents
-
view
7 -
download
0
Transcript of An epidemiological approach for the estimation of disease onset in Central Europe in central and...
RETINAL DISORDERS
An epidemiological approach for the estimationof disease onset in Central Europe in central and peripheralmonogenic retinal dystrophies
Elena Prokofyeva & Robert Wilke & Gunnar Lotz &
Eric Troeger & Torsten Strasser & Eberhart Zrenner
Received: 29 October 2008 /Revised: 7 February 2009 /Accepted: 13 February 2009# Springer-Verlag 2009
AbstractPurpose To study clinical patterns of disease onset inmonogenic retinal dystrophies (MRD), using an epidemio-logical approach.Methods Records of patients with MRD, seen at theUniversity Eye Hospital Tuebingen from 1994 to 1999,were selected from a database and retrospectively reviewed.For analysis, patients were divided into 2 groups bypredominant part of visual field (VF) involvement: group1 (predominantly central involvement) included Stargardtdisease (ST), macular dystrophy (MD), and central areolarchoroidal dystrophy (CACD), and group 2 (predominantlyperipheral involvement) included Bardet–Biedl syndrome(BBD), Usher syndrome (USH) I and II, and choroideremia(CHD). Age, sex, age of first diagnosis, age of visual acuity(VA) decrease and VF emergence, night blindness andphotophobia onset, types of VF defects and age of its onset,color discrimination defects and best corrected VA wereanalyzed.Results Records of 259 patients were studied. Men weremore prevalent than women. Mean age of the patients was
47.2 (SD=15.6) years old. Forty-five patients in the firstgroup and 40 in the second were first diagnosed between 21and 30 years of age. Ninety-four patients in the first grouphad VA decrease before 30 years of age; in the secondgroup, 68 patients had VA decrease onset between 21 and40 years of age. Forty-four patients in the first groupnoticed VF at an age between 21 and 30 years, and 74patients between 11 and 30 years in the second group.Central scotoma was typical for the first group, and wasdetected in 115 patients. Concentric constriction was typicalfor the second group, and was found in 81 patients. Half ofpatients in both groups preserved best-corrected VA in thebetter eye at a level of 20/40 or better; 7% in the first groupand 6% in the second group were registered as legally blindaccording to WHO criteria, having VA <1/50 or VF <5°.Diagnosis frequency was USH I and II—34%, ST—31%,MD—18%, CHD—14%, BBD—5%.Conclusions An epidemiological approach to the estima-tion of the disease onset of various subtypes of monogenicretinal degenerations will be useful for detection of diseaseduration, its prognosis, rehabilitation and the researching offuture treatment possibilities.
Keywords Hereditary retinal dystrophies . Disease onset .
Epidemiology . Frequency of the disease . Blindness .
Central Europe
Introduction
Low vision and blindness are important public healthproblems not only in Germany, but worldwide [13]. Globally,in 2002 more than 161 million people were visually impaired,of whom 124 million had low vision and 37 million wereblind [19]; 12.8% of the European population had low vision
Graefes Arch Clin Exp OphthalmolDOI 10.1007/s00417-009-1059-9
Presentation at DOG 2008
Sponsoring organization: This research is funded by a scholarshipfrom the Tistou und Charlotte Kerstan Stiftung Vision 2000 awardedto Elena Prokofyeva.
E. Prokofyeva (*) :R. Wilke :G. Lotz : E. Troeger : T. StrasserBioengineering Medical Laboratory, Institute for OphthalmicResearch, University of Tuebingen,Paul-Ehrlich Str. 17,72076 Tuebingen, Germanye-mail: [email protected]
E. ZrennerInstitute for Ophthalmic Research, University of Tuebingen,Schleichstr.12–16,72076 Tuebingen, Germany
and 15.5% visual impairment [18]. According to the GermanFederation of Blind and Visually Impaired People, thenumber of blind people in Germany is about 145,000 andthe number of partially sighted people is approximately500,000 [8, 9].
The two most common retinal degenerative diseases thatresult in blindness secondary to photoreceptor loss are age-related macular degeneration and retinitis pigmentosa.Retinitis pigmentosa is more severe, and its symptomsappear earlier in life, but age-related macular degenerationis more prevalent [17].
Currently, there is no therapy that stops the evolution ofmonogenic retinal dystrophies [6, 17]. As the knowledge ofmolecular genetics and molecular biology increases, it maybecome possible to develop new treatment strategies [3]that will be based on pharmaceutical interventions such astopical treatment with alpha2-agonist [14], gene therapysuch as RPE65 gene replacement [4], cell transplantation[2], and artificial retinal implants [20]. Due to this, ascreening of monogenic retinal degenerations (MRD) at ageat risk and identifying affected individuals in the earlystages of the disease is necessary, and this shows theimportance of epidemiological studies focused on diseaseand blindness onset estimation in MRD.
A retrospective longitudinal study of hereditary retinaldegenerations (HRD) performed in Northern Franceshowed the importance of such studies for establishmentof HRD prevalence as well as the age of its diagnosis in thepopulation [15]. Earlier epidemiological studies have beenbased on the information received from social services, andwere focused on the estimation of the onset of blindness,but not of the disease itself [9, 10]. Disease and blindnessonset in monogenic retinal degeneration need to be furtherinvestigated using an epidemiological approach as in thefollowing study.
Materials and methods
Data from 3,787 patients with monogenic retinal degener-ations, seen at the University Eye Hospital Tuebingen from1994 to 1999, were stored in an RP-clinical access-baseddatabase. Records of 259 patients with hereditary retinaldystrophies were selected for the study from this databaseaccording to the inclusion criteria (diagnosis). Two groupsof hereditary retinal dystrophies were selected for ourstudy: the first group included pigment epithelial disorders(Stargardt and central areolar choroidal dystrophy (CACD))and macular dystrophies with different age structure (Best’sdisease, pseudovetilliform macular dystrophy, pattern mac-ular dystrophy and progressive macular dystrophy); thesecond group included syndromic degenerative diseases(Bardet-Biedl, Usher Syndrome I and II, choroideremia). A
time frame from 1994 to 1999 was chosen for the study.During this period all clinical data was collected in a highlystandardized manner, using an electronic database system.
The first visit data were retrospectively analyzed,including general information, disease history and dataabout color discrimination defects and best-corrected VA ofthese patients. General information contained the maindemographic characteristics of the study population: age,sex and nationality. Age of the patients was estimated as theage when they had their first visit to the special clinic forinherited retinal degenerations in Tuebingen. Diseasehistory included information about disease onset andevolution of clinical appearance of the disease over time,such as the age of first diagnosis, age of visual acuity (VA)decrease, night blindness and photophobia onset, and typesof VF defects and age of patient at its onset, which werereported by the patient. Age at onset of symptoms wasdefined as the age at which these symptoms were either firstreported by the patient and/or diagnosed by the ophthal-mologist. Age at first diagnosis was defined as the age atwhich the first correct diagnosis was made, as indicated bythe patient. Final diagnosis was recorded as a diagnosis thatwas established during the last visit of the patient within thechosen follow-up period.
Diagnosis was established by a team of four seniorresident ophthalmologists at the Eye University HospitalTuebingen, and was based on a comprehensive analysis ofmedical history, clinical investigation including best-corrected visual acuity, Goldmann or semiautomatic kineticperimetery, color testing (Panel D15 test), examination ofanterior segment and funduscopy, Ganzfeld ERG (in everypatient) and mfERG (in selected patients) according tocurrent ISCEV protocols [7]. Only some of the patientscould be genetically tested, and in a fraction of them it waspossible to verify the diagnosis genetically.
Types of VF defects, color discrimination defects andbest-corrected VAwere obtained from the results of clinicalexamination. For the purpose of analysis, patients weredivided into two homogenous groups according to predom-inant type of visual field defect: group 1 (with predomi-nantly central involvement)including Stargardt disease,macular dystrophy, and CACD, and group 2 (predominant-ly peripheral involvement) including Bardet-Biedl syn-drome, Usher Syndrome I and II, and choroideremia.
The study was designed with respect to ethical standardslaid down in the 1964 Declaration of Helsinki. The studyprotocol was reviewed and approved by the EthicsCommission of the Medical Faculty, Eberhard-Karls Uni-versity Tuebingen, Germany. All information was handledwith the special guarantee of confidentiality in order toavoid unwanted back-tracing of participants.
For further analysis, data was extracted from an MSAccess 2000-based RP-clinical database using Structured
Graefes Arch Clin Exp Ophthalmol

Query Language (SQL) selection, and transferred to anExcel spreadsheet that was used for data management.Statistical analysis was performed using SPSS 11.00 forWindows. Descriptive statistics, including mean andstandard deviation and frequency calculation, were usedfor data analysis. Data concerning age distribution, ageat first diagnosis, age of night blindness, photophobiaand VA decrease onset, and age of emergence of VFdefects were further stratified by diagnosis, which madeit possible to see the contribution of each diagnosis ineach age group; VA distribution data was stratified byage. Frequency of diagnosis and blindness was definedas the number of patients with this condition divided bythe study population.
Results
General information
General information about the study population includeddata about age, gender and nationality. Records of 259patients were studied. In total, group 1 (predominantlycentral involvement) included 134 patients and group 2(predominantly peripheral involvement) 125 patients.
Sex distribution: sex distribution analysis revealed thatin both groups men predominated in comparison withwomen. The same trend was revealed when stratifying thedata according to diagnosis in both groups (Figs. 1, 2a).Group 1 included 87 male and 47 female patients; group 2included 72 male and 53 female patients. In the subgroup ofpatients with choroideremia, men are prevalent, as thedisease is inherited via an X-linked recessive mechanism.At the same time, our data contained women who weremostly obligatory carriers of the disease with or withoutsymptoms, and one case was diagnosed with choroider-emia. The distribution of women in the choroideremiasubgroup is shown in Fig. 2b.
Age distribution
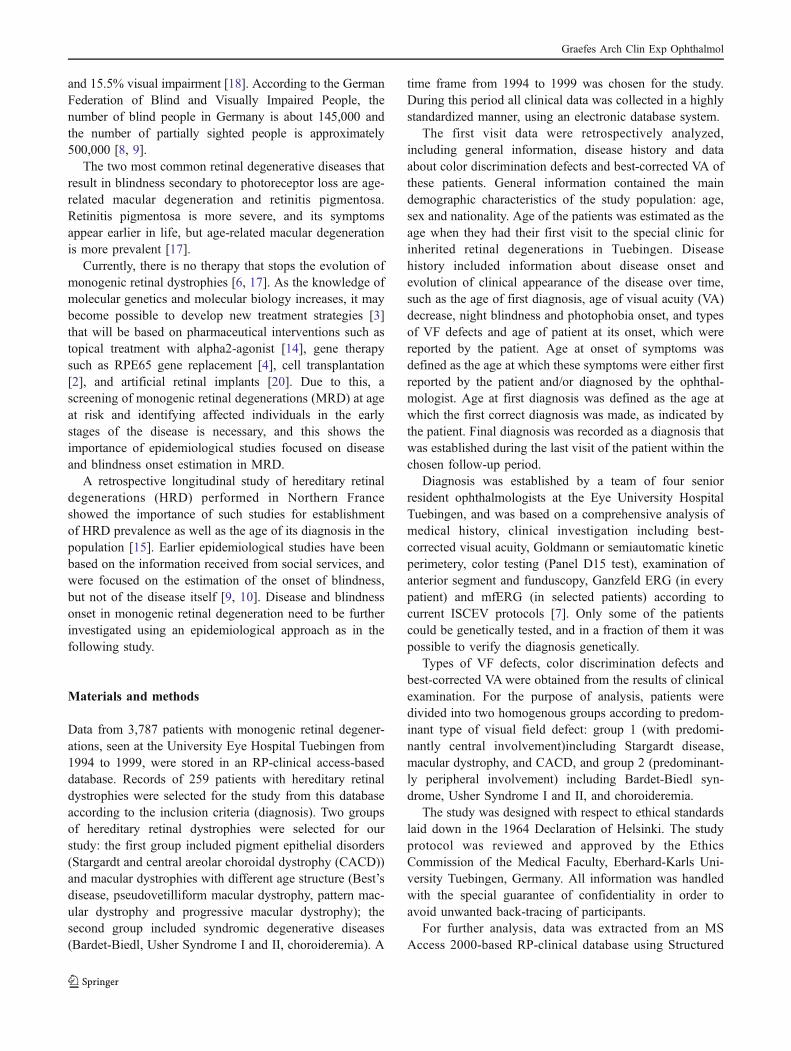
Age distribution analysis showed that patients between 21and 40 years old (n=53) represented the majority in group1. The age group 41–60 years old included 42 patients ingroup 1; age groups 0–20, 61–80, and over 80 werepresented by two, 34 and three patients respectively(Fig. 3a)
Fifty-two patients in group 2 were between 41 and60 years old, 40 between 21 to 40 years old; 26 patientswere aged between 61 and 80 years old, and there were nopatients older than 80 (Fig. 3a). Mean age for the entirestudy population was 47.2 years old (SD=15.6).
A stratification of subgroups with specific diseasesaccording to contribution of certain age groups of thepatients is shown on the Fig. 3b.
Nationality distribution of the patients: German patientswere predominant in both groups; in group 1 Germansrepresented 87 patients, and in group 2 76 patients. Forty-seven and 49 patients respectively originated from CentralEuropean countries.
History of the disease data
History of the disease data incorporated age at first diagnosis,age of visual acuity decrease, age of night blindness,photophobia onset and age of visual field defects emergence.
Age at first diagnosis showed the same trend for groups1 and 2. In group 1 we observed that ten patients werediagnosed for the first time before 10 years old, 27 between11 and 20 years old, 45 between 21 and 30, 17 between 31
55
17 15
34
85
0
10
20
30
40
50
60
Stargardt Macular dystrophy CACD
No
. of
pat
ien
ts
Diagnosis
male
female
Fig. 1 Sex distribution of patients in group 1 (predominantly centralretina involvement), stratified by diagnosis
710
30
25
68
28
11
0
5
10
15
20
25
30
35
Bardet-Biedl Usher I Usher II Choroideremia
No
. of
pat
ien
ts
Diagnosis
male
female
30%
60%
10% obligatory carrier withsymptoms
obligatory carrierwithout symptoms
diagnosed with adisease
a
b
Fig. 2 a Sex distribution of the patients in Group 2 (predominantlyperipheral involvement), stratified by diagnosis. b Distribution ofwomen in choroideremia subgroup
Graefes Arch Clin Exp Ophthalmol
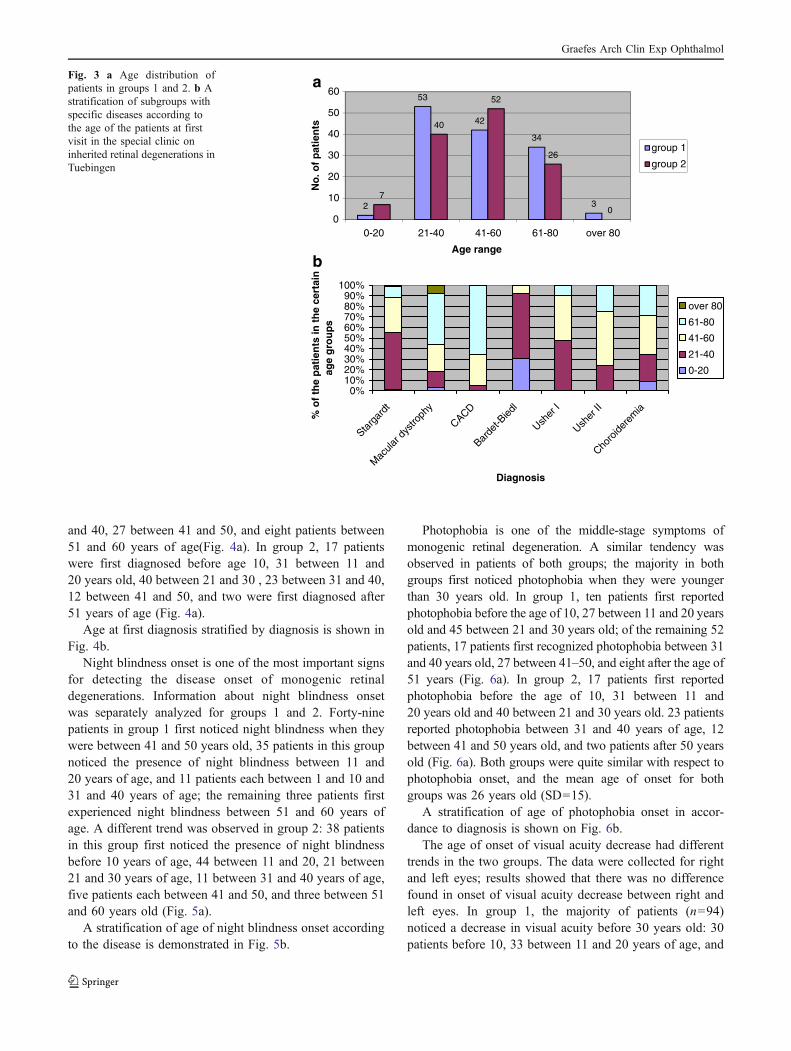
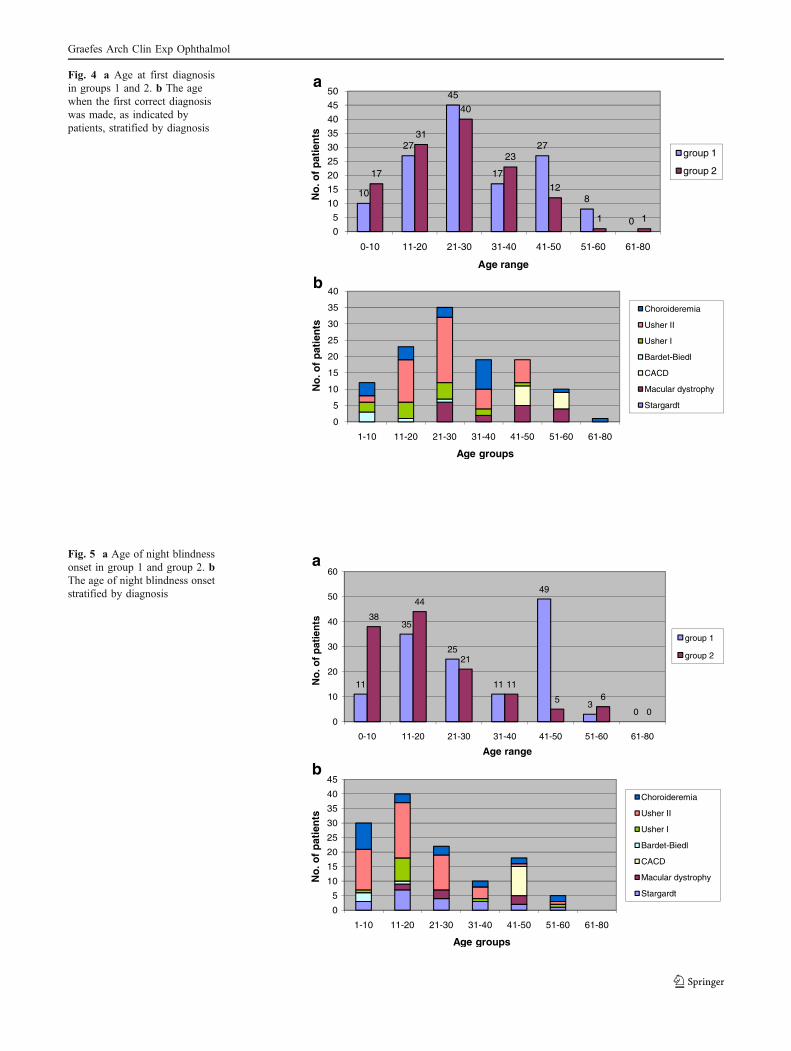
and 40, 27 between 41 and 50, and eight patients between51 and 60 years of age(Fig. 4a). In group 2, 17 patientswere first diagnosed before age 10, 31 between 11 and20 years old, 40 between 21 and 30 , 23 between 31 and 40,12 between 41 and 50, and two were first diagnosed after51 years of age (Fig. 4a).
Age at first diagnosis stratified by diagnosis is shown inFig. 4b.
Night blindness onset is one of the most important signsfor detecting the disease onset of monogenic retinaldegenerations. Information about night blindness onsetwas separately analyzed for groups 1 and 2. Forty-ninepatients in group 1 first noticed night blindness when theywere between 41 and 50 years old, 35 patients in this groupnoticed the presence of night blindness between 11 and20 years of age, and 11 patients each between 1 and 10 and31 and 40 years of age; the remaining three patients firstexperienced night blindness between 51 and 60 years ofage. A different trend was observed in group 2: 38 patientsin this group first noticed the presence of night blindnessbefore 10 years of age, 44 between 11 and 20, 21 between21 and 30 years of age, 11 between 31 and 40 years of age,five patients each between 41 and 50, and three between 51and 60 years old (Fig. 5a).
A stratification of age of night blindness onset accordingto the disease is demonstrated in Fig. 5b.
Photophobia is one of the middle-stage symptoms ofmonogenic retinal degeneration. A similar tendency wasobserved in patients of both groups; the majority in bothgroups first noticed photophobia when they were youngerthan 30 years old. In group 1, ten patients first reportedphotophobia before the age of 10, 27 between 11 and 20 yearsold and 45 between 21 and 30 years old; of the remaining 52patients, 17 patients first recognized photophobia between 31and 40 years old, 27 between 41–50, and eight after the age of51 years (Fig. 6a). In group 2, 17 patients first reportedphotophobia before the age of 10, 31 between 11 and20 years old and 40 between 21 and 30 years old. 23 patientsreported photophobia between 31 and 40 years of age, 12between 41 and 50 years old, and two patients after 50 yearsold (Fig. 6a). Both groups were quite similar with respect tophotophobia onset, and the mean age of onset for bothgroups was 26 years old (SD=15).
A stratification of age of photophobia onset in accor-dance to diagnosis is shown on Fig. 6b.
The age of onset of visual acuity decrease had differenttrends in the two groups. The data were collected for rightand left eyes; results showed that there was no differencefound in onset of visual acuity decrease between right andleft eyes. In group 1, the majority of patients (n=94)noticed a decrease in visual acuity before 30 years old: 30patients before 10, 33 between 11 and 20 years of age, and
2
53
42
34
37
40
52
26
00
10
20
30
40
50
60
0-20 21-40 41-60 61-80 over 80
No
. of
pat
ien
ts
Age range
group 1
group 2
0%10%20%30%40%50%60%70%80%90%
100%
Starg
ardt
Mac
ular d
ystro
phy
CACD
Barde
t-Bied
l
Usher
I
Usher
II
Choro
idere
mia
Diagnosis
% o
f th
e p
atie
nts
in t
he
cert
ain
ag
e g
rou
ps
over 80
61-80
41-60
21-40
0-20
a
b
Fig. 3 a Age distribution ofpatients in groups 1 and 2. b Astratification of subgroups withspecific diseases according tothe age of the patients at firstvisit in the special clinic oninherited retinal degenerations inTuebingen
Graefes Arch Clin Exp Ophthalmol
10
27
45
17
27
8
0
17
31
40
23
12
1 10
5
10
15
20
25
30
35
40
45
50
0-10 11-20 21-30 31-40 41-50 51-60 61-80
No
. of
pat
ien
ts
Age range
group 1
group 2
0
5
10
15
20
25
30
35
40
1-10 11-20 21-30 31-40 41-50 51-60 61-80
No
. of
pat
ien
ts
Age groups
Choroideremia
Usher II
Usher I
Bardet-Biedl
CACD
Macular dystrophy
Stargardt
a
b
Fig. 4 a Age at first diagnosisin groups 1 and 2. b The agewhen the first correct diagnosiswas made, as indicated bypatients, stratified by diagnosis
11
35
25
11
49
30
38
44
21
11
5 6
00
10
20
30
40
50
60
0-10 11-20 21-30 31-40 41-50 51-60 61-80
No
. of
pat
ien
ts
Age range
group 1
group 2
0
5
10
15
20
25
30
35
40
45
1-10 11-20 21-30 31-40 41-50 51-60 61-80
No
. of
pat
ien
ts
Age groups
Choroideremia
Usher II
Usher I
Bardet-Biedl
CACD
Macular dystrophy
Stargardt
a
b
Fig. 5 a Age of night blindnessonset in group 1 and group 2. bThe age of night blindness onsetstratified by diagnosis
Graefes Arch Clin Exp Ophthalmol
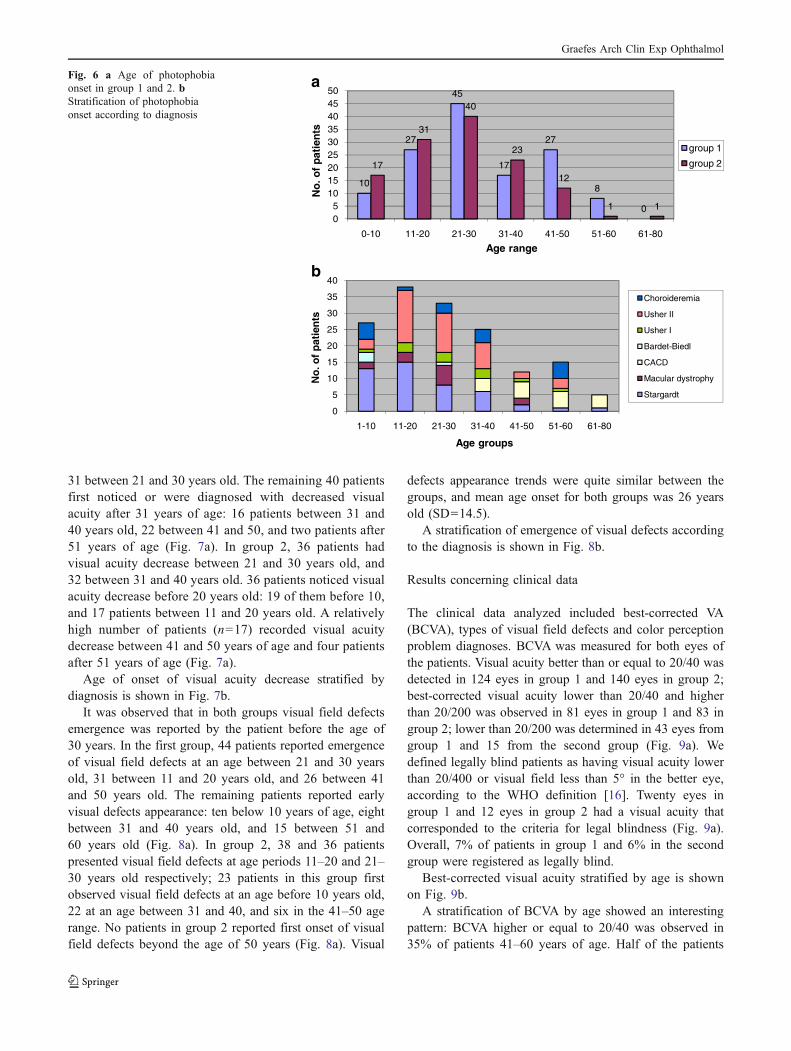
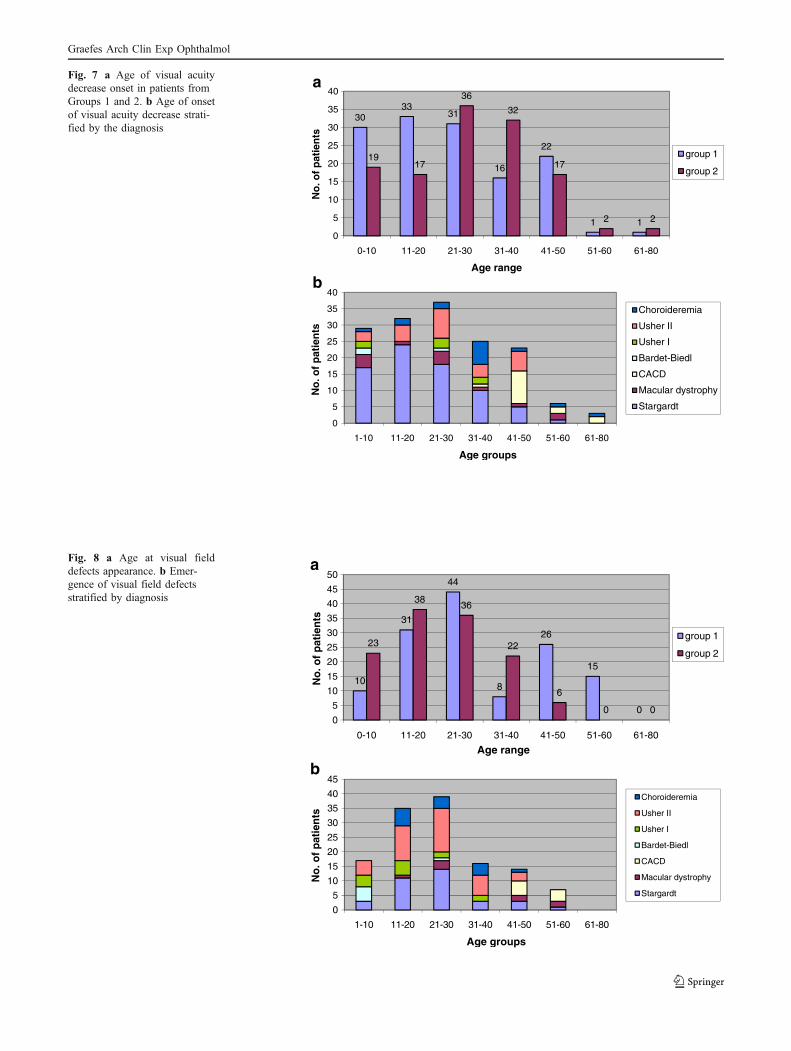
31 between 21 and 30 years old. The remaining 40 patientsfirst noticed or were diagnosed with decreased visualacuity after 31 years of age: 16 patients between 31 and40 years old, 22 between 41 and 50, and two patients after51 years of age (Fig. 7a). In group 2, 36 patients hadvisual acuity decrease between 21 and 30 years old, and32 between 31 and 40 years old. 36 patients noticed visualacuity decrease before 20 years old: 19 of them before 10,and 17 patients between 11 and 20 years old. A relativelyhigh number of patients (n=17) recorded visual acuitydecrease between 41 and 50 years of age and four patientsafter 51 years of age (Fig. 7a).
Age of onset of visual acuity decrease stratified bydiagnosis is shown in Fig. 7b.
It was observed that in both groups visual field defectsemergence was reported by the patient before the age of30 years. In the first group, 44 patients reported emergenceof visual field defects at an age between 21 and 30 yearsold, 31 between 11 and 20 years old, and 26 between 41and 50 years old. The remaining patients reported earlyvisual defects appearance: ten below 10 years of age, eightbetween 31 and 40 years old, and 15 between 51 and60 years old (Fig. 8a). In group 2, 38 and 36 patientspresented visual field defects at age periods 11–20 and 21–30 years old respectively; 23 patients in this group firstobserved visual field defects at an age before 10 years old,22 at an age between 31 and 40, and six in the 41–50 agerange. No patients in group 2 reported first onset of visualfield defects beyond the age of 50 years (Fig. 8a). Visual
defects appearance trends were quite similar between thegroups, and mean age onset for both groups was 26 yearsold (SD=14.5).
A stratification of emergence of visual defects accordingto the diagnosis is shown in Fig. 8b.
Results concerning clinical data
The clinical data analyzed included best-corrected VA(BCVA), types of visual field defects and color perceptionproblem diagnoses. BCVA was measured for both eyes ofthe patients. Visual acuity better than or equal to 20/40 wasdetected in 124 eyes in group 1 and 140 eyes in group 2;best-corrected visual acuity lower than 20/40 and higherthan 20/200 was observed in 81 eyes in group 1 and 83 ingroup 2; lower than 20/200 was determined in 43 eyes fromgroup 1 and 15 from the second group (Fig. 9a). Wedefined legally blind patients as having visual acuity lowerthan 20/400 or visual field less than 5° in the better eye,according to the WHO definition [16]. Twenty eyes ingroup 1 and 12 eyes in group 2 had a visual acuity thatcorresponded to the criteria for legal blindness (Fig. 9a).Overall, 7% of patients in group 1 and 6% in the secondgroup were registered as legally blind.
Best-corrected visual acuity stratified by age is shownon Fig. 9b.
A stratification of BCVA by age showed an interestingpattern: BCVA higher or equal to 20/40 was observed in35% of patients 41–60 years of age. Half of the patients
10
27
45
17
27
8
0
17
31
40
23
12
1 105
101520253035404550
0-10 11-20 21-30 31-40 41-50 51-60 61-80
No
. of
pati
ents
Age range
group 1
group 2
0
5
10
15
20
25
30
35
40
1-10 11-20 21-30 31-40 41-50 51-60 61-80
No
. of
pat
ien
ts
Age groups
Choroideremia
Usher II
Usher I
Bardet-Biedl
CACD
Macular dystrophy
Stargardt
a
b
Fig. 6 a Age of photophobiaonset in group 1 and 2. bStratification of photophobiaonset according to diagnosis
Graefes Arch Clin Exp Ophthalmol
3033
31
16
22
1 1
1917
36
32
17
2 2
0
5
10
15
20
25
30
35
40
0-10 11-20 21-30 31-40 41-50 51-60 61-80
No
. of
pat
ien
ts
Age range
group 1
group 2
0
5
10
15
20
25
30
35
40
1-10 11-20 21-30 31-40 41-50 51-60 61-80
No
. of
pat
ien
ts
Age groups
Choroideremia
Usher II
Usher I
Bardet-Biedl
CACD
Macular dystrophy
Stargardt
a
b
Fig. 7 a Age of visual acuitydecrease onset in patients fromGroups 1 and 2. b Age of onsetof visual acuity decrease strati-fied by the diagnosis
10
31
44
8
26
15
0
23
3836
22
6
0 00
5
10
15
20
25
30
35
40
45
50
0-10 11-20 21-30 31-40 41-50 51-60 61-80
No
. of
pat
ien
ts
Age range
group 1
group 2
0
5
10
15
20
25
30
35
40
45
1-10 11-20 21-30 31-40 41-50 51-60 61-80
No
. of
pat
ien
ts
Age groups
Choroideremia
Usher II
Usher I
Bardet-Biedl
CACD
Macular dystrophy
Stargardt
a
b
Fig. 8 a Age at visual fielddefects appearance. b Emer-gence of visual field defectsstratified by diagnosis
Graefes Arch Clin Exp Ophthalmol
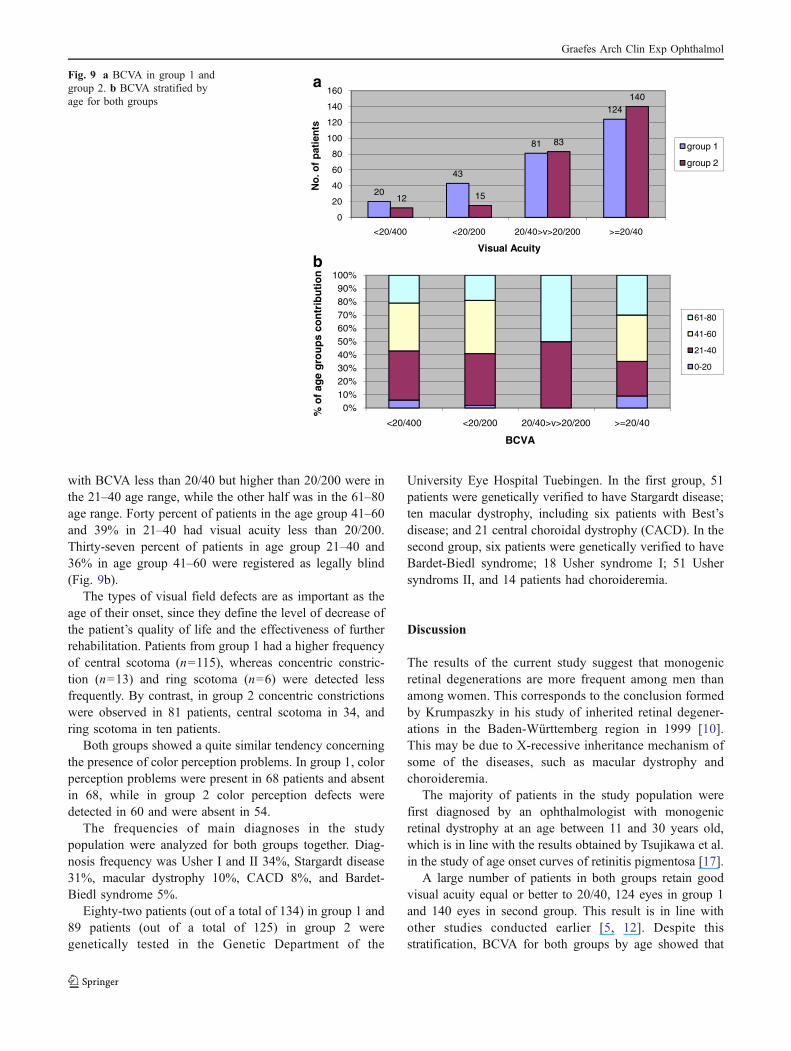
with BCVA less than 20/40 but higher than 20/200 were inthe 21–40 age range, while the other half was in the 61–80age range. Forty percent of patients in the age group 41–60and 39% in 21–40 had visual acuity less than 20/200.Thirty-seven percent of patients in age group 21–40 and36% in age group 41–60 were registered as legally blind(Fig. 9b).
The types of visual field defects are as important as theage of their onset, since they define the level of decrease ofthe patient’s quality of life and the effectiveness of furtherrehabilitation. Patients from group 1 had a higher frequencyof central scotoma (n=115), whereas concentric constric-tion (n=13) and ring scotoma (n=6) were detected lessfrequently. By contrast, in group 2 concentric constrictionswere observed in 81 patients, central scotoma in 34, andring scotoma in ten patients.
Both groups showed a quite similar tendency concerningthe presence of color perception problems. In group 1, colorperception problems were present in 68 patients and absentin 68, while in group 2 color perception defects weredetected in 60 and were absent in 54.
The frequencies of main diagnoses in the studypopulation were analyzed for both groups together. Diag-nosis frequency was Usher I and II 34%, Stargardt disease31%, macular dystrophy 10%, CACD 8%, and Bardet-Biedl syndrome 5%.
Eighty-two patients (out of a total of 134) in group 1 and89 patients (out of a total of 125) in group 2 weregenetically tested in the Genetic Department of the
University Eye Hospital Tuebingen. In the first group, 51patients were genetically verified to have Stargardt disease;ten macular dystrophy, including six patients with Best’sdisease; and 21 central choroidal dystrophy (CACD). In thesecond group, six patients were genetically verified to haveBardet-Biedl syndrome; 18 Usher syndrome I; 51 Ushersyndroms II, and 14 patients had choroideremia.
Discussion
The results of the current study suggest that monogenicretinal degenerations are more frequent among men thanamong women. This corresponds to the conclusion formedby Krumpaszky in his study of inherited retinal degener-ations in the Baden-Württemberg region in 1999 [10].This may be due to X-recessive inheritance mechanism ofsome of the diseases, such as macular dystrophy andchoroideremia.
The majority of patients in the study population werefirst diagnosed by an ophthalmologist with monogenicretinal dystrophy at an age between 11 and 30 years old,which is in line with the results obtained by Tsujikawa et al.in the study of age onset curves of retinitis pigmentosa [17].
A large number of patients in both groups retain goodvisual acuity equal or better to 20/40, 124 eyes in group 1and 140 eyes in second group. This result is in line withother studies conducted earlier [5, 12]. Despite thisstratification, BCVA for both groups by age showed that
20
43
81
124
12 15
83
140
0
20
40
60
80
100
120
140
160
<20/400 <20/200 20/40>v>20/200 >=20/40
No
. of
pat
ien
ts
Visual Acuity
group 1
group 2
0%10%20%30%40%50%60%70%80%90%
100%
<20/400 <20/200 20/40>v>20/200 >=20/40
% o
f ag
e g
rou
ps
con
trib
uti
on
BCVA
61-80
41-60
21-40
0-20
a
b
Fig. 9 a BCVA in group 1 andgroup 2. b BCVA stratified byage for both groups
Graefes Arch Clin Exp Ophthalmol
37% of patients in age group 21–40 and 36% in age group41–60 were registered as legally blind, indicating a strongimpact of monogenic retinal degenerations on incidence ofblindness principally in a productive age group.
Color perception problems didn’t appear to be a veryspecific symptom in either group, since an equal number ofpatients in both groups indicated presence and absence ofcolor vision problems. This is surprising, since color visiondiscrimination problems should be more common inprimary diseases affecting central retina than in diseasesaffecting periphery. This may be a consequence of the“bystander effect”, when cones are effected secondarilybecause of rod degeneration and production of rod-derivedcone viability factor (RdCVF) [11].
Usher syndrome I and II (34%), Stargardt disease (31%),and choroideremia (14%) were the most frequent diagnosesin our study. This corresponds to the results of otherstudies, where Usher syndrome types I and II were found tobe the most frequent types of monogenic retinal dystrophiesin Germany and in Spain [1, 9, 10].
This study has some limitations. It was designed as aretrospective cross-sectional study, and the data was obtainedfrom a clinical database which wasn’t initially designed forresearch purposes. That limited us to the analysis of the datathat were available. Furthermore, the age of symptoms onsetestimation was based on the patients’ perception, andtherefore could be subjective. However, the current studywas based on clinical data obtained from the database andincluded all patients with a diagnosis of interest, whereas thestudy performed by Krumpatszky derived data from socialservices and focused only on those patients that were alreadyregistered as blind. Our study included a high percentage ofpatients originating from other countries, which will make itpossible to more effectively compare with other non-Germanstudies performed in the future. Furthermore, examinations ofthe patients from the study population were conducted by theteam of four senior resident ophthalmologists, who hadhomogenous diagnosis criteria, which ensures high datareliability.
Overall, the results of our study showed that thesemonogenic retinal dystrophies are more frequent amongmen than among women. We also found that relatively highnumbers of patients in both groups retained quite goodvisual acuity, which shows that early and properly plannedrehabilitation strategies could be beneficial in order toincrease quality of life for these patients. Moreover, forboth groups an age for optimal therapeutic intervention wasdefined. It is recommended that this should be taken intoaccount while screening for patients to take part in clinicaltrials for testing new treatment strategies. It was also shownin the study that color perception problems didn’t appear tobe a very specific symptom in both groups; this may be aconsequence of the “bystander effect”.
Furthermore, our study showed that the age of diseaseonset can be estimated on the basis of an epidemiologicalapproach, which is based on epidemiological analysis ofage at main symptoms onset, derived from the history ofthe disease, and main clinical parameters. An epidemiolog-ical approach to the estimation of the disease onset could beused by clinicians for detecting the duration of the diseaseand its prognosis, planning rehabilitation measures, and forresearching the future possibilities for treatment. Furtherlong-term follow-up studies of clinical parameters areneeded for the establishment of a decision-making algo-rithm for estimation of disease prognosis and rehabilitationpossibilities.
Acknowledgements We would like to thank the team of seniorresident ophthalmologists who were in charge of the patients withhereditary retinal degenerations in Tuebingen University EyeHospital at the time that data collection was conducted: Dr. K.Rüther, Dr. E. Apfelstedt-Sylla, Dr. H. Jaegle and Dr. A. Schuster.Many thanks to Dr. S. Kohl, who helped with genetic data for thepatients. This study was supported by the Tistou und CharlotteKerstan Stiftung Vision 2000.
References
1. Ayuso C, Garcia-Sandoval B, Najera C, Valverde C, Carballo M,Antino G (1995) Retinitis pigmentosa in Spain. The Spanishmulticentric and multidisciplinary group for research into retinitispigmentosa. Clin Genet 48(3):120–122
2. Bartsch U, Linke SJ, Petrowitz B (2005) Stem cell-based therapiesfor retinal disorders. Ophthalmologe 102(7):679–687.doi:10.1007/s00347-005-1188-4
3. Bessant DAR, Robin RA, Bhattacharya SS (2001) Moleculargenetics and prospects for therapy of inhereted retinal dystrophies.Curr Opin Genet Dev 11(3):307–316. doi:10.1016/S0959-437X(00)00195-7
4. Cideciyan AV, Aleman TS, Boye SL, Schwartz SB et al (2008)Human gene therapy for RPE65 isomerase dificiency activates theretinoid cycle of vision but with slow rod kinetics. Proc Natl AcadSci USA 105(39):15112–15117. doi:10.1073/pnas.0807027105
5. Grøndahl J (1987) Estimation of prognosis and prevalence ofretinitis pigmentosa and Usher syndrome in Norway. Clin Genet31(4):255–264
6. Hamel C (2006) Retinitis Pigmentosa. Orphanet J Rare Dis 1:40.doi:10.1186/1750-1172-1-40
7. Kellner U, Tillack H, Renner AB (2004) Hereditary retinochor-oidal dystrophies. Part 1: Pathogenesis, diagnosis, therapy andpatients counseling. Ophthalmologie 101(3):307–319.doi:10.1007/s00347-003-0944-6
8. Knauer C, Pfeiffer N (2006) Blindness in Germany- today and in2030. Ophthalmologie 103:735–741. doi:10.1007/s00347-006-1411-y
9. Krumpatszky HG (1996) Epidemiology of blindness and eyedisease. Ophthalmologica 210:1–84
10. Krumpatszky HG (1999) Blindness incidence in Germany. Apopulation-based study from Württemberg-Hohenzollern. Oph-thalmologica 213:176–182. doi:10.1159/000027415
11. Lorentz O, Sahel J, Mohand-Said S, Leveillard T (2006) Conesurvival: identification of RdCVF. Adv Exp Med Biol 572:315–319. doi:10.1007/0-387-32442-9_44
Graefes Arch Clin Exp Ophthalmol

12. Marmor MF (1980) Visual loss in retinitis pigmentosa. Am JOphthalmol 89(5):692–698
13. McNeil JM (1991) Americans with disabilities: 1991–92. U.S.Census Bureau
14. Merin S, Obolensky A, Farber MD, Chowerst I (2008) A pilotstudy of topical treatment with an alpha2-agonist in patients withretinal dystrophies. J Ocul Pharmacol Ther 24(1):80–86.doi:10.1089/jop.2007.0022
15. Puech B, Kostrubiec B, Hache JC, Francois P (1991) Epidemi-ology and prevalence of hereditary retinal dystrophies in theNorthern France. J Fr Ophtalmol 14(3):153–164
16. Spandau HMU, Rohrschneider K (2002) Prevalence and geo-graphical distribution of Usher syndrom in Germany. Graefes
Arch Clin Exp Ophthalmol 240:495–498. doi:10.1007/s00417-002-0485-8
17. Tsujikawa M, Wada Y, Sukegawa M, Sawa M, Gomi F, Nishida K,Tano Y (2008) Age at onset curves of retinitis pigmentosa. ArchOphthalmol 126(3):337–340. doi:10.1001/archopht.126.3.337
18. Weiland JD, Humayun MS (2008) Visual Prothesis. Proc IEEE 97(3):1076–1084. doi:10.1109/JPROC.2008.922589
19. WHO Magnitude and causes of visual impairment. Fact Sheet №282, November 2004: http://www.who.int/mediacentre/factsheets/fs282/en/index.html (accessed August 25, 2008)
20. Zrenner E (2007) Subretinal implants for the restitution of visionin blind patients. ARVO Annual Meeting, Fort Lauderdale, FL,USA
Graefes Arch Clin Exp Ophthalmol