An Environmental History of North Sea Ling and Cod Fisheries, 1840-1914. By Rene Taudal Poulsen....
307
An environmental history of North Sea ling and cod fisheries, 1840-1914 René Taudal Poulsen Fiskeri- og Søfartsmuseets Studieserie nr. 22
Transcript of An Environmental History of North Sea Ling and Cod Fisheries, 1840-1914. By Rene Taudal Poulsen....

An environmental history
of North Sea ling and cod
fisheries, 1840-1914
René Taudal Poulsen
Fiskeri- og Søfartsmuseets Studieserie nr. 22

2
Fiskeri- og Søfartsmuseets Forlag Studieserien Esbjerg, 2007 Copyright: Author and publisher ISBN 978-87-90982-42-3 ISSN 0908-3421

3

4

5
CONTENTS
CONTENTS .............................................................................5
ACKNOWLEDGEMENTS................................... ...................11
ECOLOGY AND HISTORY................................ ....................15
The two questions .......................................................................................16 What were the historical abundances of ling and cod? ............................17 Which factors caused changes in the historical fisheries? .......................18 The case study – why? .............................................................................19
Literature review ........................................................................................21 Scandinavian maritime history and ethnology.........................................21 Historical studies of fishing fleet dynamics .............................................25 A theory of fishing fleet dynamics...........................................................30 Terrestrial environmental history.............................................................32 Historical ecology and marine environmental history.............................34 Fisheries biological studies of ling and cod .............................................40
The methodology ........................................................................................42 The catch rate approach ...........................................................................42 Calculating catch rates .............................................................................42 Standardizing fishing effort .....................................................................49 Calculating historical abundance estimates .............................................51
The sources..................................................................................................51

6
THE BOHUSLÄN FISHERIES BEFORE 1859 ................. .....57 The Bohuslän fisheries before 1840 ........................................................57 The fisheries in Holmberg’s Bohuslän.....................................................61
The overall state of the fishing industry..............................................62 The individual fishing communities....................................................64
Fishing practices in the 1840s..................................................................71 Gear.....................................................................................................73 Vessels ................................................................................................75 Fishing operations ...............................................................................76 Handling of the catches.......................................................................77
The expansion of the Jäderen fishery.......................................................78 Status for the longline fisheries in 1859...................................................79
TRENDS AND CATCH RATES ............................. ................81
Decadal changes 1859-1914........................................................................81 The fisheries statistics..............................................................................81 Decadal trends .........................................................................................84
Growth rates........................................................................................84 The relative decline.............................................................................90 The work force....................................................................................91 Regional trends ...................................................................................92 A comparison with other fisheries ......................................................94
Conclusion ...............................................................................................97
Calculating catch rates...............................................................................99 Technological change: Did catching power increase? .............................99
The sources .......................................................................................100 Catchability changes .........................................................................101 Conclusion: The impact of technological change on catch rate calculations .......................................................................................104
Time budgets: How much time was spent fishing? ...............................104 Travelling time..................................................................................105 Setting time .......................................................................................109 Handling time....................................................................................110 Length of season ...............................................................................112 Conclusion: Defining CPUE.............................................................114

7
SPATIAL EXPANSION 1859-77.......................... ................117
Driving forces in the spatial expansion ...................................................118 The sources and the spatial resolution of the analysis ...........................118
1859-71 .............................................................................................118 1872-86 .............................................................................................119
The fishing companies ...........................................................................120 The rise of the Ålesund fishery..............................................................123
Regions and fishing strategies...........................................................131 Catch rates and fleet dynamics ..............................................................132 Conclusion .............................................................................................142
Target species............................................................................................144 The Swedish fish market........................................................................154 Conclusion .............................................................................................158
DECLINE AND SPATIAL CONTRACTION 1878-90 ...........1 59
The decline of the Ålesund fishery ..........................................................160 Economic explanations for the decline of the Ålesund fishery..............163 Ecological explanations for the decline of the Ålesund fishery.............167 Conclusion .............................................................................................170
Regional responses to the decline of the 1870s and 1880s .....................172 Fishing District 1 and the expansion of the Kattegat fishery .................172 The Jäderen fisheries .............................................................................174 The Fishing Districts 2 and 7: Ålesund and Skagerrak..........................176
Social organisation....................................................................................178 The seven case studies ...........................................................................180 Gear and vessel ownership ....................................................................182 Social organisation and risk taking ........................................................185 Conclusion .............................................................................................186

8
TOTAL REMOVALS & HISTORICAL ABUNDANCES........187
Total removals ..........................................................................................187 Swedish catches .....................................................................................188 Other countries.......................................................................................197
Danish fisheries, 1860-90 .................................................................198 Danish catches, 1890-1914 ...............................................................203
Norwegian catches.................................................................................208 British, German and Dutch catches .......................................................210 Total North Sea removals, 1903-14 .......................................................215 Conclusion .............................................................................................217
Historical stock abundances and fish sizes .............................................219 Stock structure and population dynamics ..............................................220
The concept of fish stocks.................................................................220 Population dynamics .........................................................................221
Stock abundances...................................................................................223 Methodology.....................................................................................223 Results...............................................................................................226
Size composition of landings.................................................................228 The data set .......................................................................................230 A modern comparison.......................................................................235
Conclusion .............................................................................................239
SHETLAND FISHERIES 1891-1914....................... .............243
Spatial shifts ..............................................................................................243 The fisheries inspectors and the data sets ..............................................243 Shetland fisheries...................................................................................250
Did the British fish market attract Swedish fishermen?....................252 Did the fishermen change target species? .........................................255 Did catch rates decline in the Skagerrak and off Jäderen?................257 Catch rates in the Danish Skagerrak fisheries, 1895-1911................260 Conclusion ........................................................................................264

9
Technological changes..............................................................................264
Alternatives to longline fisheries .............................................................268
Longline fisheries after 1914....................................................................271
CONCLUSION.....................................................................277
Changing fishing strategies, 1840-1914...................................................277
The social organisation of coastal communities .....................................279
Long-term ecosystem changes .................................................................280
History and ecology ..................................................................................282
BIBLIOGRAPHY ....................................... ..........................285
Unpublished sources.................................................................................285
Publications ...............................................................................................286
Web publications ......................................................................................306

10

11
ACKNOW LEDGEMENTS
This book is based on my PhD studies, which I carried out from July 2002 to July 2005 at the Centre for Maritime and Regional Studies (CMRS) in Denmark. CMRS is a joint research centre hosted by the University of Southern Denmark and the Fisheries and Maritime Mu-seum in Esbjerg. The PhD project was part of the global research programme, History of the Marine Animal Populations (HMAP). Many people contributed to this work, and I want to thank them all for their assistance and advice. I would also like to thank the A.P. Sloan Foundation, Forskeruddan-nelsesrådet, HMAP, CMRS, the research programme CONWOY and the Danish research councils for funding my PhD scholarship. I also thank the CMRS for financing the publication of this book. My PhD supervisor, Professor Poul Holm, has given me highly im-portant advice and comments throughout the entire process. Poul introduced me to the discipline of maritime history when I was an undergraduate student, and he has taught me the importance of inter-disciplinary studies and the potential of environmental history. I am very thankful for his advice and support. My PhD committee consisted of Professor Martin Rheinheimer, Cen-tre for Maritime and Regional Studies, University of Southern Den-mark, Dr David Starkey, Maritime Historical Studies Centre, Univer-sity of Hull, and Professor Henrik Gislason, Danish Institute of Fish-eries Research, Charlottenlund. All three have given me highly useful advice, and I want to thank them for their valuable assistance. Martin Rheinheimer has encouraged me to publish the dissertation and I want to thank him for his assistance. I also owe thanks to Bo Poulsen, with whom I cooperated closely during my studies. Bo Poulsen completed his PhD dissertation on the

12
environmental history of North Sea herring fisheries in 1600-1860 at the Centre for Maritime and Regional Studies at the same time as me, and he served as great inspiration to me. The intellectual and social working conditions in Esbjerg were ideal for my work. I owe thanks to Anne Lif Lund Jacobsen for her very fruitful advice and database assistance. I also want to thank my col-leagues at the University of Southern Denmark, Anne Husum Mar-boe, Maibritt Bager, Arne Langhelle, Erika Washburn, Dr Bo Ejstrud, Dr Niels Chr. Nielsen and Helle Kildebæk Raun for their assistance. During my PhD studies, I attended seminars held by the research school Mariners, hosted at the Centre for Maritime and Regional Studies. These seminars were very useful to me, and I want to thank all PhD students at the seminars for their comments to my work. Thanks are also due to my other colleagues both at the History De-partment at the University of Southern Denmark and the Fisheries and Maritime Museum, Esbjerg. In the course of my PhD studies, I spent two months at the University of New Hampshire in the United States. This stay was highly impor-tant to the project and to me personally. I want to thank Professor Andrew A. Rosenberg, Dr Andrew Cooper, Karen Alexander, Dr William Leavenworth, Dr Jeff Bolster, Dr Matthew MacKenzie and Lynn Rutter for making my stay so inspiring. They gave me good advice and constructive suggestions. I cooperated closely with Dr Cooper on the calculation of historical abundance estimates, and this was a very exciting experience for me. I owe thanks to Dr Robb Robinson, Dr Michael Haines, Michaela Barnard and Martin Willcox from the Maritime Historical Studies Centre at the University of Hull for fruitful advice on British archives and fisheries history. I have benefited from participating in HMAP workshops and summer schools held from 2001 to 2007. I want to thank Dr Tim Smith from NOAA’s National Marine Fisheries Service and Dr Brian R. MacKenzie from the Danish Institute of Fisheries Research for their advice. Furthermore, I have benefited greatly from attending the Dan-

13
ish research project CONWOY’s annual meetings from 2003 to 2005 as well as meetings held by Fishnet.dk. I want to thank Ragnar Olsson, Göteborg and Hrefna Karlsdóttir, Reykjavik for their archival assistance. I also want to thank museum curators Anna-Lena Segestam Macfie and Eva Göransson at Bo-husläns Museum in Uddevalla for archival assistance. Anne-Lena Segestam Macfie was also very kind in measuring fish hooks kept in the museum archives in Uddevalla. At Landsarkivet i Göteborg, I want to thank Malin Söderback for assistance in connection with the archival material from Länsstyrelsen. Museum curators Lars-Olof Lööf and Barbro Ilvemo at Göteborgs Stadsmuseums Arkiv were kind enough to help me with the ethnographic material kept in the museum archives in Göteborg. Erika Svahn from Statistiska Central Byrån in Stockholm assisted me with fisheries statistics, which are kept in Riksarkivet in Stockholm. Dr Odd Aksel Bergstad from the Norwegian Institute of Marine Re-search kindly made his modern size composition data for ling avail-able to me, and I thank him for his assistance. I also want to thank Director Morten Hahn-Pedersen from the Fisher-ies and Maritime Museum in Esbjerg for giving me the opportunity to publish this book as part of the museum’s series of publications, Skriftserien. I also want to thank Dr. Susanne Askham from the Language Centre at the Copenhagen Business School for editing the text. Librarians at the library of the University of Southern Denmark, Esbjerg, have done a very significant job in making books and arti-cles available to me. I thank them for their assistance. René Taudal Poulsen Esbjerg, October 15, 2007.

14

15
ECOLOGY AND HISTORY
Human beings depend on nature; indeed, healthy ecosystems are cru-cial to life on the globe. Whether humans are destroying the world’s ecosystems is presently heavily debated, such that human interaction with ecosystems is undoubtedly an important and current topic. Many are concerned about pollution and maintain that natural resources are being consumed more quickly than they can regenerate. The overex-ploitation of tropical rainforests and overharvesting of the oceans are often seen as clear examples of the depletion of renewable resources. This alarmist stance, however, comes under scrutiny from those who have a more optimistic interpretation, and who stress that ecological problems are often exaggerated. The optimists thus argue that the alarmists focus narrowly on particular issues, losing sight of the over-all state of ecosystems. Fundamentally, the controversy can be said to have two focii:
• What is the present state of the globe’s ecosystems? • How do human societies interact with ecosystems?
The two questions can be rephrased thus: first, “how critical is the present situation?”; secondly, if it is critical, can we do something about it?
Alarmists argue that major, global policy changes are required to resolve ecological problems. At best, implementation of such policy changes can halt the process of ecosystem degradation. Technological innovations are often singled out as a major source of ecological problems. New products and new production technologies precipitate the depletion of natural resources. In the short term, innovations con-ceal ecological problems, but ultimately contribute to ecosystem de-gradations. By contrast, optimists argue that human creativity will suffice to avoid ecological collapse. Innovation will reduce pollution and lead to a more efficient use of natural resources. The dividing line in this argument is obviously the impact of innovation. The central question is whether innovations basically disguise ecological prob-lems or do indeed resolve them.

16
Regardless of their major differences, the alarmist and optimist viewpoints have a common problem in that they suffer from historical myopia. Most of their arguments are based on data series extending only a few years or decades back in time. Natural fluctuations, how-ever, are an inherent part of ecosystems, and major ecological changes have taken place long before humans set foot on the globe. The crux of the matter is whether the present state of global ecosys-tems is alarming in a long-term historical perspective. The analysis to follow is an attempt to address this issue. Its purpose is to increase our understanding of long-term ecosystem changes and human re-sponse to such changes. The study will take a case study from the oceans and rephrase the above two questions:
• Have fish stock abundances declined dramatically in the long-term?
• Which factors – ecological and anthropogenic – have caused changes in fisheries?
The two questions
The oceans cover more than 70 per cent of the globe. For marine eco-systems, issues of ecological degradation and human responses to such changes are highly relevant. In 2004 the United Nations’ Food and Agricultural Organisation (FAO) estimated that 26 per cent of the world’s fish stocks were overexploited, depleted or recovering from depletion and 52 per cent were fully exploited.1 Historically, there are many examples of fish stock collapses. The decline of the Newfound-land cod, once considered among the world’s greatest fisheries, is a case in point. In 1968 catches peaked at 810,000 tons, but plummeted disastrously in the 1980s. Despite the introduction of a fisheries moratorium in 1992, the cod stock has not recovered.2
The debate on the exploitation of the oceans suffers from a lack of a long-term historical perspective; for example, most fisheries management schemes in the European Union are based on time series 1 FAO 2004, part 1, p. 32. 2 Hutchings & Myers 1994; Hutchings & Myer, 1995.

17
that only extend back to the 1960s. In essence, a historical baseline is useful to evaluate the present state of the marine ecosystems. If we adopt a historical approach, we can ask whether the present state of marine ecosystems is unprecedented in a long-term perspective. In addition, we should ask if key fish stocks are now at an exceptionally low level on a centennial scale.
What were the historical abundances of ling and cod?
The North Sea has some of the world’s most productive fishing grounds. As it is situated close to highly populated areas, the North Sea has been fished for centuries. Traditionally, cod fishery was among the most important and productive fisheries of the North Sea. The North Sea cod stock is presently at a ‘historically’ low level ac-cording to stock assessment biologists. Recently, biologists from the International Council for the Exploration of the Sea (ICES) have ad-vised a total closure of fishery for cod as well as of fisheries where cod is caught as a bycatch.3 If implemented, such closures would cause major economic problems in the fishing industry and wreak havoc on many coastal communities. With little alternative employ-ment to offer the fishermen, many such communities will certainly experience severe structural problems.
In the case of cod, ‘historically’ means since 1963. Only then did biologists undertake the first stock assessment. Ideally, abundance fluctuations should be studied over a long time perspective and more focus should be directed towards earlier periods when the fishing industry (and hence the human impact on the marine environment) was very different from the present. Though it is seldom properly defined, overfishing is often described as a recent phenomenon, one which has taken place only in the last 30 or 40 years. However, little is known about fish stocks before World War One. A study of the nineteenth century exploitation of marine resources can give us in-sight into long-term ecological changes and inform ecologists and fisheries managers on long-term ecosystem shifts.
3 ICES 2006, p. 26; ICES 2004, p. 192-215; ICES 2002, p. 37-40.

18
The following analysis takes the demersal – i.e. bottom-living – stocks of ling and cod in the north-eastern North Sea and the Skager-rak as a case and asks how abundant they were in the nineteenth cen-tury. Specifically, the study focuses on stock abundances in the 1870s before the advent of steam trawlers in the North Sea. These abun-dance estimates are compared to present abundances in order to evaluate long-term changes in the North Sea ecosystem. Moreover, the case study examines the size composition of the catches. A large decrease in average fish sizes would indicate significant long-term ecosystem changes.
The calculation of historical stock abundances requires an under-standing of the social, economic and technological setting of a fish-ery. Indeed, the historical context of the fishery is a prerequisite for validating the data set for an abundance calculation. Calculating his-torical stock abundances is thus impossible without an account of the historical context of the fisheries.
Which factors caused changes in the historical fisheries?
The second question of this study is a simple one: Which factors – ecological and anthropogenic – have caused change in historical fish-eries. Specifically, the study focuses on the nineteenth century Swed-ish North Sea fisheries for ling and cod. Situated within the field of marine environmental history, this is a study of the historical interac-tion between fisheries and fish populations. By asking how human societies have responded to ecological changes over time, marine environmental history addresses the classical disciplinary question of historical driving forces. Indeed, marine environmental history en-hances our understanding of a historical development by adding eco-logical aspects to the analysis. Marine environmental history also takes account of anthropogenic drivers of change.
Historical studies of the exploitation of the oceans can elucidate the fundamental issues of renewable resource depletions. Thus, ma-rine environmental history gives a time perspective to the ongoing debate concerning societies’ ability to adapt to ecological changes. The field offers insights which have relevance for historians, marine scientists and fisheries managers.
This study examines nineteenth century Swedish fishermen’s re-sponses to ecological changes, by focusing on the fishermen’s fishing

19
strategies. A fishing strategy involves a series of choices for the fish-ermen:
• Choice of target species: Should the fishermen pursue a sin-gle- or a multi-species fishery?
• Choice of fishing ground: Where should fishing take place? • Choice of fishing technology: Which gear and vessels should
be employed in the fishery? • Choice of fishing season, season length and time spent fish-
ing: When should fishing take place and how much time should be spend on the grounds?
• Commercial choices regarding fish markets and landing ports: Where should the catches be sold and at what quality?
The following analysis examines how ecological changes, and in particular stock fluctuations, influenced a particular nineteenth cen-tury Swedish fishing strategy. How did Swedish fishermen change their behaviour in response to changing stock abundances? The con-cept of ecological flexibility is central to this problem. How easily did the fishermen shift fishing strategies? How did they determine where to fish and with what technology? The study will also examine the fishermen’s behaviour at sea and fishing fleet dynamics, which can be seen as the result of the individual fishermen’s fishing strategies.
In particular, the analysis focuses on the spatial dynamics of the fishing industry. As a working hypothesis, it asks whether the fisher-men gradually ventured to more distant grounds or introduced more efficient fishing gear in response to declining catch rates. The study asks whether serial stock depletions took place in the nineteenth cen-tury. Did the fishermen employ a mining strategy, for example: de-pleting one stock on a particular fishing ground and then moving on to an unexploited stock in a different area?
The case study – why?
The twin questions of historical stock abundances and drivers of change in historical fisheries are answered here through a case study of the Swedish longline fisheries for the demersal species ling and cod in the North Sea and the Skagerrak from 1840 to 1914. These fisheries were conducted from the county of Bohuslän, to the north of the city of Göteborg. Though the Swedish fisheries are the focus of the analysis, the case study is not an attempt at writing a national

20
Swedish fisheries history. It focuses mainly on one particular fishing sector, the longline fisheries, and it moreover includes international perspectives.
Many countries exploited the demersal stocks of the North Sea in the nineteenth and early twentieth centuries. Nevertheless, the demer-sal stocks of ling and cod in the Skagerrak and the northeastern North Sea were primarily exploited by Swedish fishermen, at least until the 1880s. Accordingly, Swedish fishermen play the main role in the following analysis. Moreover, abundance estimates can be computed more easily for the Skagerrak stocks than for stocks in other areas of the North Sea, which were frequented by vessels of many nationali-ties.
Why does this study choose Sweden as a case? The Swedish longline fisheries offer several analytical advantages. Significantly, Swedish fisheries statistics are comprehensive, allowing for an analy-sis of fishing fleet dynamics and spatial shifts in the fishery. Such data are difficult to find for other demersal fisheries in the North Sea.
Why choose 1840-1914? The goal of the study is to analyse demersal stock abundances before the introduction of efficient steam vessels in the North Sea, and this is possible due to detailed Swedish fisheries statistics from the period 1872-86. The systematic compila-tion of Swedish fisheries statistics was inaugurated in 1859. 1840 is set as the starting point of the analysis, however, because of the avail-ability of two additional detailed descriptions of the Bohuslän fisher-ies from the early and mid 1840s. Both of them give relevant infor-mation as to the scale of the industry and the technology employed. The endpoint of the present analysis is 1914, due to the outbreak of World War One in that year. The war decisively changed the struc-tural conditions for North Sea fisheries. By that same time, longline fishery had lost most of its importance to the Bohuslän fishing indus-try. Some additional information is available on North Sea cod and haddock from the inter-war period, but will not be considered here.4
Why does this study choose ling and cod? The choice of species is partly determined by present ecological problems of the North Sea.
4 Rijnsdorp et al.; Hislop; Pope et al.

21
Biologists’ concerns for the cod stock indicate a pressing need for a long-term historical perspective. The choice of species here is also partly determined by the fact that nineteenth century fish catch statis-tics are often incomplete. Computing historical abundances requires high quality data sets from credible sources and this requirement is difficult to fulfil. Such data sets are however available for Swedish longline fisheries. The Swedish data set thus allows for a comprehen-sive analysis both of historical stock abundances and fishing fleet dynamics.
Literature review
Scandinavian maritime history and ethnology
The development of the Bohuslän coastal communities has been ex-amined by several scholars, most influentially Olof Hasslöf. His dis-sertation Svenska Västkustfiskarna from 1949 formed the basis of much Scandinavian research on maritime communities in the decades following its publication. Indeed, it is no exaggeration to say that Hasslöf established a paradigm for maritime ethnography.5 He de-scribed how the Bohuslän fishermen organised their work, with a focus on the development of their working culture from the Middle Ages to the 1940s. One of Hasslöf’s primary analyses concerned so-cial organisation within fishing communities. Hasslöf focused on the fishermen as working teams (lag) and on cooperation between people in the coastal communities. He achieved this despite the fact that the fishermen had not produced many written sources themselves. Before the twentieth century most sources on the fishing communities come from government agencies or from academics. It is difficult to under-stand the social structure of the maritime communities based on such external observations. Hasslöf bypassed this problem, however, by using ethnographic interviews, and letting the fishermen and their families speak for themselves.
5 See Holm, 1992.

22
Hasslöf concluded that the Bohuslän fishing teams were organ-ised in a democratic and cooperative fashion, as opposed to a capital-ist organisation. In Bohuslän the fishermen owned the vessels and gear themselves and coastal communities were characterised by egali-tarianism and solidarity. By contrast, onshore capitalists owned gear and vessels in a capitalist organisation. The fishermen worked on-board the fishing vessels as employees and had a low level of influ-ence on their work. The capitalist organisation was hierarchical, something which Hasslöf in fact resented. To Hasslöf, the democ-ratic-cooperative organisation remained the ideal.6 Although a few attempts were made to establish such capitalist companies in Bo-huslän and Göteborg, they were never really successful. This interpre-tation was the backbone of much of Hasslöf’s research.7
An understanding of the social structure of the fishing communi-ties is crucial to an analysis of the dynamics within the fisheries. How did the social structure influence the development of the fishery? Since Hasslöf’s notion of the democratic and cooperative organisa-tion was so influential, it merits critical scrutiny. In the analysis to follow, it will be tested against quantitative evidence, deriving mainly from the 1880s. Does the dichotomy between democracy and capital-ism adequately cover the differences within the coastal communities? Were the Bohuslän coastal communities characterised by egalitarian-ism and cooperation? If they were, what were the societal implica-tions of such an organisation, and how flexible was it? How easily could fishing communities adapt to structural economic and ecologi-cal changes?
Before Hasslöf’s studies were published, other scholars had ex-amined the historical development of the Bohuslän fisheries. Karl Rencke was the first scholar to write about ethnographic fieldwork in the Bohuslän fisheries, as exemplified in Valdemar Haneson and Karl Rencke’s joint publication on this topic, dating from 1923. While Haneson’s chapter gave a brief outline of the history of the Bohuslän fishing industry, Rencke in his chapter focused on fishing technology
6 Hasslöf 1949, p. 152, 204-6, 208-9, 472, 544-5. 7 Hasslöf 1939; Hasslöf 1972; Hasslöf 1979; Hasslöf 1981.

23
and also described how the fishermen set and retrieved their gear, as well as how gear was produced. He obtained his insights by partici-pating in various fisheries in 1920 and 1921 and interviewing fisher-men on issues relating to fishing operations.8 Haneson’s and Rencke’s book was published as one volume in a book series on the history of Göteborg and Bohuslän. The series appeared on the occasion of a major public exhibition held in Göteborg in 1923.
In 1941 Lennart Dalén defended his doctoral dissertation Den bo-huslänska fiskelägesbygden. Situated within the field of economic geography, Dalén’s dissertation traced the historical development of the Bohuslän fishing industry from the Middle Ages to the 1930s. Dalén focused on regional development and distinguished between development patterns in different parts of Bohuslän. However, he discussed spatial patterns within the fishing industry at sea only very briefly.
Of all the fisheries in Bohuslän, the herring sector has previously received the most attention from scholars. Herring appeared irregu-larly on the Bohuslän coast, being periodically highly abundant (for instance from 1747 to 1808 and from 1877 to 1900). In the intermedi-ate period, fisheries were small-scaled, as herring abundances in the archipelago were very low. These herring fluctuations have fascinated marine biologists, who have discussed their causes at least since the 1870s.9
The economic and demographic development of these fisheries has also merited research by a group of historians, in addition to the work done by Dalén and Hasslöf.10 In the 1980s, a Scandinavian re-search project called the Kattegat-Skagerrak project focused on the regional history of the Kattegat and Skagerrak coastal communities.11 The project engaged historians, anthropologists, and geographers,
8 Haneson et al., p. 79. 9 Ljungman 1878; Ljungman 1883; Andersson 1956; Andersson 1958; Andersson 1960; Ackefors; Höglund 1972; Höglund 1976; Alheit et al.; Lindquist; Corten. 10 Nystedt; Nilsson 1963, p. 281-317; Andersson 1996; Sanddahl 1998; Gerhard 1940; Gerhard 1955; Rogers; Tedebrand; Sanddahl 2003. 11 Published as Kattegat-Skagerack projektet Meddelelser. See also Holm 1991.

24
among others, from Sweden, Denmark and Norway and examined contacts between the coastal communities bordering the Skagerrak and Kattegat. The project examined fishing, shipping, migration, tourism, coastal culture and religious movements in the Kattegat-Skagerrak area, with the focus being mainly on the nineteenth cen-tury. Issues within environmental history were not examined.
In his doctoral dissertation Kystfolk, from 1991, Poul Holm syn-thesised the history of the coastal communities in the Kattegat-Skagerrak region. He adopted the regional approach from the Kat-tegat-Skagerrak project and focused on contacts and interactions be-tween the coastal communities in the Kattegat-Skagerrak region from 1550 to 1914. The regional perspective allowed Holm to identify contacts across the sea and across national boundaries. Holm hereby placed the Kattegat-Skagerrak region in a wider context of the North Sea-Baltic Sea region. He adopted a holistic approach through analy-sis of the economic, social and cognitive changes in the coastal com-munities as well as the regional consequences of political changes. Holm questioned Hasslöf’s dichotomy between capitalist and democ-ratic organisations and argued that it did not properly describe the social reality of the coastal communities. This divergence of opinion will be examined more closely in the following analysis, as it has relevance for central issues of the dynamics within maritime commu-nities.
In addition, local historians with a special attachment to particular places have written about the coastal communities in Bohuslän. Though they are mainly interested in local issues, some of these books contain relevant information on the longline fisheries’ devel-opment.12
In conclusion, research on the Bohuslän fishing industry has fo-cused mainly on social, cultural, technological, political, economic and local issues. Historians have paid little regard to the issue of hu-man impact on the marine environment. Research has focused on ecological issues only in relation to the causes of herring fluctuations. The importance of ecology to the longline fisheries for demersal spe-
12 Tengby; Hansson; Thornblad.

25
cies has not previously been examined, and the question of fishing strategies has also been neglected. Understanding fishermen’s behav-iour at sea is relevant to an understanding of the driving forces of fishing communities’ history. Fishing strategy shifts reflect the eco-logical flexibilities within the fishing communities and, more funda-mentally, human responses to ecosystem changes.
Historical studies of fishing fleet dynamics
Internationally, fishing strategies and fishing fleet dynamics have been examined by a small number of maritime historians. In the countries bordering the North Sea in particular, the large-scale nine-teenth century British fisheries have received the most attention.
In his PhD dissertation on the development of the Yorkshire fish-ing industry from 1790 to 1914, Robb Robinson discussed fisher-men’s responses to ecological changes. One of his main points was that the North Sea demersal fish stocks were in decline during the nineteenth century due to increased fishing pressure.13 In response to the stocks’ decline, the fishermen introduced more efficient gear and sailed to more remote waters. Robinson’s line of reasoning is based on contemporary reports produced by a series of government commit-tees known as Royal Commissions. The commissioners were ap-pointed to examine the state of the British fishing industries, and by the late 1800s they concluded that some fish stocks were indeed de-clining. In addition, Robinson referred to the research results pub-lished by marine scientist Walter Garstang in 1900, showing declin-ing catch rates in the demersal fisheries, and also highlighted the dis-satisfaction expressed by nineteenth century fishermen over diminish-ing catch rates. Robinson referred to the widely held view among smackowners in the 1880s, that traditional fishing grounds were be-coming exhausted.14 In addition, Robinson reasoned that there was no motivation for fishermen to sail more distant waters unless fish stocks on the traditional fishing grounds were indeed declining. Logically, the spatial expansion of the British fishing industry took place in re-
13 Robinson 1984, p. 297. 14 Robinson 1984, p. 293.

26
sponse to declining catch rates at the traditional fishing grounds. Rob-inson wrote:
‘The practice of travelling ever further to fish is difficult to explain if one accepts the view that trawling grounds could not be worked out by sail-ing smacks. It surely did not make rational eco-nomic sense for such craft to be sent ever further to catch their fish unless there was a pressure to force them. That pressure must undoubtedly have been falling stocks on traditional grounds as claimed by many eminent smackowners.’15
Robinson repeated this interpretation in his book Trawling from 1996, concluding that ‘…the trade’s usual way of responding to prob-lems of maintaining or improving fish landings was to increase the catching efficiency of the vessels it deployed and seek out new grounds ever further afield.’16
Robinson’s analysis however lacked a quantitative perspective. He did not examine rates of decline, or compare them with modern stock fluctuations. Robinson used the concept ‘overfishing’ to de-scribe the development in the British North Sea fisheries from the 1880s, but did not give a precise definition of this term.17
In his dissertation on technological changes in the British fisher-ies from 1830 to 1914, Michael Haines also focused on the expansion of fishing effort and the introduction of ever more efficient fishing gear and vessels. Haines concluded that the demersal stocks of the North Sea were declining due to fishing.18 He said that:
‘… the uninhibited deployment of increased catching power due to the technological devel-
15 Robinson 1984, p. 297. 16 Robinson 1996, p. 223. See also Robinson 1987 & Robinson 2002. 17 Robinson 1984, p. 450. 18 Haines 1998a, p. 284-93.

27
opment of Britain’s fishing fleet continued in the face of diminishing returns.’19
Haines also concluded that ‘short-term economic needs eclipsed longer-term ecological considerations.’20 Like Robinson, Haines ex-plained the geographical expansion of the British fisheries by refer-ring to declining catch rates.21 Thus, Robinson and Haines both had a negative interpretation of the nineteenth century development of the British fisheries, in which increasing fishing effort had a detrimental impact on commercially desirable stocks. Technological innovation and spatial expansion were thus a common response to stock decline.
This interpretation was shared by fisheries biologist and historian David Cushing in his book The Arctic Cod from 1966. Cushing at-tributed the nineteenth century spatial expansion of the British trawl-ing fleets to declining catch rates. He claimed that:
‘In the North Sea, the larger fish were no longer being caught, the catch of each boat was less and the total catch was only maintained by searching further afield.’22
In his book The Fishing Industries of Scotland 1790-1914 the Scottish geographer Malcolm Gray also adopted the same line of reasoning. He described Scottish trawler fishermen travelling to more distant grounds and introducing larger fishing vessels during the 1890s. Nevertheless, their catches per day of fishing were no higher than they had been earlier, when the fishing effort was on a smaller scale.23
In general, British historians have told a story of stock decline and technological innovation coupled with spatial expansion in the nineteenth century North Sea fishing industries. These conclusions are based mainly on qualitative evidence from nineteenth century
19 Haines 1998a, p. 290. 20 Haines 1998a, p. 288. 21 Haines 1998a, p. 189. See also Haines 1998b. 22 Cushing, p. 20. 23 Gray, p. 173.

28
observers, whereas the notion of spatial expansion in the face of de-clining stocks can be said to merit quantitative research. As will be argued below, a catch rate analysis of the North Sea fishing industry will be appropriate.
In North America, these issues have also been analysed. In an ar-ticle in Exploited Seas, published in 2002, historian Sean Cadigan and marine biologist Jeffrey Hutchings jointly examined the nineteenth-century spatial expansion of the Newfoundland cod fisheries to Lab-rador. They asked what caused the fishermen to gradually move fur-ther to the north. Their analysis presents a historical example of hu-man ingenuity, spatial expansion and technological innovation in the face of ecological changes. Cadigan and Hutchings concluded that the spatial expansion of the fishery was precipitated by declining catch rates on the traditional grounds closer to home and by an increasing fishing effort. In an attempt to fill the void left by the declining in-shore stocks on the traditional grounds, larger vessels and state subsi-dies were introduced in the fishery, thus allowing for fisheries on more distant grounds.24 This story has many parallels to the history of nineteenth century British fisheries as presented by the British mari-time historians.
Margaret Beattie Bogue’s book on the US and Canadian Great Lakes fisheries during the period from 1783 to 1933 also addressed such issues. Bogue described the resource exploitation as a ‘callous slaughter’.25 She gave several examples of a ‘highly competitive, virtually unregulated, and wasteful exploitation of a natural resource for profit that over time seriously eroded its commercial utility.’26 According to Bogue, the ingredients of the decline were:
‘… changes in the land- and waterway-use pat-tern in the drainage basin, the rise of strong mar-ket demand, the absence of scientific knowledge necessary to make effective laws, and the priori-
24 Cadigan et al., p. 62. See also Hutchings et al. 1995, p. 61. 25 Bogue, p. 25. 26 Bogue, p. 44.

29
tising of economic activity in a developing region that assigned minor value to the fish resource.’27
In addition, the United States’ federal system of fisheries man-agement was an obstacle to uniform conservation rules. Because of divided jurisdiction, no efficient measures to protect the stocks were implemented. Bogue also analysed the different attitudes among the fishermen towards pressuring the resource, and she emphasised that aggressive fish dealers had a very destructive impact on the fish stocks because of their disregard for the need for fish conservation.
In the Great Lakes the major commercial species were in rapid decline in the nineteenth and early twentieth century. Facing declin-ing stocks, the fishermen introduced new and more efficient fishing technology. In other words, their industry expanded in the face of declining fish resources.28 They also began fishing for more ‘rough’ species – i.e. species initially considered less commercially desir-able.29
In conclusion, Bogue stated:
‘The response of Great Lakes fishermen in the early twentieth century to declining fish stocks and rising prices was not unique. Under similar conditions in many different places and times, fishers turned to more effective harvesting meth-ods and expanded operations to keep their occu-pation viable.’30
Bogue focused on how humans used the resources, why they utilised them as they did, and what the consequences of the exploitation were. While analysing the failure of the resource management, Bogue did not quantify human impact on the environment. She listed the human activities that caused the stocks to decline but said that it was an im-
27 Bogue, p. 27. 28 Bogue, p. 261. 29 Bogue, p. 257, 324. 30 Bogue, p. 261. Same conclusion, p. 336.

30
possible task to measure the human impact on the aquatic resources.31 Bogue derived her conclusions on stock decline from total catches, which did not necessarily reflect actual stock sizes. To a large extent, she based her arguments on contemporary observers’ information on the state of the Great Lakes stocks.32
The Great Lakes fisheries were thus just one example of a general destructive pattern of human exploitation of aquatic resources.33 On the basis of Bogue’s work, it is pertinent to ask if a similar develop-ment took place in the North Sea. Did North Sea fishermen use more efficient technology or increase the fishing effort in order to maintain their catches, or did they shift target species or occupation to safe-guard the stocks?
A theory of fishing fleet dynamics
While maritime historians have focused on specific fisheries in spe-cific, historical contexts, a model of fisheries development and fish-ing fleet dynamics has been advanced by fisheries biologists Ray Hilborn and Carl J Walters in their book Quantitative Fish Stock As-sessment from 1992. Based on many fisheries’ developments, they have developed a conceptual model of general development patterns in fisheries from unexploited stocks to overexploitation and economic overcapitalisation of the fishery.34 Since the model is presented in this widely read fish stock assessment textbook, it is relevant to ask if it can apply to the Swedish case study. Does it fit with the dynamics of the Bohuslän longline fleet?
Figure 1 from Hilborn and Walters’ book shows the typical pat-tern of fishery development. The first phases from predevelopment to growth are characterised by exploration and initiation of the fishery. Four prerequisites should be fulfilled before hitherto unexploited fishing grounds can be explored.35 Sufficient and safe fishing tech-
31 Bogue, p. 123, 283, 286, 296. 32 Bogue, p. 149-71. 33 For an Asian case see Butcher. 34 Hilborn & Walters, p. 104-55. 35 Hilborn & Walters, p. 105-6.

31
nology should be at hand. Cheap capital which is willing to invest in the venture is also required, alongside the fishermen’s own entrepre-neurial spirit and the presence of a large fish market.
Figure 1. Hilborn and Walters’ model of fisheries development. 36
During the later phases, from full exploitation to overexploitation,
the fishery expands, as fishermen rapidly learn about the new fishing grounds. The catch per man declines as fishermen congregate on the
36 Hilborn & Walters, p. 7.

32
fishing grounds and fish stocks are gradually depleted. Boats continue to enter the fishery area despite declining catch rates. This is mainly because of the lag between the time of the investment decision and the time of delivery of new vessels. ‘In other words, the population of fishermen will peak at a level that is not sustainable.’37 Later the fish-ery starts to decline to a ‘bionomic equilibrium’. Some fishermen leave the fishery or change target species. The remaining fishermen start a ‘…desperate search for new fishing grounds and more efficient fishing methods’.38 They also increase the pressure on fisheries man-agers to solve the problem and call for the government to set up hatcheries. The decline is followed by a ‘bionomic equilibrium’ with relatively stable, but low catch rates. Here the fishermen’s income barely covers the costs of fishing.
Later phases are characterised by cycles of innovation and con-solidation, as the bionomic equilibrium is not stable. The low catch rates and low income give the fishermen incentives for innovation in fishing technologies and searches for new grounds. Thus, recovery is followed by new overexploitations and overcapitalisations.
‘When successful innovations/discoveries occur, the fishery is reset into a condition where growth and investment are again favored. …noisy catch rate signals and time delays in investment re-sponse will lead to temporary overdevelop-ment.’39
The following analysis will test Hilborn and Walters’ major theses on the case study of Swedish longline fishery.
Terrestrial environmental history
The present study is situated within the field of marine environmental history. Environmental history as such has so far focused mainly on terrestrial issues, but the overarching questions in marine environ-
37 Hilborn & Walters, p. 106. 38 Hilborn & Walters, p. 106. 39 Hilborn & Walters, p. 108.

33
mental history are parallel to those of its terrestrial counterpart. Hu-man impacts on an ecosystem and societies’ responses to ecosystem changes are at the centre of research in environmental history. Envi-ronmental history thus focuses on human interactions with the natural environment through time.40 The early developments of environ-mental history took place in the United States in the 1970s, and Wil-liam Cronon and Donald Worster stand out as some of its earlierst proponents.
In his 1983 book Changes in the Land, Cronon set out to analyse the causes of habitat changes in New England in the period 1600-1800. The starting point of his analysis was a realisation that culture and nature exist in a dynamic relationship. Acknowledging that natu-ral fluctuations are the very essence of ecosystems, Cronon wanted to explain how human activities brought about ecological changes. To Cronon, nature is not just a stage on which history takes place. Ac-cordingly, Cronon brought the interaction of man and the environ-ment to the centre of the historical analysis. He concluded that human activities such as agriculture and lumbering caused profound ecologi-cal changes in the New England ecosystems three and four centuries ago. European settlers introduced new species, thus changing the species composition of wildlife and forests. Cronon also studied the social and cultural aspects that brought about these changes by focus-ing on the Indians and the settlers’ different concepts of property.
Cronon showed that human activities had major ecological conse-quences centuries ago when the world’s population was much lower than it is today. These issues are also highly relevant in regard to aquatic environments.
Worster’s book The Dust Bowl, published in 1979, represented a different strand within environmental history, focusing as it did on the history of environmental problems or human-induced ecosystem ca-tastrophes. Worster examined the dust storms that ravaged the US plains in the 1930s, and asked what had brought them about. His main thesis was that the storms were caused by a specific culture held by the people on the plains. Their culture was characterised by ac-
40 Winiwater et al.

34
quisitiveness coupled with a feeling of ecological freedom. Like Cronon, Worster demonstrated the complicated dynamics of natural resources exploitation and ecological changes.
Historical ecology and marine environmental history
Although the interaction between culture and environment has re-ceived increased attention from different strands of environmental history, historians have paid less regard to marine environments.41 The long-term changes in the world’s oceans are almost unknown. What species were previously the most abundant and how abundant were they in comparison with modern times? How did humans react to ecological changes and which changes were brought about by hu-mans? What role did life in the oceans play in a specific historical development? Such questions are the topics of marine environmental history. So far no comprehensive study of the environmental history of the North Sea has been attempted. In order to undertake such a study, interdisciplinary studies merging history and biology are needed.
In itself the discussion of human impacts on the environment has a long history, as described by Tim Smith in his book Scaling Fisher-ies from 1994.42 The question was moreover hotly debated among scientists as early as the nineteenth century. In 1883 the British scien-tist Thomas Huxley said:
‘…that the cod fishery, the herring fishery, the pilchard fishery, the mackerel fishery, and proba-bly all the great sea-fisheries, are inexhaustible; that is to say that nothing we do seriously affects the number of fish.’43
However, another British scientist, Walter Garstang, reached a differ-ent conclusion in his article The Impoverishment of the Sea, published
41 For an introduction to marine environmental history and an overview on publica-tions on marine environmental history see Bolster. 42 Smith. 43 Huxley cited by Smith, p. 53.

35
in 1900. Garstang, adopting a catch rate approach, argued that the seas were exhaustible with the technology then at hand, and claimed that major demersal stocks were indeed affected by ever-increasing fishing pressure. By standardising fishing effort into a common unit of effort, Garstang argued that the catch per unit of effort in British fisheries was declining for many demersal species.44
Recently there has been an increased recognition of major long-term changes of aquatic ecosystems among some marine biologists.45 Hilborn and Walters, for example, stated that widespread changes in species diversity in the North Sea could have taken place before sci-entific investigations were initiated. They also highlighted major changes in the relative abundance of species which had been ob-served since systematic trawl surveys were started in the 1920s. The abundance of long-living species that reach maturity at a late stage has declined relative to faster-growing species, which are less vulner-able to fishing. Short-lived, early-maturing species, by contrast, can sustain a higher fishing mortality.46
Jeremy Jackson from the Scripps Institute in San Diego, Califor-nia has argued for a historical approach to ecological studies of the world’s oceans. On the basis of examination of long-term changes in Caribbean coral reef ecosystems, Jackson argued that these ecosys-tems had changed significantly long before modern ecological studies were initiated. He showed that, historically, Jamaican subsistence fisheries had a major impact on the ecosystem, in particular the coral reefs, even though the population of Jamaica was only a few hundred thousand.47 In comparison with other human disturbances of marine ecosystems – such as pollution and anthropogenically induced cli-mate change – overfishing is the most pervasive factor. In a Science article with eighteen co-authors, he labelled this phenomenon the ‘primacy of overfishing’. The long-term consequence of overfishing
44 Garstang; See also Smith, p. 96-109. 45 E.g. Steneck et al.: Barrett et al. 1999; Barrett et al. 2004; Rose; Myers et al. 2003; Jónsson; Amorosi et al.; Øiestad. 46 Hilborn & Walters, p. 248, 250. 47 Jackson 1997.

36
has been an ‘enormous’ loss of large animals from the upper levels of the food web. Jackson and his co-authors argued that historical stud-ies of long-term abundance changes can provide goals for modern fish stock restoration programmes.48 Though these are controversial findings, they show the relevance of studies of long-term ecosystem changes to modern ecology debates.
A group of marine biologists associated with the University of British Columbia and lead by Daniel Pauly and Villy Christensen has also analysed long-term changes in the marine ecosystems of the northern hemisphere, and in particular in the North Atlantic.49 They have adopted a comprehensive approach that seeks to encompass the whole of the North Atlantic ecosystem. Using a so-called Ecopath model, the group has assessed changes in biomass of large predatory fish in the North Atlantic in the twentieth century. The group has moreover identified the phenomenon of ‘fishing down the food web’. In technical terms, top predators are placed on the highest trophic levels in the food web, whereas prey species are from lower trophic levels. As top predators in the oceans are depleted, the fishermen increasingly catch smaller fish lower in the food web.50 The main result of the Ecopath modelling is that the biomass of high-trophic level fishes has declined by two-thirds since 1950 and by a factor of nine since 1900. With all catches aggregated, the average trophic level of the catches has declined consistently since 1950. The group cannot moreover attribute this consistent, long-term decline to natural fluctuations. Thus, fishing must have had a major impact on stocks. If the present exploitation patterns remain, the group, controversially, predicts ‘widespread fisheries collapses’.51 Indeed, the ‘results raise serious concern for the future of the North Atlantic as a diverse healthy ecosystem.’52 These major long-term changes have moreover
48 Jackson 2001. 49 Pauly 1995; Pauly et al. 1998; Pauly et al. 2000; Pauly et al. 2003; Christensen et. al. 2003. 50 Pauly et al. 1998. 51 Pauly et al. 1998. 52 Christensen et. al. 2003, p. 1.

37
taken place relatively unnoticed, because ‘each generation of fisheries scientists accepts as a baseline the stock size and species composition that held true at the beginning of their careers, and uses this to evalu-ate changes.’ This leads to a gradual change of baseline as new biolo-gists enter the profession, a phenomenon which Pauly called ‘the shifting baseline syndrome’.53
In essence, Ecopath is a comprehensive modelling approach em-bracing whole marine ecosystems. While Pauly, Christensen and their colleagues focused on the twentieth century, and in particular the period after 1950, ecologist Steven Mackinson has applied the same methodology to the North Sea ecosystem in the 1880s. In a report from 2001, Mackinson described how the Ecopath methodology can model what the North Sea ecosystem may have looked like in the 1880s.54 Modern knowledge of ecosystem functioning, coupled with various historical data sets allows for the establishment of a likely scenario for the 1880s. Amongst other things, Mackinson suggested that the historical abundances of many fish species can be derived from historical trawl surveys by raising the survey catches to total biomasses. Mackinson also suggested that biomasses could be calcu-lated if it is assumed that 20 per cent of the unexploited biomass had been harvested by 1880. Alternatively, biomasses could be estimated from modern catch rate data by assuming that modern vessels were 20 or 30 times more efficient than nineteenth century fishing vessels. The Ecopath-model demonstrably represents a top-down approach encompassing whole ecosystems. By contrast, the analysis to follow will present a bottom-up approach, focusing on only two species – ling and cod – in the northern parts of the North Sea and the Skager-rak.
In 1996 the International Council for the Exploration of the Sea published a volume of the ICES Journal of Marine Science specifi-cally addressing long-term changes in the North Sea fish stock. The time perspective was broadened compared to traditional stock as-sessments, and the volume focused on the early decades of the twen-
53 Pauly 1995. 54 Mackinson.

38
tieth century. Based on historical catch-at-age data, J G Pope and C T Macer were able to estimate biomasses for cod, haddock and whiting from 1920 onwards.55 Their calculations were based on data showing the strength of the individual year classes of the three species. Unfor-tunately, such detailed data are not available for the period predating World War One, and Pope and Macer’s approach cannot be replicated for the nineteenth century.
In 2000 the global research project History of Marine Animal Populations (HMAP) was initiatiated. This book is one of the results of the HMAP programme, which runs until 2010. HMAP is con-ceived as an interdisciplinary study of the exploitation of the oceans and fish stocks through time. In the HMAP prospectus from 2000 three goals were identified.56 Firstly, the project sets out to assess the ecological impact of large-scale harvesting. Secondly, the project focuses on long-term changes in stock abundances; the purpose here being to establish reference points as to what lived in the oceans within historical time. Thirdly, the role of marine resources in histori-cal development is assessed. In effect, HMAP aims at developing the disciplines of marine environmental history and historical marine ecology.
Six main hypotheses are identified within the programme, and they serve as guideposts for individual projects, including this book.57 First, historical records can be used to infer fish population and com-munity structure after accounting for anthropogenic factors. Sec-ondly, anthropogenic changes – such as socio-economy, politics and demography – play a significant role in fisheries development. Thirdly, environmental forcing causes changes in the abundance and/or the spatial distribution of fish stocks. Fourthly, fishing mortal-ity has significant impacts on fish populations. Fifthly, changes in energy flows in the ecosystem structures take place due to environ-mental change and fishing mortality. And finally, the diversity of marine animals has declined due to exploitation and habitat loss. Sub-
55 Pope et. al. 56 Holm, Starkey & Smith 2000. 57 Holm & Smith 2000.

39
sequently, the researchers within the programme have further devel-oped these HMAP hypotheses.58
At the University of New Hampshire, one project within HMAP is currently focusing on fisheries in the Gulf of Maine, off the North American east coast.59 In asking what constitutes a healthy marine ecosystem, the project has focused mainly on cod. The group consists of historians, ecologists and statisticians, who have argued for a his-torical approach to ecological studies and the necessity of shifting ecological baselines backwards. Historical biomass estimates can then be used as reference points for stock rebuilding programmes. In this case, a historical biomass estimate was derived from logbooks kept by the captains of the Scotian Shelf fishing fleet from Beverly, Massachusetts during the period 1852-59. Significantly, the fisher-men had no economic incentives to misreport catches, and the cul-tural values of the time incited them to be accurate. Based on these logbooks, the total removals of cod were calculated for the Nova Sco-tian Shelf fisheries in the 1850s. This was combined with catch rate data from the individual vessels in the calculation of the historical abundance estimate.
The group has thus calculated an estimate for the cod stock on the Nova Scotian Shelf in 1852 at 1,260,000 metric tonnes. A biomass of 1,260,000 tonnes is possible within the Scotian Shelf ecosystem’s restraints; in technical terms, this is within the carrying capacity of the ecosystem. The present biomass of the Scotian Shelf is a mere 4 per cent of the historical estimate, which indicates a major long-term decline in cod abundance. As the group points out, the historical bio-mass estimate is corroborated by modern studies of the productivity of the North Atlantic ecosystem.
The HMAP group describes the nineteenth century New England fishing communities as ‘open, candid and cooperative’, and the fish-ermen as ‘social’ rather than ‘secretive’, in that cooperating fisher-men shared knowledge of the fishing grounds. There was also a high degree of specialisation as certain communities focused on particular
58 Holm, Smith & Starkey 2000; MacKenzie et al.; Holm 2003. 59 Rosenberg et al. 2005.

40
grounds. The Gulf of Maine project also addressed the issue of hu-man responses to ecosystem changes. From 1852 to 1859 catch rates declined by 50 per cent. In the face of the decline, more efficient technology was introduced. The fishermen shifted from handlines to longlines with more hooks. In addition, they ventured to more distant grounds.60
In another HMAP study, Bo Poulsen’s PhD dissertation on North Sea herring fisheries from 1600-1860 analyses the driving forces – both ecological and anthropogenic – of these fisheries. He has identi-fied the spatial patterns in the fisheries and established a 250 year time series of catch rates for North Sea herring from 1600 to 1850.61
Although the above literature review discusses examples of re-search cooperation between historians and ecologists, the history of the oceans is still largely unknown. While historians and ecologists have recently initiated collaborations in an attempt to examine long-term marine ecosystem changes and their societal implications, ma-rine environmental history and historical ecology merit far more re-search.
Fisheries biological studies of ling and cod
The Swedish longline fisheries caught ling and cod. Specific knowl-edge on these stocks, their population biology and responses to ex-ploitation is available from a large pool of fisheries biological articles and reports. Given its high commercial importance, cod has been the subject of numerous fisheries biological studies62, whereas ling has received much less attention from the scientific community, which means that knowledge on fundamental biological characteristics of this species is sparser.63 Since ling was the main target species for
60 Bolster & Alexander. 61 Poulsen 2006; Poulsen, B. 2007; Poulsen (in press 1); Poulsen (in press 2); Poulsen (in press 3); Poulsen (in press 4). 62 E.g. Jakobsson et al.; Myers et al.; Svedäng et al. 2001a; Svedäng et al. 2001b; Svedäng et al. 2002. 63 Molander, 1956; Large et al.

41
Swedish fishermen, focus is primarily directed towards ling studies in the following analysis.
From 1993 to 1996, the Norwegian Institute of Marine Research and Møre Research conducted a study of the biology of the deep wa-ter species ling, blue ling and tusk, concentrating on the population biology and structure, but also the genetic structure and methodology to determine age.64 These issues are highly relevant to the present study, because the scientists’ ultimate goal was to examine the spatial distribution of the deep sea stocks and identify methodology to esti-mate stock abundances.
Within the International Council for the Exploration of the Sea (ICES), a working group on the biology and assessment of deep-sea fisheries resources (WGDEEP) has worked with similar issues. The group has examined ling and tusk stocks in the North Sea and North Atlantic, and their terms of reference have been to compile landing data and consider the possibilities of assessing the state of the stocks and advising fisheries managers on a precautionary exploitation pat-tern.65 Though only focusing on the 1980s and 1990s, the group’s reports contain useful information on stock structure and biology of the stocks. In addition, data on the modern deep sea catches from the North Sea and the Skagerrak can also be derived from this source, and in the following analysis, these data are compared to the histori-cal catches and abundances.
In addition to the articles and reports focusing specifically on ling and cod biology, a number of standard books on general fisheries biology have been consulted. These books deal with such relevant issues as elementary fisheries biology and fish stock responses to exploitation.66 However, they disregard or only very briefly address issues of long-term ecosystem changes.
64 Bergstad et al.. 65 ICES CM 2000/ACFM:8; ICES CM 2001/ACFM:23; ICES CM 2002/ACFM:16; ICES CM 2004/ACFM:15. 66 Jennings et al.; Hilborn & Walters; Fernö et al.; Castro et al.

42
The methodology
The catch rate approach
Fishermen are hunters. Placed at the top of the food chain, fishermen are the oceans’ major predators. Like any predator, they depend on the abundance of prey, which often fluctuates. To the fishermen stock fluctuations appear as increasing or declining catch rates to which they have to adapt. Epitomising human dependence on marine eco-systems, catch rates are key to the understanding of fishermen’s re-sponses to ecological changes.
The catch rate approach is at the core of fisheries biology, as modern fisheries biologists use the catch rate approach to estimate fish stock abundances and monitor changing abundances. Historical data sets on catches and fishing effort also have an important function in calculating such estimates for historical fish stocks. This requires a validation of the historical data sets in a historical context.
In the following analysis, catch rate data sets are used as an ana-lytical tool for two purposes. Firstly, catch rates are used to examine the relationship between ecological changes and fishermen’s fishing strategies, as catch rates show the fishermen’s catching successes. Secondly, the catch rate data sets are used to estimate the historical abundances of ling and cod.
Calculating catch rates
A catch rate analysis requires quantitative data sets for commercial catches and fishing effort. Basically, the data sets should provide answers to the following three questions:
• How much was caught? • How extensive was the fishing effort? • Where did fishing take place? Indeed, such data sets are available for the nineteenth century
Swedish longline fisheries.

43
In fisheries biology, the concept of catch rates, or, to be more precise, catch-per-unit-effort (CPUE) has been used for more than a century.67 In 1900, the British marine scientist Walter Garstang ap-plied the catch-rate approach to an analysis of British fisheries data sets.68 Garstang standardised fishing effort into a common unit of effort for the purpose of determining if demersal stocks, i.e. bottom living fishes such as cod and haddock, were in decline. He concluded that a decline in the abundance of demersal stocks exploited by Brit-ish fishermen had indeed taken place in the late nineteenth century; this was evident from a decline in CPUE. The sea was certainly not inexhaustible. On the contrary, ‘…the rate at which sea fishes repro-duce and grow is no longer sufficient to enable them to keep pace with the increasing rate of capture. In other words, the bottom fisher-ies are undergoing a process of exhaustion.’69 Garstang arrived at this conclusion based on an analysis of detailed catch data sets from indi-vidual vessels as well as aggregated catch and effort data sets for the entire British fishing fleet.
Garstang’s calculations were hampered by the fact that British vessels differed in terms of efficiency (i.e. catching power). However, Garstang took these differences into consideration when he calculated the total fishing effort of the British fleet. He adopted the sailing smack as a standard unit of effort and converted the fishing effort of the remaining fleet into this unit. Garstang used detailed data sets from individual fishing vessels to determine differences in catching power or efficiency. In 1885, for example, he estimated that a steam vessel equipped with a beam trawl was four times as efficient as a sailing smack with a trawl. Based on catch data sets from a Grimsby trawler owner, Garstang demonstrated statistically that the average catches by steam beam trawlers were four times as high as the catches made by sailing smacks in 1885. This led him to conclude that the catching power of one steam beam trawler equalled that of four sail-ing smacks, i.e. four units of effort. Also, Garstang demonstrated that
67 Smith. 68 Garstang. 69 Garstang, p. 64.

44
catching power increased by approximately a third when beam trawls were exchanged for otter trawls in 1895. He did so by comparing catch records of Scottish steam trawlers before and after they were fitted with otter trawls. Through this sophisticated use of standardisa-tion, Garstang managed to establish CPUE as a measure of fish abun-dance which is still widely used a century later. Strangely, however, few historians have made references to CPUE studies, and few, if any, historians have made independent CPUE analyses.70
Within modern marine biology, CPUE is routinely used to calcu-late stock abundances, and for fisheries biologists, the standardisation of fishing effort is a major research issue. The basic assumption un-derlying many CPUE analyses is that the catch rate is proportional to the abundance of the fish stock, which means that CPUE is linearly related to stock abundance: the higher the stock abundance, the larger the CPUE. When a fish stock declines, CPUE follows suit. This makes CPUE a relative index of stock abundance, and stock fluctua-tions can be monitored from time series of CPUE.
The fish catches depend on fishing effort, fish density and prob-ability of catch. Mathematically, this can be expressed as in the equa-tion below:
C = qEN
Where C is catch, E is fishing effort, N is fish density, and q is the catchability coefficient. The catchability coefficient is a measurement of the probability of catch. Effectively, the catchability q is the pro-portion of the stock caught to a given fishing effort, which makes catchability reflect the efficiency of the fishing gear. The equation can be reformulated to isolate the catch rate:
C/E = qN
This makes the equation show the relationship between fish density, catchability and catch rates.71
70 Robinson 1984; Robinson 1996; Haines 1998a. See also Holm 1991, p. 198-202; Poulsen & Holm, 2007 and Poulsen (in press 1). 71 Maunder et al., p. 141-43; Hilborn & Walters, p. 176-7.

45
Ideally, catchability is stable over an extended period of time, and the catch rate is proportional to abundance and changes according to stock fluctuations. Catchability may also change, however, due to gear innovation.72 If more efficient fishing gear is employed, the catchability of the stock will increase, and catchability will also change if the fishing fleet changes fishing strategy.
‘Changes in q can occur when a fleet moves from one part of a stock to another … or where a fish-ery is developing and moving into areas which have not been previously fished.’73
Thus, spatial changes in the fishery can invalidate the assumption of proportionality between catch rate and stock size. A group of Norwe-gian fisheries biologists also warns of such problems:
‘…if the fleet substantially expand the area of fishing due to catch rate reductions, misleading estimates of stock sizes might be produced.’74
In this case, fishermen are only able to maintain their catch rates be-cause they have expanded the area fished. Hence, if spatial expan-sions of fishing effort are not taken into account when assessing stock size, they may conceal a major stock decline. Consequently, spatial changes within the fishery should be taken into account in any analy-sis of historical CPUE data sets.
A recent example of the problems in interpreting CPUE data comes from the Newfoundland cod fishery, which collapsed in the early 1990s. Before the collapse of the stock, catch rates gave a mis-leading, overly positive impression of the state of the stock, because changes in catchability were not taken into account. The fishermen maintained high catch rates despite a significant decline of the stock, which was due to their improved ability to locate the fish, or, in tech-nical terms, due to increased catchability. The fisheries biologists
72 Jennings et al., p. 86-8, 131. 73 ICES CM 2001/ACFM:23, p. 29. 74 Bergstad et al., p. 88.

46
relied too heavily on the catch rate data sets, which caused them to overestimate stock size.75 Thus, commercial data sets may cause problems for fisheries biologists trying to estimate fish abundances, basically because commercial data sets may be biased. Fisheries bi-ologists Ray Hilborn and Carl Walters put it this way:
‘One of the major problems with using commer-cial catch and effort data to estimate stock distri-bution and abundance is that the fishermen go where the fish are.’76
Catch and effort data are biased because the fishing effort is not con-ducted at random locations. Fishermen concentrate their fishing effort where they know stock densities to be high. Consequently, the data are not always a random sample of the fish stocks.
Figure 1 adopted from Hilborn and Walters shows three possible relationships between stock abundances and catch rates. The linear model assumes proportionality between stock abundance and catch rate. This is the ideal situation and occurs in fisheries where the search for fish is random.
The other two models show non-linear relationships between abundance and CPUE. In the case of hyperstability, catch rates do not decline as rapidly as the stock. If the catch rates are taken at face value, hyperstability can result in overestimation of the abundance of the stock, as it happened in the case of the Newfoundland cod fishery in the 1980s. For schooling fish like herring and mackerel, catch rates do not necessarily decrease in spite of declining stock abundances. The densities of the fish schools remain high even if the stocks are depleted, which allows fishermen to maintain high catch rates. Rather, the decline of the stock results in a decrease of the total num-ber of schools and a spatial contraction of the stock.77
75 Hutchings et al. 2004. 76 Hilborn & Walters, p. 162. 77 Hilborn & Walters, p. 175-6; Fréon et al., p. 174-250

47
Figure 1. Hilborn and Walters: Three possible relationships between stock abun-dance and catch rates. 78
Hyperdepletion occurs if only part of a stock is vulnerable to fish-
ing. As this part of the stock is being depleted, catch rates will decline rapidly even though the overall stock size remains high. Conse-quently, the catch rates exaggerate the decline of the stock. Hilborn and Walters mention some invertebrates as examples of hyperdeple-tion.79
78 Hilborn & Walters, p. 176. 79 Hilborn & Walters, p. 176.

48
The problems caused by hyperstability and hyperdepletion are probably less serious in historical analyses than in modern analyses, because fishermen’s search for fish was much more random before the mid-twentieth century due to the unavailability of sonars and other fish-locating instruments. Nevertheless, it is relevant to discuss how fisheries biologists usually deal with these problems. Hilborn and Walters suggest that the principles of spatial stratification should be applied to commercial catch and effort data and that the data sets should distinguish between fishing grounds.80 By stratifying the fish-ing effort and catches by fishing grounds, it becomes possible to de-tect spatial shifts within the fisheries. Consequently, the question ‘Where were the fish caught?’ becomes highly important, and this is one reason why historical catch rates should be spatially disaggre-gated.
One final point should be added to the above observations: In a multi-species fishery, it is important to know exactly which species the fishermen were targeting. If the target species was changed, a literal interpretation of CPUE time series could lead to invalid con-clusions on stock abundance changes. Focusing on data sets from a modern fleet of long-liners, a group of Norwegian fisheries biologists says:
‘If cod and haddock are target species and ling and tusk occur as bycatch, consistently underes-timates of CPUE of ling and tusk is expected.’81
In this particular case, only the catch-rate data sets for cod and had-dock are useful to the fisheries biologists. For the historian analysing historical CPUE data, it is equally important to identify the fisher-men’s species preferences before the CPUE data sets are analysed. Only CPUE time series for target species should be used in the analy-sis of changing stock abundances.
80 Hilborn & Walters, p. 177-8. 81 Bergstad et al., p. 88.
49
Standardizing fishing effort
CPUE is defined as catch divided by a standardised unit of fishing effort. Potentially, uncertainties pertain to both catch and effort data sets, but most difficulties stem from the effort data. The basic chal-lenge for the researcher is to standardise fishing effort, and this is a major research topic within marine biology. Recently, a volume of the scientific journal Fisheries Research was dedicated to this issue, addressing methodological problems in regard to CPUE analyses.82 Simply stated, the question is how to convert the fishing effort from fleets of different fishing vessels, equipped with different gear and engines, into a standardized unit of effort? When time series of CPUE are used to monitor changing stock abundances, track should be kept of changes in the fishing fleet’s catching power, and thus of any changes in catchability. Information on fishing technology, i.e. the gear and vessels employed, are at the core of this issue. Presently, the catching power of the European fishing fleets is estimated to increase by several per cent every year. In the nineteenth and early twentieth centuries, the annual changes may have been smaller, but fisheries historians should keep such changes in mind when analysing long-term changes in stock abundances. Below is a brief list of some of the parameters that should be taken into account when standardising.
The type and size of the fishing gear:
• Number of long-lines per vessel • Length of long-lines • Number, size and shape of hooks • Bait types • Size of trawl • Size of nets • Mesh sizes
The attributes of the fishing vessels:
• Tonnage • Crew size
82 Fisheries Research 70, 2004.

50
• Horse power The actual definition of CPUE depends on which specific fishery
is analysed. For instance, in long-line fisheries, fishing effort can be measured as the number of baited hooks put in the water in a given time period. Accordingly, CPUE is defined as the catch per baited hook per time period. In bottom trawl fisheries, fishing effort may be defined as the number of hours trawling with gear of a particular size (length of beam trawl and mesh size) by a vessel with a given engine power.83
As part of the standardisation of fishing effort, time budgets for the fishing operations should be established. The actual time spent fishing is an important parameter in the calculation of total fishing effort. Fisheries biologists Hilborn and Walters distinguish between different phases of a fishing trip. The time from the vessel leaves port until it returns is referred to as total time.84 This is divided into four phases as shown in the equation below:
Total time = Travel time + Search time + Setting time + Handling time
Travelling time is defined as the time spent sailing to and from the fishing grounds, whereas search time is spent on finding the right spot to set the gear. Setting time is defined by Hilborn and Walters as the time it takes the fishermen to set the gear. Finally, handling time re-fers to the time the fishermen spent processing and curing the fish onboard the fishing vessels. Ideally, the travel and handling time should be discarded from the calculation of fishing effort, because this time does not reflect the actual fishing effort. On the other hand, search and setting times are important to the calculation of stock abundance, and as such they should be included in the estimated total units of fishing effort.
Ideally, time budgets should be established for each single fishing vessel, but historical data sets seldom allow for such detailed analy-
83 Fernö et al. 84 Hilborn & Walters, p. 122-5.

51
ses.85 If no such data are available, more rough estimates should be examined. Are there any indications of changes in the operation of the fisheries at sea? Does anybody – either the fisheries inspectors or the fishermen – say that more or less time was spent fishing? If such changes did indeed take place, a literal interpretation of catch rate data sets will produce invalid conclusions. Rather, the calculation of units of fishing effort should account for changes in the time budgets. For example, a twenty per cent increase in the fishing season will probably lead to a similar increase in fishing effort. For any historical analysis, it is important to take the length of the season into account.
Calculating historical abundance estimates
Based on the CPUE data sets, abundance estimates are calculated. The calculation of historical abundance estimates was undertaken by Dr Andrew B Cooper, PhD in Quantitative Ecology and Resource Management. The models applied in the calculations are described in great detail in an article written by Cooper, Professor Poul Holm, Professor Brian MacKenzie and myself, published in Fisheries Re-search.86
The sources
An analysis of fishing fleet dynamics and historical fish abundances requires detailed, highly credible data sets. The primary prerequisite must be that the data set contains data on catches and fishing effort with locational reference. Secondly, catch and effort data set must come from individual fishing vessels. In order to standardize fishing effort, detailed data on the individual vessels are required. In terms of fishing effort, data on the type and the size of the vessels and the fish-ing gear must be available. In addition, data on crews is also valuable
85 The Dutch North Sea herring fisheries are a notable exception, to which very de-tailed and consistent sources are preserved. See Poulsen (in press 1) & Poulsen (in press 2). 86 Poulsen, R.T., et al.

52
for the standardization of fishing effort. As regards catches, the spe-cies composition and the value must be available. Finally, data on fish prices are needed to assess the fishermen’s financial performance.
Do such data sets exist for nineteenth century North Sea fishing industries? Admittedly, the requirements are difficult to fulfil. Scot-tish fishermen, for example, pursued cod, ling and hake off Shetland during most of the nineteenth century. For a long time the Fishery Board of Scotland collected Scottish fisheries statistics without dis-tinguishing between species caught, stating only the total number of demersal fish caught.87 However, such data sets exist for the Swedish longline fisheries for ling and cod in the northeastern North Sea and Skagerrak. Swedish fisheries statistics were collected and published annually from 1859 onwards, but the most detailed data set covers the period 1872-86. The Swedish data set consists of catch and effort data produced by the fishermen. The development of official Swedish fisheries statistics was part of a general trend in nineteenth century European societies, in which government agencies to an increasing extent collected economic statistics for the purpose of monitoring the national economy.88 The limitations and flaws of the official Swedish fisheries statistics will be discussed in due course. Additional statisti-cal data on ling and cod fisheries in the Skagerrak and northeastern North Sea are available from the official, annual Danish and Norwe-gian fisheries statistics. The problems relating to the Danish and Norwegian sources are described thoroughly in a later chapter.
High resolution fisheries statistics are crucial to the analysis, but more general information on the fishing industry and the fishermen is also fundamental. The fishing statistics should be validated in their proper historical context: do other sources on the fishing industry agree with the official fisheries statistics? Moreover, the fishermen’s strategic choices were made in a specific social context, which is not immediately evident from the statistics. This means that other sources are needed to analyse the fishing fleet dynamics and place the fisher-ies statistics in a proper context.
87 NAS, Fishery Board of Scotland. 88 Sjöström.

53
The Swedish administration had a well-established system of lo-cal status reports in the nineteenth century. Every fifth year local offi-cials – kronolänsmän and kronofogdar – sent reports to the govern-ment’s regional administration in Göteborg – länshövdingen. Län-shövdingen’s administration prepared an overview of the state of the Bohuslän economy, population etc., which served as input to a na-tional publication known as Konungens Befallningshafvande femårs-berättelse. Much of the primary material in the local and regional reports has been preserved in the archives of Landskansliet in Göte-borg and offers a wealth of information about the fishing industry, as the performance of the fishing industry and the fishing villages were monitored through the reports. Some of the local reports were written by the same men who collected statistics for annual reports on the fishing industry. Thus, there were overlaps between the published fisheries statistics and the primary material in the Landskansli archive with respect to who produced the reports.89
Independent information, i.e. unrelated to the government ad-ministration, can be found in a series of publications written by con-temporary observers and scientists. These people discussed the state of the Bohuslän fishing industry, and their works contain much useful information regarding fishing technology and fishing operations. The first of these publications came out in the 1830s and 1840s, and the most informative of them were published by Axel Emanuel Holmberg in three volumes from 1842 to 1845 and by Carl Ulric Ekström in 1845.
Information regarding the stock characteristics of ling, cod and other demersal species can be found in a number of scientific publica-tions published by marine biologists in the second half of the nine-teenth century.90 These sources can be used to validate information from the fisheries statistics. Additional information is available from Danish and Norwegian scholars.91
89 Persson, p. 23. 90 Malm 1877; Smitt. 91 Smidth; Petersen; Drechsel; Løberg.

54
In 1884, the journal Bohuslänsk Fiskeritidsskrift was published, and the journal Svensk Fiskeritidsskrift appeared for the first time in 1892. Axel Vilh. Ljungman was the publisher of Bohuslänsk Fiskeri-tidsskrift, and in his own words the journal was published with the purpose of ‘advancing’ the Bohuslän fishing industry. Today Ljung-man is most famous for his theories about the causes of the herring fluctuations on the Bohuslän coast.92 The journals were intended to increase public knowledge about the fisheries,93 and both journals were published several times a year and contained summaries of the fisheries statistics, articles on relevant fishing legislation, means of improving the fisheries, fish biology and fisheries history. Svensk Fiskeritidsskrift had a similar profile. The two journals thus contain relevant information on the state of the industry at different times in the nineteenth and early twentieth centuries. Additional information is available from Danish and Norwegian fisheries journals – Tidsskrift for Fiskeri, Nordisk Tidsskrift for Fiskeri and Norsk Fiskeritidende.
In 1858 the fishing company Göteborgs och Bohus Läns AB för Storsjöfiske was established in Göteborg with the purpose of intro-ducing innovative fishing strategies into the longline fisheries. The company did not live long, but the management meeting minutes are preserved in Göteborg. The minutes are relevant sources not only to the development of the company but more widely to the Bohuslän fishing industry of the 1850s and early 1860s. This source gives sig-nificant information on catch rates, spatial distribution of fishing ef-fort, the curing of catches, time spent fishing and the fishing technol-ogy employed.
A series of ethnographic interviews dating from the 1920s to the 1940s provide information on the fishermen’s perceptions of the fish resources and life in the coastal communities. Etnographers – includ-ing Olof Hasslöf – interviewed people in the coastal communities of Bohuslän from the early 1920s to the 1940s.94 The transcribed inter-
92 Smith 1987 p. 173; Ljungman 1878; Ljungman 1883; Nordisk Tidsskrift for Fiskeri 1879, p. 257-68. 93 Bohuslänsk Fiskeritidsskrift I, 1884, N:o I-VIII, p. 1-3. 94 Hasslöf 1949, p. 17-8.

55
views are kept in the museum archives in Göteborg and Uddevalla. Some of the interviewees were fishermen born in the 1850s, and they had taken part in the longline fisheries for several decades. The et-nographers interviewed the fishermen about how the fishing was or-ganised and asked them to describe the work at sea and the fishing gear. Information found in these interviews serves as a useful sup-plement to the statistical analysis. The fact that the fishermen looked several decades back in time limits the value of the statements. Nev-ertheless, the interviews are a useful supplement to the fisheries re-ports and statistics. The interviews contain important information on the fishing technology employed, the fishing operations, the curing of the catch, the season length etc. It is likely that additional information on life in the coastal communities can be had from personal notes and diaries kept by fishermen. This type of source has not been identified for this project, but it may very well exist in someone’s private pos-session.

56

57
THE BOHUSLÄN FISHER-
IES BEFORE 1859
The Bohuslän fisheries before 1840
For centuries, Sweden’s economic development was dominated by agriculture, lumbering and mining. Fisheries, on the other hand, played only a minor role in the Swedish economy. In line with this, the primary books on Swedish economic history only make mention of fishing briefly.95 In 1840, Sweden – like other continental Euro-pean countries – was struggling to catch up with Great Britain, the leading industrial nation of the time. In terms of productivity, innova-tion and gross national product per capita, the Swedes were far be-hind the British.
Bohuslän’s economic development differed from that of the the rest of the country. Agriculture was important, but Bohuslän had the most fisheries-dependent economy in the country. The herring fishery was certainly the most spectacular sector of the industry, and for cen-turies it had been an important force in the development of the Bo-huslän economy, which expanded and contracted concurrently with the herring fisheries. Large-scale coastal herring fisheries had been carried out during several periods since at least the Middle Ages.96 The years between 1747 and 1808 and between 1877 and 1900 stand out as such prosperous periods. At the peak of the eighteenth century herring fisheries, more than 16,000 people were engaged in the catch-ing and processing sectors of the industry. The industry also caused
95 Schön; Magnusson. 96 On the herring fisheries se Dalén, p. 75-94, 131-69, 211-38; Hasslöf, 1949, p. 110-218; Holm, 1991, p. 106-8, 184-9; Sandahl, 1998; Nystedt; Brattö.

58
people to migrate from the Swedish inland to Bohuslän for work.97 In economic terms the eighteenth century herring fishery was more im-portant to Sweden than the Swedish East India Company, which has received much attention in historical research.98 When the herring disappeared in 1808, the coastal communities of Bohuslän experi-enced a recession, and the population declined from 1810 to 1835.99 The decline in the fishing industry was partly alleviated by growth in merchant shipping, and by 1835 the main economic crisis was over-come. 100
Figure 2. Swedish fishing grounds in the Skagerrak and the North Sea.101
97 Andersson, 1996, p. 222. 98 Magnusson, p. 280-1; Andersson, 1996, p. 215-26; Högberg, p. 165-83. 99 Dalén, p. 147-8, 164; Höglund; Hasslöf 1949; Haneson et al.; Holm 1991; Högberg, p. 165-83. 100 Dalén, p. 152, 184, 196. 101 Berättelse 1888-89, Karta öfver Bohuslänska Storsjöfiskets fiskeplatser 1888.

59
After the demise of the herring fishery, the longline sector be-
came the most important fishery in Bohuslän. Longline fisheries had taken place in the Skagerrak for centuries. Longlines were used to catch demersal, i.e. bottom living, species such as ling and cod. Ex-actly when the fishery was initiated is uncertain. Probably Bohuslän fishermen fished with longlines in the Skagerrak as early as the six-teenth century.102 It is also difficult to estimate the size of the fleet and total catches because fisheries statistics were not systematically collected. Based on the landshövding’s five-year report from 1822, Hasslöf estimated the Bohuslän fishermen’s annual catch to be be-tween 200,000 and 300,000 ling and an equivalent or higher number of cod.103
As part of a job commissioned by the Swedish government, Pro-fessor Sven Nilsson published a report on the state of the Bohuslän fisheries in 1828. Nilsson’s main focus was the decline of the herring fisheries. In his opinion, the decline was the result of a very high fish-ing pressure on the stock. Nilsson also discussed the state of the longline fisheries, which pursued ling, cod, saithe, halibut and rays from late March to late September.104 Even though the longline fish-eries were multi-species fisheries, fishermen only considered ling to be financially interesting. Ling was most abundant at depths greater than 200 metres, on fishing grounds off Lindesnäs in southern Nor-way. Smaller vessels were used for fishing closer to home and at lower depths. Typically, a higher proportion of the catches made by small vessels consisted of cod.
Nilsson worried about the state of the ling stock and reported that catch rates had declined by 75 per cent during the period 1808-28, which reflected a major decline in the abundance of ling. Most of the decline had taken place in just 10-12 years. Nilsson realised that such changes were dramatic, but he claimed that fishermen from all over Bohuslän concurred with this view. Part of the decline was attribut-
102 Hasslöf 1939, p. 12; Hasslöf 1949, p. 55-69. 103 Hasslöf 1949, p. 68. 104 Nilsson 1828, p. 31-6.

60
able to the fact that extra manpower had entered the longline sector after the termination of the herring fishery in 1808. Cod, on the other hand, had not declined to the same extent as ling.
According to Nilsson, the declining ling abundance was also evi-dent from the fact that the average size of the fish had decreased. While a normal ling was 1.8 metres long, a large part of the catches consisted of small ling of a length between 44 and 60 cm. Nilsson did not specifically state where the catches of the small ling came from. His suggestion to the government was to reduce the fishing effort by transferring manpower from fisheries to the merchant marine. The fishing effort should be reduced in order to safeguard the stock.
It is difficult to evaluate Nilsson’s claims about a rapid decline of the ling stock, given the lack of catch and fishing effort data for the period preceeding 1859. It is quite possible that his notions reflected general nostalgia. Nevertheless, Nilsson’s highly pessimistic picture of the industry shows that ecological concerns were being voiced long before fisheries statistics were systematically collected. While not providing convincing evidence of a stock decline, Nilsson’s essay certainly raised a number of important questions regarding the eco-logical basis of the industry. How did the stock abundances change, and how did such changes affect the fishermen? Also, to what extent did the average fish sizes change, and did such changes indicate ma-jor ecological changes? The issues that Nilsson brought up are still relevant.
Four years later, another report on the Bohuslän fishing industry was published.105 Its author, Ol. Lundbeck, also painted a bleak pic-ture of the Bohuslän fisheries, but for very different reasons than Nilsson. Instead of claiming that stocks were subject to an exceed-ingly high fishing pressure, Lundbeck diagnosed the industry as being underdeveloped. The fishing effort was too low, and Lundbeck con-cluded that there was plenty of room for expansion within the indus-try. It was poverty that prevented the coastal population from invest-ing more heavily in the fisheries.
105 Lundbeck, p. 8-12.
61
Lundbeck made a brief description of longline fishery, which was the most important sector of the industry at the time. Two types of vessels were used – skutor and båtar. The skutor were the larger ones and stayed at sea for up to two weeks, whereas the båtar made 6-7 day trips. Interestingly, Lundbeck said that the average size of the fish caught increased with depth and distance from the fishing villages. Thus, the skutor caught larger fish than the båtar.
Lundbeck briefly mentioned that longline fishery also took place during the winter. Small vessels using old longlines were engaged in this fishery and usually made only day-trips a few kilometres from the coast.
The fisheries in Holmberg’s Bohuslän
The most informed and comprehensive description of the mid-nineteenth century Bohuslän was made by Axel Em. Holmberg (1817-1861), a priest and historian. Bohuslän historians have repeat-edly turned to Holmberg for a well-informed snapshot of the state of the county in the mid-nineteenth century. Holmberg published three volumes titled Bohusläns Historia och Beskrifning between 1842 and 1845. Tracing the political history of Bohuslän over more than a thousand years, the first volume is only peripherally relevant in re-gard to Bohuslän’s fishing industry. The second volume, however, contains a detailed analysis of Bohuslän in the 1840s. Holmberg de-scribed Bohuslän’s natural resources and landscapes as well as its demographic development. The second volume also focused on the main economic, political and religious institutions of the mid-nineteenth century Bohuslän. Hence, Holmberg painted a detailed picture of the economy of the region, including the state of the fishing industry. The third volume contains a description of the individual parishes and communities of Bohuslän, focusing on such diverse issues as soil quality, fisheries and church architecture.
Based on the last two volumes of Holmberg’s work, the scale of the fishing industry can be assessed both in terms of the number of fishermen and the technology employed in the fisheries. Holmberg’s work also addressed the regional differences between coastal com-munities.

62
The overall state of the fishing industry In 1840, Bohuslän’s population had two main occupations: Agricul-ture and fishing. Historically the former depended on the latter. When herring were abundant along the Bohuslän coast, agriculture was ne-glected by many of the county’s residents. During such periods, fish-ing was the main employment.106 Though Holmberg admitted that traders and merchants had benefited from the large-scale herring fish-eries, he emphasised that fishery had negative social implications for a large group of people due to its sudden fluctuations. Thousands of people had been employed in the herring fisheries, both in the catch-ing and the processing sectors, around the year 1800. For most of them, the disappearance of herring from the coast in 1809 meant fi-nancial decline. By drawing their attention to the sea, the herring fishery had wreaked havoc on agriculture as an alternative liveli-hood.107 According to Holmberg, wealth was replaced by poverty when the herring disappeared. Only ‘immorality’ remained.108
Holmberg held a critical view of the fishermen and their lifestyle. In fact, he said that no other working men were more ignorant than the Bohuslän fishermen, who hardly knew that fish spawn.109 Holm-berg focused on the alcoholism and violence that took place in many fishing communities.110 However, despite Holmberg’s apparent cul-tural prejudices, his description of fishery is highly interesting.
Since the decline of the herring fishery in the early nineteenth century, the fishing industry had lost part of its former economic im-portance to the region, and fisheries were no longer the main occupa-tion of the Bohuslän population. Nevertheless, Holmberg estimated that 8,000 people had their sole income from fishing. In addition, fishing was an important part-time occupation for many peasants.111
106 Holmberg, vol. II, p. 35, 71. 107 Holmberg, vol. II, p. 91-92. 108 Holmberg, vol. II, p. 86. 109 Holmberg, vol. II, p. 82-3. 110 Holmberg, vol. II, p. 92-3. 111 Holmberg, vol. II, p. 81.

63
Apart from small-scale herring fisheries, the Bohuslän fishing in-dustry of the 1840s consisted of three main sectors: the longline fish-ery and the mackerel fishery, as well as the lobster and oysters fisher-ies. The lobster fishery took place in most parts of the Bohuslän ar-chipelago, and oysters were also caught on several locations on the coast. All the year round, the demersal species of cod, haddock, whit-ing and sole were caught close to the Bohuslän coast. However, ac-cording to Holmberg’s estimate the income from the coastal fishery was only small.112 The longline fisheries further to sea had a much greater economic impact.
The longline fishermen pursued cod, ling, halibut, rays and in some years also pollock. Fishing took place from the spring until October on Jutska Refvet in the Skagerrak and off Skagen and Lindesnäs. Longlines were employed with hooks spaced approx. 5.3 metres apart. Haddock was used as bait on the longlines and was caught on smaller longlines. The fishing fleet consisted of two dis-tinct types of vessels: First, the skutor, which were decked boats with three masts. With a crew of 10-12 men, these vessels went on trips of up to two weeks’ duration, venturing up to approx. 320 kilometres from the Bohuslän coast. The second type, sjöbåtar, had a crew of eight men and made trips of a maximum of eight days, mainly to the grounds north of Skagen. Thus, Holmberg made the same distinction between sjöbåtar and bankskutor as Lundbeck had done in 1832.
In Holmberg’s opinion, the fisheries were not nearly as developed as they should have been, and he characterised the fishing communi-ties as very poor.113 Theoretically, the fishery could be much larger; for example, only small-scale, coastal fishery took place in Thorsby parish, even though it had a long, open coastline well suited for fish-eries.114 Why, asked Holmberg, did the Bohuslän fisheries not ex-pand? His main answer was poverty. Even though he condemned the alcoholism that was found in many fishing communities, he stated that the main explanation for the poor state of the fishing industry
112 Holmberg, vol. II, p. 97-8. 113 Holmberg, vol. II, p. 81. 114 Holmberg, vol. III, p. 392.
64
was the fishermen’s lack of financial resources. Holmberg was echo-ing Lundbeck’s interpretation from 1832 in which he singled out poverty and lack of capital as the primary causes of the underdevel-opment of the industry.
According to Holmberg, the fishermen depended on the saltery owners. The saltery owners supplied the fishermen and paid them low prices for the fish they caught.115 Finally, Holmberg advised that the Swedish state should grant subsidies to the fishermen to assist them in acquiring the appropriate fishing gear.116
The individual fishing communities The third volume of A E Holmberg’s work was a topographical de-scription of Bohuslän’s individual parishes and communities. Holm-berg’s description of the fishing communities makes it possible to make a tentative assessment of the scale of the longline sector around 1845. Holmberg estimated that 8,000 people were solely dependent on the income from fisheries; however, the question is how many of these people were actually involved in the longline sector?
By comparing Holmberg’s description from the mid-1840s with the first official fisheries statistics, published in 1859, it is possible to identify the most dynamic longline communities at the time. Table 1 shows the individual fishing villages’ fleets as stated by Holmberg in 1842-45 and the first published fisheries statistics from 1859. In addi-tion, Table 1 shows an estimate of the number of fishermen employed on longline vessels. This number is calculated by assuming that the sjöbåtar and the bankskutor carried an average of eight and eleven men, respectively. These assumptions are based on Holmberg’s own information on average crew sizes. For some parts of the coast, Holmberg stated neither the size of the fishing fleet nor the number of men employed onboard, but only indicated that longline fisheries did take place. Hence, Holmberg does not allow for an estimate of the total population of longline fishermen in Bohuslän.
115 Holmberg, vol. II, p. 100-1. 116 Holmberg, vol. II, p. 101-2.

65
Garpviken
HasselösundSmögen
GrafvarneTången
Näset Veijern
Hunnebostrand
Malmön Lilla KornöStora Kornö
GrundsundRågårdsvik
IslandsbergGullholmen
Bovallstrand
Edshultshall
BjörholmenMollösund
Böklöfva
KäringönHellevikstrand
KyrkesundToftenäs
Stocken & Råön
Skärhamn
KlädesholmenFlatholmen
DyrönÅstolTjörnekalf
Stansviken
ÖckeröHönö
HälsöKnipplan
Hyppeln
Fotö
Rörö
Vrångö
Donsö
Figure 3. Bohuslän fishing communities.
Tjörn
Orust
Stångenäset
Sotenäset
Göteborg

66
Table 1. Number of longline vessels and fishermen in Bohuslän villages, 1845 & 1859.117
Fleet, 1845 Fleet, 1859 Crew
Fishing village Bankskutor Sjöbåtar Large Small 1845 1859
Hunnebostrand 0 3 24
Malmön 0 10 68
Smögen 0 6 48
Lilla Kornö 0 2 16
Stora Kornö 0 2 16
Norra Grundsund
Näset 0 3 24
Tången 0 2 16
Grafvarne 0 9 72
Veijern 0 1 8
Hasselösund 0 2 16
Fiskebäckskil 1 0 10
Stocken & Råön 1 1 2 0 19 20
Grundsund 7 0 77
Rågårdsvik 2 0 22
Gullholmen 5 9 0 40 102
Hellevikstrand 1 2 4 0 27 48
Käringön 5 1 6 0 63 72
Hallsbäcksstrand 0 1 8
Böklöfva 0 4 28
Björholmen 3 0 1 0 33 12
Edshultshall 1 0 0 0 11 12
Mollösund 4 2 8 0 60 96
Engviken 0 1 7
Limhall 1 0 12
117 Holmberg, vol. II & III & Handlingar 1859, Tablå öfver Bohus Läns Hafsfiske år 1859.

67
Kyrkesund 4 0 2 1 44 41
Säbykihle 0 1 8
Skärhamn 1 0 12
Nödsäter 0 1 8
Flatholmen 0 1 6
Galpeviken 0 1 7
Tjörnekalf 5 0 1 10 55 77
Klädesholmen 9 0 4 1 99 54
Dyrön 0 1 6
Åstol 6 0 1 6 66 53
Göteborg 1 0 12 Longline fishing did take place. The exact number of vessels is unknown.
No evidence of longline fisheries.
Holmberg’s detailed description of Bohuslän started in the north-
ernmost part of the county, but made no mention of longline fisheries on the coastline stretching from the Norwegian border to the penin-sula of Sotenäs. Some of the communities on this part of the coast were dependent on fisheries, but they did not pursue the demersal species to any great extent and definitely not with longlines from bankskutor or sjöbåtar. Instead these fishermen pursued herring, lob-sters and oysters, in addition to mackerel, close to their homes.118
The peninsula of Sotenäs was an agricultural area, and fishermen were concentrated mainly in three communities in the parish of As-kum.119 Grafvarne, which had a good natural harbour, was one of them, and Holmberg described it as a ‘lively fishing community’.120 Holmberg did not, however, state whether or not the Grafvarne fish-ermen engaged in longline fisheries, which is surprising since accord-ing to the first published fisheries statistics, Grafvarne was Sotenäs’
118 Holmberg, vol. II, p. 165-280. 119 Holmberg, vol. III, p. 2. 120 Holmberg, vol. III, p. 9.

68
most active longline fishing community in 1859.121 The neighbouring island of Malmön was populated by approximately fifty households and also had a good natural harbour. Agriculture was on a very small scale, and the main occupation of the islanders was longline fish-ery,122 which is in agreement with the published statistics from 1859. The third community was Smögen, also densely populated by fisher-men, which Holmberg described as Bohuslän’s ‘most able, proper, and wealthy fishermen’.123
Just to the south of Sotenäs were the poor communities of the peninsula Stångenäs, which were mainly inhabited by peasants. Stångenäs had three fishing communities, Stora Kornö, Lilla Kornö and Norra Grundsund. While shipping was a considerable business in this area, Holmberg gave no indication of longline fisheries, other than mentioning that a large saltery was located there.124 It is probable that the saltery was engaged in the curing of demersal species, caught in the longline fisheries.
Further to the south was Orust, Sweden’s third largest island, where longline fisheries were important. Orust had a coat of arms showing three lings with hooks through their mouths.125 The main fisheries were concentrated on the western part of the island. Holm-berg estimated that approximately 2,000 people out of a total popula-tion of 5,700 earned a living from fishing in the parish of Morlanda on Orust. In fact, all four main fishing sectors were represented in Morlanda parish. Catches consisted of lobsters and oysters as well as herring and mackerel. However, the main fishery was the longline fishery. Fishing was pursued by ‘a large number of skutor and sjöbåtar’ .126 Shipping was an expanding business. In actual fact, the
121 Handlingar 1859, Tablå. 122 Holmberg, vol. III, p. 10. 123 Holmberg, vol. III, p. 12. 124 Holmberg, vol. III, p. 19. 125 Holmberg, vol. III, p. 156. 126 Holmberg, vol. III, p. 191.
69
three old fishing communities of Fiskebäckskil, Rågårdsvik and Gåsö had abandoned fishery in favour of shipping.127
The most active fishing community in the area, Grundsund had a population of 473 people. It employed ‘a large number of’ sjöbåtar in the longline fishery. Unfortunately, Holmberg did not state the exact number of vessels. When the first statistics were published in 1859, Grundsund was the home of seven large longline vessels.128 Gullhol-men, the neighbouring island, had five sjöbåtar. In this community of 341 people, poverty and alcohol abuse were major problem sources.129 The longline fishermen of Gullholmen expanded their activities during the mid-nineteenth century: By 1859, the five sjöbåtar had been replaced by nine large longline vessels.130 On the adjacent island of Käringön, the fishing fleet consisted of five skutor and one sjöbåt.131 Hellevikstrand, Mollösund, Stocken and Råön also pursued demersal species with longlines. Their fleets consisted mainly of the small sjöbåtar, but Mollösund also had five banksku-tor.132 While the numbers of vessels in most of these communities were stable during the period 1845-59, Mollösund’s population of longline fishermen increased by one third.
To the south of Orust, the population of the island of Tjörn was mainly employed in agriculture. Even though the soil of the island was comparatively fertile, 1,200 people were dependent on fisheries. Holmberg described these fishermen as being very poor, as lack of capital prevented many of them from getting involved in longline fishery, which, in Holmberg’s opinion, should have been their main occupation. Instead of pursuing ling and cod, the Tjörn fishermen used small longlines for haddock catches and also worked with mackerel fisheries. A group of peasants, however, were involved in the longline fishery for ling and cod. They were based mainly in the
127 Holmberg, vol. III; p. 192-94. 128 Handlingar 1859. 129 Holmberg, vol. III, p. 194. 130 Handlingar 1859. 131 Holmberg, vol. III, p. 195. 132 Holmberg, vol. III, p. 196-7.

70
south-western part of the island, in Klädesholmen, Tjörnekalf and on the nearby island of Åstol.133 By 1859 additional coastal communities had entered the longline fishery, including villages such as Skärhamn and Flatholmen.
Further to the south was the town of Marstrand. Traditionally, Marstrand had benefited from herring fishery, but the decline in this fishery in 1809 had caused great problems. Although it was an early centre for tourists, Marstrand was still in a state of stagnation in the 1840s, and like in the case of Tjörn, the main problem was lack of demand and capital, which caused the fishermen to mishandle their catches. Holmberg advocated for government support to develop a large-scale longline fishery in the North Sea, based in Marstrand.134
On the islands of the northern archipelago of Göteborg, fishing was the main occupation, and agriculture served as a supplementary occupation. Herring were caught in the sound of Kalfsund, but the catches were used only as a fertiliser. Hardly any longline fisheries were performed from these islands; instead, approximately twelve vessels were used to carry fresh fish from Skagen in Denmark to the urban market in Göteborg. Holmberg criticised this trade and the government for not restricting it, because it presented an obstacle to the development of large-scale longline fishery in the Göteborg ar-chipelago.135 Again, Holmberg was echoing Lundbeck’s book on the Bohuslän fisheries from 1832. Lundbeck had described how fish were imported from Denmark, and he had concluded that this practice was detrimental to the Swedish fisheries.136
Based on Holmberg’s information on the individual village fleets it is possible to draw a rough picture of the different fishing strategies in the mid-1840s. The bankskutor fished to the south of Lindesnäs and ventured further to sea than the sjöbåtar, and the ownership of sjöbåtar and bankskutor reveals the fishing strategies used and which fishing grounds the fishermen frequented. According to Holmberg,
133 Holmberg, vol. III, p. 210-27. 134 Holmberg, vol. III, p. 405, 423-4. 135 Holmberg, vol. III, p. 475-9, 136 Lundbeck, p. 19.

71
the bankskutor were owned by Käringön, Mollösund, Hellevikstrand, Edshultshall and Råön, all of which were located on the island of Orust or immediately adjacent to it. Hence, the Orust communities focused on the most distant grounds off Lindesnäs. The sjöbåtar were owned by the other communities, which focused on the grounds closer to home. This does not mean that no other communities en-gaged in fisheries at the most distant grounds off Lindesnäs at that time, but certainly the main effort in the most distant fisheries came from Orust.
In conclusion, careful reading of Holmberg’s books reveals that the centers of longline fishery were situated on Orust. Small commu-nities on the two peninsulas Sotenäs and Stångenäs and the island of Tjörn were also involved in demersal fisheries, but probably not to the same scale as the Orust fishermen. In 1845, Holmberg was hoping for an expansion of the longline fisheries, and some expansion did take place between 1845 and 1859. A comparison of Holmberg’s information with the first published statistics from 1859 shows the main trends during this period. Many of the existing communities underwent a comparatively stable development, but a few well-established longline communities, such as Mollösund, expanded. It is more remarkable, however, that a new group of coastal communities from Tjörn and Sotenäset had entered the longline fisheries by 1859. Although Holmberg made no estimate of the total number of longline fishermen in 1845, it is evident that more communities and more men were employed in fishery in 1859.
Fishing practices in the 1840s
A E Holmberg gave an overview of the different sectors in Bo-huslän’s fishing industry and its fishing communities, but he did not describe the fishing technology and the specific fishing practices in the longline fisheries. How did the fishermen set their gear? Did the fishing practices differ between the sjöbåtar and the bankskutor? Dur-ing which seasons and at what times of the day did the fishermen fish? How long were the longlines? And how many hooks did they have? Some of the answers to these technical questions can be found in a book by Carl Ulric Ekström, titled Praktisk Afhandling om lämpligaste Sättet af fiska Sill, Torsk, Långa, Makrill, Hummer och Ostron. Ekström’s book was published in 1845 on behalf of the

72
Academy of Science (Kongl. Maj:ts Wetenskaps-akademi). Ekström was a priest on the island of Tjörn but worked mainly as a doctor and zoologist.137 His publication had two purposes. One was to present an overview of the fishing technologies employed at the time, and the other was to advise the fishermen on possible improvements of their fishing operations.138
Fishing for demersal species could take place from the New Year until September or October, but Ekström distinguished between two fisheries – the spring and the winter fisheries. The spring fishery was Bohuslän’s most important fishery in terms of catches. It started in March or April, depending on the weather. Despite its name, the spring fishery usually ended in September when the autumn storms stopped it.139 The longline fishery was a multispecies fishery, aimed at catching cod, ling, haddock, rays and halibut. Ling was considered tastier than cod, and it was also priced higher, and whereas ling could only be caught at considerable depths at a long distance from Bo-huslän, cod were also abundant close to the coast.140
’In the North Sea she [ling] was seen most com-monly off the Norwegian coast, upp to Finnmarken. In Kattegat she was even one of the most common fish species. Off Denmark it was caught as far to the south as Helgoland, and it was most common north of Skagen.’141
The second demersal fishery took place during the winter, start-ing in late December and ending in March, depending on the weather. The main target species was halibut, but ling and cod were also caught. Vessels carried longlines for the fishery, but because of the
137 Holm 1991, p. 250. 138 Ekström, p. 3-4. 139 Ekström, p. 35, 39. 140 Ekström, p. 57. Same conclusion on the tasty flesh of the fish, p. 58, 59. 141 Ekström, p. 57-8.

73
winter storms they did not venture very far from the Bohuslän coast.142
Gear Demersal species could be caught with handlines, longlines and drift nets. Basically, the hand-line consisted of a line with one hook, but it was uncommon in Bohuslän in the 1840s. Drift nets were also un-common since they were deemed more expensive than longlines. Longlines were the most common type of gear in demersal fisher-ies.143 Ekström described a variety of other types of fishing gear that could be used for catching demersal species, most of which were either uncommon in Bohuslän or only used in fisheries in the fjords.144
The fishermen had two main types of longlines - koljebackor and storbackor; the former were used to catch bait for the latter. Kolja is the Swedish word for haddock, and the koljebackor caught haddock in addition to small ling and cod. The koljebacka haddock catches were cut to pieces and used as bait on the storbacka hooks. Bivalves were used as bait for the koljebackor.
The storbackor were the fishermen’s most important fishing gear. As a minimum, each of the large bankskutor carried 32 backehun-drade, whereas the smaller sjöbåtar with six or seven men carried only approximately 18 backehundre. A backehundre was a 220-meter longline with fifty hooks.145 Hence, a bankskuta with 32 backehun-drade carried more than seven kilometres of longline with at least 1,600 hooks. The hooks were spaced approx. four metres apart. As a minimum, each person would carry between 150 and 200 hooks. Most of the hooks had floats to keep them away from the sea floor, where the catches were at risk of being eaten by benthic species. However, every fifth hook had no floats and therefore they stayed on the sea floor, where they would catch rays. Koljebackorna had a finer
142 Ekström, p. 46-8. 143 Ekström, p. 36. 144 Ekström, p. 46-56. 145 Ekström, p. 40, 112.

74
and shorter line, each with 100 hooks, and none of the koljebackor had floats.146 Each of the storbacka hooks was 6.5 centimeters long and had a 2.8 centimeters opening. The hooks for the koljebackor were smaller.147
Figure 4. Koljebackor (to the left) and storbackor.148
146 Ekström, p. 112-4. 147 Ekström, p. 118. 148 Reproduced from Hasslöf 1949, p. 35.

75
Vessels Ekström maintained the old distinction between bankskutor and sjöbåtar. A bankskuta had a crew of at least twelve men and a 14-meter keel. Ekström estimated that the bankskutor spent at least three weeks per trip, and often longer due to adverse weather conditions.149 Ekström’s estimate was higher than that of Holmberg; Holmberg had said that the bankskutor stayed at sea for two weeks. However, Ek-ström and Holmberg agreed that the vessels stayed at sea for so long that the catches often deteriorated on board. Often the catches were partly rotten when they were landed. Ekström strongly advocated that the vessels should be designed to allow for onboard curing of the catches.150 Like Holmberg, Ekström said that the bankskutor fished to the south-west of Lindesnäs.151
The second type of vessel was the sjöbåt. Originally, the sjöbåtar were undecked, a fact which prevented the fishermen from following the bankskutor to the grounds off Lindesnäs. However, in the 1840s the fishermen were introduced to decked sjöbåtar. Due to their rig, the bankskutor were comparatively difficult to manoeuvre, whereas the eight metres long and three-masted sjöbåtar were easier for the fish-ermen to handle. This caused Ekström to predict that the bankskutor would gradually be replaced by large decked sjöbåtar.152
The fishermen located the actual fishing grounds by means of a lead line with a blob of tallow to retrieve sea floor samples.153 Ek-ström criticised the fishermen of being conservative in terms of spa-tial strategies, because they fished on exactly the same grounds as their predecessors, and he advocated a more dynamic fishing strategy in order to increase catches, e.g. by searching for fish on new grounds. In 1843, however, fishermen from Käringön had found a hitherto unknown fishing ground in the North Sea. Ekström did not
149 Ekström, p. 38, 43, 93-4. 150 Ekström, p. 39. 151 Ekström, p. 40. 152 Ekström, p. 93-4. 153 Ekström, p. 33.

76
specifically state the name of the ground, however;154 it may very well have been the fishing ground named Jäderen, in the North Sea to the west of Norway.155
Fishing operations Both the bankskutor and the sjöbåtar carried dinghies from which to set and retrieve the longlines. The question is how much the fishing practices differed on the two types of vessels.
The bankskutor carried dinghies with room for up to six men. The time of the setting of the gear depended on the type of bottom. When it consisted of sand, the longlines were set in the evening and re-trieved the following morning. This was the most common practice, since most of the Kattegat, Skagerrak and North Sea had sandy bot-toms. On rocky grounds, however, longlines were set in the morning to avoid that the catches were eaten by other animals during the night. Loss of longlines was common, either because the lines collapsed or because the fishermen were unable to relocate them.156
According to Ekström, fishing from the sjöbåtar had much in common with the fishing practices onboard the bankskutor. The fish-ing season was the same, but the vessels made shorter trips of only one week’s duration. Generally, the sjöbåtar did not venture as far to sea as the bankskutor, focusing mainly on Jutska Refvet in the Skagerrak. When the boats arrived on the Skagerrak fishing grounds, they set the koljebackor in order to catch haddock. Haddock could be caught everywhere but were more abundant in shallow waters. When they had caught haddock, the vessels ventured to greater depths to set the storbackor. The setting and retrieval of the longlines took place from dinghies each manned with two fishermen. Work in the dinghies was dangerous, and many lives were lost while the lines were set or retrieved.157
154 Ekström, p. 36. 155 GLA, A 274, Göteborgs och Bohus Läns AB för Storsjöfiske, ‘Anteckningar om Fisket i Bohuslän samlad av C.B.’ 156 Ekström, p. 40-3. 157 Ekström, p. 44-5.

77
Handling of the catches Both Ekström and Holmberg criticised the fishermen for not taking properly care of their catches and advocated a change of fishing prac-tices. According to Ekström, the crews did not have time to cure the fish when large catches were made. In the summer, the fish would deteriorate for weeks in the holds of the vessels while they were at sea. The curing was done only after the catches had been landed, and often the catches were sent ashore partly decomposed. However, the fishermen’s conservative attitudes prevented them from changing this practice.158
Ekström described the process of onshore curing: After the fish were landed, they were soaked to remove blod from the flesh, and according to Ekström, this process destroyed the flavour of the fish. When the odour had been removed, the fish were salted and finally dried.159 The product was called kabeljou or klippfisk. Ling was also used to produce spillånga, which was treated the same way as kabel-jou, except that it did not undergo a salting process. The spillånga was supported by small sticks when it was dried.160 The roe was salted and sold to France, where it was used as bait in sardine fisher-ies. The oil extracted from the liver was used for lighting or for medi-cal purposes.161
Ekström advocated major changes in the way the fishermen han-dled the fish. First of all, the fish should be salted immediately after it was caught, which meant that the vessels should be outfitted to allow for this process to take place onboard.162 Alternatively, Ekström ad-vised that a vessel designed solely for onboard curing should be sta-tioned on the fishing grounds. The fishermen should then transfer their fresh catches to this vessel, where the curing would take place. The curing vessel should stay on the fishing grounds during the whole season, while a carrier could transport the fish to the markets in Bo-
158 Holmberg, vol. II, p. 94-6. 159 Ekström, p. 38, 130-4, 138-41. 160 Ekström, p. 143. 161 Ekström, p. 35. 162 Ekström, p. 137-9

78
huslän. This would save the fishermen travelling time between the grounds and Bohuslän and thus leave them more time for fishing on the grounds.163
The expansion of the Jäderen fishery
In 1845, Ekström criticised the fishermen for conservatism with re-gard to their fishing strategy. He advocated a spatial expansion of the fishery, but nevertheless the fishermen stayed on the same grounds that their forefathers had used. Ekström advised the fishermen to seek new fishing grounds in order to increase catches. From the 1850s there is evidence that such an expansion was taking place, as the fish-ing effort was gradually being shifted to more distant grounds in the North Sea proper.
The evidence is found in a status report made by Conrad Bergh. As an advocate of expansion of longline fishery, Bergh was involved in the establishment of a fishing company, Göteborgs och Bohusläns AB för Storsjöfiske, in 1858-59. The company intended to improve the handling of the fish, and Bergh became member of its board. In his preparations for setting up the company, Conrad Bergh had exam-ined the state of the fishing sector. Bergh’s paper is not dated, but it must have been prepared in 1858 or 1859 since it refers to events that took place in 1857 and 1858.164
According to Bergh, the total Bohuslän fleet of longline vessels numbered more than 100 vessels, most of which were fishing the grounds close to home:
‘… such as to the west off Lindesnäs, Skagerrak etc., while the large venture as far as the rich Jäderen bank. It is a fact that the number of ves-sels fishing on Jäderen increases each year, since this ground it is highly acclaimed among the fish-ermen, and the abundance of fish seems to be in-
163 Ekström, p. 38, 44. 164 GLA, A 274, Göteborgs och Bohus Läns AB för Storsjöfiske, ‘Anteckningar om Fisket i Bohuslän samlad av C.B.’

79
exhaustible, like the world famous Lofoden and New Foundland fisheries.’165
This clearly indicates that a gradual spatial expansion was taking place. Bergh estimated that 25 vessels were fishing on the most dis-tant fishing ground, Jäderens bank, which was situated 130-170 kilo-metres from Egersund in Norway and more than 500 kilometres from the Bohuslän coast. Thus, the vessels sailed farther in 1858 than they had done in the 1840s. According to Bergh, the Jäderen vessels fished at depths of approx. 70-180 metres or more.
In the mid 1840s, the majority of distant ground fishermen came from Orust. By the late 1850s, however, the situation had changed as eleven vessels from Tjörn had joined the Orust fishermen on the dis-tant grounds. In 1858, Klädesholmen sent five vessels to Jäderen, and Skärhamn, Kyrkesund, Tjörnekalf, Åstol, Herrön and Björholmen each sent one vessel. When fishing, the vessels typically anchored within sight of each other.166
Status for the longline fisheries in 1859
Swedish scholars were unimpressed by the state of the Bohuslän fish-ing industry in the mid 1840s. In their opinion, there were two major issues on the agenda for the demersal fisheries. The first issue was the handling of the catches. The quality and the flavour of the fish dete-riorated at sea due to the lack of onboard curing. Secondly, the schol-ars agreed that there was a potential for expanding the fisheries. However, an expansion did take place between 1845 and 1859. A new group of coastal communities entered the longline fishery, and fishermen ventured further to the west and the north to the new fish-ing ground Jäderen, where catch rates were high. While the fishermen extended the fishing trips to more remote waters, there were no signs of any change in curing practices at the time.
165 GLA, A 274, Göteborgs och Bohus Läns AB för Storsjöfiske, ‘Anteckningar om Fisket i Bohuslän samlad av C.B.’ 166 GLA, A 274, Göteborgs och Bohus Läns AB för Storsjöfiske, ‘Anteckningar om Fisket i Bohuslän samlad av C.B.’.

80

81
TRENDS AND CATCH
RATES
This chapter outlines the long-term trends in the development of the Bohuslän longline fisheries. In addition, the second part of the chap-ter addresses the methodological issues of how to apply the catch rate approach to the history of the Bohuslän fisheries.
Decadal changes 1859-1914
Fisheries statistics for Bohuslän were compiled systematically for the first time in 1859. From that time onwards they were published annu-ally, and it is possible to identify the long-term trends in the Bohuslän fisheries from this source. This chapter will present an overview of the development of the fishing industry from 1859 to the end of World War One, based on the published statistics. The chapter also compares the economic performance of longline fisheries with other fishing sectors and Sweden’s overall economic development.
The fisheries statistics
The fisheries statistics are the backbone of much of the following analysis. As a consequence of this, a discussion on the reliability and limitations of this source is highly pertinent. First of all, the question of the purpose and the methods of collecting fisheries statistics needs to be addressed. Secondly, how precisely did the published statistics reflect the actual catches and the fishing fleets? Did anybody have any motives for misreportings? Or to rephrase the question: Did the fishermen have any good reasons for either overestimating or under-estimating their catches?
From 1859 to 1914 the fisheries statistics were collected and as-sembled by Göteborgs och Bohusläns Hushållningssällskap or, for

82
short, the Hushållningssällskap. Each county in Sweden had its own Hushållningssällskap. The Bohuslän Hushållningssällskap was founded in 1814 to work primarily for the advancement of the Bo-huslän agricultural sector. However, part of its obligation was to im-prove the conditions of the fishing industry. The Hushållningssällskap disseminated knowledge on rational farming practices to peasants and knowledge on rational fishing practices and fish curing to fishermen. It also organised competitions and awarded prizes to fishermen and farmers that had produced superior quality products. In order to stimulate innovation, the Hushållningssällskap subsidised fishermen who were willing to try new types of vessels or fishing gear.167 In 1881, for example, it paid four fishermen from Södra Grundsund to go to Grimsby in Britain to learn how the British used smacks in their fisheries for demersal species. The British fishing vessels were con-sidered more modern than the Swedish vessels.168
In its efforts to improve the conditions of the fishing industry, the Hushållningssällskap needed information on the state of the industry, and fisheries statistics was a means to that end. Starting in 1859, the Hushållningssällskap published fisheries statistics as well as annual status reports on the fishing industry, and a local system of data col-lection was established. Customs and fisheries inspectors, who lived in the fishing villages close to the fishing operations, were employed, and the inspectors reported to the regional Bohuslän fisheries inspec-tor, who compiled the local reports into an overview for the county.169 In order to assess the diligence of the local data compilation, it is necessary to investigate who the local fisheries inspectors were, and for how long they stayed in office. Unfortunately, only lists for the years 1859-71 of the local fisheries inspectors have been preserved,170 and they indicate a high degree of continuity within the corps of offi-cers. Although some of the inspectors moved from one fisheries dis-trict to another, most of them stayed in office during the whole pe-
167 Sanne; Rodhe, p. 29-39. 168 Berättelse 1883, p. 3; Berättelse 1884, p. 4. 169 Sanne, p. 99-100; Rodhe, p. 134-5; Hasslöf 1949, p. 24. 170 Handlingar, 1859-66; Qvartalsskrift, 1866-72.

83
riod. Although they were paid by the Hushållningssällskap to collect the statistics, these people’s official titles were mainly coastguards or customs officers.
From 1859 to 1914, four regional fisheries inspectors were in of-fice in Bohuslän – E J E Uggla (1859-66), G von Yhlen (1866-85), A H Malm (1886-1907) and K A Andersson (1907-). All four were scholars or academics.
The quality of the fisheries statistics can be tested by determining the amount of funds that was spent on data collection. For obvious reasons it is difficult to estimate the actual costs of systematically collecting and assembling the data. In 1875, however, a report pub-lished by the Hushållningssällskap stated that Gerhard von Yhlen was paid 2,000 kr for his work of collecting fisheries statistics.171 Also, Hushållningssällskap accounts from 1888 show the annual costs of the collection of fisheries statistics to be 2,000 kr.172 In comparison, a casual, agricultural worker earned approx. 600 kr. per year in 1890.173
Did the fishermen have any motives to misreport catches? Ini-tially the fishermen seemed to have been unwilling to report their catches to the fisheries inspectors. However, in 1888 Malm reported that the fishermen’s initial reservations had disappeared as they had realised that reporting did not cause them any inconveniences. In other words, the fishermen had no motives to deliberately misreport their catches. Furthermore, Malm also stated that the quality of the fisheries data equalled or surpassed most other official statistics at the time.174
Data sets for the longline fishery in the Kattegat were collected for the first time in 1875. This fishery was pursued by fishing com-munities in the Göteborg archipelago, an area also referred to as Fish-ing District 1. Von Yhlen, who was in office at the time, admitted that the collection of fisheries statistics from this particular area caused difficulties. His comments in that regard are interesting because they
171 Qvartalsskrift 1876, IV, p. 205. 172 Qvartalsskrift 1889, III, p. 171. 173 Lagerqvist et al., p. 100. See also Holm 1991, p. 215. 174 Berättelse 1888-89, p. 57.

84
refer to the reliability of the statistics both from Fishing District 1 and other parts of Bohuslän. Said von Yhlen:
’The fisheries inspector, who live among the [fishing] population, could only give approximate estimates ... which show the expansion of the in-dustry. The [fishing] people sell their catches fresh in Göteborg or to merchants with no moni-toring, whereas good monitoring at the customs stations and in the merchants accounts can be ex-ercised in the other longline fisheries.’ 175
Thus, the data sets from the other, more important fishing districts further to the north were of a higher quality.
Decadal trends
When World War One broke out, 65 years had passed since the first fisheries statistics were collected in Bohuslän. The question is what the statistics reveal about the long-term development of the fishing industry. What was the scale of the fishing industry, and how many people were employed on the vessels? What position did the longline fisheries have within the fishing industry? And how did the fisheries perform in economic terms compared to other sectors of the Swedish economy?
Growth rates Like in other European countries, agriculture was the dominant sector in Sweden’s economy in 1840, and the majority of the population was employed in this sector. The Swedish economy expanded at an in-creasingly high pace during the second half of the nineteenth century. In quantitative terms, the period 1850-90 constituted a real break-through for modern growth. Before 1850, the annual growth rate in the gross national production per capita was assessed to be approx. 0.5 per cent. After 1850, it increased to 1-1.5 per cent per capita per annum, and significantly, the industrial production increased even 175 Berättelse 1879, p. 2.

85
faster. By 1890, agriculture and the associated production still em-ployed 58 per cent of the workforce, but the dynamic sectors of the economy were mainly industrial production.176
From 1850 to 1890, total industrial production increased 3.4 per cent per annum, and the infrastructural sector grew by 3.7 per cent per year. Agriculture, on the other hand, showed a lower growth rate of 1.6 per cent per annum. Sweden’s forests and mineral resources came to good use in this expansion. In fixed prices, the match facto-ries expanded by 12.9 per cent per year between 1850 and 1870, and the highly important pulp sector achieved an annual growth rate of 15.1 per cent between 1870 and 1890.177 While such high growth rates were remarkable, they were partly attributable to the fact that the initial production in these industries was very low. Similarly to continental European countries, Sweden improved its infrastructure markedly by introducing railways and industrial production tech-niques. Great Britain, the leading industrial nation at the time, was emulated by the continental countries.
Between 1890 and 1910, the Swedish economy continued to grow, but at an even higher pace, and at times Swedish growth rates surpassed those of the neighbouring Scandinavian countries, Great Britain, the continental European nations and also North America. Some sectors of the economy, such as paper and energy production, increased production values by more than 10 per cent per annum. In respect of production volumes and growth rates, the period after 1890 is termed ‘the breakthrough of the industrial society’, even though the agricultural sector still employed more people than did industry.178 This is not the place to discuss the driving forces of the nine-teenthcentury macroeconomic transformations, however; the interest-ing question is rather how the fisheries fit into this picture of overall growth. Obviously the general growth influenced the market for fish and served as an underlying factor for the expansion of the fishing industry.
176 Schön, p. 139-48. 177 Schön, p. 139-48. 178 Schön, p. 226-41.

86
Below is a table showing average, annual growth rates in the Bo-huslän fisheries. In fixed prices, the overall annual growth in the fish-ing industry’s catch values reached 6.3 per cent between 1859 and 1914. Compared to many other sectors in the Swedish economy, this was a high growth rate, and there is no doubt that the Bohuslän fish-eries expanded much more rapidly than did the agricultural sector. The growth rates even exceeded the expansion of a number of indus-tries.
Table 2. Average, annual growth rate: Catch value, fixed prices, 1859-1914.179
Longline fisheries, excluding District 1 * 1.2 %
Herring fisheries 10.1 %
Mackerel fisheries 7.6 %
All fisheries 6.3 %
All fisheries, excluding longline 7.9 %
* The category ‘longline fisheries’ excludes Fishing District 1, as data sets from this area are available only from 1875 onwards. The data set for the longline fisheries covers the period 1859-1912.
Overall, the longline fisheries were less expansive than the other
fisheries. In terms of catch values, the average annual growth rate in ling and cod fisheries was significantly below that of herring and mackerel fisheries. The results in Table 2 are calculated in fixed prices, thus excluding the effects of inflation.
179 Handlingar 1859-65; Qvartalsskrift 1866-1907; Berättelse 1867-1912/13; Publikationer 1907-14. Inflation index from Lagerqvist et al., p. 27-8.

87
-0,40
-0,30
-0,20
-0,10
0,00
0,10
0,20
0,30
0,40
0,50
0,60
1859
-64
1862
-67
1865
-70
1868
-73
1871
-76
1874
-79
1877
-82
1880
-85
1883
-88
1886
-91
1889
-94
1892
-97
1895
-190
0
1898
-190
3
1901
-06
1904
-09
1907
-12
Longline beyond SkagenHerring
-0,40
-0,30
-0,20
-0,10
0,00
0,10
0,20
0,30
0,40
0,50
0,60
1859
-64
1862
-67
1865
-70
1868
-73
1871
-76
1874
-79
1877
-82
1880
-85
1883
-88
1886
-91
1889
-94
1892
-97
1895
-190
0
1898
-190
3
1901
-06
1904
-09
1907
-12
Mackerel
All fisheries excluding longline
Figure 5. Average, annual growth rates of catch value. Five year averages, cor-rected for inflation. 180
180 Handlingar 1859-65; Qvartalsskrift 1866-1907; Berättelse 1867-1912/13; Publikationer 1907-14. Inflation index from Lagerqvist et al., p. 27-8.

88
A further analysis of the longline sector’s performance compared to those of the other sectors requires a more detailed picture. Figure 5 shows the average, annual growth rate in catch values over five year periods for the main fishing sectors. Growth rates in the longline fish-eries very rarely exceeded those of the other sectors; in fact, this was the case only in a few years around the turn of the century. This, however, does not mean that the longline fisheries were not expan-sive. During the period from 1859 to 1877, longline fisheries showed significant growth. The mid-1870s were the most expansive years showing average, annual growth rates between 10 and 15 per cent. Until around 1880, longline fishery grew at the same rate as the other sectors. From that time onwards, longline sector rates developed op-posite to those of other fisheries. The ling and cod fishery declined during the 1880s and early 1890s, whereas the other fisheries, notably the herring fishery, expanded. In contrast, longline fishery expanded around the turn of the century, whereas coastal herring fishery was in decline. The herring fisheries regained momentum in 1899, and the mackerel fisheries showed high growth rates from the mid-1890s, often exceeding 15 per cent per annum.
The growth rates in Table 2 and Figure 5 do not take into account the fact that the population of fishermen expanded during the latter half of the nineteenth century. In other words, growth rates per capita were significantly lower, especially in herring fisheries. Calculating growth rates per capita is difficult, however, since estimates of the total number of people employed in some sectors are not immediately available from the Hushållningssällskap reports. For the longline sector, the average annual growth in catch value per man can be cal-culated as shown in Table 3. Since statistics for the Fishing District 1 longline fisheries in the Kattegat were only collected from 1875, this fishery has been excluded from the table.
Table 3 also shows the development in the population of longline fishermen in Bohuslän, which did not fluctuate as rapidly as the in-come.

89
Table 3. Annual growth rates: Catch value per man (fixed prices) and number of fishermen, longline fisheries, excluding Fishing District 1.181
Value/man Number of men
1860-70 4.3 % 0.2 %
1870-80 2.9 % 1.5 %
1880-90 -3.7 % -3.1 %
1890-1900 3.8 % 0.2 %
1900-10 -0.3 % 0.7 %
The growth rates in Table 3 should be compared to the overall
growth rates of the Swedish economy at the time. Table 4 below shows the annual growth of Sweden’s GNP per capita in the period 1850-1910. In general, the Swedish economy showed more stable growth than longline fisheries. A comparison of the two tables clearly shows that the longline sector grew more rapidly than the GNP until the 1880s. The 1880s, however, presented a major setback for the demersal fisheries, while recovery characterised the 1890s. After the turn of the century, longline fisheries underperformed compared to the Swedish economy.
Table 4. Growth rate per annum: GNP per capita, Sweden.182
1850-60 1.1 %
1860-70 0.5 %
1870-80 1.0 %
1880-90 0.8 %
1890-1900 2.3 %
1900-10 2.0 % By increasing the potential market for fish products, the Swedish population growth in the nineteenth century served as an underlying cause for the growth of the fishing industry.
181 Handlingar 1859-65; Qvartalsskrift 1866-1907; Berättelse 1867-1912/13; Publikationer 1907-14. Inflation index from Lagerqvist et al., p. 27-8. 182 Schön, p. 145.

90
The relative decline Due to the lower, overall growth rates, the longline sector lost ground to the other fisheries in relative terms. This is evident from Figure 6, which shows the relative value of the catches by type of fishery. Three different phases in the development of Bohuslän’s fisheries from 1859 to 1914 can be discerned from the figure: The first is the period from 1859 to the late 1870s; the 1880s constituted a second period, and the last period went from 1890 to 1914.
0%
20%
40%
60%
80%
100%
1859 1863 1867 1871 1875 1879 1883 1887 1891 1895 1899 1903 1907 1911
OtherTrawlMackerelHerringWinter, longline, coastalLongline
Figure 6. Relative catch value of Bohuslän fisheries, by sector, 1859-1914. 183
183 Handlingar 1859-65; Qvartalsskrift 1866-1907; Berättelse 1867-1912/13; Publikationer 1907-14; Sveriges Officiella Statistik: Fiske 1914. The data in Figure 6 should not be taken at face value. As Ragnar Olsson has pointed out, initially the statistics underestimated the value of the catches in coastal fisheries. Also before 1875 no catch or effort statistics were collected for the demersal fishery in the Kattegat. Despite this caveat, the conclusions regarding the major shifts between the sectors remain. See Olsson 1985, p. 40.

91
In the first, published annual report on Bohuslän’s fisheries statis-tics, Uggla, the fisheries inspector, stated that the longline fishery was by far the most important fishing sector.184 He was absolutely right. Until around 1880, the ling and cod fisheries played a dominant role in the Bohuslän fishing industry in terms of income. 50 per cent or more of the total value was generated by demersal fisheries.
In 1879, the income from the longline fisheries fell below 50 per cent of the total catch value. 11 years later, it had gone down to below 15 per cent of the total income. Herring fisheries had taken over the place as the most important sector, accounting for approximately 50 per cent of the total catch value in the 1890s. The sudden appearance of herring on the Bohuslän coast is a clear reminder of the ecological driving forces of the fishing industry’s development.
When the coastal herring fishery declined around the turn of the century, both mackerel and longline fisheries gained ground. How-ever, the relative expansion of longline fishery lasted only a few years. By 1906, the longline income had fallen below 10 per cent of the total income from the Bohuslän fisheries, and the sector stag-nated. A new type of fishery pursuing demersal species was intro-duced after 1900, namely trawl fishery with steam vessels. At the end of World War One, longline fisheries were relatively insignificant to the Bohuslän fishing industry.
The work force In the long term, the longline sector lost ground to the other fisheries in Bohuslän, but in absolute terms the sector showed a remarkably stable development. Figure 7 shows the number of fishermen em-ployed in longline fisheries, excluding the fishermen from Fishing District 1, all of them employed in the Kattegat fishery. As mentioned above, the fisheries inspectors’ annual reports did not include statis-tics from the Kattegat fishery before 1875.
184 Berättelse 1859, p. 3.

92
-
200
400
600
800
1.000
1.200
1.400
1.600
1859 1862 1865 1868 1871 1874 1877 1880 1883 1886 1889 1892 1895 1898 1901 1904 1907 1910 1913 1916 1919 1922 1925 1928 1931 1934 1937
Figure 7. Number of longline fishermen – excluding the Kattegat fisheries, 1859-1939. 185
Figure 7 shows a remarkable consistency in longline fishery. The
number of fishermen fluctuated mainly between 1,000 and 1,400 during the 53 years between 1859 and 1912. The number of fisher-men was relatively stable at 1,100-1,200 until the late 1870s, when another 200 men entered longline fishery. After culminating in 1882, the fishery was on the decline until the early 1890s and reached an all-time low at 949 men in 1891. The longline fishing community had a relatively stable development in the 1890s and after the turn of the century, with a total population of approximately 1,000 men. A major decline set in after World War One.
Regional trends The analysis of the Bohuslän fishing industry growth rates conceals major shifts between the individual Fishing Districts. District 1 was situated in the Göteborg archipelago, and the district number in-
185 Handlingar 1859-65; Qvartalsskrift 1866-1907; Berättelse 1867-1912/13; Publikationer 1907-14; Sveriges Officiella Statistik: Fiske 1914-39.

93
creased from the south to the north. Districts 8 and 9, farthest to the north, were never seriously engaged in longline fisheries.
Figure 8 shows the number of longline fishermen in the individ-ual Bohuslän fishing districts and thus indicates the regional devel-opment patterns. It is evident that the overall increase in fishing effort that took place in the late 1870s occurred only in the Districts 1 (the Göteborg archipelago), 3 (Tjörn), 6 (Stångenäset) and 7 (Sotenäset). In the remaining three districts, efforts were fairly stable.
0
100
200
300
400
500
600
700
1859 1864 1869 1874 1879 1884 1889 1894 1899 1904 1909
123456789
Figure 8. Number of longline fishermen per Fishing District, 1859-1912. 186
Until the early 1880s, Tjörn and the peninsulas of Sotenäs and
Stångenäs had the largest longline communities. In fact, Sotenäset (District 7) had the largest group of longline fishermen on the Bo-huslän coast. In 1878, however, a major decline started in Sotenäset. By the early 1890s, most fishermen in the area had abandoned longline fishery. On the other hand, the Göteborg archipelago ex-panded rapidly during the 1880s. 186 Handlingar 1859-65; Qvartalsskrift 1866-1907; Berättelse 1867-1912/13; Pub-likationer 1907-14. Data from the District 1 island of Öckerö are missing for the years 1890-92, which is the reason for the apparent decline of the first district work-force in the early 1890s.

94
A comparison with other fisheries How large was the Bohuslän fishing industry compared to those of the other North Sea countries? Fisheries historians have yet to con-duct a comprehensive, comparative, quantitative study of the entire North Sea fishing fleet in the nineteenth century. Nevertheless, it is obvious that throughout the nineteenth and early twentieth centuries, the Swedish fishing industry was small scale compared to the leading North Sea fishing nations, England, Scotland and Germany.187 Fur-thermore, the Swedish industry developed relatively late in terms of fishing technology. For example, when Britain started replacing sail-ing vessels with steam trawlers and steam drifters from the 1880s, Swedish fishermen bought the obsolete sailing ships from Britain. This indicates that the Swedish industry lagged behind the leading fishing nations of the North Sea. Table 5 also shows some of the dif-ferences in fleet size and stage of modernisation; it shows the number of steam trawlers in the various North Sea countries’ fleets from 1903 to 1913. Sweden only got a significant steam trawler fleet around 1910, and by that time the British, German and Scottish fleets were still much larger. While steam ships were only part of the total North Sea fleet, they certainly represented the most advanced fishing ves-sels at the time.
By European standards, Sweden was a very small fishing nation, and the main part of the Swedish fishing industry was located in Bo-huslän. Statistical data sets are available for the entire Swedish coast-line from 1900, which allows us to compare the Bohuslän fisheries with other Swedish fisheries. Tabel 6 shows that approximately 50 per cent of the catch values derived from Bohuslän fisheries in 1900, and ten years later, the percentage had increased to approximately 64 per cent. Furthermore, the main part of the income from Swedish fisheries derived from Bohuslän. In other words, the Bohuslän fisher-ies were clearly the most important fisheries in Sweden, even though by European standards, they were comparatively small scale as well as late in modernising their operations.
187 See Robinson 1984; Haines, 1998a; Rohdenburg.

95
Table 5. Number of steam trawlers in the North Sea or from North Sea ports, 1903-13.188
Sweden Denmark Germany Nether-lands Belgium England
Scot-land Total
1903 1 135 32 22 1060 240 1490
1904 1 156 47 24 1049 233 1510
1905 1 166 69 23 1064 228 1551
1906 1 188 70 23 1116 242 1640
1907 1 231 89 23 1134 251 1729
1908 1 247 90 25 1124 275 1762
1909 0 240 84 35 1122 278 1759
1910 18 7 221 84 30 1111 303 1774
1911 40 6 222 111 27 1120 311 1837
1912 3 311 140 1106 306 1866
1913 4 256 158 1123 304 1845
Grey: No data available
188 Bulletins Statistique 1903-1914.

96
Tabel 6. Value of catches in Swedish fisheries, by county (län), 1900 and 1914.189
County (län) 1900 1910
Kr. % Kr. %
Norrbottens 0% 0%
Västerbottens 0% 0%
Västernorrlands 307.520 6% 292.165 2%
Gävleborgs 309.064 6% 324.378 2%
Uppsala 0% 80.744 1%
Stockholms 0% 786.293 6%
Södermanlands 0% 84.607 1%
Ôstergötland 0% 286.800 2%
Kalmar 173.713 3% 809.123 6%
Gottland 162.540 3% 330.662 2%
Blekinge 702.920 14% 733.150 5%
Kristiandstads 0% 0%
Malmöhus 609.684 12% 837.499 6%
Hallands 347.858 7% 469.817 3%
Göteborgs- och Bohus 2.471.297 49% 8.769.558 64%
Total 5.084.596 100% 13.804.796 100%
189 Sveriges Officiella Statistik: Fiske 1914, p. 36-7.

97
Table 7. Value of fishing vessels and gear in Swedish fisheries, by county (län), 1914.190
County (Län) Gear Vessels Total Percent
Norrbottens 399.294 148.300 547.594 3%
Västerbottens 207.620 67.340 274.960 1%
Västernorrlands 457.225 201.505 658.730 3%
Gävleborgs 738.554 369.390 1.107.944 5%
Uppsala 100.088 36.933 137.021 1%
Stockholms 425.995 232.645 658.640 3%
Södermanlands 86.417 89.255 175.672 1%
Östergötlands 269.262 180.620 449.882 2%
Kalmar 486.438 536.845 1.023.283 5%
Gottlands 259.623 119.475 379.098 2%
Blekinge 713.498 364.565 1.078.063 5%
Kristianstads 501.682 152.495 654.177 3%
Malmöhus 1.209.015 801.390 2.010.405 9%
Hallnds 172.906 357.465 530.371 2%
Göteborgs o. Bohus 3.248.877 8.507.888 11.756.765 55%
Sweden, total 9.276.494 12.166.111 21.442.605 100%
Conclusion
Sweden experienced a major surge in growth rates after 1850. The Bohuslän fisheries were part of this expansive climate, experiencing an average overall growth rate of 6.3 per cent per annum from 1859 to 1914. The growth rates exceeded those of agriculture and were, in fact, comparable to many expanding industries.
Three distinct periods in the development of the Bohuslän longline fishery emerge from the official fisheries statistics: 1859-1877, 1878-1889 and 1890-1914. While the longline sector had a relatively stable workforce during the whole period, this cannot con-ceal the fact that the sector experienced a major decline compared to other fishing sectors in Bohuslän.
190 Sveriges Officiella Statistik: Fiske 1914, p. 30.

98
During the first phase from 1859 to 1877 the industry was expan-sive and generated more than 50 per cent of the total income of the Bohuslän fishing industry.
The predominance held by longline fishery was taken over by herring fisheries after the sudden appearance of huge herring schools in the Bohuslän archipelago in the autumn of 1877. Herring fisheries changed the structure of the industry. The 1880s were a period of rapid relative and absolute decline of the longline sector.
After 1890, the longline sector generated only a minor share of the total income of the Bohuslän fisheries. Offshore herring, mackerel and trawl fisheries grew much more rapidly than longline fisheries.

99
Calculating catch rates
CPUE methodology is important to the comprehensive objective of understanding the dynamics of the fisheries. Ideally, CPUE in longline fisheries should be defined as the catch per number of baited hooks set per given time period, but this is impossible in the case of Sweden which is why a less refined substitute, namely the annual catch per fisherman, is used. While the annual catch per man is far from any modern definitions of CPUE, the feasibility of this defini-tion depends on the questions asked by historians. Firstly, does the annual catch per man give an indication of the successes and failures of the fishermen? Secondly, does the annual catch per man properly reflect changing stock abundances?
The answer to the first question is definitely affirmative. The an-nual catch per man clearly shows the performance of fishermen, re-gardless of changes in fishing technology. Indeed, concerns about catchability changes are irrelevant to an analysis of the successes and failures of the fishery. Therefore, the annual catch per man is a useful proxy of fishermen’s performance in any historical fishery.
The answer to the second question is conditional. It depends on the fishing technology employed and the length of the fishing season. The annual catch per man only reflects changes in stock abundances during periods with stable fishing technology and stable fishing sea-son length. In the Swedish long-line fishery, both technology and length of fishing season did change between 1840 and 1914. This chapter will address these changes and assess their effects on catch rate analysis by first discussing technological changes and subse-quently assess the changes of season length and fishing time.
The years between 1872 and 1886 will get special attention, as very detailed CPUE data are available for this period. The 1872-86 data set is used to calculate historical abundance estimates.
Technological change: Did catching power increase?
The catch rate analysis is based on the underlying assumption that catch rates are linearly related to stock abundance. In technical terms, it is assumed that catchability is constant. Given the length of the

100
period in question in this analysis, 1840-1914, there is no doubt that technological changes did take place. The obvious question is how these technological changes influenced the catching power of the Swedish fishing fleets, and thus catchability.
Figure 9. Longline vessels anchored off Karingön by Jacob Hägg, 1884. 191
The sources There are two main sources for pinpointing technological changes in longline fisheries. The first one is the fisheries inspectors’ annual reports published by the Hushållningssällskap. These reports have the advantage of being close to the events; however, they lack a view on the industry’s long-term development trends. The second source is a series of ethnographic interviews with people from Bohuslän’s coastal communities.
191 Reproduced from Hasslöf 1949, p. 91.

101
The interviews were conducted by a group of etnographers from the 1920s to the 1940s, and they interviewed both fishermen and their families. Some of the fishermen had engaged in demersal fisheries at least from the 1870s and onwards. The collection of interviews started in 1920 as part of the research for Haneson’s and Rencke’s book on Bohuslän fisheries. In 1928, a new series of interviews were initiated by Göteborg’s museum. The purpose of these interviews was to document the coastal population’s lifestyle and work and to collect artefacts and drawings of houses, fishing boats, gear etc.192 One of the ethnographers who took part in this work was Olof Hasslöf, and not surprisingly the interviews and collections made in the course of this work became some of the main sources for Hasslöf’s own books and articles. Today most of the interviews are kept in the museum ar-chives in Göteborg and Uddevalla.
The interviews were transcribed by the ethnographers before be-ing handed over to the museum archives. Obviously, by using Hasslöf’s transcribed interviews, there is a risk of reproducing his interpretations. The most controversial part of Hasslöf’s interpreta-tions is his description of the social structure of the fishing communi-ties as being democratic and egalitarian. However, for the purpose of describing the fundamental fishing technology, this bias is irrelevant. Furthermore, it is possible to validate, at least to some extent, the information from the interviews by means of information from the fisheries inspectors’ annual reports.
Dating the information from the interviews is difficult. At the time of the interviews, the fishermen were often looking forty or fifty years or even longer back in time. Most certainly the interviewees’ information on the time of introduction of new fishing technology will tend to be imprecise, and should be treated as such.
Catchability changes In the 1840s and 1850s, fishing was done from bankskutor and sjöbåtar as described by Holmberg and Ekström. In terms of fishing operations, an important distinction was made between between lig-
192 Hasslöf 1949, p. 17-8.

102
gare and beseglare. When the bankskutor arrived on the fishing grounds, they anchored, and the longlines were set and retrieved from dinghies. These vessels were called liggare, a term which referred to the fact that they anchored during the fishing operations. The sjöbåtar, on the other hand, were called beseglare, because they could keep their sails set during the fishing time, and the longlines could be set from the sjöbåtar without the use of dinghies.193
During the 1850s and 1860s, the bankskutor were gradually re-placed by large, decked sjöbåtar. Being easier to manoeuvre, the sjöbåtar became the core of the Swedish longline fleet until the early 1890s.194 The sjöbåtar could be used to set and retrieve the longlines, thus partly rendering the dinghies superfluous. Nevertheless, some fishing villages preferred to maintain the practice of setting and re-trieving the lines from dinghies.195
For Swedish fisheries, the 1870s and 1880s were a period of technological stability, but significant changes in the fleet took place during the 1890s. Swedish fishermen bought sailing smacks from Britain; the sailing smacks had turned superfluous due to the intro-duction of steam ships in the British fishing fleets. By 1903, 87 sail-ing smacks were employed in the Swedish longline fisheries, and this constituted the majority of the fleet.
To assess changing stock abundances it is important to know the catching power of the old and new vessels. How effective were the new vessels in comparison with old ones? Did they, for example, increase catching power by 20% or 40%? Gerhard von Yhlen, the fisheries inspector, said that the different fishing practices employed by beseglare and liggare did have an impact on the size of the catches.196 Regretfully, von Yhlen did not specifically state to what degree, and he did not compare the catching power of the different vessels, either. This is unfortunate for the long-term estimates of abundance changes in North Sea ling and cod from the 1840s to 1914.
193 Qvartalsskrift juli 1868, p. 58. 194 Ekström, p. 93-4. 195 Hasslöf 1939, p. 14-5; Hjort, p. 222. 196 Qvartalsskrift juli 1868, p. 58.

103
However, this problem is not relevant to the assessment of abundance changes during the period 1872-86, for which very detailed data sets are available. The most important technological changes in the Swed-ish fisheries took place during earlier and later periods.
The type of fishing gear has an important bearing on the overall catching power of a fishing fleet. Accordingly, changes in gear should be carefully examined. In the case of Sweden, longlines re-mained the only important catching technology employed during the whole period. The fishermen distinguished between koljebackor and storbackor. As stated earlier, the former were used to catch bait for the latter.197 For an evaluation of fishing effort in the ling and cod fishery, only the use of storbackor is relevant.
Usually, the storbackor were set during the evening or night and retrieved the following morning or day. In the 1850s and 1860s, set-ting and retrieval of the long-lines were done from dinghies while the fishing vessels were anchored. One fisherman estimated that it could take up to ten hours to retrieve the lines.198 The men who stayed on-board the vessel spent the time baiting hooks for the next set.199 The time spent fishing depended on the season; in summer, the longlines would sometimes stay in the water for no more than three hours, whereas in spring and fall, they could stay in the sea the whole night through.200
While the basic gear was stable during the period 1840-1914, the number of hooks and accordingly the fleets’ catching power may have increased; however, no evidence of such changes are available. In fact, very little information has been preserved regarding the num-ber of hooks employed in fishery. The lack of information on num-bers of hooks is not necessarily to be interpreted as proof that no such increase took place. A gradual increase or, for that matter, a decrease could have taken place without anybody noting it down. Whatever the case, the lack of information on numbers of hooks employed in the
197 GMA 5233:9; GMA 431:1-2. 198 GMA 431:3. 199 GMA 2797:3; GMA 431:3; GMA 5233:5-9; GMA 2064:1; GMA 443:3. 200 GMA 2153:3.

104
fishery adds to the uncertainty of the conclusions drawn from the CPUE data sets.
Conclusion: The impact of technological change on catch rate calcu-lations In conclusion it can be ascertained that fishing technology in the Swedish longline fisheries underwent two significant changes in the period between 1840 and 1914. These changes took place in the 1850-60s and the 1890s and must have increased the catching power of the fleet and thus the catchability. The available sources do not allow any quantitative estimate of the effect of the changes.
The 1870s and 1880s were a period of technological stability. Accordingly, the annual catch per man is a feasible proxy for stock abundances of ling and cod during the 1870s and 1880s. Because catching power and catchability changed, as it did before and after the period, the annual catch per man is not a proper index for changing stock abundances. The Swedish fishermen of the 1890s were defi-nitely more effective than their predecessors had been in the 1850s. Thus, when decadal changes of stock abundances are assessed, the long-term increase of catching power should be taken into considera-tion.
Time budgets: How much time was spent fishing?
As part of the effort standardisation, time budgets for fishing opera-tions need to be calculated. The actual time spent fishing is an impor-tant parameter in the calculation of total fishing effort. As mentioned above, Hilborn and Walters distinguish between different phases of a fishing trip. The time from the vessel leaves port until it returns to port is referred to as total time.201 This is divided into four phases as shown in the equation below:
Total time = Travel time + Search time + Setting time + Handling time
201 Hilborn & Walters, p. 122-5.

105
Only search time and setting time are relevant to the catch rate analy-sis. They reflect the abundance of the stock, and consequently they should form the basis of the estimate of the total fishing effort.
For the Swedish fishing fleets it is impossible to calculate de-tailed time budgets. However, fairly rough indications of the time spent fishing can be inferred from the sources. The fundamental ques-tion to the catch rate analysis is: Did the time spent fishing (search time + setting time) change?
Travelling time The time the vessels spent travelling to and from the fishing grounds should be disregarded in the calculation of fishing effort. The sailing vessels depended on favourable weather, and considerable amounts of time could be spent on trips to and from the grounds. In one instance, referred to by Hasslöf, the fishermen used the dinghy to tow their vessel most of the way from the Skagerrak to Bohuslän. With no wind and catches deteriorating in the hull of the vessel, the fishermen had no other choice.202
The travelling time depended on the location of the home port, the fishing ground and the landing port. The distance to any of the grounds beyond Skagen did not vary very much from the coastal communities in Bohuslän. On the other hand, the location of the land-ing harbour had a significant impact on travelling time. Travelling time from the Jäderen, Storeggen and Shetland grounds to the poten-tial markets in Norway, Great Britain and Sweden differed considera-bly, and it is thus highly relevant to the overall conclusion of this analysis to know where the vessels fishing beyond Skagen landed their catches. The fisheries inspectors’ annual reports provide infor-mation on landing harbours, because between 1872 and 1886 they stated the landing port of each vessel, and after 1886 they stated the landing harbours for each village’s fleet. This data set contains no evidence of any significant time trends. In the reports from the 1890s and 1900s, no British ports are mentioned as landing ports, even though landings definitely did take place there. This means that the
202 Hasslöf 1949, p. 328.

106
data should be treated very carefully. Perhaps the fisheries inspectors did not state Shetland as a landing place because it was so obvious for everybody in the 1890s and 1900s.
To the nineteenth century Swedish fishermen, travelling time was also an important issue. In 1863 Uggla emphasised:
‘... the advantage of the fish market adjacent to the rich fishing bank, in particular the Storeggen off Norway’s north west coast, where the most at-tractive fishery takes place. It saves the time-consuming trips with the catches during the fish-ing season. ...’203
Hence, proximity to the fish market was an important factor and in part explains the rise of the Ålesund fishery in the 1860s. In Ålesund the fishermen collected the same prices for their catches as they did at home.204 Also the Jäderen fishermen started landing fresh fish in Norway in the mid-1860s.205 Von Yhlen estimated that approx. 38 per cent of the total catches were landed in Norway in 1867,206 and also in the 1870s large quantities of fish caught off Jäderen were landed in Norway.207 In 1876 von Yhlen estimated that at least 25 per cent of the total catches were landed in Ålesund or other Norwegian har-bours.208 The fishermen were comparatively flexible as regards their choice of landing harbour. In 1880, von Yhlen reported that some catches from the Jäderen grounds were sold in Norway, but most were landed in Bohuslän.209 In contrast, many catches were landed in Norway the following year.210
203 Handlingar 1863, p. 15. 204 Handlingar 1863, p. 49; Handlingar 1864, p. 107. 205 Handlingar 1865, p. 1; Qvartalsskrift juli 1868, p. 60; Qvartalsskrift juli 1872, p. 46. 206 Qvartalsskrift juli 1868, p. 61. 207 Berättelse 1872, p. 2. 208 Berättelse 1876, p. 2. 209 Berättelse 1880, p. 1. 210 Berättelse 1881, p. 1.

107
The archives of Göteborgs och Bohus Läns AB för Storsjöfiske can also throw light on this question. In the late 1850s and early 1860s, the company wanted to increase the fishing fleet catching power by introducing a system of carriers that could transport fish from the fishing vessels on the grounds to the ports. Hence, fishing vessels could stay longer on the grounds. For the fishing season from March to September 1857, Conrad Bergh, who was involved in estab-lishing the fishing company, estimated that each boat undertook 7 trips, most of which were destined for the Jäderen ground. Around 8 days of each trip were spent fishing. Hence, only 2 out of 6.5 months were actually spent on the fishing grounds. The boats spent the re-maining time going back and forth between the grounds and port.211
Bergh’s description coincided with estimates made by Uggla in his first annual report from 1859. Since curing of the fish only took place ashore, the quality of the fish was very poor. According to Ug-gla, the poor quality was due in part to the spatial expansion in the 1850s, which involved more travelling time. Uggla recommended improvements in the way the fish were handled and commented fa-vourably on the new carrier system that had been introduced by Göteborgs Aktiebolag för Storsjöfiske. The fishing season stretched from March to mid-September, and Uggla commented on the waste of time going to and from the fishing grounds; he estimated that two thirds of the season was wasted on travelling. Uggla also estimated that the average fisherman spent 10-14 days on a trip home from the Jäderen and vice versa. In cases of adverse weather, trips could even take much longer.212
The attempts at establishing a carrier system were unsuccessful, and travelling time remained high. The issue was brought up again in an article printed in Bohuslänsk Fiskeritidsskrift in the mid 1880s. Its author, M. Rubenson, noted that large parts of the fishing season from March to the end of August or early September were wasted due to
211 GLA, A 274, Göteborgs och Bohus Läns AB för Storsjöfiske, ‘Anteckningar om Fisket i Bohuslän samlad av C.B.’ 212 Handlingar 1859, p. 5-6.

108
the long travelling times. According to him, only 25 to 30 days were spent fishing.213
Figure 10 shows the minimum and maximum number of trips un-dertaken per vessel per year from 1890 to 1912. The data are based on information from Malm’s and Andersson’s published reports. The frequency of trips depended on which fishing grounds were visited; the closer to home a vessel was fishing, the more trips it made. One vessel fishing in the Skagerrak could make up to twenty trips per year, whereas the Shetland vessels usually made between two and five. Except for an increase in the minimum number of trips per year to the Skagerrak grounds, no major time trends can be drawn from the figure. The data in Figure 10 can also be compared to information presented in an essay from 1880 by Gerhard von Yhlen. At that time, fisheries were still taking place on the Storeggen ground. The vessels fishing here made only one trip between their home and the grounds per year, since catches were landed in nearby Ålesund. The Jäderen vessels, on the other hand, made four or five trips a year, landing part of their catches in Norway and the rest in Sweden,214 which coincides with the data in Figure 10. Thus, no marked changes in the frequency of trips appear to have taken place from the 1880s to the 1910s. It should be kept in mind, though, that Figure 10 only shows the maxi-mum and the minimum number of trips and not the average, which may have fluctuated from one year to the next.
213 Bohuslänsk Fiskeritidsskrift II, 1885, p. 358. 214 Von Yhlen 1880, p. 39-40.

109
0
5
10
15
20
25
1890 1892 1894 1896 1898 1900 1902 1904 1906 1908 1910 1912
Shetland Lowest Shetland HighestSkagerrak Lowest Skagerrak HighestJäderen Lowest Jäderen Highest
Figure 10. Number of trips per year.215
Setting time The longline fishermen usually brought bivalves to use as bait for the small longlines, the koljebackor. The koljebackor were mainly used to catch haddock, which were cut to pieces and used as bait for the large longlines, the storbackor. The time spent on the koljebackor should be disregarded in the catch rate calculations for the main target species ling and cod. The setting and retrieval of the gear were usu-ally done from dinghies, and the lines were set in the evening and retrieved the following morning.
Regretfully, it is not possible to estimate how much time was de-voted to setting the gear. By assuming that this parameter was stable, the problem can, however, be disregarded. If there were no changes in the setting time, this aspect did not influence the catch rates sig-nificantly.
215 Berättelse 1886-1912/13; Publikationer 1912, IIIA.

110
Handling time The fourth parameter in Hilborn and Walters’ equation is handling time, which refers to onboard handling of the catches. If curing was done on board the vessels, less time was spent on actual catching operations. On-board curing of the fish meant higher fish quality, since deterioration of the catches was stopped. The period stretching from 1840 to 1914 saw a long-term increase in the practice of on-board curing, but this development was by no means linear. Since handling time did change during the period, the total time spent fish-ing must have changed, which in turn must have had an impact on the total fishing effort. This time trend is highly relevant to the standardi-sation of fishing effort; the question is how much it influences the catch rate calculations. Finding an answer to this question requires an examination of the evidence regarding onboard curing practices.
To the people of that time, the issue of handling time vs. setting time was very real. On the one hand, onboard curing took time which the fishermen could have spent fishing instead. On the other hand, the vessels that landed uncured catches had to travel more frequently between their home ports and the fishing grounds in order to prevent catches from deteriorating.216 Uggla, the fisheries inspector, estimated that on balance, on-board curing would leave the fishermen more fishing time, since they did not have to take the long trips between port and the grounds so often.217 Based on this information, however, it is difficult to make an accurate estimate of the time spent fishing. The onboard curing issue was frequently discussed in the fisheries inspectors’ reports, and the inspectors advocated a change of handling practices.
As mentioned above, one of the main goals of Göteborgs och Bo-hus Läns AB för Storsjöfiske was to inspire the fishermen to ensure on-board curing of catches. By 1860, this goal still had not been achieved.218 In 1863, however, Uggla was satisfied that the practice of salting was becoming increasingly common on board longline ves-
216 Handlingar 1863, p. 52. 217 Handlingar 1864, p. 106. 218 Handlingar 1860, p. 47.

111
sels. While 7 vessels had been salting their catches in 1862, the num-ber had increased to 22 the following year. Uggla noted that the fish-ermen were beginning to imitate the two companies’ practices of onboard curing.219 However, the practice of onboard curing was on the decline by the mid-1860s. By that time the two fishing companies that set out to improve the handling practices had failed. Prices paid in the mid 1860s were higher for fish salted ashore than for fish cured on board. The market preferences had not changed in favour of the fish cured on board.220
In the late 1860s, von Yhlen reported that an increasing number of fishermen brought with them salt for onboard curing.221 During the early 1870s, von Yhlen’s annual published reports distinguished be-tween fish cured onboard and fresh landings. Unfortunately, the data set covers a very short period, and no major trends can be deduced from it. In an essay from 1880, von Yhlen said that the vessels fishing on Jutska Refvet did not salt their fish at sea.222 This was confirmed by an article in the journal Bohusläns Fiskeritidsskrift from 1885.223
When Malm took office as fisheries inspector in 1886, the issue reappeared.224 One year Malm advised the fishermen to initiate a sys-tem to reward those fishermen who salted the fish at sea.225 From this proposal it can be inferred that the practice of onboard curing was not common at the time. However, the issue was not discussed in the fisheries inspectors’ reports from the 1890s onwards, which indicates that onboard curing was gradually being accepted by the fishermen and the market. This development is also supported by other evi-dence. Haneson and Rencke reported that it had become common practice by the 1890s. When Haneson and Rencke’s book appeared in
219 Handlingar 1863, p. 15, 46, 48. 220 Handlingar 1864, p. 109; Handlingar 1865, p. 18 & Bil 1, p. 1-2; Qvartalsskrift, juli 1867, p. 13, 46. 221 Qvartalsskrift juli 1869, p. 6-7. 222 Von Yhlen, p. 35. 223 Bohuslänsk Fiskeritidsskrift II, 1885, p. 358. 224 Berättelse 1886-87, p. 5. 225 Berättelse 1888-89, p. 5.

112
1923, the longline fishermen returned to port only with the most re-cent catches uncured. Most of the catches were cured at sea.226 This was also confirmed by the Johan Hjort, a leading Norwegian fisheries biologist, writing about the Swedish longline fisheries in 1905.227
Another source of information on curing practices is the ethno-graphic interviews kept in the archives of Göteborg’s and Bohuslän’s museums. The evidence is difficult to date since the interviewees were looking many years back in time. Accordingly, this information should be treated with care. While gutting took place at sea, a group of interviewees stated that all catches were landed fresh.228 In the event of headwind and high summer temperatures, the fish deterio-rated in the vessels’ hulls and had an unpleasant odour when landed in Bohuslän. At home, women took care of the curing of the fish.229
In conclusion, the long-term trend shows an increase in the on-board curing practices. The development was not a linear one, how-ever. While it was increasingly accepted in the early 1860s, the prac-tice soon declined. As late as in the 1880s, on-board curing was un-common, but as the issue gradually disappeared from the fisheries inspectors’ agendas it may be inferred that the practice had become more common by the turn of the century. The most detailed data set on catch rates covers the period 1872-86 and will be described in more detail in the following chapters. Significantly, there is no indi-cation that a major change in curing practices took place in the 1870s and 1880s. It is fair, therefore, to assume that the handling time was constant during these years.
Length of season An additional parameter in the time budget to be considered is the length of season. An extension of the fishing season would result in an increase of the total fishing effort. On the other hand, there is a
226 Haneson et al., p. 291. 227 Hjort, p. 221. 228 GMA 2797:4; GMA 443:3; GMA 426; GMA 2153:5. 229 GMA 2153:5; GMA 4703.

113
risk of overestimating the fishing effort if a reduced fishing season is not taken into account.
In 1845, Ekström distinguished between two types of longline fisheries – the spring and the winter fisheries. The winter fishery was concentrated in the Bohuslän archipelago, and only the spring fishery is being focused on in this analysis. Despite its name, the spring fish-ery covered both the spring and the summer months. Ekström stated that the fishing season started in March or April, depending on the weather, and ended in September.230
Uggla made no mention of the fishing season, which is indicative of a stable season length during his time in office.
Regretfully, no information on season length is found in von Yhlen’s and Malm’s annual reports for the years between 1872 and 1886, which is the period with the most detailed data set. The lack of information on season length in this period is an indication of stabil-ity. In the following catch rate analysis it is assumed that the season length was generally stable in the years between 1872 and 1886. In his essay from 1880, von Yhlen reported that the longline fishing season stretched from March or April to September.231 This is in agreement with Ekström’s information.
One fishery, the skrejd fishery for cod on the Storeggen ground off Ålesund, had a longer fishing season than other longline fisheries. In order to make it to the ground in February, the fishermen left home earlier than the Jäderen and Skagerrak fishermen. In 1880, von Yhlen estimated that the skrejd fishermen’s seasons were one to two months longer than those of the other longline fishermen.232 When the Swed-ish Ålesund fishermen left this fishery for good in the early 1880s, they postponed their first fishing trip of the year to the spring to the same time as the Skagerrak and Jäderen fishermen.233
In the late 1880s the mackerel sector of the Bohuslän fishing in-dustry expanded. Taking place in the Skagerrak and the North Sea,
230 Ekström, p. 35, 39. 231 Von Yhlen, p. 34. 232 Berättelse 1880, p. 1. 233 Berättelse 1888-89, p. 3.

114
the mackerel fisheries were typically pursued by longline fishermen in the same vessels as they used for longline fisheries. From 1887 this group of longline fishermen reduced the longline season by switching to mackerel fishery in early August and September.234
In conclusion, the most important change was the reduction of the longline season from 1887 onwards, caused by the launch of the mackerel fisheries.
Conclusion: Defining CPUE In the following chapters, CPUE is defined as the annual catch per longline fisherman. One year is defined as a five- or six-month fish-ing season, starting in March and ending in August or early Septem-ber. This definition is subject to a number of uncertainties, as at least two parameters relating to the handling time and the season length changed during the period from 1840 to 1914.
With regard to the handling time, the fishermen gradually started curing catches at sea. This took time which could otherwise have been spent fishing. On the other hand, the fishermen needed to make trips between the grounds and the ports less frequently since catches did not deteriorate quickly after curing. It is impossible to estimate exactly how this development affected the catching power of the in-dividual fishermen. It is certain, however, that the development was not a linear one.
Until the late 1880s, the main fishing season stretched from March to September, with the exception of some Ålesund fishermen who started fishing earlier to take part in the skrejd fishery. In the absence of information on season length for the years between 1872 and 1886, season length is assumed to have been stable on the Skagerrak and Jäderen grounds during this period. The Ålesund skrejd fishery is not included in the historical abundance estimate; consequently, the long fishing season does not influence the abun-dance calculations. From the late 1880s, the longline season was re-
234 GLA, Göteborgs och Bohus Läns Länsstyrelse, Landskansliet, DVb:16, Malm, Femårsberättelse 1886-90. The same conclusion in Femårsberättelse 1891-95; Berättelse 1888-89, p. 2; Berättelse 1892-93, p. 3.

115
duced as the fishermen switched to mackerel fisheries, thus cutting down the effort each fisherman spent in longline fisheries. This hap-pened too late, however, to have any effect on the calculation of his-torical abundances.
Obviously, the above changes should be kept in mind when inter-preting the long-term trends in catch rates. With regard to the more detailed data set for the period 1872-86, it is safe to assume that no significant changes took place. Therefore, the catch rates between 1872 and 1886 are immediately comparable.

116

117
SPATIAL EXPANSION
1859-77
The years around 1860 were important to the Bohuslän longline fish-ery, and not only because official fisheries statistics were collected for the first time. In 1858-59, two fishing companies were established with the intention of improving the handling of catches and introduc-ing innovative fishing strategies. Although both companies had high ambitions, they ultimately failed. More importantly, a fishery was initiated by one of the companies on the remote fishing ground Sto-reggen off Ålesund in Norway in 1861, which marked the beginning of a very expansive period in the history of Bohuslän’s longline fish-eries. The expansion took place in terms of total fishing effort, catch values and spatial radius of the fishery. The spatial shifts reflected important changes in fishing strategies and also a degree of flexibility in the Bohuslän fishing communities. For the historian, the challenge is to explain the changes that took place.
In their theory on fishing fleet dynamics, Hilborn and Walters concluded that four prerequisites needed to be fulfilled before a fish-ery could be initiated on hitherto unexploited grounds. These were: safe technology, cheap capital, fishermen’s courage and a large fish market. Naturally, all four aspects were relevant in the spatial expan-sion of the Swedish fisheries of the 1860s. The driving forces behind the spatial expansion are the topic of this chapter, but it will begin with a description of the sources to this development.

118
Driving forces in the spatial expansion
The sources and the spatial resolution of the analysis
After 1859, the official fisheries statistics allow a detailed analysis of spatial aspects of the fishing fleet dynamics. Ideally, data sets would show where the individual fishing vessels went fishing on a day-to-day basis. Unfortunately, no such data have been preserved for the Bohuslän fisheries. However, the published reports from the Hushållningssällskap still allow a detailed analysis of the spatial shifts within the longline sector. The layout of the reports and the data they contain changed significantly in 1872-73 and 1886. These changes are discussed in the following, as they impose the limitations of the analysis.
1859-71 During the period 1859-71, two fisheries inspectors were appointed. E.J.E. Uggla stayed in office from 1859 to 1866, when Gerhard von Yhlen took his place. Both were well familiar with fisheries issues. Uggla also worked as customs officer, while von Yhlen had worked as a scholar for the Swedish agricultural academy before being em-ployed as a fisheries inspector.235 Uggla’s and von Yhlen’s published reports contain summarised catch and effort data for each fishing village. The basic layout of the data sets included in the annual re-ports is shown in Table 8.
The reports provide numbers of longline vessels and fishermen in each village. The data sets are summarised for each individual fishing community, and therefore, there are no data available for individual fishing vessels. As a result, there is no way of determining the behav-iour of individual vessels based on the sources from this period. The annual reports from the 1860s present the values and species compo-sitions of the catches, but they contain only sparse information as to where the fish were caught.
235 Qvartalsskrift juli 1867, p. 14; Sanne, p. 99-100.

119
Table 8. An example of catch and effort statistics from Qvartalsskrift 1869.
Fishing community Mollösund
Number of vessels Large 7
Small 0
Crew 84
Catches (in numbers) Ling 49,360
Cod 3,650
Tusk 340
etc. …
Catch value (in total) 31,816.50
There are no major differences between Uggla’s and von Yhlen’s
early statistical reports. Nevertheless, von Yhlen’s information on catch compositions was more detailed than that found in Uggla’s reports. Both Uggla and von Yhlen had a separate category for ling catches. Ling was also mentioned first in the list of species, which indicates that economically this species was the most important one. Uggla had combined the cod and tusk catches into one joint category, whereas von Yhlen distinguished between the two. Also, von Yhlen included a separate category for halibut catches, which Uggla ne-glected.
1872-86 In 1872 and 1873 the fisheries statistics were reorganised, and the detail level of the data sets increased significantly. An example of the basic type of data for the period 1872-86 is shown in Table 9. Starting from 1873, the published statistics contain data on the individual ves-sels’ catches and fishing grounds. For each vessel the fisheries statis-tics provide the tonnage and crew size, the catch value and, very im-portantly, information on which fishing grounds were visited. In addi-tion, the reports state the catches of ling, cod, tusk, halibut, haddock and rays as well as the quantities of liver oil and roe extracted from the fish.

120
Table 9. An example of catch and effort statistics from Berättelse 1883.
Fishing community Mollösund
Name of vessel Wilhelm
Tonnage 18.76
Crew 12
Fishing ground Jäderen
Catches (in numbers) Ling 4,480
Cod 510
Tusk 700
Etc. …
Catch value (in total) 5,810
Landing harbour Göteborg
Mollösund
The published report for 1872 is similar to von Yhlen’s earlier re-
ports, and it contains only aggregate data for the fishing villages. However, the primary and more detailed data for 1872 are kept in the archives of Göteborgs och Bohusläns Länsstyrelse in Göteborg. The primary data contain information about each fishing vessel, and they were also assembled by von Yhlen.236 Indeed, there was a high degree of consistency between the published statistics and the primary mate-rial, with regard to the data on both crews and catch values. In most cases, the data were in complete agreement. For only a few fishing villages, the published and the primary material contain minor dis-crepancies, differing approx. 10-20 per cent.237
The fishing companies
Based on Uggla’s first published report from 1859 it is possible to make a quantitative assessment of the state of the demersal fishing industry. In the winter fishery for demersal species, the vessels ven-tured only a few kilometres from the Bohuslän coast. In the spring fishery from March to September, the decked vessels went much 236 Göteborgs och Bohusläns Länsstyrelse, Landskansliet, DVb:12. 237 Poulsen 2005, p. 80-1.

121
further to several fishing grounds in the Kattegat and the Skagerrak, and the largest vessels went to the Jäderen ground, which was located 210-320 kilometres to the northwest of Lindesnäs.238 Compared to the 1840s, the fishery spanned wider. During the 1850s, a spatial expan-sion had brought the fishermen to more productive fishing grounds where the catch rates were higher. On the more distant grounds the attractive demersal species were more abundant than they were closer to home.239
Uggla remarked that the spatial expansion had increased the trav-elling time to and from the fishing grounds, resulting in a poor fish quality. Despite the longer travelling time, no on-board curing took place, not even in the summer.240 Uggla thus reiterated the concerns expressed by Holmberg and Ekström about the lack of on-board salt-ing of the catches.
Despite his criticism of the fishermen’s handling of the catches, Uggla was optimistic about the future of the industry. He attributed his optimism to two newly established fishing companies, Göteborgs Aktiebolag för Storsjöfiske and Göteborgs och Bohus Läns AB för Storsjöfiske.241 The goal of the companies was to improve fish curing practices in Bohuslän. Curing took place on board the companies’ vessels immediately after the fish were caught.
Pioneering higher curing qualities, Göteborgs Aktiebolag för Storsjöfiske wanted to inspire Bohuslän fishermen to similar curing practices. However, the company was unable to raise the expected sum of money. Uggla himself was a board member of the company, and he criticised the fishermen for having an unexpected, irrational behaviour.242 Only two small carriers rather than the planned four large carriers were introduced to transport catches to the fish mar-kets.243 Uggla said:
238 Handlingar 1859, p. 3. 239 Handlingar 1859, p. 4. 240 Handlingar 1859, p. 4. 241 Handlingar 1860, p. 36. 242 Handlingar 1859, p. 5, 38-9. 243 Handlingar 1859, p. 5.

122
‘It is astonishing that sensible people could be so blind to the advantages...’ 244
The company also met with resistance from the curers on shore.245 The market did not reward the company for the high quality of its products, and sometimes the company even had to sell its products at a loss.246 Attempts were also made at selling the products on the Spanish market.247
‘As long as the consumers do not understand to appreciate the product ... no change in regard to rational fishing curing will take place in the Bo-huslän archipelago.’ 248
Both companies were faced with major problems. In 1863 Göte-borgs Aktiebolag för Storsjöfiske was liquidated due to an inadequate Swedish market for high quality fish, and the same thing happened to Göteborg och Bohusläns AB för Storsjöfiske the following year.249 The insufficient demand was also put forward by geographer Lennart Dalén as an explanation of the companies’ failure. Dalén concluded that the companies’ problems originated from the fact that consumer preferences were different from the companies’ products. The con-sumers were simply unfamiliar with the companies’ new products.250
Hasslöf discussed the differences between the fishermen’s and the companies’ handling of the catches. Focusing on the unsuccessful attempts at establishing fishing companies with new curing practices, Hasslöf defended the fishermen by saying that a gradual improvement of the curing had taken place in the nineteenth century. He opposed
244 Handlingar 1859, p. 7. 245 Handlingar 1859, p. 7. 246 Handlingar 1859, p. 9; Handlingar 1861, p. 50; Handlingar 1864, p. 106; Qvartalsskrift juli 1867, p. 47. 247 Handlingar 1860, p. 40-2. 248 Handlingar 1859, p. 13. 249 Handlingar 1863, p. 15; Handlingar 1864, p. 110. 250 Dalén, p. 198-9.

123
the criticism of the fishermen expressed by the fishery inspector.251 Hasslöf’s defence of the fishermen is a clear example of his resent-ment towards any organisation not owned and controlled by the fish-ermen. In Hasslöf’s interpretation, the independent Bohuslän fisher-men were always the ideal. Hasslöf’s preference for the independent fishermen, however, caused him to underestimate the importance of one of the fishing companies. Göteborg och Bohusläns AB för Stors-jöfiske played a significant role in the spatial expansion of the Swed-ish longline fisheries from 1861.
The rise of the Ålesund fishery
In his report for 1861, Uggla stated that two vessels from Göteborgs och Bohusläns AB för Storsjöfiske had visited a new fishing ground holding more abundant fish stocks. Accordingly, they had made good catches. The bank, called Storeggen, was situated between 630 and 640 north, off the Norwegian coast at Ålesund.252 The success of the company vessels inspired longline fishermen from Bohuslän to fol-low their example. Also, the government awarded bounties to fisher-men who sailed to the bank. The size of the bounty that the pioneers received is not mentioned in the annual reports from the Hushållningssällskap, which indicates that the amount was probably not very high.253 Nevertheless, it shows that the Bohuslän fishermen did receive support from sources outside the coastal communities.
In his dissertation from 1949, Hasslöf offered a different interpre-tation of the spatial expansion. He attributed the discovery of the Storeggen bank in 1861 to two fishermen from Klädesholmen, Olof and Anders Berntsson, who had reportedly sailed to the bank by coin-cidence. Hasslöf made no mention of the role of the Göteborg fishing company.254 Hasslöf’s interpretation is at odds with the annual reports made by Uggla, the fisheries inspector. His reports from 1861 and 1863 indicated that the ‘Doggern’ and the ‘Jedderen’ from Göteborgs
251 Hasslöf 1949, p. 356-7. 252 Handlingar 1861, p. 49, 54. 253 Handlingar 1861, p. 55. 254 Hasslöf 1949, p. 69-70.

124
and Bohusläns AB för Storsjöfiske went there first,255 and this is also supported by an article on the Swedish Ålesund fisheries published in the Norwegian journal Norsk Fiskeritidende in 1884. The article stated that the grounds were discovered by the company’s two ves-sels.256 These differences in interpretation are important because they identify different driving forces in the fishery. While Hasslöf attrib-uted the change to the two Klädesholmen fishermen – i.e. representa-tives of the cooperative and democratic Bohuslän fishermen – the interpretation presented here emphasises the role of the fishing com-panies as a catalyst of change.
The Ålesund fishery was an immediate success. Consequently, five new, large vessels were commissioned in 1862 by Bohuslän fish-ermen who wanted to take part in the fishery. Old, smaller vessels were used until the new vessels were delivered.257 Soon some of the Swedish Ålesund fishermen extended their fishing season to take part in the skrejd fishery on Storeggen from February to April. Skrei is the Norwegian word for cod, and this species was also the main target of the fishery. 258 To participate in the fishery, the fishermen had to leave Bohuslän as early as mid-January. When the skrejd fishery ended in April, they focused on the traditional Storeggen-fishery for ling dur-ing the late spring and summer.259
The Ålesund fish market was also an important factor in the spa-tial expansion of the longline fishery. The Swedish Storeggen fisher-men sold the main part of their catches fresh in Ålesund. As a result, most Ålesund vessels made only one annual trip between Bohuslän
255 Handlingar 1861, p. 49, 54; Handlingar 1863, p. 46-7. 256 Norsk Fiskeritidende 1884, p. 96. 257 Handlingar 1863, p. 48. 258 Qvartalsskrift juli 1868, p. 59. 259 Qvartalsskrift juli 1871, p. 40-1; GLA, Göteborgs och Bohus Läns Länsstyrelse, Landskansliet, DVb:16, Malm; DVb:11; DDVb:15; GMA 2150; Norsk Fiskeritidende 1884, p. 96-105; Solhaug, p. 226.
125
and Storeggen,260 and this saved them travelling time between the fishing grounds and the port.261
With respect to the 1860s, it is difficult to compare the income from the Ålesund, Skagerrak and Jäderen fisheries. However, from 1872 onwards it is possible, based on the data sets in the annual Swedish fisheries reports, to calculate the catch value per fisherman for individual fishing grounds. Figure 11 shows the result of these calculations. For vessels focusing solely on Ålesund, the income per fisherman exceeded 600 kr per fisherman in most years prior to 1877. This was a higher income than that obtained by the Skagerrak and Jäderen fishermen. A group of relatively small vessels combined the Skagerrak and Ålesund fisheries, and this group had the highest earn-ings per fisherman. Also, vessels that combined Ålesund and Jäderen fisheries had high incomes. Flexible fishing strategies were more remunerative.
The evaluation of the financial outcome of the fisheries on indi-vidual grounds needs also to take the length of season into account. The Ålesund fishermen had the highest incomes, but they also spent most time in the fishery. The skrejd fishery on Storeggen took place in early February, while the Skagerrak and Jäderen fisheries usually started the fishing season in the spring.
The Ålesund fishermen were supported by the Swedish govern-ment, which sent a steamship to Storeggen from 1865 onwards. The vessel was there to help the fishermen on the fishing grounds. It de-livered supplies to the vessels on the grounds, gave tug assistance and served as a church for the fishermen.262
260 Handlingar 1863, p. 48; Handlingar 1865, p. 18; von Yhlen, p. 39. 261 Qvartalsskrift juli 1868, p. 63. 262 Handlingar 1865, Bil. 1, p. 2.

126
kr 0
kr 200
kr 400
kr 600
kr 800
kr 1.000
kr 1.200
1872 1876 1880 1884 1888 1892 1896 1900 1904 1908 1912
Kr.
/man
ShetlandSkagerrak & JäderenJäderen & ÅlesundSkagerrak & Ålesund
kr 0
kr 200
kr 400
kr 600
kr 800
kr 1.000
kr 1.200
1872 1876 1880 1884 1888 1892 1896 1900 1904 1908 1912
Kr.
/man
KattegatSkagerrakJäderenÅlesund
Figure 11. Catch value per fisherman, by fishing ground, 1872-1912. 263
In 1864 an expedition from Klädesholmen was sent to
Finnmarken in the northernmost part of Norway to develop a new fishery. Heading east, the vessel passed the North Cape, as stock abundances were rumoured to be very high in that area. The vessel’s
263 Berättelse 1867-1912/13; Publikationer 1907-14.

127
trip was subsidised by the Swedish government.264 Probably, the tar-get species was cod, which was fished by Norwegians in this area during most of the nineteenth century.265 In 1867-69, additional at-tempts were made at launching a fishery off Finnmarken in northern Norway.266 However, the Finnmarken fishery was quickly abandoned. Attempts were also made to initiate a fishery off Shetland, although the results of this fishery were disappointing.267 By 1869 the spatial expansion had come to a halt. Of all the new fishing grounds visited during the 1860s, only Storeggen off Ålesund turned out to be of lasting value to the Swedish longline fishermen.
The fundamental question is why the expeditions to northern Norway and Shetland took place at all. Congestion on the fishing grounds, mainly the Storeggen, should be taken into account when attempting an explanation of the spatial expansion. The Bohuslän longline sector was experiencing a general expansion with new fish-ermen entering the fishery in the mid 1860s. In 1868, the fisheries inspector reported that Storeggen was a small fishing ground, and that congestion was becoming a problem on this ground. The minimum distance between the vessels should be 0.25 nautical miles.268 Said the fisheries inspector:
‘It is important to explore new fishing grounds each year, but this is unlikely to happen with the individual fishermen’s initiatives. Often they cannot relocate a ground with high fish abun-dances...’269
The attempts at launching fisheries at these very distant fishing grounds demonstrate that a group of Bohuslän fishermen had the courage and the technical capability to try new avenues for the
264 Handlingar 1864, p. 109. 265 Solhaug, p. 265-73. 266 Qvartalsskrift juli 1867, p. 48; Qvartalsskrift juli 1869, p. 6. 267 Qvartalsskrift juli 1867, p. 13, 48-9. 268 Qvartalsskrift juli 1868, p. 62; See also Vollan, p. 44-5. 269 Qvartalsskrift juli 1868, p. 62.

128
longline fisheries. The success of the Storeggen fishery stimulated further expansion. Also the Finnmark fishery was started with at least some financial assistance from the Swedish government. In terms of catches, the Finnmarken venture seems to have been a success, but in spite of this, it never developed into a permanent fishery for the Swedes. The discontinuation of the Finnmark fisheries demonstrated that the fishermen were not driven by desperation to find new grounds. Even though some fishermen had the courage and technical capability to go to northern Norway or Shetland, the dangers of ex-tending the fishing voyages to these very remote waters could not be denied. In the primary material for the five-year report covering the period 1866-70, it was stated that the large losses that hit the Norwe-gians had caused the Swedes to abandon the fishery.270 Probably problems with the fish market and the dangers of life at sea contrib-uted to the explanation for the discontinuation of fishery at the most distant grounds.
Von Yhlen described the fishery off Shetland as a disappoint-ment, but he did not specifically give any reasons for this failure. Theoretically, low catch rates or an insufficient fish market in Shet-land could explain the lack of success of the Shetland fishery. How-ever, Scotsmen had fished off Shetland with longlines for ling and cod for a long time, and they continued their fishery after the Swedish experiments had ended.271 Obviously, the Scottish fishermen had better local knowledge than the Swedes as well as good connections to the British fish markets.
Some Swedish fishermen found employment on Norwegian ves-sels on the Storeggen bank, and the Norwegians copied the Swedish vessel designs.272 Initially, the Swedish fishermen were more success-ful than the Norwegians, because they were more familiar with this type of fishery.273 In 1868 von Yhlen estimated that the Norwegians
270 GLA, Göteborgs och Bohus Läns Länsstyrelse, Landskansliet, DVb:11. 271 Coull, p. 79-103; Gray, p. 124-45; Nicolson, p. 69-64, 107-11; Annual Reports of the Fisheries Board of Scotland. 272 Handlingar 1865, Bil. 1, p. 3; Qvartalsskrift juli 1868, p. 62. 273 Vollan, 1942, p. 44.

129
employed approximately 100 Swedish fishermen, and the Norwe-gians had bought four Swedish fishing vessels in 1867.274 Gradually, the Norwegians increased their involvement in both the skrejd and the summer fisheries off Ålesund. The Norwegian expansion can be traced in Figure 12 and Figure 13. By the late 1870s, Norwegians dominated the fisheries. The Norwegians had gradually learned the fishing practices from their Swedish colleagues and competitors.275
0
50
100
150
200
250
300
1862 1864 1866 1868 1870 1872 1874 1876 1878 1880 1882
NorwegianSwedish
Figure 12. Swedish and Norwegian crews in the summer fisheries off Ålesund, 1862-83. 276
274 Qvartalsskrift juli 1869, p. 8. 275 Norsk Fiskeritidende 1884, p. 96-103; Se also Solhaug, p. 240-1; Vollan, p. 224-33, 246-66. 276 Norsk Fiskeritidende 1884, p. 103.

130
0
100
200
300
400
500
600
700
800
1873 1875 1876 1877 1878 1879 1880 1881 1882 1883
NorwegianSwedish
Figure 13. Swedish and Norwegian crews in the skrejd fishery, Storeggen, 1873-83. 277
In the fall of 1869, Norway introduced a new fisheries policy
which limited foreign fishermen’s fishing rights off the Norwegian coast. The coastal fishing grounds inside a line drawn from two small islands off Ålesund were reserved for Norwegians. This immediately caused the Swedish fishermen to decide to abandon the Ålesund fish-ery. However, they changed their minds after having been pressured by the fisheries inspector and pursued the fishery outside the Norwe-gian limit. Eventually, the skrejd fishery turned a failure in 1870, and von Yhlen did not expect the fishery to continue. The summer fishery on Storeggen continued, however, and it produced an average result in 1870.278 In the winter of 1871 no Swedes took part in the skrejd fishery, but renewed attempts were made outside the Norwegian fish-
277 Norsk Fiskeritidende 1884, p. 102. 278 Qvartalsskrift juli 1871, p. 40-2; GLA, Göteborgs och Bohus Läns Länsstyrelse, Landskansliet, DVb:11.

131
ing zone from 1872 to 1883. From 1872 to 1877 von Yhlen described it as successful in spite of the new restrictions.279
The skrejd fishery off Ålesund was the most dangerous fishery in which Bohuslän fishermen were involved during the nineteenth cen-tury, as winter storms in the North Atlantic were prevalent. In Febru-ary 1868, five vessels carrying 52 people were lost en route to Sto-reggen. This was a major loss to the fishing communities, and the vessels, having an estimated value of 24,000 Rdr. rmt. were unin-sured. Two Norwegian vessels with Swedish crews were lost the same year.280 An additional four vessels and sixteen men were lost in just one week of 1872.281 The loss of lives reflects the fact that going further afield could be a dangerous and risky business.
Regions and fishing strategies Where did the Ålesund and Jäderen fishermen come from in the 1860s? The fisheries inspector’s annual reports for the years 1862-64 indicated that vessels from Klädesholmen on Tjörn visited the Sto-reggen bank at the time. Vessels from the fishing districts of Sotenäset and Stångenäset also went to Storeggen. Regretfully, the fisheries inspector did not state how many vessels came from each area. There was no mention of Storeggen fisheries from Fishing Dis-tricts 4 and 5 on the island of Orust and its vicinity. Vessels from these districts focused on the Jäderen grounds.282 In the 1860s, small vessels from the Sotenäs and Stångenäs peninsulas fished in the Skagerrak.283
279 Qvartalsskrift juli 1872, p. 47; Berättelse 1872, p. 2; Berättelse 1873, p. 1; Berättelse 1874, p. 2; Qvartalsskrift 1876, IV, p. 207; Berättelse 1876, p. 1; Berättelse 1877, p. 1; Berättelse 1878, p. 1; Berättelse 1879, p. 1; Berättelse 1880, p. 1; Berättelse 1881, p. 1; Berättelse 1882, p. 1; Berättelse 1883, p. 1; Berättelse 1884, p. 1. 280 Qvartalsskrift juli 1869, p. 3-5. 281 Berättelse 1872, p. 1. 282 Handlingar 1863, Tablå öfver Bohus Läns Hafsfiske år 1862, Handlingar 1864, Tablå öfver Bohus Läns Hafsfiske år 1863 & 1864. 283 Qvartalsskrift juli 1871, p. 43; Qvartalsskrift juli 1872, p. 46.

132
The annual reports published between 1859 and 1871 distin-guished between two types of vessels – small and large. Assuming that the large vessels went to the distant grounds, Jäderen and Storeg-gen, and the small vessels went to Skagerrak, it is possible to study the behaviour of the fishermen. Based on Holmberg’s and Ekström’s information from the 1840s, such assumptions are reasonable and are also corroborated by data on vessel sizes from the 1870s onwards; this will be discussed in a later chapter.
In the 1860s, the large vessels were concentrated mainly on the island of Orust and its vicinity. The four communities of Gullholmen, Käringön, Mollösund and Grundsund each had between six and eleven such vessels in the period between 1859 and 1871. Also situ-ated on Orust, Hellevikstrand had four large vessels. The only other fishing community with more than two large vessels was Klädeshol-men on the southern tip of Tjörn. The Klädesholmen fleet fluctuated between four and seven large vessels. Thus, in the 1860s the Orust communities maintained their position as the main area of the distant fisheries, seconded by Klädesholmen. The Orust communities may have focused on the Jäderen grounds, and Klädesholmen mainly on Storeggen.
Catch rates and fleet dynamics
How did catch rates influence the locational choices made by the longline fishermen in the period from the late 1850s to the 1870s? Is there any quantitative evidence to support the hypothesis that spatial expansions were driven by the fishermen’s search for higher catch rates?
There are two main sources on catch rates in this period, namely the archives of the fishing company Göteborgs och Bohus Läns AB för Storsjöfiske and the fisheries inspectors’ annual reports.
As part of the preparations for the setting up of Göteborgs och Bohus Läns AB för Storsjöfiske, studies on catch rates in the longline fisheries were conducted in the second half of the 1850s by Conrad

133
Bergh.284 Bergh reported that two vessels from Orust had been fishing from March 26 to September 15, 1856. In total they had caught 5,170 ling and 4,260 cod.285 Assuming an average crew of ten men for each vessel, the average catch rates were 259 ling and 213 cod per man, respectively.
Bergh also kept data, dating from 1856, from two Käringön fish-ing vessels. The ‘Freden’ had caught 450 ling per man and the ‘Os-kar’ 700 ling per man. Bergh concluded that in general, each 12-man vessel caught 6,000 ling off Jäderen during the summer, or approx. 500 ling per man. The value of the ling catch was 3,600 rdr. rmt., and the additional income from cod, rays and train oil amounted to 1,400 rdr. rmt.286 In other words, 72 per cent of the total income was gener-ated by ling, which indicates that ling was the primary target species.
Finally, Bergh had collected catch data from four vessels from Klädesholmen for the fishing season of 1857. The fishery started in March and ended in September, and the vessels had spent the main period from May to August off Jäderen.287 The vessels had made five or six trips each, spending 8-9 days on the fishing grounds on each trip. Assuming a crew of 10, the catch rates of the four vessels fluctu-ated between 500 and 750 ling per man and 28 and 40 cod per man, respectively.
In conclusion, Bergh’s data sets indicate that annual catches of ca. 500-750 ling per man were common off Jäderen in the late 1850s. This is corroborated by Uggla’s annual fishery reports. Uggla’s an-nual reports provide information on the catches made by the two ves-sels owned by Göteborg’s och Bohusläns AB för Storsjöfiske’s, the ‘Jedderen’ and the ‘Doggern’, between 1859 and 1864. Catch rate
284 GLA, A 274, Göteborgs och Bohus Läns AB för Storsjöfiske, styrelseprotokoll, 8 Juli 1859, paragraf 2. 285 GLA, A 274, Göteborgs och Bohus Läns AB för Storsjöfiske, ‘Anteckningar om Fisket i Bohuslän samlad av C.B.’ 286 GLA, A 274, Göteborgs och Bohus Läns AB för Storsjöfiske, ‘Anteckningar om Fisket i Bohuslän samlad av C.B.’ 287 GLA, A 274, Göteborgs och Bohus Läns AB för Storsjöfiske, ‘Anteckningar om Fisket i Bohuslän samlad av C.B.’

134
data from 1860 are also available for the other company. The data sets are shown in Table 10.
Table 10. CPUE for company-owned vessels, 1859-64.288
Company Year Vessels Crew CPUE: Catch/man
Ling Cod & tusk
Göteborgs AB för Stors-jöfiske 1860 1 12 451 73 Göteborgs och Bohus Läns AB för Storsjöfiske 1859 1 12 511 73 Göteborgs och Bohus Läns AB för Storsjöfiske 1860 2 26 551 Göteborgs och Bohus Läns AB för Storsjöfiske 1861 2 26 681 276 Göteborgs och Bohus Läns AB för Storsjöfiske 1862 2 24 781 318 Göteborgs och Bohus Läns AB för Storsjöfiske 1863 2 24 572 352
Göteborgs och Bohus Läns AB för Storsjöfiske 1864 2 24 547 185
For both companies, ling was the primary target species, with catch rates fluctuating between approx. 500 and 780 ling per man. Cod and tusk were caught less frequently, and the catch rates were approx. 300 fish per man.
In addition to the catches made in 1859 by the vessel of Göte-borgs och Bohus Läns AB för Storsjöfiske, the company’s vessel brought home 17,760 ling and 702 cod, which had been caught by other fishing vessels and transferred to the company vessel at sea. However, Uggla estimated that the fishermen could have caught twice as many fish if they had been more responsive to the com-
288 Handlingar 1859, Tablå öfver Bohusläns Hafsfiske år 1859; Handlingar 1860, Tablå öfver Bohusläns Hafsfiske år 1860; Handlingar 1861, Tablå öfver Bohusläns Hafsfiske år 1861; Handlingar 1863, Tablå öfver Bohusläns Hafsfiske år 1862; Handlingar 1864, Tablå öfver Bohusläns Hafsfiske år 1863 & 1864.

135
pany’s offer to bring home the fish.289 In 1860, four vessels delivered fish to the company. On average they caught and delivered 6,140 fish per boat, of which 93 per cent were ling, and the rest was cod.290 This is an indication that ling rather than cod or tusk was the preferred species. This preference was also evident from Uggla’s wording in his annual report from 1860, in which he stated that the ‘Jedderen’ and ‘Doggern’ had caught 14,321 ling in addition to ‘some cod and tusk.’291 Of the demersal species, haddock was considered less desir-able. This was evident from contracts made between a group of Bo-huslän fishermen and Göteborgs Aktiebolag för Storsjöfiske around 1860. Whereas the fishermen were obliged to deliver their ling and cod catches to the company, the company was not necessarily inter-ested in buying the haddock that they had caught. The contract stated:
’In the case that the company is willing to receive catches of haddock…’292
In 1861, summer fishery off Ålesund was launched by the two vessels owned by Göteborgs och Bohusläns AB för Storsjöfiske. In his annual report for 1861, Uggla described the discovery of the Sto-reggen bank, which had higher fish abundances than the other fishing grounds.293 The question is how much higher the catch rates were. On June 1, 1862, a vessel returned from Storeggen to Ålesund with 9,000 fish with no specification of species. This, according to Uggla, was 25 per cent above the average catch made by similar vessels on the other grounds during a whole season. If it is assumed that the vessel mentioned by Uggla carried 12 men, the average catch rate was 750 fish per man. Accordingly, the average catch rate for a whole season on the other fishing grounds was approx. 560 fish per man. Irrespec-tive of the uncertainties in the numbers, Uggla’s account indicates
289 Handlingar 1859, p. 7. 290 GLA, Göteborgs och Bohus Läns Länsstyrelse, Landskansliet, DVb:9, 20 Mars 1860. 291 Handlingar 1860, p. 46. 292 Handlingar 1860, p. 53. 293 Handlingar 1861, p. 49.

136
that the Storeggen catch rates were higher than catch rates on the other fishing grounds closer to home.
Even though catch rates in the Storeggen fishery were generally high, success was never guaranteed. In 1868 von Yhlen, the new fish-eries inspector, reported that the skrejd fishery off Ålesund in Febru-ary and March had been a disappointment. Nine vessels caught only a total of 26,800 cod plus some tusk.294 Also the summer fishery off Ålesund was dissatisfactory both in terms of catches and fish prices. Von Yhlen described the fishery as ‘unusually poor’. The fish prices paid in Ålesund had fallen by more than 30 per cent, and the crew of fourteen vessels decided to cure the fish on board and bring the catch to Sweden. They abandoned the fishery prematurely, and a fleet of fourteen vessels brought home a mere 9,110 ling, 8,270 tusk and 4,700 cod.295 Assuming a crew of 12 men on each vessel, the catch rates were remarkably low: 131 ling, cod and tusk per man. In 1868, five Swedish vessels and 52 men were lost at sea during the Ålesund fishery. In other words, the costs of low catches were very high in 1868.
Despite low fish prices, the skrejd fishery off Ålesund in Febru-ary and March 1869 was very successful. 11 Swedish vessels partici-pated, and the average catch rate was 1,420 cod per man. The Norwe-gians caught only 500 cod per man with their less advanced fishing technology and open boats.296
In the 1860s, Swedish experimental fisheries were conducted on other fishing grounds further to the north and west, but only few catch data for these ventures have been preserved. In 1867, the ‘Baron Ug-gla’ spent one and a half month fishing for cod in Finnmarken. On that trip each man caught an average of almost 2,000 cod.297 Although it is very difficult to draw substantial inferences based on the catch data of only one vessel, this serves as an indication that low catch
294 Qvartalsskrift juli 1869, p. 5. 295 Qvartalsskrift juli 1869, p. 5-6. 296 Qvartalsskrift juli 1870, p. 11-12; Qvartalsskrift juli 1871, p. 40. 297 Qvartalsskrift juli 1867, p. 48.

137
rates were probably not the reason why the Swedish Finnmarken fishery did not develop.
In 1870 the fishery on Jutska Refvet in the Skagerrak was very successful. Von Yhlen reported that each vessel managed to catch 5-600 ling on a 4-5 day trip.298 Assuming an average crew of eight men who had undertaken twelve trips during the season the catch rates were as high as 750 ling per man. The usual catch rates in the Skager-rak must have been lower.
For the 1870s, more detailed quantitative evidence is available from two sources. The most detailed data set consists of catch records of the individual vessels, published by the fisheries inspectors, von Yhlen and Malm, between 1873 and 1886.299 Additional unpublished material is available for 1872.300 Thus the detailed Swedish data set covers the period 1872-86. The second source, an article published in 1884 in a Norwegian fisheries journal, Norsk Fiskeritidende, contains quantitative information on the Swedish and the Norwegian involve-ment in the skrejd and summer fisheries off Ålesund.301
The main catch rate trends can be seen in Table 11 and Table 12, which are based on the Swedish fisheries inspectors’ annual reports. Table 13, based on the Norwegian source, shows the catch rates in the Swedish and Norwegian fisheries off Ålesund during winter (the skrejd fishery) and summer. In contrast to the Norwegian source, the Swedish fisheries inspectors did not distinguish between the skrejd and the summer fisheries off Ålesund in their statistics. This compli-cates comparisons between Table 11, Table 12 and Table 13. It is also unfortunate that the Norwegian source states the catches in the Åle-sund summer fishery by weight rather than by numbers. Thus, the Norwegian data set is not immediately comparable to the catch rates in numbers that can be derived from the Swedish annual reports.
298 Qvartalsskrift juli 1871, p. 43. 299 Berättelse 1873-1886. 300 GLA, Göteborgs och Bohus Läns Länsstyrelse, Landskansliet, DVb:12, ’Redogörelse för Bohus Läns Bankfiske år 1872 af Gerhard von Yhlen’. 301 Norsk Fiskeritidende 1884, p. 96-105.

138
Table 11. CPUE by fishing ground, ling, 1872-86.302
Skagerrak Skagerrak & Jäderen Jäderen
Jäderen & Ålesund Ålesund
Skagerrak & Ålesund
1872 98 241 515
1873 157 503 711
1874 147 289 529 382
1875 352 362 649 599 537 311
1876 457 428 659 432 769 284
1877 247 470 229 626 216
1878 278 274 539 419 750 209
1879 322 377 564 600 323
1880 289 573 495 267 249
1881 229 438 288 323 388 270
1882 217 297 370 508 200 175
1883 250 278 480 175
1884 236 265 518
1885 204 288 410
1886 220 273 499
302 Berättelse 1873-86; GLA, Göteborgs och Bohus Läns Länsstyrelse, Landskansliet, DVb:12, ’Redogörelse för Bohus Läns Bankfiske år 1872 af Gerhard von Yhlen’.

139
Table 12. CPUE by fishing ground, cod, 1872-86.303
Skagerrak Skagerrak & Jäderen Jäderen
Jäderen & Ålesund Ålesund
Skagerrak & Ålesund
1872 n/a* n/a* 70
1873 n/a* 151 58
1874 n/a* 141 44 182
1875 180 292 60 991 1.000 1.591
1876 241 363 35 878 11 1.421
1877 172 28 1.125 1.548 1.882
1878 202 196 63 232 336 415
1879 306 93 45 1.393 2.084
1880 208 92 138 2.019
1881 198 147 190 19 1.500 1.428
1882 195 115 92 45 1.125 891
1883 257 229 93 875 657
1884 230 203 57
1885 186 107 27
1886 207 90 14 * Data are not available, as parts of the catches were reported in weight.
303 Berättelse 1873-86; GLA, Göteborgs och Bohus Läns Länsstyrelse, Landskansliet, DVb:12, ’Redogörelse för Bohus Läns Bankfiske år 1872 af Gerhard von Yhlen’.

140
Table 13. CPUE in the skrejd and summer fisheries off Ålesund, 1862-83.304
Skrejd fishery Summer fishery
Cod Ling Tusk
Fish per man Kg pr man Kg pr man
Norwegian Swedish Norwegian Swedish Norwegian Swedish
1862 3.373 1.017 910 380
1863 2.218 2.349 526 748
1864 2.522 3.341 303 820
1865 2.711 3.480 289 553
1866
1867
1868
1869 1.907 2.995 211 443
1870
1871 3.707 5.402 253 282
1872 4.501 6.561 334 305
1873 670 1.145 4.614 5.711 487 536
1874 3.743 2.657 724 606
1875 1.008 1.144 4.158 4.179 503 451
1876 697 1.536 3.266 3.995 312 331
1877 858 1.386 3.779 3.298 279 184
1878 327 300 5.521 4.540 400 238
1879 1.639 2.483 6.110 4.934 364 269
1880 1.437 1.698 5.238 4.115 383 411
1881 1.276 1.267 4.885 2.310 492 276
1882 566 565 3.625 1.673 323 146
1883 623 645 4.146 570 602
304 Norsk Fiskeritidende 1884, p. 102-3.

141
On the Skagerrak and Jäderen grounds, ling was the most impor-tant species for the longline fishermen. Table 11 shows that catch rates for ling were significantly higher off Jäderen than in the Skager-rak. Thus, Table 11 provides quantitative evidence of the hypothesis that the expansion of the Jäderen fishery took place due to the high abundance of ling on this ground. The table indicates that ling, rather than cod, was the primary target species in the longline fishery.
With regard to cod, the picture is different. Table 12 shows that catch rates were higher in the Skagerrak than off Jäderen. Interest-ingly, the catch rates for ling exceeded the catch rates for cod signifi-cantly on the Jäderen ground and slightly in the Skagerrak. This is another confirmation that ling was indeed the primary target species of the Bohuslän longline fisheries.
The Swedish data set in Table 11 indicates that in the early 1870s, catch rates for ling were slightly higher in the Ålesund fishery than in the Jäderen fishery. This explains part of the attraction of the Ålesund ground. The statistics contained in the Norwegian article indicate that ling was the primary target species in the summer fishery off Åle-sund. By weight, ling accounted for 73 to 96 per cent of the total catches made between 1862 and 1883.305
The attraction of the skrejd fishery is immediately apparent from Table 12 and Table 13. In the 1870s, catch rates around 1,500 cod per man after just two or three months of fishing were common. Until 1880, the Swedish fishermen had higher catch rates than their Nor-wegian competitors. This is in agreement with information from von Yhlen’s annual reports on Swedish fisheries. In 1872 von Yhlen re-ported that on average each Swedish fisherman caught 1,500 cod during the skrejd fishery season. In 1872, the Swedish catch rates exceeded the Norwegian catches made with open boats significantly. Even more spectacularly, in 1872 von Yhlen reported that eight fish-ermen could catch 6,000 cod in just three days. In addition, high fish prices were paid in Norway. Fishing on the Storeggen bank was the
305 Norsk Fiskeritidende 1884, p. 103.

142
most costly fishery, but to von Yhlen and the Bohuslän fishermen there was no doubt that it was also the most profitable.306
The catches in the Ålesund skrejd fishery significantly exceeded the catch rates for cod made in the Skagerrak and off Jäderen; this is evident from Table 12. The high catch rates were a major attraction in this dangerous fishery. The high catch rates were partly attributable to the fact that travelling time was shorter to the Ålesund fisheries than to the Skagerrak and Jäderen fisheries. With only a short distance between the grounds and Ålesund, more time could be spent fishing. An explanation of the attraction of the Ålesund fishery should thus include the high catch rates, the proximity to the fish market and the very attractive fish prices.
Conclusion
The years from 1861 to 1877 were an expansive period in the history of the Swedish longline fisheries. Hilborn and Walters’ model of the development of new fisheries lists capital, technology, market and courage as prerequisites for the development of new fisheries. All four prerequisites were met in the Swedish fisheries.
During the 1860s, new fisheries were initiated on an entire series of fishing grounds – from Finnmarken in northern Norway to Shet-land in the west. Only the Storeggen ground off Ålesund proved suc-cessful in the long term, however. Storeggen was close to the fish market in Ålesund, and the fishermen did not have to go back and forth between the grounds and Bohuslän during the fishing season, which saved them a lot of travelling time. The income made from the Storeggen fishery exceeded those from the Skagerrak and Jäderen fisheries significantly.
The spatial expansion was initiated by a fishing company, Göte-borg och Bohusläns AB för Storsjöfiske, and the Bohuslän longline fishermen emulated the company’s fishing strategy in spatial terms. Even though this company was liquidated in the early 1860s, it served as a catalyst to the expansion of the longline fishery.
306 Berättelse 1872, p. 2, 4.

143
High catch rates on the distant grounds, Jäderen and Storeggen, pulled some of the most intrepid fishermen further away from home. The catch rate data sets indicate that ling was the main target species for most of the longline fishermen. In particular, catch rates for ling were high on the Jäderen ground and in the summer fisheries off Åle-sund. Catch rates were significantly lower for cod than for ling on the Jäderen ground. In the Skagerrak, catch rates for ling exceeded the catch rates for cod slightly. This lends quantitative evidence to the hypothesis that the spatial expansion of the fishery to the Jäderen and Ålesund grounds took place due to high ling abundances on these grounds. Cod was only highly important in the skrejd fishery off Åle-sund. Cod catch rates in this fishery were very high in the 1870s and partly explain the attraction of the Ålesund fishery.
The Swedish fishermen were not driven by desperation to find new grounds. For instance, they abandoned the Finnmarken fishery in spite of high catch rates. Thus, in the 1860s and 1870s the Swedes had not reached a situation of overdevelopment and overexploitation, as described in Hilborn and Walters’ theory of fisheries development.

144
Target species
Part of Hilborn and Walters’ theory of fisheries development ad-dressed the question of fish markets. The presence of a large fish market was a precondition for the development of new fisheries. Al-though the demand for fish is obviously a driving force in the devel-opment of any fishery, it is not clear exactly how the nineteenth cen-tury fish markets affected the dynamics of the Bohuslän longline fisheries. They were multispecies fisheries, catching ling, cod, tusk, haddock, halibut and rays. Anecdotal evidence from the 1840s to the 1860s, as well as catch rate data from the 1870s and 1880s, indicates that ling may have been the main target of longline fishery. This con-clusion is examined in more detail in this chapter, which will also throw light on which species determined the economic result of the fishery.
Before examining the issue of target species it is relevant to ask whether the fishermen could properly distinguish between the species caught. The species pursued by the longline fishermen did not resem-ble each other, despite the fact that many of them belonged to the gadoid family. Ling is characterised by having two dorsal fins, of which the second is elongated, whereas tusk only has one dorsal fin. Haddock has a large dark blotch above the pectoral fin just below the lateral line, which sets it apart from cod. In conclusion, it seems unlikely that fishermen could not properly distinguish the species.
Interestingly, the fishermen did not report catches of blue ling (Molva dypterygia), which has approximately the same depth range as ling. Blue ling resembles ling, and it can be difficult to distinguish between the two species. Today, ling catches from the North Sea and North Atlantic are significantly higher than those of blue ling, how-ever. For instance, blue ling catches from the Skagerrak and North Sea amounted to approx. 100 tonnes in 2004, whereas ling catches were approximately 6,500 tonnes.307 Furthermore, in the 1980s and 1990s, Norwegian ling catches were about 20 times higher than Nor- 307 ICES 2006, p. 142, 163-164.

145
wegian blue ling catches.308 Because of the likeness between the two species, some of the nineteenth century ling catches may have in-cluded some blue ling. However, the historical data sets most cer-tainly only contain a small proportion of blue ling. Nineteenth century scientists unanimously reported that ling was the important and most abundant deep water species. In 1877, scientist AW Malm reported that ’the fishermen do not know this species [blue ling].’ In 1892, a group of Swedish scientists, F A Smitt, B Fries, C U Ekström and C Sundevall, said that ‘ling is among Scandinavia’s most important species…’309 They said that blue ling: ’…lives only at great depths – most commonly between 100 and 300 famnar – and is common only north of Bergen …’310 According to the group of Swedish scientists it was very rarely caught off Bohuslän. In 1890, the Danish scientist C G Joh. Petersen said that blue ling ’... were taken only a few times in the Skagerrak and northern Kattegat…’311 Together with a Norwegian colleague, Johan Hjort, Petersen published a book on the results of international fishing research in 1905. The research had been carried out during the summer, and it showed that ling was the most impor-tant species in economic terms in the vast area: ”…between Spitzber-gen and Island and the Norwegian Trench”. In economic importance it was followed by tusk. The research had been conducted at depths from 200 metres to 600 metres, and the scientists had learned that the main part of the catches made during the summer consisted of ling.312 In other words, blue ling was not nearly as important to the fisher-men, nor as abundant as ling.
An ecology report dating from the nineteenth century also offers some relevant information on this subject. In 1877, August Wilhelm Malm, a scientist, published a book on the ecology of Bohuslän that included a 274-page catalogue of the fishes caught by Bohuslän fish-ermen. While cod was one of Bohuslän’s most common fish, being
308 Bergstad, p. 13. 309 Smitt, p. 529. 310 Smitt, p. 524. 311 Petersen, p. 132. 312 Hjort et al., p. 9.

146
caught both at sea and in the archipelago, ling was rare in the coastal area; only small ling were caught in shallow waters. The large ling catches were made beyond Skagen, mainly off Jäderen.313 According to Malm, tusk was very uncommon in the Bohuslän archipelago in the 1870s, and it was caught only at depths below 50 metres.314 Had-dock, on the other hand, was most common at depths between 35 and 45 metres, and it was the target species of the winter longline fishery in the Kattegat.315
On the occasion of an international fisheries exhibition held in Berlin in 1880, von Yhlen published a German essay on the history and the state of the Bohuslän fishing industry. He concluded that ling was priced higher than cod, since the latter was usually smaller.316 Nevertheless, more quantitative data is required to reach a firm con-clusion as to the economic importance of the ling catches. Actually, von Yhlen himself produced this type of material from 1873 to 1886 in his annual reports on the Bohuslän fishing industry.
For each of the years from 1873 to 1886, the fisheries inspector’s annual reports stated the individual vessels’ catches by species and total catch values. No information is available on the income from individual species. The basic structure of the data set is evidenced by Table 9 on page 120. The published data set from 1873-86 is very useful in determining which species generated the bulk of the fisher-men’s income. The target species can be identified through a correla-tion analysis in which correlations between total catch values and the number of each fish species caught are examined. No or very weak correlations between total catch values and the catch of a particular species indicate that this particular species was unimportant in gener-ating income for the fishermen. By searching for significant correla-tions it is possible to identify the economically important species.
313 Malm, A.W., vol. 2, p. 480, 491-2. 314 Malm, A.W., vol. 2, p. 499. 315 Malm, A.W., vol. 2, p. 481-2. 316 Von Yhlen, p. 33.

147
Figure 14. Drawings of ling, blue ling, cod, haddock, tusk, halibut and rays. 317
Ling (Molva molva)
Blue Ling (Molva dypterygia)
Cod (Gadus morhua)
317 Smitt, Taflor.

148
Haddock (Melanogrammus aeglefinus)
Tusk (Brosme brosme)
Halibut (Hippoglossus hippoglossus)

149
Ray (Dipturus batis)
R2 = 0,9616R2 = 0,8229
kr 0
kr 2.000
kr 4.000
kr 6.000
kr 8.000
kr 10.000
kr 12.000
kr 14.000
0 2.000 4.000 6.000 8.000 10.000 12.000 14.000
Ling catches (number of fish)
Val
ue o
f tot
al c
atch
es
JäderenSkagerrak & JäderenLinear (Jäderen)Linear (Skagerrak & Jäderen)
Figure 15.Linear regression relationships showing the dependence of total catch values on ling catches for two fishing grounds, 1873. Each dot represents data from a fishing vessel.318 318 Berättelse 1873.

150
R2 = 0,3841
0
1.000
2.000
3.000
4.000
5.000
6.000
7.000
8.000
9.000
0 500 1.000 1.500 2.000 2.500 3.000 3.500 4.000 4.500Cod catches
Val
ue o
f tot
al c
atch
es
JäderenSkagerrakSkagerrak & JäderenLinear (Skagerrak)
Figure 16. Scatter plot for cod catches and total catch values, 1886. Each dot represents data from a fishing vessel. 319
The scatter plots provide a graphic representation of this analysis.
The plots distinguish between the fishing grounds, as each ground is marked with a particular symbol.
For the vast majority of fishing vessels operating between 1873 and 1886, ling catches and total catch values were closely correlated. When ling catches were high, the income was also high and vice versa. The output of the correlation analysis for ling and cod are shown in Table 14 and Table 15, respectively. Ling and cod produced the highest correlations. In most years, the R2 for ling – a measure-ment of correlation – was 0.85 or higher, indicating that on the Skagerrak and Jäderen grounds ling catches constituted the main eco-nomic result of the fishery. The correlation was strongest for the Jäderen grounds. For the other species, no or only very weak correla-tions were observed.
319 Berättelse 1886.

151
kr 0
kr 1.000
kr 2.000
kr 3.000
kr 4.000
kr 5.000
kr 6.000
kr 7.000
kr 8.000
kr 9.000
0 200 400 600 800 1.000 1.200
Ray catches (number of fish)
Val
ue o
f tot
al c
atch
es
JäderenSkagerrakSkagerrak & Jäderen
Figure 17. Scatter plot for ray catches and total catch values, 1886. Each dot represents data from a fishing vessel. 320
There were two important exceptions to the above conclusion.
For some years there was a relatively strong correlation in the Skager-rak fisheries between cod catches and total catch values. In other words, cod was an important species for this fishery. Another inter-esting fact is that there was a very strong correlation between cod catches and total catch values for vessels fishing both in the Skager-rak and off Ålesund. In 1875, the R2 was as high as 0.86 and in the following years it was even higher or only slightly lower. This sets the flexible fishermen engaged both in fisheries off Ålesund and in the Skagerrak apart from other fishermen. The flexible fishermen engaged in the Ålesund skrejd fishery, and cod was their target spe-cies.
320 Berättelse 1886.

152
Table 14. Correlation between ling catches and total catch values, by fishing ground, 1872-86.321
Skagerrak Skagerrak &
Jäderen Jäderen Skagerrak &
Ålesund Jäderen & Ålesund Ålesund
1872 0,90
1873 0,82 0,96
1874 0,94 0,88 0,99
1875 0,93 0,80 0,97 0,48
1876 0,95 0,66 0,96 0,39 0,32
1877 0,85 0,89 0,20 0,94 0,15
1878 0,90 0,35 0,86 0,80 0,43
1879 0,41 0,86 0,71 0,75
1880 0,48 0,36 0,21
1881 0,80 0,30 0,47 0,99
1882 0,29 0,62 0,56 0,01
1883 0,21 0,00 0,78 0,64
1884 0,49 0,03 0,15
1885 0,79 0,82 0,70
1886 0,60 0,80 0,83
321 Berättelse 1872-86/87.

153
Table 15. Correlation between cod catches and total catch values, by fishing ground, 1872-86. 322
Skagerrak Skagerrak &
Jäderen Jäderen Skagerrak &
Ålesund Jäderen & Ålesund Ålesund
1872 0,03 0,49 0,18
1873 0,36 0,02 0,07
1874 0,21 0,23 0,01
1875 0,01 0,57 0,03 0,86
1876 0,77 0,57 0,24 0,89
1877 0,60 0,35 0,82 0,10
1878 0,08 0,36 0,02 0,65 0,32 0,00
1879 0,51 0,38 0,00 0,92 0,07
1880 0,58 0,28 0,37
1881 0,44 0,58 0,04 0,01
1882 0,29 0,06 0,06
1883 0,56 0,46 0,01 0,46
1884 0,47 0,37 0,05
1885 0,37 0,01 0,26
1886 0,38 0,01 0,07
322 Berättelse 1872-86/87.

154
In conclusion, ling was the most important species to most Bo-huslän longline fishermen; particularly for the Jäderen fishermen, ling catches were crucial. Cod had some importance to the Skagerrak fish-ermen, but it was highly important for the fishermen taking part in the winter skrejd fishery off Ålesund. The other species were mainly by-catch and did not determine the economic result of any of the fisher-ies.
The Swedish fish market
Except for the Ålesund vessels, most vessels landed their catches in their home villages in Bohuslän or in Göteborg during the 1870s and 1880s. From von Yhlen’s published reports it is evident that Sweden was the most important market for the majority of the longline fishing fleet at the time. The question is how demand and fish prices devel-oped during the crucial years in the 1870s and 1880s. What were the market’s preferences for fresh and cured fish? And did consumer preferences change?
According to von Yhlen, kabeljau and spillånga were the main longline fishery products. Kabeljau was salted cod. After being salted, the cod was pressed and dried. Spillånga, on the other hand, was dried ling.323 The Landskansli archives in Göteborg keeps data on the fish quantities sold and prices attained in the markets of the two largest towns in the area, Göteborg and Uddevalla. The data sets cover the periods 1880-86 and 1883-92, respectively. The data were collected monthly by the police in Göteborg and Uddevalla. Similar data for 1879 were presented in von Yhlen’s German essay,324 which means that the time series for Göteborg covers the period 1879-86.
For the period 1883-86, the time series for the two fish markets overlap and correspond well. Figure 18 and Figure 19 show the data sets for fresh and cured fish, respectively. Roughly speaking, the prices attained in the two markets were the same, except for fresh ling, which was valued lower in Uddevalla than Göteborg.
323 Von Yhlen, p. 38-9. 324 Von Yhlen, Appendix ‘Zufuhr zur Fisch-Halle in Gothenburg im Jahre 1879’.

155
kr 0
kr 5
kr 10
kr 15
kr 20
kr 25
kr 30
kr 35
kr 40
kr 45
jan-
80
jan-
81
jan-
82
jan-
83
jan-
84
jan-
85
jan-
86
jan-
87
jan-
88
jan-
89
jan-
90
jan-
91
jan-
92
Kr
per
tjog
/ Kr
per
ctr.
Ling (Gbg, tjog) Haddock (Gbg, ctr)
Ling (Uddevalla, tjog) Haddock (Uddevalla, ctr)
kr 0
kr 5
kr 10
kr 15
kr 20
kr 25
kr 30
kr 35
kr 40
kr 45
jan-
80
jan-
81
jan-
82
jan-
83
jan-
84
jan-
85
jan-
86
jan-
87
jan-
88
jan-
89
jan-
90
jan-
91
jan-
92
Kr
per
tjog
/ Kr
per
ctr.
Cod (Gbg, ctr)
Cod (Uddevalla, ctr)
Figure 18. Market price of cured fish, Uddevalla & Göteborg, 1880-92. 325
325 GLA, Göteborgs och Bohus Läns Landskansli, EVI:13-19, ’Rapport angående medelpriset för de särskilda saltsjöfisk, som blivit till försäljning torgförda..’ & ’Rapport från Uddevalla stad öfver Fisk-tillförseln’; von Yhlen.

156
0
5
10
15
20
25
30
jan-79
jan-80
jan-81
jan-82
jan-83
jan-84
jan-85
jan-86
jan-87
jan-88
jan-89
jan-90
jan-91
jan-92
Kr
per
20 fi
sh
Cod (Uddevalla, fresh)Ling (Uddevalla, fresh)Cod (Gbg, fresh)Ling (Gbg, fresh)
0
5
10
15
20
25
30
jan-79
jan-80
jan-81
jan-82
jan-83
jan-84
jan-85
jan-86
jan-87
jan-88
jan-89
jan-90
jan-91
jan-92
Kr
per
20 fi
sh
Haddock (Uddevalla, fresh)
Haddock (Gbg, fresh)
Figure 19. Market price of fresh fish, Uddevalla & Göteborg, 1879-92. 326
326 GLA, Göteborgs och Bohus Läns Landskansli, EVI:13-19, ’Rapport angående medelpriset för de särskilda saltsjöfisk, som blivit till försäljning torgförda..’ & ’Rapport från Uddevalla stad öfver Fisk-tillförseln’; von Yhlen.
157
The monthly reports from the two fish markets reflected the sea-sonality in the fisheries. Sales of cured fish peaked in the autumn from August to October, at the time when the longline fisheries ended. Sales of fresh fish, on the other hand, peaked in May, before the summer heat set in. Sales of fresh haddock and cod had a second, smaller peak in November, when the winter longline fisheries were initiated in the Kattegat area.
Usually, between 90,000 and 130,000 ling were sold at the Göte-borg fish market every year. In 1880, the number was exceptionally high at 297,000 fish; this could be due to a change of landing prac-tices among the Ålesund fishermen. Until the late 1870s, most catches made on the Ålesund ground were landed in Ålesund. How-ever, as Norwegian fish prices fell in the late 1870s, the fishermen became increasingly inclined to land fish caught on the Storeggen ground in Swedish harbours. Ling was mainly sold cured; in the pe-riod between 1879 and 1892, only between two and 16 per cent of the total ling sold were fresh when they reached the two fish markets.
Fresh cod and haddock were far more common. In fact, between 290,000 and 470,000 fresh cod were sold at the Göteborg fish market every year. Most of the fresh cod and haddock were landed by Fish-ing District 1 fishermen, who had caught the fish on their short trips in the Kattegat. The cured catches, on the other hand, came from Fishing Districts 2-7 and the fisheries beyond Skagen. Unfortunately, the cured cod catches were registered by weight, and they are thus not immediately comparable to the catches of fresh fish. The total weight of the cured cod sold at the Göteborg market fluctuated between 543 and 1,114 tonnes. Assuming that each cured cod weighed 5 kg, this equalled at least 100,000 fish. This estimate is obviously very rough but also very conservative.327
The market in Uddevalla was smaller than the one in Göteborg, selling only between 16,000 and 43,000 ling (cured and fresh) and between 32,000 and 75,000 fresh cod. In terms of numbers, haddock sales far exceeded sales of ling and cod in both fish markets. In Göte-
327 The assumed average weight of 5 kg is based on evidence, which will be dis-cussed in a later chapter on average fish sizes.

158
borg, often more than 2,000,000 fresh haddock were sold per annum in addition to approx. 100 or 200 tonnes cured fish.
The prices of the individual species can be compared for the two time series. With regard to fresh fish, ling was valued much higher than cod and haddock. Fresh ling obtained prices four times higher than fresh cod and between ten and fifteen times higher than haddock. In Uddevalla ling was valued slightly lower, as can be seen from Figure 19. Significantly, there was no time trend in the two figures, which indicates that no major shifts in consumer preferences took place during the period 1879-92.
Conclusion
The Bohuslän longline fisheries were a multispecies fishery, but ling was the main target species. Ling was particularly crucial to the Jäderen fishermen, but also highly important in the Skagerrak fisher-ies. Cod played a secondary role, except for the skrejd fishery off Ålesund in February and March, where it was the main target species.
In the fish markets in Göteborg and Uddevalla, ling was priced higher than cod and haddock, which also reflected the great impor-tance of ling to the longline fishermen.

159
DECLINE AND SPATIAL
CONTRACTION 1878-90
After 69 years of absence, herring reappeared in great abundance on the Bohuslän coast in the autumn of 1877. It took some time for the coastal population to adapt to the ecological change, but a large, coastal herring fishery was launched in the early 1880s. Herring is a schooling fish, and it was caught in seines as well as drift nets and set gill nets. In the late nineteenth century, herring was mainly sold fresh or used for guano and fish oil production, while salting took place only on a small scale. At the height of the fishery, more than 2.4 mil-lion hectolitres of herring were caught, of a value of more than 2.3 million kr. In the early 1890s, the fishery accounted for more than 60 per cent of the total income from Bohuslän’s fishing industry, and it employed thousands of men in the catching and processing sectors. Fishing for herring was conducted in the autumn and early winter. Initially, the fishery was concentrated in the northern parts of Bo-huslän, but it gradually expanded southwards to the Sotenäs peninsula and the vicinity of Marstrand.328 The period from the early 1880s to the turn of the century was thus dominated by herring fishery.
As opposed to the herring fisheries, the longline sector experi-enced a period of relative and absolute decline in the 1880s. In the mid 1870s, the longline catches accounted for approx. 50 per cent of the total income of the Bohuslän fisheries. Only 15 years later, this share had decreased to approximately 15 per cent. The total fishing effort in the longline fisheries also decreased, and Swedish fishery on the most distant grounds off Ålesund was discontinued.
328 Dalén, p. 211-38; Hasslöf 1949, p. 110-218; Nilsson 1963, p. 281-317; Berättelse 1877-1900.

160
Herring fisheries were conducted during the autumn and did not coincide directly with the main fishing season of the longline fisher-ies. Nevertheless, herring fishery affected the longline sector in two significant ways: Firstly by changing the structure of the fish markets and thus the profitability of the longline sector, and secondly, the herring fishery took manpower from the longline fisheries. This raises the question of the fishermen’s ecological flexibility. How did the fishermen respond to the structural changes of the fishery, and how easily did they switch fishing strategy and target species? What were their motives for doing so, and what were the economic implications?
The decline of the Ålesund fishery
For many years, the skrejd and summer fisheries on Storeggen off Ålesund were the most dangerous and admired fisheries in Sweden. The Storeggen skrejd fishery took place in February and March, while the summer fishery started in April or early May and lasted to the early autumn.329 This chapter examines the ultimate causes of its decline after 1880.
Historians of the Bohuslän fisheries have focused on these fisher-ies due to their economic success in the 1860s and early 1870s, and due to their distant location more than 800 kilometres from Bo-huslän.330 It is important to remember, however, that the Ålesund fishery accounted for only about one third of the total workforce in the Swedish longline sector in its heydays. It peaked in 1878, when more than 480 fishermen spent the whole or part of the season off Ålesund. The fishery started to decline both in relative and absolute terms in 1879. Gradually, it became common to combine fisheries off Ålesund with fisheries in the Skagerrak and off Jäderen. This indi-cates that the Swedish fishermen cut short the fishing season on the Ålesund grounds in the early 1880s. By 1884, the Ålesund fisheries
329 Qvartalsskrift juli 1868, p. 59; GLA, Göteborgs och Bohus Läns Länsstyrelse, Landskansliet , DVb:16, Malm; DVb:11; DVb:15. 330 Dalén, p. 199-202; Hasslöf 1949, p. 69-74.

161
were discontinued, and not until 1899 did a Swedish ship briefly visit the Ålesund grounds.331
0%
20%
40%
60%
80%
100%
1872 1873 1874 1875 1876 1877 1878 1879 1880 1881 1882 1883 1884 1885 1886
OtherÅlesundSkagerrak & ÅlesundJäderen & ÅlesundJäderenSkagerrak & JäderenSkagerrak
Figure 20. Relative distribution of fishermen by fishing ground, 1872-86. 332
The changes in the Ålesund fishery were also evident in the man-
ning of the vessels. The optimal vessel and crew sizes differed for the individual fishing grounds, and choosing the right crew size involved balancing two aspects: safety and income. The average crew size is interesting because it reflects the fishermen’s expectations from the fishery. By reducing a vessel’s crew by one person, each man would probably increase his income, but it involved a greater danger to life at sea, as a reduction of this kind meant that each man would have to work harder. Based on data from the fisheries inspectors’ annual re-ports, Figure 21 shows the average crew sizes for vessels fishing on the different fishing grounds.
331 Berättelse 1899, Tab. 1. 332 Berättelse 1872-86.

162
0
2
4
6
8
10
12
14
16
1872 1876 1880 1884 1888 1892 1896 1900 1904 1908 1912
Men
/ves
sel
KattegatSkagerrakJäderenÅlesundShetland
0
2
4
6
8
10
12
14
16
1872 1876 1880 1884 1888 1892 1896 1900 1904 1908 1912
Men
/ves
sel
Skagerrak & JäderenJäderen & ÅlesundSkagerrak & Ålesund
Figure 21. Average crew sizes by fishing ground. 333
It is evident that the vessels fishing on the individual fishing
grounds were distinctly different with regard to average crew sizes. Unsurprisingly, the vessels that ventured furthest from home had the largest crews. On most fishing grounds the average crew size was remarkably stable for long periods. However, it declined sharply on
333 Berättelse 1872-1912/13; Publikationer 1907-14.

163
the small group of vessels that spent the whole season off Ålesund. In an attempt to counter the unfavourable conditions for the Ålesund fishery, the fishermen made an effort to lower the overall costs and attempted to improve the economy of the fishery by reducing the average crew size. The vessel ‘James Dickson’ from Åstol is a case in point. In 1872, it had a crew of 15, which was reduced to 13 when the ship ventured to Ålesund in the latter half of the 1870s. In the light of the major loss of life that had taken place at sea during the Ålesund fishery in 1868, such a reduction is remarkable. By reducing the crews, the danger to life at sea increased. In fact, this reduction in average crew size in the Ålesund fishery was unprecedented in the history of longline fishery. Between 1872 and 1912, no other fisheries experienced such a rapid decline of average crew sizes. Nevertheless, the rationalisations in the Ålesund fishery were unsuccessful, and the Swedes finally abandoned the fishery in 1884.
In the 1870s and early 1880s, a group of fishermen combined Ålesund and Skagerrak fisheries, spending part of the season on each ground. These were the risk takers. Their vessels were the same size as the small vessels that fished only in the Skagerrak. In addition, their crews were significantly smaller than those of the traditional Ålesund vessels, which spent the whole season off Ålesund. Gener-ally, the risk takers were successful, generating the highest income per man. In the mid-1870s, their income was often 66 % higher than those earned by the other fishermen.334 The high income was proba-bly partly attributable to a longer fishing season. Most likely the risk takers took part in the skrejd fishery in February and March off Åle-sund before joining the Skagerrak fisheries later in the season.
Economic explanations for the decline of the Ålesund fishery
The skrejd fishery for cod off Ålesund was a risky business for the fishermen. It failed completely in 1878 due to bad weather and did not even cover the living expenses for many fishermen.335 Neverthe-less, the fishermen returned to Ålesund in 1879, which turned out to
334 See Figure 11, p. 126. 335 Berättelse 1878, p. 1.

164
be a more successful season.336 Thus, one disappointing year did not scare the fishermen. The fishermen’s behaviour indicates that the ultimate decline of the Swedish Ålesund fishery in the early 1880s had structural causes; they did not give up the fishery just because of one disappointing season.
To explain the decline it is necessary to look into both economic and ecological issues. So far, historians of the Bohuslän fisheries have examined only economic aspects. Dalén and Hasslöf stressed increased Norwegian competition and the attraction of the herring fishery closer to home as the main reasons why the Swedes aban-doned Ålesund.337 Odd Vollan, a Norwegian fisheries historian, also attributed the development to economic changes, noting that the aver-age income of Norwegian fishermen developed more favourably than that of Swedish fishermen at the time. This made the Swedes with-draw from the fishery.338 Trygve Solhaug, another Norwegian histo-rian, also explained the decline of the Swedish Ålesund fishery with reference to the competition from the Norwegians.339
Indeed, economy was highly important to the fishermen. Tradi-tionally, the fishermen’s average income increased with the distance from Bohuslän. The further away the fishermen went, the more they earned.340 Thus, long voyages were generally rewarding. In the 1870s, the most profitable fishermen combined fisheries off Ålesund, Jäderen and in the Skagerrak. The fishermen who focused solely on Ålesund also had higher incomes than the average fisherman.
In the late 1870s fish prices decreased significantly, and this was partly attributable to the herring fisheries. In 1878 von Yhlen stated that fish prices had gone down by 33 per cent due to the large quanti-ties of herring in the Swedish market.341 The prices dropped most dramatically, however, for the Ålesund fishermen. Hence, economic
336 Berättelse 1879, p. 1. See also Figure 11, p. 126. 337 Dalén, p. 205, 211; Hasslöf, 1949, p. 72-3. 338 Vollan, p. 55. 339 Solhaug, p. 240-2. 340 See Figure 11, p. 126. 341 Berättelse 1878, p. 1.
165
changes did play a significant role in the decline of the Ålesund fish-ery.
Reports by contemporary observers serve to improve our under-standing of the changes. Generally, reports by the fisheries inspectors von Yhlen and Malm confirm that economic aspects caused the Swedish fishermen to abandon the fishery. In 1880 von Yhlen noted that fish prices had dropped in Ålesund.342 In 1881 he continued by stating that the longline fishery was having problems in competing with the Norwegian fishery for demersal species. Additionally, the coastal herring fishery in Bohuslän was causing problems for the longline sector.343 In 1882, von Yhlen was more explicit in his de-scription of the difficulties of the longline fisheries. 22 vessels had been withdrawn from the longline fleet, and low fish prices, particu-larly in Norway, were making conditions very difficult for the fish-ery. In the 1882 report, von Yhlen also introduced ecological obser-vations by saying that the demersal species were less abundant than usually on the traditional fishing grounds.344
In 1883, von Yhlen stated that the capital-intensive longline fish-ery was suffering from low profitability, and the herring fisheries were attracting longline fishermen. Usually, a team of longline fish-ermen would sell their vessel and replace it with a seine for herring fishery. Unfortunately, the proceeds of the sale did not allow for the additional acquisition of a new large vessel. The fishermen could only afford a small boat for mackerel fisheries, which could also be used for trading herring during the winter.345
In his annual reports von Yhlen focused mainly on short-term changes from one year to the next. He took a broader view on the development of the industry in his five-year reports. In his report covering the period 1876-80, he emphasised the economic aspects of the industry changes. He stated that compared to the capital expended on the fishery, the longline fishermen were earning less than before.
342 Berättelse 1880, p. 1. 343 Berättelse 1881, p. 2. 344 Berättelse 1882, p. 2. 345 Berättelse 1883, p. 2.

166
While Norwegian fish prices had dropped by 50 per cent, the de-crease in Sweden was between 25 and 35 per cent. Von Yhlen attrib-uted the decrease in Sweden to the high abundance of cheap herring. From this statement it may be inferred that the fish markets for demersal and pelagic species were actually partly overlapping, as large quantities of herring spilled over into the market for demersal species. Von Yhlen also attributed the decreasing Swedish fish prices to a change in landing strategies among the Swedish Ålesund fisher-men. Rather than following the traditional practice of landing the catches in Ålesund, they brought with them a large part of the catches to Sweden in an attempt to avoid the low prices in the Norwegian market. Consequently, the supply of demersal fish in the Swedish market increased, which caused prices to drop there.346
This interpretation was repeated in the next five-year report, pre-pared by A.H. Malm. Summarising the main development in the pe-riod 1881-85, Malm most probably based his conclusions on von Yhlen’s work. The decline of the Ålesund summer fishery was attrib-uted to low fish prices and the fact that Norwegian fishermen dis-placed the Swedes.347 With regard to the decline in the skrejd fishery for cod in February and March, the five-year report added a new as-pect. According to Malm’s report, the skrejd fishery had been aban-doned partly because of the rough weather during the winter and partly due to low fish prices. The main reason, however, was the fact that herring fisheries were conducted during the winter. When fish-ermen engaged in herring fisheries, they could not leave home suffi-ciently early to make it to Ålesund in February. Having to choose between the skrejd and herring fisheries, they stayed at home and opted for the latter.348
346 GLA, Göteborgs och Bohus Läns Länsstyrelse, Landskansliet, DVb:14, Femårsberättelse 1876-80, Gerhard von Yhlen. 347 GLA, Göteborgs och Bohus Läns Länsstyrelse, Landskansliet, DVb:15, Femårsberättelse 1881-85. 348 GLA, Göteborgs och Bohusläns Länsstyrelse, Landskansliet, DVb:16, Malm, ’Öfversigt öfver Göteborgs och Bohus Läns fiskerier under femårsperioden 1881-1885’.

167
Another aspect of the same issue was touched upon in an article published in a Swedish fisheries journal, Bohuslänsk Fiskeritidsskrift, in 1885. According to this article, herring fishery also attracted longline fishermen because it was less laborious and more comfort-able than longline fishery.349
In conclusion, the contemporary observers attributed the decline to the low prices and the increasing presence of Norwegian fishermen on the Ålesund grounds. The attention of Swedish fishermen was increasingly directed towards herring fisheries, which were less capi-tal-intensive and more comfortable for the fishermen. The attraction of the herring fishery was to be found in the higher incomes it gener-ated.
Ecological explanations for the decline of the Ålesund fishery
Ecology as a driving force in the development of longline fisheries has so far been neglected. Did the Swedish fishermen abandon the Ålesund banks in the early 1880s due to declining catch rates? The main sources to answering this question are described above, namely the catch and effort statistics from the Swedish fisheries inspectors’ annual reports and an article published in the Norwegian journal Norsk Fiskeritidende in 1884.350 The data sets are shown in Table 11, Table 12 and Table 13 on pages 139-140. The tables show that the Norwegian catch rates were lower than Swedish catch rates in the early 1870s, but it also indicates that the Norwegians caught up with the Swedes in the mid 1870s. By 1877, the Norwegians outperformed the Swedes, which confirms that the Norwegian fishermen success-fully learned from and competed against the Swedes.
In 1878 the skrejd fishery failed completely due to adverse weather conditions.351 Both the Norwegian and Swedish data sets clearly show low catch rates that year. In 1879 von Yhlen reported a
349 Bohuslänsk Fiskeritidsskrift II, 1885, p. 357. 350 Berättelse 1873-1886. GLA, Göteborgs och Bohus Läns Länsstyrelse, Landskansliet, DVb:12, ’Redogörelse för Bohus Läns Bankfiske år 1872 af Gerhard von Yhlen’. Norsk Fiskeritidende 1884, p. 96-105. 351 Berättelse 1878, p. 1.

168
catch rate for the skrejd fishery of almost 1,800 cod per man.352 This is in disagreement with the Norwegian source, which indicates catches of almost 2,500 cod per man. Despite the disagreement about the actual number, the two sources show the same trends, and gener-ally support each other.
The decline in the skrejd fishery from 1880 is evident in both the Norwegian and Swedish sources. The catch rates declined signifi-cantly, both in the Swedish and the Norwegian fisheries. In 1881 von Yhlen described the skrejd fishery as a failure. The strong winter had inflicted problems on the fishermen and delayed their departure from Bohuslän.353 In 1883 von Yhlen described the fishery as ‘poor’ and attributed the poor performance to adverse weather and a shortening of the fishing season. During the winter, a number of fishermen took part in the herring fishery in Bohuslän, and this pursuit caused them to arrive late to the Ålesund fishing grounds.354 With a shorter season, the fishermen had less time to catch fish, and the catch rates thus de-creased. Bearing the reduction of the fishing season in mind, one should be careful in concluding that decreasing stock abundances caused the fishery to decline. The annual catch rates did decline for some years, but this was attributable to changes of the season rather than decreasing stock abundances.
In the summer fisheries for ling, the Norwegian fishermen suc-ceeded in maintaining high catch rates, while the Swedish catch rates declined. The high Norwegian catch rates indicate that ling abun-dances were not decreasing at the time.
The behaviour of the Norwegian fishermen also serves to shed light on the causes of the Swedish fishermen’s departure from Åle-sund. Obviously, the Norwegians did not have the possibility of switching from the longline sector to herring fisheries in the Bohuslän archipelago. Nevertheless, continued Norwegian fishery for demersal species on the Ålesund banks would indicate that no major ecological change had taken place in the 1880s.
352 Berättelse 1879, p. 1. 353 Berättelse 1880, p. 1. 354 Berättelse 1883, p. 1.

169
kr 0
kr 20.000
kr 40.000
kr 60.000
kr 80.000
kr 100.000
kr 120.000
kr 140.000
kr 160.000
kr 180.000
1879 1881 1883 1885 1887 1889
Cat
ch v
alue
0
100
200
300
400
500
600
Num
ber
of m
en a
nd v
esse
ls
Catch value
Number of men
Number of vessels
Figure 22. Norwegian effort and catch value in summer fisheries off Ålesund, 1879-89.355
Figure 22 and Figure 23 show data from the annual, official Nor-wegian fisheries statistics. The Norwegian fishermen had a much more stable income in the summer fishery than the Swedes, both in the 1870s and the early 1880s. This confirms Vollan’s interpretation of the successful Norwegian competition against the Swedes. Interest-ingly, the Norwegian fishery for ling and cod on the Ålesund banks continued after 1883, which indicates that the ecological basis for longline fisheries had not changed significantly. The continuation of the Norwegian fishery after 1883 indicates that ling and cod could still be caught on the Ålesund grounds. Reporting on the Ålesund fishery in 1884, the Norwegian fisheries inspector stated that this sector had experienced a major expansion during the last couple of years, even though 1884 was a disappointment.356 In conclusion, suc-
355 Tabeller vedkommende Norges Fiskerier i Aaret 1882, p. 51, 1884, p. IX, 1885, p. 61, 1886, p. 62, 1887, p. 61, 1888, p. 62, 1889, p. 49-50. 356 Tabeller vedkommende Norges Fiskerier i Aaret 1884, p. IX

170
cessful Norwegian competition, rather than a major ecological shift, inspired the Swedish decision to abandon the Ålesund fisheries.
-
200.000
400.000
600.000
800.000
1.000.000
1.200.000
1.400.000
1.600.000
1862 1865 1868 1871 1874 1877 1880 1883 1886 1889
Kg
SwedishNorwegian
Figure 23. Swedish and Norwegian ling catches (kg) in summer fisheries off Åle-sund, 1862-89. 357
Conclusion
When herring appeared in Bohuslän’s archipelago in the late 1870s, the longline fishermen were faced with a dilemma. Should they stay in the longline sector and maintain their knowledge on demersal spe-cies that they had accumulated over many years? Or should they change their target species, hoping to increase their income but probably also lose their longline skills? The choice was not an easy one. Nevertheless, the longline sector declined significantly, and the Ålesund fishery was discontinued.
357 Norsk Fiskeritidende 1884, p. 103 for the period 1862-83; Tableler vedkommende Norges Fiskerier i Aaret 1884, p. IX, 1885, p. 61, 1886, p. 62, 1887, p. 61, 1888, p. 62, 1889, p. 49-50 for the period 1884-89.

171
The Swedish withdrawal from Storeggen was caused by increas-ing Norwegian competition and low fish prices paid in Ålesund. Norwegian fisheries for demersal species continued off Ålesund after the Swedish exodus, which indicates that ling and cod could still be caught on the ground. For the Swedish fishermen, it was more attrac-tive to engage in the coastal herring fisheries in Bohuslän. Work in this sector was less risky and more comfortable, and the fishermen could stay closer to home. Based on contemporary observations, it is safe to conclude that low profitability was a main factor in the decline of the longline fisheries off Ålesund.
How did the development in the Swedish longline fisheries tie in with Hilborn and Walters’ theory of fisheries development? In fact, their theory cannot explain the Swedish exodus from the Ålesund fishery in the 1880s. The exodus was not caused by a major drop in catch rates. While congestion could be a problem on the Ålesund ground, the Swedish fishermen were definitely not desperate to find new fishing grounds. Rather the Swedish longline fishermen reverted to the old fishing grounds in the Skagerrak and off Jäderen. Also, there were no major technological breakthroughs or attempts to in-crease fishing effort with more efficient gear and vessels. In conclu-sion, the decline of the Swedish Ålesund fishery does not tie in with Hilborn and Walters’ theory. Rather, the main explanations for the decline of the Swedish Ålesund fishery were the Norwegian competi-tion and the attractive, alternative employment in the herring fishery in the Bohuslän archipelago.

172
Regional responses to the decline of the 1870s
and 1880s
The late 1870s and 1880s were a time of structural change in the Bo-huslän fisheries, as the herring fisheries gained ground, and the longline sector declined. The fishermen’s responses to the challenges of the 1880s differed markedly, depending on where they lived. This chapter examines the regional differences in the response to structural changes, and the decline of longline fisheries in particular.
Detailed data sets are available for the period 1872-86. The data set reveals distinct regional differences as well as remarkable simi-larities between neighbouring fishing villages. Firstly, the Kattegat fisheries were conducted from the Göteborg archipelago (Fishing District 1). Secondly, a distinct group, mainly from the island of Orust, focused on the Jäderen grounds. Thirdly, a group of fishing communities in southern Tjörn and Sotenäset as well as Stångenäset fished both in the Skagerrak and off Ålesund. This last group could be divided into two sub-groups, depending on their reaction to the decline of the Ålesund fishery from the late 1870s. The Tjörn com-munities redirected their effort to the Skagerrak. Initially, the Sotenäset villages did the same, but they abandoned longline fishery in the mid 1880s.
Fishing District 1 and the expansion of the Kattegat fishery
The data set shows that the longline fishermen of the islands in Göte-borg’s archipelago, Fishing District 1, focused solely on the Kattegat. Their fishing strategy was distinctly different from that of the other Fishing Districts.
Back in the 1830s and 1840s, Lundbeck and Holmberg had criti-cised the practice of importing fish from northern Jylland in Denmark to Göteborg. From their point of view, this hampered the develop-ment of a large fishing industry in the Göteborg archipelago. The practice continued, however, and in 1865 Uggla estimated that fifteen vessels from the outer parts of the Göteborg archipelago were em-ployed in the import trade, and they had made 353 trips to Denmark

173
in one year. In addition, people from the northern parts of the Göte-borg archipelago went to Denmark to buy fresh fish for the Göteborg fish market.358
This import was discontinued in the 1870s. In 1871 the railway to Frederikshavn, on Jylland’s Kattegat coast, was completed, thus con-necting Frederikshavn with the rest of Jylland and Germany. The Jylland railway transported Danish catches to German fish markets. Accordingly, the Swedish vessels employed in the import of fish from Denmark to Sweden switched to fishing.359 Dalén emphasised this sudden change in Fishing District 1, from importing fish from north-ern Jylland to launching longline fishery in the Kattegat. He attributed the changes to the expanding fish market and the introduction of rail-ways in Sweden and Denmark. Danish catches could be exported by rail to Germany, thus ending the need for Danish exports to Sweden. Similarly, the completion of the Göteborg – Stockholm railway in 1862 expanded the fish market for the Bohuslän fishermen.360
The fisheries inspectors started reporting on the Kattegat fishery in 1875. Their increased attention towards the Kattegat fishery indi-cates that this fishery was gaining economic importance at the time. Furthermore, the fisheries statistics indicated expansion. In contrast to the longline fisheries beyond Skagen, the Kattegat fishery was in-creasing in the 1880s. Consequently the fishing harbours of Fishing District 1 became more important to the industry.
In terms of technology, the Kattegat fisheries differed from the longline fisheries beyond Skagen. The Kattegat vessels were consis-tently the smallest, having an average crew of 6 men in the whole period. The average crew size was remarkably stable in the long term, in fact, not changing significantly from the 1870s until the outbreak of hostilities in 1914. Like the rest of the fleet, the Kattegat fishermen used longlines. By selling their catches fresh in Göteborg, they were targeting a different market, however. Contrary to the longline fisher-ies beyond Skagen, the Kattegat fishermen made very frequent trips
358 Handlingar 1865, Tablå öfver Bohus Läns Hafsfiske år 1865. 359 Qvartalsskrift 1876, IV, p. 208. 360 Dalén, p. 202-7.

174
between Bohuslän and the fishing grounds. Malm estimated that each vessel made two to three trips per week in the 1880s and 1890s.361
Why did the expansion of Fishing District 1 and the Kattegat fishery take place? In fact, the first district performed better than the other districts in the 1880s. The reduction of fish prices in the late 1870s did not hit the Kattegat fishermen as hard as it did the other fishermen.362 Traditionally, the development of the first fisheries dis-trict has been attributed to the urban expansion of Göteborg. Hasslöf and Olsson emphasised the role played by the Göteborg fresh fish market.363
While the total population of Göteborgs och Bohus län increased by almost 78 per cent from 1860 to 1910, the main growth took place in Göteborg, the population of which increased 4.5 times. In contrast, the countryside only increased its population by 13 per cent from 168,000 to 190,000 people in the same period.364 The expansion of Göteborg was related to the industrial development.365 According to von Yhlen, the price paid for fresh fish landed at the Göteborg fish market was considerably higher than it was for fish landed in other parts of Bohuslän. Despite the lower diversity of species in the Kat-tegat, the fishery paid off well.366 Thus, the rapid development of Göteborg explains the peculiar development of longline fisheries in Fishing District 1 and the Kattegat.
The Jäderen fisheries
Dalén reported that it was common practice among Orust fishermen to fish on the Jäderen ground. This is strongly supported by the data
361 GLA, Göteborgs och Bohus Läns Länsstyrelse, Landskansliet, DVb:16, Femårsberättelse, Malm, 1886-90; DVb:16, Femårsberättelse, Malm, 1891-95; Berättelse 1889-90, p. 2. 362 GLA, Göteborgs och Bohus Läns Länsstyrelse, Landskansliet, DVb:14, Femårsberättelse 1876-80, Gerhard von Yhlen. 363 Hasslöf 1949, p. 74-6, 258-9; Olsson 1984; Olsson 1985, p. 53. 364 Persson, p. 191. 365 Fritz. 366 Von Yhlen, p. 37.

175
set from 1872 to 1886. In 1879, von Yhlen said that 37 vessels and 440 men had taken part in the Jäderen fishery, and almost all of them came from Orust.367 The Jäderen fishermen came from Björholmen, Edshultshall and Mollösund from Fishing District 4 and Käringön from Fishing District 5.
In the Orust fishing villages, there is some evidence that local co-ordination of fishing effort in terms of locational choices may have been practised. Mollösund, on the southern tip of Orust, is a clear example of such practices. During the period 1872-86, all vessels from Mollösund went to the Jäderen ground; however, the years 1881 and 1882 are notable exceptions. In 1881 the entire Mollösund fleet spent part of the season off Jäderen and the other part off Ålesund, and in 1882, the entire fleet tried a new combination of Jäderen and Skagerrak fisheries. In 1883 the fleet reverted to the old practice of focusing solely on the Jäderen ground.
In the 1870s the longline fishermen from Hellevikstrand in Fish-ing District 5 also sailed to the Jäderen ground. From 1880 onwards, the entire Hellevikstrand fleet combined Jäderen fisheries with fisher-ies in the Skagerrak. This latter practice resembled the fishing strate-gies used by the Grundsund fishermen from Fishing District 6. These fishermen combined longline fisheries in the Skagerrak and off Jäderen. The coordination of fishing effort was also evident in the Grundsund fleet. Generally fisheries took place both in the Skagerrak and off Jäderen, but the vessels made a joint switch of all effort to Jäderen in the two seasons of 1880 and 1881. In 1885 they all also abandoned the fishery off Jäderen, focusing instead solely on the Skagerrak. The decision to focus on only one fishing area must have been an unfortunate one, as most of the vessels reintroduced the com-bination of Skagerrak and Jäderen fisheries in 1886.
A large fleet of longline vessels was based on the island of Gull-holmen situated off Orust. The fishermen on this island had more diverse fishing strategies, focusing on the Skagerrak as well as Jäderen and Ålesund. In the 1880s the fishing strategy became more
367 Berättelse 1879, p. 1.
176
focused, as the fleet increasingly turned to the Skagerrak fishing ground and abandoned the Jäderen ground.
The Fishing Districts 2 and 7: Ålesund and Skagerrak
In the 1860s, the radius of the Bohuslän longline fisheries increased considerably with the launch of the Storeggen fishery. Despite the expansion, fleets from some of the fishing communities continued to fish only in the Skagerrak; among these communities were Has-selösund, Stora Kornö and Lilla Kornö from the north and Böklöfva from Fishing District 4. All of them had only small fleets of one to three vessels.
Even though the distance from Bohuslän to Storeggen was long, it made good economic sense to go there in the 1870s. Many fisher-men spent the early part of the fishing season in the skrejd fishery off Ålesund and the last part in the Skagerrak. These fishermen came mainly from Grafvarne, Hunnebostrand, Näset and Tången from Fishing District 7. This was a successful fishing strategy in the 1870s, when the income per man exceeded the income earned in other longline fisheries. In 1877 von Yhlen noted that these fishermen were the most successful in terms of income per man.368 Until the early 1880s, Grafvarne was the home of the best-earning vessels in Bo-huslän, the ‘Freden’, ‘Gossen’, ‘Granaten’ and ‘Purren’, and all of them had combined Ålesund and Skagerrak fisheries. Their success was followed by a rapid decline in the 1880s, however, and by 1884 the Storeggen fisheries had been abandoned by the Swedes. The longline fisheries in Fishing District 7 contracted significantly, as the fishermen left the sector.
Before the longline fishery was finally abandoned by most of the Fishing District 7 fishermen, vessels from Grafvarne, Tången, Hun-nebostrand, Näset and Tången were transferred from Storeggen to the Skagerrak. This also happened to the vessel from Gravarne, which had been very successful until 1877. They were withdrawn, however, in the early 1880s. It is evident that Fishing District 7 communities searched for an alternative to the declining Ålesund fishery in Skager-
368 Berättelse 1877, p. 1.

177
rak longline fisheries. This indicates that the ultimate decision to shift from longlining to other occupations was not an easy one. Eventually, Fishing District 7 fishermen from Sotenäset were attracted by the herring fisheries and abandoned the longline sector.
Indeed, not everybody was happy about the scale of investments made in herring fishery. Axel Ljungman, a scientist, who today is most famous for his theories on herring fluctuations, warned the fish-ermen against relying too heavily on the unpredictable herring fish-ery. The herring fisheries could suddenly contract, and according to Ljungman, the fishermen did not know if they would get a satisfac-tory reward from this fishery. By focusing solely on the herring fish-ery, important ecological knowledge accumulated in the longline sector would be lost. Ultimately, the herring would disappear, at which time the fishermen would have to rely on the longline sector for their main income.369 What Ljungman addressed was basically the question of knowledge accumulation and rigidities within the fishing communities and more broadly the issue of economic and ecological flexibility.
Some of the fishing communities on the island of Tjörn and its vicinity had sent vessels to Ålesund in the 1870s. The vessels came primarily from Klädesholmen and neighbouring Tjörnekalf, but Dyrön, Åstol, Kyrkesund, Skärhamn and Stansviken were also tem-porarily represented in the Ålesund fishery. Like Fishing District 7 fishermen, the Tjörn fleets abandoned the Storeggen bank around 1880. Contrary to their northern colleagues, the Tjörn longline fish-ermen did not change occupation however. Most of the vessels were permanently transferred to the Skagerrak or Jäderen fisheries. Thus, they followed the course advised by Ljungman.
369 Bohuslänsk Fiskeritidsskrift 1888, p. 25.

178
Social organisation
According to Swedish etnographer Olof Hasslöf, the Bohuslän fish-ermen had a very strong, democratic-cooperative social organisation. People in the coastal communities of Bohuslän opposed company ownership of vessels and gear, which is why the fishermen insisted on remaining independent of outside capitalists. This was done by organising boat-fellowships, lag, that owned the gear and the vessels themselves. Attempts at establishing capitalist ventures in which the gear and the vessels were owned by companies or onshore capitalists were never successful in Bohuslän. Such ventures were:
‘... always met with great mistrust and opposition. But it has also taken the form of warnings against company ownership, supported by requests to fishing brothers to show solidarity and not to lose the fishermen’s position as free men in free teams.’370
The quotation proves Hasslöf’s clear preference for the Bohuslän fishermen’s independence. In contrast, the Baltic Sea fishermen were often controlled by landowners. Rather than being independent, the fishermen operated within hierarchical social stuctures. To Hasslöf, the boat-fellowships ensuring fishermen’s ownership of gear and vessels were ideal.371
Hasslöf derived his conclusions mainly from interviews with fishermen and their families and thus ignored the prejudice that aca-demics and officials usually held against fishermen. Nilsson, Holm-berg, Ekström and the fisheries inspectors were scholars and bureau-crats, and at times their views differed significantly from those of the fishermen. For instance, the scholars usually claimed that the fisher-men were irrational and conservative with regard to fishing practices. Hasslöf’s interviews gave a different, much more positive view of the 370 Hasslöf 1949, p. 209. 371 Hasslöf 1949, p. 152, 204-6, 208-9, 470-2, 544-5.

179
Bohuslän fishermen. It may, however, be relevant to ask whether Hasslöf quoted the fishermen’s ideology rather than presenting an accurate analysis of the social organisation of the communities.
Hasslöf’s notion of the democratic, cooperative and independent fishermen with self-ownership and boat-fellowships became widely accepted in ethnographic research, but some of his interpretations have also met criticism. In his doctoral dissertation from 1991 and an article from 1992, historian Poul Holm questioned Hasslöf’s dichot-omy between a democratic-cooperative organisation and a capitalist organisation with companies engaged in the fisheries.372 Holm argued that Hasslöf’s distinction was too sharp. Even though the fishing teams and boat-fellowships did not distinguish between employer and employee, this did not preclude hierarchical decision making. The contrast between self-ownership and company-ownership (‘fleet-ownership’) was not as simple as Hasslöf made it. Rather than being clear-cut alternatives, the differences between fishing communities were on a continuum. Holm argued that there were many alternatives of social organisation on ‘the continuum from boat-fellowship over individual ownership to fleet ownership’.373 Even in boat-fellowships, profits were often unequally distributed between the fishermen. When the fishermen held different sizes of shares in the vessels, they would get different profits. Holm emphasised that complete equality would have a negative effect on the fishermen’s motivation towards their work. Total equality would deprive the fishermen of incentives to work hard. In addition, Holm emphasised that the boat-fellowship did not preclude hard and dangerous working conditions onboard the vessels. Owning shares in the boats might make the fishermen engage in more risky ventures than they would if the vessels were owned by onshore capitalists. The differences between Hasslöf’s and Holm’s interpretations are relevant because they throw light on the essential question of how coastal communities function. The social structure had an important bearing on the development of the maritime com-munities.
372 Holm 1991, p. 223-32; Holm 1992, p. 197-214. 373 Holm 1992, p. 210.

180
In an article published as part of the Kattegat-Skagerrak project, Lasse Cornell, a Swedish historian, also questioned Hasslöf’s conclu-sion on the democratic organisation of maritime communities. Cor-nell described Hasslöf’s notion as ‘structuralist’ in the sense that Hasslöf tended to infer an almost perpetual conflict between a capital-ist organisation and the democratic organisation of coastal communi-ties. The evidence of Hasslöf’s democratic-cooperative organisation in shipping communities was weak, Cornell argued.374
Based on the above discussion, there is good reason to revisit the issue of the social organisation within the coastal communities. With regard to Bohuslän, some of the ethnographic interviews in Göte-borg’s museum archives confirm Hasslöf’s interpretation.375 While the ethnographic interviews certainly have the advantage of offering an alternative to the interpretation of the scholars’ reports, there is a risk that the interviewer reported the fishermen’s ideals and ideology, which may not have been in complete agreement with the actual so-cial organisation. Ideally, the social organisation should be examined through other types of sources, including more quantitative evidence, and this is the intention of the present chapter, as there are relevant, quantitative sources available from Bohuslän which have not yet been thoroughly examined by historians or ethnographers.
The seven case studies
In the Landskansli archives in Göteborg, detailed records of fishing gear and vessel ownership in 1886 are kept.376 These records have been produced by the local officials in the villages of Bohuslän and list the individual households’ ownership of gear and vessels, includ-ing estimated values, as well as the number of fishermen per house-hold. The purpose of the lists was to make an overview of the fishing industry in the individual communities; there is no evidence that the list was used for taxation purposes. The fishermen had no financial
374 Cornell, p. 12-3. 375 E.g. GMA 2070; GMA 5233. 376 GLA, Göteborgs och Bohus Läns Landskansli, vol. EVI:18, ’Fiskeristatistiska uppgifter från Göteborgs och Bohus Län år 1886’.

181
incentives to fail to report gear or vessel ownership, and this adds to the credibility of the source. The lists make it possible to perform an analysis of the distribution of gear and vessel ownership within the fishing communities.
Records exist from the majority of the Bohuslän fishing commu-nities. Only records from the villages of Fishing District 4, the island of Orust, are missing. For the purpose of this analysis, seven fishing villages have been selected as case studies. The seven villages are: Bovallstrand (District 7), Gullholmen (District 6), Käringön (District 5), Klädesholmen (District 3), Dyrön (District 2), Rörö (District 1) and Fotö (District 1). Two criteria were applied in the selection of the case studies. Firstly, each of the seven fishing districts from the Göte-borg archipelago to Sotenäset was to be represented in the study. Secondly, all of the major fishing sectors – longline, herring and mackerel fisheries – should be included in the analysis. The selected villages represent much of the diversity within the Bohuslän fishing industry in the second half of the nineteenth century.
When the ownership of fishing gear is applied as an expression of fishermen’s engagement in the different fisheries, distinct regional patterns emerge. In Dyrön, Gullholmen and Käringön,75, 69, and 62 per cent of the households, respectively, owned longlines. In contrast, Klädesholmen was less dependent on demersal fisheries. Only 30 per cent of the households in Klädesholmen owned longlines. The last three case studies – Rörö, Fotö, and Bovallstrand – did not engage in the main longline fisheries.
In Dyrön, Käringön and Gullholmen, longline vessels represented the largest investment. The Käringön and Klädesholmen fishermen were engaged in longline fisheries on the Jäderen grounds, and the Dyrön and Gullholmen longline fleets focused on the Skagerrak in 1886.377
In Käringön, 54 households owned parts in the longline vessels. Each part was worth between 700 and 825 kr. This equalled 10-13 per cent of the value of one vessel. While the owners had equal shares in the vessels, 16 households engaged in longline fishery without own-
377 Berättelse 1886-87.

182
ing any shares. Most households also engaged in lobster fisheries and various net fisheries.
On the island of Dyrön, adjacent to Tjörn, the population of fish-ermen engaged in two sectors – longline fisheries in the Skagerrak and herring fisheries. Judging from the ownership of gear, virtually all fishermen were engaged in both types of fishery. Ownership of gear was divided among most fishermen, whereas ownership of the community’s two longline vessels was concentrated on only 6 house-holds.
Being a centre for the longline fisheries, Gullholmen had many households that owned longlines, and its population also engaged in herring fisheries. The last of the longline case studies is Klädeshol-men, on the southern part of Tjörn. Interestingly, a group of house-holds reported to own no boats or gear.
Fotö, Rörö and Bovallstrand are examples of fishing villages that engaged in the Kattegat longline fisheries, but their fishermen did not participate in the main longline fisheries beyond Kattegat. Fishermen in Bovallstrand in the north had the highest average investments per household. Having abandoned the longline fisheries beyond Skagen in 1883, the fishermen engaged in herring and mackerel fisheries. Despite their withdrawal from the longline fisheries beyond Skagen, 67 per cent of the households also owned koljebackor for demersal fisheries in the Kattegat.
In the Göteborg archipelago, Rörö fishermen combined kolje-backe fisheries with herring, mackerel and lobster fisheries. The fish-ermen in neighbouring Fotö focused on koljebacke and lobster fisher-ies. Herring was only of minor importance in this community. The investments per household in Rörö and Fotö exceeded those of some of the fishing communities further north. Thus, the fishermen in Göteborg’s archipelago did not focus only on the Kattegat area due to lack of capital. Rather, their fishing strategy was determined by the attractive market for fresh fish in Göteborg.
Gear and vessel ownership
Are Hasslöf’s notions on the social organisation supported by the data set from 1886? To what extent did the structure of ownership in 1886 correspond to Hasslöf’s description of the Bohuslän fishing commu-nities as egalitarian, cooperative and democratic? Alternatively, does
183
the data set support Holm’s notion that shares in vessel and gear could be inequally distributed also in boat-fellowships?
It is evident from the above description that most households owned at least a small share in gear or a vessel. Nevertheless, there were marked inequalities within the communities. This can be seen clearly from the Lorenz diagram, presented in Figure 24, which shows the distribution of ownership in the seven case studies. The line ‘perfect’ refers to a theoretical situation where wealth was equally distributed between all households. The case studies’ devia-tion from the ‘perfect’ line reflects the degree of inequality in wealth distribution.
The longline fishing community of Klädesholmen, on the south-ern tip of Tjörn, had the most inequal distribution of wealth. 10 per cent of the households owned 66 per cent of the gear and vessels. Fotö was also in a group of its own, though with a more equal distri-bution of wealth. In Fotö, 12 per cent of the households owned 43 per cent of the gear and vessels. The other five case studies formed a separate group with roughly the same distribution of wealth. This is remarkable given the fact that the five communities had very different fishing strategies. Thus, the Lorenz-diagram shows that the different fishing strategies did not originate in different ownership structures.
In general, the data set from 1886 confirms Holm’s notion that there were many degrees of ownership structure between a strictly capitalist organisation and a boat-fellowship organisation. The seven case studies reveal significant differences in ownership structures between individual fishermen. While most fishermen owned at least a small part of the gear, there were marked inequalities in some com-munities. Thus, Holm is right in criticising Hasslöf’s dichotomy of being too simplistic to embrace the complexities of the social organi-sation in the coastal communities. The Bohuslän case studies show that there were indeed many different forms of social organisation even within the boat-fellowships.

184
0%
20%
40%
60%
80%
100%
1% 19% 38% 56% 75% 93%
Percentage of households
Per
cent
age
of th
e to
tal v
alue
of g
ear
and
vess
els
KlädesholmenDyrönGullholmenKäringönBovallstrandFotöRöröPerfect
Figure 24. Lorenz diagram: Distribution of wealth defined as ownership of gear and vessels, 1886. 378
Even though the fishermen owned the vessels and gear, there are
also examples of capital being raised from other sources outside the fishing communities. Holm mentioned the example of Oscar Dickson, a wealthy Göteborg merchant, who let a group of Grundsund fisher-men use a new type of vessel free of charge for six months in 1884.379 Dickson’s support by providing the new vessel became a catalyst for change in the longline sector in the late 1880s and 1890s, and the example will be described in more detail below. Also, the Swedish government supported the fisheries financially, at least in the early 1860s as described above. Finally, inexpensive government loans were made available to the longline fishermen in the 1890s, when the fishing fleet was renewed. This is also discussed more thoroughly later. All the above examples show that Hasslöf’s description of the
378 GLA, Göteborgs och Bohus Läns Landskansli, vol. EVI:18, ’Fiskeristatistiska uppgifter från Göteborgs och Bohus Län år 1886’. 379 Holm 1991, p. 230.

185
social organisation in the fishing communities is insufficient. It does not take the social complexities into consideration, and it disregards the role that merchants and the Swedish government played in the transformation of the fishing industry.
Social organisation and risk taking
One last aspect regarding the social organisation of coastal communi-ties merits comments. In his criticism of Hasslöf’s dissertation, Holm emphasised that the boat-fellowship did not preclude hard and dan-gerous working conditions on board the vessels.380 Although Hasslöf did mention the risks of life at sea, he did not relate this to the social organisation and certainly not the cooperative working teams. Hasslöf used it more as a sign of the heroic character of the fishermen.381
The differences between Hasslöf’s and Holm’s interpretations il-lustrate the relevance of a closer examination of the relationship be-tween social organisation and risk-taking. Generally, the longline fishing teams were willing to take high risks; in particular, setting and retrieving longlines from dinghies was dangerous work. As von Yhlen stated in his annual report for 1868, currents and wind could take the dinghies away from the anchored vessels, and they were doomed if they did not meet other vessels or reached the Norwegian coast.382 The engagement of the Bohuslän fishermen in the skrejd fishery in February and March off Ålesund also reflected their will-ingness to take risks. The decisions to take risks were made in the boat-fellowships and thus reflected the social organisation. This indi-cates that there was a large group of risk-takers in the longline work-ing teams, and the boat-fellowships thus did not guarantee the best working conditions for the crews.
380 Holm 1991, p. 229. 381 Hasslöf 1949, 44-55. 382 Qvartalsskrift juli 1868, p. 58.

186
Conclusion
In this chapter, Hasslöf’s dichotomy between democratic, independ-ent coastal communities and hierarchical capitalist organisations has been questioned. This dichotomy is too simplistic to consider the complexities in the social organisation of the Bohuslän communities. The ownership of boats and gear was unequally distributed between households, and sources outside the communities, such as Göteborg merchants, played a significant role as catalysts of change in the fish-eries. This indicates that capitalism vs. democracy is too simple a model to be applied in the analysis of social structures in coastal communities.

187
TOTAL REMOVALS &
HISTORICAL ABUN-
DANCES
This chapter will examine ling and cod abundances in the Skagerrak and north-eastern North Sea in the 1870s and ask how the historical abundances differ from the present situation. Estimates of historical stock abundances are relevant both to maritime historians, fisheries biologists and fisheries managers.
For maritime historians, data on historical abundances can in-crease the understanding of the ecological basis of fisheries. Indeed, fishermen depended on prey abundances and had to adapt to changes in the aquatic ecosystems.
From a scientific and management perspective, historical base-lines of stock abundances are relevant for the determination of stock management reference points. This is not to say that the goal of mod-ern fisheries management should be a complete restoration of former stock abundances; some ecosystem changes may be irreversible. Nevertheless, historical abundance estimates can increase scientists’ and fisheries managers’ understanding of the scale of change in eco-systems.
Total removals
A first step towards the calculation of historical abundances is an estimate of the total removals made from the stocks. This chapter seeks to uncover how much was caught in the 1870s and 1880s and describes how such estimates are made. Firstly, the total Swedish removals of ling and cod are calculated. Secondly, a tentative assess-

188
ment of the removals made by other countries’ fishing fleets is pre-sented.
Swedish catches
From 1859 to 1886 and in 1914, the Swedish fisheries inspectors reported catches made by the Swedish longline vessels. The aggre-gate catches – from the Skagerrak, Jäderen and Storeggen – are shown in Table 16. Between 1872 and 1886, when the data set is most detailed, approx. 20-30 per cent of the longline vessels did not report their catches (only catch values). This type of underreporting most probably also took place before 1872, and therefore the data in Table 16 should be considered as minimum catches only. The data set for cod and tusk is discarded between 1861 and 1865 because the two species were merged into one category in the fisheries inspectors’ reports. Taken at face value, the data set shows that haddock catches peaked in 1869 at almost 700,000 individuals, whereas ling catches fluctuated between 234,000 and 540,000 individuals. For some years, cod catches are more uncertain, but they peaked in two years in the 1870s at more than 450,000 individuals.
Data on catches made in the demersal fisheries in the Kattegat and the Bohuslän archipelago were not compiled. It was very difficult for the fisheries inspectors to keep track of these fisheries, because each vessel made as many as two or three trips per week.383 There-fore, the stocks and the fisheries in the Kattegat are disregarded in the following analysis.
With a few exceptions, all catches were reported in numbers. Some catches from the Skagerrak and Storeggen were recorded in weight between 1872 and 1874, and they are not immediately compa-rable to the catches in numbers.
383 Berättelse 1879, p. 2.
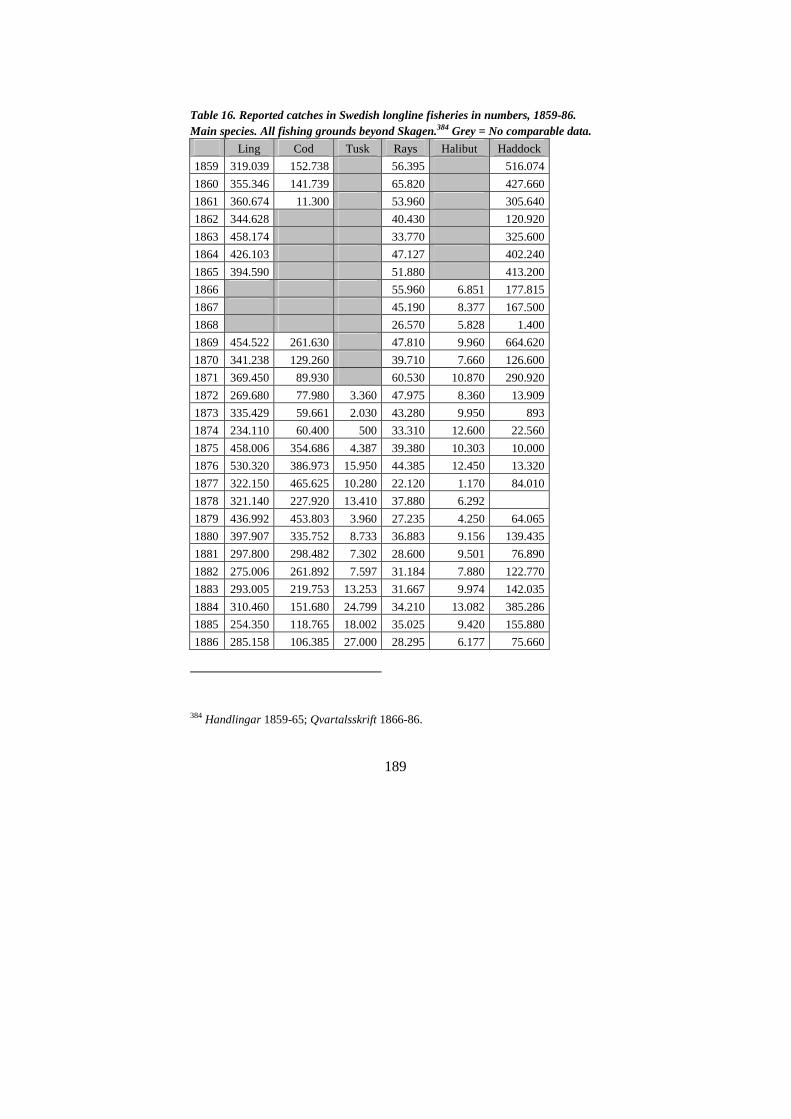
189
Table 16. Reported catches in Swedish longline fisheries in numbers, 1859-86. Main species. All fishing grounds beyond Skagen.384 Grey = No comparable data.
Ling Cod Tusk Rays Halibut Haddock
1859 319.039 152.738 56.395 516.074
1860 355.346 141.739 65.820 427.660
1861 360.674 11.300 53.960 305.640
1862 344.628 40.430 120.920
1863 458.174 33.770 325.600
1864 426.103 47.127 402.240
1865 394.590 51.880 413.200
1866 55.960 6.851 177.815
1867 45.190 8.377 167.500
1868 26.570 5.828 1.400
1869 454.522 261.630 47.810 9.960 664.620
1870 341.238 129.260 39.710 7.660 126.600
1871 369.450 89.930 60.530 10.870 290.920
1872 269.680 77.980 3.360 47.975 8.360 13.909
1873 335.429 59.661 2.030 43.280 9.950 893
1874 234.110 60.400 500 33.310 12.600 22.560
1875 458.006 354.686 4.387 39.380 10.303 10.000
1876 530.320 386.973 15.950 44.385 12.450 13.320
1877 322.150 465.625 10.280 22.120 1.170 84.010
1878 321.140 227.920 13.410 37.880 6.292
1879 436.992 453.803 3.960 27.235 4.250 64.065
1880 397.907 335.752 8.733 36.883 9.156 139.435
1881 297.800 298.482 7.302 28.600 9.501 76.890
1882 275.006 261.892 7.597 31.184 7.880 122.770
1883 293.005 219.753 13.253 31.667 9.974 142.035
1884 310.460 151.680 24.799 34.210 13.082 385.286
1885 254.350 118.765 18.002 35.025 9.420 155.880
1886 285.158 106.385 27.000 28.295 6.177 75.660
384 Handlingar 1859-65; Qvartalsskrift 1866-86.

190
Can we really trust the reported catches? The catch data sets for haddock indicate remarkable fluctuations. In 1878, no fishermen re-ported to have caught haddock, whereas more than 278,000 and 385,000 individuals were known to have been caught, mainly in the Skagerrak, in respectively 1871 and 1884. Moreover, in 1869 a total of 664,000 haddock were caught. The question is whether these data reflect true stock fluctuations or rather different reporting practices? Haddock recruitment is known to have fluctuated widely in the sec-ond half of the twentieth century. In 1967, the recruitment of North Sea haddock was remarkably successful. This is evidenced by Figure 25 and Figure 26, which show how the large 1967 year class resulted in large catches two and three years later. The basic question is whether a similar haddock outburst had taken place in 1881 or 1882, which would explain the high catch reports in 1884. Another even larger outburst could have taken place two or three years before the very large catches made in 1869.
-
100.000.000
200.000.000
300.000.000
400.000.000
500.000.000
1963 1968 1973 1978 1983 1988 1993 1998 2003
Figure 25. Recruitment (age 0), North Sea haddock, 1963-2004. 385 385 ICES 2004, p. 2-226, Table 4.4.2.2.

191
0
200.000
400.000
600.000
800.000
1.000.000
1963 1968 1973 1978 1983 1988 1993 1998 2003
Ton
nes
Figure 26. Total catches, North Sea haddock, 1963-2003. 386
The available data do not provide any definite answers to these
questions. The fishermen’s reporting practices reflected their species preferences. Haddock was used as bait, and it was not as highly val-ued by the fishermen as ling and cod. All longline fishermen had koljebackor that they used to catch haddock387, but very few fisher-men reported to have caught any haddock. This is evident from Figure 27, which shows the percentage of fishermen that reported catches of haddock. Even in 1884, when large haddock catches were made, only a small group of vessels reported to have caught any had-dock. In contrast, the reports on ling and cod catches were much more meticulous, as evidenced from Figure 28 and Figure 29. Only a mi-nority of the vessels did not report any ling catches, and the reports on cod catches were also very frequent. This indicates that reporting of the target species, ling and secondarily cod, were more thorough
386 ICES 2004, p. 2-226, Table 4.4.2.2. 387 GLA, Göteborgs och Bohus Läns Länsstyrelse, Landskansliet, vol. EVI:18, ’Fiskeristatistiska uppgifter från Göteborgs och Bohus Län år 1886’.

192
than the reporting of by-catch species such as haddock. Therefore, the following analyses focus on ling and cod only. To examine historical haddock fluctuations, data sets from other North Sea fishing fleets are required.
Unfortunately, between 1872 and 1886 approx. 20-30 per cent of the longline vessels did not report their catches but stated only catch values. The species composition of the non-reported catches can be inferred from the rest of the fleet, however, which makes it possible to estimate total removals. The results are shown in the figure be-low.388
0%
20%
40%
60%
80%
100%
1872 1874 1876 1878 1880 1882 1884 1886
SkagerrakSkagerrak & JäderenJäderenÅlesundSkagerrak & Ålesund
Figure 27. Percentage of fishermen reporting catches of haddock, 1872-86. Se-lected fishing grounds. 389
388 The calculations were made by Dr. Andrew B. Cooper, University of New Hamsphire. For a thorough discussion of the methodology, see Poulsen et al., 2007. 389 Berättelse 1872-86.

193
0%
20%
40%
60%
80%
100%
1872 1874 1876 1878 1880 1882 1884 1886
SkagerrakSkagerrak & JäderenJäderenÅlesundSkagerrak & Ålesund
Figure 28. Percentage of fishermen reporting catches of ling, 1872-86. Selected fishing grounds.390
390 Berättelse 1872-86.

194
0%
20%
40%
60%
80%
100%
1872 1874 1876 1878 1880 1882 1884 1886
SkagerrakJäderenJäderen & ÅlesundÅlesundSkagerrak & Ålesund
Figure 29. Percentage of fishermen reporting catches of cod, 1872-86. 391
391 Berättelse 1872-86.

195
050
100150200250300350400450500
1870 1875 1880 1885 1890
Year
Est
imat
ed C
atch
. (
in th
ousa
nds)
Ling
Cod
Table 17. Estimated Swedish catches of ling and cod in the Skagerrak and off Jäderen, 1872-86.392
Significantly, the calculations indicate that ling were caught in greater numbers than cod on the Skagerrak and Jäderen grounds. This supports the conclusion that ling rather than cod was the main target species in longline fishery.
The calculated total removals can be evaluated if compared with data sets of fish consumption in Sweden at the same time. Detailed consumption data are available from the two fish markets in Göteborg and Uddevalla from 1879 to 1892.393 Obviously, the data set from the two markets include catches from the Jäderen, Skagerrak and Kat-tegat grounds and to some extent also from Storeggen. Between 290,000 and 470,000 cod were sold fresh at the Göteborg fish market per year in addition to at least 100,000 cured cod. An additional 32-75,000 fresh cod, and up to 900 tonnes of cured cod, were sold at the Uddevalla fish market per year. Thus, the sales in these two markets
392 Poulsen et al., 2007. See also figures on pages 155 and 156. 393 GLA, Göteborgs och Bohus Läns Landskansli, EVI:13-19, ’Rapport angående medelpriset för de särskilda saltsjöfisk, som blivit till försäljning torgförda..’ & ’Rapport från Uddevalla stad öfver Fisk-tillförseln’; von Yhlen, 1880.

196
exceeded the estimated total Swedish removals from Skagerrak and Jäderen. As regards ling, the Göteborg and Uddevalla markets sold a total of 120,000 to 300,000 individuals, mainly cured. With respect to haddock, total sales in the two fish markets often approached 3,000,000 fresh and several hundred tonnes cured fish. The number of haddock sold at the two fish markets in Göteborg and Uddevalla widely exceeded the largest known haddock catches of 378,000 indi-viduals in 1884 and 664,000 individuals in 1869. Even if an unknown number of fish caught in the Kattegat are deducted from the fish mar-ket sales, the discrepancy is very high. This indicates that the longline fishermen most certainly underreported their haddock catches. As regards ling and cod, the estimated total removals seem more reason-able, although they are probably also too low. Obviously, parts of the catches were sold at other markets than Göteborg and Uddevalla or consumed within the fishing communities. As mentioned earlier, von Yhlen estimated that 25 per cent of the total longline catches in 1876, including the catches made on Storeggen, were sold in Norway.
In conclusion, the calculated total Swedish removals are conser-vative estimates, and the actual landings were probably higher. This low estimate of catches gives the abundance estimates in the follow-ing chapter a conservative bias. Accordingly, the abundance estimates should be interpreted as minimums.
No other Swedish fishermen engaged in demersal fisheries in the Skagerrak and northern North Sea in the 1870s and 1880s. The fisher-ies in Halland County were smallscale compared to the northern neighbours in Bohuslän. Most often, fishing in Halland was con-ducted from open boats, and the fishermen stayed within sight of the coastline. Some fishermen did engage in fisheries with decked boats in the area around the Danish Kattegat island of Læsø and further to the south, at the grounds of Fladen and Middelgrund, in the 1870s. However, there is no evidence of Halland fishermen pursuing fisher-ies in Kattegat at that time.394 Hence, it is safe to conclude that the Halland fisheries are irrelevant to this analysis.
394 Holmquist, p. 28-35; Lundberg, p. 200-1.
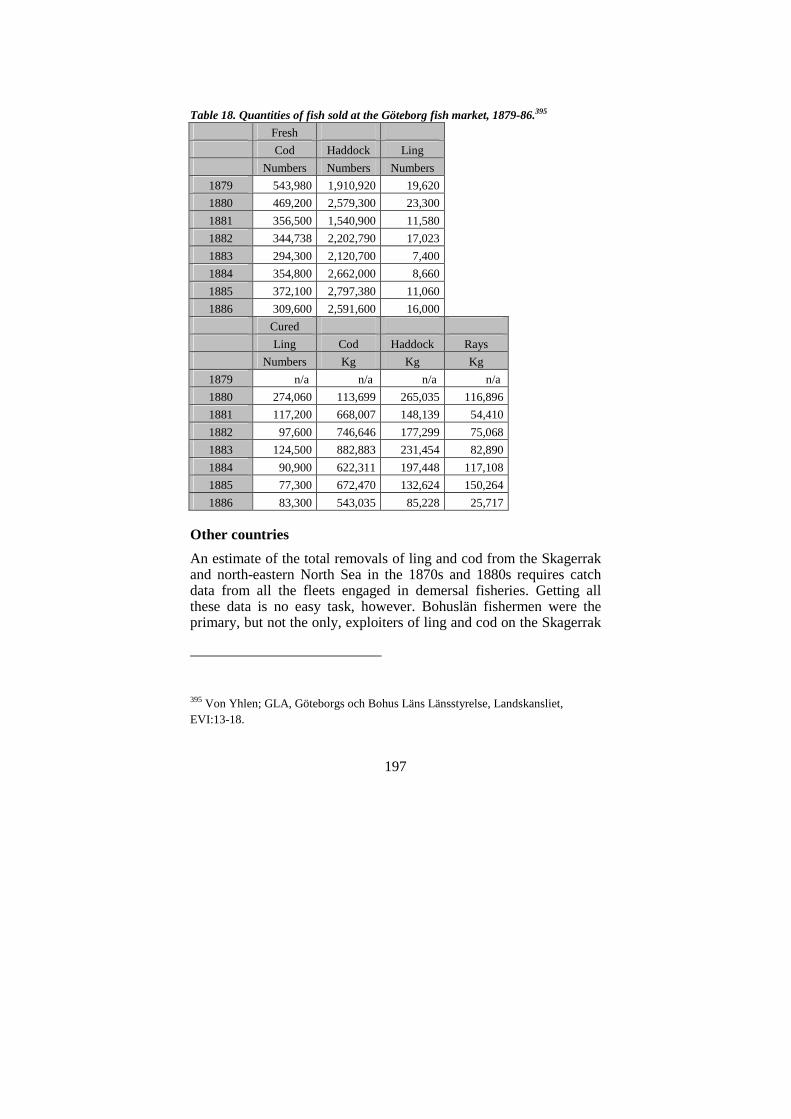
197
Table 18. Quantities of fish sold at the Göteborg fish market, 1879-86.395
Fresh
Cod Haddock Ling
Numbers Numbers Numbers
1879 543,980 1,910,920 19,620
1880 469,200 2,579,300 23,300
1881 356,500 1,540,900 11,580
1882 344,738 2,202,790 17,023
1883 294,300 2,120,700 7,400
1884 354,800 2,662,000 8,660
1885 372,100 2,797,380 11,060
1886 309,600 2,591,600 16,000
Cured
Ling Cod Haddock Rays
Numbers Kg Kg Kg
1879 n/a n/a n/a n/a
1880 274,060 113,699 265,035 116,896
1881 117,200 668,007 148,139 54,410
1882 97,600 746,646 177,299 75,068
1883 124,500 882,883 231,454 82,890
1884 90,900 622,311 197,448 117,108
1885 77,300 672,470 132,624 150,264
1886 83,300 543,035 85,228 25,717
Other countries
An estimate of the total removals of ling and cod from the Skagerrak and north-eastern North Sea in the 1870s and 1880s requires catch data from all the fleets engaged in demersal fisheries. Getting all these data is no easy task, however. Bohuslän fishermen were the primary, but not the only, exploiters of ling and cod on the Skagerrak
395 Von Yhlen; GLA, Göteborgs och Bohus Läns Länsstyrelse, Landskansliet, EVI:13-18.

198
and Jäderen grounds, and the sources on catches are incomplete from many countries.
This chapter will make a first tentative assessement of the fishing industries of the other North Sea countries in terms of fishing effort and catches. The main focus is on Denmark, which has a long, but sparsely populated coastline facing the Skagerrak. Denmark serves as an illustration of the problems related to the calculation of total re-movals. With regard to Norwegian fishery, a brief analysis is made of the quantitative evidence from the 1880s. The fisheries of the other North Sea countries fisheries are described in brief.
Danish fisheries, 1860-90 Denmark’s Skagerrak coastline is long but has no natural harbours. In the nineteenth century, the distance from the Skagerrak communities to the main population centres, and fish markets, was relatively far. This meant that the Danish Skagerrak fisheries developed later than those of the other North Sea countries. Also, Danish fisheries statis-tics were compiled at a later time than the statistics in other countries. Danish statistics were published for the first time in 1890 and covered the years 1888-89. Consequently, an estimation of the size of the industry and the catches in the 1870s and 1880s is a difficult task.
The structure and scale of the Danish Skagerrak industry can be gauged from a number of reports published before 1890. Between 1859 and 1863, A.J. Smidth, a Danish former actor, wrote a series of reports on the state of the fishing industry in Denmark. Despite his unusual previous career in acting, Smidth wrote very well-informed status reports on Danish fisheries. Serving as an advisor to the Danish government on fishing issues, Smidth made field trips to most Danish coastal communities between 1859 and 1863. His reports to the gov-ernment were published and reproduced in brief in the newspaper Berlingske Tidende.396 The aim of Smidth’s research was to identify where fishing took place, which species were pursued and when fish-ing took place. He was also charged with the task of describing the fishing vessels and the gear as well as the handling and curing of fish.
396 Moustgaard, p. 9-36.

199
Additionally, he was also to estimate the population of fishermen and assess their financial situation.397 The location of the Danish Skager-rak fishing communities is shown on the map below.
Figure 30. Fishing communities in northern Jylland, Denmark, ca. 1890. 398
In the summer of 1863, Smidth visited the fishing communities
on the Danish Skagerrak coast from Skagen to Vigsø. Based on statis-tics forwarded to him by a local official, Smidth recorded the number of boats and dinghies and crews in each fishing village. The cod fish-ery was the most important sector, and it was the first item in the report. It was conducted with hand lines in the spring and in the fall. In the winter, however, longlines were employed in the cod and had-dock fisheries. The fish was sold fresh or dried. Various flatfish, skates and ‘other large fish’ were also caught, but Smidth made no
397 Smidth, p. 37. 398 Reproduced from Drechsel, Kort D.

200
specific mention of ling,399 which indicates that ling was not an im-portant target species for Danish fisheries. In total, 828 people were engaged in all types of fisheries on this coast;400 another 240 fisher-men lived in Skagen.401 It is, however, not possible to estimate how many of them were engaged in demersal fisheries.
Further to the south, between Vigsø and the Limfjord, fishing was also small-scale. Except for two fishing communities, Agger and Klitmøller, Smidth never visited this part of the coast, and he got his information from two local officials. The fishery resembled the fish-ing activities further to the north, and it was carried out only a few kilometres from the coast, which is indicative of its small scale.402 Smidth recorded the total cod and haddock catches made by the fish-ing communities on the approx. 40 kilometres long coastline between Stenbjerg and Hansted in 1858. He reported that 50,577 cod and 2,775 snese haddock (i.e. 55,500 individuals, counting 20 per snes) had been caught. Five decked boats as well as a number of smaller undecked boats and dinghies were employed. Smidth was unim-pressed by these catches and stated that there was a need for govern-ment assistance to the fishery.403 Even though Smidth hoped for an expansion of the fishery, catches of 55,500 cod were not insignificant, at least not compared to the estimated total cod catches made by the Swedes in the Skagerrak and off Jäderen between 1872 and 1886.
Smidth was rather brief in his reports on the Skagerrak fisheries, whereas he made a more detailed description of the fisheries from Nymindegab, further to the south, which he visited in 1860. Most often fishing was carried out only a few kilometres from the coast. In case of congestion on the grounds, the fishermen could go further out,
399 Smidth, p. 205-8. 400 Smidth, p. 206-8. 401 Smidth, p. 45. 402 Smidth, p. 135-9. 403 Smidth, p. 139. The catches of haddock were 2,775 snese. Assuming that one snes was twenty fish, the catch of haddock was 55,500. However, the counting of haddock was inconsistent. In certain places, the number of haddock per snes varied. In Nymindegab even 36 or 37 fish was counted as one snes. Smidth, p. 103.

201
thus losing sight of the coastline. Smidth estimated that with its longlines, one vessel could catch 4,000 haddock and 200 large cod per day in addition to rays and other species.404 This was the case under the most favourable conditions with good weather, high stock abundances and sufficient bait, and at maximum fishing effort. Com-pared to those of the Swedish fishermen, these are very high catch rates. The bottleneck that kept the fishing industry at a low level was lack of demand. In this sparsely populated area, there was no large market for fish.405
Smidth advised the government to support fisheries with decked boats in the North Sea, and looked to the Bohuslän longline fisher-men as an ideal. In 1859, Smidth visited Consul Bergh from Göte-borgs och Bohusläns AB för Storsjöfiske to learn about the Swedish company’s fishing strategy. Smidth was impressed by the good qual-ity of the company’s fish curing and visited Göteborg in 1861 to ex-amine the price of decked vessels.406 On Smidth’s advice, the Danish government advanced funds for the acquisition of one decked vessel, named the ‘D.G. Monrad’, in 1862. A group of Skagen fishermen used it to go to Storeggen with the intention of fishing along the Swedish lines, but ultimately the venture was unsuccessful.407
The situation in the early 1860s can be compared to 1883 when Arthur Feddersen, editor of the journal Nordisk Tidsskrift for Fiskeri, published an article about Danish fisheries in which he stated that cod was by far the most important species for Danish fisheries. Haddock was also important, and once in a while good catches were made of ling and whiting. Feddersen concluded, however, that ling, which could get very large, had ’no particular importance to our fishery’.408 Denmark’s fisheries were small-scale compared to fisheries of the other North Sea countries, and the Danes did not take part in fisheries in the North Sea proper. Fisheries from Jylland were only carried out
404 Smidth, p. 103. 405 Smidth, p. 102-3. 406 Smidth, p. 44-6, 140, 143. 407 Moustgaard, p. 29-31; Holm 1991, p. 189-91; Bertelsen et al., 1984, p. 89. 408 Feddersen, p. 26-7.

202
close to the coastline, and the fishermen depended on fish migration to coastal areas.409 In other words, there was no indication of any expansion in the Skagerrak cod fisheries from 1860 to the mid-1880s. It should be mentioned, though, that Danish flatfish fisheries started a long-term expansion in the 1880s.410
In 1888, C F Drechsel was employed as a Danish fisheries in-spector. In 1891, Drechsel published a book containing a description of the main Danish fisheries, including those in the Skagerrak and the North Sea fisheries.411 The Danish North Sea and Skagerrak demersal fisheries were still being conducted from open boats. Esbjerg, in the south-west of Denmark, had decked boats, but they focused on the southern North Sea only. Drechsel described the cod and haddock fishery as a coastal fishery only. Fishing was conducted only a few kilometres from the coast. Each vessel used 10-12 lines, each with 600 hooks. Figure 31 is a reproduction from Drechsel’s book, show-ing the technology employed by the Danish fishermen in the Skager-rak. The Danish fishermen pursued cod, haddock, whiting, as well as piked dogfish and rays, but Drechsel made no mention of ling.412 This indicates that ling were not found in the shallow parts of the Skager-rak close to the Danish coast.
The situation as described by Feddersen and Drechsel did not dif-fer significantly from the situation in the 1860s. There is no indica-tion of any major increase in fishing effort or any spatial expansion, and fishing technology had not changed significantly, either.413 This is an important conclusion because it has implications for the calcula-tions of cod abundances, which will be discussed in the following chapter.
409 Feddersen, p. 3. 410 Holm, 1991, p. 202-9; Bertelsen et al., 1984; Bertelsen et al., 1985. 411 Drechsel. 412 Drechsel, p. 26-32, 67. 413 Holm 1991, p. 181-218; Bertelsen et al., 1984; Bertelsen et al., 1985; Christensen, 1984; Johansen.

203
Figure 31. Technology employed in the Danish longline fisheries in the Skagerrak, c. 1890. 414
Danish catches, 1890-1914 From 1888 onwards, Drechsel published an annual report on the Dan-ish fishing industry, entitled Fiskeriberetningen, which contained data sets on fishing effort and catches. The main purpose of Drechsel’s annual reports was similar to that of the Swedish fisheries inspectors’ reports, i.e. to identify the state of the fishing industry.
Drechsel’s reports also contained information on the spatial dis-tribution of fishing effort in the Skagerrak area. In 1890-91, Drechsel reported of complaints by Skagerrak longline fishermen, who said that the fish stayed further to sea than usual. This meant that the fish-ermen had to venture approx. 5-8 km from land, and this was a diffi-cult task with small boats, which usually only went approx. 3-5 km
414 Reproduced from Drechsel, Pl. IV. B.

204
from the coast. For fishermen with small dinghies (pramme) it was even more difficult, since they would usually go only 2-3 km from the coast.415 The complaints indicate that the Danish Skagerrak fisher-ies were still focused on the coastal area in the early 1890s. Contrary to the Swedish longline fishermen, the Danes did not frequent the deeper parts of the Skagerrak. Drechsel listed the fishing grounds frequented by Danish fishermen again in 1893-94. Fishing took place from most coastal communities between Skagen and Klitmøller up to approximately 11 km from the coastline, which supports the conclu-sion that it was mainly a coastal fishery, but it also shows a gradual spatial expansion.416 The first volume of the Danish annual reports covered the years 1888-89, but no statistics were available for the Danish North Sea and Skagerrak fisheries before 1891. Based on statistics from the reports, it is possible to make estimates of the Dan-ish cod and haddock catches from the Skagerrak in the 1890s and 1900s. These estimates are relevant to the next chapter’s abundance calculations of cod, and they may put the Swedish catches in a broader perspective.
In 1905-06, Drechsel mentioned that some Danish fishermen were sceptical of fisheries statistics, fearing that they would be used to impose taxes on the catches.417 This kind of scepticism might cause the fishermen to underreport catches. Drechsel was not specific about where the sceptical fishermen lived, so he could be speaking of fish-ermen from the Skagerrak coast or other parts of Denmark. It proba-bly took some time for the fisheries inspector to make everybody familiar with the system of data collection. To some extent, statistics of growing catches and fishing fleets may reflect a gradual improve-ment of reporting practices that became more comprehensive and efficient. Thus part of the growth in the Danish fishing industry in the 1890s and early 1900s as evidenced by the annual reports is probably attributable to the gradual improvement of the data collection system. Despite these caveats, the total removals from the Skagerrak made by
415 Fiskeri-Beretning 1890-91, p. 83. 416 Fiskeri-Beretning 1893-94, p. 105. 417 Fiskeri-Beretning 1905-06, p. 75.

205
Danish fishermen can be estimated roughly from the published, an-nual reports.
There is one obstacle to the calculation of total catches. Until 1906, Danish cod and haddock catches were reported partly in num-bers and partly in weight. From 1907 onwards, all catches were re-corded by weight. A conversion from weight to numbers is required to allow estimation of the total Danish removals. To do such a con-version requires the average weight of the fish. Haddock may serve as an example of how the total catches were calculated. A similar meth-odology is applied to cod catches.
For the Skagerrak coast, most haddock catches were landed in the Thisted customs district. Between 1895 and 1906, some catches were reported in numbers and others by weight. The official Danish fisher-ies statistics reported the value of both. Accordingly, the price per individual fish and the price per kg can be calculated. By comparing the two time series of prices, the average weight of one fish can be estimated. It is assumed that the quality of the fish sold by number and by weight was the same. The calculations show that the average weight fluctuated around 1 kg with no apparent time trend from 1895 to 1906. Similar calculations can be made for all catches made on the Danish North Sea and Skagerrak coasts, which supports the calcula-tions made by the Thisted customs district.
The question is if an average weight of 1 kg is supported by other evidence? In 1883, Arthur Feddersen, the Danish fisheries journal editor, stated that common haddock in Danish waters hardly weighed more than between 2.5 and 3 kg, although it could grow to twice that weight.418
In his annual report from 1899, Drechsel stated that haddock caught in the Skagerrak from the Løkken customs district was of good quality, and each snes of fish weighed 40 pd.419 Since one snes consisted of approx. 20 individuals, and 1 pd. was 0.5 kg, the average weight of the haddock was approximately 1 kg. Information dating
418 Feddersen, p. 27. 419 Fiskeri-Beretning 1899-1900, p. 37.

206
from 1894 from the Lemvig customs district also supports these cal-culations, showing an average weight of ca. 0.75 kg.420
Information on the average fish size is also available from a dis-tinguished, Danish marine biologist, C G Joh Petersen. Petersen wrote a chapter on the biology of the most common fish in Danish waters for Drechsel’s book from 1891. According to Petersen, the haddock caught were usually between 31 and 63 cm, but they could grow much larger.421 By means of the modern length-weight ratios for North Sea haddock in the online database Fishbase, the historical lengths can be converted to weights.422 Today, haddock of 31 and 63 cm weigh 0.3 kg and 2.5 kg, respectively. A 47 cm long haddock – halfway between 31 and 63 cm – weighs 1 kg. In conclusion, an aver-age weight of 1 kg for the haddock caught in the Skagerrak appears to be a rough, but fair estimate.
By assuming an average weight per haddock of 1 kg it is possible to calculate total catches; the results are shown in Figure 32. The estimated total catches show a high degree of variability, fluctuating between 240,000 and 1,800,000 individuals.
A similar methodology has been applied to cod catches. The av-erage weight fluctuated mainly between between 4 and 7 kg. This is lower than the estimate stated by Arthur Feddersen, the editor of a Danish fisheries journal. Writing in 1883, Feddersen said that cod caught along the Danish west coast usually weighed between 10 and 15 kg, and some fish were even larger.423 Feddersen’s estimate is very high, and fish sizes could have developed between 1883 and the 1890s. Thus, an average weight of 5.5 kg per cod is assumed in the calculations of the total Danish removals from 1891 to 1914. In the early 1890s, catches of approx. 150,000 cod were estimated, and Danish catches increased gradually during the 1890s and 1900s. The Danish catches compares to the annual Swedish catches of approx. 150,000 - 200,000 individuals from the Skagerrak and Jäderen
420 Fiskeri-Beretning 1894-95, p. 120. 421 Drechsel, p. 130. 422 www.fishbase.org, North Sea haddock. 423 Feddersen, p. 26.

207
grounds in the 1870s and 1880s. In other words, the Danish coastal cod catches from the Skagerrak may have been considerable at the time.
0
200.000
400.000
600.000
800.000
1.000.000
1.200.000
1.400.000
1.600.000
1.800.000
2.000.000
1891 1894 1897 1900 1903 1906 1909 1912
Num
ber
of in
divi
dual
s
Figure 32. Estimated total removals of haddock, Danish Skagerrak fisheries, 1891-1914, number of fish. Assumed average weight: 1 kg. 424
424 Fiskeri-Beretning 1888/89-1914.
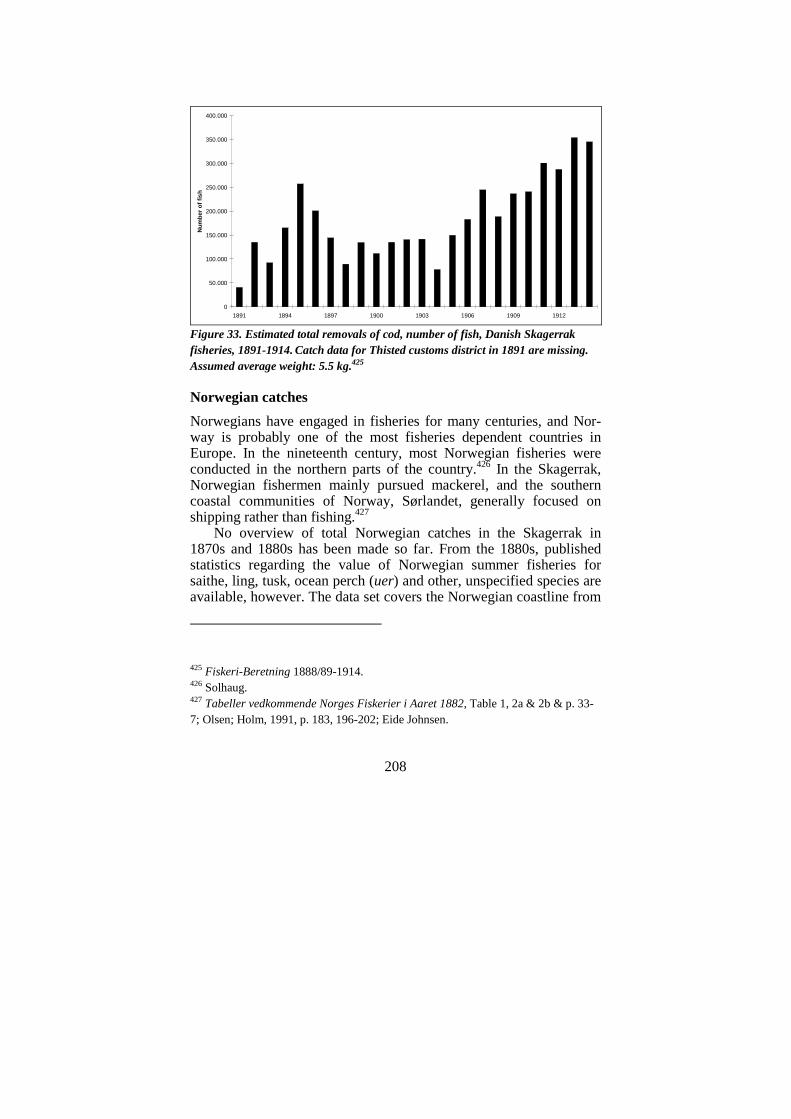
208
0
50.000
100.000
150.000
200.000
250.000
300.000
350.000
400.000
1891 1894 1897 1900 1903 1906 1909 1912
Num
ber
of fi
sh
Figure 33. Estimated total removals of cod, number of fish, Danish Skagerrak fisheries, 1891-1914. Catch data for Thisted customs district in 1891 are missing. Assumed average weight: 5.5 kg.425
Norwegian catches
Norwegians have engaged in fisheries for many centuries, and Nor-way is probably one of the most fisheries dependent countries in Europe. In the nineteenth century, most Norwegian fisheries were conducted in the northern parts of the country.426 In the Skagerrak, Norwegian fishermen mainly pursued mackerel, and the southern coastal communities of Norway, Sørlandet, generally focused on shipping rather than fishing.427
No overview of total Norwegian catches in the Skagerrak in 1870s and 1880s has been made so far. From the 1880s, published statistics regarding the value of Norwegian summer fisheries for saithe, ling, tusk, ocean perch (uer) and other, unspecified species are available, however. The data set covers the Norwegian coastline from
425 Fiskeri-Beretning 1888/89-1914. 426 Solhaug. 427 Tabeller vedkommende Norges Fiskerier i Aaret 1882, Table 1, 2a & 2b & p. 33-7; Olsen; Holm, 1991, p. 183, 196-202; Eide Johnsen.

209
the Norwegian-Swedish border (Smaalenene county) to the Bergen-hus counties in the vicinity of Bergen. Figure 34 shows the catch values in these fisheries compared to the values of catches made in the Swedish longline fisheries. It is uncertain how large a portion of the Norwegian income was generated by ling catches. It could be interesting to perform an in-depth analysis of Norwegian fish market data to assess the scale of the Norwegian ling catches. Despite this uncertainty, the graph clearly shows that the Swedish fisheries out-performed the Norwegian fisheries considerably in the 1880s, which indicates that the Swedes were the main exploiters of ling on the Skagerrak and Jäderen grounds at the time. This is admittedly an extremely tentative analysis, and more information on the scale of the Norwegian fishery would be highly relevant to the assessment of ecological changes in the nineteenth century North Sea.
kr 0
kr 200.000
kr 400.000
kr 600.000
kr 800.000
kr 1.000.000
kr 1.200.000
1880 1883 1886 1889 1892 1895 1898 1901 1904
Norwegian, Skagerrak, Stavanger & BergenhusNorwegian, SkagerrakSwedish, longline
Figure 34. Catch value in Swedish longline fisheries and Norwegian summer fisheries for saithe, ling, tusk, ocean perch (Uer) etc.. The Norwegian data set covers the Skagerrak and Jäderen coastlines from Smaalenene to Bergenhus.428
428 Tabeller vedkommende Norges Fiskerier i Aaret i 1882-1904; Berättelse 1880-1904/05.

210
British, German and Dutch catches
The above analysis has focused on countries bordering the Skagerrak and Jäderen grounds. The question is, however, whether fishing ves-sels from other countries visited these grounds in the 1870s and 1880s.
In the 1890s and 1900s, the Danish fisheries inspector published information on foreign – i.e. British and German – trawlers sighted in Danish territorial waters. These reports indicate that the fishing grounds were increasingly frequented by fleets from other countries than Sweden, Denmark and Norway.429 As early as the 1870s, the Danish journal Tidsskrift for Fiskeri reported that English fishermen were sighted off the sourthern parts of Jylland.430 In July 1889, an English fishing fleet was observed off Hirtshals on the Danish Skagerrak coast. According to Drechsel, this was the first time Eng-lish fishing vessels were sighted by Danish fishermen that far to the north.431 The British were there to stay, however, and in 1893-94 Drechsel reported that British fisheries were conducted on grounds in the Skagerrak off Hanstholm, Hirtshals and Skagen.432 In 1895 the British caused problems for Swedish longline fishermen in Skagerrak, who lost gear due to interference from the British trawls.433 This was a classic conflict, which indicates that Scandinavian fishermen were sharing the Skagerrak grounds with other countries’ fleets in the 1890s.
In 1897 Drechsel observed a small decline in the number of sight-ings of foreign vessels, and he reasoned that this was due to the dis-appointing catches made in the North Sea. Foreign trawler fishermen increasingly turned their attention to fishing grounds beyond the North Sea, such as off the Faroes.434
429 Fiskeri-Beretning 1888/89-1900/01. 430 Tidsskrift for Fiskeri 1872, p. 23-32; Tidsskrift for Fiskeri 1873, p. 209-14. 431 Fiskeri-Beretning 1889-90, p. 78. 432 Fiskeri-Beretning 1893-94, p. 104-5. 433 Berättelse 1895-96, p. 3. 434 Fiskeri-Beretning 1898-99, p. 159.

211
Figure 35. The spatial expansion of British fisheries, nineteenth century. The expansion started in the 1820s from areas denoted A and the fisheries reached the areas F and G at the end of the century. 435
435 Alward.

212
A more quantitative answer regarding the spatial distribution of fishing effort is difficult to establish. Figure 35 shows a map of the geographical expansion of the British fisheries from the 1820s until the 1890s. Originally, the map was presented as part of a lecture held by George Alward, a British trawler owner, at the Grimsby Institute of Engineers and Shipbuilders in 1911. The lecture and the map were subsequently published,436 but unfortunately, Alward did not specify his sources. Taken at face value, the map shows the gradual expan-sion of the British fishing fleet from the southern and western North Sea towards the Dutch, German and Danish coasts and into the north-ern North Sea by the end of the 1880s. According to Alward, British fishing for plaice to the west of Jylland was launched around 1880, and by 1889 the fishery had expanded into Skagerak, where plaice and hake were caught. From Alward’s map it appears that the British fishing fleets had not made it to the Skagerrak or Jäderen grounds in the early 1870s.
The Germans also developed a fleet of steam trawlers similar to that of the British, although the development happened later than in Britain.437 Even before steam vessels were introduced in the German fleet, Germans participated in the North Sea fishery, but it was mainly a coastal fishery until the 1880s.438 It is difficult to assess if any Ger-man vessels ventured to the Skagerrak or the Jäderen grounds in the 1870s and 1880s. The German historian Günther Rohdenburg briefly mentioned the spatial distribution of fishing effort in the German fleet in his book on the fisheries of Bremen in the nineteenth century. Rohdenburg’s information indicates that the Germans may not have made it to the same fishing grounds as the Swedes in the 1870s and 1880s.439 However, by the late 1890s German steam vessels went as far as Iceland to take part in the trawl fisheries.440
436 Alward. 437 Rohdenburg; Grotewold. 438 Heidbrink, p. 31. 439 Rohdenburg, p. 53, 248, 283. 440 Heidbrink, p. 35-43.

213
The Dutch also had long fishing traditions, and the question is if they fished for demersal species in the Skagerrak or north-eastern parts of the North Sea in the 1870s and 1880s. In 1894, the Dutch fisheries historian A. Hoogendijk published a map on the North Sea fishing grounds frequented by Dutch vessels in the nineteenth cen-tury. The Dutch fisheries for cod was conducted between 56o and 58o north, and 1-5o east, an area stretching from the south west of the Norwegian Trench and straight to the west of Denmark. Thus it seems that the Dutch were focusing mainly on an area to the south and west of the Swedish longline fisheries’ main grounds.441 Accord-ing to Hoogendijk’s map, no Dutch fisheries were conducted in the Skagerrak. The Dutch caught only few ling, and according to Hoogendijk ling was most abundant off the Norwegian coast.442
In conclusion, there is no firm evidence of British, German or Dutch fisheries for ling and cod in the Skagerrak and north-eastern North Sea in the 1870s and 1880s. This does not preclude, however, that vessels from these countries could have frequented the same fish-ing grounds as the Swedes and thus have caught ling and cod. The above analysis is only brief, and a systematic, in-depth study of the spatial patterns in the three countries fishing fleets in the nineteenth century would be very relevant for the environmental history of the North Sea. The lack of information on spatial fishing patterns in Brit-ain, Germany and the Netherlands adds uncertainty to the historical abundance estimates. In the following analysis it is assumed that no catches were made by the British, the Germans or the Dutch. If this assumption is erroneous, the abundance estimates are too low. If the three countries’ fishing fleets are disregarded, the estimates become conservative.
441 Hoogendijk, p. 141. 442 Hoogendijk, p. 144.

214
Figure 36. Dutch North Sea fishing grounds, ca. 1894. Fishing took place in the dark areas of the map, to the south and west of the Skagerrak and Jäderen.443
443 Hoogendijk, Plaat XXXIII.

215
Total North Sea removals, 1903-14
Around the turn of the century a group of distinguished marine scien-tists from the Scandinavian countries, Great Britain, Germany, the Netherlands, Belgium and France established the International Coun-cil for the Exploration of the Sea (ICES). ICES developed into a fo-rum of international fisheries research, and its members were the coastal states of Northern Europe.444
From its foundation, ICES compiled fisheries statistics from the individual member countries and published them annually under the title Bulletin Statistique. ICES’ statistics were based on national fish-eries statistics of the member countries. Figure 37 shows North Sea ling catches from 1903 to 1913 as stated in the Bulletins Statistique. The Swedish ling catches are absent from the graph, since the Swed-ish fisheries inspectors did not collect such statistics at the time. Scot-land had the largest catches of 4,000 to 6,000 tonnes, followed by England and Norway with a maximum of 2,700 and 3,000 tonnes, respectively.
The total catches made by the Scottish, English, Norwegian, Dan-ish, German, Belgian and Dutch fleets after the turn of the century fluctuated between 8,000 and 12,000 tonnes, which was equivalent to the catches made in the North Sea in the late 1990s. The modern data, which were also compiled by ICES, are shown in Figure 38.445 When the unknown Swedish catches from the early 1900s are taken into account, it is obvious that total North Sea ling catches made around 1900 exceeded the catches made today. Thus, a group of Norwegian, Faroese and Icelandic fisheries biologists were wrong when they re-cently concluded that the ling stocks in the North Sea had been ‘al-most unexploited’ as late as in the 1950s.446 A significant exploitation of North Sea ling had taken place in the nineteenth century.
444 Rozwadowski, p. 9-76. 445 ICES 2004, p. 382-3. 446 Magnússon et al., p. 48.

216
-
2.000.000
4.000.000
6.000.000
8.000.000
10.000.000
12.000.000
14.000.000
1903 1905 1907 1909 1911 1913
Kg
DenmarkNorwayBelgiumNetherlandsGermanyEnglandScotland
Figure 37. North Sea ling catches by country, 1903-13, as stated by ICES Bulletins Statistique. Swedish data are missing.447
447 Bulletins Statistique 1903-1914.

217
0
2.000
4.000
6.000
8.000
10.000
12.000
14.000
16.000
1988 1990 1992 1994 1996 1998 2000 2002
Ton
nes
IIIIVaIVb,cTotal
Figure 38. Ling catches from the North Sea and the Skagerrak, 1988-2003, by area. 448 III is the Skagerrak and Kattegat. IVa is the northern part of the North Sea. IVb and IVc are the middle and southern parts of the North Sea, respectively.
Conclusion
The Bohuslän fishing fleet was the main exploiter of ling in the Skagerrak and off Jäderen in the 1870s and 1880s. Based on the Swedish data sets it is possible to make a conservative estimate of the total removals of ling and cod from the Skagerrak and northeastern North Sea for the 1870s and 1880s.
Danish fishermen operated a coastal fishery for cod but stayed in the shallow waters within sight of the Jylland coast. Regardless of the small scale of the Danish coastal fishery, significant numbers of cod and haddock were caught in the 1890s. The Danish cod catches in the early 1890s equalled the cod catches made by Swedish fishermen in the Skagerrak in the 1880s. Norwegian catches from the 1870s and 1880s are difficult to estimate, but Norwegian sources indicate that
448 ICES 2004, p. 382-3.

218
the Norwegians probably did catch ling, although not nearly as many as did the Swedes.
There is some uncertainty regarding the fishing fleets of the other North Sea countries. The Dutch and the Germans probably did not target ling in the Skagerrak and off Jäderen in the 1870s, and the Brit-ish probably had not made it to these grounds at the time. The esti-mated total removals do not account for any possible catches made by other countries’ fleets than the Swedish. In conclusion, the estimates are conservative, which means that the abundance estimates presented in the next chapter are minimums.

219
Historical stock abundances and fish sizes
Since 2002, the fisheries advisors of the International Council for the Exploration of the Sea (ICES) have recommended total closure of the fishery for cod in the North Sea and the Skagerrak, as well as fisher-ies in which cod are caught as bycatch. ‘Zero catch’ is advised, be-cause the cod stock is being ‘harvested unsustainably’ and the repro-ductive capacity of the stock currently is reduced. While the recom-mended precautionary spawning stock biomass is 150,000 tonnes, the most recent estimate of the stock is below 40,000 tonnes. The purpose of the reference point for the spawning stock biomass is to safeguard the stock against collapse, and the reference point is established on the basis of data sets of stock recruitment and abundance. The time series for the data sets go back to 1963.449
There is currently no definite knowledge on the North Sea ling stock. Due to the lack of available information, no stock assessment is undertaken, and no precautionary reference point for the spawning stock biomass has been defined. Currently, the Advisory Committee for Fisheries Management of ICES recommends a 30 per cent reduc-tion in fishing effort in ling fisheries.450 In terms of catches, the fish-ery for ling is not nearly as important as those for cod and haddock. It is primarily conducted off northern Norway, Shetland, the Hebrides, Ireland and the Faroes as well as on the Rockall bank northwest of Ireland. Ling catches from the North Sea and the Skagerrak were 9,600 tonnes in 2002, having peaked at 14,500 tonnes in 1996. A mere 263 tonnes of the catch came from the Skagerrak in 2002.
The most important knowledge about demersal stock abundances in the North Sea only goes back to the 1960s. The long-term devel-opment of the fish stocks prior to 1960 is not taken into account in the advice. Estimating historical fish stock abundances permits an evalua-tion of the modern reference points within fisheries management. The 449 ICES 2002b, p. 219; ICES 2003; ICES 2004, p. 200-15; ICES 2006, vol. 6, p. 24-45. 450 ICES 2006.

220
question is whether the present reference point for the spawning stock biomass for cod is a realistic goal, even in a long-term historical per-spective. Since less information is available on ling, it is also perti-nent to ask what historical abundance estimates can reveal about the present state of the stock. These issues are discussed in the present chapter.
Stock structure and population dynamics
The concept of fish stocks So far, the concept of fish stock has been referred to without a proper definition. According to marine scientists Jennings et al., fish:
‘…form a series of stocks that are reproductively isolated in space or time. As a result, stocks re-spond more or less independently to the effects of fishing, and their own birth and death rates have a more consequential effect on their dynamics than those of adjacent stocks.’451
In short, a fish stock is an isolated group of fish of a particular spe-cies. The stock has common attributes such as natural mortality, growth rates and migration patterns which sets it apart from other fish of the same species located in other areas. Often it is very difficult to clearly define population boundaries. Nature is seldom as homoge-nous and clearcut as the definitions and it can be difficult to distin-guish between stocks. Genetic variation, however, is not an absolute requirement for distinguishing between stocks. Jennings et al. say:
‘Whether stocks differ genetically depends on their isolation, and a lack of genetic differentia-tion does not imply that the stock is not a useful management unit. For example, a transfer rate of 5 % of individuals each year between two stocks may lead to genetic homogeneity, but for practi-
451 Jennings et al., p. 178.

221
cal management purposes the stocks’ population dynamics will be largely independent.’452
Hilborn and Walters also discuss the issue. They say:
‘A unit stock is an arbitrary collection of popula-tions of fish that is large enough to be essentially self-reproducing (abundance changes are not dominated by immigration and emigration), with members of the collection showing similar pat-terns of growth, migration, and dispersal.’453
Life histories differ significantly for fish stocks, and the life his-tory parametres of the fish stocks influence their responses to exploi-tation. Some species have short lives and mature at a young age; such species tend to have a high growth potential. Others are long-living, have a low fecundity, and are relatively slow-growing. In general, rapidly growing species which quickly reach maturity are more resil-ient to exploitation than large, slow-growing species which mature at a high age.454
In the following, two questions in regard to the stock structure and population biology of ling are examined. The first question deals with the extent to which ling formed distinct populations in the Skagerrak and northeastern North Sea in the 1870s and 1880s. The second question seeks to clarify the life history parametres of ling and how resilient this species is to exploitation. The main focus is on ling, which was the main target species of the Swedish longliners, and the biology of cod is described in less detail.
Population dynamics Adult ling are top predators in the North Sea ecosystem,455 but never-theless, little is known about the biology and stock structure of this 452 Jennings et al, p. 178. See also p. 62. 453 Hilborn & Walters, p. 67. 454 Jennings et al., p. 242; Hutchings, p. 149-74; Large et al., p. 151, 155-6; Myers et al. 2003. 455 Bergstad et al.

222
deep-water species. Ling eggs are being observed over wide areas of the north east Atlantic, and it is difficult to identify specific spawning grounds. Spawning time is in the spring and early summer; in the North Sea area, spawning occurs in March and April. Ling feed on fish species like blue whiting, herring and cod as well as crustaceans. There is some uncertainty with respect to the boundaries of the ling stocks in the North Atlantic and the North Sea.456 Norwegian marine scientists have attempted to separate the stock components by means of a genetic analysis. Given the low degree of genetic variability of ling, it is difficult to distinguish between stocks, however. Though ling in isolated areas might be considered separate stocks, the ICES working group on deep sea species has found no evidence of distin-guishable stocks along the continental shelf west and north of the British Isles and the northern North Sea.457 Even so, in the following analysis it is assumed that ling in the Skagerrak (the western part of ICES Division IIIa) and the north-eastern North Sea (the eastern part of ICES Division IVa) constituted a separate stock at least in the 1870s and 1880s. It is assumed that the impact of immigration and emigration was low compared to the internal dynamics determined by recruitment variation, growth, and mortality due to various sources.
Knowledge of ling dynamics in response to fishing is limited. Some deep-water species and sharks and rays are considered to be very vulnerable to exploitation. Being long-lived and having slow growth rates and a low reproductive potential, such deep-sea species are susceptible to fast depletion. Ling, on the other hand, has an in-termediate life history strategy: It matures at age 5-7 years, its abso-lute fecundity reaches millions, and longevity is approximately 20 years. The natural mortality of ling is estimated at 0.2-0.3.458
The North Sea cod stock is currently at a ‘historically’ low level. The biomass is at its lowest level since 1963, when the first stock assessments were made. In 2003 there were 34 million cod aged three years or older in the North Sea, the Skagerrak and the eastern English
456 Bergstad et al.; Magnússon et al.. 457 ICES, 2004; Bergstad et al. 458 ICES 2004.

223
Channel. This estimate is in contrast to the estimate of 149 million individuals in 1973. In 2003, an estimated 78,000 tonnes of cod were caught in the North Sea, the Skagerrak and the eastern English Chan-nel. After having peaked at almost 580,000 tonnes in 1980, catches decreased significantly over a twenty-year period. The ICES Advi-sory Committee for Fisheries Management recommends complete closure of the cod fishery in order for the stock to recover. The stock is currently well below the precautionary approach reference point for a spawning stock biomass of 150,000 tonnes.459 Until 1992, a separate assessment was made for cod in the Skagerrak, but from 1993 on-wards the Skagerrak and North Sea cod assessments were merged. In the following analysis we assume that cod in the Skagerrak and the north-eastern North Sea constituted a separate stock in the nineteenth century.
Stock abundances
Methodology Usually data from trawl sampling is used in the estimation of fish stock abundances. For some species, including ling, tusk and halibut, such data are not available, since these species are rarely caught in trawls, which is why data from longline fisheries in their case are the most important source of information.460 Using data sets from longli-nes is not always unproblematic, however. The problems related to abundance estimates based on data from longliners are discussed by the scientists Arill Engås and Svein Løkkeborg in their book Marine Fish Behaviour in Capture and Abundance Estimation from 1994.461 According to Engås and Løkkeborg,
‘…the quantity and composition of … longline catches may vary considerably from situation to
459 ICES, 2004. 460 Fernö et al., p. 134. 461 Engås et al., p. 134-65.

224
situation, independently of overall population abundance and structure.’462
Engås and Løkkeborg list some concerns, and the question is if these concerns are relevant to the analysis of historical catch rates data.
The demersal species have different bait preferences, and there-fore the fishermen’s choice of bait can affect the composition of the catch.463 This was common knowledge also for the fishermen of the nineteenth century. Ling was not used as bait for the storbackor, since they avoided hooks with bait of their own species.464 The available sources do not offer any indications of any changes of bait species over the nineteenth century, and therefore this issue has been disre-garded in the following analysis. The bait types are simply assumed to be constant throughout the period.
According to Engås and Løkkeborg, the seasonal and diurnal changes for ling and cod should also be accounted for in a catch rate analysis; however, this is not relevant to this study.465 Between 1872 and 1886, the Swedish longline fisheries were conducted in the same season every year, and there is no evidence of a change with respect to the time of the day when longlines were set and retrieved.
Basically, three requirements need to be fulfilled to be able to calculate historical fish stock abundances. Firstly, the catch data should cover a separate fish stock. Secondly, an estimate of the total removals from the stock should be available. Thirdly, catch rate data should be available from a fishing fleet that was representative of the total fishing effort expended on the stock. The question is to what extent these three requirements are met for the ling and cod data sets from the Skagerrak and northeastern North Sea in the 1870s and 1880s.
As mentioned above, it is very difficult to determine the bounda-ries of ling stocks, and it is uncertain if the fish caught off Jäderen and in the Skagerrak constituted a separate stock. Nevertheless, they
462 Fernö et al., p. 159. 463 Fernö et al., p. 150-1; Løkkeborg et al., p. 312-5. 464 GMA 427. 465 Fernö et al., p. 135-8.

225
are treated as such in the following analysis. There is also some un-certainty with respect to the stock separations for cod in the North Sea and the Skagerrak. ICES working groups have calculated the stock abundance for cod since 1963. Until 1992 they undertook a separate stock assessment for the Skagerrak, treating the Skagerrak cod as an isolated stock. From 1992 onwards, however, the Skagerrak was incorporated into the North Sea assessment.466 In the following analysis it is assumed that cod in the Skagerrak and the northeastern parts of the North Sea were a separate stock in the 1870s and 1880s.
As regards total removals, the preceding chapter concluded that the estimates were probably conservative. Underreporting of catches could have taken place, and the abundance estimates are based on Swedish catches only. The Swedish catches did represent the main part of the ling catches from the Skagerrak and Jäderen grounds, but Norwegian fisheries statistics indicate that some ling catches were also made in Norway in the 1880s. While Danish fishermen did not target ling, Danish cod catches from the Skagerrak were significant in the 1890s and probably also earlier, even though the fishery was con-ducted within sighting distance of the coast. Additional catches could have been made by other countries’ fishing fleets, but most probably at a lower level. Discarding or high grading of catches at sea is a ma-jor problem relating to modern catch data, but there is no evidence of such practices in the Swedish sources from the nineteenth or early twentieth century.
The third requirement concerns representative catch rate data. Certainly, the data set available from Sweden was representative of the total Swedish fishing effort. It is difficult, however, to estimate if the Swedish fleet was also representative for Danish or Norwegian fleets in the 1870s and 1880s. This is a question which cannot be answered properly, and adds uncertainty to the analysis.
466 The first merged assessment for the North Sea and Skagerrak cod was made in ICES CM 1993/Assess:5.
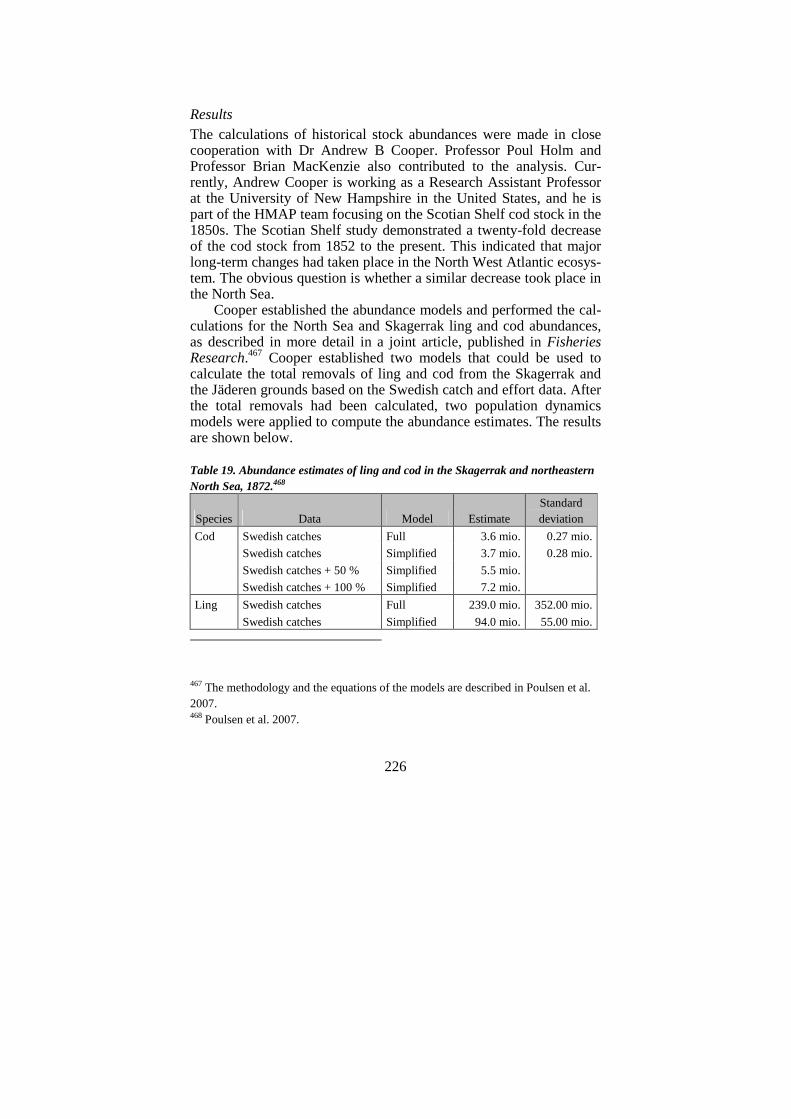
226
Results The calculations of historical stock abundances were made in close cooperation with Dr Andrew B Cooper. Professor Poul Holm and Professor Brian MacKenzie also contributed to the analysis. Cur-rently, Andrew Cooper is working as a Research Assistant Professor at the University of New Hampshire in the United States, and he is part of the HMAP team focusing on the Scotian Shelf cod stock in the 1850s. The Scotian Shelf study demonstrated a twenty-fold decrease of the cod stock from 1852 to the present. This indicated that major long-term changes had taken place in the North West Atlantic ecosys-tem. The obvious question is whether a similar decrease took place in the North Sea.
Cooper established the abundance models and performed the cal-culations for the North Sea and Skagerrak ling and cod abundances, as described in more detail in a joint article, published in Fisheries Research.467 Cooper established two models that could be used to calculate the total removals of ling and cod from the Skagerrak and the Jäderen grounds based on the Swedish catch and effort data. After the total removals had been calculated, two population dynamics models were applied to compute the abundance estimates. The results are shown below.
Table 19. Abundance estimates of ling and cod in the Skagerrak and northeastern North Sea, 1872.468
Species Data Model Estimate Standard deviation
Cod Swedish catches Full 3.6 mio. 0.27 mio.
Swedish catches Simplified 3.7 mio. 0.28 mio.
Swedish catches + 50 % Simplified 5.5 mio.
Swedish catches + 100 % Simplified 7.2 mio.
Ling Swedish catches Full 239.0 mio. 352.00 mio.
Swedish catches Simplified 94.0 mio. 55.00 mio.
467 The methodology and the equations of the models are described in Poulsen et al. 2007. 468 Poulsen et al. 2007.

227
Based on the full model, the cod population in the Skagerrak and
Jäderen in 1872 is estimated to equal 3.6 million individuals, with a standard deviation of 0.27 million individuals. The ling population was 239 million individuals, with a standard deviation of 352 million individuals. This large standard deviation for the ling population es-timate is an indication that the estimate is fairly uncertain. In the simplified model, the estimate of cod abundance changes only slightly, increasing to 3.7 million (s.d. = 0.28 million), but the esti-mate of ling abundance decreases to 94 million individuals (s.d. = 55 million).
For both populations, any underestimate of removals will lead to a too low estimate of the total population size. The Danish and Nor-wegian fleets, which are not included in this data, rarely caught ling but caught substantial number of cod from the Skagerrak and Jäderen. If our data account for only two-thirds of the total cod removals, then our estimate of the cod population increases by 50 % to 5.5 million. If our data accounts for only half of the total cod removals, our estimate of the cod population doubles to 7.2 million fish.
Regrettably, the current assessment does not provide much in-sight into a current estimate for the population in just the Skagerrak and north-eastern North Sea (i.e. Jäderen). The total allowable catch from the Skagerrak represented about 12.5 % of the total cod catch from the North Sea in 2002 and 2003. The assumption that 12.5 % of the North Sea cod population resides in the Skagerrak is questionable. If the assumption was true, this would imply that the Skagerrak popu-lation of three-year olds and older would be around 4.1 million fish, slightly higher than the 1872 estimate. It should be borne in mind, however, that our 1872 estimate is highly conservative. It is based on Swedish catches only and thus disregards the fact that Danish and Norwegian fishermen did catch substantial numbers of cod at the time.
There are currently no estimates of modern abundance for ling in the North Sea. While the estimate for ling abundance in 1872 is sub-ject to uncertainty, it is quite likely that ling was once more abundant than cod in these areas. Such evidence suggests that the ling stock may have declined on a centennial scale. In conclusion, the analysis

228
indicates that important changes may have taken place in the Skager-rak and North Sea ecosystem from one century to the next.
Size composition of landings
When Professor Sven Nilsson wrote about Swedish longline fisheries in the 1828, he complained about the state of the ling stock. The aver-age size of the fish caught was continuously decreasing, and Nilsson recommended a reduction in the fishing effort in order to safeguard the stock. While Nilsson lacked quantitative evidence to support his claims, the issue of fish sizes has remained controversial ever since.
Large fish are desirable both for financial and ecological reasons. In financial terms, the yield per unit of fishing effort is higher from catches of large individuals than of small individuals of a given spe-cies. It makes better financial sense for a longline fisherman to catch a cod of 5 kg than a cod of 2 kg per hook. From an ecosystem per-spective large fish are also desirable.469 The large individuals within a fish stock ensure its reproductive potential. Studies of fish stocks have shown that the reproductive output of many fish species in-creases with size and age. The larger the fish are, the more eggs they produce per unit of biomass. In technical terms, the relative fecundity – defined as number of eggs per unit of fish biomass – increases with body size.470 Also, the hatching success of cod eggs has been shown to be higher for a second- or third-time spawner than for a first-time spawner.471 In other words, the reproductive success is higher for large individuals of a given stock. This relationship has not been properly examined for ling, however.
Many studies have argued that the number of large individuals in the oceans have diminished significantly in the long term. Research-ing the Caribbean marine ecosystems, a group of marine scientists led by Jeremy Jackson have shown a long-term decline of large predatory
469 Kaiser et al., p. 343. 470 Jennings et al., p. 57, 59, 243. 471 Jennings et al., p. 72.

229
fish and marine mammals, which has had negative repercussions for the marine ecosystem as such.472
Marine scientists from the University of British Columbia have also studied how fisheries have depleted the highest trophic levels of the food web. They have examined the long-term decline due to fish-ing in the abundances of large predatory fish.473 Their study is con-troversial, however, because part of the changing composition of species in the world’s fish catches could reflect changing fishing strategies rather than real changes taking place in the oceans.
The question is if long-term changes of size composition within the ling stock can be identified. The question is simple: Did the abun-dance of large ling decline significantly in the long term? Did the size compositions of ling change?
Nilsson was not alone in observing declining fish sizes in the nineteenth century. In 1874 the British fisheries observer Edmund Holdsworth said:
‘It has been observed that when any newly-discovered cod-bank is first worked some fish of remarkable size are pretty sure to be caught. … But monster-cod five or six feet in length [152-183 cm], as were at first frequently reported, are now very seldom met with.’474
According to the modern length-weight conversion factor for North Sea cod, a five feet long cod weighs 37 kg, and cod of 6 feet reach the astonishing weight of 64 kg.475 Such cod sizes are enormous com-pared to the size of cod caught in the North Sea today. The average for North Sea cod catches fluctuated between 1.1 and 2.5 kg from 1963 to 2002.476 Obviously, Holdsworth’s anecdotal evidence should be treated very cautiously, especially as it stands alone.
472 Jackson, 2001 473 Pauly 1995; Pauly et al. 1998; Pauly et al. 2000; Pauly et al. 2003. 474 Holdsworth, p. 38. 475 www.fishbase.org, Cod, UK, North Sea. 476 ICES CM 2004/ACFM:07, p. 81-82.

230
Some anecdotal evidence from Denmark, however, supports Holdsworth’s notion of declining average fish sizes in the nineteenth century. In 1883 Arthur Feddersen, editor of the journal Nordisk Fiskeritidsskrift, concluded that the decreasing average sizes were undeniable evidence of declining fish stocks. Feddersen argued that large flatfish and cod had experienced such a decline.477 He did not comment on the magnitude of the decline or say where it had taken place. Neither did he specify how he had arrived at this conclusion.
Indeed, anecdotal evidence such as Nilsson’s, Holdsworth’s and Feddersen’s statements is insufficient to conclude that a major change took place in the cod stock in the late nineteenth century. Possibly Nilsson’s, Holdsworth’s and Feddersen’s observations were influ-enced by nostalgia for fish sizes that nobody had ever seen. More quantitative evidence is necessary to throw light on the question.
The data set Ideally, random samples from commercial catches and research trawls should be used to conclude on size compositions in the fish stocks. This requirement is difficult to meet with respect to the nine-teenth century, however. For the Skagerrak and the northeastern North Sea, two groups of sources regarding size composition of catches have been identified. One group consists of publications from well-informed observers and scientists, and the other is a data set based on Swedish commercial catches.
In his publication Danmarks Fiske from 1843-45, the Dane Hen-rik Krøyer stated that ling were commonly between 3 and 4 fod long, which is the equivalent of between 94 and 126 cm.478 Krøyer wrote four volumes on the biology of fishes in Danish waters, and his ob-servations were well documented. Indeed, Krøyer’s observation is in very close agreement with contemporary observations made by the Swedish zoologist G U Ekström. Since the wording is essential to the interpretation, Ekström should be quoted extensively. In 1845 he stated that:
477 Feddersen, p. 32. 478 Krøyer, vol 2, p. 164.

231
‘Ling (Gadus molva Lin.) achieve a considerable size. The usual length, which is commonly caught by Bohuslän fishermen, is 3 to 4 fot [89-119 cm]. However, some fish exceed this size, while the few fish which are incidentally caught in shallow water in the fjords are much smaller.’479
This corresponds well with Krøyer’s observations. Ekström also commented on the size of cod. According to his observations, the largest cod could reach a length of 119 cm, at which stage they would weigh approx. 17 kg. However, the common cod caught close to the Bohuslän coast was only between 30 and 49 cm long.480 Though these were not the cod caught by the longline fishermen beyond Skagen, Ekström’s information on cod size and weight is interesting because it allows a test of the consistency of his information. According to the length-weight conversion formula for North Sea cod in a web-based fish database, Fishbase, individuals of a length of 119 cm weigh 17.4 kg.481 This is in good agreement with Ekström’s information and shows that Ekström’s data set has a high credibility.
In 1864 the Norwegian O N Løberg published an overview of the state of Norwegian fisheries. Among other things, Løberg mentioned the size composition of ling. According to Løberg, consumers pre-ferred average size ling instead of the very large individuals which weighed between 12 and 18 kg.482 According to Fishbase, 12-18 kg ling are between 115 and 129 cm long. Løberg’s information is in-dicative of average ling sizes being less than 115 cm and thus in good agreement with Krøyer’s and Ekström’s older observations. It should be borne in mind that Løberg was a Norwegian and was thus also talking about ling caught more northerly than the North Sea.
Based on information from Malm’s report from 1886-87, the av-erage size of ling caught off Shetland can be calculated to 5.9 kg. This did not include the weight of the head, which was removed be-
479 Ekström, p. 57. 480 Ekström, p. 30, 34, 57. 481 www.fishbase.org, Cod, North Sea, UK. 482 Løberg, p. 153.
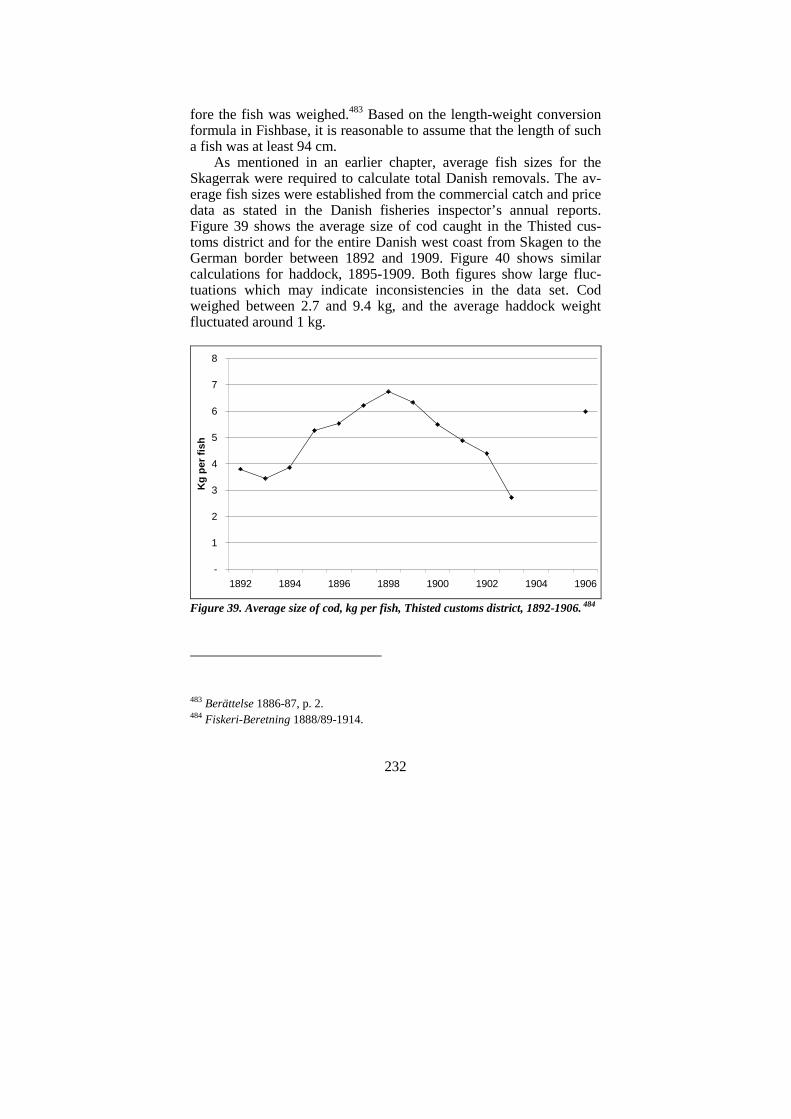
232
fore the fish was weighed.483 Based on the length-weight conversion formula in Fishbase, it is reasonable to assume that the length of such a fish was at least 94 cm.
As mentioned in an earlier chapter, average fish sizes for the Skagerrak were required to calculate total Danish removals. The av-erage fish sizes were established from the commercial catch and price data as stated in the Danish fisheries inspector’s annual reports. Figure 39 shows the average size of cod caught in the Thisted cus-toms district and for the entire Danish west coast from Skagen to the German border between 1892 and 1909. Figure 40 shows similar calculations for haddock, 1895-1909. Both figures show large fluc-tuations which may indicate inconsistencies in the data set. Cod weighed between 2.7 and 9.4 kg, and the average haddock weight fluctuated around 1 kg.
-
1
2
3
4
5
6
7
8
1892 1894 1896 1898 1900 1902 1904 1906
Kg
per
fish
Figure 39. Average size of cod, kg per fish, Thisted customs district, 1892-1906. 484
483 Berättelse 1886-87, p. 2. 484 Fiskeri-Beretning 1888/89-1914.

233
-
0,2
0,4
0,6
0,8
1,0
1,2
1,4
1,6
1895 1897 1899 1901 1903 1905
Kg
per
fish
ThistedLemvigSkagerrak
Figure 40. Average size of haddock, by customs district, 1895-1906. 485
The calculated average sizes can be compared to contemporary
information from the Danish scientist C G Joh Petersen. Petersen published a chapter on the biology of fish in the Kattegat and the Danish straits in Drechsel’s book on Danish fisheries from 1890. Cod were usually between 31 and 93 cm long, but they ‘…could get much larger’, and ling was usually between 93 and 126 cm.486 Petersen was a distinguished Danish marine biologist,487 and his data on length can be converted to weight by means of the Fishbase length-weight con-version formulas. The results are shown in Table 20 below.
485 Fiskeri-Beretning 1888/89-1914. 486 Petersen, p. 130, 132. 487 Smith, p. 76-80, 111-24.

234
Table 20. C.G. Joh. Petersen’s length data, 1890.488
Length Converted to weight Fishbase-source
Cod 31.4 cm. 0.3 kg. Denmark, Kattegat-Baltic Sea
94.1 cm. 7.8 kg. Denmark, Kattegat-Baltic Sea
Ling 94.1 cm. 6.1 kg. UK, North Sea
125.5 cm. 16.3 kg. UK, North Sea
Haddock 31.4 cm. 0.3 kg. UK, North Sea
62.8 cm. 2.4 kg. UK, North Sea
From 1914 to 1919, the annual Swedish fisheries reports included data on dominating fish sizes. For each of the Fishing Districts, the fisheries inspector reported that the fish caught were considered ‘large and beautiful’, ‘good’ or ‘good and large’.489
’However the weight varied considerably, for ex-ample 10 ling weighed between 35 and 85 kg. With regard to the most important counties [hära-dar], Tjörns and Orusts västra, the weight per 10 fish was 40 and 65 kg, respectively.’490
Figure 41 shows the information on common sizes for ling, cod and tusk included in the annual reports between 1914 and 1919.
488 Petersen, p. 130, 132, 137. 489 RA, SCB, Byrån för Jordbruksstatistik, Fisket, Primärmaterial, Län O, H VIaa:8, bl. 20; Sveriges Officiella Statistik: Fiske 1914, p. 55. 490 Sveriges Officiella Statistik: Fiske 1914, p. 55.

235
0
10
20
30
40
50
60
70
80
90
100
1914 1915 1916 1917 1918 1919
Kg
per
ten
fish
Ling HighestLing LowestCod HighestCod LowestTusk HighestTusk Lowest
Figure 41. Average fish sizes, Sweden, 1914-19: Kg per ten fish.491
A modern comparison Following the presentation of quantitative evidence from the nine-teenth and early twentieth century, the question arises whether the average size of ling changed significantly from 1840 to 1914 and in the long-term to the present day. How do the historical data on com-mon fish sizes compare to modern length distributions?
Dr Odd Aksel Bergstad from the Norwegian Institute of Marine Research in Bergen has kindly supplied a data set on the length dis-tribution of ling caught by longliners in the northern North Sea (ICES Division IVa) between 1976 and 1995.492 Figure 42 shows the mod-ern data set as well as the historical information on common fish sizes. From the figure it is evident that the average size of ling de-
491 Sveriges Officiella Statistik: Fiske 1914, p. 55; Sveriges Officiella Statistik: Fiske 1915, p. 30; Sveriges Officiella Statistik: Fiske 1916, p. 26; Sveriges Officiella Stati-stik: Fiske 1917, p. 28-9; Sveriges Officiella Statistik: Fiske 1918, p. 30; Sveriges Officiella Statistik: Fiske 1919, p. 24. 492 See also Bergstad et al., p. 45.

236
creased from the 1840s to 1914. It also appears that the common ling caught by the longliners in the nineteenth century and early twentieth century was larger than ling caught between 1976 and 1995. What was considered a small ling in the nineteenth century was larger than the most common ling is today.
Figure 42. Size composition of North Sea ling caught by Norwegian longliners, 1976-95. Comparison with common fish sizes, 1843-1919. See text for information on the historical size compositions.493
As part of my cooperation with Andrew B. Cooper from the Uni-
versity of New Hampshire, we prepared a statistical comparison of
493 Dr. Odd Aksel Bergstad, Norwegian Institute of Marine Research kindly made the modern size composition data available for me. See Bergstad & Hareide, p. 45. Historical data from: Ekström, p. 57; Krøyer, vol. 2, p. 164; Petersen, p. 132; Sveriges Officiella Statistik: Fiske 1914, p. 55; Sveriges Officiella Statistik: Fiske 1915, p. 30; Sveriges Officiella Statistik: Fiske 1916, p. 26; Sveriges Officiella Statistik: Fiske 1917, p. 28-9; Sveriges Officiella Statistik: Fiske 1918, p. 30; Sveriges Officiella Statistik: Fiske 1919, p. 24.

237
the historical and modern data sets on size compositions. Cooper performed the calculations, as described in more detail in a joint arti-cle in Fisheries Research.494 Despite uncertainties, the calculations support the hypothesis of a decrease in average size. What was con-sidered a small ling in the nineteenth century was larger than most common ling are today. Also the data sets indicate that the average size of ling may have decreased from the 1840s to 1914.
A possible explanation for the observed differences between the nineteenth and early twentieth century data sets and the modern data set could be a change of hook sizes. If hook sizes changed signifi-cantly from one century to the next, the size composition of the catches could change even with a stable size composition of the stock.495 A change of hook sizes could indicate that fish of a different size were being sought after. Accordingly, the size selectivity of the fishing gear should be examined before a firm conclusion can be reached. If there was no long-term change in hook sizes, this would support the hypothesis of a decline in fish sizes.
The archives of Uddevalla museum in Bohuslän keep samples of hooks used in the Swedish longline fisheries in the nineteenth and twentieth centuries.496 Information on hook sizes can also be found in Ekström’s book from 1845 on fishing technology in the Bohuslän fisheries.497 The longlines had traditional J-shaped hooks. Three measurements of the hook sizes were made, which are shown on Figure 43, and the data for the storbackor are shown on Figure 44. The figure does not indicate any significant changes in the hook sizes used by the Swedish fishermen from 1845 to the early 1990s. Thus the fishermen did not change preferences in regard to the size of the target species. In other words, the fishermen were targeting the same fish sizes in the nineteenth and twentieth centuries, but generally they caught smaller fish in the late twentieth century. This supports the
494 Poulsen et al. 2007. 495 Fernö et al., p. 151-3; Løkkeborg et al.. 496 Museum curator Anna-Lena Segestam-Macfie from Uddevalla Museum has measured the hooks. I am grateful for her assistance. 497 Ekström, p. 118.

238
hypothesis of a long-term decrease in the size of North Sea ling. It seems that the common size of ling decreased on a centennial scale from the 1840s to the present. The decrease could be attributable to fishing, and the conclusion indicates that the low-tech, nineteenth century longline fisheries may have had a considerable impact on the ling stocks.
Measurement
Number 1
Measurement
Number 2
Measurement
Number 3
Measurement
Number 1
Measurement
Number 2
Measurement
Number 3
Figure 43. Hook measurements.

239
-
1
2
3
4
5
6
7
8
1845 1845 1872 1872 Until 1985 Until 1985 1960-92
Years in use
Cen
timet
res
123
Figure 44. Sizes of storbacka hooks. For definition of measurements 1, 2 and 3, see Figure 43.498
Conclusion
The present management of the North Sea fish stocks is based on time series that in the best cases go back to the 1960s. So far, manag-ers and most ecologists have disregarded the long-term ecological changes. By examining historical stock abundances, marine environ-mental historians and historical ecologists can alleviate this problem of historical myopia in the present environmental discourse.
The historical abundance estimates of this study show that ling, a species of moderate commercial importance to the modern North Sea fisheries, was highly abundant in the Skagerrak and northeastern North Sea in the 1870s. The calculations are supported by ample an-ecdotal evidence which indicates that ling was indeed the main target species of the Swedish longline fisheries at least from the 1830s to 1914. Since no stock assessment of ling is carried out today, a de-
498 Ekström, p. 118 & Anna-Lena Segestam Macfie’s measurements of storbacka hooks kept at Bohusläns Museum, Uddevalla.

240
tailed comparison between historical and modern abundances is im-possible. Nevertheless, the analysis indicates that a decline of the ling stock may have taken place from one century to the next. All of the historical evidence suggests that the status of the ling population is presently worse (lower biomass, smaller individuals) than it was in the 1870s.
This study has also sought to estimate the abundance of cod in the Skagerrak and the northeastern North Sea in 1872. Unfortunately, there is some uncertainty as to total removals. Accordingly, the abun-dance estimates based on the Swedish catches are only tentative and do not indicate any major change in the abundance of cod from the early 1870s to the present. It must be emphasised, however, that the historical estimate is a minimum; the stock may very well have been larger than the estimate. The 1872 estimate for cod is based only on Swedish catches and thus disregards the fact that Danish and Norwe-gian fishermen did catch substantial numbers of cod at the time. Thus, the estimate is conservative, and the actual, historical stock abun-dance may have been higher. Significantly, we know that cod were caught from open rowing boats very close to the Danish Skagerrak coast. It is also important to emphasise that fishing for cod and ling had taken place in the North Sea long before 1872. Thus, the calcula-tions of abundances in this particular year do not represent an ecosys-tem before fishing. To reinforce the analysis, it would be very useful if nineteenth century catch data with reference to location could be identified in the other North Sea countries.
With regard to size composition, the historical evidence indicates that long-term changes may have taken place. The historical data sets from nineteenth century scholars and ecologists show that the average size of ling probably decreased from the 1840s to 1914. Probably the common size of ling has decreased on a centennial scale. In the nine-teenth and twentieth centuries, the North Sea fishermen were target-ing the same fish sizes, but generally late-twentieth century fishermen caught smaller fish than their nineteenth century predecessors. This development could be attributable to fishing and it may indicate that the Bohuslän longline fisheries had an ecological impact even though the fishermen only used low-tech longlines. This is an important con-clusion also for managers of modern fisheries. In this way, the story

241
of North Sea and Skagerrak ling demonstrates the potential of a cen-tennial perspective in fisheries management.
From a purely historical point of view, the calculation of histori-cal abundance estimates is relevant because it documents the ecologi-cal basis of life in the nineteenth century coastal communities. The North Sea offered nineteenth century fishermen catching opportuni-ties of ling that are no longer available.

242

243
SHETLAND FISHERIES
1891-1914
Although the longline sector had lost its preeminent positon in the Bohuslän fishing industry by 1890, it went through remarkable changes between 1890 and 1914. These changes had long-term reper-cussions for the sector and the coastal communities in Bohuslän. Fishing strategies were changed both in terms of vessels and fishing grounds; however, the target species and the fishing gear were un-changed. This chapter examines the driving forces of the develop-ment.
Spatial shifts
The fisheries inspectors and the data sets
At the end of 1885, Gerhard von Yhlen left his position as a fisheries inspector. His place was taken by August Hugo Malm, who published his first status report on the Bohuslän fisheries for the Hushållningssällskap in 1886-87. A H Malm was the son of A W Malm, a government official and zoologist, who had worked with fishery issues in Göteborg och Bohuslän from 1856 to 1866 and pub-lished a catalogue on Bohuslän’s fishes in 1877.499 A H Malm was an academic (fil. dr.), having graduated from the University of Lund in Skåne in 1874 with a dissertation on the biology of the broad-nosed pipefish (Syngnathus typhle). A H Malm came from a position at the Göteborg museum. He had been involved in issues related to the Bo- 499 Sanne, p. 99 & 179; Malm, A.W.
244
huslän fishing industry at least since 1884, when he made a market survey of the British fish market and the possibilities of increasing Swedish fish exports to Great Britain. During his studies, A H Malm stayed in London, and his findings were published by the Hushållningssällskap.500 A H Malm remained in office as a fisheries inspector for 22 years.
When Malm died in April 1907, his position as fisheries inspector was taken over by the 32-year old Karl Andreas Andersson. K A Andersson’s first annual report on the Bohuslän fisheries covered the years 1906-07, and the new fisheries inspector stayed in office for the rest of the period to 1914. Andersson was highly interested in fisher-ies biology and published several books and articles on fish stock fluctuations before his death in 1968. Among other things he analysed the causes of the large-scale herring fisheries off Bohuslän, and he edited the two-volume book Fiskar och fiske i Norden, which became a classic on fish biology and fisheries in Sweden after its publication in 1942.501
As there were no major disagreements between von Yhlen’s, Malm’s and Andersson’s reports, the change of fisheries inspectors did not have any impact on the general quality of the data sets.502 Despite the overall agreement between von Yhlen’s, Malm’s and Andersson’s reports, certain changes did take place. Most obviously, Malm changed the format of the published reports. His reports dif-fered from von Yhlen’s work in two fundamental ways: Firstly, Malm changed the spatial resolution of the data on the longline fisheries. Secondly, he shifted the main focus of the reports from the longline sector to the herring fisheries.
While von Yhlen had distinguished between four major areas of longline fisheries (Kattegat, Skagerrak, Jäderen and Ålesund), Malm used a more detailed spatial resolution. Figure 1 on page 31 is a re-production from Malm’s report from 1888-89, and it shows the loca-
500 Svenskt Biografiskt Lexikon, vol. 24, p. 722-4; Qvartalsskrift, 1884, Bihang; Berättelse 1884, p. 3. 501 Andersson 1942; Andersson 1956; Andersson 1958; Andersson 1960. 502 Poulsen 2005, p. 151.
245
tion of at least seven major fishing areas – from the Ålesund grounds in the north, Shetland in the west to Rubben in eastern Skagerrak. In the same report, Malm described how the fishermen reached the indi-vidual grounds.
Tampen, west of Bergen, was one of the most distant grounds that Swedish fishermen frequented at the time. To get there, they went along the Norwegian coast to Bergen, from where they proceeded westwards. Tampen was deeper than 280 metres. Nordvestbugten was located further south, west of Stavanger and Egersund, at depths of 170-270 metres. According to Malm, no fishing was done between the two fishing grounds Tampen and Nordvestbugten. Jutska Refvet, to the north-east of Jylland, was another important fishing ground, located at a depth of 160 metres. Usually, the vessels reached this ground via Kristiansand in Norway. In Malm’s definition, Jutska Refvet was only partly within the International Council for the Explo-ration of the Seas’ (ICES) present definition of the Skagerrak (Divi-sion IIIa). Parts of Jutska Refvet were situated within the ICES North Sea area (Area IV), although on the map it is shown as being mainly part of the Skagerrak. Holmens Grund, on the other hand, was located completely within the Skagerrak area, at a depth of 140 metres. The ground was located approximately halfway between Lillesand in Norway and Hirtshals in Denmark. The vessels reached this ground via Arendal or Kristiansand in Norway. Malm’s map also shows the fishing ground Rubben, which had a depth of 90 metres and was lo-cated to the north-west of Skagen, which made it possible for fisher-men to reach it directly from Bohuslän. Additionally, longline fisher-ies were conducted in the Kattegat, to the east of Skagen and to the south of the Danish island Læsø.503
Ideally, the spatial resolution of the analysis on fishing fleet dy-namics should be high, but only a coarse definition of fishing grounds is feasible here. In the above analysis on the fleet dynamics from the 1850s to 1880s, the Skagerrak and Jäderen were referred to as indi-vidual fishing grounds. These were broad categories, and fishing ef-fort was not evenly distributed within these two areas. For example,
503 Berättelse 1888-89, p. 6-8.
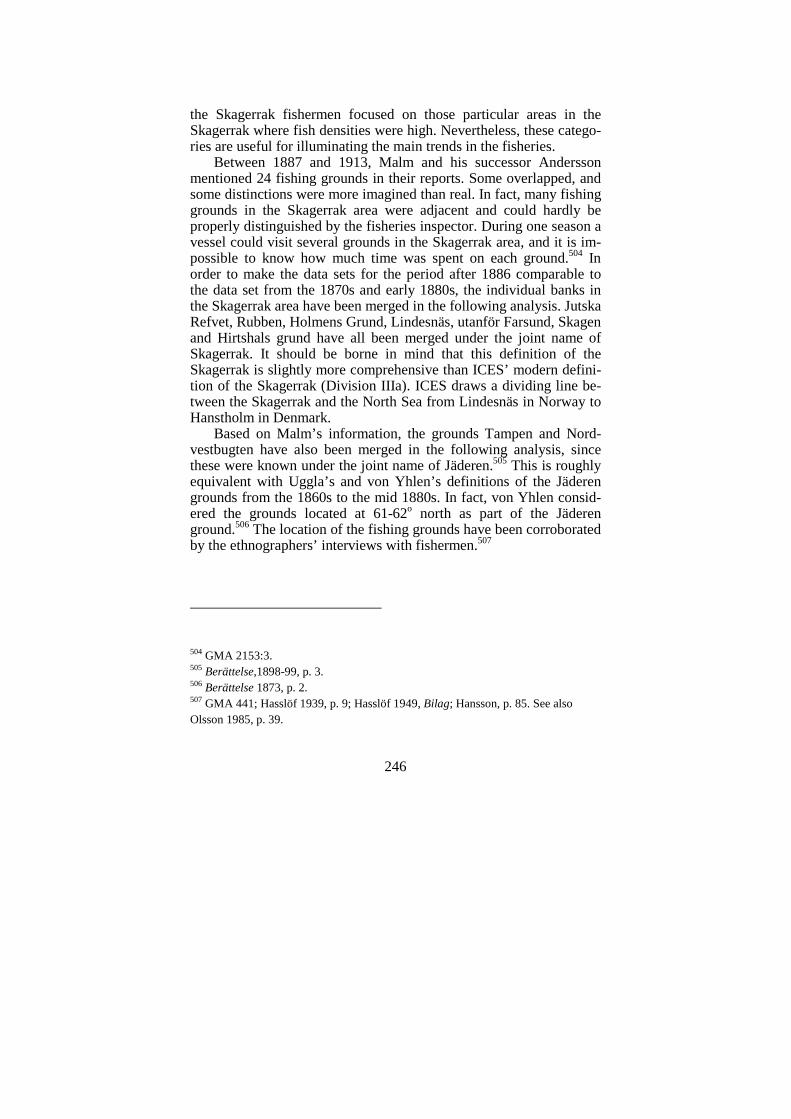
246
the Skagerrak fishermen focused on those particular areas in the Skagerrak where fish densities were high. Nevertheless, these catego-ries are useful for illuminating the main trends in the fisheries.
Between 1887 and 1913, Malm and his successor Andersson mentioned 24 fishing grounds in their reports. Some overlapped, and some distinctions were more imagined than real. In fact, many fishing grounds in the Skagerrak area were adjacent and could hardly be properly distinguished by the fisheries inspector. During one season a vessel could visit several grounds in the Skagerrak area, and it is im-possible to know how much time was spent on each ground.504 In order to make the data sets for the period after 1886 comparable to the data set from the 1870s and early 1880s, the individual banks in the Skagerrak area have been merged in the following analysis. Jutska Refvet, Rubben, Holmens Grund, Lindesnäs, utanför Farsund, Skagen and Hirtshals grund have all been merged under the joint name of Skagerrak. It should be borne in mind that this definition of the Skagerrak is slightly more comprehensive than ICES’ modern defini-tion of the Skagerrak (Division IIIa). ICES draws a dividing line be-tween the Skagerrak and the North Sea from Lindesnäs in Norway to Hanstholm in Denmark.
Based on Malm’s information, the grounds Tampen and Nord-vestbugten have also been merged in the following analysis, since these were known under the joint name of Jäderen.505 This is roughly equivalent with Uggla’s and von Yhlen’s definitions of the Jäderen grounds from the 1860s to the mid 1880s. In fact, von Yhlen consid-ered the grounds located at 61-62o north as part of the Jäderen ground.506 The location of the fishing grounds have been corroborated by the ethnographers’ interviews with fishermen.507
504 GMA 2153:3. 505 Berättelse,1898-99, p. 3. 506 Berättelse 1873, p. 2. 507 GMA 441; Hasslöf 1939, p. 9; Hasslöf 1949, Bilag; Hansson, p. 85. See also Olsson 1985, p. 39.

247
Figure 45. Approximate boundaries of the fishing grounds Skagerrak and Jäderen.
The annual reports differed in more aspects than spatial resolu-
tion, since Malm and von Yhlen had different priorities regarding the fisheries. Judging from his reports from the 1890s, Malm’s main in-terest was the herring fishery. His reports on the herring catches were far more detailed than the reports prepared by von Yhlen. Regretfully, Malm neglected the longline fisheries. First of all, he continued von Yhlen’s practice of publishing data sets from individual fishing ves-sels only for one year, namely 1886. After that time, Malm’s reports contained only aggregated data sets for fishing harbours. Secondly, from 1887 onwards Malm never reported on the catches of demersal species, only their values. Malm published aggregated data for the fishing villages, stating the number of vessels, their tonnages, number of fishermen and the location of the fishing grounds that were visited

248
by the villages’ fleets. An example of the data set’s structure is shown in Table 21.
Table 21. Example of catch and effort data from Berättelse 1904-05.508 Fishing community Mollösund Grundsund
Number of vessels 20 14
Tonnage 746 879
Crew 199 141
Fishing grounds Shetland Shetland
Nordvästbukten
Tampen
Catch value (kr.) 92.112 45.360
Landing harbours Klädesholmen Grundsund
Mollösund Klädesholmen
Edshultshall Mollösund
Skärhamn Skärhamn
Because no data from individual fishing vessels exist for the pe-
riod after 1886, the fishing effort expended on the individual fishing grounds cannot be calculated. Some villages’ fishing fleets went to two or more fishing grounds. For example in 1904, the Mollösund fleet consisted of 20 vessels with a total crew of 199 men, which sailed to Shetland, Nordvestbugten and Tampen. Based on the source it is impossible to calculate how much fishing effort was spent on individual grounds.
For most years, the fisheries inspector’s reports summarised the number of vessels visiting the main fishing grounds, i.e. Kattegat, Skagerrak, Jäderen and Shetland. Since some vessels went to two or more grounds, some were counted twice, however. This makes it impossible to know exactly how much fishing effort was spent on the individual fishing grounds.
Fortunately, a large group of villages concentrated their fishing effort on only one fishing ground. The Grundsund fleet, as shown in
508 Berättelse 1904-05, Tab. 1A.

249
Table 21, is an example of such a community. Between 1888 and 1912, the fleet that concentrated fishing effort on only one fishing ground made up between 40 and 80 per cent of the total longline fleet. These vessels generated between a maximum of 81 per cent of the longline fleet’s income (in 1910) and a minimum of 26 per cent (in 1903), and they employed between 32 and 83 per cent of the total longline crew. These data provide valuable insights into the dynamics of the fishing fleets, as they can be used as a basis of calculating av-erage vessel sizes by fishing ground and average catch values per fisherman by fishing ground.509 This facilitates a rough analysis of the spatial dynamics of the fisheries from the late 1880s to World War One.
In 1914 Statistiska Central Byrån (SCB), Sweden’s central gov-ernment authority for statistics, took over the production of fisheries statistics for Bohuslän.510 From that time, annual reports on the state of the Bohuslän fishing industry, including data on catches and fish-ing effort, were published by SCB under the title Sveriges Officiella Statistik: Fiske. For the 1914 fisheries statistics, the primary material is kept in the archives of SCB in Stockholm.511 Significantly, this data set is the most detailed for the entire period between 1840-1914, as it states catches of ling, cod, tusk, rays, and halibut as well as catch values for each single vessel. Also values of fishing vessels and fish-ing gear, vessel tonnages, and number of fishermen are stated. Parts of the data set were published in SCB’s annual report on the Swedish fishing industries.512 The structure of the 1914 primary material is shown in Table 22.
509 See Figure 11 (page 126) and Figure 21 (page 162). 510 Statistisk tidsskrift no. 10, 1953, p. 429. 511 RA, SCB, Byrån för Jordbruksstatistik, Fisket, Primärmaterial, Län O, H VIaa:8. 512 Sveriges Officiella Statistik: Fiske 1914.

250
Table 22. An example of the structure of the primary material for the fisheries statistics, 1914. 513
Fishing village Mollösund
Vessel Name Verdandie
Tonnage 88,72
Horse power
Value as new Kr. 10.000
Crew 10
Catches Ling Quantity (no. of fish) 3,600
Value (kr.) 3.510
Etc. Quantity (no. of fish) …
Value (kr.) …
Shetland fisheries
In 1867, the ‘Baron Uggla’, a Swedish longline vessel, made a trip to the fishing banks north of Shetland. The trip was unsuccessful, how-ever, and the Swedes did not return to Shetland until 1884. In 1884, Oscar Dickson, a Göteborg merchant, made the ‘Astrea’ available for Grundsund fishermen free of charge, and they pursued longline fish-eries off Shetland. The ‘Astrea’ initiated a new phase of territorial expansion in the longline fishery.
The spatial expansion of the longline fishery can be partly gauged from Figure 46. The figure shows the number of vessels per fishing ground. It should be treated with care, however, because some vessels were counted twice. The figure shows the massive increase in the Shetland fishery from 15 vessels in 1888 to 108 in 1910. The main expansion of the Shetland fishery took place from 1892 to 1902. The increasing importance of the Shetland fishery was also evidenced by a number of government initiatives after 1900. From 1901 onwards, a Swedish priest was stationed in Shetland, and Malm recommended
513 RA, SCB, Byrån för Jordbruksstatistik, Fisket, Primärmaterial, Län O, H VIaa:8, bl. 20.

251
that a Swedish doctor should be stationed in Baltasound in Shetland during the fishing season.514
Fisheries off Norway’s west coast, Jäderen, also expanded. How-ever, from the fisheries inspector’s reports, it is evident that the Jäderen fisheries were often only conducted in connection with fish-eries off Shetland. Thus Figure 46 exaggerates the development of the Jäderen fishery, which was no longer a main, separate fishery.515 Fi-nally, Figure 46 shows the decline of the Skagerrak fishery, where the fleet was more than halved from 1895 to 1912.
0
20
40
60
80
100
120
1886 1889 1892 1895 1898 1901 1904 1907 1910
Off LindesnäsShetlandJäderenSkagerrak
Figure 46. Spatial distribution of fishing effort, 1888-1912: Number of vessels per fishing ground. Minor fishing grounds are excluded. 516
How can the geographical shifts in fishery be explained? In order
to answer this question, we need to test three hypotheses on respec-tively markets, target species and catch rates.
514 Berättelse 1901-02, p. 9; Berättelse 1903-04, p. 11-12; Berättelse 1904-05, p. 7-8. 515 Berättelse 1900-01, p. 5; Berättelse 1901-02, p. 4. 516 Berättelse 1886-1912/13; Publikationer 1912, IIIA.

252
Firstly, economic aspects could have affected the fishermen’s choice of fishing grounds: a change in fish markets could have made the fishermen change fishing grounds. Presumably, the Swedes sailed to Shetland to get closer to an attractive market for fish in Britain; this is the explanation for the spatial shift offered by Lennart Dalén in his book Den bohuslänska kustlägesbygden. Dalén stated that the possi-bilities for Swedish fishermen of selling fish in Norwegian harbours were decreasing while they were simultaneously improving in Shet-land.517 To test Dalén’s conclusion, the landing practices of the Swedes become highly relevant. If an attractive British market for fish was the reason why fishermen changed fishing grounds, chang-ing landing practices should coincide with the spatial shift.
Secondly, the change may also have been caused by changing consumer preferences. If demand for ling declined, it would be ra-tional for the fishermen to shift to other target species. Presumably, the fishermen would then relocate to new fishing grounds where the abundance of the new target species was higher. The issue of target species has not been examined by Swedish fisheries historians before.
Finally, ecology could have played a significant role in the spatial shift of fishery. So far this aspect has been neglected by many fisher-ies historians. Possibly the shift took place because of declining catch rates on the traditional grounds, Skagerrak and Jäderen, which would be in agreement with Hilborn and Walters’ predictions. Hilborn and Walters argue that declining stock abundances on their traditional grounds tend to cause desperation among the fishermen. Declining catch rates force the fishermen to go to more distant grounds in search of higher catch rates.
Did the British fish market attract Swedish fishermen? There is very little quantitative evidence on Swedish landings in Great Britain to be found in Swedish historical archives. Moreover, the records of the Fisheries Board of Scotland do not offer substantial information on Swedish landings in Shetland.518 Qualitative informa-
517 Dalén, p. 237. 518 NAS, Fisheries Board of Scotland.

253
tion on landing practices is however available from the fisheries in-spectors’ annual reports.
Describing the 1886 season, Malm said that the Shetland vessels made good catches, but the fishery was hampered by the low prices that were paid for the fish in Shetland.519 This information dates from the initial phase of the Swedish Shetland fishery and may indicate that it took some time for the Swedish fishermen to establish a proper relationship to the British fish market. In his report from 1887, Malm stated that a number of vessels from Orust had spent 2.5 months off Shetland, where they sold their catches fresh.520 In his next report, Malm stated that the Shetland fishery was more profitable than fisher-ies on other grounds.521 The fishery expanded rapidly. In 1888, fifteen vessels were fishing at this new ground, and they landed their catches in Lerwick in Shetland. According to Malm, the Swedish fishermen praised the Lerwick fish dealers for their honesty.522
Looking back on the period 1886-90, Malm said that the yields of the Shetland fishery equalled good catches made on the traditional fishing grounds. The Shetland fishery was conducted relatively close to the coast, and therefore little time was spent travelling to and from the grounds. The fish was mainly sold fresh in Shetland, and no time was spent on onboard curing. Only the last catch was sold in Sweden when the vessels returned to their home ports at the end of the sea-son.523 This information shows that catch rates were high. It also indi-cates that the short travelling time from the grounds to Shetland at-tracted Swedish fishermen.
In 1890, no catches were sold in Shetland due to low prices. The fish prices paid at home were more attractive to the Swedish fisher-men. Malm emphasised that the decline of the longline fishery had
519 Berättelse 1886, p. 1-2. 520 Berättelse 1887-88, p. 2. 521 Berättelse 1888, p. 2. 522 Berättelse 1888-89, p. 2; Berättelse 1889-90, p. 2. 523 GLA, Göteborgs och Bohus Läns Länsstyrelse, Landskansliet, DVb:16, Malm, Femårsberättelse 1886-90.

254
come to a halt. Capital was no longer being drained from this sector to the herring fishery.524
In 1891, fourteeen vessels from Mollösund, Björholmen and Grundsund fished off Shetland, and this fishery was ‘more rewarding’ than fisheries on Jäderen and other traditional grounds, and some longline vessels only occasionally fished in the Skagerrak. Thus in terms of catch rates, Shetland offered the most attractive fishery. In that year, fish prices on Shetland were low compared to the prices paid in Sweden, and the fishermen rarely sold their catches to the British.525
In the latter half of the 1890s Malm wrote:
‘It is noteworthy that the fishing grounds Nord-vestbukten and Tampen off Jäderen on Norway’s west coast are now visited by relatively few ves-sels, while an increasing number go to distant Shetland. It should be emphasised that new inter-est is shown in the longline fishery, which de-clined earlier, when capital was transferred to ... the herring fishery. Since last year the number of vessels has increased by 15.’526
The Shetland fishermen had to make long trips compared to the distance to the Skagerrak and Jäderen fisheries. Crossing the northern North Sea involved more risks than was involved in fishing close to the Norwegian coast. The fishermen undertook these voyages only for a good reason. In most years, the average catch values for Shet-land fishermen exceeded the incomes of other longline fishermen by 20 per cent or more. Overall, it paid off for the fishermen to go to Shetland instead of staying in the Skagerrak or off Jäderen.527
In addition to Shetland, fisheries were initiated on a number of other fishing grounds. Three vessels from Karingön, Gullholmen and
524 Berättelse 1890-91, p. 2. 525 Berättelse 1891-92, p. 2. 526 Berättelse 1896-97, p. 3. 527 See Figure 11, p. 126.

255
Hällevikstrand pursued cod off Iceland for the first time in 1894.528 However, this fishery remained insignificant during the whole period until 1914. At least in two years, namely 1889 and 1912, Swedish fishermen also fished to the south of Shetland, venturing to the Ork-neys.529 Also, the fishery off Ålesund was reinitiated in the season of 1899 by one vessel from Näset. It was only repeated, however, in 1911, when two vessels from Näset and one from Tången went there to fish.530
To sum up, it is fair to say that economy certainly played an im-portant role in the spatial shift to Shetland. In some years between 1890 and 1914, considerable catches were landed and sold in Britain. Also, the Swedes often landed catches in Shetland because it allowed them to reduce the travelling time between the grounds and the land-ing port. This supports Dalén’s interpretation that the British market attracted the Swedes to Shetland.
Did the fishermen change target species? There is strong evidence to refute the hypothesis of a change of target species. Ling remained the main target species of the Swedish longline fishery at least from the 1830s to 1914.
In 1893, Malm reported that the Shetland fishermen primarily caught ling, and in 1899 he said that catches of ling were seen as a measure of success. Cod, on the other hand, was only of secondary importance.531 After the turn of the century, Malm repeatedly said that ling was the target species, whereas cod was caught only rarely.532 In fact, it seems that the focus on ling became even more pronounced.
SCB took responsibility for the collection of fisheries statistics in Bohuslän in 1914, and the primary material for the statistics from
528 Berättelse 1895-96, p. 2-3; GLA, Göteborgs och Bohus Läns Länsstyrelse, Landskansliet, DVb:16, Malm, Femårsberättelse, 1891-95. 529 Berättelse 1889-90, p. 2; Berättelse 1912-13, p. 3. 530 Berättelse 1899-1900, p. 4; Publikationer 1912, IIIA , p. 255, 275. 531 Berättelse 1893-94, p. 2; Berättelse 1898-99, p. 3-4. 532 Berättelse 1902-03, p. 4; Berättelse 1903-04, p. 4; Berättelse 1904-05, p. 3.

256
1914 is kept in the SCB archives in Stockholm. The material contains catch rate data for individual longline vessels, as shown in Table 22 above. For most of the vessels, the fishing grounds are stated; the vast majority of vessels fished off Shetland. Only 11 vessels from Skärhamn and Nordvikstrand and 4 vessels from other places spent part of or the whole fishing season off Jäderen.
In 1914, catches consisted predominantly of ling (approx. 72 per cent), and the bulk of the income was generated by ling catches. This is shown in Table 23.
Table 23. Total catches made by Swedish longline vessels, 1914.533
Number of fish Value
Ling 473.990 kr 552.832
Tusk 107.700 kr 42.329
Cod 52.840 kr 56.090
Rays 3.510 Kr 1.694
Other 11.510 Kr 5.382
In other words, there is clear evidence from the period 1890-1914 that the longline fishermen maintained a strong focus on ling. Thus, no change of target species took place, and consequently this hypothesis does not explain the spatial shift of the fishery.
It is worth noting that the longline fishermen did not shift their fishing effort to the middle and southern parts of the North Sea, where other countries’ fleets were catching demersal species. The distance from Bohuslän to the Dogger Bank off the English coast was shorter than the distance to the Shetland grounds. Moreover, Bo-huslän fishermen were familiar with the middle area of the North Sea, where they pursued mackerel from the 1890s.534 Nevertheless, the Swedish longline fishermen consistently avoided the middle and southern parts of the North Sea. This indicates that their target spe- 533 RA, SCB, Byrån för Jordbruksstatistik, Fisket, Primärmaterial, Län O, H VIaa:8, bl. 20. 534 Berättelse 1888-1912; Hasslöf, 1949, p. 109 & Bilag, ’Axel Bergströms fiske- och fraktresor 1880-1925’.

257
cies, ling, a deep water species, was much less abundant in the shal-low parts of the North Sea. For the Bohuslän longline fishermen there was no point in going south.
Did catch rates decline in the Skagerrak and off Jäderen? How did fluctuations in the abundances of ling affect the develop-ment of the Swedish fishery? Did the spatial shift from Skagerrak and Jäderen to Shetland take place due to declining stock abundances in the Skagerrak? Did the development of the Swedish fishery resemble Hilborn and Walters’ predictions of a fishery being overdeveloped?
Little quantitative evidence has been preserved for the period be-tween 1887 and 1913. The Swedish fisheries inspectors’ annual re-ports do not state catches, only catch values for this period. A few comments made by the inspectors regarding catch rates can be found in the annual reports, but generally the scarcity of catch data presents an obstacle to performing a catch rate analysis.
From 1914, detailed data can be found in the archives of SCB in Stockholm.535 As described above, this data set contains information on catches and fishing effort for individual longline vessels.
In 1886, A.H. Malm, the new fisheries inspector, reported that three vessels from Grundsund and one from Mollösund had fished off Shetland, where part of the catches were landed and sold. Even though the catches were ‘quite abundant’, the financial outcome was disappointing.536 Malm used the vessel ‘Otto’ from Grundsund as an example of the fishery. The vessel’s season, from May 3 to Septem-ber 7, was short. However, ‘no less than’ 450 ling per man were caught.537 This indicates that some of the first Swedish fishermen on the grounds noted high ling abundances off Shetland.
In 1887, the fishermen visited the usual fishing grounds. Based on information obtained from the fishermen, Malm stated that the fish abundances were unusually low on these grounds. Malm used the
535 RA, SCB, Byrån för Jordbruksstatistik, Fisket, Primärmaterial, Län O, H VIaa:8, bl. 20. 536 Berättelse 1886-87, p. 1-2. 537 Berättelse 1886-87, p. 2.

258
fishing village of Käringön as an example of the ling and cod fisher-ies’ failure that year. The fishermen had left Käringön on April 11 to go on their first trip. They went to the Jäderen grounds and stayed there for 11 days. After a 7-day trip home, the vessel arrived in Bo-huslän on May 7. The outcome was a mere 15-45 ling per man. Catches on the second and the third trip, which took between 3 and 5 weeks, were higher. The catch rates fluctuated between 120 and 200 ling per man per trip. The fourth trip took a month, and catches were similar to the ones made on the second and third trip, even though four of the sixteen days on the grounds were wasted due to a storm. Thus, the annual catch rates must have been between 375 and 645 ling per man. Malm concluded that the first trip was a failure for most villages, and the following trips yielded ‘mediocre’ catches.538
There was no guarantee of catches on every trip. For a group of vessels, the first trip of the year 1887 was a complete failure. The vessels spent 5 to 7 weeks on the trip without making any catches.539
Some information on catch rates in the Shetland fisheries is avail-able from ethnographic interviews with fishermen, dating from the 1920s to the 1940s. One fisherman reported that catch rates of 80-160 fish per man per trip were common in the ‘ling fishery’ off Shetland around the turn of the century.540 Generally, catch rates between 80 and 170 fish per man per trip were mentioned in the ethnographic interviews. Assuming that five trips were made per year, it seems reasonable to conclude that annual catch rates were at least 500 ling per man.541
In the summer of 1902, the ‘Verdandi’ from Mollösund provided data to Malm regarding catches made on two trips to Shetland. Approx. 4,000 ling, 1,650 tusk and a few cod were caught on these trips.542 The vessel probably had a crew of ten people.543 Assuming
538 Berättelse 1887-88, p. 1-2. 539 Berättelse 1887-88, p. 2 540 GMA 6032:1. 541 GMA 5233:4, 7, 18, 20. 542 Berättelse 1902-03, p. 4.

259
that the vessel undertook another two trips that year, the catch rates were approximately 800 ling and 330 tusk per man.
In an article published in 1905, Johan Hjort, a highly esteemed Norwegian fisheries biologist, briefly described the Swedish longline fisheries. According to Hjort, the fishery took place off Shetland and on the Moldö bank between Bergen and Shetland. He said that there was strong evidence that each Swedish fisherman usually caught 800-1,000 ling during a fishing season with four trips.544
Just before World War One, catch rates for ling were considera-bly higher than for other species. These can be calculated from the SCB data sets from 1914, as shown in Table 24 below.
Table 24. CPUE: Catches per man in the longline fisheries, 1914.545
CPUE Number of vessels
Ling 405 124
Tusk 99 115
Cod 63 87
Rays 11 31
How did the 1914 data sets compare to the catch rates made in the
nineteenth century? First of all, caution is advised against drawing firm conclusions based on observations from only one year. In addi-tion, it should be kept in mind that the 1914 data are not immediately comparable to the time series from 1872-86. Firstly, the fishing sea-son was shorter in 1914, as some of the longline vessels stopped fish-ing in July rather than late August or early September.546 Secondly, the practice of onboard curing had been adopted, which may have influenced the time spent fishing. Thirdly, more efficient vessels were
543 RA, SCB, Byrån för Jordbruksstatistik, Fisket, Primärmaterial, Län O, H VIaa:8, bl. 20. 544 Norges Fiskerier I, 1905, p. 276. 545 RA, SCB, Byrån för Jordbruksstatistik, Fisket, Primärmaterial, Län O, H VIaa:8, bl. 20. 546 RA, SCB, Byrån för Jordbruksstatistik, Fisket, Primärmaterial, Län O, H VIaa:8, bl. 20.

260
employed in the fishery in 1914. As mentioned above, the lack of information on the time spent travelling to and from the fishing grounds also adds uncertainty to the analysis. Nevertheless, it is inter-esting to compare Table 24 with the catch rate data sets from 1872-86 (See Table 11 and Table 12, pages 138-139).
Catch rates for ling in the Shetland fishery of 1914 were generally lower than on the productive Jäderen ground in the period 1872-86. On the other hand, they slightly exceeded the catch rates in the Skagerrak fisheries in the 1870s and 1880s. It should be borne in mind that in 1914 catches were made at more distant grounds than in the 1870s and 1880s. Even though a high degree of uncertainty is related to the data sets, they support the hypothesis that catch rates on the Skagerrak and Jäderen grounds closer to Bohuslän had decreased. This shows how declining catch rates – and thus ecological changes – had an important bearing on the fishermen’s locational choices.
Catch rates in the Danish Skagerrak fisheries, 1895-1911 Ling was the target species for the Swedish longline fishermen, but declining abundances of cod and haddock could have caused the Swedes to abandon the Skagerrak grounds. At least in the 1870s and 1880s, cod was the second most important species in the Skagerrak fishery after ling. Haddock was used for bait and thus had an indirect significance to the fishermen. If cod and haddock experienced a strong decline in the 1890s, this could have influenced the Swedes’ decision to relocate to the Shetland grounds. The Swedish sources do not allow for a quantitative analysis of this issue, but some quantita-tive catch data sets are available from the Danish Skagerrak fisheries for demersal species from 1895 onwards.
The Danish fisheries inspector’s annual reports contain informa-tion on the number of Danish Skagerrak longline fishermen. Figure 47 shows that the number of longline fishermen (bakkefiskere) fluctu-ated between 1,050 and 1,550 in the period 1895-1911. Based on the information on total catches contained in the annual reports, it is pos-sible to calculate the average annual catch per man. This is shown in Figure 48 and Figure 49 for cod and haddock, respectively. As a ca-veat, it should be noted that some of the Danish longline fishermen worked only part-time in the fisheries, so the catch rates in the two figures do not take time issues into account. If the time spent fishing

261
changed, fishing effort must also have changed. We cannot know if this happened, but we assume that it did not. This adds some uncer-tainty to the Danish catch rate data set.
Each fisherman caught a maximum of up to approx. 2,100 had-dock and 330 cod. The catch rates shown in the two figures are low compared to other information available from Drechsel, the Danish fisheries inspector. December 1890 saw a very good demersal fishery, and each longline fisherman caught between 200 and 240 haddock per day.547 Drechsel’s information also indicates that the Swedish catch reports on haddock from the 1870s and 1880s were probably imprecise. On a good day in 1890, Danish fishermen caught between 200 and 240 fish, but according to the published Swedish data, Swed-ish fishermen only caught that amount of fish during the whole fish-ing season in 1882 and 1883.548 Most probably, the Swedish fisher-men underreported their haddock catches. The Danish haddock data sets shows marked catch rate fluctuations as well as a striking decline in the latter half of the 1890s and certainly a major decline compared to the catches described by Drechsel in 1890.
547 Fiskeri-Beretning 1890-91, p. 86. 548 Berättelse 1882 & 1883.
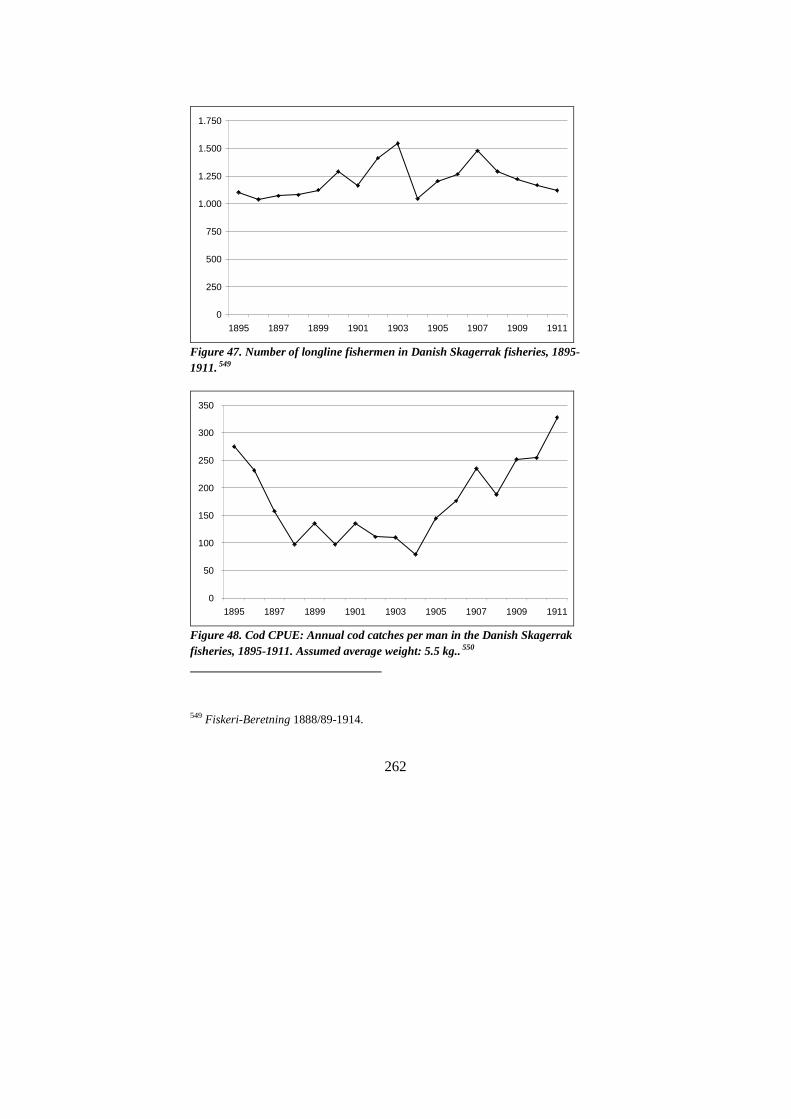
262
0
250
500
750
1.000
1.250
1.500
1.750
1895 1897 1899 1901 1903 1905 1907 1909 1911
Figure 47. Number of longline fishermen in Danish Skagerrak fisheries, 1895-1911. 549
0
50
100
150
200
250
300
350
1895 1897 1899 1901 1903 1905 1907 1909 1911
Figure 48. Cod CPUE: Annual cod catches per man in the Danish Skagerrak fisheries, 1895-1911. Assumed average weight: 5.5 kg.. 550
549 Fiskeri-Beretning 1888/89-1914.

263
-
500
1.000
1.500
2.000
2.500
1895 1897 1899 1901 1903 1905 1907 1909 1911
Num
ber
of fi
sh p
er fi
sher
men
(ba
kkef
iske
r)
Figure 49. Haddock CPUE: Annual haddock catches per man in the Danish Skagerrak fisheries, 1895-1911.Assumed average weight: 1 kg. 551
With regard to cod, a decline in the catch rates in the Danish
Skagerrak fishery is evident in the late 1890s and early 1900s. The first phase of the expansion of the Swedish Shetland fisheries had happened before 1895 and was followed by a period of stability. In 1898, the expansion of the Shetland fishery regained momentum. The decline of cod and haddock in the Skagerrak seems to have partly coincided with the Swedish expansion in the Shetland fishery. Ac-cordingly, declining cod and haddock abundances in the Skagerrak in the late 1890s may have encouraged the Swedes to shift their fishing effort to Shetland. When the Skagerrak cod and haddock catch rates increased again after the turn of the century, the Swedish fishermen remained on the Shetland grounds, however. It must be emphasised that this is only a provisional conclusion. To reach a firmer conclu-
550 Fiskeri-Beretning 1888/89-1914. 551 Fiskeri-Beretning 1888/89-1914.

264
sion it will be necessary to analyse additional catch data from other North Sea countries’ fishing fleets.
Conclusion The expansion of the Shetland fishery and the decline of the Skager-rak fishery were the most significant changes in the development from the late 1880s to 1914. Three hypotheses have been examined to explain this shift.
Firstly, economy certainly played an important role in the devel-opment. For some years, considerable catches from the Shetland fish-eries were landed and sold in Britain. Also, the Swedes often chose to land their catches in Shetland because it allowed them to reduce their travelling time between the grounds and the landing port. This sup-ports Dalén’s interpretation that the British market attracted the Swedes.
Secondly, there is no evidence of a change in target species. On the contrary, ling remained the target species of the longline fishery.
Thirdly, declining catch rates for ling, cod and haddock in the Skagerrak may have forced the Swedes to the Shetland grounds, where catch rates for ling were high. This supports Hilborn and Wal-ters’ model of fishing fleet dynamics, in which fishermen venture to more distant grounds when catch rates decline in the grounds closer to home.
Technological changes
Technological change is highly relevant to the issue of human re-sponses to ecosystem changes. Hilborn and Walters argue that fish-ermen typically introduce more efficient gear in an attempt to allevi-ate problems relating to declining stock abundances. This question should also be examined in regard to the development of the Bo-huslän longline fisheries.
In terms of fishing vessels, nineteenth century Swedish fishermen were far behind the British. In 1881, four fishermen from Grundsund were sent to Grimsby to learn British fishing practices. Their stay was funded by the Hushållningssällskap. In 1884, Oscar Dickson, a Göte-borg merchant, bought the British sailing smack ‘Astrea’ and let the

265
Grundsund fishermen use it free of charge for six months. The vessel fished off Shetland, but it was sold to Russia at a public auction in 1885. Landing the catches in Shetland and Gullholmen in 1885, the nine fishermen on the ‘Astrea’ earned 593 kr. each, which was approx. 40 per cent more than the Skagerrak, Jäderen and Kattegat fishermen earned.552 The catalyst for change, a merchant’s investment in a sailing smack, came from outside the Bohuslän fishing communi-ties.
The experiences that the Grundsund fishermen made off Shetland stimulated them to engage further in this fishery. In 1886, three ves-sels from Grundsund went to the Shetland grounds, and they were followed by a vessel from Mollösund.553 According to Malm, the longline fleet was unsuitable for fisheries on these distant grounds. Malm did not specifically state what prevented the Swedish longline vessels from fishing off Shetland, but he did make it clear that they were technologically inferior to the British fleet.
In 1886 attempts were made to acquire a former British sailing smack, which turned out to be too expensive for the fishermen, how-ever.554 The following year fishermen from Gullhomen acquired three vessels of the ‘Astrea’ type.555 The fleet was further expanded the following years. By 1892, fishermen in Grundsund and Gullholmen had acquired 8 and 6 vessels, respectively.556 Mollösund and Bleket followed suit in 1893, and subsequently many villages bought such vessels.
In most years from 1891 to 1905, Malm recorded the number of sailing smacks in the individual fishing villages. Figure 50 shows the aggregated data set from 1884 to 1905. The main expansion took place in 1898 and 1899 when 73 vessels were acquired. With a fleet of more than 40 sailing smacks in 1904, Gullholmen became the main centre for this type of vessels. The Gullholmen fleet saw a major ex-
552 Berättelse 1884, p. 2; Berättelse 1885, p. 2; Berättelse 1886-87, p. 3. 553 Berättelse 1886-87, p. 1-2. 554 Berättelse 1886-87, p. 4. 555 Berättelse 1887-88, p. 3-4. 556 Berättelse 1892-93, p. 3.

266
pansion from 1897 to 1902, which was followed by Grundsund, Mollösund and Hällevikstrand, each of which were the home ports of approximately 20 such vessels in 1904.
0
50
100
150
200
250
1884 1886 1888 1890 1892 1894 1896 1898 1900 1902 1904
Total
Used in longline fisheries
Figure 50. Number of sailing smacks in the Bohuslän fishing fleet, 1884-1905. 557
Traditionally, the longline fishermen had taken their vessels on shore during the winter, and Malm said this practice was still being used in 1894.558 In contrast, the sailing smacks were used all year round. Being faster and more versatile vessels, they were also em-ployed in the mackerel fisheries in the North Sea and carried freight in the Baltic Sea during parts of the year. Moreover, some of the ves-sels provided accommodation for the fishermen during the coastal herring fisheries, and they were used for onboard curing of the her-
557 Berättelse 1884-1904/05. 558 Von Yhlen, 1880, p. 41; Berättelse 1893-94, p. 3.

267
ring catches.559 This serves as an indication of the rationalisation of the Bohuslän fishing sector.
While the sailing smacks, or kuttrar as they were called in Bo-huslän, represented an innovation in the Swedish longline fisheries, the British fishermen looked upon them as obsolete.560 In the UK, sailing smacks were being replaced by steam vessels. The British subsequently offered their sailing smacks for sale at prices that the Swedish fishermen (and fishermen in other continental countries) could afford to pay.561 Malm himself strongly supported the techno-logical changes in the longline sector, advising the fishermen to ac-quire the former British sailing smacks. The acquisitions were facili-tated by cheap government loans that were made available to the fish-ermen in the late 1890s.562
Symptomatically, the territorial expansion of the fishery coin-cided with the introduction of the first sailing smacks. In his report covering 1898-99, Malm stated that the expansion to Shetland took place insofar as the fishermen could provide large fishing vessels (i.e. sailing smacks).563 Concluding on Malm’s observations, the introduc-tion of the new type of vessel was crucial to the territorial expansion of the longline fishery during the 1890s.
While the sailing smacks eventually became the backbone of the Bohuslän longline fisheries, other technological options were consid-ered in the 1880s. The idea of acquiring a steam vessel for longline fisheries had been aired at least as early as 1885 in an article by M. Rubenson in Bohuslänsk Fiskeritidsskrift, a Swedish fisheries journal. Rubenson characterised the Bohuslän fishery as outdated and hoped
559 Berättelse 1888-89, p. 6; Berättelse 1891-92, p. 3; Berättelse 1893-94, p. 3 ; Berättelse 1895-96, p. 3; GLA, Göteborgs och Bohus Läns Länsstyrelse, Landskansliet, DVb:16, Malm, Femårsberättelse, 1886-90 & 1901-05. 560 The histories and technical data of the individual sailing smacks are described by Dambert. 561 Berättelse 1894-95, p. 38. See Haines 1998a and Robinson 1984 regarding the technological changes in the British fishing fleets. 562 Berättelse 1899-1900, p. 4. 563 Berättelse 1898-99, p. 3.

268
that steam vessels would be introduced into demersal fisheries.564 In 1886 the possibilities of establishing a private limited company to employ a steamship in the longline fisheries were examined.565 The following year, a fishing company, the Vinga, was established in Göteborg and acquired the steamship Flygarn. Despite its small size, the Flygarn was engaged in longline fisheries in the Skagerrak and partly off Shetland and the Orkneys.566 The performance of the steamship did not stimulate the Bohuslän fishermen to purchase simi-lar vessels, and Malm made no mention of the Flygarn in his reports after 1890.
Steam never came to play a role in Swedish longline fisheries. Nevertheless, innovations in vessel propulsion were transferred from shipping to the longline sector after the turn of the century. In 1907, Andersson mentioned that four motor vessels were introduced into the longline fishery.567 Already the following year the number had increased to 33.568 For the Shetland fishery alone, the fleet of motor boats soared from 2 in 1909 to 21 in 1910.569 This is a clear indication of the technological improvements of the longline fleet after 1900.
Alternatives to longline fisheries
Fishing with longline vessels on distant grounds was generally a dan-gerous occupation. In the 1890s, some longline fishermen could get employment elsewhere if they wanted to.
Overall, the Bohuslän fishing industry experienced high growth rates in the 1890s. The fishery for mackerel expanded, as did the Danish seine fishery. It became common for the longline fishermen to abandon demersal fishery as early as August to take part in mackerel 564 Bohuslänsk Fiskeritidsskrift II, 1885, p. 358. 565 Berättelse 1886-87, p. 4. 566 Berättelse 1887-88, p. 3; Berättelse 1888-89, p. 3-5; Berättelse 1889-90, p. 2; Berättelse 1890-91, p. 2. 567 Berättelse 1907-08, p. 3. 568 Berättelse 1909-09, p. 4. 569 Berättelse 1910-11, p. 3.

269
fisheries in the North Sea. In the early 1890s, this was a profitable pursuit.570 The growth rates in mackerel fishery increased signifi-cantly in the 1890s, often exceeding 10 per cent per annum.
In the late 1890s, large-scale coastal herring fishery came to an end when the herring departed from the archipelago. However, an offshore purse seine fishery, vadsillfisket, was initiated instead, which meant that the fishermen followed the herring schools offshore. This way they avoided the major economic crisis which usually followed the decline of coastal herring fisheries. They had the required techni-cal capabilities, vessels with combustion engines and purse seines, to catch herring in the Kattegat and the Skagerrak.571
While steam vessels never came to play any significant role in Swedish longline fisheries, they were employed in other sectors of the industry after the turn of the century. In 1901 a fishing company, Göteborgs Ångfiskeaktiebolag, was established with the purpose of pursuing British-style trawl fishery. Initially, most crew members were British, but the plan was to gradually replace them with Swedes. Fishing was conducted in the North Sea and the Irish Sea, and catches were landed in the traditional British trawling harbours of Grimsby and Fleetwood.572 It is symptomatic that the annual reports from 1905 onwards included a separate section on trawl fisheries. As opposed to the longline vessels, the steam trawlers mainly pursued haddock.573 Steam trawlers required significantly more capital than the traditional longline vessels.574
While shipping had been a major source of employment for Bo-huslän’s coastal population after the demise of the herring fishery in 1809, it became increasingly concentrated in the large ports of Göte-borg, Stockholm and Skåne in the second half of the nineteenth and
570 Berättelse 1890-91, p. 3. 571 Dalén, p. 238-44. 572 Berättelse 1901-02, p. 5-6; Berättelse 1902-03, p. 5-9; Berättelse 1903-04, p. 4-5; Berättelse 1905-06, p. 4-5. 573 Berättelse 1909-10, p. 6. 574 Sveriges Officiella Statistik: Fiske 1914.

270
twentieth centuries as capital requirements increased.575 Thus if fish-ermen wanted to seek employment in the merchant marine, the large ports rather than the small coastal communities were the right places to go.
While Bohuslän’s fishing industry was undergoing structural changes in the 1890s, the fishermen also had employment opportuni-ties ashore. Bohuslän was the hinterland of Göteborg, which ex-panded rapidly at the time. As mentioned above, the population growth rates in the other parts of Bohuslän were very modest in com-parison.576
Also a new industry was established in Bohuslän in the 1880s, namely the stone quarries. In his book from 1984, historian Lennart Persson analysed the stone quarry industry in Bohuslän from an eco-nomic and political point of view.577 The first stone quarry in Bo-huslän was established on the island of Malmön in 1842, but the in-dustry remained very small-scale until the 1880s and did not really take off until the 1890s. The production of paving stones drew work-ers from many parts of Sweden to Bohuslän. At the height of the pro-duction in 1929, the industry employed 7,000 workers.578 In the 1890s the industry changed from seasonal occupation to all-year employ-ment. It was a low-pay industry, and the quarrying working culture differed from the culture in the fisheries. The stone quarry labourers developed radical political sympathies with revolutionary views, which was certainly not the case in the fisheries.
What was the impact of the stone quarry industry on the longline fisheries? The peninsulas of Sotenäset and Stångenäset were ideal for stone quarries, which were situated close to the sea with easy access to sea transportation. Old fishing communities such as Veijern, Bovallstrand, Hunnebostrand, Grafvarne, Hovenäset and Tången were increasingly inhabited by stone quarry workers.579 Nevertheless,
575 Kuuse et al., p. 60-75; Olsson 1995. 576 Persson, p. 191; Nilsson 1963, p. 371; Fritz. 577 Persson 1984. 578 Hasslöf 1949, p. 435. 579 Dalén, p. 289-92, 305-6.

271
the stone quarries had a comparatively insignificant impact on the longline sector. According to Persson, the stone quarry in the middle part of Bohuslän did absorb manpower from the fisheries when the coastal herring fisheries declined in the late 1890s, but many former fishermen returned to the fisheries after the turn of the century.580 Also vessels from the mackerel fisheries were employed in the ship-ment of stones during the seasons of the year when no fisheries were conducted.581 The longline fisheries had already declined in Sotenäset and Stångenäset when the stone quarries industry took off in the 1890s. Thus it is safe to conclude that the stone quarries only had an important impact on other fishing sectors than longlining.
Longline fisheries after 1914
World War One broke out in the late summer of 1914. Even though Sweden did not take part in the hostilities, the war changed the condi-tions of the Swedish fishing industry. It is worthwhile to briefly study the development of the Swedish longline sector during the war, be-cause it may also shed light on the development in the pre-war years.
When war broke out in August 1914, the longline season was al-ready coming to an end. In his memoirs, fisherman Axel Bergström described the events of 1914.582 Having completed the third trip of the year in the ‘ling fishery’, Bergström and his fellow fishermen were preparing for the mackerel fishery when war was declared. Some fishermen had already left Bohuslän to start fishing for mackerel on the Dogger Bank in the middle North Sea. While some fishermen decided to stay at home due to the new circumstances, Bergström and his colleagues chose to proceed to the Dogger Bank. After a few days of uninterrupted fishing, they were approached by a warship and ad-vised to suspend fishing. They took the advice and thus ended the fishing season. Bergström’s story shows how the war changed the conditions for the fisheries. 580 Persson, p. 50, 156, 166, 182-4; Hasslöf, 1949, p. 259, 437-8. 581 Persson, p. 123. 582 GMA 5233:26-27.

272
Hostilies made fishing in the North Sea more dangerous, and the longline fishery declined accordingly. The fishery inspectors’ annual reports stated that the Bohuslän fishermen increasingly concentrated their fisheries in the Kattegat and the Skagerrak, which was closer to the safe Swedish, Danish and Norwegian harbours.583 With regard to longline fishery, the annual reports stated specifically, however, that fishing still took place off Shetland and between Shetland and Jäderen in Norway.584 These were more dangerous waters, which made a large group of fishermen decide to leave the longline sector. In 1915 longline fisheries were pursued only by 714 men; in compari-son, the 1914 figure was 1,284.
0
1.000.000
2.000.000
3.000.000
4.000.000
5.000.000
6.000.000
7.000.000
8.000.000
1914 1915 1916 1917 1918 1919 1920
kg
CodHaddockWhitingLingTusk
Figure 51. Demersal catches by weight in all sectors of the Bohuslän fisheries, 1914-20. 585 583 Sveriges Officiella Statistik: Fiske 1915, p. 23; Sveriges Officiella Statistik: Fiske 1916, p. 18-9; Sveriges Officiella Statistik: Fiske 1917, p. 22. 584 Sveriges Officiella Statistik: Fiske 1915, p. 30; Sveriges Officiella Statistik: Fiske 1916, p. 25; Sveriges Officiella Statistik: Fiske 1917, p. 28; Sveriges Officiella Statistik: Fiske 1918, p. 30. 585 Sveriges Officiella Statistik: Fiske 1914-1920.

273
0%
200%
400%
600%
800%
1000%
1200%
1914 1915 1916 1917 1918 1919 1920
CodHaddockWhitingLingTusk
Figure 52. Index of price per kg, 1914-20. 586
The annual reports provide evidence of a remarkable decline in
ling catches. As Figure 51 shows, catches had halved from 1914 to 1917. By contrast, catches of other demersal species increased. Cod catches swelled by 50 per cent, and haddock catches more than tri-pled. Cod and haddock catches increased to satisfy a high demand for fish. Despite the increased landings of cod and haddock, fish prices continued to soar. Interestingly, ling and tusk were the scarcest spe-cies, and their prices increased the most. Even after correcting fish prices for inflation, the price of ling more than tripled from 1914 to 1917. The prices of cod and haddock also increased, but not nearly to the same extent. This development is evident from Figure 52. Given the favourable prices of ling, it is remarkable that the fishermen did not succeed in increasing the catches of this species. The fishermen were able to increase the catches of cod and haddock from the Skagerrak, but a similar increase for ling was impossible. The fishing
586 Sveriges Officiella Statistik: Fiske 1914-20. Inflation index from Lagerqvist & Nathorst-Böös, p. 28

274
opportunities in the Skagerrak and the Kattegat could not compensate for the decreased catching opportunities off Shetland. This indicates that ling abundances were significantly lower in the Skagerrak than they were off Shetland. On that basis, the development of the longline fishery during World War One indirectly supports the hypothesis that a long-term decline had probably taken place in ling abundances in the Skagerrak before 1914. Ecological changes, i.e. declining ling abundances, played an important role in the development of the longline fishery.
In the interwar period, the long-term decline of the longline sector continued, but at a higher pace. Longline fishermen turned to other occupations, and in 1932 only 325 men remained in the sector. In comparison, 1,182 had been employed as late as in 1919. Longline catch values declined by 24 per cent from 1920 to 1939, whereas catch values in the entire Bohuslän fishing industry increased by 92 per cent.587 Fishing was concentrated in the coastal communities of Orust and Tjörn. Mollösund became the centre of longline fisheries until the ultimate demise of the fishery after World War Two.588
In his book Kystfolk, historian Poul Holm described the longline sector as an outdated fishery in the interwar period. The market for fresh fish was more expansive, and new market preferences for fresh fish were emerging. The problems of the sector were also evident in the population decline in the coastal communities of Bohuslän.589 Holm’s interpretation is supported by the data set described above.
The decline in Swedish longline fishery came late compared to the UK, the leading fishing nation at the time. In the UK, the decline in the longline sector happened as early as the 1860s and 1870s. The development in the longline sector was contrary to the development in most other UK fishing sectors. Thus, British fishermen changed focus to other sectors at an early time.590
587 Sveriges Officiella Statistik: Fiske 1919-39. 588 Dalén, p. 238-84; Hasslöf 1949, p. 77-80. 589 Holm 1992, p. 209. 590 Robinson 1984, p. 188-201.

275
Interestingly, the decline of the Swedish longline sector shows that boat-fellowships did not guarantee successful adaptation to struc-tural changes in the fish markets and fishing technology. In other words, rigidities in the longline communities may have prevented the fishermen from choosing a more dynamic and expansive fishing strategy.

276

277
CONCLUSION
Changing fishing strategies, 1840-1914
During the 74 years covered by this study, significant fishing strategy changes took place in the Bohuslän longline fisheries. The changes were most evident in terms of geography and types of fishing vessel. New longline fisheries were launched on fishing grounds hithertho unknown to the Swedish fishermen, and a new type of vessel, the sailing smacks, was introduced. With regard to target species and fishing gear, no major changes took place, however. Ling remained the most important fish to the Bohuslän fishermen, and longlines were used throughout the period.
Based on fishing strategy shifts, the development in the Bohuslän longline fisheries for ling and cod can be subdivided into three dis-tinct phases:
• 1840-1877 • 1878-1889 • 1890-1914 The first phase until 1877 was characterised by the preeminent
position of the longline sector in the Bohuslän fisheries. In the views of contemporary observers, the fishing industry was underdeveloped in the 1840s and 1850s. It did expand, however, during the 1850s and 1860s. Traditionally, the Skagerrak grounds had been the main focus for longline fishermen, but the more distant Jäderen grounds were increasingly frequented during the 1850s. In the early 1860s, a fishery for ling and cod off Ålesund was initiated. Ecology played an impor-tant role in the spatial expansion of the fishery. Catch rates for ling were higher on the Jäderen and Ålesund grounds than in the Skager-rak. The fishermen were drawn to the more distant grounds by high stock densities. This demonstrates that catch rates, and ultimately ecology, were important drivers of change in the fisheries. The ex-pansion was also facilitated by the Swedish access to the attractive

278
Ålesund fish market, which was close to the Storeggen fishing ground.
In their theory of fishing fleet dynamics, Hilborn and Walters identified four prerequisites for spatial expansion in the development phases of fisheries. These were adequate technology, a large fish market, capital and daring. All four aspects were present when the Bohuslän fishermen went to Ålesund. The fishing ground off Åle-sund, however, was discovered by a fishing company from Göteborg. Thus, the catalyst for change came from outside the Bohuslän fishing communities. The spatial expansion of the Swedish fishery in the early 1860s happened rapidly, as predicted by Hilborn and Walters. Fisheries continued, however, on the old fishing grounds in the Skagerrak. This shows that the longline fishermen did not apply a mining strategy or deplete fish stocks serially.
During the second period, from 1878 to 1889, the longline sector underperformed compared to other fishing sectors, notably the her-ring and mackerel fisheries. The longline fleet decreased, and ling and cod fisheries on the most distant grounds, off Ålesund, were abandoned. The decline was primarily due to antropogenic factors. Declining fish prices, Norwegian competition and the alternative employment opportunities in the coastal herring fisheries explain the development. There is no indication of a decline in the demersal stock abundances off Ålesund at the time. Thus, Hilborn and Walters’ the-ory of fishing fleet dynamics does not explain this particular devel-opment. This case does not, however, refute Hilborn and Walters’ theory, but it emphasises a particular development in the Swedish fisheries at the time.
The third phase from 1890 to 1914 was characterised by techno-logical change and territorial expansion. Using former British sailing smacks, the Bohuslän fishermen were increasingly focusing on the distant fishing grounds off Shetland. Though outdated in Britain, the sailing smacks were superior to the old Swedish vessels. By the turn of the century, most fishing took place off Shetland. Market forces, ecology and technological innovation all played part in this shift in fishing strategy. For some years, the British fish market attracted Swedish fishermen, and Swedish catches were landed in Britain. Sig-nificantly, catch rates for ling were higher off Shetland than on the Jäderen and Skagerrak grounds. Furthermore, declining catch rates

279
for ling, cod and haddock in the Skagerrak may have forced the Swedish fishermen to the more distant grounds. Technological inno-vation, the sailing smacks, enabled the spatial expansion of the 1890s. Overall, the Bohuslän’s longline fishermen succeeded in maintaining catch rates for ling during the period from the 1840s to 1914 by means of technological innovation and a spatial expansion.
In Hilborn and Walters’ theory on fishing fleet dynamics, spatial expansion and technological innovation were caused by declining catch rates. Commonly, fishermen respond to ecosystem degradations and declining stock abundances with expansion and innovation. In-stead of lowering the fishing pressure, fishermen tend to increase the catching power of the fleet, when catch rates decline. Hilborn and Walters pessimistically predicted fisheries to peak at unsustainable levels with overexploitation and overcapitalisation. In their theory, there are cycles of innovation and consolidation; the fisheries will never achieve a stable situation. The theory fits very well with the development of the Swedish longline fishery in the 1890s and 1900s. There is no evidence of desperate fishermen in search for new fishing grounds or more efficient gear, but declining catch rates for ling, cod and haddock in the Skagerrak may have played a significant role in the spatial expansion of the fishery at the time. Indeed, the process of declining stock abundances, technological innovation and spatial expansion has a long history.
The social organisation of coastal communities
The main work on the Bohuslän fisheries was written by Olof Hasslöf in 1949. His book was very influential in Scandinavian maritime eth-nography and history, and it presented the result of impressive work with the social organisation in coastal communities. More broadly, Hasslöf established a paradigm with which to analyse maritime com-munities. His main notion regarded independent, cooperative and democratic fishermen. According to Hasslöf, these fishermen had a social organisation that was distinctly different from hierarchical and capitalist ventures. Hasslöf saw a clear dichotomy between independ-ent, cooperative fishermen and hierarchical capitalists. The issue is central to the understanding of coastal communities, but Hasslöf’s interpretation remains controversial.

280
The above analysis shows that the dichotomy between democracy and capitalism does not explain all the complexities of the social or-ganisation in nineteenth century Bohuslän. Even though the fisher-men did not distinguish between employer and employee, there were significant inequalities in regard to the ownership of vessels and gear.
When Hasslöf idealised the independent fishing teams, he under-estimated the importance of external catalysts of change. In the 1860s, fishing companies tried to introduce innovative curing prac-tices. Though they did not succeed in this attempt, one of the compa-nies discovered the highly productive Storeggen fishing ground and thus initiated an expansive period in the history of the fishery. Gov-ernment subsidies and the support of a Göteborg merchant also facili-tated the spatial expansion of longline fisheries. These aspects show that there was no sharp distinction between capitalist organisations and independent, democratic fishing communities.
Contrary to Hasslöf’s idealisation of the boat-fellowships, this dissertation has documented that the fishing teams did not guarantee the fishermen the best working conditions at sea. Many of the longline boat-fellowships were willing to take high risks of life at sea, such as when they went to the Ålesund grounds during the winter.
In the twentieth century, the Swedish longline fishery was out-dated. Despite the introduction of sailing smacks, the longline sector experienced a major decline compared to other fishing sectors in Bo-huslän. Thus, Hasslöf’s ideal boat-fellowships remained in a stagnat-ing fishing sector.
While Hasslöf idealised the Bohuslän fishing teams and boat-fellowships, he did not address the question of fishing’s impact on the marine environment. This study shows that, indeed, the basic, nine-teenth century fishing technology may have had a significant impact on the North Sea and Skagerrak ling stock. Therefore, this analysis sets the Swedish fishery in a very different perspective.
Long-term ecosystem changes
The fisheries management of the North Sea suffers from historical myopia, being based mainly on time series which only go back as far as the 1960s at best. The present management does not take long-term ecosystem changes into account, and nobody knows if the present

281
state of the North Sea ecosystem is unprecedented in a long-term perspective. Have fish stocks declined significantly on a centennial scale? And what has caused aquatic ecosystems to change? The his-tory of the oceans and fish stocks is virtually unkown at the moment and merits more historical research.
This study has taken the Bohuslän longline fisheries in the Skagerrak and the North Sea from 1840 to 1914 as its case. Although it was a multispecies fishery, ling remained the primary target species for Swedish fishermen during the entire period. The catches of ling determined the financial outcome of the fishery. Cod, on the other hand, only had secondary importance to the longline fishermen, ex-cept for the skrejd fishery which was conducted off Ålesund from the 1860s to the early 1880s.
Based on commercial catch and effort data, the historical abun-dances of ling and cod in the Skagerrak and northeastern North Sea were calculated. The analysis was made in cooperation with Dr. An-drew B. Cooper, who established the models, Professor Poul Holm and Professor Brian MacKenzie. The historical abundance estimates shows that ling, a species of moderate commercial importance to the modern North Sea fisheries, was highly abundant in the 1870s. The calculations are supported by a large quantity of anecdotal evidence which indicates that ling was indeed a highly important species at the time. Since no stock assessment of ling is carried out today, a detailed comparison between historical and modern abundances is impossible. Nevertheless, the analysis indicates that a decline in the ling stock may have taken place on a centennial scale. All of the historical evi-dence suggests that the status of the ling population is presently worse (lower biomass, smaller individuals) than it was in the 1870s.
This study has also sought to estimate the abundance of cod in the Skagerrak and the northeastern North Sea in 1872. Unfortunately, there is some uncertainty with respect to total removals. Accordingly, the abundance estimates based on Swedish catches are only tentative and do not indicate any major change in the abundance of cod from the early 1870s to the present.
The abundance estimates for both ling and cod are conservative. The estimated total removals used in the calculation of the historical abundance estimates are corroborated by historical data sets from Swedish fish markets. The estimates are based on Swedish catches

282
only, however, and they disregard the fact that Danish and Norwegian fishermen caught substantial numbers of cod and also some ling at the time. Thus, the actual, historical stock abundance may have been higher than the estimates.
Did nineteenth century fishing technology have a significant im-pact on the stocks? Did the ling stock decline due to fishing? Signifi-cantly, long-term declines in average fish sizes may have taken place. The historical data sets from nineteenth century scholars and ecolo-gists show that the average size of ling probably declined from the 1840s to 1914, and presumably the decline continued in the twentieth century. In the nineteenth and twentieth centuries, the North Sea fish-ermen were targeting the same fish sizes, but generally late-twentieth century fishermen caught smaller fish than their nineteenth century predecessors. This development could be attributable to fishing. In fact, this may indicate that the Bohuslän longline fishery was ecologi-cally significant even though the fishermen used only low-tech longlines.
History and ecology
Marine environmental history is a bridge over the otherwise wide gap between history and ecology. Ecologists can learn from studies of historical fish populations, and ecology can increase historians’ un-derstanding of historical developments by elucidating the ecological driving forces of history.
This study has examined the North Sea ecosystem in the nine-teenth and early twentieth centuries and emphasises the importance of ecology to maritime history. The analysis has documented that major changes in the North Sea ecosystem may have taken place from the the nineteenth to the twenty-first century. In addition, changing fish stock abundances have had major implications for coastal communi-ties.
By extending biological data series backwards in time, historical studies may increase historians’ and ecologists’ understanding of long-term changes and give input to fisheries management. Reference points in fisheries management can be evaluated with long-term his-torical abundance estimates. Ling was a highly abundant species in

283
the nineteenth century, but today’s management plans do not even state a biomass reference point for this species.
The history of the oceans has only recently been studied by histo-rians and ecologists. Still, the changes in the seas are almost un-known, and these issues merit more research. While this study is based mainly on fisheries statistics from commercial sources, an al-ternative avenue would be to study scientists’ and naturalists’ papers from the past. Data from early trawl surveys are available in the his-torical archives, and historical biomass estimates may be derived from such sources. Also the question of long-term human impact on fish stocks should be examined. For example, the causes of stock fluctuations for such important species as cod, haddock and herring are poorly understood.591 Historical studies of fish stock fluctuations can help elucidate such issues.
This study shows that centennial scale changes in the North Sea ecosystem may have been considerable. Ling abundances in the Skagerrak and northeastern North Sea may have been considerable in the 1870s, but abundances have most probably declined on a centen-nial scale due to fishing. Whenever possible, such changes should be taken into account in modern fisheries management. This book’s most important contribution is the merger of ecological, economic and social analyses. The social and economic dynamics in fisheries cannot be understood without accounting for human interaction with marine ecosystems.
591 See Daan et al.; Hislop; Pope et al; Heath et al.

284

285
BIBLIOGRAPHY
Unpublished sources
Riksarkivet, Stockholm [RA] Statistiska Central Byrån [SCB], Byrån för Jordbruksstatistik, Fisket, Primärmaterial, Län O, H VIaa:8, 1914-15. Landsarkivet, Göteborg [GLA] Göteborgs och Bohus Läns Landsstyrelse, Landskansliet: Femårsberättelser, DVb:7-16. EVI:12-18, Rapport angående medelpriset för de särskilda saltsjöfisk, som blivit till försäljning torgförda. Göteborgs och Bohusläns AB för Storsjöfiske, A 274. Göteborgs museums arkiv, Göteborg [GMA] Havsfiske Bohusläns museums arkiv, Uddevalla [BMA] Olof Hasslöf’s arkiv National Archives of Scotland, Edinburgh [NAS] Fisheries Board of Scotland, AF 7-37.

286
Other unpublished sources Bertelsen, Jan & K. Sekkelund, 1984, Fra kyst- til havfiskeri, Skagen 1870-1910, unpublished master’s thesis, University of Aalborg.
Haines, Michael Stuart, 1998a. Britain’s Distant Water Fishing In-dustry, 1830-1914: A Study in Technological Change, unpublished PhD dissertation, University of Hull.
Robinson, Robb, 1984. The English Fishing Industry 1790-1914: A Case Study of the Yorkshire Coast, unpublished PhD dissertation, University of Hull.
Publications
Ackefors, Hans, 1970. ‘Sillen förr och nu i Västerhavet och Nor-dostatlanten’. Göteborgs Naturhistorisk Museum: Årstryck 1970, p. 23-86.
Alheit, Jürgen & E. Hagen, 1997. ‘Long-term climate forcing of European herring and sardine populations’. Fisheries Oceanography 6:2, p. 130-139. Alward, G.L., 1911. The Development of the British Fisheries during the 19th Century with Special Reference to the North Sea, Grimsby News Co., Grimsby.
Amorosi, Thomas, T.H. McGovern & S. Perdikaris, 1994, ‘Bioar-chaeology and cod fisheries: a new source of evidence’. Jakobsson, Jakob, Astthorsson, R.J.H. Beverton, B. Björnsson, N. Daan, K.T. Frank, J. Meincke, B. Rothschild, S. Sundby & S. Tilseth (ed.) ICES Marine Science Symposia 198, p. 31-48, ICES, København.
Andersson, Bertil, 1996. Göteborgs historia – näringsliv och sam-hällsutveckling: Från fästningsstad till handelsstad 1619-1820. Nerenius & Santérus, Stockholm.

287
Andersson, K.A., 1942. Fiskar och fiske i Norden vol. 1, Natur och Kultur, Stockholm.
Andersson, K.A., 1956. De stora sillfiskeperioderne på Sveriges väst-kust och sillen som framkallade dem. Lund.
Andersson, K.A., 1958. The Stock of Herring and the Herring Fisher-ies on the West Coast of Sweden in the First Half of the Twentieth Century, Institute of Marine Research, Series Biology, Report no. 8, Lund.
Andersson, K.A., 1960. On the Causes of the Great Fluctuations in the Herring Fishery on the West Coast of Sweden, Institute of Marine Research, Series Biology, Report no. 12, Lund.
Annual Report of the Fishery Board of Scotland, 1883, 1893, 1899, 1912, Edinburgh, Glasgow, London.
Barrett, James H., Rebecca A. Nicholson & Ruby Cerón-Carrasco, 1999. ‘Archaeo-ichthyological Evidence for Long-term Socioeco-nomic Trends in Northern Scotland: 3500 BC to AD 1500’. Journal of Archaeological Science 26, p. 353-88. Barrett, James H., A.M. Locker & C.M. Roberts, 2004. ‘The origins of intensive marine fishing in medieval Europe: the English evi-dence’. Proceedings of the Royal Society of London Series B, 271, p. 2417-21.
Bergstad, Odd Aksel & N.R. Hareide (ed.), 1996. Ling, blue ling and tusk of the north-east Atlantic. ‘Fisken & Havet’ 15, Havforskningsinstituttet, Bergen.
Bertelsen, Jan & K. Sekkelund, 1985. ’Kutterfiskeriets udvikling fra Skagen’. Kattegat-Skagerrak projektet: Meddelelser 9, p. 68-97.
Berättelse: • Andersson, K.A., Berättelse öfver Göteborgs och Bohus läns
fisken 1906/07-1912/13, Göteborg.

288
• Malm, A.H., Berättelse öfver Göteborgs och Bohus läns hafsfisken 1886-1903/04, Göteborg.
• Malm, A.H., Berättelse öfver Göteborgs och Bohus läns fisken 1904/05-1905/06, Göteborg.
• Von Yhlen, Gerhard, Berättelse öfver Bohusläns hafsfiske 1867-75, Göteborg
• Von Yhlen, Gerhard, Berättelse öfver Göteborgs och Bohus läns hafsfisken 1876 – 85, Göteborg.
Bogue, Margaret Beattie, 2000. Fishing the Great Lakes: An Envi-ronmental history 1783-1933, University of Wisconsin Press, Madis-son. Bohuslänsk Fiskeritidsskrift, 1884-91. Ljungman, Axel Vilh. (ed.), Göteborg. Bolster, William Jeffrey & Karen Alexander, (forthcoming), ‘Using Historic Records to Determine the Abundance of Cod on the Nova Scotian Shelf, 1852-1859: An Interdisciplineary Approach to the Enviromental History of the North West Atlantic’.
Bolster, W. Jeffrey, 2006. ‘Opportunities in marine environmental history’. Environmental History 11, issue 3, p. 567-597.
Branch, Trevor A., Ray Hilborn, Alan C. Haynie, Gavin Fay, Lucy Flynn, Jenniifer Griffiths, Kristin N. Mashall, Jeffrey K. Randall, Jennifer M. Scheuerell, Eric J. Ward, and Mark Young, 2006. ‘Fleet dynamics and fishermen behaviour: lessons for fisheries managers’. Canadian Journal of Fisheries and Aquatic Sciences. 63, p. 1647-68.
Bulletins Statistique 1903-1914. International Council for the Explo-ration of the Sea, Høst, København. Butcher, John G., 2004. The Closing of the Frontier: A History of the Marine Fisheries of Southeast Asia, c. 1850-2000, Institute of South-east Asian Studies, Singapore.

289
Cadigan, Sean T. & J.A. Hutchings, 2001. ‘Nineteenth-Century Ex-pansion for the Newfoundland Fishery of Atlantic Cod: An Explora-tion of Underlying Causes’. P. Holm, T.D. Smith & D.J. Starkey, Exploited Seas: New Directions for Marine Environmental History, St. John’s, Newfoundland, p. 31-65.
Campbell, Robert A., 2004. ‘CPUE standardisation and the construc-tion of indices of stock abundance in a spatially varying fishery using general linear models’. Fisheries Research 70, p. 209-27.
Cardinale, Massimiliano & H. Svedäng, 2004. ‘Modelling recruit-ment and abundance of Atlantic cod, Gadus morhua, in eastern Skagerrak-Kattegat (North Sea): evidence of severe depletion due to a prolonged period of high fishing pressure’. Fisheries Research 69, p. 263-82.
Castro, Peter & M.E. Huber, 1992. Marine Biology, McGraw-Hill, Boston.
Christensen, Gunnar, 1984. ‘Dansk Fiskeriforening – dens forløbere og udviklingen 1884 til 1913’. Erhvervshistorisk Årbog 1983, Aarhus Universitetsforlag, Århus, p. 21-83.
Christensen, Villy, G. Sylvie, J.J. Heymans, C.J. Walters, R. Watson, D. Zeller & D. Pauly, 2003. ‘Hundred-year decline of North Atlantic predatory fishes’. Fish and Fisheries 1, p. 1-24.
Cornell, Lars, 1988. ‘Kring den bohuslänska allmogesjöfartens karak-tär under 1800-talet’. Lasse Cornell (ed.), Kattegat-Skagerack projek-tet 16, p. 9-13, Göteborg.
Corten, Ad., 2001. Herring and Climate. Changes in the distribution of North Sea herring due to climate fluctuations, Ponsen & Looijen, Wageningen. Cornell, Lasse, 1985. ‘Handel och sjöfart i Kattegatt-Skagerack-området I ljuset av ekonomisk integration och disintegration 1800-1880’, Kattegat-Skagerrak Projektet Meddelelser 8, p. 7-36.

290
Coull, James R., 1996. The Sea Fisheries of Scotland: A Historical Geography, John Donald Publishers, Edinburgh.
Cronon, William, 1983. Changes in the land: Colonist, and the ecol-ogy of New England, Hill & Wang, New York.
Cushing, David H., 1966. The Arctic cod: A study of research into the British trawl fisheries, Pergamon, Oxford.
Dambert, Eric, 1990. Kutterepoken i Sverige 1 & 2, Munkedal.
Daan, Niels, K. Richardson & J.G. Pope, 1996. ’Changes in the North Sea Ecosystem and their Causes: Århus 1975 Revisited’. ICES Jour-nal of Marine Science 53, p. 879-83. Dalén, Lennart, 1941. Den bohuslänska fiskelägesbygden, Göteborgs högsk., Geografiska institutionen, Göteborg.
Drechsel, C.F., 1890. Oversigt over vore Saltvandsfiskerier i Nordsøen og Farvanden indenfor Skagen, Indenrigsministeriet, København.
Ekström, G.U., 1845. Praktisk Afhandling om lämpligaste sättet att fiska Sill, Torsk, Långa, Makrill, Hummer och Ostron, Stockholm, 1845. Engås, Arill & Svein Løkkeborg, 1994. Marine Fish Behaviour in Capture and Abundance Estimation, Fishing News Books, Oxford.
FAO, 2004. The State of World Fisheries and Aquaculture, FAO, FN, Rom. Feddersen, A., 1883. De danske Hav-Fiskerier, Hoffensberg & Traps, København.
Fernö, Anders & Steinar Olsen (ed.), 1994. Marine Fish Behaviour in Capture and Abundance Estimation, Fishing News Books, Oxford.

291
Fisheries Research 70, 2004. Fiskeri-Beretning for Finantsaaret 1888/89-1907/08, 1890-1908, København.
Fiskeri-Beretning for Aaret 1908-1914. 1909-1915, København.
Fréon, Pierre & Misund O.A., 1999. Dynamics of pelagic fish distri-bution and behaviour: Effects on fisheries and stock assessment, Fishing News Books, Oxford.
Fritz, Martin, 1996. Göteborgs historia – näringsliv och samhällsut-veckling: Från handelsstad till industristad 1820-1920, Nerenius & Santérus, Stockholm.
Garstang, Walter, 1900. ‘The impoverishment of the sea – a critical summar of the experimental and statistical evidence bearing upon the alleged depletion of the trawling grunds’. Journal of the Marine Bio-logical Association 6, p. 1-69.
Gerhard, Ingemar, 1940. ’Bohusläns havsfiske 1859-1900’ in Svenska Västkustfiskaren 3, p. 54-9.
Gerhard, Ingemar, 1955. Västkustfisket: Dess organisationer och ekonomi, Svenska västkustfiskarnas centralförbund, Göteborg.
Gray, Malcolm, 1978. The Fishing Industries of Scotland, 1790-1914, Oxford University Press, Oxford.
Grotewold, Chr., 1908. Die deutsche Hochseefischerei in der Nord-see, Ernst Heinrich Moritz, Stuttgart.
Haglund, Bertil (ed.), 1952. ‘Västkustfiske. Fiskar och fiske i Väster-havet’, Norstedts, Stockholm.
Haines, Michael, 1998b. ‘The Impact of Steam Vessels on Britain’s Distant Water Fisheries before 1914’ in Holm, Poul & D. Starkey

292
(ed.), North Atlantic Fisheries, Markets and Modernisation, Studia Atlantica, 2, Fiskeri- & Søfartsmuseet, Esbjerg, p. 99-118.
Handlingar: Göteborg och Bohusläns Hushållningssällskaps Han-dlingar, 1859-65, Göteborg och Bohusläns Hushållningssällskap, Göteborg.
Haneson, Walder & Karl Rencke, 1923. Bohusfisket, Jubileumsut-ställningens publikationskom., Göteborg. Hansson, Olof 1983. Min barndom på Gullholmen, Skrifter utgivna av Bohusläns museum och Bohusläns hembygdsförbund 6, Udde-valla.
Hasslöf, Olof, 1939. Bankskutor och sjöbåtar i Bohuslän, Göteborg.
Hasslöf, Olof, 1949. Svenska västkustfiskarna: Studier i en yrkes-grupps näringsliv och sociala kultur, Svenska Västkustfiskarnas Cen-tralförbund, Göteborg.
Hasslöf, Olof, 1972. ‘Maritime Commerce’ in Hasslöf, Olof, H. Hen-ningsen, A.E. Christensen jr., ‘Ships and Shipyards, Sailors and fish-ermen: Introduction to Maritime Ethnology’, Københavns Univer-sitetsforlag, København, p. 73-122.
Hasslöf, Olof, 1979. ‘Rättsförhållanden och organisationsformer i sillfisket’ in Norveg, no. 22, Universitetsforlaget, Oslo, p. 91-109.
Hasslöf, Olof, 1981.’Från skeppslag til rederiaktiebolag’, Handels- og Søfartsmuseets årbog 1981, Handels- og Søfartsmuseet på Kronborg, Helsingør, p. 110-28.
Heath, M.H. & K. Brander, 2001. ICES Cooperative Research Report 244, ICES, København.
Heidbrink, Ingo, 2004. Deutschlands einzige Kolonie is das Mer!: Die deutsche Hochseefischerei und die Fischereikonflikte des 20.
293
Jahrhunderts, Schriften des Deutschen Schiffartsmuseums 63, Bre-men.
Helgoland Marine Research 59, No. 1, 2005.
Hilborn, Ray & C. Walters, 1992. Quantitative Fisheries Stock As-sessment: Choice, Dynamics and Uncertainty, Kluwer, Bos-ton/Dordrecht/London.
Hislop, John R.G., 1996. ’Changes in North Sea gadoid stocks’, ICES Journal of Marine Science 53, p. 1146-1156.
Hjort, Johan, 1905. Norges fiskerier I: Norsk Havfiske, Selskabet for De norske Fiskeriers Fremme, Bergen. Hjort, Johan & C.G. Joh. Petersen, 1905. Kort Oversigt over de Inter-nationale Fiskeriundersøgelser Resultater, Skrifter udgivne af Kom-misionen for Havundersøgelser 3, C.A. Reitzel, København. Holdsworth, Edmund W.H., 1874. Deep-Sea Fishing and Fishing Boats, Edward Stanford, London. Holm, Poul, 1991. Kystfolk. Kontakter og sammenhænge over Kat-tegat og Skagerrak ca. 1550-1914, Fiskeri- & Søfartsmuseet, Esbjerg.
Holm, Poul, 1992. ’The Modernisation of Fishing: The Scandinavian and the British Model’, L. Fischer, H. Hamre, P. Holm & J.R. Bruijn, The North Sea: Twelve Essays on Social History of Maritime Labour, p. 197-214, Stavanger Maritime Museum & The Association of North Sea Societies, Stavanger.
Holm, Poul, 2000. ’Under overfladen – havenes økohistorie’, Ny Vi-den 10a, Syddansk Universitet, Odense.
Holm, Poul, T.D. Smith & D.J. Starkey (ed.), 2001. The Exploited Seas: New Directions for Marine Environmental History, Interna-tional Maritime Economic History Association/Census of Marine Life, St. John’s, Newfoundland.

294
Holm, Poul, 2003. ‘History of Marine Animal Populations: a global research program of the Census of Marine Life’, Oceanologica Acta 25, p. 207-211.
Holmberg, Axel Em., 1842-45. Bohusläns Historia och Beskrifning 2-3, Uddevalla.
Hoogendijk Jz., A., 1894. De Grootvisscherij op de Noordzee, Tjeenk Willink, Haarlem.
Högberg, Staffan, 1969. Utrikeshandel och sjöfart på 1700-talet: Stapelvaror i svensk export och import 1738-1808, Bonniers, Lund.
Holmquist, Tor, 1947. Den halländska vinter-fiskehamnsfrågan, Meddelande från Lunds Universitets Geografisk Institution, Avhan-dlingar XI, Lund.
Hutchings, Jeffrey A. & R.A. Myers, 1994. ‘What Can Be Learned from the Collapse of a Renewable Resource? Atlantic Cod, Gadus morhua, of Newfoundland and Labrador’ Canadian Journal of Fish-eries and Aquatic Sciences 51, p. 2126-2146.
Hutchings, Jeffrey A. & Ransom A. Myers, 1995. ‘The Biological Collapse of Atlantic Cod off Newfoundland and Labrador’ in Ragnar Arnason & Lawrence Felt (ed.) The North Atlantic Fisheries, p. 37-93.
Hutchings, J.A., 2002. ‘Life Histories of Fish’ in Reynolds, John D. & P.J.B. Hart, Handbook of Fish Biology and Fisheries, vol 1., Blackwell, Padstow, Cornwall, p. 149-74.
Höglund, Hans, 1972. On the Bohuslän Herring during the Great Herring Fishery Period in the Eighteenth Century, Institute of Marine Research, Series Biology, Report 20, Lund.
Höglund, Hans, 1976. Bohusläns sillperioder, Lysekil, 1976.

295
ICES 2002. ICES Report of ACFM 2002, ICES, København.
ICES 2002b, ICES Cooperative Research Report 255. ‘Report of the ICES Advisory Committee on Fishery Management’, København.
ICES, 2003. ICES Cooperative Research Report 261. ‘Report of the ICES Advisory Committee on Fishery Management’, København. ICES, 2004. ICES Advice 2004: ACFM/ACE Report 2004 1, book 2, part 1, ICES, København.
ICES, 2006. ICES Advice 2006: Report of the ICES Advisory Com-mette on Fishery Management, Advisory Commettee on the Marine Environment and Advisory Committee on Ecosystems, 2006, Book 6, ICES, København. ICES CM 1993/Assess:5. ‘Report of the Working Group on the As-sessment of Demersal Stocks in the North Sea and the Skagerrak’, ICES, København, 1993.
ICES CM 2000/ACFM:8. ‘Report of the Study Group on the Biology and Assessment of Deep-sea Fisheries Resources’, ICES, København, 2000.
ICES CM 2001/ACFM:23. ‘Report of the Working Group on Biology and Assessment of Deep-sea Fisheries Resources’, ICES, København, 2001.
ICES CM 2002/ACFM :16. ‘Report of the Working Group on the Biology and Assessment of Deep-Sea Fisheries Resources’, ICES, København, 2002. ICES CM 2004/ACFM:15. ‘Report of the Working Group on the Bi-ology and Assessment of Deep-Sea Fisheries Resources’, ICES, København, 2004.
Jackson, J.B.C., 1997. ‘Reefs since Columbus’, Coral Reefs 16, p. 23–32.

296
Jackson, Jeremy B.C., 2001. ’What was natural in the coastal oceans?’, ‘Proc. Natl. Acad. Sci. USA’, Vol. 98, issue 10, p. 5411-5418.
Jackson, Jeremy B.C., M.K. Kirby, W.H. Berger, K.A. Bjorndal, L.W. Botsford, B.J. Bourque, R.H. Bradbury, R. Cooke, J. Earland-son, J.A. Estes, T.P. Hughes, S. Kidwell, C.B. Lange, S.H. Lenihan, J.M. Pandolfi, C.H. Peterson, R.S. Steneck, M.J. Tegner, R.R. War-ner, 2001. ’Historical Overfishing and the Recent Collapse of Coastal Ecosystems’, Science 293, p. 629-638.
Jakobsson, Jakob, Astthorsson, R.J.H. Beverton, B. Björnsson, N. Daan, K.T. Frank, J. Meincke, B. Rothschild, S. Sundby & S. Tilseth (ed.), 1994. ICES Marine Science Symposia 198, ICES, København.
Jennings, Simon, M.J. Kaiser, J.D. Reynolds, 2001. Marine Fisheries Ecology, Blackwell, Oxford.
Johansen, Hans Chr., 1989, ‘Den danske fiskerbefolkning i perioden fra ca. 1700 til 1914’, Rogers, John (ed.) Kustbygd i förändring 1650-1950: Familj och hushåll i nordiska fiskesamhällen, Meddelande från Familjehistoriske projektet 8, Uppsala Universitet, Uppsala, p. 11-40.
Johnsen, Berit Eide, 2001. Rederistrategi i endringstid: Sørlandsk skipsfart fra seil til damp og motor, fra tre til jern og stål: 1875-1925, Høyskoleforlaget, Kristiansand.
Jónsson, J., 1994. ’Fisheries off Iceland, 1600-1900’, Jakobsson, Ja-kob, Astthorsson, R.J.H. Beverton, B. Björnsson, N. Daan, K.T. Frank, J. Meincke, B. Rothschild, S. Sundby & S. Tilseth (ed.) ICES Marine Science Symposia 198, ICES, København, p. 3-16.
Kaiser, M.J. & S. Jennings, 2002. ’Ecosystem Effects of Fishing’ in Hart, Paul J.N. & J.D. Reynolds (ed.), Handbook of Fish Biology and Fisheries 2, Blackwell, Padstow, Cornwall, p. 342-66.

297
Knijn, Ruud. J., T.W. Boon, H.J.L. Heesen & J.R.G. Hislop, 1993. ‘Atlas of North Sea Fishes: Based on bottom-trawl survey data for the year 1985-1987’, ICES Cooperative Research Report no. 194, ICES, København.
Krøyer, Henrik, 1843-45. Danmarks Fiske 2, København.
Kuuse, Jan & K. Olsson, 1997. Sjöfart & sjöförsäkring under 125 år: Sveriges Ångfartygs Assurans Förening, Sveriges Ångfartygs As-surans Förening, Göteborg.
Lagerqvist, Lars O. & E. Nathorst-Böös, 1997. Vad kostade det? Priser och löner från medeltid till våra dagar, LT, Stockholm.
Large, P.A., C. Hammer, O.A. Bergstad, J.D.M. Gordon, P. Lorance, 2003. ’Deep-water Fisheries of the North east Atlantic II Assessment and management Approaches’, J. Northw. Atl. Fish. Sci. 31, p. 151-163.
Larsen, Birger, 1975. ‘Havets geografi’, Nørrevang, Arne & T.J. Meyer (ed.) Danmarks Natur 3, Politiken, København, p. 9-23.
Lindquist, Armin, 1999. ‘Pelagic fish resources – not easy to predit, examples from herring and sprat fisheries of Bohuslän’, Andersson, Bertil (ed.), Swedish and International Fisheries, Rapport från Eko-nomisk-Historiska Institutionen vid Göteborgs Universitet 13, p. 9-21.
Ljungman, Axel Vilh., 1878. Bohus Läns Hafsfisken och de Veten-skapliga Hafsfiskeundersökningarna, Göteborgs Handels-Tidning, Göteborg.
Ljungman, Axel Vilh., 1883. Kortfattad Berättelse öfver De under Årtiondet 1873-83 utförda vetenskapliga undersökningar rörande sillen och sillfisket vid Sveriges Vestkust, Göteborg.
Lundbeck, Ol., 1832. Anteckningar rörande Bohuslänska Fiskeri-erna, i synnerhet Sillfisket, Göteborg.

298
Lundberg, Rudolf, 1888. Meddelanden rörande Sveriges Fiskerier, Wilhelm Bille, Stockholm.
Løberg, O.N., 1864. Norges Fiskerier, Benzen, Kristiania.
Løkkeborg, Svein, K. Skajaa & A. Fernö, 2000. ’Food-search strategy in ling (Molva molva L.): crepuscular activity and use of space’, Journal of Experimental Marine Biology and Ecology 247, p. 195-208.
MacKenzie, Brian R., J. Alheit, D.J. Conley, P. Holm & C.C. Cinze, 2002. ‘Ecological hypotheses for a historical reconstruction of upper trophic level biomass in the Baltic Sea and Skagerrak’, Canadian Journal of Fisheries and Aquatic Sciences 59, p. 173-190. Mackinson, Steven, 2002. ’Representing trophic interaction in the North Sea in the 1880s using the Ecopath mass-balance approach’ S. Guénette, V. Christensen, D. Pauly. (eds) Fisheries impacts on North Atlantic ecosystems: models and analyses, Fisheries Centre Research Reports 9 (4), p. 35-98. Magnusson, Lars, 1996. Sveriges ekonomiska historia, Tiden/Athena, Stockholm Magnússon, Jútta V., O.A. Bergstad, N.-R. Hareide, J. Magnússon & J. Reinert, 1997. Ling, Blue Ling and Tusk in the Northeast Atlantic, TemaNord 1997:535, Nordic Council of Ministers, København.
Malm, A.H., 1874. Om den brednäbbade kantnålens – Siphonostoma typhle Yarr – uteckling och fortplantning, Lund.
Malm, A.W., 1877. Göteborgs och Bohusläns Fauna: Ryggradsdjuren, Göteborg.
Maunder, Mark N. & A.E. Punt, 2004. ’Standardising catch and effort data: a review of recent approaches’, Fisheries Research 70, p. 141-59.

299
Molander, Arvid, 1936/37. ‘Bohusfisket under ett kvartssekel (1910-1934.)’, Vikarvet 14, p. 31-43.
Molander, Arvid R., 1956. Swedish Investigations on Ling (Molva vulgaris Fleming), Institute of Marine Research, Lysekil, Series Biol-ogy, Report 6.
Moustgaard, Poul, 1987. At vove for at vinde: Dansk fiskeri sildret af A.J. Smidth, 1859-63, Grenå (republication of A.J. Smidth, 1859-64), p. 7-36.
Myers, Ransom A., B.R. MacKenzie, K.G. Bowen & Nicholas J. Barrowman, 2001. ’What is the carrying capacity for fish in the ocean? A meta-analysis of population dynamics of North Atlantic cod’, Canadian Journal of Fisheries and Aquatic Sciences 58, p. 1464-76.
Myers, Ransom A. & B. Worm, 2003. ‘Rapid worldwide depletion of predatory fish communities’, Nature 423, p. 280-3.
Nicolson, James R., 1982. Hay & Company: Merchants in Shetland, Lerwick.
Nilsson, Sven, 1828. Förnyad Underdånig Berättelse om Fiskerierna i Bohuslän, Stockholm.
Nilsson, Lars, 1963, ’Det stora sillfisket 1752-1808’ in Lönnroth, Erik (ed.), 1963, Bohusläns historia, Almqvist & Wicksell, Uppsala, p. 281-355.
Nordisk Tidsskrift for Fiskeri, 1874-82. Boeck, Thorv., H.V. Fiedler, A. Feddersen, H. Widegren, A.V. Ljungman (ed.), København. Norsk Fiskeritidende, 1884. Grieg, Bergen.
Nystedt, Olle, 1994. Sillen i Bohuslän: Sillen, sillfisket och sillpe-rioderna i Bohuslän, Uddevalla, 1994.
300
Olsen, Harald, 1984. ’Makrelfiskets utvikling på den norske Skager-rak-kysten på 1800-tallet: En indikasjon på den moderne fisker-inærings fremvekst i Norge’, Kattegat-Skagerrak projektet Meddelel-ser 6, p. 85-112.
Olsson, Ragnar, 1984. ’Ett ösamfund under 1800-talet: Öckerö efter det stora bohuslänska sillfisket’, Kattegat-Skagerrak projektet: Med-delelser 6, p. 29-63.
Olsson, Ragnar, 1985. ’Västkustfisket i förändring’ in Kattegat-Skagerack projektet Meddelelser 9, p. 38-67.
Olsson, Ragnar (ed.), 1995. Sjömän, fartyg och samhälle: Studier i bohuslänsk sjöfartshistoria 1800-1900 1, Uddevalla.
Pauly, Daniel, 1995. ‘Anecdotes and the shifting baseline syndrome of fisheries’, Trends in Ecology & Evolution 10 (10), p. 430.
Pauly, Daniel, V. Christensen, J. Dalsgaard, R. Froese, F. Torres Jr., 1998. ‘Fishing down marine food webs’, Science 279, p. 860-863.
Pauly, D., V. Christensen, R. Froese & M.L.D. Palomares, 2000. ‘Fishing down aquatic food webs’, American Scientist 88, p. 46-51. Pauly, Daniel & J. Maclean, 2003. In a Perfect Ocean: The state of fisheries and ecosystems in the North Atlantic Ocean, Island Press, Washington, DC.
Persson, Lennart K., 1984. Arbete, Politik, Arbetarrörelse: En studie av stenindustrins Bohuslän 1860-1910, Meddelande från Historiska Institutionen i Göteborg, Göteborg.
Petersen, C.G. Joh, 1890. ’Om Naturforholdene i Farvandene inden-for Skagen’, Drechsel, C.F., 1890, Oversigt over vore Saltvandsfisk-erier i Nordsøen og Farvanden indenfor Skagen, Indenrigsministeriet, København, p. 103-46.

301
Pitcher, Tony J., 2001. ’Fisheries Managed to Rebuild Ecosystems? Reconstructing the Past to Salvage the Future’, Ecological Applica-tions 11, 2, p. 601-17.
Pope, J.G. & C.T. Macer, 1996. ‘An evaluation of the stock structure of North Sea cod, haddock and whiting since 1920, together with a consideration of the impacts of fisheries and predation effects on their biomass and recruitment’, ICES Journal of Marine Science 53, p. 1157-1169. Poulsen, B., Holm, P., & MacKenzie, B. R. (2007). ‘A longterm (1667-1860) perspective on impacts of fishing and environmental variability on fisheries for herring, eel, and whitefish in the Limfjord, Denmark’, Fisheries Research. Poulsen, Bo, 2005. Historical exploitation of North Sea herring stocks. An environmental history of the Dutch herring fisheries, c. 1600-1860. Unpublished PhD-dissertation, University of Southern Denmark. Poulsen, Bo (in press 1). Historical exploitation of North Sea herring stocks: - an environmental history of the Dutch herring fisheries, c. 1600-1860, Aksant, Amsterdam. Poulsen, Bo, (in press 2). ‘Talking Fish - Cooperation and communi-cation in the Dutch North Sea herring fisheries’. Beyond the Catch. Interdisciplinary approaches to the North Atlantic fisheries, 1000-1850, Brill, Leiden & Boston. Poulsen, Bo (in press 3). ‘Markets, prices and consumption. The her-ring trade in the North Sea and Baltic region, c. 1600-1850’, The dy-namics of economic culture in the North Sea- and Baltic Region (ca. 1250-1700). Studies of the Groningen Hansa Research Center. Poulsen, Bo (in press 4). Historical evidence for the variability of fish populations prior to industrialized fishing. Journal of Marine Sys-tems.

302
Poulsen, René Taudal, 2005. An Environmental History of North Sea ling and cod fisheries, ca. 1840-1914, Unpublished PhD-dissertation, University of Southern Denmark. Poulsen, René Taudal, Andrew B. Cooper, Poul Holm & Brian R MacKenzie, 2007. ‘An abundance estimate of ling (Molva molva) and cod (Gadus morhua) in the Skagerrak and the northeastern North Sea, 1872’, Fisheries Research. Poulsen, René Taudal & Poul Holm, 2007. ‘What can maritime histo-rians learn from marine science? The concept of catch per unit effort (CPUE)’, International Journal of Maritime History 19, No. 2. Publikationer: Göteborg och Bohusläns Hushållningssällskaps Pub-likationer, 1907-14, Göteborg.
Qvartalsskrift: Göteborg och Bohusläns Hushållningssällskaps Qvar-talsskrift, 1866-1907, Göteborg.
Rencke, Karl, 1929. ‘Terminologien i det bohuslänska storsjöfisket’, Göteborgs Kungl. Vetenskaps- och vitterhetssamhälles handlingar, F.5. Ser. A. Bd. 1, nr. 1, Göteborg.
Rijnsdorp, Adriaan D., P.I. van Leeuwen, N. Daan, H.J.L. Heessen, 1996. ‘Changes in abundance of demersal fish species in the North Sea between 1906-1909 and 1990-1995’, ICES Journal of Marine Science 53, p. 1054-1062.
Rogers, John, 1989. ’Fiske och fiskare i Sverige 1650-1950’, Rogers, John (ed.), Kustbygd i förändring 1650-1950: Familj och hushåll i nordiska fiskesamhällen, Meddelande från Familjehistoriske projektet 8, Uppsala Universitet, Uppsala, p. 57-82.
Robinson, Robb, 1987. A history of the Yorkshire coast fishing indus-try 1780-1914, Hull University Press, Hull. Robinson, Robb, 1996. Trawling: The Rise and Fall of the British Trawl Fishery, University of Exeter Press, Exeter.

303
Robinson, Robb, 2002. ’Steam Power and Distant-Water Trawling’, Starkey, David J., et al. (ed.), 2000, England’s Sea Fisheries. The Commercial Sea Fisheries of England and Wales since 1300, Lon-don, p. 206-16.
Rodhe, Sten Olof, 1964. Göteborgs och Bohus läns hushållningssäll-skap 1814-1964, Uddevalla.
Rohdenburg, Günther, 1975. Hochseefischerei an der Unterweser: Wirtschaftliche voraussetzungen, struktureller Wandel und technische Evolution im 19. Jahrhundert und bis zum Ersten Weltkrig, Staatsar-chiv der Freien Hansestadt Bremen, Bremen.
Rose, G.A., 2004. ‘Reconciling overfishing and climate change with stock dynamics of Atlantic cod (Gadus morhua) over 500 years’, Canadian Journal of Fisheries and Aquatic Sciences 61, p. 1553-7.
Rosenberg, Andrew A., W.J. Bolster, K.E. Alexander, W.B. Leaven-worth, A.B. Cooper & M.G. McKenzie, 2005. ‘The history of ocean resources: modelling cod biomass using historical records’, Frontiers in Ecology and the Environment 3, 2, p. 78-84.
Rozwadowski, Helen, 2002. The Sea Knows No Boundaries: A Cen-tury of Marine Science under ICES, ICES, København.
Sandahl, Jens, 2003. ‘The Bohuslän Herring Fishery, c. 1752-1808’, Starkey, David J., P. Holm. J.T. Thór & B. Andersson, Politicas and People in the North Atlantic Fisheries since 1485, Studia Atlantica 5, Hull, p. 189-202
Sanne, Gunnar, 1942. Göteborgs och Bohus läns hushållningssäll-skap 1814-1939: kort historik, Uddevalla.
Schwach, Vera, 2000. Havet, fisken og vitenskapen, Fra fiskeriun-dersøkelser til havforskningsinstitutt 1860-2000, Oslo.

304
Schön, Lennart, 2000. En modern svensk ekonomisk historia: tillväxt och omvandling under två sekel, SNS, Stockholm
Sjöström, Olle, 2002. Svensk statistikhistoria: en undanskymd kritisk tradition, Gidlunds, Hedemora.
Smidth, A.J., 1987, At vove for at vinde: Dansk fiskeri sildret af A.J. Smidth, 1859-63, Grenå. Republication of:
• Smidth, A.J., 1859. Indberetning om Fiskeriernes Tilstand ved Jyllands Østkyst, København.
• Smidth, A.J., 1860. Beretning om Fiskeriernes Tilstand ved Øerne i Kattegat, ved det nordlige Fyen, i det nordlige Lille-belt, i Koldingfjords og ved Vestkysten af Jylland fra Høyer til Vixøbugten, København.
• Smidth, A.J., 1864. Indberetning om Fiskeriernes Tilstand i Kongerigets Farvande for Aarene 1863-63, København.
Smith, Tim D., 1994. Scaling Fisheries: the Science of Measuring the Effects of Fishing 1855-1955, Cambridge University Press, Cam-bridge, UK. Smitt, F.A., B. Fries, C.U. Ekström & C. Sundevall, 1892. Skandina-viens Fiskar, Norstedt, Stockholm, 2nd edition.
Solhaug, Trygve, 1976. De norske fiskeriers historie, 1815-1880, Universitetsforlaget, Bergen.
Steneck, Robert & J. Carlton, 2001. ‘Human Alterations of Marine Communities: Students Beware!’, Bertness, Mark et al. (ed.) Marine Community Ecology, p. 445-68, Sunderland, Massachusetts.
Svedäng, Henrik, M. Svedäng, K. Frohlund & V. Øresland, 2001a. Analys av torskbeståndens utveckling i Skagerrak och Kattegatt. Del-rapporter af Havsfiskelaboratiets Torskprojekt steg I, Finfot 2001:1, Fiskeriverket, Havsfiskelaboratoriet, Lysekil.
Svedäng, Henrik, H. Hallbäck & P. Jakobsson, 2001b. Undersöknin-gar av kustnära fiskbestånd i mellersta Bohuslän: förekomst och stor-

305
leksfördelning, Fiskeriverkets Havsfiskelaboratoriums Torskprojekt steg II, Finfo 2001:5, Fiskeriverket, Havsfiskelaboratoriet, Lysekil.
Svedäng, Henrik, V. Öresland, M. Cardinale, H. Hallbäck & P. Ja-kobsson, 2002. De kustnära fiskbeståndens udveckling och nuvarande status vid svenska västkusten. Synopsis af ”Torskprojektet steg I-III”, Finfo 2002:6, Fiskeriverket, Havsfiskelaboratoriet, Lysekil.
Svensk Fiskeritidsskrift, 1892-1914. Lundberg, Rudolf (ed.), Sveriges allmänna fiskevårdsförbund, Stockholm.
Svenskt Biografiskt Lexikon, 1984. Statens Arkivsstyrelse, Stock-holm, vol 24, p. 722-4.
Sveriges Officiella Statistik: Fiske år 1914-1939. 1916-41, Kungl. Statistiska Centralbyrån, Stockholm.
Statistisk Tidsskrift 10, 1953, Liber, Stockholm.
Tabeller vedkommende Norges Fiskerier i Aaret …, 1882-1914, Det statistiske Centralbureau, Kristiania.
Tedebrand, Lars-Göran, 1993. Gullholmen: Ett bohuslänskt fiskeläges demografi, Umeå University, Umeå, 1993.
Tengby, Nils, 1991. Käringön: Ett litet fiskeläges historia, Bohusläns museum, Uddevalla.
Thornblad, Lars, 1971. Mollösund: Ur ett gammalt fiskeläges his-toria, Konstindustriskolan, Göteborg.
Tidsskrift for Fiskeri 1866-1873. Fiedler, H.V. & A. Feddersen (ed.), København.
Vollan, Odd, 1942. Omlegginga av fisket i Ålesund og på Sunnmøre, Ålesunds Museum skrift 5.

306
Von Yhlen, Gerhard, 1880. Die Seefischerei an der Westküste Schwedens, Internationale Fischereiausstellung zu Berlin, Stockholm. Winiwarter, Verena; et al., 2004. "Environmental History in Europe from 1994 to 2004: Enthusiasm and Consolidation," Environment and History 4, p. 501-30.
Worster, Donald, 1978. Dust Bowl: the Southern Plains in the 1930s, XXX, New York.
Øiestad, Victor, 1994. ’Historic changes in cod stocks and cod fisher-ies: Northeast Arctic cod’, Jakobsson, Jakob, Astthorsson, R.J.H. Beverton, B. Björnsson, N. Daan, K.T. Frank, J. Meincke, B. Roths-child, S. Sundby & S. Tilseth (ed.) ICES Marine Science Symposia 198, p. 17-30, ICES, København.
Web publications
Holm, P., D. Starkey & T.D. Smith, 2000. HMAP Prospectus, History of the Marine Animal Populations. http://www.cmrh.dk/hmappros.html
Holm, Poul & T. Smith, 2000. HMAP Report of the Planning work-shop, http://www.cmrh.dk/hmaprepo.htm
Holm, Poul, A. Rosenberg, D.J. Starkey, R.C. Francis & T.D. Smith, 2000. History of Marine Animal Populations, Phase II: Working De-scription, http://www.cmrh.dk/hmapii.pdf
Sandahl, Andreas, 2003. A historic perspective on Swedish fisheries – Was everthing better before?, Stockholm. http://www.ecology.su.se/news/images/exjobb_2003_10.pdf
Sandahl, Jens, 1998. Sillfiske och sillmarkand: 1700-tallets bohuslän-ska sillfiskeperiod i ett internationellt perspektiv, Göteborg. http://hemsidor.torget.se/users/s/sandahl/sillfiskeomarknad.pdf

307
Fishbase. www.fishbase.org