An Empirical Analysis of Risk, Incentives and the Delegation of Worker Authority
45
DEPARTMENT OF ECONOMICS Working Paper An Empirical Analysis of Risk, Incentives and The Delegation of Worker Authority By Jed Devaro Fidan Ana Kurtulus Working Paper 2011‐13 UNIVERSITY OF MASSACHUSETTS AMHERST
-
Upload
csueastbay -
Category
Documents
-
view
0 -
download
0
Transcript of An Empirical Analysis of Risk, Incentives and the Delegation of Worker Authority
DEPARTMENT OF ECONOMICS
Working Paper
An Empirical Analysis of Risk, Incentives and The Delegation of Worker Authority
By
Jed Devaro Fidan Ana Kurtulus
Working Paper 2011‐13
UNIVERSITY OF MASSACHUSETTS AMHERST
AN EMPIRICAL ANALYSIS OF RISK, INCENTIVES, AND THE DELEGATION OF WORKER AUTHORITY
BY
JED DEVARO
AND
FIDAN ANA KURTULUS
DeVaro is the Wang Family Professor in the Department of Management and the Department of Economics, College of Business and Economics, California State University, East Bay; Hayward, CA; 94542; USA. E-mail: [email protected]; Phone: (510)885-3289. Kurtulus is Assistant Professor in the Department of Economics at the University of Massachusetts, Amherst; 912 Thompson Hall; Amherst, MA; 01003; USA. E-mail: [email protected]. Phone: (413)545-2512. The authors acknowledge the Department of Trade and Industry, the Economic and Social Research Council, the Advisory, Conciliation and Arbitration Service and the Policy Studies Institute as the originators of the 1998 Workplace Employee Relations Survey data, and the Data Archive at the University of Essex as the distributor of the data. None of these organizations bears any responsibility for the authors’ analysis and interpretations of the data. We are grateful for helpful comments from numerous colleagues and seminar participants at Cornell University, the University of Illinois at Urbana-Champaign, the University of Massachusetts at Amherst, the University of Victoria, and the 2006 meeting of the Society of Labor Economists. All programs are available upon request, and the data used in this study are publicly available via the U.K. data Archive.
JEL Classification: D21, D23, D81, M51, M52, M54
Keywords: Agency Theory, Risk versus Incentives Tradeoff, Delegation of Worker Authority, Performance Pay

1
The notion of a tradeoff between risk and incentives is a key implication of the
principal-agent model that has received significant attention in the literature since the
original papers by Holmstrom (1979) and Shavell (1979). The intuition is that risk-
averse workers are reluctant to accept output-contingent compensation contracts in
production settings characterized by a high degree of risk, meaning situations in which
output is determined largely by stochastic factors beyond the worker’s control. The
firm’s response, therefore, is to decrease the amount of output-based pay as the degree of
risk or uncertainty in the production environment increases. This theoretical prediction
has been the subject of a vast number of empirical tests, and the collective evidence has
been inconclusive. Some tests have found the predicted negative relationship, while
others have found a positive relationship or no relationship.
Prendergast (2002) proposes a theory that potentially explains the inconclusive
empirical evidence. At the heart of Prendergast’s explanation is the delegation of worker
authority which, he argues, is a key element that the standard agency model ignores. In
production settings characterized by a low level of uncertainty, the firm has a clear sense
of what tasks should be performed and how they should be performed. In such settings,
the firm is content to monitor labor inputs. In contrast, when the production setting is
characterized by a high level of uncertainty, the firm understands less what decisions
need to be made and which tasks should be performed. The firm responds by delegating
more authority to the worker, who is closer to the production process and often has better
information than does the firm about what tasks should be performed.1 The firm
1 The argument that the agent should receive more authority the greater is his informational advantage was formalized by Aoki (1986). See also Dessein (2002) for a discussion of recent trends in firms pushing decision rights lower in their organizational hierarchies in order to profit from the local knowledge possessed by lower level managers.

2
accompanies this delegation of authority with output-based pay, to hold the worker
accountable for his decisions and to ensure that the worker does not misuse his discretion
by choosing the wrong tasks.2 That is, when the degree of uncertainty increases, the firm
shifts from monitoring inputs and retaining control over tasks to monitoring outputs and
delegating authority over tasks.
This suggests a positive relationship between incentive pay and risk (operating
through the channel of worker authority), in contrast to the negative relationship
(operating through the channel of insurance) implied by standard agency theory. Thus,
the main testable result of Prendergast’s model is that the predicted sign of the
relationship between risk and incentives is ambiguous. He states the empirical problem
as follows:
“The empirical difficulty here is that worker discretion is typically unobserved that could bias econometric estimates … without controlling for some measure of responsibility, we are likely to find a positive relationship between uncertainty and incentives; but if we can control for task assignment, we would expect to see no such relationship.” (pp. 1096-1097) Thus, Prendergast argues that controlling for worker authority in a regression of incentive
pay on risk should decrease the coefficient on risk.
Prendergast cites several empirical papers that provide indirect support for his
theory, but a direct test requires that worker authority be incorporated into the standard
risk-incentives regressions. A practical difficulty with implementing this test is that
measures of worker authority over task selection are rarely available in existing data sets.
2 The argument that authority and incentives go hand in hand was formalized in the literature prior to Prendergast (2002). Jensen and Meckling (1992) analyzed how the decentralization of decision rights to agents with specific knowledge and abilities increases efficiency and argued that these decision rights should be accompanied by a control mechanism such as pay-for-performance in order to motivate individuals to use their decision rights optimally. Holmstrom and Milgrom (1994) derived a formal model in which the effectiveness of incentives is enhanced when simultaneously implemented with delegation of responsibility to agents.

3
Furthermore, measures of worker authority must be available in conjunction with
measures of incentive pay and risk for the theory to be tested. Our empirical tests are
based on a large, nationally-representative cross section of British establishments from
the 1998 Workplace Employee Relations Survey (WERS98), containing information on
risk, multiple dimensions of worker authority (both as perceived by workers and as
perceived by employers), and incentive pay.
A potential concern is that a control for worker authority appearing on the right-
hand side of a risk-incentives model might be endogenous; since it is chosen by the
employer along with the structure of the compensation plan, the unobserved determinants
of both choices are likely to be correlated, biasing the coefficients. To address this
concern we estimate a bivariate probit model, treating both incentive pay and worker
authority as endogenous variables. The parameters in the bivariate probit model with a
dummy endogenous variable on the right-hand side are identified (except in pathological
cases, such as one demonstrated in Maddala 1983, that do not apply here) even in the
absence of exclusion restrictions (Heckman 1978, Wilde 2000, Monfardini and Radice
2008). An exogeneity test in this model reveals that the null hypothesis that worker
authority is exogenous cannot be rejected.
We address four empirical questions in this paper. Is there empirical support for:
1) the risk-incentives tradeoff predicted by agency theory?
2) a positive relationship between authority and incentives?
3) a positive relationship between risk and authority?
4) the main testable implication of Prendergast’s model, namely that the risk
coefficient in an incentives regression should become smaller (i.e. less positive or

4
more negative) when delegation of worker authority is incorporated into the risk-
incentives regression model?
Our empirical results support affirmative answers to all four questions, though in some
cases the relevant parameters are estimated with low precision. Thus, our analysis
contributes to the literature by providing empirical evidence clarifying the relationship
between risk and incentive pay and how managers optimally bundle incentive pay and the
delegation of worker decision rights to cope with risk. In particular, we attempt to
reconcile the mixed nature of the empirical literature concerning evidence for a risk-
incentives tradeoff by empirically addressing Prendergast’s extension of the standard
principal-agent model.
II. RELATED LITERATURE
A large number of empirical studies have aimed to test for the negative
relationship between risk and incentives predicted by standard agency theory using data
from a variety of industries and worker types. Some tests have found the predicted
negative relationship (Lambert and Larcker 1987, Kawasaki and McMillan 1987,
Aggarwal and Samwick 1999 and 2002, Mengistae and Xu 2004, Adams 2005, Gibbs,
Merchant, Van der Stede and Vargus 2006, and Wulf 2007), while others have found a
positive relationship (Rao 1971, Norton 1988, Leffler and Rucker 1991, Allen and Lueck
1992, Lafontaine 1992, Martin 1988, Core and Guay 1999 and 2002, Conyon and
Murphy 2000, Ackerberg and Botticini 2002, Oyer and Schaefer 2005, Foss and Laursen
2005, Shi 2005) or no statistically significant relationship at all (Anderson and
Schmittlein 1984, John and Weitz 1989, Yermack 1995, Bushman, Indjejikian and Smith
5
1996, Ittner, Larcker and Rajan 1997, Garen 1994, Nagar 2002).3 The majority of these
studies did not include a control for authority in the regressions of incentives on risk.
Turning to our second empirical question, previous empirical evidence tends to
support the notion that incentive pay accompanies the delegation of authority (MacLeod
and Parent 1999, Nagar 2002, Colombo and Delmastro 2004, Foss and Laursen 2005,
Wulf 2007). Regarding our third empirical question, direct empirical evidence regarding
a positive correlation between delegation and risk is rare since data spanning multiple
firms and industries typically do not contain information on the extent of authority
delegated to workers. Nonetheless, some empirical support can be found from
franchises, sharecropped farms, retail banking, and Danish firms (Lafontaine 1992, Rao
1971, Nagar 2002, Foss and Laursen 2005).
While the evidence on these first three questions from the broad nationally-
representative sample of British establishments we study in this paper complements the
evidence from previous analyses, in our view the main contribution of our study is the
evidence we present on the fourth empirical question. Our data are particularly well
suited for testing Prendergast’s model, given the availability of an authority measure that
closely matches the notion of authority discussed by Prendergast. Several previous
studies have incorporated authority into a risk-incentives regression model, and these are
most closely related to our paper as we now discuss.
Foss and Laursen (2005) studied 993 Danish firms sampled in 1996. While their
measures of incentive pay and authority are roughly similar to ours, their main risk
measure, which they refer to as “within-industry variance in profitability”, differs
3 A table that summarizes the variables, data and econometric models used in these papers is available from the authors upon request.

6
substantially. To construct this variable, they assigned each firm in their sample to one of
70 industry categories. Within each of these 70 groups, they computed the variance of
firm profits. Each firm’s value for the risk measure is the variance that was computed for
all firms belonging to the same industry category, so that the risk variable in their
analysis assumes only 70 possible values. They then estimated an ordered probit model
using incentive pay as the dependent variable and the 70-valued risk measure as an
independent variable, along with a set of controls.
Estimating the Foss and Laursen model using their risk measure is
computationally identical to estimating a more general model that includes 70 industry
dummies (in lieu of their risk measure) but that also imposes 70 parametric restrictions,
so that the ratio of every pair of coefficients on the industry dummies is constrained to
equal a constant that the researcher specifies. The 70 restrictions implicitly imposed in
the Foss and Laursen model are testable but are not tested in their paper. Implicit in these
70 restrictions is the strong assumption that the coefficients of each industry dummy
reflect the effect of risk and nothing else. Since that assumption is unlikely to be correct,
there is reason to suspect that the test might fail. Our risk measure, which we describe
shortly, does not impose such restrictions on industry dummies.
Adams (2005) analyzed the manufacturing establishments from the 1998 WERS
(a subsample of 166 establishments of the 1590 we consider). Adams treated the unit of
observation as the worker rather than the establishment, but incentive pay is not observed
in the 1998 WERS at the level of individual workers, so he attempted to infer the
measure using establishment-level questions about what fraction of the workers in the
given worker’s occupation receives either profit-related pay or ESOPs (if more than 80%
7
of the workers receive such payments, the given worker is assumed to receive it, if less
than 20% of the workers receive such payments, the given worker is assumed not to
receive it, and if between 20% and 80% of the workers receive such payments, the given
worker is dropped from the sample). We prefer to conduct the analysis at the
establishment level because the risk measure available in the WERS only varies across
establishments and not across workers within an establishment. So for the purpose of
measuring the risk-incentives tradeoff, no additional information comes from
disaggregating to the worker level, since this parameter is identified only by variation
across establishments.
Wulf (2007) used a panel of 250 publicly-traded U.S. firms to show that in the
presence of a control for whether division managers have officer status (such as
president, CFO, VP) the tradeoff between division-level risk and managerial incentives is
stronger than when the control is omitted. This result is consistent with the notion of
authority as a mitigating factor in the risk-incentives relationship. However, one aspect
of the analysis that complicates an interpretation of this as a direct test of Prendergast’s
main implication is that the set of covariates in the regressions which omit authority are
different from those that include authority.
Nagar (2002) used a cross section of 100 retail banks in the U.S. in 1994 to show
that, holding constant the authority delegated from top bank management to branch
managers (in terms of hiring, promotions, hours and investment decisions), there is a
negative but statistically insignificant relationship between uncertainty (as proxied by
volatility in earnings and bank growth) and incentive pay (as reflected by the proportion
of bank managers’ pay comprised of bonuses). Since that study did not estimate models
8
that omit authority, we are unable to make a comparison of the relationship between risk
and incentives when authority is controlled as opposed to when it is not, so the study does
not provide a test of our fourth empirical question.
Shi (2005) used data on 2900 CEO’s from the Compustat Execucomp database in
1992-2001, providing evidence consistent with Prendergast’s main testable prediction if
we interpret Shi’s notion of CEO ability to respond to risk broadly as Prendergast’s
notion of decision-making authority. Specifically, Shi found that CEO incentives, as
measured by the share of firm profits held by the CEO, increase with industry-wide risk
measured as variance of industry stock return, which Shi argued is risk to which the CEO
can respond by collecting industry information and making decisions based on it, and this
positive relation diminishes as the definition of industry is broadened, so that the CEO is
less able to act on collected information. An advantage of our analysis is that while Shi
focuses only on CEOs, our study is based on a broad sample of employee-types, both
managerial and non-managerial.
Finally, Ben-Ner, Kong, and Lluis (2007) analyzed 640 observations from the
Minnesota Human Resources Management Practices, a survey in 1994-1995 of private,
for-profit, Minnesota-based firms. Their binary incentives measure indicates the
“existence of an individual incentives plan”, and they used an authority measure similar
to ours. Their analysis considered two measures of risk or uncertainty, namely “external
uncertainty” and “internal uncertainty”. The external uncertainty measure is similar to
that constructed by Foss and Laursen (2005), as described earlier. The internal
uncertainty measure is the sum of 3 components that the authors argue should be related
to internal uncertainty (i.e. complexity, variability, and routine, each of which is
9
measured on a Likert scale). Some of the evidence in Ben-Ner, Kong, and Lluis is
consistent with ours (e.g. positive relationships between incentives and delegation and
between delegation and risk). However, as was the case with Wulf (2007), one aspect of
their analysis that complicates an interpretation of the results as a direct test of
Prendergast’s main implication is that the specifications in the regressions that omit
authority are different from those that include authority.
While Prendergast’s model is one of the earliest and probably the best known in
the theoretical literature aiming to reconcile agency theory with the mixed empirical
support for a risk-incentives tradeoff, alternative theoretical approaches for explaining the
empirical puzzle have been proposed (e.g., Zabojnik 1996, Core and Qian 2002, Baker
and Jorgensen 2003, Raith 2003, Oyer 2004, Adams 2005, Raith 2005, Serfes 2005, Shi
2005). Many of these alternative theories do not concern issues of delegation of
authority, and some of them are based on ideas that our data are ill-equipped to address
(e.g. distinguishing between two alternative types of risk, as in Zabojnik 1996 and Baker
and Jorgensen 2003), so we do not address them in this paper. However, the empirical
support for Prendergast’s model that we find in this paper does not cast doubt on the
validity of these alternative theories.
III. THEORETICAL ANALYSIS AND HYPOTHESES
In Prendergast’s model, the risk-neutral agent exerts effort on one of n tasks. The
principal chooses either an input-based or an output-based compensation contract, and
either assigns the agent a task or delegates authority to the agent to choose a task. Thus,
in a literal interpretation of the model the worker who has been delegated authority
10
chooses what task to perform. In real-world organizations, it is often the upper-level
managers who have the authority to choose the tasks, while front line workers are granted
authority not over what tasks to perform but rather over how and when to perform them;
i.e. the actual tasks – what is supposed to be done – are determined higher up in the
organization. We argue that a broader interpretation of the term “task delegation”
(extending to how and when) in Prendergast’s model is appropriate, and in that case his
model is also applicable to non-managerial workers. For example, a worker doing a job
consisting of multiple tasks can choose the emphasis to place on each, so Prendergast’s
assumption that a worker chooses one out of n tasks could be interpreted to mean the
emphasis the worker places on a particular task or the frequency with which it is
performed.
As in earlier work (e.g. Holmstrom 1979, Holmstrom and Milgrom 1991)
Prendergast interprets risk as uncertainty in the economic environment. The firm’s
output is yi = ei + εi, where i denotes the agent’s task, and ei is the agent’s effort. The n
random variables, εi, have common variance, σ2, but differ in their means, with an
increase in σ2 implying a more uncertain production environment.
The agent knows the true value of εi whereas the principal only knows its
distribution, and this asymmetry justifies the delegation of authority, given that the
worker frequently has more accurate information than does the manager about the
idiosyncrasies of the production process by virtue of being closer to it. For example, a
sales clerk would be better informed concerning customers’ impressions about a new
product (i.e., demand variability) than would be the store manager. Likewise, a line
worker is more likely to know whether the particular machine he operates is about to

11
break down and lead to a production bottleneck (i.e., supply variability) than the plant
manager.
When σ2 is sufficiently low the principal assigns the agent a task and compensates
using an input-based contract, whereas when σ2 is sufficiently high the principal allows
the agent to choose the task but compensates using an output-based contract. If agents
are risk-averse, the standard risk-incentives tradeoff is also present, and the net effect of
risk on incentives is ambiguous in sign. From this discussion, four points emerge that
can be addressed empirically:
1. In the absence of a control for delegation of worker authority, the sign of the risk-
incentive relationship is theoretically ambiguous.
2. Incentive pay and delegation of worker authority should be positively correlated.
3. Authority and risk should be positively correlated.
4. When a control for worker authority is included in a regression of incentive pay on
risk, the risk coefficient should decrease (i.e. become less positive or more negative).
IV. METHODS
Data
Our sample is drawn from both the management and worker questionnaires in the
1998 British Workplace Employee Relations Survey (WERS98), jointly sponsored by the
Department of Trade and Industry, ACAS, the Economic and Social Research Council,
and the Policy Studies Institute. Distributed via the UK Data Archive, the WERS data
are a nationally representative stratified random sample covering British workplaces with
at least ten employees, except for those in the following 1992 Standard Industrial
12
Classification (SIC) divisions: agriculture, hunting, and forestry; fishing; mining and
quarrying; private households with employed persons; and extra-territorial organizations.
Some of the 3192 workplaces targeted were found to be out of scope, and the final
sample size of 2191 implies a net response rate of 80.4% (Cully et al., 1999) after
excluding the out-of-scope cases.4 Data were collected between October 1997 and June
1998 via face-to-face interviews. The respondent in the management questionnaire was
usually the most senior manager at the workplace with responsibility for employment
relations. In addition, a random sample of up to 25 employees per establishment was
surveyed, producing the responses for the employee questionnaire.
The “risk” question was only asked of establishments in the private sector,
producing 1591 responses. Of these, 1590 establishments responded to the questions
about performance-related pay. Descriptive statistics for all variables in our analysis are
displayed in Table 1 for the analysis sample of 1590 establishments. In Table 1 and in all
of our analysis we use establishment weights; in most cases worker weights yield the
same qualitative results. Some of the variables in our analysis contain missing values,
and we estimate all of our models using list-wise deletion. The main source of missing
information is the measure of worker authority, since only 1277 of the 1590
establishments reported any worker responses to the authority question. A table of means
on this smaller subsample of N = 1277 closely matches Table 1.
4 The “scope” is workplaces with 10 or more employees located in Great Britain (England, Scotland and Wales) and engaged in activities within Sections D (Manufacturing) to O (Other Community, Social and Personal Services) of the 1992 Standard Industrial Classification. The survey covers both private and public sectors. If a case is sampled that does not meet these parameters, it is called “out of scope.”

13
Measures
Incentive Pay
In the principal-agent model, the firm consists of a single worker whose
individual output (or net revenue) coincides with that of the firm. Taken literally, the
model abstracts from some relevant details of the workplace, such as the fact that most
firms are comprised of more than one worker, and a broader interpretation is therefore
required if the theory is to be helpful in understanding behavior in a large sample of
employers. In practice, employers rarely design incentive compensation systems tailored
to the characteristics of individual workers. In the typical workplace, the employer
designs the incentive pay system to apply to broad groups of workers (such as all workers
within an establishment or perhaps all workers in a particular occupation within the
establishment) rather than an individual worker. Thus, from the standpoint of empirical
work that aims to test the theory, a measure of pay-for-performance at the level of the
establishment (as opposed to the level of the individual worker) is acceptable. We use
the following measure from the management survey:
Performance Pay = 1 if any employees at the workplace receive payments or dividends from individual or group performance-related schemes = 0 otherwise5
In the principal-agent model the relevant notion of incentive pay is a linear piece
rate, or the slope of the relationship between the agent’s compensation and output,
whereas our binary measure of performance pay describes whether performance-related
pay is used at all, providing no information on its intensity. From the standpoint of
5 The wording of the question permits group-based as well as individual-based schemes, whereas the relevant theories pertain to individual-based schemes. This does not present a problem for our analysis. The majority of establishments reporting pay-for-performance use individual-based schemes in our data, and restricting the incentive pay measure to equal one only when it is certain that individual-based performance pay is used yields results very similar to those we report here.

14
testing Prendergast’s specific model, however, our binary measure actually matches the
theory better than would a continuous measure of incentive pay within the establishment.
The reason is that the prediction of Prendergast’s model (taken literally) is that the
principal chooses either output-based pay or input-based pay and never a mix of the two,
though the basic logic of Prendergast’s argument should extend to the proportion of
compensation that is output-based. Furthermore, since we have a large sample of
establishments, with plenty of variation in the use of incentive pay, our binary measure
provides valuable information, though more detailed data on a continuous measure of
incentive pay within each establishment would be even more informative.
Risk or Uncertainty
In the principal-agent model, the agent’s output or net revenue (which equals the
output or net revenue of the entire single-worker firm) is determined both by the agent’s
effort level and by a stochastic component. The variance of the stochastic component of
output is referred to as risk or uncertainty. Consider the piece-rate system used to
compensate the installers of automobile windshields at Safelite Glass Corporation.
Safelite designs a “one size fits all” piece-rate scheme that is applied uniformly to all
workers in the job, in consideration of broad, market-level risks that are expected to
influence the outputs of large groups of workers. Our measure from the management
survey is as follows:
Risk = 1 if the current state of the market for the main product or service of the establishment is described as “turbulent”
= 0 otherwise

15
While the potential for such market-level turbulence to affect managerial output
is clear, it is perhaps less obvious how the behavior of non-managerial workers might be
affected. At Safelite Glass Corporation, market turbulence can be expected to affect the
productivity (output) of non-managerial workers even if they have some authority over
the work process, as overall demand uncertainty for windshields trickles down to the
typical windshield installer. This captures Prendergast's notion of uncertainty in the
production environment, but since it is a broad measure it is also likely to capture
measurement noise.
Worker Authority
Prendergast (2002) draws a key “distinction between instances in which an
employer tells his agent what to work on and situations in which the agent is given
discretion over the activities that he spends time on. [emphasis added]” (p. 1072)
Prendergast’s notion of authority therefore corresponds to delegating workers the power
to make their own decisions about which tasks to perform.6 The WERS employee survey
contains a question that closely corresponds to this notion. At each establishment, up to
25 employees are randomly sampled and asked the following question:
“In general, how much influence do you have about the range of tasks you do in your
job?” Responses are recorded on a four-point scale (1 = “none”, 2 = “a little”, 3 =
“some”, 4 = “a lot”). We code all responses of “don’t know” as missing. Since our
measures of incentive pay, risk, and firm characteristics are measured at the
establishment level, for the authority measure we aggregate the worker authority
6 Other studies that formalize the notion of the delegation of authority in the agency framework include Aghion and Tirole (1997) and Al-Najjar (2001).
16
responses to the establishment level by taking the modal worker response.7 The idea is
that the most frequently occurring worker response to the authority questions within an
establishment reflects the degree of authority experienced by the typical worker in that
establishment. In the main analysis we use the following four-valued authority measure
and the four binary indicators implied by it:
Authority = 1 if establishment’s modal worker response is “none” = 2 if establishment’s modal worker response is “a little” = 3 if establishment’s modal worker response is “some” = 4 if establishment’s modal worker response is “a lot” Authority1 = 1 if establishment’s modal worker response is “none” = 0 otherwise Authority2 = 1 if establishment’s modal worker response is “a little” = 0 otherwise Authority3 = 1 if establishment’s modal worker response is “some” = 0 otherwise Authority4 = 1 if establishment’s modal worker response is “a lot” = 0 otherwise We also consider some alternative measures of authority in our sensitivity analysis.
In addition to our key variables (i.e. risk, incentives, and authority), we include a
large set of controls for firm characteristics in our models, including establishment size,
main activity of the establishment, industry, whether the establishment is a single
independent establishment or one of multiple establishments, ownership (private versus
public, franchise versus non-franchise, publicly traded versus non-publicly traded),
whether the establishment produces a single product or multiple products, fraction of
part-time workers, presence of temporary workers, presence of fixed-term workers under
one year, presence of fixed-term workers over one year, number of recognized unions,
fraction of establishment that is unionized, and whether the establishment has been in
7 We also aggregated using the median rather than the mode throughout the paper, finding very similar results to those we report here. These are available upon request. The median results are virtually insensitive to how the median is defined when the number of workers sampled at the establishment is even (i.e. whether observation n/2 or observation n/2 + 1 is defined as the median).

17
operation for more than five years. These controls are defined in the appendix. Most are
included simply to absorb employer attributes that may be correlated with the main
variables of interest, though a few are included because of a clear theoretical rationale, in
particular unionization and establishment size. Given that unions exert considerable
influence over both the level of compensation and its composition, the number of
recognized unions at the establishment and also the fraction of the workforce that is
unionized can be expected to influence the probability that an establishment will use
incentive pay. Regarding establishment size, monitoring difficulty increases as the
number of employees gets larger, making the establishment more likely to grant
employees pay for performance as a substitute for costly monitoring. Coordinating and
directing workers also becomes more costly as the number of employees increases, so
larger organizations are more likely to resort to decentralization of decision-making and
delegation.
Empirical Analysis
To investigate whether a tradeoff between risk and incentives, as predicted by
standard agency theory, can be identified in the WERS data, we estimate the following
probit model:
Prob(Performance Payi = 1) = Φ(αRiski + Xiβ)
where Xi is a vector of controls for firm characteristics, and i indexes establishments.
Agency theory predicts α < 0. Our results in Table 2 support this prediction, though they
are estimated with modest precision. In the first specification the effect is statistically
insignificant. As revealed in the second and third specifications, however, once industry
18
controls are included in the model the effect is statistically significant at the ten percent
significance level on a one-tailed test. 8 Based on the third specification that includes the
full set of controls, the change in the predicted probability that incentive pay is offered
when Risk increases from 0 to 1 (evaluating other covariates at their means) is -0.051.
This magnitude is substantial, given that the mean of Performance Pay is 0.196. On
average, an increase in Risk from 0 to 1 is associated with a decrease of 26 percent in the
predicted probability that performance-related pay is used.
We next investigate whether empirical support can be found for a positive
relationship between authority and incentives. The rationale for a positive correlation is
that in risky settings the principal wants to switch from monitoring labor inputs to
monitoring outputs. In such settings, the firm delegates decision-making authority to the
worker but accompanies this authority with output-based pay. To test this empirically,
we estimate the following probit model:
Prob(Performance Payi = 1) = Φ(β2Authority2i + β3Authority3i + β4Authority4i + Xiβ).
Empirical support for a positive correlation between authority and incentives would be
implied by positive and statistically significant estimates of β2, β3, and β4; furthermore,
there should be a monotonic pattern in the marginal effects, so that (relative to
Authority1) the effect of Authority3 is higher than the effect of Authority2, and the effect
of Authority4 is highest of all. As seen in Table 3, in the first specification the relevant
effects are statistically insignificant. However, once industry controls are included in the
model, the estimated effect of Authority4 is positive and significant at the five percent
8 Since the negative relationship between risk and incentives predicted by the principal-agent model is a directional hypothesis, we use one-tailed hypothesis tests as the criterion for statistical significance. We adhere to this convention throughout the paper whenever a directional hypothesis is implied by the theory.

19
level on a one-tailed test, though the estimated effects of Authority2 and Authority3
remain statistically insignificant. Finally, our results support a monotonic pattern in the
marginal effects, though only the effect of Authority4 is statistically significant.
We next investigate whether empirical support can be found for a positive
relationship between risk and delegation of authority. A component of Prendergast’s
model is that delegation of authority is more likely in risky settings, so that authority and
risk are positively related. To test this empirically, we estimate an ordered probit model
in which the four-valued dependent variable is Authority, and Risk is the key independent
variable. The results, displayed in Table 4, clearly support a positive relationship
between authority and risk. In the most controlled specification, on average, the increase
in the probability of the highest degree of authority being delegated that is associated
with Risk is 11.9 percentage points, amounting to a 37.5% increase in the probability that
the highest level of authority is delegated.
Finally, we address the central empirical question of this paper, namely whether
there is empirical support for the main testable implication of Prendergast’s model.
Prendergast argues that if controls for worker authority are added to risk-incentives
regressions, the coefficient on risk should decrease. That is, if the coefficient were
positive without controls for authority, it should be less positive once authority is added
as a control, and if the coefficient were negative in the absence of the authority control, it
should be greater in magnitude once authority is added. As a starting point we augment
the model in Table 2 with controls for worker authority as follows:
Prob(Performance Payi = 1) = Φ(αRiski + β2Authority2i + β3Authority3i + β4Authority4i + Xiβ)
Prendergast’s argument suggests that the relatively weak statistical evidence of a risk-
incentives tradeoff that we found at the start of the section should strengthen when

20
authority controls are added to the model. Table 5 displays the marginal effects. The
first six columns of the table should be read in pairs (i.e. columns 1 and 2 correspond to
one specification, which is presented both with and without authority controls, columns 3
and 4 correspond to another specification that includes industry controls, and columns 5
and 6 correspond to a third specification that includes both industry and firm controls).
When industry controls are included in the model, a statistically significant effect of Risk
emerges. In the third and most controlled specification, when authority is omitted from
the model, Risk is associated with a 5.7 percentage point decrease in the probability of
incentive pay being used, whereas when authority is included as a control, this magnitude
increases to 6.8 percentage points, strengthening the evidence of a risk-incentives
tradeoff as Prendergast’s model predicts. A statistical test of the null hypothesis that the
Risk coefficient is equal between the model that includes authority controls and the model
that excludes authority controls (versus the alternative hypothesis that the Risk coefficient
is lower in the model that includes authority controls than in the model that excludes
authority controls) in the most controlled specification reveals that the null can be
rejected at the ten percent significance level, and nearly at the five percent significance
level (p-value = 0.052). Furthermore, the marginal effect of Authority4 in that
specification is positive and statistically significant, confirming the positive relationship
between authority and incentive pay that we documented earlier in this section.
The results thus far appear supportive of the main testable implication of
Prendergast’s model. However, as mentioned in the introduction, worker authority is
potentially endogenous in a risk-incentives regression. Our results in the sixth column of
Table 5 suggest that Authority4 is the authority variable that matters the most. We thus

21
aggregate authority to two categories (i.e. we use only the dummy variable Authority4)
and estimate a bivariate probit model of incentives and authority to account for this
endogeneity, allowing for correlation between the unobserved determinants of both
variables. The bivariate probit model includes a dummy endogenous regressor (i.e.
Authority4) in the incentives equation. Note that in this model, except in rare cases that
do not apply here, identification of the parameters is attained even in the absence of
exclusion restrictions (Heckman 1978, Wilde 2000, Monfardini and Radice 2008). The
recursive structure of the model is consistent with Prendergast’s theory, e.g. “So
uncertain environments result in the delegation of responsibilities, which in turn
generates incentive pay based on output” (Prendergast, p. 1072).
Results from the bivariate probit are presented in the last two columns of Table 5.
Marginal effects are displayed, along with the point estimates (in square brackets) and
their standard errors (in parentheses below the point estimates). The essential point to
note from the bivariate probit results is that an exogeneity test reveals that the null
hypothesis that worker authority is exogeneous cannot be rejected. That is, the null
hypothesis that ρ = 0 cannot be rejected, where ρ is the correlation in the disturbances in
the incentives and authority equations. This means that in the empirical tests it is
reasonable to use a comparison of columns 5 and 6 of Table 5 that treated authority as
exogenous in evaluating the main testable prediction of Prendergast’s model. Our
conclusion is that when authority controls are added to the risk-incentives model, the
evidence of a risk-incentives tradeoff strengthens, supporting Prendergast’s main testable
implication.
22
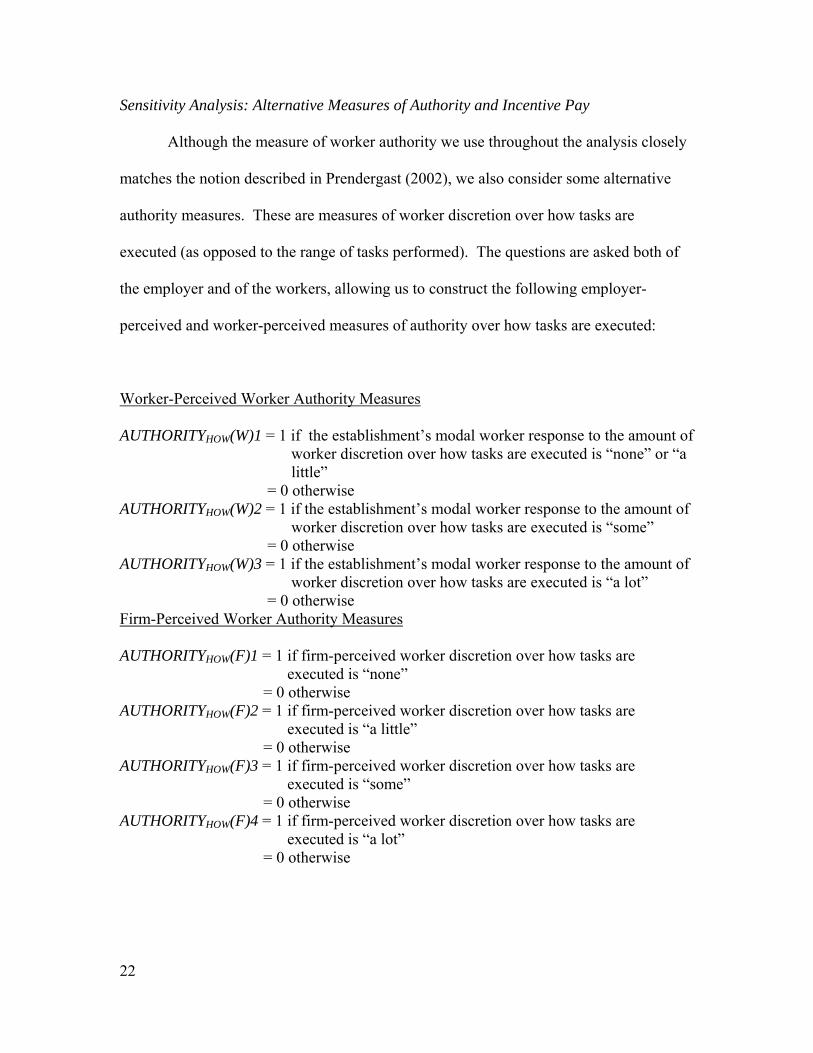
Sensitivity Analysis: Alternative Measures of Authority and Incentive Pay
Although the measure of worker authority we use throughout the analysis closely
matches the notion described in Prendergast (2002), we also consider some alternative
authority measures. These are measures of worker discretion over how tasks are
executed (as opposed to the range of tasks performed). The questions are asked both of
the employer and of the workers, allowing us to construct the following employer-
perceived and worker-perceived measures of authority over how tasks are executed:
Worker-Perceived Worker Authority Measures
AUTHORITYHOW(W)1 = 1 if the establishment’s modal worker response to the amount of worker discretion over how tasks are executed is “none” or “a little”
= 0 otherwise AUTHORITYHOW(W)2 = 1 if the establishment’s modal worker response to the amount of worker discretion over how tasks are executed is “some” = 0 otherwise AUTHORITYHOW(W)3 = 1 if the establishment’s modal worker response to the amount of
worker discretion over how tasks are executed is “a lot” = 0 otherwise Firm-Perceived Worker Authority Measures
AUTHORITYHOW(F)1 = 1 if firm-perceived worker discretion over how tasks are executed is “none”
= 0 otherwise AUTHORITYHOW(F)2 = 1 if firm-perceived worker discretion over how tasks are
executed is “a little” = 0 otherwise AUTHORITYHOW(F)3 = 1 if firm-perceived worker discretion over how tasks are executed is “some” = 0 otherwise AUTHORITYHOW(F)4 = 1 if firm-perceived worker discretion over how tasks are
executed is “a lot” = 0 otherwise

23
The variable names include “(W)” or “(F)” to indicate which worker authority measures
reflect worker perceptions and which reflect firm perceptions. The lowest two categories
of the worker-perceived measure are aggregated from four categories to three due to an
extremely small count in the lowest cell. One difference between the worker-perceived
measures and the firm-perceived measures is that the question in the employer survey
pertains to the discretion of workers in the establishment’s largest occupational group,
whereas the question from the worker survey is based on a random sample of workers in
the establishment. That is, in the employer survey the respondent employer is asked to
rate the level of worker authority in the establishment’s “largest occupational group”
rather than in the establishment as a whole.
We estimate models that include different combinations of authority controls
(authority over range of tasks performed, worker-perceived authority over how tasks are
executed, employer-perceived authority over how tasks are executed). Results are
displayed in Table 6. When reading Table 6, compare the marginal effect of Risk in the
first column to the marginal effect of Risk in each of the remaining columns, to see how
the risk-incentives relationship changes when different configurations of authority
controls are added to the model. The results reveal that the authority measure that
individually suggests the strongest empirical support for Prendergast’s theory is also the
measure that best matches the notion of authority discussed in his paper (namely
authority over the range of tasks performed), since the risk effect decreases by the most
when these particular authority measures are included as controls.
Statistical tests of the null hypothesis that the Risk coefficient is equal between the
model that includes authority controls (i.e. column 2, 3, 4, 5, or 6) and the model that
24
excludes authority controls (i.e. column 1), versus the alternative hypothesis that the Risk
coefficient is lower in the model that includes authority controls than in the model that
excludes authority controls, reveals that the null is virtually always rejected when the
main measures of authority are used but not when the alternative measures are used.
More precisely, the null can be rejected at the ten percent significance level in columns 1
versus 2 (p-value = 0.057) and in columns 1 versus 6 (p-value = 0.088), and it narrowly
misses rejection at the ten percent significance level in columns 1 versus 4 (p-value =
0.107). When only the alternative measures are used, the null is not at all close to
rejection; the p-value is 0.440 for columns 1 versus 3, and the p-value is 0.283 for
columns 1 versus 5. Thus, statistical evidence supporting Prendergast’s main prediction
emerges only for the main authority measure and not for the alternative authority
measures.
Turning now to alternative measures of incentive pay, a potential drawback of our
measure is that it refers to group performance-related schemes as well as individual
performance-related schemes, whereas the theory we address in this paper pertains to
individual performance-related schemes. To explore this issue, we use some further
information in the WERS employer survey. If the respondent reports that performance-
related pay is used at the establishment and that “any non-managerial occupations [are]
eligible”, the respondent is then asked what measures of performance are used to
determine the amount of performance-related pay. Respondents can list as many of the
following responses as they wish, in addition to providing their own responses not on the
list: “1 = Individual performance / output”, “2 = Group or team performance / output”, “3
= Workplace-based measures”, “4 = Organisation-based measures”. The most common
25
response is “1”, either alone or in combination with other choices. Using this information
we modify the binary performance measure we have used throughout the analysis. If an
establishment reports the use of performance-related pay but does not include “1 =
Individual performance / output” in its list of responses to the above question, we
reclassify the binary performance pay measure for this observation from 1 to 0. The idea
behind this reclassification is to create a binary incentive pay measure that equals one
only if it can be determined with certainty (abstracting from reporting and coding errors)
that performance-related pay is used and at least some of it is based on individual
performance or output.
Two points are worth noting about this modified measure. First, when the
respondent lists more than one answer to the question of what type of performance-
related scheme is used at the establishment, there is no way to discern the relative
importance of the responses listed. Second, because the question is only asked if
performance-pay is used and “any non-managerial occupations [are] eligible”, if
performance pay is used at the establishment but no non-managerial occupations are
eligible for it we have no information on what type of performance pay is used. Thus, we
only have information on the type of performance-related pay used for 357 of the 418
establishments that report the use of performance-related pay. For the remaining 61
establishments we define the binary incentive measure as “1” even though in some of
these cases the performance-pay might not be based on individual performance / output.
The mean of the modified incentive pay measure is 0.151, as opposed to 0.196 for the
unmodified measure we use throughout the paper. Replicating all of our analysis in the
26
paper using the modified measure yields no qualitative changes to our conclusions. All
of these results are available upon request.
V. DISCUSSION
In this study we use a large, nationally representative cross section of British
establishments, containing responses both from employers and from multiple workers in
each establishment, to shed light on the four empirical questions posed in the
introduction. In answer to the first question, we find statistically weak evidence of the
negative relationship between risk and incentives predicted by the standard principal-
agent model. On average, greater turbulence in the market for the establishment’s main
product or service is associated with a lower probability of performance-related pay for
the establishment as a whole. In answer to the second and third questions, we find
evidence supporting a positive relationship between performance-related pay and the
degree of worker authority over the range of tasks performed, and evidence supporting a
positive relationship between risk and the degree of worker authority.
In answer to the fourth question, our results suggest that when measures of worker
authority are included in a risk-incentives model, the relationship between risk and
incentives becomes more negative, and the potential endogeneity of authority in this
model does not appear to be a concern. We interpret the overall evidence in this
empirical test of Prendergast’s theory as supportive. The evidence from the WERS data
suggests that Prendergast’s theory is at least part of the reason why a vast empirical
literature has failed to uncover the negative relationship between risk and incentives that
has been central to agency theory for nearly three decades.

27
We conclude with four comments. First, while some of our main results are
estimated with high precision, others are not. Throughout the analysis, we rely on one-
tailed hypothesis tests since the relevant theory implies directional hypotheses. However,
in some cases our results would not achieve statistical significance at conventional levels
if the more stringent two-tailed tests were used instead.
Second, while our results on the risk-incentives tradeoff represent only one study
in a vast empirical literature that has found mixed evidence, we believe the breadth of our
sample (which is nationally representative of all British establishments) makes our results
particularly interesting. While many analyses of the risk-incentives tradeoff have been
conducted, the heavy focus has been on a relatively small set of worker groups, in
particular groups that, it is fair to say, are atypical. For example, while the number of
jobs held by either CEOs or sharecroppers is negligible, the majority of previous
empirical studies focus on these two groups. The general point is that it is difficult to
know what relative weights to assign to the various empirical studies in forming an
overall evaluation. We think the present study, based on a broad and nationally
representative sample of establishments, contributes to forming such an overall
evaluation.
Third, we hope that our results will stimulate further research in this area using
other data sets. Panel data would be particularly helpful to convincingly identify causal
parameters; the cross sectional nature of our data is a limitation of our analysis. Also,
since we have focused only on Britain, due to the strengths of the WERS data for testing
Prendergast’s theory, it would be useful for future tests to use data from the United States
and other countries. While we cannot rule out the possibility that the empirical support of

28
Prendergast’s model is specific to Britain, we will be rather surprised if this is confirmed
in future work. We see nothing peculiar to Britain in the fundamental workplace issues
Prendergast’s model addresses, and we therefore expect the empirical support for his
model in Britain to generalize to data sets from other countries. Furthermore, though our
binary measure of incentive pay proved to be quite informative, more detailed
information concerning how the intensity of incentive pay varies across organizations
would also be interesting.
Finally, while we believe our results suggest that Prendergast’s theory at least
partially explains why the empirical literature has failed to uncover a risk-incentives
tradeoff, this does not rule out that alternative theories may also play a role. Our focus on
Prendergast’s theory in this analysis is driven largely by the availability of an authority
measure that corresponds closely to the notion discussed by Prendergast. Though we
believe our evidence is supportive of Prendergast’s theory, we do not see it as casting
doubt on the alternative models, and we see investigation of these alternatives as a
promising direction for future work with other data sets.
APPENDIX
FIRM CHARACTERISTICS USED AS CONTROL VARIABLES:
Single-Establishment Firm = 1 if the establishment is either a single independent establishment not belonging to another body, or the sole UK establishment of a foreign organization
= 0 if the establishment is one of a number of different establishments within a larger organization
Establishment Size = total number of full time, part time, and temporary workers at the
establishment (measured in thousands) Fraction of Part Time Workers = number of part time workers at the establishment as a
fraction of establishment size

29
Temporary Workers = 1 if there are temporary agency employees working at the
establishment at the time of the survey = 0 otherwise
Fixed Term Workers Under One Year = 1 if there are employees who are working on a
temporary basis or have fixed-term contracts for less than one year
= 0 otherwise
Fixed Term Workers Over One Year = 1 if there are employees who have fixed term contracts for one year or more
= 0 otherwise Number of Recognized Unions = total number of recognized unions at the workplace 100% Workers Unionized = 1 if 100% of all employees, including managers, are covered
by collective bargaining either at this workplace or at a higher level (employee-perceived measure)
= 0 otherwise 80-99% Workers Unionized = 1 if 80-99% of all employees, including managers, are
covered by collective bargaining either at this workplace or at a higher level (employee-perceived measure)
= 0 otherwise 60-79% Workers Unionized = 1 if 60-79% of all employees, including managers, are
covered by collective bargaining either at this workplace or at a higher level (employee-perceived measure)
= 0 otherwise 40-59% Workers Unionized = 1 if 40-59% of all employees, including managers, are
covered by collective bargaining either at this workplace or at a higher level (employee-perceived measure)
= 0 otherwise 20-39% Workers Unionized = 1 if 20-39% of all employees, including managers, are
covered by collective bargaining either at this workplace or at a higher level (employee-perceived measure)
= 0 otherwise 1-19% Workers Unionized = 1 if 1-19% of all employees, including managers, are
covered by collective bargaining either at this workplace or at a higher level (employee-perceived measure)
= 0 otherwise

30
0% Workers Unionized = 1 if 0% of all employees, including managers, are covered by collective bargaining either at this workplace or at a higher level (employee-perceived measure)
= 0 otherwise Main Activity of Establishment = 1 if the main activity of the establishment is to produce
goods or services for consumers = 0 for any of the following other possibilities: supplier
of goods or services to other companies; supplier of goods or services to other parts of the organization to which we belong; do not produce goods or provide services for sale in the open market; an administrative office only
Single Product = 1 if the establishment is concentrated on one product or service
= 0 if it is concentrated on several different products or services Private Sector Franchise = 1 if the establishment is a private sector company and a
franchise = 0 otherwise
Private Sector Non-franchise = 1 if the establishment is a private sector company but not
a franchise = 0 otherwise
Private Sector Publicly-Traded Franchise = 1 if the establishment is a publicly-traded
private sector unit and a franchise = 0 otherwise
Private Sector Publicly-Traded Non-franchise = 1 if the establishment is a publicly-
traded private sector unit but not a franchise
= 0 otherwise Operation Over Five Years = 1 if the workplace has been operating at its present address
for 5 years or more = 0 otherwise
Industry Controls: (Manufacturing; Electricity, Gas, and Water; Construction; Wholesale
and Retail; Hotels and Restaurants; Transport and Communication; Financial Services; Other Business Services; Public Administration; Education; Health; Other Community Services)

31
REFERENCES
Ackerberg, Daniel A., and Maristella Botticini (2002). “Endogenous Matching and the Empirical Determinants of Contract Form.” Journal of Political Economy, Vol. 110, No. 3, pp. 564-591.
Adams, Christopher P. (2005). “Worker Discretion, Adverse Selection, and the Risk-
Incentive Trade-off.” May 2005. FTC Working Paper. Aggarwal, Rajesh K., and Andrew A. Samwick (1999). “The Other Side of the Tradeoff:
The Impact of Risk on Executive Compensation.” Journal of Political Economy Vol. 107, No. 1 (February 1999): 65-105.
Aggarwal, Rajesh K., and Andrew A. Samwick (2002). “The Other Side of the Tradeoff:
The Impact of Risk on Executive Compensation—A Reply.” Working Paper, Dartmouth College.
Aghion, Philippe and Tirole, Jean (1997). “Formal and Real Authority in Organizations.” Journal of Political Economy, Vol. 105, No. 1. (February 1997), 1 – 29. Al-Najjar, Nabil I. (2001). “A reputational model of authority”. Journal of Economic Behavior and Organization, Vol. 46, pp. 165-191. Allen, Douglas and Dean Lueck (1992). “Contract Choice in Modern Agriculture: Cash
Rent versus Cropshare.” Journal of Law and Economics Vol. 35, No. 2 (October 1992): 397-426.
Anderson, Erin and David C. Schmittlein (1984). “Integration of the Sales Force: An
Empirical Examination.” RAND Journal of Economics Vol. 15, No. 3 (Autumn 1984): 385-395.
Aoki, Masahiko (1986). “Horizontal versus Vertical Information Structure of the Firm,”
American Economic Review, 76: 971 – 983. Baker, George, and Bjorn Jorgensen (2003). “Turbulence, Risk, and Incentives.”
Working Paper, Harvard University.
Ben-Ner, Avner, Fanmin Kong, and Stephanie Lluis (2007). “Uncertainty and Organization Design.” Working paper, University of Minnesota.
Colombo, Massimo G. and Delmastro, Marco (2004). "Delegation of Authority in
Business Organizations: An Empirical Test". Journal of Industrial Economics, Vol. LII, No. 1: 53-80.

32
Conyon, Martin J. and Kevin J. Murphy (2000). “The Prince and the Pauper? CEO Pay in the United States and United Kingdom.” The Economic Journal 110 (November 2000): 640-671.
Core, John and Wayne Guay (1999). “The Use of Equity Grants to Manage Optimal
Equity Incentive Levels.” Journal of Accounting and Economics 28: 151-184. Core, John and Wayne Guay (2002). “The Other Side of the Tradeoff: The Impact of
Risk on Executive Compensation. A Revised Comment.” Working Paper, University of Pennsylvania.
Core, John and Jun Qian (2002). “Project Selection, Production, Uncertainty, and
Incentives.” Working Paper, University of Pennsylvania (January 2002). Cully, M., Woodland, S., O’Reilly, A., and Dix, G. (1999). Britain at Work: As
Depicted by the 1998 Workplace Employee Relations Survey. London: Routledge.
Department of Trade and Industry, Advisory, Conciliation and Arbitration Service,
Workplace Employee Relations Survey: 1998 [computer file]. Colchester, Essex: The Data Archive [distributor], 22 March 1999.
Dessein, Wouter (2002). “Authority and Communication in Organizations.” Review of
Economic Studies 69: 811-838. Foss, Nicolai J., and Keld Laursen (2005). “Performance Pay, Delegation and
Multitasking Under Uncertainty and Innovativeness: An Empirical Investigation.” Journal of Economic Behavior and Organization Vol. 58, 246 – 276.
Garen, John E. (1994). “Executive Compensation and Principal-Agent Theory.” Journal
of Political Economy Vol. 102, No. 6 (December 1994): 1175-1199. Gibbs, Michael, Merchant, Kenneth A., Van der Stede, Wim A. and Vargus, Mark E
(2006). “Performance Measure Propoerties and Incentives.” (September 2006). Working Paper.
Heckman, James J. (1978). “Dummy Endogenous Variables in a Simultaneous Equation System.” Econometrica 46, 931-959. Holmstrom, Bengt (1979). “Moral Hazard and Observability,” Bell Journal of
Economics, 1979,10 (1), 74 – 91. Holmstrom, Bengt, and Paul Milgrom. (1991). “Multitask Principal-Agent Analyses:
Incentive Contracts, Asset Ownership, and Job Design.” Journal of Law, Economics, and Organization, Vol. 7 (Supplement 1991): 24-52.

33
Holmstrom, Bengt, and Paul Milgrom. (1994). “The Firm as an Incentive System”, American Economic Review, Vol. 84, No. 4 (September 1994): 972-991.
Ittner, Christopher D., Larcker, David F., and Madhav V. Rajan (1997). “The Choice of
Performance Measures in Annual Bonus Contracts.” The Accounting Review Vol. 72, No. 2 (April 1997): 231-255.
Jensen, Michael C. and Meckling, William H. (1992). “Specific and General Knowledge,
and Organizational Structure”. In Contract Economics, edited by Lars Werin and Hans Wijkander. Blackwell, Oxford, 251 – 274.
John, George and Weitz, Barton (1989). “Salesforce Compensation: An Empirical
Investigation of Factors Related to Use of Salary Versus Incentive Compensation”. Journal of Marketing Research, Vol. XXVI, 1 – 14.
Kawasaki, Seiichi and John McMillan (1987). “The Design of Contracts: Evidence from
Japanese Subcontracting.” Journal of the Japanese and International Economies 1: 327-349.
Lafontaine, Francine (1992). “Agency Theory and Franchising: Some Empirical
Results.” RAND Journal of Economics Vol. 23, No. 2 (Summer 1992): 263-283. Lambert, Richard A. and David F. Larcker (1987). “An Analysis of the use of
Accounting and Market Measures of Performance in Executive Compensation Contracts.” Journal of Accounting Research Vol. 25, Studies on Stewardship Uses of Accounting Information: 85-125.
Leffler, Keith B. and Randal R. Rucker (1991). “Transactions Costs and the Efficient
Organization of Production: A Study of Timber-Harvesting Contracts.” Journal of Political Economy Vol. 99, No. 5: 1060-1087.
MacLeod, W. Bentley and Daniel Parent (1999). “Job Characteristics and the Form of
Compensation.” In Research in Labor Economics Vol. 18, edited by Solomon Polacheck. Stamford, Conn.: JAI, 1999.
Maddala, G.S. (1983). Limited-Dependent and Qualitative Variables in Econometrics.
Cambridge University Press, Cambridge. Martin, Robert E. (1988). “Franchising and Risk Management.” The American
Economic Review Vol. 78, No. 5 (December 1988): 954-968. Mengistae, Taye and Lixin Colin Xu (2004). “Agency Theory and Executive
Compensation: The Case of Chinese State-Owned Enterprises.” Journal of Labor Economics, Vol. 22, No. 3, 615 – 637.

34
Monfardini, Chiara, and Rosalba Radice (2008). “Practioner’s Corner: Testing Exogeneity in the Bivariate Probit Model: A Monte Carlo Study.” Oxford Bulletin of Economics and Statistics, 70, 271-282.
Nagar, Venky (2002). “Delegation and Incentive Compensation.” The Accounting
Review Vol. 77, No. 2 (April 2002): 379-395. Norton, Seth W. (1988). “An Empirical Look at Franchising as an Organizational Form.”
Journal of Business Vol. 61, No. 2: 197-218. Oyer, Paul (2004). “Why Do Firms Use Incentives That Have No Incentive Effects.”
Journal of Finance, Vol. LIX, No. 4, pp. 1619-1649. Oyer, Paul, and Scott Schaefer (2005). “Why Do Some Firms Give Stock Options to All
Employees?: An Empirical Examination of Alternative Theories.” Journal of Financial Economics 76: 99-133.
Prendergast, Canice (2002). “The Tenuous Tradeoff Between Risk and Incentives.”
Journal of Political Economy Vol. 110, No. 5 (October 2002): 1071-1102. Raith, Michael (2003). “Competition, Risk, and Managerial Incentives.” American
Economic Review, Vol. 93, 1425 – 1436. Raith, Michael (2005). “Specific Knowledge and Performance Measurement.” Working
Paper, University of Rochester (November 2005). Rao, C. H. Hanumantha (1971). “Uncertainty, Entrepreneurship, and Sharecropping in
India.” Journal of Political Economy Vol. 79, No. 3 (May-June 1971): 578-595. Serfes, Konstantinos (2005). “Risk Sharing vs. Incentives: Contract Design Under Two-
sided Heterogeneity.” Economics Letters, Vol. 88, 343 – 349. Shavell, S. (1979). “Risk Sharing and Incentives in the Principal and Agent
Relationship,”Bell Journal of Economics, 1979, 10 (1), 55–73.
Shi, Lan (2005). “Respondable Risk and Incentives for CEOs: the Role of Information-collection and Decision-making.” Working Paper, University of Washington (November 2005).
Wilde, Joachim (2000). “Identification of Multiple Equation Probit Models with
Endogenous Dummy Regressors.” Economics Letters 69, 309-312. Wulf, Julie (2007). “Authority, Risk, and Performance Incentives: Evidence from
Division Manager Positions Inside Firms.” Journal of Industrial Economics, Volume 55, Issue 1, 169-196.

35
Yermack, David (1995). “Do Corporations Award CEO Stock Options Effectively.” Journal of Financial Economics 39: 237-269.
Zabojnik, Jan (1996). “Pay-Performance Sensitivity and Production Uncertainty. Economic Letters 53: 291-296.

36
Table 1: Descriptive Statistics Mean Min Max Median Std. Dev. Basic Firm Characteristics: Risk 0.218 0 1 0 0.388 Single-Establishment Firm 0.350 0 1 0 0.435 Fixed Term Workers Over One Year 0.140 0 1 0 0.401 Fixed Term Workers Under One Year 0.233 0 1 0 0.493 Operation Over Five Years 0.899 0 1 1 0.297 Main Activity of Establishment 0.686 0 1 1 0.457 Temporary Workers 0.193 0 1 0 0.483 Establishment Size 0.062 0.002 28.971 0.106 0.928 Fraction of Part Time Workers 0.310 0 1 0.132 0.287 Number of Recognized Unions 0.637 0 10 1 1.893 100% Workers Unionized 0.236 0 1 0 0.444 80-99% Workers Unionized 0.045 0 1 0 0.323 60-79% Workers Unionized 0.035 0 1 0 0.251 40-59% Workers Unionized 0.018 0 1 0 0.178 20-39% Workers Unionized 0.007 0 1 0 0.097 1-19% Workers Unionized 0.016 0 1 0 0.132 0% Workers Unionized 0.644 0 1 0 0.500 Firm Ownership: Private Sector Publicly-Traded Non-franchise 0.016 0 1 0 0.122 Private Sector Publicly-Traded Franchise 0.329 0 1 0 0.495 Private Sector Non-franchise 0.027 0 1 0 0.109 Private Sector Franchise 0.469 0 1 0 0.473 Industry: Manufacturing 0.166 0 1 0 0.376 Electricity, Gas, and Water 0.002 0 1 0 0.176 Construction 0.041 0 1 0 0.209 Wholesale and Retail 0.235 0 1 0 0.382 Hotels and Restaurants 0.088 0 1 0 0.256 Transport and Communication 0.048 0 1 0 0.246 Financial Services 0.039 0 1 0 0.232 Other Business Services 0.115 0 1 0 0.315 Public Administration 0.020 0 1 0 0.176 Education 0.098 0 1 0 0.293 Health 0.110 0 1 0 0.297 Other Community Services 0.038 0 1 0 0.209 Largest Occupational Group at Workplace: Managers and Administrators 0.006 0 1 0 0.075 Professional Occupations 0.099 0 1 0 0.326 Associate Professional and Technical Operations 0.056 0 1 0 0.267 Clerical and Secretarial Occupations 0.145 0 1 0 0.349 Craft and Skilled Service Occupations 0.132 0 1 0 0.324 Personal and Protective Service Occupations 0.170 0 1 0 0.333 Sales Occupations 0.162 0 1 0 0.343 Plant and Machine Operatives 0.138 0 1 0 0.365 Other Occupations 0.092 0 1 0 0.319 Incentive Pay: Performance Pay 0.196 0 1 0 0.440 Worker Authority: Authority1 0.078 0 1 0 0.277 Authority2 0.078 0 1 0 0.244 Authority3 0.526 0 1 1 0.495 Authority4 0.317 0 1 0 0.451 AUTHORITYHOW(W)1 0.032 0 1 0 0.141

37
AUTHORITYHOW(W)2 0.307 0 1 0 0.443 AUTHORITYHOW(W)3 0.660 0 1 1 0.453 AUTHORITYHOW(F)1 0.072 0 1 0 0.276 AUTHORITYHOW(F)2 0.209 0 1 0 0.445 AUTHORITYHOW(F)3 0.441 0 1 0 0.496 AUTHORITYHOW(F)4 0.278 0 1 0 0.410 Sample Size = 1590 Note: Tabulations are for the 1590 establishments in the private sector for which data on both risk and incentives are non-missing and excluding those establishments in public administration. Some of the above statistics are based on a smaller sample, however, due to missing values. Establishment Size is measured in thousands.

38
Table 2: Evidence of a Tradeoff Between Risk and Incentives Dependent Variable: Performance PayIndependent Variables: Risk -0.039
(0.046) -0.061* (0.039)
-0.051* (0.036)
Industry Controls: Manufacturing -0.123***
(0.027) -0.108***
(0.026) Electricity, Gas, and Water -0.060
(0.045) -0.100***
(0.018) Construction -0.120***
(0.027) -0.107***
(0.023) Hotels and Restaurants -0.128***
(0.026) -0.108***
(0.022) Transport and Communication -0.078*
(0.042) -0.083***
(0.027) Financial Services 0.115
(0.087) 0.064
(0.083) Other Business Services -0.095***
(0.031) -0.078***
(0.028) Public Administration -0.109***
(0.033) -0.111***
(0.022) Education -0.171***
(0.023) -0.156***
(0.026) Health -0.194***
(0.023) -0.167***
(0.021) Other Community Services -0.121***
(0.024) -0.101***
(0.021) Firm Controls: Single-Establishment Firm 0.003
(0.033) Fixed Term Workers Over One Year -0.011
(0.048) Fixed Term Workers Under One Year 0.041
(0.029) Private Sector Publicly-Traded Non-franchise 0.058
(0.123) Private Sector Publicly-Traded Franchise -0.017
(0.068) Private Sector Non-franchise 0.089
(0.173) Private Sector Franchise -0.093
(0.070) Operation Over Five Years 0.040
(0.032) Main Activity of Establishment 0.083**
(0.032) Temporary Workers 0.017
(0.029) Establishment Size 0.036
(0.024) Fraction of Part Time Workers -0.130**
(0.056) Number of Recognized Unions 0.017
(0.013) 100% Workers Unionized -0.070

39
(0.047) 80-99% Workers Unionized -0.045
(0.041) 60-79% Workers Unionized -0.005
(0.045) 40-59% Workers Unionized -0.106
(0.068) 20-39% Workers Unionized 0.035
(0.102) 1-19% Workers Unionized -0.169
(0.106) Sample Size 1546 1546 1546 Note: Results are probit marginal effects evaluated at the mean of the independent variable or, for binary independent variables, the change in predicted probabilities when the independent variable increases from 0 to 1 (evaluating all other covariates at their means). Robust standard errors are in parentheses; *, **, and *** denote statistical significance at the 10%, 5%, and 1% levels, respectively, using a one-tailed test for Risk and two-tailed tests for all other covariates. Reference group for industry dummies is Wholesale and Retail. Reference group for % unionized dummies is 0% Workers Unionized.

Table 3: Relationship Between Incentive Pay and Worker Authority Dependent Variable: Performance Pay Independent Variables: Authority2 0.028
(0.110) -0.037 (0.083)
-0.025 (0.069)
Authority3 -0.012 (0.087)
0.014 (0.064)
0.000 (0.052)
Authority4 0.069 (0.090)
0.110** (0.066)
0.100** (0.057)
Industry Controls NO YES
YES
Firm Controls NO NO YES Sample Size 1245 1245 1245 Note: Results are probit marginal effects evaluated at the mean of the independent variable or, for binary independent variables, the change in predicted probabilities when the independent variable increases from 0 to 1 (evaluating all other covariates at their means). Robust standard errors are in parentheses; *, **, and *** denote statistical significance at the 10%, 5%, and 1% levels, respectively, using a one-tailed test for Authority2, Authority3, Authority4. See Appendix for definitions of industry and firm controls.

41
Table 4: Relationship Between Worker Authority and Risk
Dependent Variable: Authority Independent Variables: Risk 0.084*
(0.055) 0.094** (0.052)
0.119** (0.053)
Industry Controls NO YES YES Firm Controls NO NO YES Sample Size 1245 1245 1245 Note: Results are probit marginal effects for Prob(Authority = 4) evaluated at the mean of the independent variable or, for binary independent variables, the change in the predicted Prob(Authority = 4) when the independent variable increases from 0 to 1 (evaluating all other covariates at their means). Robust standard errors are in parentheses; *, **, and *** denote statistical significance at the 10%, 5%, and 1% levels, respectively, using a one-tailed test for Risk. See Appendix for definitions of industry and firm controls.
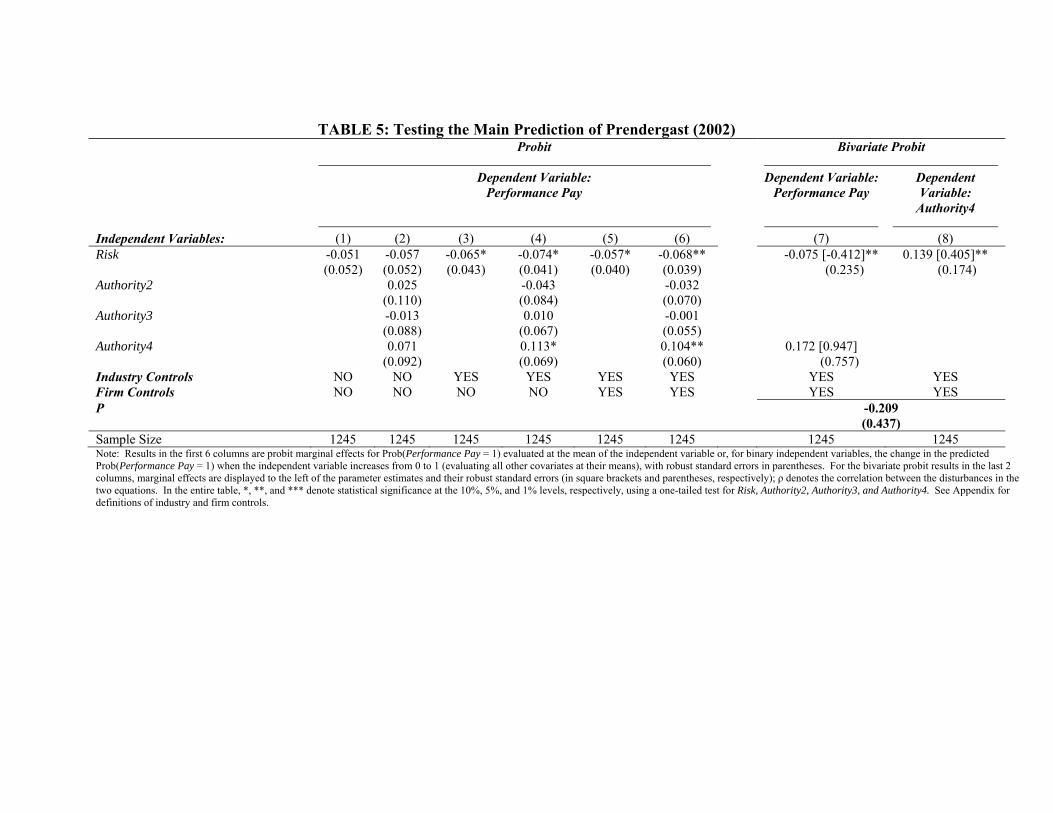
TABLE 5: Testing the Main Prediction of Prendergast (2002) Probit Bivariate Probit Dependent Variable:
Performance Pay Dependent Variable:
Performance Pay Dependent Variable:
Authority4 Independent Variables: (1) (2) (3) (4) (5) (6) (7) (8) Risk -0.051
(0.052) -0.057 (0.052)
-0.065* (0.043)
-0.074* (0.041)
-0.057* (0.040)
-0.068** (0.039)
-0.075 [-0.412]** (0.235)
0.139 [0.405]** (0.174)
Authority2 0.025 (0.110)
-0.043 (0.084)
-0.032 (0.070)
Authority3 -0.013 (0.088)
0.010 (0.067)
-0.001 (0.055)
Authority4 0.071 (0.092)
0.113* (0.069)
0.104** (0.060)
0.172 [0.947] (0.757)
Industry Controls NO NO YES YES YES YES YES YES Firm Controls NO NO NO NO YES YES YES YES Ρ -0.209
(0.437)Sample Size 1245 1245 1245 1245 1245 1245 1245 1245 Note: Results in the first 6 columns are probit marginal effects for Prob(Performance Pay = 1) evaluated at the mean of the independent variable or, for binary independent variables, the change in the predicted Prob(Performance Pay = 1) when the independent variable increases from 0 to 1 (evaluating all other covariates at their means), with robust standard errors in parentheses. For the bivariate probit results in the last 2 columns, marginal effects are displayed to the left of the parameter estimates and their robust standard errors (in square brackets and parentheses, respectively); ρ denotes the correlation between the disturbances in the two equations. In the entire table, *, **, and *** denote statistical significance at the 10%, 5%, and 1% levels, respectively, using a one-tailed test for Risk, Authority2, Authority3, and Authority4. See Appendix for definitions of industry and firm controls.

Table 6: Test of Prendergast’s Main Prediction with Alternative Measures of Worker Authority
Dependent Variable: Performance Pay Independent Variables: (1) (2) (3) (4) (5) (6) Risk -0.057*
(0.040) -0.067**
(0.039) -0.057* (0.040)
-0.065** (0.039)
-0.059* (0.039)
-0.067** (0.038)
Authority2
-0.032 (0.070)
-0.029
(0.067)
-0.023 (0.066)
Authority3
-0.001 (0.055)
0.000 (0.054)
0.007 (0.055)
Authority4
0.105** (0.060)
0.113** (0.059)
0.119** (0.059)
AuthorityHOW(W)2
0.007 (0.101)
0.014 (0.103)
0.003 (0.103)
AuthorityHOW(W)3
0.018 (0.098)
-0.009 (0.100)
-0.025 (0.100)
AuthorityHOW(F)2
0.087** (0.050)
0.089** (0.047)
AuthorityHOW(F)3
0.038 (0.048)
0.042 (0.047)
AuthorityHOW(F)4
0.071* (0.050)
0.055 (0.047)
Firm and industry controls
YES YES YES YES YES YES
Sample Size 1241 1241 1241 1241 1241 1241 Note: Results are probit marginal effects for Prob(Performance Pay = 1) evaluated at the mean of the independent variable or, for binary independent variables, the change in the predicted Prob(Performance Pay = 1) when the independent variable increases from 0 to 1 (evaluating all other covariates at their means). Robust standard errors are in parentheses; *, **, and *** denote statistical significance at the 10%, 5%, and 1% levels, respectively, using one-tailed tests. Firm and industry controls are those listed in Table 2; see the Appendix for their definitions.