An Empirical Analysis of Bundling and Tying: Over-the-Counter Pain Relief and Cold Medicines
35
AN EMPIRICAL ANALYSIS OF BUNDLING AND TYING: OVER-THE-COUNTER PAIN RELIEF AND COLD MEDICINES DAVID S. EVANS MICHAEL SALINGER CESIFO WORKING PAPER NO. 1297 CATEGORY 9: INDUSTRIAL ORGANISATION OCTOBER 2004 PRESENTED AT CESIFO VENICE SUMMER INSTITUTE, WORKSHOP ON RECENT DEVELOPMENTS IN ANTITRUST ANALYSIS, JULY 2004 An electronic version of the paper may be downloaded • from the SSRN website: www.SSRN.com • from the CESifo website: www.CESifo.de
Transcript of An Empirical Analysis of Bundling and Tying: Over-the-Counter Pain Relief and Cold Medicines
AN EMPIRICAL ANALYSIS OF BUNDLING AND TYING: OVER-THE-COUNTER PAIN RELIEF AND
COLD MEDICINES
DAVID S. EVANS MICHAEL SALINGER
CESIFO WORKING PAPER NO. 1297 CATEGORY 9: INDUSTRIAL ORGANISATION
OCTOBER 2004
PRESENTED AT CESIFO VENICE SUMMER INSTITUTE, WORKSHOP ON RECENT DEVELOPMENTS IN ANTITRUST ANALYSIS, JULY 2004
An electronic version of the paper may be downloaded • from the SSRN website: www.SSRN.com • from the CESifo website: www.CESifo.de
CESifo Working Paper No. 1297
AN EMPIRICAL ANALYSIS OF BUNDLING AND TYING: OVER-THE-COUNTER PAIN RELIEF AND
COLD MEDICINES
Abstract We apply and extend the cost-based approach to bundling and tying under competition developed in Evans and Salinger (2004a) to over-the-counter pain relievers and cold medicines. We document that consumers pay much less for tablets with multiple ingredients than they would to buy tablets with each ingredient separately. We then decompose the sources of these savings into marginal cost savings and a component that reflects fixed costs of product offerings. The analysis both documents substantial economies of bundling and illustrates the sort of cost analysis that is necessary for understanding tying.
JEL Code: L11.
David S. Evans LECG
350 Massachusetts Avenue Suite 300
Cambridge, MA 02139 USA
Michael Salinger Boston University
School of Management 595 Commonwealth Ave.
Boston, MA 02215 USA
The authors thank Irina Danilkina, Chris Nosko, and Ori Stitelman for exceptional research support and Tim Bresnahan, Howard Chang, Georg Getz, Nick Nichols, Bernard Reddy and Richard Schmalensee for comments and suggestions. Microsoft Corporation provided research funding for which the authors are grateful. The opinions expressed herein are those of the authors alone.
Preliminary – Do not redistribute or cite without permission
An Empirical Analysis of Bundling and Tying: Over-the-Counter Pain Relief and Cold Medicines
David S. Evans
Michael Salinger
August 2004
I. Introduction
At virtually any pharmacy, grocery store, or convenience store, one can purchase
“cold tablets” that contain more than one active ingredient. The main components of
these medicines are pain relievers, decongestants, antihistamines, and cough
suppressants. Tablets (or other dosage forms) containing just one of the ingredients are
also available. The tablets that contain more than one active ingredient are therefore
examples of bundled products.1 In this paper, we establish that the bundle discount is
substantial and use a cost-based framework to estimate the cost savings from bundled
products.
Our theoretical framework is based on the cost-based, unified theory of bundling
and tying developed in Evans and Salinger (2004a). Under that theory, a bundle discount
can be the result of two distinct cost effects. One is marginal cost savings (that could
arise from, for example, conserving on the number of packages and tablets produced).
The other is a reduction in the contribution to fixed costs of each product offering (such
as the cost of a shelf slot or the system cost of an additional stock keeping unit). As we
will explain,2 whether the private savings consumers get from the bundle reflect social
savings as well depends on the relative contribution of each. Thus, to estimate cost
savings from bundling, we must empirically identify these two effects.
1 A bundled product is one that combines more than one product that could be sold separately.
1
Preliminary – Do not redistribute or cite without permission
To do so, we exploit regularities in the pricing of different package sizes. The
price per tablet for any given medication tends to be a decreasing function of package
size.3 Suppose, for example, that a particular medicine––acetaminophen––is available in
packages of 50, 100, and 200 tablets, with the price per tablet a decreasing function of
tablet size. There seems no reason to rule out the possibility that some customers would
ideally like to purchase 150 tablets. Such a customer could either buy one package of 100
tablets and one of 50 tablets, thus sacrificing potential economies of package size, or one
package of 200 tablets that contains 50 more tablets than he wants. We estimate how high
fixed costs would have to be to make it unprofitable to offer package sizes that we do not
observe. As a basis for these estimates, we extend the model in Evans and Salinger
(2004a) to package-size effects.
We estimate that, in this case, the marginal cost savings from bundled products
exceed the fixed costs of the product offerings, so bundling lowers costs. For example,
we estimate that the price of a package of 48 tablets that combines two active ingredients
is $3.60 less4 than the sum of the prices of the same ingredients sold in separate packages
of 48 tablets each. We decompose this $3.60 into a marginal cost savings of $2.40 and an
average fixed cost of $1.20. The net cost effect is the difference between the two, or
$1.20. The gain would be substantially larger for tablets that contain three active
ingredients. Moreover, these cost effects do not capture the value of the convenience
consumers get from bundled products.
2 See Section III. 3 While this assertion should come as no surprise, we document the regularity in Section II. 4 The percentage difference would vary with the active ingredients but would generally be between 30 percent and 50 percent.
2
Preliminary – Do not redistribute or cite without permission
We can also use our framework to estimate the cost savings from having the
separate products available rather than having consumers who want just one component
buy the bundled product. This type of calculation is important for addressing the policy
issues associated with the antitrust laws concerning tying. Tying occurs when a bundled
product is offered and at least one of the separate products is not. Since tying can be an
antitrust violation, the law encourages companies, at least those with market power, to
offer the products that it bundles separately as well. For a consumer who wants just one
component of a bundle, buying the separate component rather than the bundle saves the
marginal cost of the components he does not want. However, the separate component is
itself a distinct product that generates a fixed cost of offering it. Selling the separate
component only saves costs if the fixed cost is less than marginal costs avoided by not
providing a customer with the part of a bundle he does not want. While in most of the
cases we consider, our estimates are that the separate products save costs, there is one
case in which we estimate that it does not. Of course, this result does not imply that the
separate product should not be offered in this case. In the example we consider,
consumers who want, for example, just pain relief, would strictly prefer not to have to
take a decongestant at the same time. Just as a complete welfare analysis of bundling and
tying would have to account for the convenience value of the bundle for consumers who
want all the components, so would it also have to account for the possibility that some
consumers would pay not to have a component of a bundle.
The remainder of the paper is organized as follows. Section II describes the data
and establishes some broad empirical regularities in it. Section III describes our
framework for understanding bundling and tying, applies it to the bundle discount, and
3
Preliminary – Do not redistribute or cite without permission
derives the formulas to calculate the (possibly negative) cost savings from the bundle and
from the separate products. In Section IV, we extend the cost-based theory to package-
size effects and derive the formula to calculate the average fixed cost of a good. We then
estimate the average fixed costs and use them to in turn estimate the effect of bundling
and components sales on costs. The concluding section provides a brief summary.
II. The Pricing of Pain Relief, Cold, Sinus, and Allergy Medicines
The primary data collected for this paper were the prices of all cold5 and pain relief
medications sold at the Walgreens6 at 757 N. Michigan Ave. in Chicago on April 3, 2003.
For each package, we observe the brand, the price, dosage form,7 quantity of each active
ingredient per unit, and number of units. We have supplemented the data with some prices
offered at the website of CVS8 and have generally checked prices on the web and at other
outlets to confirm that the regularities we document are not specific to this particular
location and time.
A. Empirical Regularities
We will ultimately use a price regression to describe the bundle discount. To
guide the specification of that regression, it will be useful to explore less formally some
strong regularities that are present in the data. We will also use these stylized facts to
argue for a cost-based explanation for the bundle discount.
5 We use the term “cold” to include medications labeled as sinus, allergy, and cough as well. 6 Walgreens is a large pharmacy chain in the United States. 7 Dosage forms include tablets, caplets, liquid, “gel tabs,” etc. 8 The website www.cvs.com is a vehicle for ordering pharamaceuticals (and other products) to be delivered by mail. The website is operated by CVS, which also operates a large chain of retail pharmacies.
4
Preliminary – Do not redistribute or cite without permission
1. Bundle Discounts and Brand Name Premia
Johnson & Johnson’s Tylenol is the dominant brand of the pain reliever
acetaminophen and Pfizer’s Sudafed is the dominant brand of the decongestant
pseudoephedrine hydrochloride. Each Extra Strength Tylenol contains 500 mg of
acetaminophen and each Maximum Strength Sudafed contains 30 mg of pseudoephedrine
hydrochoride. Johnson & Johnson does not offer a Tylenol-brand pseudoephedrine
hydrochloride nor does Pfizer offer a Sudafed-brand acetaminophen. However, both a
Tylenol Sinus Caplet and a Sudafed Sinus and Headache Caplet contain 30 mg of
pseudoephedrine hydrochloride and 500 mg of acetaminophen.9 Table 1 lists the prices
we observed for 24-tablet packages of these products and for their store-brand
equivalents.10 Table 1 illustrates two general phenomena in the pricing of this class of
product. First, branded products command a substantial premium—from just over 30
percent to 50 percent—over the price of the CVS product. Second, within both the
branded and non-branded segments, the price of the combination product is much lower
than the sum of the prices of the stand-alone products. The incremental cost to a
consumer of the pseudoephedrine hydrochloride in the Tylenol Sinus Caplet over
purchasing just Extra Strength Tylenol is $2.00, which is only 44 percent of the price of
buying a package of 24 Sudafed tablets. The incremental price of the acetaminophen in
the Sudafed Sinus and Headache Caplets is $1.40, which is 35 percent of the price of
buying a package of 24 Extra Strength Tylenol tablets. The comparisons are even more
9 Novartis also offers a product that contains 500 mg of acetaminophen and 30 mg of pseudoephedrine hydrochloride, Tavist Allery/Sinus/Headache. 10 These data are taken from www.cvs.com rather than our Walgreens data set. To isolate the bundle discount, we need to hold package size constant. To do so, we need all six of the products in Table 1 (just acetaminophen, just pseudophedrine, and the combination tablet in branded and generic form) available in
5

Preliminary – Do not redistribute or cite without permission
striking with the CVS products. The incremental price of the acetaminophen in the
combination product over pseudoephedrine hydrochloride tablets is only $0.50, or 17
percent of the price of buying acetaminophen tablets separately.11
Table 1. Prices for 24 Tablet/Caplet Packages
Brand Combination Pseudoephedrine HCl Alone Acetaminophen AloneTylenol $5.99 NA $3.99 Sudafed $5.99 $4.59 NACVS $3.99 $3.49 $2.99 Note: Tylenol: “Tylenol Sinus Caplet” (the combination product) and “Tylenol Extra Strength Caplets.”
Sudafed: “Sudafed Sinus and Headache Caplet” (the combination product) and “Sudafed Sinus & Cold.” CVS: “Non-Aspirin Sinus Caplets Maximum Strength” (the combination product), “Nasal Decongestant Tablets Maximum Strength,” and “Non-Aspirin Caplets Extra Strength.” NA denotes a combination that was not offered. Doses are 30 mg of pseudoephedrine hydrochloride and 500 mg of acetaminophen.
Source: Downloaded from CVS website, http://www.cvs.com, February 11, 2004.
There are also products that combine pseudoephedrine hydrochloride and ibuprofen.
Here, the comparisons are not quite as clean because we observed package sizes of 20 rather
than 24 for the combination product. Still, as we will document in section II.A.3 below (and
as is well known), the price per pill is generally a decreasing function of package size. Thus,
comparing the price per pill of the bundled product with the sum of the prices per pill of the
component products sold in somewhat larger packages understates the gains from bundling.
We observed a price of $6.29 for a package of 20 Advil “Cold & Sinus” tablets, which is
less than $0.32/tablet. To buy Advil and Maximum Strength Sudafed separately in 24-tablet
a common package size. Our Walgreens data set did not generate such a comparison, but the data we obained from the CVS website did. 11 In our Walgreens data set, the comparable prices were $6.99 for 24 Tylenol Sinus tablets, $4.99 for 24 Extra Tylenol tablets, and $6.79 for 24 Sudafed. Thus, the price of the branded combination product was only $0.20 higher than the stand alone Sudafed product. For the Walgreens brands, the prices were $2.99 for 24 tablets of extra strength acetaminophen and $3.49 for 24 maximum strenght pseudoephedrine hydrochloride tablets. While we did not observe a Walgreens version that combined just these two active ingredients, we did observe a package of 24 tablets with these two ingredients and 25 milligrams of the antihistimine, Diphenhydramine HCl. The price was $3.99.
6
Preliminary – Do not redistribute or cite without permission
packages, the sum of the prices per pill would be more than $0.49/tablet.12 On a per-pill
basis, the price of the bundled product was 64 percent of the price of the components. For
the store-brand versions, the per-pill price of the bundled product was less than $0.21, which
was 21 percent less than $0.27, the sum of the per-pill prices of the two separate products.13
The strong stylized fact that emerges from this set of comparisons is that the prices
consumers pay for combinations of medicines—both branded and store-brand—are
substantially less than the prices they would pay to buy the same active ingredients as
separate medicines. Of course, consumers who want all the components of the combination
medicines likely get convenience as well as the lower price.
2. Pricing of Different Dosages
The phenomenon of lower prices for combining the same active ingredient into
fewer pills and distinct packages that we observed with combination drugs applies to
different doses of the same medicine.
a) Pain Relievers
Tylenol comes in three dosage forms for adults:14 Regular Strength (325 mg/tablet),
Extra Strength (500 mg/tablet), and Arthritis Strength (650 mg/tablet). In a sense, each
Arthritis Strength tablet is a bundle of two Regular Strength tablets. As a result, buying two
packages of, say, 100 Regular Strength Tylenol rather than one package of 100 Extra
12 The price we observed for 24 Advil was $4.99. As reported in note 11, we observed a price of $6.79 at Walgreens for a package of 24 Sudafed. 13 The Walgreens products are WalProfem tablets (ibuprofen), WalPhed (pseudoephedrine hydrochloride) and WalProfem Cold & Sinus. The prices we observed were $4.29 for 20 WalProfem Cold & Sinus Tablets, $2.99 for 24 WalProfem tablets, and $3.49 for 24 WalPhed tablets. 14 It also comes in junior and children’s doses.
7
Preliminary – Do not redistribute or cite without permission
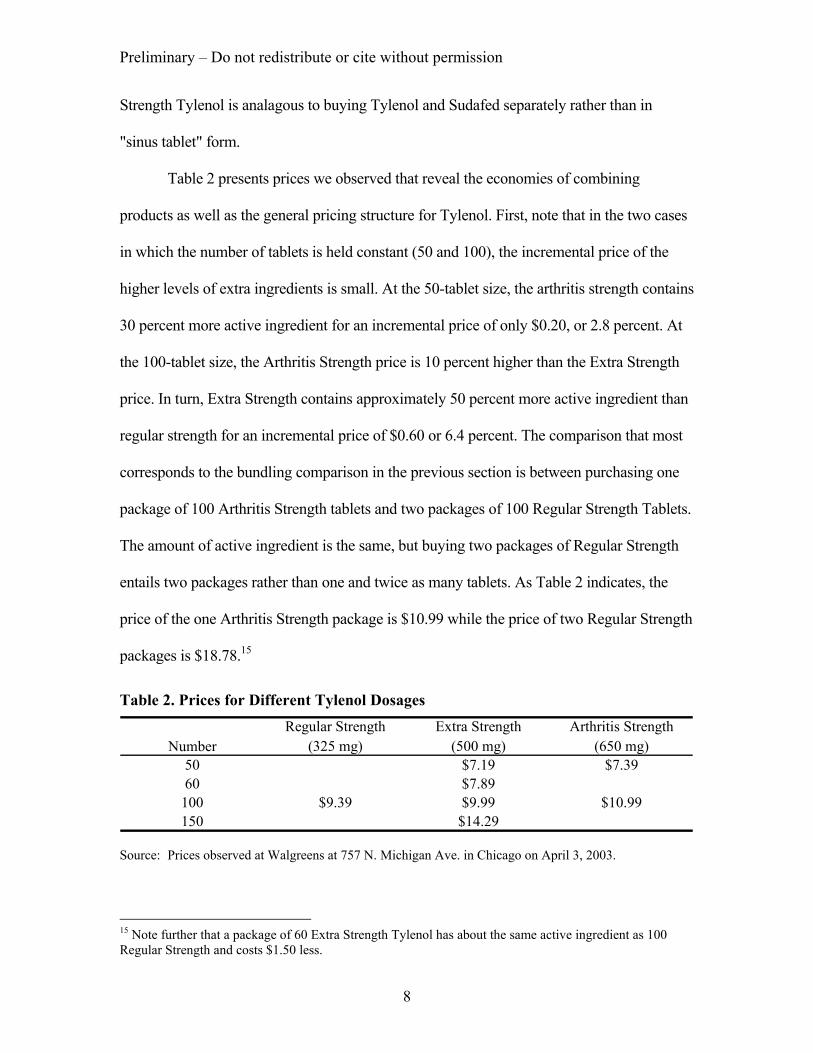
Strength Tylenol is analagous to buying Tylenol and Sudafed separately rather than in
"sinus tablet" form.
Table 2 presents prices we observed that reveal the economies of combining
products as well as the general pricing structure for Tylenol. First, note that in the two cases
in which the number of tablets is held constant (50 and 100), the incremental price of the
higher levels of extra ingredients is small. At the 50-tablet size, the arthritis strength contains
30 percent more active ingredient for an incremental price of only $0.20, or 2.8 percent. At
the 100-tablet size, the Arthritis Strength price is 10 percent higher than the Extra Strength
price. In turn, Extra Strength contains approximately 50 percent more active ingredient than
regular strength for an incremental price of $0.60 or 6.4 percent. The comparison that most
corresponds to the bundling comparison in the previous section is between purchasing one
package of 100 Arthritis Strength tablets and two packages of 100 Regular Strength Tablets.
The amount of active ingredient is the same, but buying two packages of Regular Strength
entails two packages rather than one and twice as many tablets. As Table 2 indicates, the
price of the one Arthritis Strength package is $10.99 while the price of two Regular Strength
packages is $18.78.15
Table 2. Prices for Different Tylenol Dosages Regular Strength Extra Strength Arthritis Strength
(325 mg) (500 mg) (650 mg) 50 $7.19 $7.39 60 $7.89
100 $9.39 $9.99 $10.99 150 $14.29
Number
Source: Prices observed at Walgreens at 757 N. Michigan Ave. in Chicago on April 3, 2003.
15 Note further that a package of 60 Extra Strength Tylenol has about the same active ingredient as 100 Regular Strength and costs $1.50 less.
8
Preliminary – Do not redistribute or cite without permission
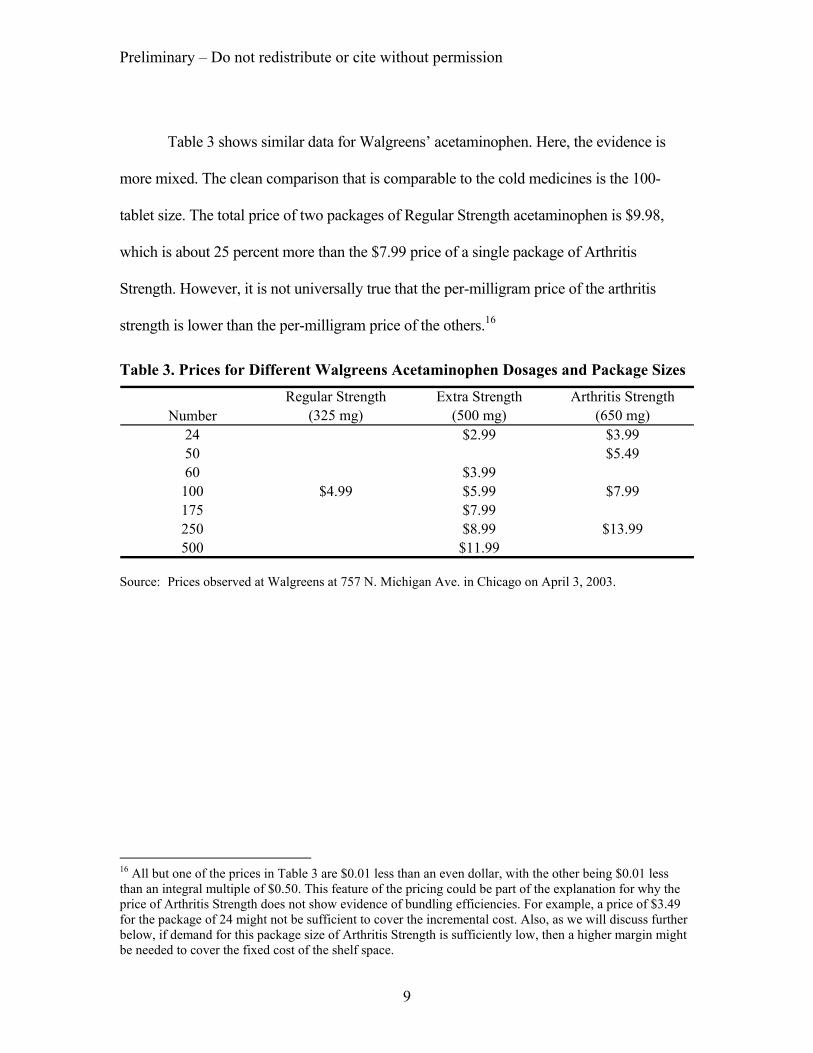
Table 3 shows similar data for Walgreens’ acetaminophen. Here, the evidence is
more mixed. The clean comparison that is comparable to the cold medicines is the 100-
tablet size. The total price of two packages of Regular Strength acetaminophen is $9.98,
which is about 25 percent more than the $7.99 price of a single package of Arthritis
Strength. However, it is not universally true that the per-milligram price of the arthritis
strength is lower than the per-milligram price of the others.16
Table 3. Prices for Different Walgreens Acetaminophen Dosages and Package Sizes
Regular Strength Extra Strength Arthritis Strength(325 mg) (500 mg) (650 mg)
24 $2.99 $3.99 50 $5.49 60 $3.99 100 $4.99 $5.99 $7.99 175 $7.99 250 $8.99 $13.99 500 $11.99
Number
Source: Prices observed at Walgreens at 757 N. Michigan Ave. in Chicago on April 3, 2003.
16 All but one of the prices in Table 3 are $0.01 less than an even dollar, with the other being $0.01 less than an integral multiple of $0.50. This feature of the pricing could be part of the explanation for why the price of Arthritis Strength does not show evidence of bundling efficiencies. For example, a price of $3.49 for the package of 24 might not be sufficient to cover the incremental cost. Also, as we will discuss further below, if demand for this package size of Arthritis Strength is sufficiently low, then a higher margin might be needed to cover the fixed cost of the shelf space.
9
Preliminary – Do not redistribute or cite without permission
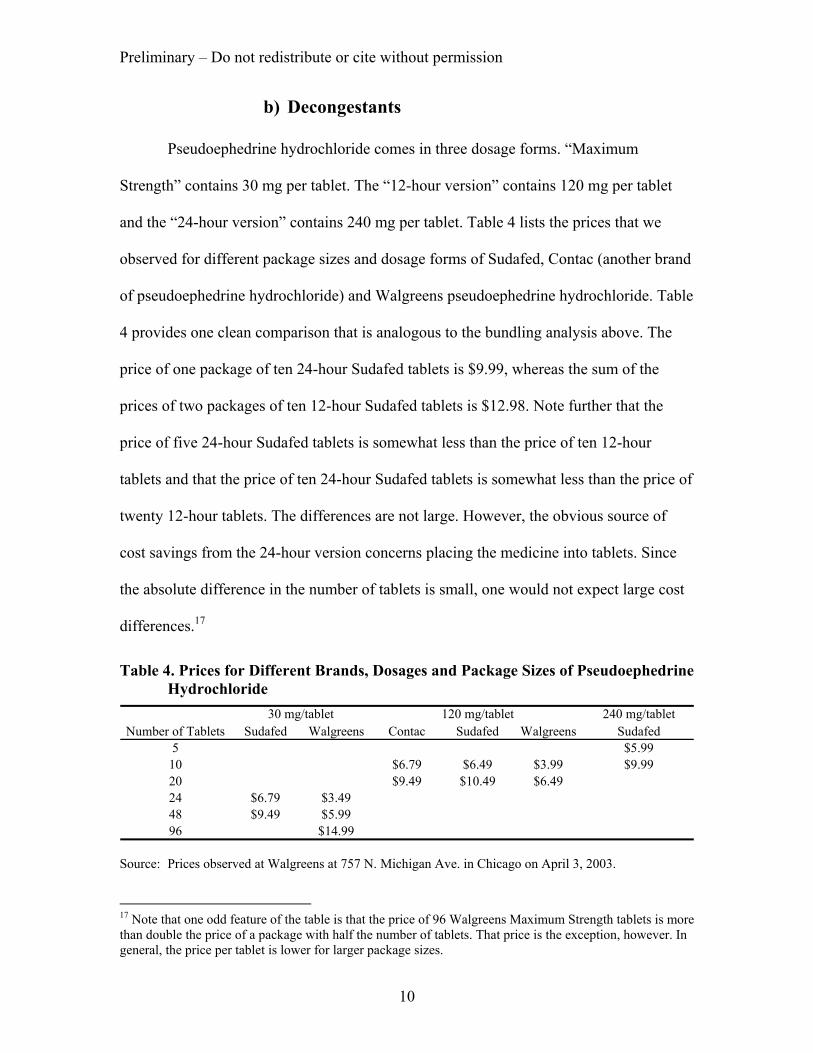
b) Decongestants
Pseudoephedrine hydrochloride comes in three dosage forms. “Maximum
Strength” contains 30 mg per tablet. The “12-hour version” contains 120 mg per tablet
and the “24-hour version” contains 240 mg per tablet. Table 4 lists the prices that we
observed for different package sizes and dosage forms of Sudafed, Contac (another brand
of pseudoephedrine hydrochloride) and Walgreens pseudoephedrine hydrochloride. Table
4 provides one clean comparison that is analogous to the bundling analysis above. The
price of one package of ten 24-hour Sudafed tablets is $9.99, whereas the sum of the
prices of two packages of ten 12-hour Sudafed tablets is $12.98. Note further that the
price of five 24-hour Sudafed tablets is somewhat less than the price of ten 12-hour
tablets and that the price of ten 24-hour Sudafed tablets is somewhat less than the price of
twenty 12-hour tablets. The differences are not large. However, the obvious source of
cost savings from the 24-hour version concerns placing the medicine into tablets. Since
the absolute difference in the number of tablets is small, one would not expect large cost
differences.17
Table 4. Prices for Different Brands, Dosages and Package Sizes of Pseudoephedrine Hydrochloride
30 mg/tablet 120 mg/tablet 240 mg/tabletNumber of Tablets Sudafed Walgreens Contac Sudafed Walgreens Sudafed
5 $5.99 10 $6.79 $6.49 $3.99 $9.99 20 $9.49 $10.49 $6.49 24 $6.79 $3.49 48 $9.49 $5.99 96 $14.99
Source: Prices observed at Walgreens at 757 N. Michigan Ave. in Chicago on April 3, 2003. 17 Note that one odd feature of the table is that the price of 96 Walgreens Maximum Strength tablets is more than double the price of a package with half the number of tablets. That price is the exception, however. In general, the price per tablet is lower for larger package sizes.
10
Preliminary – Do not redistribute or cite without permission
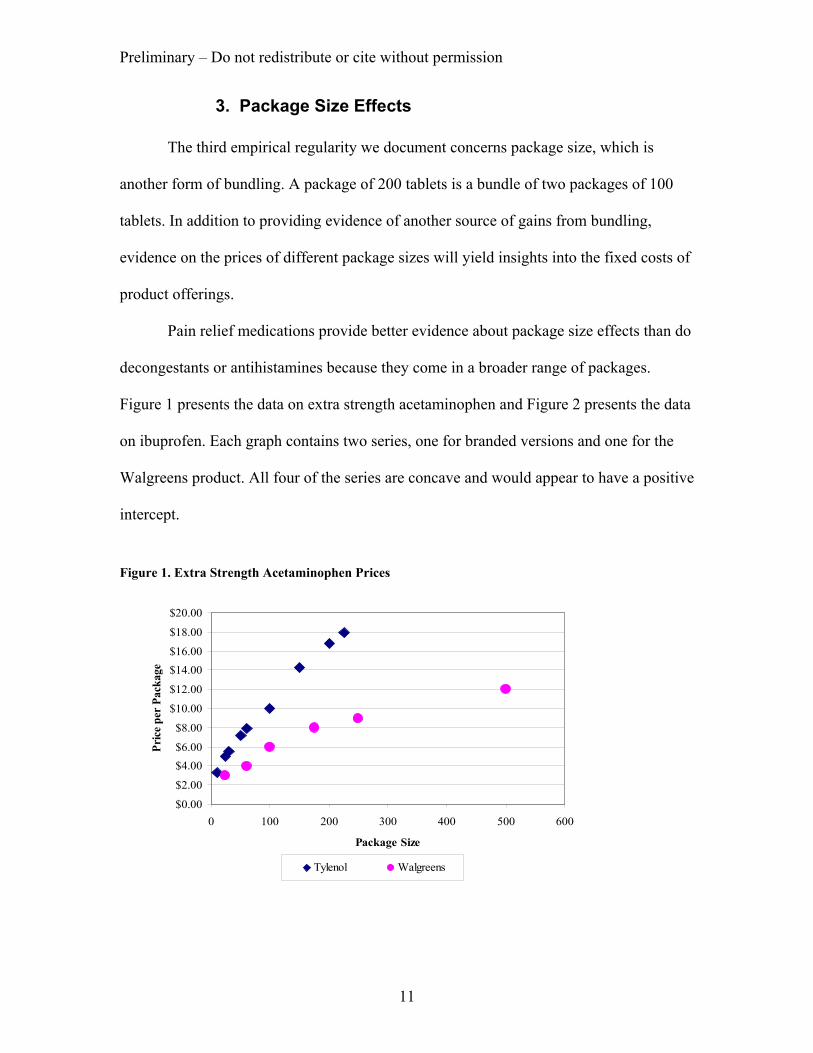
3. Package Size Effects
The third empirical regularity we document concerns package size, which is
another form of bundling. A package of 200 tablets is a bundle of two packages of 100
tablets. In addition to providing evidence of another source of gains from bundling,
evidence on the prices of different package sizes will yield insights into the fixed costs of
product offerings.
Pain relief medications provide better evidence about package size effects than do
decongestants or antihistamines because they come in a broader range of packages.
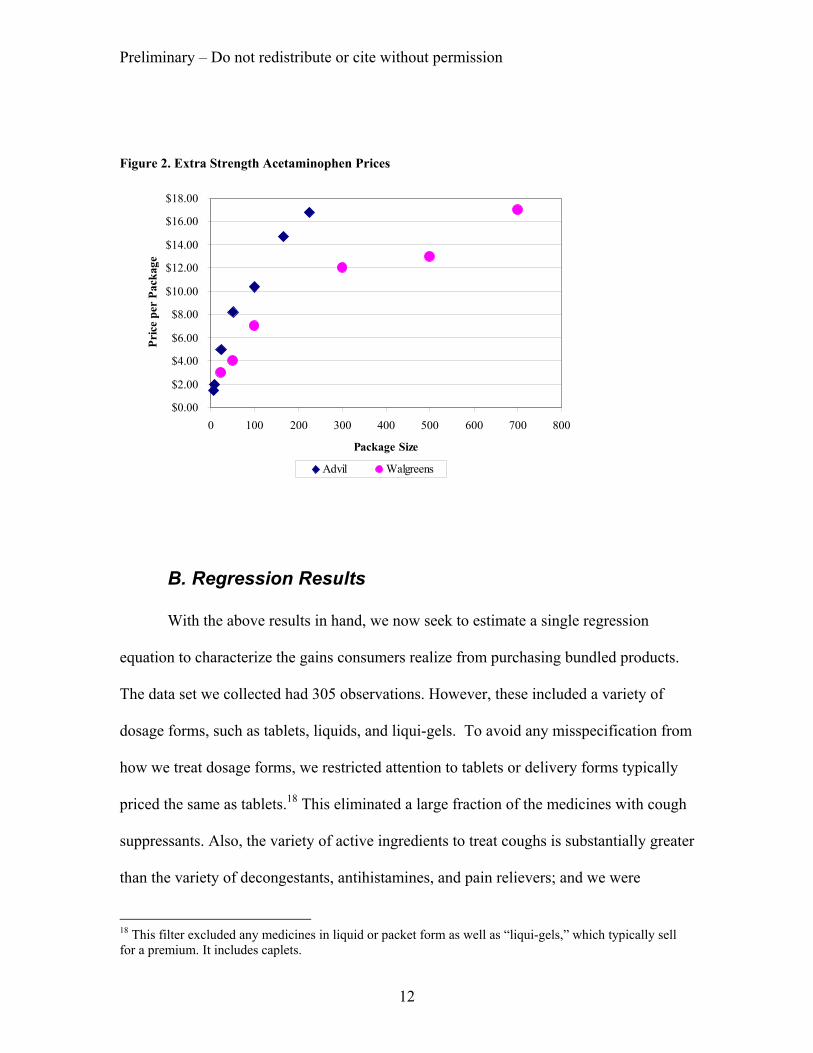
Figure 1 presents the data on extra strength acetaminophen and Figure 2 presents the data
on ibuprofen. Each graph contains two series, one for branded versions and one for the
Walgreens product. All four of the series are concave and would appear to have a positive
intercept.
Figure 1. Extra Strength Acetaminophen Prices
$0.00
$2.00
$4.00$6.00
$8.00
$10.00
$12.00
$14.00$16.00
$18.00
$20.00
0 100 200 300 400 500 600
Package Size
Pric
e pe
r Pa
ckag
e
Tylenol Walgreens
11
Preliminary – Do not redistribute or cite without permission
Figure 2. Extra Strength Acetaminophen Prices
$0.00
$2.00
$4.00
$6.00
$8.00
$10.00
$12.00
$14.00
$16.00
$18.00
0 100 200 300 400 500 600 700 800
Package Size
Pric
e pe
r Pa
ckag
e
Advil Walgreens
B. Regression Results
With the above results in hand, we now seek to estimate a single regression
equation to characterize the gains consumers realize from purchasing bundled products.
The data set we collected had 305 observations. However, these included a variety of
dosage forms, such as tablets, liquids, and liqui-gels. To avoid any misspecification from
how we treat dosage forms, we restricted attention to tablets or delivery forms typically
priced the same as tablets.18 This eliminated a large fraction of the medicines with cough
suppressants. Also, the variety of active ingredients to treat coughs is substantially greater
than the variety of decongestants, antihistamines, and pain relievers; and we were
12
18 This filter excluded any medicines in liquid or packet form as well as “liqui-gels,” which typically sell for a premium. It includes caplets.
Preliminary – Do not redistribute or cite without permission
concerned that we would be unable to get reliable estimates of how each cough
suppressant is priced. As a result, we excluded cough medicines. More precisely, we
restricted attention to tablets in which the active ingredients were limited to the pain
relievers acetaminophen and ibuprofen, the decongestant pseudoephedrine hydrochloride,
and the antihistamines chlorpheniramine maleate and diphenhydramine HCl.19 This left
us with 112 observations.
In order to capture brand effects and the non-linearities in package size
documented above, we chose the following specification:
(1) 2 20 1 2 3 4 5
1
N
i i i i i i i ij
P b b B b T b T b T B b T B c Z=
= + + + + + +∑ j ij
where:
Pi is the price of package i
Ti is the number of tablets in package i
Bi is a brand name dummy for package i
Zij is the amount of ingredient j in package i
The presence of a brand premium raises issues for the effect of bundling in this
case. To see the general issue, consider Table 1. For the branded products, the bundle
discount is computed as the price of Tylenol Sinus (or Sudafed Sinus Headache) with the
sum of the prices of Tylenol Extra Strength and Sudafed Maximum Strength. Both of the
prices of the component products include a brand premium.20 Unless the price of the
19 Thus, we excluded medicines with cough suppressants. The products we observed contained a much greater variety of cough suppressants than of the other types of ingredients, and we were concerned that we did not have sufficient data to estimate with much accuracy the price effects of each cough suppressant. 20 The fact that Tylenol is a Johnson & Johnson brand while Sudafed is a Pfizer brand is of interest, but a similar issue would arise if the same company owned both.
13
Preliminary – Do not redistribute or cite without permission
bundled product includes a double brand premium, then part of the bundle discount
reflects a brand premium effect.21
Our specification allows the brand premium to be a quadratic function of the
number of tablets. While this functional form allows for some flexibility in estimating
how companies impose a brand premium, it does not allow the brand premium to be a
function of the number of active ingredients. Neither does it allow for the brand premium
to depend on the volume of active ingredient per tablet.22 We ran regressions in which the
brand premium could depend on the number of active ingredients. They provided no
evidence that bundled, branded products command a higher (absolute) premium than do
unbundled ones.23
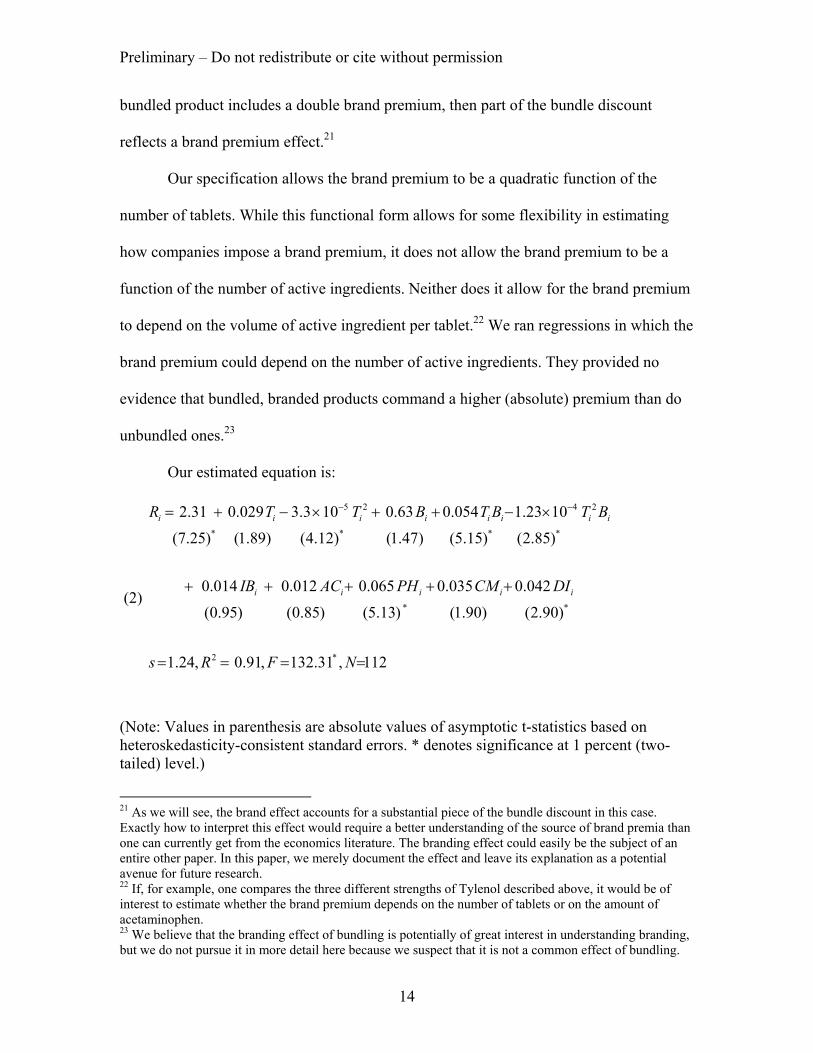
Our estimated equation is:
(2)
5 2 4 2
* * * *
* *
2 *
2.31 0.029 3.3 10 0.63 0.054 1.23 10
(7.25) (1.89) (4.12) (1.47) (5.15) (2.85)
0.014 0.012 0.065 0.035 0.042
(0.95) (0.85) (5.13) (1.90) (2.90)
1.24, 0.91, 132.31
i i i i i i
i i i i i
i iR T T B T B
IB AC PH CM DI
s R F
− −= + − × + + − ×
+ + + + +
= = = , 112N=
T B
(Note: Values in parenthesis are absolute values of asymptotic t-statistics based on heteroskedasticity-consistent standard errors. * denotes significance at 1 percent (two-tailed) level.)
21 As we will see, the brand effect accounts for a substantial piece of the bundle discount in this case. Exactly how to interpret this effect would require a better understanding of the source of brand premia than one can currently get from the economics literature. The branding effect could easily be the subject of an entire other paper. In this paper, we merely document the effect and leave its explanation as a potential avenue for future research. 22 If, for example, one compares the three different strengths of Tylenol described above, it would be of interest to estimate whether the brand premium depends on the number of tablets or on the amount of acetaminophen. 23 We believe that the branding effect of bundling is potentially of great interest in understanding branding, but we do not pursue it in more detail here because we suspect that it is not a common effect of bundling.
14
Preliminary – Do not redistribute or cite without permission
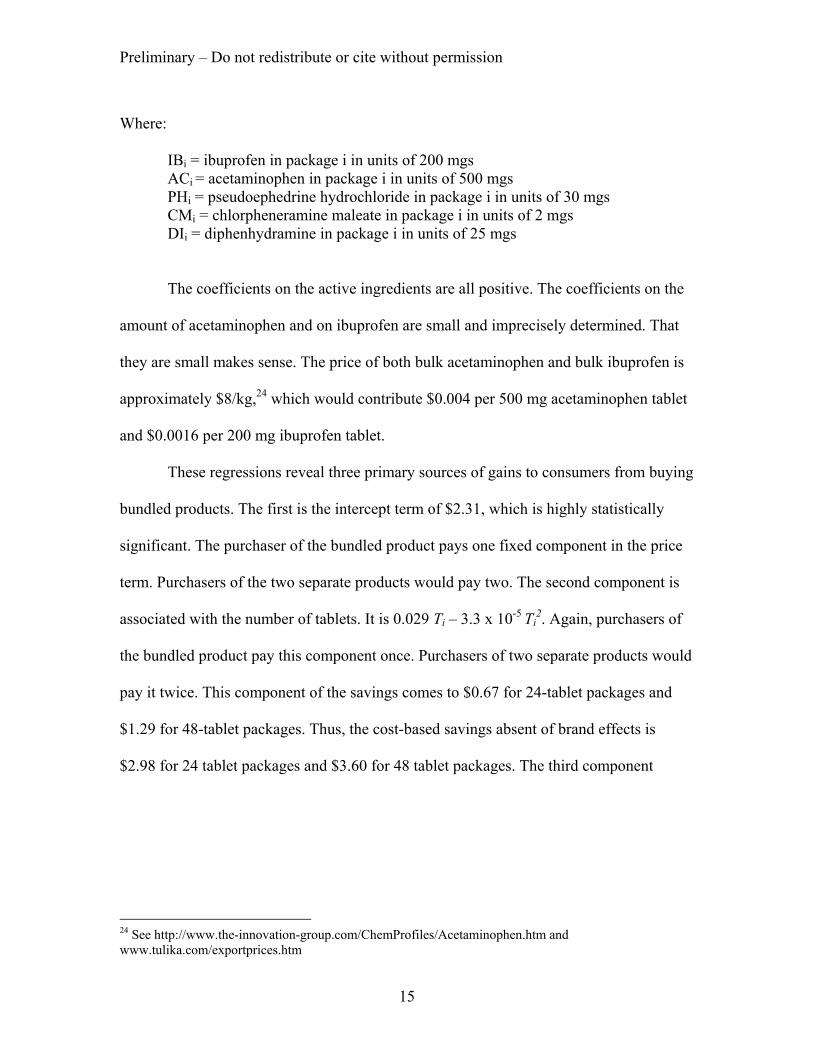
Where: IBi = ibuprofen in package i in units of 200 mgs ACi = acetaminophen in package i in units of 500 mgs
PHi = pseudoephedrine hydrochloride in package i in units of 30 mgs
CMi = chlorpheneramine maleate in package i in units of 2 mgs DIi = diphenhydramine in package i in units of 25 mgs
The coefficients on the active ingredients are all positive. The coefficients on the
amount of acetaminophen and on ibuprofen are small and imprecisely determined. That
they are small makes sense. The price of both bulk acetaminophen and bulk ibuprofen is
approximately $8/kg,24 which would contribute $0.004 per 500 mg acetaminophen tablet
and $0.0016 per 200 mg ibuprofen tablet.
These regressions reveal three primary sources of gains to consumers from buying
bundled products. The first is the intercept term of $2.31, which is highly statistically
significant. The purchaser of the bundled product pays one fixed component in the price
term. Purchasers of the two separate products would pay two. The second component is
associated with the number of tablets. It is 0.029 Ti – 3.3 x 10⁻⁵ Ti2. Again, purchasers of
the bundled product pay this component once. Purchasers of two separate products would
pay it twice. This component of the savings comes to $0.67 for 24-tablet packages and
$1.29 for 48-tablet packages. Thus, the cost-based savings absent of brand effects is
$2.98 for 24 tablet packages and $3.60 for 48 tablet packages. The third component
24 See http://www.the-innovation-group.com/ChemProfiles/Acetaminophen.htm and www.tulika.com/exportprices.htm
15
Preliminary – Do not redistribute or cite without permission
applies only to purchasers of branded products. It is given by 0.63 + 0.54 Ti – 0.00012
Ti2. It amounts to $1.84 and $2.92 for 24-tablet and 48-tablet packages, respectively.25
III. Modeling the Bundle Discount
In Evans and Salinger (2004a), we present a cost-based model that serves as a
unified framework for understanding bundling and tying under competition. In this
section, we apply that framework to model the bundle discount we have observed.26
The essential features of the framework are:
1. There are two products, A and B, that can be sold separately or bundled;
2. Some customers want A, some want B, and some want both; 3. The marginal cost of the bundle might be lower than the sum of the
marginal costs of the components; 4. There is a fixed cost of each product offering; 5. Markets are perfectly contestable, which implies that prices equal
average cost; and 6. The prices for the goods offered in the market are sustainable.
The first three of these seem readily applicable to this case. The different
medications can be (and are) sold both separately and in combination. To use the
example in Table 1, some people have a headache and want just acetaminophen. Some
people have a cold and want just a decongestant. Some have a sinus headache and want
both. Because of savings in packaging, making tablets, and transactions expense, the
marginal cost of the bundled product is less than the sum of the marginal costs of the
unbundled items.
25 These estimates are for the savings from buying a bundled medicine with two active ingredients as compared with buying the components separately. The effect would be twice as large for products with three active ingredients as compared with buying all three separately. 26 In broad terms, either the bundle discount reflects cost differences or it is price discrimination. See Evans and Salinger (2004b) for a discussion of why the discount is not entirely (or even primarily) price discrimination.
16
Preliminary – Do not redistribute or cite without permission
Assumption 3 implies that, without some constraint on the products offered, there
is an advantage to having the bundle available in addition to the separate components.
The bundle makes it possible to satisfy the demand of people who want both components
at a lower cost and, therefore, price. In practice, another efficiency of bundling is that it
provides convenience. If so, consumers who want both components would be willing to
pay a convenience premium to buy them in bundled form. It would be trivial to extend
the model to allow for a convenience premium. We do not do so here for two reasons.
First, we want to keep the model simple, and marginal cost savings are sufficient to make
those who want both components prefer to buy them in bundled form. Second, under
competition, the convenience value would not be reflected in prices. Measuring it would
require more precise estimates of demand than we attempt here.
The fourth assumption is necessary to capture the possibility of tying. Tying, as
an economic matter, occurs when the two products are sold in bundled form and at least
one of the products is not available separately. As such, it represents a limitation on the
products that are offered. To make sense of this limitation when there are some customers
who would like the component that is not offered, there needs to be some product-
specific scale economy. The simplest way to model these scale economies is to assume a
fixed cost of each product offering.
Tying is a prevalent practice under competition. Indeed, our objective in
formulating the model was to understand tying under competition. Given that scale
economies are necessary to understand tying, however, one cannot assume perfect
competition. The contestability assumption is a way of incorporating competition into a
model when scale economies are present. Like any model, it should be viewed as an
17
Preliminary – Do not redistribute or cite without permission
approximation. The key implication of a contestability model is that prices are
determined primarily by costs with the underlying elasticity of demand playing at most a
secondary role. This perspective is in distinct contrast to price discrimination models. In
evaluating whether contestability is a reasonable approximation, we need to consider
whether the threat of entry is the primary constraint on the extent to which prices can
exceed costs. Given the substantial number of large companies that would seem to have
the capability to produce and market any one of these products, that assumption strikes us
as being reasonable.
In this case, tying does not occur.27 In the Evans-Salinger model, however, mixed
bundling is a possible outcome, so the absence of tying is not a reason to reject the
model. Moreover, fixed costs of product offerings are likely present in this case even if
they are not sufficient to result in tying.28 Each additional stock keeping unit (sku)
imposes a cost on a retailer as it must order the product, maintain inventories, and so on.
In addition, each distinct product sold by a retailer must occupy a shelf slot. The cost of
these slots is an example of what accountants refer to as “semi-fixed” or “step” costs.
They are not fixed with respect to all levels of output, but they are incurred in discrete
units (or “steps”). Whether or not such costs should be deemed primarily fixed or
primarily marginal depends on the size of the steps relative to total demand. We do not
have the information one would need to determine whether shelf space should be
27 This comment requires some qualification. To take one example, Johnson & Johnson sells acetaminophen alone and acetaminophen in combination with pseudoephedrine HCl. It does not sell pseudoephedrine HCl alone. While this is technically tying from the standpoint of the company, the market outcome does not entail tying. One can purchase pseudoephedrine HCl. Moreover, because Johnson & Johnson does sell Tylenol without any additional active ingredients, its tying is not the sort that could raise antitrust concerns. 28 The model assumes that consumers who want just one component are willing to buy it as part of the bundle. In economics terminology, we assume free disposal. That plainly does not apply to this case. Many
18
Preliminary – Do not redistribute or cite without permission
considered a fixed or marginal expense, but it is at least plausible that it is more nearly
fixed.29
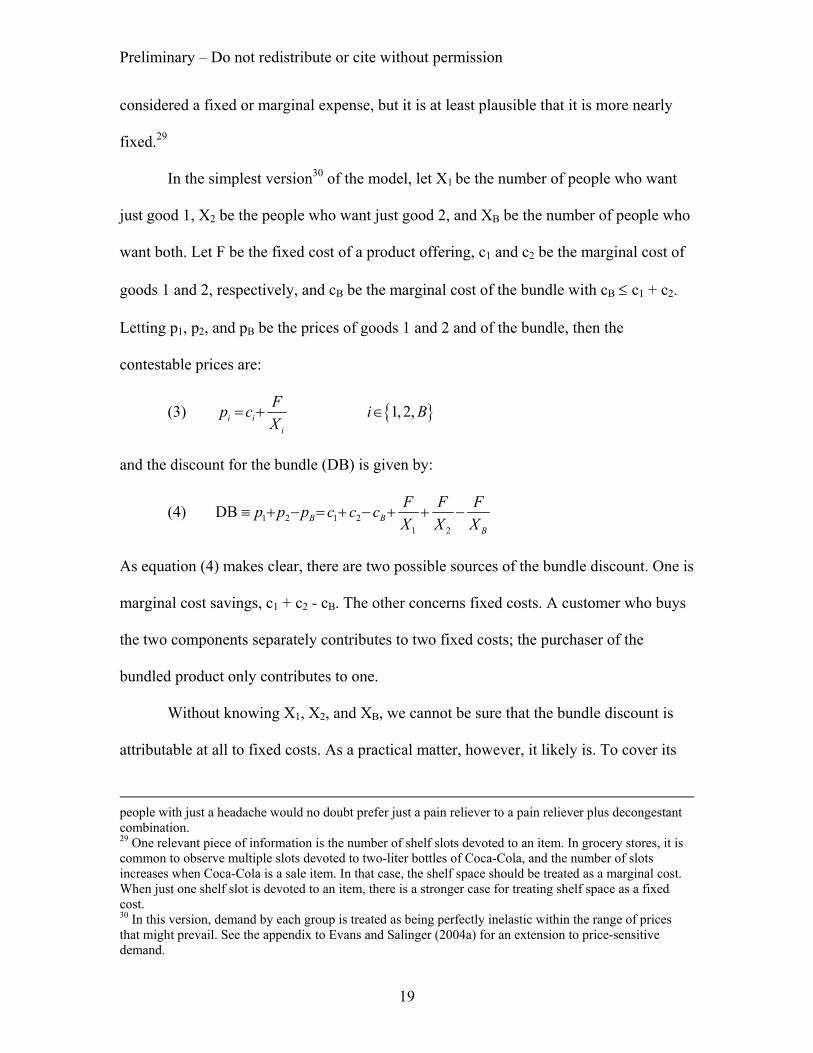
In the simplest version30 of the model, let X1 be the number of people who want
just good 1, X2 be the people who want just good 2, and XB be the number of people who
want both. Let F be the fixed cost of a product offering, c1 and c2 be the marginal cost of
goods 1 and 2, respectively, and cB be the marginal cost of the bundle with cB ≤ c1 + c2.
Letting p1, p2, and pB be the prices of goods 1 and 2 and of the bundle, then the
contestable prices are:
(3) { }1,2,i ii
Fp c iX
= + ∈ B
and the discount for the bundle (DB) is given by:
(4) DB ≡ 1 2 1 21 2
B BB
F F Fp c c cp pX X X
+ − = + − + + −
As equation (4) makes clear, there are two possible sources of the bundle discount. One is
marginal cost savings, c1 + c2 - cB. The other concerns fixed costs. A customer who buys
the two components separately contributes to two fixed costs; the purchaser of the
bundled product only contributes to one.
Without knowing X1, X2, and XB, we cannot be sure that the bundle discount is
attributable at all to fixed costs. As a practical matter, however, it likely is. To cover its
people with just a headache would no doubt prefer just a pain reliever to a pain reliever plus decongestant combination. 29 One relevant piece of information is the number of shelf slots devoted to an item. In grocery stores, it is common to observe multiple slots devoted to two-liter bottles of Coca-Cola, and the number of slots increases when Coca-Cola is a sale item. In that case, the shelf space should be treated as a marginal cost. When just one shelf slot is devoted to an item, there is a stronger case for treating shelf space as a fixed cost. 30 In this version, demand by each group is treated as being perfectly inelastic within the range of prices that might prevail. See the appendix to Evans and Salinger (2004a) for an extension to price-sensitive demand.
19
Preliminary – Do not redistribute or cite without permission
costs, a retailer must “mark up” the prices of the items it sells. Unless the retail mark-up
on the bundled item is at least the sum of its mark-ups on the components—and there is
no reason to suppose that it is—then part of the customer savings reflects retail mark-ups.
A key result in Evans and Salinger (2004a) is that mixed bundling can occur even
if it is not the set of offerings that minimizes total costs. Under mixed bundling, there has
to be a bundle discount,31 but the private savings from the bundle discount do not
necessarily represent social savings. If we let SB be the cost savings from offering the
bundle32 (stated on a per-customer basis to aid comparability with the bundle discount),
then:
(5) 21
21 XF
XFDB
XFcccSB
BB −−=−−+=
The first three terms of (5), which reflect marginal costs, are identical to (4). With the
marginal costs, private savings reflect social savings. The last term of (5) is also the last
term of (4). There is a social fixed cost of offering the bundle that must be subtracted
from the marginal cost savings. In a contestable market, purchasers of the bundle bear
this cost as well. The difference between (4) and (5) comes from the two terms in (4) that
reflect the average fixed costs of the two component goods. If those who want both
components were to buy them separately, the prices they would pay would reflect these
fixed costs. When they buy the bundle instead, they get a private benefit from not
contributing to those fixed costs, but there is no corresponding social benefit because the
fixed costs of the components are not reduced.
31 Otherwise, consumers who want both components would not buy the bundle. 32 SB represents the savings from offering the bundle given that goods 1 and 2 are also offered.
20
Michael Salinger
It is not the price discrimination captured by price discrimination models. For the moment, forget about the bundle. Suppose c1=c2=1; F=2; X1= 1 and X2=2. In our model, P1 = 3 and P2 = 2. You can call this price discrimination because different customers pay different margins, but it is not monopoly price discrimination based on willingness to pay and it is not Ramsey pricing (because there is no common fixed cost to be covered jointly by the two goods.
Preliminary – Do not redistribute or cite without permission
The last part of equation (5) provides a simple approach to inferring the cost
savings from the bundle (under mixed bundling) from the bundle discount. It says that the
cost savings (per consumer of the bundle) are the bundle discount minus the average
fixed cost portion of the prices of the two separate goods.
The following pair of examples illustrates the point:
Example 1: c1 = c2 = 2, cB = 2.9, F = 0, X1 = X2 = XB = 100 Example 2: c1 = c2 = 1, cB = 1.9, F = 100, X1 = X2 = XB = 100
In both cases, the unique sustainable outcome is mixed bundling with p1 = p2 = 2 and pB =
2.9.33 The bundle discount is substantial. In example 1, the bundle discount entirely reflects
social savings. The total cost of meeting demand with mixed bundling is 690. The cost of
meeting demand with components selling would be 800, or 110 more. In example 2, the
total cost of meeting demand with mixed bundling is also 690, just as in example 1. In
contrast to example 1, however, the total cost of meeting demand with components selling
would be only 600.34 Unless the bundled product provides convenience for the customers
who want both items, the mixed bundling would be inefficient despite the substantial bundle
discount.
33 This point should be obvious for example 1. For example 2, the prices under pure components selling would be $1.50 (calculated as 1 + 100/200) for each item. Customers who buy both pay a total of 3. This outcome is not sustainable because it is susceptible to entry with the bundle at a price of 2.9. Similarly, pure bundling is not sustainable. The price under pure bundling would be 1.9 + 100/300 ≈ 3.23. That price is not sustainable because an entrant could break even selling either component at a price of 3. 34 In example 2, there are some marginal cost savings from bundling. If there were no marginal cost savings from bunding, then mixed bundling would still be sustainable (and inefficient), but it would not be the unique sustainable outcome. Components selling would be sustainable as well. Mixed bundling can be the unique sustainable outcome with no marginal cost savings from bundling if XB is greater than the geometric mean of X1 and X2. For a more complete explanation, see Evans and Salinger (2004a).
21
Preliminary – Do not redistribute or cite without permission
A similar point applies to the individual components. Under mixed bundling, the
price of each component has to be less than the price of the bundle,35 but that does not
imply that offering the separate good lowers costs. If we let DCi and SCi be the discount
and cost savings (per customer of good i) of offering good i (given that the bundle is
offered), we have:
(6) iB
iBBii XF
XFccppDC −+−=−≡
(7) B
ii
iBi XFDC
XFccSC −=−−=
Equation (7) says that to infer the cost savings from having a component available
separately, one must subtract the average fixed cost component of the price of the bundled
good from the component discount.
Referring back to our pricing regression, the bundle discount has three
components: the intercept, the coefficients on the tablet variables, and the coefficients on
the brand-name variables. As noted above, we focus on the first two. The estimated
equation distinguishes between price components that are fixed and variable with respect
to package size. Within our model, however, the key distinction is whether or not the
costs are fixed or marginal with respect to a customer. The cost of placing active
ingredients into tablets and, to some extent, the cost of the package itself, are examples of
costs that are marginal with respect to both package size and to the customer. To the
extent that package costs rise less than proportionately with the number of tablets,
35 Another simplifying assumption of our model is that consumers who want just one of the goods get no utility or disutility from the other good. As a result, they view the bundle as a perfect substitute for the good they want. That assumption does not apply to our application, since, for example, many consumers who want just a pain reliever would prefer not to have to take a decongestant as well. Just as it would be easy to incorporate a convenience value for the bundle in the model, we could also assume that consumers who want just one component are willing to pay a premium not to have it bundled with the other.
22
Preliminary – Do not redistribute or cite without permission
however, then part of packaging cost would be reflected in our intercept term. Even
though this component is fixed with respect to package size, it is variable with respect to
the customer.36 Another example of this kind of cost is the cost of the time it takes a clerk
to process a transaction. Finally, some costs are fixed both with respect to the customer
and to the size of the package. The costs of having an additional sku and, to a large
extent, the cost of shelf space are examples.37
IV. Decomposing Fixed and Marginal Cost Effects with Package Size Pricing Regularities
We now show how to use the package-size regularities documented in Section II to
decompose the bundle and component discounts into marginal cost and fixed cost
components. This decomposition will then allow us to measure the (possibly negative) cost
savings (per customer) from each product.
1. Theory
The key to understanding the size of the the product-specific fixed costs is to
observe products that could conceivably exist but do not.38 In the cases we have considered,
product tying does not occur. Among the products sold in bundled form that we have
36 Our argument that the packaging cost is reflected at least partially in the intercept term does not require that the packaging cost equation literally has a positive intercept. If we observed packaging costs directly, our estimates of the marginal cost savings from bundling would be based on the cost of a package of a given size, such as 24 tablets or 48 tablets. Taken, literally, the intercept reflects the cost of a 0-tablet package, which is irrelevant for computing the gains from bundling. Given our choice of a quadratic functional form, however, the cost of a pacakge of a particular size would be reflected in part in the intercept. 37 It is possible that some costs might be variable with respect to package size but fixed with respect to the customer. This could happen if, for example, larger packages require more shelf space. Our procedure for estimating the component of price that covers fixed costs ignores this possibility. 38 Other papers that use or suggest an analogous approach to estimating fixed costs are Bresnahan and Reiss (1987), Pakes and McGuire (1994), Ericson and Pakes (1995), Fershtman and Pakes (2000), Miravete (2004), and Pakes, Ostrovsky and Berry (2004).
23
Preliminary – Do not redistribute or cite without permission
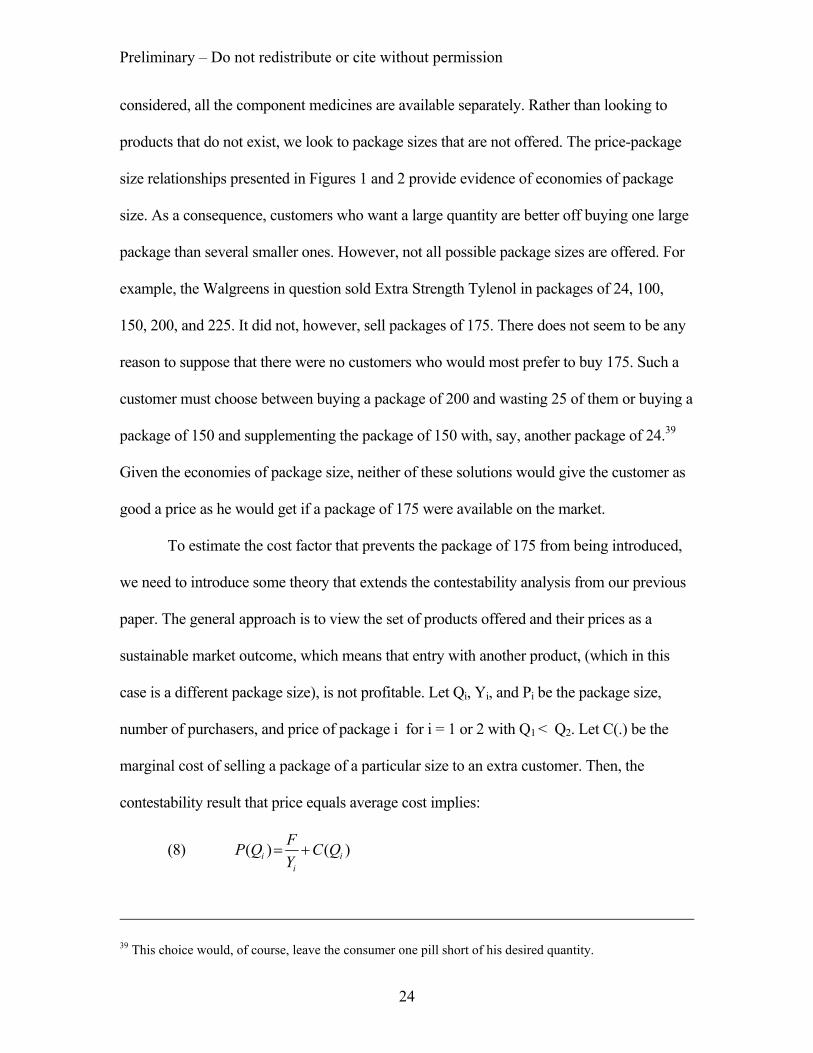
considered, all the component medicines are available separately. Rather than looking to
products that do not exist, we look to package sizes that are not offered. The price-package
size relationships presented in Figures 1 and 2 provide evidence of economies of package
size. As a consequence, customers who want a large quantity are better off buying one large
package than several smaller ones. However, not all possible package sizes are offered. For
example, the Walgreens in question sold Extra Strength Tylenol in packages of 24, 100,
150, 200, and 225. It did not, however, sell packages of 175. There does not seem to be any
reason to suppose that there were no customers who would most prefer to buy 175. Such a
customer must choose between buying a package of 200 and wasting 25 of them or buying a
package of 150 and supplementing the package of 150 with, say, another package of 24.39
Given the economies of package size, neither of these solutions would give the customer as
good a price as he would get if a package of 175 were available on the market.
To estimate the cost factor that prevents the package of 175 from being introduced,
we need to introduce some theory that extends the contestability analysis from our previous
paper. The general approach is to view the set of products offered and their prices as a
sustainable market outcome, which means that entry with another product, (which in this
case is a different package size), is not profitable. Let Qi, Yi, and Pi be the package size,
number of purchasers, and price of package i for i = 1 or 2 with Q1 < Q2. Let C(.) be the
marginal cost of selling a package of a particular size to an extra customer. Then, the
contestability result that price equals average cost implies:
(8) ( ) ( )i ii
FP Q C QY
= +
39 This choice would, of course, leave the consumer one pill short of his desired quantity.
24
Preliminary – Do not redistribute or cite without permission
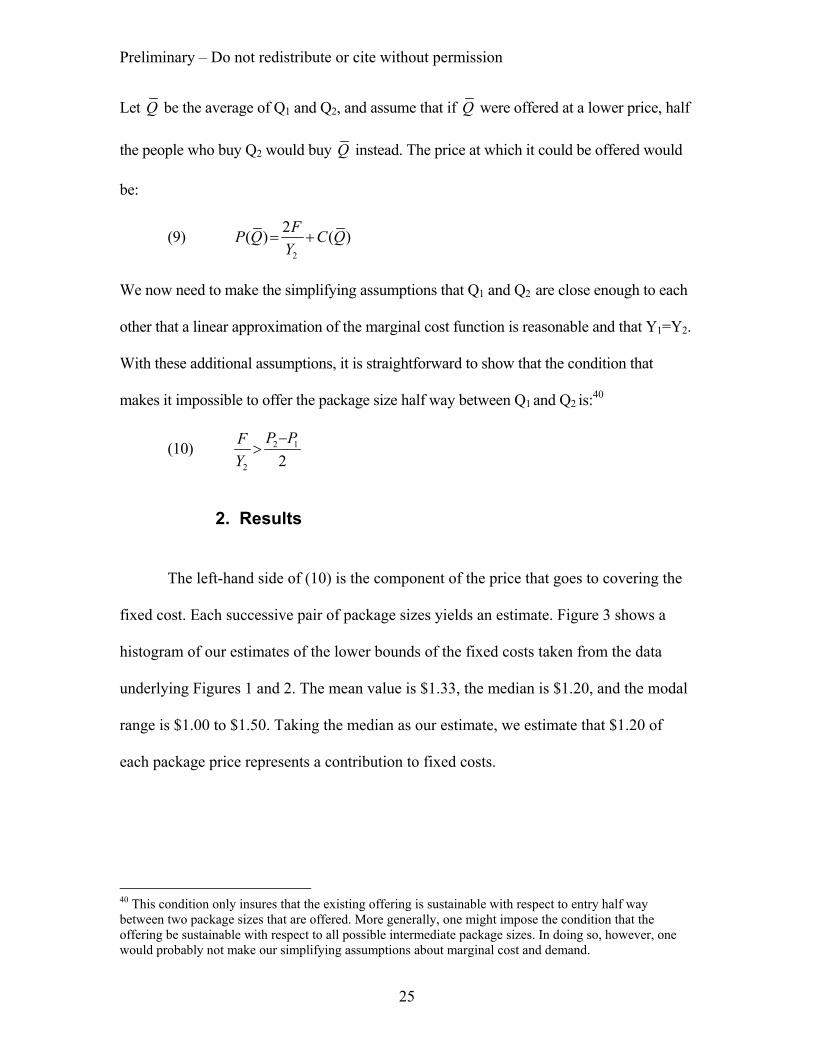
Let Q be the average of Q1 and Q2, and assume that if Q were offered at a lower price, half
the people who buy Q2 would buy Q instead. The price at which it could be offered would
be:
(9) 2
2( ) ( )FP Q C QY
= +
We now need to make the simplifying assumptions that Q1 and Q2 are close enough to each
other that a linear approximation of the marginal cost function is reasonable and that Y1=Y2.
With these additional assumptions, it is straightforward to show that the condition that
makes it impossible to offer the package size half way between Q1 and Q2 is:40
(10) 2 1
2 2P PF
Y−
>
2. Results
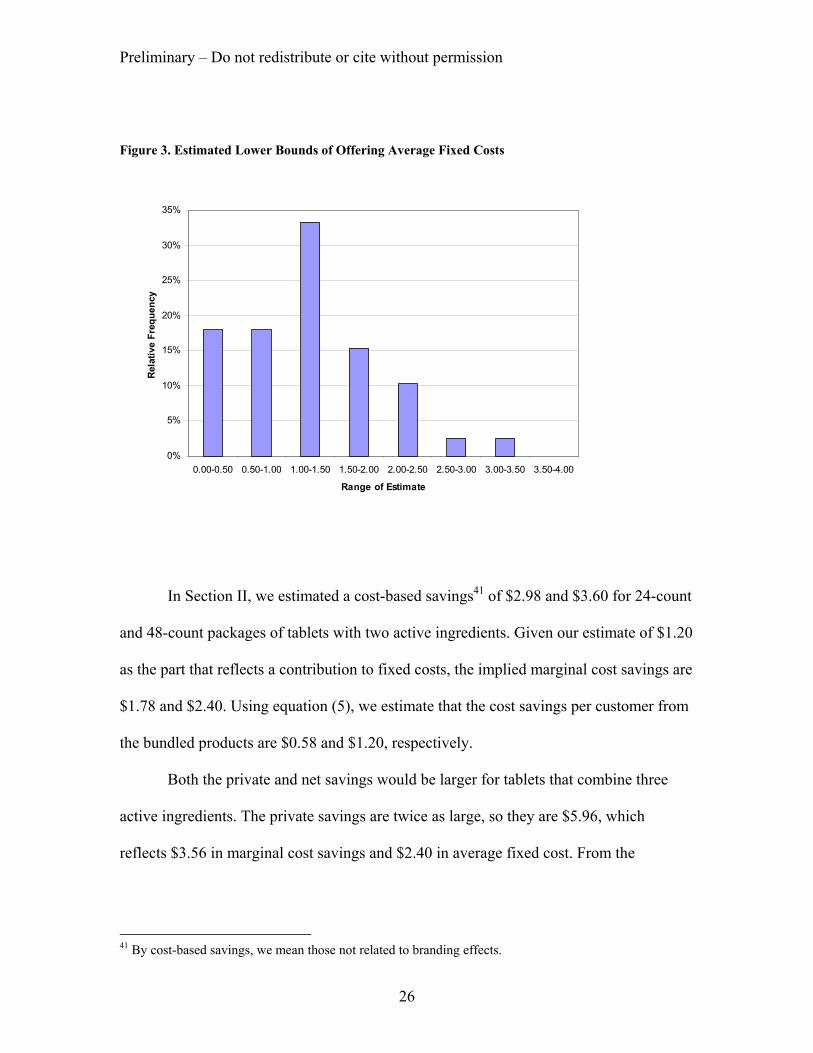
The left-hand side of (10) is the component of the price that goes to covering the
fixed cost. Each successive pair of package sizes yields an estimate. Figure 3 shows a
histogram of our estimates of the lower bounds of the fixed costs taken from the data
underlying Figures 1 and 2. The mean value is $1.33, the median is $1.20, and the modal
range is $1.00 to $1.50. Taking the median as our estimate, we estimate that $1.20 of
each package price represents a contribution to fixed costs.
40 This condition only insures that the existing offering is sustainable with respect to entry half way between two package sizes that are offered. More generally, one might impose the condition that the offering be sustainable with respect to all possible intermediate package sizes. In doing so, however, one would probably not make our simplifying assumptions about marginal cost and demand.
25
Preliminary – Do not redistribute or cite without permission
Figure 3. Estimated Lower Bounds of Offering Average Fixed Costs
0%
5%
10%
15%
20%
25%
30%
35%
0.00-0.50 0.50-1.00 1.00-1.50 1.50-2.00 2.00-2.50 2.50-3.00 3.00-3.50 3.50-4.00
Range of Estimate
Rela
tive
Freq
uenc
y
In Section II, we estimated a cost-based savings41 of $2.98 and $3.60 for 24-count
and 48-count packages of tablets with two active ingredients. Given our estimate of $1.20
as the part that reflects a contribution to fixed costs, the implied marginal cost savings are
$1.78 and $2.40. Using equation (5), we estimate that the cost savings per customer from
the bundled products are $0.58 and $1.20, respectively.
Both the private and net savings would be larger for tablets that combine three
active ingredients. The private savings are twice as large, so they are $5.96, which
reflects $3.56 in marginal cost savings and $2.40 in average fixed cost. From the
26
41 By cost-based savings, we mean those not related to branding effects.
Preliminary – Do not redistribute or cite without permission
marginal cost savings of $3.56, which represents a social benefit, we must subtract the
$1.20 average fixed cost of the additional offering. The net cost savings are $2.36.
The gains from bundling would also be larger for larger packages. For example,
for packages of 48 tablets, our regression equation implies private gains of $3.60 and
$7.20 for tablets that combine two ingredients and three ingredients, respectively. The net
effect on costs would then be savings of $1.20 and $3.60 for the bundled products.42
We can also use equation (8) to estimate whether there are cost savings from
offering the stand-alone products. Consider again the example in Table 1. The regression
results indicate that for people who want just acetaminophen, the marginal cost of buying
acetaminophen bundled with pseudoephedrine hydrochloride would be $0.065 ⋅ 24 =
$1.56. As this exceeds our estimate of the average fixed cost of $1.20, we estimate the
cost savings from having the stand-alone acetaminophen product to be $0.36. For
consumers who want just pseudoephedrine hydrochloride, the regression results imply
that the marginal cost of buying it bundled with acetaminophen would be $0.012 ⋅ 24 =
$0.29. As this incremental cost is less than the average fixed cost, it would lower costs
not to offer the 24-tablet package of just pseudoephendrine hydrochloride. In other
words, tying would lower costs.43
V. Summary and Conclusions
As we discuss in greater detail in Evans and Salinger (2004b), bundling and tying
law is unsettled in both the United States and Europe. We believe that policy makers
42 The calculations are $3.60 – 2 ⋅ $1.20 = $1.20 and $7.20 – 3 ⋅ $1.20 = $3.60. 43 Assuming that the groups that want just pseudoephedrine HCl and that want the bundled product are of equal size, tying would also be sustainable. By pricing the bundled product to attract the group that wants
27
Preliminary – Do not redistribute or cite without permission
would welcome insights from the economics literature on how to formulate a more
sensible policy. To date, however, that literature has been largely theoretical.44 If there is
to be an empirical literature on bundling and tying that informs policy, it must be based
on some underlying theory. We believe that the framework we have used in this paper
will prove to be superior to competing frameworks both because it is more tractable and
because it more nearly captures the essence of most of the bundling and tying that occurs
in practice.
When we apply our framework to over-the-counter pain relief and cold medicines,
we find a substantial bundle discount, which we interpreted within a cost-based model of
bundling and tying under competition. The model highlights the importance of
distinguishing between the effects of fixed and marginal costs. Either can give rise to a
bundle discount, but whether mixed bundling is the set of product offerings that minimizes
the cost of satisying different types of customers depends critically on the relative
contribution of each effect.
just the decongestant, the average fixed costs could be reduced from $1.20 to $0.60. This $0.60 price reduction would more than offset the $0.29 marginal cost associated with the extra active ingredient. 44 An exception is Crawford (2004).
28
Preliminary – Do not redistribute or cite without permission
29
References
Baumol, William J. 1982. “Contestable Markets: An Uprising in the Theory of
Industry Structure.” American Economic Review 72: 1-15. Baumol, William J., John C. Panzar, and Robert D. Willig. 1982. Contestable
Markets and the Theory of Industry Structure (New York: Harcourt Brace Jovanovich, Inc.).
Bresnahan, Timothy F. and Peter C. Reiss. 1987. “Do Entry Conditions Vary
Across Markets?” Brookings Papers on Economic Activity: Special Issue on Microeconomics (3): 833-871.
Crawford, Gregory. 2004. “The Discriminatory Incentives to Bundle: The Case of
Cable Television." University of Arizona, Working Paper. Ericson, Richard and Ariel Pakes. 1995. “Markov-Perfect Industry Dynamics: A
Framework for Empirical Work.” ReStud 1995: 53–82. Evans, David S. and Michael A. Salinger. 2004a. “The Role of Cost in
Determining When Firms Offer Bundles and Ties.” http://ssrn.com/abstract=555818. Evans, David S. and Michael A. Salinger. 2004b. “Why Do Firms Bundle and
Tie? Evidence from Competitive Markets and Implications for Tying Law.” Yale Journal on Regulation, Forthcoming, http://ssrn.com/abstract=550884.
Fershtman, Chaim and Ariel Pakes. 2000. “A Dynamic Oligopoly with Collusion
and Price Wars.” RAND Journal of Economics 31(2): 207-236. Miravete, Eugenio. 2004. “Are all those Calling Plans Really Necessary? The
Limited Gains From Complex Tariffs.” CEPR Discussion Paper No. 4237. http://ssrn.com/abstract=509009.
Morrison, Steven A. and Clifford Winston. 1987. “Empirical Implications and
Tests of the Contestability Hypothesis.” Journal of Law and Economics 30(1): 53-66.
Pakes, Ariel and Paul McGuire. 1994. “Computing Markov-Perfect Nash Equilibria: Numerical Implications of a Dynamic Differentiated Product Model.” RAND Journal of Economics 25(4): 555-589.
Pakes, Ariel, Michael Ostrovsky, and Steven T Berry. 2004. “Simple Estimators
for the Parameters of Discrete Dynamic Games (with Entry/Exit Samples).” NBER Working Paper No. W10506. http://ssrn.com/abstract=552302.
CESifo Working Paper Series (for full list see www.cesifo.de)
___________________________________________________________________________ 1237 M. Hashem Pesaran, Davide Pettenuzzo, and Allan Timmermann, Forecasting Time
Series Subject to Multiple Structural Breaks, July 2004 1238 Panu Poutvaara and Andreas Wagener, The Invisible Hand Plays Dice: Eventualities in
Religious Markets, July 2004 1239 Eckhard Janeba, Moral Federalism, July 2004 1240 Robert S. Chirinko, Steven M. Fazzari, and Andrew P. Meyer, That Elusive Elasticity:
A Long-Panel Approach to Estimating the Capital-Labor Substitution Elasticity, July 2004
1241 Hans Jarle Kind, Karen Helene Midelfart, Guttorm Schjelderup, Corporate Tax
Systems, Multinational Enterprises, and Economic Integration, July 2004 1242 Vankatesh Bala and Ngo Van Long, International Trade and Cultural Diversity: A
Model of Preference Selection, July 2004 1243 Wolfgang Eggert and Alfons J. Weichenrieder, On the Economics of Bottle Deposits,
July 2004 1244 Sören Blomquist and Vidar Christiansen, Taxation and Heterogeneous Preferences, July
2004 1245 Rafael Lalive and Alois Stutzer, Approval of Equal Rights and Gender Differences in
Well-Being, July 2004 1246 Paolo M. Panteghini, Wide vs. Narrow Tax Bases under Optimal Investment Timing,
July 2004 1247 Marika Karanassou, Hector Sala, and Dennis J. Snower, Unemployment in the
European Union: Institutions, Prices, and Growth, July 2004 1248 Engin Dalgic and Ngo Van Long, Corrupt Local Government as Resource Farmers: The
Helping Hand and the Grabbing Hand, July 2004 1249 Francesco Giavazzi and Guido Tabellini, Economic and Political Liberalizations, July
2004 1250 Yin-Wong Cheung and Jude Yuen, An Output Perspective on a Northeast Asia
Currency Union, August 2004 1251 Ralf Elsas, Frank Heinemann, and Marcel Tyrell, Multiple but Asymmetric Bank
Financing: The Case of Relationship Lending, August 2004
1252 Steinar Holden, Wage Formation under Low Inflation, August 2004 1253 Ngo Van Long and Gerhard Sorger, Insecure Property Rights and Growth: The Roles of
Appropriation Costs, Wealth Effects, and Heterogeneity, August 2004 1254 Klaus Wälde and Pia Weiß, International Competition, Slim Firms and Wage
Inequality, August 2004 1255 Jeremy S. S. Edwards and Alfons J. Weichenrieder, How Weak is the Weakest-Link
Principle? On the Measurement of Firm Owners’ Control Rights, August 2004 1256 Guido Tabellini, The Role of the State in Economic Development, August 2004 1257 François Larmande and Jean-Pierre Ponssard, EVA and the Controllability-congruence
Trade-off: An Empirical Investigation, August 2004 1258 Vesa Kanniainen and Jenni Pääkkönen, Anonymous Money, Moral Sentiments and
Welfare, August 2004 1259 Panu Poutvaara and Andreas Wagener, Why is the Public Sector More Labor-Intensive?
A Distortionary Tax Argument, August 2004 1260 Lars P. Feld and Stefan Voigt, Making Judges Independent – Some Proposals
Regarding the Judiciary, August 2004 1261 Joop Hartog, Hans van Ophem, and Simona Maria Bajdechi, How Risky is Investment
in Human Capital?, August 2004 1262 Thomas Eichner and Rüdiger Pethig, Efficient Nonanthropocentric Nature Protection,
August 2004 1263 David-Jan Jansen and Jakob de Haan, Look Who’s Talking: ECB Communication
during the First Years of EMU, August 2004 1264 David F. Bradford, The X Tax in the World Economy, August 2004 1265 Hans-Werner Sinn, Migration, Social Standards and Replacement Incomes. How to
Protect Low-income Workers in the Industrialized Countries against the Forces of Globalization and Market Integration, August 2004
1266 Wolfgang Leininger, Fending off one Means Fending off all: Evolutionary Stability in
Submodular Games, August 2004 1267 Antoine Bommier and Bertrand Villeneuve, Risk Aversion and the Value of Risk to
Life, September 2004 1268 Harrie A. A. Verbon and Lex Meijdam, Too Many Migrants, Too Few Services: A
Model of Decision-making on Immigration and Integration with Cultural Distance, September 2004
1269 Thomas Eichner and Rüdiger Pethig, Economic Land Use, Ecosystem Services and
Microfounded Species Dynamics, September 2004 1270 Federico Revelli, Performance Rating and Yardstick Competition in Social Service
Provision, September 2004 1271 Gerhard O. Orosel and Klaus G. Zauner, Vertical Product Differentiation When Quality
is Unobservable to Buyers, September 2004 1272 Christoph Böhringer, Stefan Boeters, and Michael Feil, Taxation and Unemployment:
An Applied General Equilibrium Approach, September 2004 1273 Assaf Razin and Efraim Sadka, Welfare Migration: Is the Net Fiscal Burden a Good
Measure of its Economics Impact on the Welfare of the Native-Born Population?, September 2004
1274 Tomer Blumkin and Volker Grossmann, Ideological Polarization, Sticky Information,
and Policy Reforms, September 2004 1275 Katherine Baicker and Nora Gordon, The Effect of Mandated State Education Spending
on Total Local Resources, September 2004 1276 Gabriel J. Felbermayr and Wilhelm Kohler, Exploring the Intensive and Extensive
Margins of World Trade, September 2004 1277 John Burbidge, Katherine Cuff and John Leach, Capital Tax Competition with
Heterogeneous Firms and Agglomeration Effects, September 2004 1278 Joern-Steffen Pischke, Labor Market Institutions, Wages and Investment, September
2004 1279 Josef Falkinger and Volker Grossmann, Institutions and Development: The Interaction
between Trade Regime and Political System, September 2004 1280 Paolo Surico, Inflation Targeting and Nonlinear Policy Rules: The Case of Asymmetric
Preferences, September 2004 1281 Ayal Kimhi, Growth, Inequality and Labor Markets in LDCs: A Survey, September
2004 1282 Robert Dur and Amihai Glazer, Optimal Incentive Contracts for a Worker who Envies
his Boss, September 2004 1283 Klaus Abberger, Nonparametric Regression and the Detection of Turning Points in the
Ifo Business Climate, September 2004 1284 Werner Güth and Rupert Sausgruber, Tax Morale and Optimal Taxation, September
2004
1285 Luis H. R. Alvarez and Erkki Koskela, Does Risk Aversion Accelerate Optimal Forest
Rotation under Uncertainty?, September 2004 1286 Giorgio Brunello and Maria De Paola, Market Failures and the Under-Provision of
Training, September 2004 1287 Sanjeev Goyal, Marco van der Leij and José Luis Moraga-González, Economics: An
Emerging Small World?, September 2004 1288 Sandro Maffei, Nikolai Raabe and Heinrich W. Ursprung, Political Repression and
Child Labor: Theory and Empirical Evidence, September 2004 1289 Georg Götz and Klaus Gugler, Market Concentration and Product Variety under Spatial
Competition: Evidence from Retail Gasoline, September 2004 1290 Jonathan Temple and Ludger Wößmann, Dualism and Cross-Country Growth
Regressions, September 2004 1291 Ravi Kanbur, Jukka Pirttilä and Matti Tuomala, Non-Welfarist Optimal Taxation and
Behavioral Public Economics, October 2004 1292 Maarten C. W. Janssen, José Luis Moraga-González and Matthijs R. Wildenbeest,
Consumer Search and Oligopolistic Pricing: An Empirical Investigation, October 2004 1293 Kira Börner and Christa Hainz, The Political Economy of Corruption and the Role of
Financial Institutions, October 2004 1294 Christoph A. Schaltegger and Lars P. Feld, Do Large Cabinets Favor Large
Governments? Evidence from Swiss Sub-Federal Jurisdictions, October 2004 1295 Marc-Andreas Mündler, The Existence of Informationally Efficient Markets When
Individuals Are Rational, October 2004 1296 Hendrik Jürges, Wolfram F. Richter and Kerstin Schneider, Teacher Quality and
Incentives: Theoretical and Empirical Effects of Standards on Teacher Quality, October 2004
1297 David S. Evans and Michael Salinger, An Empirical Analysis of Bundling and Tying:
Over-the-Counter Pain Relief and Cold Medicines, October 2004