
An economic impact comparative analysis of farmers’ markets in Michigan and Ontario
21
Journal of Agriculture, Food Systems, and Community Development ISSN: 2152-0801 online www.AgDevJournal.com Advance online publication 1 An economic impact comparative analysis of farmers’ markets in Michigan and Ontario Richard C. Sadler a * Department of Geography, University of Western Ontario Michael A. R. Clark b Old East Village Business Improvement Association Jason A. Gilliland a Department of Geography, University of Western Ontario Submitted September 28, 2012 / Revised December 22 and 24, 2012, February 15 and 23, 2013 / Accepted February 26, 2013 / Published online June 17, 2013 Citation: Sadler, R. C., Clark, M. A. R., & Gilliland, J. A. (2013). An economic impact comparative analysis of farmers’ markets in Michigan and Ontario. Journal of Agriculture, Food Systems, and Community Development. Advance online publication. http://dx.doi.org/10.5304/jafscd.2013.033.009 Copyright © 2013 by New Leaf Associates, Inc. Abstract Farmers’ markets play a vital role in local economic development by providing a site for local and small business incubation, creating an economic multi- plier effect to neighboring businesses, and recycling customer dollars within the community. While several studies have evaluated characteristics of farmers’ markets within single metropolitan areas, few have compared the impact of multiple markets in socioeconomically contrasting regions. This research compares shopping habits and economic impacts of customers at farmers’ markets in two North American cities: Flint, Michigan, and London, Ontario. Overall, 895 market visitors completed surveys. We conducted statistical and spatial analyses to identify differences between these markets. Though geographically proximate and similar in metropolitan size, the two cities differ greatly in recent economic develop- ment, social vitality, and public health indicators. The objectives of this article are to quantify the impact that each market has on its local economy and contextualize these impacts in light of the place-specific attributes of each market. Results indicate that customers come from a mix of urban and suburban locations, but that key urban areas do not draw a substantial share of * Corresponding author: +1-519-661-2111 x82817; [email protected] a Department of Geography, University of Western Ontario, 1151 Richmond Street, London, Ontario N6A 5C2 Canada b Old East Village Business Improvement Association, 316 Rectory Street, London, Ontario N5Y 5P8 Canada
Transcript of An economic impact comparative analysis of farmers’ markets in Michigan and Ontario
Journal of Agriculture, Food Systems, and Community Development ISSN: 2152-0801 online www.AgDevJournal.com
Advance online publication 1
An economic impact comparative analysis of farmers’ markets in Michigan and Ontario
Richard C. Sadler a *
Department of Geography, University of Western Ontario
Michael A. R. Clark b
Old East Village Business Improvement Association
Jason A. Gilliland a
Department of Geography, University of Western Ontario
Submitted September 28, 2012 / Revised December 22 and 24, 2012, February 15 and 23, 2013 / Accepted February 26, 2013 / Published online June 17, 2013
Citation: Sadler, R. C., Clark, M. A. R., & Gilliland, J. A. (2013). An economic impact comparative analysis of farmers’ markets in Michigan and Ontario. Journal of Agriculture, Food Systems, and Community Development. Advance online publication. http://dx.doi.org/10.5304/jafscd.2013.033.009
Copyright © 2013 by New Leaf Associates, Inc.
Abstract Farmers’ markets play a vital role in local economic development by providing a site for local and small business incubation, creating an economic multi-plier effect to neighboring businesses, and recycling customer dollars within the community. While several studies have evaluated characteristics of farmers’ markets within single metropolitan areas, few have compared the impact of multiple markets in socioeconomically contrasting regions.
This research compares shopping habits and economic impacts of customers at farmers’ markets in two North American cities: Flint, Michigan, and London, Ontario. Overall, 895 market visitors completed surveys. We conducted statistical and spatial analyses to identify differences between these markets. Though geographically proximate and similar in metropolitan size, the two cities differ greatly in recent economic develop-ment, social vitality, and public health indicators. The objectives of this article are to quantify the impact that each market has on its local economy and contextualize these impacts in light of the place-specific attributes of each market. Results indicate that customers come from a mix of urban and suburban locations, but that key urban areas do not draw a substantial share of
* Corresponding author: +1-519-661-2111 x82817; [email protected]
a Department of Geography, University of Western Ontario, 1151 Richmond Street, London, Ontario N6A 5C2 Canada
b Old East Village Business Improvement Association, 316 Rectory Street, London, Ontario N5Y 5P8 Canada
Journal of Agriculture, Food Systems, and Community Development ISSN: 2152-0801 online
www.AgDevJournal.com
2 Advance online publication
customers. Marketing efforts in nearby disadvan-taged neighborhoods, therefore, might yield new customers and increase multiplier effects within the neighborhoods. The London market drew slightly younger customers who shopped less frequently, while the Flint market drew an older crowd that attended more regularly. This may be attributable to the relative age of the markets, and certainly reflects the marketing push of each market’s managers. Given the opportunity to compare similarities and differences, much can be learned from each market in terms of opportunities for marketing, local economic development, and increased community vitality.
Keywords customer survey, farmers’ markets, food systems planning, kernel-density analysis, local economic development, multipliers
Introduction Farmers’ markets are becoming increasingly popular destinations among food shoppers in North America (Kaufman, 2004), yet few studies have documented the impact of these markets on local economies. Through the sale of local food, farmers’ markets can help ameliorate issues of food security, create community focal points for building social capital, serve as an alternative to the conventional food system, and strengthen local economies. The United States federal government has been keen to support farmers’ markets; US$10 million was recently set aside through the 2008 farm bill to support a Farmers Market Promotion Program (Wisconsin Ag Connection, 2011). Despite attention from the federal government, however, there has been a lack of recognition of the importance of local food systems by municipal governments. Limited attention and support has been directed to the development of farmers’ markets in particular, and food system planning in general (Pothukuchi & Kaufman, 2000). While the benefits of farmers’ markets are evident, work must continue to identify ways to improve their profitability, as well as to accomplish various social goals such as increasing food security and building the economy. Survey research has
been conducted on consumer food shopping behavior at the population level in the United States and Canada to assess large-scale trends (Zepeda & Li, 2006). One study indicated a strong trend toward more local food consumption (Adams & Salois, 2010), supporting the need for research to assess farmers’ markets and other integral parts of local food systems. On a smaller scale, there are likely many locally focused, unpublished studies of consumer spending habits at farmers’ markets that are designed to inform their management and growth (Brown & Miller, 2008). Few studies exist, however, which examine the similarities and differences among the customer shopping and spending habits at different markets (as noted by Brown & Miller, 2008). Such a com-parative approach will inform the development of each market, help to better meet customer expec-tations and thus improve market viability. The objective of this article is to evaluate customer shopping and spending habits and quantify the economic impact of farmers’ markets in two very different North American cities. This evaluation demonstrates and compares the impact of each market on its respective community, and ultimately provides justification for local or municipal government bodies to be involved in the food system.
Literature Review Evaluating farmers’ markets is important because of the close links among access to healthy food, food consumption, and food security, as well as the opportunity to elucidate the role that markets can play in providing healthy food and fostering health promotion and economic development. Currently, 12.6% of American households and 7.0% of Canadian households are food insecure (Nord & Hopwood, 2008, p. iii), contributing to an increase in nutrition-related ailments such as obesity and compromised psychosocial functioning (Olson, 1999). Farmers’ markets located in low-income or minority neighborhoods can help these popula-tions procure a healthy diet by improving access to nutritious foods (Larsen & Gilliland, 2009; Neff, Palmer, McKenzie, & Lawrence, 2008). Social benefits are also offered by farmers’ markets by
Journal of Agriculture, Food Systems, and Community Development ISSN: 2152-0801 online www.AgDevJournal.com
Advance online publication 3
creating community gathering places where people can congregate, socialize, and develop a sense of neighborhood security and pride (Blank, 1996; Feenstra, 2002). Farmers’ markets convey various economic benefits, including opportunities for small family farms to maintain profitability (Hinrichs, 2000). The economic effects of food system globalization have garnered significant criticism (Morgan, Marsden, & Murdoch, 2006; Murdoch, Marsden, & Banks, 2000). Many farmers who work under contract to large agri-business conglomerates retain a lower percentage of the food dollar (Kaufman, 2004). Agri-businesses, aided by current agricultural subsidies, often promote value-added products which are high in sugar and fat, and for which farmers will receive even less of the food dollar (Nestle, 2003; Niles & Roff, 2008). But farmers’ markets facilitate the direct farmer-to-consumer sale of farm goods, doubling farmers’ gross return by eliminating steps between producer and consumer (Kaufman, 2004). Markets bring together small and medium-sized farmers, producers, and brokers who can exchange operating and marketing strategies (Econsult Corporation, 2007). Vendors are able to interact directly with their customers to determine the variety of products most demanded by local consumers and educate consumers about different types of healthy foods. Farmers’ markets also serve as low-risk, low-cost incubators for small entrepre-neurs to grow existing or test new businesses before expanding to permanent locations (Cameron, 2007; Guthrie, Guthrie, Lawson, & Cameron, 2006; Hinrichs, Gillespie, & Feenstra, 2004). The increased popularity among conventional food retailers to emulate farmers’ markets by expanding their offerings of local foods demon-strates the innovative role that farmers’ markets play in capturing and nurturing local food networks (Abatekassa & Peterson, 2011). Yet farmers’ markets remain distinct from the conventional food production and distribution system in many ways. In contrast to the ownership model of conventional food retailers, many farmers’ markets are driven by municipalities, local economic development corporations, or grassroots move-
ments by local farmers to create a direct-to-consumer avenue for food sales. These organiza-tions have a clear stake in helping strengthen the local food system in their communities and subsequently in helping with the revitalization and development of well-functioning, healthy and sustainable communities (Pothukuchi, 2009). Given the need for farmers’ markets to be engaged in their local communities and the multiple benefits they provide, farmers’ markets play an important leadership role in delivering new and alternative products to consumers, in re-forming the food system, and in local food system planning (Brown & Miller, 2008). Food system planning merits inclusion in the agenda of local governments because it impacts many aspects of society, including public health, social justice, economic development, and water and land use (Morgan, 2009). An increased aware-ness of the food system by planners and public health practitioners has contributed to the creation of many food policy councils (Morgan, 2009). Yet despite this growth, food system planning is not often included in community planning documents (Pothukuchi & Kaufman, 2000). One recent excep-tion was initiated by a public health department in Waterloo, Ontario, Canada, which worked with planners to include food systems in the master planning process by citing the various health, social, economic, and environmental benefits to building a stronger local food economy (Desjardins, Lubczynski, & Xuereb, 2011). To quantify the impact of farmers’ markets, and thus suggest reasons for their inclusion in local food and economic development planning, we conducted surveys at two farmers’ markets in Michigan and Ontario. Numerous studies have evaluated customer characteristics at farmers’ markets in North America; sample sizes in these studies range between 200 and 450 responses. Most of these surveys collect demographic and behavioral data such as average money and time spent at the market and products purchased. Some of these studies have also collected opinions about the importance of various attributes of markets (Elepu & Mazzocco, 2010; Kezis, Gwebu, Peavey, & Cheng, 1998), as well as expectations of the type and quality of goods available (Bond & Feagan,
Journal of Agriculture, Food Systems, and Community Development ISSN: 2152-0801 online
www.AgDevJournal.com
4 Advance online publication
2013; Govindasamy, Zurbriggen, Italia, Adelaja, Nitzsche, & VanVranken, 1998; Onianwa, Mojica, & Wheelock, 2006). This study differs in several key elements: first, a large sample size (N=895) provides greater statistical certainty in significance testing; second, the study uses a modified economic impact multi-plier to estimate the impact of two markets in their local regions; third, advanced spatial analysis is presented to pinpoint “hot spots” regarding geo-graphic patterns of customer spending character-istics; and finally, the study offers a comparison of two markets situated across the U.S./Canada border from each other. These characteristics and differences can be used by other communities and planners interested in quantifying the impact of markets and justifying the inclusion of local food systems in community development plans. The spatial analysis is a valuable tool for customer survey analyses since it addresses questions on consumer point of origin and spending patterns.
Research Context Flint, Michigan, U.S., and London, Ontario, Canada, are two midsized urban areas in the Great Lakes region of North America. Although they are relatively close in proximity (130 miles or 209 km apart) and have similar metropolitan populations (around 450,000 inhabitants), their presence in two different countries with varying social and econom-ic contexts has created two very different cities. London’s urban form is relatively compact for a North American city, with little “leapfrogging” of development, whereby new construction is encouraged within an existing growth boundary and at allowable development densities of up to 12 housing units per acre (City of London, 2006). Many municipalities were amalgamated in the 1990s as a result of provincial legislation that cen-tralized development approvals and incentivized compact development (Vojnovic & Poel, 2000). Further intensification has been aided by histori-cally low crime and unemployment rates, which help create a favorable environment for compact development (Hayek, Arku, & Gilliland, 2010; Ontario Court of Justice, 2011). As a result, public transportation operates relatively effectively (bus service is available in every neighborhood) and
basic goods and services are available in most neighborhoods. Flint’s urban form, conversely, is a classic model of a declining post-industrial city. The city has lost 41% of its total employment base since 1980, having suffered considerably from the exodus of the automotive industry (Jacobs, 2009). Consistent with research findings by Palumbo, Sacks, and Wasylenko (1990), the presence of higher crime rates within the city of Flint during the 1970s and 1980s facilitated the process of extreme leapfrog development and central-city abandonment. This has had the effect of creating a highly dispersed urban area. Municipal governance is fragmented into several dozen cities, townships, and villages, each in competition with one another for economic development (Zheng, 2009). This pattern of decentralization has been exacerbated by continuing social issues related to unemployment, drug use, and gang violence (Federal Bureau of Investigation, n.d.). The result is a low-density city where those without access to an automobile can have great difficulties in accessing basic goods, services, and employment. Both of the case study regions support several farmers’ markets. In Flint, most farmers’ markets are in suburban municipalities. In London, two permanent markets in the urban core are sur-rounded by temporary markets within the urban area, and several more in the metropolitan area. The specific markets examined in this article are the Flint Farmers’ Market and the Western Fair Farmers’ and Artisans’ Market in London, selected for their location in socioeconomically distressed urban neighborhoods and their reputations as markets inclusive of the local population (personal communications, market managers, 2012). The Flint Farmers’ Market is the main market for the city of Flint. It has run continuously in the same location near downtown since 1940 (personal communication, market manager, 2012), and is open three days a week (as of 2012). According to market officials, the early summer months see the highest local attendance. Vendors include local and organic produce sellers (including farmers from inside the city limits), as well as nonlocal vendors and artisans. The primary stated vision of the Flint Farmers’ Market is to help rebuild Flint by serving
Journal of Agriculture, Food Systems, and Community Development ISSN: 2152-0801 online www.AgDevJournal.com
Advance online publication 5
as a hub for the growing local food system and thereby encouraging the consumption of healthy foods (personal communication, market manager, 2012). Reflecting the growth of local food in the area, seven suburban municipalities now have their own independently run farmers’ markets, and two satellite markets operated in Flint during the summer of 2012 (personal communication, market manager, 2012). London’s Western Fair Market, by contrast, has only been open since 2006 (personal commu-nication, market manager, 2012). It is located in London’s Old East Village, a low-income neigh-borhood immediately east of the downtown core. The market is fully open on Saturdays year-round, but some vendors operate every day. According to market officials, the late winter months see the highest local attendance. While the mix of vendors is similar to the Flint Farmers’ Market, the primary goal of this market is to foster a sense of commu-nity, as well as to generate local economic develop-ment by serving as a business incubator for small agricultural and artisanal businesses. This is part of a larger goal to increase the quality of life of neigh-borhood residents by providing greater access to healthy food, supporting local businesses, and generating local employment (personal commu-nication, market manager, 2012). This economic development model is evident in the market’s success at establishing two seasonal satellite markets in other parts of the city, as well as the expansion of a number of vendors to retail locations outside the market. Despite differences in regional context, market age, and vendor make-up, the markets are similar in several ways. They are both located in, and fulfill the basic needs of, residents in disadvantaged neighborhoods while attracting customers from across their respective urban areas. In London, the Old East Village has been a historical center for industry, but has since fallen on hard times due to deindustrialization. In Flint’s situation, the entire city was heavily reliant on industry for its success throughout the 20th century. Thus, the area sur-rounding each market is primarily composed of working-class neighborhoods and former industrial properties. Each market serves as a community focal point for its neighborhood, where residents
congregate and hold community events, and both exist to make their communities better by pro-viding residents with an option for healthy food. In light of these differences and similarities and to better understand the characteristics of the markets, a customer survey was run at each market during 2011.
Methods Customer surveys were administered at each market once per week for 3 weeks (on Saturdays) in London in February 2011 and in Flint in June 2011. For London, the market is busiest during the Christmas season and least busy in the summer, due to the proliferation of outdoor markets else-where in the urban area. In Flint, the market is slowest in the winter and busiest at harvest time in the late summer. Based on these characteristics and on consultation with the market managers, Febru-ary (for London) and June (for Flint) are consid-ered “average” months in terms of sales. Throughout each survey day, market customers were asked randomly to participate in the survey, following sampling methods of past farmers’ market studies (Elepu, 2005; Govindasamy et al., 1998; Onianwa, Mojica, & Wheelock, 2006; Smithers, Lamarche, & Joseph, 2008). Customers were excluded from participation if they were under 19 years of age. Surveyors asked that only one survey be completed per family or group, typically by the primary shopper in the household. The refusal rate was below 50% at each market, and did not vary substantially from the customer profile of survey participants. All customer data for each market was compiled into a single database and analyzed using SPSS statistical software and geographical information system (GIS) software. Pretested questions from Estimating the Eco-nomic Impact of Public Markets (Econsult Corpora-tion, 2007) were adapted to develop a question-naire to understand the customer profile and shopping behaviors at each market. Supplementary questions were developed in consultation with farmers’ market officials (see questions in the appendix). Customer counts were conducted by positioning two observers at every entrance to record the overall number of visitors entering the market. By combining these counts with data
Journal of Agriculture, Food Systems, and Community Development ISSN: 2152-0801 online
www.AgDevJournal.com
6 Advance online publication
gathered on purchasing patterns, it is possible to estimate the overall economic impact of each market using the pretested evaluation methodology (Econsult Corporation, 2007). Compared to pre-vious work, this research collected a much larger sample size: over 400 participants each from the two different markets (N=895). The customer survey tool and analytical procedures in this study employ methods used in a California farmers’ market study (Wolf & Berrenson, 2003). This research employed chi-squared tests to determine if significant differences existed between subgroups attending the same market, and between customers attending either the Flint or London market. Market segments were defined from this analysis, which will be useful for each market in planning for expansion and marketing campaigns. The economic impact of the markets was measured using a modified economic impact multiplier developed by the Project for Public Spaces (Econsult Corporation, 2007), itself derived from the Regional Input/Output Multiplier (U.S. Bureau of Economic Analysis, 1997). This previ-ously validated approach assumes multipliers of 1.6 for producers, 1.31 for nonproducers, 1.65 for prepared food vendors, and 0.66 for other vendors. This means, for instance, that for every dollar spent at a local producer’s booth at a farmers’ market, an additional $0.60 will be recycled within the com-munity. These values were used to calculate the relative impact of each market by quantifying how much money is spent or recycled within the community based on shopping characteristics at the markets. This study also advances knowledge on consumer behavior for farmers’ markets through the novel application of advanced spatial analysis in a GIS to determine the existence of geographic clusters in purchasing patterns. For each customer, purchasing habits were classified by one of the 8 categories included in the survey (e.g. coffee and drinks, fruits and vegetables, etc.). The total dollar value spent was also included as a key variable for “weighting.” Then the corresponding dollar value spent on each category (or overall) was used to weight features in a type of spatial analysis in GIS called “kernel density.” Spatial analysis was
possible because survey data for each respondent could be located in geographic space (either by the respondent’s nearest street intersection [USA] or six-digit postal code [Canada]). By combining the amount spent on various items with the home location of the respondent, relative hot spots were identified from which customers of a particular type are more likely to originate. The result is a rasterized (or pixelated) surface with predicted values for any region on the map in GIS (Environ-mental Systems Research Institute [ESRI], 2011). Past studies have used kernel density to estimate the density of grocery stores or homicides per square mile (Bader, Purciel, Yousefzadeh, & Neckerman, 2010), but did not use the weighting function to determine densities based on specific characteristics of locational variables. The use of kernel-density analysis to model spending patterns in geographic space is a novel application for studies using customer surveys as a primary data source. Questions regarding individual socioeconomic characteristics were deliberately omitted from the survey to enhance response rates. To account for socioeconomic characteristics, a GIS was used to geocode and overlay individual respondent addresses on a map of neighborhood-level socio-economic distress that was calculated for each city. The socioeconomic distress index, which considers four variables from the U.S. and Canadian censuses (unemployment, lone parenthood, low educational attainment, and low income), is used to predict areas of relatively high disadvantage by adding together an unweighted sum of z-scores for each of the four variables. Using this data and the spatial join function in ArcGIS, respondents can be classified by level of the socioeconomic distress within their neighborhood to determine whether the customer profiles at each market are inclusive of disadvantaged populations. Indices for Flint and London compiled for past research (Larsen & Gilliland, 2009; Sadler et al., 2012) have been re-created for this research.
Results A total of 405 surveys were completed by adults at the Flint market, while patron counts estimated that 9,197 people (defined as children old enough
Journal of Agriculture, Food Systems, and Community Development ISSN: 2152-0801 online www.AgDevJournal.com
Advance online publication 7
to walk and older) visited the market over the 3 weeks of data collection. Meanwhile, 490 surveys were collected in London, and patron counts estimated that 7,211 people visited the market over the 3 weeks of data collection.
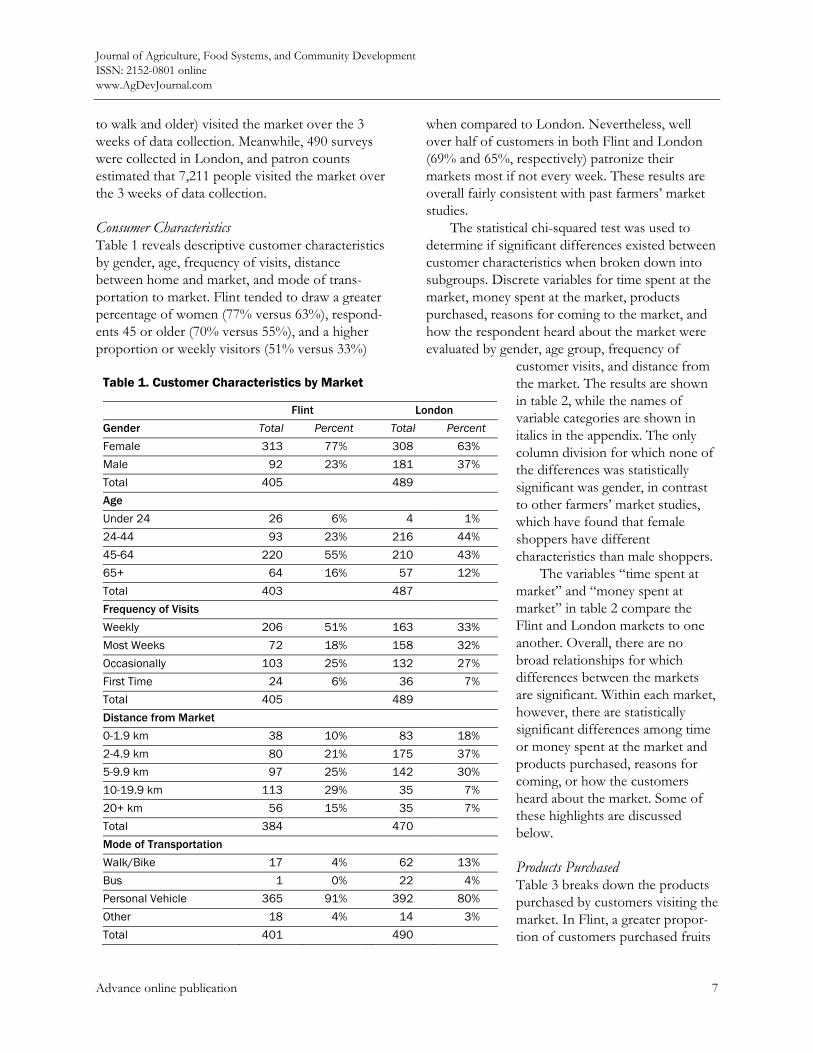
Consumer Characteristics Table 1 reveals descriptive customer characteristics by gender, age, frequency of visits, distance between home and market, and mode of trans-portation to market. Flint tended to draw a greater percentage of women (77% versus 63%), respond-ents 45 or older (70% versus 55%), and a higher proportion or weekly visitors (51% versus 33%)
when compared to London. Nevertheless, well over half of customers in both Flint and London (69% and 65%, respectively) patronize their markets most if not every week. These results are overall fairly consistent with past farmers’ market studies. The statistical chi-squared test was used to determine if significant differences existed between customer characteristics when broken down into subgroups. Discrete variables for time spent at the market, money spent at the market, products purchased, reasons for coming to the market, and how the respondent heard about the market were evaluated by gender, age group, frequency of
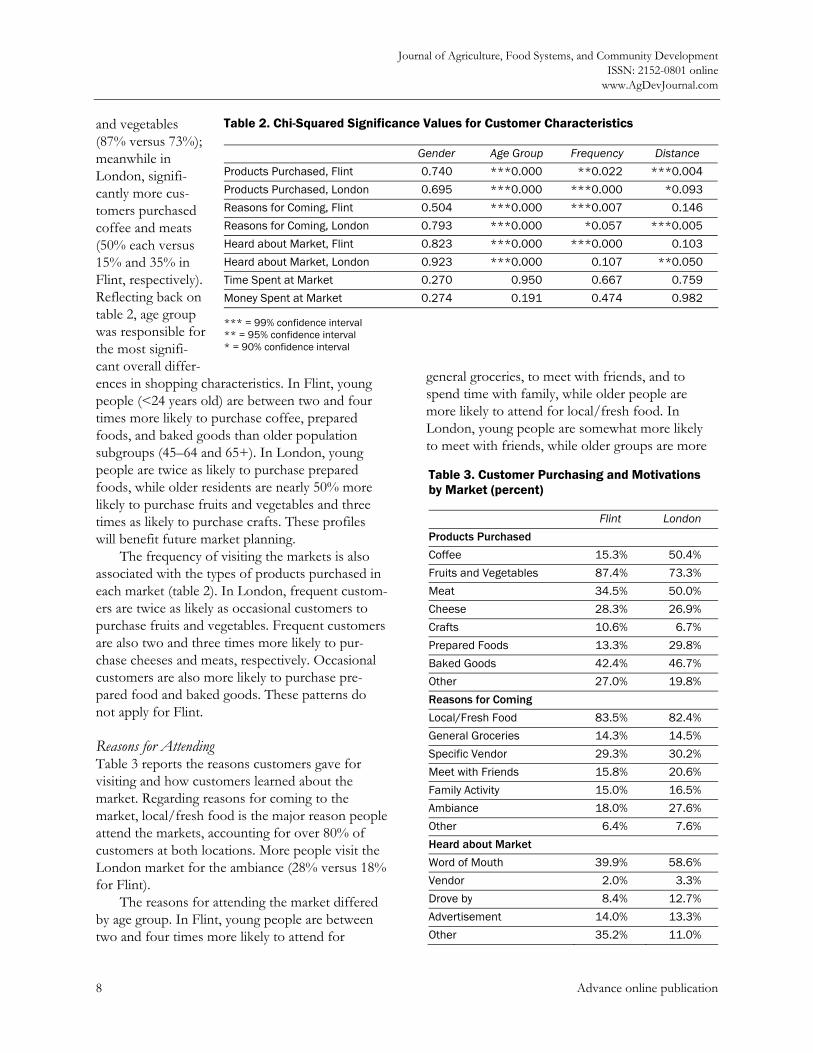
customer visits, and distance from the market. The results are shown in table 2, while the names of variable categories are shown in italics in the appendix. The only column division for which none of the differences was statistically significant was gender, in contrast to other farmers’ market studies, which have found that female shoppers have different characteristics than male shoppers. The variables “time spent at market” and “money spent at market” in table 2 compare the Flint and London markets to one another. Overall, there are no broad relationships for which differences between the markets are significant. Within each market, however, there are statistically significant differences among time or money spent at the market and products purchased, reasons for coming, or how the customers heard about the market. Some of these highlights are discussed below.
Products Purchased Table 3 breaks down the products purchased by customers visiting the market. In Flint, a greater propor-tion of customers purchased fruits
Table 1. Customer Characteristics by Market
Flint London
Gender Total Percent Total Percent
Female 313 77% 308 63%
Male 92 23% 181 37%
Total 405 489
Age
Under 24 26 6% 4 1%
24-44 93 23% 216 44%
45-64 220 55% 210 43%
65+ 64 16% 57 12%
Total 403 487
Frequency of Visits
Weekly 206 51% 163 33%
Most Weeks 72 18% 158 32%
Occasionally 103 25% 132 27%
First Time 24 6% 36 7%
Total 405 489
Distance from Market
0-1.9 km 38 10% 83 18%
2-4.9 km 80 21% 175 37%
5-9.9 km 97 25% 142 30%
10-19.9 km 113 29% 35 7%
20+ km 56 15% 35 7%
Total 384 470
Mode of Transportation
Walk/Bike 17 4% 62 13%
Bus 1 0% 22 4%
Personal Vehicle 365 91% 392 80%
Other 18 4% 14 3%
Total 401 490
Journal of Agriculture, Food Systems, and Community Development ISSN: 2152-0801 online
www.AgDevJournal.com
8 Advance online publication
and vegetables (87% versus 73%); meanwhile in London, signifi-cantly more cus-tomers purchased coffee and meats (50% each versus 15% and 35% in Flint, respectively). Reflecting back on table 2, age group was responsible for the most signifi-cant overall differ-ences in shopping characteristics. In Flint, young people (<24 years old) are between two and four times more likely to purchase coffee, prepared foods, and baked goods than older population subgroups (45–64 and 65+). In London, young people are twice as likely to purchase prepared foods, while older residents are nearly 50% more likely to purchase fruits and vegetables and three times as likely to purchase crafts. These profiles will benefit future market planning. The frequency of visiting the markets is also associated with the types of products purchased in each market (table 2). In London, frequent custom-ers are twice as likely as occasional customers to purchase fruits and vegetables. Frequent customers are also two and three times more likely to pur-chase cheeses and meats, respectively. Occasional customers are also more likely to purchase pre-pared food and baked goods. These patterns do not apply for Flint.
Reasons for Attending Table 3 reports the reasons customers gave for visiting and how customers learned about the market. Regarding reasons for coming to the market, local/fresh food is the major reason people attend the markets, accounting for over 80% of customers at both locations. More people visit the London market for the ambiance (28% versus 18% for Flint). The reasons for attending the market differed by age group. In Flint, young people are between two and four times more likely to attend for
general groceries, to meet with friends, and to spend time with family, while older people are more likely to attend for local/fresh food. In London, young people are somewhat more likely to meet with friends, while older groups are more
Table 2. Chi-Squared Significance Values for Customer Characteristics
Gender Age Group Frequency Distance
Products Purchased, Flint 0.740 ***0.000 **0.022 ***0.004
Products Purchased, London 0.695 ***0.000 ***0.000 *0.093
Reasons for Coming, Flint 0.504 ***0.000 ***0.007 0.146
Reasons for Coming, London 0.793 ***0.000 *0.057 ***0.005
Heard about Market, Flint 0.823 ***0.000 ***0.000 0.103
Heard about Market, London 0.923 ***0.000 0.107 **0.050
Time Spent at Market 0.270 0.950 0.667 0.759
Money Spent at Market 0.274 0.191 0.474 0.982
*** = 99% confidence interval ** = 95% confidence interval * = 90% confidence interval
Table 3. Customer Purchasing and Motivations by Market (percent)
Flint London
Products Purchased
Coffee 15.3% 50.4%
Fruits and Vegetables 87.4% 73.3%
Meat 34.5% 50.0%
Cheese 28.3% 26.9%
Crafts 10.6% 6.7%
Prepared Foods 13.3% 29.8%
Baked Goods 42.4% 46.7%
Other 27.0% 19.8%
Reasons for Coming
Local/Fresh Food 83.5% 82.4%
General Groceries 14.3% 14.5%
Specific Vendor 29.3% 30.2%
Meet with Friends 15.8% 20.6%
Family Activity 15.0% 16.5%
Ambiance 18.0% 27.6%
Other 6.4% 7.6%
Heard about Market
Word of Mouth 39.9% 58.6%
Vendor 2.0% 3.3%
Drove by 8.4% 12.7%
Advertisement 14.0% 13.3%
Other 35.2% 11.0%
Journal of Agriculture, Food Systems, and Community Development ISSN: 2152-0801 online www.AgDevJournal.com
Advance online publication 9
likely to attend to spend time with family. The frequency with which respondents visit the market is also correlated with the reasons for coming to the market and how the customers heard about the market. In both markets, custo-mers who attend more frequently are more likely to attend for the ambiance. In Flint, frequent custo-mers are also more likely to visit for general gro-ceries. Those attending less frequently are more likely to visit as a family occasion. This trend is somewhat reversed in London, with customers who attend frequently coming to visit with family. Respondents indicated that they originally heard about the markets in significantly different ways. In Flint, 40% marked “word of mouth,” and 35% marked “other” and indicated that they had known about the market all their lives. In London, 59% marked “word of mouth.” In Flint, many first-time visitors responded that they came because they noticed the market when they drove by. This is not the case in London, as most first-time visitors were more likely to come due to word of mouth. Age group is also a predictor of the means by which residents initially heard about their market. Many young people discovered the market by driving by, while the majority of older people responded that they had known about the market their whole lives. In London, it appears that advertising is more influential among the older populations, while young people are attracted by word of mouth.
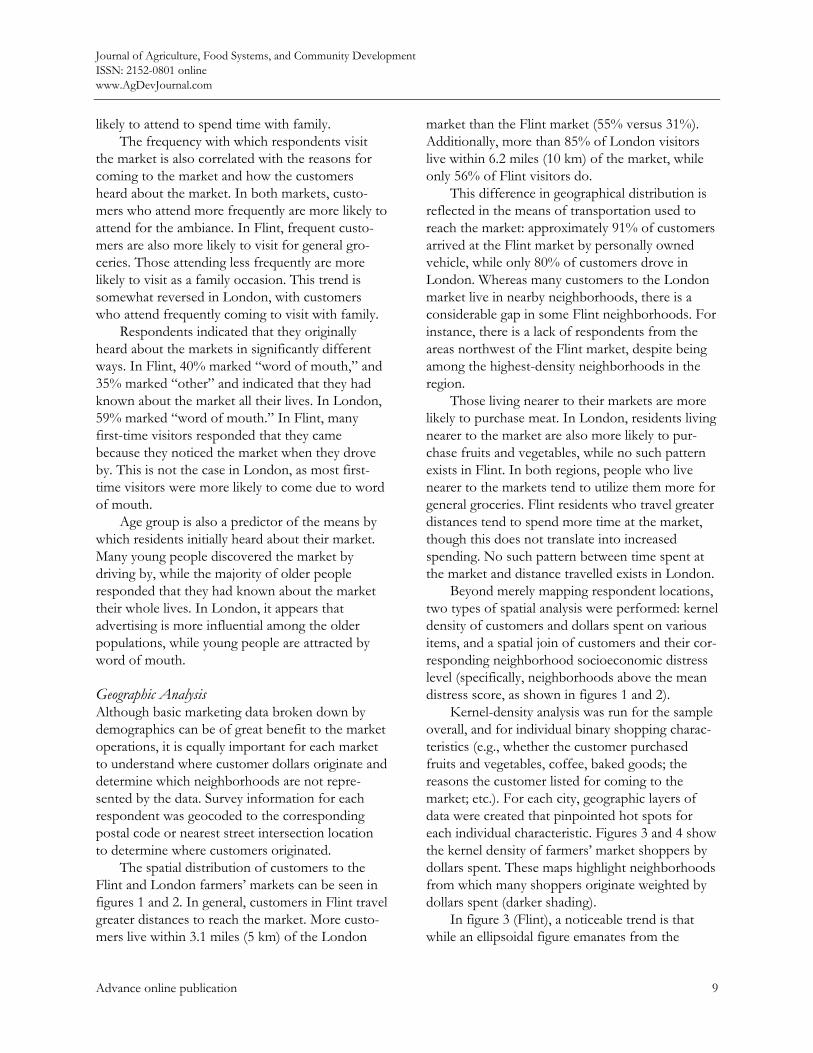
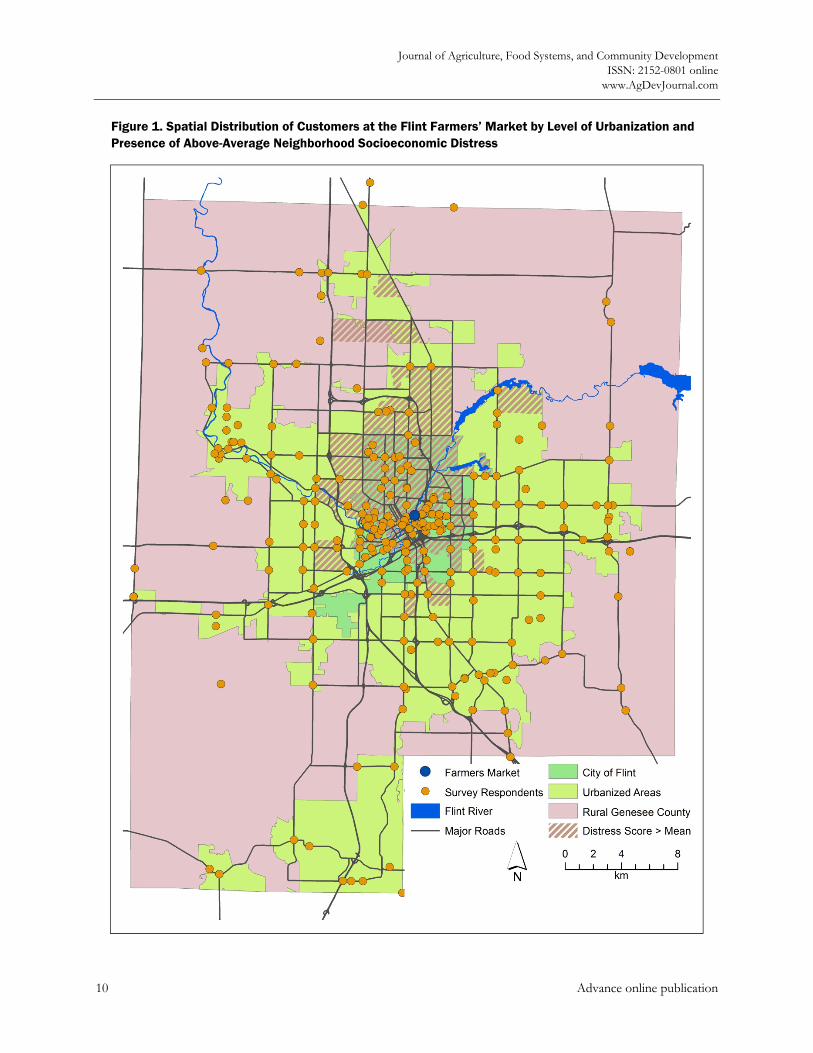
Geographic Analysis Although basic marketing data broken down by demographics can be of great benefit to the market operations, it is equally important for each market to understand where customer dollars originate and determine which neighborhoods are not repre-sented by the data. Survey information for each respondent was geocoded to the corresponding postal code or nearest street intersection location to determine where customers originated. The spatial distribution of customers to the Flint and London farmers’ markets can be seen in figures 1 and 2. In general, customers in Flint travel greater distances to reach the market. More custo-mers live within 3.1 miles (5 km) of the London
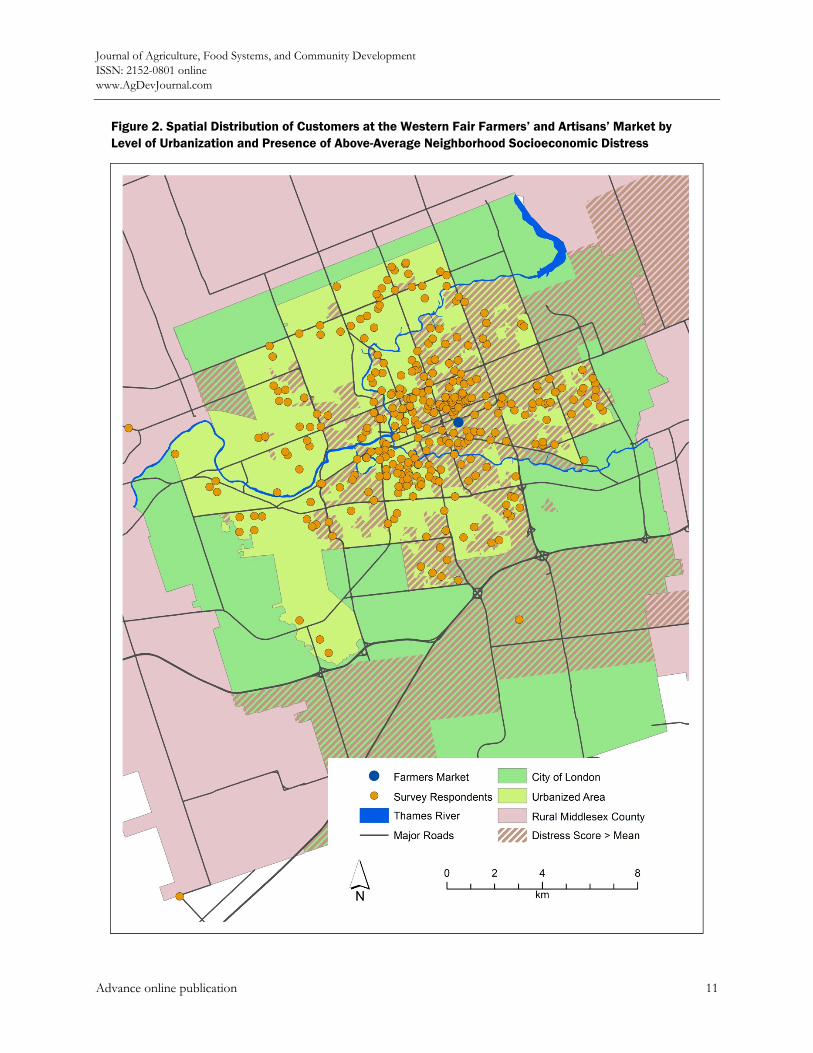
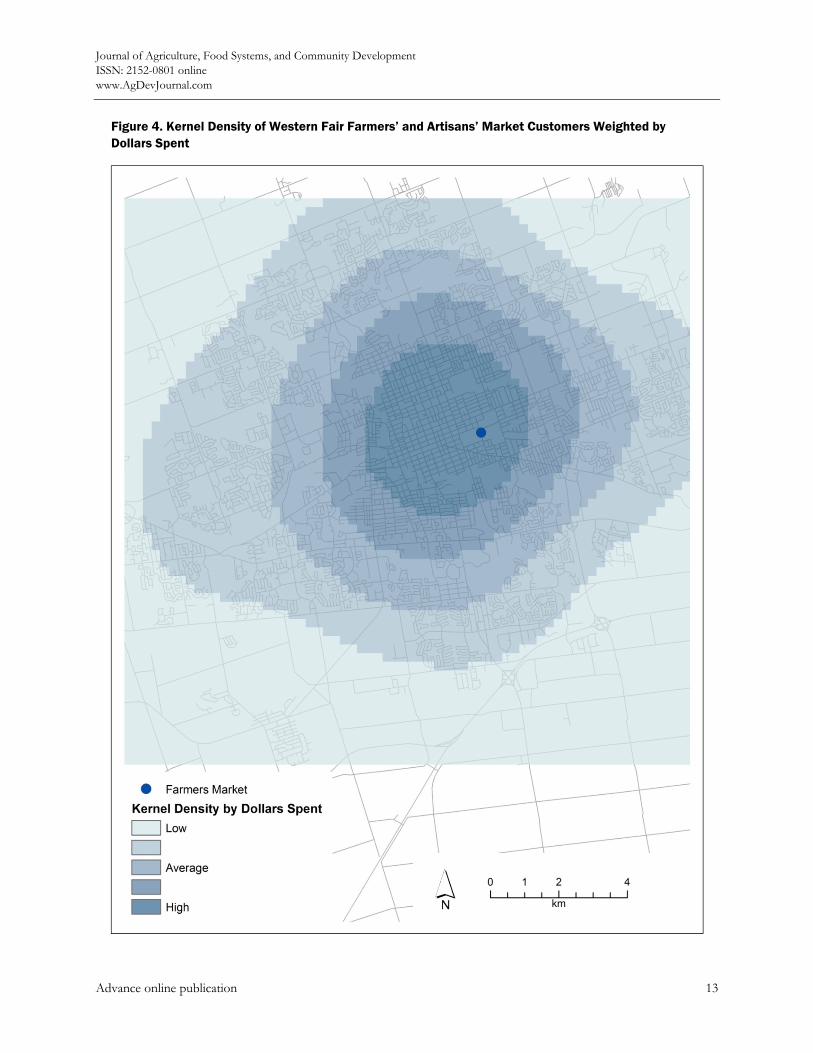
market than the Flint market (55% versus 31%). Additionally, more than 85% of London visitors live within 6.2 miles (10 km) of the market, while only 56% of Flint visitors do. This difference in geographical distribution is reflected in the means of transportation used to reach the market: approximately 91% of customers arrived at the Flint market by personally owned vehicle, while only 80% of customers drove in London. Whereas many customers to the London market live in nearby neighborhoods, there is a considerable gap in some Flint neighborhoods. For instance, there is a lack of respondents from the areas northwest of the Flint market, despite being among the highest-density neighborhoods in the region. Those living nearer to their markets are more likely to purchase meat. In London, residents living nearer to the market are also more likely to pur-chase fruits and vegetables, while no such pattern exists in Flint. In both regions, people who live nearer to the markets tend to utilize them more for general groceries. Flint residents who travel greater distances tend to spend more time at the market, though this does not translate into increased spending. No such pattern between time spent at the market and distance travelled exists in London. Beyond merely mapping respondent locations, two types of spatial analysis were performed: kernel density of customers and dollars spent on various items, and a spatial join of customers and their cor-responding neighborhood socioeconomic distress level (specifically, neighborhoods above the mean distress score, as shown in figures 1 and 2). Kernel-density analysis was run for the sample overall, and for individual binary shopping charac-teristics (e.g., whether the customer purchased fruits and vegetables, coffee, baked goods; the reasons the customer listed for coming to the market; etc.). For each city, geographic layers of data were created that pinpointed hot spots for each individual characteristic. Figures 3 and 4 show the kernel density of farmers’ market shoppers by dollars spent. These maps highlight neighborhoods from which many shoppers originate weighted by dollars spent (darker shading). In figure 3 (Flint), a noticeable trend is that while an ellipsoidal figure emanates from the
Journal of Agriculture, Food Systems, and Community Development ISSN: 2152-0801 online
www.AgDevJournal.com
10 Advance online publication
Figure 1. Spatial Distribution of Customers at the Flint Farmers’ Market by Level of Urbanization and Presence of Above-Average Neighborhood Socioeconomic Distress
Journal of Agriculture, Food Systems, and Community Development ISSN: 2152-0801 online www.AgDevJournal.com
Advance online publication 11
Figure 2. Spatial Distribution of Customers at the Western Fair Farmers’ and Artisans’ Market by Level of Urbanization and Presence of Above-Average Neighborhood Socioeconomic Distress
Journal of Agriculture, Food Systems, and Community Development ISSN: 2152-0801 online
www.AgDevJournal.com
12 Advance online publication
Figure 3. Kernel Density of Flint Farmers’ Market Customers Weighted by Dollars Spent
Journal of Agriculture, Food Systems, and Community Development ISSN: 2152-0801 online www.AgDevJournal.com
Advance online publication 13
Figure 4. Kernel Density of Western Fair Farmers’ and Artisans’ Market Customers Weighted by Dollars Spent
Journal of Agriculture, Food Systems, and Community Development ISSN: 2152-0801 online
www.AgDevJournal.com
14 Advance online publication
farmers’ market, an additional peak in customer dollars is spent by residents of Flushing, a nearby city to the west. In figure 4, in contrast, London does not have any distant suburban settlements with a noticeably high level of customer dollars spent. The pattern in London is simply an ellipsoid around the location of the farmers’ market, reflecting the denser settlement pattern in London than in Flint. Respondents’ home locations were connected with the socioeconomic distress score for each neighborhood (as shown in figures 1 and 2). In London, 197 of 441 regional respondents (45%) lived in neighborhoods worse than the regional mean for socioeconomic distress. In Flint, 108 of 384 regional respondents (28%) lived in such neighborhoods. The farmers’ market in London was located in a neighborhood where the mean distress score was more than 1 standard deviation above the mean, while in Flint the market was located in a neighborhood that was 2 standard deviations above the mean distress score. In each case, many respondents originated from these neighborhoods. This means that each market geographically serves a neighborhood that is in a poorer state socioeconomically than the average neighborhood in the region. This information alone cannot suggest whether farmers’ market customers are actually distressed, but the socioeconomic homogeneity of many of these neighborhoods suggest that at least some low-income residents are attending the markets.
Economic Impact The average amount of money spent among all respondents (US$31 in Flint and CDN$38 in London) was multiplied by the estimated total attendance at the markets each week (3,066 in Flint and 2,404 in London). This value was then extrapolated across the entire year, giving estimates for the money spent at each market. In London, the estimated direct economic impact of the mar-ket was CDN$4.8 million. For Flint, the estimated direct economic impact of the market was US$4.9 million. A market-specific multiplier was created for the markets in London and Flint using the economic impact multiplier as a basis (Econsult Corporation, 2007). For London, this value is 1.47,
while for Flint the value is 1.39. The resulting multipliers vary for London and Flint because the percentage of products sold is different for each market. Thus the annual impact of the London farmers’ market is CDN$7.0 million, while the impact of the Flint farmers’ market is US$6.8 million annually. These values include the financial impact directly on the market vendors, the impact of money recycled by those vendors in the local economic region, and the impact of spending by market visitors in the surrounding community.
Discussion Besides describing the characteristics of farmers’ market shoppers, another primary intention of this article to discuss similarities and differences be-tween two markets on either side of the U.S./ Canada border. The Flint and London commu-nities can use these “customer inventories” to learn about their customers and learn from one another. Results indicate that the two markets are statisti-cally similar, for instance in the time each customer spent at the market, the amount of money they spent, and the origin of customers in urban and suburban areas; however, in many other ways the markets are decidedly different. In each city, the distribution of the origin of customers somewhat aligns with the urbanized area. Both markets draw customers from almost all the neighborhoods within their respective cities. In Flint, there are higher respondent concentrations in neighborhoods just east and west of the market. Few customers are drawn from the neighborhoods directly north of the market, despite their dense populations. These neighborhoods tend to be characterized by higher socioeconomic distress. Higher-distress suburban neighborhoods just south and north of the city limits are also not well repre-sented in the customer profile. Customers come from all over the region, including many rural areas around the county. Many customers originally discovered the Flint market by simply driving by, suggesting that the higher visibility of the market (between the freeway and the downtown core) plays a role in drawing prospective visitors. In London, higher concentrations of custo-mers come from the neighborhood where the market is located, and a neighborhood in the near
Journal of Agriculture, Food Systems, and Community Development ISSN: 2152-0801 online www.AgDevJournal.com
Advance online publication 15
south side of the city, both of which are high-distress neighborhoods. The market does not draw many customers from affluent neighborhoods northwest of downtown. As well, few customers come from outlying rural areas of London. The concentration of customers is likely due to the relatively denser settlement pattern in London. In terms of variations between markets, custo-mers at the Flint market who traveled greater distances spent more time at the market (distance and time spent are significantly correlated), while a similar relationship does not exist for the London market. Thus in Flint, marketing efforts to retain these distant customers will ensure their spending dollars continue to reach the market. In London, efforts to retain customers for extended periods do not necessarily need to consider the distance traveled. This is especially important because in both regions, people who live nearer to the markets use them more for general groceries. Additionally, be-cause London attracts a greater number of visitors from the neighborhood, they have a considerable economic impact. The general result that proximity to the market increases the likelihood of shopping for general groceries suggests that for each com-munity, its market serves a primary function as a supplement to grocery stores rather than a “boutique market,” particularly for residents within walking distance. This is important because in each community, the distressed neighborhoods imme-diately adjacent to the markets do not have grocery stores and have otherwise been classified as “food deserts” (Larsen & Gilliland, 2009; Sadler et al., 2012). The “reasons for coming” to each market were virtually identical for Flint and London customers. More than four out of five visitors in Flint and London stated “local/fresh food” as a key reason for patronizing the market. While fruits and vege-tables are the most common purchase at either market, some general differences exist in purchas-ing patterns between Flint and London market-goers. More customers in Flint purchase fruits and vegetables than in London (87% versus 73%), whereas more customers in London versus Flint purchase coffee (50% versus 15%), meats (50% versus 34%), and prepared foods (30% versus
13%). These differences likely reflect differences in vendor make-up at each market. For example, the notably higher percentage of London customers purchasing coffee is undoubtedly related to the fact that the roasting facilities and café of a popular fair-trade coffee brand in Ontario are based in the market and serve as a major draw. In contrast to Flint, which has a highly utilitar-ian style in that many customers shop for general groceries, more people visit the London market for its ambiance. This difference may be because the London market provides more seating and a café for customers, allowing them the opportunity to casually enjoy the market. The Flint market has fewer spaces for casual relaxation and is arranged along one linear boulevard, which creates a busy atmosphere. Discussion with Flint’s market manager confirmed that additional seating is desired. The existing marketing efforts of each farmers’ market can be seen in the way respondents indi-cated that they originally heard about the markets. Flint residents tend to indicate that they had “always known” about the market, while a majority in London heard about the market through word of mouth. This is attributable to the age of each market; the London market opened in 2006, while the Flint market has been in operation at its current site since 1940. The presence of many long-time shoppers in Flint might create a different market-ing strategy from that in London, which continues to build its customer base. In terms of economic impact, both markets play an important role in the movement and recy-cling of money within and through their commu-nities. The markets attract spending from outside the neighborhoods and serve as sources of afforda-ble, nutritious food. The economic impact values will be of great use to overall food system planning in these communities, but their relatively low numbers in comparison to the total amount of money spent in the regional food system suggests great room for growth among local food entre-preneurs. The geographic analysis presented in this study is useful for future marketing efforts, since the results show not only where market customers originate, but also significant gaps where substan-
Journal of Agriculture, Food Systems, and Community Development ISSN: 2152-0801 online
www.AgDevJournal.com
16 Advance online publication
tial populations reside but few market customers originate. This has implications for potential marketing strategies at each market, as well as customer information for enterprising businesses within the market seeking to expand operations closer to their customer base. It could also be used by community groups to determine whether or where barriers exist for people to access the farmers’ market or other healthy food options.
Conclusions This research — a collection of detailed customer inventories for two markets and a comparative analysis of their characteristics — is useful to Flint and London as a tool for policy advocacy for local food systems and local economic development. Jacobsen (2001) has noted the importance of farmers’ markets in community development, but notes the need for local governments to support this type of development. In the community sur-veyed in that study, food policy councils promoted the importance of local food and farmers’ markets to municipal planners (Jacobsen, 2001). Both Flint and London have similar advocacy groups: in Flint, the edible flint Collaborative; in London, the London Food Charter Working Group. Each of these groups has the opportunity to make use of these data to advocate for policy changes that encourage local economic development through support of their farmers’ markets. Research of this nature promotes the eco-nomic benefits of farmers’ markets and provides an opportunity for knowledge translation to the public sector. Jacobsen (2001) indicated broader support for farmers’ markets after community officials were apprised of their economic benefits. These markets both retain nearly $7 million per year in their respective communities. Since each community spends over $1 billion on food annu-ally, this represents an important opportunity for growth. The average Ontario household spends CDN$7,284 per year on food (Statistics Canada, 2006a). London, with 184,950 households, spends CDN$1.34 billion on food each year (Statistics Canada, 2006b). By comparison, Flint spends US$1.1 billion per year on food, US$900 million of which leaves the county (personal communication, Michigan State University Extension representa-
tive, 2012). These figures represent huge growth potential in farmers’ markets and other local or alternative food networks. This research also provides evidence that the two markets surveyed are somewhat different from those surveyed in past research. Women made up a greater percentage of respondents, though shop-ping characteristics did not vary statistically by gender. Differences in customer characteristics by age suggest that each market has opportunities to expand marketing to attract more of the dominant age category. In both cities, a substantial university population exists within walking or public-transportation distance, which could be tapped for customers. Defining the differences between the two markets is useful to demonstrate the wide appeal that markets can play in different cities (i.e., not every market serves the same segment of the population). Perhaps most compelling, this research shows that the markets provide the surrounding commu-nity with a source of nutritious food; they are not merely “boutique” establishments frequented by upper middle class, suburban residents (as found in Elepu & Mazzocco, 2010). In London, previous research showed that the Old East Village neigh-borhood was a food desert (Larsen & Gilliland, 2008). A follow-up, “natural experiment” study revealed that the opening of the farmers’ market alleviated inequalities in the availability and price of nutritious food in the neighborhood such that it was no longer a food desert (Larsen & Gilliland, 2009). In Flint, a downtown grocery store recently closed, leaving the equivalent of a food desert in the absence of the market. The importance of the farmers’ markets to these communities is demon-strated empirically by these results, suggesting that residents who live close to the farmers’ markets rely on them for general groceries and tend to buy more fresh fruits, vegetables, and meats. Further-more, a substantial portion of each market’s customers was shown to be living in neighbor-hoods with socioeconomic distress levels above the mean for the region, and each market is located in a neighborhood with exceptionally high socio-economic distress. The presence of both markets in distressed neighborhoods, and the fact that many customers come to the markets from
Journal of Agriculture, Food Systems, and Community Development ISSN: 2152-0801 online www.AgDevJournal.com
Advance online publication 17
distressed neighborhoods, reflect research showing a concern among market managers to balance economic motives with improving food security and serving as a source of nutritious food for local residents (Guthman, Morris, & Allen, 2006). There are still opportunities for each farmers’ market to grow within its respective business market. At present, neither market is strongly linked to a vibrant business community in the immediate vicinity. In London, only 25% of market visitors also visited other stores or arts groups in the area on the same trip. Despite this, new commercial and residential development is on the rise owing to a general increase in infill construc-tion in the neighborhood, successful municipal incentive programs for redevelopment of existing buildings, and ongoing efforts of active community developers associated with the Old East Village Business Improvement Area (OEVBIA), thereby creating more opportunities for linkages between the market and surrounding businesses. These linkages will both help grow the market as well as help the local business community. The OEVBIA is currently working on a local economic develop-ment plan for the neighborhood that involves the creation of an “agri-food district,” and considers building stronger linkages between the farmers’ market and the neighboring commercial corridor as a central objective. In Flint, a renaissance of the downtown core has been emphasized by public funding (in the form of higher education) and private ventures. In London, a number of food vendors have already expanded from the market to open additional locations along the commercial corridor outside the market. As businesses develop and expand, the link between the surrounding shopping district and the markets is likely to strengthen, thereby increasing the local economic impact of the markets even further. The role as a small business incubator is one of the most important that many farmers’ markets play (Cameron, 2007; Guthrie et al., 2006). Small businesses are one of the largest drivers of employment, and any facility that can offer assis-
tance is of great value to a city. Markets provide a low-risk, supportive environment for small businesses to establish themselves. Yet farmers’ markets are also characterized by vendors with diverse economic and political backgrounds, which can create some conflict (Oths & Groves, 2012). The consumer profiles presented in this article will be instructive for local economic developers and the managers of each market as they work with these diverse vendors to build markets that are inclusive of many socioeconomic subgroups and their purchasing habits, as well as profitable economically. This research is necessary to provide a better understanding of customer bases at different markets and demonstrate their effect on the local economy. The geospatial techniques used to track customer spending patterns can be replicated to aid small businesses in incubation at other farmers’ markets. The results of this research and similar future research will benefit farmers’ market mana-gers and vendors, small business owners, and local economic development officers with a need to quantify the impact of a local economic develop-ment project like a farmers’ market. Research of this nature may also help demonstrate the short-comings of farmers’ markets within growing alter-native food networks and offer insight into how to become more socially inclusive to all populations. Although farmers’ markets cannot resolve food system issues on their own, they can serve as an important starting point for improving accessibility to food, providing farmers and other vendors with a local point of sale and entrepreneurial opportu-nities, and increasing the dialogue around food systems at the community level.
Acknowledgements The authors wish to thank the managers of the Flint Farmers’ Market and the Western Fair Farmers’ and Artisans’ Market for their assistance, as well as the research assistants who aided in data collection.
Journal of Agriculture, Food Systems, and Community Development ISSN: 2152-0801 online
www.AgDevJournal.com
18 Advance online publication
References Abatekassa, G., & Peterson, H. C. (2011). Market access
for local food through the conventional food supply chain. International Food and Agribusiness Management Review, 14(1), 63–82.
Adams, D. C., & Salois, M. J. (2010). Local versus organic: A turn in consumer preferences and willingness-to-pay. Renewable Agriculture and Food Systems, 25(4), 331–341. http://dx.doi.org/10.1017/S1742170510000219
Bader, M. D. M., Purciel, M., Yousefzadeh, P., and Neckerman, K. M. (2010). Disparities in Neighborhood Food Environments: Implications of Measurement Strategies. Economic Geography, 86(4), 409–430. http://dx.doi.org/10.1111/j.1944-8287.2010.01084.x
Blank, U. (1996). Tourism in United States cities. In C. M. Law (Ed.), Tourism in Major Cities (pp. 206–232). London: International Thomson Business Press.
Bond, D., & Feagan, R. (2013). Toronto Farmers’ Markets: Towards Cultural Sustainability? Journal of Agriculture, Food Systems, and Community Development, 3(2), 45-60. http://dx.doi.org/10.5304/jafscd.2013.032.005
Brown, C., & Miller, S. (2008). The impacts of local markets: A review of research on farmers markets and community supported agriculture (CSA). American Journal of Agricultural Economics, 90(5), 1298–1302. http://dx.doi.org/10.1111/j.1467-8276.2008.01220.x
Cameron, A. (2007). Farmers’ markets as small business incubators and safety nets: Evidence from New Zealand. International Journal of Entrepreneurial Behaviour & Research, 13(6), 367–379. http://dx.doi.org/10.1108/13552550710829179
City of London. (2006). City of London official plan. London, Ontario: Author.
Desjardins, E., Lubczynski, J., & Xuereb, M. (2011). Incorporating policies for a healthy food system into land use planning: The case of Waterloo Region, Canada. Journal of Agriculture, Food Systems, and Community Development, 2(1), 127–140. http://dx.doi.org/10.5304/jafscd.2011.021.003
Econsult Corporation. (2007). Estimating the economic impact of public markets. New York: Project for Public Spaces. Retrieved from the Project for Public Spaces website: http://www.pps.org
Elepu, G. (2005). Urban and suburban farmers markets in Illinois: A comparative analysis of consumer segmentation using demographics, preferences, and behaviors (Unpublished doctoral dissertation). University of Illinois, Urbana-Champaign, Illinois.
Elepu, G., & Mazzocco, M. A. (2010). Consumer segments in urban and suburban farmers markets. International Food and Agribusiness Management Review, 13(2), 1–18.
Environmental Systems Research Institute [ESRI]. (2011). ArcGIS resource center desktop 10: Kernel density (spatial analyst). Retrieved from http://help.arcgis.com/en/arcgisdesktop/10.0/ help/index.html#//009z0000000s000000.htm
Federal Bureau of Investigation. (n.d.). Uniform crime reports. Retrieved from http://www.fbi.gov/about-us/cjis/ucr/ucr
Feenstra, G. W. (2002). Creating space for sustainable food systems: Lessons from the field. Agriculture and Human Values, 19(2), 99–106. http://dx.doi.org/10.1023/A:1016095421310
Govindasamy, R., Zurbriggen, M., Italia, J., Adelaja, A., Nitzsche, P., & VanVranken, R. (1998). Farmers’ markets: Consumer trends, preferences, and characteristics (Report No. P-02137-7-98). New Brunswick, New Jersey: New Jersey Agricultural Experiment Station.
Guthman, J., Morris, A. W., & Allen, P. (2006). Squaring farm security and food security in two types of alternative food institutions. Rural Sociology, 71(4), 662-684.
Guthrie, J., Guthrie, A., Lawson, R., & Cameron, A. (2006). Farmers’ markets: The small business counter-revolution in food production and retailing. British Food Journal, 108(7), 560-573. http://dx.doi.org/10.1108/00070700610676370
Hayek, M., Arku, G., & Gilliland, J. (2010). Assessing London, Ontario’s brownfield redevelopment effort to promote urban intensification. Local Environment: The International Journal of Justice and Sustainability, 15(4), 389-402. http://dx.doi.org/10.1080/13549831003677712
Hinrichs, C. C. (2000). Embeddedness and local food systems: Notes on two types of direct agricultural market. Journal of Rural Studies, 16(3), 295-303. http://dx.doi.org/10.1016/S0743-0167(99)00063-7
Hinrichs, C. C., Gillespie, G. W., and Feenstra, G. W. (2004). Social learning and innovation at retail farmers’ markets. Rural Sociology, 69(1), 31-58.
Journal of Agriculture, Food Systems, and Community Development ISSN: 2152-0801 online www.AgDevJournal.com
Advance online publication 19
Jacobs, A. J. (2009). The impacts of variations in development context on employment growth: A comparison of central cities in Michigan and Ontario, 1980–2006. Economic Development Quarterly 23(4), 351-371. http://dx.doi.org/10.1177/0891242409343304
Jacobsen, C. T. (2001). Planning for farmers markets and sustainable food systems (Unpublished master’s thesis). University of British Columbia, Vancouver, British Columbia.
Kaufman, J. (2004). Planning for the local food system in the United States. In R. H. G. Jongman (Ed.), The New Dimensions of the European Landscapes (Wageningen UR Frontis Series) (pp. 39–57). Dordrecht, the Netherlands: Springer.
Kezis, A. S., Gwebu, T., Peavey, S. R., & Cheng, H.-T. (1998, February). A study of consumers at a small farmers’ market in Maine: Results from a 1995 survey. Journal of Food Distribution Research, 29(1), 91-99.
Larsen, K., & Gilliland, J. (2008). Mapping the evolution of “food deserts” in a Canadian city: Supermarket accessibility in London, Ontario, 1961–2005. International Journal of Health Geographics, 7(16). http://dx.doi.org/10.1186/1476-072X-7-16
Larsen, K., & Gilliland, J. (2009). A farmers’ market in a food desert: Evaluating impacts on the price and availability of healthy food. Health & Place, 15(4), 1158-1162. http://dx.doi.org/10.1016/ j.healthplace.2009.06.007
Morgan, K. (2009). Feeding the city: The challenge of urban food planning. International Planning Studies, 14(4), 341-348. http://dx.doi.org/10.1080/13563471003642852
Morgan, K., Marsden, T., & Murdoch, J. (2006). Worlds of food: Place, power, and provenance in the food chain. Oxford: Oxford University Press.
Murdoch, J., Marsden, T., & Banks, J. (2000). Quality, nature, and embeddedness: Some theoretical considerations in the context of the food sector. Economic Geography, 76(2), 107-125. http://dx.doi.org/10.2307/144549
Neff, R. A., Palmer, A. M., McKenzie, S. E., & Lawrence, R. S. (2009). Food systems and public health disparities. Journal of Hunger & Environmental Nutrition, 4(3–4), 282-314. http://dx.doi.org/10.1080/19320240903337041
Nestle, M. (2003). Food politics: How the food industry influences nutrition and health. Los Angeles: University of California Press.
Niles, D., & Roff, R. J. (2008). Shifting agrifood systems: The contemporary geography of food and agriculture; An introduction. GeoJournal, 73(1), 1-10. http://dx.doi.org/10.1007/s10708-008-9174-4
Nord, M., & Hopwood, H. (2008). A comparison of household food security in Canada and the United States (Economic Research Report No. ERR-67). Washington, D.C.: United States Department of Agriculture. Retrieved from http://www.ers.usda. gov/publications/err-economic-research-report/ err67.aspx#.UbXVUtj4LVc
Olson, C. M. (1999). Nutrition and health outcomes associated with food insecurity and hunger. Journal of Nutrition, 129(2), 521S-524S.
Onianwa, O., Mojica, M. N., & Wheelock, G. (2006). Consumer characteristics and views regarding farmers markets: An examination of on-site survey data of Alabama consumers. Journal of Food Distribution Research, 37(1), 119-125. http://purl.umn.edu/8547
Ontario Court of Justice. (2011). Statistical data for criminal proceedings, London, January 2011 to December 2011. Retrieved from http://www.attorneygeneral. jus.gov.on.ca/english/jot/2011/west_2011_ london.pdf
Oths, K. S., & Groves, K. M. (2012). Chestnuts and spring chickens: Conflict and change in farmers market ideologies. Ecology of Food and Nutrition, 51(2), 128-147. http://dx.doi.org/10.1080/03670244.2012.661340
Palumbo, G., Sacks, S., & Wasylenko, M. (1990). Population decentralization within metropolitan areas: 1970–1980. Journal of Urban Economics, 27(2), 151-167. http://dx.doi.org/10.1016/0094-1190(90)90012-C
Pothukuchi, K. (2009). Community and regional food planning: Building institutional support in the United States. International Planning Studies, 14(4), 349-367. http://dx.doi.org/10.1080/13563471003642902
Pothukuchi, K., & Kaufman, J. (2000). The food system: A stranger to the planning field. Journal of the American Planning Association, 66(2), 113-124. http://dx.doi.org/10.1080/01944360008976093
Journal of Agriculture, Food Systems, and Community Development ISSN: 2152-0801 online
www.AgDevJournal.com
20 Advance online publication
Sadler, R. C., Gilliland, J. A., & Arku, G. (2012). Community development and the influence of new food retail sources on the price and availability of nutritious food. Journal of Urban Affairs. Advance online publication. http://dx.doi.org/10.1111/ j.1467-9906.2012.00624.x
Smithers, J., Lamarche, J., & Joseph, A. E. (2008). Unpacking the terms of engagement with local food at the Farmers’ Market: Insights from Ontario. Journal of Rural Studies, 24(3), 337-350. http://dx.doi.org/10.1016/j.jrurstud.2007.12.009
Statistics Canada (2006a). Average household expenditures, by province and territory (Ontario, Manitoba) [Data table]. Retrieved from http://www.statcan.gc.ca/tables-tableaux/sum-som/l01/cst01/famil16d-eng.htm
Statistics Canada (2006b). Household size, by census metropolitan area (2011 census) (London, Windsor, Barrie, Greater Sudbury / Grand Sudbury, Thunder Bay) [Data table]. Retrieved from http://www.statcan.gc.ca/ tables-tableaux/sum-som/l01/cst01/famil122e-eng.htm
Vojnovic, I., & Poel, D. (2000). Provincial and municipal restructuring in Canada: Assessing expectations and outcomes. Canadian Journal of
Regional Science, 23(1). Retrieved from http://www.cjrs-rcsr.org/archives/23-1/ INTRO-ENG.pdf
U.S. Bureau of Economic Analysis (1997). Regional Multipliers: A User Handbook for the Regional Input-Output Modeling System (RIMS II). Retrieved from http://www.bea.gov/scb/pdf/regional/perinc/ meth/rims2.pdf
Wisconsin Ag Connection. (2011, June 6). USDA invests in local agriculture farmers markets [Press release]. Retrieved from http://www.wisconsinagconnection.com/story-national.php?Id=1202&yr=2011
Wolf, M. M., & Berrenson, E. (2003). A comparison of purchasing behaviors and consumer profiles at San Luis Obispo’s Thursday night farmers’ market: A case study. Journal of Food Distribution Research, 34(1), 107-122. http://purl.umn.edu/27936
Zepeda, L., & Li, J. (2006). Who buys local food? Journal of Food Distribution Research, 37(3), 1-11. http://purl.umn.edu/7064
Zheng, L. (2009). Trapped in the race to the bottom: Who is using business incentives now? (Unpublished master’s thesis). Cornell University, Ithaca, New York.

Journal of Agriculture, Food Systems, and Community Development ISSN: 2152-0801 online www.AgDevJournal.com
Advance online publication 21
Appendix: List of Questions for Customer Surveys
What street intersection is nearest to your home? (U.S.) OR What is your postal code? (Canada) What is your gender? What is your age (in years)?
0–24, 25–44, 45–64, 65+
How often do you visit the market? Every Week, Most Weeks, Occasionally, First Time
How do you usually get to the market?
Walk/Bicycle, Bus/Public Transportation, Personal Vehicle, Other
About how much money did you spend at the market today? What kinds of things did you buy at the market? (Check all that apply)
Coffee / Drinks Fruits or Vegetables Meat / Poultry Cheese Crafts Prepared Food Baked Goods Other
Approximately how much time did you spend at the market today? What other kinds of vendors would you like to see in the farmers’ market? What are the most important reasons for you coming to the market today? (Check all that apply)
Local / Fresh Food General Groceries Specific Vendor Meet with Friends Family Activity Ambiance Other
How did you hear about the market?
Word of Mouth Vendor Drove by Advertisement Media Other