an assessment of the effect of subsidized fertilizer on farmer
133
AN ASSESSMENT OF THE EFFECT OF SUBSIDIZED FERTILIZER ON FARMER PARTICIPATION IN COMMERCIAL FERTILIZER MARKETS IN NORTH RIFT REGION OF KENYA JOYCE MUMBUA MAKAU A thesis submitted in partial fulfillment of the requirements for the award of the degree of Master of Science in Agricultural and Applied Economics, University of Nairobi December 2016
-
Upload
khangminh22 -
Category
Documents
-
view
2 -
download
0
Transcript of an assessment of the effect of subsidized fertilizer on farmer

AN ASSESSMENT OF THE EFFECT OF SUBSIDIZED FERTILIZER ON FARMER
PARTICIPATION IN COMMERCIAL FERTILIZER MARKETS IN NORTH RIFT
REGION OF KENYA
JOYCE MUMBUA MAKAU
A thesis submitted in partial fulfillment of the requirements for the award of the degree of
Master of Science in Agricultural and Applied Economics, University of Nairobi
December 2016

i

ii
DEDICATION
I dedicate this thesis to my family and friends for their inspiration and moral support throughout
the study period. May our gracious Lord bless you abundantly.

iii
ACKNOWLEDGEMENTS
My sincere gratitude goes to Dr. P. Irungu, Prof. R. Nyikal and Dr. L. Kirimi for their
supervision and guidance throughout this study. Further appreciation goes to the Department of
Agricultural Economics, University of Nairobi, for the opportunity to pursue my postgraduate
studies. I also wish to thank Tegemeo Institute of Agricultural Policy and Development of
Egerton University for the two-year study leave, scholarship and provision of good quality data,
and the African Economic Research Consortium (AERC) through the Collaborative Masters of
Science in Agricultural and Applied Economics (CMAAE) secretariat for the facilitation they
offered me pursue Master degree in Agricultural and Applied Economics in University of
Pretoria and the grant that enabled me to purchase software used in data analysis. This thesis
would not have been completed without their financial support.
I am highly indebted to Dr. Nicole Mason of Michigan State University for her assistance with
econometric modeling. I also thank my classmates for their encouragement. A heap of thanks
also goes to the enumerators and respondents for making this research work a success. I also
wish to thank my family and especially my son, Mark, for his love and care throughout my MSc
study. Finally, I thank the Almighty God for his mercies throughout my academic sojourn.

iv
TABLE OF CONTENTS
DECLARATION.............................................................................. Error! Bookmark not defined.
DEDICATION................................................................................................................................ i
ACKNOWLEDGEMENTS ........................................................................................................ iii
TABLE OF CONTENTS ............................................................................................................ iv
LIST OF TABLES ..................................................................................................................... viii
LIST OF FIGURES ..................................................................................................................... ix
ABBREVIATIONS AND ACRONYMS ..................................................................................... x
ABSTRACT ................................................................................................................................. xii
CHAPTER ONE ........................................................................................................................... 1
INTRODUCTION......................................................................................................................... 1
1.1 Background ........................................................................................................................... 1
1.2 Statement of the problem ...................................................................................................... 7
1.3 Objectives of the study .......................................................................................................... 9
1.4 Hypotheses tested .................................................................................................................. 9
1.5 Justification of the study ..................................................................................................... 10
1.6 Scope and limitation of the study ........................................................................................ 11
CHAPTER TWO ........................................................................................................................ 12
LITERATURE REVIEW .......................................................................................................... 12
2.1 Defining “fertilizer subsidy” ............................................................................................... 12
2.2 Fertilizer subsidies and input vouchers ............................................................................... 12
2.3 Rationale of a fertilizer subsidy .......................................................................................... 13
2.4 History of fertilizer subsidy programs in Kenya ................................................................. 15

v
2.5 Theoretical review ............................................................................................................... 18
2.5.1 A review of theories underpinning farmer participation in fertilizer markets .............. 18
2.5.2 Review of methods used to evaluate farmer participation in fertilizer markets ........... 21
2.6 Empirical review ................................................................................................................. 24
2.7 Summary ............................................................................................................................. 27
CHAPTER THREE .................................................................................................................... 28
METHODS AND DATA ............................................................................................................ 28
3.1 Theoretical framework ........................................................................................................ 28
3.2 Empirical framework........................................................................................................... 31
3.2.1 Assessing factors influencing the quantity of subsidized fertilizer acquired by a
household in North Rift region of Kenya .............................................................................. 31
3.2.2 Justification for inclusion of regressors in the Tobit Model ......................................... 33
3.2.3 Assessing the effect of subsidized fertilizer on household participation and level of
participation in commercial fertilizer outlets in North Rift region of Kenya ........................ 40
3.2.4 Justification for inclusion of regressors in the double-hurdle model ........................... 44
3.3 Data types and sources ........................................................................................................ 52
3.3.1 Sampling frame............................................................................................................. 53
3.3.2 Selection of Clusters ..................................................................................................... 54
3.3.3 Selection of sample households .................................................................................... 54
3.4 Data collection..................................................................................................................... 55
3.4.1 Data capture and analysis ............................................................................................. 55
3.5 Study area ............................................................................................................................ 55

vi
3.6 Diagnostic tests ................................................................................................................... 57
CHAPTER FOUR ....................................................................................................................... 60
RESULTS AND DISCUSSION ................................................................................................. 60
4.1 Household characteristics .................................................................................................... 60
4.1.1 Household categorization by source of fertilizer .......................................................... 60
4.1.2 Household socio-economic characteristics ................................................................... 61
4.2 Factors influencing the quantity of subsidized fertilizer acquired by households in North
Rift region of Kenya .................................................................................................................. 63
4.3 Determinants of market participation and the extent of participation in commercial
fertilizer markets in North Rift region of Kenya ....................................................................... 70
4.3.1 Factors influencing household participation in commercial fertilizer outlets .............. 70
4.3.2 Factors influencing the level of household participation in commercial fertilizer outlets
in North Rift region of Kenya................................................................................................ 74
CHAPTER FIVE ........................................................................................................................ 80
SUMMARY, CONCLUSIONS AND RECOMMENDATIONS ............................................ 80
5.1 Summary ............................................................................................................................. 80
5.2 Conclusion ........................................................................................................................... 82
5.3 Recommendations ............................................................................................................... 83
REFERENCES ............................................................................................................................ 86
ANNEXES ................................................................................................................................. 110
Annex 1: Distribution of survey households by counties and AEZs ...................................... 110
Annex 2: Summary of multicollinearity tests for all independent variables in the models .... 110
Annex 3: Person Correlation Matrix ....................................................................................... 111

vii
Annex 4: Summary of Breusch-Pagan test for heteroskedasticity .......................................... 112
Annex 5: Summary of Durbin Hauman test for endogeneity.................................................. 112
Annex 6: Structured Household Survey Questionnaire uploaded in SurveyCTO server ....... 113

viii
LIST OF TABLES
Table 1.1: Quantity and cost of inorganic fertilizer procured by the GoK under the fertilizer cost-
reduction initiative in Kenya (2009-2014) ...................................................................................... 5
Table 2.1: Price comparison between commercial and subsidized fertilizers in Kenya ............... 17
Table 3.1: Description of variables hypothesized to influence quantity of subsidized acquired by
fertilizer in the North Rift of Kenya ............................................................................................. 32
Table 3.2: Summary of likelihood ratio tests for choosing between double-hurdle, Tobit and
Heckman models ........................................................................................................................... 41
Table 3.3: Description of variables in the double-hurdle model and their hypothesized signs .... 45
Table 3.4: Percentage of subsidized fertilizer distributed by National Cereals and Produce Board
in Kenya by region ........................................................................................................................ 57
Table 4.1: Distribution of households by source of fertilizer in north Rift region of Kenya ....... 60
Table 4.2: Fertilizer application rates on maize among sample households in North Rift Kenya 61
Table 4.3: Means and frequencies of socio-economic characteristics of fertilizer users in the
North Rift region of Kenya ........................................................................................................... 62
Table 4.4: Maximum likelihood estimates of factors influencing the quantity of subsidized
fertilizer acquired by households in North Rift region of Kenya ................................................. 64
Table 4.5: Maximum likelihood estimates of factors influencing farmer participation in
commercial fertilizer markets in North Rift region of Kenya ....................................................... 71
Table 4.6: Maximum likelihood estimates of factors influencing the level of participation in
commercial fertilizer outlets in North Rift region of Kenya ......................................................... 76

ix
LIST OF FIGURES
Figure 1.1: Major fertilizer distribution channels in Kenya .......................................................................... 6
Figure 2.1: Effect of fertilizer subsidy on commodity supply .................................................................... 14
Figure 4.2: Map of North Rift region of Kenya .......................................................................................... 56
x
ABBREVIATIONS AND ACRONYMS
AEZs Agro-ecological zones
AHM Agricultural Household Model
APE Average Partial Effects
AU African Union
CAADP Comprehensive Africa Agriculture Development Programme
CMAAE Collaborative Masters in Agricultural and Applied Economics
CRE Correlation Random Effects
EPSEM Equal Probability Selection Method
ERA Economic Review of Agriculture
FAO Food and Agricultural Organization
FISP Farmer Input Subsidy Program
GoK Government of Kenya
IFDC International Fertilizer Development Centre
IMR Inverse Mills Ratio
Kg Kilogram
Kg /ha Kilograms per hectare
KIHBS Kenya Integrated Household Budget Survey
KNBS Kenya National Bureau of Statistics
KShs Kenya shillings
KTDA Kenya Tea Development Agency
LR Likelihood Ratio
MDG Millennium Development Goal

xi
MoAL&F Ministry of Agriculture, Livestock and Fisheries
MoS Measure of Size
MT Metric Tons
NAAIAP National Accelerated Agricultural Inputs Access Program
NASSEP National Sample Survey and Evaluation Programme
NCPB National Cereals and Produce Board
NEPAD New Partnership for Africa's Development
ROK Republic of Kenya
TAPRA Tegemeo Agricultural and Policy Research Analysis
TIP Target Input Program
SAPs Structural Adjustment Policies
SDGs Sustainable Development goals
SPS Starter Pack Scheme
SSA Sub-Saharan Africa
xii
ABSTRACT
One of the most outstanding economic issues concerning input subsidies in many third world
countries is their effect on commercial fertilizer purchases. This is particularly so in countries
like Kenya where subsidized fertilizer distribution exists side-by-side with commercial market
outlets. The objective of the national fertilizer program designed in 2009 in Kenya was mainly to
encourage fertilizer use through public support to local fertilizer manufacturers and
strengthening local fertilizer distribution channels. However, the effect of the subsidy program
on commercial fertilizer market outlets in general is not known.
This study assessed the level of displacement of commercial fertilizer sales by subsidized
fertilizer as well as the factors affecting the quantity of subsidized fertilizer received by
households in the North Rift region of Kenya. A structured questionnaire was used to collect
primary data from 1,023 households. Descriptive statistics were used to characterize the fertilizer
market in the North Rift of Kenya. A double-hurdle model was employed to assess the effect of
subsidized fertilizer on farmer participation in commercial fertilizer market outlets.
Results show that most of the subsidized fertilizer went to the wealthier, male-headed, more
educated households with more land and higher non-farm incomes. This means that the
beneficiaries of the national fertilizer subsidy were households with the resources to purchase
fertilizer from commercial sources in the absence of a subsidy. Reducing the quantity of
subsidized fertilizer to the bare minimum is likely to make wealthy households shy away from
the subsidized fertilizer thereby allowing poorer households to acquire the subsidized fertilizer.

xiii
In addition, households with strong social networks with the chair of the village fertilizer subsidy
vetting committee received significantly more subsidized fertilizer. This is an indication that the
process of identifying the beneficiaries of Kenya’s national fertilizer is prone to substantial
capture by social elites through rent-seeking and exclusivity.
Access to subsidized fertilizer reduced households’ probability to participate in commercial
fertilizer market in the North Rift of Kenya by 29 percent. This indicates that the national
fertilizer subsidy is suppressing commercial fertilizer outlets. On average, an extra kilogram (kg)
of subsidized fertilizer displaced 0.22 kg of commercial fertilizer, ceteris paribus, indicating that
the national fertilizer subsidy has a potential to crowd out commercial fertilizer. This may not
augur well in a liberalizing economy such as Kenya’s.
The study recommends that the government of Kenya should consider strengthening the current
National Accelerated Agricultural Inputs Access Program (NAAIAP). A program targeted to
resource-poor households where farmers access fertilizers through vouchers that can be
redeemed from the agro-dealers like in Nigeria. This will enhance the transparency, equity and
inclusiveness of the subsidy program which the current one does not.

1
CHAPTER ONE
INTRODUCTION
1.1 Background
Governments in sub-Saharan Africa (SSA) are increasingly intervening in agricultural input
markets in an effort to correct market failure in pursuit of a more inclusive pro-poor agriculture-
led economic growth strategy (Dorward, 2009; 2006). Poor output price incentives, high
fertilizer prices, lack of credit, poor infrastructure, and information asymmetry are some of the
constraints that hinder farmers in SSA from improving agricultural production and productivity
(Druilhe and Barreiro-Hurlé, 2012). Therefore, both agricultural growth and growth of
agricultural labor productivity in SSA continue to lag behind that of 1960s (Badiane et al., 2015).
Thus, the much anticipated agriculture-led economic transformation in SSA remains a pipe
dream.
Fertilizer is one of the most important farm inputs that has received considerable government
support in SSA (Baltzer and Hansen, 2012). Such interventions have included import and price
controls, institutionalization of fertilizer subsidies, and establishment of state-owned fertilizer
production distribution systems (Ariga and Jayne, 2010). Fertilizer use in SSA lags far behind
the rest of the world this has led to low farm productivity (Sheahan et al., 2016). Therefore,
subsidies are expected to induce farmers to adopt the use of modern inputs including fertilizer to
increase agricultural productivity to feed a bourgeoning population (Baltzer and Hansen, 2012).

2
In the last two decades, many SSA countries have re-introduced fertilizer subsidy programs
under the “smart subsidy” Africa-wide clarion attributed to the celebrated success of the
Malawian Agricultural Input Subsidy Program (Liverpool-Tasie, 2012). The primary objective of
the resurgence of these subsidies was to promote agricultural production, improve food security
and stimulate the growth of the private input sector (NEPAD, 2006; FMARD, 2011). For
instance, the Malawian government pioneered the return of fertilizer subsidies in 1998 having
discontinued related programs in early 1990s (Kelly et al., 2011). Other countries that re-
introduced fertilizer subsidies were Nigeria (1999), Zambia (2000), Tanzania (2002), Kenya
(2006) and Ghana (2008) (ibid.).
In the past, fertilizer subsidy and promotion programs were implemented as direct budgetary
support payments to lower farm-gate prices of fertilizer (Gregory, 2006). These, however,
suffered from high unsustainable costs, administrative inefficiencies and rent-seeking (ibid.).
Therefore, subsidized input programs in SSA have generally been expensive, unsuccessful and
rarely equitable, with benefits accruing mainly to large-scale farmers (Gregory, 2006).
Government intervention in fertilizer markets coupled with poor investment in infrastructure to
facilitate a competitive commercial fertilizer distribution channel has been shown to deter
agricultural development in SSA countries (Takeshima and Lee, 2012). In most cases,
commercial fertilizer markets have been negatively affected by publicly-managed fertilizer
distribution especially where public and private distribution channels exist concurrently (Ricker-
Gilbert et al., 2011).

3
However, the level of market distortion is dependent on the level of administrative efficiency,
targeting, size of the program and timeliness of fertilizer distribution (Liverpool-Tasie, 2014).
As such, the effect of government intervention in commercial sector participation in fertilizer
markets is not obvious (Liverpool-Tasie 2014). Lack of knowledge on the effect of fertilizer
subsidy on commercial markets may lead to inefficiencies associated with poor program policy
design.
Kenya introduced its input subsidy program, dubbed the “National Accelerated Agricultural
Inputs Access Program” (NAAIAP), in 2006. This was a program designed as a safety-net for
farmers who lacked financial resources to purchase farm inputs (Megan et al., 2014). The aim
was to address the then Millennium Development Goal (MDG) number one of eradicating
extreme poverty and hunger (ibid.). Moreover, the program was a response by the Kenya
Government to the Abuja Declaration of 2006 on “Fertilizer for African Green Revolution” in
which the African Union (AU) member states resolved to increase fertilizer use from 8 to 50 kgs
per hectare by 2015 (Bunde et al., 2014).
To enhance fertilizer use, AU member countries were expected to increase their budgetary
allocation to fertilizer purchases, introduce “smart” fertilizer subsidies, and remove all taxes and
tariffs on fertilizer and fertilizer raw materials to improve fertilizer financing by importers and
agro-dealers (NEPAD, 2006). At the same time, member countries were to develop and
implement fertilizer policy and regulatory frameworks by which the fertilizer sub-sector would
be regulated and quality-controlled (ibid.).

4
In 2009, the Government of Kenya (GoK) introduced its national fertilizer subsidy program in
line with Vision 2030 (GoK, 2007). The subsidy program, which is still operational, is being
implemented by the Ministry of Agriculture, Livestock and Fisheries (MoAL&F) as a three-tier
fertilizer cost reduction strategy called the “Fertilizer Cost-Reduction Initiative” or simply, “the
national fertilizer subsidy” (IFDC, 2012). The program was started as an emergency response to
high fertilizer prices in 2008 (Nzuma, 2013). The aim was to encourage fertilizer use through (a)
reduction of fertilizer cost and effective fertilizer supply chain (Tier 1), (b) blending of fertilizers
(Tier 2), and (c) support to local fertilizer manufacturing (Tier 3) (Ndung’u et al., 2009).
In an attempt to address Tier 1, the GoK procures and distributes fertilizer at subsidized prices to
farmers across the country through the National Cereals and Produce Board (NCPB) depots
(IFDC, 2012). Table 1.1 presents a summary of the quantity and cost of subsidized fertilizer
procured by the Kenyan Government since inception of national fertilizer subsidy in 2009. A
total of 444,805 metric tons (MT) of subsidized fertilizer were procured between 2009 and 2014.
This has contributed approximately 23 percent of the total inorganic fertilizer demand at a cost of
Kenya shillings (KShs) 14.1 billion which is approximately 30 percent of the treasury allocation
for the agriculture sector (MoAL&F, 2015). Elsewhere in Africa, fertilizer subsidies absorb a
significant part of total public expenditure in agriculture; for example, 60 percent in Malawi, up
to 50 percent in Tanzania and 40 percent in Zambia (Druilhe and Barreiro-Hurlé, 2012).

5
Table 1.1: Quantity and cost of inorganic fertilizer procured by the GoK under the
fertilizer cost-reduction initiative in Kenya (2009-2014)
Financial
year
Total
fertilizer
requirement
(MT)
Quantity
of
organic
fertilizer
required
(MT)
Percentage
of organic
fertilizer
procured
Quantity
subsidized
(MT)
Percent of
organic
fertilizer
subsidized
Treasury
allocation
for
subsidized
fertilizer
(KShs M)
2009/2010 503,784 384,406 76.3 16,624 4.3 758
2010/2011 505,489 365,561 72.3 96,000 26.3 2,995
2011/2012 539,910 387,401 71.8 94,155 24.3 3,320
2012/2013 542,780 379,946 70.0 66,276 17.4 3,150
2013/2014 568,000 431,680 76.0 171,750 39.8 3,900
Total 2,659,963 1,948,994 73.3 444,805 22.8 14,123
Source: MoAL&F, (2015).
In Kenya, fertilizer is distributed by the NCPB through four main channels C-1 to C-4 in Figure
1.1. The diagram focuses on domestic participants and does not include international fertilizer
actors (manufacturers, shippers and others). In channel C-1, commercial importers buy the
fertilizer directly from international suppliers and deliver it to wholesale points or to other firms
in the chain, who then transmit the product to agro-dealers from whom farmers purchase at full
market prices (IFDC, 2012).
In the second channel, C-2, importers purchase fertilizer directly from international suppliers and
deliver it to their own distribution or wholesale points or to agro-dealers from whom farmers
purchase at subsidized prices through the voucher system under the NAAIAP (ibid.). The third
supply channel, C-3, captures specific high-value crops (mainly tea, coffee, sugar) in which
procurement is made directly from international sources or through local importers by a
collective crop agency on behalf of all farmers (ibid.).

6
C-1: Commercial
importers
C-2: Commercial
importers C-3: Commercial
importers C-4: Public imports -
NCPB
Agro-dealers /Retailers
Wholesalers /Distributors
Out-grower farmers All farmers at subsidized
price (No voucher)
Commodity Company: e.g.
KTDA (Kenya Tea Development
Agency)
State agency: NCPB
depots
Target all farmers: at
full market prices
Target poor farmers: at subsidized
price (Voucher system)
Figure 1.1: Major fertilizer distribution channels in Kenya
Source: Modified from IFDC (2012)
International fertilizer suppliers

7
The fourth supply chain, C-4, is state-led and it involves procurement by tender and distribution
through the NCPB network of depots across the country at subsidized prices (ibid.). It is worth
noting that C-4 differs from C-2 in that in the latter, the vouchers issued to beneficiaries are
redeemable from accredited dealers who in turn redeem them from the government (IFDC,
2012).
According to the MoAL&F (2014), the following are procedures for accessing subsidized
fertilizer by the farmers (i) a farmer must be vetted by Location Subsidy Fertilizer Vetting
Committee and be registered, (ii) a farmer obtains an official form showing the crops and
quantity of fertilizer required based on size of land prepared for planting, (iii) the form is signed
by the chief /assistant chief and the ward extension officer and the farmer can access a
maximum of 40 bags, (iv) the original copy is taken to the nearest NCPB depot and upon
receiving dully filled and authorized form the NCPB official advices the farmer to pay for and
collect the fertilizer.
1.2 Statement of the problem
Fertilizer supply through the NCPB started in 2009 as an attempt to stabilize fertilizer prices in
Kenya by strengthening respective distribution channels in order to boost productivity (GoK,
2007). This has created a dual fertilizer market in which both the government and commercial
sellers participate in fertilizer procurement and distribution. According to the International
Fertilizer Development Corporation (IFDC), such a parallel fertilizer marketing system creates
uncertainty for the commercial sellers because the public sector rarely has a clear exit strategy
(IFDC, 2012).

8
Although government intervention in the fertilizer market is principally aimed at correcting
market failure in distribution, it has the potential of crowding out commercial players when
implemented in a market where the private sector is operating well (Krausova and Banful, 2010).
Previous studies on the effect of fertilizer subsidies on commercial outlets in SSA have
concentrated on targeted subsidies whereby the fertilizer is channeled to certain intended
beneficiaries, for example, Ricker-Gilbert et al. (2011); Mason (2011); Xu et al. (2009) and
Liverpool-Tasie (2012; 2014) in Malawi, Zambia and Nigeria. Although these studies have shed
some the light on the circumstances under which fertilizer subsidies may promote or suppress
private fertilizer markets, they have not examined the effect of non-targeted fertilizer subsidy
programs on farmer participation in commercial markets. Consequently, the existing literature is
unable to inform policy makers on the effect of non-targeted fertilizer subsidy programs on
farmer participation in privately-operated fertilizer distribution channels, which would otherwise
suppress the commercial fertilizer markets.
In particular, there is no study that has explicitly evaluated the effect of the fertilizer subsidy
program on farmer participation in commercial fertilizer markets in the North Rift region of
Kenya. Additionally, no study has attempted to identify the determinants of the quantity of
subsidized fertilizer acquired by farmers in North Rift region of Kenya in order to understand
who the national fertilizer subsidy beneficiaries are. This study aimed to fill these gaps in
knowledge by providing evidence on whether the input subsidy suppresses or promotes the
commercial fertilizer markets in North Rift region of Kenya.

9
1.3 Objectives of the study
The overall objective of this study was to assess the effect of subsidized fertilizer on farmer
participation in commercial fertilizer outlets in the North Rift region of Kenya. The specific
objectives of the study were:
1. To describe the socio-economic characteristics of households in North Rift region of
Kenya by source of fertilizer used.
2. To identify the determinants of the quantity of subsidized fertilizer acquired by
households in North Rift region of Kenya.
3. To assess the effect of subsidized fertilizer on farmer participation and level of
participation in commercial fertilizer outlets in North Rift region of Kenya.
1.4 Hypotheses tested
The following hypotheses were tested in this study:
1. There is no difference in the socio-economic characteristics of households who access
fertilizer from different sources in North Rift region of Kenya.
2. Socio-economic, institutional and market factors have no effect on the quantity of
subsidized fertilizer acquired by households in North Rift region of Kenya.
3. The quantity of subsidized fertilizer acquired by a household has no effect on farmers’
decision as well as the level of participation in commercial fertilizer outlets in the North
Rift region of Kenya.

10
1.5 Justification of the study
Effective and efficient use of fertilizers is embedded in strategies from global, continental and
local policies. To be precise, countries that prescribed to MDGs, now Sustainable Development
goals (SDGs), and the Comprehensive Africa Development Programme (CAADP) have tried to
promote and encourage the use of fertilizers. At the local level, Vision 2030’s economic pillar
includes agriculture as a major sector, and in which fertilizer use is significant. In addition, the
Africa Fertilizer Summit brought forth the Abuja declaration on fertilizer for the African Green
Revolution and resolved to introduce smart subsidies (Lunduka et al., 2013; FAO, 2014).
However, the perceived benefits and costs of these subsidy programs continue to stir heated
debate. Literature reveals that the most contentious issues surrounding fertilizer subsidies
programs in SSA countries are poor targeting, patronage, crowding out of commercial inputs and
fiscal sustainability (Sharma and Thaker, 2010; Druilhe and Barreiro-Hurlé, 2012; Ricker-Gilbert
et al., 2011). To add to this literature, there is need to understand the effect of subsidized
fertilizer on commercial fertilizer markets in Kenya.
Therefore, by assessing the effect of national fertilizer subsidy on farmer participation in
commercial markets, this study provides policy makers, the private sector, development partners
and researchers with information on the magnitude of the existing displacement of commercial
by subsidized fertilizer in Kenya, which is currently unknown. This will help to shed some light
on who benefits from the national program and aid in re-examining the effectiveness of the
program. Additionally, it will contribute to the current debate on general county-level fertilizer
subsidy program design and implementation.

11
This study also provides information on fertilizer use patterns and the factors influencing the
quantity of subsidized fertilizer acquired by households in the North Rift of Kenya. This
information can be used by the government to re-examine how to implement fertilizer subsidy
programs in other areas so as to strengthen the fertilizer supply chain.
This study contributes to existing stock of scientific knowledge through the application of a
double-hurdle model in exploring the effect of non-targeted fertilizer subsidy on commercial
fertilizer markets. The model has been applied in assessing the factors affecting farmer decision
to participate in commercial fertilizer outlets and the extent of participation in Nigeria, Malawi
and Zambia.
1.6 Scope and limitation of the study
The main objective of this study was to assess the effect of subsidized fertilizer on farmer
participation in commercial fertilizer outlets in the North Rift region of Kenya. Focus was on
smallholder farmers in Uasin Gishu, Trans-Nzoia, Elgeyo Marakwet, Baringo, Nandi, Samburu,
Turkana and West Pokot counties where farmers were picked to respond to the questionnaires
designed (refer to Annex 1). One major limitation of data used in this study is collection of
reliable fertilizer quantity and off-farm income data. Most respondents kept sketchy or no
records and the study relied mostly on recall ability. In addition, some farmers could not
remember the prices at which they bought their fertilizer. Authors had to rely on official prices
given at the NCPB depot for the subsidized fertilizer since it was controlled by the government.

12
CHAPTER TWO
LITERATURE REVIEW
2.1 Defining “fertilizer subsidy”
A subsidy is defined as a payment made from public resources to allow a household, sector or
industry face a lower market price of a commodity or service (Takeshima and Lee, 2012).
According to Bates (1981), fertilizer subsidies, constitute government intervention in fertilizer
supply to maintain stable and low prices for the benefit of both resource-poor farmers and urban
consumers through lower food prices.
2.2 Fertilizer subsidies and input vouchers
After several fertilizer subsidy programs were discontinued in 1990’s, lessons learnt led re-
designing of smart subsidy programs (Druilhe and Barreiro-Hurlé, 2012). Smart subsidy
programs aimed at promoting fertilizer market development and improve agricultural production
and productivity for resource-poor households (Sibande, 2016). Supply of fertilizer through
commercial markets targeting the poor can be considered as smart subsidy (Minot and Benson,
2009). These subsidies are phased out once the market infrastructure is developed and markets
are operating well. Provision of input vouchers is one of approach to designing smart subsidies
for fertilizer (Dorward, 2009). In this approach the beneficiaries are identified and issued with
vouchers that are redeemable at commercial input suppliers (Mangisoni, 2007).
The cost of the fertilizer to the farmer is reduced by the value of the voucher. The supplier,
having provided fertilizer to the farmer in exchange for the voucher takes the voucher to a
designated agency and is reimbursed for its value plus a handling fee (Minot and Benson, 2009).
The voucher is an income transfer through private sector suppliers to farmers (Dorward, 2009;

13
Minot and Benson, 2009; Druilhe and Barreiro-Hurlé, 2012). Vouchers are a way to guarantee
demand for fertilizer supplied and enable commercial sellers to benefit from economies. Input
vouchers help strengthen commercial-sector distribution network, build exit strategies by
reducing the value of the voucher over time, provide an opportunity to train farmers and input
suppliers on efficient and profitable use of fertilizer and in emergency response situations,
vouchers can replace food aid as medium-term support to those affected.
2.3 Rationale of a fertilizer subsidy
In a world of imperfect markets, subsidies are socially justifiable because they
combat market inequities (Aloyce et al., 2014; DeBow, 1991). Imperfect markets are
predominant in SSA where economic market does not meet the rigorous standards of a
hypothetical perfectly competitive market (Krugman, 1997). With regard to fertilizer, many
farmers in SSA do not to use recommended rates partly because they cannot afford large
quantities of fertilizer and partly due to lack of appreciation of the benefits of adequate fertilizer
use.
Theoretically, the introduction of fertilizer subsidies in an agricultural production process
increases fertilizer use as farmers are able to purchase the input whose price has fallen (Debertin,
1986; Varian, 1992; Ricker-Gilbert and Jayne, 2008). The net effect of the fertilizer subsidy is a
reduction in production cost at the farm level, an increase in commodity supply (from Q to Q*)
and a fall in commodity prices (from P to P*) in Figure 2.1.

14
Figure 2.1: Effect of fertilizer subsidy on commodity supply
Source: Varian (1992)
However, this only happens in an environment where farmers are faced with intractable market
failure (Druilhe and Barreiro-Hurlé, 2012). In analyzing fertilizer use in SSA, information
asymmetry and poor fertilizer market development are the two main sources of market failure
(Tuteja, 2003). Market failure presents a prima facie case for government intervention in
fertilizer markets, albeit with the consequence of dead weight loss to society (see Figure 2.1)
(Alston and Hurd, 1990). Despite the deadweight loss, fertilizer subsidies are often justified on
social welfare grounds such as equity (Dorward, 2009).
Dead weight loss
F
Output
C
D
E
B
A
P
P*
Q
Q*
S (with subsidy)
S (no subsidy)

15
2.4 History of fertilizer subsidy programs in Kenya
As in many SSA countries, Kenya implemented “universal” subsidy programs from
independence in 1963 to the early 1980s when the largely donor-funded projects came to an
abrupt end following the adoption of structural adjustment policies (SAPs) (Dorward, 2009;
Minot, 2009). These programs were state-led and succeeded in raising agricultural productivity
through use of modern inputs including fertilizer (Badiane et al., 2015). However, they were
phased out largely because they tended to benefit the well-off in the society (Druilhe and
Barreiro-Hurlé, 2012). Additionally, the fertilizer subsidy programs were inefficient due to high
administrative costs, government monopoly and political influence (Banful, 2010).
In 1980s and 90s, input markets in Kenya were liberalized following the adoption of SAPs. As a
result, fertilizer use declined due to increase in price from KSh 4 in 1990 to KSh 24 per kilogram
in 2001 (Karanja and Nyoro (2002); Kelly et al., 2011). By the end of the 1990s subsidy
programs re-emerged in several SSA countries including Kenya, principally to forestall the
dismal performance of the agricultural sector due to the negative effects of SAPs (NEPAD,
2013). Through the donor-driven Poverty Reduction Strategy Papers (PRSPs), many SSA
countries started implementing “smart subsidies” to raise agricultural productivity (Bindraban et
al., 2008). The Abuja Declaration of 2006 provided the continental policy framework for the
implementation of “smart subsidies’’ in Africa (Bunde et al., 2014). Smart subsidy programs
were designed to address the weaknesses of the universal subsidies (Minde et al., 2008; Tiba,
2009).

16
In SSA, Malawi pioneered the return of input subsidies through the Starter Pack Scheme (SPS)
in 1998, followed by the Target Input Program (TIP) in 2000 and the Farmer Input Subsidy
Program (FISP) in 2005 (Bunde et al., 2014). According to Levy and Barahona (2002), SPS
succeeded in promoting national food security and lowering maize prices from US$ 0.25 per
kilogram before the subsidy program to US$ 0.18 per kilogram following subsidy
implementation. However, these subsidies crowded out commercial operators by 0.13 kg in
Zambia and 0.22 kg in Malawi (Mason and Jayne, 2012; Ricker-Gilbert et al., 2011). Therefore,
despite the visible benefits of the SPS, most donors supporting Malawi were unwilling to support
the subsidy program claiming it was undermining the growth of commercial fertilizer sellers and
creating a dependence syndrome among farmers (Harrigan, 2008).
In Kenya, the return of the fertilizer subsidy program in 2006 under NAAIAP (Kiratu et al.,
2014). This program begun with a component called “Kilimo Plus”, which was pro-poor and
aimed at increasing food production to enhance food security. The beneficiaries in this program
were given starter kits comprising of 10 kg of certified maize seed, 50 kg of base fertilizer, and
50 kg of top dressing fertilizer (Megan et al., 2014). The kit was supposed to aid the farmers to
cultivate 0.4 hectare of land which was said to be enough to provide food to an average
household of five people at an annual maize consumption of 125 kg per capita (Kiratu et al.,
2014). The grant was administered through a voucher issued to the farmer (ibid.).
Following the 2008 global financial crisis, the GoK initiated the National Fertilizer Subsidy
Program in 2009 designed to increase fertilizer use among poor households as well as to cushion
them against high fertilizer prices (Tegemeo, 2010). This program was supported by bulk
procurement of fertilizer by the MoAL&F which was then distributed as subsidized fertilizer to
farmers (Nzuma, 2013).

17
In this program, the government procured subsidized fertilizers through the NCPB which was
distributed to farmers through its depots countrywide after being vetted by the Location Subsidy
Fertilizer Vetting Committee.
Table 2.1 shows the price comparison between commercial and subsidized fertilizers in 2012 and
2013. Generally, the level of subsidy differs from year to year and across different types of
fertilizer and region in Kenya. The national subsidy program has lowered and somewhat
stabilized fertilizer prices. From the Table, the amount of subsidized fertilizer is substantial,
which means it has a potential displace effect to commercial outlets.
Table 2.1: Price comparison between commercial and subsidized fertilizers in Kenya
Type Fertilizer
Commercial fertilizer
prices (KShs)
National Cereals and
Produce Board Prices
(KShs) Subsidy level (%)
2013 2014 2013 2014 2013 2014
DAP 3,760 2,000 2,480 1,800 36 10
CAN 2,600 2,300 1,600 1,500 37 44
NPK 3,360 3,100 2,500 2,000 24 32
Source: Author (Survey data)
Although Kenya’s fertilizer subsidy programs have had a positive effect on crop yield, household
income and poverty reduction (Mason et al., 2015), studies show that they are fraught with
problems associated with poor targeting, rent-seeking, smuggling and diversion to commercial
markets (Gregory, 2006; Kamoni and Rotich, 2013). The supply of fertilizer subsidy in Kenya
has raised public concerns due to its chronic lateness in delivery, which has led to low fertilizer
application rates (ibid.). Both the intention and the practice of the fertilizer subsidy program may
have affected participation in commercial outlets.

18
2.5 Theoretical review
2.5.1 A review of theories underpinning farmer participation in fertilizer markets
Three theoretical constructs underpin the motivation of a farmer participating in an input
markets. These are (i) theory of the firm, (ii) random utility model, and (iii) agricultural
household model. The particulars of each model are described below.
2.5.1.1 Theory of the firm
In the neoclassical theory of the firm, the main objective of a business firm is profit
maximization. Thus, with this major motive, any firm will supply an output that maximizes the
profits for all the individual firms. Maximum profits refer to pure profits which are a surplus
above total costs of production. It is the amount left with the entrepreneur after he has made
payments to all factors of production, including his wages of management.
According to Varian (1992), profit maximizing condition can be expressed as:
Maximize π(Q) = R(Q) - C(Q) (2.1)
subject to a cash constraint.
where π(Q) is profit, R(Q) is total revenue, C(Q) are total costs, and Q is the output produced.
The assumptions underlying this theory are; the objective of the firm is to maximize profits, the
entrepreneur is the sole owner of the firm, tastes and habits of consumers are stable, and
techniques of production are given (Mendola, 2007). There is however profound market
imperfection in Africa that is characterized by lack of credit, inefficient labor and land rental
markets, tenure rights, marketing constraints, or various combinations of these (Boucher et al.,
2005). Therefore, households in SSA aim to maximize utility rather than profits (Mendola,
2007).

19
Profit maximization cannot be used to anchor the current study because of the existence of trade-
offs between profit maximization and other household goals, and the role of uncertainty and risk
in farm household production decisions as in the case of fertilizer use in the north rift of Kenya.
In addition, this theory overlooks the aspect of consumption in household decision processes.
2.5.1.2 Random utility model
Households are often faced with a range of options from which to make choices. Whether one
item is preferable to another depends on how much satisfaction it yields relative to its
alternatives utility (Case and Fair, 2007). Neoclassical random utility theory assumes that an
individual has perfect discriminatory power, access to information and rank alternative choices
in a well-defined and consistent manner (Kjær, 2005). Therefore, the individual can thus
determine his or her best choice and will repeat this choice under identical circumstances
(Anderson et al., 1992).
The utility derived from a given choice can be expressed as the linear sum of a deterministic part
that captures the observable components of the utility function and a random error term that
captures unobservable components of the function.
ijijij VU
According to Hanemann (1984), is the latent utility derived by an individual household
from choosing to buy fertilizer form source , is the observable systematic component of
utility, and is the stochastic error term unobservable to the researcher and treated as a random
component. This random component is inherently stochastic and an individual’s preferences
cannot be understood perfectly. In addition, individual’s utility function cannot be observed.
Therefore, random utility framework was not adopted for this study.

20
2.5.1.3 Agricultural household model
Among peasant households, the neoclassical agricultural household model (AHM) has been
used to explain the behavior of farm households in simultaneous decision making about
consuming own-produced and market-purchased goods. By consuming all or part of its own
output, which could alternatively be sold at a given market price, the household implicitly
purchases goods from itself. On the other hand, by households allocating it’s time to leisure or
to household production activities, the household implicitly buys time, valued at the market
wage, from itself. Therefore, small-holder farmers have this dual character.
The interaction of consumption and production within the household causes a unique form of
decision making which sets smallholder farmers apart from any other kind of production unit
under capitalism. According to Singh et al. (1986), the AHM typically incorporates the notion of
full household income and conceives of the household as a production unit that converts
purchased goods and services as well as its own resources into use values or utilities when
consumed. Hence, the household maximizes utility through the consumption of all available
commodities (home-produced goods, market-purchased goods, and leisure), subject to income
constraints.
The model shows that if all markets exist and all goods are tradable, prices are exogenous and
production decisions are taken independently of consumption decision. It is however noted that
markets do not exist in all cases and hence not all goods are tradable. Hence, it is not possible to
separate consumption from production (ibid.).

21
In reality, households operating in developing countries are likely to face more than one market
imperfection leading to transactions and investments that are sub-optimal (Dillon and Barret,
2014). Hence, the logical option is for the household’s objective to maximize utility from a list of
consumption goods. Subsequently, utility maximization approach within the AHM is more
suitable than the profit maximization approach for assessing farm household behavior. This
model has been used by Ricker-Gilbert et al. (2011) and Liverpool-Tasie (2012) to study
participation in fertilizer markets in Malawi and Nigeria respectively.
2.5.2 Review of methods used to evaluate farmer participation in fertilizer markets
Past studies have treated household decision to participate in fertilizer markets as a two-step
process (Ricker-Gilbert et al., 2011; Liverpool-Tasie, 2012; Liverpool-Tasie, 2014). The first
step entails a household making the decision on whether or not to participate in the fertilizer
market while the second step involves deciding how much fertilizer to purchase conditional upon
the participation decision (Goetz, 1992; Key et al., 2000; Holloway et al., 2001; Bellmare and
Barrett, 2006). These studies have typically used the Heckman (1979), the Tobin (1958), double-
hurdle (Omiti et al., 2009; Ricker-Gilbert et al., 2011; Jayne et al., 2013; Liverpool-Tasie, 2014)
and triple-hurdle models (Burke, 2009). The choice of the model to use depends on the objective
of the study, the nature of underlying econometric issues at hand such as inferences based on
normal distributions when distributions are not normally distributed, parametric inference where
the economist's theoretical knowledge is limited to directions of change, classical and Bayesian
inferential procedures when samples from a population are limited in size, unique, and non-
repeatable except at very high cost and tractability of results (Kmenta & Ramsey, 1980).

22
The Heckman model is a two-stage technique that corrects for selection bias arising from non-
randomness of the sampling units associated with non-experimental survey design (Olwande and
Mathenge, 2012). The correction for selection bias is achieved by generating an inverse Mill’s
ratio (IMR) in first stage and using it as an explanatory variable in the second stage (Heckman,
1979). Some studies that used Heckman model in analyzing market participation include Siziba
et al., (2011); Jagwe (2011); Sebatta et al. (2012); Moono, 2015). However, the model is
designed for incidental truncation where the zeros arising from decision not to participate in a
certain market are considered to be unobserved values rather than logical economic decisions
leading to loss of valuable information in the dataset (Ricker-Gilbert et al., 2011). Therefore, the
Heckman model could not be applied in the current study.
The Tobit model has been the widely used in data that have zeros, yielding a censored dependent
variable (Tobin, 1958). Although it can be used to model farmer participation in fertilizer
markets, its major drawback is that it requires that the decision to participate and how much to
buy be determined by the same process, which is restrictive (Wooldridge 2003; Ricker-Gilbert et
al., 2011). The Tobit model allows the partial effect of a particular regressor on the probability of
participation as well as the level of participation to have the same signs (Wooldridge, 2008;
Reyes et al., 2012).
Due to the shortcomings of the Tobit model mentioned above, this study did not use it to assess
the effect of national fertilizer subsidy on farmer participation and the level of participation in
commercial market outlets. However, Tobit model was used to evaluate the determinants of the
quantity of subsidized fertilizer acquired by households in North Rift region of Kenya. This is
because the study considered households who benefited from subsidized fertilizer.

23
In empirical instances where zeros in the outcome variable reflect a household’s optimal choice
rather unobserved characteristics, the double-hurdle model is normally used (Cragg, 1971). This
model is more flexible than the Tobit because it allows for the possibility that the factors
influencing the decision to participate in the market be different from factors affecting the
decision of how much to buy (Komarek, 2010). For this reason, the double-hurdle model was
adopted for use in the third objective of this study. The first hurdle comprised the household
deciding whether or not to participate in commercial fertilizer market while the second hurdle
assessed how much fertilizer to buy conditional upon the participation decision (Goetz, 1992;
Key et al., 2000; Holloway et al., 2001; Bellmare and Barrett, 2006).
The choice of which model to use depends on the underlying distribution of the dependent
variable. For example, if the dependent variable is normally distributed, the ordinary least
squares (OLS) technique is used (Wooldridge, 2002). If it is continuous but limited within some
range, the Tobit model is used (Baum, 2006). If the dependent variable involves count data, then
the Poisson model is used (Crawley, 2005). In this study, the probit model was used for in the
first hurdle because that hurdle involved a binary choice of whether or not to participate in
commercial fertilizer market outlets. Truncated regression was then used in the second hurdle to
assess the factors influencing how much fertilizer to buy from commercial sources contingent
upon the participation decision.

24
2.6 Empirical review
Several studies have been undertaken in many countries to evaluate the effect of fertilizer input
vouchers on commercial fertilizer sales. For example, Xu et al. (2009) using double hurdle
model, examined the impact of government input programs on crowding out the private sector in
Zambia using a double-hurdle model. The study found that in areas where the private sector was
fairly active and the average wealth was high, input subsidies substantially crowded out the
private sector. On the other hand, in poorer areas where the private sector was relatively inactive,
subsidies helped to generate demand and crowd in the private sector.
Like Xu et al. (2009), the current study recognizes two parallel fertilizer distribution channels.
However, the current study differs from Xu et al. (2009) in that once the national subsidized
fertilizer is paid for farmers can only get it through NCPB depots but not from the private
markets.
Ricker-Gilbert et al. (2011) used a double-hurdle model to evaluate whether subsidies crowd out
commercial fertilizer sales in Malawi. The study found that on average, crowded out 0.22 kg of
commercial fertilizer. In addition, one kilogram of subsidized fertilizer increased fertilizer use by
0.18 kg among the poorest farmers and 0.30 kilogram among relatively non-poor farmers. This
meant that fertilizer subsidies targeted to the rural poor increased total fertilizer use albeit also
distorting the market. Ricker-Gilbert and colleagues’ study is useful to the current one in terms
of econometric modeling regarding how to control for potential endogeneity caused by the non-
random targeting of fertilizer subsidy in the North Rift of Kenya.
Mason and Jayne (2012) used a double-hurdle model to assess the effect of fertilizer subsidies in
crowding out the commercial fertilizer outlets in Zambia.

25
The study found that each additional kg of subsidized fertilizer received by a household
decreased the quantity of fertilizer purchased from commercial retailers by 0.13 kg. In addition,
the displacement effect was 0.23 kg in areas where the private sector was operating well.
Moreover, the displacement rate was higher among households that cultivated two or more acres
of land than among those that cultivated smaller areas. The authors also found that the
displacement rates were higher among male-headed households (0.15) than among female-
headed ones (0.09). The study used the double hurdle model which informed the current study on
the considerations for various methodological approaches.
Jayne et al. (2013) used a double-hurdle model to evaluate the effect of fertilizer subsidy
programs on commercial outlets in Kenya, Malawi and Zambia. The authors found that fertilizer
subsidies crowded out commercial fertilizer outlets in all the three countries. An additional
kilogram of subsidized fertilizer distributed in Malawi, Zambia, and Kenya crowded out 0.18 kg,
0.13 kg and 0.43 kg of commercial fertilizer respectively. In addition, the crowding out was
higher for subsidized fertilizer distributed to households with large land sizes. In all the three
countries, an additional ton of subsidized fertilizer allocated to households with large farm sizes
doubled the magnitude of crowding out. In Malawi, for instance, 251 kg of commercial sales
were displaced compared to 27 kg if the subsidized fertilizer were allocated to households with
small land sizes. According to Jayne et al (2013), the crowding out effect was lower in areas with
low commercial fertilizer demand. The study informed the current one on important background
information on the determinants of the quantity of subsidized fertilizer acquired by households.
Mason and Ricker-Gilbert (2013) used a combination of correlated random effects (CRE) Tobit
estimation with a control function to test and control for endogeneity in assessing the effect of
input subsidies on commercial seed outlets in Malawi and Zambia.

26
The study found that an additional kilogram of subsidized maize seed crowded out 0.58 and 0.49
kg of commercial improved maize seed in Malawi and Zambia respectively. The authors also
found that acquiring subsidized fertilizer had no effect on commercial seed purchases in both
countries. In addition, the study found that on average, an additional hectare of land owned by
the household led to 11.30 and 0.19 more kgs of subsidized fertilizer purchased by households in
Malawi and Zambia respectively.
Although Mason and Ricker-Gilbert (2013) examined the effects of maize seed subsidy on
commercial seed markets, it is informative to the current study in terms of providing some of the
important variables to include in the estimation the double-hurdle model and the use of the
control function to control for potential endogeneity.
Liverpool-Tasie (2014) used a double-hurdle model to assess the effect of fertilizer voucher
system on farmer participation in private fertilizer markets in Nigeria. The study found that the
farmers that received subsidized fertilizer had a higher probability of participating in the private
fertilizer markets in subsequent years than those who did not because the fertilizer was
distributed through private markets. The study concluded that fertilizer subsidies enhanced the
commercial fertilizer market. In the Nigerian case, the farmers were given fertilizer vouchers
redeemable from commercial dealers. This practice differs from that in Kenya where no such
vouchers are issued in Tier 1 (see Figure 1.1). However, the beneficiaries vetted at the village
level redeem their stamped forms with the NCPB. Although Liverpool-Tasie (2014) focused on
the effect of targeted fertilizer on farmer participation in commercial markets, the relevance of
this study to the current one is that it provides useful information for identification of regressors
to include in the empirical models. Additionally, the current study used a similar methodological
approach especially in regard to the formulation of double-hurdle model.

27
2.7 Summary
The literature reviewed in the fore-going sections shows that fertilizer subsidies can either
crowd-in or crowd-out commercial fertilizer markets. In addition, the effect of subsidy programs
in commercial outlets is dependent on the level of administrative efficiency, the size of the
subsidy program, targeting, and timeliness of fertilizer distribution. Various models have been
suggested in the literature to assess the effect of subsidies on farmer participation and the level of
participation in commercial fertilizer markets.
This study used the double-hurdle model because of its ability to address corner solution
challenges with estimating input demand. It also allows for the possibility that the factors
influencing the likelihood of market participation be different from those influencing the level of
participation contingent upon the participation decision. From the literature reviewed, only Xu et
al. (2009) explicitly modeled farmers’ fertilizer purchase behavior where subsidy programs
parallels the commercial ones. Even then, according to Xu et al. (2009), in Zambia, private firms
had been contracted to distribute fertilizer on behalf of government to the targeted households.
This departs from the Kenya’s national subsidy program in that it is non-targeted.
The next chapter describes the methodology applied in this study.

28
CHAPTER THREE
METHODS AND DATA
3.1 Theoretical framework
This study is anchored on the Agricultural Household Model (AHM). Agricultural households in
developing countries are faced with challenges that influence their livelihood and livelihood
strategies (Ellis, 1993; Carney, 1998). According to Singh et al. (1986), the AHM recognizes that
farmers consume the agricultural output they produce. The model assumes that farm output is
consumed by producing households, with the surplus being marketed, a reality for most farm
households in developing countries (ibid). At the core of household models is the concept of
separability. Separability means that production, consumption and labor supply decisions in a
household are independent of each other. According to Taylor and Adelman (2003),
consumption and production decisions in developing countries are jointly determined.
According to Singh et al. (1986), the AHM assumes that households maximize utility derived
from the proceeds of production and family labor subject to a set of constraints. In any
production cycle, the ith household is assumed to maximize the following utility function (ibid.):
) (3.1)
where is an agricultural staple, is a market-purchased good, and is leisure subject to a
cash income constraint:
) ) (3.2)
where is price of the market-purchased commodity, is price of the staple, is household
production of the staple, Q- is the marketed surplus, is market wage, is total labour, is
family labor input [so that if L-F>0, then the household hires labor; if L-F<0 then the household
supplies off-farm labor], and is any non-labor non-farm income (ibid.).

29
The household also faces a time constraint. This is because it cannot allocate more time to
leisure, on-farm production or off-farm employment than the total time available. Therefore,
(3.3)
where T is the total household time. It also faces a production technology constraint that depicts
the relationship between inputs and farm output:
) (3.4)
where is the household's fixed quantity of land and is its fixed stock of capital.
The three constraints on household behavior can be collapsed into a single one (Singh et al.,
1986) by substituting the production constraint into the cash income constraint for and
substituting the time constraint into the cash income constraint for yields:
(3.5)
where ) is a measure of farm profits.
In equation (3.5), the left-hand side ( ) shows the total household
expenditure on the market-purchased commodity, the household's purchase of its own output and
time in form of leisure. The right-hand side is a development of Becker's concept of full income,
in which the value of the stock of time owned by the household is explicitly recorded as labor
income (Becker, 1965). The extension of the AHM is the inclusion of a measure of farm profits
(Taylor and Adelman, 2002):
(3.6)

30
In this case, all labor is valued at the market wage. Equations 3.1 to 3.5 show that the household
can choose different levels of consumption for the agricultural staple, market-purchased good
and leisure. Maximizing utility subject to the single constraint in equation 3.5 yields the
following first order conditions (Singh et al., 1986):
⁄ (3.7)
⁄ (3.8)
⁄ (3.9)
The first-order conditions on the production side can be solved for optimal input demand (L*)
and output supply (Q*) in terms of prices, wage rate, land and capital:
) (3.10)
) (3.11)
In this study, equation 3.10 took the following general form:
) (3.12)
where is the quantity of commercial fertilizer purchased at market price by the
farmer, is quantity of subsidized fertilizer received, is average price of all
commercial inorganic fertilizers purchased by the household with an exception of foliar feed;
is price of output (maize in this case), K, A and Z represent access to credit, land size
and household socio-economic characteristics that affect the demand for fertilizer. The
estimation of equation 3.12 uses standard econometric techniques associated with compensated
input demand functions (Debertin, 1986).

31
In equation 3.12 following Roy (1951); Cameron and Trivedi (2005, 2009), = 0 is
determined by the density f1(.)such that P( ) = 0 = f1(0) and P( ) > 0 is
determined by f2( | > 0) = f2( )|1 − f2(0). The associated likelihood
function whose log is maximized can be expressed as:
{ )}
{ )
) )} 3.12
3.2 Empirical framework
3.2.1 Assessing factors influencing the quantity of subsidized fertilizer acquired by a
household in North Rift region of Kenya
To assess the factors influencing the quantity of subsidized fertilizer acquired by the ith farmer, a
Tobit model was fitted into the data:
(3.13)
This equation was used to generate Tobit model residuals (Ωi) that were then used in the second
stage of the double-hurdle model to test and control for endogeneity.
Table 3.1 presents a summary of variables in equation (3.13) that were hypothesized to affect
quantity of subsidized fertilizer acquired by households in North Rif region and their expected
signs.

32
Table 3.1: Description of variables hypothesized to influence quantity of subsidized
acquired by fertilizer in the North Rift of Kenya
Variable Description Measurement Hypothesized
signs
Dependent variables:
Quantity of subsidized fertilizer
purchased in 2013 /2014
Kg
Independent variables: AGE Age of household head Years +
GENDER Gender of household head Dummy (1 =Male, 0= Female) +
EDUC Years of formal schooling of
household head
Years +
LANDSIZ
E
Total farm size Acres -
HHSIZE Household size Number +
NONINC
M
Non-farm income per year KShs -
TLU Total Livestock Units Number -
WEALTH
CAT
Household wealth category
based on PCA
Categorical (1 = “Poor”, 2 =
“Middle class”, 3=“Rich”)
-
CRD Access to credit facilities in
2013/2014 cropping season
Dummy (1 = Yes, 0 = No) +
NCPB Distance to nearest NCPB depot Kilometers -
MOBILE Ownership of mobile phone Dummy (1 = Yes, 0 = No) +
TRANSP
ORT
Ownership of a transport
equipment
Dummy (1 = Yes, 0 = No) +
MAIZEP
RIC
Price of output/90kg bag KShs +
FERTPRI
C
Price of fertilizer/kg KShs +
LEADER
SHIP
If a member of the household
belong to the same family, or
belong to a group or are in any
way connected to government
officials in the fertilizer subsidy
vetting committee.
Dummy (1 = Yes, 0 = No) +
Source: Author (Survey data)

33
3.2.2 Justification for inclusion of regressors in the Tobit Model
The following factors were hypothesized to influence the quantity of subsidized fertilizer
acquired by a household.
(a) Socio-economic factors
AGE: This was measured in years representing the age of the household head. It was a
continuous variable. According to Frank (1995), older individuals are able to assess the utility of
new agricultural technologies by relating their perception of the practice to their experience and
interpreting the value of that practice to their needs. If that experience suggests that the potential
rewards to be gained adopting the new practice is greater than the expected effort or cost, the
individual is likely to adopt it (Rogers, 1962). In this study, older household heads could have
enabled farmers to establish social capital and networks with village chiefs who were responsible
for approving the fertilizer subsidy forms. Therefore, older farmers would acquire more
subsidized fertilizer than younger ones. Therefore, AGE was hypothesized to be positively
associated with the quantity of subsidized fertilizer acquired by households in North Rift region
of Kenya. According to Xu et al. (2009), age of the household head increased the quantity of
subsidized fertilizer acquired by households in Zambia by 4.41 kg.
GENDER: This was a dummy variable one and zero representing male- and female-head of
household respectively. Being a male-headed household was expected to be positively related
with the quantity of subsidized fertilizer acquired by the household. This is because male-
headed households tend to In Kenya, Foeken et al. (2002) found that women-headed households
were using less chemical fertilizer than their male-headed counterparts. This is because female-
headed households lack the resources to purchase chemical fertilizer. In Uganda, Okoboi and

34
Barungi (2012) found that female-headed households were less likely to use chemical fertilizers
compared to their male-headed counterparts. The authors attributed to this to dominance of male
extension workers in Uganda who focused their services mostly to fellow men. In this study,
GENDER was hypothesized to be positively related to the quantity of subsidized fertilizer
acquired by households.
EDUC: This variable represented the number of years of household head in formal school.
Generally, more educated farmers are able to get and make use of information on input and
output markets at reduced transaction costs than less educated ones (Sigei et al., 2014).
Additionally, education has a positive effect on the likelihood of a household accessing financial
assets or being more attractive to financial services providers to enable them acquire the
necessary farm inputs (Diagne and Zeller 1998; Tu et al., 2015). Such households are more likely
to participate in product and factor markets (Obisesan et al., 2013). Additionally, more educated
farmers are often more enlightened than uneducated ones on the benefits of using modern inputs
such as fertilizer (ibid.). In this study, EDUC was expected to be positively related with the
quantity of subsidized fertilizer acquired by the household.
LANDSIZE: This was a continuous variable representing the total land area cultivated by the
household. It was derived from summing up the total land owned and rented. Larger land sizes
increase the demand for inputs purchased by a household (Sall et al., 2000; Adegbola and
Gardebroek, 2007). Additionally, land can be used as collateral for credit hence increasing
household’s purchasing power of farm inputs (Abeykoon et al., 2013). However, Feder et al.
(1985) report that in developing countries, farm size may be negatively correlated with the
demand for fertilizer as households with smaller land sizes use fertilizer more intensely to
improve productivity than their counterparts.
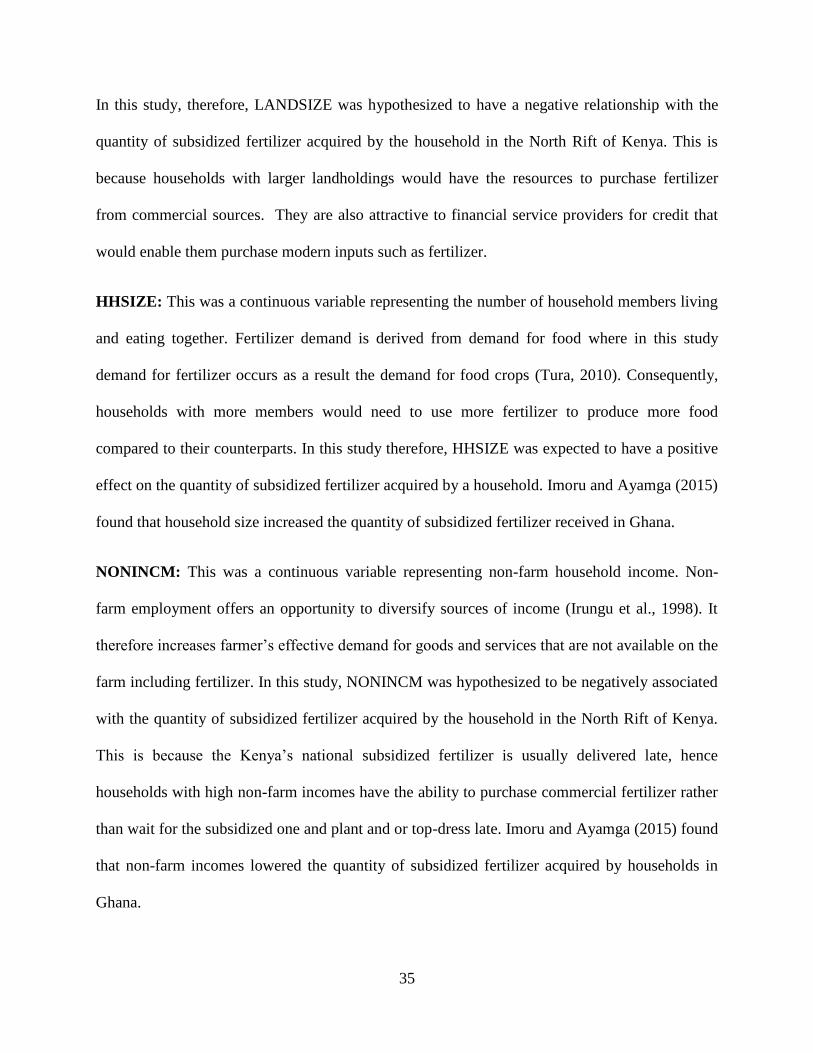
35
In this study, therefore, LANDSIZE was hypothesized to have a negative relationship with the
quantity of subsidized fertilizer acquired by the household in the North Rift of Kenya. This is
because households with larger landholdings would have the resources to purchase fertilizer
from commercial sources. They are also attractive to financial service providers for credit that
would enable them purchase modern inputs such as fertilizer.
HHSIZE: This was a continuous variable representing the number of household members living
and eating together. Fertilizer demand is derived from demand for food where in this study
demand for fertilizer occurs as a result the demand for food crops (Tura, 2010). Consequently,
households with more members would need to use more fertilizer to produce more food
compared to their counterparts. In this study therefore, HHSIZE was expected to have a positive
effect on the quantity of subsidized fertilizer acquired by a household. Imoru and Ayamga (2015)
found that household size increased the quantity of subsidized fertilizer received in Ghana.
NONINCM: This was a continuous variable representing non-farm household income. Non-
farm employment offers an opportunity to diversify sources of income (Irungu et al., 1998). It
therefore increases farmer’s effective demand for goods and services that are not available on the
farm including fertilizer. In this study, NONINCM was hypothesized to be negatively associated
with the quantity of subsidized fertilizer acquired by the household in the North Rift of Kenya.
This is because the Kenya’s national subsidized fertilizer is usually delivered late, hence
households with high non-farm incomes have the ability to purchase commercial fertilizer rather
than wait for the subsidized one and plant and or top-dress late. Imoru and Ayamga (2015) found
that non-farm incomes lowered the quantity of subsidized fertilizer acquired by households in
Ghana.

36
TLU: This was coded as a continuous variable representing the number of tropical livestock
units (TLUs) owned by the household. The TLU was obtained by multiplying the number of
livestock owned by the household with the corresponding conversion factor for each species:
cattle = 0.7, sheep = 0.1, goats = 0.1, pigs = 0.2, chicken = 0.01 based on Food and Agricultural
Organization (FAO, 2004). In this study, TLU was used as a proxy for the quantity of own-
produced manure accessible to the household. According to Ali et al. (2012), manure can be
used as a substitute for inorganic fertilizer thereby reducing the demand for fertilizer. Therefore,
TLU was hypothesized to have a negative relationship with the quantity of subsidized fertilizer
acquired by a household in the North Rift of Kenya. This is because the higher the number of
animals kept the higher the likelihood that the farmer will have access to more manure for his/her
crop production and therefore less need for inorganic fertilizer.
WEALTHCAT: This was coded as a categorical variable where 1 = “Poor”, 2= “Middle class”
and 3=“Rich” household respectively. WEALTHCAT was derived from Principal Component
Analysis (PCA) which aggregates assets owned by the household to generate a household wealth
index (Moser and Felton, 2007; Córdova, 2009). To compute the principal components, asset
ownership was coded as a dummy where one and zero represented ownership and non-ownership
respectively. Following Moser and Felton (2007), the eigen values generated by the PCA were
used as weights for the positive response. Finally, the factor scores from the PCA were
multiplied by number of assets owned as below:
∑
(3.14)
where WWHHi is the household wealth index for the ith household, is the factor score or PCA
weight of asset j owned by the ith household, and is the jth asset owned by the ith household.

37
On the basis of the values of the asset index the consumers were classified into “Rich” that were
the top 20 % which was followed by “Middle” 40% and “poor” 40%.
Studies show that poor households face entry barriers in access to markets due to low levels of
physical and financial assets (Ellis, 2000; Holloway et al., 2001 and Khatun and Roy, 2012).
This means subsidizing fertilizer is an incentive for the poor households to acquire more
fertilizer. Using the rich as the base category, this study hypothesized a negative relationship
between WEALTHCAT and the quantity of subsidized fertilizer acquired by a household in
North Rift of Kenya. According to Imoru and Ayamga (2015), the richer in n Ghana received
disproportionately more fertilizer than the poor.
LEADERSHIP: This variable was coded as a dummy with one representing a social
relationship with officials of the village fertilizer subsidy vetting committee and zero otherwise.
Liverpool-Tasie (2014) found that being a relative of one of the farm group leaders in Nigeria
increased the number of bags subsidized fertilizer received by households due to social capital.
In the current study, LEADERSHIP was hypothesized to be positively related to the quantity of
subsidized fertilizer acquired by the household. This is because fertilizer subsidy beneficiaries
are vetted by the local leaders. In Ghana, Imoru and Ayamga (2015) found that community
leadership positively influence quantity of subsidized fertilized acquired by household. The
authors attributed the positive relation with the fact that the input subsidy program in Ghana was
channeled through village leader.
(b) Institutional factors
CRD: This variable was coded as a dummy with one and zero representing household access to
agricultural credit.

38
Access to credit has been shown to increase farmers’ purchasing power thus enabling them to
procure farm inputs and cover operating costs (Guirkinger and Boucher, 2005; Eswaran and
Kotwal, 1990; Komicha and Öhlmer, 2007). In Peruvian agriculture, Guirkinger and Boucher
(2005) found that credit obtained from informal lenders increased household access to inputs. In
this study, therefore, CRD was hypothesized to have a positive association with the quantity of
subsidized fertilizer acquired by a household in North Rift region of Kenya.
(c) Infrastructural factors
NCPB: This variable was continuous representing distance to the nearest fertilizer seller. This
variable was to assess whether location of NCPB depots has an influence on the quantity of
subsidized fertilizer acquired by a household. NCPB is a government marketing board which
procures and sells maize and fertilizer at administratively determined prices (Jayne et al., 2008).
Studies show that distance to input markets is a major constraint to the quantity of input
purchased by farm households (Goetz, 1992; Montshwe, 2006; Bahta and Bauer, 2007; Omiti et
al., 2009). In this study, NCPB was hypothesized to be negatively related with the quantity of
subsidized fertilizer acquired by households in the North Rift of Kenya.
MOBILE: Ownership of a mobile phone was coded as a dummy variable with one representing
ownership and zero otherwise. In this study, ownership of mobile phone was hypothesized to
have a positive effect on the quantity of subsidized fertilizer acquired by households in North
Rift region of Kenya. This is because a mobile phone increases farmer access to agricultural
information (Sigei, 2014; Nyamba and Mlozi 2012).

39
According to Fafchamp and Hill (2005), poor access to market information results in
information-related problems, namely moral hazard and adverse selection, which in turn increase
transaction costs. This discourages some farmers from accessing farm inputs.
TRANSPORT: This variable represented household ownership of transport equipment. It was
coded as a dummy with one denoting ownership and zero otherwise. According to Key et al.
(2000), ownership of a means of transport such as bicycle, motorcycle, car and truck has
increases the quantity of fertilizer purchased by a household. This is because fertilizer is a bulk
commodity and ownership of a means of transport enables the household to haul large quantities
of the input to reduce transportation cost. In this study, therefore, TRANSPORT was
hypothesized to have a positive association with the quantity of subsidized fertilizer acquired by
a household in North Rift region of Kenya. This is because ownership of a transport equipment
reduce transaction costs as subsidized fertilizer is distributed via NCPB depots located at major
towns
(d) Market factors
MAIZEPRIC: This was coded as a continuous variable representing the market price (in Kenya
shillings) of a kilogram of maize reported by sample households during the season just prior to
the survey 2013. In Kenya, Alene et al. (2008) found the price of maize to be positively related
with the quantity of subsidized fertilizer acquired by a household. This was because high output
price acted as an incentive for sellers to supply more in the market where they enjoyed greater
margins due to the fertilizer subsidy. In Nigeria, Liverpool-Tasie (2012) found that price of
maize was positively correlated with the quantity of fertilizer received.

40
Therefore, in this study, MAIZEPRIC was hypothesized to be positively associated with the
quantity of subsidized fertilizer acquired by households in North Rift region of Kenya.
FERTPRIC: This variable was a continuous one representing the median price of a kilogram of
fertilizer in Kenya shillings as reported by households. In this study the price of fertilizer was
hypothesized to have a negative effect on quantity of subsidized fertilizer acquired by
households in North Rift region of Kenya, This means that the higher the price of fertilizer, the
less likely farmers are to purchase it.
3.2.3 Assessing the effect of subsidized fertilizer on household participation and level of
participation in commercial fertilizer outlets in North Rift region of Kenya
To achieve this objective, a choice had to be made between using a double-hurdle, a Heckman or
a Tobit model, all of which have potential for use in a two-step decision making process as in the
case of this study. The traditional approach to deal with datasets that have zeros arising from
non-response is the use of Tobit model (Tobin, 1958). However, according to Burke (2015), the
Tobit model is too restrictive as it assumes that the same set of variables determine both the
probability of engaging in a behavior as well as the extent of engaging in that behavior.
The double-hurdle model overcomes the restriction of the Tobit model by allowing different
mechanisms to determine the discrete probability of participation as well as the level of
participation (Cragg, 1971). The Heckman and double-hurdle models are similar in identifying
the rules governing the discrete (zero or positive) outcomes. Both models recognize that
outcomes are determined by the participation in the first step and level of participation in the
second step. They also permit the possibility of estimating the first and second stage equations
using different sets of explanatory variables.

41
However, the Heckman, as opposed to the double-hurdle model, assumes that there are no zero
observations in the second stage once the first-stage selection is passed (Tura, 2010).
To choose between the three models, the study used the Vuong (1989) test. The test involves the
computation of a likelihood ratio (LR) in which the log-likelihood of each model is estimated
separately and the test statistic is estimated as:
{ }
) ) (3.15)
where is the test statistic. The test statistic has a chi-square distribution with degrees of
freedom equal to the difference between number of free parameters of the alternative and the null
model (Satorra and Bentler, 2001). Table 3.2 summarizes the LR test statistics to choose between
a double-hurdle, a Heckman and a Tobit model for use in the third objective of this study. The
null hypothesis was that either Tobit or Heckman is superior to the double-hurdle model. As
shown in Table 3.2, the two null hypotheses were rejected confirming that the double-hurdle
model was best suited for use in this study.
Table 3.2: Summary of likelihood ratio tests for choosing between double-hurdle, Tobit
and Heckman models
Model Chi-square p-value Decision
Tobit vs double-hurdle 767.11 0.000 Reject Tobit
Heckman vs double-hurdle 5.5962 0.017 Reject Heckman
Tobit vs Heckman 762.2095 0.000 Reject Tobit
Source: Author (Survey data)

42
Based on these results, a double-hurdle model was used. In the first step (or hurdle), the factors
influencing the probability of a household participating in commercial fertilizer markets were
evaluated. The second step involved assessing the level of household participation in commercial
fertilizer markets contingent upon the participation decision.
The double-hurdle model assumed that the zeros in the dataset arose from a rational choice by
the household rather than missing observations (Burke, 2009).
Sample selection bias was suspected from the underlying random tendency of human subjects to
self-allocate among one treatment group or another in non-experimental research designs
(Heckman, 1979). If uncorrected, self-selection bias can lead to inconsistent β estimates due to
self-selection (ibid.). In order to correct for selection bias, the IMR, λi, was computed in the first
stage probit model following Wooldridge (2010) as follows:
)
) (3.16)
where ϕ and ф are, respectively, the density and distribution function for standard normal
variable, and
(3.17)
where is a vector of explanatory variables hypothesized to influence household demand for
commercial fertilizer including household demographic and socio-economic characteristics while
are unknown parameters to be estimated and 𝜎2 is the variance.
In the second hurdle, the IMR obtained in the first hurdle was used as one of the regressors to
control for self-selection bias. The average partial effects (APEs) were obtained at the means of
the dependent variables from the MARGINS command in Stata (StataCorp, 2005).

43
The coefficients in the first hurdle constituted the participation APEs while those in the second
hurdle were the conditional APEs.
3.2.3.1 Assessing the determinants of households participation in commercial fertilizer
outlets in North Rift region of Kenya
A double-hurdle model was used for this objective. The first stage of the model determined the
likelihood of a household participating in commercial fertilizer outlets using the following probit
model:
(3.18)
Equation 3.18 was used to compute the IMR using equations 3.16 and 3.17.
3.2.3.2 Assessing the effect of subsidized fertilizer on the level of participation in
commercial fertilizer outlets in North Rift region of Kenya
In the second stage of the double-hurdle model, the level of farmer participation in commercial
fertilizer outlets was estimated using the quantity of fertilizer purchased by each household from
those outlets as the dependent variable. The IMR computed in stage 1 (equation 3.18) was used
as a regressor to account for sample selection bias.
Equation 3.19 was fitted to the data to assess the determinants of the quantity of fertilizer
purchased by the sample households from the commercial market outlets:

44
(3.19)
Table 3.3 highlights the hypothesized variables and their expected signs for the double-hurdle
model given in equations 3.18 and 3.19.
3.2.4 Justification for inclusion of regressors in the double-hurdle model
(a) Socio-economic factors
AGE: This was measured in years representing the age of the household head. Age of the
household head was used as measure of risk attitude of the farmer (Mukundi, 2014; Sebatta et
al., 2014). Studies show that older farmers have experience in fertilizer use and therefore
understand its benefits and hence are more likely than younger farmers to participate in
commercial fertilizer markets (Olwande and Mathenge, 2010). On the other hand, age can
negatively influence a household’s market participation decision. According to Kisaka-Lwayo et
al. (2005), younger farmers are more likely to take risks and may be willing to take up new ideas
such as participating in commercial fertilizer outlets. In this study, older farmers could have
created huge social capital, accumulated over the years, with the Chiefs responsible for
approving the fertilizer subsidy forms. Thus, they would be less willing to participate in
commercial fertilizer outlets relative to younger farmers. There, AGE was hypothesized to be
negatively related with the likelihood of farmer participation and level of participation in
commercial fertilizer market in North Rift of Kenya.

45
Table 3.3: Description of variables in the double-hurdle model and their hypothesized signs
Variable Description Measurement Hypothesized
signs
Hurdle
1
Hurdl
e2
Dependent variables:
Participation in commercial fertilizer
market outlets
Dummy (1 = Yes, 0 = No)
Quantity of commercial fertilizer
purchased by a household
Kg
Independent variables:
AGE Age of household head Years - -
GENDER Gender of household head Dummy (1 =Male,
0= Female)
+ +
EDUC Years of formal schooling of
household head
Years + +
LANDSIZE Total land size cultivated Acres + +
HHSIZE Household size Number + +
NONINCM Non-farm income KShs ± ±
TLU Total Livestock Units Number - -
WEALTHCA
T
Household wealth category Categorical (1 =
“Poor”, 2 = “Middle
class”, 3=”Rich”)
- -
CRD Access to credit facilities in
2013/2014 cropping season
Dummy (1 = Yes, 0
= No)
+ +
DISTFERT Distance to nearest fertilizer seller Kilometers - -
MOBILE Ownership of mobile phone Dummy (1 = Yes, 0
= No)
+ +
TRANSPOR
T
Ownership of a transport equipment Dummy (1 = Yes, 0
= No)
+ +
MAIZEPRIC Price of output/90kg bag KShs + +
FERTPRIC Price of fertilizer/kg KShs - -
QSUBSIDY Quantity of subsidized fertilizer
acquired
Kg ± ±
IMPROVED
SEED
If a household used improved maize
seed in 2013/2014 cropping season
Dummy (1 = Yes, 0
= No)
+ +
Source: Author (Survey data)

46
GENDER: This was coded as a dummy variable with one and zero representing male and
female head of household respectively. The gender of the household head was hypothesized to
influence market participation positively because male households might have more information
on production technologies and input access than their female counterparts (Moono, 2015).
Additionally, male-headed households could also be wealthier than their female-headed counter-
parts and this could allow male-headed households to own more productive assets which
increase the chances of producing a marketable surplus.
In SSA, female-headed households are more likely to be resource poor and hence less likely to
participate in markets (Gebregziabher, 2010). Reyes et al. (2012) found that the gender of the
household head positively influenced households’ probability of market participation but had no
effect on the intensity among potato producers in Mozambique. Siziba et al. (2010), found
gender not to have significant influence on the probability and intensity of market participation
among cereal producers in SSA. Further, Omiti et al. (2009) found the gender of the household
head to positively influence intensity of market participation among kale producers in Kenya. In
this study therefore, being male was hypothesized to be positively related with the probability
and level of farmer participation in commercial fertilizer outlets in the North Rift of Kenya.
EDUC: This represented the number of years the household head took in formal school.
Generally, more educated farmers are able to get and make use of information on input /output
markets at reduced transaction costs than less educated ones (Sigei et al., 2014). Additionally,
education has a larger impact on the likelihood of a household to access financial assets or be
more attractive to financial services providers (Diagne and Zeller 1998; Tu et al., 2015). Such
households are more likely to participate in product and/or factor markets (Obisesan et al., 2013).

47
This may be due to the fact that more educated farmers are enlightened on the benefits of using
fertilizer in crop production (ibid.). In this study, EDUC was expected to be positively
associated with the probability and level of household participation in commercial fertilizer
outlets in the North Rift of Kenya.
LANDSIZE: This was a continuous variable representing the total land farmed by the
household. It was derived from adding owned to rented land. Larger land sizes influence the size
of marketable surplus and hence a higher probability to participate in input markets (Olwande
and Mathenge, 2010; Sall et al., 2000; Adegbola and Gardebroek, 2007). Moreover, land can be
used as collateral for credit hence increasing household’s purchasing power of farm inputs
(Abeykoon et al., 2013). Larger landholdings indicate that potentially high amounts of fertilizer
are needed (Liverpool-Tasie, 2014). In this study, therefore, LANDSIZE was hypothesized to
have a positive relationship with the probability and level of farmer participation in commercial
fertilizer outlets.
HHSIZE: This was a continuous variable representing the members of the household living and
eating together. Ceteris paribus, larger families have higher food demand compared to smaller
ones. Because fertilizer demand is derived from the demand for food, large family sizes may
need to use more fertilizer than smaller families in order to meet their food requirement (Tura,
2016). Thus, larger families would have a higher likelihood to participate in commercial
fertilizer markets relative to smaller ones. Because the quantity of subsidized fertilizer acquired
by the household from government depots is seldom enough, this study hypothesized a positive
relationship between HHSIZE and the probability and level of household participation in
commercial fertilizer outlets in the North Rift of Kenya.

48
NONINCM: This was a continuous variable representing non-farm income. Non-farm income
increases household’s participation in input markets particularly among households with no
access to credit (Lamb, 2003). Conversely, households with high non-farm income save more
and in turn are able to access credit for investment in agricultural production (Reardon et al.,
2007). It has been observed that when the off-farm activity is lucrative, households shun away
from farm activities and therefore participate less in agricultural markets (Bjornsen and Mishra,
2012). Based on these contrasting observations, the relationship between non-farm income and
the probability and level of household participation in commercial fertilizer outlets was
considered indeterminate.
TLU: This was a continuous variable representing the number of tropical livestock units (TLUs)
owned by the household calculated as shown in Section 3.2.2. Households with many livestock
(hence higher TLUs) were expected to have more manure than those with less. This is because
manure is a substitute for commercial fertilizers, whose prices rose sharply in recent (Huang,
2009; MacDonald, 2009). Such households are expected to use less inorganic fertilizers and
therefore less likely to participate in private fertilizer markets (Nambiro and Okoth, 2013).
Therefore, in this study, TLU was hypothesized to have a negative effect on both the probability
and the level household participation in commercial fertilizer outlets in the North Rift of Kenya.
WEALTHCAT: This was coded as a categorical variable where 1 = “Poor”, 2=’Middle class”
and 3=”Rich” household respectively as shown in Section 3.2.2. Using the rich as the base
category, it was hypothesized that WEALTHCAT would be negatively associated with the
probability and level of household participation in commercial fertilizer outlets in North Rift of
Kenya. This is because the poor lack the resources needed to purchase fertilizer from the
commercial outlets.

49
(a) Institutional factors
CRD: This variable was coded as a dummy with one and zero representing access to agricultural
credit. Access to agricultural credit is an important factor influencing adoption of new
technology such as high yielding varieties and fertilizers (Morris et al., 1999; Gemeda et al.,
2001; Adesina and Zinnah, 1993; Langyintuo et al., 2005; Langyintuo and Mekuria, 2005).
Therefore, households with access to credit are able to participate in markets. In this study,
access to credit was hypothesized to have a positive relationship with the probability of as well
as the extent of household participation in commercial fertilizer markets in the North Rift of
Kenya.
(c) Infrastructural factors
DISTFERT: This was a continuous variable representing distance to the nearest fertilizer seller.
This variable assessed as distance from the homestead to the nearest fertilizer seller in
Kilometers. According to Ariga and Jayne (2010), households located 10 kilometers away from
fertilizer selling points had 23 percent probability of not participating in input markets in Kenya.
Sheahan (2011) found that distance to the nearest fertilizer selling point in Kenya was a major
disincentive to fertilizer use although otherwise profitable. In this study, distance to the nearest
fertilizer seller was hypothesized to be negatively related with the probability as well as the level
of household participation in commercial fertilizer markets in North Rift region.
MOBILE: Mobile phone ownership was coded as a dummy where one and zero represented
ownership and non-ownership. Mobile phones speed up ways in which farmers get information
and are becoming increasingly crucial as an infrastructural device for improving efficiency of
agriculture markets and improve participation in Tanzania (Nyamba and Mlozi 2012).

50
According to Key et al. (2000), ownership of communication equipment such as mobile phone
and radio has a positive influence on farmer participation in product and factor markets. This is
because it reduces transaction costs which in turn lower cost of production. In this study,
ownership of a mobile phone was therefore hypothesized to have a positive effect on both the
probability and extent of household participation in commercial fertilizer markets in North Rift
region of Kenya.
TRANSPORT: Ownership of a means of transport was coded as a dummy where one
represented ownership and zero otherwise. Ownership of a means of transport increases the
chances of households participating in input markets as it reduces transportation costs (Jagwe,
2011). Mather et al. (2011) found that ownership of an ox-cart positively influenced both the
probability and intensity of market participation among maize producers in Zambia. Reyes et al.
(2012) found that ownership of a bicycle only influenced the intensity of market participation
positively among potato producers in Mozambique. In this study, ownership of a means of
transport was hypothesized to positively influence both the probability as well as intensity of
market participation in commercial fertilizer markets in North Rift region of Kenya.
(d) Market factors
MAIZEPRIC: This variable was continuous representing the price in Kenya shillings of a
kilogram of maize in North Rift region paid by households for the largest quantity of maize
during the 2013 /2014 cropping season. Maize prices determine income and economic welfare of
households which in turn influence production decision and consequently market participation
(Benfica et al., 2006). Moono (2015) found that output price positively influenced farmer
decision to enter and the extent of participation in the banana markets in Zambia.

51
Farm output prices impact positively on market participation as they act as an incentive for
increased sales (Omiti et al., 2009; Enete and Igbokwe, 2009). According to Barnard et al.
(2016), the demand for most agricultural goods is derived demand. Therefore, ceteris paribus, an
increase in maize demand increases the demand for fertilizer and high maize prices encourage
households to produce more (ibid.). In this study, the price of maize, the main crop grown in the
North Rift region of Kenya was hypothesized to have a positive effect on the probability and
level of market participation in commercial fertilizer outlets.
FERTPRIC: This variable was continuous representing the price of a kilogram of fertilizer (in
Kenya shillings) paid by households during the 2013 2014 cropping season. In farm input market
participation studies, price is used as a measure of consumers' sensitivity to price or the price
elasticity of input demand (Anderson et al., 1997). Based on the law of demand, an increase in
the price of a commodity reduces the quantity demanded (Varian, 1992). In this study,
FERTPRIC was hypothesized to have a negative effect on the probability and level of household
participation in commercial fertilizer outlets in the North Rift region of Kenya.
QSUBSIDY: This was a continuous variable representing the quantity of subsidized fertilizer
acquired by households from the NCPB. Fertilizer subsidies have had mixed effect on farmer
participation in commercial fertilizer markets.
Xu et al. (2009); Ricker-Gilbert et al. (2011) and Mason and Jayne (2012) found that when
subsidized fertilizer is injected into the market, it reduces farmer participation in commercial
fertilizer outlets. On the other hand, Liverpool-Tasie (2012; 2014) found that receiving
subsidized fertilizer through a voucher redeemable through the private sector increased the
probability and extent of farmer participation in the private fertilizer markets.

52
In this study, QSUBSIDY was hypothesized to have a negative or a negative effect on the
probability and level of household participation in commercial fertilizer outlets in the North Rift
region of Kenya following the findings of Xu et al. (2009), Ricker-Gilbert et al. (2011) and
Mason and Jayne (2012). This is because in the Kenyan case the subsidized fertilizer is likely to
displace the commercial one.
IMPROVEDSEED: This variable was coded as a dummy to represent use of improved maize
seed with one denoting use and zero otherwise. Use of improved seed increases the marketable
surplus of the output therefore positively influencing household to participate in the market
(Ferris et al., 2001). Studies indicate that farmers’ failure to adopt improved inputs such as high
yielding seed varieties, fertilizer, among others, leads to low productivity and therefore reduced
marketable surplus, which ultimately, reduces the degree of market participation (Ferris et al.,
2001; Nkonya and Kato, 2001; Aliguma et al., 2007). In this study, use of improved maize seeds
was hypothesized to have a positive effect on the likelihood as well as the level of farmer
participation in commercial fertilizer outlets in the North Rift of Kenya. This is because
improved maize varieties require concomitant application of fertilizer to ensure high yields.
3.3 Data types and sources
This study used primary data collected by Tegemeo Institute of Agricultural Policy and
Development, in North Rift region of Kenya in 2014 under Tegemeo Agricultural and Policy
Research Analysis II project (TAPRAII). The survey covered two cropping seasons in 2012-
2013 and 2013-2014. The primary data were collected using a semi-structured questionnaire to
capture farmer information and socio-economic, institutional and market factors.

53
3.3.1 Sampling frame
This study used data collected within the fifth National Sample Survey and Evaluation
Programme (NASSEP V) frame which is a household based sampling frame developed and
maintained by Kenya National Bureau of Statistics (KNBS). It is based on the list of enumeration
areas (EAs) from the 2009 Kenya Population and Housing Census. The sampling frame was
stratified according to counties and further into rural and urban areas. During the 2009
population and housing census, each sub-location was subdivided into census enumeration areas.
An enumeration area was defined as a small geographic unit with clearly defined boundaries
(UN, 2000).
The primary sampling unit for the NASSEP V master sampling frame was a cluster, which
constituted one or more EAs with an average of 100 households per cluster. The survey used a
two-stage stratified cluster sampling procedure where the first stage selected the 55 clusters from
NASSEP V using the equal probability selection method (EPSEM). The second stage randomly
selected a uniform sample of 20 households in each cluster from a roster of households in the
cluster using systematic random sampling method. Eventually, 1,100 households were selected
for the study. To compensate for household that refuse to participate in the survey, the rule of
thumb is to increase sample size by 10 percent. The sample size was calculated to give
representative estimates of various indicators for the main Agro-Ecological Zones (AEZs)
namely; Lower midlands (3-6), Upper midlands (2-6), Upper midlands (0-1), Lower highlands
and Upper highlands covering North Rift region. The sample size was determined following
Anderson et al. (2007) as:
)
4.1

54
where;
is the sample size, is the proportion of population having the major interest, is the
confidence interval and is the margin of error. Since the proportion of the population in the
study site was unknown, = 0.5, = 1.96 and = 0.0296. Thus, the sample size was determined
as:
)
= 1,100 4.2
Out of a sample size of 1,100 households, 77 did not take part in the survey while 313 did not
use fertilizers in the 2013 /2014 cropping season.
3.3.2 Selection of Clusters
The clusters were selected using the EPSEM. The clusters were selected systematically from
NASSEP V sampling frame with equal probability independently within the counties and rural
strata. The EPSEM method was adopted since during the creation of the sampling frame, the
clusters were standardized so that each could have one Measure of Size (MoS) defined as having
an average of 100 households.
3.3.3 Selection of sample households
From each selected cluster, a uniform sample of 20 households was selected systematically with
a random start. The systematic sampling method was adopted as it enables the distribution of the
sample across the cluster evenly and yields good estimates for the population parameters. The
sampling of households was done without replacement of non-responding households. Annex 1
summarizes number of households selected across agro-ecological zones and counties in the
North Rift of Kenya.

55
3.4 Data collection
Primary data were collected through Computer Aided Personal Interviews using SurveyCTO
software (SurveyCTO, 2014). The data were collected between July and September 2014 by
trained graduates recruited through a competitive process. The interviews were conducted in
Swahili and where possible in vernacular dialect.
3.4.1 Data capture and analysis
The data were downloaded from the surveyCTO server and cleaned using the Statistical Package
for Social Sciences (SPSS). Descriptive statistical and econometric analyses were undertaken
using STATA. The results were presented in tabular form.
3.5 Study area
According to MoAL&F (2014) as of 2014, Kenya had 30 active cereal depots with 43 percent of
them being in the North Rift region that encompasses Uasin Gishu, Trans-Nzoia, Elgeyo
Marakwet, Baringo, Nandi, Samburu, Turkana and West Pokot counties.

56
Figure 3.2: Map of North Rift region of Kenya
Source: www.arcgis.com
Table 3.4 presents the proportion of subsidized fertilizer distributed via NCPB depots across the
country by region. The North Rift region consumes approximately one half of the national’s
subsidized fertilizer. Approximately 85 percent of small-scale farmers in the high-potential
maize zones in the North Rift region of Kenya use fertilizer. The North Rift region alone uses 1.5
million bags of planting fertilizer yearly (Kamau et al., 2013). .This led to the choice of North
Rift region as the study area.

57
Table 3.4: Percentage of subsidized fertilizer distributed by National Cereals and Produce
Board in Kenya by region
Region 2010/2011 2011/2012 2012/2013 2013/2014 Average
North Rift 56.7 50.9 41.2 45.4 48.6
South Rift 22.4 19.8 27.2 19.7 22.2
Lake /Western 11.8 14.7 13.9 22.4 15.7
Northern 6.0 8.9 12.2 8.8 9.0
Nairobi /Eastern 2.9 5.3 5.2 3.4 4.2
Coast 0.2 0.3 0.3 0.4 0.3
Source: NCPB (Occasional reports)
3.6 Diagnostic tests
(a) Testing for multicollinearity
Multicollinearity refers to a case where one variable is a linear function of another (Wooldridge,
2002). Presence of multicollinearity leads to inefficient OLS estimates (Farrar and Glauber,
1967). It affects cross-section data such that there are wide confidence intervals leading Type 1
error (Wooldridge, 2009). According to Gujarati (2007), multicollinearity renders OLS estimates
and standard errors sensitive to small changes in the dataset.
A number of methods are used to test for multicollinearity in regression analysis including pair-
wise correlation analysis, Pearson correlation, and Variance Inflation Factor (VIF) (Weissfeld
and Sereika, 1991; Curto and Pinto, 2007; Dormann et al., 2013). This study used both VIF and
Pearson’s pair-wise correlation matrix to test for multicollinearity. According to Kleinbaum et
al. (1988), a VIF value greater than 10 indicates a problem of multicollinearity. The results of
VIF presented in Annex 2 show that the VIF was less than 1.67, indicating absence of
multicollinearity among the explanatory variables.

58
With regard to the pair-wise correlation, a statistically significant Pearson correlation coefficient
between any two regressors that is greater or equal to 0.8 indicates existence of multicollinearity
(Gujarati, 2007). Based on the results presented in Annex 3, none of the explanatory variable had
a statistically significant pair-wise correlation above 0.4, which shows that the data had no
multicollinearity.
(b) Testing for heteroscedasticity
Heteroscedasticity occurs when the variance of the error term is not consistent, leading to
inefficient and invalid test of hypothesis (Wooldridge, 2002). If present in the data the estimates
will not be the Best Linear Unbiased Estimates (BLUE) (Gujarati, 2007). In this study, the
Breusch-Pagan/Cook-Weisberg test was used to test for heteroscedasticity under the null
hypothesis of a constant variance (homoscedasticity).
According to Coenders and Saez (2000), a significant p-value of the Breusch-Pagan/Cook-
Weisberg test leads to the rejection of the null hypothesis of homoscedasticity. As shown by the
results in Annex 4, the Breusch-Pagan/Cook-Weisberg test was not statistically significant
(p=0.512), we fail to reject the null hypothesis of homoscedasticity implying that
heteroscedasticity was not a problem in the dataset.
(c) Testing for endogeneity
Endogeneity occurs when a regressor is correlated with the error term of a regressand (Hanchane
and Mostafa, 2010). The presence of endogeneity leads to inconsistent parameter estimates
because explanatory variable is correlated with the error term (Antonakis et al., 2014). In this
study, endogeneity was tested using the two-step Durbin-Wu-Hausman test (Hausman, 1978).
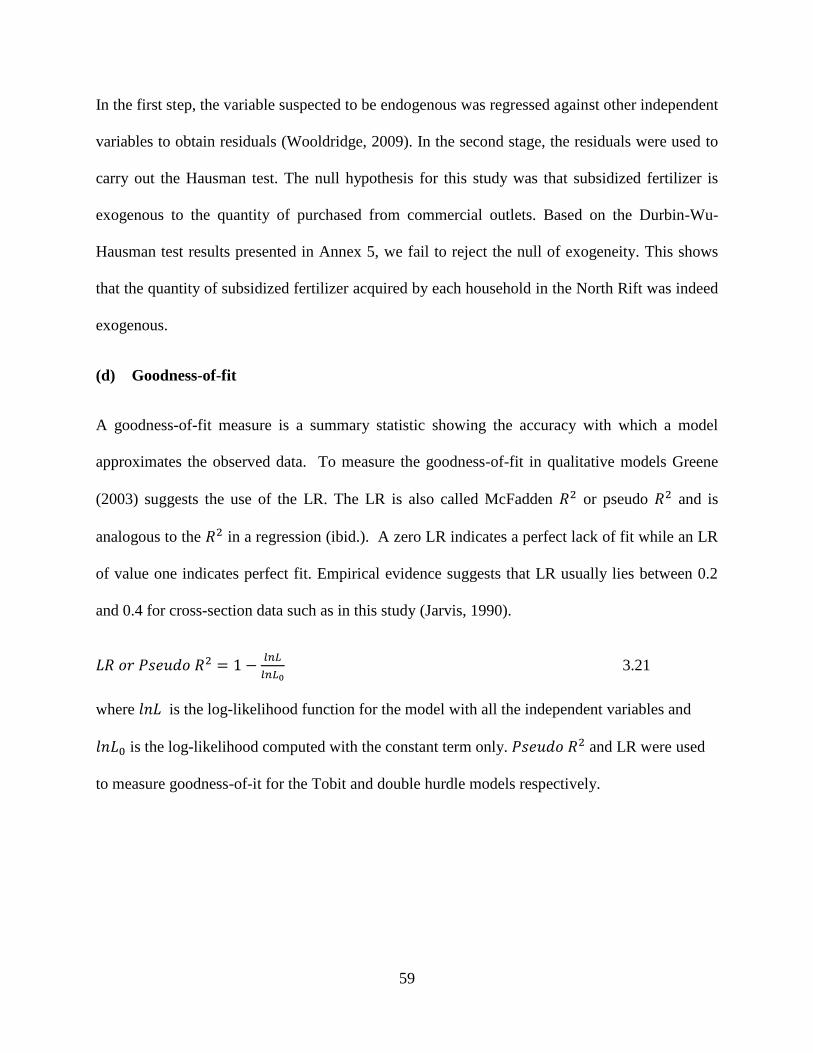
59
In the first step, the variable suspected to be endogenous was regressed against other independent
variables to obtain residuals (Wooldridge, 2009). In the second stage, the residuals were used to
carry out the Hausman test. The null hypothesis for this study was that subsidized fertilizer is
exogenous to the quantity of purchased from commercial outlets. Based on the Durbin-Wu-
Hausman test results presented in Annex 5, we fail to reject the null of exogeneity. This shows
that the quantity of subsidized fertilizer acquired by each household in the North Rift was indeed
exogenous.
(d) Goodness-of-fit
A goodness-of-fit measure is a summary statistic showing the accuracy with which a model
approximates the observed data. To measure the goodness-of-fit in qualitative models Greene
(2003) suggests the use of the LR. The LR is also called McFadden or pseudo and is
analogous to the in a regression (ibid.). A zero LR indicates a perfect lack of fit while an LR
of value one indicates perfect fit. Empirical evidence suggests that LR usually lies between 0.2
and 0.4 for cross-section data such as in this study (Jarvis, 1990).
3.21
where is the log-likelihood function for the model with all the independent variables and
is the log-likelihood computed with the constant term only. and LR were used
to measure goodness-of-it for the Tobit and double hurdle models respectively.

60
CHAPTER FOUR
RESULTS AND DISCUSSION
4.1 Household characteristics
4.1.1 Household categorization by source of fertilizer
The categorization of households by fertilizer source is as shown in Table 4.1. Out of a sample of
1,023 households, 30.6 percent did not use fertilizer. Of the 710 households that used fertilizer,
81.7 and 15.6 percent obtained theirs from commercial and subsidized sources respectively. The
rest purchased their fertilizer from both commercial and subsidized sources. This study sought to
determine the effect of fertilizer subsidy on commercial markets, the non-users were excluded;
hence, the analysis was based on 710 households.
Table 4.1: Distribution of households by source of fertilizer in north Rift region of Kenya
Attribute Number of households Percentage of households Buying
fertilizer from different sources
No fertilizer 313 30.6
Use fertilizer 710 69.4
Use commercial sources only 580 81.7
Use subsidized sources only 111 15.6
Use both sources 19 2.7
Total 1,023 100
Source: Author (Survey data)
Table 4.2 presents the mean quantity of fertilizer used per acre in the North Rift region of Kenya
in the 2013/2014 cropping season. Those that purchased subsidized fertilizer used 183.2 kg/acre
while those that used commercial fertilizer used 62.6 kg/acre. The difference was statistically
significant (p=0.05).

61
Farmers using both commercial and subsidized fertilizer used a mean of 166.6 kg/acre which
was statistically higher than that used by the households who only used commercial fertilizer
(p=0.05). This implies fertilizer subsidy has substantially lowered fertilizer prices that lead to
increased demand. On average, households that obtained their fertilizer from commercial sources
used 62.6 kg/acre. These findings are consistent with Sheahan (2011) who found that in the high
potential areas of Kenya, mono-cropped fields were fertilized at a rate between 50-91 kg/acre.
Table 4.2: Fertilizer application rates on maize among sample households in North Rift
Kenya
Fertilizer source Mean quantity kg
/acre
Std Error Range
Commercial only 62.6a 6.13 0.59 2020
Subsidized only 183.2b 32.92 4.38 2222
Use both sources 166.6b 36.43 10.88 801
Overall 82.35 7.01 .59 2222
Source: Author (Survey data)
a,b
Numbers with the same superscript are not significantly different (Tukey's HSD, < 0.05).
4.1.2 Household socio-economic characteristics
Table 4.3 presents the socio-economic characteristics of fertilizer users in the North Rift of
Kenya. Out of the 710 households who used fertilizer 81.8 percent were male-headed
households. In addition, 84.1 percent used commercial fertilizer and 69.3 percent used subsidized
fertilizer. These finding were different across the groups. Ogada et al. (2014) found that in Kenya
78 percent of the farm families were male-headed. This is lower than what the current study
found. The difference may be due to the difference in study area.
The mean age of the household head was 48 years (range=21-94). This finding is close to that of
Machio (2015) who found that the average age of a household in North Rift region was 47 years.

62
The average household size was six and did not vary significantly across the three fertilizer use
groups which are nearly the same as that of Kenya’s national mean of 5 members per household
(CBS, 2005). However, this finding compare well with that of Machio (2015) who found that the
average household size in North Rift region was 6 persons. The overall land size was 4.36 acres
(range=0.09-50) and was statistically significant across the three sources (p < 0.05).This finding
tallies with that of Unnevehr (2013) who found that the average land holding per household in
the North Rift region of Kenya is 4 acres.
Table 4.3: Means and frequencies of socio-economic characteristics of fertilizer users in the
North Rift region of Kenya
Variable Commercial only Subsidy only Dual user Overall
Frequencies
GENDER 488(84.1)a 61 (69.3)
b 19(73.1)
c 568(81.8)
WEALTHCAT
Poor 104 (17.9)a 8(9.1)
b 6 (23.1)
c 118 (17.0)
Middle 309 (53.3) 37 (42.0) 3 (11.5) 349 (50.3)
Rich 167 (28.8)a 43 (48.9)
b 17 (65.4)
c 227 (32.7)
CRD 75 (12.9) 8 (6.8) 5 (19.2) 86 (12.4)
MOBILE 507 (87.4)a 80 (90.9)
b 26 (100)
c 613 (88.3)
TRANSPORT 104 (17.9)a 17 (19.3)
b 5 (19.2)
c 126 (18.2)
IMPROVEDSEED 560 (96.6)a 85 (96.6)
b 26 (100)
c 671 (96.7)
Means:
AGE 47 (0.6) 52.2 (1.8) 48.2 (2.4) 47.7 (0.6)
EDUC 7.58 (0.2) 7.6 (0.61) 9.42 (0.91) 7.65 (0.18)
LANDSIZE 3.74 (0.21) a 6.51 (0.81)
b 10.87 (1.76)
a 4.36 (0.22)
HHSIZE 5.96 (0.11) 6.1 (0.26) 6.08 (0.34) 5.98 (0.09)
NONINCM 54250 (5831) a 88781 (12063)
a 221270 (5212)
b 64886.2
(5594)
TLU 1.22 (0.03) 1.16 (0.08) 1.48 (0.15) 1.22 (0.03)
DISTFERT 5.13 (0.29) 4.9 (0.5) 4.39 (0.72) 5.07 (0.25)
MAIZEPRIC 2602 (109) 2445 (188) 2561 (665) 2580 (97)
FERTPRIC 74.0 (0.56) a 49.4 (1.31)
b 73.2 (3.38)
a 65.5 (2.26)
N 580 111 19 710
Source: Author (Survey data)
Numbers in brackets among frequencies and means represent percentages and standard errors
respectively. a
,b Numbers with the same superscript are not significantly different from
each other (p < 0.05).

63
Of the 710 households interviewed, 12.4 percent had accessed credit 12 months prior to the
survey. Access to credit did not vary across the three sources. Another 88.3 percent and 27.7
percent had a mobile phone and an on-farm means of transport respectively. These findings were
significantly different (χ2=11.30).
When grouped in terms of wealth status, 17.0, 50.3 and 32.7 percent of the households were in
the “poor,” “middle class,” and “rich” categories respectively. About 48.9 and 42.0 percent of
households in the “rich” and “middle class” categories respectively received subsidized fertilizer.
The proportion of respondents in each wealth category was significantly different across the
three sources (χ2=32.31; p =0.00). This is an indication that the national fertilizer subsidy was
benefiting the better-off in North Rift region in Kenya. Place et al. (2004) found that wealth
positively influence use of chemical fertilizer in Kenya. Hence, it can be inferred that it is only
the well-off in terms of income that can effectively utilize the input provision programs whether
subsidized or commercial.
4.2 Factors influencing the quantity of subsidized fertilizer acquired by households in
North Rift region of Kenya
Table 4.4 presents the determinants of the quantity of subsidized fertilizer that acquired by each
household from the NCPB in the North Rift of Kenya. The pseudo R2 of 0.694 shows a good fit
indicating that the model fitted the data well. Out of the 15 variables evaluated, 11 were
statistically significant. Of these, four and seven variables were, respectively, negatively and
positively correlated with the quantity of subsidized fertilizer acquired by each household.

64
Table 4.4: Maximum likelihood estimates of factors influencing the quantity of subsidized
fertilizer acquired by households in North Rift region of Kenya
Variable Coefficient† Std Error t-value
AGE 0.13* 0.08 1.74
GENDER 0.67** 0.28 2.42
EDUC 0.0091* 0.02 0.39
LANDSIZE 0.04** 0.02 2.37
HHSIZE -0.02 0.04 -0.43
NONINCM 0.00 0.00 1.52
TLU -0.31** 0.14 -2.16
WEALTHCAT
Poor -1.17*** 0.31 -3.76
Middle -0.56** 0.25 -2.26
CRD -0.78** 0.35 -2.22
DISTFERT -0.03 0.02 -1.42
MOBILE 0.77* 0.45 1.73
TRANSPORT 0.56** 0.23 2.41
MAIZEPRIC 0.00 0.00 1.75
FERTPRIC -0.00 0.01 -0.05
LEADERSHIP 0.20*** 0.09 2.30
Log likelihood -371.83
Pseudo R2 0.69
Prob > Chi2 0.00
Source: Author (Survey data)
*, ** and *** represent statistical significance at 10%, 5% and 1% levels respectively.
As expected, the age of the household head had a positive influence on the quantity of subsidized
fertilizer acquired by the household. An additional year in the age of the household head
increased quantity of subsidized fertilizer acquired by the household by 0.1 kg. This could be due
to the fact that elderly heads of household have greater social capital in terms of social networks,
influence and relationships particularly with the Vetting Committee, which enabled them to
acquire the subsidized fertilizer.

65
This finding tallies with that of Ricker-Gilbert et al. (2011) who reported that households with
older heads had long term strong relationships and networks with government officials charged
with vetting the beneficiaries of subsidized fertilizer in Malawi. In that study, each additional
year lived in a village increased the quantity of subsidized fertilizer by 0.09 kg which compares
well with the current study.
Male-headed household had a positive and significant effect on the quantity of subsidized
fertilizer acquired. According to Chibwana (2010), female-headed households in Malawi
acquired 6.1kg less than the male-headed households. This is because female-headed households
face numerous challenges associated with agricultural production such as cultural discrimination,
lack of access to job opportunities, low literacy and lack of regular income that could impact on
program participation and fertilizer use. According to Peterman et al. (2014), female-headed
households are more likely to be asset poor and subsistence oriented than their wealthier male
counterparts who stand to benefit from technologies such as fertilizer subsidy in developing
countries.
Ricker-Gilbert and Jayne (2009) found that female-headed households in Malawi received less
subsidized fertilizer than their male counterparts. In this study, being in a male-headed household
increased the quantity of subsidized fertilizer acquired by the household by 0.67kg. This is
because female-headed households are more likely to have less social capital compared to male-
headed households. In addition, the time taken to acquire fertilizer from NCPB depots is high
and women have many other household chores to attend to.

66
The years in formal school of the household head had a positive influence on the quantity of
subsidized fertilizer acquired by the household as expected a priori. This is because human
capital represented by the head’s formal education increases households’ understanding of
market dynamics hence influences their demand for modern inputs such as fertilizer. In addition,
education may increase the household head’s bargaining power with the subsidy vetting
committee. This finding tallies with that of Wu (1977) who reported that in the short run,
education increased the quantity of subsidized fertilizer acquired in Taiwan. The author
attributed this to the likelihood that education improves farmer perceptions about inorganic as
opposed to organic farming. In this study, an additional year of formal school by the household
head increased the quantity of subsidized fertilizer acquired by 0.009 kg. Even though this
quantity is quite low, it implies there is an element of elite capture in the distribution of the
national fertilizer subsidy in the study area.
As expected a priori, the coefficient on land size was positive and statistically significant at 5
percent level. An additional acre of land owned by a household increased the quantity of
subsidized fertilizer received by a household.. This means that large farm owner were more
likely to benefit from the national fertilizer subsidy than their counterparts. Imoru et al. (2015)
made a similar finding for Ghanaian farmers where an additional acre of land increased the
quantity of subsidized fertilizer received by 0.05 kg.
The number of TLUs owned by a household had a negative but significant effect on the quantity
of subsidized fertilizer acquired as expected a priori. This could be due to the fact that more
livestock produce more manure, which is a substitute for fertilizer.

67
Therefore, households will demand less subsidized fertilizer as the number of livestock owned
increases. Jaleta et al. (2009) found that a unit increase in the number of livestock owned
reduced the quantity of fertilizer purchased by households in Ethiopia. This is because manure is
a substitute for chemical fertilizers. On the other hand, Minot et al. (2000) found that each
additional livestock owned by the household reduced the quantity of fertilizer used by one
kilogram in Benin. In this study, one additional TLU reduced the amount of subsidized fertilizer
acquired by the household by 0.3 kg. This means that farmers in the North Rift region of Kenya
would substitute inorganic fertilizer for manure leading to better soils at less cost.
Compared to rich household, being in either a poor or middle wealth household had a negative
and significant effect on the quantity of subsidized fertilizer acquired by a household in the study
area as expected. This is because poor households use less fertilizer on their plots possibly due to
low income. According to Shively and Ricker-Gilbert (2013), the demand for inorganic fertilizer
was positively correlated with household wealth. In this study, a shift from being in a rich to a
poor or middle income category would reduce the quantity of subsidized fertilizer received the
household by 1.2 and 0.6 kg respectively.
This observation can be explained by two plausible reasons: one, poor households may not have
the ability to purchase the subsidized fertilizer, and two, richer households may in addition have
the social capital and persuasive power to engage the members of the village fertilizer subsidy
vetting committee thereby benefiting enormously from the subsidy. This implies that the better-
off in North Rift region of Kenya seem to benefit more from the national fertilizer subsidy.

68
While targeting based on poverty level was strictly not the objective of the national fertilizer
subsidy, the significance of poor and middle income households receiving less quantities of
subsidized fertilizer suggests that the beneficiaries of the subsidized fertilizer scheme included a
good portion of wealthy households. Direct targeting of the poor household is necessary.
Contrary to expectation, access to credit had a negative but significant effect on the quantity of
subsidized fertilizer acquired by the household. This means that households which did not have
access to credit acquired 0.8 kg less than their counterparts. This was probably because farmers
who accessed credit had the means to purchase commercial fertilizer from the market.
Additionally, studies show that subsidized fertilizer in the North Rift is often delivered late so
that farmers are often obliged to purchase from the market (Kamau et al., 2013; Kamoni, 2013).
Liverpool-Tasie (2014) found that access to credit lower the quantity of subsidized fertilizer
received by 0.07 kg in Nigeria. This means that access to credit does not change farmers'
production decisions.
As expected, ownership of a mobile phone had a positive and significant effect on the quantity of
subsidized fertilizer acquired by households in North Rift region. This could be attributed to the
fact that a mobile phone can be used to provide market information, which lowers information
acquisition costs to reduce information asymmetry. In this study, ownership of a mobile phone
increased the quantity of subsidized fertilizer received by 0.8 kg. This means that use of mobile
phones make it easier for farmers make optimal marketing by providing accurate and real-time
information on (Deichmann et al., 2016). Kikulwe et al. (2014) found that ownership of a
mobile phone significantly increased the quantity of inputs purchased as it reduced the
transaction costs.

69
Ownership of a mode of transport had a positive influence on the quantity of fertilizer subsidized
fertilizer acquired by households in North Rift region as expected a priori. This is because
ownership of transport equipment reduces transport costs resulting in high profit margins. In
addition, households owning transportation equipment would more likely use fertilizer since they
would be in a better position to get it from the distribution center to the homestead.In this study,
ownership of a farm transport increased the quantity of subsidized fertilizer acquired by 0.6kg.
This result is consistent with that of Key et al. (2000) who found that ownership of a means of
transport lowered the proportional transaction costs thereby enhancing the intensity of market
participation in SSA.
As expected, the relationship between any household member and officials of the Location
Subsidy Fertilizer Vetting Committee had a significant and positive effect on the quantity of
subsidized fertilizer received by a household. This finding suggests that there is a possibility of
the vetting process being undermined by such relationships. This could be in form of lobbying
or rent-seeking by either interest groups or individuals, which ultimately adversely affects the
distribution of subsidized fertilizer.
This finding tallies with that of Liverpool-Tasie (2014) who reported that households whose
members were related to the farm group leadership received 1.6 kg more than their counterparts
in Kano Nigeria. Shively and Ricker-Gilbert (2013) found that in Malawi, household heads that
had lived in their villages for longer periods received 100kgs over households’ heads that had
lived for shorter period. The length of residency was influential in creating ties between the
village heads and members of the Village Development Committees responsible for selecting the
beneficiaries of fertilizer subsidy in Malawi.

70
In this study, having a relationship with officials of the fertilizer subsidy Vetting Committee
increased the quantity of subsidized fertilizer received by a household by 0.2kg. Based on
previous studies, this is relatively low.
4.3 Determinants of market participation and the extent of participation in commercial
fertilizer markets in North Rift region of Kenya
4.3.1 Factors influencing household participation in commercial fertilizer outlets
Table 4.5 presents the maximum likelihood estimates of the determinants of farmer participation
in commercial markets in the North Rift of Kenya. The likelihood ratio testing for the goodness-
of-fit of the double-hurdle model was 0.79 indicating a good fit. Out of 18 variables, 6 were
statistically significant. Half of these variables had a positive effect on the probability of a
household participating in commercial fertilizer outlets while the other half had a negative effect.
As expected, the number of years of formal schooling of the household head had a positive and
significant effect on the likelihood of a household participating in commercial fertilizer
markets.This can be attributed to the fact that more educated heads of households are likely to be
more aware and enlightened about the benefits of new technologies such as fertilizer relative to
their non-educated counterparts. Ceteris paribus, an additional year of formal schooling of the
household head increased the likelihood of a household participating in commercial fertilizer
markets by 0.14 percent.
This finding is consistent with that of Martey et al. (2012) who reported that education is
positively correlated with commercialization of smallholder agriculture in Ghana. According to
Enete and Igbokwe (2009), education equipped households with better production and
managerial skills in cassava production in Africa.

71
Lubungu et al. (2012) also found formal education to be an essential tool for utilization of market
information dynamics in Zambia. In Ethiopia, Tura et al. (2010) found that the households that
were headed by literate persons were more likely to adopt improved technologies compared to
their non-educated counterparts.
Table 4.5: Maximum likelihood estimates of factors influencing farmer participation in
commercial fertilizer markets in North Rift region of Kenya
Variable Coefficient Std error t-value AGE -0.00 0.00 -0.44 GENDER 0.09 0.12 0.74 EDUC 0.01* 0.01 1.68 LANDSIZE 0.05 0.01 4.90 HHSIZE 0.03 0.02 1.74 NONINCM 0.02* 0.01 2.82 TLU 0.19 0.06 3.29 WEALTHCAT
Poor -0.36 0.31 -1.16 Middle -0.26 0.24 -1.11 CRD -0.00 0.00 -0.35 DISTFERT -0.00* 0.00 1.76 MOBILE 0.11 0.13 0.87 TRANSPORT 0.00 0.01 0.03 MAIZEPRIC 0.00 0.00 1.53 FERTPRIC -0.23*** 0.10 2.16 QSUBSIDY -0.29*** 0.13 -2.32 IMPROVEDSEED 0.61*** 0.27 2.28
Prob > Chi2 0.0000
-1305.1124
-1305.1124 Source: Author (Survey data)*, **, *** represent statistical significance at 10%, 5%, and 1%
levels respectively.
Non-farm income had a positive and significant effect on the probability of a household
participating in commercial fertilizer markets in the study area. This can be attributed to the fact
that non-farm income contributes to the total household income, which, if large enough, enables
households to purchase farm inputs (Reardon et al., 1988; 2007).

72
Thus, high income households are expected to be more likely to participate in the input markets
compared to their low income counterparts. This finding is consistent with that of Martey et al.
(2012) who reported that investment of non-farm income in farm technology increased
production volumes and the marketable surplus thereby increasing the likelihood of the
household participating in the market in Ghana. In the current study, a one shilling increase in
non-farm income increased the probability of a household participating in commercial fertilizer
markets by 0.02 percent. This increase was relatively low compared to previous studies.
Distance to the nearest fertilizer seller had a negative but significant effect on the probability of
households participating in commercial fertilizer markets in the North Rift of Kenya. This is
because longer distances raise both travel time and costs, which impact negatively on market
participation (Kafle, 2010). This finding is consistent with that of Gebremedhin and Jaleta (2010)
who reported that distance to nearest fertilizer seller had a one percent reduction in the likelihood
of a household participating in bean markets in Ethiopia. Liverpool-Tasie (2014) also reported
that distance to the main market lowered the probability of households participating in
commercial outlets by 22 percent in Nigeria.
According to Ricker-Gilbert et al. (2011), distance to input markets reduced Malawian farmers’
probability of participating in commercial fertilizer markets by 0.2 percent. Ariga and Jayne
(2010) also found that households located 10 kilometers away from fertilizer sellers in the high
potential areas in Kenya decreased their likelihood of participating in commercial fertilizer
markets by 23 percent. In this study, an additional kilometer to the nearest fertilizer seller
decreased the probability of households participating in commercial fertilizer markets in the
North Rift by 0.42 percent. This reduction tallies with previous literature.

73
The price of commercial fertilizer had a negative but significant effect on the probability of a
household participating in commercial fertilizer outlets in the North Rift of Kenya. This is
attributable to the law of demand (Varian, 1992). Higher commodity prices diminish consumers’
propensity to participate in markets in order to minimize expenditure (Beemanya, 1978). In this
study, the negative effect of fertilizer price on the probability of households participating in
commercial fertilizer outlets could be attributed to high fertilizer prices in Kenya in the recent
past. This indicates that farmers in the North Rift are price sensitive.
Thus, a one percent increase in fertilizer price would reduce the propability of a household
participating in commercial fertilizer outlets by 22 percent. Liverpool-Tasie (2014) and Ricker-
Gilbert et al. (2009) independently found that the price of fertilizer had a negative effect on
household participation in private fertilizer markets in Nigeria and Malawi respectively. The
authors attributed their findings to the fact that farmers were rational and paid attention to input
prices, which is similar to the current case.
The quantity of subsidized fertilizer acquired by the household had a negative but significant
effect on the likelihood of farmers participating in commercial fertilizer outlets in North Rift as
expected a priori. This finding can be attributed to the fact that the subsidized fertilizer is a
cheaper substitute of commercial fertilizer. Thus, an additional kilogram of subsidized fertilizer
would reduce the probability of households participating in commercial fertilizer outlets by 29
percent, which is somewhat huge. In a similar study in Malawi, Ricker-Gilbert et al. (2011)
found that an extra kilogram of subsidized fertilizer decreased the likelihood of a household
participating in commercial fertilizer outlets by 10 percent.

74
As expected a priori, the use of improved maize seed increased the probability of a household
participating in commercial fertilizer markets in the North Rift region of Kenya by 60 percent.
This can be attributed to the fact that the adoption of improved maize varieties requires
concomitant adoption of production-enhancing technologies that include appropriate fertilizer.
Bett et al. (2015) observed that the use of fertilizer increased the probability to use improved
maize varieties by 28 percent in the moist transitional zone of eastern Kenya. Ricker-Gilbert
(2013) also reported that in Malawi, the farmers who had planted improved maize varieties used
approximately 50 kg more of fertilizer than those that had not.
The authors argued that high crop yield response is realized when improved seed, fertilizer and
other soil fertility management technologies are combined. Liverpool-Tasie and Sheu (2013)
found that the use of improved maize seed led to an increase in the likelihood of farmers
participating in commercial fertilizer markets in Nigeria. Likewise in this study, use of improved
maize seed increased the likelihood of households participating in commercial fertilizer outlets
by 61 percent.
4.3.2 Factors influencing the level of household participation in commercial fertilizer
outlets in North Rift region of Kenya
Table 4.6 shows the effect of the selected variables on the quantity of commercial fertilizer
purchased conditional upon the participation decision. The residual, Ώ, which measured the
endogeneity of subsidized fertilizer was not statistically significant indicating that the quantity of
subsidized fertilizer acquired by households was not endogenous (see the details in Section
3.2.1). The IMR was negative but statistically significant (t=0.026).

75
This implies that the self-selection bias suspected in the probit model (see Section 4.3.2) was
present but successfully controlled by the inclusion of the IMR in equation (3.19). Six out of nine
variables had a positive influence on the quantity of commercial fertilizer purchased while three
variables had a negative effect.
Land size had a positive and significant effect on the quantity of commercial fertilizer purchased
by a household as expected. This is because land sizes are associated with wealth that influences
the ability to purchase fertilizer from commercial outlets. These results are consistent with the
finding by Liverpool-Tasie (2014) who observed that larger landholdings potentially require
larger quantity of fertilizer in Nigeria. Minot et al. (2009) found that each additional hectare was
associated with an additional 170 kg of fertilizer used in Ghana. In the current study, an acre
increase in land size increase the quantity of fertilizer purchased from commercial outlets by
0.45 kg.
As expected, the size of the household had a positive and significant effect on the quantity of
fertilizer purchased from commercial outlets. This suggests that a large household is more likely
to use fertilizer than a small one. This probably due to the fact a large family contributes to the
labor required in the application of fertilizer. In addition, large families have a high demand for
food.
This finding supports that of Deininger and Okidi (1999) who reported that large families may
use fertilizer to fulfill higher food requirement in cases where expanding land holding is
restricted by imperfect or missing land markets in Uganda. In this study, an additional member
increased the quantity of fertilizer purchased from commercial outlets by 0.15 kg.

76
Table 4.6: Maximum likelihood estimates of factors influencing the level of participation in
commercial fertilizer outlets in North Rift region of Kenya
Variable Coefficient Std error t-value
AGE -0.04 0.00 0.00
GENDER 0.14 0.13 0.02
EDUC 0.03 0.01 0.00
LANDSIZE 0.45*** 0.17 2.59
HHSIZE 0.15* 0.08 1.92
NONINCM 0.01*** 0.00 3.24
TLU 0.18*** 0.06 3.08
WEALTHCAT
Poor -0.39 0.12 -0.05
Middle -0.26 0.14 -0.04
CRD 0.04 0.16 0.01
DISTFERT -0.12** 0.05 -2.31
MOBILE 1.23** 0.59 2.09
TRANSPORT 0.13** 0.12 0.02
MAIZEPRIC 0.00 0.00 0.00
FERTPRIC -0.24*** 0.05 -4.55
QSUBSIDY -0.22*** 0.08 -2.62
IMPROVEDSEED 0.63 0.26 0.16
Ώ 0.01 0.00 0.01
IMR -0.05* 0.03 -1.88
Prob > Chi2 0.0000
-1305.1124
-1305.1124
Source: Author (Survey data)
*, **, *** represent statistical significance at 10%, 5%, and 1% levels respectively. The
coefficients and p-values were obtained by the MARGINS command in STATA.
Non-farm income had a positive and significant effect on quantity of commercial fertilizer
purchased. This implies that households in the North Rift were using some of their non-farm
income to purchase fertilizer for production. The households which participated in non-farm
activities purchased 0.01 kg more than those which did not. In Ethiopia, Nasir and Hundie (2014)
found that, on average, households that participated in non-farm activities used 65 kg of urea and
91 kg of DAP to fertilizer their farms.

77
The authors attributed this positive effect to the fact that non-farm income increases rural
incomes, which in turn increases agricultural productivity due to increased access to modern
inputs.
Contrary to expectation, TLU had a positive and significant effect on the quantity of commercial
fertilizer acquired by the household. Therefore, an additional TLU would increase the quantity
of commercial fertilizer purchased by household by 0.2 kg. This is because TLU is a measure of
income level and hence wealth status of the households. This improves households’ purchasing
power and their liquidity, hence buying this input. Ketema and Bauer (2011) found that livestock
holding increased the quantity of fertilizer used in Ethiopia by 0.092 kg. This indicates that
availability of manure is less important in determining its application.
Distance to the nearest fertilizer seller had a negative but significant effect on quantity of
fertilizer purchased from commercial markets in the North Rift as expected. This means that
households farther away from a fertilizer seller purchased smaller quantities of commercial
fertilizer. This is because long distances to market increase both transport and transaction costs.
According to Sadoulet and De Janvry (1995), costs incurred from poor infrastructure, long
market distance, imperfect information and high marketing costs are major market constraints in
agrarian households in developing countries. In this study, an additional kilometer in distance to
a fertilizer seller would reduce the quantity of fertilizer purchased from commercial outlets by a
0.11 kg. In the North Rift region of Kenya, commercial fertilizer distribution channels are quite
developed hence low negative marginal effect.

78
As expected, ownership of a mobile phone had a positive and significant effect on the quantity of
fertilizer purchased by a household in the study area. In this study, ownership of a mobile phone
increased the quantity of fertilizer purchased by each household from commercial outlets by 1.23
kg. This could be attributed to the fact that a mobile phone can be used to acquire information as
well as making it easier and faster to carry out financial transactions and reduce barriers to
fertilizer access. According to Lio and Liu (2006), ownership of mobile phone increases overall
agricultural productivity because it facilitates the adoption of modern agricultural inputs such
fertilizers. This means that use of mobile phones can increase use of modern inputs such as
fertilizer as farmers can receive information and decide on where, to whom, and when to
purchase inputs more easily than without mobile phones (Tadesse and Bahiigwa, 2015).
According to Kijima (2016), ownership of a mobile phone increased quantity of subsidized
fertilizer purchased by 0.92 kg in Nigeria.
Ownership of a mode of transport had a positive influence on the quantity of fertilizer purchased
from commercial outlets as expected. This is because ownership of transport equipment reduces
transport and travel costs resulting in higher profit margins. This result is consistent with that of
Key et al. (2000) who reported that ownership of a means of transport in SSA lowered the
proportional transaction costs thereby enhancing the intensity of market participation. In this
study, owning to owning a means of transport increased the quantity of fertilizer purchased from
commercial outlets by 0.13kg. Demeke et al. (1998) found that ownership of transport equipment
lowered transportation costs and increased farmer participation in modern input markets in
Ethiopia. Ownership of transport equipment could be attributed to the fact that households with
these means of transport could be using them to transport fertilizer from the market to their
homes and therefore the positive effect.

79
The price at which commercial fertilizer was sold exerted a significant and negative effect on
quantity of fertilizer purchased from the commercial outlets as expected a priori. The finding is
consistent with economic theory of the existence of an inverse relationship between price and
demand (Imoru and Ayamga, 2015). In this study, an additional ten shillings on price would
lower the quantity of fertilizer purchased from commercial outlets by 2.4 kg. Sheahan et al.
(2016) found that fertilizer price reduces the amount purchased by household by 0.17 kg in
Kenya. This means that, an increase in the price of fertilizer would reduce the quantity
purchased as expected.
As expected a priori, one kilogram of subsidized fertilizer acquired by a household reduced the
quantity of fertilizer purchased from commercial markets. Ricker-Gilbert and Jayne (2009) found
that the quantity of subsidized fertilizer provided to farmers in Malawi displaced 0.2 kg from the
private market in Malawi. Ricker-Gilbert et al. (2011) also found that an additional kilo of
subsidized fertilizer crowded out 0.22 kg of commercial fertilizer in Malawi. Xu, et al. (2009)
reported that one kilogram of subsidized fertilizer crowded out 0.12 kg of commercial fertilizer
in Zambia. In this study, an additional kilogram of subsidized fertilizer acquired by a household
displaced 0.22kg of fertilizer purchased from the commercial outlets in the North Rift of Kenya.
In the next chapter, the summary, conclusions and recommendations are presented.

80
CHAPTER FIVE
SUMMARY, CONCLUSIONS AND RECOMMENDATIONS
5.1 Summary
The main focus of this study was to assess the effect of the national fertilizer subsidy on farmer
participation in commercial fertilizer outlets in the North Rift region in Kenya. The region was
selected because it consumes more than half of the total subsidized fertilizer in Kenya. It also has
13 out of the 30 active NCPB depots in the country through which subsidized fertilizer is
distributed. The objectives of the study were (i) to describe the socio-economic characteristics of
farmers in the North Rift region of Kenya disaggregated by fertilizer source, (ii) to identify the
determinants of the quantity of subsidized fertilizer acquired by households in the North Rift
region of Kenya, (iii) to assess the effect of subsidized fertilizer on farmer participation and the
level of participation in commercial fertilizer outlets in the North Rift region of Kenya.
The study used primary data collected in 2014 by Tegemeo Institute of Agricultural Policy and
Development. The data were collected using a structured questionnaire administered to 1,023
households and 710 households reported to have used fertilizer in the 2013/2014 cropping
season. The households were selected through a two-stage stratified cluster sampling technique.
Descriptive statistics were used to describe the survey respondents by fertilizer source, while a
Tobit model was employed to evaluate the determinants of the quantity of subsidized fertilizer
acquired by households. Thereafter, a double-hurdle model was used to assess the effect of
subsidized fertilizer on farmer participation as well as the level of participation in commercial
fertilizer outlets in the North Rift region of Kenya.

81
Of the 710 households who used fertilizer, 12.4 percent had accessed credit 12 months prior to
the survey while 88.3 percent and 27.7 percent had mobile phone and transport equipment
respectively. When grouped in terms of wealth status, 17.0 percent 50.3 percent and 32.7 percent
of the households were in the “poor,” “middle class,” and “rich” categories respectively. In
addition, about 48.9 percent and 42.0 percent of households in the “rich” and “middle class”
categories respectively compared to 9.1 percent poor households purchased subsidized fertilizer.
Age, being in a male-headed household, years of formal school of the household head, land size,
ownership of a mobile phone and transport equipment, and relationship with the Subsidy
Fertilizer Location Vetting Committee officials positively influenced the quantity of subsidized
fertilizer acquired by households in the North Rift region of Kenya. These findings indicate that
the level of social connection affects how much subsidized fertilizer a household receives.
Further, being in a “poor” or “middle” income household and access to credit negatively
influenced the quantity of subsidized fertilizer acquired in the North Rift region of Kenya. These
results indicate that the current national fertilizer subsidy benefits the wealthier households in
North Rift region.
The factors that positively influenced farmer participation in commercial fertilizer markets were
the number of years of formal school of the household head, non-farm income and use of
improved maize seed. The level of market participation was positively influenced by land size
owned, household size, non-farm income, TLU, and ownership of a mobile phone and farm
transport. These findings provide useful insight on what factors need to be targeted in order to
stimulate participation and level of participation in commercial fertilizer markets. These factors
must be considered in order to accurately understand farmer market participation decision.

82
On the other hand, distance to the nearest fertilizer vendor, fertilizer price and the quantity of
subsidized fertilizer acquired by the household reduced households’ probability and level of
participation in commercial fertilizer markets by 29 percent and 0.2 kgs respectively in the study
area. These results provide useful information on factors that deter households’ participation and
level of participation in commercial fertilizer markets.
5.2 Conclusion
Fertilizer use is important for increasing food supply and reducing food costs especially in food
insecure countries. In an effort to correct market failure and promote pro-poor agricultural
growth, many countries in SSA have increasingly reverted to fertilizer subsidy under the general
term “smart subsidies” in an effort to increase food production. In Kenya, the national fertilizer
subsidy program aims at encouraging fertilizer use by supporting local fertilizer manufacturing
and strengthening distribution. This study assessed the effect of the national fertilizer subsidy
program on farmer participation on commercial outlets.
Results show that most of the beneficiaries of the national fertilizer subsidy program were the
richer, male, better educated farmers with larger land sizes and the wherewithal to procure
fertilizer from commercial sources instead of relying on the subsidy. Female-headed households
received disproportionately less subsidized fertilizer than their male counterparts. This may be
due to the fact that the process of acquiring fertilizer from NCPB depots is time-consuming and
women may be constrained in its acquisition by both the dominance of patriarchy in decision
making in the study area as well as time due to being the main providers of family labor at the
household level.

83
In addition, some of these beneficiaries had a relationship with the Location Fertilizer Subsidy
Vetting Committee officials and received high quantities of the subsidized fertilizer. This
preponderance raises the questions as to whether the program beneficiaries actually need the
subsidy and particularly given the huge budget outlay committed to the subsidy by the
government. It also exposes potential beneficiaries to problems of rent-seeking and other
malpractices by both the vetting committee and the NCPB. That the national fertilizer subsidy
was not explicitly designed to focus on smallholder resource-poor farmers raises questions about
its equity and sustainability. However, households that used subsidized fertilizer only applied
more fertilizer per acre than farmers sourcing it either from commercial only or both commercial
and subsidy outlets. This is an indication the fertilizer subsidy increased fertilizer use.
This study found that the quantity of subsidized fertilizer reduced household participation in
commercial fertilizer outlets by 29 percent. In addition, a kilogram of subsidized fertilizer
acquired by the household displaced 0.2 kg of commercial fertilizer demanded thereby
“crowding out” the private sector in fertilizer distribution. These findings provide quantitative
information about the displacement impacts of fertilizer subsidies on commercial
markets. Therefore, targeting must be effective to minimize displacement effect to ensure that
this program achieve the intended purpose of cost reduction and effective fertilizer supply chain.
5.3 Recommendations
1. This study found that the national fertilizer subsidy is distorting commercial fertilizer
markets. Therefore, government should consider strengthening the current NAAIAP
program which is targeted to resource-poor households through the voucher system as
practiced in Nigeria. Studies show that a well-targeted voucher system “crowds in”

84
commercial fertilizer distributors which increases efficiency and reduces red tape. In
addition, the government should consider having an exit strategy in the fertilizer subsidy
program which would assure the growth and proliferation commercial input markets in
Kenya for increased efficiency and equity.
2. The current fertilizer subsidy program is distributed via NCPB depots which are located
in major towns and therefore not fully accessible to households who lack transport
equipment or own small land sizes. This study recommends that the government should
also consider distributing subsidies through the well-established network of agro-vets in
order to reduce transaction costs associated with the acquisition of fertilizer subsidies. A
voucher-based fertilizer distribution system like in Nigeria would not only be efficient
but also equitable among resource-poor rural-based farmers.
3. The government should monitor the work of the Location Fertilizer Subsidy Vetting
Committee officials whose influence this study found had a positive impact on the
quantity of subsidized fertilizer acquired by a household. In addition, caution is required
to ensure that households report true land sizes owned in order to receive subsidized
fertilizer.
4. The design and implementation of subsidy programs should address gender-related
constraints especially distance to the nearest subsidized fertilizer distributors which is a
main barrier to women in accessing subsidized fertilizer for their small land sizes.
5. Ownership of a mobile phone was positively related to both quantity of subsidized and
commercial fertilizer received by a household. Policies that encourage access to
information should be enhanced. This could be through strengthened extension services
to provide information on fertilizer availability and costs.
85
5.4 Areas for further research
The current study did not focus on the following areas which are recommended for further
research:
1. Measuring the net social welfare effect of the fertilizer subsidy program in Kenya against
their opportunity cost in terms of displacement of other investments that are crucial in
achieving sustained improvements in rural living standards.
2. Assessing the effect of national fertilizer subsidy on total fertilizer use accounting for
possible leakages into commercial markets. This will shed light on whether the
subsidized fertilizer has actually increased total fertilizer use or whether farmers who
acquire it also leak it to agro-dealers.
3. A comparison of costs and benefits of the national fertilizer subsidy program relative to
other agricultural sector programs in Kenya. This will help the government to understand
the sustainability of the national fertilizer subsidy program
4. It is also important for a study that looks at the impact of the fertilizer subsidy on
Kenya’s macro-economic indicators such as gross domestic product, agricultural output,
general price levels and the fiscal balance, and rural wages and poverty.

86
REFERENCES
Abeykoon, M.N.D.F., Weerahewa, J., & Silva, G.L.L.P. (2013). Determinants of Market
Participation by Indigenous Poultry Farmers: A Case Study in Anuradhapura District in
Sri Lanka. Tropical Agricultural Research, 24 (4), 347-361.
Adegbola, P., & Gardebroek, C. (2007). The Effect of Information Sources on Technology
Adoption and Modification Decisions. Journal of Agricultural Economics, 37 (1),55-65.
Adesina, A., & Zinnah, M. (1993). Technology characteristics, farmers’ perceptions and
adoption decisions: a Tobit model application in Sierra Leone. Agricultural Economics
9(4), 297-311.
Alene, A., Manyong, V.M., Omanya, G. Mignouna, H.D. Bokanga, M., & Odhiambo, G.(2008).
Smallholder market participation under transactions costs: Maize supply and fertilizer
demand in Kenya. Food Policy, 33(4), 318-28.
Ali M, Ali A, Tahir M., & Yaseen, M. (2012). Growth and yield response of hybrid maize
through integrated phosphorus management. Pakistan Journal of Life and Social
Sciences, 10(1), 59-66.
Aliguma, L., Magala, D., & Lwasa, S. (2007). Uganda: Connecting Small-Scale Producers to
Markets: The Case of the Nyabyumba United Farmers Group in Kabale District.
Regoverning Markets Innovative Practice series, IIED, London.
Aloyce, G.M., Gabagambi, D.M., & Hella, J.P.,(2014). Assessment of operational aspects of the
input supply chain under national agriculture input voucher scheme (NAIVS) in
Tanzania. Journal of Development and Agricultural Economics, 6(3), 94-104.
Alston, J.M., & Hurd, B.H. (1990). Some neglected social costs of government spending in farm
programs. American Journal of Agricultural Economics, 72(1), 149-156.

87
Anderson, S. P., De Palma, A., & Thisse, J. F. (1992). Discrete choice theory of product
differentiation. MIT press.Anderson, P.L., McLellan, R.D., Overton, J.P., & Wolfram,
G.L. (1997). Price elasticity of demand. Makinac Center for Public Policy, 13.
https://www.mackinac.org/1247. Accessed August 2016.
Antonakis, J., Bendahan, S., Jacquart, P., & Lalive, R. (2014). Causality and endogeneity:
Problems and solutions. The Oxford handbook of leadership and organizations, 93-117.
Ariga, J., Jayne, T., & Nyoro, J. (2006). Factors Driving the Growth in Fertilizer Consumption in
Kenya, 1990-2005. Working Paper 24/2006, Tegemeo Institute, Egerton University,
Nairobi.
Ariga, J., & Jayne, T. S. (2010). Factors driving the increase in fertilizer use by smallholder
farmers in Kenya, 1990-2007. Yes Africa can: Success stories from a dynamic continent.
Washington DC: The World Bank. Available at http://siteresources. Worldbank.
org/AFRICAEXT/Resources/258643-1271798012256/Kenya_fertilizer_june_2010.pdf
(Accessed 15 June 2015).
Badiane, O., Collins, J., Diao, X., & Ulimwengu, J. (2015). Economic Recovery in Africa and its
Determinants. Beyond a Middle Income Africa: Achieving Economic Growth with
Rising Employment and Incomes, ReSAKSS Annual Trends and Outlook Report.
International Food Policy Research Institute (IFPRI), Washington DC.
Bahta, S. T., & Bauer, S. (2007). Analysis of the determinants of market participation within the
South African small-scale livestock sector. Tropentag papers, Witzenhausen.

88
Banful, A.B. (2010). Old problems in the new solutions? IFPRI Discussion Paper 01002,
Washington D.C., IFPRI.
Banful, A. B. (2011). Old problems in the new solutions? Politically motivated allocation of
program benefits and the ‘new’ fertilizer subsidies. World Development, 39(7), 1166-
1176.
Barahona, C., & Levy, S. (2003). How to generate statistics and influence policy using
participatory methods in research: reflections on work in Malawi, 1999-2002.Working
paper series, 212. Brighton: IDS.
Barnard, F. L., Akridge, J. T., Dooley, F. J., Yeager, E. A., & Foltz, J. C. (2016). Agribusiness
management. Routledge.
Bates, R. H. (1981). Markets and States in Tropical Africa: The Political Basis of Agricultural
Policies. Berkeley, CA, US: University of California Press.
Becker, G. (1981). A Treatise on the Family. Cambridge, MA: Harvard University Press.
Bellmare, M.F., & Barrett, C.B. (2006). An Ordered Tobit Model of Market Participation:
Evidence from Kenya and Ethiopia. American Journal of Agricultural Economics,
88(2), 324-337.
Benfica, R., Tschirley, D., & Boughton, D. (2006). Interlinked Transactions in Cash Cropping
Economics. Paper resented in Seminar on The Determinants of Farmer Participation
and Performance in Zambezi River Valley of Mozambique at the 26 International
Association of Agricultural Economists Conference in Gold Coast, Australia, August
12 to 18, 2006.

89
Bett, E.K., Mbataru, P., & Ouma, J. (2015). Drivers of adoption of Improved Maize varieties in
Moist Transitional zone of Eastern Kenya.
http://etdlibrary.ku.ac.ke/handle/123456789/12344. Accessed July 2014.
Bjornsen, H. M., & Mishra, A. K. (2012). Off-farm Employment and Farming Efficiency in
Modern Agriculture: A Dynamic Panel Analysis. In 2012 Annual Meeting, August 12-
14, 2012, Seattle, Washington (No. 124742). Agricultural and Applied Economics
Association.
Boucher, S.R., Barham, B.L., & Carter, M.R. (2005). The impact of “market-friendly” reforms
on credit and land markets in Honduras and Nicaragua. World Development, 33(1),
107-128.
Bunde, A.O., Kibet, K., Ojala, D.O., Mugo, S.W., & Chomboi, K.C. (2014). Impact of Fertilizer
Input Subsidy on Maize Production in Nandi North District, Kenya. International
Journal of Sciences: Basic and Applied Research, 15(1), 520-540.
Burke, W.J. (2009). Triple Hurdle Model of Smallholder Production and Market Participation in
Kenya’s Dairy Sector. Unpublished MSc Thesis, Michigan State University, USA.
Burke, W. J., Myers, R. J., &, Jayne, T. S. (2015). A Triple-Hurdle Model of Production and
Market Participation in Kenya's Dairy Market. American Journal of Agricultural
Economics, 7(4), 1227-1246.
Carney, D. (1998). Sustainable Rural Livelihoods: What Contributions Can We Make? London:
Department for International Development.
Case K.E., &, Fair R.C. (2007). Principles of Economics. Dorling Kindersley Pvt. Ltd. India.

90
CBS. (2005). “Geographic Dimensions of Well-Being in Kenya. Who and Where are the Poor.”
A constituency Level Profile Volume II. The Legal Press Kenya Limited, Nairobi,
Kenya.
Coenders, G., & Saez, M. (2000). Collinearity, heteroscedasticity and outlier diagnostics in
regression. Do they always offer what they claim? New Approaches in Applied
Statistics, 16, 79-94.
Choudhry, G.H., Hidiroglou, M.A., & Rao, J.N.K. (2013). On sample allocation for efficient
domain estimation. Quality control and applied statistics, 58(3), 189-190.
Córdova, A. (2009). Methodological note: Measuring relative wealth using household asset
indicators. Insights Series No. I0806.
http://vanderbilt.edu/lapop/insights/I0806en.pdf. Accessed August 2016.
Cragg, J. G. (1971). Some statistical models for limited dependent variables with application to
the demand for durable goods. Econometrica, 39(5), 829-844.
Curto, J. D., & Pinto, J. C. (2007). New multicollinearity indicators in linear regression models.
International Statistical Review, 75(1), 114-121.
Debertin, D. L. (1986). Agricultural Production Economics, Macmillan, New York.
Debow, M. E. (1991). Markets, Government Intervention, and the Role of Information: An
Austrian School' Perspective, with an Application to Merger Regulation, George
Mason Law Review, 14(1),31-98.
Deichmann, U., Goyal, A., & Mishra, D. (2016). Will digital technologies transform agriculture
in developing countries?. Agricultural Economics, 47(S1), 21-33.

91
Deininger, K., & Okidi, J. (1999). Capital market access, factor demand, and agricultural
development in rural areas of developing countries: The case of Uganda. EPRC
Research Series No, 12.
http://www.academia.edu/26126743/Capital_market_access_factor_demand_and_agric
ultural_development_in_rural_areas_of_developing_countries_The_case_of_Uganda.
Accessed August 2014.
de Janvry, A., and Sadoulet, E. (2006). Progress in Modeling of Rural Household’s Behavior
Under Market Failures. In Poverty, Inequality and Development, 2(1), 155-181.
Springer USA.
Demeke, M., Kelly, V. A., Jayne, T. S., Said, A., Le Vallee, J. C., & Chen, H.
(1998). Agricultural market performance and determinants of fertilizer use in
Ethiopia (No. 55599). Michigan State University, Department of Agricultural, Food,
and Resource Economics.
Diagne, A., & Zeller, M. (1998). Determinants of access to credit and its impact on income and
food security in Malawi. Manuscript submitted to IFPRI’s Publication Review
Committee for consideration as an IFPRI Research Report.
http://ageconsearch.umn.edu/bitstream/16530/1/rr010116.pdf. Accessed March 2015.
Dillon, B., & Barrett, C.B. (2014). Agricultural factor markets in Sub-Saharan Africa: an updated
view with formal tests for market failure. The World Bank.
http://www.worldbank.org/content/dam/Worldbank/Feature%20Story/Africa/afr-brian-
dillon.pdf. Accessed February 2015

92
Dormann, C. F., Elith, J., Bacher, S., Buchmann, C., Carl, G., Carré, G., & Lautenbach, S.
(2013). Collinearity: a review of methods to deal with it and a simulation study
evaluating their performance. Ecography, 36(1), 27-46.
Dorward, A. (2006). Markets and Pro-Poor Agricultural Growth: Insights from Livelihood and
Informal Rural Economy Models in Malawi. Agricultural Economics, 35(2), 157–169.
Dorward, A. Chirwa, E., Kelly V., Jayne, T., Slater, R., & Boughton, D. (2008). Evaluation of
the 2006/07 Agricultural Input Subsidy Programme, Malawi. Final Report. Study
undertaken for the Ministry of Agriculture and Food Security, Malawi, DFID, USAID
and Future Agricultures Consortium. Imperial College London, Wadonda Consult.
Dorward, A. (2009). Rethinking Agricultural Input Subsidy Programmes in a Changing World.
Paper prepared for the Trade and Markets Division of the Food and Agriculture
Organization of the United Nations and presented at School of Oriental and African
Studies. April, 2009. https://www.oecd.org/tad/agricultural-policies/46384527.pdf.
Accesses April 2015.
Druilhe, Z., & Barreiro-Hurlé, J. (2012). Fertilizer subsidies in sub-Saharan Africa (No. 12-04).
ESA Working paper. http://www.fao.org/3/a-ap077e.pdf. Accessed January 2015.
Ellis, F. (1993). Peasant Economics: Farm Households and Agrarian Development. New York
and Melbourne: Cambridge University Press.
Enete, A.A., & Igbokwe, E.M. (2009). Cassava Market Participation Decision of Producing
Households in Africa. Tropicultura, 27(3), 129-136.
Eswaran, M., and Kotwal, A. (1990). Implications of credit constraints for risk behavior. Oxford
Economic Papers, 42(2), 473-482.

93
FAO. (2004). Tropical Livestock Units (TLU), Virtual Livestock Centre, Livestock and
Environment Toolbox, Rome, Italy.
Farrar, D. E., & Glauber, R. R. (1967). Multicollinearity in regression analysis: the problem
revisited. Review of Economics and Statistics, 1(49), 92-107.
Feder, G., Just, R. E., & Zilberman, D. (1985). Adoption of agricultural innovations in
developing countries: A survey. Economic development and cultural change, 33(2),
255-298.
FMARD. (2011). Agricultural Transformation Agenda: We Will Grow Nigeria’s Agricultural
Sector. Draft. Abuja, Nigeria.
Ferris, R.S.B., Okoboi, G., Crissman, C., Ewell, P., and Lemaga, B. (2001). Uganda’s Irish
Potato Sector. IITAFOODNET, CIP, PRAPACE, CGIAR and ASARECA at the
Government of Uganda’s Conference on Competitiveness of Selected Strategic
Exports.
http://s3.amazonaws.com/zanran_storage/www.foodnet.cgiar.org/ContentPages/114713
89.pdf. Accessed June 2015.
Foeken, D. W. J., Klaver, W., and Owuor, S. O. (2002). Crop cultivation in Nakuru town,
Kenya: Practice and potential.
http://erepository.uonbi.ac.ke/bitstream/handle/11295/38785/01PUB0000000772.pdf?s
equence=1&isAllowed=y. Accessed November 2016.
Gebregziabher, D. (2010). Market chain analysis of poultry: The case of Alamata and Atsbi-
Wonberta Woredasof Tigray region. Unpublished MSc Thesis, Haramaya University,
Addis Ababa.
94
Gebremedhin, B., & Jaleta, M. (2010). Commercialization of smallholders: Does market
orientation translate to market participation? (Working Paper No. 2). Addis Ababa,
Ethiopia: International Livestock Research Institute.
Gemeda, A., Aboma, G., Verkuijl, H., & Mwangi, W. (2001).Farmers’ maize seed system in
Western Oromia, Ethiopia. International maize and Wheat Improvement Center
(CIMMYT), Mexico, and Ethiopia Agricultural Research Organization (EARO). 32 pp.
Goetz, S.J. (1992). A Selectivity Model of Household Food Marketing Behavior in SubSaharan
Africa. American Journal of Agricultural Economics, 74(2), 444-452.
GoK. (2007). Kenya 2030 Vision. Nairobi, Kenya.
http://www.ascu.go.ke/DOCS/Vision2030.pdf. Accessed January 2014.
Greene, W.H. (1994). Accounting for excess zeros and sample selection in Poisson and negative
binomial regression models.
https://papers.ssrn.com/sol3/papers.cfm?abstract_id=1293115. . Accessed November,
2016.
Greene, W.H. (2003). Econometric analysis. Pearson Education India.
Gregory, I. (2006). The role of input vouchers in pro-poor growth. Background Paper
Prepared for the African Fertilizer Summit, 9-13.http://www.inter-
reseaux.org/IMG/pdf/08_Gregory--Role_of_Input_Vouchers.pdf. (Accessed August,
2016).
Guirkinger, C. and Boucher, S. (2005). Credit constraints and productivity in Peruvian
agriculture. Department of Agricultural and Resource Economics, University of
California-Davis.
https://arefiles.ucdavis.edu/uploads/filer_public/2014/06/19/07-005.pdf.

95
Gujarati N. D. (2007). Basic Econometrics, McGraw-Hill Companies, New York, USA.
Hanchane, S., & Mostafa, T. (2010) Endogeneity problems in multilevel estimation of education
production functions: An analysis using PISA data. Journal of Applied Statistics, 39(5),
1101-1114.
Hanemann, W.M. (1984). Discrete/continuous models of consumer demand. Econometrica:
Journal of the Econometric Society, 1(52), 541-561.
Harrigan, J. (2008). Food insecurity, poverty and the Malawian Starter Pack: Fresh start or false
start? Food Policy, 33(3):237-49.
Hausman, J.A. (1978). Specification tests in econometrics. Econometrica, 46(6), 1251-1271.
Heckman, J.J. (1976). The Common Structure of Statistical Models of Truncation, Sample
Selection, and Limited Dependant Variables and a Simple Estimator for Such Models.
Annals of Economic and Social Measurement, 5(4), 475-492.
Heckman, J.J. (1979). Sample Selection Bias as a Specification Error. Econometrica, 47(1), 153-
161.
Heckman, J.J., LaLonde, R.J., & Smith, J.A. (1999). The economics and econometrics of active
labor market programs. Handbook of Labor Economics, 3, 1865-2097.
Holloway, G.J., Barrett, C.B., & Ehui, S.K. (2001). The Double Hurdle Model in the Presence of
Fixed Costs Applied Economics and Management Working Paper, Cornell University.
Huang, W.Y. (2009). Factors contributing to the recent increase in US fertilizer prices, 2002-08.
DIANE Publishing.
IFDC. (2012). Kenya fertilizer Assessment. http://ifdc.org/r-d/research/kenya-fertilizer-
assessment-june-2012-(1) Accessed March 2014.

96
Imoru, J.A., & Ayamga, M. (2015). Fertiliser subsidy effects on fertiliser use in the northern
region of Ghana. African Journal of Agricultural Research, 10(53), 4926-4936.
Irungu, P., Mbogoh, S. G., Staal, S. J., Thorpe, W., & Njubi, D. (1998). Factors influencing
adoption of Napier grass in smallholder dairying in the highlands of Kenya. British
Society of Animal Science.
Jagwe, N. (2011). The Impact of Transaction Costs on the Participation of Smallholder Farmers
and Intermediaries in the Banana Markets of Burundi, Democratic Republic of Congo
and Rwanda. Unpublished Thesis, University of Pretoria, South Africa.
Jaleta, M., Gebremedhin, B., & Hoekstra, D. (2009). Smallholder Commercialization: Processes,
Determinants and Impact. Discussion Paper No. 18: Improving Productivity and Market
Success of Ethiopian Farmers, Improving Market Opportunities, International Livestock
Research Institute, Nairobi.
ayne, T.S., Myers, R.J., & Nyoro, J. (2008). The effects of NCPB marketing policies on maize
market prices in Kenya. Agricultural Economics, 38(3), 313-325.
Kafle, B. (2010). Determinants of adoption of improved maize varieties in developing countries:
a review. International Research Journal of Applied and Basic Sciences, 1(1), 1-7.
Kamau, Mercy, F. Karin, M. Olunga, K. Onyango., & J. Makau. 2013. Food Situation
Assessment: October 2013. Tegemeo Technical Bulletin No. 1. Nairobi: Tegemeo
Institute.
Kamoni, P. M., & Rotich, G. (2013). Factors affecting the effectiveness of the supply chain of
subsidized fertilizer in Kenya: A case study of the National Cereals and Produce Board.
International Journal of Social Sciences and Entrepreneurship, 1(7), 140-165.

97
Karanja, A. M., & Nyoro J. K. (2002). Coffee Prices and Regulation and their Impact on
Livelihoods of Rural Community in Kenya, Tegemeo Institute of Agricultural Policy and
Development, Egerton University, Kenya.
Kelly, V., Crawford, E., & Ricker-Gilbert, J. (2011). The new generation of African fertilizer
subsidies: panacea or Pandora’s box? Policy Synthesis for cooperating USAID offices
and country missions number 87, May, USAID and MSU.
http://www.jatropha.pro/pdf%20bestanden/african_fertilizer_subsidies_may_2011_0.pd
f. Accessed June 2015.
Ketema, M., & Bauer, S. (2011). Determinants of Manure and Fertilizer Applications in Eastern
Highlands of Ethiopia. Quarterly Journal of International Agriculture, 50(3), 237-252.
Key, N., Sadoulet. E., & DeJanvry, A. (2000). Transactions Costs and Agricultural Household
Supply Response. American Journal of Agricultural Economics, 82(2), 245-259.
Khatun, D. & Roy, B.C. (2012). Rural livelihood diversification in west Bengal: Determinants
and constraints. Agricultural Economics Research Review, 25(1), 115-124.
Kikulwe, E.M., Fischer, E., & Qaim, M. (2014). Mobile money, smallholder farmers, and
household welfare in Kenya. PloS one, 9(10), 1-13.
Kiratu, N.M., Ngigi, M., & Mshenga, P.M. (2014). Perception of Smallholder Farmers towards
the Kilimo Plus Subsidy Program in Nakuru North District. Journal of Agriculture and
Veterinary Science, 6(6), 28-32.
Kisaka-Lwayo, M., Darroch, M.A.G., & Ferrer, S.R.D. (2005). Analysis of risk attitudes of
smallholder crop farmers in Umbumbulu district, Kwazulu-Natal, South Africa. African
Crop Science, 7(2), 909-914.
98
Kjær, T. (2005). A review of the discrete choice experiment-with emphasis on its application in
health care (p. 1). Denmark: Syddansk Universitet.
Kleinbaum, D. G., Kupper, L., & Muller, E. (1988). Applied Regression Analysis and Other
Multivariate Methods. 2nd
ed., PWS-Kent, Boston, Mass.
Kmenta, J., & Ramsey, J. B. (1980). Problems and issues in evaluating econometric models.
In Evaluation of Econometric Models (pp. 1-11). Academic Press.
Komarek, A. (2010). The determinants of banana market commercialization in Western Uganda.
African Journal of Agricultural Research, 5(9), 775-784.
Komicha, H. H., & Öhlmer, B. (2007). Influence of Credit Constraint on Technical Efficiency of
Farm Households in Southeastern Ethiopia. International Conference on African
Development Archives. Paper 125.
Krausova, M. and Banful, A. (2010). Overview of the agricultural input sector in Ghana.
Discussion Paper 01024. Washington, DC: International Food Policy Research Institute.
Krugman, P.R. (1997). Development, geography, and economic theory (Vol. 6). MIT press.
Lamb, R. (2003). Fertilizer Use, Risk, and Off-farm Labor Markets in the Semi-Arid Tropics of
India. American Journal of Agricultural Economics, 85(2), 359-371.
Langyintuo, A.S., Hamazakasa, P, Nawale, E., & Jere, I. (2005). Maize production systems in
Zambia: Setting indicators for impact assessment and targeting. CIMMYT Report,
Harare, Zimbabwe.
Langyintuo, A.S., & Mekuria, M. (2005). Accounting for neighborhood influence in estimating
factors determining the adoption of improved agricultural technologies. Selected Paper
presented at the American Agricultural Economics Association Annual Meeting,
Providence, RI, USA, July 24-27.
99
Levy, S., & Barahona, C. (2002). 2001-2002 targeted Input Programme, Main Report of the
Evaluation Programme.
https://www.ilri.org/biometrics/GoodStatisticalPractice/development/malawi/main0102.p
df. Accessed September 2014.
Lio, M., & Liu, M. C. (2006). ICT and agricultural productivity: evidence from cross‐ country
data. Agricultural Economics, 34(3), 221-228.
Liverpool-Tasie, S. (2012). Targeted subsidies and private market participation: An assessment
of fertilizer demand in Nigeria. IFPRI Discussion Paper 01194, IFPRI, Washington, DC.
Liverpool-Tasie, L.S. (2014). Fertilizer subsidies and private market participation: The case of
Kano State, Nigeria. Agricultural Economics, 45(6), 663-678.
Liverpool-Tasie, L.S.O., & Sheu, S. (2013). Spillover effects of targeted subsidies: An
assessment of fertilizer and improved seed use in Nigeria.
https://scholar.google.com/scholar?hl=en&q=Spillover+Effects+of+Targeted+Subsidies+
An+Assessment+of+Fertilizer+and+Improved+Seed+Use+in+Nigeria&btnG=&as_sdt=1
%2C5&as_sdtp=.
Lubungu, M., Chapoto, A., & Tembo, A. (2012). Smallholder Farmers Participation in Livestock
Markets: The Case of Zambian Farmers. Working Paper 66. Indaba Agricultural Policy
Research Institute, Lusaka, Zambia.
Lunduka, R., Ricker‐Gilbert, J., & Fisher, M. (2013). What are the farm‐level impacts of
Malawi's farm input subsidy program? A critical review. Agricultural Economics, 44(6),
563-579.MacDonald, J.M. (2009). Manure use for fertilizer and for energy: report to
Congress. DIANE Publishing.

100
Machio, P.N. (2015). Determinants of rural poverty in Kenya: The case of cash crop growing.
Unpublished PhD Thesis, University of Nairobi, Kenya.
Mangisoni, J. H., Kachule, R., Kalinda, T., Chilongo, T., Simfukwe, M., & Tostao, E. (2007).
Input voucher study in Malawi, Mozambique and Zambia. FANRPAN Report, 4.
Martey, E., Al-Hassan, R.M., & Kuwornu, J.K. (2012). Commercialization of smallholder
agriculture in Ghana: A Tobit regression analysis. African Journal of Agricultural
Research, 7(14), 2131-2141.
Mason, N. (2011). Rewarding Loyalty–Election Outcomes and Government Subsidized Fertilizer
Allocation in Zambia. Unpublished PhD Dissertation, Michigan State University, USA
Mason, N.M., & Jayne, T.S. (2012). Fertilizer subsidies and smallholder commercial fertiliser
purchases: Crowding out, leakage and policy implications for Zambia. Journal of
Agricultural Economics, 64(3), 558-582.
Mason, N., & Ricker-Gilbert, J. (2013). Disrupting Demand for Commercial Seed: Input
Subsidies in Malawi and Zambia. World Development, 45, 75-91.
Mason, N.M., Wineman, A., Kirimi, L., & Mather, D. (2015). The effects of Kenya’s
‘smarter’input subsidy program on crop production, incomes, and poverty. Tegemeo
Policy Brief No. 11, October, 2015. http://fsg.afre.msu.edu/kenya/Policy_Brief_11.pdf.
Accessed May 2014.
Megan, S., Olwande, J., Kirimi, L., & Jayne, T.S. (2014). Targeting of subsidized fertilizer under
Kenya’s national accelerated agricultural input access program (NAAIAP) (No.
188572). Michigan State University, Department of Agricultural, Food, and Resource
Economics.
101
Mendola M. (2007). Farm Household Production Theories: A Review of “Institutional” and
“Behavioral” Responses. Asian Development Review, 24(1), 49-68.
https://think-asia.org/handle/11540/1702. Accessed November 2016.
Minde, I., Jayne, T. S., Crawford, E., Ariga, J., & Govereh, J. (2008). Promoting Fertilizer Use in
Africa: Current Issues and Empirical Evidence from Malawi, Zambia, and Kenya.
Working Paper No. 13, Regional Strategic Analysis and Knowledge Support System,
Pretoria, South Africa.
Minot, N. (2009). Fertilizer subsidies in sub-Saharan Africa. In Presentation at the Fertilizer
Policy Symposium of the COMESA African Agricultural Markets Programme (AAMP),
Livingstone, Zambia..
Minot, N., Kherallah, M., & Berry, P. (2000). Fertilizer market reform and the determinants of
fertilizer use in Benin and Malawi (No. 40). International Food Policy Research Institute
(IFPRI). Washington, D.C.
http://ageconsearch.umn.edu/bitstream/16127/1/ms000040.pdf. Accessed July 2014.
MoAL&F, (2014). Subsidy fertilizer distribution guidelines.
http://kenyalaw.org/kenya_gazette/gazette/volume/MTE1NQ--/Vol.CXVII-No.33
Accessed April 2014).
MoAL&F, (2015). Economic Review of Agriculture.
http://www.kilimo.go.ke/wpcontent/uploads/2015/10/Economic-Review-of-
Agriculture_2015-6.pdf. Accessed December 2015.
Moono, L. (2015). An analysis of factors influencing market participation among smallholder
rice farmers in western province, Zambia. Unpublished MSc Thesis, University of
Nairobi, Kenya.

102
Morris, M. L., Tripp, R., & Dankyi, A. A. (1999). Adoption and Impacts of Improved Maize
Production Technology. A case study of the Ghana grains development project.
Economics Program Paper, 99-01.
Moser, C., & Felton, A. (2007). The construction of the asset index measuring asset
accumulation in Ecuador. Global Economy and Development: The bookings institution
Massachusetts, Washington D.C, USA: Chronic research centre: 1-23.
Mukundi, E.N. (2014). Sweet potato marketing among smallholder farmers in Rachuonyo
district, Homa bay county, Kenya: The role of collective action. Unpublished MSc
Thesis, Egerton University, Njoro.
Nambiro, E., & Okoth, P. (2013). What factors influence the adoption of inorganic fertilizer by
maize farmers? A case of Kakamega District, Western Kenya. Scientific Research and
Essays, 8(5), 205-210.
Nasir, M., & Hundie, B. (2014). The Effect of off Farm Employment on Agricultural Production
and Productivity: Evidence from Gurage Zone of Southern Ethiopia. Journal of
Economics and Sustainable Development, 5(23), 85-98.
Ndung’u, N., Thugge, K., & Otieno, O. (2009). Unlocking the Future Potential for Kenya: The
Vision 2030. Paper presented at the CSAE Conference, 2009. 22-24 March 2009. Oxford,
UK: Centre for the Study of African Economies.
NEPAD. (2006). The Abuja Declaration on Fertilizers for an African Green Revolution - Status
of Implementation at Regional and National Level.
http://www.nepad.org/system/files/Abuja%20Declaration.pdf. Accessed June 2015.

103
Nkonya, E., & Kato, E. (2001). Agricultural Input Marketing in Uganda International Food
Policy Research Institute (IFPRI). The IFPRI Policy Workshop, Kampala, 25-26 June
2001.
Nyamba, S.Y., & Mlozi, M.R. (2012). Factors influencing the use of mobile phones in
communicating agricultural information: a case of Kilolo district, Iringa, Tanzania.
International Journal of Information and Communication Technology Research, 2(7),
558-563.
Nzuma, J.M. (2013). The Political Economy of Food Price Policy: The Case of Kenya. WIDER
Working Paper 2013/026. Helsinki: UNU-WIDER.
Obisesan, A.A., Akinlade, R.J., & Fajimi, F.O. (2013). Determinants of fertiliser use among
smallholder food crop farmers in Ondo State, Nigeria. American Journal of Research
Communication, 7, 254-260.
Ogada, M.J., Muchai, D., Mwabu, G., & Mathenge, M. (2014). Technical efficiency of Kenya’s
smallholder food crop farmers: do environmental factors matter? Environment,
Development and Sustainability, 16(5) 1065-1076.
Okoboi, G., & Barungi, M. (2012). Constraints to fertilizer use in Uganda: insights from Uganda
Census of Agriculture 2008/9. Journal of Sustainable Development, 5(10), 99-113.
Olwande, J., & Mathenge, M. (2012). Market participation among poor rural households in
Kenya. In Proceedings of International Association of Agricultural Economists Triennial
Conference, Brazil (18-24 August). 1-30.
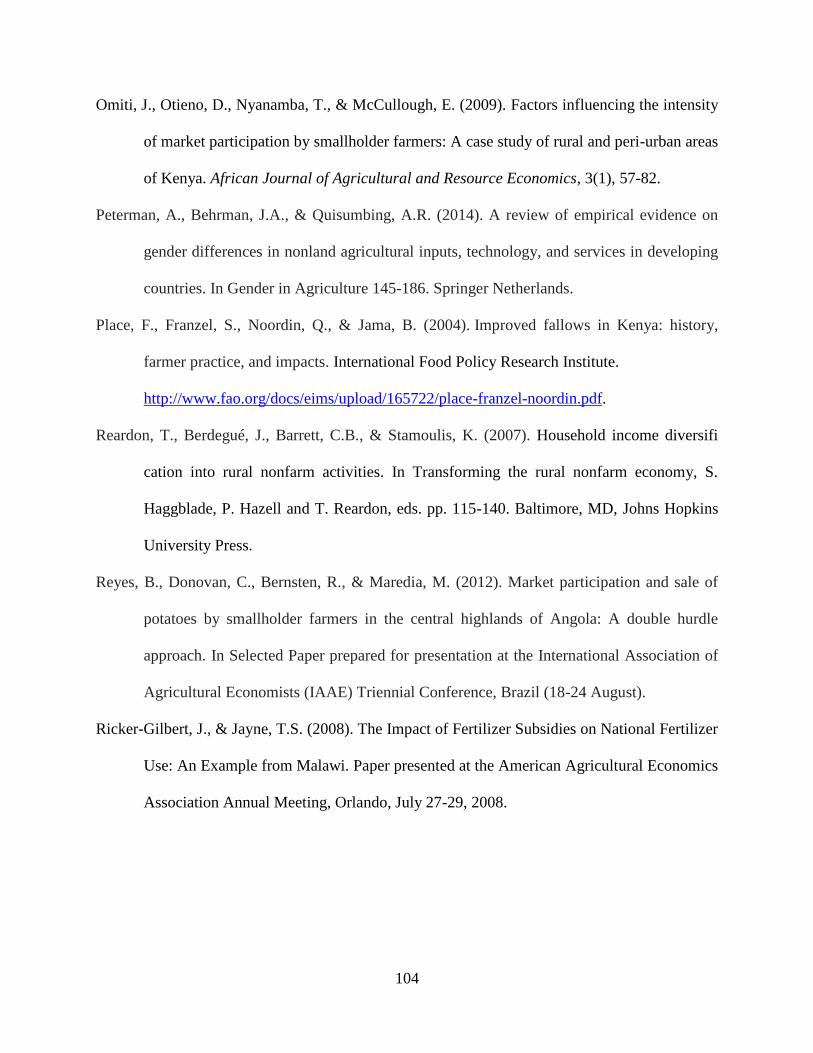
104
Omiti, J., Otieno, D., Nyanamba, T., & McCullough, E. (2009). Factors influencing the intensity
of market participation by smallholder farmers: A case study of rural and peri-urban areas
of Kenya. African Journal of Agricultural and Resource Economics, 3(1), 57-82.
Peterman, A., Behrman, J.A., & Quisumbing, A.R. (2014). A review of empirical evidence on
gender differences in nonland agricultural inputs, technology, and services in developing
countries. In Gender in Agriculture 145-186. Springer Netherlands.
Place, F., Franzel, S., Noordin, Q., & Jama, B. (2004). Improved fallows in Kenya: history,
farmer practice, and impacts. International Food Policy Research Institute.
http://www.fao.org/docs/eims/upload/165722/place-franzel-noordin.pdf.
Reardon, T., Berdegué, J., Barrett, C.B., & Stamoulis, K. (2007). Household income diversifi
cation into rural nonfarm activities. In Transforming the rural nonfarm economy, S.
Haggblade, P. Hazell and T. Reardon, eds. pp. 115-140. Baltimore, MD, Johns Hopkins
University Press.
Reyes, B., Donovan, C., Bernsten, R., & Maredia, M. (2012). Market participation and sale of
potatoes by smallholder farmers in the central highlands of Angola: A double hurdle
approach. In Selected Paper prepared for presentation at the International Association of
Agricultural Economists (IAAE) Triennial Conference, Brazil (18-24 August).
Ricker-Gilbert, J., & Jayne, T.S. (2008). The Impact of Fertilizer Subsidies on National Fertilizer
Use: An Example from Malawi. Paper presented at the American Agricultural Economics
Association Annual Meeting, Orlando, July 27-29, 2008.

105
Ricker-Gilbert, J., & Jayne, T.S. (2009). Do Fertilizer Subsidies Affect the Demand for
Commercial Fertilizer? An Example from Malawi. Contributed Paper presented at the
International Association of Agricultural Economists Conference, Beijing, China, August
16-22, 2009.
Ricker-Gilbert, J., Jayne, T., & Chirwa, E. (2011). Subsidies and Crowding Out: A Double-
Hurdle Model of Fertilizer Demand in Malawi. American Journal of Agricultural
Economics, 93(1):26-42.
Ricker-Gilbert, J., Jayne, T., & Shively, G. (2013). Addressing the “wicked problem” of input
subsidy programs in Africa. Applied Economic Perspectives and Policy, 35(2), 322-340.
Rogers, E. M. (1962). Diffusion of innovations. Simon and Schuster.
Sadoulet, E., & De Janvry, A. (1995). Quantitative Development Policy Analysis, Baltimore:
Johns Hopkins University Press.
Sall, S., Norman, D., & Featherstone, A.M. (2000). Quantitative Assessment of Improved Rice
Variety Adoption: The Farmer’s Perspective. Agricultural Systems, 66(2), 129-144.
Satorra, A., & Bentler, P.M. (2001). A scaled difference chi-square test statistic for moment
structure analysis. Psychometrika, 66(4), 507-514.
Sebatta, C., Mugisha J., Katungi E., Kashaaru A., & Kyomugiha, H. (2014). Smallholder
Farmers’ Decision and Level of Participation in the Potato Market in Uganda. Modern
Economy, 5(8), 895-906.
Sharma, V.P., & Thaker, H. (2010). Fertiliser subsidy in India: Who are the beneficiaries?
Economic and Political weekly, 45(12), 68-76.
Sheahan, M.B. (2011). Analysis of fertilizer profitability and use in Kenya. Unpublished PhD
Dissertation, Michigan State University, USA.

106
Sheahan, M., Ariga, J., & Jayne, T. S. (2016). Modeling the Effects of Input Market Reforms on
Fertiliser Demand and Maize Production: A Case Study from Kenya. Journal of
Agricultural Economics, 67(2), 420-447.
Shively, G.E., & Ricker-Gilbert, J. (2013). Measuring the Impacts of Agricultural Input
Subsidies in Sub-Saharan Africa: Evidence from Malawi's Farm Input Subsidy Program.
Global Policy Research Institute (GPRI). Policy Briefs, 1(1), p.4.
Sibande, L. C. (2016). Essays on the impact of farm input subsidies on farm households in
Malawi (Doctoral dissertation, University of Kent Canterbury United Kingdom).
Sigei, G., Bett, H., & Kibet, L. (2014). Determinants of Market Participation among Small-scale
Pineapple Farmers in Kericho County, Kenya. Journal of Economic Sustainable
Development, 4(19), 59-66.
Singh, I., Squire, L., & Strauss, J. (1986). Agricultural Household Models: Extensions,
Applications, and Policy. Johns Hopkins University Press, Baltimore.
Siziba, S., Nyikahadzoi, K., Diagne, A., Fatunbi, A.O., & Adekunle, A.A. (2011). Determinants
of cereal market participation by sub-Saharan Africa smallholder farmer. Journal of
Agricultural and Enviromental Studies, 2(1), 180-193.
StataCorp, L.P. (2005). Stata base reference manual Volume 2.
http://www.stata.com/manuals13/r.pdf. Accessed July 2014.
SurveyCTO (2016). surveyCTO. [Online] Available at: www.surveyCTO.com. Accessed July
2014.
Tadesse, G., & Bahiigwa, G. (2015). Mobile phones and farmers’ marketing decisions in
Ethiopia. World Development, 68(5), 296-307.

107
Takeshima, H., & Lee, H.L. (2012). Agricultural inputs subsidy and their developmental impact:
conventional wisdom. Washington, DC: International Food Policy Research Institute
(IFPRI).
Taylor, E., & Adelman, I. (2003). Agricultural Household Models: Genesis, Evolution and
Extensions. Review of Economics of the Household, 1(1), 33-84.
Tegemeo. (2010). Kenya Baseline Study Report Prepared for: The Alliance for a Green
Revolution in Africa. Nairobi, Kenya.
Tiba, Z. (2009). The role of input subsidies: Operational guidelines on implementation. Policies
for Good Economic Management of Food Price Swings in African Countries. Rome,
FAO Trade and Markets Division.
Tobin, J. (1958). Estimation of relationships for limited dependent variables. Econometrica,
26(1), 24-36.
Tu, T.T.T., Viet, N.Q,. & Loi, H.H. (2015). Determinant of Access to Rural Credit and Its Effect
on Living Standard: Case Study about Poor Households in Northwest, Vietnam.
International Journal of Financial Research, 6(2), 218-230.
Tuteja, U. (2003). Agricultural Input Subsidies in India: Quantum of Subsidies to Scheduled
Caste Farmers in Haryana. Agricultural Economics Research Centre, University of
Delhi,New Delhi.
Tura, M., Aredo, D., Tsegaye, W., Rovere, R.L., Tesfahun, G., Mwangi, W., & Mwabu, G.
(2010). Adoption and continued use of improved maize seeds: Case study Central
Ethiopia. African Journal of Agricultural Research, 5(17), 2350-2358.

108
Tura, E.G. (2016). Determinants of Market Participation and Intensity of Marketed Surplus of
Teff Producers in Bacho and Dawo Districts of Oromia State, Ethiopia. Journal of
Economics and Sustainable Development. 7(1), 13-24.
United Nations (UN), (2000). Handbook on geographic information systems and digital
mapping. http://unstats.un.org/unsd/publication/SeriesF/SeriesF_79E.pdf
Unnevehr, L., & Grace, D. (2013). Aflatoxins: Finding solutions for improved food safety (Vol.
20). International Food Policy Research Institute.
Van Ittersum, M.K., Van Bussel, L.G., Wolf, J., Grassini, P., Van Wart, J., Guilpart, N.,
Claessens, L., de Groot, H., Wiebe, K., Mason-D’Croz, D., & Yang, H. (2016). Can sub-
Saharan Africa feed itself? Proceedings of the National Academy of Sciences, 113(52),
14964-14969.
Varian, H. R. (1992). Microeconomic analysis (3rd edition). New York: Norton.
Vuong, Q.H. (1989). Likelihood ratio tests for model selection and non-nested hypotheses.
Econometrica, 57(2), 307-333.
Weissfeld, L.A., & Sereika, S.M. (1991). A multicollinearity diagnostic for generalized linear
models. Communications in Statistics.Theory and Methods, 20(4), 1183-1198.
Wooldridge, J. M. (2010). Econometric analysis of cross section and panel data. MIT press.
Wooldridge, J. M. (2014). Quasi-maximum likelihood estimation and testing for nonlinear
models with endogenous explanatory variables. Journal of Econometrics, 182(1), 226-
234.
Wooldridge, J.M. (2009). On estimating firm-level production functions using proxy variables to
control for unobservables. Economics Letters, 104(3), 112-114.
Wooldridge, J. M. (2010). Econometric analysis of cross section and panel data. MIT press.

109
Wu, C. C. (1977). Education in farm production: the case of Taiwan. American Journal of
Agricultural Economics, 59(4), 699-709.
Xu, Z., Burke, W.J., Jayne, T.S., & Govereh, J. (2009). Do input subsidy programs “crowd in” or
“crowd out” commercial market development? Modeling fertilizer demand in a two-
channel marketing system. Agricultural Economics, 40(1), 79-94.
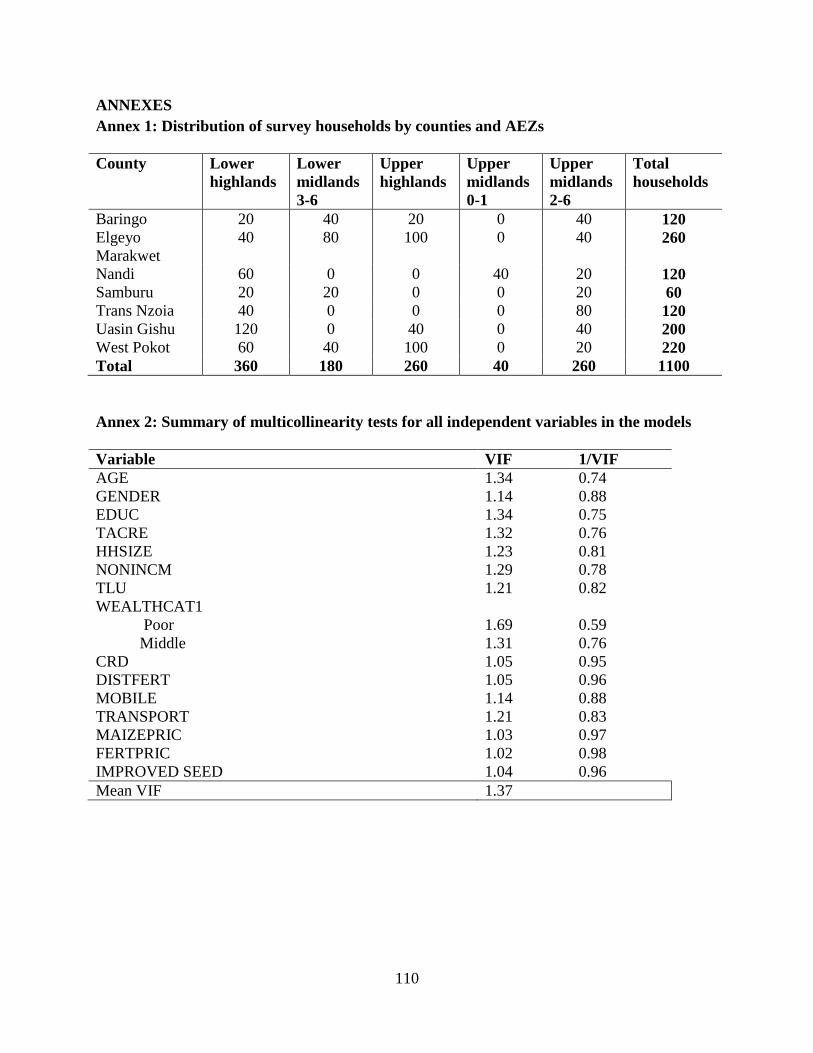
110
ANNEXES
Annex 1: Distribution of survey households by counties and AEZs
County Lower
highlands
Lower
midlands
3-6
Upper
highlands
Upper
midlands
0-1
Upper
midlands
2-6
Total
households
Baringo 20 40 20 0 40 120
Elgeyo
Marakwet
40 80 100 0 40 260
Nandi 60 0 0 40 20 120
Samburu 20 20 0 0 20 60
Trans Nzoia 40 0 0 0 80 120
Uasin Gishu 120 0 40 0 40 200
West Pokot 60 40 100 0 20 220
Total 360 180 260 40 260 1100
Annex 2: Summary of multicollinearity tests for all independent variables in the models
Variable VIF 1/VIF
AGE 1.34 0.74
GENDER 1.14 0.88
EDUC 1.34 0.75
TACRE 1.32 0.76
HHSIZE 1.23 0.81
NONINCM 1.29 0.78
TLU 1.21 0.82
WEALTHCAT1
Poor 1.69 0.59
Middle 1.31 0.76
CRD 1.05 0.95
DISTFERT 1.05 0.96
MOBILE 1.14 0.88
TRANSPORT 1.21 0.83
MAIZEPRIC 1.03 0.97
FERTPRIC 1.02 0.98
IMPROVED SEED 1.04 0.96
Mean VIF 1.37

111
Annex 3: Person Correlation Matrix
Variable A
GE
GE
ND
ER
ED
UC
LA
ND
SIZ
E
HH
SIZ
E
NO
NIN
CM
TL
U
PO
OR
MID
DL
E
CR
D
DIS
TF
ER
T
MO
BIL
E
TR
AN
SP
OR
T
MA
IZE
PR
IC
FE
RT
PR
IC
QS
UB
SID
Y
IMP
RO
VE
DS
EE
D
AGE 1
GENDER -0.22 1.00
EDUC -0.37 0.27 1.00
LANDSIZE 0.29 -0.01 -0.02 1.00
HHSIZE 0.02 0.17 0.09 0.10 1.00
NONINCM 0.02 0.05 0.08 0.32 0.12 1.00
TLU 0.13 0.01 0.09 0.27 0.17 0.15 1.00
POOR 0.10 0.02 0.15 0.13 -0.12 0.11 0.14 1.00
MIDDLE -0.03 -0.06 -0.24 -0.20 0.18 -0.22 -0.26 -0.46 1.00
CRD -0.09 0.02 0.07 -0.02 0.05 0.09 -0.01 -0.10 -0.04 1.00
DISTFERT 0.02 -0.02 -0.05 0.00 0.04 -0.02 0.08 0.04 0.00 -0.10 1.00
MOBILE 0.00 0.10 0.25 0.07 0.16 0.08 0.11 0.04 -0.15 0.11 -0.07 1.00
TRANSPORT 0.00 0.13 0.27 0.20 0.11 0.24 0.14 0.13 -0.25 0.03 0.02 0.19 1.00
MAIZEPRIC -0.01 0.05 0.01 0.00 0.05 -0.02 0.05 0.03 0.06 -0.03 -0.06 0.00 -0.02 1.00
FERTPRIC -0.08 0.00 -0.01 -0.05 -0.06 -0.10 -0.01 0.04 0.04 -0.02 0.03 -0.05 -0.05 -0.03 1.00
QSUBSIDY 0.12 -0.03 0.02 0.36 0.02 0.38 0.07 -0.04 -0.16 0.02 -0.06 0.04 0.25 -0.04 -0.04 1.00
IMPROVEDSEED 0.10 0.04 0.04 0.01 0.08 0.03 0.07 0.06 -0.06 -0.08 0.05 0.08 0.06 -0.03 -0.11 0.02 1.00

112
Annex 4: Summary of Breusch-Pagan test for heteroskedasticity
Breusch-Pagan / Cook-Weisberg test for heteroscedasticity
Ho: Constant variance
Variables: fitted values of Qsubsidy
Chi2(1) = 0.43
Prob > Chi2 = 0.5117
Annex 5: Summary of Durbin Hauman test for endogeneity
Durbin Hausman test for endogeneity
Ho: Exogenous variables
Prob > F = 0.5036

113
Annex 6: Structured Household Survey Questionnaire uploaded in SurveyCTO server
Identifier
Household Number HHID: _________________
Date: (DD/MM/YY) SURDATE:_____________
Household Name; ________________________________________________________ HHNAME
Respondent ID; __________________________________________________________ MEM: __________
(Enumerator Instruction: Record the member number of the Respondent from the Demography)
Identifying Variables:
Supervisor: __________________ SNUM: ______________
Enumerator: __________________ ENUM: ______________
County : __________________ COUNT: _______________
IF THE HOUSEHOLD IS NOT ABLE TO PARTICIPATE IN THE SURVEY, WHY NOT? INTVIEW __________
(1=head and spouse separated 2= refused 3= household members cannot be found
4 =family commitments; (burial, wedding) 5 =working outside area 6= other, specify_______)

114
LAND
Q1.0 How many acres in total land holding does the household own? tacres_____
Q1.1 How many acres of land were rented-in in the last main season 2013/2014? rent_____
Q1.2 Did the household grow any improved varieties for maize in the last cropping year 2013/2014? (1=Yes 0=No) mzimpr____
Q1.3 For the largest sale made by the household what was the price of 90kg bag of maize mzprice___
Q1.4 Did any household member try to get any cash or in-kind credit during the 2013/2014 cropping year? (1=Yes 0=No) crd____
Q1.5 Has anyone in household received any extension service in 2013/2014? Yes=1, No=2 recadv_____
INFRASTRUCTURE (Enumerator Instruction: Distance should be recorded in kilometers (Km)
Q2.1 Does any member of this household owns a mobile phone? (1=Yes 0=No) mobile____
Q2.Distance from your homestead to the nearest fertilizer seller?

115
Q3. DEMOGRAPHIC CHARACTERISTICS OF HOUSEHOLD MEMBERS (Adults and Children)
(A household member to be listed is anyone who lived in the household for at least one full month during the last 12 months (August
2013 to July 2014). For head and spouse, they are considered household members irrespective of the duration they were physically
present at home).
ID Name
What is the age of […….]
born?
What is the gender of
[…….]?
1=male
0=female
Relation-ship of [……]o current
head
1 Head
2 Other household member
What is the
highest level
of education
[…………]
Years in
schooling?
(See codes
below)
Did
[..……..]
receive cash
from
informal
/business
activity?
Include
farm
kibarua,
dividends
Between
August
2014 and
July 2015
1=Yes
0=No
Did [.…] receive
cash or payment
in kind from
salaried
employment,
wage activities,
remittances, or
pensions
Between August
2014 and July
2015
1=Yes
0=No
MEM
NAME
AGE
GENDER
RHEAD
EDUC
BUS
SAL

116
Q4. BUSINESS AND INFORMAL LABOUR ACTIVITIES
We would like to know about all the off-farm income earning activities, including share dividends, your household was involved in,
except salaried employment pensions and remittances. August 2013 to July 2014 (include jua kali and farm kibarua). (Probe for
charcoal burning, fishing and own tree selling) the activity codes are below.
Business14.sav (Key variables: hhid, mem, activity)
Person name
Person
code
Activity
Code
Please classify each month’s net earnings as:
0=None 1=Low 2=Average 3=High
Low earnings
month
Average earnings
month
High earnings
month
8/13 9/13 10/13 11/13
4
12/13
44
1/14 2/14 3/14 4/14 5/14 6/15 7/15 NAME MEM ACTIVITY Aug Sept Oct Nov Dec Jan Feb Mar Apr Mar Jun Jul lgross lcost agross acost hgross hcost
58 Accounting clerk 8 Charcoal burning 70 Harvesting 24 Mining 38 Transporter (goods) 1 Agricultural
trading
9 Clothes/shoes
business (trading)
17 Hawker 74 Non-agricultural
business
55 Tree seller, commercial 46 Bar operator 51 Cobbler 57 Hiring out a bull 54 Nurse 52 Vehicle mechanic 64 Battery charging 10 Curio trader 73 Hotel 68 Pet breeder 45 Veterinary doctor 2 Bicycle
(repair/transporter)
11 Dealing
ropes/sisal/firewood
18 Jaggery 25 Photography 67 Video business 60 Boat making 12 Driver 49 Laundry business 63 Pit latrine digger 56 Village elder 3 Brick making 13 Earning dividends 19 Livestock trader 26 Planting 39 Weaving 4 Brokerage 14 Electrician 20 Local brewing 27 Ploughing 40 Welding/painting/blacksmith 62 Building 72 Income from
another farm
42 Lumbering/wood
cutting
47 Plumber 66 Other specify_________

117
Q5. SALARIED WAGE EMPLOYMENT/PERMANENT EMPLOYMENT ACTIVITIES
We would now like to talk about all salaried employment that anyone in this household engaged in during the past 12 months from
August 2013 to July 2014 including pensions and remittances.
Person
code
from
demog
From the list
below, please list
all the salaried
employment
activities in which
this person was
engaged at any
time during the
past 12 months
What is
[….] current
monthly
wage?
KShs
Did [….] earn
this same
monthly wage
during all of the
past 12
months?
1=Yes ( go
to incuse)
2=No
If [……] did not earn the same wage during all 12 months, please indicate the wage earned for
each month individually (KShs)
(Skip this section if person received the same monthly wage during the whole year)
8/13 9/13 10/13 11/13 12/13 1/14 2/14 3/14 4/14 5/14 6/14 7/14
MEM ACTIVITY MNWAGE SAME Aug Sept Oct Nov Dec Jan Feb Mar Apr May June Jul
Employment
Codes:
18 Accountant 2 Civil leader 45 Driver 6 General farm
worker 19 Manager 53 Plumber/battery
charger/barber 5 Administrator 20 Cleaner 4 Doctor 47 Hair dresser 39 Mechanic 11 Policeman/woman
38 Banker/receptionist 23 Clerk 40 Electrician 7 House help 28 Messenger 59 Postmaster
50 Butcher 3 Committee
member 36 Engineer 8 Industrial
worker 60 Miller 12 Remittance (local)
44 Cane cutter 35 Conductor 56 Equipment
operator 33 Lab attendant 9 Nurse 63 Research
31 Secretary 15 Teacher 57 Soldier 26 Veterinary 29 civil servant 17 Watchman
24 Shop
keeper/attendant 54 Technician 62 Sports/coach 16 Waiter/cook 43 Welding 42
Other,
specify_________
Q6. FERTILIZER

118
Q6. Did the household purchase fertilizer in the 2013/2014 cropping season? FERT_________
Q6. What CROP INPUTS did you purchase/hire on CREDIT OR IN CASH in 2013/14 cropping year?
Fertilizer14.sav (Key Variables: hhid; inptype)
Input codes:
1=DAP
2=MAP
3=TSP
4=SSP
5=NPK
(20:20:0)
6=NPK
(17:17:0)
7=NPK
(25:5:+5S)
8=CAN
(26:0:0)
9=ASN
(26:0:0)
10=UREA
(46:0:0)
11=SA (21:0:0)
15=NPK
(23:23:23)
16=NPK
(20:10:10)
17=DAP +
CAN
19=Magmax
Lime
20=DSP
30=UREA+CA
N
31=Mavuno-
top dress.
32=Blended
fertilizer
(specify______
_)
33=NPK
(22:6:12)
21=NPK
(23:23:0)
22=NPK
(17:17:17)
23=NPK
(18:14:12)
24=NPK
(15:15:15)
58=NPK(2
5:5:0)
25=Mavun
o-basal
27=Rock-
phosphate
28=NPK
14:14:20
29=Mijing
u 1100
Input
sources
1=small
trader
2=Stockist
3=large
company
4=CBO
5=NCPB
6=County
Govt
7=KTDA
8=Farmer
group
9=Relative
or friend
10=other,
specify___
___
Input type
[Select
input
codes
from
column on
the left]
Quantity bought
Unit of
purchase
2=kg
13=gram
20=5 kg
bag
8=10 kg
bag
7= 25 kg
bag
11=50 kg
bag
Source of
Fertilizer and
other inputs
(Select input
sources from
column on the
left)
Price
per unit
specifie
d
Kms
from
point of
purchas
e to
farm
Transport
Cost per
Unit of the
fertilizer
(KShs)
[Instructio
n: fill for
ONLY
fertilizers]
Main
Crop for
which
input
was used
inptype Qbought unit inpsorce punit kms trancost mcrop

119
Asset
Q6. Did the household have the following assets from July 2013 to June 2014?
Item Quantity Value per unit (Kshs) Total value if unit value is not known
Ploughs for tractor
Animal traction
Cart
Trailer
Tractor
Zero-grazing unit
Sheller
Planter
Zero grazing unit
Ridger
Boom sprayer
Zero-grazing unit
Other specify…
Thank you