‘Advertising agencies’ attitudes toward competing for creative assignments’
Upload
khangminh22Category
view
0download
0
For comments, suggestions or further inquiries please contact:
Philippine Institute for Development Studies
The PIDS Discussion Paper Seriesconstitutes studies that are preliminary andsubject to further revisions. They are be-ing circulated in a limited number of cop-ies only for purposes of soliciting com-ments and suggestions for further refine-ments. The studies under the Series areunedited and unreviewed.
The views and opinions expressedare those of the author(s) and do not neces-sarily reflect those of the Institute.
Not for quotation without permissionfrom the author(s) and the Institute.
August 2001
The Research Information Staff, Philippine Institute for Development Studies3rd Floor, NEDA sa Makati Building, 106 Amorsolo Street, Legaspi Village, Makati City, PhilippinesTel Nos: 8924059 and 8935705; Fax No: 8939589; E-mail: [email protected]
Or visit our website at http://www.pids.gov.ph
DISCUSSION PAPER SERIES NO. 2001-17
An Assessment of the AbsorptiveCapacity of Agencies Involved
in the Public Works Sector
Rosario G. Manasan and Ruben G. Mercado
AN ASSESSMENT OF THE ABSORPTIVE AN ASSESSMENT OF THE ABSORPTIVE
CAPACITY OF AGENCIES INVOLVEDCAPACITY OF AGENCIES INVOLVED IN THE PUBLIC WORKS SECTORIN THE PUBLIC WORKS SECTOR**
FINAL REPORT
Rosario G. Manasan Ruben G. Mercado
*This study was jointly undertaken through PIDS Project entitled “An Assessment of the Institutional Capacity and Absorptive Capacity of Agencies Involved in the Public Works Sector” funded by the Japan Bank for Institutional Cooperation (JBIC).

Table of Contents
Page ABSTRACT EXECUTIVE SUMMARY i-vii 1. INTRODUCTION 1 1.1 Macroeconomic Context 1 1.2 Objectives 5 2. PUBLIC WORKS AND HIGHWAYS SECTOR PERFORMANCE 6 AND CHALLENGES 2.1 Roads 6 2.2 Bridges 8 2.3 Ports 8 2.4 Water Supply 8 2.5 Flood Control 8 3. AGENCIES INVOLVED IN PUBLIC WORKS 8 3.1 DPWH 9 3.2 Local Government Units 14 4. DPWH BUDGET IN PERSPECTIVE 22 AND CHALLENGES 4.1 Annual Budget 22 5. ASSESSMENT OF BUDGET PERFORMANCE 27 5.1 Concepts and Measures of Absorptive Capacity 27 5.2 Assessment of DPWH Absorptive Capacity 31 6. ISSUES 41
6.1 Issues Obtaining from the Agency 42 6.2 Issues Obtaining from Policies or Performance of and 48
Coordination with other Agencies/Institutions 6.3 Issues Obtaining form Budgeting Authorities and System 51

Page 7. RECOMMENDATIONS FOR IMPROVING ABSORPTIVE 55 CAPACITY OF PUBLIC WORKS FUNDS 7.1 Measures Needed to Improve Agency’s Capacity for 55 Fund Absorption 7.2 Measures Needed to Improve Budget Determination and 57 Programming having Bearing on Agency Absorptive Capacity
7.3 Areas for Donor Assistance and Support 57 REFERENCES 59
List of Tables Table 1 Revenue and Disbursements (% of GNP) 2 Table 2 National Government Expenditures, by Sectoral Classification, 4 Obligation Basis: 1982-2001 (percent of GNP) Table 3 Percent Distribution of National Government Expenditures, 4 By Sectoral Classification, 1982-2001 Table 4 Public Works and Highways Performance Status and Targets 7 Table 5 Number of Devolved Personnel, 1992 14 Table 6 Agency Budgets and Devolution, 1992 15 (in thousand pesos) Table 7 Aggregate LGU Expenditures by Sector, 1985-1998 20 Table 8 Department of Public Works and Highways budget, 1990-2000 23 By Expenditure Item and Total, in Pesos Table 9 Department of Public Works and Highways Annual Budget/ 24 Appropriation, Office of the Secretary (in thousand pesos) Table 10 Department of Public Works and Highways Annual Agency 25 Budget/Appropriation, Office of the Secretary (in percent)

Page Table 11 Agency Appropriation by Major Implementing Agencies, 26 1995-2000 (Office of the Secretary) Table 12A Budget Utilization Performance, Department of Public Works 32 And Highways, 1996-1999, Summary of Budget Levels Table 12B Budget Utilization Performance, Department of Public Works 33 And Highways, 1996-1999, Summary of Absorptive Capacity Indices Table 12C Previous Year’s Appropriation Release During the Budget 34 Year for Budget Years, 1997-1999 and Availment Index Table 13 Comparative Budget Performance on Local and Foreign 36 Projects, Department of Public Works and Highways, 1996-1999, Summary of Absorptive Capacity Indices Table 14 Manpower Distribution of Project Management Offices, 47 Department of Public Works and Highways Table 15 Quarterly Allotment and Obligations, Fund 102 53 (Foreign Assisted Projects), Cumulative Total
List of Figures Figure 1 Growth Rate of Real GDP (1975-1999) 1
Figure 2 Department of Public Works and Highways, 13 Organizational Chart Figure 3 DPWH Appropriation, Allotment and Obligation, 1996-2000 54 (in pesos billions)
List of Annexes
Annex 1 Recently Completed and on-going DPWH-Implemented 61 Foreign-Assisted Projects, 1997-1999 Annex 2 DPWH-Implemented Foreign-Assisted Projects, 2000 62
Page Annex 3 On-going DPWH-Implemented Foreign-Assisted Projects, 63 1997-1999 Annex 4 On-going DPWH-Implemented Foreign-Assisted Projects, 64 1997-1999, Original and Revised Project Duration Annex 5 On-going DPWH-Implemented Foreign-Assisted Projects, 65 1997-1999, Budget Performance on Net Commitment (Summary of Absorptive Capacity Indices) Annex 6 On-going DPWH-Implemented Foreign-Assisted Projects, 66 1997-1999, Original and Revised Project Cost/Cost Overrun/Timeliness Index Annex 7A Absorptive Capacity Indices, by Program/Project/Region, 68 1996, Department of Public Works and Highways Annex 7B Absorptive Capacity Indices, by Program/Project/Region, 71 1997, Department of Public Works and Highways Annex 7C Absorptive Capacity Indices, by Program/Project/Region, 76 1998, Department of Public Works and Highways Annex 7D Absorptive Capacity Indices, by Program/Project/Region, 79 1999, Department of Public Works and Highways

ABSTRACT
This study evaluates the absorptive capacity of a government agency for domestic and external funds. It takes the case of the Department of Public Works and Highways (DPWH), one of the biggest recipients of funds from government and foreign sources. Specifically, the paper a) provides an assessment of the institutional framework, capability and absorptive capacity of the DPWH to implement local and foreign-funded projects and programs; b) develops measures or indicators to assess the agency’s absorptive capacity with respect to available resources; c) identifies issues within the agency and with related institutions in financial management and implementation of programs/projects; and d) formulates recommendations on how to strengthen the agency’s capacity to utilize resources. The study makes specific reference to the extent or magnitude of resources utilized, the particular programs where low utilization are more prevalent and the factors that hinder the full absorption of available money that are within and beyond the agency’s control. The paper lists down some concrete recommendations for the agency and its partner institutions that will help improve its overall capacity for fund absorption.
Keywords: absorptive capacity, public works, local government, governance, public finance

i
EXECUTIVE SUMMARY Study Objectives: Under the contract agreement with the Japan Bank for International Cooperation (JBIC), the Philippine Institute for Development Studies (PIDS) conducted the present study with the following objectives indicated under the Terms of Reference (TOR) of the said agreement: At the macro level:
1. Assess progress of accomplishments of the overall political and macroeconomic situation in the country by providing updates on the progress of accomplishments and identifying setbacks in the attainment of specific policies/programs;
2. Identify what needs to be done in the attainment of the above in the areas of macroeconomic policies, legislative arena, financial and institutional aspects.
Given time constraints and to provide focus to the evaluation, the study will highlight on the public works sector considering that the bulk of JBIC’s loan portfolio is for infrastructure and public works activities. In line with this, the following specific objectives are outlined: At the micro level:
1. Assess the institutional framework, capability and absorptive capacity of institutions involved in the public works sector in (i) implementing local and foreign-funded projects and programs; and (ii) institutionalizing measures that will strengthen the country’s international competitiveness;
2. Review the sector’s preparedness in instituting safety measures or safety nets required under the World Trade Organization (WTO) provisions and the Asian Free Trade Association (AFTA);
3. Assess the capacity of local government units (LGUs) in absorbing/implementing projects that are locally and foreign-funded and instituting measures that are in line with improving competitiveness and addressing poverty incidence.
4. Identify strengths and weaknesses of these institutions in project packaging, management and implementation and sustainable management of projects/programs.
5. Formulate suggestions on how to strengthen the capacities of these institutions (in terms of financing, manpower support, among others).
The study has significantly addressed all the abovecited objectives except
Objective No. 2, given that it does not relate whatsoever to the issues in the public works sector. In the case of Study Objective No. 3, while a qualitative assessment was made on both the DPWH and the LGUs, a quantitative evaluation was made with respect to DPWH only. This is because the issue of absorptive capacity does not concern LGUs at the moment given that to date LGUs have not been involved significantly in public works projects. The binding constraint with respect to public works development in the case of LGUs rests primarily on the lack of funds to undertake projects rather than fund absorption. Nonetheless, efforts were made to meet Objective No. 3 by discussing to the greatest extent possible issues on public works with respect to the LGUs.

ii
Summary of Findings: Macroeconomic Context. Philippine economic performance in the last 25 years has been characterized by many economists as following a boom-bust cycle. The same period also provides compelling evidence that a poor or deteriorating fiscal position on the part of the public sector effectively constrains the government’s options in support of economic recovery and sustainable growth.
The burden of the protracted fiscal adjustment process that was set in motion since 1983 has primarily been absorbed by maintenance and capital expenditures of the national government largely because government outlays on personnel and debt service are largely mandatory in nature. In this regard, government expenditure on public works (a large part of which goes to capital outlays) is hard hit whenever a crisis comes around. In particular, government expenditure on public works (on an obligation basis) plummeted to 2.1 percent of GNP (or 13.5 percent of the budget) during the 1983-1985 crisis from an average of 3.3 percent of GNP (or 18 percent of the budget) in 1975-1982. National government expenditure on public works was depressed from 1986 to 1989 but regained some ground in the period 1990-1991 when it rose slowly and peaked at 2.8 percent of GNP (or 14.4 percent of the budget) in 1991. Then, the expenditure level slid down again (to an average of 2.2 percent of GNP or 11.5 percent of the budget) in 1992 and 1993 as fiscal pressures built up with the economic slowdown in 1991. After staging a mild recovery to an average of 2.4 percent of GNP (or 12.5 percent of the budget) in 1994-1998, government expenditure on transportation and communications then dipped to 2.1 percent of GNP (or 11.3 percent of the budget) in 1999, a somewhat delayed response to the Asian financial crisis. Meanwhile, actual expenditures of the DPWH on an obligation basis closely mirror the movement of total public works spending of the central government. It dipped from 1.9 percent of GNP (or 12.2 percent of the budget) in 1982 to an average of 1.2 percent of GNP (or 8.7 percent of the budget) during the 1984-1985 recession. The DPWH budget remained at around 1 percent of GNP (or 5.0 percent of the budget) in the second half of the 1980s before rising to 1.9 percent of GNP (or 9.6 percent of the budget) in 1991. But following the downturn in the economy in that year, the DPWH slipped to 1.6 percent of GNP (or 8.6 percent of the budget) in 1992 and 1.3 percent of GNP (or 6.8 percent of the budget) in 1993. With the improved fiscal position in 1994-1997, the DPWH budget rose to an average of 1.7 percent of GNP (or 9 percent of total national government expenditures) before declining once again to 1.5 percent of GNP (or 8.2 percent of the budget) in 1999. One, thus, observes an overall downtrend in government expenditures on public works from 1982-1999 resulting largely from the massive fiscal restructuring that was undertaken during that period. In other words, public sector funds which can be committed to public works are severely limited owing to fiscal constraints and competing demands from other sectors. At the same time, reports in the late nineties underscored the significant slowdown in the utilization of available funds by implementing agencies of the Philippine Government. This has been confirmed by Government reports and also by the donor agencies, which have been alarmed and, thus, placed a more cautious stance in programming its funds to agencies they provide support to.

iii
The depressed level of public sector investment in the country introduces
serious constraints on the economic growth potentials of the country. It is imperative, therefore, that appropriations and allotments for public works agencies are fully utilized. This need primarily motivates the conduct of the present study, which aims to assess the absorptive capacity of agencies involved in the public works sector and to analyze the factors that will contribute to improving such capacity. Agencies Involved in Public Works: DPWH and LGUs. There are two major public institutions that are mandated by law to provide public works services: the Department of Public Works and Highways (DPWH) and, with enactment of the 1991 Local Government Code (LGC), the local government units (LGUs). DPWH is mandated to be the government’s engineering and construction arm, responsible for planning, design, construction and maintenance of infrastructure facilities, particularly, national highways, flood control and water resource development systems, and other public works. The 1991 LGC mandates the devolution of many functions previously discharged by central government agencies to the LGUs. There are three basic reasons why in spite of the strong and numerous provisions under the existing Code that allow them to take a prominent role, LGUs have not significantly been involved in infrastructure development, in general, and public works activities, in particular. The first relates to the ambiguous assignment of roles/functions in the delivery of public works services across levels of government. The second pertains to the limited funds available at the LGU level and the third relating to the first, is the lack of technical and administrative capability to undertake them. Given these factors, the DPWH retains the primary responsibility for the delivery of services and facilities and continues to be the primary mover with LGUs playing only a minor and supporting role.
Absorptive Capacity: Concepts and Measures. The study uses the term absorptive capacity, as it relates to budget performance, as the ability of an agency to maximize the use of available financial resources. The study introduces some indices that will measure the agency’s absorptive capacity relative to the dynamics of appropriation, allotment and obligation. These measures include the following:
Appropriation Utilization Index (ApUI) = Obligations/Appropriation
This index indicates the government agency’s ability to utilize funds relative to the legislated/ statutory spending target. Budget Programming Index (BPI) = Allotment
Appropriation Basically, this index shows the extent to which the legislated budget for the agency (appropriation) for the year has been prioritized by DBM given the actual availability of funds from domestic and external sources. Allotment Utilization Index (AUI) = Obligation
Allotment This index shows the extent to which the agency has utilized the
allotments that are actually made available by DBM. Thus, the AUI is primarily affected by the agency’s implementation capabilities. Overall Absorptive Capacity Index (OACI)

iv
= AUI = Obligations/Allotment BPI Allotment/Appropriation
This index is a measure of the congruence of agency’s ability to utilize the allotments it received (AUI) with the relative priority given to the agency by the fiscal managers (BPI).
Overall Assessment. Results of the analysis showed that fund utilization relative to appropriation had been low in the four-year period under study. The improvement observed in 1999 was not on the account of increased spending but due to the reduction in the appropriation for the year relative to the previous year (from P61B in 1998 to P34B in 1999). One will observe that while appropriations have shown an enormous variability during the period, obligations have remained fairly stable at a range of about P26 billion to P28 billion.
While total agency appropriation has risen from P40.4 billion in 1996 to P61.8 billion in 1998, allotment by DBM to the agency has shown a remarkable decline. Allotment has gone down from P41.8 billion in 1996 to P32.3 billion in 1998. This is reflected in the BPI for DPWH which declined from 1.0368 in 1996 to only .5231 in 1998. In 1999, while allotment exceeded the appropriation (BPI = 1.1125), the untimely release of these funds did not help improve fund utilization by the agency.
Relative to the allotment released to the agency, DPWH showed improvements in fund utilization with AUI rising from 62 percent to 81 percent during the period 1996 to 1998. However, the 81 percent AUI in 1998 does not mean an increased level of spending as obligation decreased by P3 billion from the previous year (from about P29 billion to P26 billion). It is, thus, largely explained by the large decrease in the allotment from P42 billion to P32 billion. In 1999, although the allotment increased to 36 billion (greater than the appropriation), obligation has remained almost the same thus showing a lower AUI of 72 percent compared to 81 percent in the previous year.
The variable trend in OACI from 1996–1999 shows the mismatch over the years between budget programming of DBM and DPWH’s capacity for fund absorption. As implied by the computed OACI, DPWH had a relatively low absorptive capacity in 1996 and 1999. In 1998, perhaps as a result of the plunge in the BPI during the year, OACI registered greater than unity (1.54) suggesting that the agency can absorb or spend more if allotment had been raised. In 1999, the low OACI has been attributed to late allotment release by the DBM and thus cannot be attributed solely to the agency’s weaknesses. Highways. Relative to allotment, utilization has been low but increasing from 1996 to 1998 (AUI=.6757 .6871 .7710 ) then declined in 1999 (AUI = .6423). Except in 1998, the low utilization of highways funds is largely an agency weakness since allotment has been relatively high (BPI ranged from 90-105 percent). The low and slow progress in fund utilization for highways have been brought about by the perennial bottlenecks surrounding these projects. Foremost among these factors include the acquisition of right of way, problems on poor performance of contractors arising from lax imposition of pre-qualification criteria for bidders and the feeble monitoring and supervision of projects. These problems have long plagued the agency but there have not been significant efforts to resolve them. Pulling further down the agency’s performance in the sector are problems relating to low and untimely allotment release by DBM in recent years as well

v
as coordination problems with other sectors or institutions involved mainly the local government units and other national government agencies. Flood Control and Drainage. The indices for flood control and drainage showed the best picture in all years relative to other projects. Relative to allotment, AUI registered greater than 70 percent. Moreover, AUI rates mirrors the corresponding BPI particularly in 1996 and 1997 showing the good match between programming and the agency’s fund absorption capacity (O ACI ~ 1). In 1999, allotment exceeded the appropriation, which may be too much for the agency to absorb and, thus, the decline in AUI (.7601) and low OACI (.4870). Port. The indices showed relatively good performance of port projects in all years, except in 1996. Poor AUI in 1996 (.2850) is on account of the low utilization of funds of a foreign assisted project. Water Supply. During the four-year period, both utilization and allotment rates have been erratic. Appropriation went down from P114M in 1996 to P8M in 1999. However, allotment in 1999 was 32 times the appropriation but AUI has been low at 26 percent. Water supply showed the lowest OACI (.0081), the worst matching of programming and agency absorption. Water supply suffered setbacks in terms of utilization mainly because of some coordination problems with the local government units that are at the forefront of implementing the project. This is particularly the problem with respect to the ADB-Rural Water Supply and Sanitation Sector Project (RW3SP) wherein there had been much delay in the finalization and approval of the Memorandum of Agreement (MOA) between DPWH/DOH/DILG and the 20 provinces involved in the said project. Preliminary and Detailed Engineering. There had been a consistently low utilization of this budget item over the four-year period most especially in the last two years, where fund utilization registered less than 30 percent (AUI = .3692 .5256 .2915 .2696). The low utilization occurred in spite of the relatively high allotment as shown by the BPI ( .9357 .7224 .7422 .7574). The agency’s inability to use the funds available reflects, on one hand, its inability (particularly the 15 regional offices and their respective district engineering offices where these funds are equally distributed) to carry out activities for project planning and necessary project feasibility and engineering studies. On the other hand, the low utilization can be a reflection of an inapt appropriation for this budget item in the first place. DPWH uses up only P45M to P60M annually during the period 1996-1999 but the annual appropriation for this budget item ranges from P150M to P235M. Various Infrastructures. Various infrastructure outranked highways in terms of appropriation in 1996 and 1997. However, in the two succeeding years, both appropriation and allotment have substantially declined. The low utilization accorded to this budget item may be partly due to the nature of these projects. These being congressional projects may have competed with the agency priority activities in terms of fund prioritization and institutional support. The same appears to hold true of DBM’s prioritization for the subject budget item. There are also instances that priorities of the proponents change in terms of scope or project location during the year which would necessitate design changes and thus delay or cause the non-implementation of the project.

vi
Issues. A variety of factors have contributed to the low absorptive capacity of DPWH in general during the period under study. The small improvements attained in recent years in fund utilization indicates that much is still desired in addressing the perennial issues that impede the agency towards better fund absorption. These factors include those, which derive from the structural and systemic weaknesses of the agency, as well as those that have been brought about by the inefficiencies in the budgeting system and coordination with various sectors or institutions.
Issues identified that obtain from the agency include the Right of Way
Acquisition (ROWA), lapses in the bidding, contracting and procurement procedures, alteration in the original project design/variation orders, compliance to documentation requirements, problems on monitoring and evaluation including the variety of reporting or monitoring forms and issues relating to the performance of Project Management Offices (PMOs).
Issues obtaining from policies or performance of and coordination with other
agencies/institutions include the ROWA issue (i.e. property valuation, squatter relocation, realignment of public utilities), synchronization, complementation and coordination of projects with other agencies and LGU involvement in public works implementation.
With respect to issues obtaining from budgeting authorities and system, one of
the biggest problems of DPWH and most implementing agencies has been the insufficient and delayed cash releases by the DBM. This is largely a fiscal than an operational issue since the delay or insufficiency of fund transfer is due primarily to shortfalls in the Government’s revenue collection. The study has also revealed the mismatch in allotment levels between budget items relative to agency utilization capacity. There seems to be a tendency for DBM to increase or reduce the allotment not on the basis of the expenditure experience over a longer reference period but on just the utilization in the previous year. There is a need for DBM to devise ways by which information on the usage of funds of agencies in the past can be used to anticipate allotment releases on a particular budget item.
Recommendations. The study identified concrete policy or program actions that will help raise the fund absorption of agencies involved in public works. These include:
a) Recommendations that are directed to DPWH and the other institutions it
coordinates; These include addressing the perennial factors impeding project implementation such as right of way acquisition, bidding process and contractor selection and performance monitoring. Also highlighted are improvements in preliminary and detailed engineering, project monitoring and evaluation system, partnerships and coordination with the LGUs on project implementation as well as organizational strengthening especially with respect to Project Management Offices (PMOs) with the end in view of rationalizing or standardizing their size either in terms of number or packages/ components or total costs of projects handled.
b) Reforms that will improve budget determination and programming; and
vii
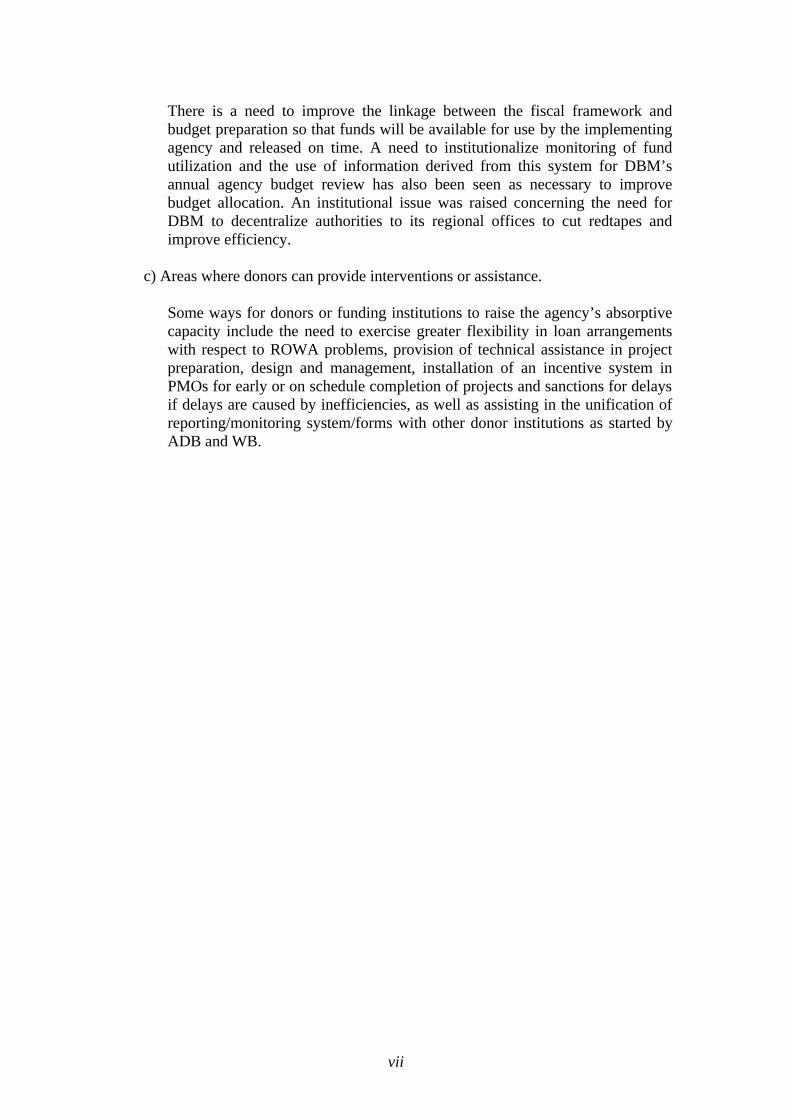
There is a need to improve the linkage between the fiscal framework and budget preparation so that funds will be available for use by the implementing agency and released on time. A need to institutionalize monitoring of fund utilization and the use of information derived from this system for DBM’s annual agency budget review has also been seen as necessary to improve budget allocation. An institutional issue was raised concerning the need for DBM to decentralize authorities to its regional offices to cut redtapes and improve efficiency.
c) Areas where donors can provide interventions or assistance. Some ways for donors or funding institutions to raise the agency’s absorptive capacity include the need to exercise greater flexibility in loan arrangements with respect to ROWA problems, provision of technical assistance in project preparation, design and management, installation of an incentive system in PMOs for early or on schedule completion of projects and sanctions for delays if delays are caused by inefficiencies, as well as assisting in the unification of reporting/monitoring system/forms with other donor institutions as started by ADB and WB.

1
AN ASSESSMENT OF THE ABSORPTIVE CAPACITY OF AGENCIES INVOLVED IN THE PUBLIC WORKS SECTOR
1. INTRODUCTION 1.1. Macroeconomic Context Economic Growth and the Fiscal Deficit. Philippine economic performance in the last 25 years has been characterized by many economists as following a boom-bust cycle (Figure 1). The same period also provides compelling evidence that a poor or deteriorating fiscal position on the part of the public sector effectively constrains the government’s options in support of economic recovery and sustainable growth. For instance, in the early 1980s, the government attempted to mitigate the effects of the second oil price shock by pursuing an expansionary expenditure program financed by foreign borrowing. As a consequence, the national government’s fiscal deficit soared to 4.3 percent and 4.6 percent of GNP in 1981 and 1982, respectively, from an average of 1.5 percent in 1978-1980 (Table 1). However, this approach proved to be unsustainable for a number of reasons. First, the recession in the world economy took longer than expected. Second, foreign capital was not as accessible during this period (compared to the 1970s) so that the government did not have the wherewithal to weather both the external and the internal balance. Third, the financial crisis of 1981 and severe political difficulties in 1983 led to massive capital flight that further exacerbated the situation.
Fig. 1 Growth Rate of Real GDP ( 1975-1999 )
-10.00
-8.00
-6.00
-4.00
-2.00
0.00
2.00
4.00
6.00
8.00
10.00
75 76 77 78 79 80 81 82 83 84 85 86 87 88 89 90 91 92 93 94 95 96 97 98 99
Year
With external financing severely constrained, the government defaulted on its foreign obligations in October 1983 and it had no choice but to adopt a stringent stabilization program under the auspices of the IMF. Government spending, particularly that on maintenance and capital, was cut deeply. The fiscal deficit was subsequently reduced but the toll on the economy was heavy and the economy contracted by 7.3 percent annually for two consecutive years: 1984 and 1985. Similarly, after rebounding from the 1984-1985 recession with a creditable GDP growth rate of 3.4 percent in 1986 and an annual average rate of growth of 5.5 percent in 1987-1989, the economy faltered once again in 1990 when the rate of growth of GDP decelerated to 2.4 percent. Moreover, GDP contracted by 0.5 percent in 1991 and was practically stagnant in 1992 (Figure 1).

2
The unsustainable character of growth in 1986-1989 may be explained by a confluence of external and internal factors. First, anemic growth in the developed countries dampened demand for the country’s exports during this period. Second, the country was badly hit by a number of natural calamities (e.g., Mt. Pinatubo eruption, earthquake and typhoons) that had deleterious effects on overall output growth and devastated huge amounts of government infrastructure. Third, incessant political instability (as manifested by a series of coup attempts) led to a crisis in investor confidence. Fifth, there was a delay in the implementation of essential infrastructure programs and policy reforms that were aimed at correcting the economy’s structural weaknesses. For instance, the failure of government to implement an adequate energy program earlier on resulted in severe power outages. Also, the government stalled too long in adjusting petroleum product prices and this resulted in the ballooning of the consolidated public sector deficit (CPSD). Meanwhile, government owned/controlled corporations also contributed significantly to the CPSD even as the fiscal deficit of the central government surged to 3.4 percent of GNP in 1990. Once again, the government pursued an orthodox stabilization program consisting of tight monetary and fiscal policy. National government expenditure on capital and maintenance bore the brunt of the adjustment again. Further improvements in tax effort were also put in place. Thus, the fiscal deficit was reined in anew such that in 1994 the national government posted a surplus for the first time in 20 years. This experience was repeated in 1995, 1996 and 1997. Thus, an expansionary mood pervaded the preparation and execution of the 1997 budget.

3
In 1996, the outlook for the economy was at its most optimistic in the last quarter of a century. GDP growth accelerated from 2.1 percent in 1993 to 5.8 percent in 1996 as policy reforms stimulated investment and economic activity. Inflation was maintained at single digit levels since 1992. Gross international reserves reached a record high given the substantial inflow of foreign investment, albeit a good portion of which was in the form of portfolio investment. Then, the Asian financial crisis struck and the Philippines’ GDP growth rate slipped to 5.2 percent in 1997 and –0.6 percent in 1998 before it rebounded to 3.3 percent in 1999. The financial crisis led to a squeeze in the government budget. On the one hand, revenues suffered largely because of the decline in imports and the slowdown in the economy. On the expenditure side, higher interest payments caused by the rise in interest rates and higher demand for government assistance in drought- and typhoon- affected areas put greater pressure on budgetary resources. Thus, the government started to post a deficit in the second semester of 1997 although it still managed to post a surplus for the entire year. Despite the onset of the crisis in July 1997, the 1998 President’s Budget was not downscaled when it was presented to Congress. Moreover, Congressional initiatives led to an even larger budget appropriation. But concomitant with the downward adjustment in the revenue program in the early part of 1998, the national government expenditure program was similarly modified. Thus, Administrative Order 372 was issued in February 1998 imposing a 25 percent reserve on total appropriations for non-personnel items of all national government agencies. At the same time, the order imposed a 10 percent reserve on the internal revenue allotment (IRA) share of local government units. Fiscal Deficit and Government Spending on Public Works. As earlier noted, the burden of the protracted fiscal adjustment process that was set in motion since 1983 has primarily been absorbed by maintenance and capital expenditures of the national government largely because government outlays on personnel and debt service are largely mandatory in nature. In this regard, government expenditure on public works (a large part of which goes to capital outlays) is hard hit whenever a crisis comes around. In particular, government expenditure on public works (on an obligation basis) plummeted to 2.1 percent of GNP (or 13.5 percent of the budget) during the 1983-1985 crisis from an average of 3.3 percent of GNP (or 18 percent of the budget) in 1975-1982 (Table 2 and Table 3). National government expenditure on public works was depressed from 1986 to 1989 but regained some ground in the period 1990-1991 when it rose slowly and peaked at 2.8 percent of GNP (or 14.4 percent of the budget) in 1991. Then, the expenditure level slid down again (to an average of 2.2 percent of GNP or 11.5 percent of the budget) in 1992 and 1993 as fiscal pressures built up with the economic slowdown in 1991. After staging a mild recovery to an average of 2.4 percent of GNP (or 12.5 percent of the budget) in 1994-1998, government expenditure on transportation and communications then dipped to 2.1 percent of GNP (or 11.3 percent of the budget) in 1999, a somewhat delayed response to the Asian financial crisis. Meanwhile, actual expenditures of the Department of Public Works and Highways (DPWH) on an obligation basis closely mirror the movement of total public works spending of the central government. It dipped from 1.9 percent of GNP (or 12.2 percent of the budget) in 1982 to an average of 1.2 percent of GNP (or 8.7 percent of the budget) during the 1984-1985 recession (Table 2). The DPWH budget remained at around 1 percent of GNP (or 5.0 percent of the budget) in the second half of the 1980s before rising to 1.9 percent of GNP (or 9.6 percent of the budget) in 1991. But following the downturn in the economy in that year, the DPWH

4
slipped to 1.6 percent of GNP (or 8.6 percent of the budget) in 1992 and 1.3 percent of GNP (or 6.8 percent of the budget) in 1993. With the improved fiscal position in 1994-1997, the DPWH budget rose to an average of 1.7 percent of GNP (or 9 percent of total national government expenditures) before declining once again to 1.5 percent of GNP (or 8.2 percent of the budget) in 1999.
Moreover, total public sector infrastructure investment in the country (which was equal
to 3.3 percent of GNP in 1986-1998 and about 60 percent of which was accounted for by outlays in the public works sector) has not kept pace with the Medium Term Public Investment Plan target of about 5 percent to GNP nor with the average level (of 4.5 percent of GNP) in the East Asian region (Kohli 1994).
One, thus, observes an overall downtrend in government expenditures on public works from 1982-1999 resulting largely from the massive fiscal restructuring that was undertaken during that period. In other words, public sector funds which can be committed to public works

5
are severely limited owing to fiscal constraints and competing demands from other sectors (Halcrow Fox 1997). At the same time, a number of reports have pointed to the dramatic slowdown in the utilization of available financial resources from both domestic and foreign funding sources in the late 1990s. For instance, the National Economic and Development Authority (NEDA) recorded in its 7th Official Development Assistance Portfolio Review (ODAPR) a drop in the overall ODA availment rate to 66 percent in 1998 from the previous year’s 74 percent. This figure further slipped to 62 percent in the 1999 (8th ODAPR). The low disbursement rate had been associated with delays in project implementation. Said difficulties, in turn, are attributed to various factors including problems in the acquisition of right of way for infrastructure projects, weak management and financial system, and poor monitoring mechanisms. In addition, the austerity measures implemented by the government as a result of the recent Asian financial crisis had effectively reduced the budgets of agencies to levels that are below the approved appropriation. Specifically, Executive Order No. 454 (Implementing Austerity Measures in Government for 1997” issued in 31 October 1997) directed all government agencies to set aside (as reserve) an amount equivalent to at least 5 percent of their authorized budget through the conduct of cost-reduction measures that included personnel attrition, deferment of capital outlay expenses, reduction in operations cost, and deferment of projects encountering problems and significant cost-overruns. Similarly, Administrative Order No. 372 (“Adoption of Economy Measures in Government in 1998” signed in 27 December 1997) mandated all government agencies to adopt cash management measures (in any of the following broad areas: organization and staffing, suspension of certain agency activities such as the implementation of new capital/infrastructure projects, except those which have already been contracted out, suspension of all tax expenditure subsidies to all government owned/controlled corporations and local government units (LGUs), deferment of projects that are encountering significant implementation problems, reduction in office operations cost, and the suspension of fund realignments with the end in view of generating “forced savings” equal to at least 25 percent of authorized non-personnel expenditures. The depressed level of public sector investment in the country introduces serious constraints on the economy’s growth potentials. The positive relationship between economic growth and public investment is generally taken to be part and parcel of conventional wisdom or received knowledge. In the Philippines, this relationship has been established in a more systematic manner in a study which shows that (1) public sector infrastructure investment expenditures are statistically associated with economic growth, and (2) public sector infrastructure investment crowds in private sector investment in contrast to public sector non-infrastructure investment (Manasan 1994). Halcrow Fox (1997) noted the difficulty in ascertaining the real cause of the poor performance of the sector: lack of funds or ineffective use of the funds available. 1.2. Objectives
Given this background, it is imperative that appropriations and allotments for public works agencies are fully utilized. This need is primarily what motivates the conduct of the present study, which aims to document the absorptive capacity of agencies involved in public works and to analyze the factors that contribute to improving the said capacity. A qualitative assessment is made for both the DPWH and the LGUs. However, in this study, a quantitative evaluation will be made only with respect to DPWH. This is so because absorptive capacity is not a major issue for LGUs at the moment given that, to date, LGUs are not significantly

6
involved in public works programs and projects. Relatedly, the binding constraint with respect to public works development in the case of LGUs rests primarily on the lack of funds to undertake projects rather than fund absorption.1 The quantitative assessment of the absorptive capacity of the Department of Public Works and Highways (DPWH) will include:
• an assessment of the institutional capability and absorptive capacity of the DPWH to implement local and foreign funded projects and programs;
• the development of indicators to assess the institution’s absorptive capacity with respect to available resources;
• the identification of problems within the agency’s control as well as those which are outside the agency’s sphere of control; and
• recommendations to strengthen the government’s capacity to improve budget programming and fund utilization.
Specifically, the paper hopes to document the magnitude of unutilized resources, the
particular programs where low utilization is prevalent and, more importantly, the factors that hinder the full absorption of available financing. 2. PUBLIC WORKS AND HIGHWAYS SECTOR PERFORMANCE AND
CHALLENGES Table 4 summarizes the state of public works in the country and the related development objectives in the medium term. 2.1. Roads
As of end of 1998, the over all road network of the Philippines (national and local roads combined) was 190,030 km. in length. About 15 percent or 27,912 km. are classified as national roads while the rest are categorized as local roads. Barangay roads comprise about 70 percent of all local roads.
The paved road ratio, an indicator of road quality, was 61 percent for national roads (71 percent for arterial roads and 47 percent for secondary roads) and only 13 percent for local roads as of end of 1998. Thus, the overall paved road ratio was only 20 percent. The low paved road ratio for local roads is attributable to the large inventory of barangay roads, many of which do not warrant paving as these are slightly used and, therefore, can just be maintained as all weather roads. However, other local roads need significant improvement as only 70 percent of city roads are paved while ratios for municipal and provincial roads (at 34 percent and 21 percent, respectively) are even much lower.
The Estrada Administration hopes to pave 93 percent of national roads (i.e. 85 percent of secondary roads and 100 percent of arterial roads) at the end of its term. It also aims to rehabilitate and improve 26,800 km of feeder roads and to construct 6,000 new ones. At the
1 A more detailed discussion in this regard is found in Section 3.2 and a case study of one of the first attempts to involve LGUs in a major public works project is discussed in Section 7.2.

7
same time, it targets 25 percent of barangay roads to be paved by the year 2004. The achievement of these targets will entail about P211 billion. With respect to new road constructions, 1,995 km of urban roads, 12 interchanges and 608 km of expressways are lined up. This will involve a huge sum of a little more than P179 billion. Overall, total road investments to achieve the medium-term targets for road construction and maintenance would be around P390 billion.
8
2.2. Bridges There are 261,965 lineal meters (lm) of bridges in the country. Of these, only 89 percent are permanent (i.e. concrete and steel) as of the end of 1998. The present administration hopes to make all the existing bridges permanent. This will involve the reconstruction of 29,763 temporary bridges and the improvement of bridges measuring a total of 38,670 lm. The cost to achieve this goal will be a little more than P19 billion. In addition, around P3 billion will be needed to build 4,495 lm of new bridges. 2.3. Ports There are 179 fishing ports while there are 102 municipal/ feeder ports. The feeder ports program that is currently being implemented has completed 33 ports and has started work in 36 others, focusing on rural and depressed areas.
In the medium-term, Roll-On-Roll-Off (RORO) terminal upgrading will be done for the ports of Matnog, San Isidro, Liloan and Lipata. The development of transfer points along Manila and Cebu corridor will be done for Ports of Pagbilao (Quezon), Pantao (Bicol), Ormoc (Leyte), Balamban (Cebu), Culasi (Capiz) and San Carlos (Negros Occidental). This will cost around P40 million. At the same time, about P150 million will be spent to conduct of feasibility studies for the following local ports: Puerto Princesa, Legaspi, Pantao, Romblon, Currimao, San Carlos, Tagbilaran, Dumaguete, Maasin, Ormoc, Culasi, Dumagat (Aklan), Dumangas (Iloilo), Pulupandan, Balamban (Cebu), Iliga. 2.4. Water Supply About 87 percent of the total population in rural areas or 36 million have access to safe drinking water. By year 2004 (the end of the Plan period), it is targeted to increase to 93 percent or about 44 million. 2.5. Flood Control DPWH has spent P12.2 billion for 3,366 foreign-funded and locally-funded flood control projects from 1993-98. The total area that has been provided by DPWH with flood control and drainage facilities reached 292,193 or 59.3 percent of the total potential coverage area of 492,831 hectares. Meanwhile, about 90 percent of the total coverage area for mini-Sabo dams had been accomplished by the agency. A projected 1.4 million hectares will be added to the potential coverage bringing the total potential coverage to 1.95 million hectares. At the end of 2004, about 1.66 million hectares or 85 percent of the total coverage area will be targeted for flood control and drainage provision involving about P42 million. 3. AGENCIES INVOLVED IN PUBLIC WORKS
There are two major public institutions that are mandated by law to provide public works services: the Department of Public Works and Highways (DPWH) and, with enactment of the 1991 Local Government Code, the local government units (LGUs).

9
3.1. DPWH The DPWH, which is the primary agency tasked to undertake all activities relating to the
public works sector and thus, given its huge responsibility, has consistently captured a large slice of the national government budget. It received an average appropriation of about P 42 billion annually from the government’s budget during the past five years. The agency is also a regular recipient of substantial amount of financing from bilateral and multilateral funding institutions for its various infrastructure programs such as highways (roads and bridges), flood control and drainage, ports, water supply as well as school buildings.
History.2 About two weeks after the declaration of Philippine independence in 12 June
1898, then President Emilio Aguinaldo created by Proclamation the Department of Public Works, Education and Hygiene. Over time, this agency evolved into three distinct departments: the Department of Education, Culture and Sports (DECS), the Department of Health (DOH) and DPWH.
In 1902, the Philippine Commission passed Act No. 222 creating the Department of Commerce and Police and Act No.268 creating the Bureau of Engineering and Construction (public works) and the Bureau of Architecture and Construction (public buildings). In October 1905, by virtue of the Reorganization Act (No. 1401), the Bureau of Public Works was created and placed under the Department of Commerce and Police. The year 1910 marked an important milestone with the appearance of motor vehicles for the first time in Philippine highways. Since then, the demand to maintain existing roads and bridges in good condition and to build new ones has grown incessantly. To address the need for the rapid development of the transportation and communications sector, the Department of Commerce and Police was replaced by the Department of Commerce and Communications (DOCC) under the Reorganization Act No. 2666 of 1916. In 1931, Act No. 4007 converted the DOCC to the Department of Public Works and Communications (DPWC). However, the said Act did not specify the new functions and composition of the new department.
In 1935, with the inauguration of the Commonwealth Government, the DPWC was
reorganized to consist of: the Bureau of Public Works, the Port Aeronautics, the Coast and Geodetic Survey, the Metropolitan Water District Division of Marine, the Railway and Repair Shop, the National Radio Broadcasting, the Irrigation Council and the Board of Examiners for Civil, Mechanical Chemical and Mining Engineers. The DPWC had still another facelift in 1951, with its reconstitution as the Department of Public Works, Transportation and Communications (DPWTC) under Executive Order No. 392 to include the following offices: Bureau of Public Works, Posts, Telecommunications, Motor Vehicle Office, Irrigation Council, Flood Control Commission, Radio Control Board, National Transportation Board and Government Quarters Committee.
Two years later, in 1953, Republic Act No. 917 or the Philippine Highways Act was
passed to provide for the effective administration and financing of existing highways as well as to institutionalize the involvement of provinces and cities in the maintenance of roads and bridges. In 1954, the Bureau of Public Highways was created by virtue of Republic Act No. 1192 and placed under the DPWTC and tasked with the management of road and bridge construction and maintenance.
2 This was culled from the official historical accounts documented by the public information departments of the DOH and DPWH.

10
In 1972, following the declaration of Martial Law, the government implemented the
Integrated Reorganization Plan (Presidential Decree No. 1). The DPWTC became the Ministry of Public Works, Transportation and Communications (MPWTC). In 1974, the BPH was expanded, given more power and restructured to a ministry, i.e. Ministry of Public Highways, for more effective highway administration. In 1979, under Executive Order No. 546, MPWTC was split into two ministries: the Ministry of Public Works (MPW) and the Ministry of Transportation and Communications (MOTC). All bureaus and offices concerned with public works functions were placed under the former and those involved in transportation and communications were placed under the supervision and administration of the MOTC.
In 1981, Executive Order No. 710 merged the MPW and the MPH into a single ministry,
i.e. the Ministry of Public Works and Highways (MPWH). Under the new ministry are 15 regional offices, 117 district and 45 city engineering offices, 5 bureaus and 6 service offices as well as attached corporations and councils for administrative supervision. Following the installation of the Aquino administration, Executive Order No. 124 reorganized the Ministry of Public Works and Highways (MPWH). Specifically, it provided for the change in nomenclature from MPWH to Department of Public Works and Highways (DPWH) in the event of the adoption of the 1986 Philippine Constitution which provided for a presidential form of government. But more importantly, E.O. No. 124 put in place the present institutional framework of DPWH by defining its mandate, powers and functions, organizational structure, and agency linkages.
Mandate. DPWH is mandated to be the government’s engineering and construction arm, responsible for planning, design, construction and maintenance of infrastructure facilities, particularly, national highways, flood control and water resource development systems, and other public works. The law provides that “this responsibility shall be decentralized to the fullest extent feasible.”
Powers and Functions. The agency’s powers and functions as provided for by the law are as follows: 1. Provide technical services for the planning, design, construction, maintenance and/or
operation of infrastructure facilities. 2. Develop and implement effective codes, standards and reasonable guidelines to ensure the
safety of all public and private structures in the country and assure efficiency and proper quality in the construction of public works;
3. Ascertain that all public works plans and project implementation designs are consistent with current standards and guidelines;
4. Identify, plan, secure funding for, program, design, construct or undertake pre-qualification, bidding, and award of contracts of public works projects with the exception only of specialized projects undertaken by government corporate entities with established technical capability as directed by the President of the Philippines or as provided by law;
5. Provide the works supervision function for all public works construction and ensure that actual construction is done in accordance with approved government plans and specifications;
6. Assist other agencies, including the local governments, in determining the most suitable entity to undertake the actual construction of public works projects;

11
7. Maintain or cause to be maintained all highways, flood control, and other public works throughout the country except those that are the responsibility of other agencies as directed by the President of the Philippines or as provided for by law;
8. Classify roads and highways into national, regional, provincial, city, municipal and barangay roads and highways, based on objective criteria it shall adopt; provide or authorize the conversion or roads and highways from one category to another; and
9. Delegate, to any agency it determines to have the adequate technical capability, any of the foregoing powers and functions.
Specific Responsibilities. In the light of E.O. 124 and consistent with the 1991 Local
Government Code (RA 7160), the following are the specific responsibilities of DPWH at present. Highways
Integrated planning of the Philippine highway system. Funding, design, construction and maintenance of national roads.
(Provincial, city, municipal and barangay roads are with the local government units (LGUs)).
Ports3 Planning, funding, design and construction of foreign-assisted fishing ports and
municipal (feeder) multi-purpose ports (Other ports are with the DOTC and LGUs) Flood Control
Planning, funding, construction and maintenance of major flood control and drainage
facilities. Water Supply4
Funding, design and construction of Level I facilities (point sources)5 with foreign
financing (Locally funded Level I projects are with the LGUs) 3 The NEDA Infrastructure Committee (INFRACOM) passed a resolution in 19 August 1991 transferring, lock, stock and barrel, the responsibility for port projects to the Department of Transportation and Communication (DOTC). The DPWH has since then continued only projects that were ongoing before this cabinet decision and those that are included in the agency’s appropriation mainly through congressional insertions. 4 The Local Water Utilities Administration (LWUA), the National Water Resources Board (NWRB), and the Metropolitan Waterworks and Sewerage System (MWSS) are the attached agencies of the DPWH concerned with water supply activities. However, these agencies are not directly implementing water supply projects. The NWRB is a coordinating and regulatory agency for all water resources development and utilization. The LWUA, on the other hand, is a specialized lending institution tasked to promote and oversee the development of provincial water works system and extends services to duly formed Water Districts and Rural Waterworks and Sanitation Associations (RWSAs). The MWSS is responsible for the water supply and sewerage disposal in the greater Metro Manila area. However, DPWH continues to construct and maintain storm sewers and drains in Metro Manila while in other urban areas, LGUs take responsibility in this area. 5 A point source refers to a protected well or a developed spring with an outlet but without a distribution system. It is generally adaptable in rural areas where the houses are thinly scattered. It normally serves an average of 15 households.

12
National Buildings
Design, construction, and maintenance of buildings of national government agencies (funded mainly by concerned agencies).
Urban Community Infrastructure
Planning, funding, construction and maintenance of basic national infrastructure in depressed areas of urban centers with foreign assistance
(Locally funded community infrastructures are with the LGUs) Other Public Works
Design and construction of schoolbuildings and other nationally-funded public works (funded by end-user agencies)
Organization. As indicated earlier, E.O. 124 defines the basic organization of DPWH as
it exists today. It prescribes no more than five (5) undersecretaries (Usec) and no more than six (6) assistant secretaries (Asec) to support the Secretary who is the head of the agency and all appointed by the President of the Philippines. It further specifies that the six assistant secretaries shall each be responsible for Internal Audit Services, Monitoring and Information Service, Planning Service, Comptrollership and Financial Management Service, Legal Service and Administrative and Manpower Management Service. Apart from the Department proper, the agency shall also be composed of five (5) Bureaus, namely, Bureau of Research and Standards, Bureau of Design, Bureau of Construction, Bureau of Maintenance and Bureau of Equipment. Field offices shall include 14 Regional Offices and their respective District Offices within the province or city headed by the District Engineer appointed by the Secretary and under the supervision of the respective Regional Directors. It also prescribes two Assistant Regional Directors (ARDs) in the Regional Offices to assist the Regional Director. One ARD shall exercise supervision over the construction, maintenance and works supervision functions in the region while the other is tasked with planning, project design, evaluation and technical assistance function in the Regional Office. Under E.O. 124, the attached agencies and corporations of the agency include the National Water Resources Board (NWRB), the Metropolitan Waterworks and Sewerage System (MWSS), the Local Water Utilities Administration (LWUA), the National Irrigation Administration (NIA), the reorganized Metropolitan Manila Flood Control and Drainage Council (MMFCDC) and the Traffic Engineering Center (TEC) which is to be created under a separate executive issuance.
Figure 2 shows the present DPWH organizational and reporting structure. The agency is headed by the Secretary and supported by four (4) Usecs and four (4) Asecs. One Asec has been in charge of both Planning Service and Monitoring and Information Service and another supervising the Legal Service and Internal Audit Service operations. The four Usecs have been tasked to oversee specific bureaus, regional offices and project management offices. As shown in the figure, there are currently 16 regional offices and 125 District Engineering Offices under the supervision by DPWH. There are four attached agencies of the department, namely, MWSS, LWUA, NWRB and the Toll Regulatory Board (TRB). The NIA has been transferred to the Department of Agriculture in 1995 while the supervision of the MMFCDC and the TEC has been transferred to the Metro Manila Development Authority (MMDA) also in the same year.

13
Figure 2

14
Manpower. As of January 2000, total manpower complement of DPWH totaled 36,617. Of these, about 20,000 are regular personnel while the rest are casual and contractual employees in the central and regional offices and in the 22 project management offices. More than half of the total number of personnel are in the 16 regional offices with an average of about 1000 per regional office. 3.2. Local Government Units
The Local Government Code of 1991 mandates the devolution of many functions previously discharged by central government agencies. Prior to the implementation of the Code, the functions assigned to LGUs were limited to the levy and collection of local taxes, the issuance and enforcement of regulations governing the operation of business activities in their jurisdictions, and the administration of certain services like garbage collection, operation and maintenance of cemeteries, public markets, and slaughterhouses. Then, LGUs had a secondary role in agricultural planning and extension, construction and maintenance of local roads and public buildings, and operation of high schools, hospitals/health services with the central government carrying the primary responsibility for the delivery of the said services and facilities. In contrast, the Code, ordains the transfer from the national government agencies (NGAs) to the LGUs of the principal responsibility for the delivery of basic services and the operation of facilities in the following areas: agricultural extension and research, social forestry, environmental management and pollution control, primary health care, hospital care, social welfare services, repair and maintenance of local infrastructure facilities (i.e., local roads and bridges), water supply and communal irrigation and land use planning. The devolution is substantial not only in terms of the sheer number of functions that were shifted but more so in terms of the number of personnel transferred (Table 5) and corresponding reductions implied in the budgets of affected NGAs (Table 6).
Table 5. Number of Devolved Personnel, 1992 NUMBER OF RATIO OF DEVOLVED PERSONNEL NUMBER OF PERSONNEL TO
DEPARTMENT/AGENCY BEFORE DEVOLVED PRE-DEVOLUTION DEVOLUTION PERSONNEL PERSONNEL % Department of Agriculture 29,638 17,673 59.63 Office of the Secretary 29,234 17,664 60.42 National Meat Inspection Commission 404 9 2.23 Department of Budget and Management 3,532 1,650 46.72 Department of Environment and Natural Resources 21,320 895 4.20 Department of Health 74,896 45,896 61.28 Department of Social Welfare and Development 6,932 4,144 59.78 Other Executive Offices 191 25 13.09 Philippine Gamefowl Commission 191 25 13.09 Total 136,509 70,283 51.49
Source: 1993 National Expenditure Program, Regional Coordination Staff

15
Policy and Regulatory Framework. Section 17 of the Code provides the basis for the involvement of LGUs in provision of public works. It specifically ordains LGUs to undertake public works and infrastructure projects funded out of local funds.
Table 6. Agency Budgets and Devolution, 19921 (In thousand pesos)
RATIO OF DEVOLVED DEVOLVED AGENCY BUDGET BUDGET TO
BEFORE DEVOLVED PRE-DEVOLUTION DEVOLUTION BUDGET BUDGET %
Department of Agrarian Reform 1,842,374 9,389 0.51
Department of Agriculture 5,210,028 1,055,620 20.26
Department of Budget and Management 465,379 172,847 37.14 Department of Environment and Natural Resources 1,941,782 167,675 8.64
Department of Health 9,991,392 3,851,079 38.54
Department of Public Works and Highways 27,109,267 1,096,347 4.04
Department of Social Welfare and Development 1,320,708 866,420 65.60 Department of Tourism 207,721 2,753 1.33
Department of Transportation and Communication 7,563,929 97 0.00
Philippine Gamefowl Commission 15,208 8,705 57.24
Total 55,667,788 7,230,932 12.99
Based on the 1992 Expenditure Program and incorporates full year impact of the
functions/projects/activities devolved. Captures only expenditures of devolving agencies (i.e., Office of the Secretary
of Departments except for the Department of Agriculture which also includes the
National Meat Inspection Commision).
Source: 1993 National Expenditure Program
Specific Functions
The following are the specific tasks for each level of sub-national government under
Section 17(b):
Barangay
- Maintenance of barangay roads and bridges and water supply systems; - Infrastructure facilities such as multi-purpose hall, multipurpose pavement, plaza, sports
center and other similar facilities Municipality
- Municipal buildings, cultural centers, public parks including freedom parks, playgrounds and sport facilities and equipment, and other similar facilities
- Infrastructure facilities intended primarily to service the needs of the residents of the municipality and which are funded out of municipal funds including, but not limited to,
16
municipal roads and bridges; school buildings and other facilities for public elementary and secondary schools; clinics, health centers and other health facilities necessary to carry to carry out health services; communal irrigation, small water impounding projects and other similar projects; fish ports; artesian wells, spring development, rainwater collectors and water supply systems; seawalls, dikes drainage and sewerage, and flood control; traffic signals and road signs and similar facilities
Province
- Provincial buildings, provincial jails, freedom parks and other public assembly areas, and other similar facilities.
- Infrastructure facilities intended to service the needs of the residents of the province and which are funded out of provincial funds including, but not limited to, provincial roads and bridges; inter-municipal waterworks, drainage and sewerage, flood control and irrigation systems; reclamation projects; and similar facilities
City
- Same as municipality and province - Adequate communication and transportation facilities
However, Section 17(c) and Section 17(d) further provide:
“c) Notwithstanding the provision of subsection (b) hereof, public works and infrastructure projects and other facilities, programs and services funded by the National Government under the annual General Appropriations Act, other special laws, pertinent executive orders, and those wholly or partially funded from foreign sources, are not covered under this Section, except in those cases where the local government unit concerned is duly designated as the implementing agency for such projects, facilities, programs and services. d) The designs, plans, specifications, testing of materials, and the procurement of equipment and materials from both foreign and local sources necessary for the provision of the foregoing services and facilities shall be undertaken by the local government unit concerned, based on national policies, standards and guidelines.” Thus, the implementation public works and infrastructure programs and projects that are funded out of the GAA, other special laws and official development assistance continues to rest with the national government agencies, specifically the DPWH. Moreover, unlike other devolved departments, the DPWH did not actually devolve personnel nor facilities to LGUs. In this regard, LGUs are not bound to allocate a fixed portion of their funds for the sector except to the extent that many local projects funded of the Local Development Fund are in the public works sector. The Local Engineer
The Code provides for the mandatory appointment of a local Engineer in every municipality, province and city. The basic qualifications of the local engineer include being a licensed civil engineer and having acquired experience in the practice of his profession for at least five (5) years in the case of the provincial and city engineer and three (3) years in the case of the municipal engineer. The Code specifies the functions of the engineer as follows:

17
- Initiate, review and recommend changes in policies and objectives, plans and programs,
techniques, procedures and practices in infrastructure development and public works in general of the local government unit concerned;
- Advise the governor or mayor, as the case may be, on infrastructure, public works and other engineering matters;
- Administer, coordinate, supervise and control the construction, maintenance, improvement, and repair of roads, bridges and other engineering and public works projects of the local government unit concerned;
- Provide engineering services to the local government unit concerned, including investigation and survey, engineering designs, feasibility studies, and project management;
- In the case of the provincial engineer, exercise technical supervision over all engineering offices of component cities and municipalities; and
- Exercise such other powers and perform such other duties and functions as may be prescribed by law or ordinance.
NG-LGU Coordination
The Code prescribes for the mandatory consultation and coordination by national government entities with LGU with respect to programs and projects implemented within the local government unit concerned. The following are the relevant provisions in this regard:
- Section 2( c ). It is likewise the policy of the State to require all national agencies and
offices to conduct periodic consultations with appropriate local government units, non-governmental and people’s organizations and other concerned sectors of the community before any project or program is implemented in their respective jurisdictions.
- Section 26. It shall be the duty of every national agency or government-owned or controlled corporation authorizing or involved in the planning and implementation of the project or program that may cause pollution, climatic change, depletion of non-renewable resources, loss of cropland, rangeland, or forest cover, and extinction of animal or plant species, to consult with the local government units, non-governmental organizations, and other sectors concerned and explain the goals and objectives of the project or program, its impact upon the people and the community in terms of environment or ecological balance, and the measures that will be undertaken to prevent or minimize the adverse effects thereof.
- Section 27. Prior Consultations Required – No project or program shall be implemented by government authorities unless the consultations mentioned in Sections 2 ( c ) and 26 hereof are complied with, and prior approval of the sanggunian concerned is obtained: Provided, That occupants in areas where such projects are to be implemented shall not be evicted unless appropriate relocation sites have been provided, in accordance with the provisions of the Constitution.
Related to these, the Implementing Rules and Regulations (IRR) of the Code provides
the following:
- Article 55. NGAs with project implementation functions shall coordinate with one another and with LGUs concerned in the discharge of these functions. They shall ensure the participation of LGUs both in the planning and implementation of said national projects. NGAs and GOCCS with field units or branches in a province, city or

18
municipality shall furnish the local chief executive concerned, for his information and guidance, monthly reports, including duly certified budgetary allocations and expenditures.
- Article 56. The local chief executives may call upon any national official or employee stationed in or assigned to an LGU to advise and regularly report to him on matters affecting LGUs and make recommendations thereon; or to coordinate in the formulation and implementation of all plans, programs and projects. When appropriate, the local chief executive may initiate an administrative or judicial action against any National Government official or employee who may committed an offence in the performance of his official duties while stationed or assigned in the LGU concerned. The local chief executive shall inform the NGA concerned if any services have adverse effects on the lives of the citizens that is foreseen or is being felt and to submit proposals intended to prevent or mitigate the same.
Guidelines on the Use of the 20 Percent Local Development Fund
Section 287 of the Code provides that every local government must allocate 20 percent of its IRA to “local development projects that are embodied or contained in the local development plans. Neither the Code nor its IRR provided any definition of “local development projects.” Thus, in principle, the Code gives LGUs the discretion in choosing projects that will be included in their local development plans. In practice, however, contrary to the spirit of the Code, Department of Interior and Local Government (DILG) through various Memorandum Circulars had imposed restrictions on the use of the said fund. For instance, DILG Circular No. 99-66 issued on 23 April 1999 stipulated that the use of the fund should be limited to the following: (1) social development such as human and ecological security initiatives (20 percent of the 20 percent); purchase of fire trucks, patrol cars/jeeps and other relevant equipment for maintaining peace and order; tourism development and promotion and other social development undertakings supportive of job generation and livelihood opportunities; (2) economic development such as food security program, poverty eradication initiatives, seedlings, nurseries, agricultural demonstration farms and animal breeding stations; cooperatives development; livestock dispersal and fishery development and fish culture farming; and (3) procurement of new heavy equipment only for infrastructure, agricultural and environmental projects.
Assessment of LGU Involvement in Public Works. There are three basic reasons why
in spite of the strong and numerous provisions under the existing Code that allow them to take a prominent role, LGUs have not significantly been involved in infrastructure development, in general, and public works activities, in particular. The first relates to the ambiguous assignment of roles/functions in the delivery of public works services across levels of government. The second pertains to the limited funds available at the LGU level and the third, which relates to the first, is the lack of technical and administrative capability to undertake them. Unclear Delineation of Functions Across Levels of Government
As discussed above, specific provisions of the Local Government Code limit the
opportunity of the LGUs to take active part in the implementation of infrastructure projects by allowing national government agencies to continue implementing public works and infrastructure programs and projects that are funded out of the GAA, other special laws and those wholly or partly funded from foreign sources. Consequently, the existing regulatory framework effectively permits, nay encourages, the existence of a two-track service delivery mechanism, where both LGUs and the DPWH can initiate devolved activities. Thus, the

19
national government through the DPWH continues to identify, prepare, fund and implement infrastructure projects at the LGU level provided the funding comes from non-LGU sources while the LGUs can construct and maintain the local road system, (i.e, except national roads) provided the funds come from local sources. As a result, in the public works arena, the DPWH retains the primary responsibility for the delivery of services and facilities and continues to be the primary mover with LGUs playing only a minor and supporting role.
Lack of Funds
The Code prescribes a higher LGU share in national government internal revenue taxes
(or IRA). At the same time, the Code also allows LGUs greater autonomy in mobilizing resources from local sources by expanding their tax base and liberalizing the credit environment for LGUs.
The higher LGU share in internal revenue taxes that was mandated in the 1991 Code has
provided LGUs with a substantially larger revenue base. Despite this, however, there is a widespread perception that a vertical imbalance exists in the sense that the LGUs’ prevailing share in national taxes is deficient to cover both the cost of devolved functions and the cost of so-called unfunded mandates. These unfunded mandates include the salary increases under the Salary Standardization Law (SSL), the higher personnel benefits stipulated under the Magna Carta for Health Workers, and the cost of sectoral representation in local Sanggunians. Analysis shows that while these concerns were unfunded in the aggregate in the early years of Code implementation (i.e., 1993, 1994 and 1995), this was not the case in 1996, 1997, and 1998 when salary adjustments under the SSL were so hefty such that increases in the IRA was not enough to cover the cost of devolved functions and unfunded mandates.6 However, a matching of the IRA level with LGU expenditure responsibilities in 1999 and 2000 show that the natural increase in the IRA arising from the implementation of the Code is sufficient to cover the inflation and population growth adjustments in the cost of devolved functions, additional mandatory positions and unfunded mandates (Manasan 2001).
Also, LGUs generally have only have limited access to GAA funds that are allocated for
infrastructure activities because of provisions Section 17 ( c ) and Section 17 (d) of the Code. In addition, this problem is exacerbated by the national government’s practice of issuing circulars that restricts the use of the Local Development Fund. Moreover, LGUs have generally not been aggressive in maximizing their taxing authorities under the Code. At the same time, insufficient legal provisions with respect to LGU depository banks and the intercept of the IRA for loan amortization have limited LGUs’ access to credit and the capital market, a fact that constrains their ability to fund lumpy investments in public works.
Thus, Table 7 shows LGU spending on public works have remained low, albeit
increasing from an average of 0.4 percent of GNP (or 24.4 percent of their total budget) in 1985-1991 to 0.44 percent of GNP (or of their total budget) in 1993-1998. However, it is also noteworthy that the budget share of public works in the LGU budget has declined in the post-Code period, from an average of 24.4 percent in 1985-1991 to an average of 12.8 percent in 1993-1998.
6 For instance, the difference between the increase in the IRA and the cost of devolved functions of both barangay and non-barangay LGUs (i.e., combined provinces, cities and municipalities) was positive in 1993, 1994 and 1995.
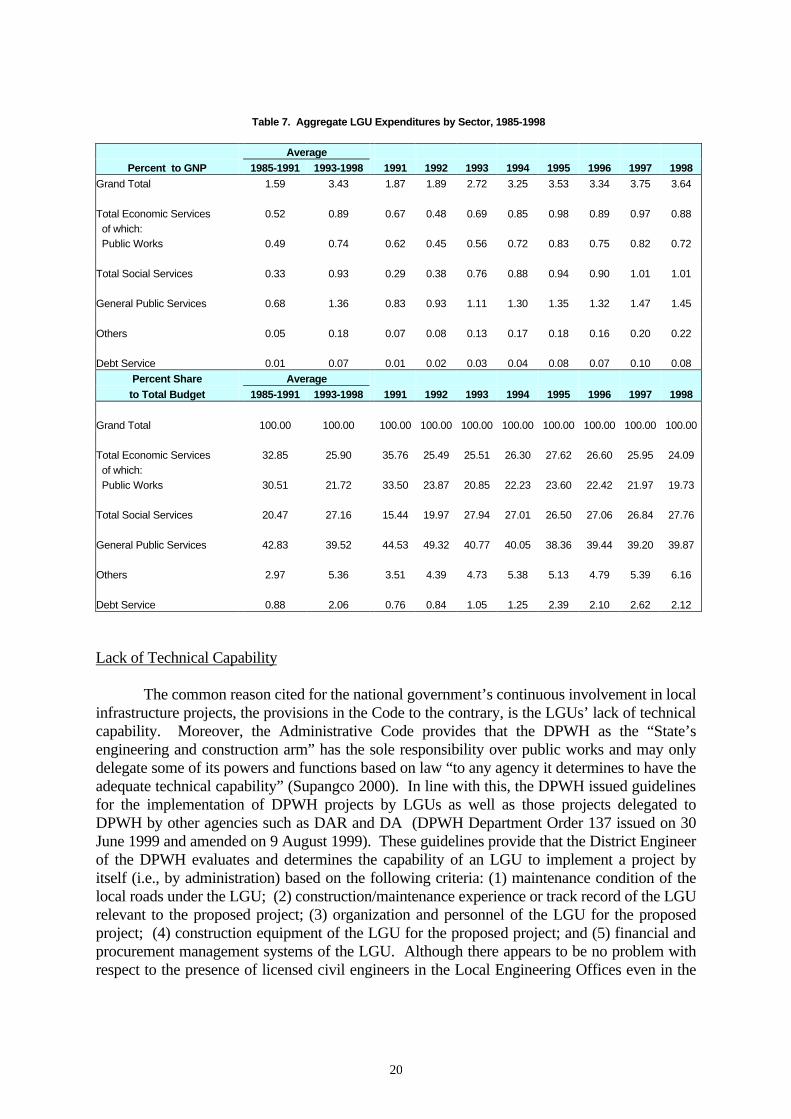
20
Table 7. Aggregate LGU Expenditures by Sector, 1985-1998
Average
Percent to GNP 1985-1991 1993-1998 1991 1992 1993 1994 1995 1996 1997 1998
Grand Total 1.59 3.43 1.87 1.89 2.72 3.25 3.53 3.34 3.75 3.64
Total Economic Services 0.52 0.89 0.67 0.48 0.69 0.85 0.98 0.89 0.97 0.88
of which: Public Works 0.49 0.74 0.62 0.45 0.56 0.72 0.83 0.75 0.82 0.72
Total Social Services 0.33 0.93 0.29 0.38 0.76 0.88 0.94 0.90 1.01 1.01
General Public Services 0.68 1.36 0.83 0.93 1.11 1.30 1.35 1.32 1.47 1.45
Others 0.05 0.18 0.07 0.08 0.13 0.17 0.18 0.16 0.20 0.22
Debt Service 0.01 0.07 0.01 0.02 0.03 0.04 0.08 0.07 0.10 0.08
Percent Share Average to Total Budget 1985-1991 1993-1998 1991 1992 1993 1994 1995 1996 1997 1998
Grand Total 100.00 100.00 100.00 100.00 100.00 100.00 100.00 100.00 100.00 100.00
Total Economic Services 32.85 25.90 35.76 25.49 25.51 26.30 27.62 26.60 25.95 24.09
of which:
Public Works 30.51 21.72 33.50 23.87 20.85 22.23 23.60 22.42 21.97 19.73
Total Social Services 20.47 27.16 15.44 19.97 27.94 27.01 26.50 27.06 26.84 27.76
General Public Services 42.83 39.52 44.53 49.32 40.77 40.05 38.36 39.44 39.20 39.87
Others 2.97 5.36 3.51 4.39 4.73 5.38 5.13 4.79 5.39 6.16
Debt Service 0.88 2.06 0.76 0.84 1.05 1.25 2.39 2.10 2.62 2.12
Lack of Technical Capability The common reason cited for the national government’s continuous involvement in local infrastructure projects, the provisions in the Code to the contrary, is the LGUs’ lack of technical capability. Moreover, the Administrative Code provides that the DPWH as the “State’s engineering and construction arm” has the sole responsibility over public works and may only delegate some of its powers and functions based on law “to any agency it determines to have the adequate technical capability” (Supangco 2000). In line with this, the DPWH issued guidelines for the implementation of DPWH projects by LGUs as well as those projects delegated to DPWH by other agencies such as DAR and DA (DPWH Department Order 137 issued on 30 June 1999 and amended on 9 August 1999). These guidelines provide that the District Engineer of the DPWH evaluates and determines the capability of an LGU to implement a project by itself (i.e., by administration) based on the following criteria: (1) maintenance condition of the local roads under the LGU; (2) construction/maintenance experience or track record of the LGU relevant to the proposed project; (3) organization and personnel of the LGU for the proposed project; (4) construction equipment of the LGU for the proposed project; and (5) financial and procurement management systems of the LGU. Although there appears to be no problem with respect to the presence of licensed civil engineers in the Local Engineering Offices even in the

21
case of low income class LGUs7, many LGUs do not have the basic equipment and facilities to undertake the projects by administration precisely because of limited funds. Moreover, poor maintenance of local roads is largely a function of the shortfall in local financing than inadequate technical capacity. Weak or Non-Coordination between DPWH and LGUs
Under existing laws both the LGUs and the DPWH can undertake public works activities on the basis of their service scope and funding sources. The Code recognizes the need for coordination between the national government agencies and the LGUs so as to prevent conflict and to ensure consistency between their respective plans and programs. However, coordination and consultation have been a thorny issue particularly between DPWH and the LGUs (Supangco 2000). The latter have often complained that the former implement projects without prior local consultation. The DPWH, on the other hand, claims that the LGUs are informed and consulted of their projects through direct communication with the local chief executives and/or through their participation in the Regional Development Council. One of the concerns that have been raised regarding the problems of coordination is the absence in the Code and in the IRR of a provision that defines the concrete procedures that will have to take place to effect effective coordination. Thus, there is a need to install an institutional coordination mechanism whereby information on the programs and projects that each level of government plan to undertake is transmitted between the different actors. While the RDC becomes the existing venue wherein DPWH and LGUs can coordinate and be informed of their projects, experience showed the weakness of this mechanism. In many cases, the LGUs do not have their own investment programs to present in the RDC because of problems within their respective Local Development Councils. Also, some local chief executives do not regularly attend RDC meetings and some of those that do so do not pass on the relevant information to their staff.
7 In a small survey of LGUs that are to be involved in the Secondary Education Improvement and Development Project, some 97 percent of municipalities reported the presence of at least one civil engineer in their Municipal Engineering Office.

22
4. DPWH BUDGET IN PERSPECTIVE 4.1. Annual Budget
Total and By Expense Class. The annual appropriation of DPWH from 1990-2000 is shown in Table 8. From 1990 to 1995 the agency appropriation in nominal terms ranged from P9 billion to P23 billion. From thereon, it had ranged from P38 billion in 1999 to P62 billion in 1998. The increase starting in 1996 was due to the incorporation of the funds earmarked for the implementation of Republic Act 8150 in the agency’s annual appropriation. RA 8150 identified and provided funding for priority infrastructure projects for implementation within a four-year period. 8 It also provides that project implementation shall be managed and supervised by DPWH in consultation with the congressional representatives. In real terms (i.e., in 1990 prices), the DPWH appropriation from 1990-2000 ranged from about P8 billion to about P31 billion. The lowest appropriation was posted in 1991 while the highest was registered in 1998. The agency’s 1999 budget suffered a big reduction, settling at almost half of the previous year’s peak. However, the 2000 legislated budget of P52 billion is P10 billion higher than the budget proposed by the executive largely because of congressional insertions under the so-called “Various Infrastructure and Urgent Infrastructure” budget items. With the end of the implementation of RA 8150, the President’s 2000 budget no longer contained any allocation for “various infrastructures.” Instead, P5 billion was proposed for a budget item called the “rural urban development infrastructure fund” or RUDIF. However, Congress disapproved the P5 billion RUDIF and in its place appropriated about P15 billion for “various infrastructure,” an amount close to a third of the total DPWH budget. The biggest chunk of the DPWH budget is for capital outlays. Capital outlays ranged from 61 percent (1995) to about 87 percent (1998) of the total DPWH budget during the period 1990-2000. Relative to Personal Services (PS) and Maintenance and Other Operating Expenses (MOOE), the allocation for Capital Outlay (CO) exhibited the greatest volatility in terms of levels. Historically, PS and MOOE have remained relatively stable with minimal incremental increases from year to year. However, it is the level of capital outlays that moves up and down to accommodate movements in the government’s overall fiscal stance and the implementation of fiscal adjustment measures.
Budget/Expenditure Items. The appropriations for DPWH are classified into two major categories: Programs and Projects. Programs refer to three broadly defined budget items: General Administration and Support (GAS), Support to Operations and Operations. The appropriation for Operations comprises about 90 percent of the entire Programs budget, which consists mainly of allocations for road maintenance and various infrastructures. Projects, on the other hand, are divided into local and foreign projects. Allocations for foreign-funded projects include both the peso counterpart and the loan/grant proceeds during the budget year.
8 R.A. 8150 is entitled “An Act Providing for a Four-Year Public Works and Highways Infrastructure Program”. It mandates DPWH to undertake the pre-identified list of projects covering new construction, reconstruction, improvement and/or rehabilitation, feasibility studies, engineering, acquisition of sites, equipment, materials, supplies, labor, supervisory and management services. The law lists the specific projects along five major categories: National Arterial Roads, National Secondary Roads, Flood Control, Local Roads, and other public works that include schoolbuildings and multipurpose pavements, among others. The law was approved on 8 September 1995 and implemented starting in 1996.

23
It should be emphasized, however, that the DPWH manages other funds in addition to the appropriations that are made directly in the name of the agency itself. These funds include those coming from the Countrywide Development Fund, DECS-School Building Program, Calamity Fund, International Commitment Funds, and Rural Urban Development Infrastructure Fund (RUDIF), among others.
Projects. More than two thirds of the total appropriations for DPWH is allocated for local and foreign projects (Table 9/Table 10). From 1995 to 1998, more than two-thirds of the total project funds went to local projects. In 1999, however, foreign projects and local projects received almost equal shares in total project funding. In terms of nominal amount, however, funds for foreign projects decreased by about P400 million in 1999 relative to 1998. The doubling in the share of foreign projects in the 1999 budget (relative to that in 1997/1998) came

24
about as the appropriation for local projects declined in that year. In the 2000 budget, the appropriation for foreign projects decreased by about P800 million relative to the previous year. With the increase in the appropriation for local projects, this widened once again the gap in the shares of local and foreign projects.
Local Highways (roads and bridges) constitute the largest expenditure item followed by flood control and drainage under the local projects category in all the years under study with the exception of 1996, 1997 and 2000. In 1996 and 1997, “various infrastructures” included under RA 8150 outranked highways as the biggest budget item under local projects. However, in the 1998 and the 1999 budgets, highways again took the lion’s share of the total appropriations for local projects. As indicated earlier, the appropriation for “various infrastructure” projects under RA 8150 was reduced to P606 million in 1999 compared to about an average of P12 billion in the previous years from 1996-1998. However, in the 2000 budget, “various infrastructure”

25
again outranked highways with the Congressional appropriation of P15 billion for “various infrastructure” which constitute about 52 percent of the local projects. This P15 billion appropriation for “various infrastructure” even surpassed that of all local projects combined in 1999.
Table 10. Department of Public Works and Highways Annual Agency Budget/Appropriation
Office of the Secretary (in percent)
1995 1996 1997 1998 1999 2000
Total Appropriation 100.0 100.0 100.0 100.0 100.0 100.0
Total DPWH Budget 4.1 8.9 12.4 11.3 6.4 7.9
including Schoolbuilding 5.5 10.0 13.9 11.9 6.9 8.2
of which: General Adm/Operations 39.7 17.0 14.2 13.7 21.3 18.0
Projects 60.3 83.0 85.8 86.3 78.7 82.0
Local of which: 83.3 68.6 76.8 71.7 50.3 67.5
Highways (Roads/Bridges) 66.4 30.7 40.4 46.9 77.6 31.9
Flood Control and Drainage 0.2 0.1 0.1 0.1 0.1 0.1
Various Infra Including Local Projects 12.6 55.4 52.8 39.3 4.1 51.7 under RA 8150
Other Infrastructures 0.0 0.0 0.0 0.7 0.0 5.6
Urgent Arterial/Sec, Local Roads and 0.0 7.7 0.0 4.4 0.0 0.0
Bridges and other Infra Ports 0.0 0.0 0.0 0.2 0.1 0.0
Water Supply 0.0 0.0 0.0 0.4 0.0 0.1
National Buildings 0.6 0.5 1.1 1.1 1.9 0.8
Prelim./Detailed Engineering 1.5 0.7 0.5 0.6 1.6 0.9 Others 0.2 0.1 0.0 0.2 0.3 0.1
Foreign* of which: 16.7 31.4 23.2 28.3 49.7 32.5
Highways (Roads/Bridges) 70.3 79.7 78.5 78.0 85.5 87.6
Flood Control and Drainage 3.3 16.0 18.6 19.1 14.4 12.4
Various Infra Projects/Local 26.5 0.0 0.0 0.0 0.0 0.0
Ports 0.0 0.1 0.6 0.2 0.0 0.0 Water Supply 0.0 1.1 0.3 0.2 0.1 0.0
National Buildings 0.0 0.0 0.0 0.0 0.0 0.0
Prelim./Detailed Engineering 0.0 0.0 0.0 0.0 0.0 0.0
Others/Urban Infra 0.0 3.1 2.0 2.5 0.0 0.0
Schoolbuilding Program 24.8 10.6 11.0 4.8 6.2 3.7
Source: GAA, 1995-2000
* Includes loans/grants and GOP counterpart fund
Foreign Agency appropriations for foreign projects depend upon the availability of foreign-assisted projects implemented during the budget year. Highways (roads and bridges) receive the biggest followed by flood control and drainage. Appropriations for foreign-assisted ports after 1998 and water supply projects after 1999 were nil.
Comparison With Other Government Agencies. Historically, DPWH received the one of the largest budget shares among the executive departments, second only to the DECS whose

26
position is secured by Constitutional mandate9 (Table 11). However, the difference between the budgets of DECS and DPWH is quite large. In 1995, DECS’ budget was more than 1.5 times as large as the DPWH budget. This implies a gap of P23 billion in the budgets of the two agencies. The budget gap was down to about P7 billion in 1996 and about P3 billion in 1997. However, the large disparity between the two agencies was again evident in 1999 when the budget of the DECS was P44 billion more than that of the DPWH. In the 2000 budget, the disparity has been narrowed slightly to P32 billion. The budgets of DECS and DPWH represent 15 percent and about 8 percent, respectively, of the total national government appropriation net of debt service.
Table 11. Agency Appropriation by Major Implementing Agencies, 1995-2000
Office of the Secretary
Appropriation Net of Debt Service 1995 1996 1997 1998 1999 2000
(In Thousands)
Total 387,397,933 453,351,182 433,817,543 546,743,816 585,097,506 665,094,141
DPWH 15,933,171 40,369,384 53,824,037 61,816,287 37,724,417 52,366,016
DECS 39,160,751 47,894,016 56,056,630 77,853,016 81,203,772 84,625,790
DOH 8,534,076 9,237,553 11,020,083 12,943,217 11,265,838 11,097,625
DA 1,583,647 1,970,685 2,251,814 2,296,656 11,890,716 3,273,758
DENR 3,231,900 4,326,644 5,159,543 4,707,834 4,956,778 5,873,466
DOTC 3,088,334 5,488,521 7,116,342 11,629,366 9,774,168 13,350,404
Schoolbuilding 5,268,534 4,783,000 6,656,150 3,131,142 2,500,000 2,500,000
(In Percent)
Total 100.0 100.0 100.0 100.0 100.0 100.0
DPWH 4.1 8.9 12.4 11.3 6.4 7.9
DECS 10.1 10.6 12.9 14.2 13.9 12.7
DOH 2.2 2.0 2.5 2.4 1.9 1.7
DA 0.4 0.4 0.5 0.4 2.0 0.5
DENR 0.8 1.0 1.2 0.9 0.8 0.9
DOTC 0.8 1.2 1.6 2.1 1.7 2.0
Schoolbuilding 1.4 1.1 1.5 0.6 0.4 0.4
Source GAA, 1995-2000
ODA Projects. Annex 1 lists the foreign-assisted projects that were completed and currently being implemented by DPWH during the period 1997-1999. These projects totaling 54 include those which were started way back in the early nineties and those which commenced in recent years.
These 54 projects cost P56 billion in government counterpart and 2 billion and 210 billion in US dollar and yen denominated loans, respectively. Most of these projects are funded by the Overseas Economic Cooperation Fund (OECF)/Japan Bank for International Cooperation (JBIC) (34) and the Asian Development Bank (ADB) (10). The rest have funding assistance
9 Art. II, Sec. 17 of the 1987 Constitution provides that “The State shall give priority to education…” which was interpreted by the Supreme Court to mean that DECS should have the highest budgetary support among departmental budgets although debt service allocation may be higher (Briones, 1996).
27
from the World Bank (WB)/International Bank for Reconstruction and Development (IBRD), Japan International Cooperation Agency (JICA) and bilateral agencies from Australia, France, Switzerland, France and the United Kingdom (UK). A substantial number of the foreign assisted projects are for roads and bridges construction. Also, most of the foreign assisted projects are funded by loans rather than grants. Only two projects, funded by JICA, are purely grants. The project from the UK has both a loan and grant fund portion. Ten projects are expected to be implemented starting year 2000 (Annex 2). Another 3 projects (2 JBIC and 1 WB) are still under negotiation. Seven committed projects have a total cost of P7.7 billion in GOP counterpart and 26 million US dollars and 41 billion yen in loan proceeds. All these projects are expected to be completed no later than year 2004. 5. ASSESSMENT OF BUDGET PERFORMANCE 5.1 Concepts and Measures of Absorptive Capacity
The term “absorptive capacity” has been used in economic literature mostly as they relate to foreign aid. The term was defined by the United Nations Economic Commission for Asia and the Far East as “a limit to the amount of efficient investment physically possible…particularly in the short run.” (Meier, 1964). Adler (1965), arguing against earlier thinking that absorptive capacity is a well-defined concept with an established meaning that needed no further explanation or analyses, inquired into the meaning and usefulness of the concept to policy. He concluded that absorptive capacity becomes a meaningful concept if it is related to the rate of return on capital, which an economy finds acceptable, and that it must pertain to total and not just foreign capital. He explained that the difficulty in assessing the expected rate of return on capital explains the wide differences in the appraisal of absorptive capacity especially in underdeveloped economies. Reyes (1985/1993) highlighted the fact that the meaning of absorptive capacity is subject to different interpretations depending on the context in which it is used and for that reason the term is often put in quotation marks. He, however, proposed to view the concept of absorptive capacity in two perspectives. Implicit in the first view is the earlier notion of return on capital by defining the term as “the capacity to use assistance as a source of financing economically viable investment projects and technical assistance”. The second view downplays the relationship to the rate of return on capital and instead focuses on the fund utilization. He proposes that the term can simply refer to, when applied in the context of foreign aid, “the capacity of a recipient country to program and use foreign assistance in a manner acceptable to donors, be it for capital or technical-assistance projects, financing of current imports and the budget deficit, debt relief,...”
In this study, the term absorptive capacity, as it relates to budget performance, more or
less parallels Reyes’ second view, by referring to it as the ability of an agency to maximize the use of available financial resources. Consistent also with earlier arguments that the concept of absorptive capacity should not be limited to foreign sources but to the use of capital regardless of the source, this study attempts to apply the term to both foreign and domestic funding.
Funds for the implementation of programs and projects of government agencies
normally come from two major sources -- domestically generated funds (either through taxes/ fees and domestic debt finance) and loans/grants from international donor institutions. There are

28
varied and distinct number of institutions involved in the administration and monitoring of these funds. Thus, in assessing the agency’s absorptive capacity, one has to make not only the aggregate analysis of these funds but also a separate analysis of funds generated from local sources and those from donor institutions.
Basic Terms. Three basic budgeting terms will be used in the development of measures
of agency absorptive capacity and these are defined as follows10: Appropriation
This refers to the spending authorization made by law directing the payment of goods
and services out of government funds under specified conditions or for specified purposes. The Executive submits a budget proposal (the President’s budget) to Congress for consideration and approval. After review and debate, Congress enacts the General Appropriations Act (GAA). Allotment
This refers to the authorization to incur obligations or enter contracts which is issued by the Department of Budget and Management (DBM) to government agencies. The DBM ensures that these expenditures are covered by appropriations both as to amount and purpose. Obligations
This refers to the actual expenditures of government agencies in terms of liabilities legally incurred or committed to be paid for by the government, either immediately or in the future.
Measures of Absorptive Capacity. Absorptive capacity may be measured by the extent to which the agency utilized the appropriations made in its favor in the GAA. In this sense, the agency’s legislated budget, i.e., appropriations, is regarded as its expenditure target for a particular budget year. Alternatively, absorptive capacity may be defined in terms of the agency’s ability to use the allotments released by the DBM. Here, the total allotment advice from DBM may be viewed as further delimiting what can actually be spent of the statutory spending authorization.
Given this perspective, the following indices are defined: Appropriation Utilization Index (ApUI) = Obligations/Appropriation
This index indicates the government agency’s ability to utilize funds relative to the legislated or statutory spending target. In principle, the index takes on values that range from 0 to 1. At one end of the scale, an index = 1.0 would imply full achievement of the target. At the other end, extremely poor performance would yield an index = 0. In practice, however, the index for a specific program (or agency) may exceed unity. This happens when specific items in the GAA are realigned in favor of said program (or agency).
10 Definitions based on Budget Expenditures and Sources of Financing (BESF) Glossary of Terms
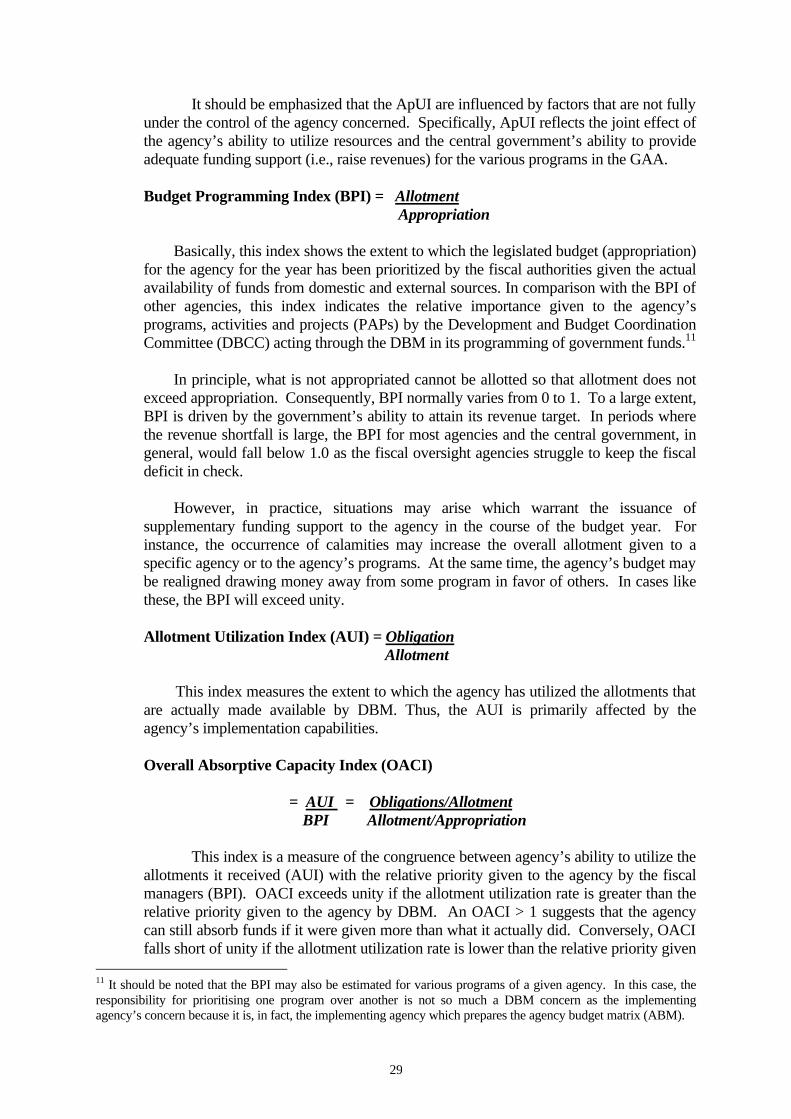
29
It should be emphasized that the ApUI are influenced by factors that are not fully under the control of the agency concerned. Specifically, ApUI reflects the joint effect of the agency’s ability to utilize resources and the central government’s ability to provide adequate funding support (i.e., raise revenues) for the various programs in the GAA. Budget Programming Index (BPI) = Allotment
Appropriation
Basically, this index shows the extent to which the legislated budget (appropriation) for the agency for the year has been prioritized by the fiscal authorities given the actual availability of funds from domestic and external sources. In comparison with the BPI of other agencies, this index indicates the relative importance given to the agency’s programs, activities and projects (PAPs) by the Development and Budget Coordination Committee (DBCC) acting through the DBM in its programming of government funds.11 In principle, what is not appropriated cannot be allotted so that allotment does not exceed appropriation. Consequently, BPI normally varies from 0 to 1. To a large extent, BPI is driven by the government’s ability to attain its revenue target. In periods where the revenue shortfall is large, the BPI for most agencies and the central government, in general, would fall below 1.0 as the fiscal oversight agencies struggle to keep the fiscal deficit in check. However, in practice, situations may arise which warrant the issuance of supplementary funding support to the agency in the course of the budget year. For instance, the occurrence of calamities may increase the overall allotment given to a specific agency or to the agency’s programs. At the same time, the agency’s budget may be realigned drawing money away from some program in favor of others. In cases like these, the BPI will exceed unity. Allotment Utilization Index (AUI) = Obligation
Allotment
This index measures the extent to which the agency has utilized the allotments that are actually made available by DBM. Thus, the AUI is primarily affected by the agency’s implementation capabilities. Overall Absorptive Capacity Index (OACI) = AUI = Obligations/Allotment BPI Allotment/Appropriation
This index is a measure of the congruence between agency’s ability to utilize the
allotments it received (AUI) with the relative priority given to the agency by the fiscal managers (BPI). OACI exceeds unity if the allotment utilization rate is greater than the relative priority given to the agency by DBM. An OACI > 1 suggests that the agency can still absorb funds if it were given more than what it actually did. Conversely, OACI falls short of unity if the allotment utilization rate is lower than the relative priority given
11 It should be noted that the BPI may also be estimated for various programs of a given agency. In this case, the responsibility for prioritising one program over another is not so much a DBM concern as the implementing agency’s concern because it is, in fact, the implementing agency which prepares the agency budget matrix (ABM).

30
to the agency by DBM. An OACI < 1 indicates that the DBM programmed more funds for the agency than what it can absorb. On the other hand, an OACI =1 represents the happy middle that is achieved when budget programming matches the agency’s capacity for fund absorption.
The above-cited indices can be computed for the entirety of an agency’s budget as well as for each major program/activity/project of said agency for any given year. This study attempts to assess the trend in the ratios for the period 1996-1999. These years can be divided into two different fiscal circumstances, a pre-crisis and a post-crisis period. It is worthwhile to consider the experience of the agency in maximizing the use of available financial resources under these distinct budgetary settings. When applied to ODA, the abovementioned indices reflect the rate of donor fund utilization for a given year. In contrast, the conventional indices used for ODA (for instance, those used in the ODA Portfolio Review of the NEDA as discussed below) refer to the cumulative progress in utilizing specific loans over its lifetime.
Absorptive Capacity Indices for ODA Funding. Foreign-assisted projects, being part of
the country’s ODA, are not solely monitored by the implementing agency but are also under close review by the National Economic and Development Authority (NEDA) through its Project Monitoring Staff (PMS). The NEDA-PMS starting in 1992, makes an annual assessment of the ODA portfolio and in each report, highlights the performance of the government agencies in the utilization of ODA funds, particularly its loan component, and identifies major problems encountered in their programming and use. For the purpose of this study, parallel to the measures introduced by Reyes (1985; 1993) and the indicators monitored by the NEDA-PMS, the following absorptive capacity indices for ODA will be utilized to discuss ODA projects and, where appropriate, to compare with those derived from the indices previously discussed.
Utilization Index ( UI ) = Loan/Grant Availed
Loan/Grant Committed
This index shows the ability of the agency to absorb loan/grant funds programmed for the specific program/project.
Availment Index ( AI ) = Loan/Grant Availed Loan/Grant Scheduled
This index shows the ability of the agency to absorb funds (loan/grant portion) according to schedule.
Timeliness Index ( TI ) = Actual Project Duration Planned Project Duration
This index shows whether the implementation of the project has exceeded its original duration. This index directly measures the delays in project implementation. It validates the utilization and availment indices and has implications on project cost revisions.
31
Aside from these indices, other indicators that can be analyzed include the disbursement backlogs (DB) and cost overrun ratio (COR). The former refers to the unused loan/grant funds from the scheduled funds for the particular year. COR refers to the proportion of the revised to the original loan amount. In addition, one can also examine the GOP counterpart funds programmed yearly in terms of agency proposals vis-a-vis the amount approved by Congress and releases made by the DBM. While it may be worthwhile to look separately on the absorptive capacity indices for local counterpart and loan proceeds, data constraints would hamper this effort. Available allotment and obligation data do not discriminate between these funds unlike appropriation data. Thus, one can only make an analysis on the combined funds12 and on the loan/grant portion only13.
5.2. Assessment of DPWH Absorptive Capacity Table 12A/B summarizes the results of the budget performance of DPWH in terms of the indices described above.
Overall Assessment. Fund utilization relative to appropriation in the DPWH had been low in the four-year period under study. The improvement observed in 1999 was largely due to the reduction in the appropriation for the year relative to the previous year (from P61B in 1998 to P34B in 1999) rather than increased spending per se. While appropriation level exhibited enormous variability during the period, obligation level was fairly stable at a range of about P26 billion to P28 billion.
While total agency appropriation rose from P40.4 billion in 1996 to P61.8 billion in 1998, allotment by DBM to the agency posted a remarkable decline. Allotment went down from P41.8 billion in 1996 to P32.3 billion in 1998. Thus, the BPI for DPWH declined from 1.0368 in 1996 to only .5231 in 1998. In 1999, while allotment exceeded the appropriation (BPI = 1.1125), the untimely release of these funds did not help improve fund utilization by the agency.14
Relative to the allotment released to the agency, DPWH showed improvements in fund utilization with AUI rising from 62 percent to 81 percent during the period 1996 to 1998. However, the relatively high AUI in 1998 does not imply an increased level of actual spending as obligation decreased by P3 billion from the previous year (from about P29 billion to P26 billion). Instead, it is primarily explained by the large decrease in the allotment from P42 billion to P32 billion. In 1999, although the allotment increased to P36 billion (even larger than the appropriation), obligation remained almost the same as the previous year thus showing a lower AUI (72 percent) compared that in the previous year (81 percent).
12 This is discussed in Section 6.2 13 This is discussed in Section 6.3 14 See discussions in Section 7.3
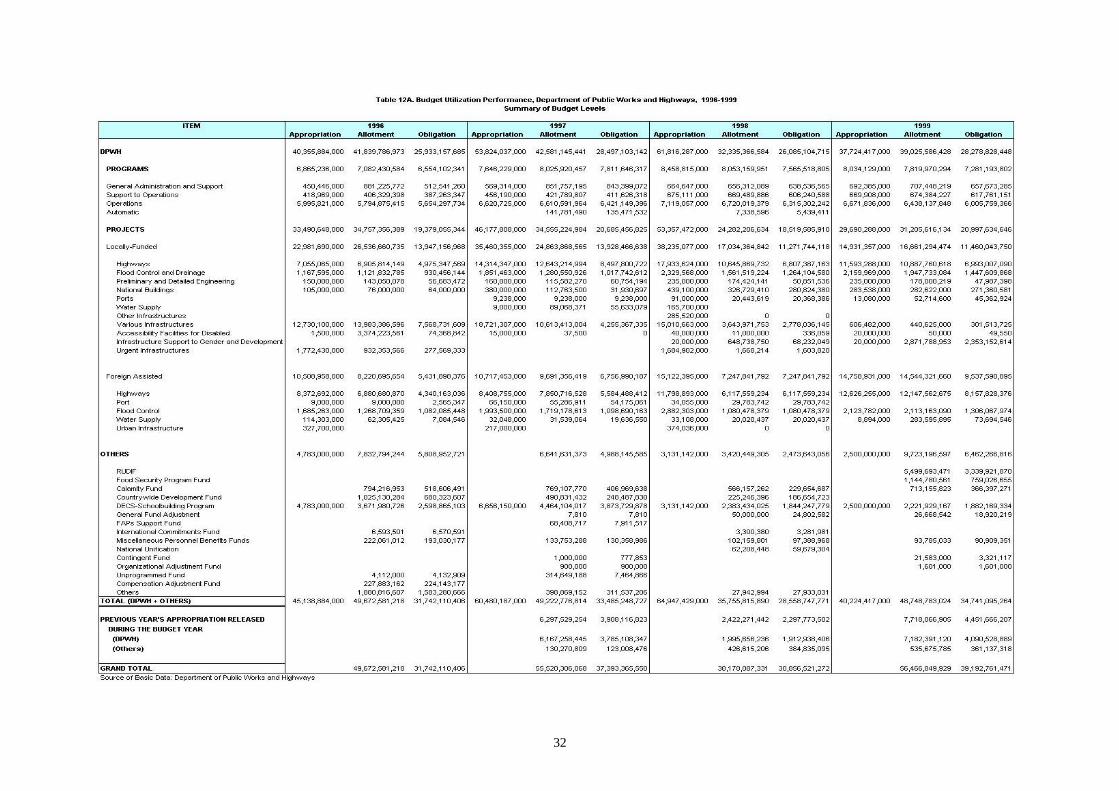
32

33

34

35
The variable trend in OACI from 1996–1999 shows the mismatch between budget programming of DBM and DPWH’s capacity for fund absorption over the years. As indicated by the OACI, DPWH had a relatively low absorptive capacity in 1996 and 1999. In 1998, as a result of the drop in the BPI in that year, OACI was greater than unity (1.54), suggesting that the agency can absorb or spend more if allotment had been raised. In 1999, the low OACI may be due in large part to the delay in the release of allotment advice by the DBM rather than to weaknesses in the agency’s implementation capability.
Programs. In the years under study, all indices relative to utilization of program funds (or administrative and operations budget) showed encouraging results, with rates close to 1.
Relatively high ApUIs were registered in the case of General Administration Support. In 1996 and 1997, ApUI was greater than 1, implying there was a realignment of funds in favor of this budget item during the year. The relatively lower ApUI for Support to Operations has been due to low spending for the operation and management of the Traffic Engineering Center (TEC) in 1997 and 1999 and that of the Infrastructure Computer Center (ICC) in all years. In 1997 and 1999, BPIs for TEC were zero as no allotment was released out of the P7.2 million and P8.2 million budget for the TEC, respectively. On the other hand, ICC yielded low AUI especially in the years 1998 and 1999. In 1998, only about P14 million was utilized by the agency out of the P70.2 million released by the DBM based on the P90 million budget for that year. The same level of spending was incurred in 1999 out of the P49 million released by the DBM out of the P48 million appropriation for this budget item.
Projects. Table 13 shows a summary of budget performance by project type and funding source. The following discussion highlights the major trends that may be gleaned from the table. Highways.
Relative to allotment, fund utilization was low but increasing from 1996 to 1998 (AUI of .6757, .6871 and .7710 )> However, the AUI declined to .6423 in 1999. Except in 1998, the low utilization of highways funds largely reflects agency weakness since the allotment level has been relatively high (as the BPI ranged from 90-105 percent). In 1998, the high OACI (OACI >1) was not due to increased utilization of funds but to the low allotment released relative to the appropriation for the year (BPI=.5638). This implies that the agency can absorb more if it has been given the opportunity to spend more. In 1999, the low OACI (.6839) indicates agency weakness since AUI was low (.6839) relative to BPI (BPI=.9391). As mentioned above, the evidence of untimely release of funds in 1999 may have resulted to the agency’s low AUI.
The low and slow progress in fund utilization for highways was brought about by the perennial bottlenecks surrounding these projects. Foremost among these factors are the acquisition of right of way, poor performance of contractors and the feeble monitoring and supervision of projects. These problems have long plagued the agency but have not been significantly resolved to date. Further pulling down the agency’s performance in the sector are problems relating to low and untimely release of allotments by the DBM in recent years as well as coordination problems with other sectors or institutions involved mainly the local government units and other national government agencies.

36

37
Flood Control and Drainage.
Relative to other projects, the indices for flood control and drainage showed the best picture in all years. Relative to allotment, fund utilization was greater than 70 percent. Moreover, AUI mirrors the corresponding BPI particularly in 1996 and 1997, indicating a good match between programming and the agency’s fund absorption capacity (AACI ~ 1). However, in 1998 and 1999, a mismatch occurred. In 1998, there had been an allotment shortfall, thus an all time high on AUI (.8874) and OACI (1.7506) were posted. In contrast, in 1999, allotment exceeded appropriation. This may have been too much for the agency to absorb and, thus, the decline in AUI (.7601) and low OACI (.4870). The high allotment release coincided with the advent of the La Nina phenomenon.
The relatively better performance of flood control and drainage projects may be attributed to the more prudent budget allocation, particularly in terms of making reasonable estimates of the anticipated financial requirements that are needed to carry out the projects. It should be noted that, like highway projects, flood control projects are not spared from the problems of right of way acquisition. More specifically, the identification and development of resettlement sites for the affected families represents the biggest impediment to smooth project implementation. This is not only in terms of the difficulty of convincing the families to resettle but also the huge financial resources needed to develop the site, i.e., at least providing sufficient water supply, sanitation facilities and electricity to encourage resettlement. For instance, in the case of the Pampanga Delta Development Project, additional funding (in excess of the NEDA-ICC approved level) has been required for the development of the resettlement site. Consequently, it had to go through the approval process once again in order to effect fund release. In the case of the Metro Manila Flood Control Project, some families were given compensation should they opt not to locate in the resettlement site in Baras, Rizal in order not to delay any further the implementation of the project. Ports.
The indices showed relatively the good performance of port projects in all years, except
in 1996. Poor AUI in 1996 (.2850) is on account of the low utilization of funds of a foreign assisted project. In 1997 and 1998, AUI was high for both local and foreign port projects (AUI = .9828 (1997) and .9985(1998). Port performance in 1997 was the best among the other projects as all indices, i.e. ApUI, BPI, AUI and OACI, showed values close to unity. This reflects the good match between DBM programming and agency utilization of funds and implies the attainment of expenditure target for port projects during this year. However, in 1998, allotments and obligations have shown a mismatch as the BPI was lower than the AUI (OACI= 2.4860). In 1999, the level of obligations was the highest during the four-year period. However, the AUI was lower (AUI= .8605) compared to previous years. This time, there had been a very high allotment release to local port projects far exceeding the appropriation (BPI=4.0302) and seemed to have been more than the agency’s capability to utilize (OACI=.2135).
Water Supply.
Except in 1997, water supply projects are all foreign-assisted projects. During the four-year period, both utilization and allotment rates have been erratic. Appropriation went down from P114 million in 1996 to P8 million in 1999. Allotment in 1999 was 32 times the appropriation but AUI has been low at 26 percent. Water supply showed the lowest OACI (.0081), the worst matching of programming and agency absorption. Water supply suffered

38
setbacks in terms of utilization mainly because of coordination problems with the local government units that are at the forefront of implementing the project. The delay in the submission of documentation requirements to the funding agency (i.e., document float) affected the timing of the loan release. This was particularly the problem with respect to the ADB’s Rural Water Supply and Sanitation Sector Project (RW3SP) wherein there had been much delay in the finalization and approval of the Memorandum of Agreement (MOA) between DPWH/DOH/DILG and the 20 provinces involved in the said project.15 Preliminary and Detailed Engineering.
Table 12 shows that there had been a consistently low utilization of the allotment for this budget item over the four-year period most especially in the last two years, when fund utilization registered less than 30 percent (AUI = .3962, .5256, .2915 and .2696). The low utilization occurred in spite of the relatively high allotment as shown by the BPI ( .9537, .7224, .7422 and .7574).
The agency’s inability to use the funds available reflects, on one hand, its inability to carry out activities for project planning and necessary project feasibility and engineering studies. The weakness appears to be lodged in the 15 regional offices and their respective district engineering offices. Note that the budget for preliminary and detailed engineering are equally divided and sub-allotted to these units. On the other hand, the low utilization can be a reflection of an inapt appropriation for this budget item in the first place. DPWH uses up only P45 million to P60 million annually during the period 1996-1999 but the annual appropriation for this budget item ranges from P150 million to P235 million. National Buildings.
Except in 1997, there had been a relatively high utilization of funds for national
buildings (AUI ranged from 84 to 96 percent). The low allotment released by DBM in 1997 for this budget item (BPI = .2967) may have contributed to the low fund utilization during this year (AUI = .2832). Various Infrastructures.
“Various infrastructure” outranked highways in terms of appropriation in 1996 and
1997. However, in the two succeeding years, both appropriation and allotment declined substantially. Appropriation plummeted from P18 billion in 1997 to P606 million in 1999. Allotment dropped from about P14 billion in 1996 to P441 million in 1999. Utilization was low in 1996 (AUI = .5413) even when allotment exceeded appropriation (BPI = 1.0985). In 1997, utilization was even lower (AUI = .4009). On the other hand, the relatively higher utilization rate in 1998 (AUI = .7624) and 1999 (AUI = .6843) can be explained by the already low appropriation and allotment for this budget item during these years.
The low utilization of allotment for this budget item may be partly due to the nature of these projects. These projects which included Congressional budget insertions may have competed with the agency priority activities in terms of fund prioritization and institutional support. The same appears to hold true of the programming/prioritization of allotment releases for this budget item. Also, changes made by the proponents in terms of scope and project
15 Further discussion is made in Section 7 on the RW3SP as it relates to LGU involvement in public works

39
location during the year necessitate design changes and, thus, delay or cause the non-implementation of the projects. Accessibility Facilities for the Disabled.
This is one of the two local projects that have low appropriation levels (P1.5 million to P40 million) but received huge allotments (P3.4 billion in 1996). Nevertheless, utilization of this fund has consistently been low from 1996-1998 (AUI = .0220, .0000, .0306). In 1999, AUI improved (.9910) since allotment was a measly P50,000 out of the P20 million appropriation and obligations incurred was close to the allotment released (P49,500). Infrastructure Support to Gender and Development.
This is a new item in the DPWH budget starting in 1998. It is also the other budget item that has a low appropriation but high allotment in some years. In 1998 and 1999, there was a relatively low appropriation given to this budget item but allotment far exceeded the same (BPI = 32.4 (1998) 143.6 (1999). There was low utilization of the fund in 1998 (AUI = .1052) but this improved to .8201 in 1999. Urgent Infrastructure.
Urgent infrastructures as the term suggests include infrastructure projects needing
immediate completion. This budget item was present in 1996 and in 1998. Analysis of the indices for this budget item seem to give the impression that these projects were not deemed urgent in both agency implementation and fund programming by DBM. Utilization of the funds have been low in 1996 (AUI = .2977) but was better in 1998 (AUI = .9614) largely on the account of very low allotment of only P2 million out of the P1.7 billion appropriation. Allotment relative to appropriation was low in 1996 (BPI = .5260) and much lower in 1998 (BPI = .0010).
Local vs. Foreign Projects. Overall, foreign projects outdo local projects in utilization performance. Thus, foreign projects have better utilization rates (AUI) and higher allotment relative to appropriations (BPIs) than local projects. Across project types, AUI and BPI are higher for foreign projects for highways and ports than local projects in most years. However, in the case of flood control and drainage, local projects showed higher AUI than foreign projects as foreign projects encountered more problems. This is indicated by the higher BPI for local projects relative to foreign projects except in 1997.
The better performance of foreign projects relative to local projects in fund utilization may be traceable not only to the fact that they get very well-qualified contractors but also the close monitoring on project implementation by oversight agencies and donors. Moreover, the establishment of project management offices (PMOs) facilitates project implementation and addresses the problems during project execution in a more timely manner. Monitoring of projects at the local level is lodged with the LGUs. The DPWH Regional Offices and their respective District Offices also undertakes the same. There are only few LGUs (e.g. Infrastructure Monitoring and Advisory Group (IMAG) in Mindanao, General Santos City), which have established a monitoring system to evaluate progress in the implementation of government-funded infrastructure projects at the subregional/local level.16
16 See Sec. 7.1 for further discussion.

40
ODA. Of the 54 projects presented in Annex 1, 39 projects are ongoing during the period 1997-1999 (Annex 3) and have been included in the monitored projects under the 6th, 7th and 8th ODA portfolio review of the NEDA Project Monitoring Staff. The projects consist largely of roads and bridges and are mostly funded with the assistance from OECF/JBIC. As can be observed from Annex 4, project duration had mostly been revised, except for 10 projects which mostly have just recently commenced. Annex 5 shows a summary of the computed absorptive capacity indices for these 39 projects. Availment/Disbursement Backlog.
Overall, AI for ODA funds (i.e loan availment of the agency according to the scheduled loan release) are comparably lower by 10 percent than AUI rates derived from annual agency spending for foreign projects but closely follow the trend. Availment rate had been low since 1997, even lower than the country’s AI of the total ODA portfolio. Be that as it may, DPWH performance in loan availment have shown a modest improvement over the three-year period. From 56.9 percent in 1997, the rate increased to 61.5 percent in 1998. However, the increase was not sustained as AI dropped to 60 percent in 1999. These rates translate to an increased availment from US$429.5 million in 1997 to US$563 million in 1998. While AI decreased from 1998 to 1999, the level of availment had increased to US$684.9 million in 1999 inasmuch as the scheduled loan release for 1999 had been higher than the previous year. The overall AI needs improvement especially when one notes the disbursement backlog (DB) through the years. DB in 1997 was US$324.9 million, which increased to US$351.8 million in 1998 and ballooned to US$456.4 million in 1999. On a project type basis, highways reflect the overall trend in availment. AI increased from 55.1 percent in 1997 to 56.8 percent in 1998 and then further rose to 60 percent in 1999. This translates to an escalation of at least US$100 million a year. As a result of the low AI, DB increased from US$244 million in 1997 to US$306 million in 1998 and then to US$405 million in 1999. Flood control and drainage, however, showed a differing trend. After increasing from 61.7 percent in 1997 to a high of 77.8 percent in 1998, AI dropped to a low 59.8 percent the following year. This translates to an increase in availment level from US$129.8 million in 1997 to US$160.1 million in 1998 then a plunge to US$59.8 million in 1999. Such availment performance has caused DB to increase again from US$45.6 million in 1998 to US$51 million in 1999 despite the reduction in the number of projects. Water supply did poorly in its availment rate but showed a remarkable improvement nevertheless during the succeeding years. The two projects together increased its availment from 2.6 percent in 1998 to 29.8 percent in 1999. The poor performance had resulted in a backlog of US$11.3 million or one-third of the total loan cost. The lone project for urban infrastructure performed relatively better with an 86.7 percent availment rate and a DB of only US$7 million, less than a tenth of the total loan cost. In terms of projects by creditor/donor, the overall trend in AI is reflected by OECF/JBIC inasmuch as it accounts for at least 75 percent of the total scheduled loan releases for each year. However, with respect to the AI in 1999, the decrease for OECF/JBIC projects was more significant than for the total project funds. AI in 1999 dropped from 63 percent in 1998 to 56 percent in 1999. Thus, DB in 1999 had risen more sharply from 265 million in 1998 to 379 million in 1999. In contrast, relatively better performance was shown by WB projects especially in the last two years. AI for its two projects reached an average of almost a hundred percent thus bringing DB to only US$0.8 million in 1999. Projects with ADB funding had a remarkable improvement in AI from 15.3 percent in 1998 to 79.4 percent in 1999. DB is still high at

41
US$63.7 million as the scheduled loan release amount have increased to US$81.4 million from the previous year’s US$35.9 million. Utilization/Timeliness.
While the number of projects had increased from 27 in 1997 to 39 in 1998, total loan cost had decreased from US$1.9 billion to US$1.7 billion during the same period. In 1999, the number of projects had gone down to 32 but total loan cost had remained at a similar level as the previous year. On the aggregate, utilization of loan funds had been low in 1997 (22 percent) but showed big improvements in 1998 (33 percent). In 1999, utilization had reached 40 percent. Taken as a whole, the 40 percent utilization performance of the agency can still be judged as poor considering that more than half of these projects should have been completed and/or nearing their expected completion. As shown in Annex 5 many of the projects have TIs of more than 100 percent in the 6th (8 projects) and 7th (12 projects) ODA reviews. In 1999, there were seven projects having TIs of more than 100 percent while 18 are reported to be behind schedule. The reduction of these projects from the previous year whose implementation had been extended is attributed to a combination of the following factors: the completion of the project, full loan availment and the further revision in the completion date/year of the projects. In terms of project types, highways and water supply followed the overall trend of increasing UIs over the three-year period, though they are still low and have not reached half of the total loan cost. Flood control and drainage suffered a setback in 1999, dropping its UI from 37 percent in 1998 to 20 percent in 1999. With respect to utilization by donor/creditor source, the overall trend in utilization mirrors that of OECF/JBIC projects, as they fund more than 70 percent of both the total number of projects and the total loan cost. With reference to the World Bank projects, the utilization may seem to be high in terms of the indices. However, these projects have already more than 100 percent TIs implying that these projects actually performed poorly in its utilization of loan funds. Cost Overrun.
About half of the 39 projects have incurred cost overrun which amounted to P9.6 billion or about 10 percent of the original total project cost (Annex 6). Additional loan cost which is primarily a reflection of foreign exchange adjustment, amounted to P1.3 billion while the rest or P8.3 billion is the total amount the government would shoulder as a result of a host of factors relating to delayed project implementation. This includes, among others, price escalation, foreign currency adjustment to contractors, payment of extended services of consultants, reconfiguration of specifications for equipment and changes in the design for civil works. One can observe from the table that projects which incurred cost-overrun are those projects which have TIs of more than 100 percent. 6. ISSUES
A variety of factors have contributed to the low absorptive capacity of DPWH during the
period under study. Although there is some improvement in recent years, the rate of fund utilization remains low. This indicates that much is still desired in terms of addressing the perennial issues that impede better fund absorption in the agency. These factors may be categorized into: (1) those which derive from the structural and systemic weaknesses of the
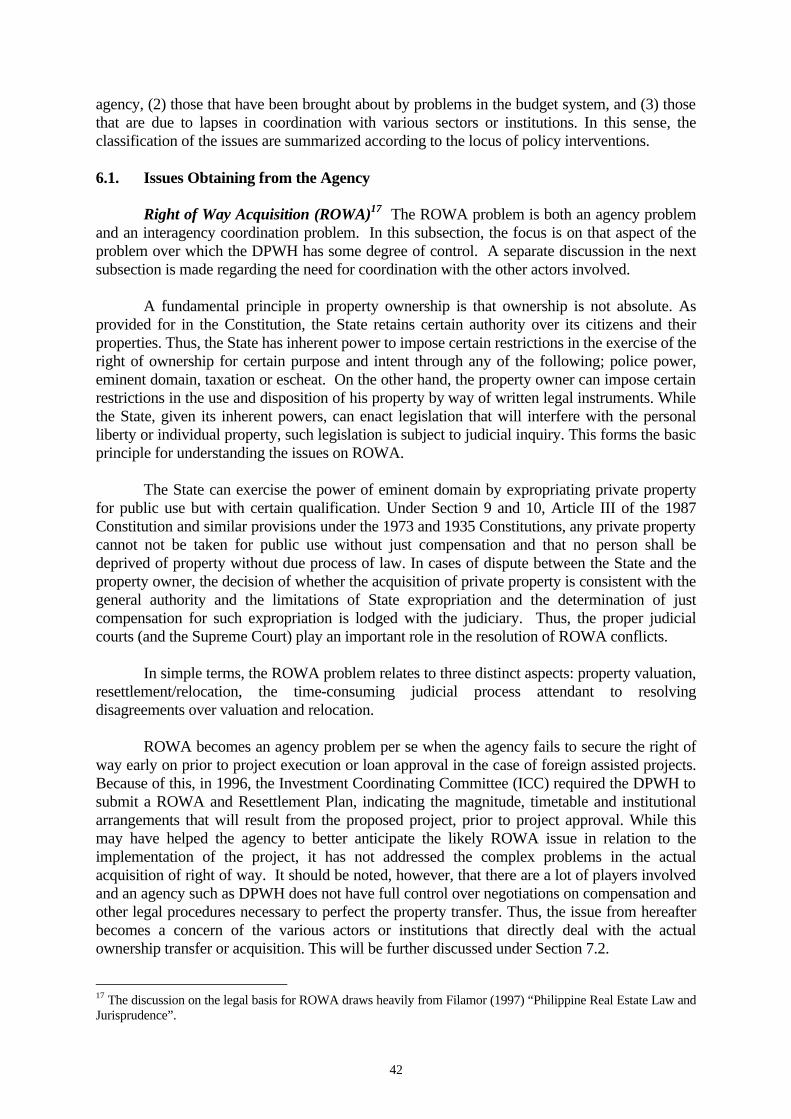
42
agency, (2) those that have been brought about by problems in the budget system, and (3) those that are due to lapses in coordination with various sectors or institutions. In this sense, the classification of the issues are summarized according to the locus of policy interventions. 6.1. Issues Obtaining from the Agency
Right of Way Acquisition (ROWA)17 The ROWA problem is both an agency problem and an interagency coordination problem. In this subsection, the focus is on that aspect of the problem over which the DPWH has some degree of control. A separate discussion in the next subsection is made regarding the need for coordination with the other actors involved.
A fundamental principle in property ownership is that ownership is not absolute. As provided for in the Constitution, the State retains certain authority over its citizens and their properties. Thus, the State has inherent power to impose certain restrictions in the exercise of the right of ownership for certain purpose and intent through any of the following; police power, eminent domain, taxation or escheat. On the other hand, the property owner can impose certain restrictions in the use and disposition of his property by way of written legal instruments. While the State, given its inherent powers, can enact legislation that will interfere with the personal liberty or individual property, such legislation is subject to judicial inquiry. This forms the basic principle for understanding the issues on ROWA. The State can exercise the power of eminent domain by expropriating private property for public use but with certain qualification. Under Section 9 and 10, Article III of the 1987 Constitution and similar provisions under the 1973 and 1935 Constitutions, any private property cannot not be taken for public use without just compensation and that no person shall be deprived of property without due process of law. In cases of dispute between the State and the property owner, the decision of whether the acquisition of private property is consistent with the general authority and the limitations of State expropriation and the determination of just compensation for such expropriation is lodged with the judiciary. Thus, the proper judicial courts (and the Supreme Court) play an important role in the resolution of ROWA conflicts. In simple terms, the ROWA problem relates to three distinct aspects: property valuation, resettlement/relocation, the time-consuming judicial process attendant to resolving disagreements over valuation and relocation.
ROWA becomes an agency problem per se when the agency fails to secure the right of way early on prior to project execution or loan approval in the case of foreign assisted projects. Because of this, in 1996, the Investment Coordinating Committee (ICC) required the DPWH to submit a ROWA and Resettlement Plan, indicating the magnitude, timetable and institutional arrangements that will result from the proposed project, prior to project approval. While this may have helped the agency to better anticipate the likely ROWA issue in relation to the implementation of the project, it has not addressed the complex problems in the actual acquisition of right of way. It should be noted, however, that there are a lot of players involved and an agency such as DPWH does not have full control over negotiations on compensation and other legal procedures necessary to perfect the property transfer. Thus, the issue from hereafter becomes a concern of the various actors or institutions that directly deal with the actual ownership transfer or acquisition. This will be further discussed under Section 7.2.
17 The discussion on the legal basis for ROWA draws heavily from Filamor (1997) “Philippine Real Estate Law and Jurisprudence”.

43
Bidding, Contracting and Procurement. Problems in bidding, contracting and procurement are a major source of delays in project implementation. At present, procurement for civil works is governed by Presidential Decree 1594, while the guidelines for the procurement of goods and supplies is defined under Executive Order 302 (July 2000). The law prescribes the process and procedures that relate to constitution and composition of the Pre-Qualification, Bids and Awards Committee (PBAC), the preparation of the bidding documents, the notification/publication of invitation to bid, the pre-qualification of the prospective contractors, the evaluation of bids, and the selection of contractors. A particularly time consuming step in the procurement process relates to the stringent pre-qualification procedure. Even at the pre-qualification phase, every bidder has to submit a detailed project proposal that has to go through a technical evaluation. Pre-qualification alone is said to take up to nine months. Despite this, it has been noted that the said process is very subjective and does not help much in promoting the transparency.
Over and above these procedures, additional review and approvals have to be secured through various levels of bureaucracy within the implementation agency and oversight agencies. The different steps in this process prior to the final approval by the DPWH Secretary include: Bureau of Design (overall plan review and quantitative evaluation - 2 months), Bureau of Construction (determination and evaluation of cost estimates – 3 weeks to 1 month), Legal Department (review of legal impediments - 1 week), Chief of Operations (recommendation of approval/disapproval – 3 days). This review/approval process is put in place to provide additional safeguards against irregularities or corruption. A review of projects implemented by DPWH for 1988-1998 showed that it takes an average of 15 months for DPWH to engage the work of project consultants (JBIC, 2000). On the whole, the time it takes to go through the process, lengthy as it is, is predictable and well known to implementing units.
The question then becomes: how can this process be shortened without compromising the integrity of the system? At DPWH, the ongoing Road Information and Management Support System (RIMMS) Project (which has been organized to look at ways of rationalizing bidding and contracting procedures) has estimated that “eligibility screening” based on non-discretionary criteria and information from a data bank (or masterfile) of qualified contractors instead of detailed evaluation of proposals could shorten the pre-qualification process from nine to four months. If this system is established and applied in the various projects of the agency, the whole period for the bidding process can significantly be reduced. At the same time, the Department of Budget and Management (DBM) has drafted legislation to amend PD 1594 and EO 302 that seek, among others, to shorten the pre-qualification procedure. Consistent with the work of the RIMMS project, the focus of the draft bill is on eligibility screening and post-qualification rather than pre-qualification of contractors.
Poor performance of contractors has been a perennial problem in DPWH. Some of the
contractors were found to be financially troubled and lacks reliable equipment and manpower. One of the reasons for the non-termination of poorly performing contractors is the long and tedious process of re-bidding with the next qualified bidder, which takes a year. There are also cases where contractors seek the help of lower courts for temporary restraining order (TRO) in order that the contract will not be awarded to another contractor. In this case, the Supreme Court has issued a circular reminding lower courts to desist from issuing TROs against government infrastructure projects. The DOJ has also been asked to secure legal and legislative support to improve agency capacity to enforce contracts and prevent legal issues from impairing implementation, even allowing the engagement of private counsel in special cases. The bill that

44
is currently being deliberated in Congress should help put an end to this practice of TRO issuance on infrastructure projects.
In order to avoid contracting with poorly performing contractors, the agency has been
requested to exercise closer monitoring of contractors. The Construction Industry Association of the Philippines (CIAP) has been enjoined to monitor the performance of contractors through a database that provides a list of contractors and their current and recent engagements and an evaluation of their performance. This can be used by the DPWH in addition to the agency list of blacklisted contractors based on the NEDA-approved Uniform Guidelines for the Blacklisting of Contractors involved in Public Construction. The agency has also been asked to closely scrutinize bids using stricter conventions that compare these bids with the Approved Agency Estimate (AAE) in order to gauge whether they are likely to execute project in a timely manner. One of the reasons for the poor selection of contractors is that there are only few that are participating especially in local projects. The strictness in implementing rules cannot be easily done because there are only few of them and terminating their contracts will cause further delay in project implementation. Few contractors participate in the bidding because of past experience of not being paid on time or fear of not being paid at all.
Design Changes/Variation Orders. Project delays may also arise when a major alteration in the original project design is made when the project is already in the implementation stage. A request for variation order is considered by the DPWH as something out of the ordinary and therefore it is subjected to greater scrutiny. As such, the time required to secure approval for a variation order is 1.5 times as long as the time needed to obtain approval of an original project design.18 This is because a variation order involves two rounds of the review/approval process, one for the issuance of an authorization clearance which is needed before the proposed design change is approved and another one to actually process the variation order. Note that before an authorization clearance is issued the proposed alteration in the design has to be subjected to the usual procedure for evaluating an original project design which as already described above takes around 4 months. In addition, once the authorization for a variation order is secured, the design alteration is again subjected to the same review process. However, this time around the process would typically take about half the time it takes to secure the authorization clearance since the new design has already been subjected to detailed evaluation.
With regards to variation orders, the issue takes on two aspects. One is concerned with streamlining the review/approval process without sacrificing the quality of the evaluation. Again, the Road Information and Management Support System (RIMMS) project is presently undertaking a review of the said process.
The other aspect of the problem relates to the question of minimizing the instances when a variation order is required. There are instances when design changes cannot be avoided. This is the case when projects are affected by unforeseen environmental conditions such as typhoons and other natural disasters. In general, however, design changes can be avoided if the agency pays greater attention to project preparation and detailed engineering. One may infer that the low utilization of funds for preliminary and detailed engineering reflects the inability of the agency to maximize the use of these resources intended for better preparation of civil works. The 18 A proposed project design passes through the following evaluation stages prior to approval by the DPWH Secretary: Bureau of Design (overall plan review and quantitative evaluation - 2 months), Bureau of Construction (determination and evaluation of cost estimates – 3 weeks to 1 month), Legal Department (review of legal impediments - 1 week), Chief of Operations (recommendation of approval/disapproval – 3 days).

45
agency central office receives allotment for this budget item and then sub-allots the same equally among its regional offices. The analysis above suggests that this fund posted low utilization rates in the last four years. A need for closer internal monitoring of the fund utilization at the regional level is thus indicated.
In addition, there have been instances when alteration in the design has to be made because the project proponents (e.g., legislators in the case of Congressional projects under the “various infrastructure”) change the scope of work or project location. In these cases, there is a need to solidify commitment to the original project design early on through a memorandum of agreement between the DPWH and the proponent/legislator.
Compliance to Documentation Requirements. In the case of foreign assisted projects,
delays in project implementation have also been traced to the so-called “document float.”19 In some cases, the project management office fails to submit audited financial reports and supporting documents on time in violation of the loan covenant with the donors. It has been pointed out that there is little incentive for the agency to comply with the required documentation since the government effectively advances the funding for the project using local funds even with large undisbursed loan balances.20 There have been instances that projects are nearing termination and yet less than half of the loans have been released by the donor agencies in view of insufficient or non-submission of the required documentation for loan withdrawal.
In order to address this problem, task forces have been set up to facilitate the submission
of requisite documents in severely affected projects. For instance, a task force from the Commission on Audit (COA) was formed for the WB-assisted First Water Supply, Sewerage and Sanitation Project which has not submitted audited accounts for three consecutive years already. In the case of the Third Elementary Education Project, a joint team from DECS and DPWH was set up and tasked to reconstitute the documents needed to reimburse some P 2 billion. Nonetheless, after 1996, document float has not been as serious as in earlier years. This is partly due to the fact that the DBM has been stricter in withholding the allotment releases for projects with significant document float.
In the case of local projects, the release of the allotment advice has also been traced to
the delay in submission to the DBM of the agency documentation requirements such as the work and financial plan or what is referred to at present as the agency budget matrix (ABM). In this regard, DPWH officials noted that delays in the enactment of the GAA and the significant amount of Congressional insertions (which necessitate adjustments in the work/financial plans implied by the President’s budget) have contributed to the DPWH’s late submission of the ABM.
Problems on Monitoring and Evaluation. Lack of Effective Monitoring and Evaluation System for Local Projects.
The presence of a strong monitoring and evaluation system has the potential of mitigating delays in project implementation arising from the various reasons already cited above. Although such a system is operational in the case of foreign assisted regional projects, it
19 It should be noted that this problem is not relevant to JBIC projects since special account procedures are not followed in said projects. 20 Note that the government pays commitment fees even on the undisbursed portion of its loans.
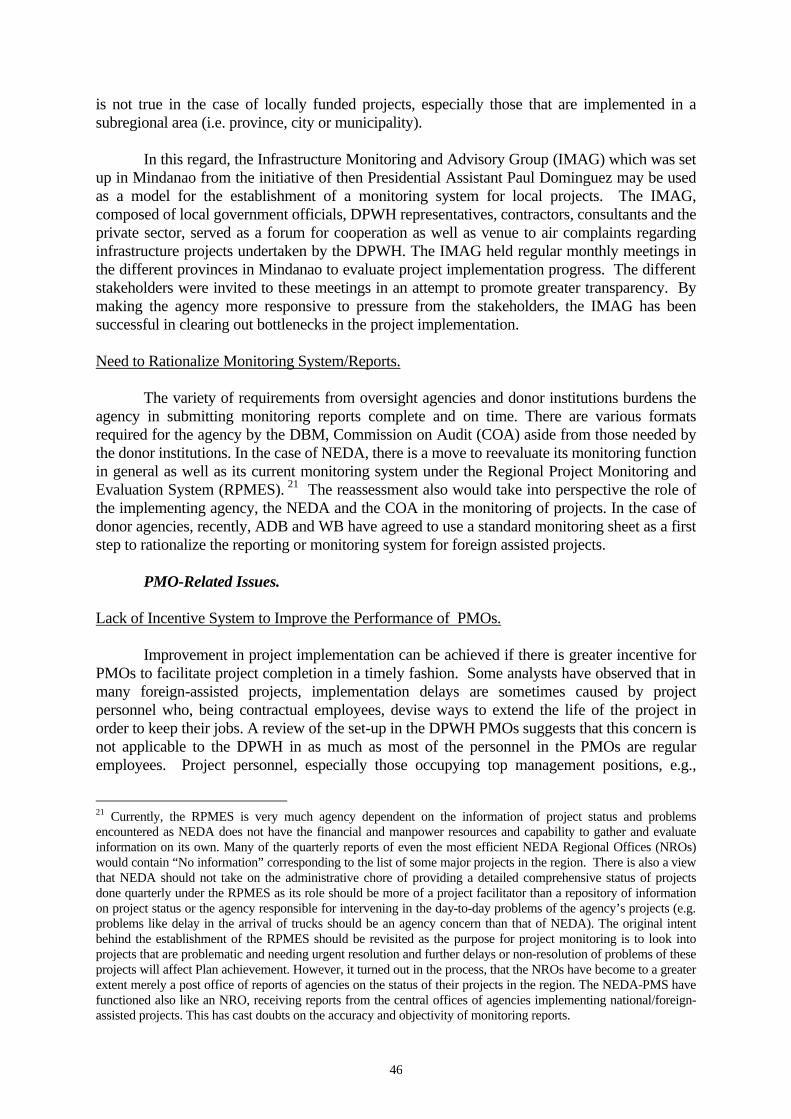
46
is not true in the case of locally funded projects, especially those that are implemented in a subregional area (i.e. province, city or municipality).
In this regard, the Infrastructure Monitoring and Advisory Group (IMAG) which was set
up in Mindanao from the initiative of then Presidential Assistant Paul Dominguez may be used as a model for the establishment of a monitoring system for local projects. The IMAG, composed of local government officials, DPWH representatives, contractors, consultants and the private sector, served as a forum for cooperation as well as venue to air complaints regarding infrastructure projects undertaken by the DPWH. The IMAG held regular monthly meetings in the different provinces in Mindanao to evaluate project implementation progress. The different stakeholders were invited to these meetings in an attempt to promote greater transparency. By making the agency more responsive to pressure from the stakeholders, the IMAG has been successful in clearing out bottlenecks in the project implementation. Need to Rationalize Monitoring System/Reports.
The variety of requirements from oversight agencies and donor institutions burdens the agency in submitting monitoring reports complete and on time. There are various formats required for the agency by the DBM, Commission on Audit (COA) aside from those needed by the donor institutions. In the case of NEDA, there is a move to reevaluate its monitoring function in general as well as its current monitoring system under the Regional Project Monitoring and Evaluation System (RPMES). 21 The reassessment also would take into perspective the role of the implementing agency, the NEDA and the COA in the monitoring of projects. In the case of donor agencies, recently, ADB and WB have agreed to use a standard monitoring sheet as a first step to rationalize the reporting or monitoring system for foreign assisted projects.
PMO-Related Issues.
Lack of Incentive System to Improve the Performance of PMOs.
Improvement in project implementation can be achieved if there is greater incentive for PMOs to facilitate project completion in a timely fashion. Some analysts have observed that in many foreign-assisted projects, implementation delays are sometimes caused by project personnel who, being contractual employees, devise ways to extend the life of the project in order to keep their jobs. A review of the set-up in the DPWH PMOs suggests that this concern is not applicable to the DPWH in as much as most of the personnel in the PMOs are regular employees. Project personnel, especially those occupying top management positions, e.g.,
21 Currently, the RPMES is very much agency dependent on the information of project status and problems encountered as NEDA does not have the financial and manpower resources and capability to gather and evaluate information on its own. Many of the quarterly reports of even the most efficient NEDA Regional Offices (NROs) would contain “No information” corresponding to the list of some major projects in the region. There is also a view that NEDA should not take on the administrative chore of providing a detailed comprehensive status of projects done quarterly under the RPMES as its role should be more of a project facilitator than a repository of information on project status or the agency responsible for intervening in the day-to-day problems of the agency’s projects (e.g. problems like delay in the arrival of trucks should be an agency concern than that of NEDA). The original intent behind the establishment of the RPMES should be revisited as the purpose for project monitoring is to look into projects that are problematic and needing urgent resolution and further delays or non-resolution of problems of these projects will affect Plan achievement. However, it turned out in the process, that the NROs have become to a greater extent merely a post office of reports of agencies on the status of their projects in the region. The NEDA-PMS have functioned also like an NRO, receiving reports from the central offices of agencies implementing national/foreign-assisted projects. This has cast doubts on the accuracy and objectivity of monitoring reports.

47
Project Managers, hold plantilla positions and, thus, do not have the incentive to delay project completion for the purpose of extending their employment. Perhaps, the problem is related to the fact that some personnel in the PMO have been “overstaying” in their positions and have lost the enthusiasm for their work. While mechanisms to monitor the performance of the PMOs have been established, these have not been enough to improve project performance. What appears to be missing is an accompanying incentive system that will reward good performance and penalize bad performance. Moreover, existing civil service and government compensation regulations delimits the flexibility of government to provide adequate incentives to good performers. A review of these rules is, therefore, in order. PMO Structure and Span of Control.
A review of the size and scope of supervision of the different PMOs for foreign assisted projects reveals that the Project Director of some PMOs heads more than 10 project components or packages aside from the project’s administrative or support offices (Table 14). For instance, in the case of the Philippine-Japan Highway Loan Project, there are 14 project packages with a total of 51 road projects for implementation. In addition, four support offices (headed by Deputy Directors) are also being managed by the said PMO Director. In contrast, some PMOs have more limited scope/coverage. In this regard, a more in depth assessment of the PMO structure with the end in view of rationalizing/standardizing the size of PMOs either in terms of number of packages/components or total costs of projects handled is needed. The rationale for this exercise is to enhance the efficiency of PMO operations by making sure that the inherent limits on a manager’s span of attention and control are respected. However, many policy analysts in the area (e.g., Garilao and Associates) as well as DPWH officials have indicated that while this might be a good move in the medium term it is not an urgent reform measure.
Table 14. Manpower Distribution of Project Management Offices Department of Public Works and Highways
Regular Contractual Casual/Daily
Project Management Pool 112
1. Asian Development Bank 40
2. BAMA Special Bridge 27 3. CARBDP 23 1
4. Feasibility Studies 54 44
5. Foreign Assisted Project-PMO 7 23
6. IBRD Highways 58 8 7. Major Flood Control Project 22
8. Manggahan Floodway Project* 26 165
9. Mt. Pinatubo Emergency* 11 39
10. 2nd Palawan Integ. Area Devt. 34 11. Pampanga Delta Devt.* 54
12 Pampanga River Control* 61
13. Phil. Japan Highway Loan * 100 185
14. PREMIUMED 61 15. Rural Water Supply 43 10
16. Small Water Impounding 21 1
17. Special Buildings 52 6
18. SRRIP 46 19. RRDP 21 3
20. Solid Waste Management 14
21. TEC-TEAM 121 26
22. Urban Road Project Office* 243 16 TOTAL 112 1,139 527 Source: Department of Public Works and Highways *JBIC-related
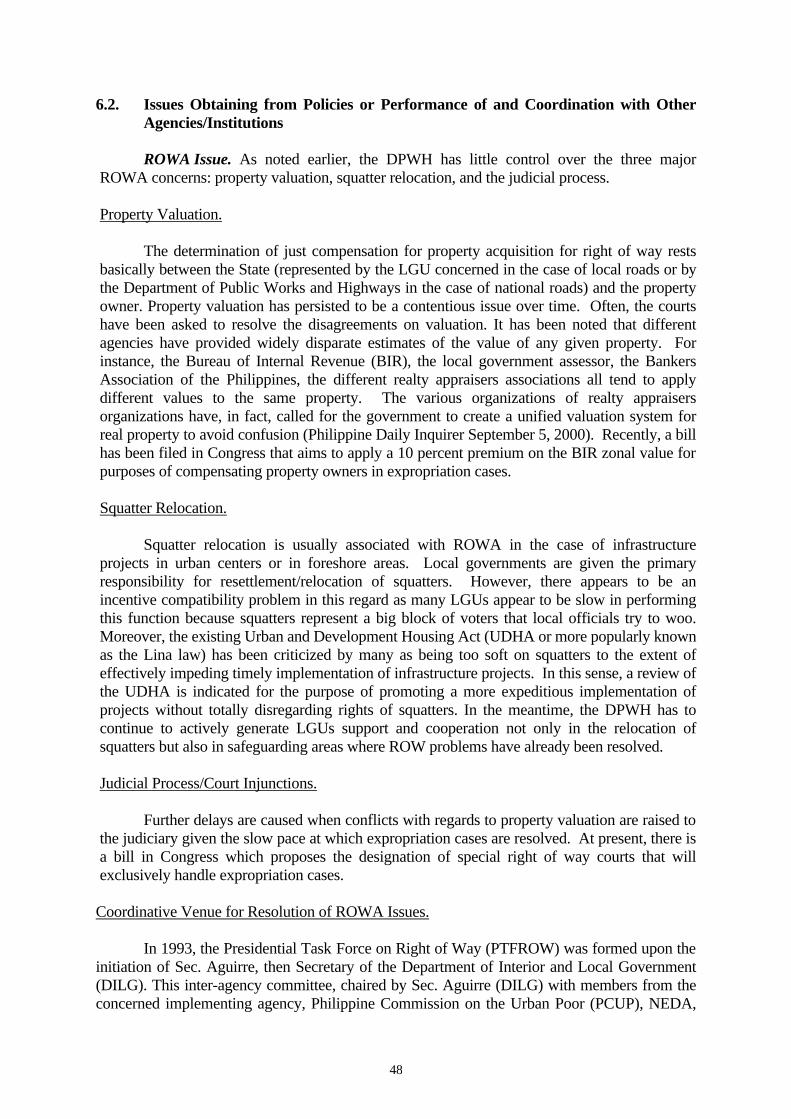
48
6.2. Issues Obtaining from Policies or Performance of and Coordination with Other Agencies/Institutions
ROWA Issue. As noted earlier, the DPWH has little control over the three major
ROWA concerns: property valuation, squatter relocation, and the judicial process. Property Valuation.
The determination of just compensation for property acquisition for right of way rests basically between the State (represented by the LGU concerned in the case of local roads or by the Department of Public Works and Highways in the case of national roads) and the property owner. Property valuation has persisted to be a contentious issue over time. Often, the courts have been asked to resolve the disagreements on valuation. It has been noted that different agencies have provided widely disparate estimates of the value of any given property. For instance, the Bureau of Internal Revenue (BIR), the local government assessor, the Bankers Association of the Philippines, the different realty appraisers associations all tend to apply different values to the same property. The various organizations of realty appraisers organizations have, in fact, called for the government to create a unified valuation system for real property to avoid confusion (Philippine Daily Inquirer September 5, 2000). Recently, a bill has been filed in Congress that aims to apply a 10 percent premium on the BIR zonal value for purposes of compensating property owners in expropriation cases.
Squatter Relocation.
Squatter relocation is usually associated with ROWA in the case of infrastructure projects in urban centers or in foreshore areas. Local governments are given the primary responsibility for resettlement/relocation of squatters. However, there appears to be an incentive compatibility problem in this regard as many LGUs appear to be slow in performing this function because squatters represent a big block of voters that local officials try to woo. Moreover, the existing Urban and Development Housing Act (UDHA or more popularly known as the Lina law) has been criticized by many as being too soft on squatters to the extent of effectively impeding timely implementation of infrastructure projects. In this sense, a review of the UDHA is indicated for the purpose of promoting a more expeditious implementation of projects without totally disregarding rights of squatters. In the meantime, the DPWH has to continue to actively generate LGUs support and cooperation not only in the relocation of squatters but also in safeguarding areas where ROW problems have already been resolved. Judicial Process/Court Injunctions.
Further delays are caused when conflicts with regards to property valuation are raised to the judiciary given the slow pace at which expropriation cases are resolved. At present, there is a bill in Congress which proposes the designation of special right of way courts that will exclusively handle expropriation cases. Coordinative Venue for Resolution of ROWA Issues.
In 1993, the Presidential Task Force on Right of Way (PTFROW) was formed upon the initiation of Sec. Aguirre, then Secretary of the Department of Interior and Local Government (DILG). This inter-agency committee, chaired by Sec. Aguirre (DILG) with members from the concerned implementing agency, Philippine Commission on the Urban Poor (PCUP), NEDA,
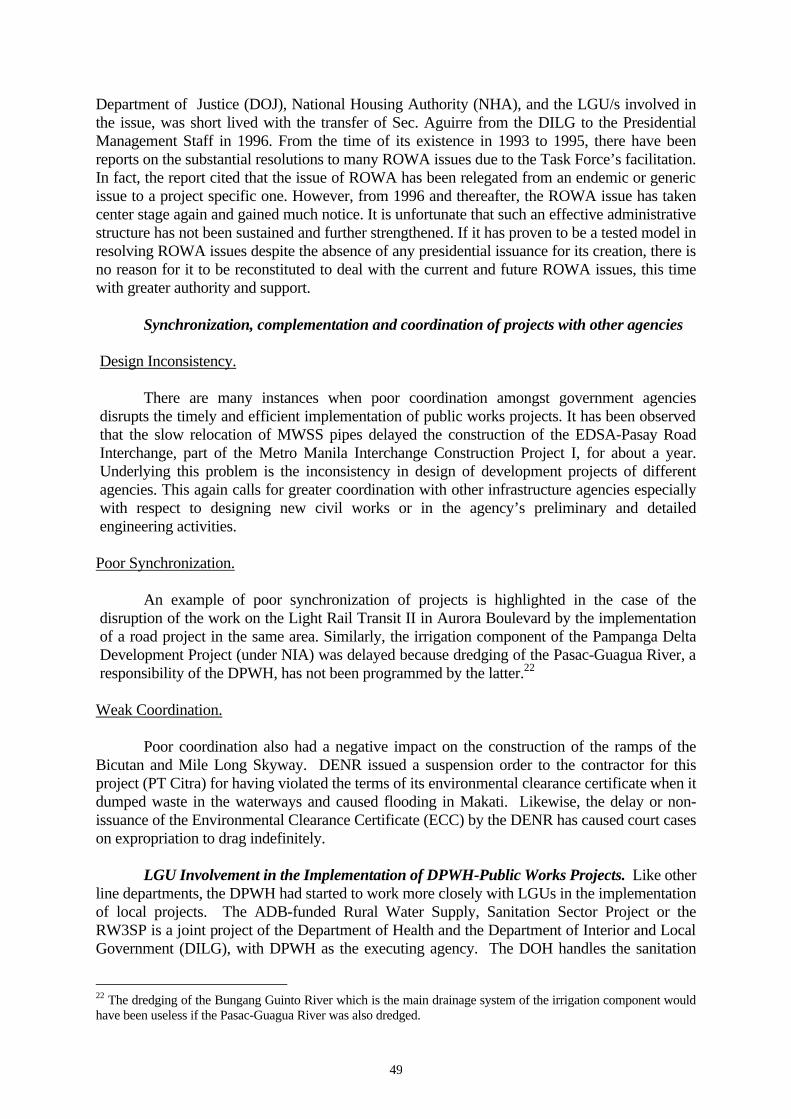
49
Department of Justice (DOJ), National Housing Authority (NHA), and the LGU/s involved in the issue, was short lived with the transfer of Sec. Aguirre from the DILG to the Presidential Management Staff in 1996. From the time of its existence in 1993 to 1995, there have been reports on the substantial resolutions to many ROWA issues due to the Task Force’s facilitation. In fact, the report cited that the issue of ROWA has been relegated from an endemic or generic issue to a project specific one. However, from 1996 and thereafter, the ROWA issue has taken center stage again and gained much notice. It is unfortunate that such an effective administrative structure has not been sustained and further strengthened. If it has proven to be a tested model in resolving ROWA issues despite the absence of any presidential issuance for its creation, there is no reason for it to be reconstituted to deal with the current and future ROWA issues, this time with greater authority and support.
Synchronization, complementation and coordination of projects with other agencies Design Inconsistency.
There are many instances when poor coordination amongst government agencies
disrupts the timely and efficient implementation of public works projects. It has been observed that the slow relocation of MWSS pipes delayed the construction of the EDSA-Pasay Road Interchange, part of the Metro Manila Interchange Construction Project I, for about a year. Underlying this problem is the inconsistency in design of development projects of different agencies. This again calls for greater coordination with other infrastructure agencies especially with respect to designing new civil works or in the agency’s preliminary and detailed engineering activities.
Poor Synchronization.
An example of poor synchronization of projects is highlighted in the case of the
disruption of the work on the Light Rail Transit II in Aurora Boulevard by the implementation of a road project in the same area. Similarly, the irrigation component of the Pampanga Delta Development Project (under NIA) was delayed because dredging of the Pasac-Guagua River, a responsibility of the DPWH, has not been programmed by the latter.22 Weak Coordination.
Poor coordination also had a negative impact on the construction of the ramps of the Bicutan and Mile Long Skyway. DENR issued a suspension order to the contractor for this project (PT Citra) for having violated the terms of its environmental clearance certificate when it dumped waste in the waterways and caused flooding in Makati. Likewise, the delay or non-issuance of the Environmental Clearance Certificate (ECC) by the DENR has caused court cases on expropriation to drag indefinitely.
LGU Involvement in the Implementation of DPWH-Public Works Projects. Like other line departments, the DPWH had started to work more closely with LGUs in the implementation of local projects. The ADB-funded Rural Water Supply, Sanitation Sector Project or the RW3SP is a joint project of the Department of Health and the Department of Interior and Local Government (DILG), with DPWH as the executing agency. The DOH handles the sanitation
22 The dredging of the Bungang Guinto River which is the main drainage system of the irrigation component would have been useless if the Pasac-Guagua River was also dredged.

50
component, the DPWH is assigned the water supply component and DILG is tasked with institutional development. The projects under the RW3SP are situated in selected LGUs (all belonging to 20 poorest provinces under the Social Reform Agenda). These LGUs are expected (and have committed through a Memorandum of Agreement signed by the respective Governors) to provide counterpart funds equivalent to 20 percent of the total project cost. Ten percent represents the cash counterpart of the provinces and the remaining 10 percent is the counterpart financing contributed by Barangay Water Supply and Sanitation Associations (BWSSA). The cost share of the BWSSAs was typically made in kind (site development and manpower services).
The RW3SP experience highlights some of the problems associated with central
government-LGU partnership in implementing projects and provides lessons for similar projects in the future that involve the LGUs.
Timing of Project.
The conduct of elections can disrupt project execution. The effectivity date of the project
was November 1997. In principle, the project could have taken off in January 1998. However, local officials were busy with pre-election activities so that the then incumbent governors formalized their LGUs’ commitment to undertake the project by signing a Memorandum of Agreement (MOA) with the DPWH only in February of 1998. But when a new set of local officials were voted into office, the DPWH had to orient the newly elected governors. In fact, new MOAs were put into effect with the newly elected local officials as signatories.23 Lack of Financial Capacity/Delayed Release of Counterpart Funds.
Relative to other types of projects, the LGU cost share required in the RW3SP is lower.
Because of this, the RW3SP provinces did not have as much difficulty in raising the requisite counterpart funds for the project as in other projects. 24 Despite this, delays in the release of counterpart funds contributed to the overall slowdown in project implementation. In response, the DPWH-PMO had devised a system for monitoring whether the LGUs have already given their contributions through the submission of SOD/SOE (Statement of Disbursements/Expenditures).
Lack of Administrative Capacity.
Problems in bidding and contracting have been one of the obstacles encountered in the
20 project sites. There were reports that some provinces only had one bidder. Consequently, there was difficulty in finding a replacement for poorly performing contractors. This is particularly acute considering that the RW3SP is located in the 20 poorest provinces of the country and therefore, more often than not, administrative capacity is lacking and the required technical support is not available.
23 It should be pointed out that, from the legal perspective, new MOAs need not have been signed with the newly elected governors. However, having the new governors sign the MOAs themselves was important in ensuring that their support for the project is forthcoming. 24 For instance, in the DECS-Third Elementary Education Project (TEEP), the LGU cost share was set at a higher rate (25 percent). In these projects, fiscal affordability on the part of the LGUs appears to be a real problem. Eventually, the GOP and the donors agreed to make downward adjustment on the LGU cost share in line with the LGUs’ financial capacity.

51
Absorptive Capacity. The PMO of the RW3SP is also now looking at the absorptive capacity of LGUs with
respect to the physical target originally programmed for each of the provinces. They reckon that a possible reason for the low fund utilization and delayed implementation of project activities in some LGUs is the mismatch between the absorptive capacity of said LGUs and the physical targets. This came about because the overall RW3SP target (in terms of the number of projects to be implemented in each of the 20 provinces) was mechanically set with some notional expectation of what the demand for the services should be without regard for the actual ability of the provinces to deliver said services within the project duration. Governance.
Some governors have shown outstanding leadership and commitment to the project. For
example, one governor initiated the purchase of a drilling machine even if this is not required of the LGU under the project. In contrast, in some areas where the governors and the mayors belong to different political parties, the project experienced setbacks in the implementation of the project. There were also instances where some governors, perhaps in search of a political campaign vehicle, slowed down project implementation by requiring that the distribution of project supplies/materials be done only when they are present.25
Multiplicity of Objectives.
The RW3SP experience may not provide a good gauge of the LGUs’ capacity to implement public works projects. It should be emphasized that RW3SP tried to combine equity and efficiency objectives at the same time. It was meant to promote increasing LGU involvement in the implementation of devolved public work projects. Thus, the project was premised on giving the LGUs greater responsibility (in terms of a more active part in financing and actual project implementation). However, the project is being implemented in the poorest of the provinces. As such, these provinces are the ones which would tend to lag behind in terms of both financial and technical capability. Perhaps, in future projects, greater selectivity in choosing LGU partners should be practiced. Also, there might be a need to re-calibrate the required counterpart funds in line with what LGUs can afford. The same is true of the technical/administrative capacity requirements.
6.3. Issues Obtaining from Budgeting Authorities and System
Expenditure Management. Release of Allotment and Cash.
Over the years, a common complaint amongst line departments refers to the shortfalls in the level of allotment and cash that is released by the DBM. On top of this, the release of the advice of allotment and notice of cash allocation is not made in a timely manner, especially during periods when the government’s fiscal position is tight. For instance, in 1992 and 1993, cash releases were said to have been skewed towards the last half of the year when construction activities were originally programmed in the first half of the year, during dry season (NEDA/PMS 1993, 1994). With the easing of the fiscal situation in 1995-1996 and the
25 To make matters worse, these same governors do not give priority to the said activity in their schedules.

52
inclusion of a common fund (i.e., Lump Sum Fund for Foreign Assisted Projects) in the yearly appropriation, this problem appeared to have been resolved.
Table 15 presents a summary of quarterly allotments and obligations of the agency with
respect to foreign assisted projects (FAPs) in 1996-1999. It tends to show that the DPWH’s low absorptive capacity in 1996 is largely due to weaknesses in agency’s operations. Although the agency received the advice of allotment for 90 percent of its appropriations as early as the first quarter of the year, overall fund utilization for the year was low. In contrast, in 1999, delays in the release of the advice of allotment are evident in the figures for the first and second quarter. This is said to have critical implications on the agency’s spending performance. Thus, while institutional weakness on the part of DPWH undoubtedly continue to persist, the delayed release of the advice of allotment may have worsened the already low absorptive capacity of the agency.
When budget cuts are instituted by the government during years when shortfalls in
revenue are experienced, the DPWH budget tends to suffer disproportionately relative to other agencies. This is so because the government is constrained to apply the reductions in non-mandatory expenditure items like capital and maintenance outlays. Thus, this practice impacts negatively on the DPWH’s budget (75 percent of which goes to capital outlays).
The study reveals a mismatch between the priority given to specific programs/activities/projects (PAPs) and the relative capacity of said PAPs to utilize funds. Thus, the OACIs of many PAPs diverge from 1 and tend to fluctuate widely from year to year. This finding may be traced either to a poor information base or the poor use of data on expenditure allotment and obligation for management purposes.
While programming or prioritization across the various department/agencies is the responsibility of the DBM, prioritization across the P/A/Ps is part of the mandate of individual agencies. On the part of the DBM, it has good information on allotments but incomplete data on obligations. In turn, this may have constrained its ability in allocating available funds to agencies with high absorptive capacity. In contrast, DPWH has an excellent and computerized database of its expenditures (allotments, obligations and disbursements). However, it appears this information is not effectively used in prioritizing the allocation of funds across P/A/Ps. A good example here is the discussion above on the TEC. Also, the DPWH may need to reconsider its allotment to two budget items (i.e. accessibility facilities for the disabled and infrastructure support to gender and development) which has almost always exceeded appropriation but have consistently been underutilized as indicated by the low obligation levels. Overly Optimistic Revenue Projections.
The Philippines has had a long history of having overly optimistic government revenue projections. In turn, its annual appropriations also tend to be set at unrealistically high levels. Consequently, the DBM has had to implement budget cuts (in form of mandatory reserves imposed right at the start of the budget year or in the more non-transparent delayed release of advice of allotments and cash allocations) during budget implementation.

53

54
This practice has had deleterious effects on the budget programming and program/project implementation. One, both the DBM and the departments/agencies have had to spend considerable effort in preparing their work and financial plans only to redo them again each time budget cuts are imposed. Two, the untimely release of cash allocations (even when there is no delay in the release of the advice of allotments) has effectively stalled project implementation as both the line agencies and the prospective contractors hesitate to enter into contracts given the uncertainties on cash availability. Moreover, in cases where there is a live contract in force, the contracts also slow down on their construction activities when they are not paid on time.
Congressional Insertions. Congress has exhibited a propensity to raise the overall
appropriations relative to the overall budget proposed by the President. Often, this exercise appears to be related to the desire on the part of legislators to include more projects that will directly benefit their constituents.26 The analysis above indicates that DPWH is usually tasked to implement Congressional insertions. However, there is typically no provision for incremental overhead support for the additional projects implied by the said insertions. This practice tends to pull down the agency’s ability to improve its absorptive capacity.
Improvement of Absorptive Capacity and National Development Plan Achievement. There appears to be positive relationship between the absorptive capacity of the agency and the achievement of sectoral targets laid out in the country’s development plan. In the case of public works, under the 1998-2004 Medium-Term Philippine Development Plan (MTPDP), as have been shown in Table 4, the cost to achieve the six-year plan target is estimated to be P413B or P69B per year. Interestingly, DPWH had a fairly constant expenditure pattern under a pre-crisis or post-crisis period and regardless of low or high appropriations and allotments (Figure 3). The annual range of obligations is from P26B to about P29B in the case of pure DPWH budget and from about P5 billion to P7 billion from other fund sources. Thus, one may infer that perhaps, the absorptive capacity of DPWH in a year’s time falls between P31B to P36B. If DPWH annual expenditure performance remains at an average of P30B, then MTPDP target will not be achieved by 2004. Another seven years is needed, extending the target to 2011. This will inevitably happen if no changes are made in the existing institutional machinery of the agency and if the recurrent problems in project implementation remain unchecked.
Figure 3DPWH Appropriation, Allotment and Obligation, 1996-2000
(in Peso billions)
0.0
10.0
20.0
30.0
40.0
50.0
60.0
70.0
Proposed to Congress 31.5 38.1 46.9 37.7 42.4
Appropriation 40.4 53.8 61.8 33.6 52.4
Allotment 41.8 42.6 32.3 36.7
Obligation 25.9 28.5 26.1 28.3
1996 1997 1998 1999 2000
26 Although Congressional predisposition to increase the aggregate budget level has been mitigated in recent years, the penchant for Congressional insertions has been sustained.

55
7. RECOMMENDATIONS FOR IMPROVING ABSORPTIVE CAPACITY OF PUBLIC WORKS FUNDS
In view of the issues cited above, the following lists some policy actions that will help
raise the fund absorption of agencies involved in public works, with particular reference to DPWH. These recommendations flow from the previous analysis of the issues and are categorized into short-term and long-term actions. Short-term refers to those policies or actions that can be implemented immediately up to the medium-term (up to 4/5 years) while long-term refers to those that can be done immediately but may not be completed in the medium-term. 7.1. Measures needed to improve agency’s capacity for fund absorption 1. Address the perennial factors hampering project implementation a. Right of Way Acquisition
Short-Term - Acquisition of ROW prior to the actual project inception or even before the project loan
is approved in the case of FAPs - Lump sum appropriation for ROWA for projects already in the agency pipeline and not
just for projects that have already signed loan agreements. 27 - Reconstitution of the Presidential Task Force on ROWA or similar body to address
coordinative problems and facilitate issue resolution - Provision of realistic cost estimate for ROWA including the development cost of
relocation sites for the affected families. The estimated cost must be reflected in the GAA.
- Enjoining the full cooperation of the LGUs in relocating affected families as well as in safeguarding areas where ROWA have been resolved
Long-Term - Review/amendment of the UDHA law to give the government greater leverage on
squatter relocation especially particularly those relating to urgent or critical infrastructure projects. At present, a number of bills have been filed in Congress seeking to prohibit lower courts from issuing temporary restraining orders on the construction works of infrastructure projects.
- Unify real property valuation system to avoid confusion brought about by widely divergent valuations from different sources
b. Improvement in the bidding process and system of selection and monitoring of performance
of contractors28 Short-Term - Ensure that well-qualified contractors are allowed to participate in the bidding process - Exercise strong political will to enforce rules and make the pre-qualification process
impartial and transparent and not easily subject to external/political pressures
27 An example is the case of the CAMANAVA flood control and drainage project wherein JBIC required that the ROWA issues be settled prior to loan signing. The DPWH took two years to complete the ROWA partly because of difficulties in raising the funds for ROWA. 28 WB is currently undertaking a project for the improvement of administrative management and systems in the DPWH, DOH and DECS.

56
- Support move to rely less on stringent but subjective pre-qualification procedures in favor of post-qualification (Refer to RIMMS project proposal and bill amending existing procurement law drafted by DBM as discussed above.)
- Support move to establish data base of public works contractors - Encourage information sharing among DPWH-PMOs and between government agencies
regarding poorly performing contractors 2. Improve preliminary and detailed engineering
Short-Term - Review actual utilization of these funds by the regional and district engineering offices Long-Term - Capacity building for project preparation
3. Improvement of the project monitoring and evaluation system
Short-Term - Revive the Cabinet Action Committee on Implementation and Assistance (CACIA)
System which has proven to be effective in monitoring and addressing slippages in project implementation during the Aquino administration
- Rationalize/standardize the reporting forms required by oversight agencies and donor institutions Long-Term - Reevaluate the current monitoring and evaluation system implemented by NEDA
through the RPMES. Identify the role of the NEDA, the implementing agency and the COA in the whole process/system.
- Support the formation of monitoring committees for local projects - Encourage the formation of a monitoring group within or among local areas drawing
from the IMAG concept in Mindanao
4. Provision of institutional support for activities beyond the agency’s regular functions/mandate Short-Term - Increases in the budget of the agency beyond the President’s budget proposal should be
accompanied by adequate provision for administrative overhead and manpower support. 5. Coordination/partnerships with LGUs on project implementation
Short-Term - Greater selectivity in choice of LGU partners, focusing on more capable LGUs as
capability build-up of other LGUs is supported Long-Term - Develop the potential of working with LGUs on implementing public works projects
drawing from the experience of LGU implemented projects such as the ADB-assisted RW3SP.

57
6. Organizational Strengthening Long-Term - DBM to consider the manpower complement of DPWH particularly the number of
engineers in the regional and district offices considering the number of projects being implemented and are expected for the agency to implement.
- Undertake in depth assessment of the PMO structure with the end in view of rationalizing/standardizing the size of PMOs either in terms of number of packages/components or total costs of projects handled
7.2. Measures needed to improve budget determination and programming having
bearing on agency absorptive capacity 1. Institutionalization of monitoring fund utilization and using information and analysis of the
same for annual agency budget review
Short-Term - Improve database of DBM with respect to agency level allotments and obligations to aid
in budget programming - DBM to look into authorities given to its regional offices. DPWH Regional Offices
complain that DBM Regional Office often refer their concerns to DBM Central Office. 2. Improvement in the linkage between fiscal framework and budget preparation; timely
release of funds Short-Term - Use of more realistic revenue targets; - Improve fiscal authorities’ capacity in the area of revenue forecasting - Avoid increasing total budget level in the GAA - DBM’s policy of “what you see is what you get” should not be a promise but an
implementable policy. 7.3. Areas for Donor Assistance and Support 1. Exercise greater flexibility in loan arrangements to address ROWA problems.
Long-Term - For donor institutions consider imputing ROWA expenses in the project cost even if these expenses were incurred before loan approval/signing. The donor agency and the executing agency can enter into an agreement in this regard to facilitate loan signing and early commencement of project
2. Provide technical assistance in project preparation, design and management.
Long-Term Arrangements can be made to involve agency personnel in the preliminary engineering and design activities of the project, which is usually contracted out as part of the loan agreement.

58
Short-Term Provide fund assistance for training needs assessment as well as refresher courses especially for PMO personnel
Long-Term
3. Technical assistance for designing a reward system in the PMOs for completion of activities on or ahead of schedule and, conversely, apply appropriate sanctions for project delays resulting from inefficiencies in internal operations. This incentive system should be on top of the existing incentive system of the government as the latter has been found limiting and fraught with legal impediments. Such incentive schemes would not only help move the project in accomplishing the various outputs according to schedule but also would help prevent project delays, keep effective and efficient project personnel for future projects and deal appropriately with those that are poorly performing. This can form part of the loan agreement to strengthen the implementation of the system. Short-Term
4. Assist in unifying the reporting system / forms with the other donor institutions as started by ADB and WB.

59
REFERENCES
Adler, John H. (1965). Absorptive Capacity: The Concept and Its Determinants. The Brookings
Institution, Washington, D.C. Briones, Leonor (1996). Philippine Public Fiscal Administration. Fiscal Administration
Foundation, Inc. (FAFI), Manila. Filamor, Alberto E. (1997). Philippine Real Estate Law and Jurisprudence. Manila. Halcrow Fox (1997). Philippine Transport Strategy Study. Final Report. Prepared for the
Government of the Philippines and the Asian Development Bank. Japan Bank for International Cooperation (JBIC) (2000), Report on Project Implementation
Review (PIR) Meeting for JBIC-Supported DPWH Projects. 21 June 2000 (Unpublished Material).
Manasan, Rosario G. Breaking Away from the Fiscal Bind: Reforming the Fiscal System.
Manila: Philippine Institute for Development Studies, 1994. Manasan, Rosario G., “LGU Financing of SEDIP Civil Works: Affordability and
Sustainability,” Report submitted to ADB, March 1998 Manasan, Rosario G. “Impact of Local Government Code and Proposed Amendments on
Ability to Finance Infrastructure,” Paper presented at the Mindanao Budget Summit, October 1999.
Manasan, Rosario G. “Public Expenditure Management: A Case Study of the Philippines,”
Report submitted to the Minerva Oz for JBIC, February 2000. Manasan, Rosario G. “Evaluation of Proposals to Increase the Share of LGUs in National Taxes
and to Change the IRA Distribution Formula,” Paper presented to the Committee on Local Government, House of Representatives, January 2001.
Meier, Gerald M. (1964). Leading Issues in Development Economics. As quoted in Adler (1965) National Economic and Development Authority (NEDA)-Project Monitoring Staff (PMS)
(1998). Compilation of 1st to 6th ODA Portfolio Review. Unpublished Document National Economic and Development Authority (NEDA)-Project Monitoring Staff (PMS), 6th,
7th , 8th ODA Portfolio Review.(Agency Consultation Review) Unpublished Document. Reyes, Romeo A. (1985). Official Development Assistance to the Philippines: A Study of
Administrative Capacity and Performance. National Economic and Development Authority: Manila.

60
Reyes, Romeo A. (1993). Absorptive Capacity for Foreign Aid: The Case of the Philippines. Philippine Institute for Development Studies and International Center for Economic Growth, Makati.
Supangco, Joselito. “Project Chronology and Accomplishment: Infrastructure,” Consultant’s
report submitted to the ADB TA No. 3145 – PHI (Strengthening Public Finance and Planning of LGUs), 2000
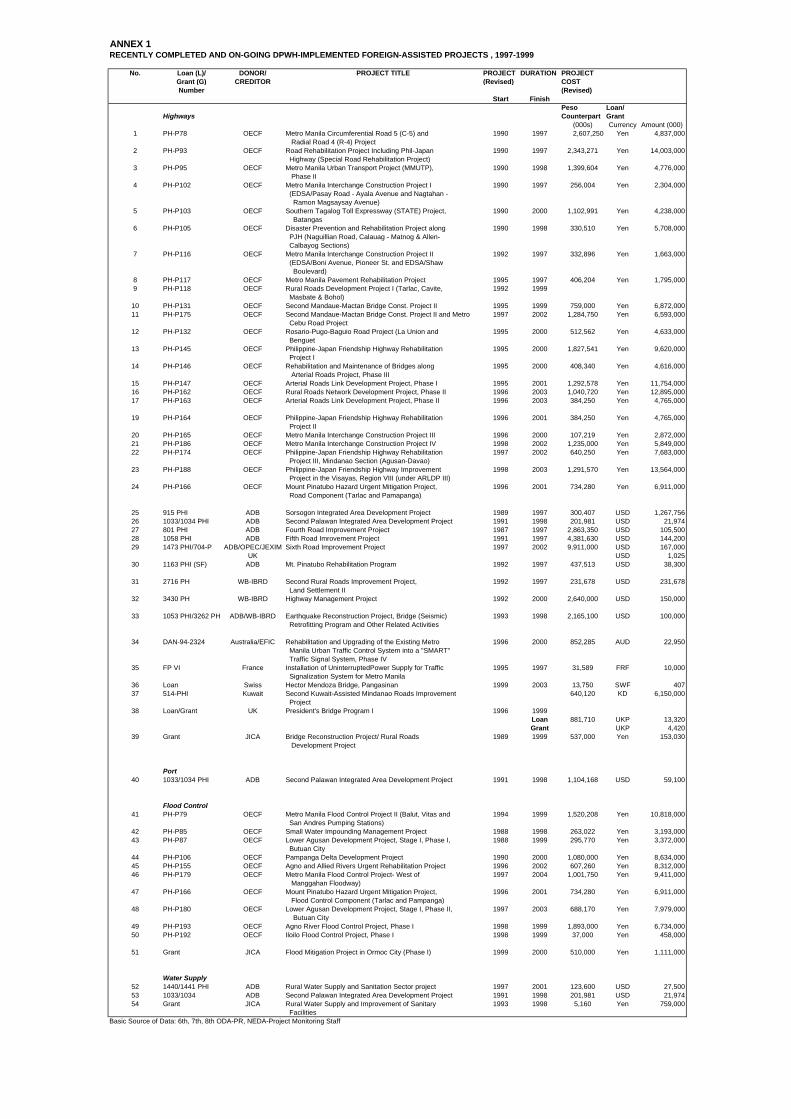
ANNEX 1RECENTLY COMPLETED AND ON-GOING DPWH-IMPLEMENTED FOREIGN-ASSISTED PROJECTS , 1997-1999
No. Loan (L)/ DONOR/ PROJECT TITLE PROJECT DURATION PROJECTGrant (G) CREDITOR (Revised) COSTNumber (Revised)
Start FinishPeso Loan/
Highways Counterpart Grant(000s) Currency Amount (000)
1 PH-P78 OECF Metro Manila Circumferential Road 5 (C-5) and 1990 1997 2,607,250 Yen 4,837,000 Radial Road 4 (R-4) Project
2 PH-P93 OECF Road Rehabilitation Project Including Phil-Japan 1990 1997 2,343,271 Yen 14,003,000 Highway (Special Road Rehabilitation Project)
3 PH-P95 OECF Metro Manila Urban Transport Project (MMUTP), 1990 1998 1,399,604 Yen 4,776,000 Phase II
4 PH-P102 OECF Metro Manila Interchange Construction Project I 1990 1997 256,004 Yen 2,304,000 (EDSA/Pasay Road - Ayala Avenue and Nagtahan - Ramon Magsaysay Avenue)
5 PH-P103 OECF Southern Tagalog Toll Expressway (STATE) Project, 1990 2000 1,102,991 Yen 4,238,000 Batangas
6 PH-P105 OECF Disaster Prevention and Rehabilitation Project along 1990 1998 330,510 Yen 5,708,000 PJH (Naguillian Road, Calauag - Matnog & Allen- Calbayog Sections)
7 PH-P116 OECF Metro Manila Interchange Construction Project II 1992 1997 332,896 Yen 1,663,000 (EDSA/Boni Avenue, Pioneer St. and EDSA/Shaw Boulevard)
8 PH-P117 OECF Metro Manila Pavement Rehabilitation Project 1995 1997 406,204 Yen 1,795,0009 PH-P118 OECF Rural Roads Development Project I (Tarlac, Cavite, 1992 1999
Masbate & Bohol)10 PH-P131 OECF Second Mandaue-Mactan Bridge Const. Project II 1995 1999 759,000 Yen 6,872,00011 PH-P175 OECF Second Mandaue-Mactan Bridge Const. Project II and Metro 1997 2002 1,284,750 Yen 6,593,000
Cebu Road Project12 PH-P132 OECF Rosario-Pugo-Baguio Road Project (La Union and 1995 2000 512,562 Yen 4,633,000
Benguet13 PH-P145 OECF Philippine-Japan Friendship Highway Rehabilitation 1995 2000 1,827,541 Yen 9,620,000
Project I14 PH-P146 OECF Rehabilitation and Maintenance of Bridges along 1995 2000 408,340 Yen 4,616,000
Arterial Roads Project, Phase III15 PH-P147 OECF Arterial Roads Link Development Project, Phase I 1995 2001 1,292,578 Yen 11,754,00016 PH-P162 OECF Rural Roads Network Development Project, Phase II 1996 2003 1,040,720 Yen 12,895,00017 PH-P163 OECF Arterial Roads Link Development Project, Phase II 1996 2003 384,250 Yen 4,765,000
19 PH-P164 OECF Philippine-Japan Friendship Highway Rehabilitation 1996 2001 384,250 Yen 4,765,000 Project II
20 PH-P165 OECF Metro Manila Interchange Construction Project III 1996 2000 107,219 Yen 2,872,00021 PH-P186 OECF Metro Manila Interchange Construction Project IV 1998 2002 1,235,000 Yen 5,849,00022 PH-P174 OECF Philippine-Japan Friendship Highway Rehabilitation 1997 2002 640,250 Yen 7,683,000
Project III, Mindanao Section (Agusan-Davao)23 PH-P188 OECF Philippine-Japan Friendship Highway Improvement 1998 2003 1,291,570 Yen 13,564,000
Project in the Visayas, Region VIII (under ARLDP III)24 PH-P166 OECF Mount Pinatubo Hazard Urgent Mitigation Project, 1996 2001 734,280 Yen 6,911,000
Road Component (Tarlac and Pamapanga)
25 915 PHI ADB Sorsogon Integrated Area Development Project 1989 1997 300,407 USD 1,267,75626 1033/1034 PHI ADB Second Palawan Integrated Area Development Project 1991 1998 201,981 USD 21,97427 801 PHI ADB Fourth Road Improvement Project 1987 1997 2,863,350 USD 105,50028 1058 PHI ADB Fifth Road Imrovement Project 1991 1997 4,381,630 USD 144,20029 1473 PHI/704-P ADB/OPEC/JEXIM Sixth Road Improvement Project 1997 2002 9,911,000 USD 167,000
UK USD 1,02530 1163 PHI (SF) ADB Mt. Pinatubo Rehabilitation Program 1992 1997 437,513 USD 38,300
31 2716 PH WB-IBRD Second Rural Roads Improvement Project, 1992 1997 231,678 USD 231,678 Land Settlement II
32 3430 PH WB-IBRD Highway Management Project 1992 2000 2,640,000 USD 150,000
33 1053 PHI/3262 PH ADB/WB-IBRD Earthquake Reconstruction Project, Bridge (Seismic) 1993 1998 2,165,100 USD 100,000 Retrofitting Program and Other Related Activities
34 DAN-94-2324 Australia/EFIC Rehabilitation and Upgrading of the Existing Metro 1996 2000 852,285 AUD 22,950 Manila Urban Traffic Control System into a "SMART" Traffic Signal System, Phase IV
35 FP VI France Installation of UninterruptedPower Supply for Traffic 1995 1997 31,589 FRF 10,000 Signalization System for Metro Manila
36 Loan Swiss Hector Mendoza Bridge, Pangasinan 1999 2003 13,750 SWF 40737 514-PHI Kuwait Second Kuwait-Assisted Mindanao Roads Improvement 640,120 KD 6,150,000
Project38 Loan/Grant UK President's Bridge Program I 1996 1999
Loan 881,710 UKP 13,320Grant UKP 4,420
39 Grant JICA Bridge Reconstruction Project/ Rural Roads 1989 1999 537,000 Yen 153,030 Development Project
Port40 1033/1034 PHI ADB Second Palawan Integrated Area Development Project 1991 1998 1,104,168 USD 59,100
Flood Control41 PH-P79 OECF Metro Manila Flood Control Project II (Balut, Vitas and 1994 1999 1,520,208 Yen 10,818,000
San Andres Pumping Stations)42 PH-P85 OECF Small Water Impounding Management Project 1988 1998 263,022 Yen 3,193,00043 PH-P87 OECF Lower Agusan Development Project, Stage I, Phase I, 1988 1999 295,770 Yen 3,372,000
Butuan City44 PH-P106 OECF Pampanga Delta Development Project 1990 2000 1,080,000 Yen 8,634,00045 PH-P155 OECF Agno and Allied Rivers Urgent Rehabilitation Project 1996 2002 607,260 Yen 8,312,00046 PH-P179 OECF Metro Manila Flood Control Project- West of 1997 2004 1,001,750 Yen 9,411,000
Manggahan Floodway)47 PH-P166 OECF Mount Pinatubo Hazard Urgent Mitigation Project, 1996 2001 734,280 Yen 6,911,000
Flood Control Component (Tarlac and Pampanga)48 PH-P180 OECF Lower Agusan Development Project, Stage I, Phase II, 1997 2003 688,170 Yen 7,979,000
Butuan City49 PH-P193 OECF Agno River Flood Control Project, Phase I 1998 1999 1,893,000 Yen 6,734,00050 PH-P192 OECF Iloilo Flood Control Project, Phase I 1998 1999 37,000 Yen 458,000
51 Grant JICA Flood Mitigation Project in Ormoc City (Phase I) 1999 2000 510,000 Yen 1,111,000
Water Supply52 1440/1441 PHI ADB Rural Water Supply and Sanitation Sector project 1997 2001 123,600 USD 27,50053 1033/1034 ADB Second Palawan Integrated Area Development Project 1991 1998 201,981 USD 21,97454 Grant JICA Rural Water Supply and Improvement of Sanitary 1993 1998 5,160 Yen 759,000
FacilitiesBasic Source of Data: 6th, 7th, 8th ODA-PR, NEDA-Project Monitoring Staff
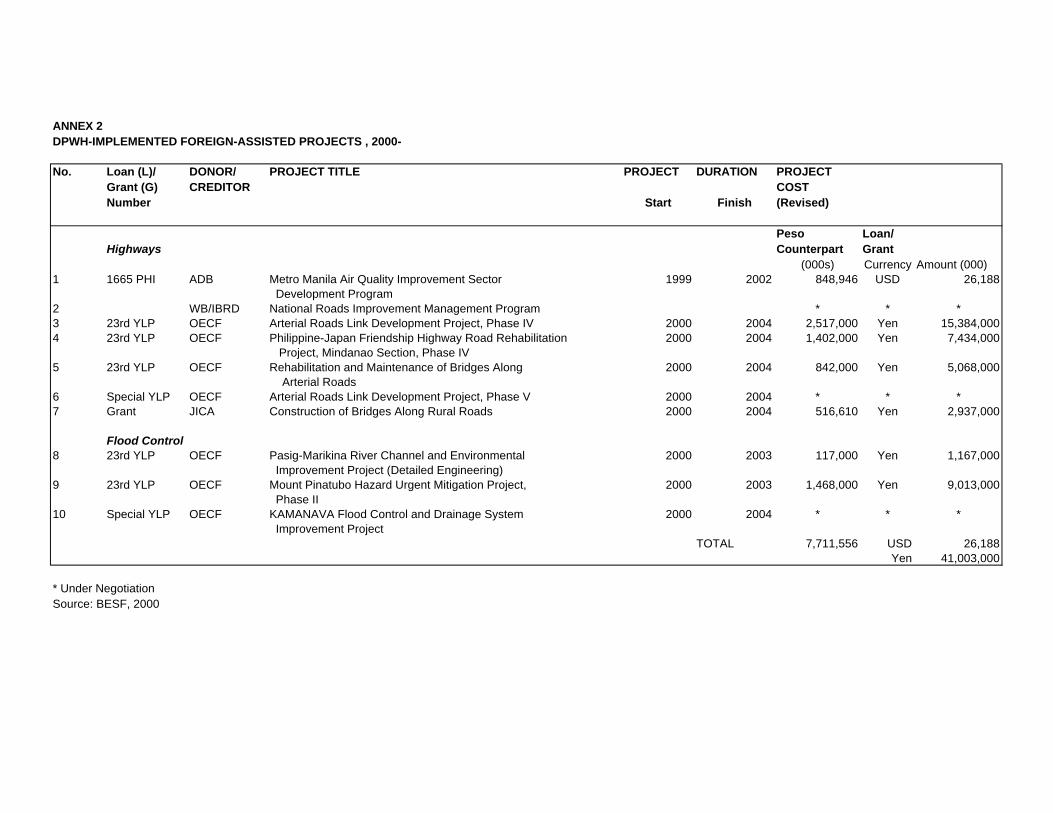
ANNEX 2DPWH-IMPLEMENTED FOREIGN-ASSISTED PROJECTS , 2000-
No. Loan (L)/ DONOR/ PROJECT TITLE PROJECT DURATION PROJECTGrant (G) CREDITOR COSTNumber Start Finish (Revised)
Peso Loan/Highways Counterpart Grant
(000s) Currency Amount (000)1 1665 PHI ADB Metro Manila Air Quality Improvement Sector 1999 2002 848,946 USD 26,188
Development Program2 WB/IBRD National Roads Improvement Management Program * * *3 23rd YLP OECF Arterial Roads Link Development Project, Phase IV 2000 2004 2,517,000 Yen 15,384,0004 23rd YLP OECF Philippine-Japan Friendship Highway Road Rehabilitation 2000 2004 1,402,000 Yen 7,434,000
Project, Mindanao Section, Phase IV5 23rd YLP OECF Rehabilitation and Maintenance of Bridges Along 2000 2004 842,000 Yen 5,068,000
Arterial Roads6 Special YLP OECF Arterial Roads Link Development Project, Phase V 2000 2004 * * *7 Grant JICA Construction of Bridges Along Rural Roads 2000 2004 516,610 Yen 2,937,000
Flood Control8 23rd YLP OECF Pasig-Marikina River Channel and Environmental 2000 2003 117,000 Yen 1,167,000
Improvement Project (Detailed Engineering)9 23rd YLP OECF Mount Pinatubo Hazard Urgent Mitigation Project, 2000 2003 1,468,000 Yen 9,013,000
Phase II10 Special YLP OECF KAMANAVA Flood Control and Drainage System 2000 2004 * * *
Improvement ProjectTOTAL 7,711,556 USD 26,188
Yen 41,003,000
* Under NegotiationSource: BESF, 2000

ANNEX 3ONGOING DPWH-IMPLEMENTED FOREIGN-ASSISTED PROJECTS , 1997-1999
No. Loan (L)/ DONOR/ PROJECT TITLE PROJECT DURATION PROJECTGrant (G) CREDITOR (Revised) COSTNumber (Revised)
Start FinishPeso Loan/
Highways Counterpart Grant
1 PH-P95 OECF Metro Manila Urban Transport Project (MMUTP), 1990 1998 1,399,604 Yen 4,776,000 Phase II
2 PH-P102 OECF Metro Manila Interchange Construction Project I 1990 1997 256,004 Yen 2,304,000 (EDSA/Pasay Road - Ayala Avenue and Nagtahan - Ramon Magsaysay Avenue)
3 PH-P103 OECF Southern Tagalog Toll Expressway (STATE) Project, 1990 2000 1,102,991 Yen 4,238,000 Batangas
4 PH-P116 OECF Metro Manila Interchange Construction Project II 1992 1997 332,896 Yen 1,663,000 (EDSA/Boni Avenue, Pioneer St. and EDSA/Shaw Boulevard)
5 PH-P117 OECF Metro Manila Pavement Rehabilitation Project 1995 1997 406,204 Yen 1,795,0006 PH-P118 OECF Rural Roads Development Project I (Tarlac, Cavite, 1992 1999
Masbate & Bohol)7 PH-P131 OECF Second Mandaue-Mactan Bridge Const. Project II 1995 1999 759,000 Yen 6,872,0008 PH-P175 OECF Second Mandaue-Mactan Bridge Const. Project II and Metro 1997 2002 1,284,750 Yen 6,593,000
Cebu Road Project9 PH-P132 OECF Rosario-Pugo-Baguio Road Project (La Union and 1995 2000 512,562 Yen 4,633,000
Benguet10 PH-P145 OECF Philippine-Japan Friendship Highway Rehabilitation 1995 2000 1,827,541 Yen 9,620,000
Project I11 PH-P146 OECF Rehabilitation and Maintenance of Bridges along 1995 2000 408,340 Yen 4,616,000
Arterial Roads Project, Phase III12 PH-P147 OECF Arterial Roads Link Development Project, Phase I 1995 2001 1,292,578 Yen 11,754,00013 PH-P162 OECF Rural Roads Network Development Project, Phase II 1996 2003 1,040,720 Yen 12,895,00014 PH-P163 OECF Arterial Roads Link Development Project, Phase II 1996 2003 384,250 Yen 4,765,000
16 PH-P164 OECF Philippine-Japan Friendship Highway Rehabilitation 1996 2001 384,250 Yen 4,765,000 Project II
17 PH-P165 OECF Metro Manila Interchange Construction Project III 1996 2000 107,219 Yen 2,872,00018 PH-P186 OECF Metro Manila Interchange Construction Project IV 1998 2002 1,235,000 Yen 5,849,00019 PH-P174 OECF Philippine-Japan Friendship Highway Rehabilitation 1997 2002 640,250 Yen 7,683,000
Project III, Mindanao Section (Agusan-Davao)20 PH-P188 OECF Philippine-Japan Friendship Highway Improvement 1998 2003 1,291,570 Yen 13,564,000
Project in the Visayas, Region VIII (under ARLDP III)21 PH-P166 OECF Mount Pinatubo Hazard Urgent Mitigation Project, 1996 2001 734,280 Yen 6,911,000
Road Component (Tarlac and Pamapanga)22 1473 PHI/704-P ADB/OPEC/JEXIM Sixth Road Improvement Project 1997 2002 9,911,000 USD 167,000
UK USD 1,02523 3430 PH WB-IBRD Highway Management Project 1992 2000 2,640,000 USD 150,00024 DAN-94-2324 Australia/EFIC Rehabilitation and Upgrading of the Existing Metro 1996 2000 852,285 AUD 22,950
Manila Urban Traffic Control System into a "SMART" Traffic Signal System, Phase IV
25 FP VI France Installation of UninterruptedPower Supply for Traffic 1995 1997 31,589 FRF 10,000 Signalization System for Metro Manila
26 514-PHI Kuwait Second Kuwait-Assisted Mindanao Roads Improvement 640,120 KD 6,150,000 Project
27 Loan/Grant UK President's Bridge Program I 1996 1999Loan 881,710 UKP 13,320
Flood Control28 PH-P79 OECF Metro Manila Flood Control Project II (Balut, Vitas and 1994 1999 1,520,208 Yen 10,818,000
San Andres Pumping Stations)29 PH-P85 OECF Small Water Impounding Management Project 1988 1998 263,022 Yen 3,193,00030 PH-P87 OECF Lower Agusan Development Project, Stage I, Phase I, 1988 1999 295,770 Yen 3,372,000
Butuan City31 PH-P106 OECF Pampanga Delta Development Project 1990 2000 1,080,000 Yen 8,634,00032 PH-P155 OECF Agno and Allied Rivers Urgent Rehabilitation Project 1996 2002 607,260 Yen 8,312,00033 PH-P179 OECF Metro Manila Flood Control Project- West of 1997 2004 1,001,750 Yen 9,411,000
Manggahan Floodway)34 PH-P166 OECF Mount Pinatubo Hazard Urgent Mitigation Project, 1996 2001 734,280 Yen 6,911,000
Flood Control Component (Tarlac and Pampanga)35 PH-P180 OECF Lower Agusan Development Project, Stage I, Phase II, 1997 2003 688,170 Yen 7,979,000
Butuan City36 PH-P193 OECF Agno River Flood Control Project, Phase I 1998 1999 1,893,000 Yen 6,734,00037 PH-P192 OECF Iloilo Flood Control Project, Phase I 1998 1999 37,000 Yen 458,000
38 Grant JICA Flood Mitigation Project in Ormoc City (Phase I) 1999 2000 510,000 Yen 1,111,000
Water Supply39 1440/1441 PHI ADB Rural Water Supply and Sanitation Sector project 1997 2001 123,600 USD 27,500
Source of Basic Data: NEDA-PMS

ANNEX 4Ongoing DPWH-Implemented Foreign-Assisted Projects, 1997-1999Original and Revised Project Duration
No. Loan (L)/ DONOR/ PROJECT TITLE PROJECT DURATION PROJECT DURATION TargetGrant (G) CREDITOR (Original) (Revised) CompletionNumber Difference
Start Finish Start Finish (Years)OECF/JBIC
Highways
1 PH-P95 OECF/JBIC Metro Manila Urban Transport Project (MMUTP), 1990 1994 1990 1998 4 Phase II
2 PH-P102 OECF/JBIC Metro Manila Interchange Construction Project I 1990 1995 1990 1999 4 (EDSA/Pasay Road - Ayala Avenue and Nagtahan - Ramon Magsaysay Avenue)
3 PH-P103 OECF/JBIC Southern Tagalog Toll Expressway (STATE) Project, 1990 1994 1990 2000 6 Batangas
4 PH-P116 OECF/JBIC Metro Manila Interchange Construction Project II 1992 1996 1992 1998 2 (EDSA/Boni Avenue, Pioneer St. and EDSA/Shaw Boulevard)
5 PH-P117 OECF/JBIC Metro Manila Pavement Rehabilitation Project 1992 1995 1995 1999 46 PH-P118 OECF/JBIC Rural Roads Development Project I (Tarlac, Cavite, 1992 1996 1992 1999 3
Masbate & Bohol)7 PH-P131 OECF/JBIC Second Mandaue-Mactan Bridge Const. Project II 1995 1998 1995 1999 18 PH-P175 OECF/JBIC Second Mandaue-Mactan Bridge Const. Project II and Metro 1997 2001 1997 2002 1
Cebu Road Project9 PH-P132 OECF/JBIC Rosario-Pugo-Baguio Road Project (La Union and 1995 1998 1995 2000 2
Benguet10 PH-P145 OECF/JBIC Philippine-Japan Friendship Highway Rehabilitation 1995 1999 1995 2000 1
Project I11 PH-P146 OECF/JBIC Rehabilitation and Maintenance of Bridges along 1995 2001 1995 2001 0
Arterial Roads Project, Phase III12 PH-P147 OECF/JBIC Arterial Roads Link Development Project, Phase I 1995 1999 1995 2001 213 PH-P162 OECF/JBIC Rural Roads Network Development Project, Phase II 1996 2002 1996 200314 PH-P163 OECF/JBIC Arterial Roads Link Development Project, Phase II 1996 1999 1996 2003 415 PH-P164 OECF/JBIC Philippine-Japan Friendship Highway Rehabilitation 1996 2000 1996 2001 1
Project II16 PH-P165 OECF/JBIC Metro Manila Interchange Construction Project III 1996 1998 1996 2000 217 PH-P186 OECF/JBIC Metro Manila Interchange Construction Project IV 1999 2002 1999 2002 018 PH-P174 OECF/JBIC Philippine-Japan Friendship Highway Rehabilitation 1997 2001 1997 2002 1
Project III, Mindanao Section (Agusan-Davao)19 PH-P188 OECF/JBIC Philippine-Japan Friendship Highway Improvement 1998 2003 1998 2003 0
Project in the Visayas, Region VIII (under ARLDP III)20 PH-P166 OECF/JBIC Mount Pinatubo Hazard Urgent Mitigation Project, 1996 1999 1996 2001 2
Road Component (Tarlac and Pamapanga)21 1473 PHI/704-P ADB/OPEC/JEXIM Sixth Road Improvement Project 1997 2002 1997 2002 0
UK 1997 1998 1997 1999 122 3430 PH WB-IBRD Highway Management Project 1992 1999 1992 2000 123 DAN-94-2324 Australia/EFIC Rehabilitation and Upgrading of the Existing Metro 1996 2000 1996 2004 4
Manila Urban Traffic Control System into a "SMART" Traffic Signal System, Phase IV
24 FP VI France Installation of UninterruptedPower Supply for Traffic 1997 1998 1997 1998 0 Signalization System for Metro Manila
25 514-PHI Kuwait Second Kuwait-Assisted Mindanao Roads Improvement 1999 2003 1999 2003 0 Project
26 Loan/Grant UK President's Bridge Program I 1997 1998 1997 1999 1Flood Control
27 PH-P79 OECF/JBIC Metro Manila Flood Control Project II (Balut, Vitas and 1990 1994 1990 1999 5 San Andres Pumping Stations)
28 PH-P85 OECF/JBIC Small Water Impounding Management Project 1988 1992 1988 1998 629 PH-P87 OECF/JBIC Lower Agusan Development Project, Stage I, Phase I, 1988 1993 1988 1999 6
Butuan City30 PH-P106 OECF/JBIC Pampanga Delta Development Project 1990 1997 1990 2000 331 PH-P155 OECF/JBIC Agno and Allied Rivers Urgent Rehabilitation Project 1996 2002 1996 2002 032 PH-P179 OECF/JBIC Metro Manila Flood Control Project- West of 1997 2003 1997 2004 1
Manggahan Floodway)33 PH-P166 OECF/JBIC Mount Pinatubo Hazard Urgent Mitigation Project, 1996 1999 1996 2001 2
Flood Control Component (Tarlac and Pampanga)34 PH-P180 OECF/JBIC Lower Agusan Development Project, Stage I, Phase II, 1997 2002 1997 2003 1
Butuan City35 PH-P193 OECF/JBIC Agno River Flood Control Project, Phase I 1998 2002 1998 2002 036 PH-P192 OECF/JBIC Iloilo Flood Control Project, Phase I 1998 2000 1998 2002 2
37 Grant JICA Flood Mitigation Project in Ormoc City (Phase I) 1998 1999 1999 2000 1
Water Supply38 1440/1441 PHI ADB Rural Water Supply and Sanitation Sector project 1997 2001 1997 2001 0
Intersectoral3455-PH WB-IBRD Third Municipal Development Project 1993 1999 1993 1999 0
Source of Basic Data: NEDA-PMS

ANNEX 5Ongoing DPWH-Implemented Foreign-Assisted Projects, 1997-1999Budget Performance on Net Commitment(Summary of Absorptive Capacity Indices)
6th OPR 7th OPR 8th OPRNo. Loan (L)/ DONOR/ PROJECT TITLE UI AI DB TI UI AI DB TI UI AI DB TI
Grant (G) CREDITOR % % ($M) % % % ($M) % % % ($M) %
NumberTOTAL 22.1 56.9 324.9 32.9 61.5 351.8 40.0 60.0 456.4
Highways 20.3 55.1 244.2 31.5 56.8 306.2 45.5 60.0 405.4
1 PH-P95 OECF/JBIC Metro Manila Urban Transport Project (MMUTP), 48.7 70.0 9.1 133.3 69.1 69.0 10.9 150.0 Phase II
2 PH-P102 OECF/JBIC Metro Manila Interchange Construction Project I 88.0 97.4 0.5 146.7 100.0 100.0 0.0 166.7 (EDSA/Pasay Road - Ayala Avenue and Nagtahan - Ramon Magsaysay Avenue)
3 PH-P103 OECF/JBIC Southern Tagalog Toll Expressway (STATE) Project, 50.0 65.0 10.4 122.2 61.8 84.1 3.6 138.9 67.7 85.9 3.7 155.6 Batangas
4 PH-P116 OECF/JBIC Metro Manila Interchange Construction Project II 64.7 64.9 5.3 98.6 87.8 93.8 0.7 115.3 (EDSA/Boni Avenue, Pioneer St. and EDSA/Shaw Boulevard)
5 PH-P117 OECF/JBIC Metro Manila Pavement Rehabilitation Project 48.2 79.0 2.1 118.3 70.1 70.1 3.9 138.36 PH-P118 OECF/JBIC Rural Roads Development Project I (Tarlac, Cavite, 62.3 82.8 6.2 118.3 73.2 75.7 9.1 138.3 91.6 100.0 0.0 158.3
Masbate & Bohol)7 PH-P131 OECF/JBIC Second Mandaue-Mactan Bridge Const. Project II 76.4 102.1 -1.0 53.6 91.9 95.7 2.1 67.9 94.5 94.5 3.0 82.18 PH-P175 OECF/JBIC Second Mandaue-Mactan Bridge Const. Project II and Metro 0.0 0.0 37.7 3.6 3.8 9.3 18.1 17.9 53.9 68.8 12.7 32.1
Cebu Road Project9 PH-P132 OECF/JBIC Rosario-Pugo-Baguio Road Project (La Union and 10.0 13.8 26.2 53.6 91.9 95.7 2.1 67.9 39.2 39.2 22.2 82.1
Benguet10 PH-P145 OECF/JBIC Philippine-Japan Friendship Highway Rehabilitation 28.6 164.1 -9.8 29.2 63.0 145.2 -13.9 41.7 73.1 97.7 1.3 54.2
Project I11 PH-P146 OECF/JBIC Rehabilitation and Maintenance of Bridges along 21.6 113.8 -1.1 29.2 59.0 139.7 -5.7 41.7 82.4 122.4 -5.5 54.2
Arterial Roads Project, Phase III12 PH-P147 OECF/JBIC Arterial Roads Link Development Project, Phase I 22.8 40.3 36.2 38.9 47.1 51.1 39.0 55.6 64.1 64.1 33.2 72.213 PH-P162 OECF/JBIC Rural Roads Network Development Project, Phase II 1.4 32.1 3.6 17.9 4.0 15.7 20.6 32.1 5.0 8.3 56.5 46.414 PH-P163 OECF/JBIC Arterial Roads Link Development Project, Phase II 2.3 9.3 9.7 20.8 10.5 15.4 20.2 37.5 28.3 29.7 25.1 54.215 PH-P164 OECF/JBIC Philippine-Japan Friendship Highway Rehabilitation 5.4 31.5 10.2 17.9 11.2 25.7 22.7 32.1 26.7 36.6 34.8 46.4
Project II16 PH-P165 OECF/JBIC Metro Manila Interchange Construction Project III 7.9 9.1 20.9 31.3 24.9 24.8 15.9 56.3 34.1 34.1 14.9 81.317 PH-P186 OECF/JBIC Metro Manila Interchange Construction Project IV 0.0 0.0 0.0 0.0 0.0 0.0 11.4 13.318 PH-P174 OECF/JBIC Philippine-Japan Friendship Highway Rehabilitation 0.0 0.0 5.1 3.6 2.1 14.4 7.2 17.9 3.3 6.6 28.4 32.1
Project III, Mindanao Section (Agusan-Davao)19 PH-P188 OECF/JBIC Philippine-Japan Friendship Highway Improvement 0.0 0.0 0.0 0.0 0.0 0.0 0.6 9.5
Project in the Visayas, Region VIII (under ARLDP III)20 PH-P166 OECF/JBIC Mount Pinatubo Hazard Urgent Mitigation Project, 2.0 12.2 8.6 23.3 37.1 71.3 7.6 43.3 60.8 67.1 16.2 63.3
Road Component (Tarlac and Pamapanga)21 1473 PHI/704-PADB/OPEC/JEXIM Sixth Road Improvement Project 2.2 12.7 24.8 16.7 7.7 19.8 52.4 38.9
UK22 3430 PH WB-IBRD Highway Management Project 46.1 54.7 57.3 75.0 68.4 70.9 42.2 89.3 87.5 105.0 -6.2 103.623 DAN-94-2324Australia/EFIC Rehabilitation and Upgrading of the Existing Metro 0.0 0.0 0.0 0.0 0.0 0.0 0.0 122.0
Manila Urban Traffic Control System into a "SMART" Traffic Signal System, Phase IV
24 FP VI France Installation of UninterruptedPower Supply for Traffic 100.0 100.0 0.0 137.9 Signalization System for Metro Manila
25 514-PHI Kuwait Second Kuwait-Assisted Mindanao Roads Improvement 0.0 0.0 0.0 1.6 0.0 0.0 0.0 Project
26 Loan/Grant UK President's Bridge Program I 100.0 100.0 0.0 104.2 100.0 100.0 0.0 104.2
Flood Control 27.6 61.7 80.7 37.1 77.8 45.6 20.3 59.8 51.0
27 PH-P79 OECF/JBIC Metro Manila Flood Control Project II (Balut, Vitas and 55.0 67.0 26.6 134.5 100.0 100.0 0.0 148.8 San Andres Pumping Stations)
28 PH-P85 OECF/JBIC Small Water Impounding Management Project 67.8 79.4 5.1 134.5 79.5 83.0 3.8 148.829 PH-P87 OECF/JBIC Lower Agusan Development Project, Stage I, Phase I, 32.9 51.3 9.6 134.5 47.3 54.5 9.8 148.8 66.5 80.5 4.3 163.1
Butuan City30 PH-P106 OECF/JBIC Pampanga Delta Development Project 56.6 56.6 34.1 91.7 62.6 84.2 7.5 104.2 67.8 97.5 1.2 99.031 PH-P155 OECF/JBIC Agno and Allied Rivers Urgent Rehabilitation Project 2.0 40.5 2.2 13.9 2.8 13.8 10.6 25.0 10.2 23.7 21.6 36.132 PH-P179 OECF/JBIC Metro Manila Flood Control Project- West of 0.0 0.0 1.1 2.8 2.1 29.1 3.5 13.9 3.1 15.1 12.9 25.0
Manggahan Floodway)33 PH-P166 OECF/JBIC Mount Pinatubo Hazard Urgent Mitigation Project, 2.0 12.2 8.6 23.3 37.1 71.3 7.6 43.3 60.8 67.1 16.2 63.3
Flood Control Component (Tarlac and Pampanga)34 PH-P180 OECF/JBIC Lower Agusan Development Project, Stage I, Phase II, 0.0 0.0 2.0 3.1 2.1 30.7 2.8 15.6 4.8 25.6 8.7 28.1
Butuan City35 PH-P193 OECF/JBIC Agno River Flood Control Project, Phase I 0.0 0.0 0.0 0.0 0.0 0.0 1.1 8.336 PH-P192 OECF/JBIC Iloilo Flood Control Project, Phase I 0.0 0.0 0.0 0.0 0.0 0.0 1.2 22.2
37 Grant JICA Flood Mitigation Project in Ormoc City (Phase I) 0.0 0.0 0.0 0.0
Water Supply 0.5 2.6 3.7 19.6 13.4 29.8 11.3 43.138 1440 PHI ADB Rural Water Supply and Sanitation Sector project 0.5 2.6 3.7 19.6 13.0 28.9 5.9 43.1
1441 PHI 0.0 0.0 3.7 19.6 13.8 30.8 5.4 43.1Urban Infrastructure3455-PH WB-IBRD Third Municipal Development Project 66.9 86.7 7.0 103.7
Source of Basic Data: NEDA-PMS

ANNEX 6Ongoing DPWH-Implemented Foreign-Assisted Projects, 1997-1999Original and Revised Project Cost / Cost Overrun / Timeliness Index
No. Loan (L)/ DONOR/ PROJECT TITLE COST OVERRUN TIGrant (G) CREDITOR Original RevisedNumber (P M) (P M) (P M) Ratio
GRAND TOTAL Total 99,488.782 109,127.432 9,638.650 1.097LP/GP 67,404.789 68,740.577 1,335.788 1.020GOP 32,083.993 40,386.855 8,302.862 1.259
Highways1 PH-P95 OECF/JBIC Metro Manila Urban Transport Project (MMUTP), Total 1,246.725 2,312.605 1,065.880 1.855 150.0
Phase II LP/GP 758.190 913.001 154.811 1.204GOP 488.535 1,399.604 911.069 2.865
2 PH-P102 OECF/JBIC Metro Manila Interchange Construction Project I Total 495.482 833.767 338.285 1.683 166.7 (EDSA/Pasay Road - Ayala Avenue and Nagtahan - LP/GP 371.610 577.763 206.153 1.555 Ramon Magsaysay Avenue) GOP 123.872 256.004 132.132 2.067
3 PH-P103 OECF/JBIC Southern Tagalog Toll Expressway (STATE) Project, Total 975.900 2,244.226 1,268.326 2.300 155.6 Batangas LP/GP 683.600 1,001.271 317.671 1.465
GOP 292.300 1,242.955 950.655 4.252
4 PH-P116 OECF/JBIC Metro Manila Interchange Construction Project II Total 326.176 739.010 412.834 2.266 115.3 (EDSA/Boni Avenue, Pioneer St. and EDSA/Shaw LP/GP 244.559 406.114 161.555 1.661 Boulevard) GOP 81.617 332.896 251.279 4.079
5 PH-P117 OECF/JBIC Metro Manila Pavement Rehabilitation Project Total 351.795 749.396 397.601 2.130 138.3LP/GP 263.970 425.914 161.944 1.613GOP 87.825 323.482 235.657 3.683
6 PH-P118 OECF/JBIC Rural Roads Development Project I (Tarlac, Cavite, Total 1,032.000 1,923.827 891.827 1.864 158.3 Masbate & Bohol) LP/GP 774.410 1,307.200 532.790 1.688
GOP 257.590 616.627 359.037 2.394
7 PH-P131 OECF/JBIC Second Mandaue-Mactan Bridge Const. Project II Total 1,833.000 4,344.395 2,511.395 2.370 82.1LP/GP 1,718.000 3,346.113 1,628.113 1.948GOP 115.000 998.282 883.282 8.681
8 PH-P175 OECF/JBIC Second Mandaue-Mactan Bridge Const. Project II and Metro Total 2,933.000 2,933.000 0.000 1.000 32.1 Cebu Road Project LP/GP 1,648.250 1,648.250 0.000 1.000
GOP 1,284.750 1,284.750 0.000 1.000
9 PH-P132 OECF/JBIC Rosario-Pugo-Baguio Road Project (La Union and Total 1,235.000 1,397.792 162.792 1.132 82.1 Benguet LP/GP 926.600 1,087.353 160.753 1.173
GOP 308.400 310.439 2.039 1.007
10 PH-P145 OECF/JBIC Philippine-Japan Friendship Highway Rehabilitation Total 3,412.000 4,164.413 752.413 1.221 54.2 Project I LP/GP 2,558.510 2,382.445 -176.065 0.931
GOP 853.490 1,781.968 928.478 2.088
11 PH-P146 OECF/JBIC Rehabilitation and Maintenance of Bridges along Total 1,636.000 1,726.382 90.382 1.055 72.2 Arterial Roads Project, Phase III LP/GP 1,227.660 1,120.620 -107.040 0.913
GOP 408.340 605.764 197.424 1.483
12 PH-P147 OECF/JBIC Arterial Roads Link Development Project, Phase I Total 4,168.004 2,335.230 -1,832.774 0.560 46.4LP/GP 3,126.064 1,460.197 -1,665.867 0.467GOP 1,041.940 875.033 -166.907 0.840
13 PH-P162 OECF/JBIC Rural Roads Network Development Project, Phase II Total 4,163.000 4,907.550 744.550 1.179 46.4LP/GP 3,122.280 3,708.950 586.670 1.188GOP 1,040.720 1,198.600 157.880 1.152
14 PH-P163 OECF/JBIC Arterial Roads Link Development Project, Phase II Total 1,538.003 1,928.081 390.078 1.254 54.2LP/GP 1,153.753 1,454.750 300.997 1.261GOP 384.250 473.331 89.081 1.232
15 PH-P164 OECF/JBIC Philippine-Japan Friendship Highway Rehabilitation Total 3,083.001 3,039.024 -43.977 0.986 46.4 Project II LP/GP 2,312.591 2,364.532 51.941 1.022
GOP 770.410 674.492 -95.918 0.875
16 PH-P165 OECF/JBIC Metro Manila Interchange Construction Project III Total 927.400 819.678 -107.722 0.884 81.3LP/GP 695.400 712.459 17.059 1.025GOP 232.000 107.219 -124.781 0.462
17 PH-P186 OECF/JBIC Metro Manila Interchange Construction Project IV Total 2,906.000 2,906.000 0.000 1.000 13.3LP/GP 1,671.000 1,671.000 0.000 1.000GOP 1,235.000 1,235.000 0.000 1.000
18 PH-P174 OECF/JBIC Philippine-Japan Friendship Highway Rehabilitation Total 2,561.000 2,191.630 -369.370 0.856 32.1 Project III, Mindanao Section (Agusan-Davao) LP/GP 1,920.750 1,520.066 -400.684 0.791
GOP 640.250 671.564 31.314 1.049
19 PH-P188 OECF/JBIC Philippine-Japan Friendship Highway Improvement Total 5,162.000 5,167.000 5.000 1.001 9.5 Project in the Visayas, Region VIII (under ARLDP III) LP/GP 3,391.000 3,391.000 0.000 1.000
GOP 1,776.000 1,776.000 0.000 1.000
20 PH-P166 OECF/JBIC Mount Pinatubo Hazard Urgent Mitigation Project, Total 2,304.000 2,405.000 101.000 1.044 63.3 Road Component (Tarlac and Pamapanga) LP/GP 1,770.000 1,835.740 65.740 1.037
GOP 534.000 569.430 35.430 1.066
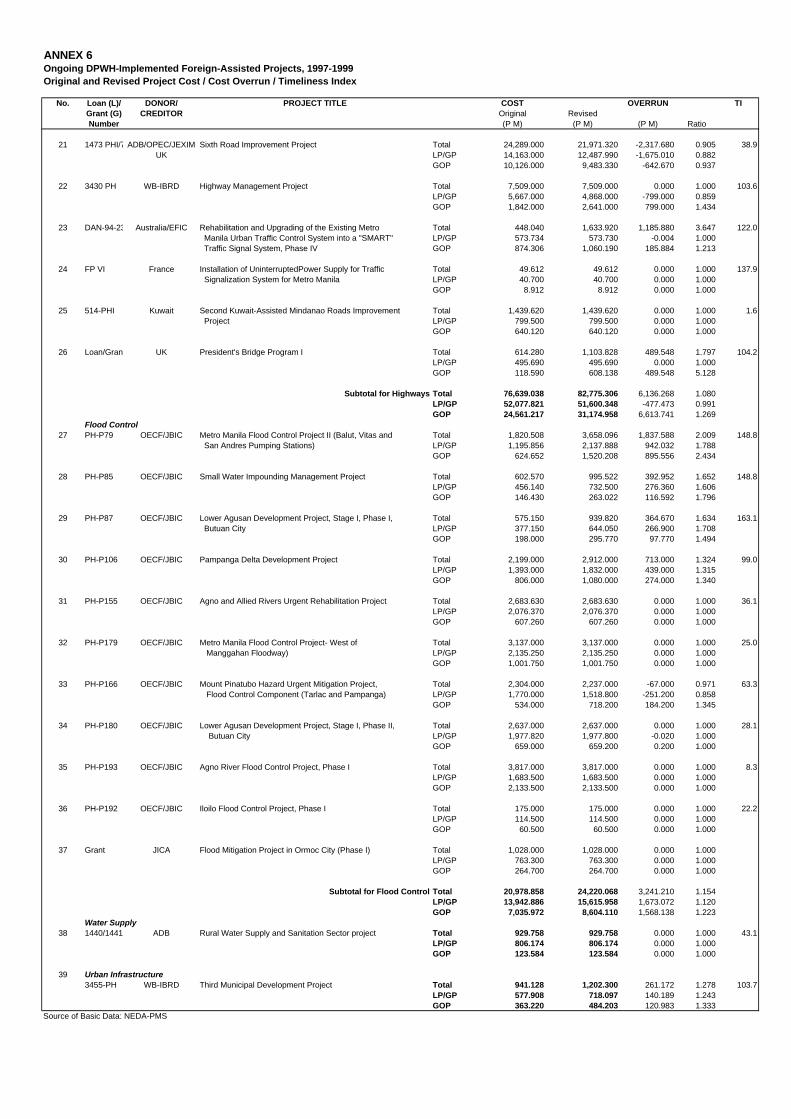
ANNEX 6Ongoing DPWH-Implemented Foreign-Assisted Projects, 1997-1999Original and Revised Project Cost / Cost Overrun / Timeliness Index
No. Loan (L)/ DONOR/ PROJECT TITLE COST OVERRUN TIGrant (G) CREDITOR Original RevisedNumber (P M) (P M) (P M) Ratio
21 1473 PHI/704-PADB/OPEC/JEXIM Sixth Road Improvement Project Total 24,289.000 21,971.320 -2,317.680 0.905 38.9UK LP/GP 14,163.000 12,487.990 -1,675.010 0.882
GOP 10,126.000 9,483.330 -642.670 0.937
22 3430 PH WB-IBRD Highway Management Project Total 7,509.000 7,509.000 0.000 1.000 103.6LP/GP 5,667.000 4,868.000 -799.000 0.859GOP 1,842.000 2,641.000 799.000 1.434
23 DAN-94-2324 Australia/EFIC Rehabilitation and Upgrading of the Existing Metro Total 448.040 1,633.920 1,185.880 3.647 122.0 Manila Urban Traffic Control System into a "SMART" LP/GP 573.734 573.730 -0.004 1.000 Traffic Signal System, Phase IV GOP 874.306 1,060.190 185.884 1.213
24 FP VI France Installation of UninterruptedPower Supply for Traffic Total 49.612 49.612 0.000 1.000 137.9 Signalization System for Metro Manila LP/GP 40.700 40.700 0.000 1.000
GOP 8.912 8.912 0.000 1.000
25 514-PHI Kuwait Second Kuwait-Assisted Mindanao Roads Improvement Total 1,439.620 1,439.620 0.000 1.000 1.6 Project LP/GP 799.500 799.500 0.000 1.000
GOP 640.120 640.120 0.000 1.000
26 Loan/Grant UK President's Bridge Program I Total 614.280 1,103.828 489.548 1.797 104.2LP/GP 495.690 495.690 0.000 1.000GOP 118.590 608.138 489.548 5.128
Subtotal for Highways Total 76,639.038 82,775.306 6,136.268 1.080LP/GP 52,077.821 51,600.348 -477.473 0.991GOP 24,561.217 31,174.958 6,613.741 1.269
Flood Control27 PH-P79 OECF/JBIC Metro Manila Flood Control Project II (Balut, Vitas and Total 1,820.508 3,658.096 1,837.588 2.009 148.8
San Andres Pumping Stations) LP/GP 1,195.856 2,137.888 942.032 1.788GOP 624.652 1,520.208 895.556 2.434
28 PH-P85 OECF/JBIC Small Water Impounding Management Project Total 602.570 995.522 392.952 1.652 148.8LP/GP 456.140 732.500 276.360 1.606GOP 146.430 263.022 116.592 1.796
29 PH-P87 OECF/JBIC Lower Agusan Development Project, Stage I, Phase I, Total 575.150 939.820 364.670 1.634 163.1 Butuan City LP/GP 377.150 644.050 266.900 1.708
GOP 198.000 295.770 97.770 1.494
30 PH-P106 OECF/JBIC Pampanga Delta Development Project Total 2,199.000 2,912.000 713.000 1.324 99.0LP/GP 1,393.000 1,832.000 439.000 1.315GOP 806.000 1,080.000 274.000 1.340
31 PH-P155 OECF/JBIC Agno and Allied Rivers Urgent Rehabilitation Project Total 2,683.630 2,683.630 0.000 1.000 36.1LP/GP 2,076.370 2,076.370 0.000 1.000GOP 607.260 607.260 0.000 1.000
32 PH-P179 OECF/JBIC Metro Manila Flood Control Project- West of Total 3,137.000 3,137.000 0.000 1.000 25.0 Manggahan Floodway) LP/GP 2,135.250 2,135.250 0.000 1.000
GOP 1,001.750 1,001.750 0.000 1.000
33 PH-P166 OECF/JBIC Mount Pinatubo Hazard Urgent Mitigation Project, Total 2,304.000 2,237.000 -67.000 0.971 63.3 Flood Control Component (Tarlac and Pampanga) LP/GP 1,770.000 1,518.800 -251.200 0.858
GOP 534.000 718.200 184.200 1.345
34 PH-P180 OECF/JBIC Lower Agusan Development Project, Stage I, Phase II, Total 2,637.000 2,637.000 0.000 1.000 28.1 Butuan City LP/GP 1,977.820 1,977.800 -0.020 1.000
GOP 659.000 659.200 0.200 1.000
35 PH-P193 OECF/JBIC Agno River Flood Control Project, Phase I Total 3,817.000 3,817.000 0.000 1.000 8.3LP/GP 1,683.500 1,683.500 0.000 1.000GOP 2,133.500 2,133.500 0.000 1.000
36 PH-P192 OECF/JBIC Iloilo Flood Control Project, Phase I Total 175.000 175.000 0.000 1.000 22.2LP/GP 114.500 114.500 0.000 1.000GOP 60.500 60.500 0.000 1.000
37 Grant JICA Flood Mitigation Project in Ormoc City (Phase I) Total 1,028.000 1,028.000 0.000 1.000LP/GP 763.300 763.300 0.000 1.000GOP 264.700 264.700 0.000 1.000
Subtotal for Flood Control Total 20,978.858 24,220.068 3,241.210 1.154LP/GP 13,942.886 15,615.958 1,673.072 1.120GOP 7,035.972 8,604.110 1,568.138 1.223
Water Supply38 1440/1441 PHI ADB Rural Water Supply and Sanitation Sector project Total 929.758 929.758 0.000 1.000 43.1
LP/GP 806.174 806.174 0.000 1.000GOP 123.584 123.584 0.000 1.000
39 Urban Infrastructure3455-PH WB-IBRD Third Municipal Development Project Total 941.128 1,202.300 261.172 1.278 103.7
LP/GP 577.908 718.097 140.189 1.243GOP 363.220 484.203 120.983 1.333
Source of Basic Data: NEDA-PMS

Annex 7A. Absorptive Capacity Indices, By program/project/region, 1996Department of Public Works and Highways
Loan/Grant No. Reference No. Item BPI AUI ApUI OACI
Reference A. Programs 1.0316 0.9254 0.9547 0.8970
A.I General Administration and Support 1.9563 0.5816 1.1379 0.2973
A.II Support to Operations 0.9698 0.9531 0.9243 0.9827
A.II.a Policy Formulation, Program Planning and Standards Development 0.9865 0.9588 0.9458 0.9719
A.II.b Operation and management of the Infra Computer Center 1.0903 0.6532 0.7122 0.5991
A.II.c Operation and Management of the Traffic Engineering Center 0.9075 1.0000 0.9075 1.1019
A.II.d Regional Support (Planning and Design, Construction, Maintenance and material Quality Control and Hydrology Divisions) 0.9421 1.0085 0.9501 1.0704
A.II.e Operational Support for the Maintenance and Repair of Infrastructure Facilities and Other Related Activities 0.9403 1.0001 0.9404 1.0636
A.III Operations 0.9665 0.9757 0.9430 1.0096
A.III.a Construction, Maintenance, Repair and Rehabilitation of Infra Facilties 0.7906 0.9101 0.7195 1.1512
A.III.b Maintenance, Repair and Rehabilitation of Infrastructure Facilities 0.9864 0.9784 0.9651 0.9919
A.III.c Operational Support in the Maintenance and Repair of the Infrastructure Facilities and Other Related Activities of District/City Engg. Offices 0.9824 0.9952 0.9777 1.0130
A.III.d Operational Support in the Maintenance and Repair of the Infrastructure Facilities and Other Equipment including Replacement of Parts, Regional Depot/base Shops and Area Shops 1.0470 1.0011 1.0481 0.9561
B. Projects
1. Locally-Funded Projects 1.1540 0.5256 0.6065 0.4554
B.1.a. a. Highways (Roads and Bridges) Projects under R.A. No. 8150 0.9788 0.7205 0.7052 0.7360
B.1.a.1 NCR 1.1967 0.5732 0.6859 0.4790
B.1.a.2 Region I 0.9356 0.9074 0.8490 0.9698
B.1.a.3 CAR 0.1564 0.9927 0.1553 6.3460
B.1.a.4 Region II 0.4874 0.9083 0.4428 1.8635
B.1.a.5 Region III 0.7148 0.9836 0.7030 1.3761
B.1.a.6 Region IV-A 0.8823 0.5125 0.4522 0.5809
B.1.a.7 Region IV-B 0.9772 0.9022 0.8816 0.9232
B.1.a.8 Region V 0.9516 0.9218 0.8772 0.9687
B.1.a.9 Region VI 0.9299 0.8906 0.8281 0.9577
B.1.a.10 Region VII 0.9311 0.8408 0.7829 0.9030
B.1.a.11 Region VIII 0.9588 0.7918 0.7592 0.8258
B.1.a.12 Region IX 0.9276 0.6673 0.6190 0.7194
B.1.a.13 Region X 0.8751 0.7829 0.6851 0.8947
B.1.a.14 Region XI 1.1007 0.8984 0.9889 0.8163
B.1.a.15.a Region XII- Main Region 0.9520 0.7674 0.7306 0.8061
B.1.a.15.b Region XII- ARMM 0.9453 0.7537 0.7124 0.7973
B.1.a.16 Nationwide 1.2384 0.5659 0.7008 0.4570
B.1.b b. Flood Control and Drainage Projects under RA No. 8150 0.9608 0.8294 0.7969 0.8632
B.1.b.1 NCR 0.4009 0.8668 0.3475 2.1621
B.1.b.2 Region I 0.8834 0.9419 0.8321 1.0662
B.1.b.3 CAR 0.8514 0.9537 0.8120 1.1202
B.1.b.4 Region II 0.8954 0.8432 0.7550 0.9417
B.1.b.5 Region III 1.0079 0.9844 0.9922 0.9767
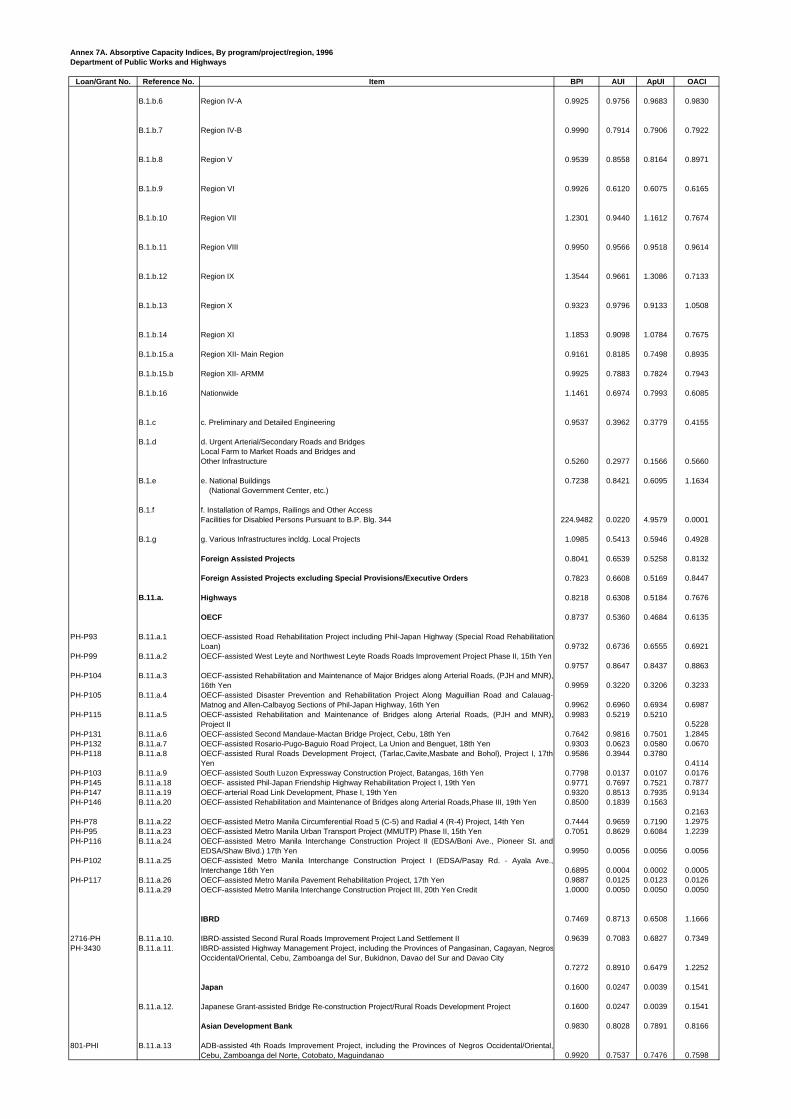
Annex 7A. Absorptive Capacity Indices, By program/project/region, 1996Department of Public Works and Highways
Loan/Grant No. Reference No. Item BPI AUI ApUI OACI
B.1.b.6 Region IV-A 0.9925 0.9756 0.9683 0.9830
B.1.b.7 Region IV-B 0.9990 0.7914 0.7906 0.7922
B.1.b.8 Region V 0.9539 0.8558 0.8164 0.8971
B.1.b.9 Region VI 0.9926 0.6120 0.6075 0.6165
B.1.b.10 Region VII 1.2301 0.9440 1.1612 0.7674
B.1.b.11 Region VIII 0.9950 0.9566 0.9518 0.9614
B.1.b.12 Region IX 1.3544 0.9661 1.3086 0.7133
B.1.b.13 Region X 0.9323 0.9796 0.9133 1.0508
B.1.b.14 Region XI 1.1853 0.9098 1.0784 0.7675
B.1.b.15.a Region XII- Main Region 0.9161 0.8185 0.7498 0.8935
B.1.b.15.b Region XII- ARMM 0.9925 0.7883 0.7824 0.7943
B.1.b.16 Nationwide 1.1461 0.6974 0.7993 0.6085
B.1.c c. Preliminary and Detailed Engineering 0.9537 0.3962 0.3779 0.4155
B.1.d d. Urgent Arterial/Secondary Roads and BridgesLocal Farm to Market Roads and Bridges andOther Infrastructure 0.5260 0.2977 0.1566 0.5660
B.1.e e. National Buildings 0.7238 0.8421 0.6095 1.1634 (National Government Center, etc.)
B.1.f f. Installation of Ramps, Railings and Other AccessFacilities for Disabled Persons Pursuant to B.P. Blg. 344 224.9482 0.0220 4.9579 0.0001
B.1.g g. Various Infrastructures incldg. Local Projects 1.0985 0.5413 0.5946 0.4928
Foreign Assisted Projects 0.8041 0.6539 0.5258 0.8132
Foreign Assisted Projects excluding Special Provisions/Executive Orders 0.7823 0.6608 0.5169 0.8447
B.11.a. Highways 0.8218 0.6308 0.5184 0.7676
OECF 0.8737 0.5360 0.4684 0.6135
PH-P93 B.11.a.1 OECF-assisted Road Rehabilitation Project including Phil-Japan Highway (Special Road RehabilitationLoan) 0.9732 0.6736 0.6555 0.6921
PH-P99 B.11.a.2 OECF-assisted West Leyte and Northwest Leyte Roads Roads Improvement Project Phase II, 15th Yen0.9757 0.8647 0.8437 0.8863
PH-P104 B.11.a.3 OECF-assisted Rehabilitation and Maintenance of Major Bridges along Arterial Roads, (PJH and MNR),16th Yen 0.9959 0.3220 0.3206 0.3233
PH-P105 B.11.a.4 OECF-assisted Disaster Prevention and Rehabilitation Project Along Maguillian Road and Calauag-Matnog and Allen-Calbayog Sections of Phil-Japan Highway, 16th Yen 0.9962 0.6960 0.6934 0.6987
PH-P115 B.11.a.5 OECF-assisted Rehabilitation and Maintenance of Bridges along Arterial Roads, (PJH and MNR),Project II
0.9983 0.5219 0.52100.5228
PH-P131 B.11.a.6 OECF-assisted Second Mandaue-Mactan Bridge Project, Cebu, 18th Yen 0.7642 0.9816 0.7501 1.2845PH-P132 B.11.a.7 OECF-assisted Rosario-Pugo-Baguio Road Project, La Union and Benguet, 18th Yen 0.9303 0.0623 0.0580 0.0670PH-P118 B.11.a.8 OECF-assisted Rural Roads Development Project, (Tarlac,Cavite,Masbate and Bohol), Project I, 17th
Yen 0.9586 0.3944 0.3780
0.4114PH-P103 B.11.a.9 OECF-assisted South Luzon Expressway Construction Project, Batangas, 16th Yen 0.7798 0.0137 0.0107 0.0176PH-P145 B.11.a.18 OECF- assisted Phil-Japan Friendship Highway Rehabilitation Project I, 19th Yen 0.9771 0.7697 0.7521 0.7877PH-P147 B.11.a.19 OECF-arterial Road Link Development, Phase I, 19th Yen 0.9320 0.8513 0.7935 0.9134PH-P146 B.11.a.20 OECF-assisted Rehabilitation and Maintenance of Bridges along Arterial Roads,Phase III, 19th Yen 0.8500 0.1839 0.1563
0.2163PH-P78 B.11.a.22 OECF-assisted Metro Manila Circumferential Road 5 (C-5) and Radial 4 (R-4) Project, 14th Yen 0.7444 0.9659 0.7190 1.2975PH-P95 B.11.a.23 OECF-assisted Metro Manila Urban Transport Project (MMUTP) Phase II, 15th Yen 0.7051 0.8629 0.6084 1.2239PH-P116 B.11.a.24 OECF-assisted Metro Manila Interchange Construction Project II (EDSA/Boni Ave., Pioneer St. and
EDSA/Shaw Blvd.) 17th Yen 0.9950 0.0056 0.0056 0.0056PH-P102 B.11.a.25 OECF-assisted Metro Manila Interchange Construction Project I (EDSA/Pasay Rd. - Ayala Ave.,
Interchange 16th Yen 0.6895 0.0004 0.0002 0.0005PH-P117 B.11.a.26 OECF-assisted Metro Manila Pavement Rehabilitation Project, 17th Yen 0.9887 0.0125 0.0123 0.0126
B.11.a.29 OECF-assisted Metro Manila Interchange Construction Project III, 20th Yen Credit 1.0000 0.0050 0.0050 0.0050
IBRD 0.7469 0.8713 0.6508 1.1666
2716-PH B.11.a.10. IBRD-assisted Second Rural Roads Improvement Project Land Settlement II 0.9639 0.7083 0.6827 0.7349PH-3430 B.11.a.11. IBRD-assisted Highway Management Project, including the Provinces of Pangasinan, Cagayan, Negros
Occidental/Oriental, Cebu, Zamboanga del Sur, Bukidnon, Davao del Sur and Davao City0.7272 0.8910 0.6479 1.2252
Japan 0.1600 0.0247 0.0039 0.1541
B.11.a.12. Japanese Grant-assisted Bridge Re-construction Project/Rural Roads Development Project 0.1600 0.0247 0.0039 0.1541
Asian Development Bank 0.9830 0.8028 0.7891 0.8166
801-PHI B.11.a.13 ADB-assisted 4th Roads Improvement Project, including the Provinces of Negros Occidental/Oriental,Cebu, Zamboanga del Norte, Cotobato, Maguindanao 0.9920 0.7537 0.7476 0.7598

Annex 7A. Absorptive Capacity Indices, By program/project/region, 1996Department of Public Works and Highways
Loan/Grant No. Reference No. Item BPI AUI ApUI OACI
1058-PHI B.11.a.14 ADB-assisted 5th Roads Improvement Project, including the Provinces of Nueva Vizcaya, Laguna,Quezon, Masbate, Zamboanga del Sur/Norte 0.9935 0.6863 0.6819 0.6908
PH-P1033-PHI/ PH-P1034-PHI B.11.a.15 ADB-assisted Palawan Integrated Area Development Project Road Component 0.9280 0.7914 0.7345 0.8528PH-P 915-PHI B.11.a.16 ADB-Sorsogon Integrated Area Development Project, Road Component 0.9693 0.8039 0.7792 0.82931163-PHI (SF) B.11.a.21 ADB-assisted Mt. Pinatubo Rehabilitation Program 1.0000 0.9036 0.9036 0.9036
ADB/IBRD 0.9950 0.5511 0.5483 0.5539
ADB Loan No.1053 PHI (SF) andIBRD Loan No.3262-PH
B.11.a.17 ADB/IBRD-assisted Earthquake Reconstruction Project, Bridge (Seismic) Retrofitting Program andother Related Activities
0.9950 0.5511 0.5483 0.5539
TEAM 0.0050 1.0000 0.0050 200.0000
PH-P86 B.11.a.27 Traffic Engineering and Management (TEAM) Phase III, 14th Yen 0.0050 1.0000 0.0050 200.0000
French 0.0050 0.5206 0.0026 104.1118
B.11.a.28 Installation of Uninterrupted Power Supply for Traffic Signalization System, Metro Manila, FrenchProtocol 0.0050 0.5206 0.0026 104.1118
B.11.b b. Port 1.0000 0.2850 0.2850 0.2850
ADB 1.0000 0.2850 0.2850 0.2850
PHI-1033/1044 B.11.b.1 ADB-assisted Palawan Integrated Area Development Project (PIADP) for Brooke's Point 1.0000 0.2850 0.2850 0.2850
B.11.c c. Flood Control Projects under RA 8150 0.7528 0.8529 0.6421 1.1329 OECF 0.7478 0.8547 0.6391 1.1429
PH-P79 B.11.c.1 OECF-assisted Metro Manila Flood Control Project II, (Balut, Vitas and San Andres Pumping Sta.), 14thYen 0.8395 0.9410 0.7899 1.1209
PH-P106 B.11.c.2 OECF-assisted Pampanga Delta Development Project, Flood Control Component, 16th Yen 0.3885 0.9543 0.3707 2.4567PH-P87 B.11.c.4 OECF-assisted Lower Agusan Development Project Stage I, Flood Control Component, Phase I,
Butuan City, 14th Yen 0.9750 0.9966 0.9717 1.0222PH-P85 B.11.c.5 OECF-assisted Small Water Impounding Management (SWIM) Projects, 14th Yen 0.8957 0.4956 0.4438 0.5533
B.11.c.6 OECF-assisted Agno Flood Control Project (Rehab and Improvement Works), Package IV, 20th Yen,Pangasinan and Tarlac 0.8830 0.0200 0.0177 0.0227
ADB 0.9834 0.7919 0.7787 0.8052
915 PHI (SF) B.11.c.3 ADB-assisted Sorsogon Integrated Area Development Project, Flood Control Component 0.9834 0.7919 0.7787 0.8052
B.11.d d. Water-Supply Projects under RA No. 8150 0.5451 0.1137 0.0620 0.2086
IBRD 0.5382 0.1458 0.0785 0.2710
3242-PH B.11.d.1 IBRD-assisted First Water Supply Sewerage and Sanitation Sector Project (FWSSSSP) 0.5382 0.1458 0.0785 0.2710
ADB 0.5707 0.0015 0.0009 0.0027
1033/1034 PHI B.11.d.2 ADB-assisted Palawan Integrated Areaa Development Project (PIADP), Rural Water Component 0.5707 0.0015 0.00090.0027
B.11.e e. Urban Infrastructure Projects (2 projects per GAA)
3146-PH B.11.e.1 Metro Manila Infrastructure Utilities and Engineering-II, Fringe Program3455-PH B.11.e.2 Program for Essential Municipal, Infra, Utilities
Maintenance and Engineering Development
Others 0.4071
Total DPWH 1.0421 0.6187 0.6447 0.5937
Non-DPWH Fund
LIV Unprogrammed Fund 1.0051
XL Compensation Adjustment Fund 0.9883
XLCOAF Compensation Adjustment Fund 1.0000
XLII Countrywide Development Fund 0.6636
XLIII DECS-School Bldg. Program 0.7078
XLVII International Commitments Fund 0.9965
XLVIII Miscellaneous Personnel Benefits Fund 0.8693
XXXIX Calamity Fund 0.6530
Total Non-DPWH 0.7099
GRAND TOTAL 1.1897 0.6300 0.7495 0.5295

Annex 7B. Absorptive Capacity Indices, By program/project/region, 1997Department of Public Works and Highways
Loan/Grant No. Reference No. Item BPI AUI ApUI AACI
A. Programs 1.0311 0.9736 1.0039 0.9442
A.I General Administration and Support 1.4961 0.9902 1.4814 0.6618
A.II Support to Operations 0.9246 0.9759 0.9023 1.0555
A.II.a Policy Formulation, Program Planning and Standards Development 0.9608 0.9497 0.9124 0.9884
A.II.b Operation and management of the Infra Computer Center 0.9437 0.9295 0.8772 0.9849
A.II.c Operation and Management of the Traffic Engineering Center
A.II.d Regional Support (Planning and Design, Construction, Maintenance and material Quality Control) 0.9756 0.9991 0.9747 1.0241
A.II.e Operational Support for the Maintenance and Repair of Infrastructure Facilities and Other Related Activities 0.8881 0.9939 0.8826 1.1191
A.III Operations 0.9985 0.9713 0.9699 0.9728
A.III.a Construction, Maintenance, Repair and Rehabilitation of Infra Facilties 0.8929 0.8986 0.8023 1.0063
A.III.b Maintenance, Repair and Rehabilitation of Infrastructure Facilities 0.9814 0.9773 0.9591 0.9957
A.III.c Operational Support in the Maintenance and Repair of the Infrastructure Facilities and Other Related Activities of District/City Engg. Offices 1.0304 0.9992 1.0296 0.9698
A.III.d Operational Support in the Maintenance and Repair of the Infrastructure Facilities and Other Equipment including Replacement of Parts, Regional Depot/base Shops and Area Shops 0.9992 0.9980 0.9972 0.9989
B. Projects 0.7562 0.6013 0.4547 0.7952
1. Locally-Funded Projects 0.7114 0.5633 0.4007 0.7917
B.1.a. a. Highways (Roads and Bridges) Projects under R.A. No. 8150 0.8833 0.6721 0.5937 0.7610
B.1.a.1 NCR 0.9544 0.5008 0.4780 0.5247
B.1.a.2 Region I 0.9952 0.9467 0.9422 0.9513
B.1.a.3 CAR 0.8299 0.9064 0.7522 1.0923
B.1.a.4 Region II 0.9976 0.8275 0.8255 0.8294
B.1.a.5 Region III 0.6081 0.9213 0.5603 1.5150
B.1.a.6 Region IV-A 0.9034 0.5462 0.4934 0.6046
B.1.a.7 Region IV-B 0.8899 0.9194 0.8182 1.0331
B.1.a.8 Region V 0.8941 0.7184 0.6423 0.8034
B.1.a.9 Region VI 0.9174 0.6928 0.6355 0.7552
B.1.a.10 Region VII 0.6997 0.2624 0.1836 0.3750
B.1.a.11 Region VIII 0.9236 0.7610 0.7029 0.8240
B.1.a.12 Region IX 0.9396 0.6471 0.6080 0.6886
B.1.a.13 Region X 0.9875 0.7590 0.7495 0.7686
B.1.a.14 Region XI 0.9893 0.8437 0.8346 0.8528
B.1.a.15.a Region XII- Main Region 0.9559 0.8864 0.8473 0.9274
B.1.a.15.b Region XII- ARMM 0.7114 0.5869 0.4176 0.8250
B.1.a.16 CARAGA 0.9783 0.9224 0.9023 0.9428
B.1.a.17 Nationwide 0.6497 0.6592 0.4283 1.0146
B.1.b b. Flood Control and Drainage Projects under RA No. 8150 0.6916 0.7948 0.5497 1.1491
B.1.b.1 NCR 0.7753 0.7485 0.5804 0.9655
B.1.b.2 Region I 0.9704 0.9563 0.9280 0.9854
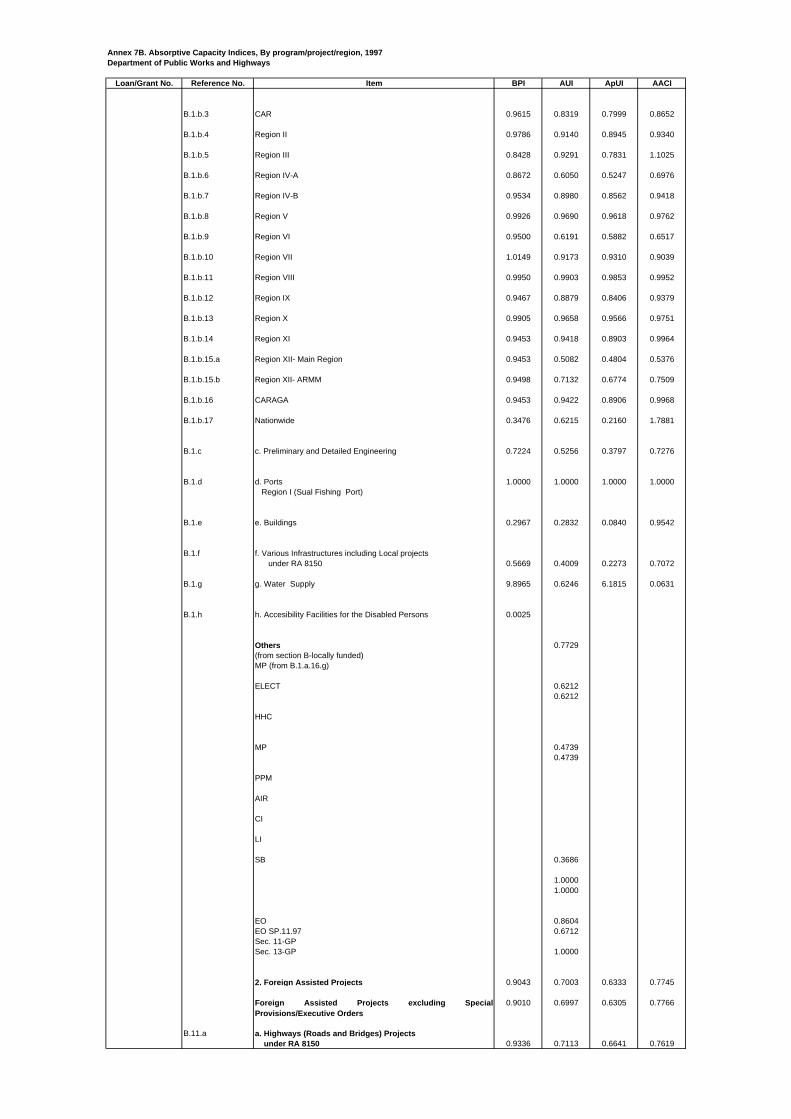
Annex 7B. Absorptive Capacity Indices, By program/project/region, 1997Department of Public Works and Highways
Loan/Grant No. Reference No. Item BPI AUI ApUI AACI
B.1.b.3 CAR 0.9615 0.8319 0.7999 0.8652
B.1.b.4 Region II 0.9786 0.9140 0.8945 0.9340
B.1.b.5 Region III 0.8428 0.9291 0.7831 1.1025
B.1.b.6 Region IV-A 0.8672 0.6050 0.5247 0.6976
B.1.b.7 Region IV-B 0.9534 0.8980 0.8562 0.9418
B.1.b.8 Region V 0.9926 0.9690 0.9618 0.9762
B.1.b.9 Region VI 0.9500 0.6191 0.5882 0.6517
B.1.b.10 Region VII 1.0149 0.9173 0.9310 0.9039
B.1.b.11 Region VIII 0.9950 0.9903 0.9853 0.9952
B.1.b.12 Region IX 0.9467 0.8879 0.8406 0.9379
B.1.b.13 Region X 0.9905 0.9658 0.9566 0.9751
B.1.b.14 Region XI 0.9453 0.9418 0.8903 0.9964
B.1.b.15.a Region XII- Main Region 0.9453 0.5082 0.4804 0.5376
B.1.b.15.b Region XII- ARMM 0.9498 0.7132 0.6774 0.7509
B.1.b.16 CARAGA 0.9453 0.9422 0.8906 0.9968
B.1.b.17 Nationwide 0.3476 0.6215 0.2160 1.7881
B.1.c c. Preliminary and Detailed Engineering 0.7224 0.5256 0.3797 0.7276
B.1.d d. Ports 1.0000 1.0000 1.0000 1.0000 Region I (Sual Fishing Port)
B.1.e e. Buildings 0.2967 0.2832 0.0840 0.9542
B.1.f f. Various Infrastructures including Local projects under RA 8150 0.5669 0.4009 0.2273 0.7072
B.1.g g. Water Supply 9.8965 0.6246 6.1815 0.0631
B.1.h h. Accesibility Facilities for the Disabled Persons 0.0025
Others 0.7729(from section B-locally funded)MP (from B.1.a.16.g)
ELECT 0.62120.6212
HHC
MP 0.47390.4739
PPM
AIR
CI
LI
SB 0.3686
1.00001.0000
EO 0.8604EO SP.11.97 0.6712Sec. 11-GPSec. 13-GP 1.0000
2. Foreign Assisted Projects 0.9043 0.7003 0.6333 0.7745
Foreign Assisted Projects excluding SpecialProvisions/Executive Orders
0.9010 0.6997 0.6305 0.7766
B.11.a a. Highways (Roads and Bridges) Projects under RA 8150 0.9336 0.7113 0.6641 0.7619
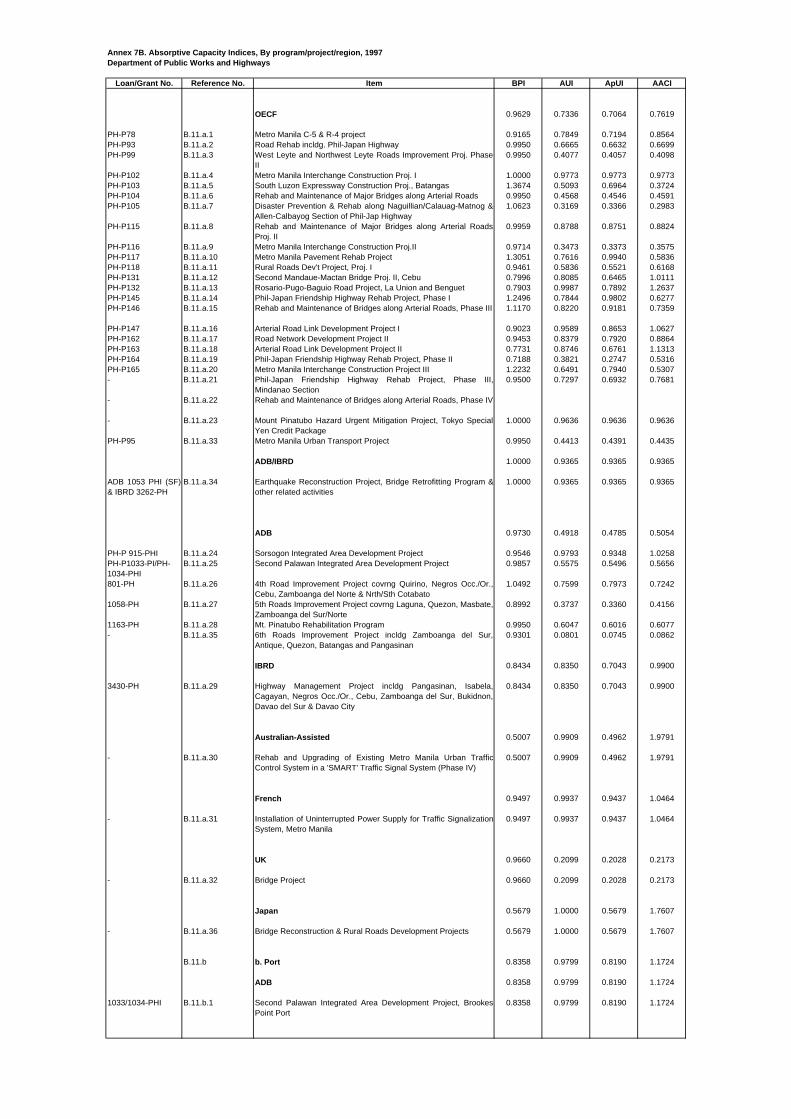
Annex 7B. Absorptive Capacity Indices, By program/project/region, 1997Department of Public Works and Highways
Loan/Grant No. Reference No. Item BPI AUI ApUI AACI
OECF 0.9629 0.7336 0.7064 0.7619
PH-P78 B.11.a.1 Metro Manila C-5 & R-4 project 0.9165 0.7849 0.7194 0.8564PH-P93 B.11.a.2 Road Rehab incldg. Phil-Japan Highway 0.9950 0.6665 0.6632 0.6699PH-P99 B.11.a.3 West Leyte and Northwest Leyte Roads Improvement Proj. Phase
II0.9950 0.4077 0.4057 0.4098
PH-P102 B.11.a.4 Metro Manila Interchange Construction Proj. I 1.0000 0.9773 0.9773 0.9773PH-P103 B.11.a.5 South Luzon Expressway Construction Proj., Batangas 1.3674 0.5093 0.6964 0.3724PH-P104 B.11.a.6 Rehab and Maintenance of Major Bridges along Arterial Roads 0.9950 0.4568 0.4546 0.4591PH-P105 B.11.a.7 Disaster Prevention & Rehab along Naguillian/Calauag-Matnog &
Allen-Calbayog Section of Phil-Jap Highway1.0623 0.3169 0.3366 0.2983
PH-P115 B.11.a.8 Rehab and Maintenance of Major Bridges along Arterial RoadsProj. II
0.9959 0.8788 0.8751 0.8824
PH-P116 B.11.a.9 Metro Manila Interchange Construction Proj.II 0.9714 0.3473 0.3373 0.3575PH-P117 B.11.a.10 Metro Manila Pavement Rehab Project 1.3051 0.7616 0.9940 0.5836PH-P118 B.11.a.11 Rural Roads Dev't Project, Proj. I 0.9461 0.5836 0.5521 0.6168PH-P131 B.11.a.12 Second Mandaue-Mactan Bridge Proj. II, Cebu 0.7996 0.8085 0.6465 1.0111PH-P132 B.11.a.13 Rosario-Pugo-Baguio Road Project, La Union and Benguet 0.7903 0.9987 0.7892 1.2637PH-P145 B.11.a.14 Phil-Japan Friendship Highway Rehab Project, Phase I 1.2496 0.7844 0.9802 0.6277PH-P146 B.11.a.15 Rehab and Maintenance of Bridges along Arterial Roads, Phase III 1.1170 0.8220 0.9181 0.7359
PH-P147 B.11.a.16 Arterial Road Link Development Project I 0.9023 0.9589 0.8653 1.0627PH-P162 B.11.a.17 Road Network Development Project II 0.9453 0.8379 0.7920 0.8864PH-P163 B.11.a.18 Arterial Road Link Development Project II 0.7731 0.8746 0.6761 1.1313PH-P164 B.11.a.19 Phil-Japan Friendship Highway Rehab Project, Phase II 0.7188 0.3821 0.2747 0.5316PH-P165 B.11.a.20 Metro Manila Interchange Construction Project III 1.2232 0.6491 0.7940 0.5307- B.11.a.21 Phil-Japan Friendship Highway Rehab Project, Phase III,
Mindanao Section0.9500 0.7297 0.6932 0.7681
- B.11.a.22 Rehab and Maintenance of Bridges along Arterial Roads, Phase IV
- B.11.a.23 Mount Pinatubo Hazard Urgent Mitigation Project, Tokyo SpecialYen Credit Package
1.0000 0.9636 0.9636 0.9636
PH-P95 B.11.a.33 Metro Manila Urban Transport Project 0.9950 0.4413 0.4391 0.4435
ADB/IBRD 1.0000 0.9365 0.9365 0.9365
ADB 1053 PHI (SF)& IBRD 3262-PH
B.11.a.34 Earthquake Reconstruction Project, Bridge Retrofitting Program &other related activities
1.0000 0.9365 0.9365 0.9365
ADB 0.9730 0.4918 0.4785 0.5054
PH-P 915-PHI B.11.a.24 Sorsogon Integrated Area Development Project 0.9546 0.9793 0.9348 1.0258PH-P1033-PI/PH-1034-PHI
B.11.a.25 Second Palawan Integrated Area Development Project 0.9857 0.5575 0.5496 0.5656
801-PH B.11.a.26 4th Road Improvement Project covrng Quirino, Negros Occ./Or.,Cebu, Zamboanga del Norte & Nrth/Sth Cotabato
1.0492 0.7599 0.7973 0.7242
1058-PH B.11.a.27 5th Roads Improvement Project covrng Laguna, Quezon, Masbate,Zamboanga del Sur/Norte
0.8992 0.3737 0.3360 0.4156
1163-PH B.11.a.28 Mt. Pinatubo Rehabilitation Program 0.9950 0.6047 0.6016 0.6077- B.11.a.35 6th Roads Improvement Project incldg Zamboanga del Sur,
Antique, Quezon, Batangas and Pangasinan0.9301 0.0801 0.0745 0.0862
IBRD 0.8434 0.8350 0.7043 0.9900
3430-PH B.11.a.29 Highway Management Project incldg Pangasinan, Isabela,Cagayan, Negros Occ./Or., Cebu, Zamboanga del Sur, Bukidnon,Davao del Sur & Davao City
0.8434 0.8350 0.7043 0.9900
Australian-Assisted 0.5007 0.9909 0.4962 1.9791
- B.11.a.30 Rehab and Upgrading of Existing Metro Manila Urban TrafficControl System in a 'SMART' Traffic Signal System (Phase IV)
0.5007 0.9909 0.4962 1.9791
French 0.9497 0.9937 0.9437 1.0464
- B.11.a.31 Installation of Uninterrupted Power Supply for Traffic SignalizationSystem, Metro Manila
0.9497 0.9937 0.9437 1.0464
UK 0.9660 0.2099 0.2028 0.2173
- B.11.a.32 Bridge Project 0.9660 0.2099 0.2028 0.2173
Japan 0.5679 1.0000 0.5679 1.7607
- B.11.a.36 Bridge Reconstruction & Rural Roads Development Projects 0.5679 1.0000 0.5679 1.7607
B.11.b b. Port 0.8358 0.9799 0.8190 1.1724
ADB 0.8358 0.9799 0.8190 1.1724
1033/1034-PHI B.11.b.1 Second Palawan Integrated Area Development Project, BrookesPoint Port
0.8358 0.9799 0.8190 1.1724
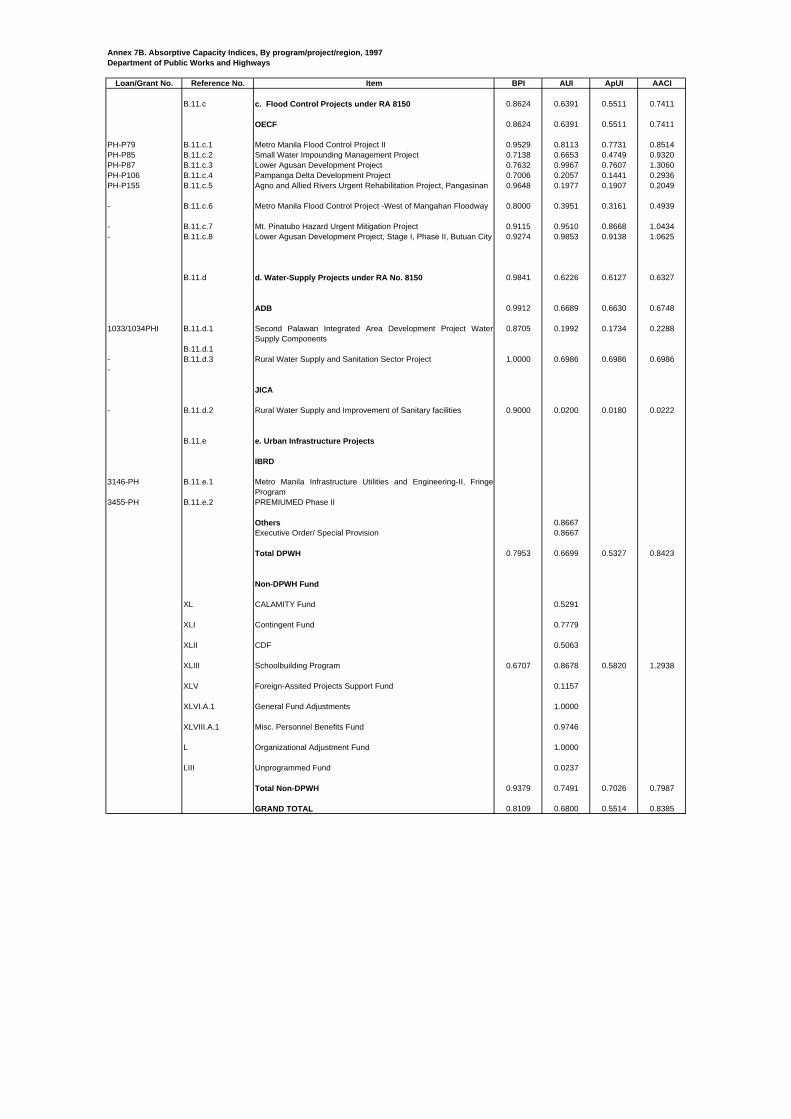
Annex 7B. Absorptive Capacity Indices, By program/project/region, 1997Department of Public Works and Highways
Loan/Grant No. Reference No. Item BPI AUI ApUI AACI
B.11.c c. Flood Control Projects under RA 8150 0.8624 0.6391 0.5511 0.7411 OECF 0.8624 0.6391 0.5511 0.7411
PH-P79 B.11.c.1 Metro Manila Flood Control Project II 0.9529 0.8113 0.7731 0.8514PH-P85 B.11.c.2 Small Water Impounding Management Project 0.7138 0.6653 0.4749 0.9320PH-P87 B.11.c.3 Lower Agusan Development Project 0.7632 0.9967 0.7607 1.3060PH-P106 B.11.c.4 Pampanga Delta Development Project 0.7006 0.2057 0.1441 0.2936PH-P155 B.11.c.5 Agno and Allied Rivers Urgent Rehabilitation Project, Pangasinan 0.9648 0.1977 0.1907 0.2049
- B.11.c.6 Metro Manila Flood Control Project -West of Mangahan Floodway 0.8000 0.3951 0.3161 0.4939
- B.11.c.7 Mt. Pinatubo Hazard Urgent Mitigation Project 0.9115 0.9510 0.8668 1.0434- B.11.c.8 Lower Agusan Development Project, Stage I, Phase II, Butuan City 0.9274 0.9853 0.9138 1.0625
B.11.d d. Water-Supply Projects under RA No. 8150 0.9841 0.6226 0.6127 0.6327
ADB 0.9912 0.6689 0.6630 0.6748
1033/1034PHI B.11.d.1 Second Palawan Integrated Area Development Project WaterSupply Components
0.8705 0.1992 0.1734 0.2288
B.11.d.1- B.11.d.3 Rural Water Supply and Sanitation Sector Project 1.0000 0.6986 0.6986 0.6986-
JICA
- B.11.d.2 Rural Water Supply and Improvement of Sanitary facilities 0.9000 0.0200 0.0180 0.0222
B.11.e e. Urban Infrastructure Projects
IBRD
3146-PH B.11.e.1 Metro Manila Infrastructure Utilities and Engineering-II, FringeProgram
3455-PH B.11.e.2 PREMIUMED Phase II
Others 0.8667Executive Order/ Special Provision 0.8667
Total DPWH 0.7953 0.6699 0.5327 0.8423
Non-DPWH Fund
XL CALAMITY Fund 0.5291
XLI Contingent Fund 0.7779
XLII CDF 0.5063
XLIII Schoolbuilding Program 0.6707 0.8678 0.5820 1.2938
XLV Foreign-Assited Projects Support Fund 0.1157
XLVI.A.1 General Fund Adjustments 1.0000
XLVIII.A.1 Misc. Personnel Benefits Fund 0.9746
L Organizational Adjustment Fund 1.0000
LIII Unprogrammed Fund 0.0237
Total Non-DPWH 0.9379 0.7491 0.7026 0.7987
GRAND TOTAL 0.8109 0.6800 0.5514 0.8385
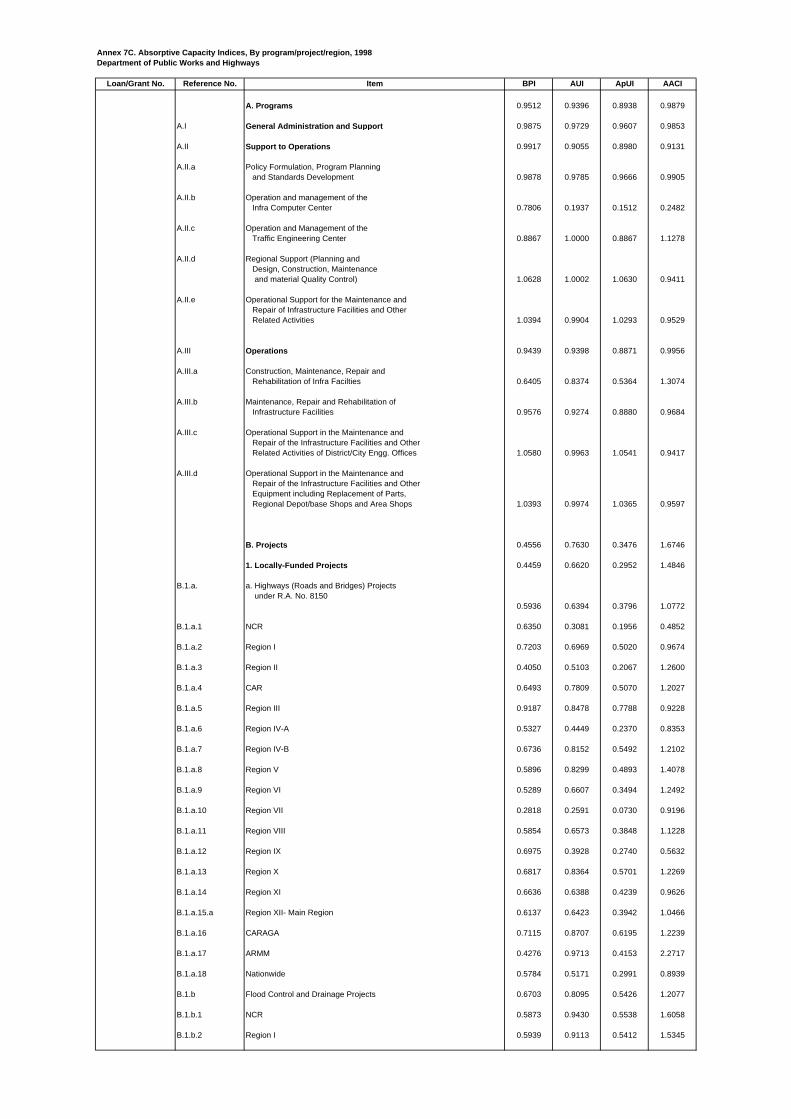
Annex 7C. Absorptive Capacity Indices, By program/project/region, 1998Department of Public Works and Highways
Loan/Grant No. Reference No. Item BPI AUI ApUI AACI
A. Programs 0.9512 0.9396 0.8938 0.9879
A.I General Administration and Support 0.9875 0.9729 0.9607 0.9853
A.II Support to Operations 0.9917 0.9055 0.8980 0.9131
A.II.a Policy Formulation, Program Planning and Standards Development 0.9878 0.9785 0.9666 0.9905
A.II.b Operation and management of the Infra Computer Center 0.7806 0.1937 0.1512 0.2482
A.II.c Operation and Management of the Traffic Engineering Center 0.8867 1.0000 0.8867 1.1278
A.II.d Regional Support (Planning and Design, Construction, Maintenance and material Quality Control) 1.0628 1.0002 1.0630 0.9411
A.II.e Operational Support for the Maintenance and Repair of Infrastructure Facilities and Other Related Activities 1.0394 0.9904 1.0293 0.9529
A.III Operations 0.9439 0.9398 0.8871 0.9956
A.III.a Construction, Maintenance, Repair and Rehabilitation of Infra Facilties 0.6405 0.8374 0.5364 1.3074
A.III.b Maintenance, Repair and Rehabilitation of Infrastructure Facilities 0.9576 0.9274 0.8880 0.9684
A.III.c Operational Support in the Maintenance and Repair of the Infrastructure Facilities and Other Related Activities of District/City Engg. Offices 1.0580 0.9963 1.0541 0.9417
A.III.d Operational Support in the Maintenance and Repair of the Infrastructure Facilities and Other Equipment including Replacement of Parts, Regional Depot/base Shops and Area Shops 1.0393 0.9974 1.0365 0.9597
B. Projects 0.4556 0.7630 0.3476 1.6746
1. Locally-Funded Projects 0.4459 0.6620 0.2952 1.4846
B.1.a. a. Highways (Roads and Bridges) Projects under R.A. No. 8150
0.5936 0.6394 0.3796 1.0772
B.1.a.1 NCR 0.6350 0.3081 0.1956 0.4852
B.1.a.2 Region I 0.7203 0.6969 0.5020 0.9674
B.1.a.3 Region II 0.4050 0.5103 0.2067 1.2600
B.1.a.4 CAR 0.6493 0.7809 0.5070 1.2027
B.1.a.5 Region III 0.9187 0.8478 0.7788 0.9228
B.1.a.6 Region IV-A 0.5327 0.4449 0.2370 0.8353
B.1.a.7 Region IV-B 0.6736 0.8152 0.5492 1.2102
B.1.a.8 Region V 0.5896 0.8299 0.4893 1.4078
B.1.a.9 Region VI 0.5289 0.6607 0.3494 1.2492
B.1.a.10 Region VII 0.2818 0.2591 0.0730 0.9196
B.1.a.11 Region VIII 0.5854 0.6573 0.3848 1.1228
B.1.a.12 Region IX 0.6975 0.3928 0.2740 0.5632
B.1.a.13 Region X 0.6817 0.8364 0.5701 1.2269
B.1.a.14 Region XI 0.6636 0.6388 0.4239 0.9626
B.1.a.15.a Region XII- Main Region 0.6137 0.6423 0.3942 1.0466
B.1.a.16 CARAGA 0.7115 0.8707 0.6195 1.2239
B.1.a.17 ARMM 0.4276 0.9713 0.4153 2.2717
B.1.a.18 Nationwide 0.5784 0.5171 0.2991 0.8939
B.1.b Flood Control and Drainage Projects 0.6703 0.8095 0.5426 1.2077
B.1.b.1 NCR 0.5873 0.9430 0.5538 1.6058
B.1.b.2 Region I 0.5939 0.9113 0.5412 1.5345

Annex 7C. Absorptive Capacity Indices, By program/project/region, 1998Department of Public Works and Highways
Loan/Grant No. Reference No. Item BPI AUI ApUI AACI
B.1.b.3 CAR 0.7483 0.9643 0.7216 1.2887
B.1.b.4 Region II 0.8661 0.7289 0.6313 0.8416
B.1.b.5 Region III 0.6647 0.9633 0.6403 1.4492
B.1.b.6 Region IV-A 0.4846 0.9565 0.4635 1.9739
B.1.b.7 Region IV-B 0.6395 0.8918 0.5703 1.3944
B.1.b.8 Region V 0.5068 0.9593 0.4861 1.8929
B.1.b.9 Region VI 0.7583 0.6463 0.4901 0.8523
B.1.b.10 Region VII 0.8637 0.6791 0.5865 0.7863
B.1.b.11 Region VIII 0.6528 0.2061 0.1345 0.3157
B.1.b.12 Region IX 0.5617 0.9824 0.5518 1.7489
B.1.b.13 Region X 0.7147 0.9626 0.6880 1.3469
B.1.b.14 Region XI 0.7207 0.7996 0.5763 1.1095
B.1.b.15.a Region XII- Main Region 0.6863 0.8683 0.5959 1.2651
B.1.b.16 CARAGA 0.7414 0.9767 0.7242 1.3173
B.1.b.17 Nationwaide 0.7518 0.7294 0.5484 0.9702
B.1.c c. Preliminary and Detailed Engineering 0.7422 0.2915 0.2164 0.3928
B.1.d d. National Buildings 0.7441 0.8595 0.6395 1.1551
B.1.e e. Other Infrastructures
B.1.e.1 NCRB.1.e.2 Region IB.1.e.3 Region IIB.1.e.4 Region IIIB.1.e.5 Region IV-AB.1.e.6 Region VB.1.e.7 Region VIB.1.e.8 Region VIIB.1.e.9 Region VIIIB.1.e.10 Region IXB.1.e.11 Region XB.1.e.12 Region XIB.1.e.13 Region XIIB.1.e.14 Region XIII
B.1.f f. Ports (Regions I, VII and XIII) 0.2247 0.9963 0.2238 4.4349
B.1.g g. Water Supply
NCRRegion IIIRegion IV-ARegion VIIRegion VIIIRegion XRegion XIRegion XII
B.1.h h. Various Infrastructures including Local projects 0.2428 0.7624 0.1851 3.1404
B.1.I I. Accesibility Facilities for the Disabled Persons 0.2750 0.0306 0.0084 0.1111
B.1.j j. Infrastructure Support to Gender and Development 32.4369 0.1052 3.4116 0.0032
B.1.k k. Urgent Arterial/Secondary, Local Roads and Bridges and other Infrastructures 0.0010 0.9614 0.0010 971.0171
Others
2. Foreign Assisted Projects 0.4801 1.0000 0.4801 2.0829
Foreign Assisted Projects excluding Special Provisions/ExecutiveOrders
0.4793 1.0000 0.4793 2.0865
B.11.a a. Highways (Roads and Bridges) Projects under RA 8150 0.5185 1.0000 0.5185 1.9287

Annex 7C. Absorptive Capacity Indices, By program/project/region, 1998Department of Public Works and Highways
Loan/Grant No. Reference No. Item BPI AUI ApUI AACI
OECF 0.5340 1.0000 0.5340 1.8725
PH-P103 B.11.a.1 Southern Tagalog Toll Expressway 0.2457 1.0000 0.2457 4.0704PH-P105 B.11.a.2 Disaster Prevention and Rehabilitation Project along Naguillan Road,
Calauag-Matnog and Allen-Calbayog Section of Phil-Japan Highway0.6599 1.0000 0.6599 1.5155
PH-P116 B.11.a.3 Metro Manila Interchange Construction Project IIPH-P118 B.11.a.4 Rural Roads Development Project (Tarlac, Cavite, Masbate and Bohol),
Project I0.1171 1.0000 0.1171 8.5384
PH-P131 B.11.a.5 Second Mandaue-Mactan Bridge, Project II, Cebu 0.8235 1.0000 0.8235 1.2144PH-P132 B.11.a.6 Rosario-Pugo-Baguio Road Project, La Union and Benguet 0.5562 1.0000 0.5562 1.7980PH-P145 B.11.a.7 Phil-Japan Friendship Highway Rehabilitation Project, Phase I 0.8838 1.0000 0.8838 1.1315PH-P146 B.11.a.8 Rehabilitation and Maintenance of Bridges along Arterial Roads, Phase
III0.8603 1.0000 0.8603 1.1624
PH-P147 B.11.a.9 Arterial Road Links Development Project, Phase I 0.7438 1.0000 0.7438 1.3444PH-P162 B.11.a.10 Rural Road Network Development Project II 0.2233 1.0000 0.2233 4.4778PH-P163 B.11.a.11 Arterial Road Link Development Project II 0.2171 1.0000 0.2171 4.6064PH-P164 B.11.a.12 Phil-Japan Friendship Highway Rehabilitation Project, Phase II 0.3965 1.0000 0.3965 2.5219PH-P165 B.11.a.13 Metro Manila Interchange Construction Project III 0.0103 1.0000 0.0103 97.0553PH-P174 B.11.a.14 Phil-Japan Friendship Highway Rehabilitation Project, Phase I,
Mindanao (Agusan-Davao)0.0838 1.0000 0.0838 11.9373
PH-P166 B.11.a.15 Mount Pinatubo Hazard Urgent Mitigation Project (Road Component-Tarlac&Pampanga), Tokyo Special Yen Credit Package
0.7268 1.0000 0.7268 1.3759
PH-P95 B.11.a.19 Metro Manila Urban Transport 0.3536 1.0000 0.3536 2.8282
IBRD
3430-PH B.11.a.16 Highway Management Project including the provinces of Pangasinan,Isabela, Cagayan, Negros Occ./Or., Cebu, Zamboanga del Sur,Bukidnon, Davao del Sur and Davao City
0.5769 1.0000 0.5769 1.7335
Australia
- B.11.a.17 Rehabilitation and Upgrading of Existing Metro Manila Urban TrafficControl System into "SMART" Traffic Signal System (Phase IV)
0.7608 1.0000 0.7608 1.3144
ADB
ADB Loan No. 1473-PHI/ Jexim Bank/OPEC/ KFAED
B.11.a.20 6th Roads Improvement Project including the provinces of Pangasinan,Zambales, Batangas, Quezon, Palawan, Masbate, Antique, Aklan,Cebu, Negros Or., Zamboanga del Sur and Lanao del Norte
0.4046 1.0000 0.4046 2.4718
UK
- B.11.a.18 Bridge Project 0.1997 1.0000 0.1997 5.0084
B.11.b Port Project under RA 8150
ADB 0.8746 1.0000 0.8746 1.1434
ADB Loan No. 1473-PHI/JEXIM Bank/OPEC/KFAED
B.11.b.1 Second Palawan Integrated Area Development Project, Brooke's Point,Port Component
0.8746 1.0000 0.8746 1.1434
B.11.c Flood Control Projects under RA 8150 0.3749 1.0000 0.3749 2.6676
OECF 0.3749 1.0000 0.3749 2.6676
PH-P79 B.11.c.1 Metro Manila Flood Control Project II, (Balut, Vitas and San AndresPumping Stations)
0.1694 1.0000 0.1694 5.9021
PH-P85 B.11.c.2 Small Water Impounding Management 0.6795 1.0000 0.6795 1.4718PH-P87 B.11.c.3 Lowe Agusan Development Project, Stage I, Phase I, Butuan City 0.7370 1.0000 0.7370 1.3568PH-P106 B.11.c.4 Pampanga Delta Development Project, Pampanga and Bulacan, Flood
Control Component0.2615 1.0000 0.2615 3.8244
PH-P155 B.11.c.5 Agno and Allied Rivers Urgent Rehabilitation Project Pangasinan 0.4182 1.0000 0.4182 2.3912PH-P179 B.11.c.6 Metro Manila Flood Control Project-West of Mangahan Floodway, Metro
Manila and Rizal0.7095 1.0000 0.7095 1.4093
- B.11.c.7 Mt. Pinatubo Hazard Urgent Mitigation Project (Flood ControlComponent), Tarlac & Pampanga
0.6233 1.0000 0.6233 1.6045
PH-P180 B.11.c.8 Lowe Agusan Development Project, Stage I, Phase II, Butuan City 0.1740 1.0000 0.1740 5.7465
B.11.d Water Supply 0.6047 1.0000 0.6047 1.6537
ADB 0.6353 1.0000 0.6353 1.5742
1033/1034 PHI B.11.d.1 Second Palawan Integrated Area Development Project Water SupplyComponents
6.6698 1.0000 6.6698 0.1499
1440/1441(SF)-PH B.11.d.3 Rural Water Supply and Sanitation Sector Project 0.0000 0.0000
JICA
- B.11.d.2 Rural Water Supply and Improvement of Sanitary Facilities 0.2549 1.0000 0.2549 3.9234

Annex 7C. Absorptive Capacity Indices, By program/project/region, 1998Department of Public Works and Highways
Loan/Grant No. Reference No. Item BPI AUI ApUI AACI
B.11.e Urban Infrastructure Project
IBRD
3455-PH B.11.e.1 Program for Essential Municipal Infrastructure Utilities Maintenance andEngineering Development (PREMIUMED) Phase II
OthersSpecial Provision/Executive Orders 1.0000
Total DPWH 0.5234 0.8069 0.4223 1.5416
Non-DPWH Fund
XL Calamity Fund 0.4056
XLII Countrywide Development Fund 0.8287
XLIII DECS-School Building Program 0.7612 0.7738 0.5890 1.0165
XLV General Fund Adjustment 0.4961
XLVI International Commitments Funds 0.9944
XLVII Misc. Personnel Benefits Funds 0.9533
XLVIII National Unification 0.9593
Total Non-DPWH Fund 1.0835 0.7209 0.7811 0.6654
Grand Total 0.5504 0.7987 0.4396 1.4511
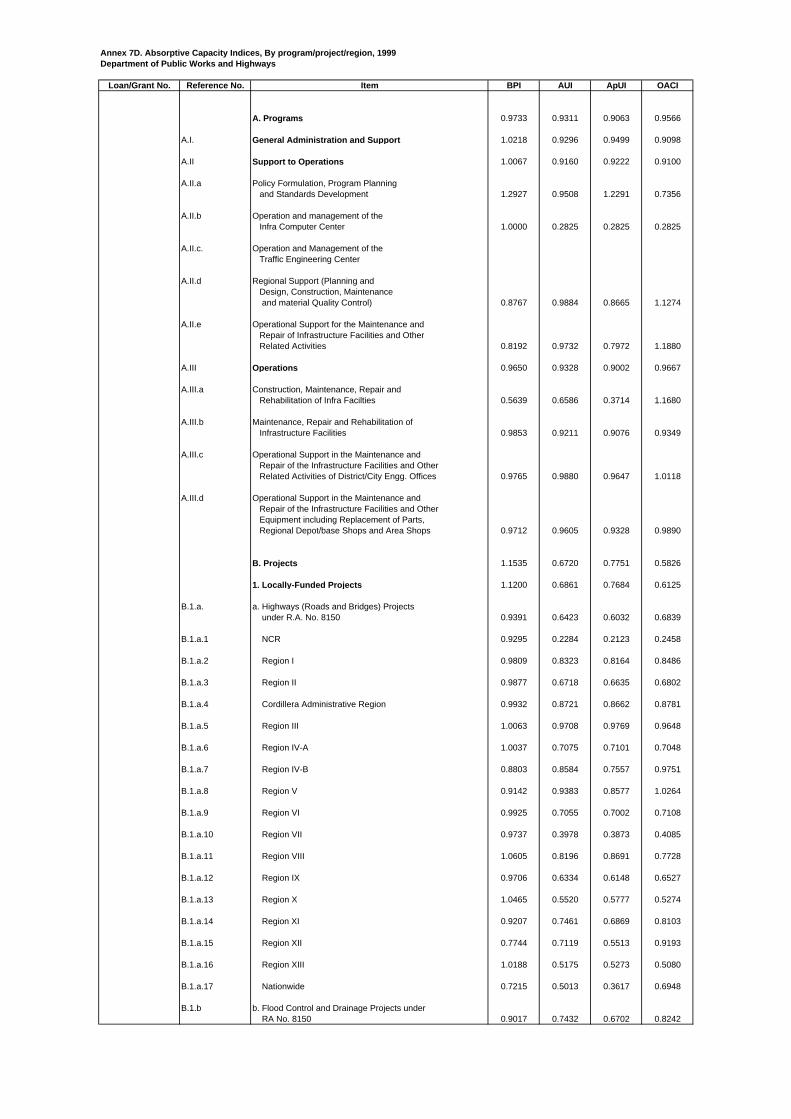
Annex 7D. Absorptive Capacity Indices, By program/project/region, 1999Department of Public Works and Highways
Loan/Grant No. Reference No. Item BPI AUI ApUI OACI
A. Programs 0.9733 0.9311 0.9063 0.9566
A.I. General Administration and Support 1.0218 0.9296 0.9499 0.9098
A.II Support to Operations 1.0067 0.9160 0.9222 0.9100
A.II.a Policy Formulation, Program Planning and Standards Development 1.2927 0.9508 1.2291 0.7356
A.II.b Operation and management of the Infra Computer Center 1.0000 0.2825 0.2825 0.2825
A.II.c. Operation and Management of the Traffic Engineering Center
A.II.d Regional Support (Planning and Design, Construction, Maintenance and material Quality Control) 0.8767 0.9884 0.8665 1.1274
A.II.e Operational Support for the Maintenance and Repair of Infrastructure Facilities and Other Related Activities 0.8192 0.9732 0.7972 1.1880
A.III Operations 0.9650 0.9328 0.9002 0.9667
A.III.a Construction, Maintenance, Repair and Rehabilitation of Infra Facilties 0.5639 0.6586 0.3714 1.1680
A.III.b Maintenance, Repair and Rehabilitation of Infrastructure Facilities 0.9853 0.9211 0.9076 0.9349
A.III.c Operational Support in the Maintenance and Repair of the Infrastructure Facilities and Other Related Activities of District/City Engg. Offices 0.9765 0.9880 0.9647 1.0118
A.III.d Operational Support in the Maintenance and Repair of the Infrastructure Facilities and Other Equipment including Replacement of Parts, Regional Depot/base Shops and Area Shops 0.9712 0.9605 0.9328 0.9890
B. Projects 1.1535 0.6720 0.7751 0.5826
1. Locally-Funded Projects 1.1200 0.6861 0.7684 0.6125
B.1.a. a. Highways (Roads and Bridges) Projects under R.A. No. 8150 0.9391 0.6423 0.6032 0.6839
B.1.a.1 NCR 0.9295 0.2284 0.2123 0.2458
B.1.a.2 Region I 0.9809 0.8323 0.8164 0.8486
B.1.a.3 Region II 0.9877 0.6718 0.6635 0.6802
B.1.a.4 Cordillera Administrative Region 0.9932 0.8721 0.8662 0.8781
B.1.a.5 Region III 1.0063 0.9708 0.9769 0.9648
B.1.a.6 Region IV-A 1.0037 0.7075 0.7101 0.7048
B.1.a.7 Region IV-B 0.8803 0.8584 0.7557 0.9751
B.1.a.8 Region V 0.9142 0.9383 0.8577 1.0264
B.1.a.9 Region VI 0.9925 0.7055 0.7002 0.7108
B.1.a.10 Region VII 0.9737 0.3978 0.3873 0.4085
B.1.a.11 Region VIII 1.0605 0.8196 0.8691 0.7728
B.1.a.12 Region IX 0.9706 0.6334 0.6148 0.6527
B.1.a.13 Region X 1.0465 0.5520 0.5777 0.5274
B.1.a.14 Region XI 0.9207 0.7461 0.6869 0.8103
B.1.a.15 Region XII 0.7744 0.7119 0.5513 0.9193
B.1.a.16 Region XIII 1.0188 0.5175 0.5273 0.5080
B.1.a.17 Nationwide 0.7215 0.5013 0.3617 0.6948
B.1.b b. Flood Control and Drainage Projects under RA No. 8150 0.9017 0.7432 0.6702 0.8242

Annex 7D. Absorptive Capacity Indices, By program/project/region, 1999Department of Public Works and Highways
Loan/Grant No. Reference No. Item BPI AUI ApUI OACI
B.1.b.1 NCR 0.6715 0.7821 0.5252 1.1648
B.1.b.2 Region I 0.9439 0.9872 0.9318 1.0459
B.1.b.3 Region II 1.0176 0.9743 0.9914 0.9574
B.1.b.4 Cordillera Administrative Region 0.9650 0.9214 0.8892 0.9548
B.1.b.5 Region III 0.8738 0.7734 0.6758 0.8851
B.1.b.6 Region IV-A 0.7263 0.9743 0.7076 1.3415
B.1.b.7 Region IV-B 1.1157 0.6244 0.6967 0.5597
B.1.b.8 Region V 1.0424 0.9538 0.9942 0.9150
B.1.b.9 Region VI 0.9859 0.6975 0.6877 0.7075
B.1.b.10 Region VII 1.0718 0.2470 0.2648 0.2305
B.1.b.11 Region VIII 0.8058 0.8973 0.7230 1.1136
B.1.b.12 Region IX 1.0939 0.7920 0.8663 0.7240
B.1.b.13 Region X 0.9839 0.8646 0.8507 0.8787
B.1.b.14 Region XI 0.8208 0.9432 0.7741 1.1491
B.1.b.15 Region XII 0.8656 0.9816 0.8497 1.1340
B.1.b.16 Region XIII 0.9853 0.8159 0.8039 0.8281
B.1.b.17 Nationwide 0.8667 0.5852 0.5072 0.6752
B.1.c c. Preliminary and Detailed Engineering 0.7574 0.2696 0.2042 0.3559
B.1.d d. National Buildings 0.9968 0.9602 0.9571 0.9633
NCR
Region IV-A
Nationwide
B.1.e e. Various Infrastructures including Local projects 0.7265 0.6843 0.4972 0.9419
B.1.f f. Ports 4.0302 0.8605 3.4681 0.2135
B.1.g g. Accessibility Facilities for the Disabled persons 0.0025 0.9910 0.0025 396.4000
B.1.h h. Infrastructure Support to Gender and Development 143.5894 0.8194 117.6576 0.0057
OthersSpecial Orders and Provisions 0.2117
Foreign Assisted Projects 0.9958 0.6560 0.6533 0.6587
Foreign Assisted Projects excluding SpecialProvisions/Executive Orders
0.9855 0.6558 0.6462 0.6654
B.11. a. Highways (Roads and Bridges) Projects Under 0.9621 0.6716 0.6461 0.6980R.A. No. 8150
OECF 0.9440 0.7490 0.7070 0.7934
PH-P131 & PH-P175
B.11.a.1 OECF-Assisted Second Mandaue-Mactan Bridge Project II,Cebu, 18th YCP and 21st YCP
0.9963 0.9857 0.9820 0.9894
PH-P132 B.11.a.2 OECF-Assisted Rosario-Pugo-Baguio Road Project, LaUnion and Benguet, 18th YCP
0.9963 0.6443 0.6419 0.6468
PH-P145 B.11.a.3 OECF-Assisted Phil-Japan Friendship HighwayRehabilitation Project, Phase 1, 19th YCP
0.7313 0.7444 0.5444 1.0179
PH-P146 B.11.a.4 OECF-Assisted Rehabilitaion and Maintenance of Bridgesalong Arterial Roads, Phase III, 19th YCP
0.9963 0.9068 0.9034 0.9102
PH-P147 B.11.a.5 OECF-Assisted Arterial Road Links Development Project,Phase 1, 19th YCP
0.9963 0.7716 0.7687 0.7745
PH-P162 B.11.a.6 OECF-Assisted Rural Road Network Development Project II,20th YCP
0.9950 0.0780 0.0776 0.0784

Annex 7D. Absorptive Capacity Indices, By program/project/region, 1999Department of Public Works and Highways
Loan/Grant No. Reference No. Item BPI AUI ApUI OACI
PH-P163 B.11.a.7 OECF-Assisted Arterial Road Links Development Project II,20th YCP
0.9950 0.7218 0.7182 0.7254
PH-P164 B.11.a.8 OECF-Assisted Phil-Japan Friendship HighwayRehabilitation Project II, 20th YCP
0.9950 0.8453 0.8411 0.8496
PH-P165 B.11.a.9 OECF-Assisted Metro Manila Interchange ConstructionProject III, 20th YCP
0.9950 0.0848 0.0844 0.0852
PH-P166 B.11.a.10 OECF-Assisted Mount Pinatubo Hazard Urgent MitigationProject (Road Component -Tarlac and Pampanga), TokyoSpecial Yen Credit Package, 21st YCP
1.0000 1.0000 1.0000 1.0000
PH-P174 B.11.a.11 OECF-Assisted Phil-Japan Friendship Highway RahabilitaionProject, Phase III, Mindanao Section (Agusan-Davao) 21stYCP
0.9950 0.6227 0.6196 0.6259
IBRD 0.9975 0.7177 0.7159 0.7195
Loan No. 3430-PHI B.11.a.12 IBRD-Assisted Highway Management Project including theProvinces of Pangasinan, Isabela, Cagayan, NegrosOcc./Oriental, Cebu, Zamboanga del Sur, Bukidnon, Davaodel Sur and Davao City
0.9975 0.7177 0.7159 0.7195
Australia 0.9950 0.9999 0.9949 1.0050
DAN-44 B.11.a.13 Australian-Assisted Rehabilitation and Upgrading of ExistingMetro Manila Urban Traffic Control System into "Smart"Trafffic Signal System Phase IV
0.9950 0.9999 0.9949 1.0050
United Kingdom 0.9950 0.0842 0.0837 0.0846
B.11.a.14 UK-Assisted Bridge Project 0.9950 0.0842 0.0837 0.0846
Asian Development Bank 0.9950 0.4175 0.4154 0.4196
Loan No PH-P1473/JEXIM Bank/OPEC
B.11.a.15 ADB-Assisted 6th Roads Improvement Project including theProvinces of Pangasinan, La Union, Zambales, Quezon,Batangas, Cavite, Palawan, Masbate, Aklan, Antique, Iloilo,Cebu, Negros Oriental, Zamboanga del Sur, MisamisOccidental, Davao Oriental, Davao del Norte, Lanao delNorte, North Cotobato, Sultan Kudarat, Agusan del Norte,Surigao del Sur, Catanduanes, Camarines Sur, Leyte,Quezon City, Ilocos Norte and Rizal
0.9950 0.4184 0.4163 0.4205
Loan No. PH-P1473/JEXIM Bank/OPEC
B.11.a.16 ADB-Assisted 6th Roads Improvement Project, C-3 Bridge,Navotas
0.9950 0.0000 0.0000 0.0000
B.11.b. Flood Control Projects under R.A. No. 8150 0.9950 0.6181 0.6150 0.6212
OECF 0.9950 0.6067 0.6037 0.6098
PH-P79 B.11.b.1 OECF-Assisted Metro Manila Flood Control Project II, (Balut,Vitas, and San Andres Pumping Stations), 14th YCP
0.9950 0.0298 0.0296 0.0299
PH-P87 B.11.b.2 OECF-Assisted Lower Agusan Development Project,Stage I,Phase I, Butuan City, 14th YCP
0.9950 0.5347 0.5320 0.5373
PH-P106 B.11.b.3 OECF-Assisted Pampanga Delta Development Project,Pampanga and Bulacan (Flood Control Component), 16thYCP
0.9950 0.5448 0.5420 0.5475
PH-P155 B.11.b.4 OECF-Assisted Agno and Allied Rivers Urgent RehabilitaionProject, Pangasinan, 20th YCP
0.9950 0.1951 0.1941 0.1960
PH-P166 B.11.b.5 OECF-Assisted Mount Pinatubo Hazard Urgent MitigationProject (FCD-Tarlac and Pampanga) Tokyo Special YenCredit Package, 21st YCP
0.9950 0.8926 0.8882 0.8971
PH-P179 B.11.b.6 OECF-Assisted Metro Manila Flood Control Project-West ofMangahan Floodway, Metro Manila and Rizal 21st YCP
0.9950 0.1725 0.1716 0.1734
PH-P180 B.11.b.7 OECF-Assisted Lower Agusan Development Project,Stage I,Phase II, Butuan City, 21st YCP
0.9950 0.2587 0.2574 0.2600
PH-P192 B.11.b.8 OECF-Assisted Iloilo City Flood Control Project, 22nd YCP 0.9950 0.9496 0.9449 0.9544
PH-P193 B.11.b.9 OECF-Assisted Agno and Allied Rivers Urgent RehabilitationProject, Phase II, Pangasinan, 22nd YCP Package I
0.9950 0.7424 0.7387 0.7462
JICA 0.9950 0.9013 0.8968 0.9058
B.11.b.10 Flood Mitigation Project in Ormoc City JICA Grant AidProgram
0.9950 0.9013 0.8968 0.9058
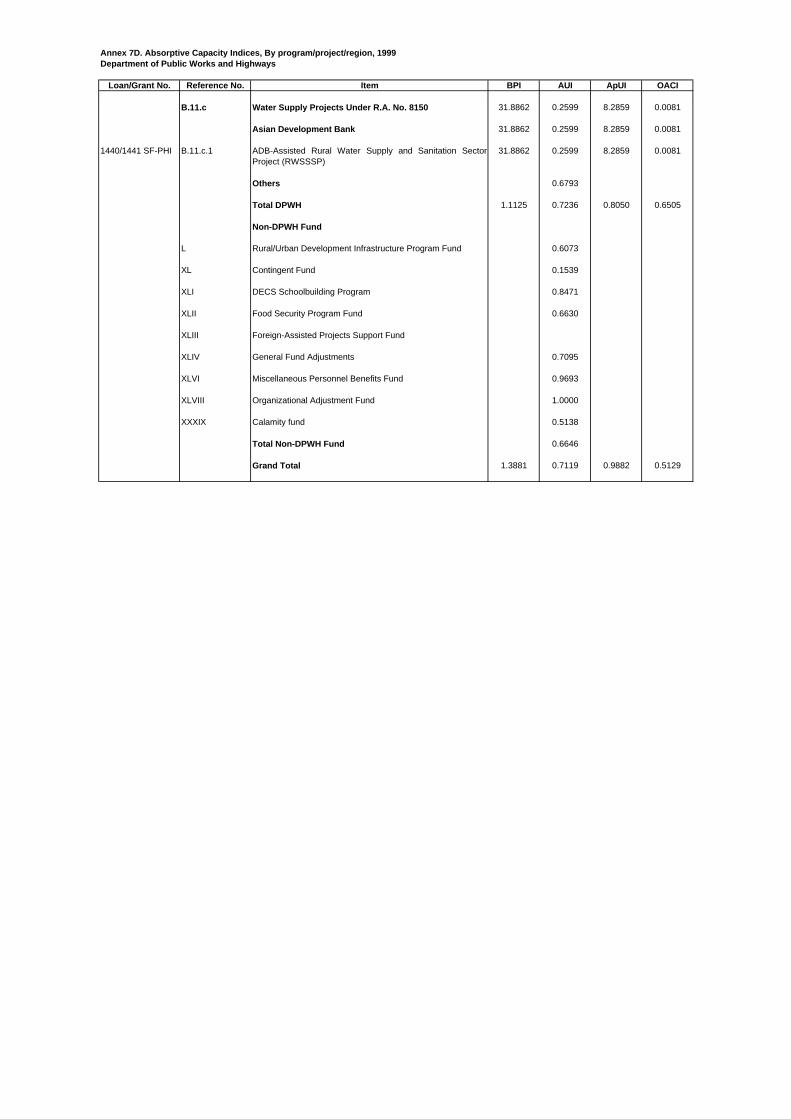
Annex 7D. Absorptive Capacity Indices, By program/project/region, 1999Department of Public Works and Highways
Loan/Grant No. Reference No. Item BPI AUI ApUI OACI
B.11.c Water Supply Projects Under R.A. No. 8150 31.8862 0.2599 8.2859 0.0081
Asian Development Bank 31.8862 0.2599 8.2859 0.0081
1440/1441 SF-PHI B.11.c.1 ADB-Assisted Rural Water Supply and Sanitation SectorProject (RWSSSP)
31.8862 0.2599 8.2859 0.0081
Others 0.6793
Total DPWH 1.1125 0.7236 0.8050 0.6505
Non-DPWH Fund
L Rural/Urban Development Infrastructure Program Fund 0.6073
XL Contingent Fund 0.1539
XLI DECS Schoolbuilding Program 0.8471
XLII Food Security Program Fund 0.6630
XLIII Foreign-Assisted Projects Support Fund
XLIV General Fund Adjustments 0.7095
XLVI Miscellaneous Personnel Benefits Fund 0.9693
XLVIII Organizational Adjustment Fund 1.0000
XXXIX Calamity fund 0.5138
Total Non-DPWH Fund 0.6646
Grand Total 1.3881 0.7119 0.9882 0.5129
Copyright © 2022 FDOKUMEN