An Assessment of Plate Waste within Milwaukee Public ...
35
An Assessment of Plate Waste within Milwaukee Public Schools’ Universal Free Breakfast-in-the-Classroom Christine Tran, Bill Emerson Congressional Hunger Fellow February 2009
-
Upload
khangminh22 -
Category
Documents
-
view
1 -
download
0
Transcript of An Assessment of Plate Waste within Milwaukee Public ...
An Assessment of Plate Waste within Milwaukee Public Schools’ Universal Free Breakfast-in-the-Classroom
Christine Tran, Bill Emerson Congressional Hunger Fellow
February 2009
Hunger Task Force
Page 1
Table of Contents EXECUTIVE SUMMARY .......................................................................................................................2
INTRODUCTION......................................................................................................................................3
BACKGROUND ........................................................................................................................................4 A. History of School Breakfast .........................................................................................................4 B. Federal Guidelines for the School Breakfast Program.................................................................5 C. Barriers to Breakfast.....................................................................................................................7 D. Breakfast in Wisconsin.................................................................................................................8 E. History of Breakfast in Milwaukee ..............................................................................................8 F. Provision 2 in MPS ......................................................................................................................9 G. Hunger Task Force’s Provision 2 Research .................................................................................9 H. Transition to Universal Free Breakfast-in-the-Classroom .........................................................10 I. UFBiC Plate Waste Study ..........................................................................................................12
METHODOLOGY ..................................................................................................................................13
RESULTS .................................................................................................................................................15 A. A. Breakfast Routines ................................................................................................................15 B. B.Plate Waste Evaluation...........................................................................................................17
MAJOR FINDINGS ................................................................................................................................24
RECOMMENDATIONS.........................................................................................................................24
REFERENCES.........................................................................................................................................25
APPENDICES..........................................................................................................................................27

Hunger Task Force
Page 2
Executive Summary For years, Wisconsin has perennially ranked last in school breakfast participation.1 This changed when Universal Free Breakfast-in-the-Classroom (UFBiC) was piloted in the Milwaukee Public Schools (MPS). The outreach and UFBiC program implementation in Milwaukee contributed to the 25 percent increase of children eating free and reduced-price breakfast in Wisconsin during the 2006-2007 school year.2
UFBiC makes breakfast more accessible by providing a nutritious breakfast to all students regardless of income. In recognizing the importance of breakfast, UFBiC was supported by the school district, advocacy groups, and the community-at-large to increase breakfast participation access in MPS. Despite the program support and breakfast participation increase, there has been anecdotal feedback in Milwaukee about the type of UFBiC meals served and how much food actually is consumed by students. Given this, Hunger Task Force found it important to evaluate “plate waste,” or the amount of food wasted during UFBiC. Approximately 470 students at 23 UFBiC school sites were observed, resulting in 2,402 observations that yield the following major findings:
Low waste: Overall, there is very little waste (4.8 percent) in UFBiC Programming. The majority of students are eating breakfast every day.
Instructional time: UFBiC does not take up a lot of instructional time. Breakfast is usually served within 15 to 20 minutes. UFBiC Programming is also used as an instructional tool by educators as they teach children various life skills.
Grade-level eating trends: Older students consume more food and waste less, demonstrating a correlation between consumption trends and the growing needs of students as they age.
MPS food policy: Some teachers and principals are not fully aware of the MPS food policy for UFBiC which states that students may save unopened items for later consumption. Knowledge of this policy can reduce waste at UFBiC school sites.
1 See Food Research and Action Center (FRAC) School Breakfast Scorecard 2005, available at http://www.frac.org 2 See FRAC School Breakfast Scorecard 2007, available at http://www.frac.org
Hunger Task Force
Page 3
Introduction Breakfast has long been considered the most essential meal of the day. But regardless of income or family status, many families find it difficult to eat breakfast. Today, families face busy work schedules and other financial priorities. Additionally, many children are faced with long distances to school and a lack of resources at home. These barriers prove difficult in providing children with proper access to nutritious morning meals. Often schools take over the role of providing breakfast to close the achievement gap in order to safeguard children’s well-being and ensure academic achievement.
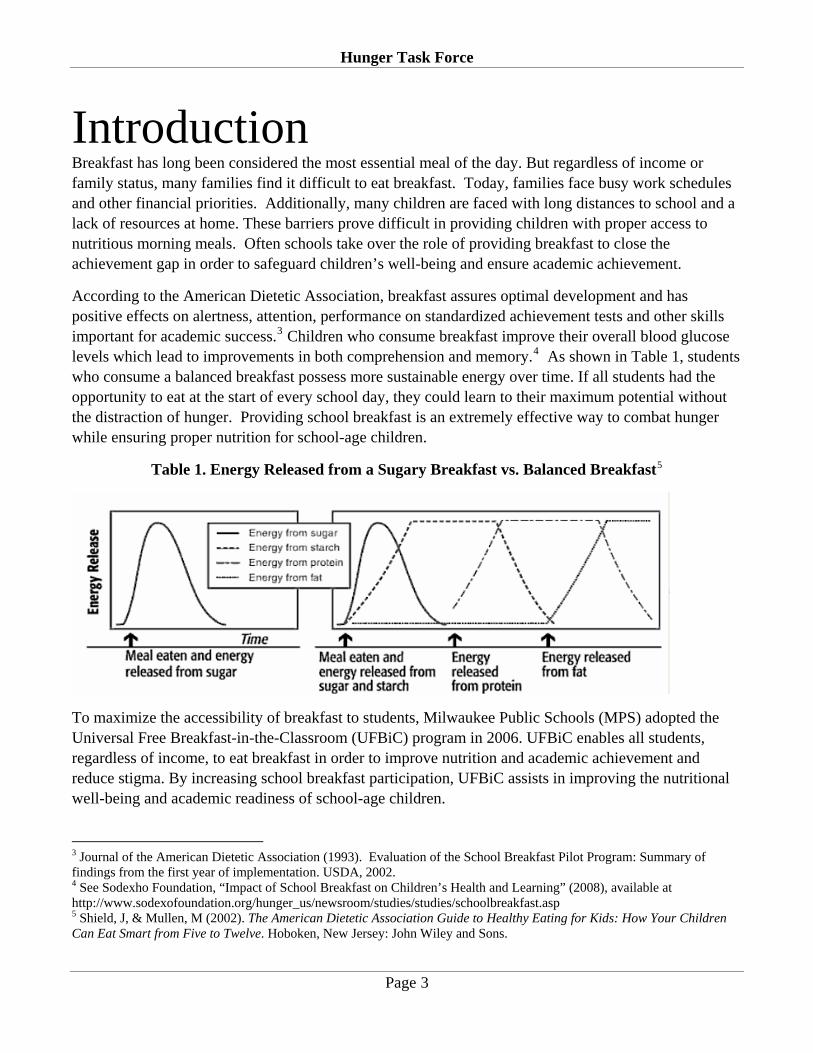
According to the American Dietetic Association, breakfast assures optimal development and has positive effects on alertness, attention, performance on standardized achievement tests and other skills important for academic success.3 Children who consume breakfast improve their overall blood glucose levels which lead to improvements in both comprehension and memory.4 As shown in Table 1, students who consume a balanced breakfast possess more sustainable energy over time. If all students had the opportunity to eat at the start of every school day, they could learn to their maximum potential without the distraction of hunger. Providing school breakfast is an extremely effective way to combat hunger while ensuring proper nutrition for school-age children.
Table 1. Energy Released from a Sugary Breakfast vs. Balanced Breakfast5
To maximize the accessibility of breakfast to students, Milwaukee Public Schools (MPS) adopted the Universal Free Breakfast-in-the-Classroom (UFBiC) program in 2006. UFBiC enables all students, regardless of income, to eat breakfast in order to improve nutrition and academic achievement and reduce stigma. By increasing school breakfast participation, UFBiC assists in improving the nutritional well-being and academic readiness of school-age children.
3 Journal of the American Dietetic Association (1993). Evaluation of the School Breakfast Pilot Program: Summary of findings from the first year of implementation. USDA, 2002. 4 See Sodexho Foundation, “Impact of School Breakfast on Children’s Health and Learning” (2008), available at http://www.sodexofoundation.org/hunger_us/newsroom/studies/studies/schoolbreakfast.asp 5 Shield, J, & Mullen, M (2002). The American Dietetic Association Guide to Healthy Eating for Kids: How Your Children Can Eat Smart from Five to Twelve. Hoboken, New Jersey: John Wiley and Sons.
Hunger Task Force
Page 4
Background A. HISTORY OF SCHOOL BREAKFAST
From 1944 to 1946, $50 million were appropriated annually by Congress to assist schools with meal operations. Since the funding was not permanent, many local schools boards were reluctant to participate.6 In 1946, Congress established the National School Lunch Act as a “measure of national security, to safeguard the health and well-being of the Nation’s children” (Public Law 79-396). Additionally, schools were given surplus commodities when possible.
On October 11, 1966, the Child Nutrition Act was signed into law by President Lyndon B. Johnson. The act was the first major change to the National School Lunch Program by placing the United Sates Department of Agriculture (USDA) in charge of food services to ensure uniform operational standards as well as expanded administrative support (Public Law 89-642). In addition, the Act established the School Breakfast Program (SBP) as a two-year pilot program to provide categorical grants in support of meal service to students who lived in poor areas or areas where they had to travel a great distance to get to school. During the first year of operation, the SBP served approximately 80,000 children at a federal cost of $573,000.7
Over the next few years, modifications were made to expand the program. In 1971, the School Breakfast Program was extended through 1973. The USDA was allowed to pay 100 percent of the operating costs of school breakfast programs in severe need areas, and eligibility for free and reduced-price breakfasts was made available by basing income guidelines on National School Lunch Program standards (Public Law 92-32). This amendment enabled Congress to give priority consideration for the program to include schools in which there was a special need to improve the nutrition and dietary practices of children of working mothers and low-income families.8 In 1975, the Child Nutrition Act made the School Breakfast Program a permanent entitlement program to provide all students across the country access to nutritionally balanced breakfast meals (Public Law 94-105).
Today, as stakeholders recognize the importance of breakfast as well as the growing need for adequate nutrition, the School Breakfast Program has significantly expanded to provide students nutritious morning meals. During the 2006-2007 school year, 8.1 million low-income children, or children who qualified for free and reduced-price meals, participated in the School Breakfast Program on an average day.9
In the 2007-2008 school year, almost 8.5 million low-income children nationally ate breakfast at school on an average school day, representing a four percent increase from the previous school year.10 Despite this important growth, nationally the School Breakfast Program still reaches only 45.9 percent of low- 6 See USDA, National School Lunch and School Breakfast Reforms, available at www.ers.usda.gov 7 See USDA, School Breakfast Program History, available at http://www.fns.usda.gov/ 8 Ibid 9 See FRAC School Breakfast Scorecard 2007, available at http://www.frac.org 10 See FRAC School Breakfast Scorecard 2008, available at http://www.frac.org
Hunger Task Force
Page 5
income children for every 100 reached by the National School Lunch Program during 2007-2008.11 Children who qualify for free or reduced-price lunches are eating lunch, but are not getting proper access to breakfast service. In 2008, over 13 million children in the United States lived in impoverished households, 1.7 million more low-income children than in 2000.12
Legislative changes to the program can either improve of hinder its outreach. Though the School Breakfast Program and the National School Lunch Program are permanently established, they must be reauthorized every five years. During this time, amendments can be made to adjust the programs to address current trends and issues. The Child Nutrition and WIC Reauthorization Act of 2004 currently expires on June 30, 2009. For many advocacy groups, state agencies, politicians and other stakeholders, reauthorization allows an opportunity for program improvements. Advocacy groups such as Hunger Task Force that support the School Breakfast Program are promoting the expansion of universal free breakfast programming - especially in areas of high poverty.
B. FEDERAL GUIDELINES FOR THE SCHOOL BREAKFAST PROGRAM
The School Breakfast Program is a federally funded entitlement program providing reimbursement for breakfast meals. The USDA’s Food and Nutrition Service (FNS) division oversees the program nationally, while the program is administered by state education agencies. Local school food authorities operate the program at voluntary public or private school site-levels.
Based on federal regulations, school meals are intended to protect the well-being and health of the nation’s children. By following specific nutritional guidelines, entitlement programs like the School Breakfast Program help alleviate food insecurity among school-age children by providing access to nutritious and low-cost meals. The School Breakfast Program provides students with 25 percent (approximately 600 calories) of their recommended daily allowances for protein, iron, calcium, and vitamins A and C. Meals must adhere to the following caloric standards and USDA breakfast meal patterns:13
• At least 60 percent of calories are from carbohydrates • Less than 30 percent are calories from fat • 10 to12 percent of calories are from protein
11 Ibid. 12 See National Center for Children in Poverty, “Who are America’s Poor Children?,” available at http://www.nccp.org/publications/pub_843.html#1 13 See USDA, Menu Planning in the School Breakfast Program, available at http://www.fns.usda.gov/

Hunger Task Force
Page 6
Table 2. USDA Breakfast Meal Patterns Pattern 1 Pattern 2 Pattern 3 • 2 servings Whole
Grains/Breads • ½ cup Fruit or Fruit Juice • 8 oz. Milk
• 1 serving Whole Grains/Bread
• 1 oz. Meat or Meat Alternative
• ½ cup Fruit or Fruit Juice • 8 oz. Milk
• 2 oz. Meat or Meat Alternative
• ½ cup Fruit or Fruit Juice • 8 oz. Milk
Though any child who attends a participating school may purchase a meal through the School Breakfast Program, household income determines a child’s eligibility to receive free or reduced-priced meals. Free meals are available to households at or below 130 percent of the federal poverty level, while reduced-price meals are available to households with incomes between 130 percent and 185 percent of the federal poverty level. Income eligibility guidelines for free and reduced-price meals are updated annually. Students who receive free or reduced-price meals are considered low-income or students in need.
Table 3. Child Nutrition Programs’ Income Eligibility Guidelines for Free and Reduced-Price Meals for the 2008-2009 School Year14
Free Eligibility Scale: at or below 130% of the poverty level
Reduced-Price Scale: 130% and 185% of the poverty level
Household Size Annual Income Household Size Annual Income 1 $13,520 1 $19,240 2 $18,200 2 $25,900 3 $22,880 3 $32,560 4 $27,560 4 $39,220 5 $32,240 5 $45,880
The School Breakfast Program operates on a system where USDA provides schools with cash reimbursement for each breakfast served. Schools are placed in two categories: non-severe or severe need. Non-severe status is allocated when a school site has less than 40 percent of their lunches served free or at a reduced-price in the preceding year; a severe need school has at least 40 percent of their lunches served free or at a reduced-price in the preceding year. For the 2008-2009 school year, the basic cash reimbursement rates for students at schools with non-severe need are:
• Free breakfasts $1.40 • Reduced-price breakfasts $1.10 • Paid breakfasts $0.25
Schools that qualify for the status of severe need receive a higher reimbursement rate of up to an additional 28 cents. To qualify, schools must meet the requirement that 40 percent or more of the lunches served to students at that school in the preceding school year were served free or at a reduced-
14 See USDA, 73 FR 19186, available at http://www.fns.usda.gov/
Hunger Task Force
Page 7
price. According to USDA, this measure ensures that students of the greatest need receive appropriate nutrition through entitlement meal programming. Based on federal regulations, schools must operate their meal services as not-for-profit programs. Schools may set their own breakfast rates for students who pay full price for breakfast, while reduced-price students may not be charged more than 30 cents.
C. BARRIERS TO BREAKFAST
Though the value for breakfast has grown considerably throughout the years, the maximum number of students who need breakfast is not being met. Though nearly 100,000 individual schools offer a school lunch in this country, more than 15,000 of those schools still do not make breakfast attainable to children in need.15 In addition, some of the barriers to breakfast service include: the stigma of receiving free meals, school buses that arrive too late for breakfast, households that cannot afford breakfast, as well as working parents who lack sufficient time to prepare breakfast at home.
According to the Food Research and Action Center (FRAC), many students who qualify for free or reduced-priced school breakfasts do not participate because “they do not wish to identify themselves as low-income by eating school breakfast.”16 To alleviate this problem, many schools have turned to universal free breakfast, which refers to providing students with breakfast at no charge regardless of household income. In order for schools to implement a universal free breakfast model, they must acquire supplemental funding from the local or state levels to offset differential costs. Though universal free breakfast solves the issue of students who fear being stigmatized as poor, other barriers still inhibit school participation.
Since its inception in 1966, the school breakfast was intended for students who had long bus rides to school and were unable to eat breakfast. Today, students still are not receiving breakfast due to school transportation issues. When school buses are late to schools, students miss out on breakfast. Some students wake up so early in order to take the bus that they do not have time to eat at home as well. Since impediments like this exist for breakfast, schools have turned to other service models, moving away from breakfast service in the cafeteria.
Schools that have noticed the need for a nutritious morning meal have turned to Universal Free Breakfast-in-the-Classroom (UFBiC) models where all children eat their morning meal in the classroom. UFBiC can increase low breakfast participation by providing greater access. Schools that have turned to UFBiC have done so for a multitude of reasons such as the need to improve academic performance, attendance, and/or student health issues. With UFBiC, all students can eat regardless of income status and how they get to school. In districts that implement UFBiC, participation rates typically rises, in many cases, by more than 50 percent over starting rates. 17
15 See Sodexho Foundation, “Impact of School Breakfast on Children’s Health and Learning,” available at http://www.sodexofoundation.org/hunger_us/newsroom/studies/studies/schoolbreakfast.asp 16 See FRAC Universal School Breakfast Fact Sheet, http://www.frac.org 17 See Sodexho Foundation, “Impact of School Breakfast on Children’s Health and Learning,” available at http://www.sodexofoundation.org/hunger_us/newsroom/studies/studies/schoolbreakfast.asp
Hunger Task Force
Page 8
D. BREAKFAST IN WISCONSIN
According to FRAC during the 2004-2005 school year, “Wisconsin has perennially ranked last in school breakfast participation.”18 In 2006-2007 the number of children eating free and reduced-price breakfast in Wisconsin increased by 25 percent.19 Much of the increase in breakfast participation can be attributed to local efforts in communities like Milwaukee implementing UFBiC. Milwaukee public elementary schools alone raised numbers by 16 percent statewide. 20 With the increase in breakfast participation, Wisconsin passed Act 20 in 2007 to increase the per-breakfast reimbursement from 10 cents to 15 cents as a supplemental incentive for schools to further expand their programming.
Though Wisconsin has seen a significant rise in breakfast participation, Wisconsin still ranks low in comparison to national rankings. For the 2007-2008 school year, Wisconsin is ranked 43rd in the nation with a breakfast participation ratio of 37.6 to every 100 students in the National School Lunch Program.21 It is clear that a disparity still exists locally and statewide. Currently, every MPS school site today offers breakfast, but not all sites have accessible breakfast programs like UFBiC.
E. HISTORY OF BREAKFAST IN MILWAUKEE
Milwaukee has a historic relationship of providing students access to nutritious meals. Long before Congress took initiatives towards child nutrition policies, Milwaukee pioneered ways to address childhood hunger. In the early 1900s, John Martin McCoy, a prominent local businessman and philanthropist, instituted the “penny lunch” program for the school children of Milwaukee to address the wide spread issue of hunger in the community. 22 In 1904, with the help of McCoy, the Women’s School Alliance of Wisconsin began administering a meal program at three centers located in working class areas with the greatest need.23 These historical efforts demonstrate Milwaukee’s long history with attempts to directly combat childhood hunger.
In 1970, parents from Milwaukee’s central-city were concerned about children going to school hungry. This led to a coalition with a local church to set up free breakfast programs at three MPS elementary school sites. At the time, the coalition was called Citizens for Central City School Breakfast Programs. In 1974, the group was renamed the Hunger Task Force. Established to directly combat childhood hunger, Hunger Task Force focused on community organizing and advocacy to promote an anti-hunger agenda. Over the years, MPS and Hunger Task Force implemented and evaluated various methods to increase breakfast participation within the district.
18 See FRAC School Breakfast Scorecard 2005, http://www.frac.org 19 See FRAC School Breakfast Scorecard 2007, http://www.frac.org 20 See FRAC School Breakfast Scorecard 2005, http://www.frac.org 21 See FRAC School Breakfast Scorecard 2008, available at http://www.frac.org 22 Baker, E.U. (1914) Wisconsin: Its Story and Biography 1848-1913. Chicago, IL: The Lewis Publishing Company. 23 Gunderson, Gordon (1971). The National School Lunch Program, available at: http://www.fns.usda.gov/cnd/lunch/AboutLunch/ProgramHistory.htm
Hunger Task Force
Page 9
F. PROVISION 2 IN MPS
During the summer of 2004, Hunger Task Force began researching a federal option called Provision 2, wherein schools can serve meals at no charge to all students regardless of household income to increase breakfast participation. (For more Provision 2 information, go to Appendix A on page 29.)
Best practices and statistics were collected from other Midwest school districts that offered Provision 2. Later that year, Hunger Task Force met with MPS district officials to advocate for the implementation of Provision 2 at MPS. With the overwhelming support from various interest groups, Superintendent William Andrekopolous proposed the implementation of Provision 2 in April 2005 for the 2005-2006 school year.24 The proposal included a $150,000 budget to cover costs for a pilot breakfast and lunch program at six elementary schools: Allen Field, Bethune, Longfellow, 38th Street, Carver and Wheatley. Four schools offered universal free breakfast in the cafeteria, while two of the six pilot schools offered breakfast in the classroom. The six pilot schools were chosen based on:
• High rates of free and reduce-priced eligible students • Indication of high poverty in the geographical area • Administrative ability to support the implementation of the pilot program
G. HUNGER TASK FORCE’S PROVISION 2 RESEARCH
In February 2006, Hunger Task Force completed a report titled: Evaluation of the 2005-2006 Provision 12 Pilot in Milwaukee Public Schools. The report addressed the need for Provision 2, the impact of Provision 2 on students and families, meal operations, breakfast participation and the meal application process.25
Through written and oral surveys and quantitative data collection, the findings included:
• 90 percent of school staff and 64 percent of parents reported that it is extremely important for all students to get free breakfast and lunch at their school.
• 92 percent of staff and 98 percent of parents at the pilot schools highly supported expansion of universal free meals to the entire district.
• More than 60 percent of parents indicated the program reduced time, stress and financial burdens.
• At least 70 percent of school staff reported positive impacts on school breakfast and its positive influences student behavior, learning, health, and socialization.
24 Interest groups included: Milwaukee City Council, Parent Teacher Association, Milwaukee Dietetic Association, Milwaukee Jewish Council, Wisconsin Council on Children and Families, Milwaukee Teachers Education Association, Service Employees International Union Local 150, Interfaith Conference of Greater Milwaukee, City of Milwaukee Health Department, and Wisconsin School Nutrition Association 25 Wong, K. (2006). Evaluation of the 2005-2006 Provision 12 Pilot in Milwaukee Public Schools. Milwaukee, WI: Hunger Task Force. Available at www.hungertaskforce.org
Hunger Task Force
Page 10
H. TRANSITION TO UNIVERSAL FREE BREAKFAST-IN-THE-CLASSROOM
Though Provision 2 was a good pathway toward exploring universal free breakfast, it did not meet the financial needs of the district. For instance, meeting the Provision 2 requirements of 100 percent return rates of meal applications at local schools was difficult to attain. This can be attributed to various reasons such as parents of students who pay for school meals lack incentives to return meal applications or parents may not want to submit social security information. Additionally, the reimbursement rates under Provision 2 could potentially be lower if school sites experience increases of free or reduced-price students after the base year. To provide universal free meals, schools electing the Provision 2 alternative must pay the difference between federal reimbursement and the cost of providing all school meals (lunch and breakfast in this case) at no charge. This budget disparity was fiscally difficult for MPS. Ultimately under Provision 2, MPS could not maximize their reimbursement potential.
Furthermore, federal programs like E-rate26 and Title I funding27, as well as the Wisconsin Student Achievement Guarantee in Education (SAGE) program28 are tied to low-income household information of students eligible for free or reduced-price meals. Funding allocations for these federal programs are commonly collected through school meal applications. Since applications were only needed during the base year using Provision 2, income data were no longer collected on an annual basis. A 2003 USDA No Child Left Behind memo29 allows for Title I funding to continue based on the Provision 2 base year. A similar provision is not currently available for SAGE in Wisconsin. Because of the potential state funding loss for not collecting income data through annual meal applications, MPS began exploring options that would maximize free breakfast while still maintaining all state and federal low-income student funding sources through annual income data collection.
To continue with the universal free breakfast initiative, Superintendent Andrekopolous initiated a proposal of spending $1 million in local tax levy toward the UFBiC program in the 2006-2007 budget with the following major conditions:
Table 4. Major Conditions in MPS UFBiC Agreement30
Conditions Purpose Serve breakfast in the classroom To maximize breakfast participation rates Meet a 95 percent meal application return rate
To maximize federal and state funding for schools with high percentages of low-income students
Collaborate with Hunger Task Force on research and evaluation of the program
To evaluate program effectiveness in order to ensure nutritional security
26 E-rate: A federal program providing discounts to assist schools in obtaining affordable telecommunication and internet access. 27 Title I: Supplementary federal funding distributed to schools with a high percentage of low-income student. 28 SAGE: a state program established in the 1996-97 school year to improve student achievement in low-income areas through the implementation specific school-improvement strategies. Schools receive state aid equal to $2,250 for each low-income K-3 child. 29 See USDA, No Child Left Behind Memo: 20 Feb. 2003, available at http://www.fns.usda.gov/ 30 See Appendix B on page 28 for a copy of the 2008-2009 agreement form
Hunger Task Force
Page 11
Hunger Task Force advocated for the UFBiC tax levy support, and the funding was approved by the MPS School Board in the 2006-07 budget. In both 2007-08 and 2008-09, the Superintendent proposed and MPS School Board approved $1 million in tax levy toward this program. The funding is set aside to help cover lost revenue incurred by the district from serving free breakfasts to all students in the approved UFBiC schools. This funding was directed to 63 schools serving UFBiC in 2006-07; 72 schools in 2007-08; and at least 75 schools for 2008-09.
In addition to advocating for local tax levy support to increase breakfast participation, Hunger Task Force aggressively worked with MPS schools in the summer and fall of 2006, 2007 and 2008 to increase meal application return rates. Hunger Task Force staff and Congressional Hunger Fellows31 conducted school meal outreach at back-to-school functions as well as various community events. Hunger Task Force staff also directly called MPS parents if school meal applications had not been returned. Since the fall of 2006, Hunger Task Force staff and volunteers have spent over 3,500 hours working with district and school staff to increase meal application return rates.
As part of the UFBiC agreement, the Hunger Task Force published Preliminary Findings from the 2006-2007 Universal Free Breakfast Initiative in Milwaukee Public Schools in 2007.32 The report presented an early assessment of UFBiC by interviewing and surveying over 500 principals, teachers, social workers, food service managers, food service workers, building engineers and school nurses in UFBiC schools. Findings included:
• 94 percent of principals interviewed said the district should provide free breakfast to all students. • Between November 2005 and November 2006, school breakfast participation increased 240
percent in the UFBiC schools. • 70 percent of school staff surveyed say the UFBiC has a positive impact on their students’
learning, learning readiness and health. • 84 percent of school staff had positive feedback about the quality of the food served during
breakfast. • 48 percent of school staff surveyed say the UFBiC has a positive impact on instructional time.
The report demonstrated that UFBiC has resulted in positive changes within the school environment. Many principals have opted to participate in UFBiC to reap the benefits experienced at existing UFBiC sites.
Today, Hunger Task Force continues active participation and research. Currently, it is conducting a three-year longitudinal study tracking UFBiC participating third grade students over a three-year period. The purpose of this study is to track students in the original UFBiC schools and compare their breakfast eating habits to test scores, disciplinary issues, attendance and nurse visits. The study will conclude its final year of data collection during the 2008-2009 school year with a report to follow.
31 Bill Emerson Congressional Hunger Fellows are from the Congressional Hunger Center, a nonprofit bipartisan anti-hunger training organization located in Washington, D.C. 32 Lent, M. (2007). Findings from the 2006-2007 Universal Free Breakfast Initiative in Milwaukee Public Schools in 2007. Milwaukee, WI: Hunger Task Force. Available at www.hungertaskforce.org
Hunger Task Force
Page 12
I. UFBiC PLATE WASTE STUDY
Sine the implementation of UFBiC, the Hunger Task Force heard concerns from stakeholders such as parents, school staff and school board directors regarding waste of breakfast in the classroom. In order to gauge the efficiency and reception of UFBiC, measuring “plate waste,” or the amount of food served that goes uneaten by the student, can prove useful in evaluating the program.
Not only does “plate waste” demonstrate a loss of financial investment, but it also is an important indicator that children’s nutritional needs are not being met. If meals served to children are undereaten, then the nutrients required by school meals are not meeting the children’s nutritional needs and requirements. Hunger Task Force analyzed plate waste during UFBiC service to provide quantifiable data regarding the trends of student consumption and waste of the items served by documenting the following:
• What is being served? • Is the quantity appropriate for the students? • Are students really eating the food provided? • What food items do students like and dislike? • How much is being thrown away?
This report is intended for stakeholders including parents, school staff, administrators, school nutrition personnel, school board members, and policy makers to better understand the value of UFBiC. The information gleaned from this study documents the type of improvements that are needed in order to ensure the longevity and best practices of UFBiC programming.
Hunger Task Force
Page 13
Methodology
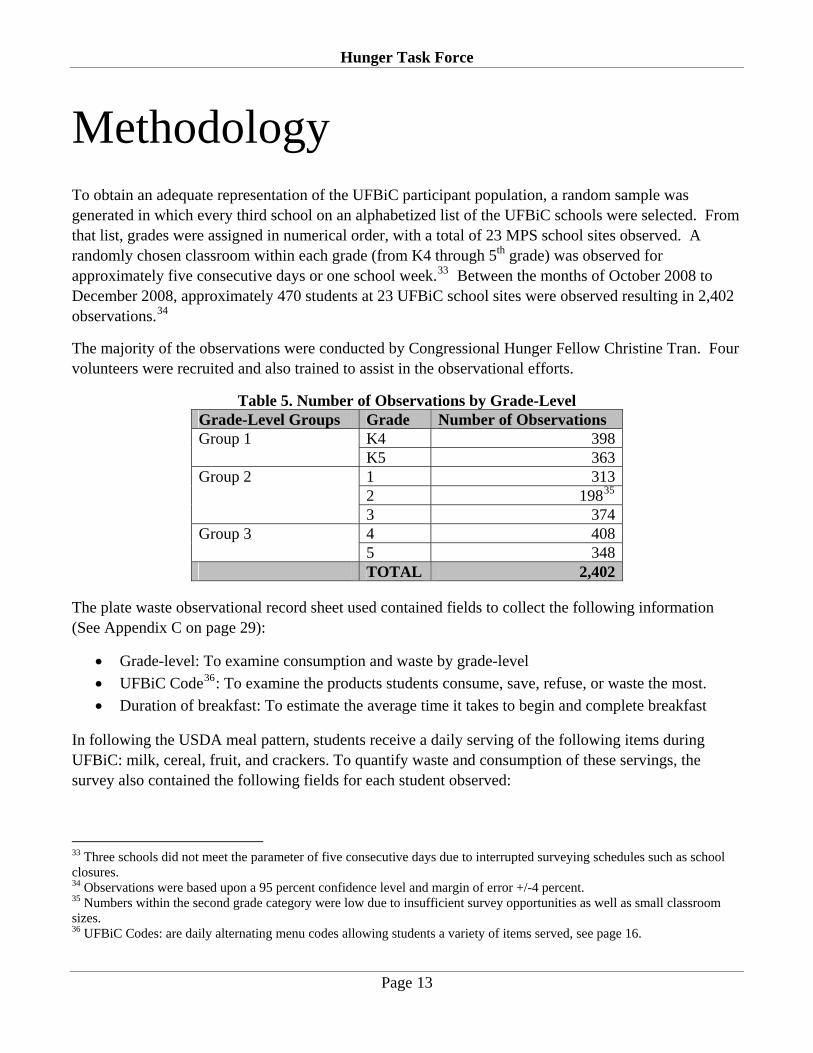
To obtain an adequate representation of the UFBiC participant population, a random sample was generated in which every third school on an alphabetized list of the UFBiC schools were selected. From that list, grades were assigned in numerical order, with a total of 23 MPS school sites observed. A randomly chosen classroom within each grade (from K4 through 5th grade) was observed for approximately five consecutive days or one school week.33 Between the months of October 2008 to December 2008, approximately 470 students at 23 UFBiC school sites were observed resulting in 2,402 observations.34
The majority of the observations were conducted by Congressional Hunger Fellow Christine Tran. Four volunteers were recruited and also trained to assist in the observational efforts.
Table 5. Number of Observations by Grade-Level Grade-Level Groups Grade Number of Observations Group 1 K4 398 K5 363 Group 2 1 313 2 19835
3 374 Group 3 4 408 5 348 TOTAL 2,402
The plate waste observational record sheet used contained fields to collect the following information (See Appendix C on page 29):
• Grade-level: To examine consumption and waste by grade-level • UFBiC Code36: To examine the products students consume, save, refuse, or waste the most. • Duration of breakfast: To estimate the average time it takes to begin and complete breakfast
In following the USDA meal pattern, students receive a daily serving of the following items during UFBiC: milk, cereal, fruit, and crackers. To quantify waste and consumption of these servings, the survey also contained the following fields for each student observed:
33 Three schools did not meet the parameter of five consecutive days due to interrupted surveying schedules such as school closures. 34 Observations were based upon a 95 percent confidence level and margin of error +/-4 percent. 35 Numbers within the second grade category were low due to insufficient survey opportunities as well as small classroom sizes. 36 UFBiC Codes: are daily alternating menu codes allowing students a variety of items served, see page 16.
Hunger Task Force
Page 14
• Fully eaten: Student fully consumed the serving provided • Partially eaten: Student partially consumed about half or more of the serving provided • Wasted: Student wasted the entire or most of serving provided • Saved: Student save the unopened serving provided for later • Refused: Student refused the serving provided
The course of the observation entailed the following procedures:
• Arrival prior to the start of breakfast • Record the start time of breakfast • Note the number of students who refused breakfast or items in breakfast • Note during the course of breakfast consumption, classroom routines, teacher agendas and
student consumption habits • Record what was consumed, wasted or saved at the trash can when students completed breakfast • Record the end time of breakfast
The collected data was then computed and evaluated based on grade level and UFBiC Code to measure waste and consumption. Additionally, qualitative data such as observations of breakfast classroom routines were also collected to understand how UFBiC is implemented during class time. During this time, the duration of breakfast, classroom policies for saving or refused breakfast items, and types of morning routines were observed in order to collect information for best practices in implementing UFBiC.
Though the information gained in this study can prove useful for understanding plate waste during breakfast service, there are some limitations to this study. Observations of plate waste allow the recording of student trends through actions, yet does not account for anecdotal reasons as to why students are wasting food. Hunger Task Force did not seek MPS or Institutional Review Board (IRB)37 approval to interview minor-age subjects, therefore data gathered are only through observations and not student interaction. Additionally, each school site varies in the duration of UFBiC participation. Therefore schools that are relatively new to the program may experience issues that are not similar to sites with a longer history of UFBiC. Despite these limitations, this study provides meaningful information that is useful toward understanding plate waste. Furthermore, by analyzing this information stakeholders can better understand how to provide children with the nutrition they are entitled to through the School Breakfast Program.
37 IRB: a committee designated by an institution to protect the rights of human subjects within a research project.
Hunger Task Force
Page 15
Results In analyzing the results of our plate-waste study, two major sections emerged to better understand plate-waste among UFBiC participants:
A. Breakfast Routines 1. Breakfast contents 2. Classroom Routines 3. UFBiC Served & Unserved Food/Beverages Policy
B. Plate Waste Evaluation 1. Overall Consumption Trends 2. Consumption Trends by Meal Component 3. Consumption Trends by UFBiC Code 4. Consumption Trends by Item 5. Consumption Trends by Grade-Level
A. BREAKFAST ROUTINES
1. Breakfast Contents All UFBiC breakfasts meet federal regulations standards. Each breakfast is boxed in light-weight cardboard and contains cereal, crackers, and juice/fruit items. Cereal boxes and milk cartons are delivered to classrooms before the start of class every morning by food service workers. In addition, each classroom receives a class roster to document students who receive a breakfast and garbage bags for after-breakfast clean up. To diversify the students’ breakfast schedule and provide more options, participating UFBiC school sites conduct breakfast service in accordance with a daily alternating coded schedule:
Table 6. MPS School Nutrition Services’ UFBiC Breakfast Codes38
Code Breakfast Contents A Cocoa Munchies, Pretzel Goldfish, Apple Juice, Choice of Milk B Corn Flakes, Strawberry Waffle Cracker, Grape Juice, Choice of Milk C Fruit Whirls, Cheddar Goldfish Crackers, Strawberry Kiwi Juice, Choice of Milk D Toasted Oats, Orange Tropical Crackers, Fruit Punch Juice, Choice of Milk E Bunch O Cinnamon Squares, Vanilla Bears, Orange Juice, Choice of Milk F Corn Puffs, Honey Graham Crackers, Strawberry Kiwi Juice, Choice of Milk G Apple Whirls, Cinnamon Apple Waffle Grahams, Apple Juice, Choice of Milk H Rice Crispies, Blueberry Waffle Crackers, Fruit Punch Juice, Choice of Milk I Crunchmania Crackers, Applesauce Cup, Choice of Milk J Frosted Shredded Wheat Bites, Austin Cheese Crackers, Orange Juice, Choice of Milk K Frosted Flakes, Parmesan Goldfish Crackers, Grape Juice, Choice of Milk L Raisin Bran, Lemon Dinosaur Crackers, Apple Juice, Choice of Milk
38 MPS School Nutrition Services 2008-2009 Menu and Calendar
Hunger Task Force
Page 16
2. Classroom Routines Food service workers deliver breakfast components prior to the start of class, allowing breakfast to start immediately when class starts. Most MPS schools start at 7:45 a.m., while a few begin their day at 9:00 a.m. The duration of breakfast takes approximately 15 to 20 minutes. Breakfast is most productive in classrooms that have specific morning routines for students and teachers. Specific daily routines can efficiently manage breakfast consumption time without losing instructional time. The most commonly observed classroom routines are shown in the chart below:
Table 7. Common Classroom Routines by Grade-Level Grade-Level Teacher Routines Student Routines K4-K5 • Take attendance
• Record number of students eating breakfast
• Teach students basic skills in eating breakfast (e.g. how to pour milk and open cereal boxes)
• Teach students basic life skills after eating breakfast (e.g. brushing their teeth and washing their hands)
• All teachers have an after-breakfast routine
• Students usually focus on eating only
• Some teachers integrate routines where students save their juice boxes and crackers for later
• Students are taught after-breakfast routines like washing their hands, brushing their teeth and silent reading
• When done, students go to a common area to look at picture books
1-3 • Take attendance • Record number of students
eating breakfast • Complete other necessary tasks
like calling parents • Converse with students about
their homework and breakfast • All teachers have an after-
breakfast routine
• Students usually focus on eating only
• Some teachers are able to teach students to complete smaller tasks such as submitting their homework while breakfast boxes are distributed
• Some teachers integrate routines where students save their juice boxes and crackers for later
4-5 • Take attendance • Record number of students
eating breakfast • Complete other necessary tasks
like calling parents • All teachers have breakfast
lessons as well as after-breakfast routines
• Most classrooms are able to multi-task, where many teachers have students complete language arts or mathematical warm-ups during breakfast or silent reading after breakfast
• Depending on classroom rules, most students independently save their juice boxes and crackers for later

Hunger Task Force
Page 17
3. UFBiC Served & Unserved Food/Beverages Policy
Students may save their breakfast items for later consumption. Some of the waste in the classroom is due to the lack of policy knowledge. Not all teachers and principals are aware of the “Universal Free Breakfast in the Classroom-Served & Unserved Food/Beverages Policy” issued by MPS Division of School Nutrition Servivices (See Appendix D on pages 30-31). This policy clearly states:
“By supporting students to save items for later, not only do they waste less, but they learn that they don’t have to eat everything at once. Ultimately, this teaches them the importance of breakfast and the concept of moderation.”
– UFBiC Teacher Once food is served to a student it is property of the child, and they are free to eat it at school, share it with a classmate, take the item home, or return it to the teacher to be properly stored in the classroom.
Some teachers thought it was against policy for students to save unopened food items for later. Teachers who are aware of the policy can encourage students to make better consumption choices by allowing students to eat what they can and save what is not consumed. Through observations and teacher comments, students in the lower elementary grades are served enough food, but the quantity is too much at once. Some teachers who noticed this did routinely save juice boxes and/or crackers for later classroom consumption to reduce waste.
B. PLATE WASTE EVALUATION
Consumption trends gathered from the plate waste evaluation are valuable in understanding what students are more inclined to consume or waste. This information can further improve UFBiC programming to ensure all participants are receiving their maximum nutritional benefits.
1. Overall Consumption Trends
Figure 1. Overall Consumption Trends
Fully Eaten51.6%
Partial16.8%
Wasted4.8%
Saved16.4%
Refused10.4%
Hunger Task Force
Page 18
Overall consumption trends were examined by calculating plate waste of all breakfast items: milk, cereal, crackers and juice/fruit. Within the 2,402 observations, more than half of breakfasts served were fully consumed, while less than 5 percent of breakfasts were wasted. Over 50 percent of breakfasts were fully eaten and about 17 percent of breakfasts were partially consumed, which amounts to a consumption measurement of almost 70 percent. This demonstrates that there is very little waste and that the majority of students are eating their breakfast daily.
Additionally, over 17 percent of students saved a portion of their breakfast for later, while about 10 percent of students refused a breakfast item or a breakfast altogether. Some students who refused accepted a milk instead.
2. Consumption Trends by Meal Component
Figure 2. Consumption Trends by Meal Component
0%
10%
20%
30%
40%
50%
60%
70%
Fully Eaten 55.2% 57.4% 56.5% 37.3%
Partially Eaten 28.5% 7.0% 21.7% 11.2%
Wasted 3.0% 3.6% 6.2% 6.4%
Saved 0.0% 24.0% 5.1% 35.7%
Refused 13.3% 8.0% 10.5% 9.4%
Milk Juice/Fruit Cereal Crackers
Since UFBiC Codes vary daily, the content of students’ breakfasts also differed. However, students receive components of milk, juice/fruit, crackers, and cereals39 on a daily basis. The following were major findings regarding each food item:
39 The only exception to the daily serving of cereal is UFBiC Code I, where students receive Crunchamania crackers as their two servings of grain.
Hunger Task Force
Page 19
• Milk: 55.2 percent of all servings of milk were completely consumed, while 28.5 percent of milk was partially consumed. In total, 83.7 percent of all servings of milk were consumed either fully or partially, with only 3 percent of servings wasted.
• Juice/Fruit: 57.4 percent of juice or fruit cups served were consumed fully. 24 percent of the juice or fruit cups were saved for later consumption. Juice was second as the item most saved.
• Cereal40: 56.5 percent of all servings of cereal were completely consumed, while 21.7 percent of cereal was partially consumed. In total, 78.2 percent of all servings of cereal were consumed either fully or partially, with only 6.2 percent of servings wasted.
• Crackers: 37.3 percent of crackers were consumed with a comparable number of students who saved crackers at 35.7 percent. Crackers are the most saved items in the breakfast box.
3. Consumption Trends by UFBiC Code
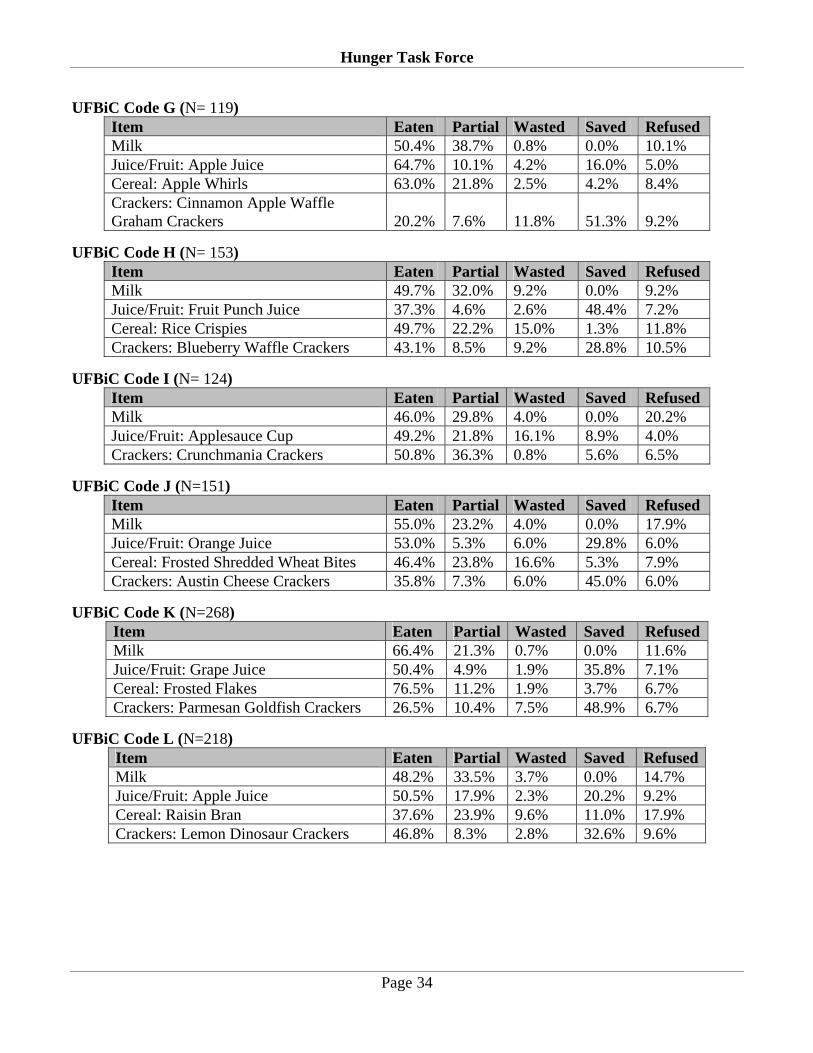
Each UFBiC Code contains a variety of items. Examining consumption trends by UFBiC Code may be informative towards determining which combination of breakfast items are most preferred. The following are the highest ranking UFBiC Codes in the fully eaten, wasted and saved categories. (See Appendix E on page 32 for the full list of consumption trends by UFBiC Code.)
• Most Fully Eaten: Codes A (60.6 percent) and C (58.6 percent) were ranked the highest in the fully eaten category. UFBiC Code Fully Eaten Partial Wasted Saved RefusedA: Cocoa Munchies, Pretzel Goldfish, Apple Juice, Choice of Milk
60.6% 13.8% 2.2% 16.1% 7.3%
C: Fruit Whirls, Cheddar Goldfish Crackers, Strawberry Kiwi Juice, Choice of Milk
58.6% 17.4% 4.6% 13.7% 5.7%
• Most Wasted: Codes H (9.0 percent) and J (8.1 percent) were ranked the highest in the wasted
categories. UFBiC Code Fully Eaten Partial Wasted Saved RefusedH: Rice Crispies, Blueberry Waffle Crackers, Fruit Punch Juice, Choice of Milk
44.9% 16.8% 9.0% 19.6% 9.6%
J: Frosted Shredded Wheat Bites, Austin Cheese Crackers, Orange Juice, Choice of Milk
47.5% 14.9% 8.1% 20.0% 9.4%
40 Since Crunchamania Crackers counts as two servings of grains, they were also included in the calculation of cereal servings.

Hunger Task Force
Page 20
• Most Saved: Codes K (22.1 percent) and J (20 percent) were ranked the highest in the saved category. UFBiC Code Fully Eaten Partial Wasted Saved RefusedJ: Frosted Shredded Wheat Bites, Austin Cheese Crackers, Orange Juice, Choice of Milk
47.5% 14.9% 8.1% 20.0% 9.4%
K: Frosted Flakes, Parmesan Goldfish Crackers, Grape Juice, Choice of Milk
54.9% 11.9% 3.0% 22.1% 8.0%
• Most Refused: Codes B (20.8 percent) and L (12.8 percent) were ranked the highest in the
refused category UFBiC Code Fully Eaten Partial Wasted Saved RefusedB: Corn Flakes, Strawberry Waffle Cracker, Grape Juice, Choice of Milk
51.0% 9.6% 1.9% 16.7% 20.8%
L: Raisin Bran, Lemon Dinosaur Crackers, Apple Juice, Choice of Milk
45.8% 20.9% 4.6% 15.9% 12.8%
4. Consumption Trends by Food Item
Each UFBiC Code was evaluated by food item to gauge consumption trends of specific cereal, crackers and juice/fruit items. Milk was also calculated by UFBiC Codes to gauge milk consumption trends. The following lists the highest ranking food items in the fully eaten, wasted and saved categories. (See Appendix F on pages 33-34 for the full list of consumption trends by UFBiC Food Item.). Cereal: There are 12 types of cereals served in the UFBiC program. Consumption Category Findings Fully Eaten • Frosted Flakes was the most fully eaten cereal at 76.5 percent. With the
addition of partially eaten numbers, total consumption percentage of Frosted Flakes was 87.7 percent.
• Cocoa Munchies was the second most fully eaten cereal at 68.2 percent. With the inclusion of partially eaten numbers, total consumption percentage of Cocoa Munchies was 86.2 percent.
Wasted • Frosted Shredded Wheat Bites was the most wasted cereal at 16.6 percent.
• Rice Crispies was the second most wasted cereal at 15 percent. Saved • Raisin Bran was the most saved cereal at 11 percent, while Fruit Whirls
was the second most save cereal. • Interestingly, Raisin Bran was the least fully eaten cereal at 37.6 percent
and Fruit Whirls was the third most eaten cereal at 65.6 percent. Refused • Corn Flakes was the most refused cereal at 22 percent.
• In addition to the most saved cereal, Raisin Bran was also the second most refused cereal at 17.9 percent.
Hunger Task Force
Page 21
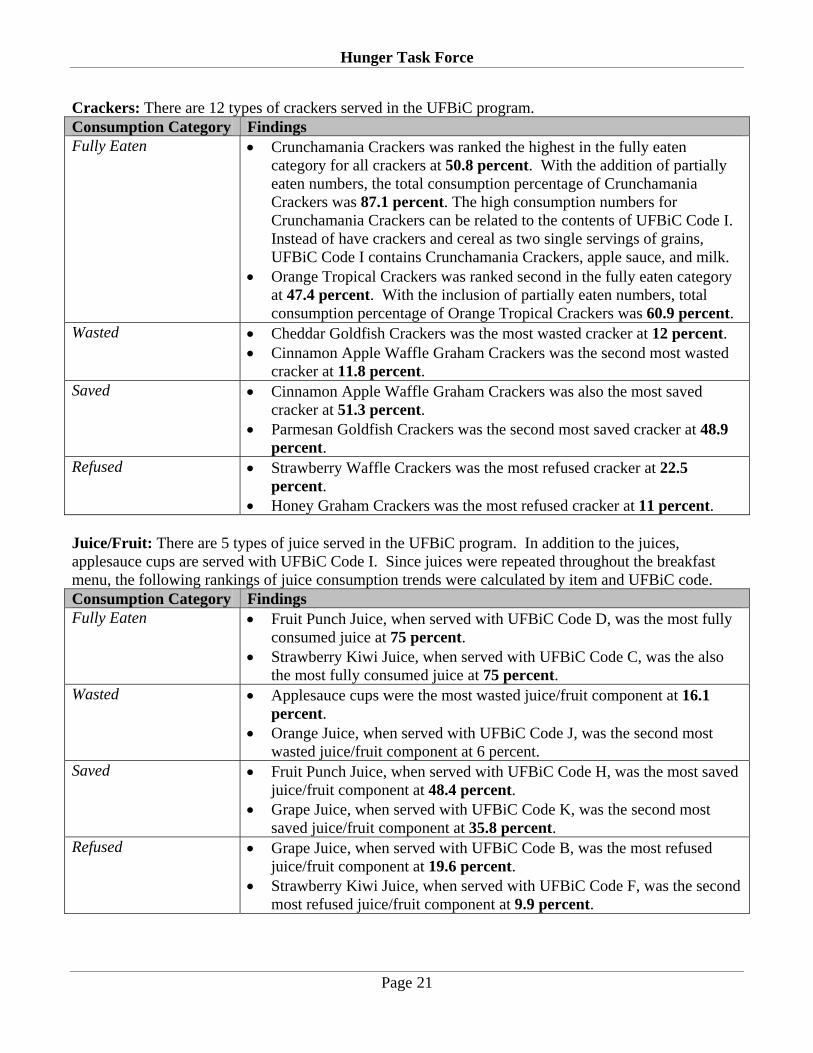
Crackers: There are 12 types of crackers served in the UFBiC program. Consumption Category Findings Fully Eaten • Crunchamania Crackers was ranked the highest in the fully eaten
category for all crackers at 50.8 percent. With the addition of partially eaten numbers, the total consumption percentage of Crunchamania Crackers was 87.1 percent. The high consumption numbers for Crunchamania Crackers can be related to the contents of UFBiC Code I. Instead of have crackers and cereal as two single servings of grains, UFBiC Code I contains Crunchamania Crackers, apple sauce, and milk.
• Orange Tropical Crackers was ranked second in the fully eaten category at 47.4 percent. With the inclusion of partially eaten numbers, total consumption percentage of Orange Tropical Crackers was 60.9 percent.
Wasted • Cheddar Goldfish Crackers was the most wasted cracker at 12 percent. • Cinnamon Apple Waffle Graham Crackers was the second most wasted
cracker at 11.8 percent. Saved • Cinnamon Apple Waffle Graham Crackers was also the most saved
cracker at 51.3 percent. • Parmesan Goldfish Crackers was the second most saved cracker at 48.9
percent. Refused • Strawberry Waffle Crackers was the most refused cracker at 22.5
percent. • Honey Graham Crackers was the most refused cracker at 11 percent.
Juice/Fruit: There are 5 types of juice served in the UFBiC program. In addition to the juices, applesauce cups are served with UFBiC Code I. Since juices were repeated throughout the breakfast menu, the following rankings of juice consumption trends were calculated by item and UFBiC code. Consumption Category Findings Fully Eaten • Fruit Punch Juice, when served with UFBiC Code D, was the most fully
consumed juice at 75 percent. • Strawberry Kiwi Juice, when served with UFBiC Code C, was the also
the most fully consumed juice at 75 percent. Wasted • Applesauce cups were the most wasted juice/fruit component at 16.1
percent. • Orange Juice, when served with UFBiC Code J, was the second most
wasted juice/fruit component at 6 percent. Saved • Fruit Punch Juice, when served with UFBiC Code H, was the most saved
juice/fruit component at 48.4 percent. • Grape Juice, when served with UFBiC Code K, was the second most
saved juice/fruit component at 35.8 percent. Refused • Grape Juice, when served with UFBiC Code B, was the most refused
juice/fruit component at 19.6 percent. • Strawberry Kiwi Juice, when served with UFBiC Code F, was the second
most refused juice/fruit component at 9.9 percent.

Hunger Task Force
Page 22
Milk: For every breakfast served, an eight-ounce serving of milk is provided. Students who are lactose-intolerant must provide a doctor’s note. Some parents send a container of milk substitute for students to eat with their cereal. Consumption Category Findings Fully Eaten • Codes K (66.4 percent) and A (62.3 percent) were ranked the highest in
the fully consumed category for milk. With the addition of partially consumed numbers, the total consumption of milk was 87.7 percent for Code K and 89.1 percent for Code A.
• Code A and K contains the most fully eaten cereal, respectively Cocoa Munchies and Frosted Flakes. Correlations between milk and cereal may be drawn from this as when more cereal is eaten, more milk is consumed.
Wasted • Codes H (9.2 percent) and Code F (4.9 percent) were ranked the most wasted codes in milk consumption.
• Code H contains the second most wasted cereal, Rice Crispies (15 percent). Code F contains the sixth most wasted cereal, Corn Puffs (5.5 percent).
Refused • Codes I (20.2 percent) and Code B (19.1 percent) were ranked the most refused codes in milk consumption.
• Code I does not contain a cereal. Instead it contains Crunchamania Crackers, which contains two servings of grain. It may be possible that milk consumption is less because there is no cereal.
• Code B contains Corn Flakes, the most refused cereal (22 percent).

Hunger Task Force
Page 23
5. Consumption Trends by Grade-Level
Menu diversity and grade-level also influenced breakfast consumption data. For instance, young students are still being socialized to eat within a school setting, while older students are more independent consumers. Some cereals may take younger students a little longer to adapt to than older students.
The plate waste assessment by grade-level demonstrated the following trends:
• Fully eaten breakfasts items are higher in Grades 4-5. • Partially eaten breakfasts are lowest in Grades 4-5. • Waste of breakfast items are lowest in Grades 4-5. • Saved breakfast items are highest in Grades 1-3. • Refused breakfast items are lowest in Grades K4-K5.
Figure 3 demonstrates a direct correlation between grade-level and the amount of consumption and waste. In comparison to younger students, older students eat more and waste less. Overall, as students mature in the school system, they require more sustenance to maintain their energy levels. These consumption trends confirm that students are eating breakfast and validates the need and importance of UFBiC.
Hunger Task Force
Page 24
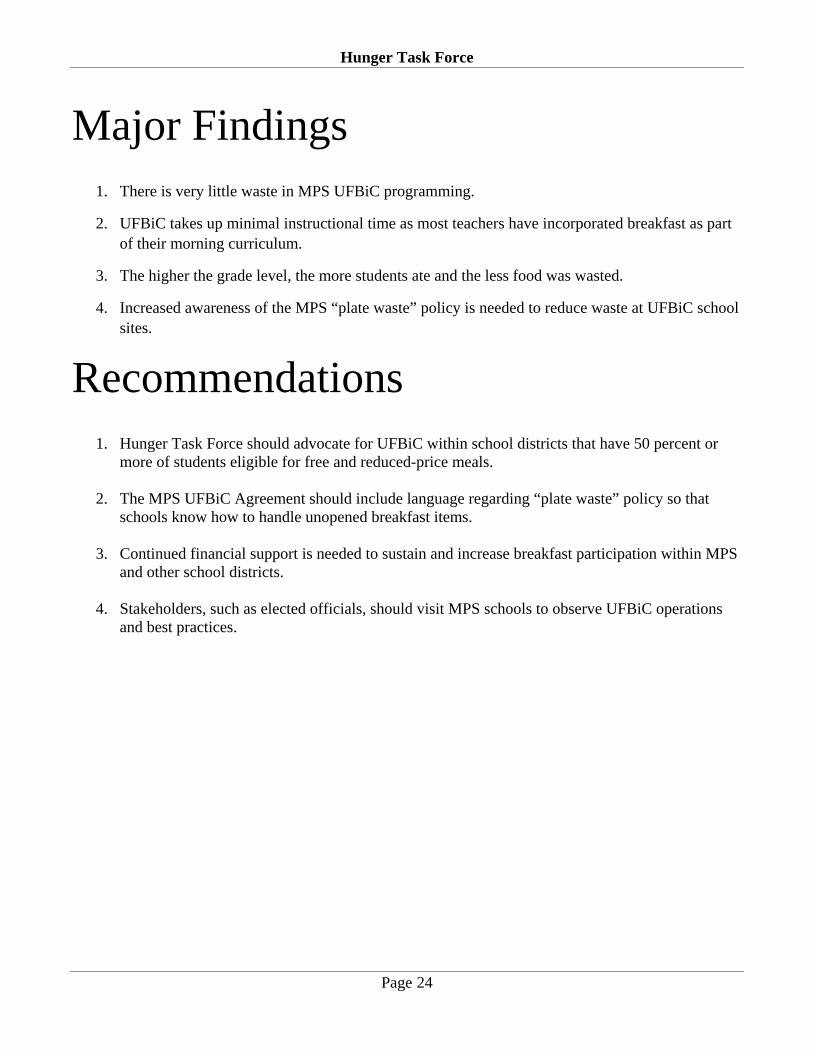
Major Findings
1. There is very little waste in MPS UFBiC programming.
2. UFBiC takes up minimal instructional time as most teachers have incorporated breakfast as part of their morning curriculum.
3. The higher the grade level, the more students ate and the less food was wasted.
4. Increased awareness of the MPS “plate waste” policy is needed to reduce waste at UFBiC school sites.
Recommendations
1. Hunger Task Force should advocate for UFBiC within school districts that have 50 percent or more of students eligible for free and reduced-price meals.
2. The MPS UFBiC Agreement should include language regarding “plate waste” policy so that
schools know how to handle unopened breakfast items. 3. Continued financial support is needed to sustain and increase breakfast participation within MPS
and other school districts.
4. Stakeholders, such as elected officials, should visit MPS schools to observe UFBiC operations and best practices.
Hunger Task Force
Page 25
References Baker, E.U. (1914) Wisconsin: Its Story and Biography 1848-1913. Chicago, IL: The Lewis Publishing Company.
Food Research and Action Center. School Breakfast Scorecard 2005. Retrieved from www.frac.org
Food Research and Action Center. School Breakfast Scorecard 2007. Retrieved from www.frac.org
Food Research and Action Center. School Breakfast Scorecard 2008. Retrieved from www.frac.org
Food Research and Action Center. Universal School Breakfast Fact Sheet. Retrieved from www.frac.org
Gunderson, Gordon (1971). The National School Lunch Program. Retrieved from www.fns.usda.gov
Journal of the American Dietetic Association (1993). Evaluation of the School Breakfast Pilot Program: Summary of findings from the first year of implementation. USDA, 2002.
Lent, M. (2007). Findings from the 2006-2007 Universal Free Breakfast Initiative in Milwaukee Public Schools in 2007. Milwaukee, WI: Hunger Task Force. Available at www.hungertaskforce.org
National Center for Children in Poverty. Who are America’s Poor Children? Retrieved from www.nccp.org
Shield, J, & Mullen, M (2002). The American Dietetic Association Guide to Healthy Eating for Kids: How Your Children Can Eat Smart from Five to Twelve. Hoboken, New Jersey: John Wiley and Sons.
Sodexho Foundation. (2008). Impact of School Breakfast on Children’s Health and Learning. Retrieved from www.sodexofoundation.org
United States Department of Agriculture, Economic Research Service. National School Lunch and School Breakfast Reforms. Retrieved from www.ers.usda.gov
United States Department of Agriculture, Food and Nutrition Service. School Breakfast Program History. Retrieved from: www.fns.usda.gov
United States Department of Agriculture, Food and Nutrition Service. Menu Planning in the School Breakfast Program, Retrieved from www.fns.usda.gov
United States Department of Agriculture, Food and Nutrition Service. Child Nutrition Programs’ Income Eligibility Guidelines for Free and Reduced-Price Meals for the 2008-2009 School Year. 73 FR 19186, available at www.fns.usda.gov United States Department of Agriculture, Food and Nutrition Service. No Child Left Behind Memo: 20 Feb. 2003. Retrieved from www.fns.usda.gov
Hunger Task Force
Page 26
Wong, K. (2006). Evaluation of the 2005-2006 Provision 12 Pilot in Milwaukee Public Schools. Milwaukee, WI: Hunger Task Force. Available at www.hungertaskforce.org
Hunger Task Force
Page 27
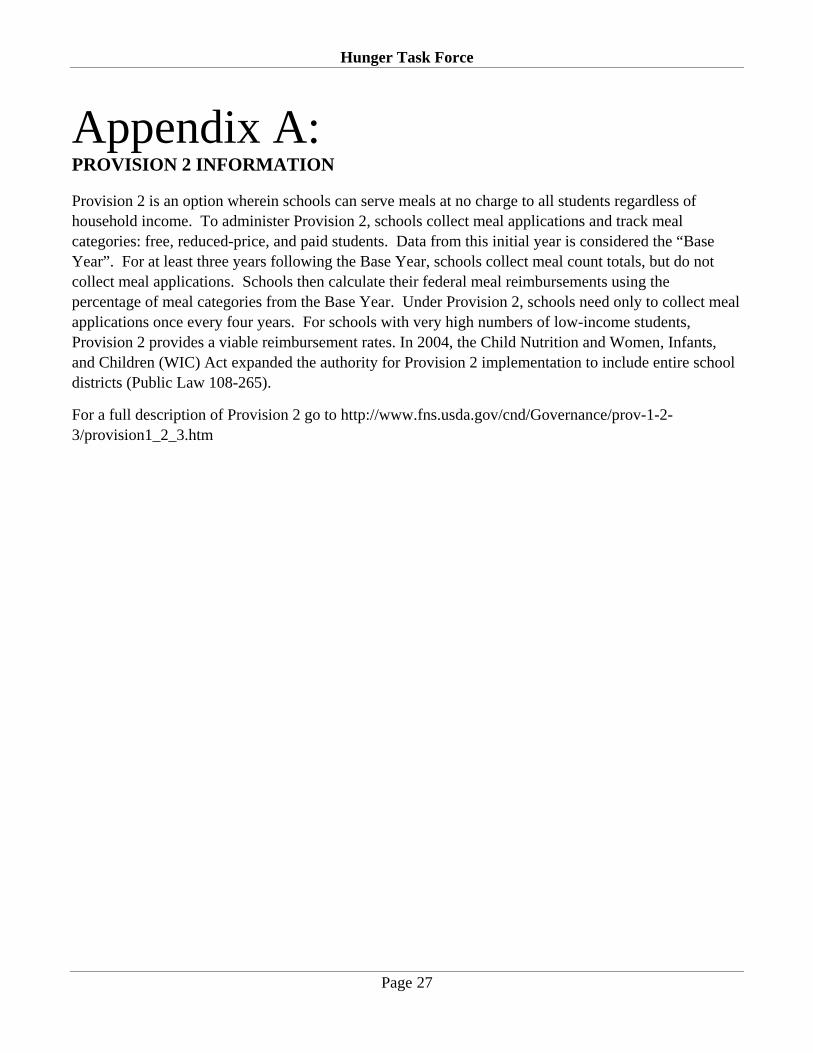
Appendix A: PROVISION 2 INFORMATION Provision 2 is an option wherein schools can serve meals at no charge to all students regardless of household income. To administer Provision 2, schools collect meal applications and track meal categories: free, reduced-price, and paid students. Data from this initial year is considered the “Base Year”. For at least three years following the Base Year, schools collect meal count totals, but do not collect meal applications. Schools then calculate their federal meal reimbursements using the percentage of meal categories from the Base Year. Under Provision 2, schools need only to collect meal applications once every four years. For schools with very high numbers of low-income students, Provision 2 provides a viable reimbursement rates. In 2004, the Child Nutrition and Women, Infants, and Children (WIC) Act expanded the authority for Provision 2 implementation to include entire school districts (Public Law 108-265).
For a full description of Provision 2 go to http://www.fns.usda.gov/cnd/Governance/prov-1-2-3/provision1_2_3.htm
Hunger Task Force
Page 28
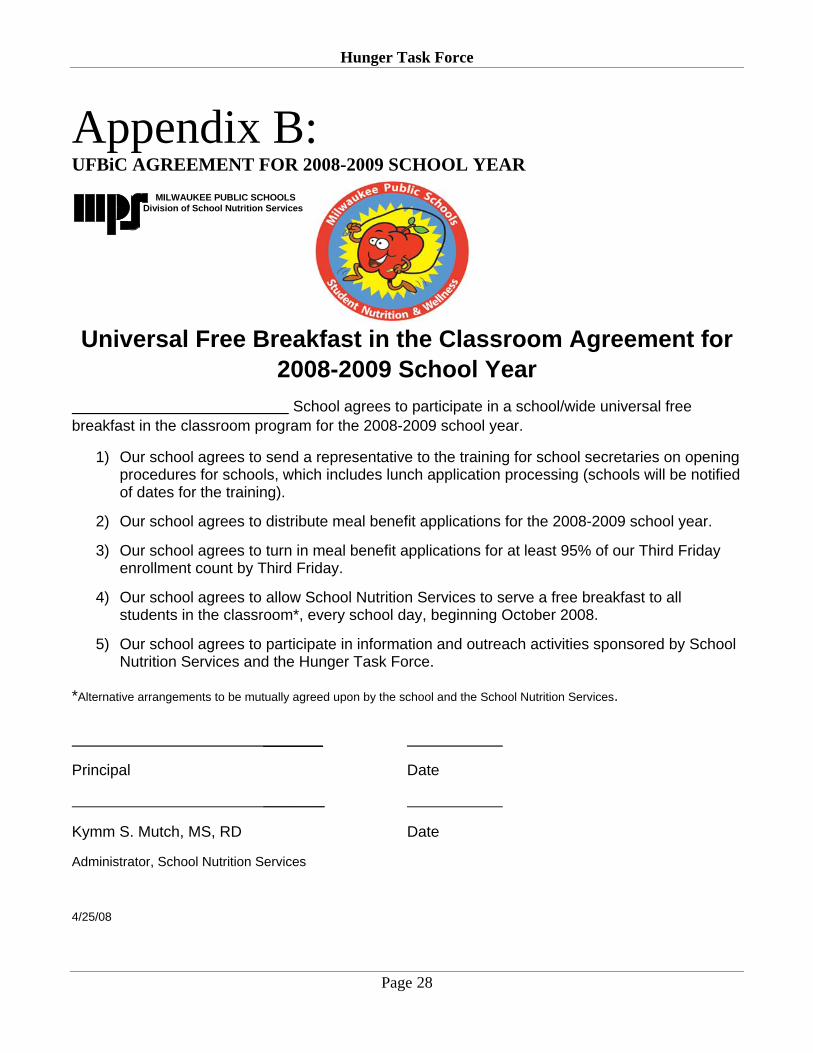
Appendix B: UFBiC AGREEMENT FOR 2008-2009 SCHOOL YEAR
MILWAUKEE PUBLIC SCHOOLSDivision of School Nutrition Services
Universal Free Breakfast in the Classroom Agreement for 2008-2009 School Year
School agrees to participate in a school/wide universal free breakfast in the classroom program for the 2008-2009 school year.
1) Our school agrees to send a representative to the training for school secretaries on opening procedures for schools, which includes lunch application processing (schools will be notified of dates for the training).
2) Our school agrees to distribute meal benefit applications for the 2008-2009 school year.
3) Our school agrees to turn in meal benefit applications for at least 95% of our Third Friday enrollment count by Third Friday.
4) Our school agrees to allow School Nutrition Services to serve a free breakfast to all students in the classroom*, every school day, beginning October 2008.
5) Our school agrees to participate in information and outreach activities sponsored by School Nutrition Services and the Hunger Task Force.
*Alternative arrangements to be mutually agreed upon by the school and the School Nutrition Services.
_______
Principal Date
________
Kymm S. Mutch, MS, RD Date
Administrator, School Nutrition Services
4/25/08
Hunger Task Force
Page 29
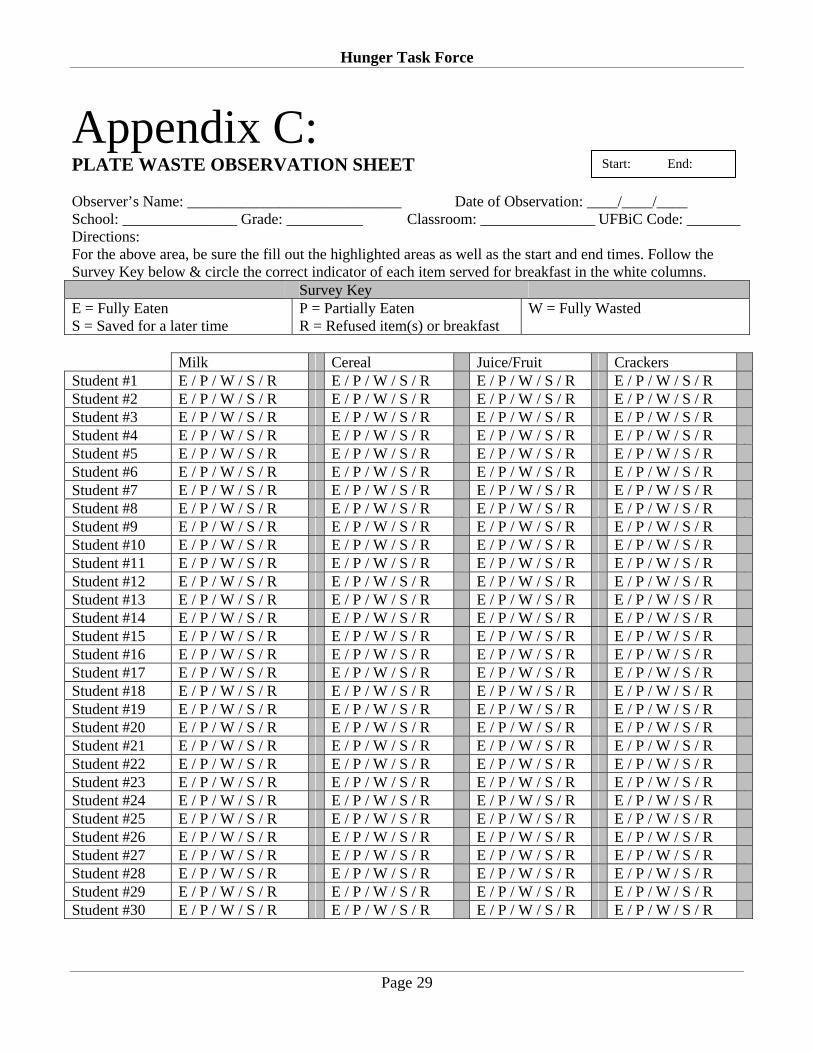
Appendix C: PLATE WASTE OBSERVATION SHEET Observer’s Name: ____________________________ Date of Observation: ____/____/____ School: _______________ Grade: __________ Classroom: _______________ UFBiC Code: _______ Directions: For the above area, be sure the fill out the highlighted areas as well as the start and end times. Follow the Survey Key below & circle the correct indicator of each item served for breakfast in the white columns. Survey Key E = Fully Eaten S = Saved for a later time
P = Partially Eaten R = Refused item(s) or breakfast
W = Fully Wasted
Milk Cereal Juice/Fruit Crackers Student #1 E / P / W / S / R E / P / W / S / R E / P / W / S / R E / P / W / S / R Student #2 E / P / W / S / R E / P / W / S / R E / P / W / S / R E / P / W / S / R Student #3 E / P / W / S / R E / P / W / S / R E / P / W / S / R E / P / W / S / R Student #4 E / P / W / S / R E / P / W / S / R E / P / W / S / R E / P / W / S / R Student #5 E / P / W / S / R E / P / W / S / R E / P / W / S / R E / P / W / S / R Student #6 E / P / W / S / R E / P / W / S / R E / P / W / S / R E / P / W / S / R Student #7 E / P / W / S / R E / P / W / S / R E / P / W / S / R E / P / W / S / R Student #8 E / P / W / S / R E / P / W / S / R E / P / W / S / R E / P / W / S / R Student #9 E / P / W / S / R E / P / W / S / R E / P / W / S / R E / P / W / S / R Student #10 E / P / W / S / R E / P / W / S / R E / P / W / S / R E / P / W / S / R Student #11 E / P / W / S / R E / P / W / S / R E / P / W / S / R E / P / W / S / R Student #12 E / P / W / S / R E / P / W / S / R E / P / W / S / R E / P / W / S / R Student #13 E / P / W / S / R E / P / W / S / R E / P / W / S / R E / P / W / S / R Student #14 E / P / W / S / R E / P / W / S / R E / P / W / S / R E / P / W / S / R Student #15 E / P / W / S / R E / P / W / S / R E / P / W / S / R E / P / W / S / R Student #16 E / P / W / S / R E / P / W / S / R E / P / W / S / R E / P / W / S / R Student #17 E / P / W / S / R E / P / W / S / R E / P / W / S / R E / P / W / S / R Student #18 E / P / W / S / R E / P / W / S / R E / P / W / S / R E / P / W / S / R Student #19 E / P / W / S / R E / P / W / S / R E / P / W / S / R E / P / W / S / R Student #20 E / P / W / S / R E / P / W / S / R E / P / W / S / R E / P / W / S / R Student #21 E / P / W / S / R E / P / W / S / R E / P / W / S / R E / P / W / S / R Student #22 E / P / W / S / R E / P / W / S / R E / P / W / S / R E / P / W / S / R Student #23 E / P / W / S / R E / P / W / S / R E / P / W / S / R E / P / W / S / R Student #24 E / P / W / S / R E / P / W / S / R E / P / W / S / R E / P / W / S / R Student #25 E / P / W / S / R E / P / W / S / R E / P / W / S / R E / P / W / S / R Student #26 E / P / W / S / R E / P / W / S / R E / P / W / S / R E / P / W / S / R Student #27 E / P / W / S / R E / P / W / S / R E / P / W / S / R E / P / W / S / R Student #28 E / P / W / S / R E / P / W / S / R E / P / W / S / R E / P / W / S / R Student #29 E / P / W / S / R E / P / W / S / R E / P / W / S / R E / P / W / S / R Student #30 E / P / W / S / R E / P / W / S / R E / P / W / S / R E / P / W / S / R
Start: End:
Hunger Task Force
Page 30
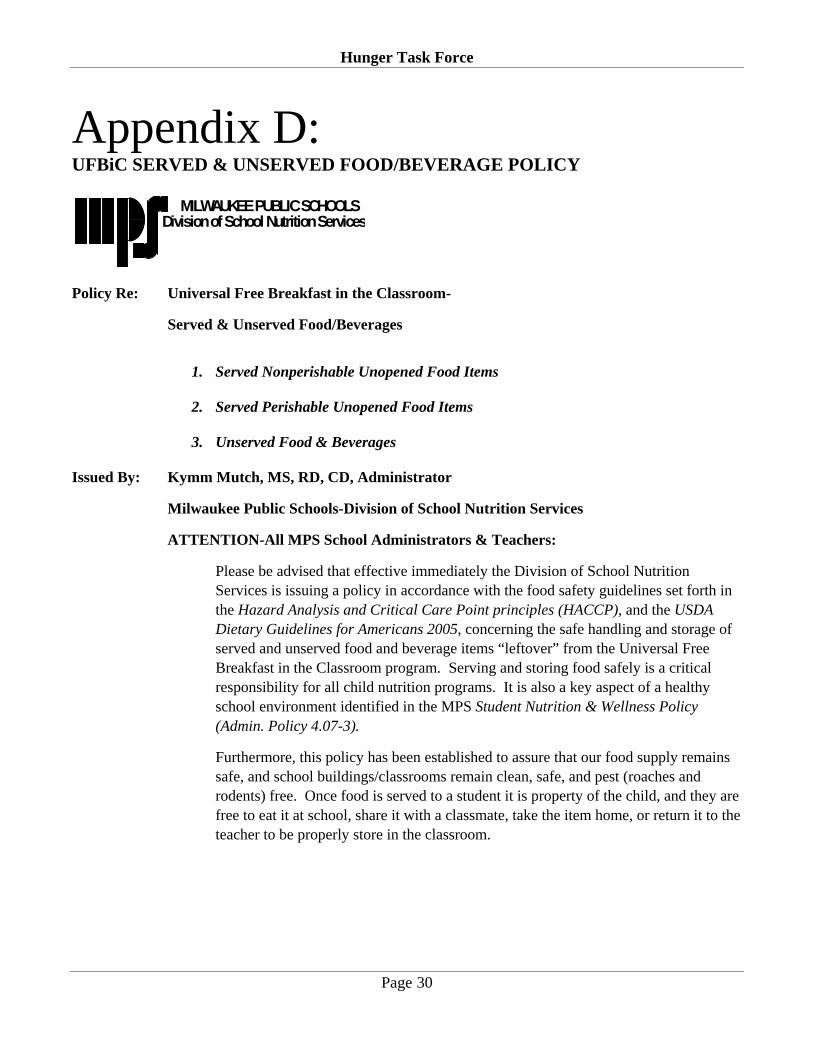
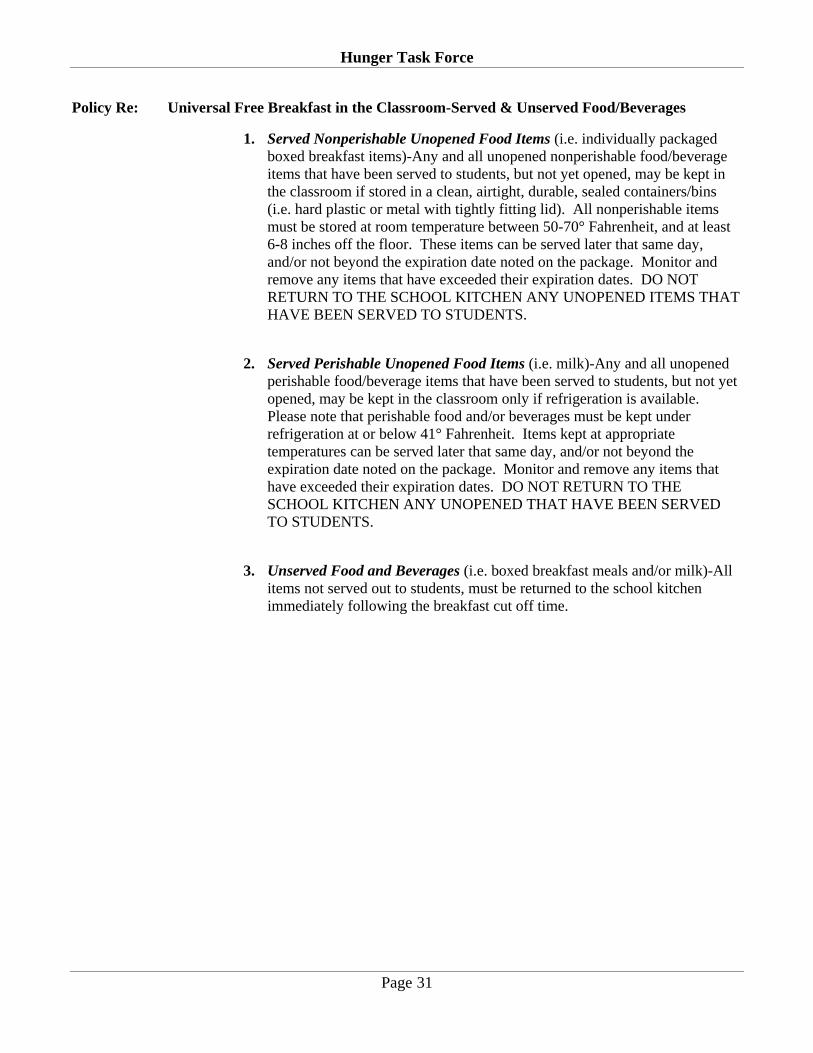
Appendix D: UFBiC SERVED & UNSERVED FOOD/BEVERAGE POLICY
MILWAUKEE PUBLIC SCHOOLSDivision of School Nutrition Services
Policy Re: Universal Free Breakfast in the Classroom-
Served & Unserved Food/Beverages
1. Served Nonperishable Unopened Food Items
2. Served Perishable Unopened Food Items
3. Unserved Food & Beverages
Issued By: Kymm Mutch, MS, RD, CD, Administrator
Milwaukee Public Schools-Division of School Nutrition Services ATTENTION-All MPS School Administrators & Teachers:
Please be advised that effective immediately the Division of School Nutrition Services is issuing a policy in accordance with the food safety guidelines set forth in the Hazard Analysis and Critical Care Point principles (HACCP), and the USDA Dietary Guidelines for Americans 2005, concerning the safe handling and storage of served and unserved food and beverage items “leftover” from the Universal Free Breakfast in the Classroom program. Serving and storing food safely is a critical responsibility for all child nutrition programs. It is also a key aspect of a healthy school environment identified in the MPS Student Nutrition & Wellness Policy (Admin. Policy 4.07-3).
Furthermore, this policy has been established to assure that our food supply remains safe, and school buildings/classrooms remain clean, safe, and pest (roaches and rodents) free. Once food is served to a student it is property of the child, and they are free to eat it at school, share it with a classmate, take the item home, or return it to the teacher to be properly store in the classroom.
Hunger Task Force
Page 31
Policy Re: Universal Free Breakfast in the Classroom-Served & Unserved Food/Beverages
1. Served Nonperishable Unopened Food Items (i.e. individually packaged boxed breakfast items)-Any and all unopened nonperishable food/beverage items that have been served to students, but not yet opened, may be kept in the classroom if stored in a clean, airtight, durable, sealed containers/bins (i.e. hard plastic or metal with tightly fitting lid). All nonperishable items must be stored at room temperature between 50-70° Fahrenheit, and at least 6-8 inches off the floor. These items can be served later that same day, and/or not beyond the expiration date noted on the package. Monitor and remove any items that have exceeded their expiration dates. DO NOT RETURN TO THE SCHOOL KITCHEN ANY UNOPENED ITEMS THAT HAVE BEEN SERVED TO STUDENTS.
2. Served Perishable Unopened Food Items (i.e. milk)-Any and all unopened perishable food/beverage items that have been served to students, but not yet opened, may be kept in the classroom only if refrigeration is available. Please note that perishable food and/or beverages must be kept under refrigeration at or below 41° Fahrenheit. Items kept at appropriate temperatures can be served later that same day, and/or not beyond the expiration date noted on the package. Monitor and remove any items that have exceeded their expiration dates. DO NOT RETURN TO THE SCHOOL KITCHEN ANY UNOPENED THAT HAVE BEEN SERVED TO STUDENTS.
3. Unserved Food and Beverages (i.e. boxed breakfast meals and/or milk)-All items not served out to students, must be returned to the school kitchen immediately following the breakfast cut off time.

Hunger Task Force
Page 32
Appendix E: CONSUMPTION TRENDS BY UFBiC CODE
UFBiC Code Fully Eaten Partial Wasted Saved Refused A: Cocoa Munchies, Pretzel Goldfish, Apple Juice, Choice of Milk
60.6% 13.8% 2.2% 16.1% 7.3%
B: Corn Flakes, Strawberry Waffle Cracker, Grape Juice, Choice of Milk
51.0% 9.6% 1.9% 16.7% 20.8%
C: Fruit Whirls, Cheddar Goldfish Crackers, Strawberry Kiwi Juice, Choice of Milk
58.6% 17.4% 4.6% 13.7% 5.7%
D: Toasted Oats, Orange Tropical Crackers, Fruit Punch Juice, Choice of Milk
56.1% 19.2% 5.8% 9.8% 9.1%
E: Bunch O Cinnamon Squares, Vanilla Bears, Orange Juice, Choice of Milk
50.1% 18.1% 5.5% 17.5% 8.8%
F: Corn Puffs, Honey Graham Crackers, Strawberry Kiwi Juice, Choice of Milk
48.3% 18.8% 5.5% 15.3% 12.0%
G: Apple Whirls, Cinnamon Apple Waffle Grahams, Apple Juice, Choice of Milk
49.6% 19.5% 4.8% 17.9% 8.2%
H: Rice Crispies, Blueberry Waffle Crackers, Fruit Punch Juice, Choice of Milk
44.9% 16.8% 9.0% 19.6% 9.6%
I: Crunchmania Crackers, Applesauce Cup, Choice of Milk
49.2% 31.0% 5.4% 5.0% 9.3%
J: Frosted Shredded Wheat Bites, Austin Cheese Crackers, Orange Juice, Choice of Milk
47.5% 14.9% 8.1% 20.0% 9.4%
K: Frosted Flakes, Parmesan Goldfish Crackers, Grape Juice, Choice of Milk
54.9% 11.9% 3.0% 22.1% 8.0%
L: Rasin Bran, Lemon Dinosaur Crackers, Apple Juice, Choice of Milk
45.8% 20.9% 4.6% 15.9% 12.8%

Hunger Task Force
Page 33
Appendix F: CONSUMPTION TRENDS BY ITEM UFBiC Code A (N=239)
Item Eaten Partial Wasted Saved RefusedMilk 62.3% 26.8% 0.4% 0.0% 10.5% Juice/Fruit: Apple Juice 69.9% 2.5% 0.8% 20.5% 6.3% Cereal: Cocoa Munchies 68.2% 18.0% 2.5% 4.6% 6.7% Crackers: Pretzel Goldfish 41.8% 7.9% 5.0% 39.3% 5.9%
UFBiC Code B (N=209)
Item Eaten Partial Wasted Saved RefusedMilk 57.9% 21.5% 1.4% 0.0% 19.1% Juice/Fruit: Grape Juice 45.5% 3.8% 1.4% 29.7% 19.6% Cereal: Corn Flakes 59.8% 12.9% 4.3% 1.0% 22.0% Crackers: Strawberry Waffle Cracker 40.7% 0.0% 0.5% 36.4% 22.5%
UFBiC Code C (N= 192)
Item Eaten Partial Wasted Saved RefusedMilk 58.9% 31.8% 0.5% 0.0% 8.9% Juice/Fruit: Strawberry Kiwi Juice 75.0% 1.6% 3.6% 15.6% 4.2% Cereal: Fruit Whirls 65.6% 18.8% 2.1% 8.3% 5.2% Crackers: Cheddar Goldfish Crackers 34.9% 17.7% 12.0% 30.7% 4.7%
UFBiC Code D (N= 156)
Item Eaten Partial Wasted Saved RefusedMilk 55.1% 30.1% 2.6% 0.0% 12.2% Juice/Fruit: Fruit Punch Juice 75.0% 3.2% 3.2% 12.2% 6.4% Cereal: Toasted Oats 46.8% 30.1% 10.9% 3.2% 9.0% Crackers: Orange Tropical Crackers 47.4% 13.5% 6.4% 23.7% 9.0%
UFBiC Code E (N= 228)
Item Eaten Partial Wasted Saved RefusedMilk 57.0% 27.6% 4.4% 0.0% 11.0% Juice/Fruit: Orange Juice 55.7% 7.9% 3.5% 26.3% 6.6% Cereal: Bunch O Cinnamon Squares 56.6% 24.6% 6.6% 3.5% 8.8% Crackers: Vanilla Bears 31.1% 12.3% 7.5% 40.4% 8.8%
UFBiC Code F (N= 345)
Item Eaten Partial Wasted Saved RefusedMilk 48.7% 31.0% 4.9% 0.0% 15.4% Juice/Fruit: Strawberry Kiwi Juice 60.3% 6.4% 3.8% 19.7% 9.9% Cereal: Corn Puffs 49.6% 25.8% 5.5% 7.2% 11.9% Crackers: Honey Graham Crackers 34.8% 12.2% 7.8% 34.2% 11.0%
Hunger Task Force
Page 34
UFBiC Code G (N= 119) Item Eaten Partial Wasted Saved Refused Milk 50.4% 38.7% 0.8% 0.0% 10.1% Juice/Fruit: Apple Juice 64.7% 10.1% 4.2% 16.0% 5.0% Cereal: Apple Whirls 63.0% 21.8% 2.5% 4.2% 8.4% Crackers: Cinnamon Apple Waffle Graham Crackers 20.2% 7.6% 11.8% 51.3% 9.2%
UFBiC Code H (N= 153)
Item Eaten Partial Wasted Saved Refused Milk 49.7% 32.0% 9.2% 0.0% 9.2% Juice/Fruit: Fruit Punch Juice 37.3% 4.6% 2.6% 48.4% 7.2% Cereal: Rice Crispies 49.7% 22.2% 15.0% 1.3% 11.8% Crackers: Blueberry Waffle Crackers 43.1% 8.5% 9.2% 28.8% 10.5%
UFBiC Code I (N= 124)
Item Eaten Partial Wasted Saved Refused Milk 46.0% 29.8% 4.0% 0.0% 20.2% Juice/Fruit: Applesauce Cup 49.2% 21.8% 16.1% 8.9% 4.0% Crackers: Crunchmania Crackers 50.8% 36.3% 0.8% 5.6% 6.5%
UFBiC Code J (N=151)
Item Eaten Partial Wasted Saved Refused Milk 55.0% 23.2% 4.0% 0.0% 17.9% Juice/Fruit: Orange Juice 53.0% 5.3% 6.0% 29.8% 6.0% Cereal: Frosted Shredded Wheat Bites 46.4% 23.8% 16.6% 5.3% 7.9% Crackers: Austin Cheese Crackers 35.8% 7.3% 6.0% 45.0% 6.0%
UFBiC Code K (N=268)
Item Eaten Partial Wasted Saved RefusedMilk 66.4% 21.3% 0.7% 0.0% 11.6% Juice/Fruit: Grape Juice 50.4% 4.9% 1.9% 35.8% 7.1% Cereal: Frosted Flakes 76.5% 11.2% 1.9% 3.7% 6.7% Crackers: Parmesan Goldfish Crackers 26.5% 10.4% 7.5% 48.9% 6.7%
UFBiC Code L (N=218)
Item Eaten Partial Wasted Saved RefusedMilk 48.2% 33.5% 3.7% 0.0% 14.7% Juice/Fruit: Apple Juice 50.5% 17.9% 2.3% 20.2% 9.2% Cereal: Raisin Bran 37.6% 23.9% 9.6% 11.0% 17.9% Crackers: Lemon Dinosaur Crackers 46.8% 8.3% 2.8% 32.6% 9.6%