"An analytical study of the relationship between consumer's enjoyment and factors affecting the...
21
"An analytical study of the relationship between consumer’s enjoyment and factors affecting the buying decision in shopping malls" 1. Prof. Arvind W Ubale . Dept. of Accountancy. A. Vartak College, Vasai- Raod, Dist- Thane 2. Dr. P.Y.Harkal, Research Guide and Associate Professor, DSM College, Parbahni, M.S. Abstract "This paper investigates the relationship between independent variables of shopping mall such as sales promotion of products and services, ambience of shopping mall, quality of products, service of sales people and food availability at shopping mall with dependent variable enjoy at shopping mall. This study attempts to explore the association exists between the variables involved, by tapping the responses of 500 respondents from the area of Thane. The major findings of the study demonstrated an overall weak association of the set of independent variables with the dependent variable but, the in-depth analysis found that ambience of shopping mall and quality of products are the only two variables that resulted into strong association with 1
Transcript of "An analytical study of the relationship between consumer's enjoyment and factors affecting the...
"An analytical study of the relationship between
consumer’s enjoyment and factors affecting the
buying decision in shopping malls"
1. Prof. Arvind W Ubale . Dept. of Accountancy. A. Vartak College,
Vasai- Raod, Dist- Thane
2. Dr. P.Y.Harkal, Research Guide and Associate Professor, DSM
College, Parbahni, M.S.
Abstract
"This paper investigates the relationship between independent
variables of shopping mall such as sales promotion of products
and services, ambience of shopping mall, quality of products,
service of sales people and food availability at shopping mall
with dependent variable enjoy at shopping mall. This study
attempts to explore the association exists between the variables
involved, by tapping the responses of 500 respondents from the
area of Thane. The major findings of the study demonstrated an
overall weak association of the set of independent variables with
the dependent variable but, the in-depth analysis found that
ambience of shopping mall and quality of products are the only
two variables that resulted into strong association with
1
the enjoy at shopping mall. Multiple regression analysis has been
performed to find out the strong relationship of variables for
shopping mall with the dependent variable. It's true that people
more often get attracted to ambience of shopping mall and quality
of products displayed on store shelves."
Keywords: Enjoy, Sales promotion, Ambience, Quality, People and
Food.
Introduction: Shopping malls are an emerging trend in the global
arena. Consumers wanted a better shopping experience and this
demand gave rise to the emergence of shopping malls in India.
Shopping was no longer limited to a mere buying activity - it has
become synonymous with splurging time and money.
People simply go about roaming through the shopping mall in order
to peep through the window of the shop and often ending up buying
something they like. The consumers desire a combination of
comfort and suitability which the shopping malls cater to, and so
this format of shopping has become so popular all over the world,
and especially so in India. The inclusion of amenities like
restaurants, multiplexes, and car parks attract more and more
crowds to shopping malls that are considered family hangout
zones. "The effects of promotion type (i.e., price discounts and
bonus packs) and price presentation across promotional benefit
levels were investigated. The results suggest, for the products
considered, that price discounts and bonus packs were valued
2
similarly for both low and moderate promotional benefit levels,
while price discounts were preferred.
Shopping in India has witnessed a revolution with the change in
the consumer buying behavior and the whole format of shopping
also altering. Industry of retail in India which has become modem
can be seen from the fact that there are multistoried malls, huge
shopping centers, and sprawling complexes which offer food,
shopping, and entertainment all under the same roof. Most of the
organized retailing in India have started recently and is
concentrating mainly in metropolitan cities. The growth in the
Indian organized retail market is mainly due to the change in the
consumer's behavior. This change has come in the consumer due to
increased income, changing lifestyles, and patterns of demography
which are favorable. This has given Indian organized retail
market a major boost. Sales promotions are an important part of
retail advertising strategy. Traditionally, research on sales
promotions has generally assumed that the buyers are end
consumers who do not engage in reselling, in large part due to
high transaction costs. Little is known about the impact of this
phenomenon on retailer's sales promotion strategy. Substantial
research in marketing has examined the impact of store
atmospherics (Ambience) on retail store patronage In addition;
research has examined the effect of gender and work status on
social influence and role expectations within the context of
shopping center patronage.
3
This research examines the differential effects of gender and
work status characteristics on the relationship between shopping
mall characteristics (including atmospherics) and consumer
shopping center patronage. The Indian customer demands at
affordable prices a variety of product mix. It is the supply
chain that ensures to the customer in all the various offerings
that a company decides for its customers, be it cost, service, or
the quickness in responding to ever changing tastes of the
customer. The evident increase in consumerist activity is
colossal which has akeady chipped out a money making recess for
the Indian organized retail sector. With the onset of a
globalized economy in India, the Indian consumer's psyche has
been changed. People have become aware of the value of money.
Nowadays the Indian consumers are well versed with the concepts
about discounted products, ambience at shopping mall, quality of
products & services, salesperson's service and availability of
good foods at shopping mall.
Literature review:
There is no dearth of literature on shopping mall buying
behavior. Researchers from all parts of the world have tried to
analyze the shopping mall behavior of shoppers, their
significance, limitations, challenges etc. from different angles.
4

Sherrell (1989) referred that consumers receive pleasure in addition
to merchandise as outcomes of a shopping trip.
(Gruen J973) endorse the current "malltainment" trend that has
malls providing large areas focused on entertaining consumers
while they ai-e in the facility.
(Taylor and Cosenza 2002) analyzed how younger consumers perceive malls
as a place to shop and socialize.
Westbrook and Black 1985) have noted that shopping pleasures include
the opportunity for social interactions with friends, family or
even strangers that one encounters on site.
Dawson, Block, and Ridgway (1990) experiential shopping modves:
Consumers visit stores to derive pleasure from the visit itself.
Reynolds and Beatty (1999) Shopping enjoyment: Satisfaction is derived
from the shopping activity itself. Shopping motives refer to a
customer's needs and wants related to the choice of outlets
(Sheth, 1983). The acceptance of retail stores depends on the
degree to which a store satisfies the specific needs of a
consumer (Groppel 1995).
Consumers tend to base their patronage decisions on the shopping
complex rather than on individual stores (May 1981) and (Gripsrud and
Horvetak 1986).
Sheth(1983) identified three antecedents for shopping preference
among an evoked set of alternative outlets: shopping motives,
shopping options; and choice calculus. According to him shopping
motives are made up of consumers' wants and needs and are
5

influenced by personal values as well as product related
characteristics.
Mall/center choice and patronage can be classified as falUng into
three categories: gravitational attraction of shopping centers
(cf. Gautschi 1981); the dimensions and predictive power of shopping
area image (Wee 1985); and the motivational and experiential
aspects- of mall shopping (Sherrel 1989).
Barich & Srinivasan (1993) Selected store image studies and their image
components - product
variety, product quality, store attractiveness, reasonable
prices, convenience, and customer service. Mall amenities are
features provided to make the shopping trip more comfortable and
enjoyable (Wakefield and Baker, 1998). The factor on shopping
complex/mall loyalty refers to the tendency to shop in a specific
shopping mall or surrounding areas (Sirgy and Samli, 1985). A discount
may be defined by the location in which, and frame by which, it
is communicated.
Discount framing, particularly the differences between cents-off
and percentage off discounts, has been widely studied. Discount
location (e.g., proximate to or distal from regular price info)
has received considerably less attention. We employ the
proximity-compatibility principle and tenets of human memory to
demonstrate that discount framing (cents-off, percentage-off, and
revised price) and discount location (proximal, distal) interact
to differentially affect both the
6

immediate value and the persistence of consumers' price
estimates. The implications of these results for retailers and
manufacturers are highlighted in the discussion (Blair, Edward A., Judy
Harris and Kent B. Monroe 2002).
Purpose of the study;
The purpose of the research study is to test the association of
the independent variables that are;
Sales promotion of products and services, ambience of shopping
mall, quality of products, service of sales people and food
availability at shopping mall with the dependent variable that
is; enjoy at shopping mall of consumers who visited in the area
of Thane.
Objectives of the study;
1. To study the relationship between enjoy with sales promotion
of products.
2. To study the relationship between enjoy with ambience of
shopping mall.
3. To study-the relationship between enjoy with quality of
products.
4. To study the relationship between enjoy with service of sales
people.
5. To study the relationship between enjoy with food availability
at shopping mall.
Hypothesis:
Ho = There is no significant association between enjoy with sales
promotion of products.
7
Hi = There is significant association between enjoy with sales
promotion of products.
Ho = There is no significant association between enjoy with
ambience of shopping mall.
HI = There is significant association between enjoy with ambience
of shopping mall.
Ho= There is no significant association between enjoy with
quality of products.
Hi = There is significant association between enjoy with quality
of products.
Ho = There is no significant association between enjoy with
service of sales people.
Hi = There is significant association between enjoy with service
of sales people.
Ho = There is no significant association between enjoy with
availability of good food.
Hi = There is significant association between enjoy with
availability of good food.
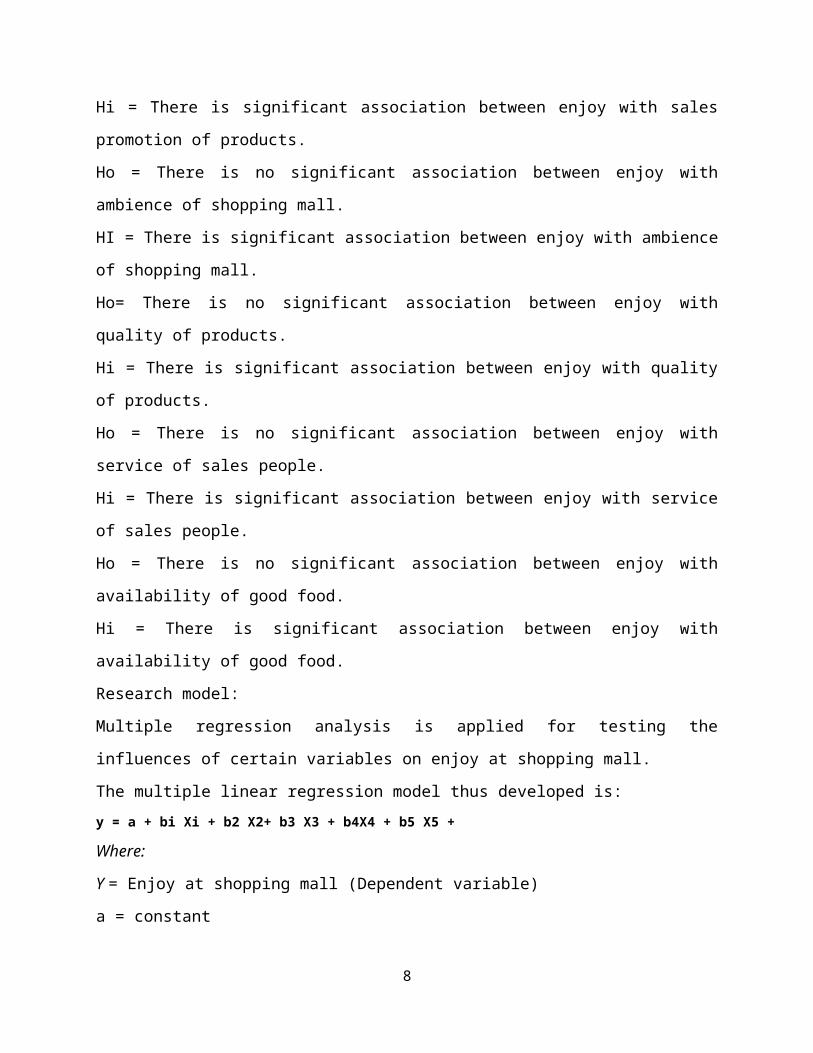
Research model:
Multiple regression analysis is applied for testing the
influences of certain variables on enjoy at shopping mall.
The multiple linear regression model thus developed is:y = a + bi Xi + b2 X2+ b3 X3 + b4X4 + b5 X5 +
Where:
Y = Enjoy at shopping mall (Dependent variable)
a = constant
8

b1 = Co-efficient of Sales promotion
X1= Sales promotion of products and services (Independent
variable)
b2 = Co-efficient of Ambience
X2= Ambience of shopping mall (Independent variable)
b3= Co-efficient of Quality
X3= Quality of products (Independent variable)
b4= Co-efficient of People
X4 = Service of sales People (Independent variable)
b5= Co-efficient of Food
X5 = Food availability at shopping mall (Independent variable)
= sampling error
Y (Enjoy) = a (constant) + b1 (Sales promotion) + b2 (Ambience) +
b3 (Quality) +
b4 (People) + b5 (Food) +
Research Methodology:
This research study has been undertaken with the aim of
identifying the strong association between the dependent variable
and independent variables of shopping mall. Both primary and
secondary data have been used in the study. Primary data have
been collected from Thane, using well structured questionnaire,
500 customers were selected from this city for the purpose of
data
collection using judgment sampling. 06 pre selected statements
were used to find out the strong association between the
9

dependent variable and independent variables. All of these were
five point Likert-type scales in which respondents were asked to
indicate their level of agreement
(1 = strongly disagree to 5 = strongly agree). Multiple
regression analysis using SPSS software has been applied to
determine the significant association.
Respondents' Profile: A total of 500 respondents participated in
the survey. Selected demographic characteristics of the sample
including education, occupation, age, gender and family monthly
income are presented in the table-1.
Table -l: Respondents' profile
Demographical
Variables
Groups Percentage
Education Intermediate
Graduation
. Post graduation
Professionals
02.50%
17.20%
28.70%
51.60%Occupation Govt, job
'Private job
Self-employed
Unemployed
Students
24.20%
05.10%
04.50%
05.70%
60.50%Age(in Years) 16-25
26-35
36-45
46-55
71.30%
07.60%
03.80%
12.10%
10

Above 56 05.10%Gender Male
Female
62.4%
37.6%Income Below Rs.20,000
Rs.>.20,001-
Rs.40,000
Rs.40,001- Rs.60,000
Above Rs.60,000
10.2%
27.4%
27.4%
35.0%
The profiles of respondents are as follows: Education: Intei-
mediate-2.5%, Graduates-17.2%, Post graduates-28.7%,
Professionals-51.6%. Occupation: Govt, job-24.2%, Private job-
5.1%, Self-employed-4.5%, Unemployed-5.7%, Students-60.5%. Age:
16-25 year- 71.3%, 26-35 year- 7.6%, 36-45 year- 3.8%, 46-55
year-12.1% and above 56 yeai-- 5.1%, Gender: Male -62.4% and
Female- 37.6%, Income: Less than Rs.20,000 p.m.- 10.2%,
Rs.20,001-40,000 p.m.- 27.4%, Rs.41,000-60,000 p.m.- 27.4%, &
Above Rs.60,000 - 35%.
Results and discussions
Table-2:
Correlation
Enjo
y
Sales
promoti
on
Ambienc
e
Qualit
y
People Food
11

Enjoy Correlati
on
Sig.(2-
teiled)
N
1.00
000
500
.094
.241
500
.282**
.000
500
.398**
.000
500
.122
.127
500
.139
.082
500
Sales
promoti
on
Correlati
on
Sig.(2-
teiled)
N
.094
.241
500
1.00
000
500
.098
.223
500
.071
.377
500
.005
.948
500
.009
.907
500
Ambienc
e
Correlati
on
Sig.(2-
teiled)
N
282*
*
.000
500
.098
.223
500
1.000
500
.223**
.005
500
.104
.193
500
.155
.053
500
Quality Correlati
on
Sig.(2-
teiled)
N
.398
**
.000
500
.071
.377
500
.223**
.005
500
1.000
500
.175*
.028
500
.255*
*
.001
500
People Correlati
on
Sig.(2-
teiled)
N
.122
.127
500
.005
.948
500
.104
.193
500
.175*
.028
500
1.000
500
.155
.053
500
Food Correlati .139 .009 .155 .255** .155 1.000
12

on
Sig.(2-
teiled)
N
.082
500
.907
500
.053
500
.001
500
.053
500 500
** Correlation is significant at the p < 0.01 level (2-tailed)
* Correlation is significant at the p < 0.05 level (2-tailed)
The correlation table-2 shows all pair wise correlations. The
values in the correlation table are standai'dized, range from 0
to 1 (positive and negative). This research observe that Sales
promotion, Ambience, Quality, People and Food are correlated with
enjoy. It means that researcher has chosen a fairly good set of
independent variables (Sales promotion of products and services.
Ambience of shopping mall, Quality of products, Service of sales
People and Food availability at shopping mall) to try and
correlate with Enjoy. These correlations arc one-toone
correlations of each variable with the others. The correlation
table shows that independent variables are positively correlated
with each other. This indicates that they are not independent of
each other and only two of them can be predict the dependent
variable (Enjoy). Regression is helpful in eliminating some the
independent variables as all of them are not required. Some of
them, being correlated with other variables, do not add any value
in the regression model.
Backward Stepwise
Regression
13

Table- 3: Multiple Regression (Backward Stepwise Regression,
Final Stage)
Model R R^2 Adjusted
R^2
Standards
error4 .445 .198 .187 .89017Final Stage of Backward Stepwise Regression model gives two major
significant independent variables. In this model Food, People and
Sales Promotion components are less significant i.e. Food, People
and Sales Promotion eliminated from the model. The coefficient of
determination measures the proportion of variation in dependent
variable Y (Enjoy) that can be attributed to the
independent variables Xi (Ambience and Quality). Therefore, the
Coefficient of Multiple Detemiination (R^) is the proportion of
variation in the dependent variable Y (Enjoy) that is explained
by the combination of independent variables (Ambience and
Quality). The coefficient of multiple determination R^ is
computed as 0.198. This implies that 19.8% of the variation in
Enjoy is explained by the variation in the Ambience and Quality.
Adjusted R^ compare two or more regression models having the same
dependent variable (Enjoy) but different number of independent
variables (Ambience and Quality). This research compares the R^
and Adjusted R^, this shows that the value of R^ is 0.011 or 1.1%
more than the value of adjusted R'^. This indicates that adjusted
R^ has reduced the overall proportion of the explained variation
of the dependent variable attributed to independent variables by
1.1% .The value of the adjusted R^
14

is computed as 0.187 .This indicates that 18.7%of the total
variation in Enjoy can be explained by the multiple regression
model adjusted for number of independent variables (Ambience and
Quality) and sample size (157).
Table- 4: ANOVA
MODEL Sum of
Squares
Degree of
freedom
Mean
square
T-test Significa
nceRegressio
n
Residuals
Total
30.073
122.029
152.102
2
496
499
15.037
.792
18.976 .000
Final table of ANOVA observed that the F- statistic is computed
as 18.976 and corresponding p value is .000. This indicates
acceptance of the alternative hypothesis and the rejection of the
null hypothesis. This is also an indication of the statistically
significant relationship between Enjoy and other independent
variables (Ambience and Quality). This indicates that the model
is statistically significant.
Table 5:
Coefficients
Variables in the
equations
Independ
ent
variable
Unstandr
ized
Coeffici
Standar
d
Error
Standard
ized
Coeffici
t-test Signific
ance
15
s ents ents
'Beta'(Constan
t)
Ambience
Quahty
1.508
. .198
.376
.368
.072
.079
.203
.353
4.094
2.740
4.769
.000
.007
.000
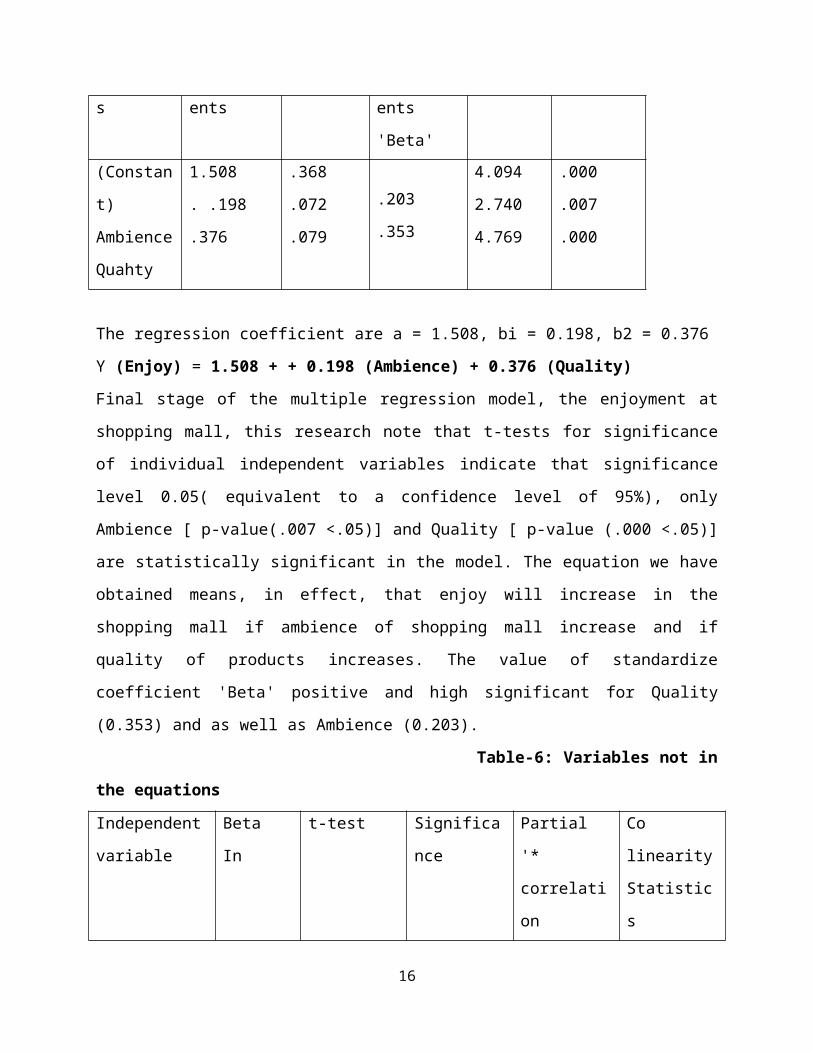
The regression coefficient are a = 1.508, bi = 0.198, b2 = 0.376
Y (Enjoy) = 1.508 + + 0.198 (Ambience) + 0.376 (Quality)
Final stage of the multiple regression model, the enjoyment at
shopping mall, this research note that t-tests for significance
of individual independent variables indicate that significance
level 0.05( equivalent to a confidence level of 95%), only
Ambience [ p-value(.007 <.05)] and Quality [ p-value (.000 <.05)]
are statistically significant in the model. The equation we have
obtained means, in effect, that enjoy will increase in the
shopping mall if ambience of shopping mall increase and if
quality of products increases. The value of standardize
coefficient 'Beta' positive and high significant for Quality
(0.353) and as well as Ambience (0.203).
Table-6: Variables not in
the equations
Independent
variable
Beta
In
t-test Significa
nce
Partial
'*
correlati
on
Co
linearity
Statistic
s
16

Food
People
Sales
Promotion
.020
.041
.050
.260
.554
.684
.795
.581
.495
.021
.045
.055
.925
.965
.988
Reliability and validity of the construct;
As far as the reliability and validity are concerned, analysis
began with measuring the reliability of the construct. First of
all, internal reliability of the scale was examined using
Cranach’s alpha coefficient. Value of the reliability are 0.7 and
above as an indicator of good reliability. This research has been
found value of Cranach’s alpha coefficient 0.728 which is good.
After that convergent validity can be accessed from the
measurement model by determining whether each
indicator's estimated maximum likelihood loading on the
underlying construct is significant. Factor loading of six
variables exceed 0.60. This shows evidence of convergence
validity of this research. Composite reliability coefficients for
each construct are also finding out. Composite reusability should
be greater than 0.7 to indicate reliable factors (Hair et al
1995).this research paper, all the composite reliability
coefficient are greater than 0.7 indicating reliability of all 06
variables. Now, composite reliability, variance extracted and
Cranach alpha coefficient values for all shopping mall variables
greatly exceeded the minimum acceptable values. This research
indicated that measures were free from error and therefore
17

yielding very consistent results (Zikmund, 2003). These tests
showed that our data are reliable and valid for this research.
Managerial Implications:
Information on consumer buying behavior will be useful for
retailing targeting Indian markets. As Indian retail industries
is in boom today and more and more national and international
players are interested in the emerging retail market in India, an
understanding of Indian mall shopper behavior, with particular
reference to the sales promotion, ambience, quality, people and
food at shopping mall are crucial. Profiling consumers by
combining variables of shopping mall shoppers and demographic
variables provide more meaningful ways to identify and
understanding various consumers and target each segment with more
focused marketing strategies (Hiu, A.Y., et al,, 2001).
Limitations of the study:
There are several limitations that warrant future research. This
study has been conducted in Thane city of Uttar Pradesh, India,
The results of the same, if conducted in other part of the
country may vary. It is become a country like India has
geographically, economically, socially and culturally very
different areas. This difference is too significant to be
ignored. The sample size consisted of 500 active mall shoppers.
The small sample size is also error prone.
Conclusion:
18

The results of this research study clearly indicate that there
exits a positive association between sales promotion of products
and services, ambience of shopping mall, quality of products,
service of sales people and food availability at shopping mall
with the dependent variable that is; enjoy of consumers at
shopping mall. An empirical study of consumer buying behavior at
local market in Thane shows that ambience of shopping mall and
quality of products established strong association with the enjoy
of consumers at shopping mall. So, it is established through this
research that consumers like ambience and quality products at
shopping mall. The three other independent variables(sales
promotion of products and services, service of sales people and
food availability at shopping mall) have been identified weak
association with enjoy at shopping mall.
Further research
There is a need to conduct research regarding different angles of
shopping mall and find their impact on the buying behavior of
consumers, for which differences can be compared if research is
conducted separately in the groups of male and female consumers
and some other demographical variables also should be considered.
This proposed research can bring to surface the true association
of independent variables of the shopping mall with the dependent
variable, and will also facilitate in identifying the main
independent variables accelerating the buying behavior in
consumers and it will definitely help practitioners in improving
their marketing strategies regarding products sales.
19

References;
Aalto-Setala, Ville, (2002), .The effect of concentration and
market power on food prices: evidence from Finland, Journal of
Retailing. 78 (3). 207-216.
Andrew J. Newman and Peter Cullen "Retailing environment and
operations" Thomson Learning.
Bhatnagar, Amit and Sanjoy Ghose (2004), "Online information
search termination patterns across product categories and
consumer demographics",. Journal of Retailing. 2>Q0) .221-22%.
Brady, Michael K., Gary A. Knight, J. Joseph Cronin Jr., G.
Tomas, M. Hult and Bruce D. Keillor (2005), "Removing the
contextual lens: A multinational, multisetting comparison of
service evaluation models". Journal of Retailing. 81 (3). 215-230.
Chandrashekaran, Rajesh, (2004), "The influence of redundant
comparison prices and other price presentation formats on
consumer's evaluations and purchase intentions", Journal of Retailing.
80 (1). 53-66.
Dorthy S. Rojers and Mercia M.T.Grassi "Retailing news
perspectives" Dryden. Patrick M. Dunne, Robbert F. Lusch and
David A. Griffith "Retailing" Thomson- South-Westem.
Garretson, Judith A., Dan Fisher and Scot Burton (2002),
"Antecedents of private label attitude and national brand
promotion attitudes: similarities and differences", Journal of
Retailing. 78 (2). 91-100.
20
Krishnamurthi, Lakshman and Purushottam Papatla (2003),
"Accounting for heterogeneity and dynamics in the loyalty-price
sensitivity relationship", Journal of Retailing. 79 (2). 121-135.
Kopalle, Praveen K. and Joan Lindsey-MuUikin (2003), "The impact
of external reference price on consumer price expectations",
Journal of Retailing. 79 (4). 225-236. •
Krishna, Aradhna,'Richard Briesch, Donald R. Lehmann and Hong
Yuan (2002), "A meta-analysis of the impact of price presentation
on perceived savings", Journal of Retailing. 78 (2). 101-118.
Kukar-Kinney, Monika and Rockney G. Walters (2003), "Consumer
perceptions of refund and competitive scope in price-matching
guarantees: effects on store patronage", Journal of Retailing. 79 (3).
153-160.
21