An analysis of the relationship between organizational culture ...
273
Edith Cowan University Edith Cowan University Research Online Research Online Theses: Doctorates and Masters Theses 1-1-2004 An analysis of the relationship between organizational culture and An analysis of the relationship between organizational culture and occupational stress: Perceptions of employees following a occupational stress: Perceptions of employees following a merger merger Brent J. Pasula Edith Cowan University Follow this and additional works at: https://ro.ecu.edu.au/theses Part of the Industrial and Organizational Psychology Commons Recommended Citation Recommended Citation Pasula, B. J. (2004). An analysis of the relationship between organizational culture and occupational stress: Perceptions of employees following a merger. https://ro.ecu.edu.au/theses/845 This Thesis is posted at Research Online. https://ro.ecu.edu.au/theses/845
-
Upload
khangminh22 -
Category
Documents
-
view
2 -
download
0
Transcript of An analysis of the relationship between organizational culture ...

Edith Cowan University Edith Cowan University
Research Online Research Online
Theses: Doctorates and Masters Theses
1-1-2004
An analysis of the relationship between organizational culture and An analysis of the relationship between organizational culture and
occupational stress: Perceptions of employees following a occupational stress: Perceptions of employees following a
merger merger
Brent J. Pasula Edith Cowan University
Follow this and additional works at: https://ro.ecu.edu.au/theses
Part of the Industrial and Organizational Psychology Commons
Recommended Citation Recommended Citation Pasula, B. J. (2004). An analysis of the relationship between organizational culture and occupational stress: Perceptions of employees following a merger. https://ro.ecu.edu.au/theses/845
This Thesis is posted at Research Online. https://ro.ecu.edu.au/theses/845

Edith Cowan University
Copyright Warning
You may print or download ONE copy of this document for the purpose
of your own research or study.
The University does not authorize you to copy, communicate or
otherwise make available electronically to any other person any
copyright material contained on this site.
You are reminded of the following:
Copyright owners are entitled to take legal action against persons who infringe their copyright.
A reproduction of material that is protected by copyright may be a
copyright infringement. Where the reproduction of such material is
done without attribution of authorship, with false attribution of
authorship or the authorship is treated in a derogatory manner,
this may be a breach of the author’s moral rights contained in Part
IX of the Copyright Act 1968 (Cth).
Courts have the power to impose a wide range of civil and criminal
sanctions for infringement of copyright, infringement of moral
rights and other offences under the Copyright Act 1968 (Cth).
Higher penalties may apply, and higher damages may be awarded,
for offences and infringements involving the conversion of material
into digital or electronic form.

An Analysis of the Relationship Between Organizational Culture and
Occupational Stress: Perceptions of Employees Following a Merger
Brent J. Pasula
Dissertation submitted to:
Edith Cowan University
in fulfillment of the requirements
for the degree of
Doctor of Philosophy
in
Occupational Health and Safety
EDITH COWAN IJNJVERSl'"Y LIBRARY
Dr. Milos Nedved, PhD., Principal Supervisor
Submitted to: Graduate School, Edith Cowan University
Date of Submission: December 10, 2004.

USE OF THESIS
The Use of Thesis statement is not included in this version of the thesis.

• This page intentionally left blank •
II
"This copy is the property of Edith Cowan University. However the
literary rights of the author must also be respected. If any passage
from this thesis is quoted or closely paraphrased in a paper or written
work prepared by the user, the source of the passage must be
acknowledged in the work. If the user desires to publish a paper or
written work containing passages copied or closely paraphrased from
this thesis, which passages would in total constitute an infringing
copy for the purpose of the Copyright Act, he or she must first obtain
the written permission of the author to do so . . " (Edith Cowan University, 2003)
III
* This page intentionally left blank *
IV
"I certify that this thesis does not, to the best of my knowledge and belief:
(i) incorporate without acknowledgment any material previously submitted for a degree or diploma
in any institution of higher education;
(ii) contain any material previously published or written by another person except where due reference is made in the
text; or
(iii) contain any defamatory material." (Edith Cowan University, 2003)
© COPYRIGHT 2004 Brent J. Pasula
All rights reserved
V
Date
• This page intentionally left blank •

An Analysis of the Relationship Between Organizational Culture and
Occupational Stress: Perceptions of Employees Following a Merger
Brent J. Pasula
ABSTRACT
There is a growing body of literature regarding the physiological and
psychological effects of stress resulting from the increasing concern about occupational
stress. This study attempts to fill an identified gap within epidemiologic literature by
examining whether organizational culture has an influence on the level of occupational
stress, perceived by employees, following the merger of their company with another.
To explore this relationship, five research questions were examined using a data
gathering process that consisted of a self-administered survey to measure psychosomatic
strain, stress-inducing work demands, and organizational culture.
The data generated from the survey underwent hierarchical analysis to determine
the factor loading of organizational culture within the proposed work stress framework.
Statistical analyses were completed with the use of the statistical package Analysis of
Moment Structures 5.0 (AMOS 5.0). The population for this study consisted of full
time employees of ExxonMobil Canada who worked for the company at least one year
prior to the distribution of the survey. The survey was distributed electronically to the
entire population, including management, using the company's electronic mail system.
Of this population, 49% of the employees participated in the study. Each participant
II
completed an online questionnaire and either faxed or e-mailed their responses to the
author. The data was compiled using Microsoft Excel and analyzed withAMOS 5.0.
AMOS 5.0 was used to create a structural equation model of the work stress
framework to investigate the influence of organizational culture within the model. The
results of this analysis suggest that organizational culture has a comprehensive and
beneficial effect throughout the work stress framework. The analysis showed that
Organizational culture has a strong loading on both decision latitude and psychosomatic
strains. A single unit decrease of the organizational culture measure drove a 0.536
increase in self-reported levels of psychosomatic strains. Organizational culture is
correlated with how a worker perceives their decision latitude but it does not appear to
influence how the worker perceives their psychological job demands. This suggests that
Organizational culture acts as a buffer to job stressors rather than influencing the
individual's perception of the stressor itself.
Of the nine organizational characteristics assessed in this study leadership has
the greatest influence on the work stress framework and plays a key role in predicting
psychosomatic strains. Employees who perceive their leaders as effective
communicators that provide clear direction and who care about people and not just
financial performance reported significantly few psychosomatic strains than those
individuals who had more negative perceptions of their leaders. As such, for a stress
reduction program to be effective, health care practitioners and corporate employee
assistance programs should focus their energies on developing strategies that foster
greater communication throughout the organization. Some aspects of this strategy
should include a means to provide employees with clear direction, keep employees
informed regarding activities that impact their job function, and involve the
development of mechanisms that allow employees to communicate their concerns and
ideas to management. Accordingly, any commitment made by leadership must have
follow up in order to maintain a trusting, high performance working environment.
III

ACKNOWLEDGEMENTS
I wish to express my sincere appreciation to the many people who provided
support, direction, and assistance toward the completion of this dissertation. Without
their words of encouragement and contributions, this dissertation research would not
have been finished.
To Guy Miller, my friend and mentor, who supported me in my efforts to obtain
an advanced degree in Occupational Health. You have been a true inspiration to me to
keep going and stop at nothing less than the best. I am also grateful to the many
colleagues who participated in this study by replying to the questionnaires making this
thesis possible.
To my parents, Mervin and Marlene, thank you for encouraging me to pursue my
dreams, setting an example for me to follow as a husband, a parent, a worker, and a
student. Thank you for instilling in me an appreciation for education and instilling its
value in me. Mom, thank you for the hard work you put into reviewing and critiquing
my writing.
To my sons, Matthew and Tyler, my sources of inspiration, who always make
me smile and have helped me to know what is truly important in life. I hope this will
serve as an example to you to set high goals for yourselves and to persevere until you
attain them.
A special note of thanks goes to my wife, Susan, for supporting me through each
phase of the project, for your encouragement, hopefulness, understanding, and belief in
me. Most of all, thank you for encouraging me to pursue my dreams and letting me
know that when I put my mind to it, there's nothing I cannot achieve. Thank you Susan
for helping me compile data, and reviewing my writing. Without your help I would not
have been able to complete this. I love you!
IV
TABLE OF CONTENTS
ABSTRACT ................................................................................................................................................................... II
ACKNOWLEDGEMENTS ....................................................................................................................................... IV
TABLE OF CONTENTS ............................................................................................................................................. V
LIST OF TABLES .................................................................................................................................................... VIII
LIST OF FIGURES ..................................................................................................................................................... XI
CHAPTER 1. ................................................................................................................................................................... 1
INTRODUCTION ................................................................................................................................................... I Introduction to the problem ............................................................................................................................ I Problem Statement ............................................................................................................................................. 7
Research Questions ............................................................................................................................................ 7
Importance of the study .................................................................................................................................... 9 Chapter I Summary ......................................................................................................................................... 13 DEFINITIONS .................................................................................................................................................. 14
CHAPTER II ................................................................................................................................................................ 18
REVIEW OF THE LITERATURE ................................................................................................................. 18 Introduction ....................................................................................................................................................... ] 8 Background to the problem ........................................................................................................................... ] 8
The Demand-Control-Support Model (Karasek, 1979) ................................................................................... 19 Framework of Occupational Stress. ................................................................................................................. 13 Merger Syndrome ............................................................................................................................................. 16 Coping Strategies .............................................................................................................................................. 17 Psychosomatic strains. ...................................................................................................................................... 31 Sleep difficulties ............................................................................................................................................... 31 Lower back and neck pain ............................................................................................................................... 34 Anxiezy .............................................................................................................................................................. 35 Increased Blood Pressure ................................................................................................................................. 36 Organizational Culture .................................................................................................................................... 37 Supervisor and Coworker Support ................................................................................................................... 41 Teamwork .......................................................................................................................................................... 48 Leadership. ........................................................................................................................................................ 50 Information. ...................................................................................................................................................... 56 Initiative ............................................................................................................................................................ 59 Sense of Belonging .......................................................................................................................................... 60 Engaged Organizational Cultures vs. Restrictive Organizational Cultures ................................................... 64
Demographic and Personality Characteristics ........................................................................................ 66 Age. .................................................................................................................................................................... 67 Gender ............................................................................................................................................................... 68 Home-Life Stressors ......................................................................................................................................... 70 Marital Status ................................................................................................................................................... 71 Personalizy ........................................................................................................................................................ 71 Ethnicity ........................................................................................................................................................... 73 Job Classification ............................................................................................................................................. 75
Cause for Concern in the Workplace .......................................................................................................... 76 Limitations of the Study .................................................................................................................................. 78
V

Chapter II Summary ....................................................................................................................................... 81
CHAPTER III ............................................................................................................................................................... 82
METHODOLOGY ................................................................................................................................................ 82 Introduction ....................................................................................................................................................... 82 Purpose of the Study ........................................................................................................................................ 82 Research Design ............................................................................................................................................... 83
Population ........................................................................................................................................................ 86 Organizational Culture .................................................................................................................................... 89 Organizational Stressors ............. ...................................................................................................................... 90 Demographics ................................................................................................................................................... 9 I Personality ........................................................................................................................................................ 92
Data Collection Procedure ............................................................................................................................. 93 The Survey Instrument: .................................................................................................................................. 95
Section 1 ............................................................................................................................................................ 95 Section II .......................................................................................................................................................... 97 Section III ....................................................................................................................................................... I 03 Section IV. ....................................................................................................................................................... I 04 Section V ............... .......................................................................................................................................... I 06
Data Management and Statistical Analyses ........................................................................................... 108 Data Management .......................................................................................................................................... 108
Statistical Analysis ........................................................................................................................................ 111 Demographic Effects ...................................................................................................................................... 111 Analysis of Measures ...................................................................................................................................... 111 Measurement Model ....................................................................................................................................... 112 Structural Model Validity ............................................................................................................................... 115 Structural Equation Modeling ....................................................................................................................... 116 Parceled Data .................................................................................................................................................. 119 Model Fit ........................................................................................................................................................ 120
Research Question Methodology ............................................................................................................... 121 Interpretation of Results ............................................................................................................................. 128 Chapter III Summary. .................................................................................................................................. 132
CHAPTER IV ............................................................................................................................................................. 133
PRESENTATION AND ANALYSIS OF THE DATA ............................................................................. 133 Introduction .................................................................................................................................................... 133 Reliability and Validity of Measurement Models ................................................................................. 133 Demographic Data. ........................................................................................................................................ 139
Gender ............................................................................................................................................................. 143 Job Classification ........................................................................................................................................... 146 Work Location ................................................................................................................................................ 149 Education. ....................................................................................................................................................... 152 Marital Status ................................................................................................................................................. 155 Time With Company. ...................................................................................................................................... 158 Age .................................................................................................................................................................. 162 Personality ...................................................................................................................................................... 173 Home-work Interface ..................................................................................................................................... 176 Organizational Culture .................................................................................................................................. 179 Organizational Culture Characteristics ......................................................................................................... 187
Major Findings ............................................................................................................................................... 191 Chapter IV Summary ................................................................................................................................... 196
CHAPTER V ............................................................................................................................................................. 197
CONCLUSIONS .................................................................................................................................................. 197 Introduction .................................................................................................................................................... 19 7 Summary and Interpretations of the Results ........................................................................................ 197 Implications ..................................................................................................................................................... 204 Recommendations ......................................................................................................................................... 205
(A) Recommendations for Restrictive Organizations .................................................................................... 205
VI

(B) Recommendations for Engaged Organizations ...................................................................................... 206 (C) Recommendations For Work Stress Intervention ................................................................................... 206 (D) Recommendations for Future Studies ..................................................................................................... 207
Chapter V Summary. .................................................................................................................................... 209
REFERENCES CITED .......................................................................................................................................... 210
APPENDICES .......................................................................................................................................................... 247
APPENDIX A ....................................................................................................................................................... 247 A.1: Standardized Regression Weights ................................................................................................... 24 7 A.2: Assessment of Normality (Personality Type A) ............................................................................ 249 A.3: Assessment of Normality (Personality Type 8) ............................................................................ 250 A.4: Conditions of Use .................................................................................................................................. 251
VII

LIST OF TABLES
Table
Table 2.1: Characteristics of an Engaged Culture and a Restrictive
Culture.
Table 3.1: Summary of the Variables and corresponding questions for
each endogenous construct.
Table 4.1: Reliability Analysis (Cronbach's alpha) of Endogenous
Constructs.
Table 4.2: Demographic Characteristics of Participants (N= 186).
Table 4.3: ANOV A of Gender on associated latent constructs.
Table 4.4: ANOVA of Job Classification on associated latent Constructs.
Table 4.5: ANOV A of work location on associated latent constructs.
Table 4.6: ANOV A of Education on associated latent constructs.
Table 4.7: AN OVA of Marital Status on associated latent constructs.
Table 4.8: ANOV A of length of time employed by the company on
associated latent constructs.
Table 4.9: ANOV A of variance between employees in their twenties and
those in their thirties on associated latent constructs.
Page Number
63
114
134
139
143
147
150
153
156
158
163
Table 4.10: AN OVA of variance between employees in their twenties and 164
those in their fourties on associated latent constructs.
Table 4.11: ANOV A of variance between employees in their twenties and 165
those in their fifties on associated latent constructs.
Table 4.12: Analysis of Variance between employees in their thirties and
employees in their forties on associated latent constructs.
VIII
166
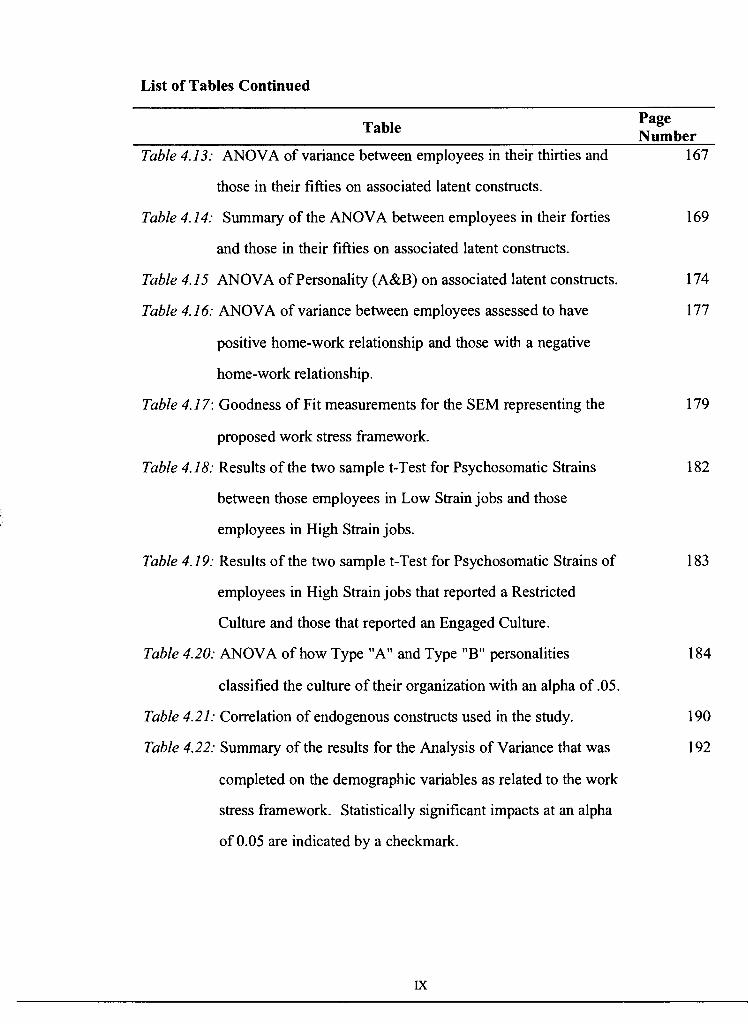
List of Tables Continued
Table
Table 4.13: ANOV A of variance between employees in their thirties and
those in their fifties on associated latent constructs.
Table 4.14: Summary of the ANOV A between employees in their forties
and those in their fifties on associated latent constructs.
Page Number
167
169
Table 4.15 ANOV A of Personality (A&B) on associated latent constructs. 174
Table 4.16: ANOV A of variance between employees assessed to have 177
positive home-work relationship and those with a negative
home-work relationship.
Table 4.17: Goodness of Fit measurements for the SEM representing the
proposed work stress framework.
Table 4.18: Results of the two sample t-Test for Psychosomatic Strains
between those employees in Low Strain jobs and those
employees in High Strain jobs.
Table 4.19: Results of the two sample t-Test for Psychosomatic Strains of
employees in High Strain jobs that reported a Restricted
Culture and those that reported an Engaged Culture.
Table 4.20: ANOVA of how Type "A" and Type "B" personalities
classified the culture of their organization with an alpha of .05.
Table 4.21: Correlation of endogenous constructs used in the study.
Table 4.22: Summary of the results for the Analysis of Variance that was
completed on the demographic variables as related to the work
stress framework. Statistically significant impacts at an alpha
of 0.05 are indicated by a checkmark.
IX
179
182
183
184
190
192
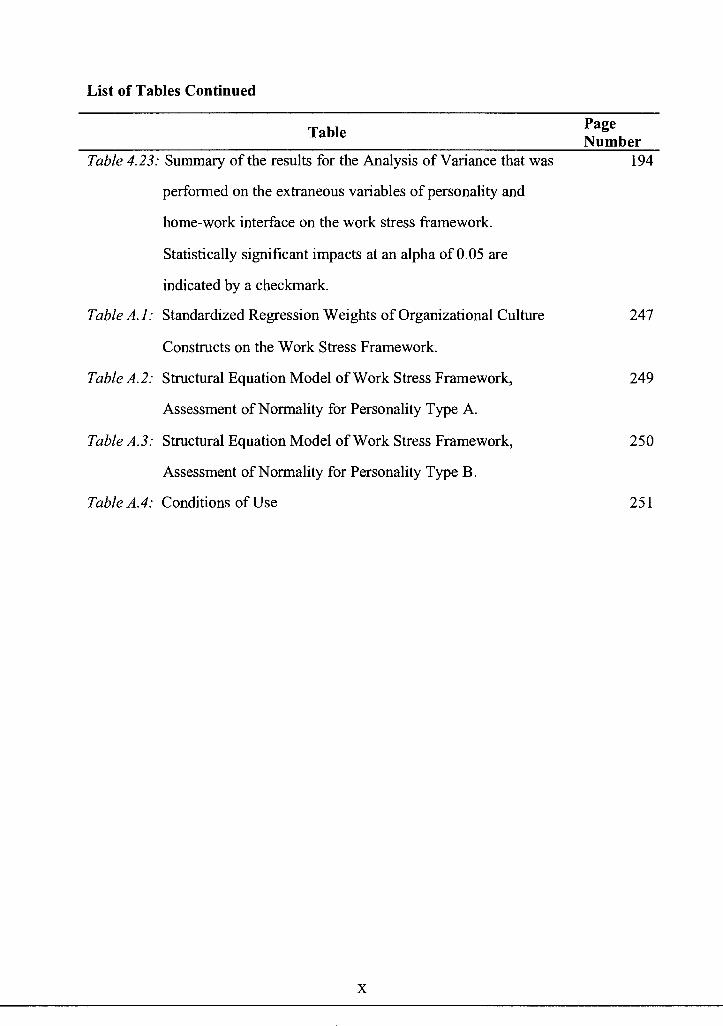
List of Tables Continued
Table
Table 4.23: Summary of the results for the Analysis of Variance that was
performed on the extraneous variables of personality and
home-work interface on the work stress framework.
Statistically significant impacts at an alpha of 0.05 are
indicated by a checkmark.
Table A.1: Standardized Regression Weights of Organizational Culture
Constructs on the Work Stress Framework.
TableA.2: Structural Equation Model of Work Stress Framework,
Assessment of Normality for Personality Type A.
Table A.3: Structural Equation Model of Work Stress Framework,
Assessment of Normality for Personality Type B.
Table A.4: Conditions of Use
X
Page Number
194
247
249
250
251
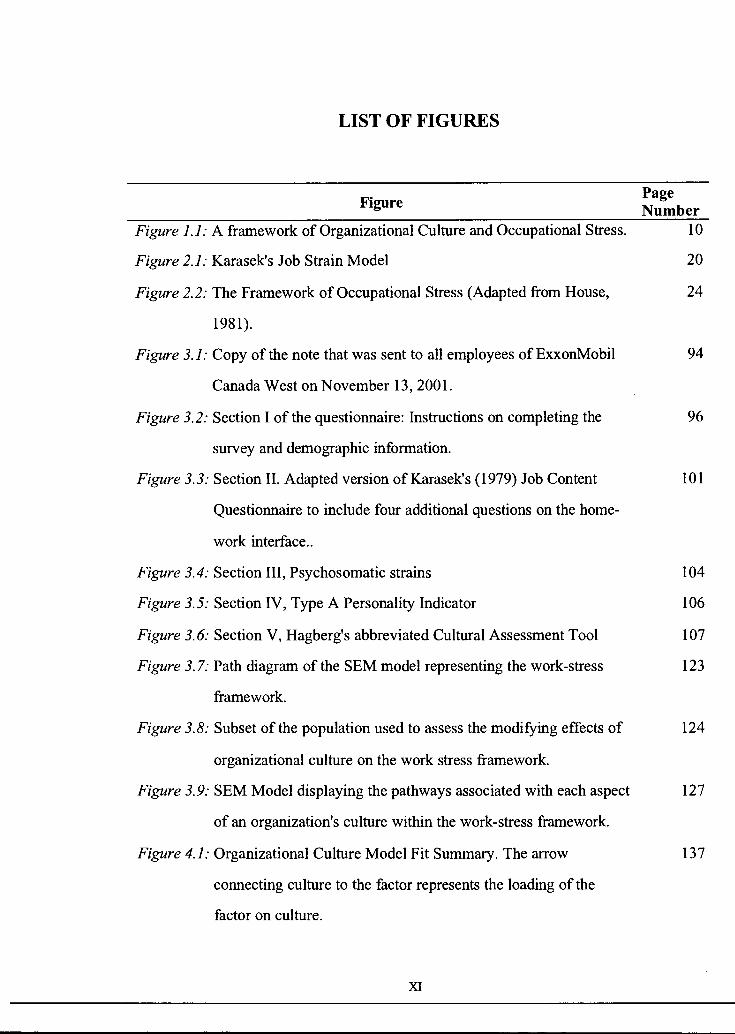
LIST OF FIGURES
Figure
Figure 1.1: A framework of Organizational Culture and Occupational Stress.
Figure 2.1: Karasek's Job Strain Model
Figure 2.2: The Framework of Occupational Stress (Adapted from House,
1981 ).
Figure 3.1: Copy of the note that was sent to all employees of ExxonMobil
Canada West on November 13, 2001.
Figure 3.2: Section I of the questionnaire: Instructions on completing the
survey and demographic information.
Figure 3.3: Section II. Adapted version ofKarasek's (1979) Job Content
Questionnaire to include four additional questions on the home
work interface ..
Figure 3.4: Section III, Psychosomatic strains
Figure 3.5: Section IV, Type A Personality Indicator
Figure 3.6: Section V, Hagberg's abbreviated Cultural Assessment Tool
Figure 3. 7: Path diagram of the SEM model representing the work-stress
framework.
Page Number
10
20
24
94
96
101
104
106
107
123
Figure 3.8: Subset of the population used to assess the modifying effects of 124
organizational culture on the work stress framework.
Figure 3.9: SEM Model displaying the pathways associated with each aspect 127
of an organization's culture within the work-stress framework.
Figure 4.1: Organizational Culture Model Fit Summary. The arrow
connecting culture to the factor represents the loading of the
factor on culture.
XI
137

List of Figures continued
Figure
Figure 4.2: Mean values and associated standard errors of the four
Endogenous Constructs that were shown to have a significant
variance according to Gender.
Figure 4.3: Mean values and associated standard errors of the two
Endogenous Constructs that were shown to have a significant
variance according to Job Classification.
Figure 4.4: Mean values and associated standard errors of the two
Endogenous Constructs that were shown to have a significant
variance according to Work Location.
Figure 4.5: Mean values and associated standard errors of the four
Endogenous Constructs that were shown to have a significant
variance according to level of Education obtained.
Figure 4. 6: Mean values and associated standard errors of the four
Endogenous Constructs that were shown to have a significant
variance according to time employed by the company.
Figure 4. 7: Mean values and associated standard errors of the eight
Endogenous Constructs that were shown to have a significant
variance according to the age of the participant.
Figure 4.8: The mean values of four Endogenous Constructs reported
according to personality.
Page Number
144
148
151
154
160
170
175
Figure 4.9: The mean values of two endogenous constructs as related to the 178
home-work relationship reported by the participant.
XII

List of Figures continued
Figure
Figure 4.10: Structural Model of the Work-Stress Framework for
Personality Type "A" participants showing standardized
regression weights.
Figure 4.11: Structural Model of the Work-Stress Framework for
Personality Type "B" participants showing standardized
regression weights.
Figure 4.12: Structural Equation Model of the Work-Stress framework
showing the regression weights of each of the endogenous
constructs for organizational culture.
XIII
Page Number
181
185
188
CHAPTER I
INTRODUCTION
Introduction to the problem
It is well documented that the modem work environment can either contribute to
or mitigate against negative outcomes of workplace stress. The nature of the work,
environmental conditions, and interpersonal relationships with colleagues all may
influence the experience of stress in the workplace. As a result, relationship between
Job characteristics and employee well-being has attracted considerable attention in job
stress literature.
A number of conceptual models have been developed that relate job
characteristics to the health and well-being of working populations (Cooper, 1998;
Parker & Wall, 1998). Among these, two theoretical frameworks have been particularly
successful in generating and guiding job stress research and have been emphasized in
two representative work stress models: Karasek's (1979) demand-control-support model
and House's (1981) framework of occupational stress. Each of these work stress models
have been strongly supported with empirical research in terms of their predictability of
work stress outcomes (Baker, Israel, & Schurman, 1996), and formed the foundation of
many current day stress prevention programs.
In recent years there has been increasing interest in the topic of stress at work
and the undesirable consequences it can have for the health and safety of individuals.
Job stress may not necessarily be more prevalent now than it has been in the past, but a
greater number of people are identifying it as the source of their physical problems and
as a result it is getting more attention The effects of stress are both widespread and
diverse, to the extent that many people would regard stress as the principal threat to well
being in a modem industrial society. "We've identified this as a top priority issue," said
National Institute of Occupational Safety and Health Director Linda Rosenstock, a
physician. "The U.S. public is reporting very high levels of stress at work, and often
reporting it's the largest source of stress they face. Shifting work patterns due to the
global economy are aggravating these issues." (Rosenstock, 1999)
Out of the ten leading causes of death in the United States, stress is directly
implicated in four. These include heart disease, strokes, injuries, and suicide. Stress is
also indirectly implicated in three causes of death: cancer, chronic liver disease, and
emphysema (Murray & Lopez, 1994). Until recently, many workplace employers
reasoned that if people could not handle stress, they were not tough enough for the job.
Now, many companies are beginning to recognize the negative impacts of stress and
have implemented counseling programs aimed at stress reduction. Many of these
programs employ strategies that are totally focused on the employee. For example,
many companies have initiated stress management programs to reduce stress in
employees in hopes ofreducing the negative impacts of stress. Unfortunately, these
methods have met with only limited success (Murphy, 1988).
As with many psychological disorders, the symptoms associated with excessive
stress are easier to treat than the source of the problem. If however, the treatment only
concentrates on the symptoms and does not address what is causing the problem any
benefit gained from the treatment will be short lived. When the treatment for stress only
addresses the symptoms, and the cause of the stress remains unchanged, the
manifestations of stress will tend to reoccur and over time and grow in severity. In an
attempt to better understand stress in working populations researchers are beginning to
focus on the antecedents of occupational stress, such as organizational culture.
Research conducted on stress is continuing to expand as the physiological and
psychological outcomes are beginning to be understood to a greater degree. This has
2

resulted in the merging of two separate fields, one focusing on the effects of
organizational demands on individual wellness and another looking at the source or
context in which stressors arise, and the likely responses (Kahn & Byosierre, 1992).
Individual wellness is increasingly becoming a concern within the workplace. Not only
are companies beginning to recognize the direct and indirect costs of employee stress,
they are also beginning to recognize the value of having a social conscience and the
direct links it has to a company's performance. The programs and strategies companies
utilize to mitigate against the negative impacts of stress become even more important
during times of restructuring and organizational change. Research has recently
identified corporate restructuring as a stressor that affects individual well being and
company performance (Baruch & Woodward, 1998).
Corporate restructuring encompasses significant and rapid changes in a
company's assets, capital structure or organizational structure (Singh, 1993). Changes
such as the aforementioned can have a significant impact on a company's performance
prior to, during the transition period, and immediately following a company's
reorganization (Kesner & Dalton, 1994; Somers & Bird, 1990). When a company
undergoes a reorganization, such as experienced during a merger, it can be a traumatic
time for employees and it is expected that employees will report greater levels of stress.
This may be due to an increase in the level of anxiety experienced by the worker as a
result of the merger and is expected to vary a great deal from employee to employee.
Despite extensive research and theory generation on the topic of stress, there is
still a great deal of ambiguity in the field. Part of the problem is the difficulty in
operationalizing stress constructs (Mikhail, 1981 ). This is often the case when dealing
with perceptual issues. Extensive reviews of the literature have been conducted
(Edwards, Caplan & Harrison, 1998; Cordes & Dougherty, 1993; Burisch, 1993) with
little progress towards arriving at conceptual agreement. Many existing stress models
are static in their design (Lazarus & Launier, 1978). They treat the stress experience as
a discrete occurrence, and view intervention as a one-time quick fix. Ultimately,
3

however, stress is less about what happens to a person and more about the reaction a
person has to a perceived stressful situation. This holds true both on individual and
organizational levels. Stress levels are determined by how a person perceives,
processes, and responds to information combined with how the individual perceives and
engages in workplace relationships.
In workplaces there should be an organizational bond of interdependence,
mutual interest, interconnecting contributions, and enjoyment between employer and
employee. Part of the responsibility of an organization is to see that this common bond
is maintained and strengthened in all facets of workplace life including stress reduction
programs. Just as any relationship requires common bonds and interests to stay healthy,
so the relationship within corporations must be a shared experience. Therefore, if stress
reduction programs are aimed solely at the individual employee without addressing the
impact ofbusiness practices, processes, and the organizational structure and culture as a
whole on the employee, then there is a higher likelihood that programs will fail by not
addressing the root issues.
An effective, comprehensive stress reduction strategy involves not only ongoing
training and practice in effective employee coping skills, but also identifying and
addressing sources of stress in business practices and processes, organizational structure,
and the role of organizational culture in the work stress framework. Research has
indicated that the impact of organizational change on employee stress levels has
received very little attention (Foster-Fisherman & Keys, 1997).
Therefore, the main purpose of this study is to present a framework that depicts
how stress at the individual employee level is related to cultural changes at the
organizational level. The framework is dynamic and acknowledges the complex
interrelationships among organizational culture, stress responses, behaviour, and
perceptions. This study will present results that should provide employers with a greater
insight into the relational influence between an organizational culture change and the
experience of stress by employees at the workplace. For example, such insight may
4

provide companies with directions needed to develop clear policies and procedures that
will guide their stress reduction programs.
It should be noted that not all stress is unpleasant. To be alive means to respond
to the stimulation of achievement and the excitement of a challenge to be met. In fact,
there is evidence in the research that suggests that people need a certain amount of
stimulation and that monotony can bring on some of the same problems associated with
excessive stress. Perception of an event, such as cultural changes in an organization, is
key to how a person will respond to tum good stress into excessive stress, or distress.
Individuals respond with different coping mechanisms to stressful situations. An
individual's personality, age, sex, diet, life style, and past experiences influences their
perception of whether or not an event they experience is stressful. When the event is
perceived as stressful, and the situation goes unresolved, the body is kept in a constant
state of activation, which increases the rate of wear and tear to biological systems
(Driskell & Salas, 1996). Driskell and Salas ( 1996) attest to the better understanding of
how the body reacts to stress. When the brain perceives danger, it triggers certain
chemicals in a "fight or flight" response that heightens the heartbeat and sharpens
reflexes. This reaction is preprogrammed biologically and allows for peak physical
responses to dangerous situations. Everyone responds to short-lived stressful events in
much the same way, regardless of whether the stressful situation is at work or home.
"These short-lived or infrequent episodes of stress pose little risk to the
individual, but when the stressful situations goes unresolved, the body is kept in
a constant state of activation, which increases the rate of wear and tear to
biological systems. Ultimately, fatigue or damage results, and the ability of the
body to repair and defend itself can become seriously compromised" (U.S.
Department of Health and Human Services, n.d., p. 10).
As a result, the longer an individual is exposed to a stressful event, the higher the
likelihood that the individual will experience a stress related injury and or disease.
An individual's response to long term stressful events, such as those associated
with a merger, are fairly consistent and vary little based on personality or demographics
(Miller & Smith, 1997). This suggests that the effects of the work environment might
have a greater influence on the employee's perception of stress than personal
5
characteristics regarding how the employee responds to stressors such as those
associated with a reorganization (Chemiss, 1980).
A stressor can be described as an event or situation that causes non-specific
physiological responses that increase the risk of various illnesses and other health
problems. There are three general types of influences that can intensify or mitigate the
impact the stressor can have on the individual. These include Bioecological influences;
e.g., noise pollution, jet lag, inadequate lighting. Psycho-intrapersonal influences; e.g.,
thoughts, values, beliefs, attitudes, perceptions and social influences; e.g.,
socioeconomic status, daily hassles, interpersonal relationships, and life events
(McGrath, 1970).
This paper examines an employee's Psycho-intrapersonal and Social influences
to investigate the role of organizational culture in the employee's experience of stress
following a merger. It outlines the background, theoretical and research foundations, a
methodology, and the results of an investigative study that explores the relationships
deemed to exist between organizational culture and the work stress framework.
Accordingly, identifying the comprehensive effects of organizational culture on
work stress is important from a work stress prevention perspective. This study
investigates the characteristics of culture affecting the work stress process and examines
the effects of organizational culture in a framework based on a theoretical model. The
proposed model is made up of a number of dependant variables, or endogenous
constructs, which fluctuate according to the latent variables influencing them.
By providing insight into the antecedents of occupational stress, such as those
characteristics of an organization's culture that have the greatest influence on the work
stress framework, health care practitioners and corporate human resource practitioners
will be able to develop more effective work stress prevention programs.
6

Problem Statement
The primary objective in undertaking this research is to assess the relationship
that exists between organizational culture and the work stress framework. Also being
examined is the influence of personality, demographics, and the home-work interface on
the work stress framework. The lack of research into the relationship between
psychosomatic strains and the type of organizational culture employed at the work
place, along with the growing propensity to "connect" these two units, particularly
during times of reorganization suggests that more information is needed about the
relationship between these two factors. Therefore, this study was devised to describe
the relationship that exists between organization culture and work stress by
characterizing the organizational culture of the business units within ExxonMobil
Canada's Upstream operations and relate differences in cultural perceptions to the level
of psychosomatic strains reported by employees. In addition, the direct relationships
between the organizational culture of the working unit and the level of psychosomatic
strain was further analyzed in an attempt to identify mediating or moderating effects of
specific organizational culture characteristics and selected demographic and personality
traits.
Research Questions
The following specific research questions were similarly adopted:
Research Question 1: In what ways, if any, do the endogenous constructs analyzed in
this study differ according to the demographic characteristics of
the population.
7
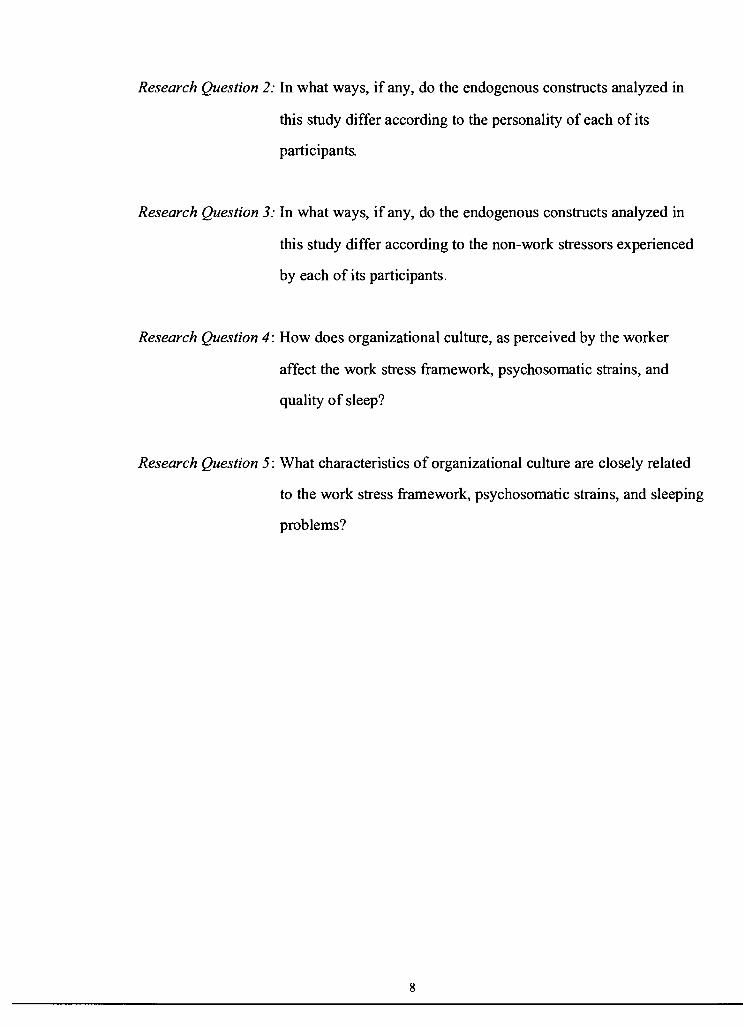
Research Question 2: In what ways, if any, do the endogenous constructs analyzed in
this study differ according to the personality of each of its
participants.
Research Question 3: In what ways, if any, do the endogenous constructs analyzed in
this study differ according to the non-work stressors experienced
by each of its participants.
Research Question 4: How does organizational culture, as perceived by the worker
affect the work stress framework, psychosomatic strains, and
quality of sleep?
Research Question 5: What characteristics of organizational culture are closely related
to the work stress framework, psychosomatic strains, and sleeping
problems?
8
-
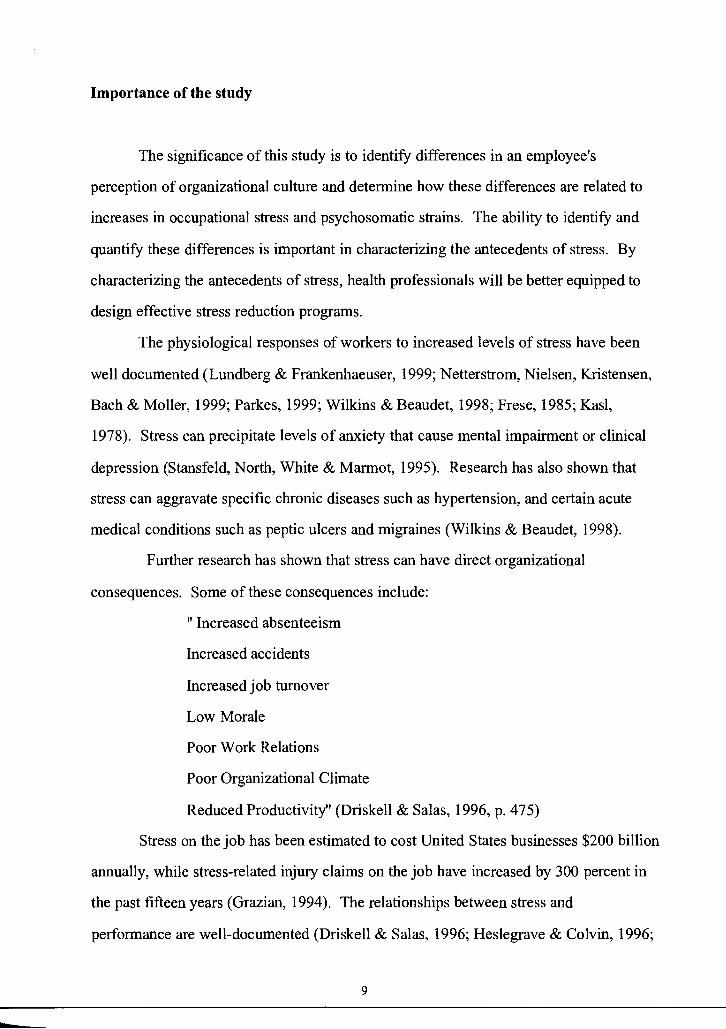
Importance of the study
The significance of this study is to identify differences in an employee's
perception of organizational culture and determine how these differences are related to
increases in occupational stress and psychosomatic strains. The ability to identify and
quantify these differences is important in characterizing the antecedents of stress. By
characterizing the antecedents of stress, health professionals will be better equipped to
design effective stress reduction programs.
The physiological responses of workers to increased levels of stress have been
well documented (Lundberg & Frankenhaeuser, 1999; Netterstrom, Nielsen, Kristensen,
Bach & Moller, 1999; Parkes, 1999; Wilkins & Beaudet, 1998; Frese, 1985; Kasl,
1978). Stress can precipitate levels of anxiety that cause mental impairment or clinical
depression (Stansfeld, North, White & Marmot, 1995). Research has also shown that
stress can aggravate specific chronic diseases such as hypertension, and certain acute
medical conditions such as peptic ulcers and migraines (Wilkins & Beaudet, 1998).
Further research has shown that stress can have direct organizational
consequences. Some of these consequences include:
" Increased absenteeism
Increased accidents
Increased job turnover
Low Morale
Poor Work Relations
Poor Organizational Climate
Reduced Productivity" (Driskell & Salas, 1996, p. 475)
Stress on the job has been estimated to cost United States businesses $200 billion
annually, while stress-related injury claims on the job have increased by 300 percent in
the past fifteen years (Grazian, 1994). The relationships between stress and
performance are well-documented (Driskell & Salas, 1996; Heslegrave & Colvin, 1996;
9
Hancock, 1986), however, attempts to design effective stress reduction programs have
met with little success. In order to create effective stress reduction programs companies
will have to look towards the essence of how they conduct their business and in doing so
assess their organizational culture.
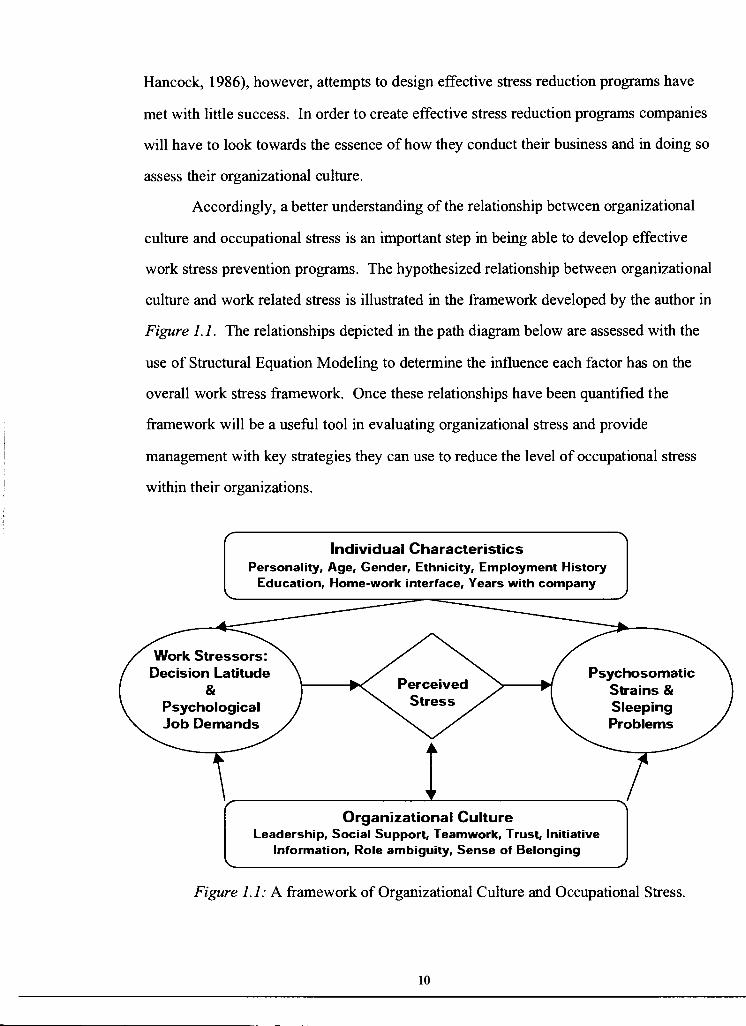
Accordingly, a better understanding of the relationship between organizational
culture and occupational stress is an important step in being able to develop effective
work stress prevention programs. The hypothesized relationship between organizational
culture and work related stress is illustrated in the framework developed by the author in
Figure 1.1. The relationships depicted in the path diagram below are assessed with the
use of Structural Equation Modeling to determine the influence each factor has on the
overall work stress framework. Once these relationships have been quantified the
framework will be a useful tool in evaluating organizational stress and provide
management with key strategies they can use to reduce the level of occupational stress
within their organizations.
Individual Characteristics Personality, Age, Gender, Ethnicity, Employment History
Education, Home-work interface, Years with company
Decision Latitude &
Psychological Job Demands
Organizational Culture
Psychosomatic Strains & Sleeping Problems
Leadership, Social Support, Teamwork, Trust, Initiative Information, Role ambiguity, Sense of Belonging
Figure 1.1: A framework of Organizational Culture and Occupational Stress.
10

This study also provides data useful to researchers and others interested in the
patterns of psychosomatic strains and organizational culture within industry. The
study's descriptive data should be useful to anyone concerned about the emerging trends
of acquisitions and mergers that seem common place in the global economy. No other
study could be identified in the literature that, like this study, collected and
analyzed data about the organizational culture and patterns of reported psychosomatic
strains. Therefore, this study adds to the knowledge base concerning the epidemiology
of stress as well as the field of management and administration of upstream petroleum
industries. Management practices grounded in the theory of organizational culture and
patterns of reported psychosomatic strains should assist managers to develop the
appropriate stress reduction programs. Consequently, there should be a shared
responsibility between employers and employees for decreasing levels of stress and
increasing productivity.
A great deal of the discussion presented above centred around what the
organization can do to reduce the level of stress experienced by employees. It must be
noted however, that the individual plays a very important role in the experience of stress
and their participation in stress reduction initiatives is vital. The perceived stress an
employee experiences as a result of their interaction with the work environment can
vary a great deal from individual to individual and is based on host of factors. A
person's stress response is driven by factors specific to the individual such as their
personality and past history and by factors external to the individual such as the type of
stressor experienced. In this study, participants were presented with a similar and
significant stressor; the merger of their company with that of another.
According to occupational stress literature, as a result of the merger between
Exxon and Mobil Oil, many employees of the merged company, ExxonMobil, should
have experienced a certain degree of stress. Some employees would have perceived it
as a challenge while others would have been motivated to work harder and still others
may have perceived the merger as a threat to their way of life. How individuals reacted
11

to this stressful event was a function of their work sites organizational culture and a
myriad of personal perceptions and beliefs.
This study attempts to provide further insight into the coping mechanisms used
by employees during a stressful event and the role organizational culture plays in this
process.
12
Chapter I Summary
In this section a short background of the theory and literature related to changing
work environments and how these changes are impacting employee stress levels is
presented. It is followed by a presentation of the problem statement. A problem
statement that defines the study through five research questions for the various variables
was also introduced. The study attempts to explore the influence of organizational
culture on the work stress framework by assessing a variety of work place
characteristics and associated psychosomatic strains. Finally, the rationale for and the
significance of this study was presented which included the introduction to a theoretical
model relating organizational culture to the work stress framework. Information
gathered during this study should be helpful to a variety of Health care professionals and
managers in their attempt to create effective stress reduction strategies.
13
DEFINITIONS
Several terms will be used that have special or restricted meaning. In order to
ensure communication and to dispel any controversy over terminology, the author
provides definitions of key terms used in this study.
AMOS
Analysis of Moment Structures. a statistical program developed by J. L.
Arbuckle in 1996 that uses hierarchical analysis to conduct Structural Equation
Modeling.
ANOVA
Analysis of Variance, "a statistical technique that isolates and assesses the
contributions of categorical independent variables to variation in the mean of a
continuous dependent variable." (Lees, 2005, np.)
Business Team Lead/ Process Team Lead
Imbedded managers within the production company responsible for the direct
supervision of supporting staff.
Business Units
Organizational divisions within ExxonMobil at the national level.
Chi-Square test
A statistical test to determine the probability that an observed deviation from the
expected event or outcome occurs solely by chance.
14
Decision Latitude
Refers to the concept of job control which relates to an individual's participation
in decision-making and job design (Spector, 1992).
Epidemiology
A branch of medical science that deals with the incidence, distribution, and
control of disease in a population.
Endogenous Construct
Is a term used in structural equation modeling that is synonymous with
dependant variable. Fluctuations in the values of endogenous constructs are said
to be explained by the model because all latent variables that influence them are
included in the model specification (Byrne, 2001).
Intrapsychic
"Denoting the psychological dynamics that occur inside the mind without
reference to the individual's exchanges with other persons or events." (Lees,
2005, np.)
Merger Syndrome
A defensive and "fear the worst" response that results from the uncertainty and
stress of a merger (Marks & Mervis, 1985, p. 51 ).
Organizational Culture
The feelings, beliefs, values and basic assumptions held by members of the
organization, either collectively or individually, as they relate to work activities
(Foster-Fishman & Keys, 1997, p. 358).
15
Participants
Refers to the people, involved in the research survey, who shared in the
information-gathering process.
Psychosomatic Strain
Results
Stress
Excessive physical or mental tension originating from psychological or
emotional causes (Kagan & Levi, 1975, p. 243).
Refers to the outcomes of the research process
The physical, emotional, or psychological responses to events that exceed the
adaptive resources of an individual (Selye, 1956).
Stressor
Events or situations that cause non-specific physiological responses that increase
the risk of various illnesses and other health problems (McGrath, 1970).
Type A Individual
Type A individuals are generally characterized as aggressive, achievement
oriented, dynamic, hard driving, assertive, fast paced, impatient, competitive,
ambitious, irritated, angry, hostile, and under time pressures (Cooper, Kirkcaldy
& Brown, 1994; Jamal, 1990; Rosenman & Chesney, 1985).
Type B Individual
Type B individuals are generally characterized as casual, easygoing, and never in
a rush to get things done (Bortner, 1969).
16

Upstream Production
Operations associated with the extractive and primary separation of crude oil and
natural gas.
17
CHAPTER II
REVIEW OF THE LITERATURE
Introduction
This review identifies key insights into the relevant research and published
literature on occupational stress. The purpose of this review is to examine the body of
literature on occupational stress in order to gain insights that will aid in the development
of a conceptual framework for this study. Associated coping mechanisms were also
identified along with psychosomatic strains, organizational culture, and the influence of
extraneous variables on the outcomes of this study. Subsequently, a theoretical model
relating organizational culture, stressors, and psychosomatic strains is presented.
Background to the problem
The relationship that people have with their work, and the difficulties that can
arise when that relationship goes awry, have long been recognized as a significant
phenomenon of the modem age. The use of the term burnout for this phenomenon
began to appear with some regularity in the 1970s in the United States, especially
among people working in the human services. Burnout was viewed as a form of job
stress, with links to such concepts as job satisfaction, organizational commitment, and
turnover.
Selye (1956) was probably the first to use the term stress in a psycho
physiological context and his definition that "stress is the nonspecific response of the
body to any demand made upon it" has held of the test of time and is still used today. In
18
his writing Selye took pains to explain that stress, in and of itself, was neither good nor
bad. Selye (1976, p. 48) states that "without stress, there would be no demand for
activity and defined the total absence of stress as death". Therefore, for every activity
(task), there is an optimal level of stress that is required to perform that activity. Both
before and beyond this point, the level of stress is either too little or too great. When the
level of stress exceeds the optimal level, in either a chronic or too intense manner, it has
the potential to become distress and be harmful and damaging to the individual. Brown
and Harris (1978) identify stress as the discrepancy between the demands oflife
situations and the capacity of the individual or group to deal with them comfortably.
Continuous exposure to stressors at work and stressful life events are major
triggers of clinical depression in susceptible individuals (National Institute of Mental
Health, 2001 ). Karasek ( 1979) finds that job demands and job control were the most
significant work contents affecting depression in a nation-wide study. Job demands and
job control in Karasek's study included the most negative aspects of daily work life. Job
demands included workload, job complexity, job conflict, job ambiguity, role clarity,
and interpersonal relationships at work. Job control was comprised of decision-making
latitude, task variety, job autonomy, and work schedule (Karasek & Theorell, 1990).
There are two work stress models that have predominantly been applied to work
stress research: Karasek's demand-control-support model (Karasek, 1979) and the
framework of occupational stress (House, 1981 ). These two models have greatly
contributed to predicting the relationship between work stresses and coping
mechanisms.
The Demand-Control-Support Model (Karasek, 1979)
Karasek (1979) developed the job demands and control model from the analysis
of depression data from 911 employees that participated in the U.S. Department of
Labor's Quality of Employment Survey (QES) in 1969, 1972, and 1977. He found that
19

psychosomatic symptoms had a specific patterned distribution with the interaction
effects between job demands and job control.
The job demands and control model primarily deals with the work content as a
major source of stress. Karasek (1979) divides job content into two components in
terms of what the individual's work entails (job demands) and what the individual can
do to control their work direction. He also conceptualizes that the two constructs
interact with each other to influence the workers' mental and physical health and
developed a model that predicted mental strain results form the interaction of job
demands and job decision latitude. The job strain model is based on the underlying
theory that psychological strains results not from a single aspect of the work
environment, but from the joint effects of the demands at work and the range of
decision-making freedom available to the worker facing those demands (Karasek, 1979).
Karasek postulates that workers experience the greatest amount of job strain in jobs
associated with high demands and low decision latitude. Karasek (1979) used this
theoretical concept in the development of his Job Strain Model. Karasek's Job Strain
Model has been successfully used to predict the onset of coronary heart disease in nation
wide surveys and is represented in Figure 2.1.
Decision Latitude
Low Passive Job High Strain Job
High Low Strain Job Active Job
Low High
Job Demands
Figure 2.1: Karasek's Job Strain Model (Karasek, 1979)
20

From the Quality of Employment research, Karasek recognized the beneficial role
of coping mechanisms such as social support on the interaction of job demands and job
control as well as on health outcomes. Karasek accepted that social interaction was
obviously a major component of health and behavioral reactions. As a result, he
expanded the original job demands and control model to include social support as a third
construct affecting health outcomes. Accordingly, the demand-control-support model
(Karasek, 1979) is the modified version of the job demands and control model.
It is clear that changes in social relations between workers and changes in
decision latitude are almost inseparable strategies when the job demands and control
model is applied to job redesign (Karasek & Theorell, 1990). This linkage led House
(1981) to develop the "participatory work design process" that suggests the work
environment is a combination of job control and social support changes, implying that
social support at work can enlarge the latitude of job control and beneficially affect
psychological strain.
Job demands can be defined as the effort required to complete assigned tasks at
work. These demands are usually a function of time and are a natural aspect of
everyday work, however, job demands become stressors if they exceed an employee's
ability to complete them or when the employee loses control over them. Karasek (1979)
operationalizes job demands in the sense of psychological stressors at work such as
requirements for working fast and hard, heavy workload, not having enough time, and
having conflicting demands. Related to this, Karasek (1979) defines job control, as the
working individual's potential control over his tasks and his conduct during the working
day. He regards job control as workers' latitude to control diverse job demands.
Karasek calls job control "decision latitude". The concept of job control has been
further discussed in organizational research broadly in terms of participation in decision
making andjob design (Spector, 1992).
The job demands and control model hypothesizes that there are four distinctly
different kinds of psychological work experiences that are generated by the interactions
21

of job demands and job control. These psychological work experiences consist of: (a)
high strain jobs (high demands and low control), (b) low strain jobs (low demands and
high control), ( c) active jobs (high demands and high control), and ( d) passive jobs (low
demands and low control). The main hypothesis of the demand and control model is
that the lowest levels of psychological well-being and the highest levels of reported
stress should be associated with the high strain group (Kristensen, 1996). Karasek
( 1979) hypothesizes that job demands are not in themselves harmful, but when
combined with low employee control, these demands can lead to the development of
psychological strain. Accordingly, active jobs only moderately raise the level of strain
because much of the energy experienced by the worker as a result of the stressors
associated with active jobs is translated into action through effective problem solving, so
in effect the employee experiences very little residual strain. This results in the level of
psychological strain from active jobs being very similar to that from passive jobs
(Karasek & Theorell, 1990). This lead Karasek (1979) to imply that job control is a
primary construct in handling demands at work and stress outcomes.
The demand-control-support model (Karasek, 1979) adds another factor to the
job demands and control model. This factor was added by the hypothesis that active
participation in social life is related to lower levels ofreported job strains. Accordingly,
the highest risk of strain is to be expected in the group with high demands, low control,
and low social support (Kristensen, 1996). In a national study using depression
measures, high social support was associated with dramatically lower levels of
depression. There was a clear demand-control association within each level of social
support in the data. These three dimensions of work content: job demands, control, and
social support were capable of predicting much of the range of total variation of
depressive symptoms in the representative working population (Karasek & Theorell,
1990). This work was expanded on by House in 1981 who developed a framework for
Occupational Stress.
22
Framework of Occupational Stress
The Framework of Occupational Stress (House, 1981) structures comprehensive
path relationships dealing with work stressors, strains, enduring outcomes, and
modifying variables into a framework that can be used to predict the onset of
occupational stress. Each path relationship within the framework has been sufficiently
confirmed by empirical research with few theoretical conflicts. The framework of
occupational stress has been examined by a number of researchers and gone through a
number of iterations. Most recently, the framework was modified by LaRocco, French
and House ( 1980) and, subsequently by Israel and other colleagues at the University of
Michigan (Baker, Israel, & Schurman, 1996; Israel, House, Schurman, Heaney, & Mero,
1989; House, Wills, Landerman, McMichael, & Kaplan, 1979). This model empirically
describes the relationship between work stressors, strains, and health outcomes. The
framework of occupational stress is based on the core principle that stress is a function
of the environmental sources of stress and the individual's perception of them, as well as
short-term and long-term physiological, psychological, and behavioral responses
associated with each experience of stress. In addition, the framework of occupational
stress attempts to accommodate a number of modifying factors that influence the
relationships among the variables mentioned above (Israel, House, Schurman, Heaney &
Mero, 1989).
The framework of occupational stress is based on the assumption that stress
arises from the misfit between the person and their working environment and that this
relationship is in part determined by an individuals' perception (Edwards, Caplan &
Harrison, 1998). This is similar to the concepts described by Karasek (1979) in the
demand-control-support model. Thus, work stressors in House's (1981) model are not
work stressors objectively estimated but work stressors subjectively perceived by
individual workers.
23

In the framework of occupational stress, work stressors induce strains through
perceived stress, which in tum affects short-term responses (strains) and negative
enduring outcomes. A number of modifying variables directly and indirectly affect the
process of work stressors, perceived stress, strain, and enduring outcomes. House,
Landis & Umberson, ( 1988) focuses on the role of modifying variables in the
occupational stress process. In particular, he regards social support at work as an
important modifying variable affecting occupational stress, which is consistent with the
role of social support in Cohen's ( 1988) stress-buffering model.
Modifying Factors (Social, personal, and physiological)
/ + ' Work .r Perceived Strains ~ Enduring .... (Physiological, Stressors .... Stress ...
~ outcomes
... .... and behavioral) ... (Physiological, ~
psychological and behavioral)
Figure 2.2: The Framework of Occupational Stress (Adapted from House, 1981)
Figure 2.2 illustrates how social support acts to influence the level of work stress
experienced by the worker. As represented by the solid lines in Figure 2.2, social
support can directly reduce perceived work stressors, strains and negative enduring
outcomes because social support meets important needs for security, social contact,
approval, belonging, and affection (Cohen & Hoberman, 1983). These effects of social
support are called main effects. Another effect of social support is illustrated by the
dotted lines in Figure 2.2. These effects represent the potential of social support to
mitigate or buffer the impact of work stressors on strains and the impact of strains on
24
enduring outcomes. This effect is called an interaction effect. The meaning of
interaction is central to most theories on social support, and some authors have gone so
far as to suggest that interaction is virtually a minor way in which support affects
enduring outcomes (Cohen & Wills, 1985; House, 1981).
Social support generally has greater beneficial effects on the negative effects of
strain and enduring outcomes among people with high work stress as opposed to those
workers with lower work stress. As shown in the study by Cohen, Schwartz, Bromet
and Parkinson, (1991) the beneficial interaction effects of social support on strains
become increasingly apparent as work stress increases. In contrast, the main effect of
social support on enduring outcomes is not affected by the levels of strain reported by
the employee. Indicating that social support may work independently from the
interaction effect. Therefore, the need to distinguish main versus interaction effects
arises when considering how stress and social support may combine to affect enduring
outcomes (Cohen, 1988; House, 1981).
The demand-control-support model successfully points out key work contents
affecting the work stress process and describes the interaction between job demands and
job control affecting psychological and physical health outcomes. In this stress arousal
process, social support has an important moderating role. However, the demand
control-support model is too simplistic of a model to effectively explain the
comprehensive relationships that exist between work stressors, strains, and an array of
diverse outcomes including psychological, physical, and organizational outcomes. It
does however clearly organize the relationship between the three main job components
and stress outcomes.
This study expands on the scope of the work stress framework to include social
support within the context of organizational culture, whereby social support is one of
nine aspects of culture that play a role in the work stress framework. As a result, a
comprehensive model is presented that attempts to account for the complex
interrelationships that influence an employee's perception of stress. The model also
25

incorporates a great deal of demographic and personal information on the subjects in
order to characterize the personalities of the participant involved in the study.
Stress is a highly personalized phenomenon and can vary widely even in
identical situations. These differences occur for a number of reasons. It has been shown
that an individual's personality greatly impacts how a person responds to stressful events
(Oishi, 1999). This is in part due to conditioning. An individual's conditioning to
stressors is related to prior experience, genetic stock, and temperament (McGrath,
1970). These conditions are at least partially responsible for shaping an individual's
personality, and can be used to predict how a person handles or copes with a stressful
event, such as a corporate merger.
Merger Syndrome
It is no mystery why stress in the workplace poses an ever-increasing health and
economic threat. New technologies have revolutionized and intensified the nature of
work. Productivity expectations have risen and the pace of change itself has
dramatically accelerated, and is likely to continue to do so into the foreseeable future.
The past decade has seen a globalization of the World's workforce and is
changing how companies are conducting their business. Many companies are quickly
realizing that they require a global presence in the market place in order to remain
competitive, achieve economies of scale, and improve returns. To take advantage of the
expanding world markets companies require a significant amount of capital, a greater
depth of expertise, and adequate staffing resources. Companies are discovering that
mergers allow them greater access to the global economy by expanding geographic
diversity, improving technological resources, realizing improved efficiencies, and
increasing their financial strength.
Mergers generally involve a great deal of reorganization and often place great
demands on employees. The stressors, that influence employees during a merger, have
26
--
been described by researchers as "merger syndrome", a defensive and "fear the worst"
response that result from the uncertainty and stress of a merger (Marks & Mervis, 1985).
Other manifestations of merger syndrome include loss of personal and organizational
identities, feelings of conflict because of ambivalence and incompatibilities among
management, business systems, and organizational cultures and goals (Buono &
Bowditch, 1989; Schweiger, Ivancevich & Power, 1987). Research has shown that if
these types of stressors are not adequately managed the employee will in all probability
experience serious health problems. It is therefore in the best interest of the company
and the individual to take preventive actions that minimize the health impacts associated
with the negative effects of stress resulting from organizational change. The coping
strategies used by employees during this time of transition are varied and dependent on
many factors such as the personality of the employee, the social support the employee
receives, and the organizational culture the employee is subjected to at the time of the
merger.
Coping Strategies
Any discussion of stress requires careful analysis of the concept of coping.
Lazarus ( 1977) defines coping as the mechanism individuals use that are "those direct,
active tendencies aimed at eliminating a stressful event". The stressful event assessed in
this study is the merger between Exxon and Mobil Oil.
The process of coping may consist of a rather large array of overt and covert
behaviours. The process of coping is a very complex response that occurs when an
individual attempts to remove stress or what is perceived as a threat from one's
environment. The actual reaction one has to an environmental event is as important as
the event itself (Garland & Bush, 1982). Therefore, how a person copes with a stressor
can play a more important role in the state of a person's health then the stressor itself.
This is a particularly important concept to understand for researchers that study stress
27

responses and health care practitioners involved in the design of stress prevention
programs.
Lazarus (1977) divides coping into two main categories, direct action and
palliation. Direct action refers to the individual's attempt to change the environment or
stressor. Palliation, on the other hand, refers to the individual's attempt to moderate the
demands made by the stressor or tolerate the subjective symptoms produced by the
stressor. Lazarus (1977) further divides palliation into two subgroups. One subgroup is
directed at the symptoms of palliation and includes the use of alcohol, tranquilizers or
muscle relaxation techniques. The second subgroup is termed intrapsychic and refers to
the use of unconscious defense mechanisms such as denial or distancing. Consequently,
the individual may deal with stress through several methods including removing the
stressor through manipulating the environment, developing specific responses to help
deal with the stressor, or seeking diversion from the stressor.
Studies by Pearlin and Schooler ( 1978) were among the first to address the
interaction of the individual and the environment. They identify coping as a
behaviour that is a protective mechanism that functions in three ways. First, by
attempting to eliminate or modify the situation that is giving rise to the problem.
Second, to perceptually control the meaning of the experience in a manner that
neutralizes the problematic character of the situation. The third is to attempt to keep the
emotional consequences of the situation manageable. These researchers believe that all
coping behaviors can be categorized into these three areas.
The research by Roth and Cohen (1986) on coping, like that of Lazarus,
identifies two basic responses to stress - approach and avoidance. These orientations
refer to the cognitive and emotional activity that is oriented either to or away from a
threat. Approach strategies involve attempts to take appropriate action to either change
a situation or to make it more controllable. On the other hand, avoidance strategies
attempt to protect the individual from the overwhelming power of the stressor by
distancing the individual from the experience. It can be argued that Roth and Cohen
28

(1986), in making a distinction between two types of avoidance techniques are in fact
describing three general responses to stress.
The coping mechanism an individual utilizes when faced with a stressful
situation is a function of that individual's personality, age, sex, diet, life style, and prior
experiences. The internal coping mechanisms a person uses to combat stress are most
apparent in situations that present acute stress. Acute stress is the most common form of
stress. It comes from demands and pressures of the recent past and the anticipated
demands and pressures of the near future. Acute stress is thrilling and exciting and has
been shown to increase performance. Excessive amounts of short-term stress, on the
other hand; can lead to psychological distress, tension headaches, upset stomach, and
other symptoms (McLean & Hakstian, 1979).
When stressful situations go unresolved, the body is kept in a constant state of
activation, which increases the rate of wear and tear to biological systems. Ultimately,
fatigue or damage results, and the ability of the body to repair and defend itself can
become seriously compromised. Events that cause these types of stress are often
referred to as chronic stressors. Chronic stressors can be associated with a negative
working environment and persist over a long period of time. This can result in chronic
job stress. The severity of the job stress depends on the magnitude of the demands that
are being made and the individual's sense of control or decision-making latitude he or
she has in dealing with them. Scientific studies based on this model confirm that
workers who perceive they are subjected to high demands but have little control are at
increased risk for cardiovascular disease. Research has also shown that an individual's
responses to long-term stressful events are fairly consistent and vary little based on
personality or demographics (Miller & Smith, 1997). The effects of the environment in
these situations might play a more important part than personal characteristics (Chemiss,
1980). This body of research provides insight as to why organizational culture plays
such an important role in influencing an employee's ability to effectively manage a
chronic stressor such as those that might be associated with a merger.
29

Everyone copes with stress differently and as a result, it becomes difficult to
assess the stress level of any given situation. This difficulty has presented many
problems to researches over the years especially when the researcher focuses on
relational approaches to stress. Relational studies alone have been unsuccessful in
quantifying stressful events because stress is so heavily influenced by a person's
perception of what constitutes a stressful event. For example, in a study by Schlote
(1989), who conducted an assessment of headache patients found that contrary to
expectations, headache sufferers reported significantly lower stress levels than the
control group, but showed nearly twice as much neck muscle tension as the control.
Although the arousal and muscle tension data indicate higher levels of stress, the
patients were unable (repressive) or not willing (suppressive) to report those stressors.
This problem surfaces in many studies that attempt to directly measure an individuals
level of stress. The inaccurate reporting of stress levels is often attributed to the
participants inability to accurately report their stress levels. Researchers that focus their
attention on assessing aspects of the job instead of directly trying to quantify stress
levels have had greater success in predicting stress outcomes. Assessing job
characteristics is a technique used by Karasek (1979) in his Job Content Questionnaire.
The Job Content Questionnaire does not however fully account for the various
coping mechanisms employed by the individual or the recent history of the study
participants. This study uses a combination of relational and stimulus approach that
takes into consideration an individual's personality and an interpretation of the person
environment relationship to provide further clarity on the role of perception within the
work stress framework.
Recent studies (Calnan, Wainwright, Forsyth, Wall & Almond, 2001; Bakker,
Schaufeli, Demerouti, Janssen, Van der Hulst & Brouwer, 2000; Maciejewski, Prigerson
& Mazure, 2000) focus on such outcomes as job dissatisfaction, depression,
absenteeism, and bum out to assess the impacts of work stressors on employee health.
Although all are antecedents of the work stress relationship, as with most qualitative
30
indicators they are hard to measure and often difficult to draw direct correlations. This
study focuses on reported psychosomatic strains and sleeping problems; both of which
act as a precursor to many of the outcomes listed above, and are closely linked to an
individual's levels of perceived stress.
If an individual is unable to successfully cope with the stressful event they may
eventually experience psychosomatic strains capable of impacting the individual's
health. For the purpose of this study, the types of coping mechanisms employed are not
as important as whether or not the coping mechanism used is capable of successfully
managing the stressor. It is hypothesized that those individuals that are unable to
effectively manage the stressful event will perceive greater amounts of stress associated
with their jobs and will report a greater number of psychosomatic strains.
Psychosomatic strains
Shorter (1992), describes the history of psychosomatic illnesses. His work
concentrated on spinal problems but laid the groundwork for future studies on illnesses
where there is no apparent demonstrable pathology. The pathology of psychosomatic
illnesses has since received much attention and can be directly linked to emotional
factors. In fact, psychosomatic illnesses are thought to be any illness in which physical
symptoms are thought to be the direct result of psychological or emotional factors. This
type of diagnosis has often been associated with stress and is closely linked to how we
perceive and respond to stress.
The working environment and how it influences the health of workers has been
recognized for a long time. Ramazzini, "the father of occupational medicine" was one
of the first to make an attempt to approach to this problem scientifically (Ramazzini,
1713). Another early pioneer was Jastrzebowski (1857) who founded the concept of
ergonomics as the science of work. He was the first to recognize that work could have
both beneficial and negative impacts on the individual and separated useful work from
31

harmful work. These concepts formed the basis of later studies that showed the mind
and the body is intimately connected, and our overall health depends on both working in
unison.
Kagan and Levi (1975) proposed a conceptual model for psychosocially
mediated diseases. In their model, social structures (i.e. organizational cultures) and
processes (work events) lead to psychosocial stimuli that if not treated properly can
eventually manifest themselves in disease and lack of well-being. This process is
modified by interacting variables such those assessed in this study.
Research shows that people who suffer from high levels of stress face a higher
risk of contracting one of the stress-linked illnesses than the rest of the population. The
accumulation of stresses and strains has in many instances been indicated as a
contributory or even primary factor in a number of diseases. In addition, a number of
studies have demonstrated that relationships exist between stressors and psychosomatic
complaints (Zapf, 1996; 1994; 1993; Dunckel, 1991; Frese, 1985). These studies show
that psychosomatic strains often manifest in the form of health related problems. Some
of these health problems include loss of sleep, neck pain, lower back pain, anxiety, and
increased blood pressure.
Sleep difficulties
Acute and chronic stress is known to cause, or exacerbate, a variety of sleep
disorders. (Morin, Rodrigue & Ivers, 2003; Akersted, Knutsson, Westerholm, Theorell,
Alfredsson & Kecklund, 2002). Related to this, Cherry, (1984) shows that sleep
disturbances increase with increasing job strain. Akerstedt, et al. (2002) in looking at
physiological responses to stress found that individuals who self report being stressed
experienced less SWS "slow wave sleep", which leads to a shallow sleep with early
awakening and an increase in the level of reported anxiety, which results in the feeling
of not being rested. Sleep is a necessary part of recovery for the human body. It is
32
divided into five stages, REM "Rapid Eye Movement" and four non-REM stages. REM
sleep is of importance for cognitive function and non-REM sleep (especially SWS) for
the recovery of physical energy.
More recent studies have shown that how we view day-to-day stresses, including
the perceptions of control over these aggravating events rather than the total number of
daily stressors, enhances our susceptibility to insomnia. People who exhibit poor
sleeping habits; those that take more than 30 minutes to fall asleep and wake up more
than 2 times during the night, perceive their lives to be more stressful than good sleepers
(Morin, Rodrigue & Ivers, 2003). It has also been shown that poor sleepers become
more upset by daily stresses and have stronger reactions to stressful events. This in
effect could exacerbate both the individual's poor sleeping habits as well as the level of
stress experienced by the person at work.
In related research, Kageyama, Nishikido, Kobayashi, Kurokawa, Kaneko and
Kabuto, (1998) compared job stress scores between poor and good sleepers in 223
white-collar male workers. The poor sleepers had significantly higher scores in job
difficulty and lower scores in both job achievement and support by colleagues when
compared to good sleepers. In another study, Doi, Minowa and Tango, (2003) reported
that workers who were dissatisfied with their job had a higher prevalence of insomnia
than satisfied workers.
Despite these findings and many others that point to a relationship between job
stress and sleep problems, some studies find no relationship between the two. For
example, associations between sleep with job control (Akerstedt et al. 2002;
Landsbergis, 1988),job quantity or demands (Kageyama et al. 1998), work overload,
and social support at the workplace (fachibana, Izumi, Honda, Horiguchi, Manabe, &
Takemoto, 1996) were not significant. The apparent inconsistencies highlighted in the
associated results might be for the following reasons. First, most studies examined job
stress factors by invalid or unreliable measures. Second, even a well-established job
stress measure like the Job Content Questionnaire (JCQ) covers only job control, job
33

demands, or social support, which are limited aspects of job stress in the workplace.
Third, confounding factors such as demographics and lifestyle, physical and
psychological health status, as well as shift work that might profoundly have impact on
results were not always taken into account, and fourth, the relatively small sample sizes,
ranging from 71 to 325, make conclusions less definitive.
Lower back and neck pain
An association between workload and musculoskeletal symptoms has been
recognized for a many years. Ramazzini (1713) observed that prolonged sitting,
uncomfortable work postures, and repetitive movements were all related to
musculoskeletal disorders. More recently, workload has expanded to include
psychological loads in addition to physical loads as described by Ramazzini.
Interestingly, research is beginning to show that psychological loads may play a more
important role in many musculoskeletal symptoms than physical loads.
Power (2001), in a British cohort study found that participants who reported
feeling psychological distress at age 23 were over twice as likely to develop lower back
pain at age 32-33. Other studies have also found that psychosocial factors at work have
an impact on musculoskeletal symptoms and that high job demands are associated with
low-back pain (Bongers, Winter, Kompier & Hildebrant, 1993), and neck problems
(Bigos, Battie, Spengler, Fisher, Fordyce, Hansson, Nachemson & Wortley, 1991). It is
now widely accepted that stress can cause back pain and the specific disorder has been
named "Tension Myositis Syndrome" (TMS). Many work stress prevention programs
utilize techniques aimed at alleviating TMS, such as therapeutic massage, but these
programs fail to effectively deal with the psychosocial factors causing the disorder.
34
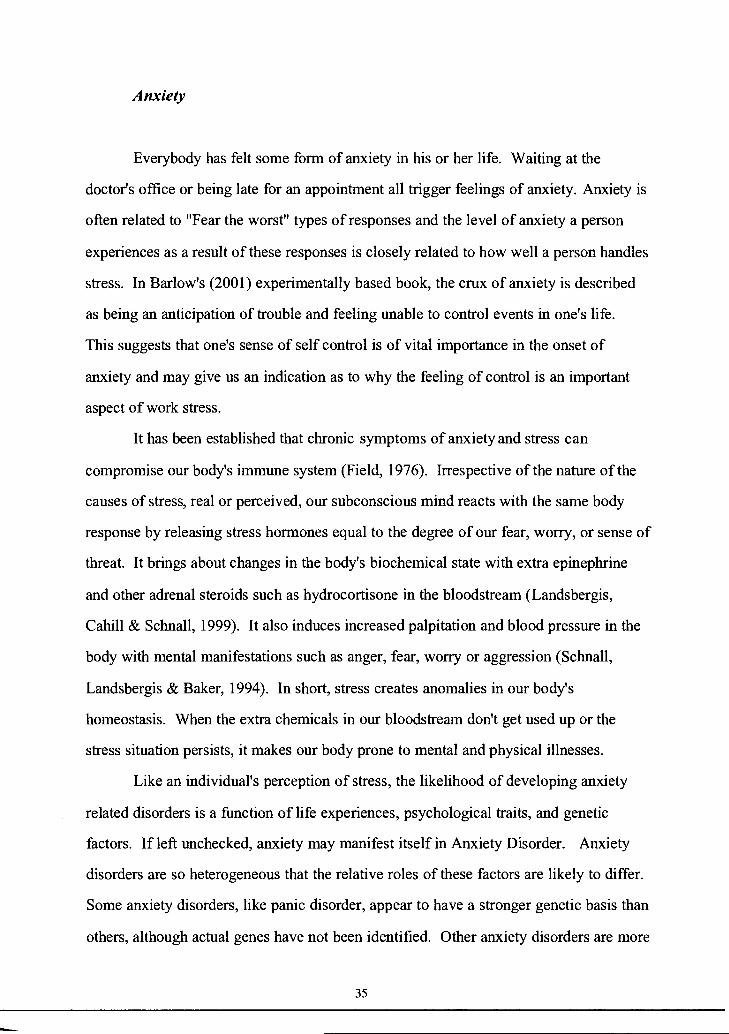
Anxiety
Everybody has felt some form of anxiety in his or her life. Waiting at the
doctor's office or being late for an appointment all trigger feelings of anxiety. Anxiety is
often related to "Fear the worst" types of responses and the level of anxiety a person
experiences as a result of these responses is closely related to how well a person handles
stress. In Barlow's (2001) experimentally based book, the crux of anxiety is described
as being an anticipation of trouble and feeling unable to control events in one's life.
This suggests that one's sense of self control is of vital importance in the onset of
anxiety and may give us an indication as to why the feeling of control is an important
aspect of work stress.
It has been established that chronic symptoms of anxiety and stress can
compromise our body's immune system (Field, 1976). Irrespective of the nature of the
causes of stress, real or perceived, our subconscious mind reacts with the same body
response by releasing stress hormones equal to the degree of our fear, worry, or sense of
threat. It brings about changes in the body's biochemical state with extra epinephrine
and other adrenal steroids such as hydrocortisone in the bloodstream (Landsbergis,
Cahill & Schnall, 1999). It also induces increased palpitation and blood pressure in the
body with mental manifestations such as anger, fear, worry or aggression (Schnall,
Landsbergis & Baker, 1994). In short, stress creates anomalies in our body's
homeostasis. When the extra chemicals in our bloodstream don't get used up or the
stress situation persists, it makes our body prone to mental and physical illnesses.
Like an individual's perception of stress, the likelihood of developing anxiety
related disorders is a function of life experiences, psychological traits, and genetic
factors. If left unchecked, anxiety may manifest itself in Anxiety Disorder. Anxiety
disorders are so heterogeneous that the relative roles of these factors are likely to differ.
Some anxiety disorders, like panic disorder, appear to have a stronger genetic basis than
others, although actual genes have not been identified. Other anxiety disorders are more
35

rooted in stressful life events. Those rooted in stressful events are important in this
study to determine an individual's overall level of psychosomatic strain.
Increased Blood Pressure
High blood pressure has long been associated with stress and together with its
associated complications, is a common cause of death in industrialized nations. It is
estimated that up to 50 million Americans have high blood pressure. Blood pressure is
known to vary during the course of a day and with emotional and psychological states.
(Landsbergis, Schnall, Pickering, Warren & Schwartz, 2003). While stress is known to
elevate high blood pressure and increase risks of cardiovascular diseases over the long
term, new studies show that workers, even those without a history of hypertension, who
feel their jobs are very stressful actually have elevated blood pressure while they're at
work.
Researchers in France recently studied blood pressure in 300 workers in a
chemical company. These workers were healthy full-time employees without any
history of high blood pressure. The workers, who ranged in age from 18 to 55,
underwent medical examinations and answered questionnaires designed to rate the
overall stress level of their jobs. In addition, of the 300 workers participating in the
study 70 were randomly selected to wear monitors that provided a 24-hour assessment
of blood pressure.
Twenty percent of the study subjects reported the highest levels of job strain.
These workers also showed significantly higher diastolic blood pressure (DBP) levels
during the workday than that of their coworkers. This suggests that a workers'
individual feelings about their stress levels may in fact lead to elevated blood pressure
while at work (Fauvel, Quelin, Duch er, Rakotomalala & La ville, 2001 ). While this
study provides good evidence that acute work stress can have a negative affect on blood
36
pressure, other studies have drawn correlations between chronic stress and high blood
pressure. In a recent study conducted by Landsbergis, Schnall, Pickering, Warren and
Schwartz, (2003) men who reported spending over 25 years in a high-stress, low
control job had higher systolic blood pressure values both at work (average 4.8 mmHg
higher) and at home (average 7.9 mmHg higher) when compared with men who held
less stressful jobs.
The manifestation of psychosomatic health related problems are often associated
with stressful events. In the cases presented above the stressful events are functions of
the individuals work situation and can vary a great deal among study participants. In the
case of this study, all of the participants were subjected to the same stressful event, a
merger. Evidence suggests that some or all of the psychosomatic strains described
above should be found in the study population. It can be expected that the degree or to
what level the employees experienced these health problems is a function of their
personality, the success of the coping mechanisms they utilized and the type of
organizational culture present in their work environment.
Organizational Culture
The assessment of organizational culture has long been a controversial and
problematic topic in occupational psychology literature (Denison, 1996; Reichers &
Schneider, 1990; Schein, 1985: Likert, 1967). Part of the difficulty in studying cultures
within organizations is that there is no current consensus of opinion on how we define
organizational culture. One of the reasons for this, as outlined by Meek (1988), is that
dual interpretations of a word often occur when a term is borrowed from another
discipline, as "culture" has been from anthropology. Some authors have attempted to
operationalize the approach to organizational culture by using a schemata of artifacts,
values and assumptions (Schein, 1985). This however has led to problems in
37
developing any set framework by which an organization's culture can be assessed to
determine its effectiveness.
Much effort has gone into defining exactly what Organizational Culture is and
even though most researchers disagree somewhat upon definitions for organizational
culture they do not dispute its importance to the proper functioning of an organization.
Several definitions of organizational culture have been offered. Moran and Volkwein
( 1992) suggest that culture be conceptualized as reflecting contents of the mind, such as
myths, stories, values, norms, and beliefs, which serve as symbols of shared meaning to
members of a group. Foster-Fishman and Keys (1997) define organizational culture as a
shared system of beliefs guiding members' thinking, perceiving, and feeling that directs
behaviour. Culture is most commonly regarded as a set of normative beliefs and shared
behavioral expectations held by workers regarding their behavior (Cooke & Szumal,
1993). Schein (1985) defined culture as the body of solutions to external and internal
problems that has worked consistently for a group and that is therefore taught to new
members as the correct way to perceive, think about, and feel in relation to those
problems. This was later refined as:
" ... a pattern of basic assumptions, invented, discovered or developed by a given
group as it learns to cope with its problems of external adaptation and internal
integration that has worked well enough to be considered valid and thus is taught
to new members as the correct way to perceive, think, and feel in relation to
those problems" (Schein, 1990, p. 111 ).
Killmann, Saxton & Serpa, (1985, p. 5) report that "culture can be defined as the shared
philosophies, ideologies, values, assumptions, beliefs, expectations, attitudes, and norms
that knit a community together." Culture then, is a characteristic of the organization that
is perhaps felt more than thought, nonetheless, it defines a very important component of
the work environment. This latter definition is important because it recognizes that
culture can be equivocally understood to deal with "major beliefs and values" (Goll &
38

Zeitz, 1991 ), or alternatively as Core Dimensions of Organizational Culture "norms and
patterns of behaviors and norms" (Gundry & Rousseau, 1994).
Organizational climate has a longer research tradition than organizational culture
(Schein, 1990). Climate, in the context of culture, is considered to refer to situational
characteristics and links to thoughts and feelings of workers (Denison, 1996). Reichers
& Schneider (1990) defined climate as "shared perceptions of organizational policies,
practices, and procedures, both formal and informal." Moran and Volkwein (1992, p.
20) provide a more comprehensive definition of organizational climate, stating:
"a relatively enduring characteristic of organization which
distinguishes it from other organizations and embodies members'
collective perceptions about their organization with respect to such
dimensions as autonomy, trust, cohesiveness, support, recognition,
innovation, and fairness; is produced by member interaction, serves
as a basis for interpreting the situation, reflects the prevalent norms,
values, and attitudes of the organization's culture; and acts as a
source of influence for shaping behavior. "
Organizational climate is also described indirectly by Halpin and Winer (1963) as
"climate is to the organization what personality is to the individual."
Organizational culture and organizational climate are very similar in meaning
and the differences between the two have been debated in many articles. This study
adopts a position on culture most closely related to what Denison (1996) expresses when
he argues that distinctions made between culture and climate are artificial. He suggests
that differences are related to interpretation rather than the actual phenomenon studied.
Both constructs examine social contexts as the product of interactions among group
members over time. Both attempt to explain ways in which an organization adapts by
the formation of collective belief systems and meaning. The content in both fields of
study is similar, and has included decision-making, communication, organizing, risk
taking, peer relations social control, autonomy, and consideration. For example, current
39
quantitative survey methods, which purport to measure organizational culture, are
described as being very similar to previous research on organizational climate. Denison
concluded that culture and climate research both address the creation and influence of
social contexts in organizations; as such, he proposes that the climate and culture
research be integrated. This study adopts an integrated approach, using quantitative
methods, to assess the organizational culture/climate of the ExxonMobil Canada West
Business Units shortly after the merger of Exxon and Mobil Oil.
Organizational culture literature is characterized by a diversity of research
methods. Two main streams of research methods predominate: qualitative methods,
characterized by observation and require interpretation; and quantitative methods,
characterized by statistical analysis, correlation, and generally employ the use of a
survey. These two approaches have been debated in numerous articles (Reichers &
Schneider, 1990; Rentsch, 1990; Rousseau, 1990; Schein, 1990). Sanday ( 1979) and
Rousseau ( 1990) conclude in their review of organizational culture methodology that the
choice of method largely depends on the researcher's training, cognitive style, and
preference.
Assessing how a company operates is a function of a number of elements and is
dependent on what aspect of the company you are studying. Following this, for an
analysis of an organization's culture to be meaningful, the dimensions being assessed
must be indicative of the research question. In order for organizational culture to be an
effective tool in improving a company's performance you must first decide what you are
trying to improve and then determine which cultural elements will help you achieve
your desired outcomes. For example, to assess how organizational culture impacts
shareholder value you may want to assess the company's tolerance of risk. When
assessing how an organization's culture influences an individual's perception of stress
you want to look closely at the work stress framework.
The work stress framework provided by Karasek, (1979) assesses organizational
characteristics and provides evidence for the demand and control model of work place
40

stressors. This model successfully points out key work contents affecting the work
stress process and describes the interaction between job demands and job control
affecting psychological and physical health outcomes. The demand-control model is
however too simple to explain comprehensive relationships between work stressors,
strains, and diverse array of psychological outcomes. The model does however clearly
organizes the relationship between decision latitude, job demands, and stress outcomes.
This study expands on the work of Karasek and assesses how an organization's
culture acts as a modifier within the job strain model developed by Karasek (1979).
Understanding the role an organization's culture plays in the work stress framework is
critical in advancing our understanding of the work stress process. The concepts arising
from this body of research will make it possible to plan and manage organizational
culture purposefully.
The nine characteristics of an organization's culture assessed in this research
include:
1. Supervisor Support,
2. Coworker Support,
3. Leadership,
4. Teamwork,
5. Trust,
6. Initiative,
7. Information,
8. Role Ambiguity, and
9. Sense of Belonging.
Supervisor and Coworker Support
Many aspects of a company's organizational culture have the potential of being a
powerful source of work stress intervention. One of these is social support. Caplan
41

(1974) suggests that social support systems consist of "continuing social aggregates that
provide individuals with opportunities for feedback about themselves and validations of
their expectations of others." Lin, Simeone, Ensel & Kuo, (1979) identify social support
with social networks or social environments. They define social support as support
accessible to an individual through social ties with other individuals, groups, and the
larger community. House ( 1981) defines social support as an interpersonal transaction
involving one or more of the following: (1) emotional concern (liking, love, and
empathy), (2) material aid (goods or services), (3) information (about the environment),
or ( 4) appraisal (information relevant to self-evaluation). Summarizing the various
definitions of social support, it is the perceived support from one's interpersonal
networks in solving one's problems or in improving one's well being. It is hypothesized
that support has positive functions on stressors and strain. Stressors and strains vary in
the types of adaptation demands they make, and the various characteristics of social
support differ with respect to the type of adaptation demands they can moderate. That
is, definitions of social support have been based on the assumption that social support is
effective in minimizing the negative effects of stressors and strains when there is
congruence between adaptation demands of stress at work and characteristics of social
support (Wilcox & Vernberg, 1985). Thus, determining characteristics of social support
that are associated with stress can be a key point in minimizing stress effects on health
and productivity at work. Prior to clarifying the characteristics of social support it is
important to first determine where the support is coming from, as this will impact how
the individual perceives and responds to the support being offered.
House ( 1981) indicates that sources of support include the individuals and
groups that have the greatest contact with the individual experiencing the stressful event.
Supervisor support and coworker support have frequently been measured as sources of
social support at work (Israel, House, Schurman, Heaney & Mero, 1989). House also
indicates that supervisors can potentially be a more effective source of support than
42

coworkers in reducing work stress and buffering the impact of work stress on outcomes
when the interaction between coworkers is limited in the work environment.
Limited interaction with coworkers is a common feature of many industrial jobs
such as assembly-line jobs and service jobs (LaRocco, House & French, 1980). It is
also a common feature found in the upstream petroleum industry, particularly in the
field offices and remote locations. Coworkers that are in similar working conditions to
each other tend to have less power to provide social support to their coworkers than do
supervisors. In these situations supervisors are more able to supply appropriate support
at the proper time. In the case of this population, teamwork and worker cohesion may
play an important role in the work process, especially in the head office where
teamwork and close and interaction with fellow employees is the norm.
House ( 1981) goes on to state that the characteristics of an organization,
especially management styles, can directly affect the amount of supervisors' support in
an organization. Sustained changes in supervisory or managerial behaviour, including
increased emphasis on social support, are likely to occur only in the context of broad
organizational participation in support. Hutchison and Garstika (1996) mention that
employees view actions taken by agents or supervisors of an organization as
representative of actions of the organization itself. They describe this process as
personification of the organization. Building on this concept, it can be stated that a
worker's satisfaction with work support can be used as a surrogate for the general
feelings of how much their organization takes care of them.
From above we see that the structure of the organization and the type of work
being conducted has a strong influence on both the level and availability of coworker
support. This is supported in a study of factory workers where coworker support had
little influence on stress and health because of the highly individuated structure of the
working environment in that factory (House & Wills, 1978). Factory workers who work
independently of others tend to report lower coworker support than other workers.
Thus, the level of coworker support an individual receives is a function of how well the
43

individual interacts with colleagues, the type of work they perform and by the values
and climate of the organization (Armeli, Eisenberger, Fasolo & Lynch, 1998; Eisenberg,
Fasolo & Davis-LaMastro, 1997). The work processes utilized within ExxonMobil
Canada's head office foster teamwork and collaboration suggesting that coworker
support may play an important role in the work stress framework in the head office. On
the other hand, coworker support may not influence the work stress framework for
employees in the field who work independently of others.
LaRocco, House and French, (1980) analyzed data from 6,360 male workers of
23 occupational groups from a number of different organizations in order to assess the
effects of social support on health related outcomes. They postulate that there are five
of sources of social support: supervisor, coworkers, wife, family, and friend. In
assessing the sources of support against perceived stress (job satisfaction) and health
related outcomes (somatic complaints, depression, and anxiety) their analyses indicates
that support from wife, coworkers, and supervisor is able to significantly buffer against
the negative outcomes associated with work stressors, such as depressive symptoms. In
their study, coworker support has a significant interaction effect on the relationship
between role conflict and job satisfaction as well as the relationship between role
conflict and depression. Coworker and supervisor support also buffered against the
negative effect of heavy workload on psychological stress symptoms (the combination
of depression, anxiety, and irritation). The results show work-related sources of support
to be more important for depression than family support.
In related work, Stansfeld, Bosma, Hemingway and Marmot, (1998) used the
demand-control-support model to assess the influence of social support on quality of
life. They conducted three surveys of 9,302 civil servants in 20 London-based branches
during a five-year period. The surveys included job demands, decision latitude, and
social support at work. Social support measures in their study included emotional
support, practical support, negative aspects of close relationships, and networks of social
support. An interesting aspect of worker interaction that was highlighted in this study
44

that had not been looked at previously in this context was the negative aspect of close
relationships.
In their longitudinal study, social support at work has a significant interaction
effect with perceived work control on quality of life. The three-way interaction of low
decision latitude, high job demands, and low social support at work was significantly
related to psychological disorders and absenteeism.
Unden (1996) also looked at absenteeism when he examined whether health
status and social support affected the absenteeism of 133 civil servants performing
office work in Sweden. The survey questionnaire included social support at work and
out of work, job demands, decision latitude, perceived health status, and psychosomatic
symptoms. Social support was significantly associated with high psychosomatic
symptoms, poor perceived health, and high absenteeism. Low sense of belonging, low
instrumental support, and low social integration had a negative relationship with high
job demands and low decision latitude. There was an interaction effect of job demands
and perceived control on depressive symptoms. Results of the multivariate analysis
showed a 0.25 correlation between work stressors and depressive symptoms, and 0.32
correlation between depressive symptoms, and a 0.31 correlation with quality of life.
Johnson, Thomas & Riordan, (1994) conducted a case-control study with 211
fishermen as the experimental group and 99 land-based workers as the control group. In
their study they compared the subjects work stressors with self-reported stress
symptoms. The study assumed that lack of social ties affected work stress, and that
fishermen were a group lacking social ties. The self-administered survey consisted of
depression, somatic symptoms, and ten work stressors including carrier stress, overload,
control, hazards, and conflict. Social support was measured by 15 items of perceived
quality of social relationships. The relationships examined were with friends, relatives,
wife, supervisors, and coworkers. Johnson, et al., (1994) found that fishermen had
greater work stressors, depression, and somatic symptoms than land-based workers.
This indicates that social ties were directly related to work stressors and depression.
45
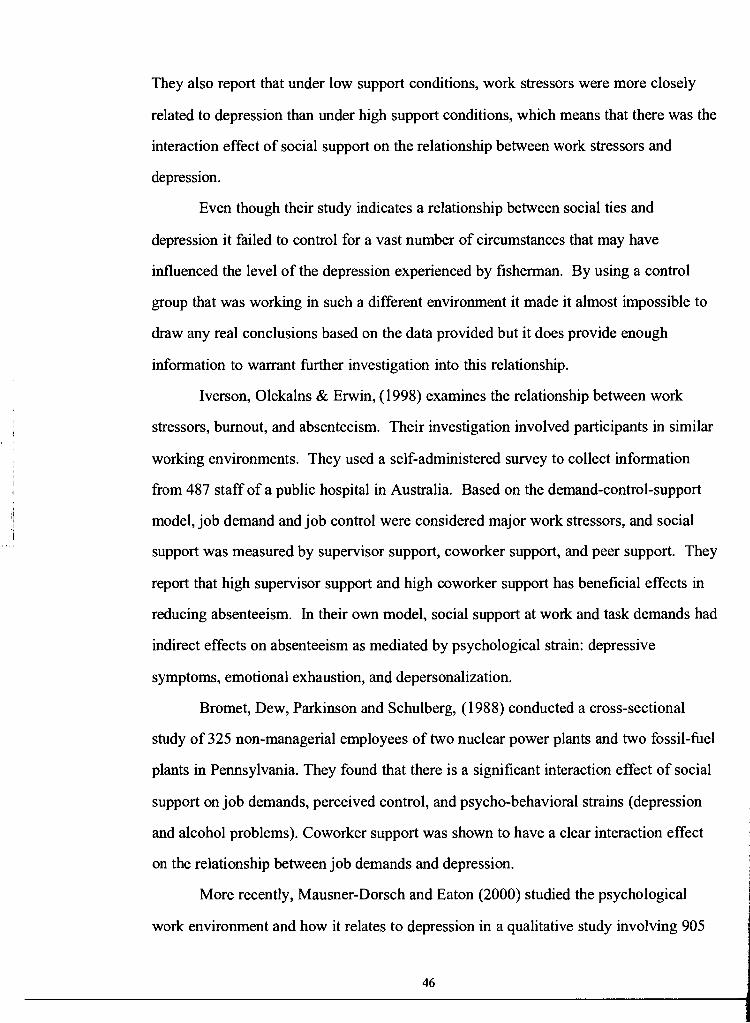
They also report that under low support conditions, work stressors were more closely
related to depression than under high support conditions, which means that there was the
interaction effect of social support on the relationship between work stressors and
depression.
Even though their study indicates a relationship between social ties and
depression it failed to control for a vast number of circumstances that may have
influenced the level of the depression experienced by fisherman. By using a control
group that was working in such a different environment it made it almost impossible to
draw any real conclusions based on the data provided but it does provide enough
information to warrant further investigation into this relationship.
Iverson, Olekalns & Erwin, (1998) examines the relationship between work
stressors, burnout, and absenteeism. Their investigation involved participants in similar
working environments. They used a self-administered survey to collect information
from 487 staff of a public hospital in Australia. Based on the demand-control-support
model, job demand and job control were considered major work stressors, and social
support was measured by supervisor support, coworker support, and peer support. They
report that high supervisor support and high coworker support has beneficial effects in
reducing absenteeism. In their own model, social support at work and task demands had
indirect effects on absenteeism as mediated by psychological strain: depressive
symptoms, emotional exhaustion, and depersonalization.
Bromet, Dew, Parkinson and Schulberg, ( 1988) conducted a cross-sectional
study of 325 non-managerial employees of two nuclear power plants and two fossil-fuel
plants in Pennsylvania. They found that there is a significant interaction effect of social
support on job demands, perceived control, and psycho-behavioral strains ( depression
and alcohol problems). Coworker support was shown to have a clear interaction effect
on the relationship between job demands and depression.
More recently, Mausner-Dorsch and Eaton (2000) studied the psychological
work environment and how it relates to depression in a qualitative study involving 905
46

full-time workers in the Baltimore area. The data was collected through individual
interviews. Their study found that Job control was the best predictor of depression and
that the interaction of high psychological job demands and low control were related to
high depressive symptoms. Calnan, Wainwright, Forsyth, Wall & Almond, (2001)
examined mental distress of workers in 81 hospitals in southern England. They used the
demand-control-support model to find the relationship between work stressors and
depressive symptoms. The interaction of high job demands, low job control, and low
social support was significantly related to high depressive symptoms. In the study,
under high support conditions, the interaction effect between job demands and job
control on mental distress was clearer than in low support situations.
The qualitative and quantitative studies referenced above provide ample
evidence of the importance of social support, regardless of source, within the context of
the work stress framework. Clearly any study into the antecedents of stress has to
incorporate a detailed discussion of social support and the moderating impact it can have
on the level of stress perceived by the employee. Many of these studies used
absenteeism as a manifestation of job stress to indicate some level of organizational
impact. To expand on this some researchers have assessed organizational outcomes by
combining employee performance with absenteeism.
Schaubroeck and Fink (1998) examined the effects of job control and social
support on organizational outcomes: absenteeism, physical symptoms, and job
performance. Based on the demand-control-support model a total of 214 employees
completed the survey Job Content Questionnaire in two offices of a large insurance
company. Job performance and absenteeism data was also collected. Job performance
and data was supplied by supervisor appraisals. The study found that supervisor support
had a significant interaction effect with low job control on low job performance.
Supervisor support, job control, and skill under utilization had a three-way interaction
on job performance. That is, high supervisor support mitigated the effect of low job
47
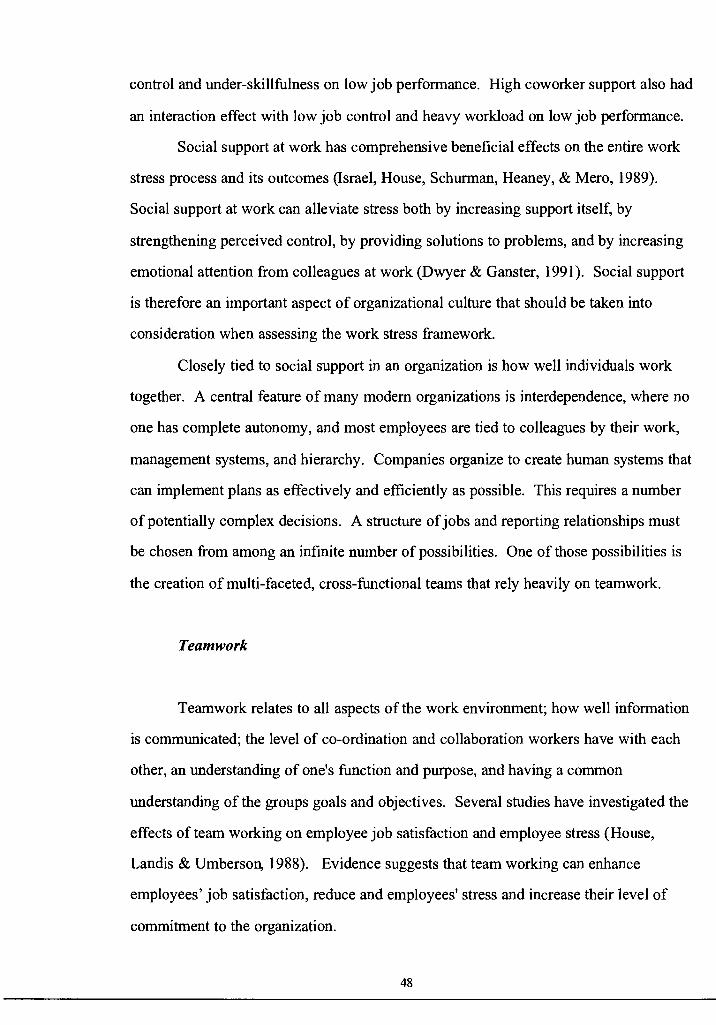
control and under-skillfulness on low job performance. High coworker support also had
an interaction effect with low job control and heavy workload on low job performance.
Social support at work has comprehensive beneficial effects on the entire work
stress process and its outcomes (Israel, House, Schurman, Heaney, & Mero, 1989).
Social support at work can alleviate stress both by increasing support itself, by
strengthening perceived control, by providing solutions to problems, and by increasing
emotional attention from colleagues at work (Dwyer & Ganster, 1991). Social support
is therefore an important aspect of organizational culture that should be taken into
consideration when assessing the work stress framework.
Closely tied to social support in an organization is how well individuals work
together. A central feature of many modem organizations is interdependence, where no
one has complete autonomy, and most employees are tied to colleagues by their work,
management systems, and hierarchy. Companies organize to create human systems that
can implement plans as effectively and efficiently as possible. This requires a number
of potentially complex decisions. A structure of jobs and reporting relationships must
be chosen from among an infinite number of possibilities. One of those possibilities is
the creation of multi-faceted, cross-functional teams that rely heavily on teamwork.
Teamwork
Teamwork relates to all aspects of the work environment; how well information
is communicated; the level of co-ordination and collaboration workers have with each
other, an understanding of one's function and purpose, and having a common
understanding of the groups goals and objectives. Several studies have investigated the
effects of team working on employee job satisfaction and employee stress (House,
Landis & Umberson, 1988). Evidence suggests that team working can enhance
employees' job satisfaction, reduce and employees' stress and increase their level of
commitment to the organization.
48
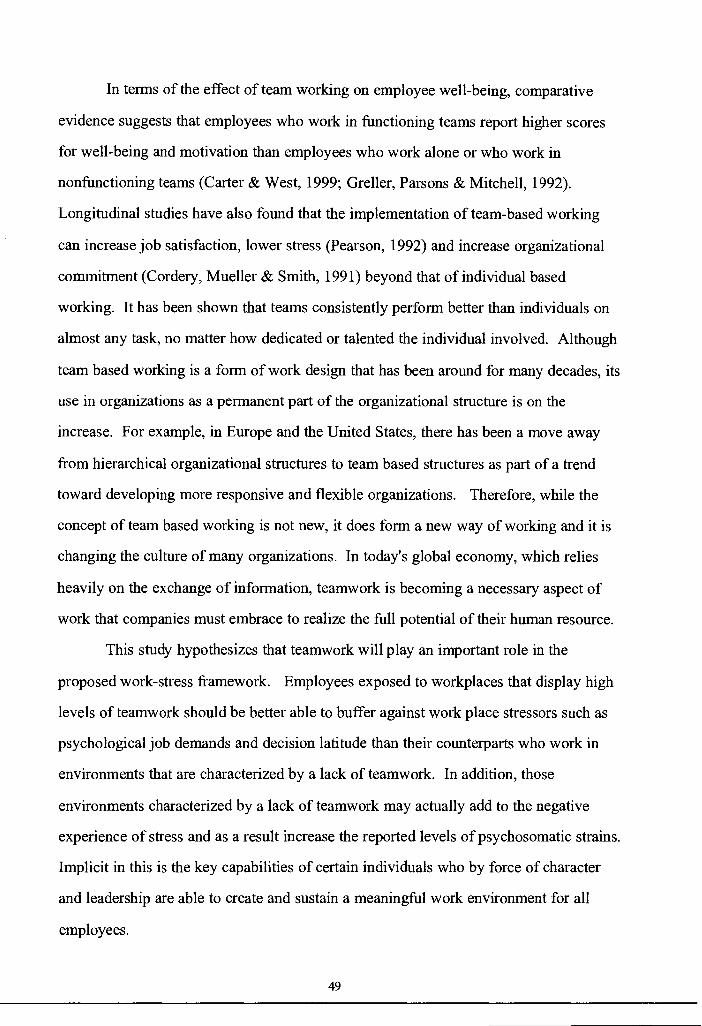
In terms of the effect of team working on employee well-being, comparative
evidence suggests that employees who work in functioning teams report higher scores
for well-being and motivation than employees who work alone or who work in
nonfunctioning teams (Carter & West, 1999; Greller, Parsons & Mitchell, 1992).
Longitudinal studies have also found that the implementation of team-based working
can increase job satisfaction, lower stress (Pearson, 1992) and increase organizational
commitment (Cordery, Mueller & Smith, 1991) beyond that of individual based
working. It has been shown that teams consistently perform better than individuals on
almost any task, no matter how dedicated or talented the individual involved. Although
team based working is a form of work design that has been around for many decades, its
use in organizations as a permanent part of the organizational structure is on the
increase. For example, in Europe and the United States, there has been a move away
from hierarchical organizational structures to team based structures as part of a trend
toward developing more responsive and flexible organizations. Therefore, while the
concept of team based working is not new, it does form a new way of working and it is
changing the culture of many organizations. In today's global economy, which relies
heavily on the exchange of information, teamwork is becoming a necessary aspect of
work that companies must embrace to realize the full potential of their human resource.
This study hypothesizes that teamwork will play an important role in the
proposed work-stress framework. Employees exposed to workplaces that display high
levels of teamwork should be better able to buff er against work place stressors such as
psychological job demands and decision latitude than their counterparts who work in
environments that are characterized by a lack of teamwork. In addition, those
environments characterized by a lack of teamwork may actually add to the negative
experience of stress and as a result increase the reported levels of psychosomatic strains.
Implicit in this is the key capabilities of certain individuals who by force of character
and leadership are able to create and sustain a meaningful work environment for all
employees.
49
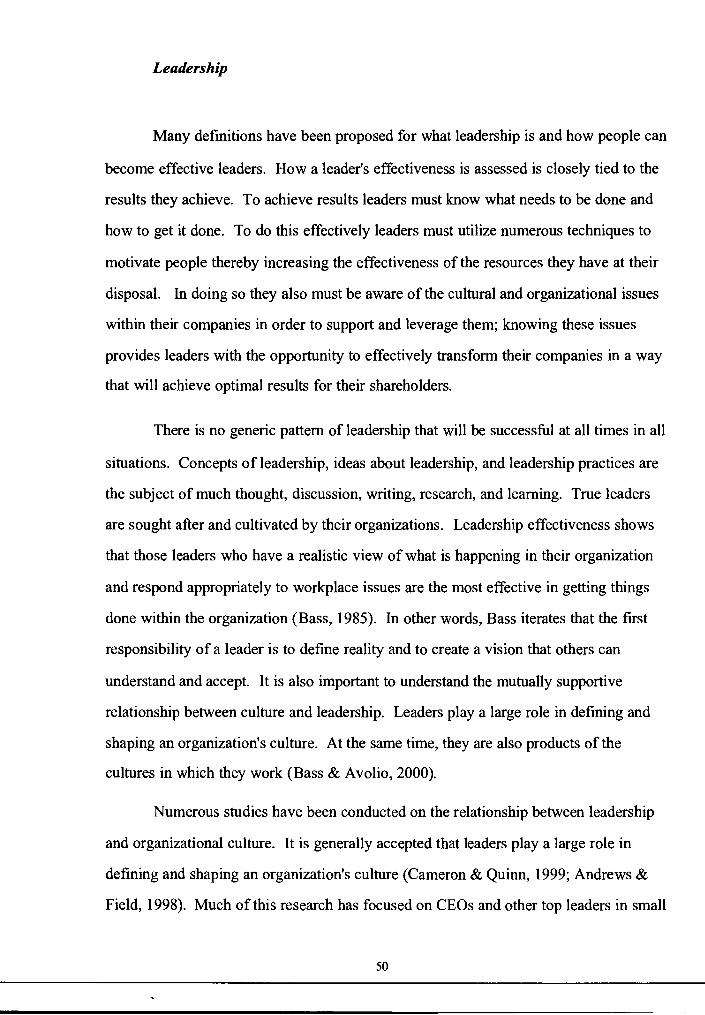
Leadership
Many definitions have been proposed for what leadership is and how people can
become effective leaders. How a leader's effectiveness is assessed is closely tied to the
results they achieve. To achieve results leaders must know what needs to be done and
how to get it done. To do this effectively leaders must utilize numerous techniques to
motivate people thereby increasing the effectiveness of the resources they have at their
disposal. In doing so they also must be aware of the cultural and organizational issues
within their companies in order to support and leverage them; knowing these issues
provides leaders with the opportunity to effectively transform their companies in a way
that will achieve optimal results for their shareholders.
There is no generic pattern of leadership that will be successful at all times in all
situations. Concepts of leadership, ideas about leadership, and leadership practices are
the subject of much thought, discussion, writing, research, and learning. True leaders
are sought after and cultivated by their organizations. Leadership effectiveness shows
that those leaders who have a realistic view of what is happening in their organization
and respond appropriately to workplace issues are the most effective in getting things
done within the organization (Bass, 1985). In other words, Bass iterates that the first
responsibility of a leader is to define reality and to create a vision that others can
understand and accept. It is also important to understand the mutually supportive
relationship between culture and leadership. Leaders play a large role in defining and
shaping an organization's culture. At the same time, they are also products of the
cultures in which they work (Bass & Avolio, 2000).
Numerous studies have been conducted on the relationship between leadership
and organizational culture. It is generally accepted that leaders play a large role in
defining and shaping an organization's culture (Cameron & Quinn, 1999; Andrews &
Field, 1998). Much of this research has focused on CEOs and other top leaders in small
50
groups such as executive teams. Waldman and Yammarino (1999, p. 282), describe the
shortcomings of such studies by pointing out that
"part of the problem in attempting to understand the potential effects of
leadership at the highest levels is that researchers have generally confined
studies of leadership to its effects on the individual, or to the analysis of small
groups, rather than to the organization as a whole."
Although the CEO is important in molding the culture of an organization,
research has shown that a number of sub-cultures can form in one organization. Sub
cultures within organizations can be generally driven by external influences but more
often they are a function of on site leadership. This process is most noticeable in
multinational companies that operate in a number of countries (Stoica & Schindehutte,
1999). Such is the case with Exxon Mobil Corporation. The Exxon Mobil Corporation
is made up of four different companies that operate in some 200 countries throughout
the world.
Not only does the leader of an organization play an important role shaping the
culture of an organization studies have also shown that a leader's actions and the type of
management style they utilize can have a significant impact on the amount of stress
perceived by their employees. A study conducted by Evans, (2003) on the relationship
between management style and teacher stress found that the management styles
exhibited by heads of departments and the way in which departments are managed are
significant factors in the levels of stress teachers report. Teachers in ambiguous and
autocratic departments reported the highest levels of stress, closely followed by those in
'political' departments. Staff in subjective and collegial departments reported low levels
of stress. The research also indicates that poor relationships between staff in a
department or between teachers and their heads of department may cause an increase in
the level of stress perceived by teachers. Weak associations between staff in ambiguous,
51

I 'i
autocratic and political departments, and poor relationships between departments are
reportedly the primary source of stress for teachers.
In a related study it was demonstrated that an effective leadership team plays an
important part in reducing employee stress, while an ineffective or 'laissez-faire'
leadership style can lead to increased levels of depression in employees. Bell and
Carter, (2001) conducted a survey of medical workers and found an increase in
employee stress and sickness absence when their leadership displayed a laissez-faire or
inactive leadership style. They also found that 'Transformational' leaders are able to
inspire and intellectually stimulate employees. "Transactional" leaders are more likely
to provide rewards and assistance in return for effort. The research suggests that both
types of leaders have employees with greater enthusiasm and better psychological well
being than the 'laissez-faire' or inactive leader. All of these studies attempt to classify
the leadership of the organization being studied in terms of the characteristics displayed
by the management. Though this method of research is able to effectively demonstrate
that leadership plays a role in the work stress framework it does not account for
employee perception.
As noted in many previous studies, perception plays an important role in how
individuals react to stressful events. For this reason, instead of focusing on the specific
characteristics of leadership this study assesses the perceptions employees have of their
leaders. It gauges the confidence employees have in their leaders, how employees view
their leaders regarding the importance they place in financial results as opposed to
human factors, and whether or not the employees believe their leaders "walk their talk".
It is hypothesized that employees who have little confidence in their leaders and
perceive them to be more interested in the finances of the company than in the
employees themselves will experience greater work places stresses and therefore report
greater psychosomatic strains.
52

It is also hypothesized that leaders who pay lip service to new initiatives will
have a negative impact on the work place and as a result, their management style will be
associated with a greater number of reported psychosomatic strains. Implicit in these
situations is building and fostering trust. In order for leaders to be truly effective, they
must build an organization that fosters trust and encourages open communication.
Trust
Trust is an important part of any relationship. This holds true for the
relationships that exist between coworkers, between workers and their supervisor, and
management and employees. Trust is the building block for gaining the respect of staff,
creating positive work relationships within a team, and enabling staff to handle stress
and uncertainty in the work environment. While many companies say they value trust
and teamwork, they continue to reward individual compliance with orders from above.
These conflicting messages can result in cynicism and distrust of management motives.
Culbert and McDonough (1985, p. 18), say that,
"we've long contended that the trusting relationship is the most effective
management tool ever invented. We know of no other management device that
saves more time or promotes more organizational effectiveness .. .In short,
trusting relationships create the conditions for organizational success".
McCauley & Kuhnert (1992) note that individuals within organizations tend to
enter into commitments or agreements with other co-workers to finish a task. Trust will
develop within an organization when the commitments are successfully fulfilled.
According to Shea (1984), trust is the "miracle ingredient in organizational life - a
lubricant that reduces friction, a bonding agent that glues together disparate parts, a
53

,j I
·1
catalyst that facilitates action. No substitute - neither threat nor promise - will do the job
as well." Organizational trust is not a simple concept to understand. It requires many
factors be considered when measuring it. According to Mishra (1996) in his Model for
Organizational Trust there are four dimensions of organizational trust. They are
competence, openness and honesty, concern for employees, and reliability. Recently,
research has been done to show that there is yet another factor to consider, that of
identification (Shockley-Zalabak, Ellis & Winograd, 2000).
The first dimension is competence. According to Shockley-Zalabak, Ellis &
Winograd, (2000, p. 42), "competence is a generalized perception that assumes the
effectiveness not only of the leadership, but also of the organization's ability to survive
in the marketplace." At an organizational level, competence connects with the extent
to which employees see the organization as effective: whether it will survive and be able
to compete.
The second dimension is openness and honesty. This is the dimension that is
most frequently referred to when speaking in respect to organizational trust (Shockley
Zalabak, Ellis & Winograd, 2000). This dimension involves the amount and accuracy of
information shared, as well as the way in which it is communicated.
The third dimension is concern for employees. This dimension pertains to the
efforts by others to understand the feelings of caring, empathy, tolerance, and safety
when in business activities. It specifically relates to these feelings as they pertain to
those felt between employers and employees and amongst employees.
The fourth dimension is reliability. This dimension deals with the question; can
you count on your co-worker, team, supplier, or organization to do what they say? Do
they act consistently and dependably? This also relates to the quality of data or
information that you receive from both management and your colleagues.
The final dimension is identification. This dimension "measures the extent to
which we hold in common goals, norms, values, and beliefs associated with our
54

organization's culture" (Shockley-Zalabak, Ellis & Winograd, 2000, p. 43). This
dimension indicates how connected we feel to management and to our co-workers.
Within the context of an organization, trust is "generally earned slowly as a
result of consistent behaviour based on personal respect and a genuine concern for the
well-being of organizational members" (Taylor, 1989). As a result, leaders within an
organization cannot expect trust from their subordinates solely because of their status or
position. When an organization is constantly changing it becomes difficult for the
employees to maintain trusting relationships. When this happens, it disrupts the normal
work processes and can result in higher stress levels for all of the employees. This can
also be examined in the context of a merger between two companies. The employees of
the merged company will not automatically trust their new management and it can be
surmised that employees will experience a greater level of stress during the time it takes
for the new management to build back the level of trust that existed prior to the merger.
Employees in organizations marked by low levels of trust usually operate under
high levels of stress. They spend a great deal of effort explaining their actions,
justifying past decisions, or looking for scapegoats when something does not work out.
This prevents employees from focusing on the work they should be doing, and
productivity ultimately declines. The amount of time it takes an employee to trust the
new management after a merger will vary from person to person and is a function each
individual's personality and past experiences.
According to Savage (1982, p. 56) an organization that exhibits low levels of
trust is characterized by:
" an atmosphere that is usually quiet; with a low level of energy and commitment,
• there is no conflict, as anyone who 'bucks the system' with complaints is
punished or fired,
55
• any change is viewed with suspicion and alarm,
• management is a top down affair; status is very important; decisions are
checked out through the entire chain of command, and
• people feel locked into their jobs."
Low trust in organizations also push people to operate with incomplete
information and to treat other people's suggestions with suspicion (Sonnenburg, 1994).
As trust declines, barriers to communication are erected and complete information is not
shared openly and honestly. In the end, the decision-making process is weakened and
decisions of poorer quality are reached. On the other hand, receiving and disseminating
accurate information helps to build a strong team spirit and invites employee
participation in solving problems.
To determine how trust influences the work stress framework this study assesses
the level of trust employees perceive within their work teams and the degree to which
employees trust their leadership. For the reasons given above, it is hypothesized that
lower levels of organizational trust will be associated with higher levels of
psychosomatic strains. Implicit in the concept of trust is the giving and receiving of
accurate information that is exchanged in the communication process.
Information
People in organizations typically spend over 75% of their time in an
interpersonal situation; thus it is not surprising to find that at the root of a large number
of organizational problems is poor communications. The effective transfer of
information is an essential component of organizational success whether it is at the
interpersonal, intergroup, intragroup, organizational, or external levels. As a result, the
flow of information within a workplace can be a strong moderator of work place
56

stressors or act as a stressor itself and produce negative outcomes. In some cases, it
may only have a negative impact when it occurs with another stressor. In other cases,
the negative effect of a single stressor can be made worse by the lack of effective
communication.
Eisenberg, Fasolo & Davis-LaMastro, (1990, p. 55) state that an individual's
willingness to communicate is significantly related to the organizational culture of the
company in which they work. The components of culture related to effective
communication include the closeness or shared history between employees or relational
factors, organizational restraints on communication related to the job, or constraints on
an organization's internal and external communication.
In related studies, lack of effective communication has been directly linked to an
increase in employee stress levels. Adkins, Quick & Moe, (2000) demonstrate that
limiting uncertainty through strategic planning and effective communicating are shown
to decrease employee stress levels. Other studies have shown that lack of information or
waiting on information to be provided to you by others so that you can complete your
task significantly raises the amount of stress experienced by workers. It has also been
demonstrated that the communication of information is particularly important during
times of uncertainty such as that associated with a merger or reorganization (Schabracq,
Cooper, Travers & van Maanen, 2001). These findings suggest that effective
communication is an important tool for reducing stress during mergers and may play an
even larger role in the work stress framework during times of transition.
To investigate how the flow of information influences the work stress framework
this study assesses various types of information flow within the workplace. It assesses
the flow of information from management to employees, from employee to employee,
and looks at the usefulness and quality of the information that is being communicated.
It is hypothesized that the quality and quantity of information communicated to
employees will have a direct influence on their associated levels of reported
psychosomatic strains. The flow of information within a workplace ultimately depends
57

on employees having all of the skills and knowledge required to do their jobs within the
scope and vision of the company. Implicit in this is the aligning of employees who
share a common understanding of a vision and a set of strategies, accept the validity of
that direction, and use their knowledge and skills to work toward making it a reality.
Alignment and Role Ambiguity
The evidence that 'role in organization' is a potential psychosocial hazard relates
largely to issues of alignment role ambiguity and role conflict (Jackson & Schuler, 1985;
Kahn, Wolfe, Quinn, Snoek & Rosenthal, 1964 ). However, other potentially hazardous
aspects of role have been identified including role overload, role insufficiency and
responsibility for other people. French and Caplan (1970) conclude that such variables
are among the most powerful predictors of psychological health.
Alignment and role ambiguity occurs when a worker has inadequate information
about his or her work role. As Warshaw (1989) states, "the individual just doesn't know
how he or she fits into the organization and is unsure of any rewards no matter how well
he or she may perform." A wide range of events can create role ambiguity and many
and of them are related to a specific event or a change in the employees' working
environment. In the case of this study, the employees of ExxonMobil Canada adopted
the work practices of Exxon and as a result experienced a significant change in their
work environment. It can be expected that this change altered the employees'
perceptions of alignment and increased the ambiguity associated with their roles in the
organization.
A lack of alignment and role ambiguity manifests itself in a general confusion
about appropriate objectives, a lack of clarity regarding expectations, and a general
uncertainty about the scope and responsibilities of the job. Kahn, Wolfe, Quinn, Snoek
and Rosenthal, (1964) found that workers who suffer from alignment/role ambiguity are
more likely to experience lower job satisfaction, a greater incidence of job-related
58
tension, greater feelings of futility and lower levels of self-confidence. French &
Caplan (1970) found that alignment and role ambiguity were related to a similar cluster
of symptoms. They also showed that alignment and role ambiguity is directly correlated
to an increase in blood pressure and higher pulse rates.
Later research by Margolis, Kroes & Quinn, (1974) finds that a number of
significant relationships exist between alignment, role ambiguity, symptoms of
depression, low job motivation and intention to leave the job. Their study assesses how
an individual's role in the organization influences the work stress framework and
hypothesizes that those individuals with higher levels of alignment and role ambiguity
will self report higher levels of psychosomatic strains.
Non-alignment issues within a workplace environment are evident when
employees tend to feel relatively powerless and as a result, potentially report higher
levels of stress. Alignment helps to overcome this problem by empowering employees
in different ways. For example, when a clear sense of direction is communicated
throughout the organization, it allows employees to initiate actions without a high
degree of vulnerability. Employees empowered in this way take initiative and make
contributions to their organization. When employees feel they are effectively
contributing to their organization they are less prone to experience elevated stress levels
and report an overall increase in their sense of well being.
Initiative
Personal initiative is a work behaviour that can be defined as self-starting and
proactive that overcomes barriers to achieve a goal. It is argued that future workplaces
will require people to show more initiative than before, and that current concepts of
performance and organizational behaviour are more reactive than desirable (Eisenbach,
Watson & Rajnandini, 1999). The components of initiative generally assessed in
research dealing with work stress are along the lines of goals, information collection,
59
., 'I I! I,
plans, and feedback. It has been shown that feedback that encourages initiative can have
both positive and negative consequences within the work stress framework. A work
environment that encourages initiative is often associated with openness and allows
employees become more creative in their thinking. It is characterized by progressive,
high-energy work .places that embrace change and foster employee participation.
Working environments that do not encourage employee initiative are often associated
with jobs that are very regimented and based on control with little decision latitude
available to the employee. Research has shown, that these types of jobs are often
associated with higher levels of coronary heart disease and increased employee stress
levels (Karasek, 1979).
It is hypothesized that those individuals who report that their working
environment encourages employee initiative will report fewer psychosomatic strains
than those employees who feel their organization places little value on employee
initiative. Employees whose work is respected and valued, and are given the
opportunity to do something meaningful in the workplace, develop a keen sense of
belonging and consequently, enable people to accomplish higher level goals.
Sense of Belonging
Self-esteem refers to an individual's overall self-evaluation of his/her
competencies (Rosenberg, 1965). In this sense, self-esteem is a personal evaluation
reflecting what people think of themselves as individuals. For Korman (1970), self
esteem reflects the degree to which the individual "sees him [her] self as a competent,
need-satisfying individual"; thus, the high self-esteem individual has a "sense of
personal adequacy" (Korman, 1966, p. 479). Pelham and Swann (1989) note that self
esteem also consists of an affective (liking/disliking) component - high self-esteem
people like who and what they are whereas low self-esteem people tend to finds faults in
their physical appearance and their past achievements. In these studies, self-esteem is
60

positively correlated with an individual's sense of belonging. This suggests that the
external environment that a person is exposed to plays an important role in their level of
self-esteem. Scholars have reasoned that individuals form a self-concept around work,
and that their organizational experiences play a powerful role in determining their level
of self-esteem. Building upon the notion that self-esteem is in part a function of
organizational experiences, Pierce, Gardner, Cummings and Dunham, (1989) introduced
the concept of organization self-esteem.
Organization self-esteem (OSE) is defined as the degree to which an individual
believes him/herself to be capable, significant, and worthy as an organizational member.
Much the same as OSE, sense of belonging is a multi-faceted construct that has been
difficult to characterize in previous research. It is recognized that sense of belonging is
a function of an individual's organizational experiences, but the processes involved in
creating a work environment that fosters a sense of belonging has not been fully
explored. Organizational experiences can be summarized as positive or negative. A
good metric to use in gauging these experiences is whether or not the individual feels
comfortable in their work environment. It can be hypothesized that feeling comfortable
in a work environment is a function of the loyalty displayed towards the organization
and the ability of the organization to instill a sense of belonging in its employees. In this
study, one facet of organizational self-esteem was looked at in detail. This study
measured the organization's ability to instill a sense of belonging in its employees.
Sense of belonging not only characterizes the overall feeling an employee has about
their work place, it reflects the self-perceived value that individual has of themselves as
important, competent, and capable within their companies.
Individuals that report a low sense of belonging will generally experience more
uncertainty as to the correctness of their thoughts, feelings, and behaviours than those
individuals with high a high sense of belonging. In addition, individuals with a low
sense of belonging will seek acceptance and approval from others through conforming
attitudinal and behavioural acts (Pierce, Gardner, Cummings & Dunham, 1989). As a
61
I 11
., 'I II I, ,.,
1: .,1
:11
result, it is recognized that the ability of an organization to instill a sense of belonging in
its employees can act as a moderator of the relationship between the employees working
environment (e.g., adverse role conditions), employee attitudes, motivation and
behaviour. Recently, Korman (2001) developed the concept of a dual motivational
system within organizations. One such system is the self-enhancement motivational
system, which is activated when employees see an opportunity to achieve high
performance goals, believe they can achieve them, but also see the organization as
encouraging them to do so. Korman believes providing meaningful work and
empowering employees to perform will lead to high self-enhancing employees and an
organization that creates strong feelings of self-worth and high scores for sense of
belonging.
The second motivational system, which Korman terms self-protective
motivation, is activated when employees feel they cannot meet performance
expectations, and see the work environment as negative that emphasizes punishment in
motivating employees. For both motivational systems Korman positions self-esteem as
a key precursor. High self-esteem precedes self-enhancement motivation, while low
self-esteem precedes self-protection motivation. These self-protection measures can
potentially result in a dysfunctional working environment by creating an atmosphere of
mistrust and employee dissatisfaction.
From the close association shown between an organization's inability to create a
strong sense of belonging and the resulting dysfunctional working environment it is
apparent that sense of belonging is closely linked with the level of stress reported by
employees. In fact, several studies have revealed a positive relationship between sense
of belonging and most facets of job satisfaction including level of perceived stress (Van
Dyne & Pierce, 2004; Stark, Thomas & Poppler, 2000; Tang & Gilbert, 1998, 1994 ).
This finding suggests that an organization's ability to create a strong sense of belonging
may play an important role in the work stress framework.
62
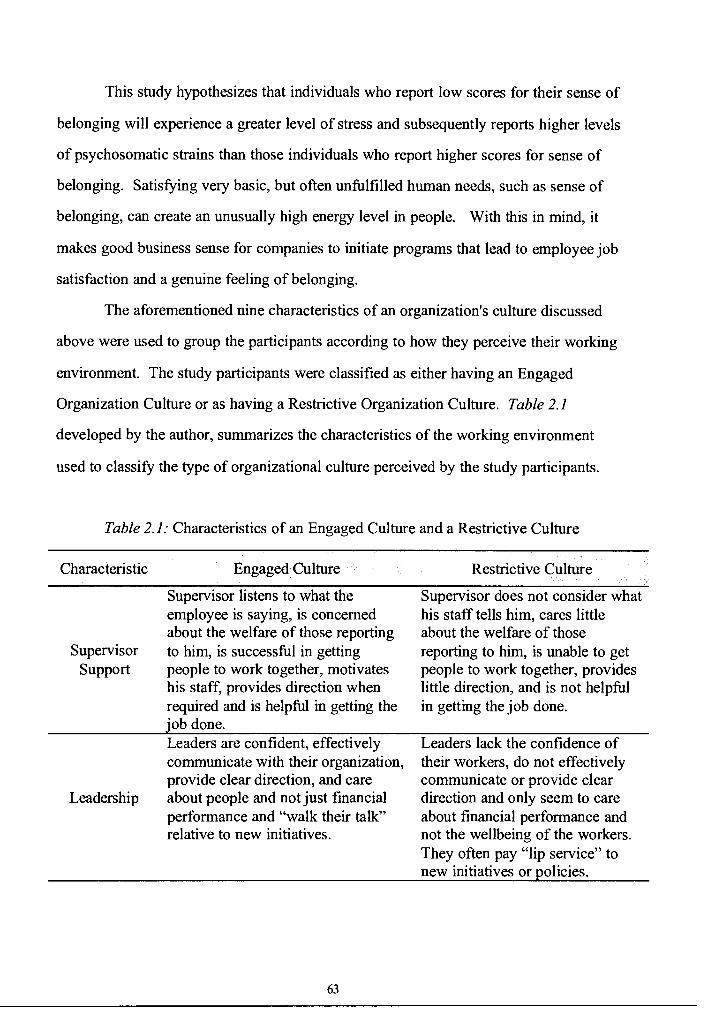
This study hypothesizes that individuals who report low scores for their sense of
belonging will experience a greater level of stress and subsequently reports higher levels
of psychosomatic strains than those individuals who report higher scores for sense of
belonging. Satisfying very basic, but often unfulfilled human needs, such as sense of
belonging, can create an unusually high energy level in people. With this in mind, it
makes good business sense for companies to initiate programs that lead to employee job
satisfaction and a genuine feeling of belonging.
The aforementioned nine characteristics of an organization's culture discussed
above were used to group the participants according to how they perceive their working
environment. The study participants were classified as either having an Engaged
Organization Culture or as having a Restrictive Organization Culture. Table 2.1
developed by the author, summarizes the characteristics of the working environment
used to classify the type of organizational culture perceived by the study participants.
Table 2.1: Characteristics of an Engaged Culture and a Restrictive Culture
Characteristic
Supervisor Support
Leadership
Engaged Culture
Supervisor listens to what the employee is saying, is concerned about the welfare of those reporting to him, is successful in getting people to work together, motivates his staff, provides direction when required and is helpful in getting the 'ob done. Leaders are confident, effectively communicate with their organization, provide clear direction, and care about people and not just financial performance and "walk their talk" relative to new initiatives.
63
Restrictive Culture
Supervisor does not consider what his staff tells him, cares little about the welfare of those reporting to him, is unable to get people to work together, provides little direction, and is not helpful in getting the job done.
Leaders lack the confidence of their workers, do not effectively communicate or provide clear direction and only seem to care about financial performance and not the wellbeing of the workers. They often pay "lip service" to new initiatives or policies.

ii
,, " ,, 'I II I,
Table 2.1: continued Characteristic Engaged Culture
Employees work is generally free from conflicting demands of others, they do not often have to wait on others to complete their tasks,
Teamwork colleagues are helpful in getting the job done, and are open to the idea of working together. There is a high level of cooperation both within groups and between groups. A high level of trust exists between colleagues and management. When
Trust someone says they are going to do something it gets done.
Information
Role Ambiguity
Initiative
Sense of Belonging
Employees are provided with the information they require to complete their jobs. Information flow is well coordinated and information is provided freely to those who need it without regard to an "ownership" issue. Roles and responsibilities are clearly defined and communicated. Employees are involved in planning their career paths and know where they are headed in the company.
Employees automatically take the initiative to complete tasks and duties.
The organization fosters a strong sense of loyalty and belonging.
Restrictive Culture Low employee collaboration, lack of common group goals, colleagues tend to have a negative impact on job performance and there is little cooperation between people within groups or between groups in the company.
Very little trust between colleagues or of management. Tasks are not often completed by individuals assigned to complete them. Employees spend much time in search of information to complete their jobs. Information flow is not well coordinated and employees tend to keep information to themselves instead of sharing it with everyone. Roles and responsibilities are not well defined or communicated and individuals know very little unclear regarding expectations or how to advance within the company. Employees will only undertake a task if they are directed to do so and are often unwilling to try new things. The organization does not foster a strong sense of loyalty or belonging.
Engaged Organizational Cultures vs. Restrictive Organizational Cultures
There has been a significant amount of research published over the last couple of
years on how workplaces are transitioning from traditional hierarchical type
64
organizations to team based organizations. Team based organizations focus on the team
approach rather than focusing on the individual, as do many hierarchical organizations.
The Team based types of organizational cultures are referred to as Engaged cultures in
this study and hierarchical organizations are referred to as Restrictive cultures.
There are many aspects that are similar between engaged cultures and restrictive
cultures, however, unlike restrictive cultures, engaged cultures build on those
similarities to create a more meaningful work experience. One particular aspect that is
quite different between the two is that of job roles, both of management and the worker.
In a restrictive culture, the management and workers roles tend to be completely
segregated, which is not true of an engaged culture. In a restrictive culture, workers
tend to have one specific task or role that they perform every day. Engaged cultures
take the approach of emphasizing skills that will allow the worker to better serve the
company by solving problems and interacting with the customer, other workers, and
other departments.
Another aspect that differs between engaged cultures and restrictive cultures are
the goals they deem to be important, both business and human resource based. Goals
indicative of restrictive cultures tend to focus on are primarily how well the company is
doing (business goals) and that everything is within the organization is secure for the
workers (i.e., working conditions, economic security, fair treatment). Engaged cultures,
on the other hand, go beyond just the basic fundamental goals associated with restrictive
cultures. The goals of engaged cultures tend to be more related to learning as well as
adapting to change within the workplace. When it comes down to human goals,
engaged cultures expand on those of the restrictive culture by adding career
development and personal contribution.
Organizations that displays characteristics associated with that of an engaged
culture give their employees responsibility and trust them to achieve the goals necessary
for the company to succeed. Not only does the organization succeed, the workers do as
well because they are viewed as a valuable asset, which motivates them to want to
65
ti
., 'I
'1 I, ,, ,,: ,I
·11
succeed. Unfortunately, most restrictive cultures do not have the same thoughts.
According to McCauley and Kuhnert (1992, p. 282), "control-oriented approaches of
work force management represent a strategy of dividing work into small, fixed jobs for
which individuals can be held accountable". On the other hand, individuals in engaged
cultures tend to work in groups, thereby making everyone accountable.
Though many companies would like to build an engaged culture, not many
actually have the ability to achieve this goal. According to Pfeffer ( 1998 ), fewer than 10
percent of all American companies develop and maintain a high performance culture.
They report that this is primarily due to management not "walking-the-talk". Walking
the talk creates environments that foster communication, build trust, and facilitates
teamwork (University of Wisconsin-Stout, 2001). When this is not done, employees
place their trust in other people, rather than in the organization's leaders. This study
hypothesizes that employees with similar job demands and similar levels of decision
latitude working within an engaged culture will report fewer psychosomatic strains than
those employees working within a restrictive culture.
Demographic and Personality Characteristics
Literature indicates that several personal characteristics and may have an
influence on how an employee perceives stress. These personal factors include
demographic variables (such as age or formal education), enduring personality
characteristics, and work-related attitudes. According to Johnson and Christenson
(2000), these factors should be identified as extraneous variables and should be
examined to determine if they vary significantly within the independent variable.
Because personal and demographic variables play such a large role in the way
individuals perceive their environment they were included within the scope of this
study. The following extraneous variables were examined to determine if a significant
relationship exists between them and an employee's perception of stress and associated
66

psychosomatic strains. The theorized influence of personality and demographic
variables within the work stress framework is graphically displayed in Figure 1.1 on
page 10.
Age
Age, one of the most studied demographic variables in psychosomatic literature,
has consistently been linked to employee stress levels. There is however some
ambiguity in the results reported by researchers on how age influences the level of stress
reported by employees. Among younger employees the level of stress is often reported
to be higher than it is among those over 30 or 40 years old. When age is spoken of in
terms psychosocial factors it is often explained in the terms of the individual's matured
personality disposition related to the attainment of developmental tasks specific to each
developmental phase and its influence on the individual's perception of the situation as
stressful or otherwise. Related to this, researchers report that in an industrial setting job
satisfaction and job involvement increases with age and as a result occupational stress
decreases (Cherrington, Condie & England, 1979).
This finding was confirmed in a recent study by Chandraiah, Agrawal,
Marimuthu and Manoharan, (2003), where the level of self reported job stress and job
satisfaction of 105 industrial managers working in different large-scale organizations
was assessed. They found higher levels of job stress and less job satisfaction among
managers 25-35 years age than their middle age counterparts (36-45 years) as well as
compared to managers between the ages of 45 and 50. The study also found that age
was negatively correlated with occupational stress and positively correlated with job
satisfaction.
Age is deemed to be synonymous with work experience; therefore, stress appears
to be more of a risk earlier in one's career. The reasons for such an interpretation have
not, however, been studied very thoroughly and separate studies have reported very
67
ti
,, " •I
'I II I, ,, ,1: ,I 11
different findings. In an epidemiological survey of 17000 randomly selected people
from the Bristol electoral register Smith, Brice, Collins, Matthews & McNamara, (2000)
report that the middle age workers, 35-55 years of age report significantly higher levels
of stress than both the older age group and the younger age group. This finding was
most evident for males, those who were single, those educated to a degree level, those in
full-time employment and those in the most stressful jobs.
These ambiguous findings are further compounded with the problem of survival
bias, i.e. those who experience a great deal of stress early in their careers are likely to
quit their jobs, leaving behind the survivors who consequently exhibit lower levels of
stress. Although the specific impact of age on the level stress experienced by the
employee has not been fully explored it is apparent that age exerts some influence
within the work stress framework and was assessed for its effects within this study.
Gender
The question often arises whether an individual's gender has an affect on
one's perception of stress. Research supports that gender can have an affect on the level
of stress experienced by an employee (Peden, Rayens, Hall & Beebe, 2001; Hudd,
Dumlao, Erdman-Sager, Murray, Phan, Soukas, &Yokozuka, 2000). Women usually
report a higher level of self-imposed stress along with a greater number of physiological
reactions to stressors than males (Hudd, et al., 2000). Some researchers have theorized
that the reason behind these differences stems from response bias. Misra and McKean
(2000) report that men show lower stress levels because they have been socialized to be
self-reliant and that a show of emotion is an expression of weakness and not masculine.
A male may therefore be more reluctant to self-report stress than his female counter part
thereby bringing into question the validity of the reports. Other researchers suggest that
the differences seen in the levels of stress can be attributed to how a person's gender
influences which strategy they pick to cope with their stress.
68
Researchers at the University of Washington and Iowa State University explored
this question by exposing male and female participants to the same stressful event, a
lecture. Results showed that male and female participants had equivalent pulse rates,
gave similar ratings of how stressful they thought the lecture would be and had similar
thoughts immediately before the lecture. These results indicated that males and females
experienced the stressful event (the lecture) in the same way. Even though they had
similar reactions to the event, males and females did use different coping strategies to
deal with the stress caused by the upcoming lecture. Men reported using more problem
focused coping techniques than women did (Ptacek, Smith & Dodge, 1994). Although
the study above shows that men and women are able to employ different coping
strategies, it did not show that men and women reported different levels of stress as the
result of a specific event. These results are in line with the findings of other researchers
who argue that different work factors account for gender-related stress (Piltch, Walsh,
Mangione & Jennings, 1995; Spielberger & Reheiser, 1995; Geller & Hobfoll, 1994),
and still others report no gender differences when controlling for occupation and
position (Greenglass, 1995).
These conflicting findings may be due to focusing on sex, rather than on gender
role, in which sex derives it psychological meaning from existing sociocultural
structures (Greenglass, 1995; Costos, 1986). Examining the influences of sex and
gender role on coping with work stress, Gianakos (1999) found gender role to be more
predictive of specific coping styles. Consistent with gender role expectations,
femininity or masculinity were both significant predictors of help seeking, direct action,
and positive thinking. These findings reinforce the hypothesis that a number of personal
attributes influence the coping mechanisms people use when experiencing work-related
stress and may play an important role in the work-stress framework.
69
Home-Life Stressors
In this study, non-work stressors such as those associated with the employee's
life away from the office were assessed to control for the effects of non-work stressors
on self-reported psychosomatic strains. Major stressful life event items selected from
the scales of two large studies were used to measure non-work stressors. Maciejewski,
Prigerson and Mazure (2000) conducted Americans' Changing Lives study (ACL) to
predict the onset of depression by stressful life events. Ten events were found to be
related to depression: death of a child, death of a spouse, death of a partner, death of a
close friend or relative, divorce, move to a new residence, loss of job, a serious financial
problem, physical attack, and life-threatening illness or injury. Tausig (1982) used the
Recent Life Changes Questionnaire (RLCQ) consisting of 118 items to predict
depression of 1,091 adult residents in New York. He categorized six significant life
events related to high CES-D scores: home, love, family, health, work, and legal
problems. He reports that these problems relate to the nature of the interface between
the workplace and family and is key to the work-family construct. Although his study
did not measure stress, various other studies have shown a high correlation between
depression and stress. These studies also reinforce the importance of including the
home-work interface in an assessment of the work-stress framework.
The influence of factors external to work can be characterized as having both
positive and negative impacts on how the employee handles stressful events at the
workplace. Most often, negative conflicts arise when the individual tries unsuccessfully
to fulfill responsibilities of roles in both domains. Although time limitations are the
most common cause of work-family conflict, other conflicts can arise because of
incompatibilities due to strain, energy, or behavioural requirements leading to an
increase in the amount of stress experienced by the individual.
70
Marital Status
Although most family-work researchers have focused on strain, and the
deleterious health and well-being consequences of work-family conflict (Barnett, 1996),
ample theory and evidence also suggests that the interrelationship between work and
family can have a positive effect on health. For example, empirical reports from a
variety of samples indicate that marital quality or spouse support is an important buffer
for job-related stress, particularly for men (Geller & Hobfell, 1994). It has been
concluded that having a supportive partner and the opportunity to talk through
difficulties at work may help individuals recover from stressful days and alleviate some
of the pressures associated with their jobs. As a result of this, the employee will report
lower stress levels and function more effectively both at work and at home. Roberts and
Levenson (2002), found that couples appeared to be attuned to the days when their
partner's stress levels were the highest and were able to effectively find ways to manage
the stress constructively. Some of the stress management techniques utilized included
making an effort to infuse positive emotions into marital conversations and finding ways
to talk about job stress rather than avoiding it. For the current study, it is hypothesized
for this study that employees in well-adjusted marriages will be better able to mitigate
against the negative outcomes of work stress and report fewer psychosomatic strains
than single employees or those employees involved in dysfunctional marriages.
Personality
It is well documented that an individual's ability to cope with stress and the
perceptions individuals hold regarding stressful events is often a function of the
individual's personality. For this study, participants are categorized as either having a
Type A or a Type B personality. Type A individuals respond in ways characterized as
aggressive, achievement oriented, dynamic, hard driving, assertive, fast paced (in eating,
71
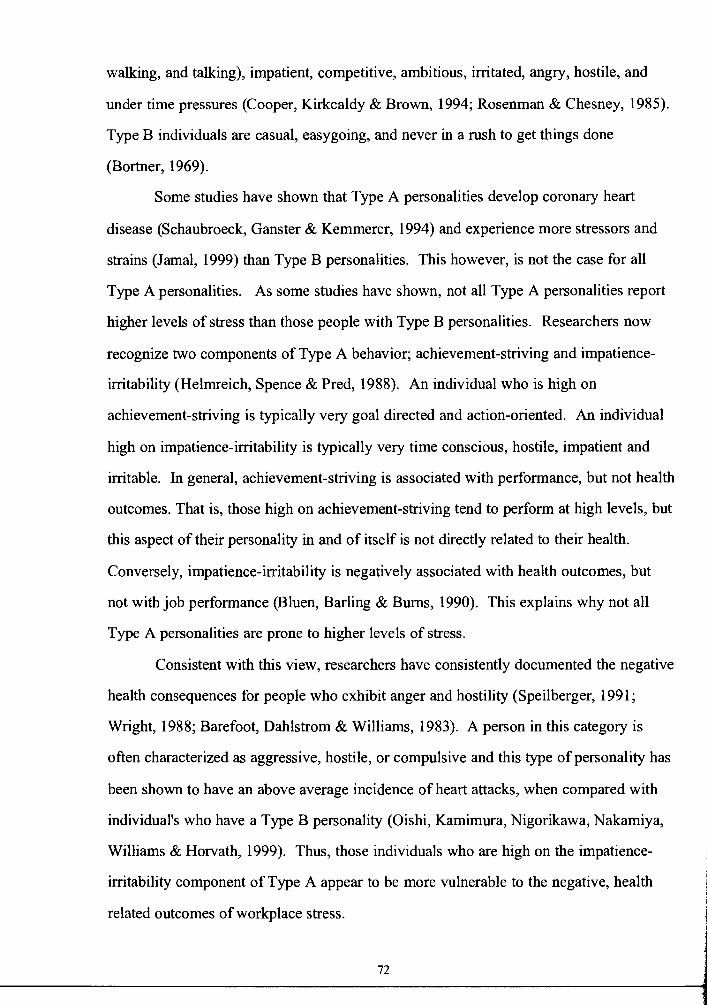
walking, and talking), impatient, competitive, ambitious, irritated, angry, hostile, and
under time pressures (Cooper, Kirkcaldy & Brown, 1994; Rosenman & Chesney, 1985).
Type B individuals are casual, easygoing, and never in a rush to get things done
(Bortner, 1969).
Some studies have shown that Type A personalities develop coronary heart
disease (Schaubroeck, Ganster & Kemmerer, 1994) and experience more stressors and
strains (Jamal, 1999) than Type B personalities. This however, is not the case for all
Type A personalities. As some studies have shown, not all Type A personalities report
higher levels of stress than those people with Type B personalities. Researchers now
recognize two components of Type A behavior; achievement-striving and impatience
irritability (Helmreich, Spence & Pred, 1988). An individual who is high on
achievement-striving is typically very goal directed and action-oriented. An individual
high on impatience-irritability is typically very time conscious, hostile, impatient and
irritable. In general, achievement-striving is associated with performance, but not health
outcomes. That is, those high on achievement-striving tend to perform at high levels, but
this aspect of their personality in and of itself is not directly related to their health.
Conversely, impatience-irritability is negatively associated with health outcomes, but
not with job performance (Bluen, Barling & Bums, 1990). This explains why not all
Type A personalities are prone to higher levels of stress.
Consistent with this view, researchers have consistently documented the negative
health consequences for people who exhibit anger and hostility (Speilberger, 1991;
Wright, 1988; Barefoot, Dahlstrom & Williams, 1983). A person in this category is
often characterized as aggressive, hostile, or compulsive and this type of personality has
been shown to have an above average incidence of heart attacks, when compared with
individual's who have a Type B personality (Oishi, Kamimura, Nigorikawa, Nakamiya,
Williams & Horvath, 1999). Thus, those individuals who are high on the impatience
irritability component of Type A appear to be more vulnerable to the negative, health
related outcomes of workplace stress.
72
It is hypothesized in this study that personality will play a large role in the work
stress framework interacting with both job stressors and organizational culture. It is
expected that the relationship between Type A and job stress may be amplified as a
result of the organizational culture the employee is exposed to. In particular, this study
predicts that Type A personalities will report greater psychosomatic strain than their
Type B counter-parts when exposed to restrictive cultures. Type A personalities who
are goal driven and thrive on accomplishment may find the increased bureaucracy
associated with a restrictive culture more stressful. Type B personalities on the other
hand will tend to act unhurried or be casual and endorse the status quo and will likely
report less job stress.
Ethnicity
The impact of ethnicity on the experience of stress in the workplace has been
previously studied by Defrank (1988), and Lincoln and Kalleberg, (1990). These
studies reported that Japanese workers generally report greater psychological distress
and lower job satisfaction compared with workers performing similar tasks in the United
States. It was hypothesized that these differences were likely due to differences in
lifestyle and the influence of external factors on the experience of stress such as the
home life interface. Recent studies, however, have examined this issue more thoroughly
and have indicated that the higher reported psychological distress among Japanese
workers is likely attributable to response bias instead of actual differences in the
perceptions held by the employees. For example the suppression of expression of
positive emotions by Japanese (Iwata, Mishima, Shimizu, Mizoue & Spielberger, 1998;
Iwata, Roberts & Kawakami, 1995). It is noted that this area needs to be further
investigated to determine the role culture plays in employee stress levels (Kawakami,
Haratani & Araki, 1998).
73

Related to this, Baruch and Woodward (1998) found that a key factor in a
manager's ability to cope with the stressors associated with a buyout was not necessarily
the ethnicity of individual, but instead the nature of the management team culture. This
finding suggests that the organizational culture experienced by the employee may play a
bigger role in determining how an employee copes with stressors than the ethnic origin
of the employee.
In other studies, ethnicity has been correlated with differences in reported levels
of blood pressure. African Americans, compared with whites, have a greater prevalence
of hypertension, develop high blood pressure at an earlier age, and have more frequent
occurrences of hypertension-related diseases (Burt, Whelton, Roccell, Brown, Cutler,
Higgins, Haran & Labarthe, 1995). This higher prevalence has been attributed to
several factors, including obesity, diet, and lower socioeconomic status (Hall, Ferrario,
Moore, Hall, Flack, Cooper, Simmons, Egan, Lackland, Perry & Roccella, 1997;
Winkleby, Jatulis, Frank & Fortmann, 1992). Even though ethnicity has not been
directly associated with how people handle stress, it has been shown to play a role in
how people respond to stressful events. For example, it is clear that the same film can
elicit different stress responses depending on the soundtrack provided (Speisman,
Lazarus, Mordkoff & Davison, 1964). This research led to findings stating that ethnicity
and culture influence the self-reported health appraisal of stress events (Aranda &
Knight, 1997).
As seen from previous research a person's race has a definite influence on health
related problems often associated with high levels of stress. The cause of these
differences is not clearly understood. The differences may in part be due to cultural
influences, physiological adaptations, or differences in perception. These differences
will be explored further in this study as it looks at how a person's race influences the
work stress framework.
74
Joh Classification
Evidence suggests that the work environment may play a role in the elevated risk
of adverse health outcomes due to the stress associated with the job. Job Classification,
for the purposes of this study is defined in terms of factors that are common to all
employees and is dependent on the individual's role within the organization. Roles as
defined in the job classification system are a part of a formal structure, which explicitly
defines roles and links them in a chain of command. Such a structure helps coordinate
employees both by reducing conflict and by resolving conflict in sensible ways. For
example, one employee may be taking on extra works over and above what the job
description describes as the duties and responsibilities of the job and he or she may ask
for a job reclassification. Level of responsibility, education and training, effort required,
and chain of command are all defined in the classification system, however, in some
instances this system does not minimizes the chances of dispute. On the other hand, the
job classification system does provide a mechanism that can resolve disputes. For
example, no matter which roles are in conflict in a chain of command there is always
someone hierarchically linked to those job roles of the employee who can provide the
needed coordination to resolve conflict before it reaches stressful proportions and
becomes disruptive for both the company and the employee.
Employees experience stress when recognition of "going beyond" the call of
duty is withheld and not valued. If an employee thinks that they are working at more
tasks than the job description calls for, a situation arises that can be very stressful,
particularly if the employee feels undervalued. When workplaces change, it is not
possible to define jobs in unambiguous and non-overlapping ways. Sometimes it is not
even possible to know what jobs will look like in the future. As a result, a great deal of
stress is generated as employees cope with the threat of the possible loss of meaningful
jobs. Companies can work to alleviate such problems by being cognizant of quality of
75
work life issues, surrounding job classification, by keeping employees well informed,
through, involvement, communication, job redesign, and shared decision making.
Cause for Concern in the Workplace
The workplace has seen an increase in excessive stress and distress among
employees as a result of the fast pace of development and change. The world is no
longer in the industrial era; we are standing on the edge of a new age, one dominated by
knowledge and information. Society is changing at a rapid pace, and many workplaces
mirror those changes. For example, mergers in the corporate sector is radically
changing how business practices are carried out; how employees are working; how
managers are managing; how leaders within the organization are leading; and how
people are working out how to do things right and how do the right thing. For example,
how are people integrated into a new system of management if it is different than the
one experienced before the merger? What happens when people oppose change? What
are the ground rules for changes to take place? If there are rules, are they aligned with an
integrated set of values or are the values of just one party involved in the merger? Are
there equity and power issues? Is the quality of work life issues addressed? Is there time
and support for dealing with distressed employees?
Many of the above questions give rise to increased stress in the modem
workplace. Much of the research points to stress reduction programs as being mainly
ineffectual. The aim of many programs should be one of optimizing conditions for
employees to become competent workers and thinkers who increase the productivity of
the company. Corporations must take a hard look at the applied use of their stress
reduction programs and ask if these methods currently being used are the best for the
employee and the company.
On the other hand, researchers must explore and investigate new and better ways
to add to the body of knowledge concerning stress reduction, which then can be
76

accessed by the workplace as valid, reliable, usable, and relevant. Therefore, it is
imperative, as noted in the above literature review, that researchers identify the factors
associated with the increasing risk of excessive stress in the workplace and assist in
researching and formulating the proper strategies for addressing them.
77
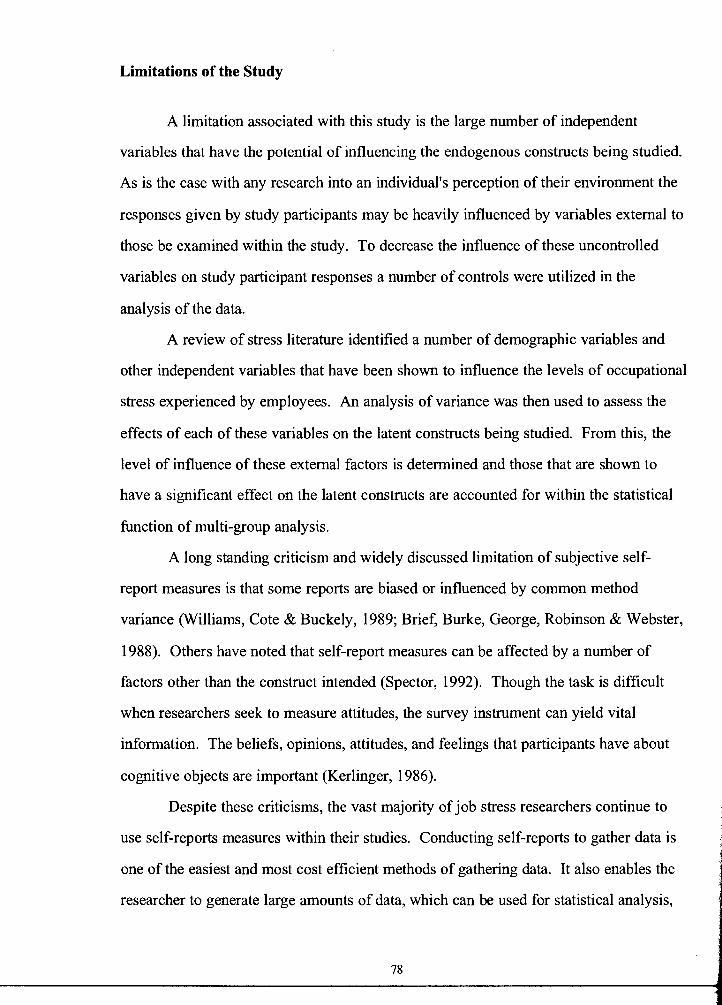
Limitations of the Study
A limitation associated with this study is the large number of independent
variables that have the potential of influencing the endogenous constructs being studied.
As is the case with any research into an individual's perception of their environment the
responses given by study participants may be heavily influenced by variables external to
those be examined within the study. To decrease the influence of these uncontrolled
variables on study participant responses a number of controls were utilized in the
analysis of the data.
A review of stress literature identified a number of demographic variables and
other independent variables that have been shown to influence the levels of occupational
stress experienced by employees. An analysis of variance was then used to assess the
effects of each of these variables on the latent constructs being studied. From this, the
level of influence of these external factors is determined and those that are shown to
have a significant effect on the latent constructs are accounted for within the statistical
function of multi-group analysis.
A long standing criticism and widely discussed limitation of subjective self
report measures is that some reports are biased or influenced by common method
variance (Williams, Cote & Buckely, 1989; Brief, Burke, George, Robinson & Webster,
1988). Others have noted that self-report measures can be affected by a number of
factors other than the construct intended (Spector, 1992). Though the task is difficult
when researchers seek to measure attitudes, the survey instrument can yield vital
information. The beliefs, opinions, attitudes, and feelings that participants have about
cognitive objects are important (Kerlinger, 1986).
Despite these criticisms, the vast majority of job stress researchers continue to
use self-reports measures within their studies. Conducting self-reports to gather data is
one of the easiest and most cost efficient methods of gathering data. It also enables the
researcher to generate large amounts of data, which can be used for statistical analysis,
78

and to conduct follow up studies over a long period of time. In the case of studying
stress, there is a sound theoretical reason for the use of self-reporting. First, self-reports
represent a participant's perception, and perception represents an important mediating
process in the occupational stress process (Spector & Jex, 1998). In other words,
whether or not any potential psychosocial hazard actually impacts on employee well
being depends to a large extent on the way in which employees perceive that
psychosocial hazard. Second, alternatives to self-reports used in job stress studies have
not provided superior results. Objective measures of job stress that use methods other
than employee self-report (Frese & Zapf, 1988) and physiological measures of job
strains (Fried, Rowland & Ferris, 1984) have been shown to be problematic and can be
less accurate than the use of self-reports.
Finally, This study is limited because it is a one case study design with a
convenience population and there is a possibility of bias due to the limited population
and return size (Campbell & Stanley, 1966). The ability to generalize from the data will
be limited (Kerlinger, 1986) particularly as only one specific industry was studied in a
specific geographic region.
The findings of the study are also limited to the reliability and validity of the
survey and the accuracy of participants' self-perceptions, biases and memory (Kerlinger,
1986). This study is dependent upon the instruments measuring characteristics that can
be directly related to personality and the work place. Specifically, the results assume
that the Cultural Assessment Tool is an adequate measure of organizational culture, and
that the Job Content Questionnaire is an adequate measure of the stressors experienced
by employees in the organization. It is further assumed that the participants understood
the directions and content of the various survey forms and responded honestly.
Researchers examine attitudes and use the information as a tool to see order and
consistency in what people say, think, and do in an attempt to predict future behavior.
"An attitude is not something we can examine and measure in the same way we can
examine the cells of a person's skin or measure the rate of her heartbeat" (Hennerson,
79

Morris & Fitzgibbon, 1987, p. 11 ). Examining complex attitudes, as this study does, is
a complex process. Henerson, et al., (1987) urges researchers to not be dissuaded
because the task is difficult, but cautions them to remember they are relying on
inference, since it is impossible to measure attitudes directly. Though the task is
difficult when researchers seek to measure attitudes, the survey instrument can yield
vital information. The beliefs, opinions, attitudes, and feelings that participants have
about cognitive objects are important (Kerlinger, 1986).
80

Chapter II Summary
In this chapter a review of the relevant research and literature concerning
occupational stress followed by a discussion of coping strategies and associated
psychosomatic strains. The characteristics of an Organization's culture were then
presented along with a comparison of characteristics of an Engaged culture to those
representative of a Restrictive Culture. Following this, the interaction effects of
demographics on the work stress framework was presented followed by causes for
concern in the workplace and the limitations of the study.
81
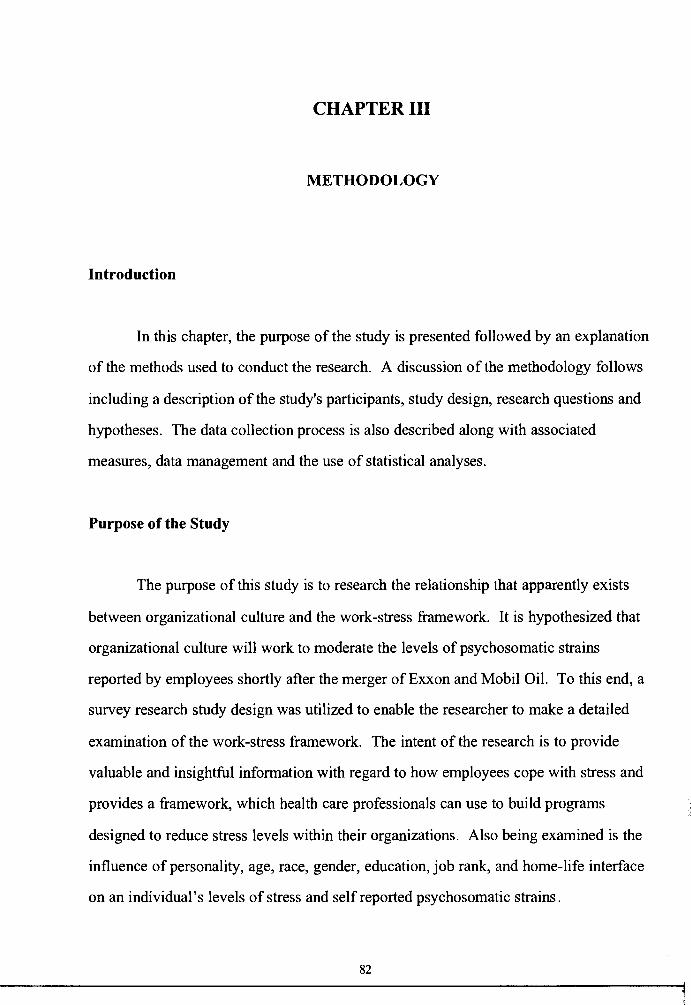
CHAPTER III
METHODOLOGY
Introduction
In this chapter, the purpose of the study is presented followed by an explanation
of the methods used to conduct the research. A discussion of the methodology follows
including a description of the study's participants, study design, research questions and
hypotheses. The data collection process is also described along with associated
measures, data management and the use of statistical analyses.
Purpose of the Study
The purpose of this study is to research the relationship that apparently exists
between organizational culture and the work-stress framework. It is hypothesized that
organizational culture will work to moderate the levels of psychosomatic strains
reported by employees shortly after the merger of Exxon and Mobil Oil. To this end, a
survey research study design was utilized to enable the researcher to make a detailed
examination of the work-stress framework. The intent of the research is to provide
valuable and insightful information with regard to how employees cope with stress and
provides a framework, which health care professionals can use to build programs
designed to reduce stress levels within their organizations. Also being examined is the
influence of personality, age, race, gender, education,job rank, and home-life interface
on an individual's levels of stress and self reported psychosomatic strains.
82
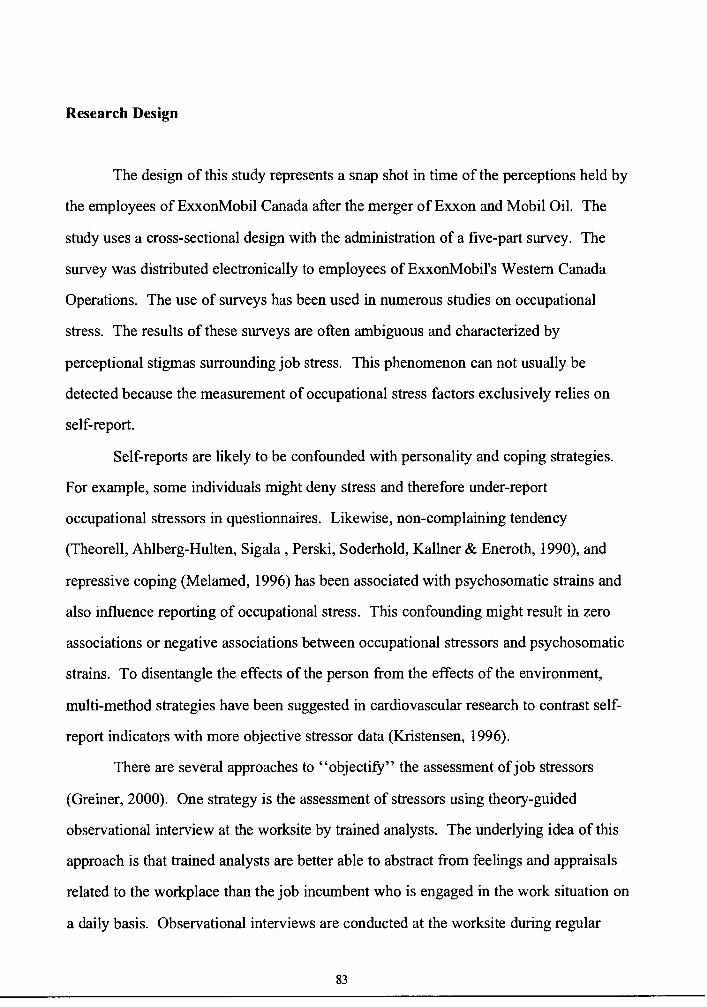
Research Design
The design of this study represents a snap shot in time of the perceptions held by
the employees of ExxonMobil Canada after the merger of Exxon and Mobil Oil. The
study uses a cross-sectional design with the administration of a five-part survey. The
survey was distributed electronically to employees of ExxonMobil's Western Canada
Operations. The use of surveys has been used in numerous studies on occupational
stress. The results of these surveys are often ambiguous and characterized by
perceptional stigmas surrounding job stress. This phenomenon can not usually be
detected because the measurement of occupational stress factors exclusively relies on
self-report.
Self-reports are likely to be confounded with personality and coping strategies.
For example, some individuals might deny stress and therefore under-report
occupational stressors in questionnaires. Likewise, non-complaining tendency
(Theorell, Ahlberg-Hulten, Sigala, Perski, Soderhold, Kallner & Eneroth, 1990), and
repressive coping (Melamed, 1996) has been associated with psychosomatic strains and
also influence reporting of occupational stress. This confounding might result in zero
associations or negative associations between occupational stressors and psychosomatic
strains. To disentangle the effects of the person from the effects of the environment,
multi-method strategies have been suggested in cardiovascular research to contrast self
report indicators with more objective stressor data (Kristensen, 1996).
There are several approaches to "objectify" the assessment of job stressors
(Greiner, 2000). One strategy is the assessment of stressors using theory-guided
observational interview at the worksite by trained analysts. The underlying idea of this
approach is that trained analysts are better able to abstract from feelings and appraisals
related to the workplace than the job incumbent who is engaged in the work situation on
a daily basis. Observational interviews are conducted at the worksite during regular
83

work with a particular worker. Using a structured protocol the analyst observes and
records environmental and organizational job characteristics, work behaviours, and
frequency and duration of job problems.
Since some information cannot be gathered by observation alone ( e.g., the
logistics of complicated work procedures), the analyst asks questions directly related to
the observations. The questions address objective work characteristics and procedures
rather than subjective feelings of the worker. The analyst combines all pieces of
information gathered by observation and interview by relating them to an objective
concept of stress, and then summarizes them in structured answer forms (Greiner, 2000).
This type of research methodology has met with some success but is very labour
intensive, and as a result is possible with only smaller sample sizes. It can also be
disruptive to the work force; thereby adding additional stressors and it may also
introduce the observer's preconceptions regarding the study content into the data
collected. As a result, the work observation may not be representative of that actual
work situation.
A second approach is to use self-report stressor data that are averaged across
individuals in identical jobs or work tasks or averaged for identical job titles; this
strategy also cancels out individual differences in perception. A third approach is to ask
questions that require as little emotional processing of the participant as possible and
separate those questions clearly from those that involve feelings and personal
perceptions (e.g., asking how often a particular events happens as opposed to how the
individual feels about the event). Many models of stress, at least implicitly, that it is the
perception of stress that initiates a physiological process that adversely affects health. It
is therefore possible that stressors are able to illicit psychosomatic responses without the
individual being aware of any stress?
By utilizing a structured questionnaire that requires little emotional processing to
assess an employee's work environment for characteristics shown to be associated with
higher levels of job stress as opposed to measuring stress itself it may be possible to
84
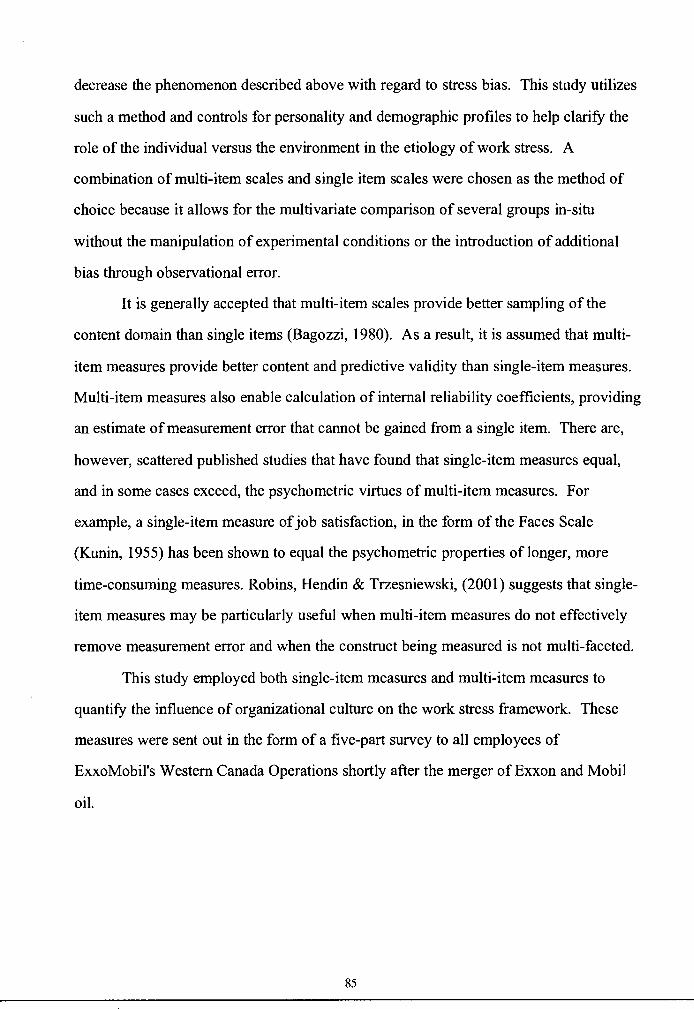
decrease the phenomenon described above with regard to stress bias. This study utilizes
such a method and controls for personality and demographic profiles to help clarify the
role of the individual versus the environment in the etiology of work stress. A
combination of multi-item scales and single item scales were chosen as the method of
choice because it allows for the multivariate comparison of several groups in-situ
without the manipulation of experimental conditions or the introduction of additional
bias through observational error.
It is generally accepted that multi-item scales provide better sampling of the
content domain than single items (Bagozzi, 1980). As a result, it is assumed that multi
item measures provide better content and predictive validity than single-item measures.
Multi-item measures also enable calculation of internal reliability coefficients, providing
an estimate of measurement error that cannot be gained from a single item. There are,
however, scattered published studies that have found that single-item measures equal,
and in some cases exceed, the psychometric virtues of multi-item measures. For
example, a single-item measure of job satisfaction, in the form of the Faces Scale
(Kunin, 1955) has been shown to equal the psychometric properties of longer, more
time-consuming measures. Robins, Hendin & Trzesniewski, (2001) suggests that single
item measures may be particularly useful when multi-item measures do not effectively
remove measurement error and when the construct being measured is not multi-faceted.
This study employed both single-item measures and multi-item measures to
quantify the influence of organizational culture on the work stress framework. These
measures were sent out in the form of a five-part survey to all employees of
ExxoMobil's Western Canada Operations shortly after the merger of Exxon and Mobil
oil.
85

Population
The merger of Exxon and Mobil Oil created an opportunity to assess one of the
largest mergers of the twentieth century. The merger created an organization with 120
000 employees that operates in some 200 countries worldwide. The company itself is
made up of four main divisions, the Upstream Division, the Downstream Division, the
Chemical Division, and the Global Services Division. Each of these is split up into
different companies. The focus of this research will be on employees within the
Upstream Division. The Upstream Division is split up into six companies, the
Exploration Company, the Development Company, the Production Company, the Gas &
Power Marketing Company, the Upstream Research Company, and the Upstream
Technical Computing Company.
The corporate entities that would become Exxon and Mobil Oil began the 20th
century as components of John D. Rockefeller's Standard Oil Trust. Two separate
refining and marketing organizations existed within the Standard Oil Trust: the Standard
Oil Company of New Jersey; and the Standard Oil Company of New York. "Jersey
Standard" and "SOCONY", as they were respectively known, were the chief predecessor
companies of Exxon and Mobil. In 1911 the U.S. Supreme Court ordered the
dissolution of the Standard Oil Trust, which resulted in the spin-off of 34 companies,
including Jersey Standard and SOCONY. In 1955 SOCONY became SOCONY Mobil
Oil, the predecessor of Mobil Oil Corporation. Jersey Standard changed its name to
Exxon in 1972. For the remainder of the 20th century Exxon and Mobil continued to
operate in a relatively low-price, low-margin environment. As markets in the United
States and Europe matured, regulations became more stringent and competitiveness
tightened worldwide. Each company continued to advance new technologies, introduce
marketing innovations, and extend its reach into emerging high-growth markets. The
two companies became more efficient, reduced costs, and increased shareholder value.
86

In 1999 Exxon and Mobil signed a definitive agreement to merge and form a
new company called ExxonMobil Corporation. One year later, in December of 2000
the companies received clearance to merge from United States Securities Commission
and the new entity of Exxon Mobil Corporation was born. The management team was
tasked with creating a new organization from two companies that had vastly different
organizational cultures.
Exxon employed characteristics associated with that of an Authoritarian type
culture and Mobil Oil utilized more of a Participatory approach to management. The
year following the merger was a period of transition for the new company as Mobil Oil
adopted the practices and managerial styles of Exxon. The same was true for
ExxonMobil's Operations in Western Canada, previously known as Mobil Oil Canada.
ExxonMobil Canada the study population used in this study consists of three
different Upstream Companies. The Production Company, the Exploration Company,
and Global Services. All came under the umbrella of the parent company ExxonMobil
Canada. Each company implemented Exxon management systems at different rates
creating an excellent opportunity to study different cultures within one organization.
AT the time of the study, each company had its own distinct organizational culture that
was to varying degrees a blend between the authoritarian style of Exxon and the
participatory style of Mobil.
ExxonMobil Canada, an Upstream Oil and Gas Company was chosen as the
study population for this research. This group represents an excellent study population
for conducting research into occupational stress and culture for the following reasons:
1. Employee activity level is fairly consistent for each of the business units.
Each business unit is conducts similar work and the manpower for each
group is set according formulas based on is based on equipment counts and
associated production levels. This method of staffing contributes to the
87

normalization of employee activity level and should provide some level of
consistency for psychological job demands.
2. The structure of the organization prior to the merger and immediately
following the merger created a number sub-cultures within the one company.
3. All employees within this population were recently exposed to a major
stressor, a merger.
4. Every employee has access to their own internal electronic mail providing an
efficient mechanism for distributing the questionnaires.
Within large companies it is reasonable to assume that over time each
organizational group can potentially develop its own subcultures. This is a natural
occurrence as an organization matures. Subcultures were also apparent in Mobil Oil
Canada at the time of the merger. Subcultures form for a number of reasons. In the case
of Mobil Oil Canada, each Business Unit functioned autonomously prior to the merger,
each with its own manager and associated business practices. Managers of
organizations play an important role in establishing and shaping the culture of their
organization (Schein, 1985; Deal & Kennedy, 1982). When each functional group has
its own Manager, it stands to reason that a subculture may develop. Organizations
usually select their management from the ranks of individuals who appear to best
represent the value system of the majority (Chatterjee, 2000), thereby preventing the
subcultures from becoming drastically different.
Each subculture that develops has the ability to impart its own influence on the
culture of the organization thereby changing the organization as a whole. In the case of
Mobil Oil Canada, it was apparent that a number of subcultures were in existence at the
time of the merger. During the merger, the subcultures had the opportunity to change
even further as it has been shown that during periods of transition leaders create change
by providing a vision that is attractive to followers (Eisenbach, et al., 1999), thereby
influencing the performance of the company throughout the transition stage.
88
ExxonMobil Canada employed 412 employees and some 1200 contractors at the
time of the study in late 2001. ExxonMobil Canada's head office is located in Calgary,
Alberta and it has operations in British Columbia, Alberta, and Saskatchewan. Prior to
the merger Mobil Oil was set up into eleven different Business Units. Each Business
Unit operated independently of the others. This gave rise to distinct subcultures that
were quite apparent to the author in visits to the different sites. Each Business Unit
conducted similar operations and for all intensive purposed engaged in the same
activity; the exploration and production of oil and gas.
The population for this study is defined as full time employees of ExxonMobil
Canada who had worked for the company at least one year prior to the distribution of the
survey. No specific sampling or randomization technique was used. It was physically
possible to include the entire population including management. This resulted in a
population size of 382 people.
Organizational Culture
The most widely cited cross-cultural work is that of Hofstede (1983; 1980; 1976)
who analyzed data from employees in 67 countries. His work is the cornerstone in
studying cross-cultural differences and has been replicated extensively. Hofstede's
survey items analyze traditional job attitudes, which result in factors that are defined in
terms of cultural values (Ronen, 1997). Hagberg (1999) built on the work of Hofstede
in the development of his Cultural Assessment Tool. This study will be using an
abbreviated version of the Cultural Assessment Tool (Hagberg, 1999), an objective and
quantitative survey that measures an employee's perceptions of their organization's
culture. These include dimensions such as social support, leadership, organizational
trust, teamwork, flow of information, innovation, role ambiguity, and sense of
belonging. Generally, the Cultural Assessment Tool is first administered to a stratified
random sampling of a company's employees. Then, a two-hour interview is conducted
89
with a random sampling of these individuals. From this, the researcher is able to gauge
employees' perceptions of 42 aspects of the organization's culture. This study used an
abbreviated version of this questionnaire and only focused on those aspects of an
organizations culture closely linked with the job stress framework.
Organizational Stressors
The scales of stressors utilized in the study consisted of work stressors and non
work stressors. Work stressors were measured by perceived job demands and job
control. Four items representing the home-work interface measured non-work stressors.
The effects of non-work stressors were controlled in a statistical analysis to discriminate
accurate effects of work stressors from non-work stressors on psychosomatic strains.
Work stressors were measured by job control and job demands. Karasek (1979)
operationalized job demands in the sense of psychological stressors at work such as
requirements for working fast and hard, heavy workload, not having enough time, and
having conflicting demands. He modified the conception of job demands to include job
complexity and interpersonal relations at work (Karasek, Brisson, Kawakami, Houtman,
Bongers & Amick, 1998). Dwyer and Ganster ( 1991) pointed that the workload, job
complexity, job conflict, and job ambiguity involved in carrying out a job as the main
components conceptualizing job demands. The main components comprising job
demands of this study were workload, time-pressure, job complexity, job conflict, and
interpersonal relationships.
The concept of job control was discussed in organizational research in terms of
participation in decision-making and job design (Spector, 1992). Karasek ( 1979)
defined job controi as the working individual's potential control over his tasks and his
conduct while at work. He indicated that job control is conceptualized by two
components: a worker's authority to make decisions on his job and the variety of skills
that the worker uses on the job. Ganster (1989) defined control as the ability to exert
90

influence over one's environment so that the environment became more rewarding or
less threatening. He mentions that participation in decision-making and job autonomy is
the main components conceptualizing job control. The main components of job control
of this study were decision-making latitude, task variety, work schedule, and job
autonomy. Karasek (1979) predicted that mental strain results form the interaction of
psychosocial job conditions such as the job demands experienced by the employee the
their job decision latitude over these job demands.
Psychosocial job conditions were measured with the job content questionnaire.
The job demands sub-scale is the sum of five items inquiring about excessive work,
conflicting demands, insufficient time to work, fast pace, and working hard. The job
control scale is the sum of two sub-scales: skill discretion as measured by six items
(learning new things on the job, ability to develop new skills, job requiring skill, task
variety, work not repetitious, job requiring creativity) and decision authority as
measured by three items (freedom to make decisions, choice about how to perform
work, and having a lot of say in the job). The work related social support scale is the
sum of two sub-scales: support from coworkers (four items) and supervisors (four). For
each item the participants are able to choose from one of four responses ranging from
strongly disagree to strongly agree.
Demographics
Age, gender, race, education, employee classification, length of time with
company, work location, and marital status make up the list of demographic information
collected for each of the participants. This data enabled the author to assess the effects
of the demographic characteristics on psychosomatic strains and to control for them if
they were shown to have a significant impact on the work-stress framework. It has been
well documented that there are significant differences in the manifestation of stress
related systems by age, gender, and marital status. Hurrell (1985) reports that female
91
workers had significantly higher stress symptoms than male workers among 2,803 postal
workers in the US. Hellerstedt and Jeffery (1997) report that stress at work was
significantly different by gender in a health behavior intervention study they conducted
on 3,843 workers in 32 profit-organizations. In a literature review study, Pohorecky
( 1991) indicated that age and gender were significant moderators affecting the
relationship between stress symptoms and behavioral strain (drug abuse).
Cohen, Schwartz, Bromet & Parkinson, (1991) reports that age is a significant
and confounding factor on the effect of stressors on health status. Vermeulen and
Mustard (2000) examine the gender difference between perceived social support, work
stress, and psychological strain and report that women have more perceived social
support, higher work stress, and greater psychological strain than their male
counterparts. The findings of Luoto, Roikolainen & Uutela, (1998) reiterate that stress
symptoms are significantly different by gender (women) and marital status (single) in an
analysis of a survey by the conducted by the National Public Health Institute in Finland.
Burvill ( 1995) also note that age, gender, and marital status are significant demographics
affecting depression prevalence in a literature review study.
An underlying theme of all of the studies presented above is that stress is a very
personal phenomenon that is heavily influenced by a multitude of internal and external
factors. How all of these factors interact has been the focus of numerous studies, but the
development of a framework that incorporates them all in the context work-stress has
not yet been a focus of researchers.
Personality
This study uses Jerabek's (1996) Type A Personality Inventory to identify
employees that display traits associated with individuals that possess a Type A
personality and those that display traits more characteristic of a Type B personality.
Jerabek's (1996) Personality Inventory has been used extensively in research and its
92

internal reliability has been validated in a study of 49435 men and women aged 10 to 70
(Sylvain & Jerabeck, 2002). Sylvain's study shows the Personality Inventory to have a
Cronbach's Coefficient Alpha of 0.9218.
Popular opinion seems to regard the Type A personality (Friedman & Rosenman,
1974) and an internal ability to control your work situation (Rotter, 1966) as ideal
characteristics for those employed in managerial positions. However, the impact of such
personality characteristics upon levels of stress, and how it influences the work stress
framework is less clearly established. This study looks at the relationship between
personality, the amount of perceived stress experienced by employees, and the level of
reported psychosomatic strains.
Data Collection Procedure
Data collection was conducted by means of a self-administered survey that was
distributed to all employees through electronic mail. On November 13, 2001, an
electronic message was sent to all of ExxonMobil's employees in Western Canada. The
employees were explained the confidentiality of the questionnaire and instructed to
either send the completed form back to the author via electronic mail, via fax, or via the
internal office mail delivery system (See Figure 3.1 Electronic Distribution of Survey).
93

l,.+.J ...... , .......... . / Brent J Pasula
, . . . . 11 /13/2001 09: 34 PM
Ill Deferred mail routing
lr To: MOC/l.N-WC-Employees-All.:1 ii' cc: ,J
bee: rt.J Subject: r' Assistance Required.J
"1 am conducting a study as part of my PhD. program and request your assistance in completing the attached survey.
The survey will take about 10 minutes of your time to complete.
Please note that the survey you are being asked to fill out is voluntary and anonymous. Please ensure that you do not write your name, or any other comments that will make you identifiable on the attached. When you email the document back to me I will not record any names thereby ensuring that you remain anonymous. I am the only one that will have access to the raw data used in this study.
occupational survey .xis
I acknowledge that all of you are extremely busy people and sincerely appreciate you taking the time out of your schedules to complete the attached survey.
Thank you, Figure 3.1: Copy of the note that was sent to all employees of ExxonMobil Canada
West on November 13, 2001.
The following measures were utilized to ensure the anonymity of the study
participants. First, the study participants were instructed not to sign any of the
documentation being returned to the author. Questionnaires that were returned to the
author by fax or by internal mail were anonymous thereby ensuring the confidentiality
of the participant. In cases where a participant had identified himself or herself on the
questionnaire, their identity was concealed with an indelible black marker. Additional
measures had to be used for questionnaires that were returned to the author
electronically.
94
Electronic messages can be tracked back to the sender of the document thereby
revealing the identity of the participant. In these cases, only the author had access to the
electronic mail box where the surveys were returned, and as soon as the author received
an electronic survey it was given a reference number, stored digitally on a secure
computer, and then the electronic mail was erased. This enabled the author to maintain
the confidentiality of the participant.
The Survey Instrument:
The Survey Instrument consists of five sections. Each Section is made up of a
number of questions used to assess a specific aspect of the employee's work situation.
The methodology used to assess the participants' responses is described in detail in
Table 4.1.
Section I
Study participants were given a choice to either print the survey off and fill it in
with a pencil or complete the survey online with the use of check boxes. The note that
accompanied the survey instrument explained the purpose of the survey, confidentiality
assurances, the voluntary nature of the survey, and invited participation in the survey.
The survey itself was sent out in the form of an excel spreadsheet with five worksheets.
Each worksheet represented a different survey instrument.
The first worksheet, "Section I" introduced the study topic, gave directions on
how to complete the survey, and collected demographic information from the
participants (see Figure 3.2).
95
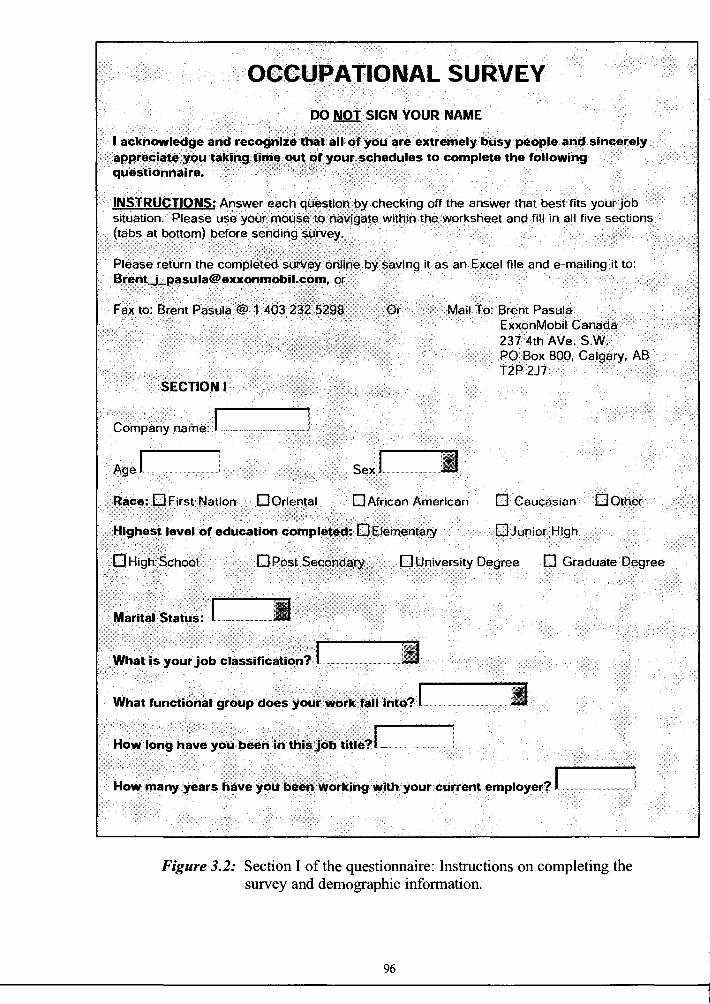
OCCUPATIONAL SURVEY
DO NOT SIGN YOUR NAME
I acknowledge and recognize that alt of you are extremely busy people and sincerely appreciate you taking time out of your schedules to complete the following questionnaire. ·
INSTRUCTIONS: Answer each question by checking off the answer that best fits your job situation. Please use your mouse to navigate within the worksheet and fill In all five sections (tabs at bottom) before sending survey.
Please return the completed survey online by saving it as an Excel file and e-mailing it to: [email protected], or
Fax to: Brent Pasula@ 1 403 232 5298
SECTION I
Company name: I ........ ___ J Agel
Or
Sex I
Mail To: Brent Pasula ExxonMobil Canada 237 4th AVe. S.W.
i
PO Box 800, Calgary, AB T2P 2J7
Race: OFirst Nation OOriental 0African American 0 Caucasian O Other
Highest level of education comp;eted: D Elementary 0 Junior High
0 High School D Post Secondary D University Degree D Graduate Degree
What is your job cl~ssification? I i What functional group does your work fall into? I How long have you been in this Job title? I . ·········•
How many years have you been working with your current employer?
Figure 3.2: Section I of the questionnaire: Instructions on completing the survey and demographic information.
96
The drop down boxes seen in Section I of the survey instrument gave the
participants the following choices:
• Marital Status:
Married, Common Law, Single, Divorced/Separated, Widowed
• What is your job classification?
Management, Employee
• What functional group does your work fall into?
Supervisor, Technical, Operations, Maintenance, Support
Section II
Section II of the questionnaire instrument collects information on the work
environment and the potential stressors experienced by employees. This study used a
tailored version the Job Content Questionnaire to measure work related stress. The
original Job Content Questionnaire was developed to measure the risk of heart disease in
a large-scale study, and contained 27 questions based largely on items and scales from
the US Quality of Employment Surveys.
The Job Content Questionnaire has the most extensive accumulated evidence on
stress' relationship to physical health. A recent international comparison of distributions
and psychometric properties of the Job Content Questionnaire among U.S., Canada, the
Netherlands, and Japan has demonstrated that the Job Content Questionnaire can be
used for cross-national studies on job stress (Karasek, et al., 1998). This survey has
been translated into over a dozen languages, including Japanese (Kawakami & Fujigaki,
1996) and French (Larocque, 1998). It is nationally standardized by detailed occupation
in several countries, has an active users' group that supports it's usage, and has an
international board of researchers that decides on policy and development issues. Its
successful use around the world as an indicator of cardiovascular disease makes it the
97
survey of choice to use in cultural studies relating to stress. Although this survey has
been used extensively in international studies, the presentation of the international data
is not accompanied by any hypothesis relating to cultural differences amongst the test
groups. This study will depart from previous research by assessing the relationship
between culture and stress from the analysis of the data derived from both the Job
Content Questionnaire and the Cultural Assessment tool.
Psychologically, the Job Content Questionnaire reflects a stimulus approach, as
opposed to a relational approach, which emphasized personal cognitive interpretation of
the person-environment relationship. The Job Content Questionnaire assumes that
behaviour is, to a significant extent, generated by social environments and their
constraints outside the individual (Karasek, et al., 1998) thus making it an ideal survey
to study the effect organizational culture has on the stress experienced by an employee.
In addition to the above, the Job Content Questionnaire was chosen for the following
reasons:
1. Its use has accumulated extensive evidence on the relationship between
occupational stress and physical health.
2. It appears to be the most widely used and accepted job-stress assessment
instrument.
3. It is widely used in cross-cultural studies of occupational stress.
4. It is easy to customize the instrument to study specific occupational
functions.
5. It is based on the Demand and Control Model of stress. During the transition
period following a merger employees are faced with increased demands and
in the case of the sample group in this study, have experienced a significant
decrease in their level of control.
6. The questionnaire uses simple language and was designed to minimize
response bias.
98
The Job Content Questionnaire can be characterized as focusing on the
psychological and social structure of the work situation. The concept of job control was
discussed in organizational research in terms of participation in decision-making and job
design (Spector, 1986). Karasek (1979) defined job control, as the working individual's
potential control over his tasks and his conduct during the working days. He suggests
that job control is conceptualized by two components: a worker's authority to make
decisions on his job and the variety of skills that the worker used on the job.
As noted earlier, considerable empirical support for the Demand and Control
(DC) model is shown in large-scale multi-occupational studies that tend to provide
support for the interaction effects between demand and control predicting strain. In
addition to the empirical evidence, the reliability and validity of the study has been
assessed as well. In order to investigate the reliability and validity of selected scales
from the Japanese version of Job Content Questionnaire Kawakami and Fujigaki, (1996)
conducted a survey of 1,126 white-collar employees of a computer company in Japan
using a questionnaire including 31 items from the JCQ. Ten JCQ scales on
psychological and physical demands were examined in 603 male and 84 female
participants.
Cronbach's alpha reliability coefficients for nine JCQ scales, which consisted of
two or more items, ranged from 0.66 to 0.90 for males and from 0.64 to 0.88 for
females. Item factor analysis for each scale indicated that the first factor explained 50 or
more percent of item variation of decision authority, supervisor support, coworker
support and framingham physical exertion in males and females and of psychological
demands in females. The skill discretion, decision authority and decision latitude
significantly and positively correlated with age, years of employment, and years of
experience in males.
In addition, it was shown that decision authority positively correlates with age
and years of experience. Psychological demands, and physical exertion significantly
and positively correlated with overtime in males and females. Skill discretion, decision
99
authority and decision latitude, psychological demands were lowest in computer
engineers/technicians. These studies suggested that the JCQ scales are reliable and valid
instruments for assessing job stressors.
For the purposed of this study, a modified version of the Job Content
Questionnaire was used that included a section on the home-work interface along with
job control, job demand, social support, and psychosomatic strains (See Figure 3.3 on
the following page).
Job Control
In this study, the concept of job control was discussed in terms of participation in
decision-making and job design Karasek (1979, p. 296) defines job control "as the
working individual's potential control over his tasks and his conduct while he or she is
at work." He indicates that job control is conceptualized by two components: a worker's
authority to make decisions on his job and the variety of skills that the worker uses on
the job. Ganster (1989) defines control as the ability to exert some influence over one's
environment so that the environment becomes more rewarding or less threatening. He
mentions that participation in decision-making and job autonomy
are the main components conceptualizing job control. This study combined the ideas of
Karasek (1979) and Ganster (1989) to define the main components of job control as
decision-making latitude, task variety, work schedule, and job autonomy.
100

SECTION II
FOR THE QUESTIONS BELOW, PLEASE CHECK ONLY ONE BOX FOR EACH QUESTION
t My Job requires that I learn new things. · . · · ?.. My Job lnvoh(es Ii lot oHepetlUve work. . .. · ..... · Q Strongly Disagree O Disagree Q Agree Q Strcilgly Agrei:i ·· '. 0Strorigly Disagree Q Disagree O Agree Q Strongly Agree 3. My job requires me to be creative. 4. My job allows me to make a lot of decisions on my own. D Strongly Disagree D Disagree D Agree D Strongly Agree D Strongly Disagree D Disagree D Agree D Strongly Agree 5. My job requires a high level of skill. . 6, On my Joi:>, I have very little rreedom to decide how I do my work. Q Strongly Disagree O Disagree Q Agree O Strongly Agree O Strongly Oisagree Q Disagree O Agree Q Strongly Agree 7. I get to do a variety of different things on my job. 8. I have a lot of say about what happens on my job. D Strongly Disagree D Disagree D Agree D Strongly Agree D Strongly Disagre~ 0Disagree D Agree D Strongly Agree 9. I have an opportunity to. develop. my own special abifities. JO. MyJ(?br09ulres wQfk!ng very fast . . •. . . . . D Strongly Disagree ,Cl.Disagree a Agree D Strongly Agree I.JStrongly.Disagroo ,0'1!)l'sagree OAgree O Strongly Agree • 11. My job requires working very hard. 12. My job requires lots of physical effort. D Strongly Disagree D Disagree D Agree D Strongly Agree D Strongly Disagree D Disagree D Agree D Strongly Agree 13. I am not asked to do 'an excessive amount of work. ' · l4t f llai/e~ iime•to:gei; the Job done .. Q Strongly Disagree . i;l Disagree O Agree O Strongly Agree O Strongly Disagree Q {)isagree O Agree Q Strongly Agree 15. I am free from conflicting demands that others make. 16. My job requires long periods of intense concentration on the D Strongly Disagree D Disagree D Agree D Strongly Agree task.
D Strongly Disagree D Disagree D Agree D Strongly Agree · 1 ~, My jot> is very h.ectic. • g,~tr<>n~/ Dis~gr8;8. Q [}lsagree Q .A!Jree Q Strongly Agee
17. My tasks are often interrupted before they can be completed, requiring attention at a later time. . D Strongly Disagree Q Disagree Q Agree O Strongly Agree 19. I am often required to work for long periods with my body in 20. I am required to work for long periods with my head or arms in physically awkward positions. physically awkward positions. D Strongly Disagree D Disagree D Agree D Strongly Agree D Strongly Disagree D Disagree D Agree D Strongly Agree 21. Waiting on.work from other people or departmeOts.oftenstows,·'. 121How$teady1$ your'work? (Check one.) .. me down on my Job. · ·· · · 0 Regular and steady O Seasonal Frequent layoffs D Strongly Disagree O Disagree O Agree • O•Strongly Agree O . Both seasonal and frequent layoffs D Other 23. How likely is it that during the next couple of years you will lose 24. During the past year. how often were you in a situation where your presentjob with your employer? you faced job loss or layoff? D Not at all likely D Not too likely D Somewhat likely D Never Faced possibility D Faced the possibility more than D Very likely once D Constantly D Actually layed off 25. My Job security Ii! gOQd. , 26.' My prospects for career development and promotions are · Q Strongly Disagree-; '/;l Disagree g Agree Q Strdrlgly AQJ:~ gqo(t . , ., , · .· : i .. \ ; >.,
·.CJ;Strongiy Disli!grte O Disagree' O:Agree O Strongly Agree 28. My supervisor is concerned about the welfare of those under him.
27. In five years. my skills will still be valuable. D Strongly Disagree D Disagree D Agree D Strongly Agree
29. My supervisqr,pa~ attention to what I arwsayi!lg, 11, ··.• •
Q Strongly Disagree··· Q Disagree Q Agree : Q Strongly Agree 31. My supervisor is helpful in getting the job done. D Strongly Disagree D Disagree D Agree D Strongly Agree 33. People I ,work with are competent in doing their jobs. 0 Strongly Disagree Q Disagree O AgreeHil Strongly Agree 35. I am exposed to hostility or conflict from the people I work with. D Strongly Disagree D Disagree D Agree D Strongly Agree 37. The people'! work with encourage each other to work together. Q Strongly DiSagree O Disagree O Agree Q Strongly Agee 39. I am happy with my life outside of work. D Strongly Disagree D Disagree D Agree D Strongly Agree 41. I feel comfortable discussing problems at work.with partner at home. 0 Strongly Disagree D Disagree · Q Agree a Strongly Agree
D Strongly Disagree D Disagree D Agree D Strongly Agree ·. ;ip. I am~Jp.'1o5lility or conflict rrom my supervisor. ·Q:Strongiyl!)l'sagree'· 0Disagree O Agree Q Strongly Agree 32. My supervisor is successful in getting people to work together. D Strongly Disagree D Disagree D Agree D Strongly Agree 34. People I work with take a personal Interest in me. Q Strongly Disagree O fXsac1ei:i O Agree· Q Strongly Agree 36. People I work with are friendly. D Strongly Disagree D Disagree D Agree D Strongly Agree 38. People I. work with are helpful in getting the Job done. Q Strongly D~gree . 0 l!)i'sagree . 0 Agree .0 Strongly Agree 40. I look forward to returning home at the end of a work day. D Strongly Disagree D Disagree D Agree D Strongly Agree 42:There have been no major changes within my personal life (last 12 months). 0 Strongly Disagree d l!)l'sagree O Agree Q Strongly Agree
Figure 3.3: Section II. Karasek's (1979) Job Content Questionnaire. Modified to include four additional questions on the home-work interface.
101

Job Demand
Job demands are measured by the psychological demands scale, which was
developed by Karasek ( 1998). In 1998 Karasek revised the original job demands scale
and added four items to the original five items, and verified the reliability and validity of
the revised scale. The refined scale included workload, time-pressure, job complexity,
job conflict, and interpersonal relationships at work. He showed the internal consistency
of the revised scale to be O .72 in the male population and 0.71 in the female population
(Karasek et al., 1998). A five-point Likert scale designated from 1 as 'rarely' to 5 as
'very often' scored all nine job demands items. The greater the mean score, the heavier
the perceived job demands were expected to be.
Psychosocial Support
There is now consistent evidence from a number of cross-sectional (Estryn
Behar 1990; Dew & Parkinson, 1990; Bromet, Dew, Parkinson & Schulberg, 1988;
Broadbent & Gath, 1981) and longitudinal studies (Niedhammer, Goldberg & Leclerc,
1998; Stansfeld, Bosma, Hemingway & Marmot, 1998; Niedhammer, Lert & Mame,
1995; Parkes, 1995; Kawakami, et al. 1992) that psychosocial factors at work play an
important role in contributing to ill health. Karasek (1979) presented the Job-Strain
model that defined the two main psychosocial factors in influencing an employee's
health as demand and control. In 1988 Johnson and Hall redefined the Job-Strain model
by introducing the concept of work-related social support (the Demand-Control Support
Model), suggesting that supporting interpersonal relationships at work may function as a
moderator in stressful jobs.
In this study, social support was measured by six questions from the Job Content
Questionnaire developed from the job demand-control-social support model by Karasek
& Theorell. The questions are related to the atmosphere of the work environment, and
102
help and support from the colleges and supervisor. The author added an additional four
constructs pertaining to the home-work interface to further expand on the psychosocial
dimensions that potentially influence employee stress levels.
Section III
Psychosomatic Strains
The Demand, Control, Support Model predicts significant variations in
psychosomatic strains. This prediction is borne out of theoretical conjecture and
historical evidence. Historically, studies have drawn a close a correlation between
Demand, Control, Support and psychosomatic strains. It is theorized that high strain
jobs that are characterized by low control and high demands elevate employee stress
levels. If the high stress levels continue unchecked for an extended period of time they
generally manifest in themselves in one of many psychosomatic strains. It is now
generally accepted that job stress can lead to psychosomatic strains and play an
important role within the work stress framework.
Most, psychosomatic strains surveys have been inspired by the Mental Status
Index developed by Gurin, Veroff and Feld, (1960) and by Langemer's ( 1962) twenty
two items screening score of psychiatric symptoms. These scales were originally
constructed to screen mental patients; however, Seiler (1973) concluded that the scales
are best interpreted as measures of psychological strain. Karasek, (1979) used these
scales to develop a 12 item psychosomatic strain scale that has been successfully used in
National Surveys within the United States to measure the level of psychosomatic strains
associated with different jobs. Karasek's psychosomatic strain questions are found in
Section III of the survey and shown in Figure 3.4.
103
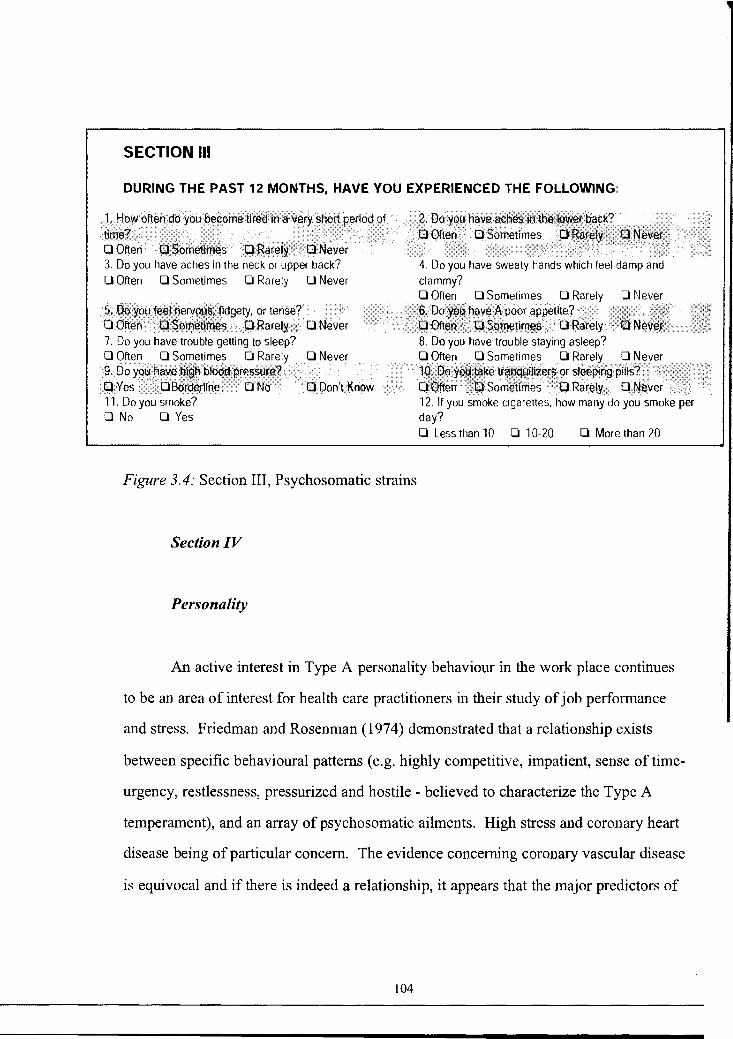
SECTION Ill
DURING THE PAST 12 MONTHS, HAVE YOU EXPERIENCED THE FOLLOWING:
3. Do you have aches in the neck or upper back? 0 Often O Sometimes O Rarely O Never
11. Do you smoke? 0 No O Yes
Figure 3.4: Section III, Psychosomatic strains
Section IV
Personality
4. Do you have sweaty hands which feel damp and clammy? OOften
12. If you smoke cigarettes, how many do you smoke per day? 0 Less than 10 0 10-20 0 More than 20
An active interest in Type A personality behaviour in the work place continues
to be an area of interest for health care practitioners in their study of job performance
and stress. Friedman and Rosenman (1974) demonstrated that a relationship exists
between specific behavioural patterns ( e.g. highly competitive, impatient, sense of time
urgency, restlessness, pressurized and hostile - believed to characterize the Type A
temperament), and an array of psychosomatic ailments. High stress and coronary heart
disease being of particular concern. The evidence concerning coronary vascular disease
is equivocal and if there is indeed a relationship, it appears that the major predictors of
104

Coronary Heart Disease lie within the hostility sub-component of the Type A
personality (Blumenthal, McKee, Haney & Williams, 1980).
Berry ( 1998) argued that organizational psychologists are interested in Type A
personality characteristics for two reasons,
" First, the conditions that appear to elicit this behaviour, such as opportunities
for achievement, are common aspects of the work environment. Thus, certain
individuals may show chronic high arousal and develop an associated
cardiovascular problem just by being at work. This is something the
organization does not want. Second, it looks as if Type A behaviour results in
high work performance and accomplishment. This, of course, is something the
organization does want " (Berry, 1998, p. 439).
The present study focuses on the role personality plays in the work stress
framework. It uses Jerabek's (1996) personality inventory to characterize the study
participants as either having a Type A or a Type B personality. Jerebek, (2002)
conducted an assessment of the internal reliability of the scales used in the Personality
Inventory. She found that her scale used to assess an individuals personality has a
Cronbach's coefficient alpha of 0.9218 in a sample size of 49435 individuals. The
Personality Inventory used in the study is located in Section IV of the questionnaire and
is displayed in Figure 3.5.
105

SECTION IV
!Jal/El l:!nough ti,ne to accomplish my goals. l.QJ)!S~gree Q,Agree t;:)S!roogly~
. z.~ .. I donluride~tand.~p ill :'- Cl Straigly ee ee. •[ a Strongly Agree
3. I frankly don't care whether I do or do not make it into the top 4. I find it difficult and useless to confide in someone. 10%. a Strongly Disagree a Disagree a Agree a Strongly Agree a Strongly Disa ree a Disagree a Agree a Strongly Agree $. · ·. · ·· st~be more difficult to get in orderto
/. ldio~ on the road. , , , , , ' q pjsagree a Agree .IJ.Strongly Agree '
7. I often choose to spend time with my friends or family, even though I have something important to do. 0 Str Di~1!E! Cl Dis.a11ee . 0 Af,ee . Cl ~trongly Agre,e
,. '"'°fat P1J$~oufb'tacqufr!\11th1ngs: v~·· . . · a:i:>t$i,gi"ee a Agref a Sirong1y Agree~
11. People who don't know what they want get on my nerves. a Strongly Disagree a Disagree a Agree a Strongly Agree
,. , task, f feel 'good about myself. O ~ . a Disagree. O Agree a Strongly Ag-ee . 15. Talking about emotions is a sign of weakness and can be used by others to get at you. a Strongly Disagree a Disa!1ee a Agree a Strongly Agree ]7~Jf ~~JijiJob Pf~rlyrmy life wo.~ld.> be much easier.:'./:,· '.f''.'//Y 7••/c .. .· , , . .. . .·
,Q StronfY ~ 0 Disagree Q Agree a Strongly Agree
6. It doesn't bother. me.if. I (fay. , .. ·.·\{·\.)''.'}./ 0 Sirorigly ~ ,, 8. I am hardly ever satisfied with my achievements. a Strongly Disagree a Disagree a A!1ee a Strongly Agree
!~~ ·~~-:l~!ciLAgr~I 12. I think that hobbies such as fishing or bowling are just a waste of time. a Strongly Disagree a Disagree a ~gree a ,5trClllgly A
J:JIJO: , , ,. , ~,t,It . , re~t!;;; P.~ee 16. It doesn't matter whether my family is financially secure. The impatant thing is to be together.
os.~a.,~~ OD:g= O~• o~~71 Figure 3.5: Section IV, Type A Personality Indicator
Section V
Organizational Culture
The most widely cited cross-cultural work is that of Hofstede ( 1983; 1980; 197 6)
who analyzed data from employees in 67 countries. His work is the cornerstone in
studying cross-cultural differences and has been replicated extensively. Hofstede's
survey items analyze traditional job attitudes, which result in factors that are defined in
terms of cultural values (Ronen, 1997). This study will be using an abbreviated version
of the Cultural Assessment Tool (Hagberg& Heifetz 1999), an objective and
quantitative survey that measures an employee's perceptions of their organization's
106
1

culture. These include dimensions such as office politics, initiative, role ambiguity,
trust, sense of belonging, diversity and teamwork.
Hagbergs, cultural assessment tool has been used extensively in the study of
organizational culture. It successfully characterizes the working environment according
to employee perceptions and situational responses. An abbreviated version of the
Cultural Assessment tool is contained within Section V of the study instrument and is
seen in Figure 3.6.
SECTIONV
1. I am clear about who does what In my organization. . . a Strongly Disagree. a Disagree a Agree a Strongly Agree
3. There is high cooperation between work groups in my organization. 0 Strongly Disagree O Disagree O Agree O Strongly Agree 5. Employees in my organization automatically take the initiative to complete tasks arid duties: o Strongly Disagree a Disagree a Agree a Strongly Agree 7. Routine information flow is well coordinated in my work place. 0 Strongly Disagree O Disagree O Agree O Strongly Agree 9. Our group/unit is refreshingly free of politics. a StrQOgly C,isagr~ a Disagr.(:18 Cl Agree o Strongly Agree
' ·<,,,)·,./ ,·.i·., ', . , "',·i","
11. The information I need to my perform my job is readily available. 0 Strongly Disagree O Disagree O Agree O Strongly Agree 13. Equipment in my organization i~ state of the art. a Strongly Disagree O Disagree Cl Agree Cl Strongly Agree · 15. The organization fosters a strong sense of loyalty and belonging. 0 Strongly Disagree O Disagree O Agree O Strongly Agree 17. Equipment in my organization is well maintained. "·. ·· Q Strongly Disagree Cl Disagree O Agree O Strongly Agret:l
19. Employees collaborate to improve written policies and procedures. 0 Strongly Disagree O Disagree O Agree O Strongly Agree
2. Employees in my organization have conflder,ice .in their leaders. . ·•·... · ... .. .· ..... Q Strongly Disagree Cl Disagree Q Agr~ Q Strongly Agree 4. Management values participation as a vehicle for producing better quality decisions. 0 Strongly Disagree O Disagree O Agree O Strongly Agree 6, lvlanag~ment seems to care only about production and · financial performance, not peciple. . / . a Strongly Disagree O Disagree Q Agree Cl Strongly Agree ·. 8. Leadership provides me with the information I need to be successful in my organization. 0 Strongly Disagree O Disagree O Agree O Strongly Agree 10. I work in an atmosphere where people freely provic!e .. in!ormatl<.m to tnostwho q~d it witl)Oul regard toarit:i(:IL ·ownership• issue. . '. . .·· .. · . . :, ' . . . / 0 Strongly Disagree, Cl Disagree · 0 Agree' 0 Strongly Agree 12. Everyone in my organization can participate in formulating specific goals and objectives. 0 Strongly Disagree O Disagree O Agree O Strongly Agree 14. The equipmentJ use is adequate to accomplish my. w:ork. Cl Strongly Disagree Q Disagree O Agree· Q Strongly Agree · · ·. 16. There is a high level of trust among employees. 0 Strongly Disagree O Disagree O Agree O Strongly Agree
18. I am asked to participate in establishing goals and , ob.jE3Ctives for myself. · · a Stro~ly Disagree O Disagree a Agree a Strongly Agree
20. My management team "walks their talk" relative to new initiatives. 0 Strongly Disagree O Disagree O Agree O Strongly Agree
Thank you for completing the above survey.
Figure 3.6: Section V, Hagberg's abbreviated Cultural Assessment Tool.
107

Hagberg's cultural assessment tool has been previously validated by Hagberg
and Heifetz (1999), but the abbreviated version customized for use within this study has
not been previously validated. For this reason the author measured the internal
consistency of scales used by calculating Cronbach's coefficient alpha for each
characteristic of organizational culture being assessed (see Table 4.1). After showing
adequate levels of internal consistency for each characteristic the author then completed
a confirmatory factor analysis to quantify the relationship that exists between
organizational culture and its underlying characteristics. A confirmatory factor analysis
tests the significance of a specific factor loading within a structural model. By doing so,
the researcher is able to quantify the relationship between a variable and it underlying
constructs. The Confirmatory factor approach examines whether or not the collected
data is consistent with a highly constrained hypothesized model (see Figure 4.1). The
results of these tests show that the abbreviated version of the Cultural Assessment Tool
used within this study to characterize the employees' perceptions of their organization's
culture has an acceptable level reliability and validity.
Data Management and Statistical Analyses
Data Management
Participants could return the questionnaire to the author either electronically or
by hard copy. Those who returned the questionnaire electronically utilized the
company's electronic mail system and hard copy questionnaires were returned by fax or
through the company's internal mail delivery system. This collection process, albeit
efficient could lead to multiple submissions of the same questionnaire. For example, an
employee may have sent a questionnaire by electronic mail to the author and then sent
the same questionnaire to the author by a fax. This would result in duplicate submissions
108

of the same questionnaire. To mitigate and prevent recording data from a single
questionnaire more than once a cursory assessment was conducted on the demographic
data. Questionnaires returned to the author with identical demographic data were
further assessed to ensure the survey was not a duplicate submission from the same
individual. This process identified four duplicate questionnaires. The duplicate
questionnaires were removed from the study and not included within the total number of
returned surveys.
Data from questionnaires submitted electronically was transferred to an Excel
database. This database used macros to compile the information into spreadsheets that
could be used by other statistical packages such at AMOS. Using macros to compile the
data should have resulted in fewer type one measurement errors than if the compilation
of the data was done by hand. The data from questionnaires submitted via inter-office
mail or by fax was entered into excel spreadsheets manually by the author. To ensure
the confidentiality of the questionnaires, all raw data was managed by the author. The
accuracy of the data entered manually was validated through two post hoc tests. First,
20% of the data was randomly selected from the Excel database and cross-referenced
against the information found on the actual questionnaire. This was done to inspect for
discrepant values. Second, all values were checked to determine if they fell within a
possible response range. This cursory analysis showed a data accuracy of greater than
99%.
As with most social science research based on the collection of data with the use
of questionnaires, incomplete or missing data is an almost inevitable occurrence.
Because incomplete data can seriously bias any conclusions that are drawn from an
assessment of the data, it must be addressed. The method chosen to handle the missing
data within this study is based on an approach that utilizes maximum likelihood
estimation and, thus is theoretically based.
Arbuckle (1996) describes the extent to which maximum likelihood estimation,
in the presence of incomplete data offers several important advantages over both listwise
109
and pairwise deletion processes. First, where the unobserved values are missing
completely at random, listwise and pairwise estimates are inefficient in how they handle
data and result in the loss of information from the reduced sample size. Maximum
likelihood estimation does not result in any loss of data. Second, where the unobserved
values are only missing at random, both listwise and pairwise estimates can be biased;
maximum likelihood estimates are asymptotically unbiased. Third, pairwise estimation,
in contrast with maximum likelihood estimation, is unable to yield standard error
estimates or to provide a valid method for testing hypothesis. Finally, when missing
values are non-ignorable, all procedures can yield biased results. However, when
compared with other options, maximum likelihood estimates will exhibit the least bias
analysis (Schafer, 1997).
In this study nine usable cases would have been eliminated from analyses under
list-wise deletion practice. However, six cases among the nine cases were saved using
the maximum likelihood technique. Of the 189 surveys returned, nine had incomplete
data. There are no clear guidelines regarding what constitutes a "large" amount of
incomplete data, although Kline (1998) suggests that it should probably constitute less
than 10% of the data. Using 10% as a guideline, this study was well within the
acceptable range for incomplete data having less than nine surveys returned with
incomplete data. The maximum likelihood estimation for missing parameters was
conducted using Analysis of Momentum Structure (AMOS).
The concept of likelihood is closely related to the more common concept of
probability. We speak about the probability or likelihood of observing events. This
concept forms the basis of the maximum likelihood estimation (MLE) for missing data.
MLE works by estimating a likelihood function for each individual based on the
variables that are present so that all the available data are used. For instance, the MLE of
a parameter is the value of the parameter that is most likely to have resulted in the
observed data. When data are missing, the AMOS program factors the likelihood
function. This function is computed separately for those cases with complete data on
110
--
some variables and those with complete data on all variables. These two likelihood's are
then maximized together to estimate a value for the missing data.
Statistical Analysis
Demographic Effects
Analysis of Variance (ANOVA) was used to assess the effects of the
demographic variables, personality, and home-work interface on the latent constructs.
The critical value used in this analysis was 0.05. Any demographic effect associated
with a critical value of less than 0.05 was said to have a significant effect on the latent
variable.
Analysis of Measures
The study began with the development of a conceptual and theoretical model
showing linkages between the endogenous constructs and their measurable variables. In
Chapters II and III of this study, the supporting relevant theories and discussion of the
measurement variables associated with each of the constructs was provided in
conjunction with a review and a description of the methodology used to answer each of
the five research questions being investigated.
How the constructs are interrelated with each other was defined by a
hypothetical framework for occupational work stress that included both main and
interaction effects of organizational culture on occupational stress. Organizational
culture was operationalized to identify what characteristic of the organization's culture
had the greatest influence on the proposed work stress framework. In other words, each
characteristic used to define the culture of the organization was assessed to determine
111
the magnitude of its influence within the work stress framework and how the
characteristic interacted within the work stress framework, either directly by influencing
the psychosomatic outcomes of stress or indirectly by modifying the individuals
perception of the stressful event. Subsequently, it was determined that Structural
Equation Modeling was the only statistical tool available that could simultaneously
assess the main and interaction effects of multiple constructs within the hypothesized
workstress framework.
In structural equation modeling (SEM), the development of the hypothetical
model depicting the linkages between the latent constructs and their empirical observed
indicators is considered as a measurement model, while the theoretical relationships
between or among the constructs is referred to as a structural model (Byrne, 1998;
Joreskog, 1993; Bollen, 1989). Both models are key to assessing how each of the
constructs influences the work stress framework.
Measurement Model
The measurement model specifies the patterns of how the observed indicators
load on the constructs, and also provides the measurement properties of how much the
observed indicators are reliable (reliability) and valid (validity). A structural model on
the other hand specifies which of the construct(s) directly or indirectly influences or
changes the values of other constructs in the model (Byrne, 1998; Maruyama, 1998).
Before testing the structural models used in the analysis of the hypothesis, the
measurement models have to be tested in order to ensure that scales used in the study
behave as they are intended. Overall model fit in structural equation modeling is
sensitive to the measurement model as well as the structural model (Bollen, 1989) and
the researcher is able to increase the validity of the conclusions drawn from the SEM if
it is shown that the scales behave as intended.
Reliability is a fundamental issue in any measurement scale. Scale reliability is
112

considered as the proportion of variance attributed to the true score of the latent
construct (De Vellis, 1991 ). It is usually measured by methods that test the internal
consistency of the scale. Values close to one indicate high reliability by characterizing
the homogeneity of the items that make up the measurement scale. The meaning of
internal consistency is the extent that its items are inter-correlated. Thus, high inter-item
correlation provides evidence that the items of a scale have a strong relationship to the
latent construct and is potentially measuring the same thing. In this study, Cronbach's
coefficient alpha is used to assess the internal consistency of each measurement scale.
By calculating Cronbach's alpha along with the item-to-total correlation for each
item examined, the overall reliability of the measurement scale can be determined. It is
generally recommended that if a measurement scale displays a Cronabach's coefficient
above 0.70 it is considered acceptable as an internally consistent scale. If the scale is
shown to have a coefficient alpha below 0.70, the scale can still be used but it should be
examined for any sources of measurement error such as inadequate sampling of items,
administration errors, situational factors, sample characteristics, number of items, and
theoretical errors that may have occurred in the development of the measurement scale
(Gable & Wolf, 1993).
Cronbach's alpha was calculated for each of the latent constructs in order to
assess the reliability of the scales used. All of the scales included in the questionnaire
showed adequate levels of internal consistency reliability. The internal reliability for the
measures ranged from a high of 0.933 for coworker support to a low of 0.619 for role
ambiguity. Table 3. 1 details how each question from the Questionnaire was used to
assess the latent constructs being investigated. The first column identifies which
construct was being assessed, the second column identifies the corresponding variables
used to quantify the construct, and the third column outlines the formula used to assess
the construct along with the weighting used for each of the questions. The Sections
noted within Table 3. 1 correspond to the five Sections within the Questionnaire.
113
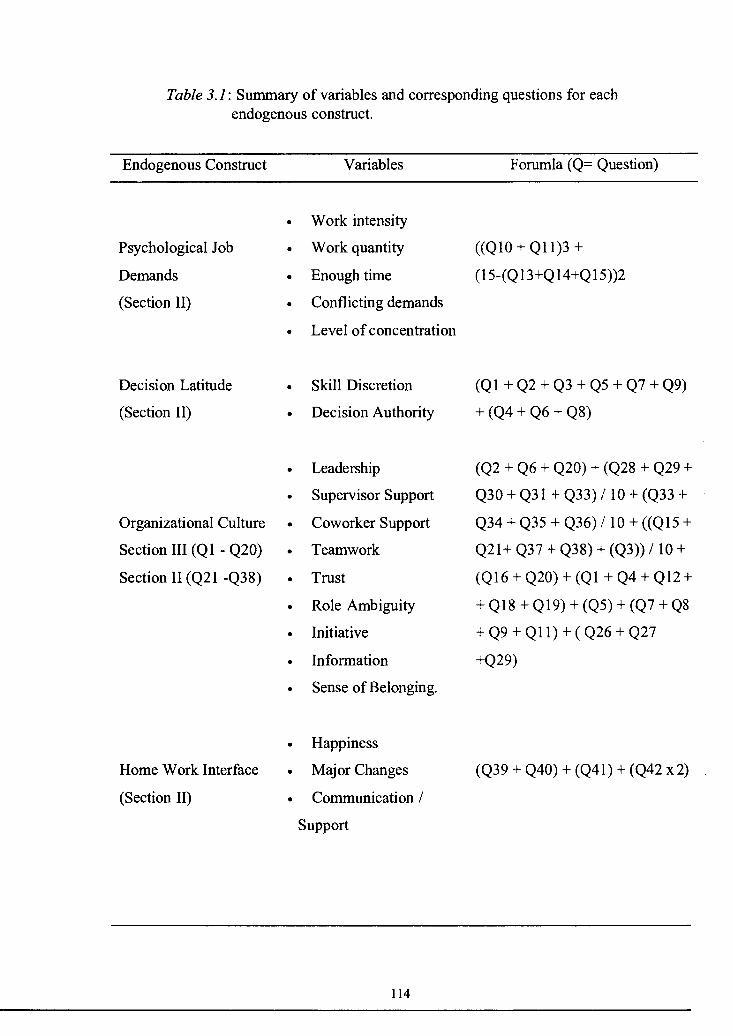
Table 3.1: Summary of variables and corresponding questions for each endogenous construct.
Endogenous Construct
Psychological Job
Demands
(Section II)
Decision Latitude
(Section II)
Organizational Culture
Section III (Q 1 - Q20)
Section II (Q21 -Q38)
Home Work Interface
(Section II)
Variables
• Work intensity
• Work quantity
• Enough time
• Conflicting demands
• Level of concentration
• Skill Discretion
• Decision Authority
• Leadership
• Supervisor Support
• Coworker Support
• Teamwork
• Trust
• Role Ambiguity
• Initiative
• Information
• Sense of Belonging .
. Happiness
• Major Changes
• Communication /
Support
114
Forumla (Q= Question)
((QlO + Ql 1)3 +
(15-(Q l 3+Q l 4+Q 15))2
ro1+Q2+Q3+Qs+Q7+Q~
+ (Q4 + Q6 + Q8)
(Q2 + Q6 + Q20) + (Q28 + Q29 +
Q30 + Q31 + Q33) / 10 + (Q33 +
Q34 + Q35 + Q36) I 10 + ((Q15 +
Q21+ Q37 + Q38) + (Q3)) / 10 +
(Q16 + Q20) + (Ql + Q4 + Ql2 +
+ Q18 + Q19) + (Q5) + (Q7 + Q8
+ Q9 + Q 11) + ( Q26 + Q27
+Q29)
(Q39 + Q40) + (Q4]) + (Q42 X 2)
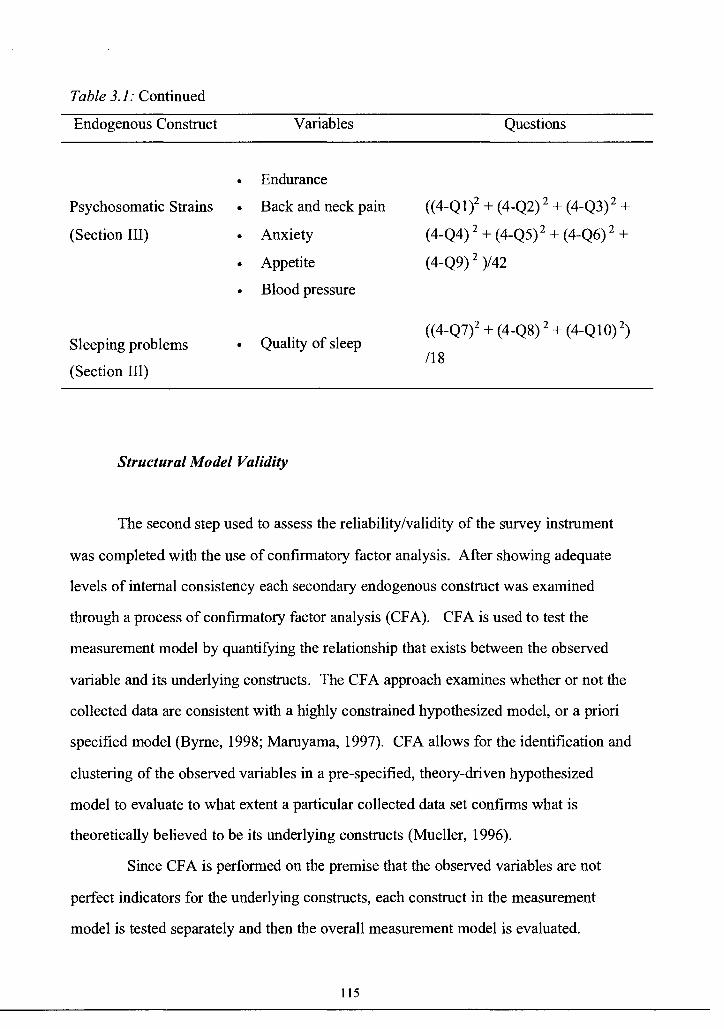
Table 3.1: Continued
Endogenous Construct Variables Questions
• Endurance
Psychosomatic Strains • Back and neck pain ((4-Q1)2 + (4-Q2) 2 + (4-Q3) 2 +
(Section III) • Anxiety (4-Q4) 2 + (4-Q5) 2 + (4-Q6) 2 +
• Appetite (4-Q9) 2 )/42
• Blood pressure
Sleeping problems Quality of sleep ((4-Q7)2 + (4-Q8) 2 + (4-QlO) 2)
• /18
(Section III)
Structural Model Validity
The second step used to assess the reliability/validity of the survey instrument
was completed with the use of confirmatory factor analysis. After showing adequate
levels of internal consistency each secondary endogenous construct was examined
through a process of confirmatory factor analysis (CF A). CF A is used to test the
measurement model by quantifying the relationship that exists between the observed
variable and its underlying constructs. The CF A approach examines whether or not the
collected data are consistent with a highly constrained hypothesized model, or a priori
specified model (Byrne, 1998; Maruyama, 1997). CF A allows for the identification and
clustering of the observed variables in a pre-specified, theory-driven hypothesized
model to evaluate to what extent a particular collected data set confirms what is
theoretically believed to be its underlying constructs (Mueller, 1996).
Since CF A is performed on the premise that the observed variables are not
perfect indicators for the underlying constructs, each construct in the measurement
model is tested separately and then the overall measurement model is evaluated.
115
Demographics were excluded from factor analysis because factor analysis is not
possible for objective measures or single-item measures. Based on standardized
residuals between manifest variables and parameter estimates, the least reliable items
were screened. In this procedure, items that are not loaded well on any latent variables
can be excluded from inclusion in the model to increase the fit of the model. Once the
assessment of the measurement model is completed the researcher is then able to test the
hypothesized relationships among the variables with the use of structural equation
modeling (SEM).
Structural Equation Modeling
During the process of structural equation modeling, once the necessary
information and requirements of the full structural model are derived, the exogenous
(similar to independent) and endogenous (similar to dependent) constructs can be
defined. Accordingly, all of the constructs fall into one of these two categories and a
resulting model can be developed to assess the relationships between the constructs with
the use of path diagrams. It is SEM's ability to assess the relationship between each of
the constructs used within the model, which is its greatest strength.
In the model, an exogenous construct can be causally related only to an
endogenous construct. In other words, SEM estimates a series of separate, but
interdependent, multiple regression equations simultaneously by specifying the
structural model (Hair, Anderson, Tatham & Black, 1995). Thus, it is a very useful
technique when one dependent variable becomes an independent variable in subsequent
relationships. For example, organizational culture is treated initially as a dependent
variable, and in turn becomes an independent variable relating to its influence on
psychosomatic strains.
SEM also differs from other multivariate techniques in that it uses only the
variance/covariance or correlation matrix as its input data. The focus of SEM is not on
116
individual observations, but on the pattern of relationships across participants (Hair,
Anderson, Tatham & Black, 1995), which is why the correlation or covariance matrix is
used as input data instead of individual data points. For this reason, SEM a
comprehensive statistical approach to testing hypotheses about relations, is the choice of
statistical analysis among behavioural science researchers. Another useful tool of SEM
is its ability to represent the relationships between observed and latent variables by path
diagrams. This drastically increases the functionality of the statistical program and aids
in the interpretation of the data.
Path diagrams portray relationships between constructs in SEM allowing the
researcher to present a visual portrayal of the predictive relationships as well as the
associative relationships. In the structural model proposed in this study, five theoretical
constructs are discussed in terms of not only their posited relationships with the
observed indicators, but also structural relationships among the constructs. Those
include organizational culture, decision latitude, job demands, psychosomatic strain, and
sleeping problems.
Of these constructs, decision latitude and organizational culture are second-order
constructs and job demands, psychosomatic strains, and sleeping problems are first
order constructs. "Second-order constructs are used in situations where the meaning of
a conceptual entity cannot be captured through individual observed variables, but must
be captured through two or more latent constructs" (Anderson & Gerbing, 1988, p. 418).
In this study, the second-order latent constructs of decision latitude and organizational
culture are defined by a number of first-order latent constructs, and the first order latent
constructs are defined by several manifest variables. This pyramidal structural equation
results in a base of 14 first order latent constructs and two-second order latent constructs
in the development of a model to describe the work stress framework.
As noted earlier, a minimum recommended sample level for the estimation of
SEM is ten observations for each estimated parameter (Hair, Anderson, Tatham &
Black, 1995). Since a total of 16 latent constructs were estimated in the study (14 first
117
order and 2 second order constructs), the sample size for this study should exceed 160.
The sample size of this study was 186; therefore the sample size of the study should
have met the minimum recommended level. This would have been the case except
based on the results of the influence of personality on the reported number of
psychosomatic strains, the study population had to be divided into two groups and a
multi-group analysis was completed.
An Analysis of Variance (AN OVA) was performed on each of the extraneous
exogenic variables measured in this study. This included demographic information such
as age and education along with other measures such as personality and home-work
interface. Personality demonstrated a statistically significant variance when assessed
against the reported levels of psychosomatic strains. Individuals that purported a Type
A personality had responses for psychosomatic strain and certain aspects of the
organization's culture that were significantly different than test subjects displaying a
Type B personality. As a result, the test subjects were divided into two groups (Type A
and Type B personalities) and a multi-group analysis was performed using AMOS.
Multi-group analysis is used to assess the fit of a specific model to two sets of data at
once. AMOS is capable of modeling data from multiple groups simultaneously and was
used to conduct multi-group structural equation models within this study.
As a result of dividing up the study population into two groups the sample size
of the population was effectively reduced by half but the number of latent constructs
assessed in the model remained the same. As a result, the power issue could have
become a serious problem because a large number of constructs were assessed using
what was essentially a relatively small sample. Thus, the sample size needed to be
enlarged or the number of parameters needed to be decreased to maintain eligible power.
To effectively study the work-stress framework the number of constructs could not be
reduced and it was not possible to increase the sample size of the population without the
introduction of additional extraneous variables. To overcome this problem the study
118
., '
utilized parceled data, a statistical method often used when a researcher needs to reduce
the number of parameters assessed in a model, but the sample size cannot be changed.
Parceled Data
The measurement model for the test of personality was tested with parcel unit
data. Ideally, the best approach to model testing is to use item-unit data but as discussed
above this was not an acceptable option. That said, using parcel-unit data is a popular
alternative in relation to the power issue when the sample size is small and the number
of parameters to be identified is large (Bandalos, 1997). The use of parcels in structural
equation modeling has been advocated on several grounds. In addition to maintaining
the statistical power of the model in lower sample sizes, it is said to be more reliable
than individual items and to have results that are more definitive (Kishton & Widaman,
1994). Another commonly offered advantage for the use of item parceling is that
parcels have distributions that are more continuous and normally distributed than those
of individual items, and thus will conform more closely to the assumption of theory
based estimation methods such as maximum likelihood. Marsh (1988) further states that
the advantages of parceling include parsimony, including more normally distributed
indicators, less idiosyncratic indicator variance, less unique variance, and as mentioned
earlier the ability to use smaller sample sizes. There is however disadvantages to using
parceled data. Marsh (1988) lists the following disadvantages of parceling: information
about the individual items will be lost, items being parceled must be reasonably uni
dimensional, and parameter estimates and factor scores derived from parceled analyses
will be dependent on the particular items parceled together. In this model, the second
order constructs are parceled as first-order constructs thereby reducing the number of
parameters within the model while maintaining its statistical power.
119
Model Fit
Once the model is specified, its plausibility is tested based on sample data that
comprise all observed variables in the model. The primary task in this model testing
procedure is to determine the goodness-of-fit between the hypothesized model and the
sample data. The structure of the hypothesized model is imposed on the sample data,
and then tested as to how well the observed data fit this restricted structure. There
should be a discrepancy between the observed data and the hypothesized model, because
it is highly unlikely that a perfect fit will exist between the two. This discrepancy is
termed the residual error and is an important factor in determining the plausibility of the
model.
"The model-fitting process can be summarized as:
Data = Model + Residual
Where Data represents the score measurements related to the observed
variables as derived from individuals comprising the sample. Model represents
the hypothesized structure linking the observed variables to the latent variables
and the Residual represents the discrepancy between the hypothesized model
and the observed data" (Byrne, 1998, p. 7).
If goodness-of-fit is adequate, it can be said that the model supports the
plausibility of the postulated relations among variables, whereas the tenability of such
relations is rejected if the goodness-of-fit is inadequate (Byrne, 1998). Generally,
models that have fit indices close to one are considered acceptable.
120
Research Question Methodology
Research Question I: In what ways, if any, do the endogenous constructs
analyzed in this study differ according to the demographic characteristics of the
population.
To answer this question a one-way analysis of variance is performed that
compares the mean squares for the various demographic features of the study population
against the mean squares of each of the endogenous constructs. An alpha of 0.05 is
utilized to determine it the variance assessed is significant or not. If the ANOV A of the
endogenous constructs shows a 'p' value of less than 0.05 it implies that the means
between the variables being assessed differ more than would be expected by chance
alone. In this case, 'p' values less that 0.05 suggest that the demographic variable has a
statistically significant impact on the endogenous construct being assessed.
If the ANOV A showed a significant p-value then the means of the two variables
being assessed were examined further in order to determine the nature of the significant
effect. This was done utilizing "post-hoc tests". The effects are considered to be non
significant, if the 'p' value is calculated to be more than 0.05, and as a result, no further
analysis of the relationship was conducted.
Research Question 2: In what ways, if any, do the endogenous constructs
analyzed in this study differ according to the personality of each of its
participants.
To answer this question a one-way analysis of variance was performed on the
mean squares of personality types A and B against the mean squares of each of the
endogenous constructs. As with Research Question I, an alpha of 0.05 was utilized to
determine it the variance assessed was significant or not.
121
Research Question 3: In what ways, if any, do the endogenous constructs
analyzed in this study differ according to the non-work stressors experienced by
each of its participants.
To answer this question a one-way analysis of variance was again performed. In
this analysis the entire sample was divided into two groups: low non-work stress and
high non-work stress. The mean score of the summed non-work stressors was used as a
dividing point to classify each of the groups. As with Research Questions 1 & 2, an
alpha of 0.05 was utilized to determine it the variance between the two groups was
significant or not.
Research Question 4: How does organizational culture, as perceived by the
worker affect the work stress framework, psychosomatic strains, and quality of
sleep?
To test this research question, the study employed structural equation modeling
(SEM) with the use of the statistical program AMOS version 5.0 to analyze the
relationships that existed between each of the variables in the work-stress framework.
Because personality was shown to have a statistically significant effect on the number of
reported psychosomatic strains and certain exogenous constructs of Organizational
Culture the study participants were divided into two groups. Group one consisted of
those individuals possessing a Type A personality and the other group consisted of
individuals having a Type B personality. These two groups were then assessed with
multi-group analysis using Structural Equation Model to determine the influence of
organizational culture within the work stress framework. The Structural Equation
Model, developed by the author, used to assess this relationship is shown in the path
diagram in Figure 3. 7.
122
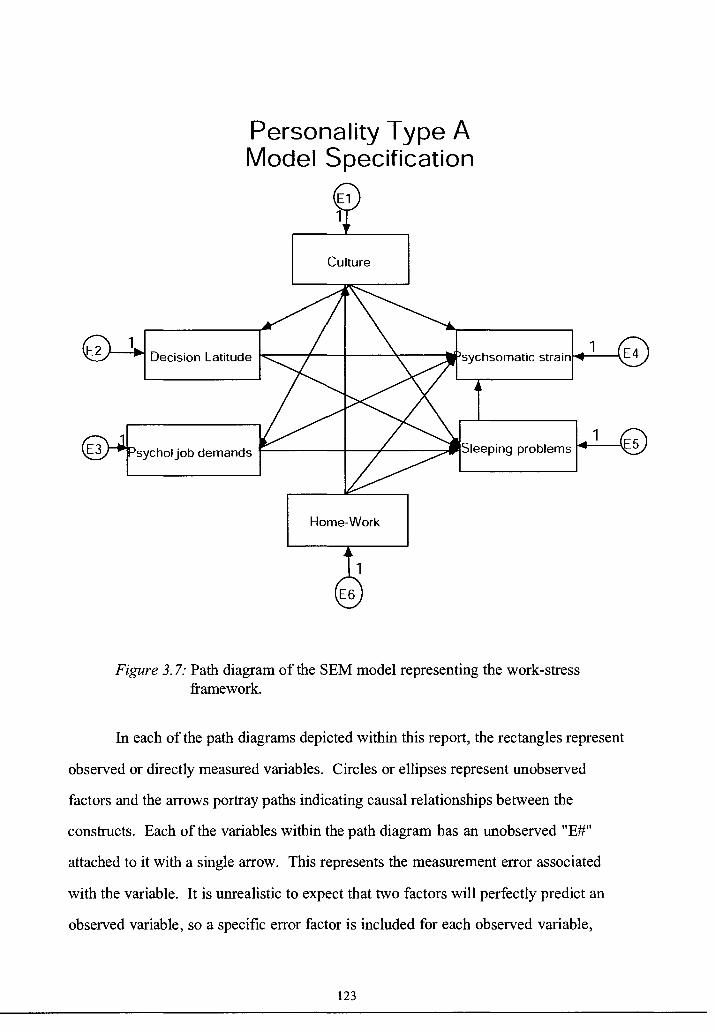
Personality Type A Model Specification
Culture
1 --...... E4
1 Psycholjob demands f------1-----,~--~..iSleeping problems -----u:.S
Home-Work
Figure 3. 7: Path diagram of the SEM model representing the work-stress framework.
In each of the path diagrams depicted within this report, the rectangles represent
observed or directly measured variables. Circles or ellipses represent unobserved
factors and the arrows portray paths indicating causal relationships between the
constructs. Each of the variables within the path diagram has an unobserved "E#"
attached to it with a single arrow. This represents the measurement error associated
with the variable. It is unrealistic to expect that two factors will perfectly predict an
observed variable, so a specific error factor is included for each observed variable,
123
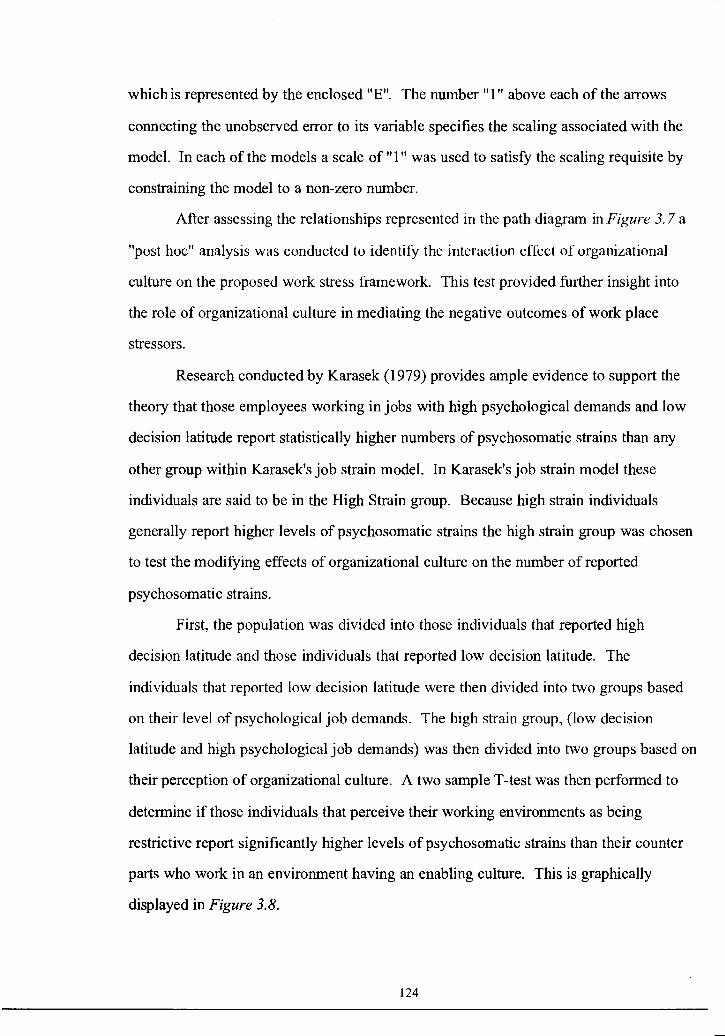
which is represented by the enclosed "E". The number "l" above each of the arrows
connecting the unobserved error to its variable specifies the scaling associated with the
model. In each of the models a scale of "1" was used to satisfy the scaling requisite by
constraining the model to a non-zero number.
After assessing the relationships represented in the path diagram in Figure 3. 7 a
"post hoc" analysis was conducted to identify the interaction effect of organizational
culture on the proposed work stress framework. This test provided further insight into
the role of organizational culture in mediating the negative outcomes of work place
stressors.
Research conducted by Karasek (1979) provides ample evidence to support the
theory that those employees working in jobs with high psychological demands and low
decision latitude report statistically higher numbers of psychosomatic strains than any
other group within Karasek's job strain model. In Karasek's job strain model these
individuals are said to be in the High Strain group. Because high strain individuals
generally report higher levels of psychosomatic strains the high strain group was chosen
to test the modifying effects of organizational culture on the number of reported
psychosomatic strains.
First, the population was divided into those individuals that reported high
decision latitude and those individuals that reported low decision latitude. The
individuals that reported low decision latitude were then divided into two groups based
on their level of psychological job demands. The high strain group, (low decision
latitude and high psychological job demands) was then divided into two groups based on
their perception of organizational culture. A two sample T-test was then performed to
determine if those individuals that perceive their working environments as being
restrictive report significantly higher levels of psychosomatic strains than their counter
parts who work in an environment having an enabling culture. This is graphically
displayed in Figure 3.8.
124

Entire Population Sample
Mean 72.29032 Stand De" 0.698991
High Decision Latitude
Low Decision Latitude
Median 72
Mean 34.25269 Stand Dev 0.450552
Low Psychological Job Demands
Median 34
Mean 35.25785 Stand De" 0.984383 Median 36
High Psychological Job
Demands
Enabling Culture
Restrictive Culture
t-Test: Two-Sample Assuming Unequal Variances
Figure 3. 8: Subset of the population used to assess the modifying effects of organizational culture on the work stress framework.
In all cases, the median score of the population was used as a dividing point to
classify each of the groups. The median score has been frequently used to distinguish
between two groups in multi-group analysis when the median value is not far from the
mean value. The median value was appropriate to use in this study because in each of
the cases the median value closely matched the mean value of the population.
According to Karasek (1979), high strain groups are characterized by low
decision latitude and high psychological job demands. First, those individuals that
reported low decision latitude were identified (below a median score of 72). This group
was then divided into two separate groups based on their level of psychological job
demands. Of this grouping, those that reported high psychological job demands ( above
a median value of 34) were identified as the high strain group.
125
The high strain group of participants was then grouped according to how they
characterized the organizational culture of their work group. Once again the median
value of the organizational culture scale (36) was used to classify individuals as either
working in an organization with an engaged culture or a restrictive culture. It is
hypothesized that high strain individuals working within an organization displaying the
characteristics of an engaged culture would report fewer psychosomatic strains than
those high strain individuals exposed to a work environment characteristic of a
restrictive culture. Multi-group analysis and associated t-tests were then utilized to test
this hypothesis. Multi-group analysis has been successfully used in the past to estimate
moderating effects of certain factors or treatments on path relations between variables
(Joreskog & Sorbom, 1996).
Research Question 5: What characteristics of organizational culture are closely
related to the job stress framework, psychosomatic strains, and sleeping
problems?
The last measurement model was developed to answer the question posed above.
A path diagram was developed that included all the primary endogenous constructs of
organizational culture to determine which component of an organization's culture shows
the greatest influence within the work-stress framework. The model (Figure 4.3) was
then assessed with the use of Structural Equation Modeling using AMOS 5.0. This
analysis provided the factor loading patterns for each aspect of an organization's culture
within the work-stress framework. By determining which characteristic of an
organization's culture loads more heavily on the work-stress framework, health care
professionals will be able to target specific management strategies that can be used to
lower employee stress levels.
126

upervisor Suppor
Initiative
Figure 3.9: SEMModel displaying the pathways associated with each aspect of an organization's culture within the work-stress framework.
127
Interpretation of Results
All research questions were interpreted in terms of two aspects: overall model fit
and parameter estimates. The overall fit index generally indicated the degree of fit the
data has to the hypothesized structural and measurement models. The fit index
however, does not specifically test the data to the hypothesized path relationships. The
estimates for the parameters can however answer whether the hypothesized path
relationships within the model were satisfied. Each parameter estimate is examined
with the use of a two-tail test. Standardized estimates are generated and the greater the
estimate the stronger the relationship between the two latent constructs. By using the
model fit index along with the parameter estimates the researcher is able to provide an
analysis of the data in an attempt to answer the research question under investigation.
When measurement and structural models are evaluated, three types of measures
use to assess Model fit are generally utilized: Absolute Fit Measures (AFM),
Incremental Fit Measures (IFM), and Parsimonious Fit Measures (PFM) (Byrne, 1998;
Hair, Anderson, Tatham & Black, 1998; Maruyama, 1998; Hu & Bentler, 1995). An
Absolute Fit Measure is used to directly evaluate how well the theoretical model fits the
sample data. The Incremental Fit Measure assesses the proportionate fit by comparing a
target model with a more restricted, nested baseline model. Lastly, a Parsimonious Fit
Measure is used to diagnose whether model fit has been achieved by over-fitting the
data with too many coefficients.
Four of the most commonly used Absolute Fit Measures in the evaluation of
models are the chi-square test, the non-centrality parameter (NCP), the root mean square
residual (RMSR), and the root mean square error of approximation (RMSEA). The chi
square statistic is used to test the existence of relationships between the rows and
columns in a contingency table. Generally, figures obtained below 0.05 indicate that the
rows and columns within the contingency table are dependent. The chi-square statistic
128

is however very sensitive to sample size and the complexity of the model. For this
reason, the chi-square statistic is often related to the degrees of freedom. A low chi
square statistic relative to the degrees of freedom indicates that there is a difference
between the observed and estimated covariance matrices with a statistically significant
value (p < 0.05). Because the Chi-square is heavily influenced by the sample size
(Bollen & Long, 1993), other goodness-of-fit indices are suggested to help the model
evaluation (Joreskog & Sorbom, 1996; Bentler, 1990).
As another absolute fit index, the non-centrality parameter (NCP) shows the
results of another measure of the likelihood-ratio chi-square statistic that is less affected
by the sample size of the study group. This fit measure shows the average squared
Euculidean distances between the estimated model and the unrestricted model. Since
this fit index cannot be statistically tested, it is recommended to use this measure in
making comparisons between alternative models. The Goodness-of-fit index (GFI)
represents the overall degree of fit, indicating a non-statistical measure ranging in value
from zero (poor fit) to 1.0 (perfect fit). Thus, a higher score indicates a better fit.
The standardized root mean square residual (SRMR), represents the average
difference between the predicted and observed variances and covariance's in the model
(Hu & Bentler, 1999). The smaller the standardized RMR, the better the model fit.
Thus, when model fit is perfect, the SRMR is 0.
The root means square residual (RMSR) explains an average of the residuals
between observed and estimated input matrices and is calculated by the square root of
the mean of the squared residuals. The root mean square error of approximation
(RMS EA) represents a close approximation of fit relative to the degrees of freedom that
could be expected if the model is estimated in the population, not just from the sample
drawn for the estimation (Steiger, 1990). If the RMSEA point estimate is less than 0.05
and the lower and upper boundaries of confidence interval are less than the
recommended values of 0.05 and 0.08 respectively (Browne & Cudeck, 1993); and the
probability value associated with this test of close fit is greater than 0.50 (Joreskog &
129

Sorbom, 1996), it can be said that the degree of approximation in the population is very
small and the model fits the data well. In these cases, the model is considered
acceptable.
As the second class of measures provided by AMOS, the incremental fit
measures can be evaluated in order to compare the proposed model to some baseline
model. The common examples of group of this fit indexes are the adjusted goodness-of
fit index (AGFI), the Tucker-Lewis index (TLI), the normed fit index (NFI), the relative
fit index (RFI), and the comparative fit index (CFI).
The AGFI as an extension of the GFI is adjusted by the ratio of degrees of
freedom for the proposed model to the degrees of freedom for the null model. Using
this statistic, it is recommended that a value greater than or equal to 0.95 is an
acceptable level for a good fit. The Tucker-Lewis index (TLI; Tucker & Lewis, 1973)
also known as the Non-normed fit index (NNFI), is used for evaluating factor analysis
and can also be used for comparisons between alternative models by substituting the
alternative model for the null model. The TLI appropriately penalizes model
complexity and appropriately rewards model parsimony.
Hu and Bentler ( 1999) suggest that:
" TLI is relatively: (1) insensitive to sample size, (2) sensitive to model
misspecifications, (3) insensitive to violations of assumptions of multivariate
normality, and (4) relatively insensitive to estimation methods" (Hu & Bentler,
1999, p. 17).
They also recommend that a TLI value greater than or equal to 0.95 is an acceptable
level for a good fitting model.
The NFI, RFI, and CFI are also used for a relative comparison of the proposed
model to the null model or independent model, which ranges from zero (poor fit or no fit
at all) to 1.0 (perfect fit). It is suggested that a good fitting model will obtain a value
130
greater to or equal to 0.95 for all of these statistical functions. In general, larger values
indicate higher levels of goodness-of-fit.
As the third class of measure, the Parsimonious Fit Measures include the
parsimonious normed fit index (PNFI) and parsimonious goodness-of-fit index (PGFI).
These measures were used to evaluate whether model fit has been obtained by "over
fitting" the data with too many coefficients. The PNFI explains the number of degrees of
freedom used to achieve a level of fit. Higher values of the PNFI are better. The PGFI
takes into account the complexity of the hypothesized model in the assessment of the
overall fit. Typically, a PGFI value larger than 0.50 indicates that the model has an
acceptable fit (Byrne, 1998).
131
Chapter III Summary
This chapter has outlined the methodology used to answer each of the research
questions posed by the author. A description of the population was then presented along
with a the measurement instruments and a summary of how the data was collected. A
description of the data preparation, statistical techniques, and data analysis was also
presented.
132
CHAPTER IV
PRESENTATION AND ANALYSIS OF THE DATA
Introduction
In this chapter the author reports the findings and the results of the surveys used
in the study. The first section addresses the validation of the measurement model,
followed by a summary of the participants' demographic and occupational
characteristics in the second section. The third through the sixth sections summarize the
findings of the data used to answer each of the five research questions. The third section
presents the findings of organizational culture at work in terms of the main effects on
the proposed work stress framework. The fourth section presents the interaction effects
of organizational culture at work on the proposed work stress framework. The last two
sections identify which characteristics of an organization's culture have the greatest
influence on the number of psychosomatic strains reported by participants.
Reliability and Validity of Measurement Models
The first step in the analysis of the measurement models is to assess the
reliability of the scales used to characterize each of the latent variables. Reliability is a
fundamental issue in any measurement scale. This is particularly true for psychosocial
research that uses summated scales to predict the constructs that are to be used in the
structural models. Since summated scales are an assembly of interrelated items
designed to measure underlying constructs, it is very important to know whether the
133
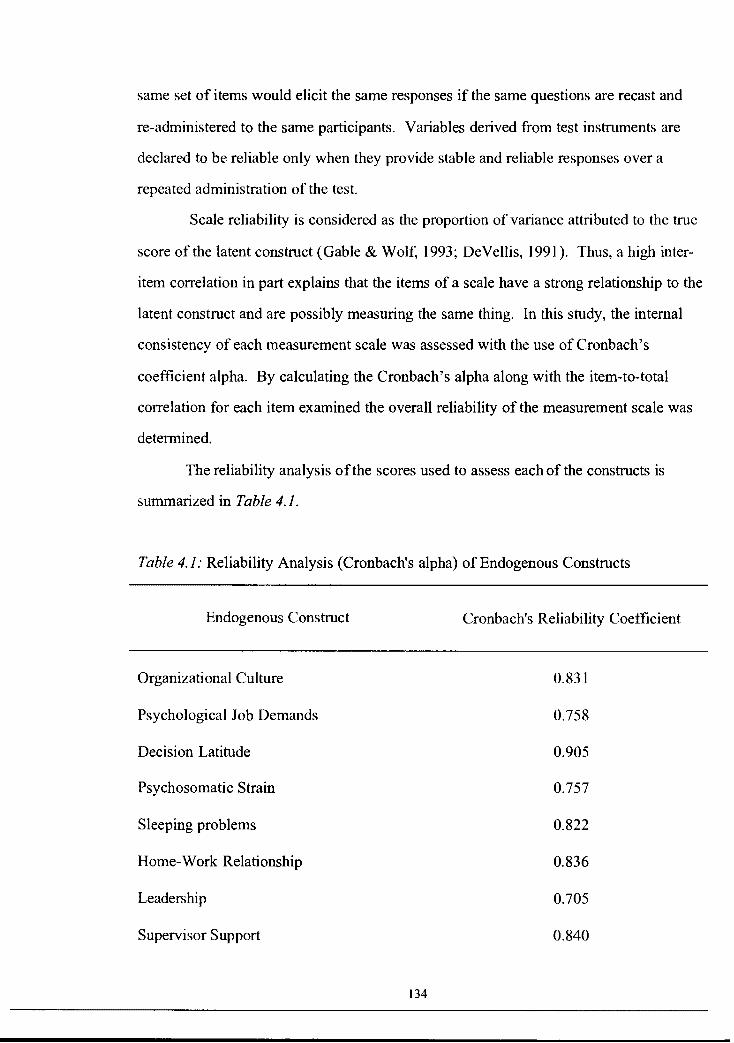
same set of items would elicit the same responses if the same questions are recast and
re-administered to the same participants. Variables derived from test instruments are
declared to be reliable only when they provide stable and reliable responses over a
repeated administration of the test.
Scale reliability is considered as the proportion of variance attributed to the true
score of the latent construct (Gable & Wolf, 1993; DeVellis, 1991). Thus, a high inter
item correlation in part explains that the items of a scale have a strong relationship to the
latent construct and are possibly measuring the same thing. In this study, the internal
consistency of each measurement scale was assessed with the use of Cronbach' s
coefficient alpha. By calculating the Cronbach's alpha along with the item-to-total
correlation for each item examined the overall reliability of the measurement scale was
determined.
The reliability analysis of the scores used to assess each of the constructs is
summarized in Table 4.1.
Table 4.1: Reliability Analysis (Cronbach's alpha) of Endogenous Constructs
Endogenous Construct Cronbach's Reliability Coefficient
Organizational Culture 0.831
Psychological Job Demands 0.758
Decision Latitude 0.905
Psychosomatic Strain 0.757
Sleeping problems 0.822
Home-Work Relationship 0.836
Leadership 0.705
Supervisor Support 0.840
134


Anderson, Tatham & Black, 1998). Construct validity deals with the adequacy of a
scale as a measure of a specific variable.
The purpose of a measurement model is to describe how well the observed
indicators serve as a measurement instrument for the latent variables. In other words,
the measurement model depicts the links between the latent variables and their observed
measures. Confirmatory Factor Analysis (CFA) was used to estimate the adequacy of
the measurement model for each of the constructs used to characterize an organization's
culture. The adequacy of the model fit was determined by several goodness of fit
statistics, including Bollen's Relative Fit Index (RFI), Goodness-of- fit Index (GFI), the
minimum discrepancy divided by the degrees of freedom (CMIN/DF), and the
Comparative Fit Index (CFI).
The primary task in the model-testing procedure is to determine the goodness-of
fit between the hypothesized model and the sample data. Chi-square has been the
traditional measure used to test the closeness of fit between the unrestricted sample
covariance and the restricted covariance matrix. Therefore, a nonsignificant chi-square
difference between the hypothesized model and the sample data indicates that the
hypothesized model is well fitted to the sample data. Bollen's (1989) RFI compares the
fit of an AMOS model to a baseline model. RFI values close to 1 indicate a very good
fit and in line with this, Byrne (2001) reports that a value above 0.95 in the RFI index
indicates superior fit with values above 0.70 being acceptable. The GFI is a measure of
the relative amount of variance and covariance in the sample that is jointly explained by
the sample. The GFI index ranges from zero to 1.00, with values close to 1.00 being
indicative of a good fit. The CFI compares the fit of an AMOS model to a baseline
model. CFI provides a measure of complete covariation in the data, and a value of close
to 1.0 indicates an acceptable fit to the data. (Byrne, 1998).
136
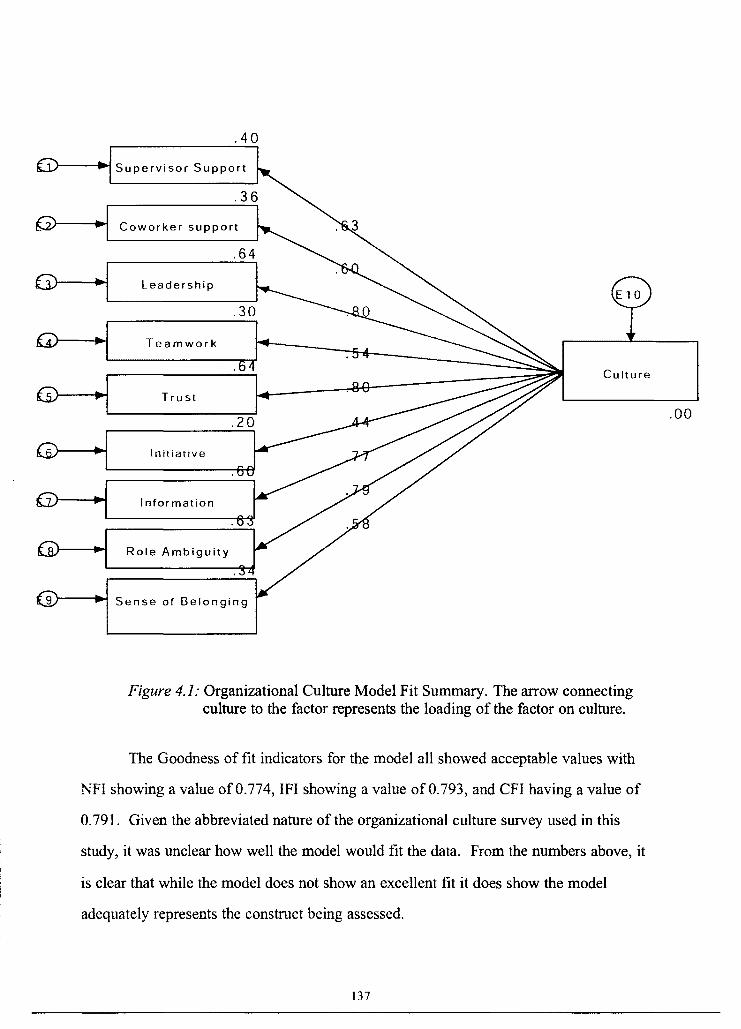
.40
Coworker support
Leadership
Teamwork
Culture
Trust
Initiative
Information
Role Ambiguity
91---- Sense of Belonging
Figure 4.1: Organizational Culture Model Fit Summary. The arrow connecting culture to the factor represents the loading of the factor on culture.
The Goodness of fit indicators for the model all showed acceptable values with
NFI showing a value of0.774, IFI showing a value of 0.793, and CFI having a value of
0. 791. Given the abbreviated nature of the organizational culture survey used in this
study, it was unclear how well the model would fit the data. From the numbers above, it
is clear that while the model does not show an excellent fit it does show the model
adequately represents the construct being assessed.
137
.00
Construct validity focuses on the extent to which data exhibit evidence of
convergent validity and discriminate validity. Convergent validity is the extent to which
different instruments concur in their measurement of the same construct. As noted
above, the scores from these different instruments should be moderately high (Byrne,
1998). Convergent validity is assessed by reviewing the t tests for the factor loadings
(Anderson & Gerbing, 1988).
Factor loading represents the correlation coefficients between the variables
(rows) and factors (columns). Analogous to Pearson's "r", the squared factor loading is
the percent of variance in that variable explained by the factor. To determine whether or
not a factor loads well on the variable is purely arbitrary, but common social science
practice uses a minimum cut-off of 0.3 or 0.35. For sample sized greater than 100
Norman and Streiner (1994) suggest an arbitrary rule-of-thumb in terms loadings as
"weak" if less than 0.4, "strong" if more than 0.6, and otherwise as "moderate". Other
researchers report that for a sample size of this number, with the stated objective of
obtaining a power level of 80% a factor loading of .40 is required (Hair, Anderson,
Tatham & Black, 1998). For this study, a factor loading is considered acceptable if it is
above 0.40 and high if it is above 0.60. It is important to note however that the
interpretation of the factor loading magnitude can vary a great deal. Whether or not a
factor loading is considered high is dependent on the context in which it is being used.
For instance, a factor loading of 0.45 might be considered "high" for dichotomous items
but for Likert scales a 0.6 might be required before the loading is considered "high".
Six of the nine factors used in this study to characterize the organization's culture
showed a high factor loading, ranging from 0.60 - 0.80. The other three factors:
Teamwork, Initiative, and Sense of Belonging all showed an acceptable factor loading
(see Figure 4.1).
138

Demographic Data
A total of 382 questionnaires were distributed. In total, 189 questionnaires were
returned, comprising a response rate of 49%. Three responses were eliminated due to
excessive missing data. Therefore, the sample size for testing the hypotheses was 186.
Table 4.2 presents the profile of the participants with regard to age, gender, education,
employment classification, job function, length of employment, marital status, ethnicity,
and personality.
Most of the participants were between the ages of 40 and 59 (66%) and had at
least a post-secondary diploma (84% ). Of this sample, 71 % were male and 29% were
female. With regard to length of employment, only 20% of the participants had worked
for the company for less than four years and 82% of the people reported to be either
married or living with a common law partner. The length of time an individual worked
with the company was a function of their anniversary date. Therefore, part years were
not included. For example, an employee that had worked for the company for three
years and ten months would have been classed as"< 4", not ">3".
Table 4.2: Demographic Characteristics of Participants (N=l86)
Characteristic Frequency %
Age
20-29 23 12
30-39 36 19
40-49 73 39
50-59 49 26
>60 5 3
Gender
Male 137 71
Female 49 29
139

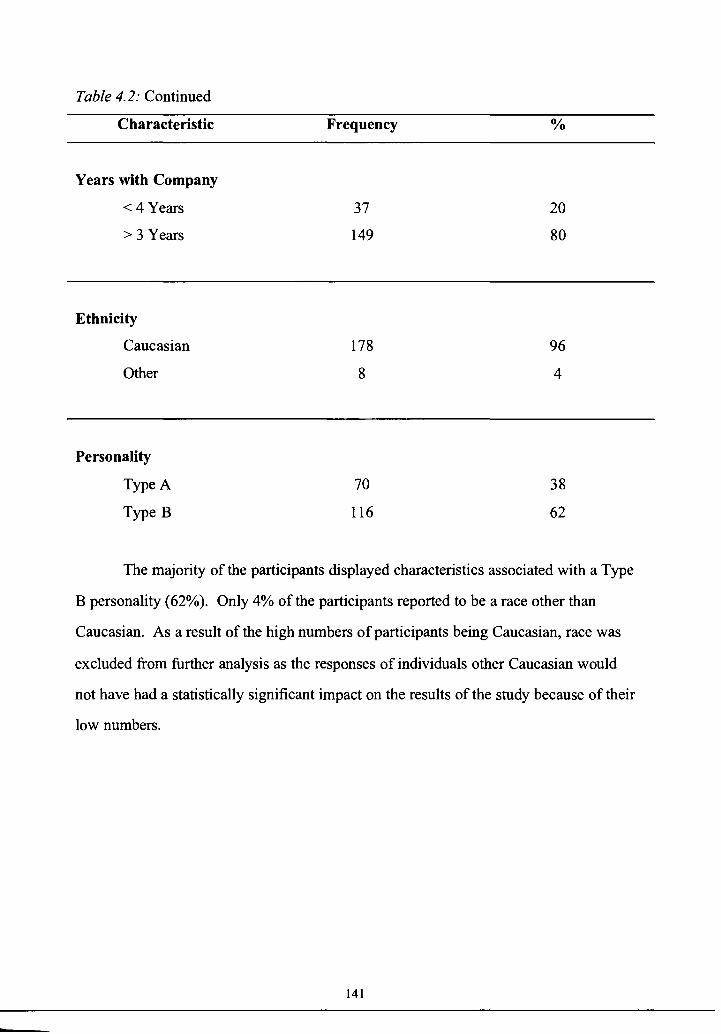
Table 4.2: Continued
Characteristic
Years with Company
< 4 Years
> 3 Years
Ethnicity
Caucasian
Other
Personality
Type A
Type B
Frequency
37
149
178
8
70
116
O/o
20
80
96
4
38
62
The majority of the participants displayed characteristics associated with a Type
B personality (62%). Only 4% of the participants reported to be a race other than
Caucasian. As a result of the high numbers of participants being Caucasian, race was
excluded from further analysis as the responses of individuals other Caucasian would
not have had a statistically significant impact on the results of the study because of their
low numbers.
141
Research Question 1: In what ways, if any, do the endogenous constructs
analyzed in this study differ according to the demographic characteristics of the
population.
To answer this question a one-way analysis of variance was conducted by
comparing the mean squares for the various demographic features of the study
population against the mean squares of each of the endogenous constructs. If the
effects were significant the means were then examined in order to determine the nature
of the effect. The results of each ANOVA are presented in the following Tables. The
Tables contain "SS" - Sum of Squares, "df' - Degrees of Freedom, "MS" - Mean Square,
"F" - F-Ration, and "P-value" - Probability Significance.
The value of concern when assessing whether or not a particular variable has a
statistically significant effect on the responses of the participants is the P-value. If the
P-value is less than the alpha, then the effect is said to be significant. The alpha, or
critical value, used in this analysis was 0.05. In other words, a P-Value ofless than 0.05
implies that the means differ more than would be expected by chance alone. Using the
P-value to predict differences must however be used with caution and further testing
must be done to examine the data more closely.
" If the sample is small, then the X 2 test will show that the data are not
significantly different from quite a wide range of very different theories, while if
the sample is large, the X 2 test will show that the data are significantly different
from those expected in a given theory even the difference may be so very slight
as to be negligible or unimportant on other criteria." (Gulliksen & Tukey, 1958,
p. 103)
A post-hoc analysis was performed on any variables that displayed an alpha less
than 0.05 to further assess the nature of the significance. In the post-hoc analysis the
142
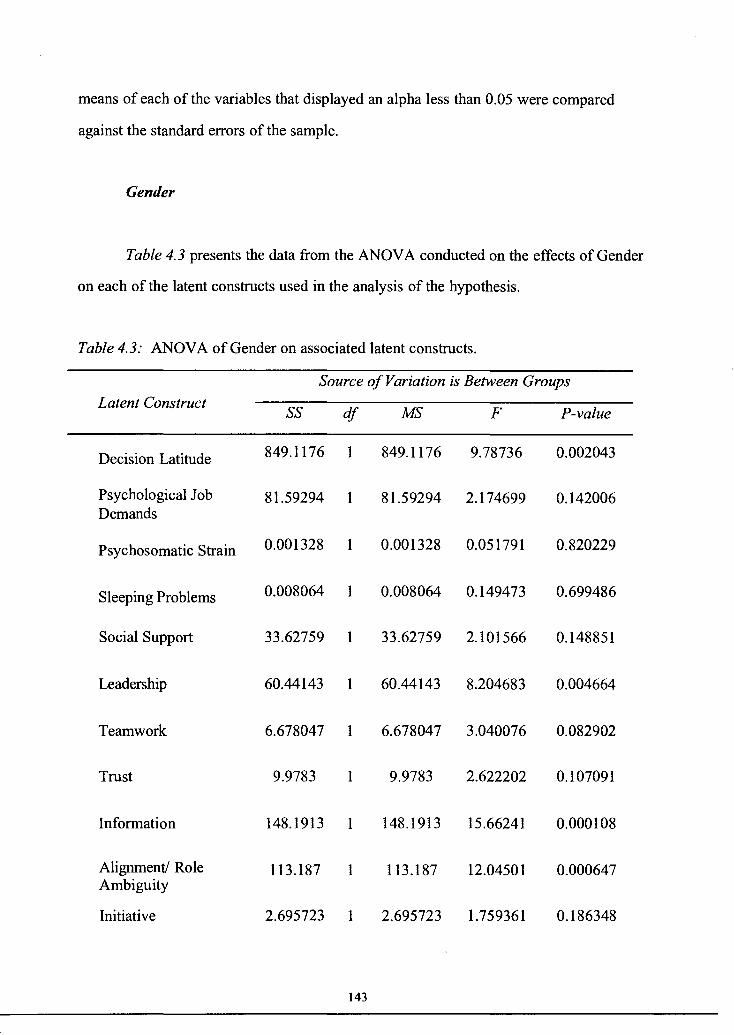
means of each of the variables that displayed an alpha less than 0.05 were compared
against the standard errors of the sample.
Gender
Table 4.3 presents the data from the ANOV A conducted on the effects of Gender
on each of the latent constructs used in the analysis of the hypothesis.
Table 4.3: ANOV A of Gender on associated latent constructs.
Source of Variation is Between Groups
Latent Construct ss df MS F P-value
Decision Latitude 849.1176 1 849.1176 9.78736 0.002043
Psychological Job 81.59294 1 81.59294 2.174699 0.142006 Demands
Psychosomatic Strain 0.001328 1 0.001328 0.051791 0.820229
Sleeping Problems 0.008064 1 0.008064 0.149473 0.699486
Social Support 33.62759 1 33.62759 2.101566 0.148851
Leadership 60.44143 1 60.44143 8.204683 0.004664
Teamwork 6.678047 1 6.678047 3.040076 0.082902
Trust 9.9783 1 9.9783 2.622202 0.107091
Information 148.1913 1 148.1913 15.66241 0.000108
Alignment/ Role 113.187 1 113.187 12.04501 0.000647 Ambiguity
Initiative 2.695723 1 2.695723 1.759361 0.186348
143

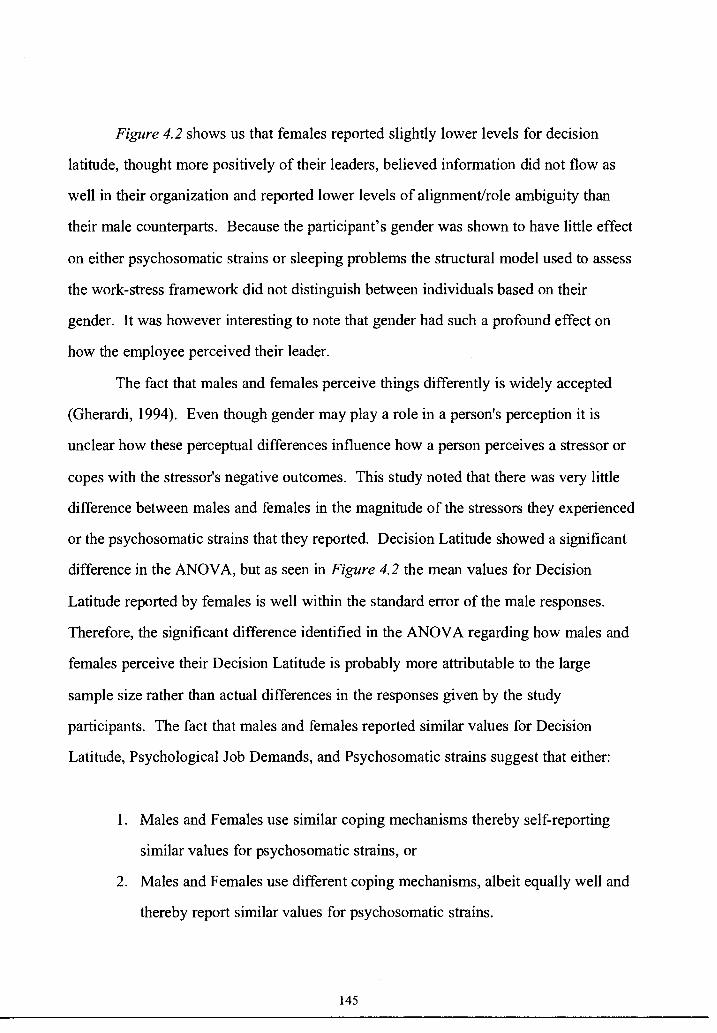
Figure 4.2 shows us that females reported slightly lower levels for decision
latitude, thought more positively of their leaders, believed information did not flow as
well in their organization and reported lower levels of alignment/role ambiguity than
their male counterparts. Because the participant's gender was shown to have little effect
on either psychosomatic strains or sleeping problems the structural model used to assess
the work-stress framework did not distinguish between individuals based on their
gender. It was however interesting to note that gender had such a profound effect on
how the employee perceived their leader.
The fact that males and females perceive things differently is widely accepted
(Gherardi, 1994). Even though gender may play a role in a person's perception it is
unclear how these perceptual differences influence how a person perceives a stressor or
copes with the stressor's negative outcomes. This study noted that there was very little
difference between males and females in the magnitude of the stressors they experienced
or the psychosomatic strains that they reported. Decision Latitude showed a significant
difference in the ANOVA, but as seen in Figure 4.2 the mean values for Decision
Latitude reported by females is well within the standard error of the male responses.
Therefore, the significant difference identified in the ANOV A regarding how males and
females perceive their Decision Latitude is probably more attributable to the large
sample size rather than actual differences in the responses given by the study
participants. The fact that males and females reported similar values for Decision
Latitude, Psychological Job Demands, and Psychosomatic strains suggest that either:
1. Males and Females use similar coping mechanisms thereby self-reporting
similar values for psychosomatic strains, or
2. Males and Females use different coping mechanisms, albeit equally well and
thereby report similar values for psychosomatic strains.
145

The findings of Hamilton and Fagot (1988) indicate that males and females tend
to utilize similar coping mechanisms. This finding appears to support the first
suggestion while other researchers have reported results that support the second
suggestion. In the cases that support the second suggestion, researchers report that
males use problem-focused coping mechanisms whereas females are more likely to use
emotion-focused methods (Trocki & Orioli, 1994). These conflicting findings on
gender influence have made sex a poor predictor of the coping mechanisms used by
employees to mitigate against the negative outcomes of stress.
Gender is also a poor indicator for predicting the level of stress reported by
individuals. Some studies show higher stress for women (Geller & Hobfoll, 1994) while
other studies report higher scores for men (Krausz, Kedem, Tal & Amir, 1992). The one
small but consistent sex difference is that males often score higher on cynicism which
can help to explain why men generally gave their leaders lower scores when compared
to their female counterparts.
As evidenced by the high percentage of male workers (71 % ) compared to female
worker (29%) the oil and gas industry remains very much a male dominated industry.
The extent of male domination is also reflected in the low number of management
positions held by women. In this study, only two out of the thirty managers that
participated in the study were female. The fact that females are not very well
represented in the decision-making processes may in part explain why females reported
less alignment/role ambiguity than their male counterparts.
Job Classification
Table 4.4 represents the results of the AN OVA on the demographic effect of Job
Classification on each of latent constructs used in the analysis of the hypothesis.
146
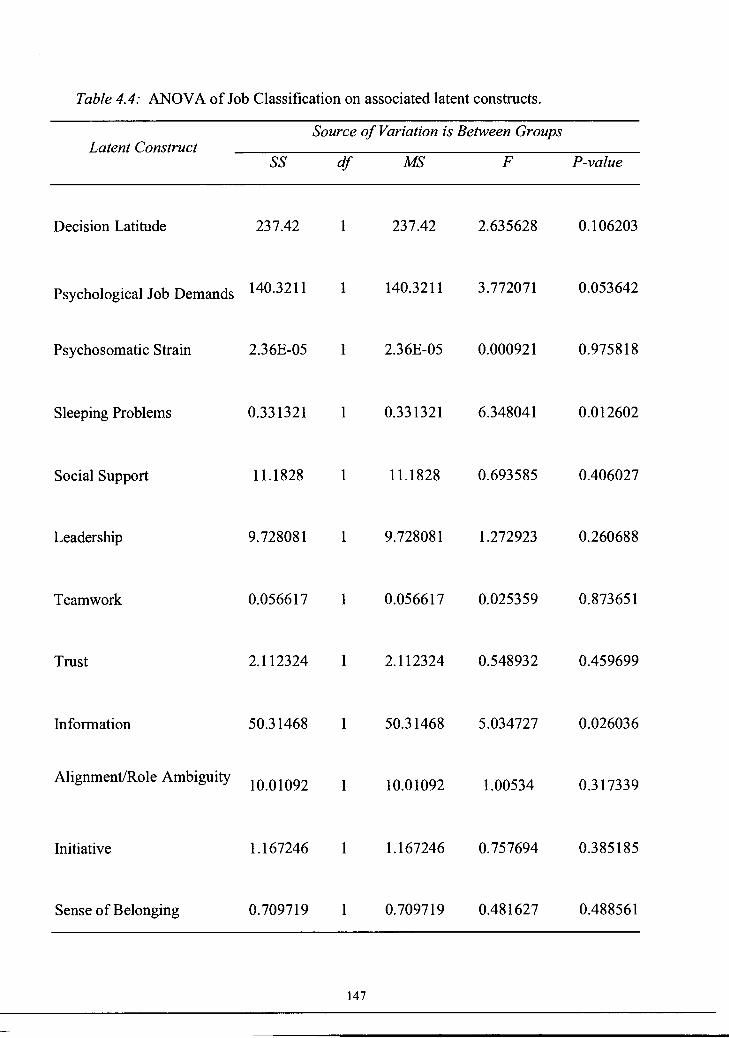
Table 4.4: ANOV A of Job Classification on associated latent constructs.
Source of Variation is Between Groups Latent Construct
ss df MS F P-value
Decision Latitude 237.42 1 237.42 2.635628 0.106203
Psychological Job Demands 140.3211 1 140.3211 3.772071 0.053642
Psychosomatic Strain 2.36E-05 1 2.36E-05 0.000921 0.975818
Sleeping Problems 0.331321 1 0.331321 6.348041 0.012602
Social Support 11.1828 1 11.1828 0.693585 0.406027
Leadership 9.728081 1 9.728081 1.272923 0.260688
Teamwork 0.056617 1 0.056617 0.025359 0.873651
Trust 2.112324 2.112324 0.548932 0.459699
Information 50.31468 1 50.31468 5.034727 0.026036
Alignment/Role Ambiguity 10.01092 1 10.01092 1.00534 0.317339
Initiative 1.167246 1.167246 0.757694 0.385185
Sense of Belonging 0.709719 1 0.709719 0.481627 0.488561
147
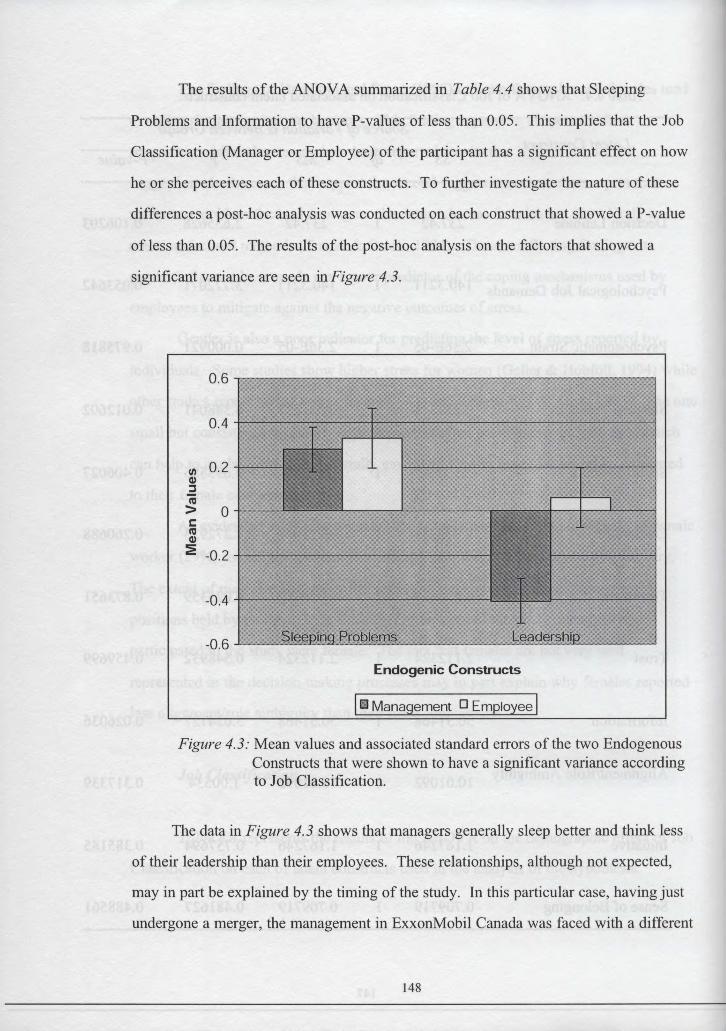
reporting structure and a host of new processes and procedures to follow and implement.
This was compounded by the fact that the managers in Canada experienced a drastic
decrease in their capital and expense authorization levels. All of these factors may have
contributed to feelings of conflict because of the ambivalence and incompatibilities
between management, business systems, and organizational cultures and goals (Buono
& Bowditch, 1989; Schweiger, Ivancevich & Power, 1987). This "merger syndrome"
effect may have contributed to the low scores given to leadership by the ExxonMobil
Canada management team.
Another contributing factor may have been that the management team in Canada
reported to new supervisors in the United States while the employees in Canada still
reported to the same supervisor. This may have contributed to employees having greater
confidence in their leadership than the management team who were faced with different
bosses and a different organizational structure.
The ANOV A also indicated that the quality of sleep varied significantly between
employees and managers. As seen in Figure 4.3 however, the mean values for sleep
reported by management had a substantial overlap with the standard error of the
employee responses. Therefore, the significant difference identified in the ANOV A
regarding the quality of sleep reported by managers and employees is probably more
attributable to the large sample size rather than actual differences in the responses given
by the study participants.
Work Location
Table 4.5 summarizes the AN OVA regarding the demographic effect of work
location i.e. in the field or at the head office in Calgary, on each of latent constructs used
in the analysis of the hypothesis.
149
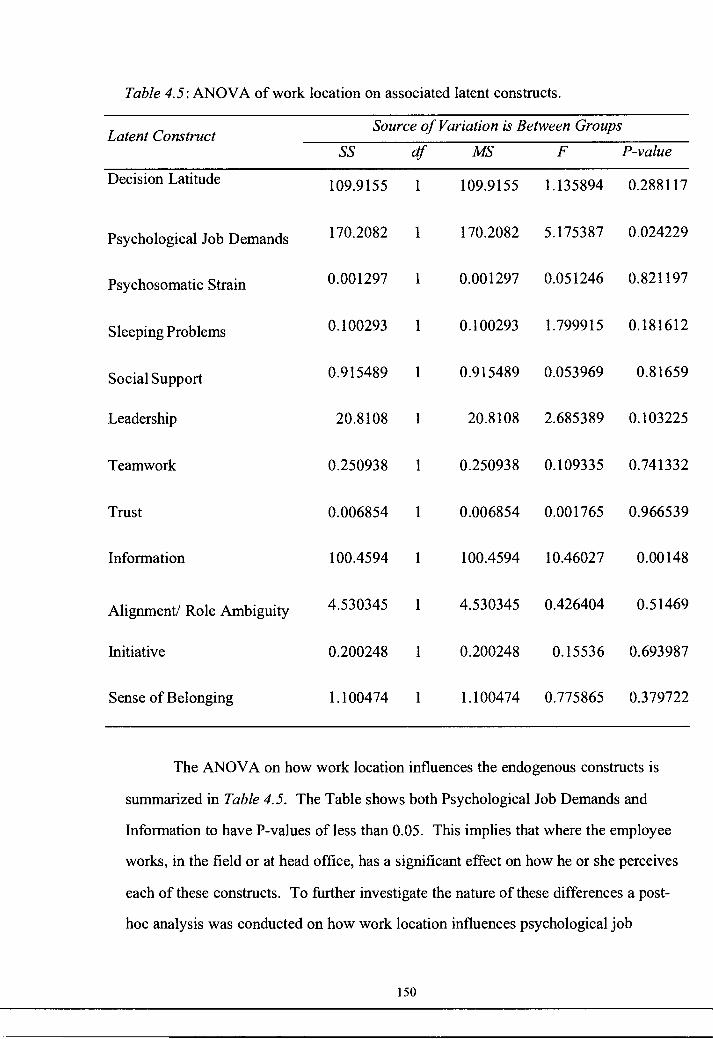

It is not surprising that workers in the field report lower scores for transfer of
information than those working in the head office. Workers in the field are given very
specific tasks to perform that are governed by specific industry accepted practices.
Since the worker is following accepted practices they require little supervision and
generally do not work in a team environment. This type of working environment can
lead to isolated employees who go about their work with little input or communication
with others. In the head office, work is often associated with specific projects or a
particular asset. In both cases, teamwork is a vital part of the work environment. This
could have led to higher information scores being reported in the head office.
Another contributor to lower information scores being reported in the field is the
hierarchical structure of the organization. In a hierarchical structure, information
generally flows from the top of the organization to the bottom. This structure relies
heavily on the middle manager communicating the information in a timely and effective
manner. When an inevitable break in the flow of communication occurs those at the
bottom of the hierarchical structure (field personnel) do not receive the same quality or
quantity of information that those at the top of the hierarchical structure (head office
personnel). The dilution of information as it flows from personnel in the head office to
those in the field can help to explain why field locations believes their work
environment is characterized by poor communication.
Education
Table 4.6 summarizes the ANOVA completed on the effects of Education on
each of the latent constructs used in the analysis of the hypothesis. The analysis of
variance for Education was conducted between those individuals that completed some
form of post secondary schooling ( eg. two year technical diploma, university degree,
etc.) and those who did not continue on with their education past high school.
152

Table 4.6: ANOVA of Education on associated latent constructs.
Latent Construct Source of Variation is Between Groups
ss df MS F P-value
Decision Latitude 0.007184 I 0.007184 7.86E-05 0.992935
Psychological Job 155.3789 1 155.3789 4.186059 0.042181 Demands
Psychosomatic Strain 0.003131 1 0.003131 0.122133 0.727133
Sleeping Problems 0.065176 1 0.065176 1.215087 0.271767
Social Support 2.5378 1 2.5378 0.156943 0.692446
Leadership 100.5988 1 100.5988 14.07281 0.000236
Teamwork 0.515932 1 0.515932 0.231343 0.631101
Trust 17.31251 1 17.31251 4.597724 0.033327
Information 23.52032 1 23.52032 2.319753 0.129457
Alignment/ Role 54.1531 1 54.1531 5.572542 0.019291 Ambiguity
Initiative 1.556228 1 1.556228 1.011582 0.315845
Sense of Belonging 5.138283 1 5.138283 3.544824 0.06131
The ANOV A of the effects of education on the endogenous constructs
being examined in this study show that the level of education obtained by the
participants had an apparent effect on the psychological job demands experienced by the
employee. Level of education also influences how the employee perceives their
leadership, the amount of trust the employee feels in their workgroup and how aligned
employees are with the organization's goals and objectives. These effects are
153
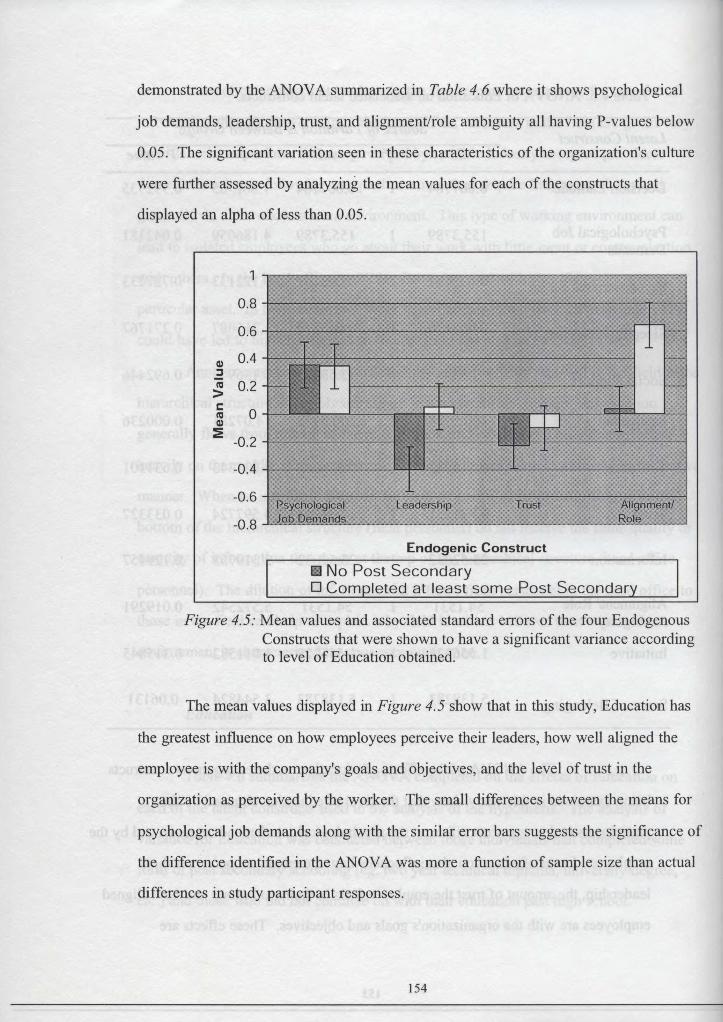

ExxonMobil, being a technology-based corporation places a great deal of
emphasis on competency and technological know-how. As a result, they place a high
value on employee development and continuous improvement. Individuals that do not
hold similar values may find themselves at odds with the company. It can be reasoned
that those individuals with only a high school education place less of a value on
education than those that went on to complete post-secondary training. Accordingly,
those individuals who have completed some form of post-secondary education are likely
aligned with the company's philosophy regarding the importance of education. Further
analysis of the data reveals that all Managers had at least some form of post-secondary
education. Since Managers directly influence the goals and objectives of the
organization it is not surprising that those with more education were more aligned with
the company's goals and objects. This also helps to explain why those with more
education scored their leadership significantly higher than their counterparts with less
education. The leadership of the organization all had post- secondary training, as such,
they were effectively scoring themselves regarding the metric of leadership, which may
have caused a bias in the results. Even though education may have had an influence on
how employees rated their leadership it did not significantly influence how the
individual perceived their psychological job demands, their decision latitude, or the
number of self reported psychosomatic strains. As such, it can be reasoned that
education does not act directly to influence the work stress framework but instead acts
indirectly by influencing an employee's perception of their leadership and how aligned
they are with the organization's goals and values.
Marital Status
Table 4. 7 summarizes the ANOVA completed on the effects of Marriage on each
of the latent constructs used in the analysis of the hypothesis. The analysis of variance
for Marriage was completed on those individuals that were either married or involved in
155
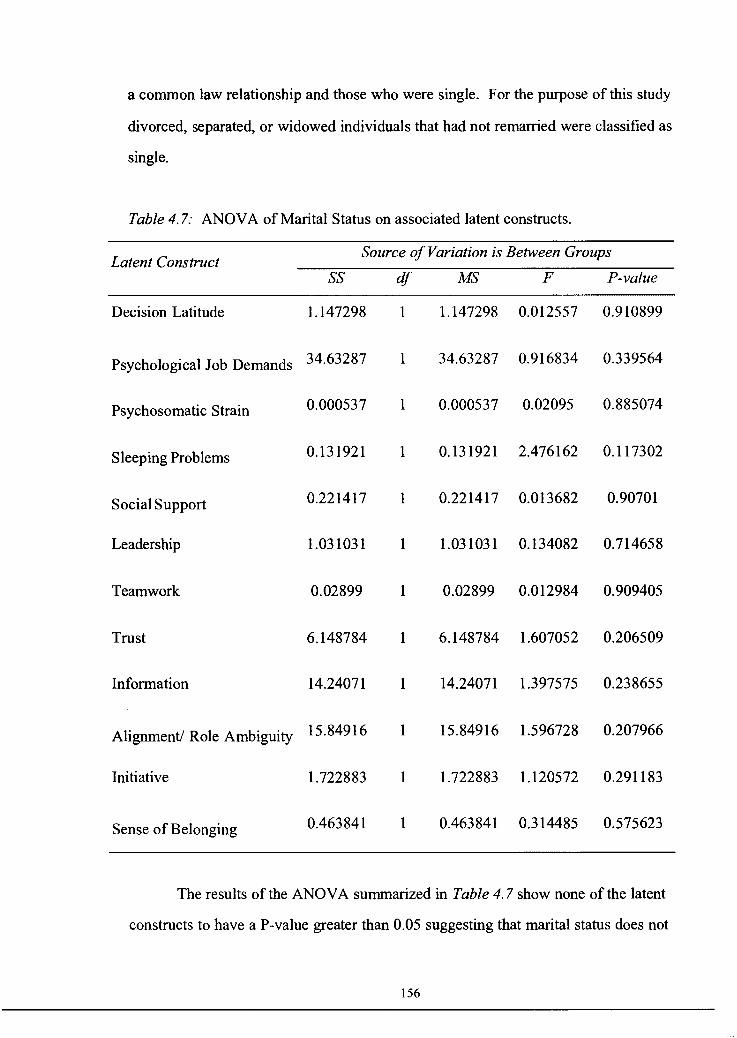
a common law relationship and those who were single. For the purpose of this study
divorced, separated, or widowed individuals that had not remarried were classified as
single.
Table 4. 7: ANOV A of Marital Status on associated latent constructs.
Latent Construct Source of Variation is Between Groups
ss df MS F P-value
Decision Latitude 1.147298 1 1.147298 0.012557 0.910899
Psychological Job Demands 34.63287 1 34.63287 0.916834 0.339564
Psychosomatic Strain 0.000537 1 0.000537 0.02095 0.885074
Sleeping Problems 0.131921 1 0.131921 2.476162 0.117302
Social Support 0.221417 1 0.221417 0.013682 0.90701
Leadership 1.031031 1 1.031031 0.134082 0.714658
Teamwork 0.02899 1 0.02899 0.012984 0.909405
Trust 6.148784 1 6.148784 1.607052 0.206509
Information 14.24071 1 14.24071 1.397575 0.238655
Alignment/ Role Ambiguity 15.84916 1 15.84916 1.596728 0.207966
Initiative 1.722883 1 1.722883 1.120572 0.291183
Sense of Belonging 0.463841 1 0.463841 0.314485 0.575623
The results of the ANOVA summarized in Table 4.7 show none of the latent
constructs to have a P-value greater than 0.05 suggesting that marital status does not
156

have a significant effect on any of the endogenous constructs used in this study. This
result was unexpected, as previous studies have shown that marriage has a moderating
effect on the levels of job strain reported by employees (Roberts & Levenson, 2002).
Other studies have shown that singles (especially men) seem to be more prone to
burnout compared with those who are married. In fact, singles seem to experience even
higher bum out levels than those individuals who are divorced (Semmer, 1996).
A recent study on the effect of marital and job stress on depressive symptoms in
middle aged women with coronary heart disease found that marital stress played a larger
role in predicting depressive symptoms than work stress (Piroska, Janszkyb,
Leineweberb, Blomb, Wamalac & Orth-Gome', 2003). Piroska et al. (2003) also
suggests that marriage may act as both a moderator and contributor to the amount of
stress experienced by an employee. This study did not find any such relationship. This
unexpected result can perhaps best be explained by the research design used in this
study. The study simply assesses whether or not an employee was married. It did not
assess the quality of the relationship between the employees and their spouses or any
associated stress caused as a result of this relationship. Instead, the study concentrated
on the entire home-work interface. Perhaps, in the case of this study, the buffering
effects of marriage are imbedded within the effects we see of the home-work interface
on the work stress framework.
Because the analysis of variance indicated that marital status did not
significantly impact the latent constructs used in the proposed work stress framework
the mean scores for each of the constructs was not assessed any further. It does however
raise questions as to why the type of interaction effect of marriage on work stress seen in
previous studies was not evident in this study.
157
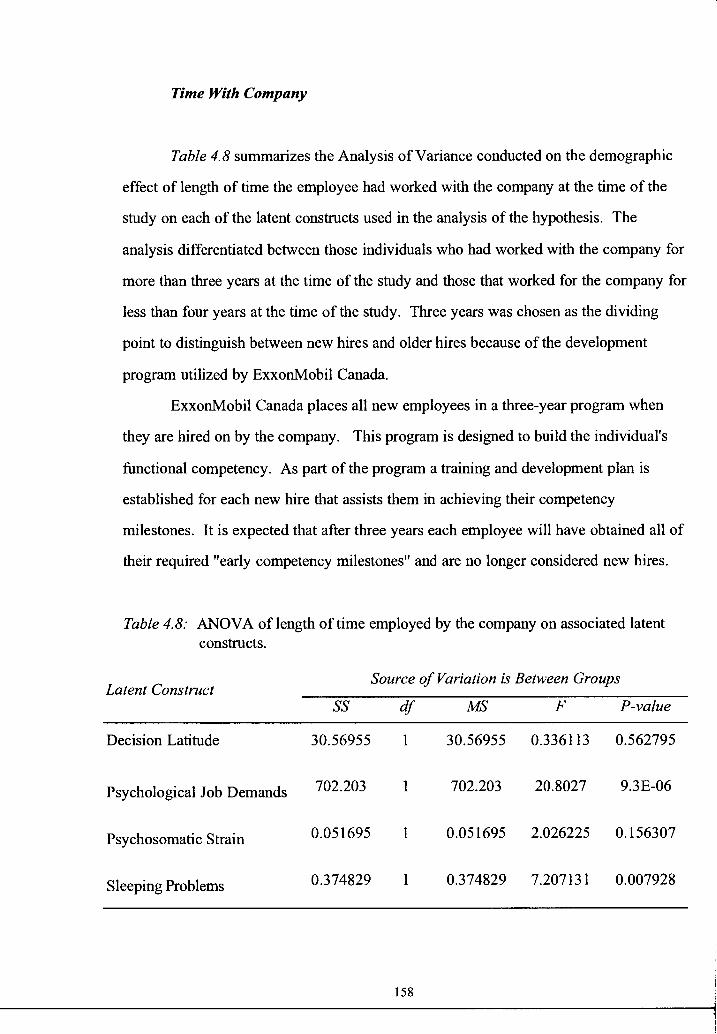
Time With Company
Table 4.8 summarizes the Analysis of Variance conducted on the demographic
effect of length of time the employee had worked with the company at the time of the
study on each of the latent constructs used in the analysis of the hypothesis. The
analysis differentiated between those individuals who had worked with the company for
more than three years at the time of the study and those that worked for the company for
less than four years at the time of the study. Three years was chosen as the dividing
point to distinguish between new hires and older hires because of the development
program utilized by ExxonMobil Canada.
ExxonMobil Canada places all new employees in a three-year program when
they are hired on by the company. This program is designed to build the individual's
functional competency. As part of the program a training and development plan is
established for each new hire that assists them in achieving their competency
milestones. It is expected that after three years each employee will have obtained all of
their required "early competency milestones" and are no longer considered new hires.
Table 4.8: ANOV A of length of time employed by the company on associated latent constructs.
Latent Construct Source of Variation is Between Groups
ss df MS F P-value
Decision Latitude 30.56955 1 30.56955 0.336113 0.562795
Psychological Job Demands 702.203 1 702.203 20.8027 9.3E-06
Psychosomatic Strain 0.051695 1 0.051695 2.026225 0.156307
Sleeping Problems 0.374829 1 0.374829 7.207131 0.007928
158
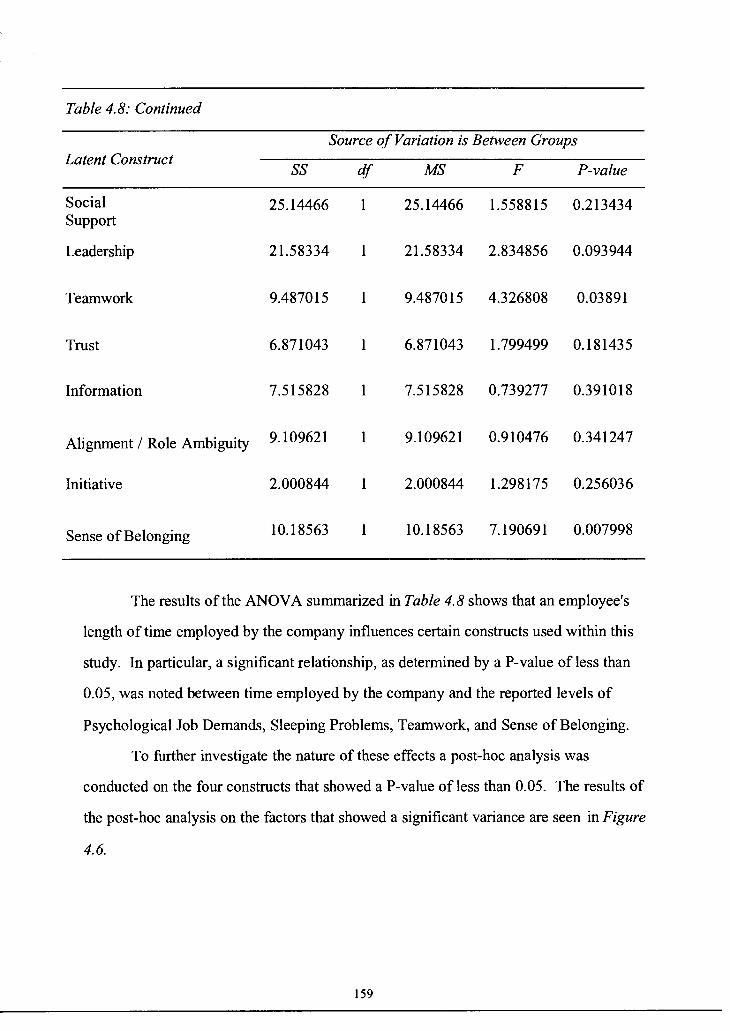
Table 4.8: Continued
Source of Variation is Between Groups Latent Construct ss df MS F P-value
Social 25.14466 1 25.14466 1.558815 0.213434 Support
Leadership 21.58334 1 21.58334 2.834856 0.093944
Teamwork 9.487015 1 9.487015 4.326808 0.03891
Trust 6.871043 1 6.871043 1.799499 0.181435
Information 7.515828 1 7.515828 0.739277 0.391018
Alignment / Role Ambiguity 9.109621 1 9.109621 0.910476 0.341247
Initiative 2.000844 1 2.000844 1.298175 0.256036
Sense of Belonging 10.18563 1 10.18563 7.190691 0.007998
The results of the ANOVA summarized in Table 4.8 shows that an employee's
length of time employed by the company influences certain constructs used within this
study. In particular, a significant relationship, as determined by a P-value ofless than
0.05, was noted between time employed by the company and the reported levels of
Psychological Job Demands, Sleeping Problems, Teamwork, and Sense of Belonging.
To further investigate the nature of these effects a post-hoc analysis was
conducted on the four constructs that showed a P-value ofless than 0.05. The results of
the post-hoc analysis on the factors that showed a significant variance are seen in Figure
4.6.
159

Of three variables shown to be significantly impacted by the length of time
employed with the company, the effect of "merger syndrome" is perhaps most apparent
in the results of Sense of Belonging. It is expected that the longer an individual is
employed by a company, the greater will be their sense of belonging. The exact
opposite occurred in this study and those with longer than three years with the company
showed significantly lower levels for sense of belonging. The new hire process utilized
by ExxonMobil and the presence of "merger syndrome" can perhaps best explain this
apparent discrepancy.
Firstly, ExxonMobil has a very well developed new hire process that is geared
towards decreasing the overall time it takes a new hire to become a productive
employee. As part of this, they are assigned a "buddy" and introduced into a network
with other new employees who often form a bond greatly increasing their Sense of
Belonging. This may in part explain why new hires report greater Sense of Belonging.
Secondly, the merger of Exxon and Mobil Oil resulted in a drastic change in
organizational philosophy for Mobil Oil Canada employees. Many felt they could not
conform to the new philosophies and as a result, felt they did not fit in. Organizational
researchers have termed these feeling as "merger syndrome". Other manifestations of
"merger syndrome" may have included: loss of personal and organizational identities;
feelings of conflict because of ambivalence and incompatibilities between management,
business systems, and organizational cultures and goals (Buono & Bowditch, 1989;
Schweiger, Ivancevich & Power, 1987). In relation to the findings of this study,
Schweiger, et al. (1987) report that the level of merger syndrome experienced by the
employee has a direct correlation to their length of employment with the company prior
to the merger. These characteristics of merger syndrome may have acted independently
or in combination resulting in the lower responses for sense of belonging by those with
greater than four years with the company. The characteristics of "merger syndrome" can
also provide insight into the drastic differences seen in the levels of reported Teamwork
between the two groups. It was expected that the length of employment would be
161
positively correlated with teamwork. The exact opposite occurred in this study with
employees with less than four years with the company reporting the highest values for
teamwork. The reason behind this is unclear but it is potentially a function of the
merger syndrome experienced by the employees with greater than three years with the
company and the new hire process utilized by ExxonMobil Canada, which focuses on
teamwork and the establishment of a peer support mechanism.
As would be expected there exits a strong correlation between age and length of
time employed by the company (0.74). As a result of this correlation, the effects
attributed to length of employment were assessed further to determine if the variances
described above were indeed a function of length of employment rather than age. By
comparing the results of the analysis of variance of age with that of length of
employment we are able to determine if age plays role in the employees responses rather
than length of employment. From Figure 4. 7 on page 170 we see that age does not have
a significant influence on the self-reports of sleep, teamwork, but does have a significant
effect on the employees sense of belonging. This suggests that age may be a
contributing factor to the responses seen above for length of employment.
Age
Tables 4.9- 4.14 summarize the results ofthe Analysis of Variance completed to
determine if age has a significant influence on any of the latent constructs being
assessed. Employees were divided into four age categories and an ANOV A was
completed to see if there was any significant difference between the responses given by
each age category. The following Tables represent the Analysis of Variance completed
on each of the different age groups and then a summary of the post-hoc analysis was
completed on the mean variances for Age is presented after Figure 4. 7 on page 170.
Table 4.9 summarizes the results of the Analysis of Variance completed on the
responses given by employees in their twenties and employees in their thirties.
162

Table 4.9: ANOV A of the variance between employees in their twenties and those in their thirties on associated latent constructs.
Latent Construct Source of Variation is Between Groups
ss df MS F P-value
Decision Latitude 86.21497 I 86.21497 0.939391 0.335869
Psychological Job Demands 78.17755 I 78.17755 2.535801 0.115929
Psychosomatic Strain 0.086523 1 0.086523 2.893502 0.093506
Sleeping Problems 0.000135 1 0.000135 0.002594 0.959526
Social Support 14.50068 1 14.50068 1.238286 0.26972
Leadership 0.033333 1 0.033333 0.003404 0.953643
Teamwork 2.44898 1 2.44898 1.548387 0.217646
Trust 0.329252 1 0.329252 0.077891 0.781023
Information 1.2 1 1.2 0.103779 0.748329
Alignment I Role Ambiguity 13.14354 I 13.14354 1.35123 0.249127
Initiative 1.257823 1 1.257823 1.870455 0.175926
Sense of Belonging 4.245578 1 4.245578 2.439572 0.122951
Table 4.9 shows that there are no significant differences identified in how twenty
year olds perceive their working environment and how thirty year olds perceive their
working environment. This is evidenced by the fact that no P-value below 0.05 was
observed in the assessment of the latent constructs for these two groups of participants.
163
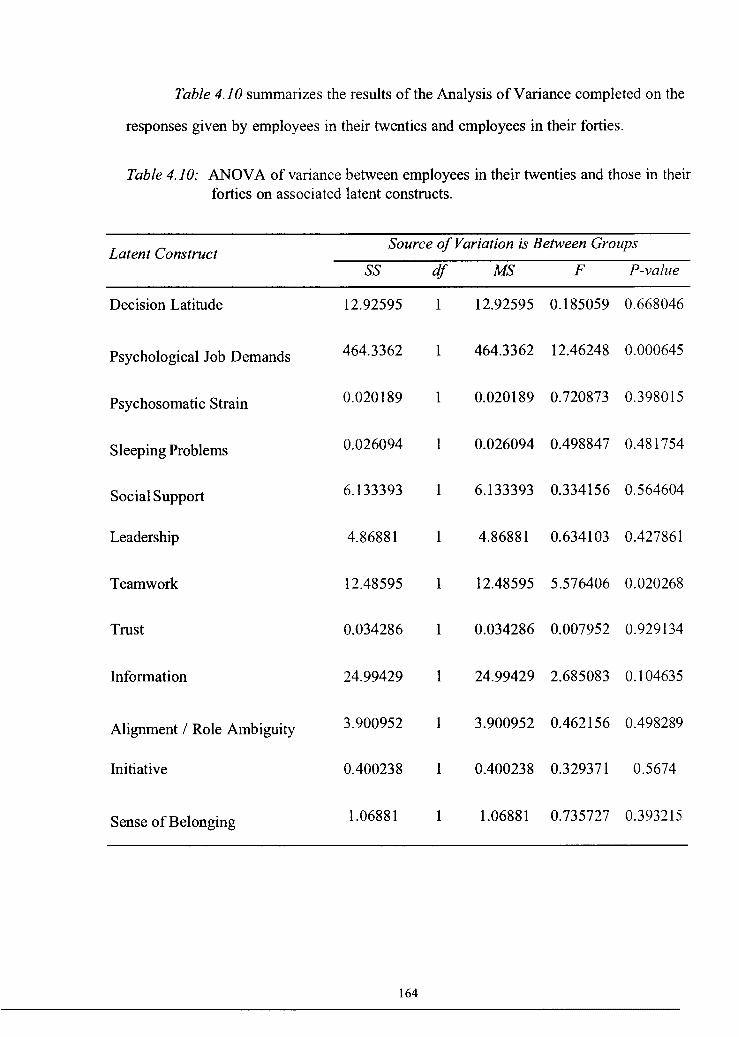
Table 4.10 summarizes the results of the Analysis of Variance completed on the
responses given by employees in their twenties and employees in their forties.
Table 4.10: ANOV A of variance between employees in their twenties and those in their forties on associated latent constructs.
Latent Construct Source of Variation is Between Groups
ss df MS F P-value
Decision Latitude 12.92595 1 12.92595 0.185059 0.668046
Psychological Job Demands 464.3362 1 464.3362 12.46248 0.000645
Psychosomatic Strain 0.020189 1 0.020189 0.720873 0.398015
Sleeping Problems 0.026094 1 0.026094 0.498847 0.481754
Social Support 6.133393 1 6.133393 0.334156 0.564604
Leadership 4.86881 1 4.86881 0.634103 0.427861
Teamwork 12.48595 1 12.48595 5.576406 0.020268
Trust 0.034286 1 0.034286 0.007952 0.929134
Information 24.99429 I 24.99429 2.685083 0.104635
Alignment / Role Ambiguity 3.900952 1 3.900952 0.462156 0.498289
Initiative 0.400238 1 0.400238 0.329371 0.5674
Sense of Belonging 1.06881 1 1.06881 0.735727 0.393215
164

Table 4.10 shows that a significant difference was observed between the
psychological job demands reported by individuals in their twenties and the
psychological job demands reported by individuals in their forties. A significant
difference was also observed regarding how each of these groups characterized the level
trust seen in their organization.
Table 4.11 summarizes the results of the Analysis of Variance completed on the
responses given by employees in their twenties and employees in their fifties.
Table 4.11: ANOVA of variance between employees in their twenties and those in their fifties on associated latent constructs.
Latent Construct
Decision Latitude
Psychological Job Demands
Psychosomatic Strain
Sleeping Problems
Social Support
Leadership
Teamwork
Trust
Information
Alignment / Role Ambiguity
Initiative
Source of Variation is Between Groups
ss df MS F P-value
105.6027 1 105.6027 1.109929 0.295827
611.3633 1 611.3633 22.13525 l.29E-05
0.009647 1 0.009647 0.317876 0.574742
0.05373 1 0.05373 0.806954 0.372192
33.62759 1 33.62759 2.101566 0.148851
1.317007 1 1.317007 0.17268 0.679049
10.8 1 10.8 6.105463 0.015988
1.910884 1 1.910884 0.539643 0.465107
0.153061 1 0.153061 0.019715 0.88875
8.082313 1 8.082313 0.714356 0.400966
0.982313 1 0.982313 0.472531 0.494163
165
:j

Table 4.11: Continued
Source of Variation is Between Groups Latent Construct ss df MS F P-value
Sense of Belonging 0.043537 1 0.043537 0.034766 0.852642
Table 4.11 shows that a significant difference was observed between the
psychological job demands reported by individuals in their twenties and the
psychological job demands reported by individuals in their fifties. A significant
difference was also observed regarding how each of these groups characterized the level
teamwork seen in their organization.
Tab! e 4.12 summarizes the results of the analysis of variance completed on the
responses given by employees in their twenties and employees in their fifties.
Table 4.12: Analysis of variance between employees in their thirties and employees in their forties on associated latent constructs.
Latent Construct Source of Variation is Between Groups
ss df MS F P-value
Decision Latitude 48.59474 1 48.59474 0.555836 0.457519
Psychological Job Demands 252.1849 1 252.1849 6.95402 0.009562
Psychosomatic Strain 0.135058 1 0.135058 6.308392 0.013456
Sleeping Problems 0.030815 1 0.030815 0.656116 0.419667
Social Support 71.21416 1 71.21416 4.304212 0.04033
Leadership 9.772011 9.772011 1.252305 0.265528
Teamwork 9.476817 1 9.476817 4.15518 0.043884
166

-----
Table 4.12: Continued
Latent Construct Source of Variation is Between Groups
ss df MS F P-value
Trust 0.748583 1 0.748583 0.184196 0.668624
Information 108.3454 1 108.3454 10.19083 0.001836
Alignment / Role Ambiguity 1.845803 1 1.845803 0.200416 0.655258
Initiative 7.108117 1 7.108117 5.945875 0.016338
Sense of Belonging 2.622453 1 2.622453 1.649648 0.201681
Surprisingly, Table 4.12 shows that there are a number of significant differences
in how employees in their thirties and employees in their forties perceive their working
environment. A significant difference was observed in how the two groups reported:
psychological job demands, psychosomatic strains, social support, teamwork,
information, and initiative.
Table 4.13 summarizes the results of the analysis of variance completed on the
responses given by employees in their thirties and employees in their fifties.
Table 4.13: ANO VA of variance between employees in their thirties and those in their fifties on associated latent constructs.
Latent Construct Source of Variation is Between Groups
ss df MS F P-value
Decision Latitude 501.3387 1 501.3387 4.471479 0.037359
Psychological Job Demands 395.8499 1 395.8499 14.1736 0.000304
Psychosomatic Strain 0.134769 1 0.134769 6.334675 0.013695
167
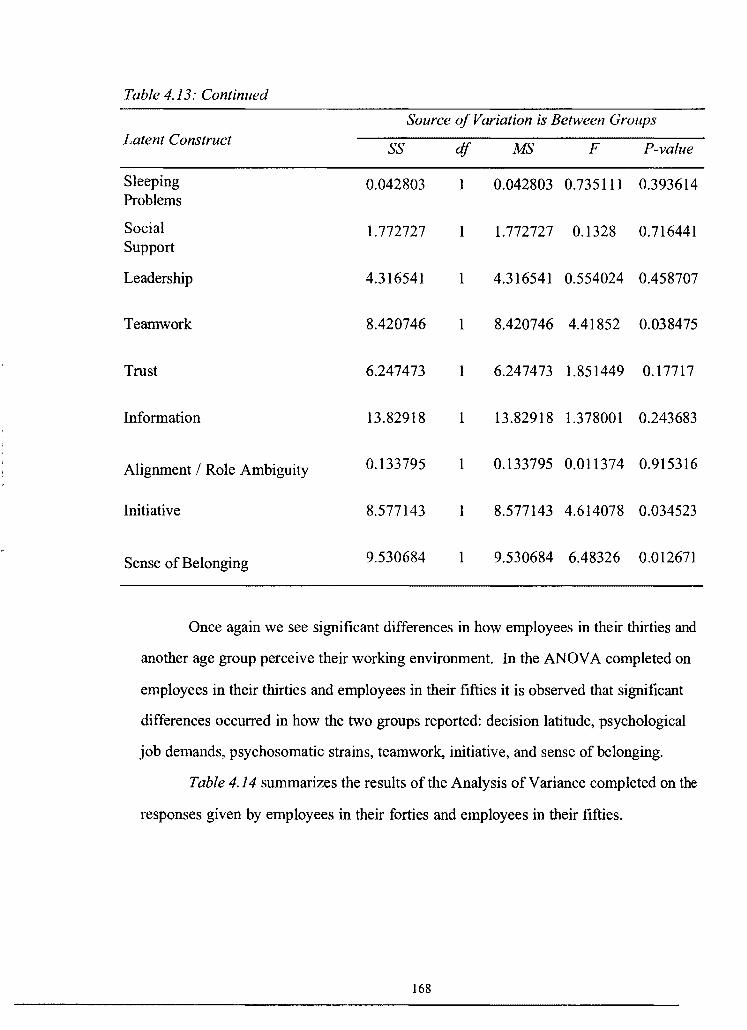
Table 4.13: Continued
Source of Variation is Between Groups Latent Construct ss df MS F P-value
Sleeping 0.042803 0.042803 0.735111 0.393614 Problems
Social 1.772727 1 1.772727 0.1328 0.716441 Support
Leadership 4.316541 1 4.316541 0.554024 0.458707
Teamwork 8.420746 1 8.420746 4.41852 0.038475
Trust 6.247473 1 6.247473 1.851449 0.17717
Information 13.82918 1 13.82918 1.378001 0.243683
Alignment / Role Ambiguity 0.133795 1 0.133795 0.011374 0.915316
Initiative 8.577143 8.577143 4.614078 0.034523
Sense of Belonging 9.530684 9.530684 6.48326 0.012671
Once again we see significant differences in how employees in their thirties and
another age group perceive their working environment. In the ANOVA completed on
employees in their thirties and employees in their fifties it is observed that significant
differences occurred in how the two groups reported: decision latitude, psychological
job demands, psychosomatic strains, teamwork, initiative, and sense of belonging.
Table 4.14 summarizes the results of the Analysis of Variance completed on the
responses given by employees in their forties and employees in their fifties.
168
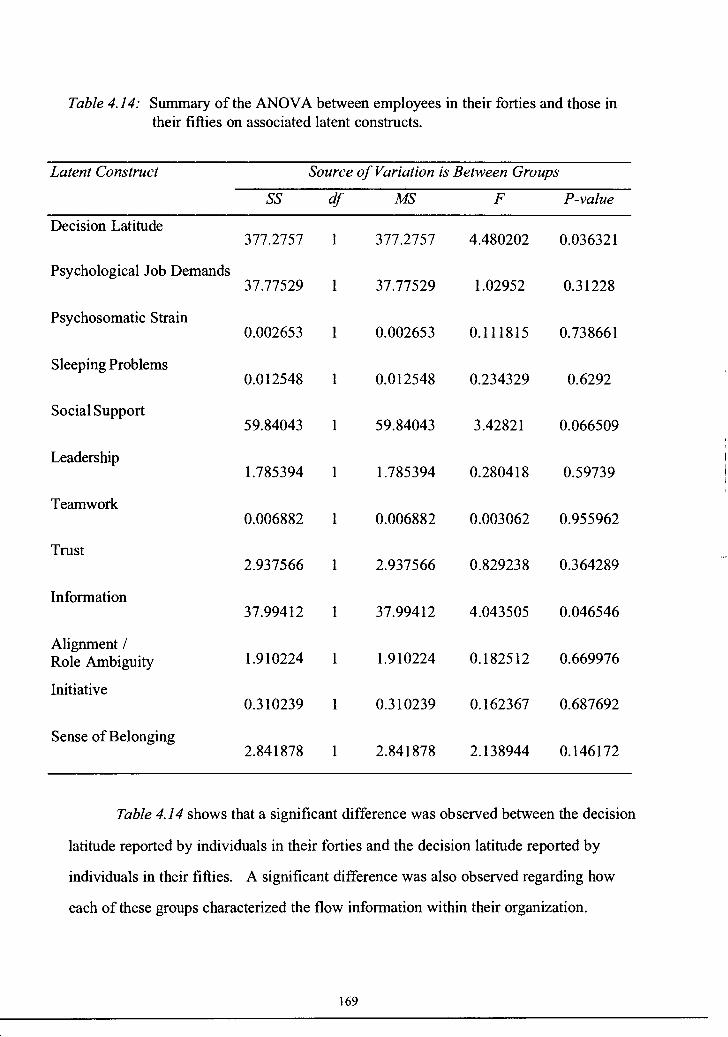
Table 4.14: Summary of the ANOVA between employees in their forties and those in their fifties on associated latent constructs.
Latent Construct Source of Variation is Between Groups
ss df MS F P-value
Decision Latitude 377.2757 1 377.2757 4.480202 0.036321
Psychological Job Demands 37.77529 1 37.77529 1.02952 0.31228
Psychosomatic Strain 0.002653 1 0.002653 0.111815 0.738661
Sleeping Problems 0.012548 1 0.012548 0.234329 0.6292
Social Support 59.84043 1 59.84043 3.42821 0.066509
Leadership 1.785394 1 1.785394 0.280418 0.59739
Teamwork 0.006882 1 0.006882 0.003062 0.955962
Trust 2.937566 1 2.937566 0.829238 0.364289
Information 37.99412 1 37.99412 4.043505 0.046546
Alignment/ Role Ambiguity 1.910224 1 1.910224 0.182512 0.669976
Initiative 0.310239 1 0.310239 0.162367 0.687692
Sense of Belonging 2.841878 1 2.841878 2.138944 0.146172
Table 4.14 shows that a significant difference was observed between the decision
latitude reported by individuals in their forties and the decision latitude reported by
individuals in their fifties. A significant difference was also observed regarding how
each of these groups characterized the flow information within their organization.
169
:, I• '1
'I 11
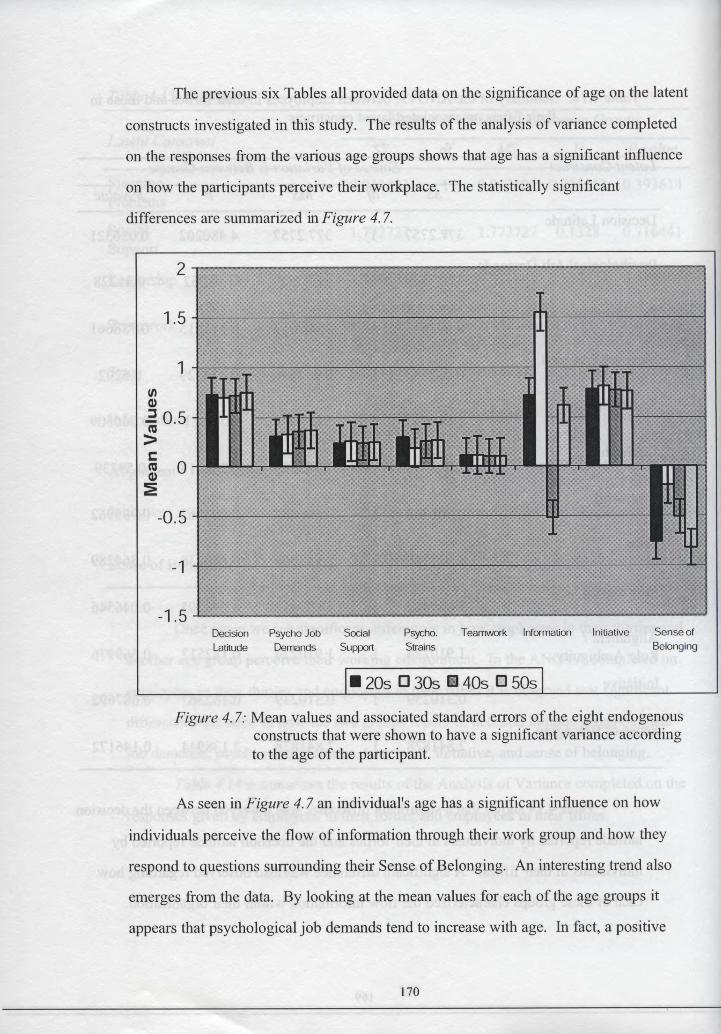
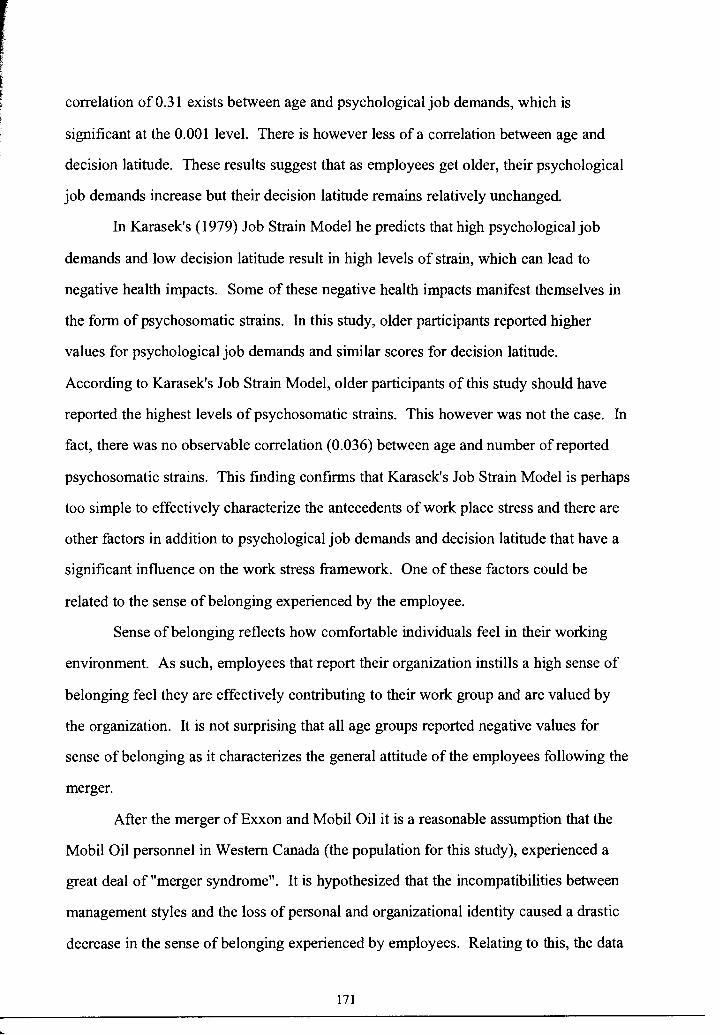
r F
correlation of 0.31 exists between age and psychological job demands, which is
significant at the 0.001 level. There is however less of a correlation between age and
decision latitude. These results suggest that as employees get older, their psychological
job demands increase but their decision latitude remains relatively unchanged.
In Karasek's ( 1979) Job Strain Model he predicts that high psychological job
demands and low decision latitude result in high levels of strain, which can lead to
negative health impacts. Some of these negative health impacts manifest themselves in
the form of psychosomatic strains. In this study, older participants reported higher
values for psychological job demands and similar scores for decision latitude.
According to Karasek's Job Strain Model, older participants of this study should have
reported the highest levels of psychosomatic strains. This however was not the case. In
fact, there was no observable correlation (0.036) between age and number of reported
psychosomatic strains. This finding confirms that Karasek's Job Strain Model is perhaps
too simple to effectively characterize the antecedents of work place stress and there are
other factors in addition to psychological job demands and decision latitude that have a
significant influence on the work stress framework. One of these factors could be
related to the sense of belonging experienced by the employee.
Sense of belonging reflects how comfortable individuals feel in their working
environment. As such, employees that report their organization instills a high sense of
belonging feel they are effectively contributing to their work group and are valued by
the organization. It is not surprising that all age groups reported negative values for
sense of belonging as it characterizes the general attitude of the employees following the
merger.
After the merger of Exxon and Mobil Oil it is a reasonable assumption that the
Mobil Oil personnel in Western Canada (the population for this study), experienced a
great deal of "merger syndrome". It is hypothesized that the incompatibilities between
management styles and the loss of personal and organizational identity caused a drastic
decrease in the sense of belonging experienced by employees. Relating to this, the data
171

suggests that individuals in their thirties experienced less merger syndrome than that of
their colleagues. Their comparatively high scores for sense of belonging and low scores
for psychosomatic strains provides some justification to support this.
There has always been a great deal of ambiguity in the results reported by
researchers on how age influences the level of stress reported by employees. It is,
however, consistently reported that younger individuals self-report greater amounts of
work stress than older individuals. Even though younger individuals generally report
greater amounts of stress, older individuals account for the majority of stress related
work claims. California's Worker's Compensation Report (1990) reports that the stress
claimant's average age at the time of stress injury is 40 years of age. This can be
compared to average age for all other disabled workers, which is 34 years of age.
Although workers under the age of 25 account for nearly a quarter of all disabling work
injuries, they account for only 5% of stress claims. If younger individuals are reporting
greater amounts of stress, but are accounting for less than 5% of stress related claims
than either the levels of stress reported by older individuals is inaccurate thereby biasing
the results of previous research or younger individuals have better stress coping
mechanisms at their disposal.
The findings presented above clearly indicate that individuals in their thirties
report significantly few psychosomatic strains than their older counter-parts. Thirty
year-old participants also perceived information to be communicated much more
effectively in the organization that any of the other age groups. The fact that individuals
in their thirties reported higher numbers for sense of belonging and information and
lower values for psychosomatic strains suggests that thirty year olds perceive their
working environment differently than individuals in other age groups. The
epidemiology of these differences is unclear, but the evidence presented in this study
strongly supports the hypothesis that it is heavily influenced by the effectiveness of the
coping mechanisms utilized by the individual.
172

There are more subtle differences in the relationships of both environmental and
personal characteristics with psychosomatic measures that the questionnaire used in this
study was unable to detect. A thorough analysis using complex techniques of pattern
matching is warranted. However, where established relationships are acknowledged it is
recommended that careful attention be placed on environmental and personal factors and
improvements that can be implemented. A more thorough analysis of these interactions
is warranted but should be taken up with some caution as most literature on this topic
suggests sociodemographic profiles and other personal attributes as related to the work
stress framework is ambiguous and difficult to characterize.
The inconsistencies with the literature demonstrated by the relationships
described above, coupled with the seemingly inconsistent relationship between age and
psychological job demands to psychosomatic measures, provide ample opportunity for
further study.
Personality
Research Question 2: In what ways, if any, do the endogenous constructs
analyzed in this study d[ffer according to the personality of each of its
participants.
To answer this question a one-way analysis of variance was performed
comparing the mean squares of personality types A and B against the mean squares of
each of the endogenous constructs. As with Research Question 1, an alpha of 0.05 was
utilized to determine if the observed variance was significant or not. Table 4.15
summarizes the effect of personality on each of the latent constructs used in the
characterization of the work stress framework.
173
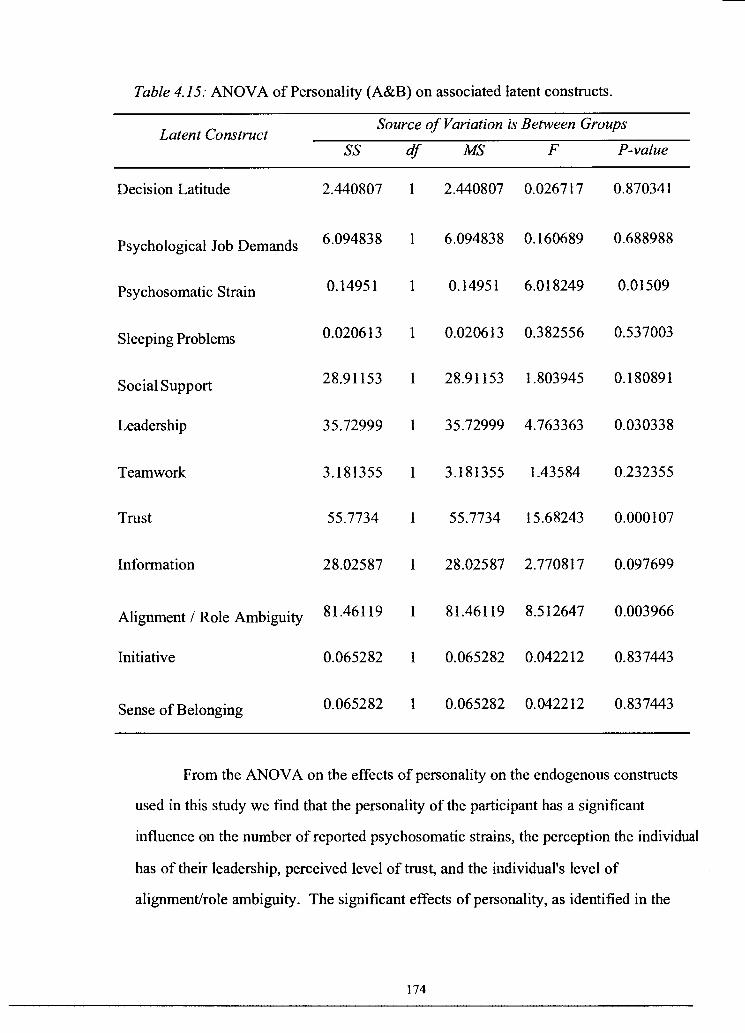
Table 4.15: ANOV A of Personality (A&B) on associated latent constructs.
Latent Construct Source of Variation is Between Groups
ss df MS F P-value
Decision Latitude 2.440807 1 2.440807 0.026717 0.870341
Psychological Job Demands 6.094838 1 6.094838 0.160689 0.688988
Psychosomatic Strain 0.14951 1 0.14951 6.018249 0.01509
Sleeping Problems 0.020613 1 0.020613 0.382556 0.537003
Social Support 28.91153 1 28.91153 1.803945 0.180891
Leadership 35.72999 1 35.72999 4.763363 0.030338
Teamwork 3.181355 1 3.181355 1.43584 0.232355
Trust 55.7734 1 55.7734 15.68243 0.000107
Information 28.02587 1 28.02587 2.770817 0.097699
Alignment / Role Ambiguity 81.46119 1 81.46119 8.512647 0.003966
Initiative 0.065282 1 0.065282 0.042212 0.837443
Sense of Belonging 0.065282 1 0.065282 0.042212 0.837443
From the ANOV A on the effects of personality on the endogenous constructs
used in this study we find that the personality of the participant has a significant
influence on the number of reported psychosomatic strains, the perception the individual
has of their leadership, perceived level of trust, and the individual's level of
alignment/role ambiguity. The significant effects of personality, as identified in the
174


with a Type B personality reported significantly higher numbers for alignment and role
ambiguity than their Type A counterparts. Type A/B behavior pattern is a behavioural
trait referring to how one responds to environmental challenges and threats (Ivancevich
& Matteson, 1984).
Type A individuals respond in ways characterized as aggressive, achievement
oriented, dynamic, hard driving, assertive, fast paced (in eating, walking, and talking),
impatient, competitive, ambitious, irritated, angry, hostile, and under time pressures
(Cooper, Kirkcaldy & Brown, 1994; Jamal, 1990; Rosenman & Chesney, 1985). Type
B individuals are casual, easygoing, and never in a rush to get things done (Bortner,
1969). It is theorized that the Type A individuals perceived the environmental changes
associated with the merger more as a threat than their Type B counterparts and as a
result experienced a greater amount of stress as a result of the merger. This is reflected
in the higher numbers of psychosomatic strains and reported by Type A individuals and
their significantly lower scores for role ambiguity and alignment.
Home-work Interface
Research Question 3: In what ways, if any, do the endogenous constructs
analyzed in this study differ according to the non-work stressors experienced by
each of its participants.
To answer this question a one-way analysis of variance was again performed. In
this analysis the entire sample was divided into two groups: low non-work stress and
high non-work stress. The mean score of the summed non-work stressors was used as a
dividing point to classify each of the groups. The constructs of the low non-work stress
group was then compared with the constructs of the high non-work stress group using
ANOV A. As with Research Questions 1 & 2, an alpha of 0.05 was utilized to detennine
176

if the variance between the two groups was significant or not. Table 4.16 summarizes
the results of the ANOV A.
Table 4.16: ANOV A of variance between employees assessed to have positive home-work relationship and those with a negative home-work relationship.
Source of Variation is Between Groups
Latent Construct ss df MS F P-value
Decision Latitude 224.7191 1 224.7191 2.541986 0.112649
Psychological Job Demands 37.77528 1 37.77528 0.999564 0.318789
Psychosomatic Strain 0.135537 1 0.135537 5.633324 0.0187
Sleeping Problems 0.077823 1 0.077823 1.5241 0.218646
Social Support 14.61236 1 14.61236 0.900992 0.343817
Leadership 0.202247 1 0.202247 0.025213 0.874019
Teamwork 23.01124 1 23.01124 10.67298 0.001307
Trust 0.140449 1 0.140449 0.035702 0.850351
Information 17.61798 1 17.61798 1.742508 0.188536
Alignment / Role Ambiguity 0.140449 1 0.140449 0.013746 0.906801
Initiative 2.97191 1 2.97191 1.891435 0.170788
Sense of Belonging 0.679775 1 0.679775 0.476165 0.491074
177
:, ;,
:1
i!


Organizational Culture
Research Question 4: How does organizational culture, as perceived by the
worker affect the work stress .framework, psychosomatic strains, and quality of
sleep?
The primary purpose of this study is to determine the effect of organizational
culture on the proposed work stress framework. The first three research questions assess
the influence of a number of extraneous variables in an attempt to reduce the
measurement error associated with the survey instrument used in this study. Research
question number four, on the other hand, addresses the core of the problem in trying to
determine the role of organizational culture in the work stress framework. To answer
this question structural equation modeling (SEM) using AMOS version 5.0 is used.
Figure 4.10 on page 181 examines the relationships, represented by path
diagrams, between job demands, job control, organizational culture, the home-work
interface, psychosomatic strains and sleeping problems. A number of tests were
performed on the model to see how well the data supported the model. The results of
these tests are shown in Table 4.17. All of the fit indices summarized in Table 4.17
show an excellent fit, meaning the proposed model was supported well by the data. This
strong overall model fit indicates that both the measurement part of the model and the
structure part of the model generally fit the data.
Table 4.17: Goodness of Fit measurements for the SEM representing the proposed work stress framework:
Fit Index
CMIN/DF
GFI
179
Value
0.086
0.991

Table 4.17 Continued
Fit Index
NFI
RFI
TLI
RMSEA
Value
0.961
0.803
1.039
0.000
The chi-square for the proposed work stress model is 5.205. Although the chi
square statistic is a global test of a model's ability to reproduce the sample
variance/covariance matrix, it is sensitive to sample size and the complexity of the
model (Bollen, 1989). Thus, the chi-square statistic must be interpreted with caution
(Joreskog & Sorbom 1996). When dealing with large sample sizes and complex
models the chi-square is often used with the degrees of freedom in terms of a ratio when
assessing fit. In this case, the chi-square to the degrees of freedom ratio was 1.15.
Marsh, Balla and McDonald (1988) suggest that the chi-square to degrees of freedom
ratios up to the value of three are indicative of acceptable fit models, suggesting that the
proposed model has an acceptable fit to the data.
Concerning parameter estimates, Organizational Culture displayed a significant
relationships with Psychosomatic Strains and Decision Latitude (Figure 4.10).
Organizational Culture had a strong negative relationship with self-reported
psychosomatic strains, which means the more positive the Organizational Culture the
fewer reported cases of Psychosomatic Strains. One unit decrease of Organizational
Culture drove a 0.536 increase in self-reported levels of Psychosomatic Strains. In fact,
Organizational Culture had a greater impact on the reported Psychosomatic Strains than
did the combined impacts of Decision Latitude (-0.145) and Psychological Job Demands
(.094). This result confirms the importance of Organizational Culture in the work stress
framework and provides evidence to suggest that the Culture of the Organization may be
180

a more important predictor of stress than either Decision Latitude or Psychological Job
Demands.
The proposed work stress framework represented by the path diagrams in Figure
4.10 hypothesizes that job demands and job control influence the reported levels of
Psychosomatic Strain. The results, however show no significant relationship between
job demands and job control on psychosomatic strains as evidenced by the low factor
loading displayed in the model shown in Figure 4.10 .
. 05
Culture
.18 .34
2 ~--~ Decision Latitude
.06 .22
.00
Home-Work
Figure 4.10: Structural Model of the Work-Stress Framework for Personality Type "A" participants showing standardized regression weights.
181

As expected, there is a strong relationship between psychological job demands
and sleeping problems. An increase in psychological job demands corresponds to a
factor loading of 0.431 on sleeping problems. Interestingly, although the psychological
job demands has a direct influence on sleeping problems, it does not have a
corresponding effect on psychosomatic strains. It is only when high psychological job
demands are associated with low decision latitude that we see an effect on the levels of
reported psychosomatic strains. This finding supports Karasek's (1979) Job Strain
Model by providing evidence to support that job strain is a factor of an individual's
decision latitude and psychological job demands. Karasek (1979) hypothesizes that job
demands are not in themselves harmful, but when combined with low employee control,
these demands can lead to negative outcomes such as psychosomatic strains as
demonstrated in Table 4.18.
Table 4.18 summarizes the results of the two sample t-test used to compare the
number of psychosomatic strains reported by those individuals in high strain jobs (low
decision latitude - high psychological job demand) and those in low strain jobs (high
decision latitude - low psychological job demands).
Table 4.18: Results of the two sample t-Test for psychosomatic strains between those employees in low strain jobs and those employees in high strain jobs.
Mean
Variance
Observations
Hypothesized Mean
Difference
Df
t Stat
Low Strain Job
0.218474359
0.026992339
52
0
98
-1.851586947
182
High Strain Job
0.275798611
0.021091619
48

Table 4.18 Continued
P(T<=t) one-tail
t Critical one-tail
P(T<=t) two-tail
t Critical two-tail
Low Strain Job
0.033548054
1.660550879
0.067096107
1.984467417
High Strain Job
Utilizing an alpha at the 0.05 level the results of the t-test indicate that
individuals in low strain jobs report statistically fewer psychosomatic strains than
individuals in high strain jobs as indicated by the p-value of0.03. This supports the
findings of Karasek ( 1979) who found that individuals in high strain jobs report greater
psychosomatic strains than those in employees working in low strain jobs. Individuals
reportedly in high strain Jobs were then assessed according to the reported
organizational culture of their workplace.
Table 4.19: Results of the two-sample t-Test for psychosomatic strains of employees in high strain jobs that reported a restricted culture and those that reported an engaged culture.
Mean
Variance
Observations
Hypothesized Mean
Difference
Df
t Stat
P(T<=t) one-tail
Restricted Engaged Culture Culture 0.298676471 0.220238095
0.02297819 0.013231753
34 14
0
32
l.948243355
0.030100843
183
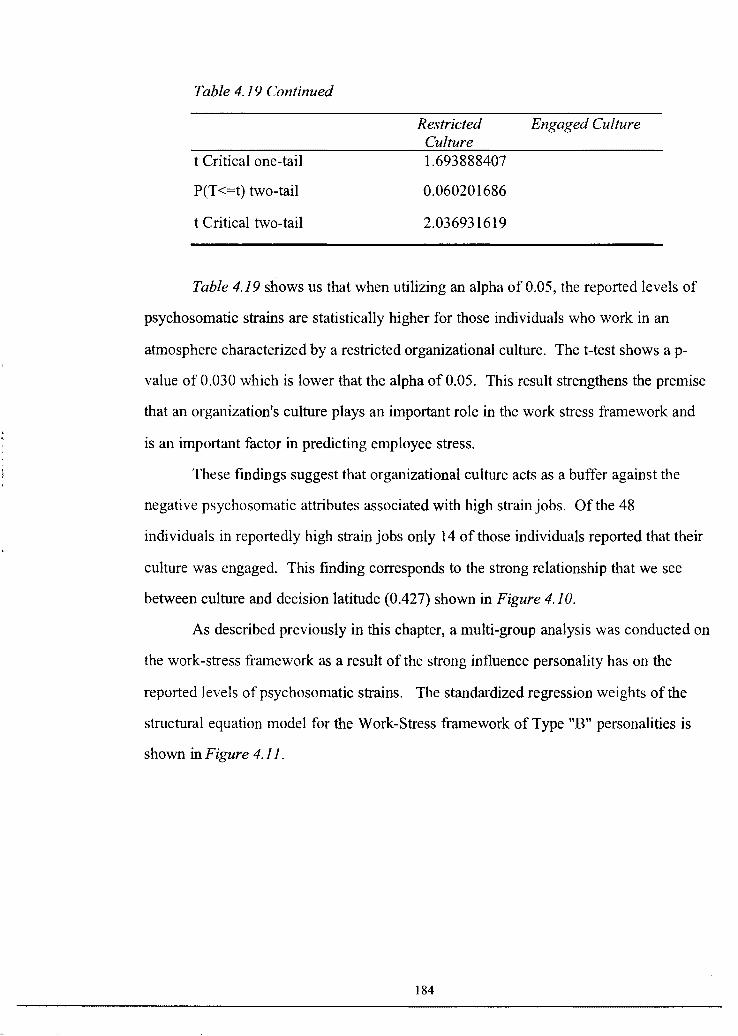
Table 4.19 Continued
t Critical one-tail
P(T<=t) two-tail
t Critical two-tail
Restricted Engaged Culture Culture l .693888407
0.060201686
2.036931619
Table 4.19 shows us that when utilizing an alpha of 0.05, the reported levels of
psychosomatic strains are statistically higher for those individuals who work in an
atmosphere characterized by a restricted organizational culture. The t-test shows a p
value of 0.030 which is lower that the alpha of 0.05. This result strengthens the premise
that an organization's culture plays an important role in the work stress framework and
is an important factor in predicting employee stress.
These findings suggest that organizational culture acts as a buffer against the
negative psychosomatic attributes associated with high strain jobs. Of the 48
individuals in reportedly high strain jobs only 14 of those individuals reported that their
culture was engaged. This finding corresponds to the strong relationship that we see
between culture and decision latitude (0.427) shown in Figure 4.10.
As described previously in this chapter, a multi-group analysis was conducted on
the work-stress framework as a result of the strong influence personality has on the
reported levels of psychosomatic strains. The standardized regression weights of the
structural equation model for the Work-Stress framework of Type "B" personalities is
shown in Figure 4.11.
184
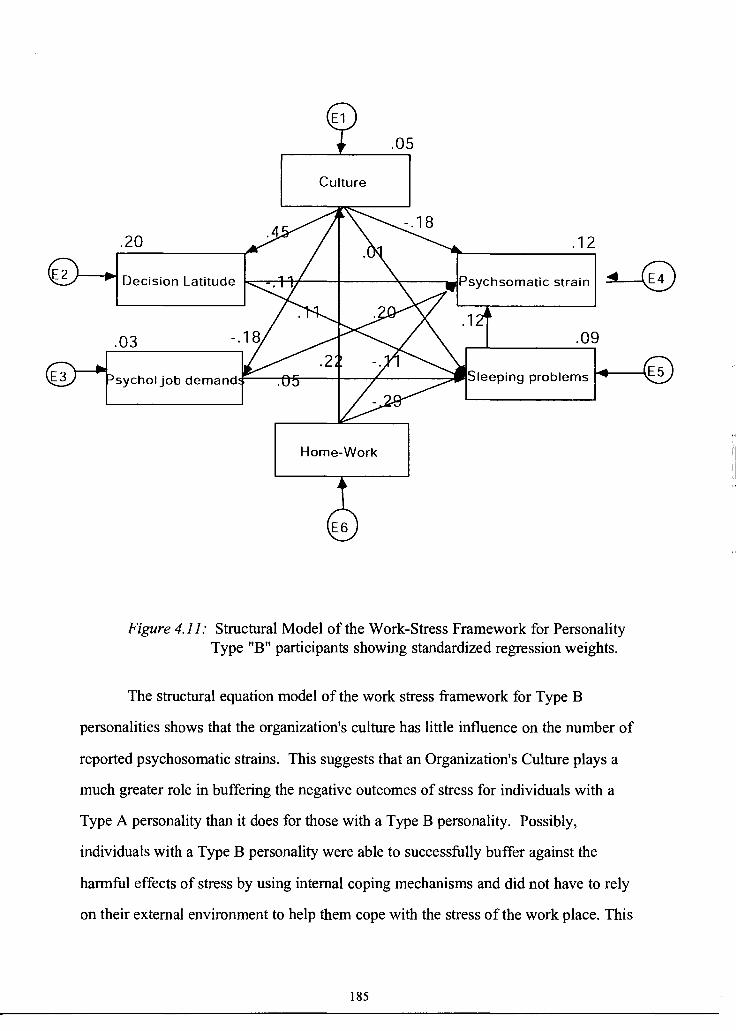
2
.05
Culture
.20 .12
Decision Latitude ~
.03 .09
sychol job demand Sleeping problems
Home-Work
Figure 4.11: Structural Model of the Work-Stress Framework for Personality Type "B" participants showing standardized regression weights.
The structural equation model of the work stress framework for Type B
personalities shows that the organization's culture has little influence on the number of
reported psychosomatic strains. This suggests that an Organization's Culture plays a
much greater role in buffering the negative outcomes of stress for individuals with a
Type A personality than it does for those with a Type B personality. Possibly,
individuals with a Type B personality were able to successfully buffer against the
harmful effects of stress by using internal coping mechanisms and did not have to rely
on their external environment to help them cope with the stress of the work place. This
185
ES
111
iii ,I
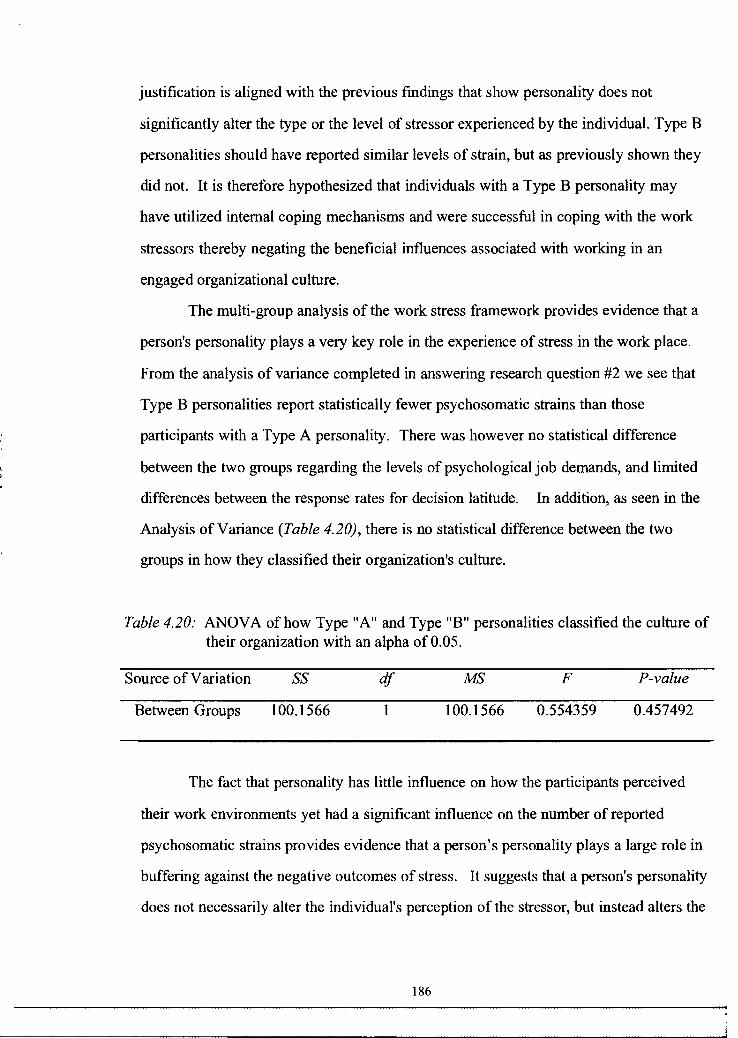
justification is aligned with the previous findings that show personality does not
significantly alter the type or the level of stressor experienced by the individual. Type B
personalities should have reported similar levels of strain, but as previously shown they
did not. It is therefore hypothesized that individuals with a Type B personality may
have utilized internal coping mechanisms and were successful in coping with the work
stressors thereby negating the beneficial influences associated with working in an
engaged organizational culture.
The multi-group analysis of the work stress framework provides evidence that a
person's personality plays a very key role in the experience of stress in the work place.
From the analysis of variance completed in answering research question #2 we see that
Type B personalities report statistically fewer psychosomatic strains than those
participants with a Type A personality. There was however no statistical difference
between the two groups regarding the levels of psychological job demands, and limited
differences between the response rates for decision latitude. In addition, as seen in the
Analysis of Variance (Table 4.20), there is no statistical difference between the two
groups in how they classified their organization's culture.
Table 4.20: AN OVA of how Type "A" and Type "B" personalities classified the culture of their organization with an alpha of 0.05.
Source of Variation SS df MS F P-value
Between Groups 100.1566 1 100.1566 0.554359 0.457492
The fact that personality has little influence on how the participants perceived
their work environments yet had a significant influence on the number of reported
psychosomatic strains provides evidence that a person's personality plays a large role in
buffering against the negative outcomes of stress. It suggests that a person's personality
does not necessarily alter the individual's perception of the stressor, but instead alters the
186
coping mechanisms utilized by the person to mitigate against the impacts of the stressor
itself.
Organizational Culture Characteristics
Research Question 5: What characteristics of organizational culture are closely
related to the job stress framework, psychosomatic strains, and sleeping
problems?
The research question posed above attempts to determine which aspects of an
organization's culture most heavily influence the work-stress framework. By
determining which characteristics of an organization's culture have the greatest loading
in the structural model of work stress, a directed approach to stress reduction can be
developed. The path diagram shown in Figure 4. 12 shows each of the endogenous
variables used to characterize the organizational culture of ExxonMobil Canada shortly
after the merger of the two companies. The influence of each of these variables on the
work stress framework is represented by its factor loading as seen in Figure 4.12.
187
Iii Iii ,.1
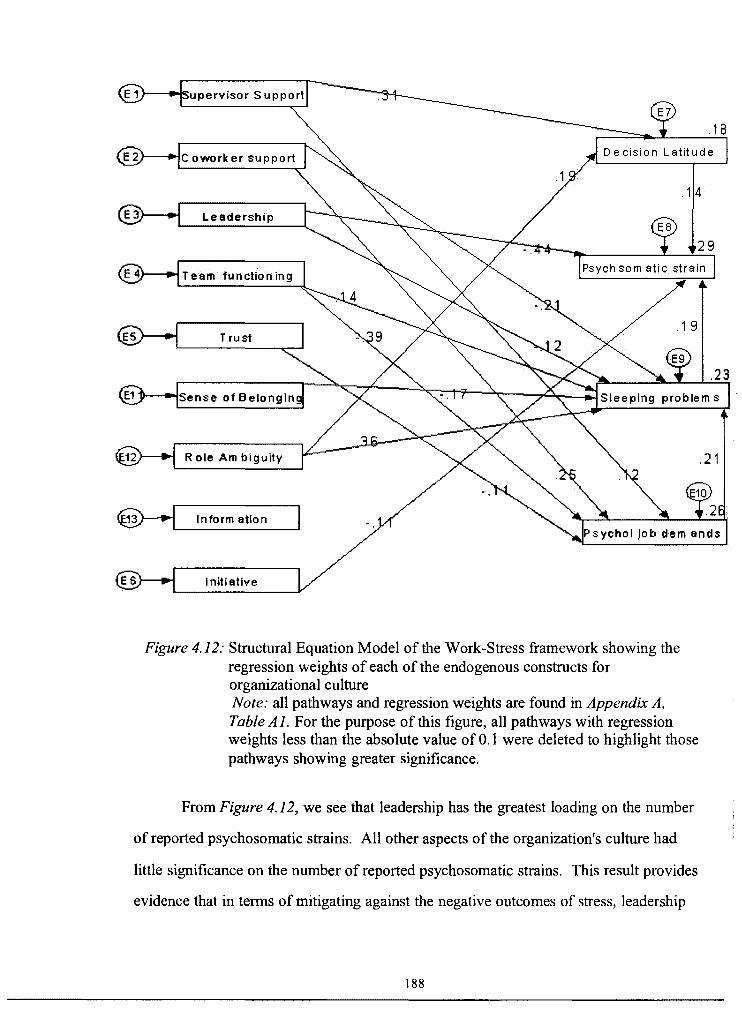
Coworker support
.14
Leadership
29
Team functioning
. 1 9 Trust
Sense of Belonging
Role Ambiguity
@----.-.-! Information
Initiative
Figure 4.12: Structural Equation Model of the Work-Stress framework showing the regression weights of each of the endogenous constructs for organizational culture Note: all pathways and regression weights are found in Appendix A, Table Al. For the purpose of this figure, all pathways with regression weights less than the absolute value of 0.1 were deleted to highlight those pathways showing greater significance.
From Figure 4.12, we see that leadership has the greatest loading on the number
of reported psychosomatic strains. All other aspects of the organization's culture had
little significance on the number of reported psychosomatic strains. This result provides
evidence that in terms of mitigating against the negative outcomes of stress, leadership
188
.23
.21
plays a very key role. These results support the findings of Evans, (2003) who reports
that the management styles exhibited by department heads are a significant factor in
postulating the levels of stress reported by teachers.
To expand on this relationship further a correlation matrix was developed and is
shown in Table 4.21. The correlation matrix shows that reported psychosomatic strain
has the greatest correlation with the type of leadership reported by the employees.
Although these findings point towards leadership as being a key predictor of work place
stress it has to be noted that the error variance is quite large for psychosomatic strains
and that the model only accounted for 0.34 of the total expected variance. This suggests
that there are other factors influencing employee psychosomatic strains not accounted
for in the proposed model. So far, this paper has only looked at organizational culture as
a means to buffer against the negative outcomes of stress. It must also be considered
that organizational culture may not only function as a buffer to stress, but also act as a
psychosocial or bioecological stressor as well.
As is often the case, too much or too little of a stimulus results in a sub-optimal
response. The same holds true with psychological and physiological responses. For
example, it is well know that exercise in moderation increases a person's overall level of
fitness, but it is equally well known that too much exercise can result in over-training
and not enough exercise can lead to obesity, both of which result in a lower level of
fitness. The same can be said for the endogenous constructs used in this study. Each
construct has the ability to act as both a stressor and a buffer of stress depending on the
personality of the individual and the framework in which the construct manifests itself.
189

Table 4.21: Correlation of endogenous constructs used in the study.
v (/) v Sll (/) CJ ~ C:
C") ~ ::0
(1) (1) C) '1J 0 (1) :; C) :::r (1) ~ C) (1) r- :i 0 V)
v;· 0 -. 0 :::r '1J (1) [ CD (1) V) o' a· c:: " * J: 0 5· ~ ~ ::;, )::,. 0 v;· 0 <o Q. fil· -. :; 0 (1) :3 ~ :3 ....,
0- 0 -. :3 ~ '1J (1) ~ C: 0::, r- -. vl :3 V) ....
i ~ Q. (/) (/) (1) .... -. .... ~- .... (1) .... (1) C: o· 0 :::r (1) a· 0 C: 0-2 :3 1:::) 1:::) V)
CD -5· :; C: :;
~ 1:::) 1:::) ~
Q. <o Q. :; 0 0 :3 :j" (1) Q. ~ ~ :'5" V) <o
Decision 1.00 Latitude
PsycholJob -0.08 1.00 Demands
Supervisor 0.42 0.02 1.00
Support Coworker
0.25 -0.01 0.46 1.00 Support
Home 0.13 -0.08 0.17 0.34 1.00
Psychsomatic -0.01 0.20 -0.17 -0.20 -0.14 1.00
Strain Sleeping
0.09 0.17 0.04 -0.10 -0.18 0.24 1.00 Problems
Leadership 0.34 -0.20 0.42 0.29 0.09 -0.44 -0.05 1.00
Team 0.15 -0.30 0.31 0.60 0.39 -0.24 -0.02 0.33 1.00
Trust 0.33 -0.21 0.38 0.31 0.03 -0.32 -0.03 0.76 0.31 1.00
Initiative 0.21 -0.10 0.16 0.22 0.12 -0.23 -0.02 0.31 0.20 0.31 1.00
Information 0.32 -0.13 0.39 0.35 0.23 -0.26 -0.01 0.54 0.27 0.54 0.35 1.00
Role 0.37 -0.16 0.37 0.31 0.00 -0.17 0.16 0.57 0.31 0.62 0.31 0.58 1.00
Ambiquity Sense of
0.17 -0.16 0.24 0.27 0.00 -0.23 -0.12 0.45 0.27 0.55 0.18 0.35 0.46 1.00 Belonging
Culture 0.46 -0.17 0.63 0.62 0.21 -0.33 0.00 0.77 0.54 0.77 0.34 0.75 0.76 0.59 1.001
190
Major Findings
From a total population of 382, surveys were received from 189 people for a
return rate of 49%. Of the 189 surveys returned, 180 were returned with complete
information for a completion rate of 95%. Of the nine questionnaires that had missing
data, six were deemed as usable within the study by using Maximum Likelihood
Estimation to fill in missing data. This resulted in an effective sample of size of 186.
The Analysis of Variance completed on each of the demographic variables
assessed in this study shows that certain demographic characteristics have a significant
influence within the work-stress framework. This finding reconfirms the complexity of
stress response processes and the need for further research into this area. Stress is a
personal phenomenon and our responses to it can vary a great deal according to the
work situation. It is therefore not surprising that this study showed demographics to
have some influence in the work-stress framework. Table 4.22 highlights which
components of the work-stress framework are most heavily influenced by the
demographic characteristics of the participants.
The findings associated with each of the five Research Questions are as follows.
Finding One: Certain Demographic characteristics have a significant
influence on an employee's perception of stress.
Certain demographic characteristics are shown to have a significant influence
within the work-stress framework and have to be accounted for when investigating the
antecedents of work place stress.
191

Table 4.22: Summary of the results for the Analysis of Variance completed on the demographic variables of participants as related to the work stress framework. Statistically significant impacts at an alpha of 0.05 are indicated by a checkmark.
~ c:n '< ~ 0 c:n U) U)
t::::, ::," '< - ~ g ('1) 0 0 ('1) U) - ::," ('1) 0 0 0 0 t""' i-:J s- c:n -· 0 'a - ('1) O'Cl 0 - ('1) c:n c:n Jg" -· ('1) ('1) t:S a, -· -· 0 0 0 0 ll> ll> 8 ~ -· i 8 - p.. - ~
-, t:S ll> -· - ~ U) ('1) ll> t;i::, t""' ...... ll> '""I ~ ct . - a .g c:n c:n ('1) ll> 0 ....
::," 0 - < - .... -- er' 0 .... ~ 8 .... er' 'a .....
~ ('1) 0 a ft U) - 0 'a t:S ('1) ~- O'Cl p.. i:;- 8 ::I. -· ('1) 8 ll> t:S
8. s· c:n O'Cl
Variable c:n c:n
Age ,I ,I ,I ,I ,I ,I ,I ,I
Education ,I ,I ,I ,I
Classification ,I ,I
Time on Job ,I ,I ,I
Gender ,I ,I ,I ,I
Work Location ,I ,I
Marital Status
From Table 4.22 we see that the demographic variables assessed in this study
play a key role in the work stress framework. Age appears to have the greatest influence
on the work-stress framework followed by Education and Gender. This supports the
finding of Cohen, Schwartz, Bromet and Parkinson(l991) who regarded age as a
significant factor that confounds the effect of stressors on employee health status.
Although this study shows that Gender and Education play an important role within the
work stress framework, neither of these demographic features have a significant impact
on the level of psychosomatic strain experienced by the employee.
This finding suggests that gender and education play a role in how the individual
interprets and responds to their working environment but does not necessarily impact the
192

L
level of stress experienced the individual. Ptacek, Smith & Dodge, ( 1994) reported
similar findings when they discovered that males and females exhibited similar stress
levels when exposed to the same stressful event, but found that males and females
employed different coping mechanisms. These results also support the finding of
Greenglass (1995) who, reported there were no gender differences in levels of reported
stress when controlling for occupation and position.
Surprisingly, marital status of the participants in this study did not have a
significant influence on any of the endogenous variables used to characterize the work
stress framework. While the results of the Analysis of Variance shows that many of the
demographic effects are significant, further analysis suggests that many of these effects
may be of little theoretical significance due to the small differences seen in the mean
values when compared to the error variance for each response category.
Finding Two: Personality plays a key role in the work-stress framework.
As evidenced by the ANOVA conducted on the responses given by each
personality type it is clear that personality plays a key role in the work-stress framework
(see Table 4.23). Further analysis of these results suggests that an individual's
personality acts as a mediator of stress rather than changing how an individual perceives
a workplace stressor. The exact mechanisms a Type "B" person utilizes to effectively
mitigate against the negative outcomes of stress were not apparent in this study and is an
area for further investigation.
Finding Three: Home-work interface influences both the level of
psychosomatic strains reported by employees and how the employees perceive
the level of trust in the organization.
193
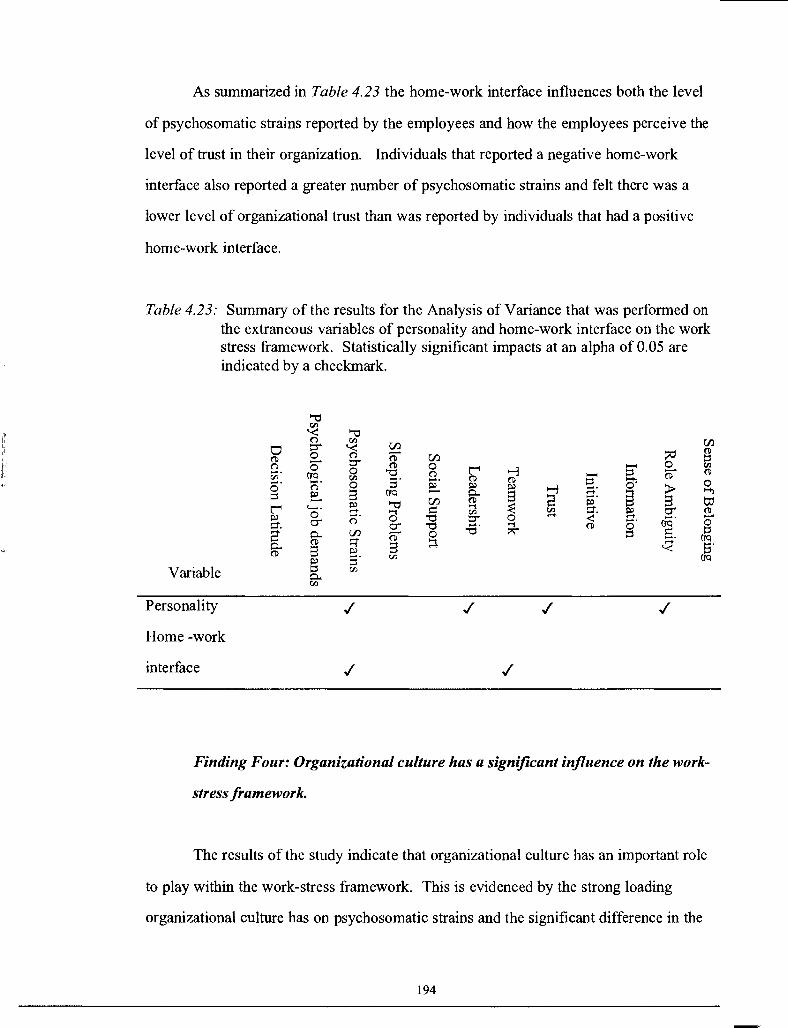
,,, !, :1 'I' L
As summarized in Table 4.23 the home-work interface influences both the level
of psychosomatic strains reported by the employees and how the employees perceive the
level of trust in their organization. Individuals that reported a negative home-work
interface also reported a greater number of psychosomatic strains and felt there was a
lower level of organizational trust than was reported by individuals that had a positive
home-work interface.
Table 4.23: Summary of the results for the Analysis of Variance that was performed on the extraneous variables of personality and home-work interface on the work stress framework. Statistically significant impacts at an alpha of 0.05 are indicated by a checkmark.
Variable
Personality
Home-work
interface
~ (1) 0 -· r.n -· 0 l:l r' ~ ..... -· a p.. (1)
'"O r.n '< 0 ::,' 0 0
/JC/ ;::;· e. '-· 0 cr" p.. (1)
s ~ ::s p.. r.n
'"O r.n
(f'J '< 0 ~ (f'J ::,' (1) 0 0 "C 0 r.n -· -· 0 l:l ~ s /JC/ -~ '"O (f'J ..... '"'I s:: ;::;· 0 "C
cr" "C (f'J ~ 0 .....
~ '"'I s ~ s· [/J
r.n
./
./
r./) (1) ::,:, l:l
r' s 0 VJ .., - ~ (1) (1) (1) l:l 8' g- ~
.., > 0 -· ...., ..... 8 8 -· s '"'I ~ 0::,
~ r.n a-. ~ cr" (1)
0 ..... <: ~- --· 0 -· ~ (1) 0 "C t: l:l ::s ~- (JQ
s· (JQ
./ ./ ./
./
Finding Four: Organizational culture has a significant influence on the work
stress framework.
The results of the study indicate that organizational culture has an important role
to play within the work-stress framework. This is evidenced by the strong loading
organizational culture has on psychosomatic strains and the significant difference in the
194

number of reported psychosomatic strains that are found between high strain individuals
working in an engaged organizational culture compared to high strain individuals
working in a restrictive organizational culture.
Organizational culture has a strong negative relationship with self-reported
psychosomatic strains, which means the more positive the organizational culture the
fewer reported cases of psychosomatic strains. Accordingly, a one-unit decrease of the
organizational culture measure drove a 0.536 increase in self-reported levels of
psychosomatic strains. Organizational culture does not however appear to have an
influence on how an individual perceives their working environment as evidenced the
low factor loading it has on psychological job demands. It does however have a direct
correlation with decision latitude suggesting that organizational culture may work within
the work stress framework as a buffer to job stressors rather than influence the
individual's perception of the stressor itself
Finding Five: Leadership plays a key role in predicting Psychosomatic Strains.
Analysis of the structural equation model developed to examine the influence of
organizational culture characteristics on the work-stress framework shows that
leadership plays a key role in predicting psychosomatic strains. Leadership exhibited a
higher loading on the number of reported psychosomatic strains within the work stress
framework than any of the other organizational characteristics being assessed. This is
evidenced in the structural equation model shown in Figure 4.12 where it shows
leadership to have a high negative factor loading (-0.44) on the number of
psychosomatic strains reported by study participants.
195

··~ !, 'I 1,
II ;1
,,I
Table 4.22: Summary of the results for the Analysis of Variance completed on the demographic variables of participants as related to the work stress framework. Statistically significant impacts at an alpha of 0.05 are indicated by a checkmark.
'"d f/l '< '"d 0 f/l Vl r/.l t, ::::r '< - ~ B ('1) 0 0 ('1) Vl
0 - ::::r ('1) 0 S' fl) -· 0 0 ,:, t'"'4 ..., - CD f/l OCI f/l -· 0 ('1) ('1) S' ~
('1) -· ..... ~ -· 0 0 0 0 I»
t ~ ..., .....
i 8 - ..... 8 1-+i ~ I»
~ ..... - I» '"d Vl I» t:t,
t'"'4 ..... ..... a .g ::t . a CD I» g. -· ::::r 0 ..... < .....
8 0 ..... ~ ..... er ,:, ..... ~ ('1) g -· [ ~ Vl <'D 0 ,:, ..... (G • :;r 8 ::\. '< (1) 8 ..... f/l Jg
I» ~ Variable [ f/l
f/l
Age ,I ,I ,I ,I ,I ,I ,I ,I
Education ,I ,I ,I ,I
Classification ,I ,I
Time on Job ,I ,I ,I
Gender ,I ,I ,I ,I
Work Location ,I ,I
Marital Status
From Table 4.22 we see that the demographic variables assessed in this study
play a key role in the work stress framework. Age appears to have the greatest influence
on the work-stress framework followed by Education and Gender. This supports the
finding of Cohen, Schwartz, Bromet and Parkinson ( 1991) who regarded age as a
significant factor that confounds the effect of stressors on employee health status.
Although this study shows that Gender and Education play an important role within the
work stress framework, neither of these demographic features have a significant impact
on the level of psychosomatic strain experienced by the employee.
This finding suggests that gender and education play a role in how the individual
interprets and responds to their working environment but does not necessarily impact the
192

Chapter IV Summary
In this chapter the results of the research were presented. The return rates and
characteristics of the survey returns were presented. An analysis of the demographic
characteristics of the survey participants was then offered. This was followed by a
discussion of the reliability and validity of the measurement scales used within the
study. Then, each research question is answered in turn with the use of a variety of
statistical instruments. Following the results of the statistical analysis, a summary of the
major findings was presented.
196

CHAPTERV
CONCLUSIONS
Introduction
In this chapter a summary of the analysis of the data is presented, along with
general and specific conclusions that can be drawn from the research. A summary of the
research problem, the specific research questions, results and conclusions is also
presented. Implications of the results and their extendibility is also discussed, followed
by recommendations for the application of these results and the need for additional
research.
Summary and Interpretations of the Results
This study examined how organizational culture affects job demands, job
control, psychosomatic strains, and sleeping problems. The first three research
questions addressed how extraneous variables such as personality; demographic
characteristics and the home-work interface interact with the work-stress framework.
The last two research questions involved the development of a structural equation
modeling to determine the role of organizational culture in the work-stress framework.
Self-administered questionnaires were distributed to all employees in
ExxonMobil's Western Canada operations through the company's internal electronic
mail system. The response rate was 49%. After data cleaning, 186 cases were used in
statistical analyses. The questionnaires gathered information on the constructs of job
197

demands and job control as work stressors, organizational culture, psychosomatic
strains, personality, the home-work interface, and collected specific demographic
information from each of the participants.
Based on a theoretical review and empirical studies, the measurement scales for
each of these constructs were developed and utilized to investigate their relationship
with the proposed work stress model. An examination of reliability and validity of the
measurement scales revealed that the measurement scale for each construct was reliable
and valid in terms of the internal consistency and accuracy of what they were supposed
to measure.
For an analysis of the structural equation, first, confirmatory factor analysis
(CF A) was conducted to refine the posited relationships of the observed indicators to the
construct. Through CF A processes, the uni-dimensionality of each construct was
confirmed and the composite reliabilities for each construct were calculated. A
structural equation model was utilized to identify the structural relationships between
the constructs. The structural model developed shows an excellent fit to the data as
evidenced by a chi-square to the degrees-of-freedom ratio of 1.15.
An assessment of the data focuses on four major findings:
1. an engaged culture buffers workplace stressors and is associated with fewer
reported psychosomatic strains,
2. the characteristics of an organization's culture work directly and indirectly to
influence the experience of stress by employees at a workplace,
3. the organizational characteristic to have the greatest influence on the number
of reported psychosomatic strains is leadership, and
4. the model used to assess the work-stress framework in this study has an
excellent fit with the data.
The demographics characteristics of the population were shown to have a
moderate but extensive influence on the constructs used within the model to characterize
the work stress framework. The demographic variables of the participants that appear to
198

have the greatest influence on the level of stress experienced by the employee are age,
gender and education. This is shown in Table 4.22 where we see that age had a
significant impact on eight of the twelve constructs used within the model, and gender
and education both had a significant influen;e on four of the twelve constructs used
within the work stress model. This finding reinforces the premise that demographic
characteristics be considered in discussions surrounding the theoretical framework of
work stress. This finding also provides evidence regarding the complexity of stress
response processes and the need for further research into this area.
Because stress is such a personal phenomenon and our responses to it vary
according to our work situations it is not surprising that this study provides evidence
that an individual's demographic characteristics influences how the individual perceives
stress. The demographics of the individual also play a role in the type of coping
mechanisms utilized by the individual to mitigate against the negative outcomes of
stress. It is also apparent that in addition to demographics, both the individual's
personality and their home-work interface play a role in the work-stress framework.
The findings of this study suggest that an individual's personality acts as a
mediator of stress rather than changing how the individual perceives their workplace.
This conclusion is supported by the results that show personality has little impact on
how a person reports workplace stressors but has a significant impact on the number of
reported psychosomatic strains. The results show us that participants with a Type A
personality report higher numbers of pyschosomatic strains than their Type B
colleagues. It is however unclear the exact mechanisms a Type "B" person utilizes to
effectively mitigate against the negative outcomes of stress and is an area for further
investigation.
In general, the findings of this dissertation support the demands-control-support
model of work stress proposed by Karasek and Theorell (1990). It is a relatively simple
theory that is referenced in most job stress literature. However, this study failed to
confirm the statement that high decision latitude counteracts the negative impacts of
199

high psychological workload. This statement is only proved correct if workers reported
that their work place exhibited characteristics associated with an engaged culture. When
on the other hand, a restrictive culture was reported the combination of high
psychological job demands and high decision latitude was associated with high ratings
for reported levels of psychosomatic strains. This result suggests that organizational
culture may play an important role as a moderator within the work-stress framework.
Although the results of this study demonstrate that organizational culture plays a
significant role in the work stress framework, it is apparent that a number of other
factors not evident in the model influence the level of stress experienced by employees
at the workplace. As noted earlier, organization culture, as defined by this study,
accounts 0.34 of the total variance seen in the reported number of psychosomatic strains.
Other items not explored within the scope of this study that may have contributed to this '
variance include such other variables as an employee's use of existing counseling
services, past history, response bias, socioeconomic status, or additional home-work
factors that were not assessed. Further investigation in these areas will be required to
explain the variances associated with the reporting of psychosomatic strains.
Nine characteristics of an organization's culture were assessed in this study to
expand our knowledge of the work-stress framework. The results show us that
organizational culture has a strong loading on both decision latitude and psychosomatic
strains. To examine this relationship further each of the nine organizational
characteristics was assessed using structural equation modeling to better define the
influence each of the characteristics has within the work-stress framework. The analysis
of the model showed that some characteristics such as supervisor support loaded heavily
on decision latitude and not on psychosomatic strains while other characteristics such as
leadership loaded heavily on psychosomatic strains and not decision latitude. This
suggests that some of the .characteristics of an organization's culture work indirectly
within the work-stress framework by influencing an employee's perception of work
place stressors while other characteristics have a more direct influence within the work-
200
stress framework. For example, leadership has a direct influence on the amount of stress
perceived by the employee as evidenced by leadership's strong loading on
psychosomatic strains.
This finding suggests that organizational culture can potentially have a
comprehensive and beneficial effect throughout the work-stress framework, rather than
simply influencing the link from one variable to another. These findings support and
build on the theoretical background of Karasek's (1979) demand-control-support model
and that of House's (1981) framework of occupational stress.
Karasek and Theorell (1990) noted that a change in social support and a change
in job control were almost inseparable when work stress was examined in relation to
work design. The relationship between social support and job control prompted
House to term "participatory work design processes" as a combination of job control
and social support changes. This implies that social support at work can enlarge the
latitude of job control and beneficially affect psychological strain. Similar results were
noted in this study supporting the demand-control-support model.
The results of this study showed that supervisor support had general beneficial
effects on psychosomatic strains, but did not have direct interaction effects on the
employees' level of strain. Israel, House, Schurman, Heaney, and Mero (1989) similarly
report that positive interpersonal relationships at work are significantly related to low
perceived work stressors, high job satisfaction, low depression, and low illness
symptoms. They did not however, include a discussion on the interaction effect of
social support although the hypothesized model of their study included some interaction
terms for social support. Their study implies that social support at work has clear
beneficial main effects on the whole work stress process but direct linkages could not be
found.
LaRocco, House and French (1980) found an interaction effect of social support
at work on the relationship between work stressors and general mental health, but failed
to find interaction effects on the relationship between work stressors and psychological
201

strain. In a literature review of community-based social support, Cohen and Wills
( 1985) conclude that the main effect of social support on stress is clear but the
interaction effect is not clear.
The structural equation models assessed in this study demonstrate that supervisor
and coworker support play a key role in the work stress framework; showing high factor
loading scores on both decision latitude and psychological job demands. The structural
equation models also demonstrate that leadership plays a much larger role within the
work stress framework by directly influencing the negative outcomes of stress rather
than influencing workplace stressors as does social support.
The characteristic of an organization's culture that appears to have the greatest
beneficial effect on the work-stress framework is that of leadership. In analyzing the
relationship between leadership and the proposed work-stress framework several
conclusions can be drawn. This study has shown that leadership plays a key role in both
defining an organization's culture and acting as moderator within the proposed work
stress framework.
Leaders characterized by those who are able to effectively communicate, appear
confident, provide clear direction, "walk their talk" relative to new initiatives and care
about people and not just fmancial performance play an important role in reducing
employee stress. Similar results were reported by Bell and Carter (2001) who conducted
a survey of medical workers and found an increase in employee stress and sickness
absence when their leadership displayed a laissez-faire or inactive leadership style.
They also found that 'Transformational' leaders inspired and intellectually stimulated
employees.
"The results of this dissertation show that it is possible to improve the health of
the worker by changing the organization of work towards a situation with reasonable
psychological work demands, and greater skill discretion and authority. Even more
importantly, improvements should be directed towards aligning the company's culture
with the ideals and principles characterized by an engaged organization. In particular,
202
this research showed that companies should concentrate their efforts on transforming
their Leadership to be responsive to the needs of its organizations from both a financial
and a personal perspective." (Bell & Carter, p. 42).
203

Implications
The implications of these results are varied. First, because this study is the first
of its type to be performed in this environment it provides baseline data to which others
might conduct a comparative analysis. Second, the information gained in this study is
useful to the various managers, supervisors, and employees of the Upstream Petroleum
Industry. It provides evidence that there are relationships between personal and
environmental characteristics that can be measured and perhaps manipulated, in the
design of effective stress reduction programs. These characteristics should however, be
measured again to establish the extent of their influence on the work stress framework
and begin to establish a chain of causality. As a final implication, as in all research
endeavors, without replication studies and the establishment of a "body" of knowledge
any interpretations of these data is subject to and open to further study.
The ability to generalize from data solely derived from questionnaires is limited
(Kerlinger, 1986). However, even though the task is difficult, when researchers seek to
measure attitudes the survey instrument can yield vital information. The beliefs,
opinions, attitudes, and feelings that participants have about cognitive objects are
important and can be interpreted with the use of questionnaires. It is however important
to verify the findings from questionnaires with observations by skilled assessors. Future
researchers should build on the findings presented in this study and conduct multifaceted
research using questionnaires and observational techniques expand on the importance of
organizational culture and specifically leadership in the work stress framework.
This study was founded on research that has been completed in other
organizations. The results of the previous studies were then compared to the results of
this study in an attempt to provide a weight of evidence in support for or against the
proposed hypothesis. In a like manner, the results of this study can be extended to other
situations building on the body of knowledge regarding the epidemiology of stress.
Obviously, the results will have a higher probability of usefulness in an environment
204
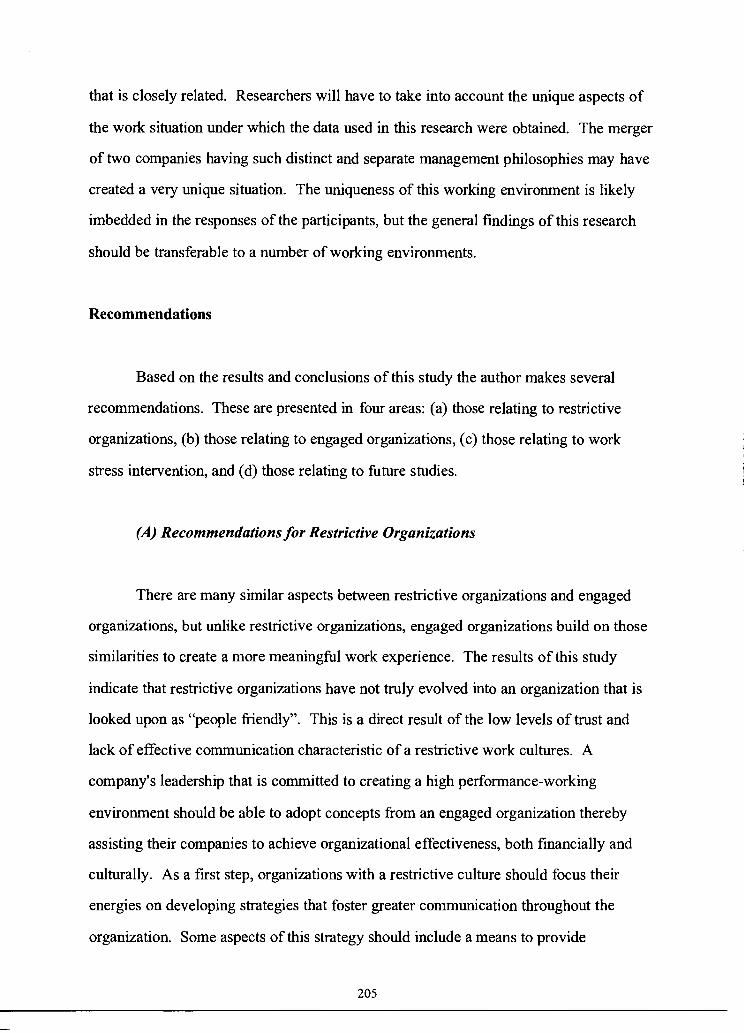
that is closely related. Researchers will have to take into account the unique aspects of
the work situation under which the data used in this research were obtained. The merger
of two companies having such distinct and separate management philosophies may have
created a very unique situation. The uniqueness of this working environment is likely
imbedded in the responses of the participants, but the general findings of this research
should be transferable to a number of working environments.
Recommendations
Based on the results and conclusions of this study the author makes several
recommendations. These are presented in four areas: (a) those relating to restrictive
organizations, (b) those relating to engaged organizations, ( c) those relating to work
stress intervention, and (d) those relating to future studies.
(A) Recommendations for Restrictive Organizations
There are many similar aspects between restrictive organizations and engaged
organizations, but unlike restrictive organizations, engaged organizations build on those
similarities to create a more meaningful work experience. The results of this study
indicate that restrictive organizations have not truly evolved into an organization that is
looked upon as "people friendly". This is a direct result of the low levels of trust and
lack of effective communication characteristic of a restrictive work cultures. A
company's leadership that is committed to creating a high performance-working
environment should be able to adopt concepts from an engaged organization thereby
assisting their companies to achieve organizational effectiveness, both financially and
culturally. As a first step, organizations with a restrictive culture should focus their
energies on developing strategies that foster greater communication throughout the
organization. Some aspects of this strategy should include a means to provide
205
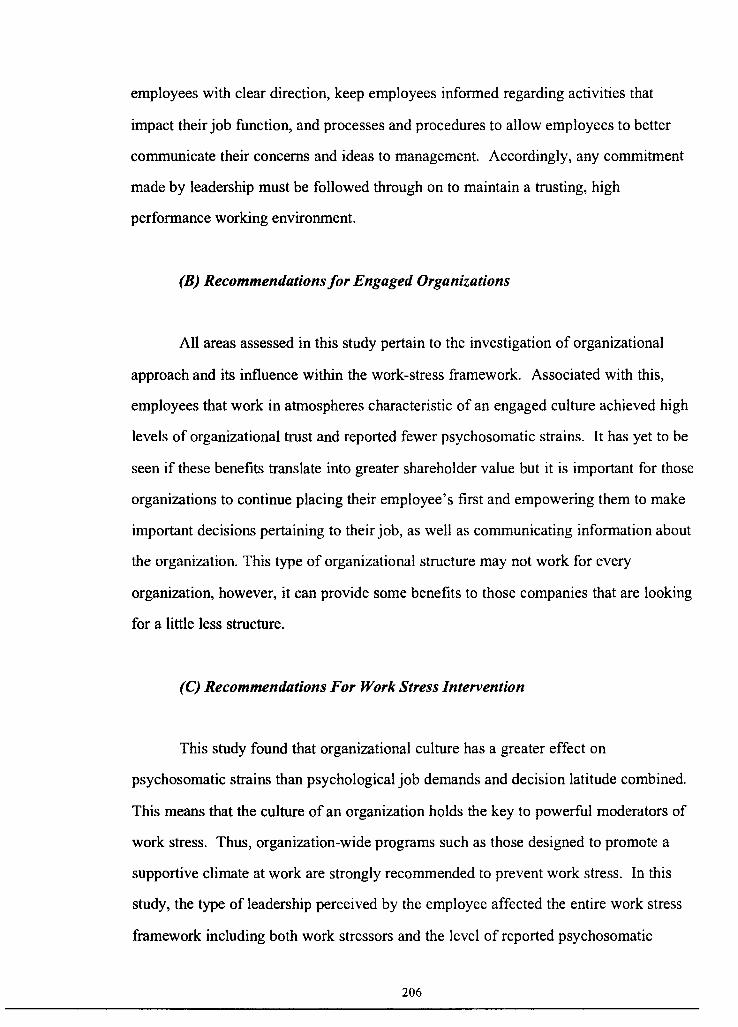
employees with clear direction, keep employees informed regarding activities that
impact their job function, and processes and procedures to allow employees to better
communicate their concerns and ideas to management. Accordingly, any commitment
made by leadership must be followed through on to maintain a trusting, high
performance working environment.
(B) Recommendations for Engaged Organizations
All areas assessed in this study pertain to the investigation of organizational
approach and its influence within the work-stress framework. Associated with this,
employees that work in atmospheres characteristic of an engaged culture achieved high
levels of organizational trust and reported fewer psychosomatic strains. It has yet to be
seen if these benefits translate into greater shareholder value but it is important for those
organizations to continue placing their employee's first and empowering them to make
important decisions pertaining to their job, as well as communicating information about
the organization. This type of organizational structure may not work for every
organization, however, it can provide some benefits to those companies that are looking
for a little less structure.
(C) Recommendations For Work Stress Intervention
This study found that organizational culture has a greater effect on
psychosomatic strains than psychological job demands and decision latitude combined.
This means that the culture of an organization holds the key to powerful moderators of
work stress. Thus, organization-wide programs such as those designed to promote a
supportive climate at work are strongly recommended to prevent work stress. In this
study, the type of leadership perceived by the employee affected the entire work stress
framework including both work stressors and the level of reported psychosomatic
206

strains. This result enlarges the significance of leadership to promote psychological
well-being at the work site. The related literature and the findings of this study suggest
that work stress negatively influences the entire well-being of an organization and that
leadership can act to comprehensively decreases work stress and its effects (Iverson,
Olekalns & Erwin, 1998; Baker, Israel, & Schurman, 1996). That is, work stress and
leadership should be essential components of work-site health promotion and work
stress prevention programs.
Many companies that have stress prevention programs focus the majority of their
efforts on decreasing the physical and psychological symptoms of stress. They use a
variety of techniques to treat stress-related symptoms such as physical therapy, massage,
education on coping strategies, and counseling for stress prevention These methods
work for stress release but are not effective in addressing the antecedents of work place
stress. If the cause of the stress is not addressed, employee stress levels will continue to
rise. Therefore, work place stress management programs that first attempt to address the
antecedents of stress will experience greater success in reducing employee stress levels
than those programs that focus on the symptoms of stress. Using this approach
combined with a high-level support in upper management will not only contribute to
stress prevention but also help to promote employee well-being.
(D) Recommendations for Future Studies
This study researched many writings in the field of occupational stress. The
study also reviewed associated coping mechanisms along with psychosomatic strains
and organizational culture. Subsequently a theoretical model relating to organizational
culture, stressors, and psychosomatic strains was presented.
The following recommendations for future studies are a result of the findings
and are as follows:
1. A study could be conducted on the complexity of stress responses.
207
I
I I

2. A study could conducted on the exact mechanisms a Type "B" person
utilizes to effectively mitigate against negative outcomes of stress
3. A study could be conducted to explain the variances associated with the
reporting of psychosomatic strains.
4. A study could be undertaken to identify what factors contributed to the
large variance of psychological job demands reported by individuals in
field locations.
5. A thorough analysis of the interactions between age, psychological job
demands, and psychosomatic measures is warranted to understand the
influence of age on the number of reported psychosomatic strains.
208

Chapter V Summary
In this chapter a summary of the findings has been presented. This included a
summary of the findings for each of the research questions along with comparisons to
the results of previously published research. A set of recommendations for the
application of the results was presented followed by recommendations for future studies.
This study provides evidence to support the theory that an engaged
organizational culture has specific characteristics that are able to buffer against the
negative outcomes of workplace stress. Perhaps the most important of these
characteristics is that of leadership. Leadership plays a key role in both defining culture
and moderating the influence of stressors on the psychological well being of the
employee. The suggestions for the implementation of the findings and for additional
research found at the end of Chapter V may serve to help guide the practice of those
who wish to tackle some of the wider implications raised by this study.
209
REFERENCES CITED
Adkins, J. A., Quick, J. C. & Moe, K. 0., (2000). Building world-class performance in
changing times. In L. R. Murphy & C. L. Cooper (Eds.), Healthy and Productive
Work: An International Perspective. London: Taylor & Francis.
Akersted, T., Knutsson, A., Westerholm, P., Theorell, T., Alfredsson, L., & Kecklund,
G. (2002). Sleep disturbances, work stress and work hours. A cross-sectional
study. Journal of Psychosomatic Research, 53(3), 741-748.
Anderson, J.C., & Gerbing, D. W. (1988). Structural equation modeling in
practice: A review and recommended two-step approach. Psychological Bulletin,
103, 411-423.
Andrews, J. & Field, R. (1998). Regrounding the concept of leadership. Leadership and
Organization Development Journal, 19(3), 128-136.
Aranda, M. P., & Knight, B. G. (1997). The influence of ethnicity and culture on the
caregiver stress and coping process: A socio-cultural review and analysis.
Gerontologist, 37, 342-354.
Arbuckle, J. L. ( 1996). Full information estimation in the presence of incomplete data.
In G.A.Marcoulides & R. E. Schumacker (Eds.), Advanced structural equation
modeling: Issues and techniques (pp. 243-278). Mahwah, NJ: Lawrence Erlbaum
Publishers.
210
Armeli, S., Eisenberger, R., Fasolo, P., & Lynch, P. (1998). Perceived organizational
support and police performance: The moderating influence of socioemotional
needs. Journal of Applied Psychology, 83, 288-297.
Bagozzi, R. P. (1980). Causal models in marketing. New York: Wiley.
Baker, E., Israel, B., & Schurman, S. (1996). Role of control and support in
occupational stress: An integrated model. Social Science and Medicine, 43,
1145-1159.
Bakker, AB., Schaufeli, W.B., Demerouti, E., Janssen, M.P., Van der Hulst, R.,
& Brouwer, J. (2000). Using equity theory to examine the difference between
burnout and depression. Anxiety Stress Coping, 13, 247-68.
Bandalos, D. L. (1997). Assessing sources of error in structural equation models: The
effects of sample size, reliability, and model misspecification. Structural
Equation Modeling, 4, 177-192.
Barefoot, J.C., Dahlstrom, W.G., & Williams, R.B. (1983). Hostility, CHD incidence,
and total mortality: A 25 year follow-up of 255 physicians. Psychosomatic
Medicine, 45, 59-63.
Barlow, D.H. (Ed.). (2001). Clinical handbook of psychological disorders: A step-by
step treatment manual (3rd ed ). New York: Guilford Press.
Barnett, R.C. (1996). A Review of Work/Family Literature. Boston: Wellesley College
Center for research of Women.
211
Baruch, Y., & Woodward, S. (1998). Stressful situations? The case of Management
buyout/buyins. Management Decision, 36(10), 641-648.
Bass, B.M. (1985). Leadership and performance beyond expectations. New York:
Free Press.
Bass, B., & Avolio, B. (2000). The Multifactor Leadership Questionnaire (2nd. ed).
Redwood City, CA: Mind Garden, Inc.
Bell, J., & Carter, A (2001). Leadership Links to Stress. Sheffield: Institute of Work
Psychology, University of Sheffield.
Bentler, P. M. (1990). Comparative fit indexes in structural models. Psychological
Bulletin, 107, 238-246.
Berry, L. (1998). Psychology at work. Boston, McGraw-Hill.
Bigos, S. J., Battie, MC., Spengler, D. M., Fisher, L.D., Fordyce W. E., Hansson, T. H.
Nachemson, A. L., & Wortley, M. D. (1991). A prospective study of work
perceptions and psychosocial factors affecting the report of back injury. Spine,
16, 1-6.
Bluen,S.D., Barling, J., & Bums, W. (1990). Predicting job satisfaction and depression
using the impatience and achievement striving dimensions of Type A behaviour.
Journal of Applied Psychology, 75, 212-216.
212
Blumenthal, J., McKee, D., Haney, T., & Williams, R. (1980). Task incentives, type A
behavior pattern, and verbal problem solving performance. Journal of Applied
Social Psychology, 10, 101 -111.
Bollen, K. A. (1989). Structural equations with latent variables. New York: Wiley.
Bollen, K. A., & Long, J. S. (1993). Testing Structural Equation Models, Newbury
Park, CA: Sage.
Bongers, P. M., Winter, C.R., Kompier, M.A., & Hildebrant, V. H. (1993).
Psychosocial Factors at Work and Musculoskeletal Disease, Scandinavian
Journal of Work, Environment, & Health. 19(5), 297-312
Bortner, R. W. (1969). A short rating scale as a potential measure of Pattern A behavior.
Journal of Chronicle Disease, 22, 87-91.
Brief, A.P., Burke, M.J., George, J.M., Robinson, B.S., & Webster, J. (1988). Should
negative affectivity remain an unmeasured variable in the study of job stress?
Journal of Applied Psychology, 73, 193-198.
Broadbent, D., & Gath, D. (1981). Symptom Level in Assembly Line Workers. Report
to the British Medical Research Council. University of Oxford, Oxford,
England.
Bromet, E. J., Dew, M. A., Parkinson, D. K., & Schulberg, H. C. (1988). Predictive
effects of occupational and marital stress on the mental health of a male
workforce. Journal of Organizational Behavior, 9, 1-13.
213
Bromet, E. J., Dew, M.A., & Parkinson, D. K., (1990). A study of blue-collar working
wives. In J. Eckenrode & S. Gore (Eds), Stress Between Work and Family (pp.
133-152). New York: Plenum Press.
Browne, M. W., & Cudeck, R. (1993). Alternative Ways of Assessing Model Fit. In K.
Bollen & J. Long (Eds.), Testing Structural Equation Models (pp. 136-62).
Newbury Park, California: Sage Publications, Inc.
Brown, G. W., & Harris, T. (1978). Social origins of depression: A study of
psychiatric disorders in women. London, UK: Taristock.
Burt, V.L., Whelton, P., Roccell, E.J., Brown, C., Cutler, J.A., Higgins, M., Haran, M.J.,
& Labarthe, D. ( 1995). Prevalence of hypertension in the US adult population:
results from the third National Health and Nutrition Survey, 1988-1991.
Hypertension, 25, 305-13.
Burvill, P. W. (1995). Recent progress in the epidemiology of major depression
Epidemiologic Review, 17, 21-31.
Byrne, B. M. (1998). Structural equation modeling with LISREL, PRELJS, and
SJ MP LIS: Basic concepts, applications, and programming. Mahwah, NJ:
Lawrence Erlbaum Associates, Inc.
Byrne, B. M. (200 l ). Structural equation modeling with AMOS: Basic concepts,
applications, and programming. Mahwah, NJ: Lawrence Erlbaum Associates,
Inc.
214

Buono, A.F., & Bowditch, J.L. (1989). The Human side of Mergers and Acquisitions.,
San Francisco, CA: Jossey-Bass.
Burisch, M. (1993). In Search of Theory: Some Ruminations on the Nature and Etiology
of Burnout. In W. B. Schaufeli, C. Maslach & T. Marek (Eds.), Professional
burnout: recent developments in theory and research (pp. 75-94). Washington,
DC: Taylor & Francis.
Calnan, M., Wainwright, D., Forsyth, M., Wall, B., & Almond, S. (2001). Mental
health and stress in the workplace: the case of general practice in the UK. Social
Science and Medicine, 52, 499-507.
Cameron, K. S., & Quinn, R. E. (1999). Diagnosing and changing organizational
culture. Reading, MA.: Addison-Wesley.
Campbell, D. T., & Stanley, J. C. (1966). Experimental and Quasi-Experimental
Designs For Research. Chicago, IL: Rand McNally.
Caplan, G. (1974). Support systems and community mental health: Lectures on concept
development. New York: Behavioral Publications.
Carter, A. J., & West, M.A. (1999). Sharing the burden- teamwork in health care
settings. In R. Payne & J. Firth-Cozens (Eds.), Stress in Health Professionals:
Psychological and organisational causes and interventions (pp. 191-202).
Chichester: Wiley.
215
Chandraiah, K., Agrawal, S. C., Marimuthu, P., & Manoharan, N. (2003). Occupational
Stress and Job Satisfaction Among Managers. Indian Journal Of Occupational
And Environmental Medicine, 7(2).
Chatterjee, R. A. (2000). The financial performance of companies acquiring very large
takeover targets. Applied Financial Economics, 10(2), 185-191.
Cherniss, C. ( 1980). Staff burnout : job stress in the human services. Beverly Hills,
Calif.: Sage Publications.
Cherrington, D.J., Condie, S.J., & England, J.L. (1979). Age and work values. Academy
of Management Journal, 22.
Cherry, N. (1984). Nervous strain, anxiety and symptoms amongst 32-year-old men at
work in Britain. Journal of Occupational Psyschology, 57, 95-105.
Cohen, S. & Hoberman, H. (1983). Positive events and social supports as buffers of life
change stress. Journal of Applied Psychology, 13, 99-125.
Cohen, S. & Wills, T. A. (1985). Stress, social support, and the buffering hypothesis,
Psychological Bulletin, 98, 310-357.
Cohen, S. ( 1988). Psychosocial models of the role of social support in the etiology of
physical disease, Health Psychology, 7, 269-297.
Cohen, S., Schwartz, J.E., Bromet, E. J., & Parkinson, D. K. (1991). Mental health,
stress, and poor health behaviors in two community samples, Preventive
Medicine, 20, 306-315.
216

Cooke, R. A., & Szumal, J. L. (1993). Measuring normative beliefs and shared
behavioral expectations in organizations: the reliability and validity of the
organizational culture inventory, Psychological reports, 72, 1299-1330.
Cooper, C. L., Kirkcaldy, B. D., & Brown, J. (1994). A model of job stress and physical
health: The role of individual differences. Personality and Individual
Differences, 16, 653-655.
Cooper, C.L. (Ed.). (1998). Theories of organizational stress., Oxford: Oxford
University Press.
Cordery, J. L., Mueller, W. S., & Smith, L. M. (1991). Attitudinal and behavioural
effects of autonomous group working: A longitudinal field setting. Academy of
Management Journal, 34(2), 464-476.
Cordes, C.L., & Dougherty, T.L. (1993) A Review and an integration of research on Job
burnout. Acad. Manage. Rev. 18:621-56.
Costos, D. (1986). Sex role identity in young adults: Its parental antecedents and relation
to ego development. Journal of Personality and Social Psychology, 50, 602-611.
Cronbach, L. J., & Meehl, P. E. (1955). Construct validity in psychological tests.
Psychological Bulletin, 52, 281- 302.
Culbert, S. A, & McDonough, J. J. (1985). Radical management: Power, politics and
the pursuit of trust. New York: Free Press.
217

Deal, T. A., & Kennedy, A. A. (1982). Corporate Cultures: Rites and Rituals of
Corporate Life. Addison: Wesley.
Defrank, R. S. (1988). Psychometric measurement of occupational stress: Current
concerns and future directions. In J. J. Hurrell, L. R. Murphy, S. L. Sauter, & C.
L. Cooper (Eds.), Occupational Stress: Issues and development in research (pp.
54-65). New York: Taylor and Francis.
Denison, D.R. (1996). What is the difference between organizational culture and
organizational climate? A native's point of view on a decade of paradigm wars.
Academy of Management Review, 21 (3), 619-654.
DeVellis, R. F. (1991). Scale development: Theory and applications. Newbury
Park: Sage Publications.
Doi, Y., Minowa, M., & Tango, T. (2003). Impact and correlates of poor sleep quality in
Japanese white-collar employees. Sleep, 26, 467-471.
Driskell, J.E., & Salas, E. (1991). Group decision making under stress. Journal of
Applied Psychology, 76(3), 473-478.
Driskell, J.E., & Salas, E. (Eds.). (1996). Stress and human performance. Lawrence
Erlbaum Associates, Inc.
Dunckel, H. ( 1991 ). Multiple load and psychosocial health. In E. Seize, E. Bamberg, &
N. Emmer (Eds.), Psychological stress on the job (pp. I 03-117). Heidelberg:
Asanger.
218

Dwyer, D., J. & Ganster, D. C. (1991). The effects of job demands and control on
employee attendance and satisfaction. Journal of Organizational Behavior, 12,
595-608.
Edwards, J. R., Caplan, R. D., & Harrison, R. (1998). Person-Environment fit
theory: conceptual foundation, empirical evidence, and directions for future
research. In C.L. Cooper (Ed.), Theories of organizational stress (pp. 28-67).
New York: Oxford University Press.
Edith Cowan University, (2003). Doctoral and Masters by Research Handbook.
[Brochure]. Perth, Western Australia: Author.
Eisenberg, R., Fasolo, P., & Davis-LaMastro, V. (1990). Perceived organizational
support and employee diligence, commitment, and innovation. Journal of
Applied Psychology, 75(1), 51-59.
Eisenberg, R., Cummings, J., Armeli, S., & Lynch, P. (1997). Perceived organizational
support, discretionary treatment, and job satisfaction. Journal of Applied
Psychology, 82, 812-820.
Eisenbach, R., Watson, K., & Rajnandini, P. (1999). Transformational leadership in the
context of organizational change. Journal of Organizational Change
management, 12(2), 80-88.
Estryn-Behar, M., Kaminski, M., Peigne, E. (1990). Stress at work and mental health
status among female hospital workers. British Journal of Industrial Medicine,
47, 20-28.
219

Evans, P. (2003). The relationship between management style and teacher stress.
National College for School Leadership, Plenum.
Fauvel, J.P., Quelin, P., Dueber, M., Rakotomalala, H., & Laville, M. (2001). Perceived
job stress but not individual cardiovascular reactivity to stress is related to higher
blood pressure at work. Hypertension, 38(1), 71-5.
Field, D. (1976). The social definitions of illness. In Tuckett (Ed.), An Introduction to
medical sociology (pp. 334-336). London: Tavistock.
Foster-Fishman, P. G., & Keys, C. B. (1997). The person/environment dynamics of
employee empowerment: an organizational culture analysis. American Journal of
Community Psychology, 25(3), 345-370.
French, J., & Caplan, R. D. (1970). Psychosocial Factors in CHD. Industrial Medicine
and Surgery, 39, 383-397.
Frese, M. (1985). Stress at work and psychosomatic complaints: a causal interpretation.
Journal of Applied Psychology, 70, 314-328.
Frese, M., & Zapf, D. (1988). Methodological issues in the study of work stress:
Objective vs. subjective measurement and the question of longitudinal studies. In
C.L. Cooper, & R. Payne (Eds.), Causes, coping, and consequences of stress at
work (pp. 375-411). Chichester: Wiley.
Fried, Y., Rowland, K.M., & Ferris, G.R. (1984). The physiological measurement of
work stress: A critique. Personnel Psychology, 37, 583-615.
220
Friedman, M., & Rosenman, R. (1974). Type A behaviour and your heart. New York:
Knopf.
Gable, K. R., & Wolf, B. M. (1993). Instrument development in the affective domain
(2nd ed.). Boston: Kluwer.
Ganster, D. C. (1989). Worker control and well-being: A review ofresearch in the
workplace. In S.L. Sauter, J. J. Hurrell, & C. L. Cooper (Eds.), Job control and
worker health (pp. 3-23). New York: John Wiley & Sons.
Garland, L., & Bush, C. (1982). Coping Behaviors and nursing. Reston, VA: Reston
Publishing.
Geller, P. A., & Hobfoll, S. E. (1994). Gender differences in job stress, tedium, and
social support in the workplace. Journal of Social and Personal Relationships,
11, 555-572.
Gherardi, S. (1994). The Gender we Think, The Gender we Do in our Everyday
Organizational Lives, Human Relation, 46(7).
Gianakos, I. (1999). Patterns of career choice and career decision-making self-efficacy.
Journal of Vocational Behavior, 54, 244-258.
Goll, I., & Zeitz, G. (1991). Conceptualizing and measuring corporate ideology.
Organization Studies, 12, 191-207.
Grazian, F. (1994). Are you coping with stress? Communication Briefings, 12(5), 3.
221
Greenglass, E. R. (1995). Gender, work stress, and coping: Theoretical implications.
Journal of Social Behavior and Personality, 10(6), 121-134.
Greiner, B. A. (2000). Expert-observer assessment of job characteristics. In P. L.
Schnall, K. Belkic, P. Landsbergis, & D. Baker (Eds.), The workplace and
cardiovascular disease (Vol. 15, 163-188). Philadelphia: Hanley & Belfus.
Greller, M. M., Parsons, C. K., & Mitchell, D.R. (1992). Additive effects and beyond:
Occupational stressors and social buffers in a police organisation. In J. C. Quick,
L. R. Murphy, & J. J. Hurrell (Eds.), Stress and Well-being at Work:
Assessments and Interventions for Occupational Mental Health. American
Psychological Association.
Gulliksen, H. & Tukey, J. (1958). Reliability for the law of comparative judgement.
Psychometrika, 23, 95-110.
Gundry, L. K., & Rousseau, D. M. (1994). Critical incidents in communicating culture
to newcomers: The meaning is the message. Human Relations, 47, 1063-1088.
Gurin, G., Veroff, J., & Feld, S. (1960). American View Their Mental Health. New
York.: Basic Books.
Hancock, P.A. ( 1986). The effect of skill on performance under an environmental
stressor Aviation Space and Environmental Medicine, 57, 59-64.
Hagberg, R., & Heifetz, J. (1999). Cultural Assessment Tool. New York: Hagberg
Consulting Group.
222

Hair, J. F., Anderson, R. E., Tatham, R. L., & Black, W. C. (1995). Multivariate Data
Analysis (4th ed). Upper Saddle River, NJ: Prentice Hall.
Hair, J. F., Anderson, R. E., Tatham, R. L., & Black, W. C. (1998). Multivariate
Data Analysis with Readings. New York: Macmillan Publishing.
Hall, W. D., Ferrario, C. M., Moore, M.A., Hall, J. E., Flack, J. M., Cooper, W.,
Simmons, J. D., Egan, B. M., Lackland, D. T., Perry, M., & Roccella, E. J.
( 1997). Hypertension related morbidity and mortality in the southeastern United
States. American Journal of Medical Sc fence, 313, 195-206.
Halpin, A. & Winer, B. (1963). A factorial study of the leader behavior descriptions. In
R. Stogdill & A. Coons (Eds.), Leader behavior: Its description and
measurement. Columbus, OH: Ohio State University, Bureau of Business
Research.
Hamilton, S., & Fagot, B. I. (1988). Chronic stress and coping styles: A comparison of
male and female undergraduates. Journal of Personality and Social Psychology,
55, 819-823.
Hellerstedt, W. L. & Jeffery, R. W. (1997). The association of job strain and health
behaviours in men and women. International Journal of Epidemiology, 26, 575-
583.
Helmreich, R. L., Spence, J. T., & Pred, R. S. (1988). Making it without losing it: Type
A, achievement motivation, and scientific attainment revisited. Personality &
Social Psychology Bulletin, 14, 495-504.
223

Hennerson, M. E., Morris, L. L., & Fitzgibbon, C. T. (1978). How to measure attitudes.
Beverley Hills, CA.: Sage Publications.
Heslegrave, R. J., & Colvin, C. (1996). An exploration of psychological and
psychophysiological measures as predictors of successfid performance under
stress. Elkridge Landing: NASA Center for Aerospace Information.
Hofstede G. (1976). Nationality and espoused values of managers. Journal of Applied
Psychology, 61, 148-155.
Hofstede, G. (1980). Culture's consequences: International differences in work-related
values. Berverly Hills, CA: Sage.
Hofstede G. ( 1983). The cultural relativity of organizational practices and theories.
Journal of International Business Studies, 75-89.
Hofstede, G., Neuijen, B., Ohayv, B., & Sanders, G. (1990). Measuring Organizational
Cultures: A Qualitative and Quantitative Study across Twenty Cases.
Administrative Science Quarterly, 35(2), 286-316.
House, J. S. & Wills, J. A. (1978). Occupational stress, social support, and health. In G .
McLean, G. Black, & M. Colligan (Eds.), Work Stress (pp. 8-29). DHEW
(NIOSH) Publication.
House, J. S., Wills, J. A., Landerman, L. R., McMichael, A. J., & Kaplan, B. H.
(1979). Occupational stress and health among factory workers. Journal of Health
and Social Behavior, 20, 139-160.
224

House, J. S. (1981). Work stress and social support. Massachusetts: Addison
Wesley Publishing Company.
House, J. S., Landis, K. R., & Umberson, D. (1988). Social relationships and
health. Science, 241, 540-544.
Hu, L. T., & Bentler, P. M. (1995). Evaluating model fit. In R.H. Hoyle (Ed.),
Structural equation modeling: Concepts, issues, and applications (pp. 76-99).
Thousand Oaks, CA: Sage.
Hu, L. & Bentler, P. M. (1999). Cutoff criteria for fit indexes in covariance structure
analysis: Conventional criteria versus new alternatives. Structural Equation
Modeling, 6, 1-55.
Hudd, S.S., Dumlao, J., Erdman-Sager, D., Murray, D., Phan, E., Soukas, N., &
Yokozuka, N. (2000). Stress at college: Effects on health habits, health status
and self-esteem. College Student Journal, 34(2), 217-228.
Hurrell, J. J. (1985). Machine-paced work and the type A behavior pattern. Journal of
Occupational Psychology, 58, 15-25.
Hutchison, S. & Garstka, M. L. (1996). Sources of perceived organizational support:
Goal setting and feedback. Journal of Applied Social Psychology, 26, 1351-
1366.
225

Israel, B. A., House, J. S., Schurman, S. J., Heaney, C. A., & Mero, R. P. (1989).
The relation of personal resources, participation, influence, interpersonal
relationships and coping strategies to occupational stress, job strains and health:
a multivariate analysis. Work & Stress, 3, 163-194.
Ivancevich, J.M., & Matteson, M. T. (1984). A Type A-B person-work environment
interaction model for examining occupational stress and consequences. Human
Relations, 37, 491-513.
Iverson, R. D., Olekalns, M., & Erwin, P. J. (1998). Affectivity, organizational stressors,
and absenteeism: A causal model of burnout and its consequences. Journal of
Vocational Behavior, 52, 1-23.
Iwata, N., Roberts, C.R., & Kawakami, N. (1995). Japan-U.S. comparison of responses
to depression scale items among adult workers. Psychiatry Res., 58, 237-245.
Iwata, N., Mishima, N., Shimizu, T., Mizoue, T., & Spielberger, C.D. (1998). Positive
and negative affect in the factor structure of the State-Trait Anxiety Inventory for
Japanese workers. Psychology Republic, 82, 651-6.
Jackson, S.E. & Schuler, R.S. (1985). A meta-analysis and conceptual critique of
research on role ambiguity and role conflict in work settings. Organizational
Behavior and Human Decision Processes, 36, 16-78.
Jamal, M. (1999). Job stress, Type-A behavior and well-being: A cross-cultural
examination. International Journal of Stress Management, 6, 57-67.
226
James, K. (1999) Re-thinking organisational stress: the transition to the new
employment age, Journal of Managerial Psychology, 14(7/8), 545-557.
Jasterbowski, W. ( 1857). An outline of ergonomics, or the science of work based upon
the truths drawn from the science on nature. Commemorative edition 44th
Annual Meeting of the Human Factors And Ergonomics Society 2000. San
Diego, Califomia,USA.
Jerabek, I. (1996). Type A Personality Inventory. USA: Plumeus Inc.
Johnson, B., & Christenson, L. (2000). Educational Research. USA: Allyn and Bacon.
Johnson, G.D., Thomas, J. S., & Riordan, C. A. (1994). Job stress, social support,
and health amongst shrimp fishermen. Work & Stress, 8, 343-354.
Johnson, J. V., & Hall, E. M. (1988). Job strain, work place social support, and
cardiovascular disease: a cross-sectional study of a random sample of the
Swedish working population. American Journal of Public Health, 78, 1336--42.
Joreskog K., & Sorbom, D. (1993). LISREL 8 & Structural equation modeling
with the SIMPLJS command language. Chicago: Scientific Software.
Joreskog, K. & Sorbom, D. (1996). LISREL 8: User's reference guide. Chicago:
Scientific Software International.
Kahn, R.L., Wolfe, D.M., Quinn, R.P., Snoek, J.D. and Rosenthal, R.A. (1964).
Organizational stress: Studies in role conflict and ambiguity. New York: Wiley.
227

Kahn, R.L., & Byosierre, P. (1992). Stress in organisations. In E. Dunnette (Ed.),
Handbook of Organizational and Industrial Psychology (2nd ed. Ch. 10). USA:
The Psychological Press.
Kagan, A.R., & Levi, L. (1975). Health and Environment - Psychosocial stimuli: A
Review. In A. Kagan (Ed.), Society, Stress, and Disease (pp. 241-260). New
York, USA: Oxford University Press.
Kageyama, T., Nishikido, N., Kobayashi, T., Kurokawa, Y., Kaneko, T., & Kabuto, M.
(1998). Self-reported sleep quality, job stress, and daytime autonomic activities
assessed in terms ofshort-term heart rate variability among male white-collar
workers. Industrial Health, 36, 263-272.
Karasek, R. A. (1979). Job demands, job decision latitude, and mental strain:
Implications for job redesign. Administrative Science Quarterly, 24, 285-308.
Karasek, R.A. (1985). Job Content Questionnaire. Los Angeles: Department of
Industrial and Systems Engineering, University of Southern California.
Karasek, R., & Theorell, T. (1990). Health Work: Stress Productivity, and the
Reconstruction of Working Life. New York: Basic Books.
Karasek, R., Brisson, C., Kawakami, N., Houtman, I., Bongers, P., & Amick, B. (1998).
The Job Content Questionnaire: An instrument for internationally comparative
assessments of psychosocial job characteristics. Journal of Occupational Health
Psychology, 3, 322-355.
228

Kasi, S. V. (1978). Epidemiological Contributions to the Study of Work Stress. In C. L.
Cooper & R. Payne (Eds.), Stress at Work (pp. 3-48). Toronto: John Wiley &
Sons.
Kawakami, N., Haratani, T., & Araki, S. (1992). Effects of perceived job stress on
depressive symptoms in blue-collar workers of an electrical factory in Japan.
Scandinavian Journal of Work and Environmental Health, 18, 195-200.
Kawakami, N., & Fujigaki, Y. (1996). Reliability and validity of the Japanese version of
Job Content Questionnaire: replication and extension in computer company
employees. Individual Health, 34, 295-306.
Kawakami, N., Haratani. T., & Araki. S. (1998). Job strain and arterial blood pressure,
serum cholesterol, and smoking as risk factors for coronary heart disease in
Japan. International Archives of Occupational Environmental Health, 71, 429-
432.
Kesner, I. F., & Dalton, D. R. (1994). Top Management Turnover and CEO Succession:
An Investigation of the Effects of Turnover On Performance. Journal of
Management Studies, 31(5), 701-12.
Kerlinger, F. N. ( 1986). Foundations of Behavioral Research (3rd ed.). New York: Holt,
Rinehart and Winston.
Killmann, R.H., Saxton, M. J., & Serpa, R. (Eds.). (1985). Five Key Issues in
Understanding and Changing Culture. San Francisco: Jossey-Bass.
229

Kishton, J.M., & Widaman, K.F. (1994). Unidimensional versus domain representative
parcelling of questionnaire items: an empirical example, Educational and
Psychological Measurement, 54(3), 757-765.
Kline, R. B. (1998). Principles and practice of structural equation modeling. New
York: The Guilford Press.
Korman, A. K. (1966). Self-esteem variable in vocational choice. Journal of Applied
Psychology, 50, 479-486.
Korman, A. K. (1970). Toward an hypothesis of work behavior. Journal of Applied
Psychology, 54, 31-41.
Korman, A. K. (2001). Self-enhancement and self-protection: Toward a theory of work
motivation. In A. I. Kraut & A. K. Korman (Eds.), Evolving Practices in Human
Resource Management (pp. 3-22). San Francisco: Jossey-Bass.
Krausz, M., Kedem, P., Tal, Z., & Amir, Y. (1992). Sex-n;,le orientation and work
adaptation of male nurses. Research in Nursing and Health, 15, 391-398.
Kristensen, T. S. (1996). Job Stress and Cardiovascular Disease: A Theoretical Critical
Review. Stress Medicine, 11, 17-26.
Kunin, T. (1955). The construction of a new type of attitude measure. Personnel
Psychology, 8, 65-77.
Landsbergis, P. ( 1988). Occupational stress among health care workers: A test of the job
demands-control model. Journal of Organizational Behavior, 9, 217-239.
230

Landsbergis, P., Cahill, J., Schnall, P. (1999). The impact oflean production and related
new systems of work organization on worker health. Journal of Occupational
Psyschology, 4, I 08-30.
Landsbergis, P.A., Schnall, P. L., Pickering, T. G., Warren, K., & Schwartz, J.E.
(2003). Life-course exposure to job strain and ambulatory blood pressure in men.
American Journal of Epidemiology, 157(11), 998-1006.
Langemer, T. (1962). A twenty-two items screening score of psychiatric symptoms
indicating impairment. Journal of Health and Human Behavior, 3: 269-276.
LaRocco, J.M., House, J. S., & French, J. R. P. (1980). Social support,
occupational stress, and health. Journal of Health and Social Behavior, 21, 202-
218.
Larocque, B. (1998). Internal consistency, factorial validity, and discriminant validity of
the French version of the Karasek Job Content Questionnaire. Revue d'
Epidemiologie et de Sante Publique.
Lazarus, R. S. (1977). Cognitive and copy processes in emotion. In R. L. Monat (Ed.),
Stress and Coping: an Anthology. New York: Columbia University Press.
Lazarus, R. S., & Launier, R. (1978). Stress-related transactions between person and
environment. In L.A. Pervin & M. Lewis (Eds.), Perspectives in interactional
psychology (pp. 287-327). New York: Plenum.
Lees, R. (2005). Biology-Online. http://www.biology-online.org/dictionary.asp
231
Likert, R. (1967). The human organizations: Its management and value. New York:
McGraw-Hill.
Lin, N., Simeone, R. L., Ensel, W. M., & Kuo, W. (1979). Social support, stressful life
events and illness: A model and an empirical test. Journal of Health and Social
Behavior, 20, 108-119.
Lincoln, J. R., & Kalleberg, A. L. (1990). Culture, control, and commitment: a study of
work organization and work attitude in the United States and Japan. Cambridge
University Press, Cambridge.
Lundberg, U. & Frankenhaeuser, M. (1999). Stress and workload of men and women in
high-ranking positions. Journal of Occupational Health Psychology, 4(2), 142-
51.
Luoto, R., Roikolainen, K., & Uutela, A. (1998). Unemployment, sociodemographic
background and consumption of alcohol before and during the economic
recession of the 1990s in Finland. International Journal of Epidemiology, 27,
623-629.
Maciejewski, P. K., Prigerson, H. G., & Mazure, C. M. (2000). Self-efficacy as a
mediator between stressful life events and depressive symptoms. British Journal
of Psychiatry, 176, 373-378.
Margolis, B., Kroes, W. H., Quinn, R. P. (1974). Job Stress: An Unlisted Occupational
Hazard, Journal of Occupational Medicine, 16(10), 659-661.
232

Marks, M.L., & Mervis, P. (1985). Merger syndrome: stress and uncertainty. Mergers
and Acquisitions, 20, 50-55.
Marsh, H. W., Balla, J. R., & McDonald, R. P. (1988). Goodness-of-fit indices in
confirmatory factor analysis: The effect of sample size. Psychological Bulletin,
102, 391- 410.
Maruyama, G. M. (1998). Basics of structural equation modeling. California: Sage
Publication.
Mausner-Dorsch, H. & Eaton, W.W. (2000). Psychosocial work environment and
depression: Epidemiologic assessment of the demand-control model. American
Journal of Public Health, 90, 1765-1770.
McCauley, D.P. & Kuhnert, K.W. (1992). A theoretical review and empirical
investigation of employee trust in management. Public Administration
Quarterly, 16(2), 265-285.
McLean, P. D., & Hakstian, A. R. (1979). Clinical depression: comparative efficacy of
outpatient treatments. Journal of Clinical Psychology, 47(5), 818-36.
McGrath, J. (1970). Social and psychological factors in stress. New York: Holt,
Rinehart, and Winston.
Meek, V. L. (1988). Organizational Culture: Origins and Weaknesses. Organizational
Studies, 9(4), 453-73.
233
Melamed, S. ( 1996). Emotional reactivity, defensiveness, and ambulatory
cardiovascular response at work. Psychosomatic Medicine, 58(5), 500-507.
Mikhail, A. ( 1981 ). Stress: A psychophysiological conception. Journal of Human
Stress, 7, 9-15.
Miller, L.H., & Smith, A.D. (1997). The Stress Solution. American Psychological
Association, pp. 14-16.
Mishra, A.K. ( 1996). Organizational responses to crisis: The centrality of trust. In R.M.
Kramer & T.R. Tyler (Eds.), Tmst in organizations: Frontiers of theory and
research (pp. 261-287). Thousand Oaks, CA: Sage.
Misra, R. & McKean, M. (2000). College Students' Academic Stress and its Relation to
Their Anxiety, Time Management, and Leisure Satisfaction. American Journal
of Health Studies, 16, 41.
Morin, C. M., Rodrigue, S., & Ivers, H. (2003). Role of stress, arousal, and coping skills
in primary insomnia. Psychosomatic Medicine, 65(2), 259-67.
Moran, E.T., & Volkwein, J. F. (1992). The cultural approach to the formation of
organizational climate. Human Relations, 45 ( 1 ), 19-4 7.
Mueller, R. 0. (1996). Basic principles of structural equation modeling: An
introduction to LISREL and EQS. New York: Springer-Verlag.
234

Murphy, L. R. (1988). Workplace interventions for stress reduction and prevention. In
C. L. Cooper, & R. Payne (Eds.), Causes, coping and consequences of stress at
work (pp. 301-339). Chichester: Wiley.
Murray, C. J., & Lopez, A. D. (1994). (Eds.) Global comparative assessments in the
Health sector: Disease burdon, expenditures, and intervention packages.
Geneva: World Health Organization.
National Institute for Occupational Safety and Health, (1998). Stress at Work,
Cincinnate, OH: Author.
Niedhammer, I., Lert, F., & Mame, M. J. (1995). Psychotropic drug use and shift work
among French nurses (1980-1990). Psychological Medicine, 25,329-38.
Niedhammer, I., Goldberg, M., & Leclerc, A. (1998). Psychological factors at work and
subsequent depressive symptoms in the Gazel cohort. Scandinavian Journal of
the Work Environment and Health, 24, 197-205.
Netterstrom, B., Nielsen, F.E., Kristensen, T.S., Bach, E., & Moller, L. (1999). Relation
between job strain and myocardial infarction: a case-control study, Occupational
Environmental Medicine, 56(5), 339-42.
Norman, G. R., & Streiner, D. L. (1994). Biostatistics: The bare essentials. St. Louis,
MO: Mosby.
Oishi, K., Kamimura, M., Nigorikawa, T., Nakamiya, T., Williams, R.E., & Horvath,
S.M. (1999). Individual differences in physiological responses and type A
behavior pattern. Applied Human Science, 18(3), 101-108.
235

Parker, S. & Wall, T., (1998). Job and work design: Organizing work to promote well
being and effectiveness. Sage Publications, Thousand Oaks, CA.
Parkes, K. ( 1995). The Effects of Objective Workload on Cognitive Performance in a
Field Setting: A Two-Period Cross-Over Trial. Applied Cognitive Psychology, 9,
S153-S171
Parkes, K. (1999). Shiftwork, job type, and the work environment as joint predictors of
health-related outcomes. Journal of Occupational Health Psychology 4(3), 256-
68.
Pearlin, L. I., & Schooler, C. (1978). The structure of coping. Journal of Health and
Social Behavior, 19(1 ), 2-21.
Pearson, C. A. (1992). Autonomous workgroups: An evaluation at an industrial site.
Human Relations, 45(9), 905-936.
Peden, A. R., Rayens, M. K., Hall, L.A., & Beebe, L. H. (2001). Preventing depression
in high risk college women: A report of an 18 month follow-up. Journal of
American College Health, 49(6), 299-307.
Pelham, B. W., & Swann, W. B., (1989). From self-conceptions to self-worth: On the
sources and structure of global self-esteem. Journal of Personality and Social
Psychology, 57, 672-680.
Pfeffer, J. (1998). The human equation. Boston, MA: Harvard Business School Press.
236

Pierce, J. L., Gardner, D. G., Cummings, L. L., & Dunham, R. B. (1989). Organization
based self-esteem: Construct definition measurement and validation. Academy of
Management Journal, 32, 622-648.
Piltch, C. A., Walsh, D. C., Mangione, T. W., & Jennings, S. E. (1994). Gender, work,
and mental distress in an industrial labor force: An expansion of Karasek's job
strain model. In G. P. Keita & J. J. Hurrell, Jr. (Eds.), Job stress in a changing
workforce: Investigating gender, diversity, and family issues (pp. 39-45).
Washington, DC: American Psychological Association.
Piroska, B., Janszkyb, I., Leineweberb, C., Blomb, M., Wamalac, S., Orth-Gome'rb. K.
(2003). Depressive symptoms in relation to marital and work stress in women
with and without coronary heart disease. The Stockholm Female Coronary Risk
Study. Journal of Psychosomatic Research, 54, 113- 119.
Pohorecky, L.A. (1991). Stress and alcohol interaction: An update of human research.
Alcoholism: Clinical and Experimental Research, 15, 438-459.
Power C, Frank J, Hertzman C, Schierhout G, Li L. (2001). Predictors oflow back pain
onset in a prospective British study. American Journal of Public Health, 91,
1671-1678.
Ptacek, J. T., Smith, R. E., & Dodge, K. L. (1994). Gender Differences in Coping with
Stress: When Stressor & Appraisals Do Not Differ. Personality & Social
Psychology Bulletin, 20, 421-430.
Ramazzini, B. (1713). De morbis artificum diatriba, Tadua, Italy. In: Swedish Council
for Work Life Research. Stockholm, Sweden. 1991.
237
Reichers, A. E., & Schneider, B. (1990). Climate and culture: An evolution of
constructs. In B. Schneider (Ed.). Organizational Climate and Culture (pp. 153-
192). San Francisco, CA: Jossey Bass.
Rentsch, J.R. (1990). Climate and culture: Interaction and qualitative differences in
organizational meanings. Journal of Applied Psychology, 75, 668-681.
Roberts, N., & Levenson, R. (2002). Work stress may Strain Marriage. Occupational
Hazards, USA., Penton.
Robins, R W., Hendin, H. M., & Trzesniewski, K. H. (2001). Measuring global self
esteem: Construct validation of a single-item measure and the Rosenberg Self
Esteem and Personality Scale. Social Psychology Bulletin, 27 , 151 .161.
Ronen S. (1997). Personal reflections and projections: International industrial/
organizational psychology at a crossroads. In P. Earley, & M. Erez (Eds.}, New
perspectives on international industrial organizational psychology (pp. 715-
731). San Francisco: New Lexington Press.
Rosenberg, M. (1965). Society and the adolescent self-image. Princeton, NJ: Princeton
University Press.
Rosenman, R.H., & Chesney, M.A. (1985). Type A behavior and coronary heart
disease: Review of theory and findings. In C. D. Spielberger & I. G. Sarason
(Eds.}, Stress and anxiety. Washington, DC: Hemisphere.
Rosenstock, L. (1999, Jan 6.). In K. Grimsley (Ed.}, The Washington Post.
238

Roth, S., & Cohen, L. J. (1986). Approach, Avoidance and coping with stress. American
Psychologist, 41(7), 813-819.
Rotter, J. (1966). Generalized expectancies for internal vs. External control
reinforcement. Psychological Monographs ,80 (1,Whole No.609).
Rousseau, D.M. (1990). Assessing organizational culture: The case for multiple
methods. In B. Schneider (Ed.), Organizational Climate and Culture (pp. 153-
192). San Francisco, CA: Jossey Bass.
Sanday, P.R. (1979). The ethnographic paradigm(s). Administrative Science Quarterly,
24, 527-538.
Savage, D. (1982). Trust as a productivity management tool. Training and Development
Journal, 54-57.
Schabracq, M., Cooper, C., Travers, C. & van Maanen, D. (2001). Occupational Health
Psychology: The Challenge of Workplace Stress, Leicester: British Psychological
Society.
Schafer, J. L. (1997). Analysis of incomplete multivariate data. London, Chapman &
Hill.
Schaubroeck, J., Ganster, D. C., & Kemmerer, B. E. (1994). Job complexity, "Type A"
behavior, and cardiovascular disorder: A prospective study. Academy of
Management Journal, 37, 426-439.
239

Schaubroeck, J., & Fink, L. S. (1998). Facilitating and inhibiting effects of job control
and social support on stress outcomes and role behavior: a contingency model.
Journal of Organizational Behavior, 19, 167-195.
Schein, E.H. ( 1985). How culture forms, develops and changes. Gaining control of the
corporate cultures, 17-43. San Francisco, DA: lossy Bass.
Schein, E.H. (1990). Ogranizational Culture. American Psychologist, 45, 109-119.
Schlote, B. ( 1989). Longterm registration of muscle tension among office workers
suffering from headache. In C. Bischoff, H. C. Traue, & H. Zenz (Eds.), Clinical
perspectives on headache and low back pain (pp. 46-63). Toronto: Hogrefe &
Huber Publishers.
Schnall P. L., Landsbergis, P.A., & Baker, D. (1994). Job strain and cardiovascular
disease. Annual Review of Public Health, 15, 381-411.
Schweiger,D. M., Ivancevich, J.M., & Power, F. R. (1987). Executive action for
managing human resources before and after acquisition. Academy of
Management Executive, 1(2), 127-138.
Selye, H. (1956). The stress of life. New York: McGraw-Hill.
Selye, H. (1976). Stress in health and disease. Boston: Butterworths.
Semmer, N. (1996). Individual differences, work stress and health. In M. J. Scharbracq,
J. A. Winnubst, & C.L. Cooper (Eds.), Handbook of Work and Health
Psychology (pp. 51-86). Chichester: Wiley.
240
Seiler, L. (1973). The 22-item scale used in the field studies of mental illness: a question
of method, a question of substance, and a question of theory. Journal of Health
and Social Behavior. 14:252-264.
Shea, G. (1984). Building trust in the workplace. New York: McGraw-Hill.
Shockley-Zalabak, P., Ellis, K. and Winograd, G. (2000). Organizational trust: What it
means and why it matters. Organizational Development Journal, 18( 4), 35-48.
Shorter, E. (1992). From Paralysis to Fatigue: A History of Psychosomatic Illness in the
Modern Era. New York: Free Press,
Singh, H. (1993). Challenges in researching corporate restructuring. Journal of
Management Studies, 30(1), 147-72.
Smith, A., Brice, C., Collins, A., Matthews V., & McNamara, R. (2000). The scale of
occupational stress: A further analysis of the impact of demographic factors and
type ofjob. Norwich: Health Safety Executive, Her Majesty's Stationery Office.
Somers, M.J., & Bird, K. (1990). Managing the Transition Phase of Mergers. Journal of
Managerial Psychology, 5(4), 0268-3964.
Sonnenburg, F.K. (1994). Managing with a conscience. New York: McGraw-Hill.
241

Spector, P.E. (1992). A consideration of the validity and meaning of self-report
measures of job conditions. In C.L. Cooper & I.T. Robertson (Eds.),
International review of industrial and organizational psychology (pp. 123-151 ).
Chichester: Wiley.
Spector, P.E., & Jex, S.M. (1998). Development of four self-report measures of job
stressors and strain: Interpersonal Conflict at Work Scale, Organizational
Constraints Scale, Quantitative Workload Inventory, and Physical Symptoms
Inventory, Journal of Occupational Health Psychology, 3(4), 356-367.
Speisman, J. C., Lazarus, R. S., Mordkoff, A., & Davison, L. (1964). Experimental
reduction of stress based on ego-defense theory. Journal of Abnormal and Social
Psychology, 68, 367-380.
Speilberger, C.D. (1991 ). State trait anger expression inventory: Revised research
edition. Odessa, FL.: Psychological Assessment Resources.
Speilberger, C. D., & Reheiser, E. C. (1995). Measuring occupational stress: The Job
Stress Survey. In H. Crandall & P. L. Perrewe (Eds.), Occupational stress: A
handbook (pp. 51-69). Washington, DC: Taylor & Francis.
Stansfeld, S. A., North. F. M., White, I., & Marmot, M. G. (1995). Work characteristics
and psychiatric disorder in civil servants in London. Journal of Epidemiology &
Community Health. 49 (1), 48-53.
Stansfeld, S. A., Bosma, H., Hemingway, H., Marmot, M. G. (1998). Psychosocial
Work Characteristics and Social Support as Predictors of SF-36 Health
Functioning: The Whitehall II Study. Psychosomatic Medicine, 60, 247-255.
242
Stark, E., Thomas, L. T., & Poppler, P. (2000). Psychological disposition andjob
satisfaction under varying conditions of organizational change: Relevance and
meaning from survivors and walking wounded. Paper presented at the annual
meeting of the Western Academy of Management, Kona, Hawaii.
Steiger, J. H. (1990). Structural model evaluation and modification: An interval
estimation approach. Multivariate Behavioral Research, 25, 173-180.
Stoica, M., & Schindehutte, M. (1999). Understanding adaptation in small firms:
Links to culture and performance. Journal of Developmental Entrepreneurship,
4(1), 1-18.
Streiner, D.L., & Norman, G.R. (1994). Health measurement scales, 4th ed. Oxford:
Oxford Univ Press.
Sylvain, V., & Jerabek, I., (2002). Psychometric Report: Type A Personality Test. USA:
Plumeus Inc.
Tachibana, H., Izumi, T., Honda, S., Horiguchi, I., Manabe, E., & Takemoto, T. (1996).
A study ofthe impact of occupational and domestic factors on insomnia among
industrial workers of a manufacturing company in Japan. Occupational
Medicine, 46, 221-227.
Tang, T. L., & Gilbert, P.R. (1994). Organization-based self-esteem among mental
health workers: A replication and extension. Public Personnel Management,
23(1 ), 127-134.
243

Tausig, M. (1982). Measuring life events. Journal of Health and Social Behavior,
23, 52-64.
Taylor, R. (1989). The Role of Trust in Labor-Management Relations, Organizational
Development (Summer).
Theorell, T., Ahlberg-Hulten, B. Sigala, F., Perski, A., Soderhold, M., Kallner, A., &
Eneroth, P., (1990). A psychosocial and biomedical Comparison Between men in
six contrasting service occupations. Work and Stress, 4, 51-63.
Theorell, T. & Karasek, R. (1996). Current issues relating to psychosocial job strain and
cardiovascular disease research. Journal of Occupational Health Psychology, 1,
9-26.
Trocki, K. F., & Orioli, E. M. (1994). Gender differences in stress symptoms, stress
producing contexts, and coping strategies. In G. P. Keita & J. J. Hurrell Jr.
(Eds.), Job stress in a changing woriforce: Investigating gender, diversity, and
family issues (pp. 7-22). Washington, DC: American Psychological Association.
Tucker, L. & Lewis, C. (1973). A reliability coefficient for maximum likelihood factor
analysis. Psychometrika, 38, 1-10.
Unden, A. (1996). Social support at work and its relationship to absenteeism. Work &
Stress, 10, 46-61.
University of Wisconsin-Stout, (2001). People Process Culture Handbook [Handbook].
(Available from the Department of Communication, Education and Training,
University of Wisconsin-Stout, Menomonie).
244

Van Dyne, L., & Pierce, J. L. (2004). Psychological ownership and feelings of
possession: three field studies predicting employee attitudes and organizational
citizenship behavior. Journal of Organizational Behavior, 25, 439-459.
Vermeulen, M., & Mustard, C. (2000). Gender differences in job strain, social support at
work, and psychological distress. Journal of Occupational Health Psychology, 5,
428-440.
Waldman, D. A., & Yammarino, F. J. (1999). CEO charismatic leadership: Levels-of
management and levels-of-analysis effects. Academy of Management Review, 24,
266-285.
Warshaw, P.R. (1989). Perceived Usefulness, Perceived Ease of Use and User
Acceptance oflnformation Technology. MIS Quarterly, 13(3), 319-340.
Wilcox, B. L., & Vemberg, E. M. (1985). Conceptual and theoretical dilemmas facing
social support research. In I. G. Sarason & B. R. Sarason (Eds.), Social support:
Theory, research, and applications (pp. 3-20). Boston, MA: Martinus Nijhoff
Publishers.
Wilkins, K., & Beaudet, M.P. (1998). Work stress and health. Health Republic, 10(3),
47-62.
Williams, L. J., Cote, J. A., & Buckely, M. R. (1989). Lack of method variance in self
reported study affect and perceptions at work: Reality or artifact? Journal of
Applied Psychology, 74, 462-468.
245
Winkleby, M.A., Jatulis, D. E., Frank, E., & Fortmann, S. P. (1992). Socioeconomic
status and health: how education, income, and occupation contribute to risk
factors for cardiovascular disease. American Journal of Public Health, 82, 816-
20.
Wright, R. L. (1988). The Type A behavior pattern and coronary heart disease.
American Psychologist, 43, 2-14.
Wright, K. N., & Saylor, W. G. (1992). A comparison of perceptions of the work
environment between minority and non-minority employees of the federal prison
system. Journal of Criminal Justice, 20, 63-71.
Zapf, D. (1993). Stress-oriented job analysis of computerised office work. The
European Work and Organisational Psychologist, 3, 85-100.
Zapf, D. ( 1994). Stress ors at work: subjective vs. objective measurement. University of
Konstanz: Department of Psychology.
Zapf, D., Dormann, C. & Frese, M. (1996). Longitudinal studies in organisational stress
research: a review of the literature with reference to methodological issues.
Journal of Occupational Health Psychology, 1, 145-69.
246

APPENDICES
APPENDIX A
A.1: Standardized Regression Weights
Table A.1: Standardized Regression Weights of Organizational Culture Constructs on the Work Stress Framework.
Standardized Organizational Estimate
regression weights Culture Construct
Psycho} job demands <----------------- Supervisor Support .123
Psychol job demands <----------------- Coworker support .248
Psycho} job demands <----------------- Team functioning -.392
Psychol job demands <----------------- Leadership -.046
Psycho} job demands <----------------- Trust -.109
Psycho} job demands <----------------- Initiative -.017
Psycho} job demands <----------------- Sense of Belonging -.041
Psycho} job demands <----------------- Role Ambiguity -.017
Psycho} job demands <----------------- Information -.041
Decision Latitude <----------------- Supervisor Support .312
Sleeping problems <----------------- Psycho} job demands .208
Decision Latitude <----------------- Coworker support .051
Sleeping problems <----------------- Supervisor Support .065
Sleeping problems <----------------- Coworker support -.213
Decision Latitude <----------------- Leadership .075
Sleeping problems <----------------- Leadership -.123
247

Standardized
regression weights
Decision Latitude
Sleeping problems
Decision Latitude
Sleeping problems
Sleeping problems
Decision Latitude
Decision Latitude
Decision Latitude
Decision Latitude
Sleeping problems
Sleeping problems
Sleeping problems
Psychsomatic strain
Psychsomatic strain
Psychsomatic strain
Psychsomatic strain
Psychsomatic strain
Psychsomatic strain
Psychsomatic strain
Psychsomatic strain
Psychsomatic strain
Psychsomatic strain
Psychsomatic strain
Organizational
Culture Construct
<----------------- Team functioning
<----------------- Team functioning
<----------------- Trust
<----------------- Trust
<----------------- Sense of Belonging
<----------------- Initiative
<----------------- Information
<----------------- Sense of Belonging
<----------------- Role Ambiguity
<----------------- Initiative
<----------------- Information
<----------------- Role Ambiguity
<----------------- Leadership
<----------------- Sleeping problems
<----------------- Decision Latitude
<----------------- Trust
<----------------- Initiative
<----------------- Information
<----------------- Team functioning
<----------------- Role Ambiguity
<----------------- Supervisor Support
<----------------- Coworker support
<----------------- Sense of Belonging
248
Estimate
-.074
.136
.059
.016
-.167
.069
.036
-.064
.192
-.018
-.052
.356
-.437
.186
.143
.035
-.106
-.058
-.088
.093
-.023
-.017
-.018
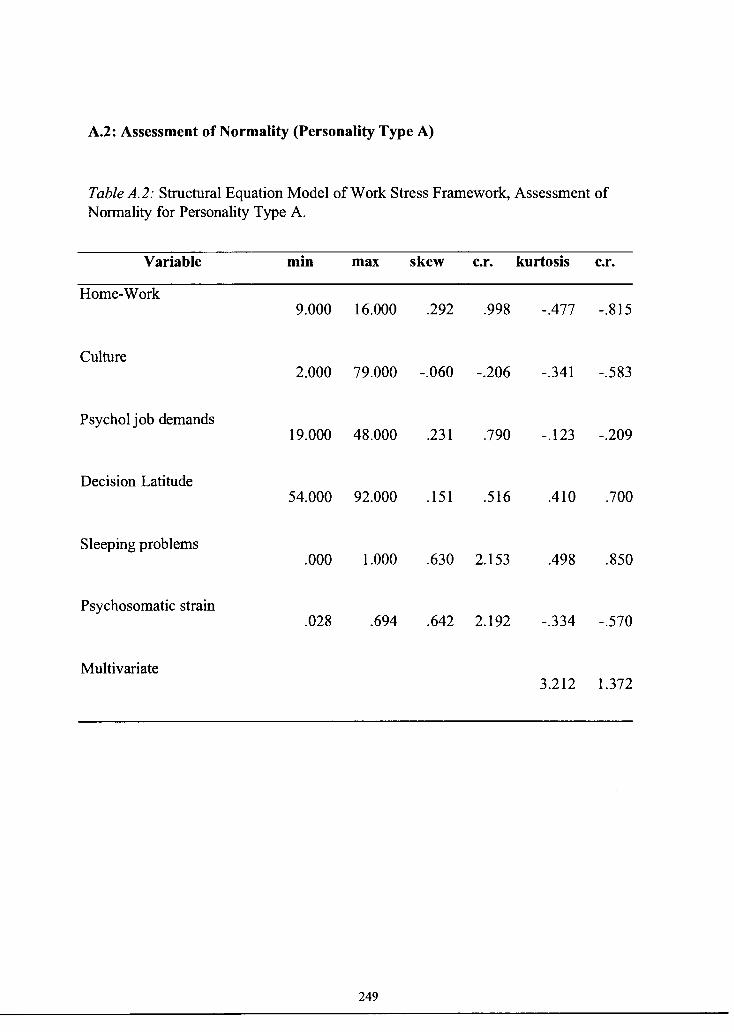
A.2: Assessment of Normality (Personality Type A)
Table A.2: Structural Equation Model of Work Stress Framework, Assessment of Normality for Personality Type A.
Variable min max skew c.r. kurtosis c.r.
Home-Work 9.000 16.000 .292 .998 -.477 -.815
Culture 2.000 79.000 -.060 -.206 -.341 -.583
Psycholjob demands 19.000 48.000 .231 .790 -.123 -.209
Decision Latitude 54.000 92.000 .151 .516 .410 .700
Sleeping problems .000 1.000 .630 2.153 .498 .850
Psychosomatic strain .028 .694 .642 2.192 -.334 -.570
Multivariate 3.212 1.372
249
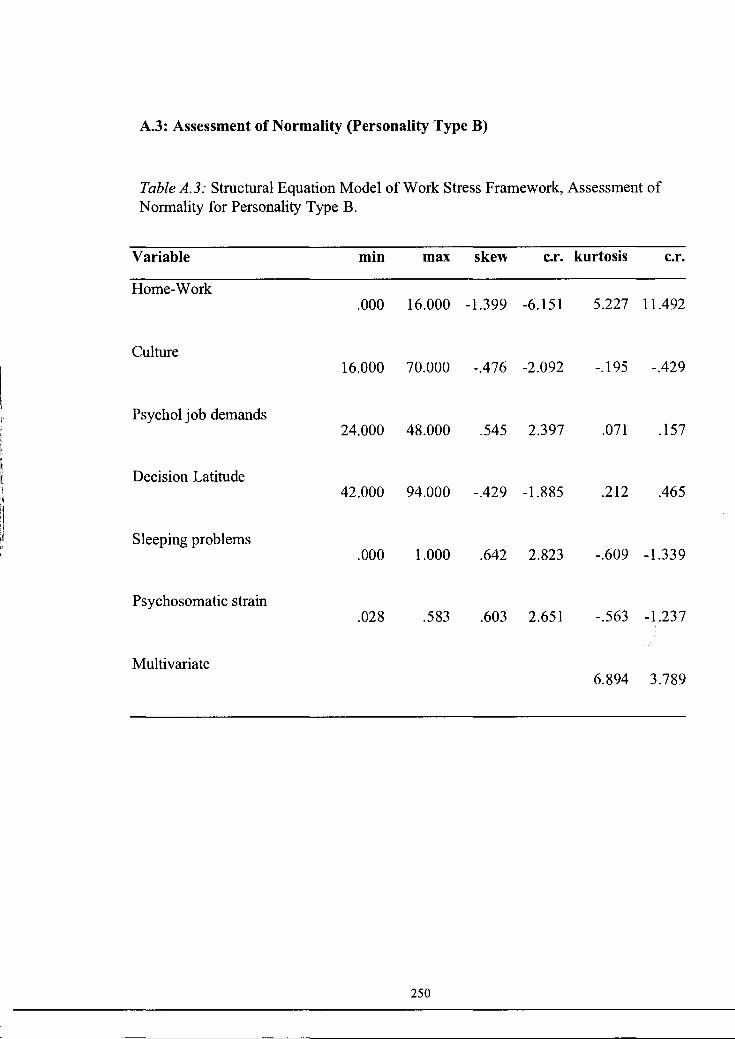
A.3: Assessment of Normality (Personality Type B)
Table A.3: Structural Equation Model of Work Stress Framework, Assessment of Normality for Personality Type B.
Variable min max skew c.r. kurtosis c.r.
Home-Work .000 16.000 -1.399 -6.151 5.227 11.492
Culture 16.000 70.000 -.476 -2.092 -.195 -.429
Psychol job demands 24.000 48.000 .545 2.397 .071 .157
Decision Latitude 42.000 94.000 -.429 -1.885 .212 .465
Sleeping problems .000 1.000 .642 2.823 -.609 -1.339
Psychosomatic strain .028 .583 .603 2.651 -.563 -1.237
Multivariate 6.894 3.789
250

A.4: Conditions of Use
Conditions of Use
The author of this study gathered confidential information from participants in
order to assess the impact of organizational culture on the work stress framework.
Participation in the study was voluntary and anonymous. To ensure the anonymity of
study participants and maintain in strict confidence the names, characteristics,
questionnaire scores, ratings, incidental comments, and/or other information on the
participant, only the author and his direct supervisors at Edith Cowan University are
allowed access to the raw data collected.
Information contained within this research paper may not be reproduced or
transferred into electronic format without the consent of the author.
Brent J. Pasula
251