An alternative index to the global competitiveness index - PLOS
19
RESEARCH ARTICLE An alternative index to the global competitiveness index Marı ´a-Dolores Benı ´tez-Ma ´ rquez ID 1 *, Eva M. Sa ´ nchez-Teba ID 2 , Isabel Coronado- Maldonado 2 1 Department of Applied Economics (Statistics and Econometrics), Faculty of Economics and Business, University of Malaga, Malaga, Spain, 2 Department of Business Management, Faculty of Economics and Business, University of Malaga, Malaga, Spain * [email protected] Abstract This paper reviews the methodology used by the World Economic Forum (WEF) to create the Global Competitiveness Index (WEF-GCI). We propose an alternative competitiveness index that only includes the objective data (hard data) from the WEF-GCI and is created by applying a multivariate statistical procedure (Exploratory Factor Analysis) that allows us to determine the weights from the implicit data structure. The rankings obtained from this index have a high degree of association with those provided by the WEF. The main benefit of this index over the WEF index is that it does not include valuations from opinion surveys given to business executives and/or entrepreneurs of the countries included in the index (soft data). Consequently, the rankings from this alternative index are not affected by political biases or individual interests as it is elaborated only including officially published objective data. 1. Introduction The competitiveness of a country or nation, which is the subject of this paper, is a controversial concept that has been under discussion for decades. The scientific literature on the subject offers various definitions that emphasize some of the multiple factors that may be related. Sus- tained economic growth, political stability, financial and banking infrastructure, the strength of exports, natural resources, the soundness of the government, and the education system, among others, affect a country’s competitiveness [1]. In terms of countries, one of the leading, most quoted definitions of competitiveness can be found in the Report of the President’s Commission on Competitiveness [2, p. 6], a definition which matches with the Organization for Economic Co-operation and Development (OECD). It is described as ‘‘the degree to which a country can, under free and fair market conditions, produce goods and services which meet the test of international markets, while simultaneously maintaining and expanding the real income of its people over the longer term” [3, p. 237]. This definition refers to the competitiveness of a nation as a whole, in order to be framed within a context of macroeconomic policy, and states that the ultimate goal of a nation’s com- petitiveness is to improve the standard of living and real income of its citizens, which can be achieved by offering goods and services at internationally competitive [4, 5]. PLOS ONE PLOS ONE | https://doi.org/10.1371/journal.pone.0265045 March 21, 2022 1 / 19 a1111111111 a1111111111 a1111111111 a1111111111 a1111111111 OPEN ACCESS Citation: Benı ´tez-Ma ´rquez M-D, Sa ´nchez-Teba EM, Coronado-Maldonado I (2022) An alternative index to the global competitiveness index. PLoS ONE 17(3): e0265045. https://doi.org/10.1371/journal. pone.0265045 Editor: Wen-Wei Sung, Chung Shan Medical University, TAIWAN Received: June 14, 2021 Accepted: February 22, 2022 Published: March 21, 2022 Copyright: © 2022 Benı ´tez-Ma ´rquez et al. This is an open access article distributed under the terms of the Creative Commons Attribution License, which permits unrestricted use, distribution, and reproduction in any medium, provided the original author and source are credited. Data Availability Statement: Global Competitiveness Report 2012-13. Geneva: World Economic Forum; 2012. Last retrieved February 27th, 2022 from https://reports.weforum.org/ global-competitiveness-report-2012-2013/ World Economic Forum (WEF). Global Competitiveness Report 2010-11. Geneva: World Economic Forum; 2011. Last retrieved February 27th, 2022 from https://www3.weforum.org/docs/WEF_ GlobalCompetitivenessReport_2010-11.pdf.
-
Upload
khangminh22 -
Category
Documents
-
view
6 -
download
0
Transcript of An alternative index to the global competitiveness index - PLOS
RESEARCH ARTICLE
An alternative index to the global
competitiveness index
Marıa-Dolores Benıtez-MarquezID1*, Eva M. Sanchez-TebaID
2, Isabel Coronado-
Maldonado2
1 Department of Applied Economics (Statistics and Econometrics), Faculty of Economics and Business,
University of Malaga, Malaga, Spain, 2 Department of Business Management, Faculty of Economics and
Business, University of Malaga, Malaga, Spain
Abstract
This paper reviews the methodology used by the World Economic Forum (WEF) to create
the Global Competitiveness Index (WEF-GCI). We propose an alternative competitiveness
index that only includes the objective data (hard data) from the WEF-GCI and is created by
applying a multivariate statistical procedure (Exploratory Factor Analysis) that allows us to
determine the weights from the implicit data structure. The rankings obtained from this index
have a high degree of association with those provided by the WEF. The main benefit of this
index over the WEF index is that it does not include valuations from opinion surveys given to
business executives and/or entrepreneurs of the countries included in the index (soft data).
Consequently, the rankings from this alternative index are not affected by political biases or
individual interests as it is elaborated only including officially published objective data.
1. Introduction
The competitiveness of a country or nation, which is the subject of this paper, is a controversial
concept that has been under discussion for decades. The scientific literature on the subject
offers various definitions that emphasize some of the multiple factors that may be related. Sus-
tained economic growth, political stability, financial and banking infrastructure, the strength
of exports, natural resources, the soundness of the government, and the education system,
among others, affect a country’s competitiveness [1].
In terms of countries, one of the leading, most quoted definitions of competitiveness can be
found in the Report of the President’s Commission on Competitiveness [2, p. 6], a definition
which matches with the Organization for Economic Co-operation and Development (OECD).
It is described as ‘‘the degree to which a country can, under free and fair market conditions,
produce goods and services which meet the test of international markets, while simultaneously
maintaining and expanding the real income of its people over the longer term” [3, p. 237].
This definition refers to the competitiveness of a nation as a whole, in order to be framed
within a context of macroeconomic policy, and states that the ultimate goal of a nation’s com-
petitiveness is to improve the standard of living and real income of its citizens, which can be
achieved by offering goods and services at internationally competitive [4, 5].
PLOS ONE
PLOS ONE | https://doi.org/10.1371/journal.pone.0265045 March 21, 2022 1 / 19
a1111111111
a1111111111
a1111111111
a1111111111
a1111111111
OPEN ACCESS
Citation: Benıtez-Marquez M-D, Sanchez-Teba EM,
Coronado-Maldonado I (2022) An alternative index
to the global competitiveness index. PLoS ONE
17(3): e0265045. https://doi.org/10.1371/journal.
pone.0265045
Editor: Wen-Wei Sung, Chung Shan Medical
University, TAIWAN
Received: June 14, 2021
Accepted: February 22, 2022
Published: March 21, 2022
Copyright: © 2022 Benıtez-Marquez et al. This is an
open access article distributed under the terms of
the Creative Commons Attribution License, which
permits unrestricted use, distribution, and
reproduction in any medium, provided the original
author and source are credited.
Data Availability Statement: Global
Competitiveness Report 2012-13. Geneva: World
Economic Forum; 2012. Last retrieved February
27th, 2022 from https://reports.weforum.org/
global-competitiveness-report-2012-2013/ World
Economic Forum (WEF). Global Competitiveness
Report 2010-11. Geneva: World Economic Forum;
2011. Last retrieved February 27th, 2022 from
https://www3.weforum.org/docs/WEF_
GlobalCompetitivenessReport_2010-11.pdf.

Other definitions of competitiveness include, although not limited to, those proposed by
several organizations or scholars [3, 6–9], which also include the country’s capacity to create a
favorable environment for improving the wealth and welfare of its citizens.
According to Porter [8, p. 167], “the only meaningful concept of competitiveness at the
national level is national productivity.” He also points out that the main goal of a nation is to
establish the necessary conditions to improve the standard of living of its citizens, that the abil-
ity to do so depends on productivity, and that it is related to how a nation uses its employment
and capital. Fagerberg [6, p. 355] defines competitiveness as “the ability of a country to realize
central economic policy goals, especially growth in income and employment, without running
into balance-of-payments difficulties.” The same author later stated that an agreed definition
of international competitiveness could be “the ability of a country to secure a higher standard
of living for its citizens than comparable economies for the present and the future” [7, p. 48].
Furthermore, in regard to the idea of reaching a consensus, Aiginger [9, p.174] proposes defin-
ing competitiveness as a country’s “ability to create welfare.” He also suggests that a compre-
hensive assessment of international competitiveness should take into account both the result,
which measures the country’s performance and is closely related to welfare, and the process
(which investigates factors affecting the generation of the result).
Every year, organizations such as the World Economic Forum (WEF), the Institute for
Management Development (IMD) and the Centre for International Competitiveness from the
University of Wales (UK) (CICUW) publish lists in which countries are classified in order of
their competitiveness; i.e. competitiveness rankings. These rankings are used by policymakers
and stakeholders to judge the relative success of their country in meeting the competitiveness
criteria used in the corresponding competitiveness index.
These three indices share the philosophy that a country’s complex competitiveness frame-
work cannot be measured directly, making it necessary to break it down into factors or pillars
of manageable size as well as the necessary levels to reach a set of criteria or characteristics that
can be measured [10]. Although they differ both in the number of countries covered and
which factors determine the level of competitiveness, all of them include factors related to the
macroeconomic environment, innovation and infrastructure.
It should also be noted that the Global Competitiveness Index (WEF-GCI), developed by
the WEF, and the ranking included in the World Competitiveness Yearbook (WCY), which is
issued by the IMD [11], combine hard statistical data provided by official agencies with others
from executive opinion surveys (soft statistical data) given to business executives and/or entre-
preneurs in the analyzed countries (IMD-WCY). Meanwhile, the European Competitiveness
Index (CICUW-ECI), produced by the Centre for International Competitiveness from the
University of Wales (UK), is based solely on quantitative data for a smaller set of variables (36
indicators grouped into three sub-indices or pillars) [12]. Similarly, the three indices differ in
the way they aggregate the original variables to form the index; the first two use weighting that
is established a priori. They also do not agree on which scale of scores to use: the WEF-GCI
varies on a scale of 0–7; the scale of the index published in the WCY varies from 0–100, with
100 being the most competitive economy and 0 the least competitive, and lastly, the value of
100 in the ECI represents the average competitiveness of the European Union (EU-25) and the
value of the index for a specific country reflects its deviation from this average value. In the
year 2015, the WEF changes the composition of WEF-GCI. To understand and clarify the
selection of years, this study is the first part developed during 2011–12 of a project for the
period 2012–2020. The reader familiar with the topic of competitiveness will bear in mind the
elaboration of the Global Sustainable Competitiveness Index. Developed in 2012 by a Korean
consulting firm SolAbility [13], the Global Sustainable Competitiveness Index (Solability-
GSCI) evaluates more than 180 countries and it is based on 127 measurable and comparable
PLOS ONE An alternative index to the global competitiveness index
PLOS ONE | https://doi.org/10.1371/journal.pone.0265045 March 21, 2022 2 / 19
Funding: A portion of the Article Publication
Charge (APC) is funded by the University of
Malaga.
Competing interests: The authors have declared
that no competing interests exist.
quantitative indicators in order to exclude the subjectiveness of qualitative indicators. ‘The
Global Sustainable Competitiveness Report’ is published until today.
While the WEF-GCI methodology is geared towards the long term and therefore includes a
wide variety of social and environmental indicators, which allows for a sustainable perspective
of competitiveness in the analyzed countries, the methodology for the index produced by the
IMD is oriented towards the short term, which consequently implies more frequent changes in
the positions held by the different countries over time [14]. Additionally, the trend from 2012
years is to provide a competitiveness index for geographical clusters of countries: Europe,
Latin America, Asia, among others.
There is no doubt that the two most influential and well-known indices out of the afore-
mentioned indices are those developed by the WEF and the IMD. They have both received
some criticism in the academic literature, especially the use of subjective data from opinion
surveys given to experts in the analyzed countries [15], and the specification of the weights
assigned to the basic criteria, which is also subjective [16].
In order to get around these problems, this paper proposes an alternative competitiveness
index (CSI) based only on the objective data used by the WEF to create the WEF-GCI. This
index, which is computed using a multidimensional statistical technique called Principal Com-
ponent Analysis (PCA), allows for the objective assignment of weights for the basic criteria as
well as the factors and pillars that eventually lead to the creation of said index. As a comple-
ment to the aforementioned, we have compared the rankings provided by both indices (CSI
and WEF-GCI) and quantified the degree to which the proposed index (CSI) explains the vari-
ations of the WEF-GCI in the set of analyzed countries.
Following this introduction, Section 2 briefly describes the methodology used by the WEF
to create the Global Competitiveness Index (WEF-GCI). Section 3 describes data and method-
ology, it explains the proposed synthetic index, including the methodology used to create it
and an analysis of the obtained results. Section 4, concerning to the results and discussion,
compares the rankings from the proposed index and the WEF-GCI on a global scale, using the
scores to analyze the relationship between them in said context. Additionally, by limiting our
study to the context of the European Union and to the WEF-GCI belongs to the 2007–08
period, we are able to compare the results obtained from the two aforementioned indices with
the results obtained from the European Competitiveness Index (ECI) corresponding to the
2006–07 period (last available period). Developed by the Centre for International Competitive-
ness, the 2006–07 ECI report is the most recent report and this is the rationale for starting with
the WEF-GCI of 2007–2008. Lastly, Sections 5 and 6 present the conclusions of this study and
bibliographic references, respectively.
2. The global competitiveness Index produced by the WEF
Since 1979, the World Economic Forum has published the annual Global Competitiveness
Report, whose main objective is to provide knowledge and stimulate debate among all the
stakeholders about the best strategies and policies to help countries overcome obstacles to
improve competitiveness [17]. The 2011–2012 Report defines competitiveness as "the set of
institutions, policies and factors that determine the level of productivity a country." It also
specifies that, in turn, the level of productivity establishes the level of prosperity an economy
can achieve and also determines the rates of return obtained by investments, which are essen-
tial for growth [17]. Accordingly, within the context of this definition, competitiveness
involves both static and dynamic components: productivity is identified as the determining
factor of a country’s capacity to maintain its level of income as well as the investment returns,
which is one of the basic factors in the explanation of an economy’s growth potential [18].
PLOS ONE An alternative index to the global competitiveness index
PLOS ONE | https://doi.org/10.1371/journal.pone.0265045 March 21, 2022 3 / 19
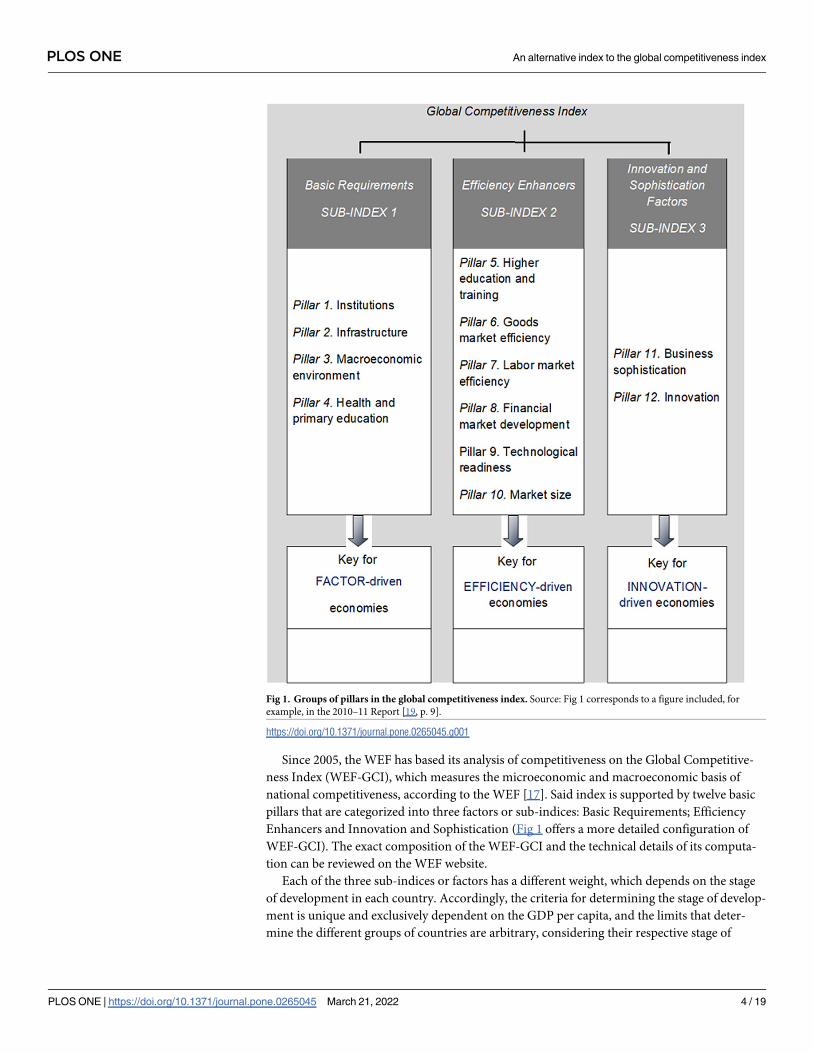
Since 2005, the WEF has based its analysis of competitiveness on the Global Competitive-
ness Index (WEF-GCI), which measures the microeconomic and macroeconomic basis of
national competitiveness, according to the WEF [17]. Said index is supported by twelve basic
pillars that are categorized into three factors or sub-indices: Basic Requirements; Efficiency
Enhancers and Innovation and Sophistication (Fig 1 offers a more detailed configuration of
WEF-GCI). The exact composition of the WEF-GCI and the technical details of its computa-
tion can be reviewed on the WEF website.
Each of the three sub-indices or factors has a different weight, which depends on the stage
of development in each country. Accordingly, the criteria for determining the stage of develop-
ment is unique and exclusively dependent on the GDP per capita, and the limits that deter-
mine the different groups of countries are arbitrary, considering their respective stage of
Fig 1. Groups of pillars in the global competitiveness index. Source: Fig 1 corresponds to a figure included, for
example, in the 2010–11 Report [19, p. 9].
https://doi.org/10.1371/journal.pone.0265045.g001
PLOS ONE An alternative index to the global competitiveness index
PLOS ONE | https://doi.org/10.1371/journal.pone.0265045 March 21, 2022 4 / 19

development. Similarly, the weights assigned to the different sub-indices in each of ups are
also arbitrary (see Table 1).
Moreover, as previously mentioned, the concepts that are implicit in the pillars are not only
quantified through statistical data published by internationally recognized official agencies
(hard data), such as the United Nations Educational, Scientific and Cultural Organization
(UNESCO), the International Monetary Fund (IMF) and the World Health Organization
(WHO), but also with data from the annual opinion survey conducted by the WEF with execu-
tives from the analyzed countries (soft data).
Table 2 shows the total number of indicators used to quantify each pillar for the 2007-08
and 2010-11 periods. The Table 2 also presents the number of objective indicators that form
each pillar (hard data) and their percentage share of the total indicators that form each pillar.
Considering the data presented in Table 2, it is noteworthy that, for both periods, the charac-
terization of four of the twelve pillars (Institutions, Financial Market Development, Business
Sophistication, and Innovation) does not involve indicators considered to be hard data, as
established in this paper, and that out of the total indicators used to compute the index, only
approximately 25% is hard data, with the high subjectivity this entails.
3. Data and methodology
The indicators used and their names for reference in future tables are listed in Table 3 and are
based on most of the objective, quantitative data (hard data) from the 2007–2008 and 2010–
2011 periods, which is available on the WEF website (http://www.weforum.org/).
Table 1. Sub-index weights considering the stage of development.
Stages of development
Stage 1: Factor-driven Transition from 1 to 2 Stage 2: Efficiency-driven Transition from 2 to 3 State 3: Innovation-driven
GDP p.c. (US $) Thresholds <2000 2000–2999 3000–8999 9000–17000 >17000
Weight Sub-index 1 60% 40%-60% 40% 20%-40% 20%
Weight Sub-index 2 35% 35%-50% 50% 50% 50%
Weight Sub-index 3 5% 5%-10% 10% 10%-30% 30%
Source: [17].
https://doi.org/10.1371/journal.pone.0265045.t001
Table 2. Number of indicators in each pillar and percentage of hard data.
Period 2007–08 Period 2010–11
Pillars Indicators Hard Data % Hard Data/Total Indicators Hard Data % Hard Data/Total
Pillar 1.Institutions 21 0 0.00 21 0 0.00
Pillar 2. Infrastructure 8 3 37.50 9 3 33.33
Pillar 3. Macroeconomics environment 4 4 100.00 5 4 80.00
Pillar 4. Health and primary education 10 6 60.00 10 6 60.00
Pillar 5. Higher education and training 8 2 25.00 8 2 25.00
Pillar 6. Goods market efficiency 15 5 33.33 15 5 33.33
Pillar 7. Labor market efficiency 7 2 28.57 7 2 28.57
Pillar 8. Financial market development 6 0 0.00 8 0 0.00
Pillar 9. Technological readiness 5 2 40.00 5 2 40.00
Pillar 10. Market size 4 2 50.00 4 2 50.00
Pillar 11. Business sophistication 9 0 0.00 9 0 0.00
Pillar 12. Innovation 6 0 0.00 6 0 0.00
Total of indicators 103 26 25.24 107 26 24.30
Source: Own elaboration from data included in WEF [17].
https://doi.org/10.1371/journal.pone.0265045.t002
PLOS ONE An alternative index to the global competitiveness index
PLOS ONE | https://doi.org/10.1371/journal.pone.0265045 March 21, 2022 5 / 19

It is shown that some pillars do not consider hard data indicators. Of the total number of
countries included in the WEF database, this study only involves 79, which are the countries
that have complete data available corresponding to the variables included in Table 3 for the
two periods under consideration.
We used the Exploratory Factor Analysis (EFA) multivariate technique to compute the pro-
posed synthetic competitiveness indicator (CSI). This exploratory technique applies to the
multidimensional data analysis of a set of elements that are described through a high number
of quantitative variables and allows us to synthesize the data regarding said variables in a
reduced number of latent variables or factors, which aim to explain the reality of said elements
(in this case, the set of analyzed countries) in relation to the complex characteristic being stud-
ied (in this case, their competitiveness).
Since the results of the EFA are later used to compute the synthetic competitiveness indica-
tor, which requires the factor scores, we used the Principal Component Analysis extraction
method [20], retaining the factors with a higher eigenvalue than the unit [21]. The varimaxorthogonal rotation procedure was applied in order to obtain the interpretation of the retained
factors) [22].
Table 3. Indicators used to compute CSI.
Pillar Description Pillar
2 Mobile telephone subscriptions /100 inhabitants X1 Pillar2X1
2 Telephone land lines /100 inhabitants X2 Pillar2X2
3 Government budget balance (% of GDP) X13 Pillar3X1
3 Gross National Savings (% of GDP) X14 Pillar3X2
3 Inflation (inter-annual variability %) X19 Pillar3X3
3 Government debt (% of GDP) X17 Pillar3X4
4 Cases of malaria /100,000 inhabitants X9 Pillar4X1
4 Cases of tuberculosis /100,000 inhabitants X6 Pillar4X2
4 Prevalence of HIV-AIDS (% of the adult population) X7 Pillar4X3
4 Infant mortality rate /1,000 births X8 Pillar4X4
4 Life expectancy (years) X5 Pillar4X5
4 Enrollment in primary education (% net) X10 Pillar5X1
5 Enrollment in secondary education (% gross) X11 Pillar5X2
5 Enrollment in higher education (% gross) X12 Pillar5X3
6 Total tax rate (%) X18 Pillar6X1
6 Number of procedures required to start a business X20 Pillar6X2
6 Number of days required to start a business X21 Pillar6X3
6 Imports (% of GDP) X22 Pillar6X4
7 Cost of layoffs (weeks of salary) X16 Pillar7X1
7 Women’s participation in the labor market (ratio in regard to men) X15 Pillar7X2
9 Individuals that use the Internet (%) X3 Pillar9X1
9 Fixed broadband Internet subscriptions /100 inhabitants X4 Pillar9X2
10 Exports (% of GDP) X23 Pillar10X1
Ancillary GDP (billions of US dollars)� X26 Anc1
Ancillary GDP per capita (US dollars)� X25 Anc2
Ancillary Population (millions of people)� X24 Anc3
Source: Prepared by the authors. Note
� = Available in the WEF database for 2010–11.
https://doi.org/10.1371/journal.pone.0265045.t003
PLOS ONE An alternative index to the global competitiveness index
PLOS ONE | https://doi.org/10.1371/journal.pone.0265045 March 21, 2022 6 / 19
Finally, we used the scores of the retained factors to create the synthetic competitiveness
indicator (CSI) as a weighted average of said scores. These weights are given by the percentage
of the total variance explained by each factor identified by the EFA.
4. Results of the exploratory factor analysis
The determinant values of the correlation matrices for the 2007-08 and 2010-11 periods,
(1.02�10−11 and 1.18�10−11, respectively), very close to zero, indicate the existence of linear
dependence between the indicators included in this study for both of these periods and the
non-existence of redundant indicators; in other words, they are the perfect linear combination
of others that are also included in the analysis. Based on these determinants, we have calculated
the values of the effective dependence coefficients associated with them, D07-08(R) = 0.6366
and D10-11(R) = 0.6345, which indicate the existence of a considerable degree of linear depen-
dence between the variables involved in each of the analyzed periods. This coefficient is
defined as D(R) = 1-|R|1/(P-1) where |R| is the determinant of the correlations. We know that
if one of the variables is the perfect linear combination of others, which are also included in
the analysis, the correlation matrix is singular, |R| = 0, and therefore, D(R) = 1. Meanwhile, if
the linear correlation between different pairs of variables is null, the correlation matrix coin-
cides with the identity, its determinant is 1 and, therefore, D(R) = 0. The comparison of the
dependence coefficient with these extreme cases can give us a good idea of the degree of linear
dependence between the indicators used [23].
As a complement to the linear dependence analysis, we calculated the KMO index (Kaiser-
Meyer-Olkin). For this analysis, the values of the KMO index are 0.824 and 0.790, respectively.
They are both higher than the minimum recommended value for this type of study (0.5) and,
therefore, the application of this methodology is considered to be acceptable. According to the
factor analysis model, the theoretical correlation coefficients calculated between each pair of
unique factors are null by hypothesis. If the partial correlation coefficients approach said theo-
retical coefficients, they must be close to zero and, therefore, the value of the KMO index
should be close to 1. Values of the KMO measurement below 0.5 are not acceptable [24].
Table 4 includes the eigenvalues associated with the retained factors, the percentage of the
total explained variance for each of these factors after the varimax rotation and the accumu-
lated percentage. This table shows that competitiveness can be synthesized in seven factors for
the two analyzed periods, according to the criteria based on selecting the factors associated
with higher eigenvalues than the unit [21]. These factors explain 77% and 76.5% of the total
variability, an acceptable percentage considering that the lower limit of acceptability for studies
in the social sciences is 60% [25].
Table 5 shows the factor loading matrices after the varimax rotation or rotated component
matrices, which are formed by the linear correlation coefficients between the factors and the
indicators used to estimate them. In order to facilitate the interpretation of said factors, in
terms of the different aspects related to the competitiveness of said factors, the coefficients that
have an absolute value greater than 0.4 are shaded in a darker color.
In regard to the interpretation of the retained factors, it should be noted that the only factor
that is common to both periods (C5) is the one that includes the variables related to the macro-
economic environment (Pillar 3), with the exception of inflation (Pillar3X3). Said factor
explains approximately 7% and can be called “Government budget balance, savings and debt.”Meanwhile, other factors related to the 2007–08 period, such as C3, C4, and C6, could be
identified in 2010–11 with C2, C3, and C6, respectively, since the variables that have higher
correlations with each of these factors are the same for both periods. Accordingly, C3 (2007–
08) has high correlations with the variables that quantify inflation (Pillar3X3) and the number
PLOS ONE An alternative index to the global competitiveness index
PLOS ONE | https://doi.org/10.1371/journal.pone.0265045 March 21, 2022 7 / 19

Table 4. Total explained variance. Principal component analysis.
Eingen values Extraction Sums of Squares Loadings Rotation Sums of Squares LoadingsTotal % of the variance % accumulated Total % of the Variance % accumulated Total % of the Variance % accumulated
Components Period 2007–2008C1 9.515 36.598 36.598 9.515 36.598 36.598 7.395 28.441 28.441
C2 2.710 10.424 47.022 2.710 10.424 47.022 3.122 12.007 40.448
C3 2.244 8.633 55.655 2.244 8.633 55.655 2.483 9.550 49.999
C4 1.844 7.094 62.748 1.844 7.094 62.748 2.281 8.772 58.771
C5 1.460 5.614 68.362 1.460 5.614 68.362 1.852 7.122 65.892
C6 1.301 5.002 73.365 1.301 5.002 73.365 1.576 6.061 71.953
C7 1.039 3.997 77.362 1.039 3.997 77.362 1.406 5.409 77.362
C8 .829 3.188 80.550
C9 .789 3.035 83.585
C10 .721 2.775 86.360
C11 .569 2.190 88.550
C12 .484 1.860 90.410
C13 .471 1.812 92.222
C14 .384 1.475 93.697
C15 .311 1.195 94.893
C16 .280 1.079 95.971
C17 .238 .916 96.888
C18 .177 .681 97.568
C19 .143 .550 98.118
C20 .126 .485 98.603
C21 .086 .330 98.933
C22 .081 .311 99.244
C23 .073 .282 99.526
C24 .057 .218 99.745
C25 .038 .147 99.892
C26 .028 .108 100.000
Components Period 2010–11C1 9.129 35.110 35.110 9.129 35.110 35.110 8.177 31.451 31.451
C2 2.931 11.274 46.384 2.931 11.274 46.384 2.525 9.712 41.163
C3 2.194 8.437 54.821 2.194 8.437 54.821 2.304 8.860 50.023
C4 1.666 6.409 61.230 1.666 6.409 61.230 2.143 8.241 58.264
C5 1.567 6.027 67.257 1.567 6.027 67.257 1.785 6.864 65.127
C6 1.396 5.369 72.627 1.396 5.369 72.627 1.671 6.428 71.556
C7 1.004 3.863 76.490 1.004 3.863 76.490 1.283 4.934 76.490
C8 .949 3.652 80.142
C9 .758 2.916 83.057
C10 .697 2.681 85.738
C11 .635 2.444 88.182
C12 .602 2.316 90.498
C13 .466 1.792 92.290
C14 .395 1.519 93.809
C15 .286 1.101 94.910
C16 .247 .949 95.859
C17 .201 .775 96.634
C18 .195 .749 97.383
(Continued)
PLOS ONE An alternative index to the global competitiveness index
PLOS ONE | https://doi.org/10.1371/journal.pone.0265045 March 21, 2022 8 / 19
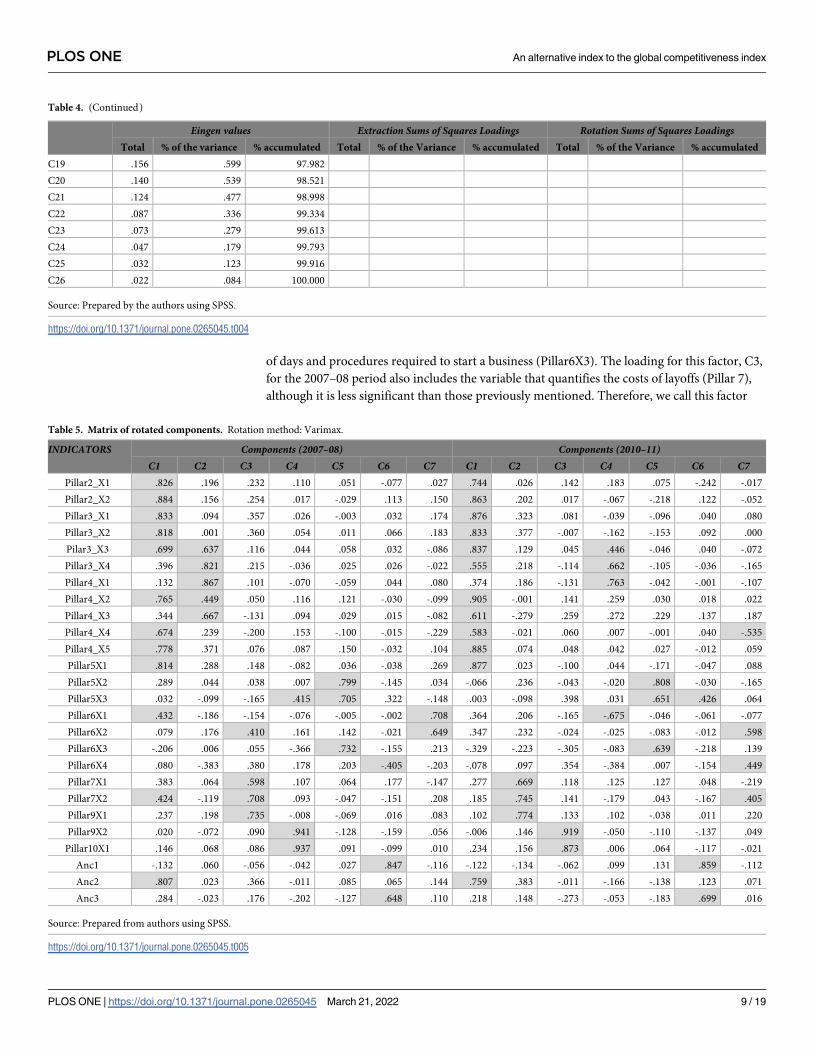
of days and procedures required to start a business (Pillar6X3). The loading for this factor, C3,
for the 2007–08 period also includes the variable that quantifies the costs of layoffs (Pillar 7),
although it is less significant than those previously mentioned. Therefore, we call this factor
Table 4. (Continued)
Eingen values Extraction Sums of Squares Loadings Rotation Sums of Squares LoadingsTotal % of the variance % accumulated Total % of the Variance % accumulated Total % of the Variance % accumulated
C19 .156 .599 97.982
C20 .140 .539 98.521
C21 .124 .477 98.998
C22 .087 .336 99.334
C23 .073 .279 99.613
C24 .047 .179 99.793
C25 .032 .123 99.916
C26 .022 .084 100.000
Source: Prepared by the authors using SPSS.
https://doi.org/10.1371/journal.pone.0265045.t004
Table 5. Matrix of rotated components. Rotation method: Varimax.
INDICATORS Components (2007–08) Components (2010–11)C1 C2 C3 C4 C5 C6 C7 C1 C2 C3 C4 C5 C6 C7
Pillar2_X1 .826 .196 .232 .110 .051 -.077 .027 .744 .026 .142 .183 .075 -.242 -.017
Pillar2_X2 .884 .156 .254 .017 -.029 .113 .150 .863 .202 .017 -.067 -.218 .122 -.052
Pillar3_X1 .833 .094 .357 .026 -.003 .032 .174 .876 .323 .081 -.039 -.096 .040 .080
Pillar3_X2 .818 .001 .360 .054 .011 .066 .183 .833 .377 -.007 -.162 -.153 .092 .000
Pilar3_X3 .699 .637 .116 .044 .058 .032 -.086 .837 .129 .045 .446 -.046 .040 -.072
Pillar3_X4 .396 .821 .215 -.036 .025 .026 -.022 .555 .218 -.114 .662 -.105 -.036 -.165
Pillar4_X1 .132 .867 .101 -.070 -.059 .044 .080 .374 .186 -.131 .763 -.042 -.001 -.107
Pillar4_X2 .765 .449 .050 .116 .121 -.030 -.099 .905 -.001 .141 .259 .030 .018 .022
Pillar4_X3 .344 .667 -.131 .094 .029 .015 -.082 .611 -.279 .259 .272 .229 .137 .187
Pillar4_X4 .674 .239 -.200 .153 -.100 -.015 -.229 .583 -.021 .060 .007 -.001 .040 -.535
Pillar4_X5 .778 .371 .076 .087 .150 -.032 .104 .885 .074 .048 .042 .027 -.012 .059
Pillar5X1 .814 .288 .148 -.082 .036 -.038 .269 .877 .023 -.100 .044 -.171 -.047 .088
Pillar5X2 .289 .044 .038 .007 .799 -.145 .034 -.066 .236 -.043 -.020 .808 -.030 -.165
Pillar5X3 .032 -.099 -.165 .415 .705 .322 -.148 .003 -.098 .398 .031 .651 .426 .064
Pillar6X1 .432 -.186 -.154 -.076 -.005 -.002 .708 .364 .206 -.165 -.675 -.046 -.061 -.077
Pillar6X2 .079 .176 .410 .161 .142 -.021 .649 .347 .232 -.024 -.025 -.083 -.012 .598
Pillar6X3 -.206 .006 .055 -.366 .732 -.155 .213 -.329 -.223 -.305 -.083 .639 -.218 .139
Pillar6X4 .080 -.383 .380 .178 .203 -.405 -.203 -.078 .097 .354 -.384 .007 -.154 .449
Pillar7X1 .383 .064 .598 .107 .064 .177 -.147 .277 .669 .118 .125 .127 .048 -.219
Pillar7X2 .424 -.119 .708 .093 -.047 -.151 .208 .185 .745 .141 -.179 .043 -.167 .405
Pillar9X1 .237 .198 .735 -.008 -.069 .016 .083 .102 .774 .133 .102 -.038 .011 .220
Pillar9X2 .020 -.072 .090 .941 -.128 -.159 .056 -.006 .146 .919 -.050 -.110 -.137 .049
Pillar10X1 .146 .068 .086 .937 .091 -.099 .010 .234 .156 .873 .006 .064 -.117 -.021
Anc1 -.132 .060 -.056 -.042 .027 .847 -.116 -.122 -.134 -.062 .099 .131 .859 -.112
Anc2 .807 .023 .366 -.011 .085 .065 .144 .759 .383 -.011 -.166 -.138 .123 .071
Anc3 .284 -.023 .176 -.202 -.127 .648 .110 .218 .148 -.273 -.053 -.183 .699 .016
Source: Prepared from authors using SPSS.
https://doi.org/10.1371/journal.pone.0265045.t005
PLOS ONE An alternative index to the global competitiveness index
PLOS ONE | https://doi.org/10.1371/journal.pone.0265045 March 21, 2022 9 / 19

“Inflation and ease of doing business,” which is identified with C2 for the 2010–11 period and
explains 9.6% (9.7%) of the total variability. Similarly, C4 (2007–08) can be called “Foreigntrade,” since the higher correlations correspond to the percentage of imports (Pillar6X4) and
exports (Pillar10X1) in the GDP. This factor is identified with C3 (2010–11) and explains 8.8%
(8.9%) of the total variability. Lastly, the variables that quantify the number of the country’s
inhabitants and income (both ancillary, Anc3 and Anc2, GDP per capita as a proxy of citizen’s
income) are included in C6 for both periods. This factor, C6, which we call “Overall countrysize,” explains 6.1% (6.4%) of the total variability. Note it presents a weak, negative correlation
with the normalized variable that quantifies the total tax rate (Pillar6X1) for the 2007–08
period, while it appears to be correlated with the Gross National Savings for the 2010–11
period (Pillar3X2).
Theoretically, we cannot establish as clear of a correspondence for the remaining factors in
the 2007–08 period and the 2010–11 period as those described in the previous paragraph.
However, C1 presents intense correlations with the variables related to infrastructure (Pillar
2), innovation (Pillar 9), education (Pillars 4 and 5), per capita income (Anc2) and some
health-related variables (infant mortality, Pillar4X4, and life expectancy, Pillar4X5) for both
periods. This factor also appears to be associated with other health variables, cases of malaria
(Pillar4X1) and tuberculosis (Pillar4X2) for the 2010–11 period. It presents a weak correlation
with the women’s participation in the labor market (Pillar7X2) for the 2007–08 period and the
number of procedures required to start a business (Pillar6X2). According to the structure of
said factor (which is common to both periods), a possible name could be “Human developmentand ease of communication.” This factor explains 28.4% (31.5%) of the total variability.
Meanwhile, the C2 factor (12% of the total variability) for the 2007–08 period unites all of
the variables that quantify health-related aspects, even those that appear to be accounted for in
Factor C1. However, this factor is not exclusive of health for the 2010–11 period, but some of
the variables included in this factor (such as life expectancy and cases of tuberculosis and HIV)
are correlated with C4 (8.2% of total variability). It is surprising that said component presents
a high negative correlation with the variable that quantifies women’s participation in the labor
market (Pillar7X2). According to the above, Factor C2 (2007–08) could be called “Health,” but
we cannot find an appropriate name or clear interpretation for Factor C4 (2010–11).
The last component (C7) appears to be associated with the labor market (Pillar 7) for the
2007–08 period, both in terms of the cost of layoffs (Pillar7X1) and women’s participation in
the labor market (Pillar7X2). The name (“Labor market”) is clear and explains 5.4% of the total
variability. For the 2010–11 period, this component presents moderate, positive levels of corre-
lation with the variables that quantify the cost of layoffs, the total tax rate (Pillars6X1) and the
number of procedures required to start a business (Pillars6X2), as well as a moderate, negative
correlation with the participation in primary education (Pillar5X1). This factor could comple-
ment the data on “ease of doing business” provided by Factor C2 for the same period, but the
negative correlation that said factor has with participation in primary education makes its
interpretation more complicated.
Table 6 presents a summary of the names of the factors identified in the two periods under
consideration, their identification with the corresponding component, and the pillars that
encompass the variables that allow for their interpretation.
The data provided by the scores of the retained factors have been synthesized in a sole
index, the synthetic competitiveness index (CSI), which summarizes the situation of each of
the analyzed countries in terms of competitiveness. Said indicator was obtained as a weighted
average of the scores for the seven retained factors, using the percentage of the total variance
explained by each factor as the weight of the score for each factor.
PLOS ONE An alternative index to the global competitiveness index
PLOS ONE | https://doi.org/10.1371/journal.pone.0265045 March 21, 2022 10 / 19
It should bear in mind other relevant factors not considered in this WEF indicators, so,
these missed relevant factor are given 0% of the total explained variance. Be aware, there is not
included hard data into the following pillars: the Pillar 1 –Institutions–, the Pillar 2 –Financial
market development–, the Pillar 11 –Business sophistication–and the Pillar 12–Innovation–.
The following section presents an analysis of the results of said indicator for the two ana-
lyzed periods.
4. Results and discussion
4.1. Rankings and geographic distributions: WEF-GCI versus CSI
This section presents a comparison of the rankings provided by the proposed index (CSI) and
the WEF-GCI, on a global scale. Table 7 shows the rankings from the CSI and WEF-GCI for
the analyzed countries and periods.
We use the scores to analyze the geographic distribution of the indices within said context and
the relationship between the two. Additionally, limiting our study to countries in the European
Union, we have compared the results obtained for the 2007–08 period for the two aforementioned
indices with those from the European Competitiveness Index (ECI) for the 2006–07 period.
Considering the classification presented in Table 7, according to the CSI, we can see that
the most competitive countries for the two analyzed periods are Singapore and Norway. Simi-
larly, although it may seem obvious, the two indices provide different rankings, both in terms
of the majority of the countries that are classified as the most competitive according to the
WEF-GCI (the first 20 countries) and the majority of the countries that are classified as the
least competitive (the last 20 countries), which remain in the same group according to the
alternative index CSI.
Meanwhile, based on the rankings shown in Table 7, the correlation coefficients have been
calculated according to Spearman’s rank correlation corresponding to the rankings provided
by both indices in Table 8. This coefficient quantifies the degree of association between the
two rankings and indicates their direction, as well as the association between the WEF-GCI for
the countries analyzed in this study, which is statistically significant, positive and high.
Table 6. Names of factors, components and pillars.
Factor names 2007–08 2010–11 Pillars
Human development and ease of communication C1 C1(a) 2, 4, 5, 9 and
ancillary
Health C2 4
Inflation and ease of doing business C3(b) C2 3 and 6
Foreign trade C4(c) C3 6 and 10
Government budget balance, savings and debt C5 C5 3
Overall country size C6 C6(d) Ancillary
Labor market C7 7
Complement to C1 in health and women’s participation in the labormarket
C4 4 and 7
Complement to C2 in ease of doing business C7 4, 6 and 7
Note.
(a) 2010–11 also includes cases of malaria and tuberculosis.
(b) 2007–08 also presents a correlation close to 0.4 with the costs of layoffs.
(c) 2007–08 also presents a correlation close to 0.4 with the Gross National Savings.
(d) 2010–11 also presents a correlation close to 0.4 with the Gross National Savings.
Source: Prepared by authors using SPSS.
https://doi.org/10.1371/journal.pone.0265045.t006
PLOS ONE An alternative index to the global competitiveness index
PLOS ONE | https://doi.org/10.1371/journal.pone.0265045 March 21, 2022 11 / 19

Table 9 presents a summary of the countries that are among the least competitive (first
quintile) and the most competitive (last quintile), respectively, for the two analyzed periods,
according to both indices.
Table 7. Rankings and geographic distributions: WEF-GCI versus CSI.
2007–08 2010–11 2007–08 2010–11
Country GCI CSI Country GCI CSI Country GCI CSI Country GCI CSI
United States 1 3 Switzerland 1 4 Mauritius 41 37 Brazil 41 61
Switzerland 2 7 Sweden 2 5 Kazakhstan 42 43 Vietnam 42 51
Denmark 3 4 Singapore 3 1 Costa Rica 43 38 Russian Federation 43 38
Sweden 4 6 United States 4 13 Morocco 44 62 Uruguay 44 41
Germany 5 17 Germany 5 15 Greece 45 34 Mexico 45 39
Finland 6 8 Finland 6 10 Azerbaijan 46 42 Colombia 46 48
Singapore 7 1 Netherlands 7 6 El Salvador 47 61 Latvia 47 27
United Kingdom 8 16 Denmark 8 3 Vietnam 48 48 Kazakhstan 48 37
Netherlands 9 5 Canada 9 16 Colombia 49 49 Peru 49 49
Canada 10 11 United Kingdom 10 21 Brazil 50 53 Namibia 50 69
Taiwan, China 11 14 Taiwan, China 11 17 Ukraine 51 41 Morocco 51 45
Austria 12 19 Norway 12 2 Uruguay 52 44 Guatemala 52 66
Norway 13 2 France 13 19 Algeria 53 32 El Salvador 53 58
Israel 14 25 Australia 14 7 Honduras 54 55 Greece 54 42
France 15 18 Austria 15 14 Trinidad and Tobago 55 36 Trinidad and Tobago 55 44
Australia 16 12 Belgium 16 8 Argentina 56 45 Algeria 56 52
Belgium 17 9 New Zealand 17 9 Peru 57 50 Argentina 57 46
Malaysia 18 30 Israel 18 31 Guatemala 58 68 Ukraine 58 54
Ireland 19 13 Malaysia 19 32 Namibia 59 70 Honduras 59 65
Iceland 20 10 China 20 20 Georgia 60 52 Georgia 60 50
New Zealand 21 15 Ireland 21 18 Pakistan 61 75 Armenia 61 47
Chile 22 35 Chile 22 35 Armenia 62 51 Dominican Republic 62 62
Estonia 23 20 Iceland 23 26 Dominican Republic 63 63 Benin 63 75
Spain 24 23 Tunisia 24 36 Venezuela 64 54 Senegal 64 70
Tunisia 25 46 Estonia 25 12 Kenya 65 76 Ecuador 65 60
Czech Republic 26 24 Oman 26 11 Senegal 66 72 Kenya 66 76
China 27 22 Czech Republic 27 25 Ecuador 67 58 Bolivia 67 67
Lithuania 28 26 Poland 28 33 Tanzania 68 77 Cambodia 68 73
Portugal 29 33 Spain 29 28 Bolivia 69 56 Guyana 69 63
Oman 30 39 Indonesia 30 56 Benin 70 73 Nicaragua 70 59
South Africa 31 67 Portugal 31 40 Cambodia 71 71 Tanzania 71 77
Latvia 32 27 Lithuania 32 34 Nicaragua 72 65 Zambia 72 79
Italy 33 21 Italy 33 22 Burkina Faso 73 78 Paraguay 73 57
Hungary 34 29 India 34 55 Madagascar 74 74 Kyrgyz Republic 74 43
India 35 57 Hungary 35 23 Kyrgyz Republic 75 60 Venezuela 75 64
Poland 36 31 Panama 36 30 Paraguay 76 64 Pakistan 76 72
Mexico 37 47 South Africa 37 71 Zambia 77 79 Madagascar 77 68
Indonesia 38 66 Mauritius 38 29 Lesotho 78 69 Lesotho 78 74
Russian Federation 39 28 Costa Rica 39 53 Guyana 79 59 Burkina Faso 79 78
Panama 40 40 Azerbaijan 40 24
Source: Prepared by the authors, results obtained using ArcGIS.
https://doi.org/10.1371/journal.pone.0265045.t007
PLOS ONE An alternative index to the global competitiveness index
PLOS ONE | https://doi.org/10.1371/journal.pone.0265045 March 21, 2022 12 / 19

In turn, the country distribution considering their scores in the GCI and CSI for the two
analyzed periods is shown in Figs 2, 3, 4, and 5. The geographic representation is based on the
quintiles (values that divide the corresponding distribution into five types, each with the same
number of countries, approximately).
In summary, and in terms of the evolution of the countries positioned in the first and fifth
quintiles, it is noteworthy that for both periods, the majority of the least competitive countries
are located in Africa, except for Cambodia, while the most competitive countries are located in
Australia (Oceania), United States (America), Singapore (Asia), and others in Central and
Northern Europe (Denmark, Finland, Holland, Norway, Sweden, and Switzerland). According
to Loo (2012), Singapore was ranked 1st in the rank using an average between IMD-WCY and
WEF-GCI. Moreover, the 2012 GSCI report [13] indicates that countries in northern Europe
are the leading countries: Denmark–rank 1–, Sweden–rank 2– Norway–rank 3– have the high-
est rakings, although this index is proposed from a sustainable perspective.
Furthermore, in terms of the evolution of the WEF-GCI over time (see Figs 2 and 4), it
should be noted that the composition of the first quintile for the two time periods is very simi-
lar and over 50% of the countries classified in this quintile are on the African continent. Simi-
larly, all of the countries classified in the last quintile for the 2007–08 period, except for Israel,
Table 8. Spearman’s rho: Correlation between the WEF-GCI and CSI.
2007–08 2010–11
WEF-GCI CSI WEF-GCI CSI
Spearman’s rho GCI Correlation Coefficient 1.000 .884�� 1.000 .884��
Sig. (2-tailed) . .000 . .000
Total countries (N) 79 79 79 79
CSI Correlation Coefficient .884�� 1.000 .884�� 1.000
Sig. (2-tailed) .000 . .000 .
Total countries (N) 79 79 79 79
��. Correlation is significant at the 0,01 level (2-tailed).
Source: Prepared by the authors, results obtained using SPSS.
https://doi.org/10.1371/journal.pone.0265045.t008
Table 9. Summary of the most and least competitive countries: WEF-GCI versus CSI.
TRADITIONAL CONTINENTAL
MODEL (UN)
1st QUINTILE: COUNTRIES IN COMMON WEF-GCI
AND CSI. 2007–08
1st QUINTILE: COUNTRIES IN COMMON WEF-GCI
AND CSI. 2010–11
AMERICA Nicaragua, Paraguay Bolivia
AFRICA Benin, Burkina Faso, Kenya, Lesotho, Madagascar, Senegal,
Tanzania, Zambia
Burkina Faso, Guyana, Kenya, Lesotho, Madagascar, Senegal,
Tanzania, Zambia
EUROPAASIA Cambodia Cambodia, Pakistan
OCEANÍATRADITIONAL CONTINENTAL
MODEL (UN)
5th QUINTILE: COUNTRIES IN COMMON WEF-GCI
AND CSI. 2007–08
5th QUINTILE: COUNTRIES IN COMMON WEF-GCI
AND CSI. 2010–11
AMERICA Canada, United States United States
EUROPA Denmark, Finland, Netherlands, Norway, Sweden,
Switzerland
Austria, Denmark, Finland, Germany, Netherlands, Norway,
Sweden, Switzerland
ASIA Singapore Singapore
OCEANÍA Australia Australia
Source: Prepared by the authors.
https://doi.org/10.1371/journal.pone.0265045.t009
PLOS ONE An alternative index to the global competitiveness index
PLOS ONE | https://doi.org/10.1371/journal.pone.0265045 March 21, 2022 13 / 19
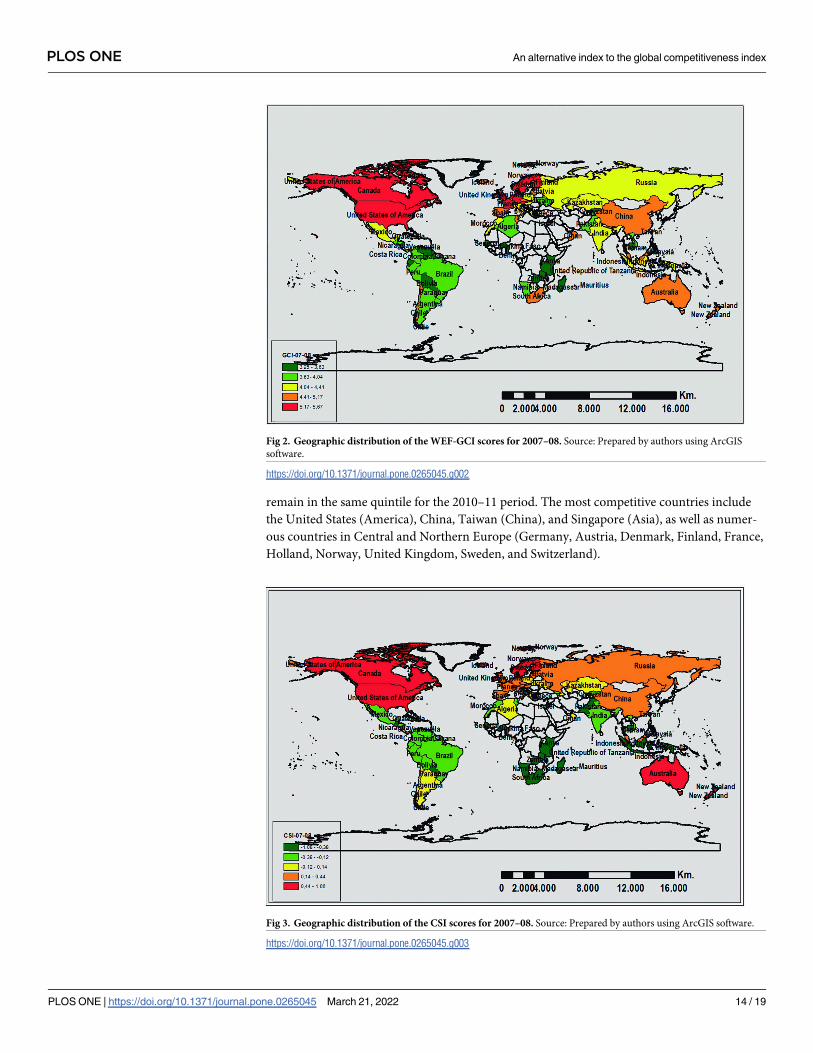
remain in the same quintile for the 2010–11 period. The most competitive countries include
the United States (America), China, Taiwan (China), and Singapore (Asia), as well as numer-
ous countries in Central and Northern Europe (Germany, Austria, Denmark, Finland, France,
Holland, Norway, United Kingdom, Sweden, and Switzerland).
Fig 2. Geographic distribution of the WEF-GCI scores for 2007–08. Source: Prepared by authors using ArcGIS
software.
https://doi.org/10.1371/journal.pone.0265045.g002
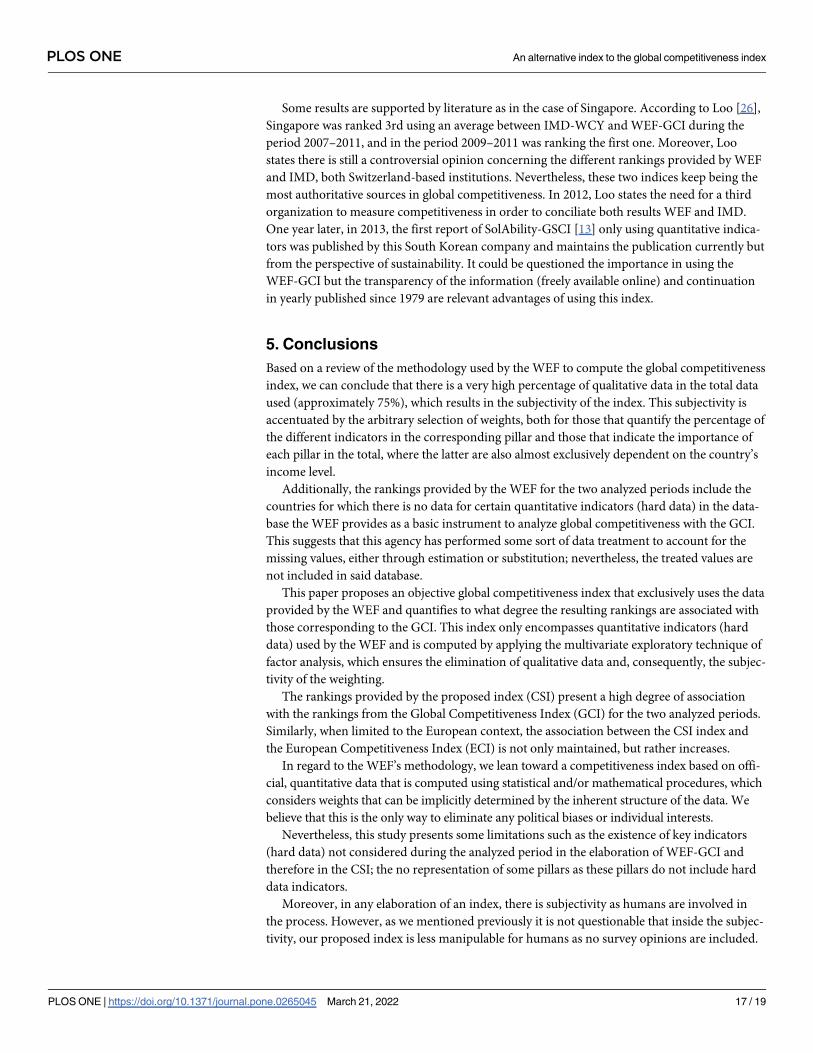
Fig 3. Geographic distribution of the CSI scores for 2007–08. Source: Prepared by authors using ArcGIS software.
https://doi.org/10.1371/journal.pone.0265045.g003
PLOS ONE An alternative index to the global competitiveness index
PLOS ONE | https://doi.org/10.1371/journal.pone.0265045 March 21, 2022 14 / 19

Finally, the CSI shows a very similar evolution as mentioned in the previous paragraph (see
Figs 3 and 5). Accordingly, the majority of the least competitive countries maintain their posi-
tion in the two analyzed periods and are generally African countries. Meanwhile, the most
competitive countries for both periods belong to Oceania (Australia), America (United States),
Central and Northern Europe (Denmark, Finland, Holland, Norway, Sweden, and
Fig 4. Geographic distribution of the WEF-GCI scores for 2010–11. Source: Prepared by authors using ArcGIS
software.
https://doi.org/10.1371/journal.pone.0265045.g004
Fig 5. Geographic distribution of the CSI scores for 2010–11. Source: Prepared by authors using ArcGIS software.
https://doi.org/10.1371/journal.pone.0265045.g005
PLOS ONE An alternative index to the global competitiveness index
PLOS ONE | https://doi.org/10.1371/journal.pone.0265045 March 21, 2022 15 / 19

Switzerland), and Asia (Singapore). Furthermore, there is a group of countries that, relatively
speaking, experienced a decline in the 2010–11 period as compared to the 2007–08 period:
Canada (America), Ireland, Iceland (Europe), and Taiwan (Asia). At the same time, other
countries’ relative competitiveness improved from one period to the next: Austria, Germany,
Estonia (Europe), and Oman (Asia).
4.2. Competitiveness in Europe: WEF-GCI, CICUW-ECI and CSI
In terms of the competitiveness of European countries for the 2007–08 period, as previously
mentioned, this section compares the results obtained for the two aforementioned indicators
with those corresponding to the European Competitiveness Index (ECI) for the 2006–07
period. This comparison is based on the data in common among 22 countries: Germany, Aus-
tria, Belgium, Denmark, Spain, Estonia, Finland, France, Greece, Holland, Hungary, Ireland,
Italy, Latvia, Lithuania, Norway, Poland, Portugal, United Kingdom, Czech Republic, Sweden,
Switzerland. The association between the rankings based on the scores of said indices, mea-
sured by Spearman’s correlation coefficient, is considered to be statistically significant, posi-
tive, and high for the different pairs considered in this study, as shown in Table 10.
4.3. Discussion
Depending on what indicators are used to measure competitiveness, the outcome will be dif-
ferent. The eternal question: What is the best index? Depend on the economic and political
interest of countries: from the USA’s point of view, from Switzerland’s point of view or Singa-
pore’s perspective, among other countries. These rankings are guides for relevant decisions
such as the investment in countries as usually is going to be directly related to the more com-
petitive countries instead of to the less competitive ones.
Regarding the countries, different sizes, geographical location, populations, political situa-
tions, or climate are other characteristics to take into account in order to elaborate an index.
The elaboration of the competitiveness index for geographical areas by WEF in last recent
years has filled a gap in the need to consider the geographical location, which in our opinion is
more reasonable than producing a unique world ranking.
Moreover, in any elaboration of an index, there is subjectivity as humans are involved in
the process. However, it is not questionable that inside the subjectivity, our proposed index is
less manipulable for humans as no survey opinions are included.
Table 10. Spearman’s correlations between ranks for the GCI and CSI in Europe.
2006–07 2007–08
ECI GCI CSI
Spearman’s rho ECI Correlation Coefficient 1 .819�� .840��
Sig. (2-tailed) .000 .000
N 22 22 22
GCI Correlation Coefficient .819�� 1 .860��
Sig. (2-tailed) .000 .000
N 22 22 22
CSI Correlation Coefficient .840�� .860�� 1
Sig. (2-tailed) .000 .000
N 22 22 22
��. Correlation is significant at the 0,01 level (2-tailed).
Source: Prepared by the authors, results obtained using SPSS.
https://doi.org/10.1371/journal.pone.0265045.t010
PLOS ONE An alternative index to the global competitiveness index
PLOS ONE | https://doi.org/10.1371/journal.pone.0265045 March 21, 2022 16 / 19
Some results are supported by literature as in the case of Singapore. According to Loo [26],
Singapore was ranked 3rd using an average between IMD-WCY and WEF-GCI during the
period 2007–2011, and in the period 2009–2011 was ranking the first one. Moreover, Loo
states there is still a controversial opinion concerning the different rankings provided by WEF
and IMD, both Switzerland-based institutions. Nevertheless, these two indices keep being the
most authoritative sources in global competitiveness. In 2012, Loo states the need for a third
organization to measure competitiveness in order to conciliate both results WEF and IMD.
One year later, in 2013, the first report of SolAbility-GSCI [13] only using quantitative indica-
tors was published by this South Korean company and maintains the publication currently but
from the perspective of sustainability. It could be questioned the importance in using the
WEF-GCI but the transparency of the information (freely available online) and continuation
in yearly published since 1979 are relevant advantages of using this index.
5. Conclusions
Based on a review of the methodology used by the WEF to compute the global competitiveness
index, we can conclude that there is a very high percentage of qualitative data in the total data
used (approximately 75%), which results in the subjectivity of the index. This subjectivity is
accentuated by the arbitrary selection of weights, both for those that quantify the percentage of
the different indicators in the corresponding pillar and those that indicate the importance of
each pillar in the total, where the latter are also almost exclusively dependent on the country’s
income level.
Additionally, the rankings provided by the WEF for the two analyzed periods include the
countries for which there is no data for certain quantitative indicators (hard data) in the data-
base the WEF provides as a basic instrument to analyze global competitiveness with the GCI.
This suggests that this agency has performed some sort of data treatment to account for the
missing values, either through estimation or substitution; nevertheless, the treated values are
not included in said database.
This paper proposes an objective global competitiveness index that exclusively uses the data
provided by the WEF and quantifies to what degree the resulting rankings are associated with
those corresponding to the GCI. This index only encompasses quantitative indicators (hard
data) used by the WEF and is computed by applying the multivariate exploratory technique of
factor analysis, which ensures the elimination of qualitative data and, consequently, the subjec-
tivity of the weighting.
The rankings provided by the proposed index (CSI) present a high degree of association
with the rankings from the Global Competitiveness Index (GCI) for the two analyzed periods.
Similarly, when limited to the European context, the association between the CSI index and
the European Competitiveness Index (ECI) is not only maintained, but rather increases.
In regard to the WEF’s methodology, we lean toward a competitiveness index based on offi-
cial, quantitative data that is computed using statistical and/or mathematical procedures, which
considers weights that can be implicitly determined by the inherent structure of the data. We
believe that this is the only way to eliminate any political biases or individual interests.
Nevertheless, this study presents some limitations such as the existence of key indicators
(hard data) not considered during the analyzed period in the elaboration of WEF-GCI and
therefore in the CSI; the no representation of some pillars as these pillars do not include hard
data indicators.
Moreover, in any elaboration of an index, there is subjectivity as humans are involved in
the process. However, as we mentioned previously it is not questionable that inside the subjec-
tivity, our proposed index is less manipulable for humans as no survey opinions are included.
PLOS ONE An alternative index to the global competitiveness index
PLOS ONE | https://doi.org/10.1371/journal.pone.0265045 March 21, 2022 17 / 19

Finally, the relevant advantages of using this index are the transparency of the information
of WEF-GCI (freely available online) and continuation in yearly published since 1979. It is a
guide for governments, enterprises, investors, citizens among others, to manage to progress in
prosperity or to achieve high living of standards.
Acknowledgments
In memoriam to Marıa Dolores Sarrion-Gavilan†.
Author Contributions
Conceptualization: Marıa-Dolores Benıtez-Marquez.
Formal analysis: Marıa-Dolores Benıtez-Marquez.
Investigation: Marıa-Dolores Benıtez-Marquez, Eva M. Sanchez-Teba, Isabel Coronado-
Maldonado.
Methodology: Marıa-Dolores Benıtez-Marquez.
Supervision: Marıa-Dolores Benıtez-Marquez.
Visualization: Eva M. Sanchez-Teba, Isabel Coronado-Maldonado.
Writing – original draft: Marıa-Dolores Benıtez-Marquez, Eva M. Sanchez-Teba, Isabel
Coronado-Maldonado.
Writing – review & editing: Marıa-Dolores Benıtez-Marquez, Eva M. Sanchez-Teba, Isabel
Coronado-Maldonado.
References1. Stevans LK, Neelankavil JP, Mendoza R, Shankar S. Economic Competitiveness of Countries: A Princi-
pal Factors Approach. International Journal of Economics and Finance. 2012; 4(12): p. 76–90.
2. Young JA. Global competition: the new reality. California Management Review. 1985; 27: p. 11–25.
3. Organisation for Economic Co-operation and Development (OECD). Technology and the Economy:
The Key Relationships Parıs: OECD; 1992.
4. Waheeduzzaman ANM, Ryans JJJ. Definition, perspectives, and understanding of international com-
petitiveness: a quest for a common ground. Competitiveness Review. 1996; 6(2): p. 7–26.
5. Waheeduzzaman ANM. Competitiveness, human development and inequality: a cross-national com-
parative inquiry. Competitiveness Review: An Intemational Business Journal incorporating Journal of
Global Competitiveness. 2002; 12(2): p. 13–29.
6. Fagerberg J. International competitiveness. The Economic Journal. 1988; 98: p. 355–374.
7. Fagerberg J. Technology and Competitiveness. Oxford Review of Economic Policy. 1996; 12(3): p.
39–51.
8. Porter ME. The Competitive Advantage of Nations New York: The Free Press; 1990.
9. Aiginger K. Competitiveness–From a dangerous obsession to a welfare creating ability with positive
externalities. Journal of Industry, Competition and Trade. 2006; 6(3–4): p. 161–177.
10. Kao C, Wu W, Hsieh W, Wang T, Lin C, Chen L. Measuring the national competitiveness of Southeast
Asian countries. European Joumal of Operational Research. 2008; 187: p. 613–628.
11. Institute for Management Development (IMD). Competitiveness factors and criteria; 2012. Lausanne,
Switzerland: IMD Switzerland.
12. Huggins R, Davies W. European Competitiveness Index 2006–2007 Wales: Robert Huggins Associates
Ud.
13. SolAbility, Report on The Global Sustainable Competitiveness Index 2012, IIsan, South Korea: Sol-
Ability, 2013.
14. Kovačič A. Competitiveness as a source of development. Working Paper No. 28; 2005.
PLOS ONE An alternative index to the global competitiveness index
PLOS ONE | https://doi.org/10.1371/journal.pone.0265045 March 21, 2022 18 / 19
15. Li X. Toward an Integrative Framework of National Competitiveness. An application to China, PhD
Series 26.2011 Denmark: Copenhagen Business School; 2011.
16. Onsel Ş, Ulengin F, Ulusoy G, Aktaş E, Kabak O, Topcu Yİ. A new perspective on the competitiveness
of nations. Socio-Economic Planning Sciences. 2008; 42: p. 221–246.
17. World Economic Forum (WEF). Global Competitiveness Report 2012–13. Geneva: World Economic
Forum; 2012. Retrieved from: https://reports.weforum.org/global-competitiveness-report-2012-2013/.
18. Balkyte A, Tvaronaviciene M. Perception of Competitiveness in the Context of Sustainable Develop-
ment: Facets of Sustainable Competitiveness. Journal of Business Economics and Management. 2010;
11(2): p. 341–365.
19. World Economic Forum (WEF). Global Competitiveness Report 2010–11. Geneva: World Economic
Forum; 2011. Retrieved from: https://www3.weforum.org/docs/WEF_GlobalCompetitivenessReport_
2010-11.pdf.
20. Morrison FD. Multivariate Statistical Methods. New York: McGraw-Hill, 1987.
21. Kaiser HF. The varimax criterion for analytic rotation in factor analysis. Psychometrika. 1958; 23: p.
187–201.
22. Kaiser HF. The Application of Electronic Computers to Factor Analysis. Educational and Psychological
Measurement. 1960; 10: p. 141–151.
23. Peña D. Analisis de datos multivariantes. Madrid: Mc Graw Hill; 2002.
24. Uriel E, Aldas J. Analisis Multivariante Aplicado. Madrid: Thomson-Paraninfo S.A.; 2005.
25. Hair JF, Anderson RE, Tatham RL, Black WC. Analisis Multivariante. Madrid: Prentice Hall Iberia;
2000.
26. Loo MKL. Competitiveness: top five nations last decade and next decade, International Journal of Busi-
ness and Management Studies, 2012, 1(3): p. 391–412.
PLOS ONE An alternative index to the global competitiveness index
PLOS ONE | https://doi.org/10.1371/journal.pone.0265045 March 21, 2022 19 / 19