An ALMA Early Science survey of molecular absorption lines toward PKS 1830− 211-Analysis of the...
21
A&A 566, A112 (2014) DOI: 10.1051/0004-6361/201423646 c ESO 2014 Astronomy & Astrophysics An ALMA Early Science survey of molecular absorption lines toward PKS 1830-211 , Analysis of the absorption profiles S. Muller 1 , F. Combes 2 , M. Guélin 3,4 , M. Gérin 4 , S. Aalto 1 , A. Beelen 5 , J. H. Black 1 , S. J. Curran 6,7 , J. Darling 8 , Dinh-V-Trung 9 , S. García-Burillo 10 , C. Henkel 11,12 , C. Horellou 1 , S. Martín 3 , I. Martí-Vidal 1 , K. M. Menten 11 , M. T. Murphy 13 , J. Ott 14 , T. Wiklind 15 , and M. A. Zwaan 16 1 Department of Earth and Space Sciences, Chalmers University of Technology, Onsala Space Observatory, 43992 Onsala, Sweden e-mail: [email protected] 2 Observatoire de Paris, LERMA, CNRS, 61 Av. de l’Observatoire, 75014 Paris, France 3 Institut de Radioastronomie Millimétrique, 300, rue de la piscine, 38406 St Martin d’Hères, France 4 LRA/LERMA, CNRS UMR 8112, Observatoire de Paris & École Normale Supérieure, 75231 Paris, France 5 Institut d’Astrophysique Spatiale, Bât. 121, Université Paris-Sud, 91405 Orsay Cedex, France 6 Sydney Institute for Astronomy, School of Physics, The University of Sydney, NSW 2006, Australia 7 ARC Centre of Excellence for All-sky Astrophysics (CAASTRO) 8 Center for Astrophysics and Space Astronomy, Department of Astrophysical and Planetary Sciences, University of Colorado, 389 UCB, Boulder, CO 80309-0389, USA 9 Institute of Physics, Vietnam Academy of Science and Technology, 10 DaoTan, ThuLe, BaDinh, Hanoi, Vietnam 10 Observatorio Astronómico Nacional, Alfonso XII, 3, 28014 Madrid, Spain 11 Max-Planck-Institut für Radioastonomie, Auf dem Hügel 69, 53121 Bonn, Germany 12 Astron. Dept., King Abdulaziz University, PO Box 80203, Jeddah, Saudi Arabia 13 Centre for Astrophysics and Supercomputing, Swinburne University of Technology, Hawthorn, VIC 3122, Australia 14 National Radio Astronomy Observatory, PO Box O, 1003 Lopezville Road, Socorro, NM 87801, USA 15 Joint ALMA Observatory, Alonso de Córdova 3107, Vitacura, Santiago, Chile 16 European Southern Observatory, Karl-Schwarzschild-Str. 2, 85748 Garching b. München, Germany Received 14 February 2014 / Accepted 9 April 2014 ABSTRACT We present the first results of an ALMA spectral survey of strong absorption lines for common interstellar species in the z = 0.89 molecular absorber toward the lensed blazar PKS 1830−211. The dataset brings essential information on the structure and com- position of the absorbing gas in the foreground galaxy. In particular, we find absorption over large velocity intervals (100 km s −1 ) toward both lensed images of the blazar. This suggests either that the galaxy inclination is intermediate and that we sample velocity gradients or streaming motions in the disk plane, that the molecular gas has a large vertical distribution or extraplanar components, or that the absorber is not a simple spiral galaxy but might be a merger system. The number of detected species is now reaching a total of 42 different species plus 14 different rare isotopologues toward the SW image, and 14 species toward the NE line-of-sight. The abundances of CH, H 2 O, HCO + , HCN, and NH 3 relative to H 2 are found to be comparable to those in the Galactic diffuse medium. Of all the lines detected so far toward PKS 1830−211, the ground-state line of ortho-water has the deepest absorption. We argue that ground-state lines of water have the best potential for detecting diffuse molecular gas in absorption at high redshift. Key words. quasars: absorption lines – quasars: individual: PKS 1830-211 – galaxies: ISM – galaxies: abundances – ISM: molecules – radio lines: galaxies 1. Introduction The spectroscopic study of absorption lines toward bright back- ground continuum sources is a powerful technique for inves- tigating the composition of the interstellar medium, as illus- trated by the detection of the first interstellar molecules along the line-of-sight toward bright nearby stars (Swings & Rosenfeld 1937; McKellar 1940; Douglas & Herzberg 1941). Since the Appendix is available in electronic form at http://www.aanda.org The reduced spectrum (FITS format) is only available at the CDS via anonymous ftp to cdsarc.u-strasbg.fr (130.79.128.5) or via http://cdsarc.u-strasbg.fr/viz-bin/qcat?J/A+A/566/A112 absorption signal is not diluted by distance, the sensitivity is only limited by the brightness of the background continuum source, allowing even rare molecular species to be detected. The discov- ery of molecular-rich absorption systems in four objects located at intermediate redshifts (0.24 < z < 0.89, e.g., see a review by Combes 2008) has opened up the possibility to explore the chemical contents of galaxies up to look-back times of half the age of the Universe. At intermediate to high redshifts, molecules can serve as in- teresting cosmological probes. For example, the evolution of the temperature of the cosmic microwave background (CMB) has been investigated up to z ∼ 3 using UV-band CO absorption-line systems observed in quasar spectra (Noterdaeme et al. 2011). Article published by EDP Sciences A112, page 1 of 21
Transcript of An ALMA Early Science survey of molecular absorption lines toward PKS 1830− 211-Analysis of the...

A&A 566, A112 (2014)DOI: 10.1051/0004-6361/201423646c© ESO 2014
Astronomy&
Astrophysics
An ALMA Early Science survey of molecular absorption linestoward PKS 1830−211�,��
Analysis of the absorption profiles
S. Muller1, F. Combes2, M. Guélin3,4, M. Gérin4, S. Aalto1, A. Beelen5, J. H. Black1, S. J. Curran6,7, J. Darling8,Dinh-V-Trung9, S. García-Burillo10, C. Henkel11,12, C. Horellou1, S. Martín3, I. Martí-Vidal1, K. M. Menten11,
M. T. Murphy13, J. Ott14, T. Wiklind15, and M. A. Zwaan16
1 Department of Earth and Space Sciences, Chalmers University of Technology, Onsala Space Observatory, 43992 Onsala, Swedene-mail: [email protected]
2 Observatoire de Paris, LERMA, CNRS, 61 Av. de l’Observatoire, 75014 Paris, France3 Institut de Radioastronomie Millimétrique, 300, rue de la piscine, 38406 St Martin d’Hères, France4 LRA/LERMA, CNRS UMR 8112, Observatoire de Paris & École Normale Supérieure, 75231 Paris, France5 Institut d’Astrophysique Spatiale, Bât. 121, Université Paris-Sud, 91405 Orsay Cedex, France6 Sydney Institute for Astronomy, School of Physics, The University of Sydney, NSW 2006, Australia7 ARC Centre of Excellence for All-sky Astrophysics (CAASTRO)8 Center for Astrophysics and Space Astronomy, Department of Astrophysical and Planetary Sciences,
University of Colorado, 389 UCB, Boulder, CO 80309-0389, USA9 Institute of Physics, Vietnam Academy of Science and Technology, 10 DaoTan, ThuLe, BaDinh, Hanoi, Vietnam
10 Observatorio Astronómico Nacional, Alfonso XII, 3, 28014 Madrid, Spain11 Max-Planck-Institut für Radioastonomie, Auf dem Hügel 69, 53121 Bonn, Germany12 Astron. Dept., King Abdulaziz University, PO Box 80203, Jeddah, Saudi Arabia13 Centre for Astrophysics and Supercomputing, Swinburne University of Technology, Hawthorn, VIC 3122, Australia14 National Radio Astronomy Observatory, PO Box O, 1003 Lopezville Road, Socorro, NM 87801, USA15 Joint ALMA Observatory, Alonso de Córdova 3107, Vitacura, Santiago, Chile16 European Southern Observatory, Karl-Schwarzschild-Str. 2, 85748 Garching b. München, Germany
Received 14 February 2014 / Accepted 9 April 2014
ABSTRACT
We present the first results of an ALMA spectral survey of strong absorption lines for common interstellar species in the z =0.89 molecular absorber toward the lensed blazar PKS 1830−211. The dataset brings essential information on the structure and com-position of the absorbing gas in the foreground galaxy. In particular, we find absorption over large velocity intervals (�100 km s−1)toward both lensed images of the blazar. This suggests either that the galaxy inclination is intermediate and that we sample velocitygradients or streaming motions in the disk plane, that the molecular gas has a large vertical distribution or extraplanar components, orthat the absorber is not a simple spiral galaxy but might be a merger system. The number of detected species is now reaching a totalof 42 different species plus 14 different rare isotopologues toward the SW image, and 14 species toward the NE line-of-sight. Theabundances of CH, H2O, HCO+, HCN, and NH3 relative to H2 are found to be comparable to those in the Galactic diffuse medium.Of all the lines detected so far toward PKS 1830−211, the ground-state line of ortho-water has the deepest absorption. We argue thatground-state lines of water have the best potential for detecting diffuse molecular gas in absorption at high redshift.
Key words. quasars: absorption lines – quasars: individual: PKS 1830-211 – galaxies: ISM – galaxies: abundances –ISM: molecules – radio lines: galaxies
1. Introduction
The spectroscopic study of absorption lines toward bright back-ground continuum sources is a powerful technique for inves-tigating the composition of the interstellar medium, as illus-trated by the detection of the first interstellar molecules alongthe line-of-sight toward bright nearby stars (Swings & Rosenfeld1937; McKellar 1940; Douglas & Herzberg 1941). Since the
� Appendix is available in electronic form athttp://www.aanda.org�� The reduced spectrum (FITS format) is only available at the CDSvia anonymous ftp to cdsarc.u-strasbg.fr (130.79.128.5) or viahttp://cdsarc.u-strasbg.fr/viz-bin/qcat?J/A+A/566/A112
absorption signal is not diluted by distance, the sensitivity is onlylimited by the brightness of the background continuum source,allowing even rare molecular species to be detected. The discov-ery of molecular-rich absorption systems in four objects locatedat intermediate redshifts (0.24 < z < 0.89, e.g., see a reviewby Combes 2008) has opened up the possibility to explore thechemical contents of galaxies up to look-back times of half theage of the Universe.
At intermediate to high redshifts, molecules can serve as in-teresting cosmological probes. For example, the evolution of thetemperature of the cosmic microwave background (CMB) hasbeen investigated up to z ∼ 3 using UV-band CO absorption-linesystems observed in quasar spectra (Noterdaeme et al. 2011).
Article published by EDP Sciences A112, page 1 of 21

A&A 566, A112 (2014)
More recently, Muller et al. (2013) have obtained a precise andaccurate measurement of the CMB temperature, TCMB = 5.08 ±0.10 K at z = 0.89, based on a multi-transition excitation analysisof a set of different molecular species seen in absorption towardthe blazar PKS 1830−211. This value is fully consistent with thevalue TCMB = 2.725 K× (1 + z)= 5.14 K at z = 0.89, yielded byadiabatic expansion of the Universe.
Molecular absorbers are also widely used to probe the cos-mological variations of fundamental constants of nature, suchas the fine structure constant, α, or the proton-to-electron massratio, μ, (see e.g., Uzan 2011). Since different molecular tran-sitions have different frequency dependence on the constants,the comparison of their velocity shift provides constraints on theconstancy of the constants. The most used species are H2, OH,CH3OH, and NH3. The tightest constraints to date yield null re-sults down to Δμ/μ of a few 10−7 over 6−7 Gyr (Kanekar 2011;Bagdonaite et al. 2013b).
Moreover, molecular isotopologues provide a way to probethe nucleosynthesis enrichment of the Universe by comparingthe isotopic ratios at different redshifts. Significant differencesare found between z = 0 and z = 0.89, e.g., for 18O/17O,28Si/29Si, and 32S/34S (Muller et al. 2006, 2011). At a look-backtime of ∼7 Gyr1, it is expected that low-mass stars contributeless than nowadays to the ISM pollution by their nucleosynthe-sis products, and the observed isotopic ratios at z = 0.89 shouldmostly reflect the yields of massive stars.
Finally, from a ground-based observation point of view, theredshift can help shift lines (e.g., lines falling in bad atmosphericwindows) to more favorable bands. This is the case, for example,of the fundamental 557 GHz transition of ortho-water, which iscompletely impossible to observe from the ground at z = 0, butcould be detected in absorption at z = 0.68 and z = 0.89 byground-based millimeter radio telescopes (Combes & Wiklind1997 and Menten et al. 2008, respectively).
The most notable of the known redshifted molecular-rich ab-sorbers is the z = 0.89 galaxy toward the blazar PKS 1830−211(Wiklind & Combes 1996, 1998). It has the highest redshift, thebrightest background continuum, and the largest amount of ab-sorbing material of all known molecular absorbers. The galaxyappears as a face-on spiral (Winn et al. 2002; Koopmans &de Bruyn 2005) and acts as a gravitational lens, splitting thebackground blazar (z = 2.5, Lidman et al. 1999) into two maincompact cores (NE and SW) separated by ∼1′′ and embed-ded in a fainter pseudo-Einstein ring seen at cm-wavelengths(Jauncey et al. 1991). Molecular absorption features are seenalong the lines-of-sight toward both compact lensed images (atv ∼ 0 km s−1 and ∼−147 km s−1, heliocentric frame and withz = 0.88582, toward the SW and NE images, respectively), in-tercepting the disk of the z = 0.89 galaxy on either side of itsbulge. At millimeter wavelengths, the angular size of the contin-uum images corresponds to a scale on the order of one parsec atz = 0.89, yielding a remarkably sharp pencil beam view throughthe disk of the absorbing galaxy.
The first unbiased radio spectral survey towardPKS 1830−211 (at 30−50 GHz, Muller et al. 2011) hasextended the molecular inventory up to a total of 34 differentspecies toward the SW line-of-sight, making it the extragalacticobject with the largest number of detected molecular species.The molecular abundances are found to be typical of Galacticdiffuse-translucent clouds, and the physical conditions of theabsorbing gas are well constrained (Henkel et al. 2008, 2009;Muller et al. 2013). In contrast, only a handful of molecular
1 Corresponding to z = 0.89.
species are detected toward the NE image, and the physicalconditions of the absorbing gas in this line-of-sight remainpoorly known.
Interestingly, Muller et al. (2011) discovered several ad-ditional velocity components, at −300, −224, −60, and+170 km s−1 seen in the lines of HCO+ and HCN. However,the continuum emission of the lensed blazar could not be re-solved and the locations of these velocity components could notbe determined.
The absorption line profiles are known to vary with atimescale of months (Muller & Guélin 2008), which is mostlikely due to morphological changes in the continuum emissionfrom the blazar core/jet structures (Garrett et al. 1997; Jin et al.2003; Nair et al. 2005). So far, the variability has only been mon-itored in the lines of HCO+ (and to a lesser extend of HCN,Muller & Guélin 2008) and CS (Schultz et al. 2014). The timevariations have the potential to reveal sub-parsec scale structuresin the absorbing gas and the chemical correlation between dif-ferent molecular species.
While the absorber in front of PKS 1830−211 offers inter-esting opportunities as a cosmological probe, it is important toimprove our knowledge of this source to understand and addresssystematics (e.g., Muller et al. 2013 about the determination ofthe CMB temperature at z = 0.89 and Bagdonaite et al. 2013babout a constraint of the varation of μ). The high angular res-olution and sensitivity now available with the Atacama LargeMillimeter/submilliter Array (ALMA) offer new possibilities ininvestigating the structure of the absorption and the molecu-lar inventory along the two independent lines-of-sight towardPKS 1830−211. We have targeted the strongest absorption linesof some common interstellar molecules, such as CO, H2O, CH,HCO+, HCN, and NH3, in addition to some other species whichhave transitions expected to be detectable within the same tuningbands. The main goals of this survey are:
1. resolve the structure of the absorption, locate the differentvelocity components, and obtain high signal-to-noise ratioline profiles;
2. investigate the chemistry and the nature of the absorb-ing gas. Is it similar to the Galactic diffuse component?Is there evidence of different (e.g., diffuse, dense) compo-nents? Or of different chemistry among the different velocitycomponents?
3. study the time variations of the absorption profiles;4. possibly detect new species in frequency ranges yet unex-
plored toward this source;5. constrain the cosmological variations of fundamental con-
stants and better understand the underlying systematics;6. measure isotopic ratios from various isotopologues at a look-
back time of more than half the present age of the Universe.
Some of these goals (1 to 4) are addressed in this first paper,while others (5 and 6) will be discussed in forthcoming publi-cations. The structure of the paper is as follows: in Sect. 2, wepresent the ALMA Cycle 0 observations and data reduction. InSect. 3, we update the inventory of chemical species detectedtoward PKS 1830−211. The absorption profiles along the twolines-of-sight are analyzed in Sect. 4. Possible interpretations ofthe wide velocity spread seen along both lines-of-sight are re-viewed in Sect. 5.1. We investigate water as a tracer of molecu-lar gas in absorption at high redshift in Sect. 5.2. A summary isgiven in Sect. 6. The complete ALMA spectral scans are shownin Appendix A.
A112, page 2 of 21

S. Muller et al.: Strong absorption lines toward PKS 1830−211
Table 1. Journal of the observations.
Band Date of Bandpass Flux Nanta δVb Noisec Main targeted
observations calibrator calibrator (km s−1) level (%) species
B3–100 GHz 2012 May 22 J 1924−292 Neptune 19 1.5 0.35 HCO+, HCN2012 Jun. 04 J 1924−292 Neptune 17 1.5 0.392012 Jun. 15 J 1924−292 Neptune 21 1.5 0.34
B6–250 GHz 2012 Apr. 09 3C 279 Titan 16 0.6 2.2 CO (4−3), C I2012 Apr. 09 3C 279 Titan 16 0.6 1.32012 May 23 3C 279 Titan 16 0.6 0.92012 Jun. 15 J 1924−292 Neptune 20 0.6 0.7
B7–290 GHz 2012 Apr. 11 3C 279 Titan 16 0.5 1.2 H2O, CH2012 Apr. 11 3C 279 Titan 16 0.5 1.1
B7–300 GHz 2012 May 23 3C 279 Titan 16 0.5 1.3 NH3, CO (5−4)2012 May 23 J 1924−292 Neptune 18 0.5 1.22012 May 23 J 1924−292 Neptune 19 0.5 1.42012 Jun. 04 J 1924−292 Neptune 18 0.5 0.92012 Jun. 04 J 1924−292 Neptune 18 0.5 0.9
Notes. (a) Number of antennas in the array; (b) channel velocity spacing (half the effective velocity resolution, due to the adopted Hanning filtering);(c) noise level of the SW spectrum, normalized to the continuum intensity of the SW image.
Table 2. Central frequencies of the different spectral windows (SPW)of our survey.
Tuning SPW 1 SPW 2 SPW 3 SPW 4(GHz) (GHz) (GHz) (GHz)
B3–100 GHz 92.142 94.017 104.142 106.017B6–250 GHz 245.087 243.267 257.592 260.537B7–290 GHz 282.573 284.448 294.572 296.446B7–300 GHz 303.613 305.488 291.614 293.489
Notes. Each band is 1.875 GHz wide.
2. Observations and data reduction
The observations were undertaken during the ALMA EarlyScience Cycle 0 phase, between 2012 early April and mid-June(see Table 1). Four tunings were observed in spectral mode, at100 GHz (B3), 250 GHz (B6), and 290 and 300 GHz (B7) (seeTable 2). For each tuning, four different 1.875 GHz-wide spec-tral windows were set, each counting 3840 channels separatedby 0.488 MHz, providing a velocity resolution of 1–3 km s−1 af-ter Hanning smoothing.
In order to resolve the two lensed images of the blazar, werequired the Cycle 0 extended configuration. This array con-figuration results in a synthesized beam of ∼0.5′′ in B6 andB7, and ∼2′′ in B3. Even though the latter beam exceeds the1′′ separation between the two images of the blazar, the highsignal-to-noise ratio of the data allows us to resolve them in theFourier plane (see below). The individual substructures of theblazar, i.e., the core/jet emission on milliarcsecond scale, remainunresolved.
The data calibration was done within the CASA2 packagefollowing a standard procedure. Either Neptune or Titan wereused for flux calibration and the absolute flux scale was setfrom a subset of short baselines for which their disks were notresolved. The flux scaling was then bootstrapped to all othersources and all baselines. We expect an absolute flux accuracyof ∼10% in B3 and ∼20% in B6 and B7.
The bandpass response was calibrated from observations ofthe bright quasars J 1924−292 or 3C 279. We noticed that the
2 http://casa.nrao.edu/
Fig. 1. Spectra of PKS 1830−211 a) after a bandpass calibration using3C 279; b) after a further step of self-bandpass (i.e., the spectrum of theSW image has been divided by that of the NE image, and normalized tothe continuum level).
spectral bandpass solution derived from 3C 279 was not satis-factory, showing some residual ripples with amplitude of a fewpercent on the spectrum (see Fig. 1a). The origin of these ripplesis probably related to imperfect linearity corrections used in thecalculation of the spectral system temperature measurements, inaddition to the fact that 3C 279 had a high flux density of �15 Jy(B6 and B7) at the time of our observations. The incompletecorrections can introduce small frequency-dependent errors inmeasured amplitude and phase, resulting in a degraded spectralbandpass quality. By comparison, the spectral bandpass derivedfrom J 1924−292, of about 8 Jy in B3, did not show any ripples.However, the bandpass of PKS 1830−211 spectra could be con-siderably improved by a further step of “self-bandpass”, usingone image of PKS 1830−211 to flatten the spectral bandpass ofthe other, as described in more detail below.
A112, page 3 of 21

A&A 566, A112 (2014)
Fig. 2. Map of the 290 GHz continuum emission of PKS 1830−211, showing the two resolved lensed images of the blazar (left, contour levelsevery 0.1 Jy/beam, with the synthesized beam indicated as the dashed ellipse in the bottom left corner) and spectra of the fundamental 557 GHztransition of ortho-water extracted toward each line-of-sight (middle, normalized to the continuum level of each lensed image). An I-band imageobtained with the Hubble Space Telescope, revealing the foreground z = 0.89 spiral galaxy, is also shown (right) with the same angular scale asthe left panel. The two crosses indicate the position of the blazar images.
At mm/submm wavelengths, it is expected that the contin-uum emission of the blazar is reduced to the two compact imagesNE and SW, since the pseudo-Einstein ring has a much steeperspectral index (α = 1.5−2.0) than the two compact images (α ∼0.7). For illustration, we show in Fig. 2 the CLEAN-deconvolvedmap of the 290 GHz continuum emission of PKS 1830−211,with spectra extracted toward each lensed image. This decon-volution step can be avoided, since the source can be simplymodeled with two point-like components (with well known rel-ative positions from VLBI observations) and the spectra can bedirectly extracted from the visibilities. This approach allows usto resolve the two images NE and SW, even at B3 in spite ofthe synthesized beam of ∼2′′. We use the Python-based task uv-multifit (Martí-Vidal et al. 2014) to extract the spectra towardthe NE and SW images from visibility-based analysis.
In a first step, the visibilities in the spectral channels with noabsorption or atmospheric lines were fit with a model consist-ing of two point-like sources, where the relative positions werefixed and the flux densities left as free parameters. The visibilityphases were then self-calibrated using this best-fit model, withone gain solution every 30 s. The self-calibration improved thesignal-to-noise ratio of the data typically by a factor of ∼2. Next,the self-calibrated visibilities were fit again with two point-likesources, but solved, on a spectral channel basis, for the flux den-sity of the NE image and for the flux ratio SW/NE. The result-ing “spectrum” contains the absorption lines toward the SW im-age, normalized to the flux density of the NE image, togetherwith the absorption lines toward the NE image, but inverted,as seen in Fig. 1b. This “self-bandpass” strategy offers the ad-vantages of removing the bandpass residuals from the bandpasscalibrator, as discussed above, as well as from the atmosphericlines (dominated by O3, see Table A.2). We noticed that the self-bandpass spectra occasionally showed a small residual spectralindex, due to the intrinsic activity of the blazar and the timedelay between the two lensed images. This was removed by afirst order polynomial. Finally, the Doppler correction was ap-plied in CASA, using the task cvel in the LSRK frame (LocalStandard of Rest, kinematical definition), before the visibilityfitting. The conversion to heliocentric frame was finally done as
vhel = vLSRK + 12.43 km s−1, for easier comparison to previousstudies.
The ALMA Cycle 0 observations were taken serendipitouslyduring a strong γ-ray flare (Ciprini 2012). The flux-density ra-tio between the two lensed images of the blazar, � = fNE/ fSW,shows a remarkable temporal and chromatic behavior (Fig. 3).The time variations are due to the intrinsic activity of the back-ground blazar and the geometrical time delay (25–27 days,Lovell et al. 1998; Wiklind & Combes 2001; Barnacka et al.2011) between its two lensed images. More subtle is the chro-matic variability, which was interpreted by Martí-Vidal et al.(2013) as being caused by opacity effects in the jet base ofthe blazar (core-shift), modulated by the time delay. The sud-den variations of� and their coincidence with the γ-ray activity(an enhancement by a factor of seven) strongly suggest that theyoriginate from the submillimeter counterpart of the γ-ray flare.The submm flux density of the blazar, on the other hand, doesnot show large variations (<10%). As a result of the variabil-ity of �, the visibility sets observed at different epochs cannotbe combined without introducing distortion in their interferencepattern. Thus, we averaged the extracted spectra instead, afterchecking that the absorption profiles were not significantly af-fected by time variations (see Sect. 4.5). The full resulting spec-tra are shown in Appendix A.
3. Inventory of species
The inventory of species toward the SW image ofPKS 1830−211 has been largely expanded from the firstunbiased spectral scan in the 7 mm band (30–50 GHz, corre-sponding to 57–94 GHz, in the absorber rest frame) performedwith the Australia Telescope Compact Array (ATCA) by Mulleret al. (2011). The ALMA Cycle 0 observations add furtherspecies to the list, namely CH, H2Cl+, and NH2, now giving atotal of 42 different species (Table 3). In addition, 14 differentrare isotopologues have now been detected, the latest being13CO, H2
37Cl+, and H217O in the ALMA data. Toward the
NE image, the number of detected species now reaches a totalof 14, the ALMA Cycle 0 observations adding C, CH, CO, H2O,H2Cl+, and NH3.
A112, page 4 of 21

S. Muller et al.: Strong absorption lines toward PKS 1830−211
Fig. 3. Evolution of the flux ratio � between the NE and SW imagesof PKS 1830−211 (marked symbols for each spectral window in ourALMA observations), overlaid over the γ-ray light curve (in grey) re-trieved from the Fermi-LAT public archive. The dotted lines mark thetime when the submillimeter flare begins to be seen in each image, ac-cording to the model by Martí-Vidal et al. (2013).
The average spectral line density is of four lines per GHzin the 30–50 GHz range covered by the ATCA 7 mm survey.Although the ALMA Cycle 0 survey is heavily biased to-ward selected transitions of strong absorption lines, it coversa relatively large combined bandwidth of 4 tunings×4 spectralwindows× 1.875 GHz= 30 GHz between the frequency limits,91 GHz and 307 GHz. In this range, we detect a total of 27 tran-sitions (not counting the multiple lines from hyperfine structure),that is, on average, one line per GHz. For the ALMA B3 tuningalone, the spectral line density reaches about two lines per GHz.
4. Analysis of absorption line profiles
In absorption, the depth Iabs, measured from the continuum levelIbg, is given by:
Iabs = fcIbg(1 − exp −τ), (1)
where τ is the optical depth and fc is the fraction of backgroundflux intercepted by the absorber (continuum covering factor).This depends on the frequency (chromatic structure of the con-tinuum) and varies from species to species (chemical segregationin the absorber). The optical depth τ(v) is a function of the col-umn density Ncol of the species, of the line excitation and of theline profile Φ(v):
τ(v) =8π3μ2S ulNcolΦ(v)
3hQ(Trot)
[1 − exp
(−hν
kBTrot
)]
exp(
El
kBTrot
) , (2)
where h and kB are the Planck and Boltzmann constants, respec-tively, Trot is the rotation temperature of the line, Q(Trot) the par-tition function, El the energy of the lower level (with respect toground state), μ the dipole moment, ν the line frequency, and S ulthe line strength. The line profile Φ(v) is taken as a Gaussian.Introducing the coefficient α relating integrated opacity to col-umn density, the column density is given by
Ncol = α
∫τ(v)dv. (3)
Under the physical conditions in the SW absorbing column(H2 volume density nH2 ∼ 1000−2000 cm−3, and kinetic temper-ature Tkin ∼ 80 K, Henkel et al. 2008, 2009; Muller et al. 2013),
the excitation of highly polar species (i.e., all species in our sur-vey, except CO and C I) is strongly radiatively coupled to CMBphotons. Their rotation temperatures are Trot ∼ TCMB = 5.14 K,much lower than the kinetic temperature. In this case, α canbe calculated from the parameters given in Eq. (2). For thelines of CO and C I, the excitation is still subthermal, but col-lisional excitation starts to raise their rotation temperatures, sothat TCMB <Trot < Tkin. We can use the non-LTE radiative trans-fer code RADEX (van der Tak et al. 2007) to estimate their αcoefficients. Along the NE line-of-sight, the gas properties arepoorly constrained but the absorbing column is likely even morediffuse than along the SW (Muller & Guélin 2008). Unlike theα coefficients of polar species, which remain constant as long asthe density is moderate, the α coefficients of the CO and C I linesdepend strongly on the physical conditions. Hereafter, we use theα coefficients given in Table 5 to derive column densities fromintegrated opacities.
4.1. Velocity components
Besides the two previously known velocity components at v =0 km s−1 (toward the SW image, heliocentric frame with z =0.88582, Wiklind & Combes 1996) and v = −147 km s−1 (towardthe NE image, Wiklind & Combes 1998), Muller et al. (2011)discovered three new velocity components, at −300 km s−1,−224 km s−1, and +170 km s−1 seen in both the HCO+ andHCN 1−0 lines in the ATCA spectra. Since the ATCA obser-vations could not resolve the two lensed images of the blazar,these additional velocity components could not be assigned toany line-of-sight.
Through the ALMA observations, the v = +170 km s−1 com-ponent is now identified in the spectra of H2O, HCO+, and HCNtoward the SW image (Fig. 4, and corresponding fit in Table 4).Not only is the v = 0 km s−1 main SW absorption componentvery broad (with a FWZP of �100km s−1), but there is also gasshifted by +170 km s−1 in velocity along the SW line-of-sight,which is quite remarkable considering that the galaxy is thoughtto be seen nearly face-on (see discussion in Sect. 5.1). Assumingthat the source covering factor is 100% for this velocity compo-nent, we derive lower limits of column densities of ∼1012 cm−2
and ∼2 × 1011 cm−2 for H2O and HCO+, respectively. Furtherassuming [H2O]/[H2]= 5 × 10⁻⁸ and [HCO+]/[H2]= 6 × 10⁻⁹
(their typical abundances in the Galactic diffuse component, see,e.g., Gérin et al. 2010; Flagey et al. 2013), we estimate a corre-sponding H2 column density of ∼3−4 × 1019 cm−2. The H I ab-sorption spectrum obtained with the Westerbork Synthesis RadioTelescope in October 1998, not resolving the two images andthe pseudo-Einstein ring (i.e., integrated over the whole radiocontinuum emission), shows a continuous absorption coveringthe velocity interval −300 km s−1 to +100 km s−1 (Koopmans &de Bruyn 2005), i.e., the +170 km s−1 velocity component hasno apparent counterpart in H I 3. The non-detection of H I ab-sorption would put an upper limit of ∼1019 cm−2 on the H Icolumn density of this component, assuming a source cover-ing factor of unity and a spin temperature of 100 K. Thus, thev = +170 km s−1 component is mostly molecular.
The v = −224 km s−1 component is identified toward theNE image. In addition, the high sensitivity and spectral reso-lution of our ALMA observations allow us to detect multipleother velocity components, particularly well seen in the 557 GHzrest frame water line and covering a velocity interval between
3 Unless the H I absorption profile has changed since these observa-tions. We are not aware of such report.
A112, page 5 of 21

A&A 566, A112 (2014)
Table 3. Census of species detected at z = 0.89 toward PKS 1830−211.
Toward the SW image
1 atom H (d), C (in)
2 atoms CH (n), OH (d), CO (bcin), 13CO (n), CS (a f n), C34S ( f ), SiO ( jkmn), 29SiO (km), 30SiO (m), NS (k), SO (kmn), SO+ (k)
3 atoms NH2(n), H2O (hn), H17
2 O (n), C2H (ekmn), HCN (ae f kmn), H13CN (e f kmn), HC15N ( f kmn), HNC (ae f km),
HN13C (e f kmn), H15NC ( f kmn), N2H+ (ak), HCO+ (ae f kmn), H13CO+ (ae f kmn), HC18O+ ( f km), HC17O+ ( f kmn),HCO (kmn), HOC+ (kmn), H2S ( f ), H34
2 S ( f ), H2Cl+ (n), H372 Cl+ (n), HCS+ (m), C2S (k)
4 atoms NH3(ghn), H2CO (cek), l-C3H (k), HNCO (km), HOCO+ (m), H2CS (k)
5 atoms CH2NH (kmn), c-C3H2(ekm), l-C3H2
(k), H2CCN (k), H2CCO (k), C4H (k), HC3N (e jkm)
6 atoms CH3OH (kln), CH3CN (km), NH2CHO (m)
7 atoms CH3NH2(km), CH3C2H (km), CH3CHO (k)
Toward the NE image
1 atom H (d), C (n)
2 atoms CH (n), OH (d), CO (n)
3 atoms H2O (n), C2H (kn), HCN ( f kmn), HNC ( f k), HCO+ (c f kmn), H2Cl+ (n)
4 atoms NH3(n), H2CO (k)
5 atoms c-C3H2(k)
Notes. In bold face, first detections toward PKS 1830−211. Underlined, first extragalactic detections.
References. (a) Wiklind & Combes (1996); (b) Gérin et al. (1997); (c) Wiklind & Combes (1998); (d) Chengalur et al. (1999); (e) Menten et al.(1999); ( f ) Muller et al. (2006); (g) Henkel et al. (2008); (h) Menten et al. (2008); (i) Bottinelli et al. (2009); ( j) Henkel et al. (2009); (k) Muller et al.(2011); (l) Ellingsen et al. (2012); Bagdonaite et al. (2013a); (m) Muller et al. (2013); (m) this ALMA cycle 0 survey.
Table 4. Results of Gaussian fittings for the v = +170 km s−1 absorptionfeature toward the SW image.
Line V0† FWHM Integrated opacity‡
(km s−1) (km s−1) (km s−1)
H2O 110−101 173.5 (0.2) 4.8 (0.6) 0.187 (0.019)HCO+ 2−1 171.4 (0.5) 10.0 (1.3) 0.125 (0.013)HCN 2−1 172.6 (0.4) 9.3 (0.9) 0.180 (0.015)
Notes. (†) Heliocentric frame, taking z = 0.88582 ; (‡) Assuming a con-tinuum covering factor fc = 1 .
−240 km s−1 and −120 km s−1 toward the NE image (Fig. 2, cen-tral panel).
On the other hand, we do not detect any absorption featurecorresponding to the −300 km s−1 velocity component in eitherof the SW or NE ALMA spectra. This component was detectedin both HCO+ and HCN 1−0 lines in the ATCA data, althoughwith a limited signal-to-noise ratio of ∼3σ. The ALMA spec-tra do not confirm this component and it remains unidentified.The strongest lines in the ALMA survey are the 557 GHz wa-ter line (non-detection down to a rms of 0.9% of the contin-uum level per 0.5 km s−1 channel) and the HCO+/HCN 2−1 lines(non-detection down to a rms of 0.2% of the continuum levelper 1.5 km s−1 channel). Since the ATCA HCO+ 1−0 absorptionintensity of the −300 km s−1 component reached 0.3% of the to-tal (NE+SW) continuum level and the 2−1 transition of HCO+
should have a slightly higher opacity (assuming excitation byCMB photons as a minimum), we would expect to detect theline in the ALMA data. Its non-detection implies either that thesignal in the ATCA spectra of both HCO+ and HCN 1−0 lineswas spurious, or that the absorption intensity of this componentdecreased since the ATCA observations.
v
Fig. 4. Spectra of the H2O, HCO+, and HCN lines toward the SW image,showing the v = +170 km s−1 velocity component besides the broad anddeep feature at v ∼ 0 km s−1. The red curve shows a Gaussian fit of theline, with parameters given in Table 4.
4.2. The absorption along the SW line-of-sight
4.2.1. Saturation and continuum source covering factor
A few species in our survey – namely H2O, HCO+, HCN,and CO – show a very deep absorption toward the SW im-age (at v ∼ 0 km s−1). The lines (see Fig. 5) are clearly satu-rated, as indicated by the detection of some of their rare iso-topologues. However, the absorption depth does not reach thefull intensity of the continuum emission and so we can concludethat the absorbing clouds do not entirely cover the SW contin-uum source. We measure the saturation level by averaging the
A112, page 6 of 21

S. Muller et al.: Strong absorption lines toward PKS 1830−211
v
Fig. 5. Spectra of species with strong or saturated lines for the main v = 0 km s−1 velocity component toward the SW image. Lines are listed basedon their increasing peak opacity, from H13CO+ to H2O.
absorption intensity for channels in the range v = −2 km s−1
to +3 km s−1. Accordingly, the saturation level ranges between∼95% of the continuum intensity for the water line, and ∼91%for the HCO+/HCN (2−1) lines. This can be interpreted in twoways: On the one hand, if we assume that the saturation levelprovides a direct measurement of the source covering factor, fc,then we conclude that the different species have slightly differ-ent covering factors (i.e., they have different distributions and arenot co-spatial). On the other hand, the values 1/ fc can be consid-ered as the solid angle of the continuum emission divided by thatof the absorbing clouds. Assuming that the physical size of theabsorbing clouds is the same for all species (i.e., same sourcecovering factor), the different values of 1/ fc for the transitionsof H2O, CO (4−3), and HCO+/HCN (2−1), only have a weakdependence on the frequency (between 100 and 300 GHz), sug-gesting that the size of the SW image remains roughly constantat our ALMA frequencies. In contrast, past VLBI observationsof PKS 1830−211 at cm-wavelengths (e.g. Guirado et al. 1999)show that the continuum size of the SW image decreases as ν−2,due to the scattering by interstellar plasma in the z = 0.89 galaxy.The absence of such an effect here is consistent with a turnoverof the continuum size – frequency relationship at high (ALMA)frequencies, where the plasma becomes transparent.
In any case, our observations show that the size of theSW continuum emission is only slightly larger (by 5−10%) thanthe size of the absorbing clouds at mm/submm wavelengths.This should naturally introduce time variability in the absorp-tion line profiles whenever substantial changes in the contin-uum morphology occur. The continuum changes are potentiallysignificantly magnified close to the lens caustics. Past observa-tions have shown significant variations of the absorption inten-sity of the different velocity components (Muller & Guélin 2008;Muller et al. 2011, 2013; Schultz et al. 2014) but no shifts invelocity, or only small ones. The small variations of ∼1 km s−1
in the centroid of methanol lines reported by Bagdonaite et al.(2013b) might be due, as they note, to the simplifying assump-tion of only one Gaussian component in the fit of the profile.
The v = +170 km s−1 feature reaches an absorption depth of3−4% of the SW continuum level. Given that it does not appear
to be saturated and that the covering factor of the v = 0 km s−1
component is fc = 0.95 suggests that both components arealigned (i.e., not on two adjacent lines-of-sight). The relative lo-cation of the v = +170 km s−1 and v ∼ 0 km s−1 features alongthe SW line-of-sight and their potential relationship cannot beelucidated at the moment.
4.2.2. Line wings
The SW v ∼ 0 km s−1 absorption covers a velocity spread ex-ceeding 100 km s−1 (FWZP), evident from the water line (Figs. 5and 6a). This width has previously been noted by Muller et al.(2006) and Menten et al. (2008) and remains puzzling consid-ering the fact that the z = 0.89 galaxy seems to be seen nearlyface-on.
CH has been established as a robust tracer of H2 indiffuse Galactic gas (Sheffer et al. 2008; Qin et al. 2010;Gérin et al. 2010). The CH absorption spectrum towardPKS 1830−211 (SW) reaches an optical depth of τ ∼ 1, and isnot saturated. It is therefore a good species to investigate theabsorption profile, after deconvolution from the line hyperfinestructure (hfs). The hfs-deconvolved spectrum of CH can bedecomposed into two components, one deep and narrow andthe other broad and shallow (see Fig. 6b). The narrow com-ponent corresponds to the absorption feature seen in all thenon-saturated and weaker lines, e.g., H13CO+ 2−1 and CS 4−3(Fig. 5). The broad line wings are not due to a saturation ef-fect (natural line broadening), since a simple scaling of the H2Oopacity reproduces remarkably well most of the profile of CH,HCO+, and HCN (Fig. 6), and the relative intensities of the threehyperfine components of CH are consistent with their expectedratios 0.83:0.33:0.17.
The fitting exercise, with two Gaussian CH components setat the same centroid velocity, results in a narrow component ofFWHM = 17 km s−1 with an opacity of τ ∼ 1.1, and a broadone of FWHM = 53 km s−1 with an opacity of τ ∼ 0.23 (seeFig. 6b). The corresponding integrated opacities are
∫τdv ∼ 20
and 13 km s−1, respectively, i.e., in a ratio ∼60% and 40% ofthe total integrated opacity. Following Eq. (2) with Trot = 5.14 K,
A112, page 7 of 21

A&A 566, A112 (2014)
v
Fig. 6. Line wings of the v = 0 km s−1 velocity component toward theSW image. The ordinate denotes optical depth and is on logarithmicscale. Opacities are clipped at a level τ = 2, where they become lesswell determined due to uncertainties in the source covering factor.
we estimate CH column densities of 4.6 and 3.0 × 1014 cm−2,respectively, for the narrow and broad component. Further as-suming a fractional abundance [CH]/[H2] = 3.5 × 10⁻⁸ (Shefferet al. 2008), we derive a total (narrow+broad component) H2 col-umn density of 2.2× 1022 cm−2 along the SW line-of-sight, con-sistent with previous estimates in the literature (see Muller et al.2011 Sect. 4.2 and references therein). We emphasize, however,that the narrow and broad components were not set apart in pre-vious estimates based on molecular absorption.
For the velocity interval between −80 to −45 km s−1, we notea significant difference between the line wings of HCO+/HCNand CH/H2O (see Figs. 6c and d). The former show a small bumpreaching apparent opacity of τ ∼ 0.02, which is not present inthe latter. This absorption feature has also been identified in theHCO+ and HCN 1−0 spectra observed with ATCA by Mulleret al. (2011). It may originate from a molecular region illumi-nated by the background continuum at low frequency (i.e., forthe HCO+ 1−0 and 2−1 lines), but not a higher frequency.
v
Fig. 7. Spectra toward the NE image (in optical depth scale, taking asource covering factor fc = 1 and thus providing lower limits to theactual opacities).
4.3. The absorption along the NE line-of-sight
The absorption profile toward the NE image of PKS 1830−211 ismarkedly different from the one toward the SW (Fig. 7). Firstly,the absorption depths are much shallower and all lines, includ-ing the water lines, appear to be optically thin. Secondly, theabsorption profile, as seen with ALMA, is decomposed in aseries of narrow features, whereas the SW profile consists ina deep and broad absorption feature (not regarding the singleweak +170 km s−1 velocity component). This might be due tothe much lower column density of molecular gas toward theNE image, which intercepts the disk of the foreground galaxyat a larger galactocentric radius of ∼4 kpc, compared to ∼2 kpcfor the SW image. In contrast to the molecular absorption, theH I absorption is significantly deeper toward the NE image thantoward the SW (Koopmans & de Bruyn 2005).
The physical conditions along the NE absorption have notyet been constrained due to the weakness of the absorption, butthe time variability of the absorption profile suggests that thegas is more diffuse than toward the SW (Muller & Guélin 2008).
A112, page 8 of 21

S. Muller et al.: Strong absorption lines toward PKS 1830−211
Fig. 8. Variations of the HCO+ 2−1 (or 1−0 if specified) line for theNE absorption between 1999 and 2012 (spectra obtained by Muller& Guélin 2008; Muller et al. 2011, 2013). For direct comparison, theALMA Cycle 0 spectrum is overlaid (grey line) on each box.
The CO 4−3 and 5−4 lines detected in the ALMA Cycle 0 sur-vey do not allow us to constrain further the physical conditionsdue to a strong degeneracy between the CO column density (orCO fractional abundance if we fix the H2 column density) andthe H2 volume density.
We note that the surface area of the NE image is magnifiedby the factor � ∼ 1.3−1.5 with respect to that of the SW im-age, due to the gravitational lensing. We may then naturallyexpect a lower source covering factor than toward the SW im-age. Taking the absorption peak of the water line at face value,we obtain a strict lower limit of fc > 0.3. On the other hand,a close look at the NE absorption profile observed at differ-ent epochs (Fig. 8) reveals independent variations of the differ-ent velocity components. For example, the spectrum taken onMarch 2010 appears identical to the spectrum taken by ALMAin June 2012, with the exception of the individual absorptionfeature at v = −170 km s−1. This indicates that the different nar-row velocity components are not spatially aligned in the line-of-sight, and hence, the continuum covering factor (per velocitycomponent) cannot be 100%, giving 0.3 < fc < 1.0. We notethat the absorption profiles of the H2O and HCO+ lines, despitethe factor of three in observed frequency, are remarkably similar(Fig. 7b). Thus, the same absorbing regions should be illumi-nated at the two frequencies.
Within the whole velocity range −240 to −90 km s−1, wemeasure a total H2O integrated opacity of 10 km s−1 for theNE absorption. This value was obtained assuming a source cov-ering factor of 100%, and is therefore a lower limit. It corre-sponds to a total H2O column density of ∼6×1013 cm−2 and to atotal H2 column density of ∼1021 cm−2 (taking [H2O]/[H2]= 5×10⁻⁸), that is, one order of magnitude lower than the columndensity toward the SW image.
4.4. Relative abundances
In Table 5, we list the opacities integrated over different ve-locity intervals for the strong lines of CH, H2O, HCO+, HCN,NH3, CO, C I. From these integrated opacities and α coefficients(Eq. (3)), we can estimate column densities. Further, assumingthat the abundance of CH or H2O relative to H2 are compara-ble to that in the Galactic diffuse medium (Gérin et al. 2010;Qin et al. 2010; Flagey et al. 2013), we derive the scaled rel-ative abundances of all other species. We use CH as referencetoward the SW absorption, since it is not saturated. Toward theNE, we use H2O, which has the highest signal-to-noise ratio. Weemphasize that since the lines in the NE absorption are opticallythin, the relative abundances are not significantly affected by theunknown source covering factor.
A detailed analysis of the chemical composition (includingother detected species) will be discussed elsewhere. Here, wenote that the relative abundances in the wings of the SW ab-sorption and in the NE absorption are within a factor of a few,and are also comparable to abundances in the Galactic diffuseinterstellar medium. This confirms the results by Muller et al.(2011) concerning the fractional abundances of species detectedin the ATCA 7 mm survey. The derived column densities andabundances of CO and C I are highly uncertain in the wings ofthe SW absorption and toward the NE image where the physicalconditions are not constrained and the α coefficients may havedifferent values. For all other species discussed here, the α coef-ficients do not vary significantly within a wide range of physicalconditions. Their relative abundances are thus more robust.
4.5. Time variations of the line profiles
Time variations of the absorption profiles toward PKS 1830−211were reported by Muller & Guélin (2008) after (sparse) monitor-ing of the HCO+ 2−1 line over a period of 12 years. Recently,variations for other species such as CH3OH and CS have alsobeen reported (Bagdonaite et al. 2013b; Schultz et al. 2014).The origin of these long-term variations is thought to be due tochanges in the continuum emission (Muller & Guélin 2008) pos-sibly associated with a precessing jet (Nair et al. 2005), althoughevidence of a periodicity of the absorption changes remains to beseen.
Hereafter, we take advantage of the high quality of theALMA spectra to investigate the potential effect of the γ-rayflare during the ALMA observations on the absorption profiles(short-term variations), and compare them to previous spectraobtained at other facilities (long-term variations).
4.5.1. Short term variations, during the ALMA observations
The submm counterpart of the γ-ray flare has occured in theSW image at some time between May 22 and June 04, as sug-gested by the inversion of the chromaticity of the flux ratio(Fig. 3). Significant but small variations can be seen in the line
A112, page 9 of 21

A&A 566, A112 (2014)
Table 5. Integrated opacities of strong absorption lines and species relative abundances.
Integrated opacitya [Abundances relative to H2]Species fc(SW)b fc(NEb αc SW blue wingd SW line centere SW red wing f NEg
(cm−2 km−1 s) (km s−1) (km s−1) (km s−1) (km s−1)
CH 0.95 1.00 2.3E+13 2.38 [3.5E-08 ]� 21.17 [3.5E-08 ]� 2.07 [3.5E-08 ]� 2.07 [5.2E-08]H2O 0.95 1.00 6.3E+12 † 11.76 [4.7E-08] sat. [–] 10.27 [4.8E-08] 7.21 [5.0E-08 ]�
HCO+ 0.91 1.00 2.1E+12 7.08 [9.5E-09] sat. [–] 4.59 [7.1E-09] 2.55 [5.9E-09]HCN 0.91 1.00 3.5E+12 5.15 [1.2E-08] sat. [–] 2.86 [7.4E-09] 1.03 [4.0E-09]NH3 0.95 1.00 1.2E+13 ‡ 1.22 [9.3E-09] 23.32 [2.0E-08] 0.51 [4.5E-09] 0.19 [2.6E-09]
CO (4−3) 0.93 1.00 7.8E+15 4.37 [2.2E-05] sat. [–] 1.39 [8.0E-06] 0.65 [5.5E-06]CO (5−4) 0.95 1.00 1.5E+16 2.69 [2.6E-05] sat. [–] 0.57 [6.2E-06] 0.28 [4.6E-06]
C I 0.93 1.00 7.6E+17 0.60 [2.9E-04] 22.32 [1.2E-03] 0.36 [2.0E-04] 0.22 [1.8E-04]
Notes. (a) The uncertainties on the integrated opacities are of a few 0.01; (b) source covering factor used to derive optical depth (see Eq. (1)); (b) seeEq. (3) for the definition of the α coefficients; (b) taken in the velocity interval [−40;−20] km s−1; (e) taken between [−10;+10] km s−1; ( f ) takenbetween [+20;+50] km s−1; (g) taken between [−175;−135] km s−1; sat.: saturated (τ > 1); (�) abundance fixed to scale that of other species in thesame velocity interval; (†) assuming an ortho-to-para ratio (OPR) of 3; (‡) assuming OPR = 1.
wings of the strong absorption of saturated species (CO 4−3 andHCO+ and HCN 2−1, see Figs. A.5−A.8). The relative varia-tions are stronger at high frequency. This is consistent if the in-tensity of the flaring region gets lower with decreasing frequency(dilution). No significant variation is found for the NE absorp-tion. It may be that the signal-to-noise ratio is not sufficient todetect this.
4.5.2. Long term (yearly timescale)
Here, we compare the ALMA B3-100 GHz (2012) spectra withpast ATCA-3 mm data taken on 2011 July 27 (Muller et al.2013). The two datasets have a wide frequency range in common(i.e., 91.2 GHz to 95.0 GHz, sky frequency), revealing the simul-taneous variations of numerous species. Because the NE andSW images were not resolved by the ATCA observations, wehave recomposed the ALMA spectra of the two lines-of-sight,assuming �= 1.35, fc(SW)= 92%, and fc(NE)= 100%. Theoverlay of the ALMA 2012 and ATCA 2011 data is shown inFig. A.9. From their comparison, we can see that the depth ofthe SW absorption has significantly decreased between 2011 and2012, while the NE absorption have become slightly stronger.More quantitatively, we compare the SW integrated opacities ofvarious species in Fig. A.10. A factor of about two is found be-tween the integrated opacities from 2011 and 2012. We note thatthe integrated opacity of the SiO J = 4−3 line has dropped morethan threefold, the largest change of all species observed in com-mon in the ATCA and ALMA data.
Muller et al. (2013) noticed that the SW absorption depthsin their July 2011 ATCA-7 mm observations had increasedby a factor of two compared to the previous observations inSeptember 2009 (Muller et al. 2011). Retrospectively, it appearsthat the July 2011 observations have been carried on at a veryfavorable time for absorption studies toward the SW image, asillustrated by the detection of the rare isotopologues 29SiO and30SiO, as well as of new species, NH2CHO, HCS+, and HOCO+.By the time of our ALMA observations, the SW absorptiondepths have returned to their level in 2009. In contrast, the ab-sorption toward the NE image became very weak in 2011, com-pared to 2009 and 2012 data.
In short, the absorption depths toward both the NE andSW images can change by a factor of at least two within atimescale of a year and may not be as predictible as suggestedby the long-term trends in monitoring so far (Muller & Guélin2008; Schultz et al. 2014). Clearly, a regular monitoring with
a timescale on the order of one month would be desirable andcould trigger dedicated studies (e.g., search of new species, highsignal-to-noise-ratio observations) when the absorption depthsincreases significantly.
5. Discussion
5.1. On the wide velocity spread of the absorption profiles
Given that the two lines-of-sight toward PKS 1830−211 samplegas on either side of the intervening galaxy’s bulge (or lens cen-ter of mass) and that both show an absorption profile with a widevelocity spread of �100 km s−1 indicates that either we are look-ing through two very special regions of the disk, or that the broadprofiles are a common property of the molecular gas componentthroughout the disk. In the Milky Way, such broad absorptionprofiles are found only in the Galactic center region (e.g., towardSgr B2 or Sgr A*, Martín et al. 2012).
Combining a low angular resolution H I spectrum (i.e., notresolving the two images of the blazar nor the pseudo-Einsteinring) with high angular resolution radio continuum maps ofPKS 1830−211, Koopmans & de Bruyn (2005) modeled the H Ikinematics using an azimuthally-symmetric gas distribution witha flat rotation curve. With this simple model, they constrainthe inclination of the z = 0.89 galaxy in a range i = 17◦–32◦, i.e., finding that the galaxy is nearly face-on, consistentwith the HST observations (Winn et al. 2002 and Fig. 2, right).Interestingly, their derived H I linewidth is σHI = 39−48 km s−1,which is high compared to local spiral galaxies (Koopmans &de Bruyn 2005). In addition, the results of their modeling pointtoward high H I depletion toward the galaxy center. Koopmans& de Bruyn (2005) suggested that the large H I linewidth couldbe due to feedback from active star formation in the Galacticdisk, resulting in high turbulent velocities.
In any case, the modeling of the H I data and the interpre-tation of the wide velocity spread of the molecular absorptionare complicated by the limited information on the gas kinemat-ics given by the sparse coverage of the background continuum.What could be the causes for the broad absorption profiles seenin the molecular gas? Possible interpretations include:
1. The inclination of the disk: while the modeling of the H Ispectrum and the HST image suggest that the galaxy isnearly face-on, an intermediate inclination could be suffi-cient for the lines-of-sight to intercept a long column of gas
A112, page 10 of 21

S. Muller et al.: Strong absorption lines toward PKS 1830−211
Fig. 9. RADEX-predicted opacities for transitions of CO (red), HCO+ (green), and fundamental ground-state transitions of H2O (ortho and para,blue), assuming a H2 column density of 1.5 × 1020 cm−2, a line width of 1 km s−1, and fractional abundances [CO]/[H2] = 10−5, [H2O]/[H2] =5 × 10⁻⁸, and [HCO+]/[H2] = 6 × 10⁻⁹.
through the disk and explore a significant part of the velocitygradient or streaming motions in the plane, especially in thecenter.
2. Extraplanar components: the broad profiles might be dueto a halo envelope, such as the warm diffuse componentaround the Milky Way, or to high/intermediate velocityclouds (Muller et al. 1963). A molecular outflow or molec-ular streamers, such as those observed in M82 (Walter et al.2002) can propel significant amounts of molecular gas intoa galaxy halo. In the case of the z = 0.89 galaxy in frontof PKS 1830−211, we do not see clear symmetric evidencefrom receeding/approaching velocity components. However,the evidence could be hampered by the fact that we sampleonly two individual lines-of-sight.
3. A thick molecular disk: there has recently been mounting ev-idence of the existence of a thick disk of diffuse molecu-lar gas seen in nearby galaxies. Garcia-Burillo et al. (1992)were first to detected extraplanar CO emission out to >1 kpcabove the disk of the edge-on galaxy NGC 891. More re-cently, deep interferometric plus single-dish observations ofM51 by Pety et al. (2013) suggest that up to 20% of the to-tal molecular mass could be extraplanar, with a typical scaleheight of ∼200 pc. Caldú-Primo et al. (2013) further presenta study of the velocity dispersion of the atomic and molecu-lar gas components in 12 nearby face-on galaxies, and find,surprisingly, a CO velocity dispersion similar to that of theH I layer. A thick disk might be the result of vertical turbu-lence, with gas ejected above the plane by star formation andthe fountain effect.
4. A merger system: the foreground galaxy could be a mergersystem (i.e., similar to the Antennae) instead of a simple
spiral, although there is no clear evidence of this in the HSTimage of PKS 1830−211.
Note that broad H I and OH absorption profiles(∼100−150 km s−1) are also found in the z = 0.68 (alsoapparently nearly face-on) absorber toward B 0218+357 (Carilliet al. 1993; Kanekar et al. 2003).
5.2. Water as a tracer of molecular gas in absorption
H2O is a molecular species that is now detected in an increas-ing number of high-redshift galaxies. In their Herschel-ATLASsample of lensed ultra-luminous starburst galaxies, Omont et al.(2013) report that water lines (such as 202−111 or 211−202, at988 GHz and 752 GHz rest frame, respectively) can have inten-sities almost comparable to high-J CO lines, making them po-tentially a key tool to study the extreme conditions in the denseand warm medium of luminous high-z galaxies. The aim of thissection is to investigate the interest of water as a tracer of molec-ular gas in absorption at high-z, i.e., not only limited to trace theemitting warm dense component, but also tracing the diffuse gascomponent, which is only detectable in absorption.
In Fig. 9, we plot the optical depths predicted with RADEXfor several lines of CO, HCO+, and H2O, and several setsof H2 density and kinetic temperature, as a function of red-shift, taking TCMB ∝ (1+z). We assume a H2 column den-sity of 1.5 × 1020 cm−2, a line width of 1 km s−1, and frac-tional abundances [CO]/[H2]= 10−5, [H2O]/[H2]= 5× 10⁻⁸, and[HCO+]/[H2]= 6 × 10⁻⁹, typical of abundances in the Galactic
A112, page 11 of 21

A&A 566, A112 (2014)
diffuse gas component4 (Sheffer et al. 2008; Qin et al. 2010;Gérin et al. 2010; Flagey et al. 2013). We also assume collisionswith only H2. While the optical depth of CO lines varies largely,depending on the physical conditions of the gas5, we note thatthe optical depth of the first ground-state lines of ortho- and para-water remains roughly at the same level, and always higher thanthat of CO and HCO+ lines. Because the excitation temperatureof the H2O lines is closely coupled to the CMB temperature, theH2 column density can be directly estimated from observationof only a single water line, provided it is not saturated and thefractional abundance of water remains roughly constant, as isobserved in the Galactic diffuse gas (Flagey et al. 2013).
Figure 10 shows that the fundamental ground-state line ofortho-water (110−101, 557 GHz rest frame) can be observed inALMA bands for a wide redshift range, 0.1 � z � 5.6. Forz > 1.2, the ground-state line of para-water can also be observed,leading to the possibility of measuring the ortho-to-para ratio. Asa result, water is an excellent tracer of the diffuse molecular gascomponent in absorption at high-z, observable from the ground(e.g., with ALMA). Number counts of submm galaxies indicatethat a large pool of targets are available as background con-tinuum sources for the sensitivity of ALMA (e.g., Casey et al.2014).
According to Herschel observations, the HF 1−0 line mayeven have a stronger opacity than H2O (Neufeld et al. 2010;Sonnentrucker et al. 2010). The HF molecule may thus be analternative tracer for moderate redshifts. At very high redshifts,though, the elemental abundance of F may decrease, inhibitingthe detection of HF (e.g., Lis et al. 2011).
6. Summary and conclusions
We present the first results from an ALMA Early ScienceCycle 0 spectral survey of the z = 0.89 molecular absorber lo-cated in front of the blazar PKS 1830−211. Four spectral tuningsat frequencies near 100, 250, 290, and 300 GHz, were selected tocover strong absorption lines from common interstellar species,namely CO, H2O, HCO+, HCN, C I, and NH3. The first resultsof this survey can be summarized as follows:
1. We enlarge the chemical inventory in this molecular-richabsorber with the detection of new species toward bothlines-of-sight. In particular, the redshift of the absorber al-lows us to detect submillimeter lines observed recently withHerschel and inacessible or difficult to observe from theground in the local z = 0 ISM, such as those from CH,H2O and H2Cl+. The inventory of species now reaches atotal of 42 different species in the main absorption towardthe SW image (plus 14 different rare isotopologues), and14 species toward the NE image.
2. The observation of strong lines provide us with high signal-to-noise ratio spectra, with the two continuum images ofPKS 1830−211 spatially resolved. This allows us to revealthe absorption profiles along the two lines-of-sight with un-precedented detail. Toward the NE image, the absorptionprofile is resolved into a collection of narrow velocity com-ponents (5−10 km s−1 wide) covering a wide velocity rangeof more than 100 km s−1. Toward the SW image, the main
4 In the diffuse molecular gas, the CO abundance strongly varies from∼10−7 to ∼10−5 depending on the physical conditions (e.g., Sheffer et al.2008).5 Due to its low electric dipole moment, the CO molecule is mucheasier to thermalize than molecules such as H2O and HCO+.
Fig. 10. Sky frequency of several tracers of molecular gas (dashed blue:H2O; dotted red: CO; dotted black: HCO+) as a function of redshift,with ALMA bands (labeled B3 to B9) and the Jansky Very Large Array(JVLA) frequency coverage overlaid.
broad absorption also covers a velocity interval of morethan 100 km s−1. In addition, the weak velocity componentat +170 km s−1, previously detected but with unknown loca-tion, is now identified toward the SW image, i.e., presentinga remarkable large velocity offset of +170 km s−1 with re-spect to the main (v = 0 km s−1) absorption feature.
3. The large velocity interval seen along both lines-of-sightsuggests either that the galaxy has an intermediate inclina-tion and that we sample velocity gradients or streaming mo-tions in the disk plane, that the gas in the foreground galaxyhas a large vertical distribution (e.g., a thick molecular disk)or extraplanar components (e.g., high velocity clouds), orthat the absorber has a more complex geometry than a simplerotating disk (e.g., it is a merger system).
4. We measure the continuum source covering factor to-ward the SW image from saturated lines, and find thatit varies little with frequency, from ∼90% at 100 GHzfor the HCO+/HCN 2−1 line to 95% at 300 GHz for theH2O 110−101 line. Either the covering factor is different forthe different species (i.e., they are not co-spatial), or the sizeof the continuum emission is roughly the same between 100and 300 GHz.
5. The ALMA observations were taken (serendipitously) at thetime of a strong γ-ray flare of the background blazar. A studyof the temporal and chromatic variations of the flux ratio be-tween the lensed images of the blazar during the flare is re-ported by Martí-Vidal et al. (2013). Over the time span of theobservations (∼two months), we find only minor variationsin the spectral line profiles, mostly in the wings of saturatedlines.
6. Of all the lines detected so far toward PKS 1830−211, theH2O 110−101 line (557 GHz rest frame) has the deepest
A112, page 12 of 21

S. Muller et al.: Strong absorption lines toward PKS 1830−211
absorption. We argue that ground-state water lines are ex-cellent probes of molecular absorption at high-redshift.
An accompanying paper (Muller et al. 2014) focusses on the firstextragalactic detection of the chloronium ion, H2Cl+, towardPKS 1830−211, and includes a measurement of the 35Cl/37Clisotopic ratio at z = 0.89. Forthcoming publications will dealwith constraints of the variations of fundamental constants,chemistry, and isotopic ratios in the z = 0.89 absorber towardPKS 1830−211, based on these ALMA Cycle 0 data.
Acknowledgements. This paper makes use of the following ALMA data:ADS/JAO.ALMA#2011.0.00405.S. ALMA is a partnership of ESO (represent-ing its member states), NSF (USA) and NINS (Japan), together with NRC(Canada) and NSC and ASIAA (Taiwan), in cooperation with the Republicof Chile. The Joint ALMA Observatory is operated by ESO, AUI/NRAOand NAOJ. The financial support to Dinh-V-Trung from Vietnam’s NationalFoundation for Science and Technology (NAFOSTED) under contract 103.08-2010.26 is gratefully acknowledged.
ReferencesBagdonaite, J., Jansen, P., Henkel, C., et al. 2013a, Science, 339, 46Bagdonaite, J., Daprá, M., Jansen, P., et al. 2013b, Phys. Rev. Lett., 111, 1101Barnacka, A., Glicenstein, J.-F., & Moudden, Y. 2011, A&A, 528, L3Bottinelli, S., Hughes, A. M., van Dishoeck, E. F., et al. 2009, ApJ, 690, 130Caldú-Primo, A., Schruba, A., Walter, F., et al. 2013, AJ, 146, 150Carilli, C. L., Rupen, M. P., & Yanny, B. 1993, ApJ, 412, 59Casey, C. M., Narayanan, D., & Cooray, A. 2014, Phys. Rep., in press
[arXiv:1402.1456]Chengalur, J. N., de Bruyn, A. G., & Narasimha, D. 1999, A&A, 343, 79Ciprini, S. 2012, ATel, 4158Combes, F. 2008, Ap&SS, 313, 321Combes, F., & Wiklind, T. 1997, ApJ, 486, 79Curran, S. J., Tanna, A., Koch, F. E., et al. 2011, A&A, 533, A55de Nijs, A. J., Ubachs, W., & Bethlem, H. L. 2012, Phys. Rev. A, 86, 2501Douglas, A. E., & Herzberg, G. 1941, ApJ, 94, 381Ellingsen, S. P., Voronkov, M. A., Breen, S. L., & Lovell, J. E. J. 2012, ApJ, 747,
L7Flagey, N., Goldsmith, P. F., Lis, D. C., et al. 2013, ApJ, 762, 11Garcia-Burillo, S., Guélin, M., Cernicharo, J., & Dahlem, M. 1992, A&A, 266,
21Garrett, M. A., Nair, S., Porcas, R. W., & Patnaik, A. R. 1997, Vistas Astron.,
41, 281Gérin, M., Phillips, T. G., Benford, D. J., et al. 1997, ApJ, 488, 31Gérin, M., de Luca, M., Goicoechea, J. R., et al. 2010, A&A, 521, A16Guirado, J. C., Jones, D. L., Lara, L., et al. 1999, A&A, 346, 392
Henkel, C., Braatz, J. A., Menten, K. M., & Ott, J. 2008, A&A, 485, 451Henkel, C., Menten, K. M., Murphy, M. T., et al. 2009, A&A, 500, 725Jauncey, D. L., Reynolds, J. E., Tzioumis, A. K., et al. 1991, Nature, 352, 132Jin, C., Garrett, M. A., Nair, S., et al. 2003, MNRAS, 340, 1309Kanekar, N. 2011, ApJ, 728, 12Kanekar, N., Chengalur, J. N., de Bruyn, A. G., & Narasimha, D. 2003, MNRAS,
345, 7Koopmans, L. V. E., & de Bruyn, A. G. 2005, MNRAS, 360, L6Lidman, C., Courbin, F., Meylan, G., et al. 1999, ApJ, 514, 57Lis, D. C., Neufeld, D. A., Phillips, T. G., Gérin, M., & Neri, R. 2011, ApJ, 738,
6Lovell, J. E. J., Jauncey, D. L., Reynolds, J. E., et al. 1998, ApJ, 508, L51McKellar, A. 1940, PASP, 52, 187Martín, S., Martín-Pintado, J., Montero-Castano, M., Ho, P. T. P., & Blundell, R.
2012, A&A, 539, A29Martí-Vidal, I., Muller, S., Combes, F., et al. 2013, A&A, 558, A123Martí-Vidal, I., Vlemmings, W., Muller, S., & Casey S. 2014, A&A, 563, A136Menten, K. M., Carilli, C. L., Reid, M. J. 1999, ASP Conf. Ser., 156, 218Menten, K. M., Güsten, R., Leurini, S., et al. 2008, A&A, 492, 725Muller, S., & Guélin, M. 2008, A&A, 491, 739Muller, C. A., Oort, J. H., & Raimond, E. 1963, CR Acad. Sci. Paris, 257, 1661Muller, S., Guélin, M., Dumke, M., et al. 2006, A&A, 458, 417Muller, S., Beelen, A., Guélin, M., et al. 2011, A&A, 535, A103Muller, S., Beelen, A., Black, J. H., et al. 2013, A&A, 551, A109Muller, S., Black, J. H., Guélin, M., et al. 2014, A&A, 566, L6Murphy, M. T., Flambaum, V. V., Muller, S., & Henkel, C. 2008, Science, 320,
1611Nair, S., Jin, C., & Garrett, M. A. 2005, MNRAS, 362, 1157Neufeld, D. A., Sonnentrucker, P., Phillips, T. G., et al. 2010, A&A, 518, 108Noterdaeme, P., Petitjean, P., Srianand, R., et al. 2011, A&A, 526, L7Omont, A., Yang, C., Cox, P., et al. 2013, A&A, 551, 115Persson, C. M., Black, J. H., Cernicharo, J., et al. 2010, A&A, 521, A45Persson, C. M., De Luca, M., Mookerjea, B., et al. 2012, A&A, 543, A145Pety, J., Schinnerer, E., Leroy, A. K., et al. 2013, ApJ, 779, 43Qin, S.-L., Schilke, P., Comito, C., et al. 2010, A&A, 521, A14Schultz, A., Henkel, C., Menten, K. M., Muller, S., & Muders D. 2014, A&A,
submittedSheffer, Y., Rogers, M., Federman, S. R., et al. 2008, ApJ, 687, 1075Sonnentrucker, P., Neufeld, D. A., Phillips, T. G., et al. 2010, A&A, 521, A12Swings, P., & Rosenfeld, L. 1937, ApJ, 86, 483Uzan, J.-P. 2011, Liv. Rev. Relat., 14, 2van der Tak, F. F. S., Black, J. H., Schöier, F. L., Jansen, D. J., & van Dishoeck,
E. F. 2007, A&A, 468, 627Walter, F., Weiss, A., & Scoville, N. 2002, ApJ, 580, 21Weiss, A., Walter, F., Downes, D., et al. 2012, ApJ, 753, 102Wiklind T., & Combes F. 1996, Nature, 379, 139Wiklind T., & Combes F. 1998, ApJ, 500, 129Wiklind, T., & Combes, F. 1999 [arXiv:astro-ph/9909314]Wiklind, T., & Combes, F. 2001, ASP Conf. Proc., 237, 155Winn, J. N., Kochanek, C. S., McLeod, B. A., et al. 2002, ApJ, 575, 103Wirström, E. S., Bergman, P., Black, J. H., et al. 2010, A&A, 522, A19
Pages 14 to 21 are available in the electronic edition of the journal at http://www.aanda.org
A112, page 13 of 21

A&A 566, A112 (2014)
Appendix A: ALMA cycle 0 data
Table A.1. Lines detected at z = 0.89 toward PKS 1830−211 in the ALMA cycle 0 survey.
Rest Sky freq. Elow S ul Dipole Q(5.14 K)Species Line freq. z = 0.88582 (K) moment
(GHz) (GHz) (Debye)
Hydrogen cyanide HC15N (2−1) 172.108 91.264 4.1 2.0 2.99 2.8Methanimine CH2NH (211−202) 172.267 91.349 9.2 7.4 1.53 14.6Hydrogen cyanide H13CN (2−1) 172.678 91.567 4.1 2.0 2.99 2.8Formyl radical HCO (202−101) (hfs) 173.377 91.937 4.2 2.8 1.36 11.3Formylium H13CO+ (2−1) 173.507 92.006 4.2 2.0 3.90 2.8Silicon monoxide SiO (4−3) 173.688 92.102 12.5 4.0 3.10 5.3Formylium HC17O+ (2−1) 174.113 92.328 4.2 2.0 3.90 2.8Hydrogen isocyanide HN13C (2−1) 174.179 92.363 4.2 2.0 3.05 2.8Ethynyl C2H (N = 2−1, J = 5/2−3/2) (hfs) 174.663 92.619 4.2 2.8 0.77 11.3Hydrogen cyanide HCN (2−1) 177.261 93.997 4.3 2.0 2.99 2.8Hydrogen isocyanide H15NC (2−1) 177.729 94.245 4.3 2.0 3.05 2.8Formylium HCO+ (2−1) 178.375 94.588 4.3 2.0 3.90 2.8Sulfur monoxide SO (54-43) 178.605 94.710 15.9 4.9 1.54 7.6Hydroxymethylidyne HOC+ (2−1) 178.972 94.904 4.3 2.0 2.77 2.8Carbon monosulfide CS (4−3) 195.954 103.909 14.1 4.0 1.96 4.7Carbon monoxide CO (4−3) 461.041 244.478 33.2 4.0 0.11 5.8Amidogen NH2 (110-101) (hfs, para) 462.434 245.216 0.0 2.1 1.82 18.Chloronium H37
2 Cl+ (111−000) (hfs, para) 484.232 256.775 0.0 2.0 1.89 4.1Chloronium H35
2 Cl+ (111−000) (hfs, para) 485.418 257.404 0.0 2.0 1.89 4.1Carbon C I 3P1-3P0 492.161 260.980 0.0 – – –Methanol CH3OH (414-303) 492.279 261.042 13.9 2.4 1.44 7.0Methylidyne CH (N = 1, J = 3/2−1/2) (hfs) 532.7/536.8 282.5/284.6 0.2 0.83 1.46 8.1Carbon monoxide 13CO (5−4) 550.926 292.142 52.9 5.0 0.11 6.0Water H17
2 O (110−101) (ortho) 552.021 292.722 0.0 4.5 1.85 9.0Water H2O (110−101) (ortho) 556.936 295.328 0.0 4.5 1.85 9.0Ammonia NH3 (10-00) (hfs, ortho) 572.498 303.580 0.0 2.7 1.47 39.2Carbon monoxide CO (5−4) 576.268 305.580 55.3 5.0 0.11 5.8
Notes. Elow is the lower-level energy of the transition. S ul is the line strength. Q(5.14 K) is the value of the partition function at a temperatureof 5.14 K. For species with hyperfine structure (indicated by hfs), the values are given for the hyperfine component with the maximum relativeintensity.
A112, page 14 of 21

S. Muller et al.: Strong absorption lines toward PKS 1830−211
Fig. A.1. ALMA cycle 0 B3–100 GHz spectra, after self-bandpass of the SW spectra by the NE spectra. Absorption lines from the SW line-of-sightappear as <1-feature, while the absorption lines from the NE line-of-sight appear as >1-feature.
A112, page 15 of 21
A&A 566, A112 (2014)
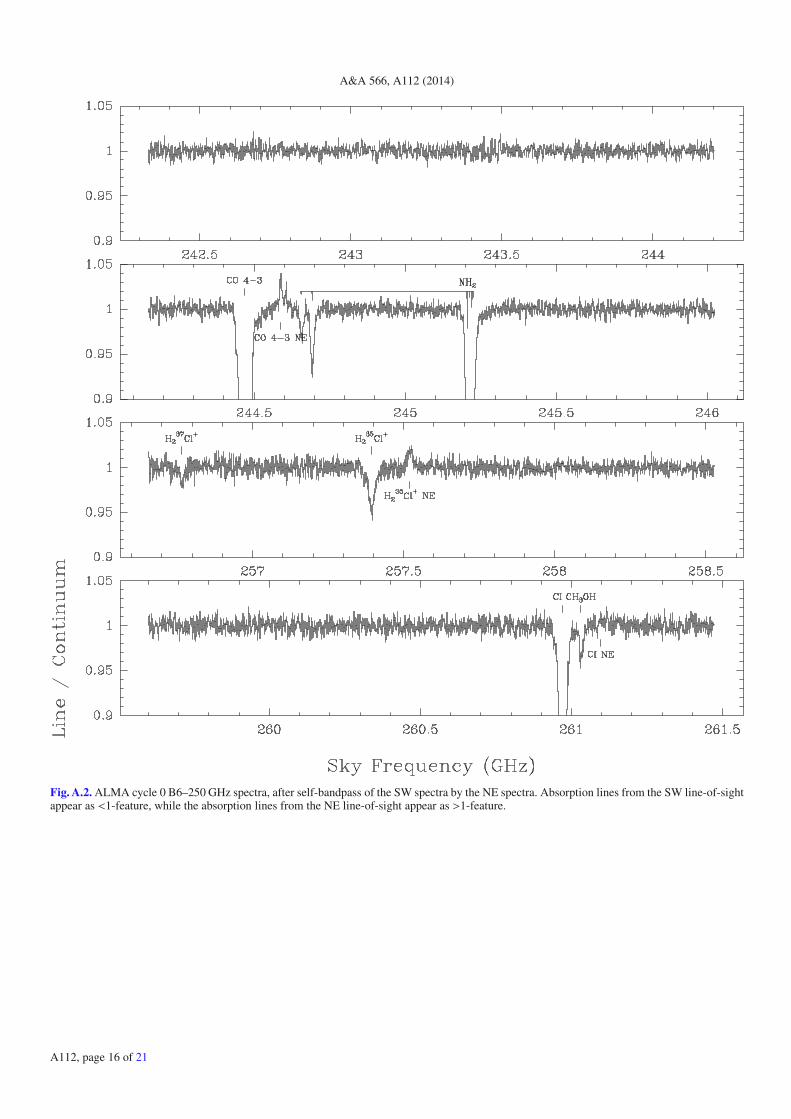
Fig. A.2. ALMA cycle 0 B6–250 GHz spectra, after self-bandpass of the SW spectra by the NE spectra. Absorption lines from the SW line-of-sightappear as <1-feature, while the absorption lines from the NE line-of-sight appear as >1-feature.
A112, page 16 of 21

S. Muller et al.: Strong absorption lines toward PKS 1830−211
Fig. A.3. ALMA cycle 0 B7–290 GHz spectra, after self-bandpass of the SW spectra by the NE spectra. Absorption lines from the SW line-of-sightappear as <1-feature, while the absorption lines from the NE line-of-sight appear as >1-feature.
A112, page 17 of 21

A&A 566, A112 (2014)
Fig. A.4. ALMA cycle 0 B7–300 GHz spectra, after self-bandpass of the SW spectra by the NE spectra. Absorption lines from the SW line-of-sightappear as <1-feature, while the absorption lines from the NE line-of-sight appear as >1-feature.
A112, page 18 of 21

S. Muller et al.: Strong absorption lines toward PKS 1830−211
Table A.2. O3 atmospheric lines in the observed bands.
Tuning Rest freq. Blend with(GHz) a z = 0.89 line
B3–100 GHz 93.844 no93.955 no
103.878 noB6–250 GHz 242.319 no
243.454 no244.158 no258.202 no
B7–290 GHz 282.837 noB7–300 GHz 290.975 no
293.548 no293.171 no303.165 no
Notes. The a posteriori Doppler correction (Earth motion relative toPKS 1830−211 direction) makes the atmospheric lines shift slightly(few MHz) from their rest frequencies, depending on the epoch.
Fig. A.5. Time variations toward the SW image between 2012 April 09and 2012 May 23.
Fig. A.6. Time variations toward the SW image between 2012 May 22and 2012 Jun 04.
A112, page 19 of 21

A&A 566, A112 (2014)
Fig. A.7. Time variations toward the SW image between 2012 Jun. 04and 2012 Jun. 15.
Fig. A.8. Time variations toward the SW image between 2012 May 22and 2012 Jun. 15.
A112, page 20 of 21

S. Muller et al.: Strong absorption lines toward PKS 1830−211
Fig. A.9. Composite ALMA B3 spectra (observed in 2012, in black) overlaid on top of the ATCA-3mm spectra obtained in July 2011 (in magenta)by Muller et al. (2013). The ALMA spectra has been recomposed using the spectra from both images (unresolved in the ATCA observations),assuming� = FNE/FSW = 1.35, fc(SW) = 92%, and fc(NE) = 100%.
Fig. A.10. Comparison of the integrated opacities of the same lines between ATCA observations in July 2011 and ALMA observations in spring2012.
A112, page 21 of 21


![pkS/ kjh j.kchj flag fo'ofo|ky;]thUn - CRSU](https://static.fdokumen.com/doc/165x107/63355175d2b728420307dd5d/pks-kjh-jkchj-flag-foofokythun-crsu.jpg)