American Sign Language to English Interpretation Fall 2012 ...
55
Program Evaluation: American Sign Language to English Interpretation Fall 2012 through Spring 2017 Research Report No. 95-17 Office of Institutional Effectiveness and Student Success OCTOBER 2017
-
Upload
khangminh22 -
Category
Documents
-
view
1 -
download
0
Transcript of American Sign Language to English Interpretation Fall 2012 ...

Program Evaluation: American Sign Language to
English InterpretationFall 2012 through Spring 2017
Research Report No. 95-17
Office of Institutional Effectiveness and Student Success OCTOBER 2017

NORTHERN VIRGINIA COMMUNITY COLLEGE
OFFICE OF INSTITUTIONAL EFFECTIVENESS AND STUDENT SUCCESS
The purpose of the Office of Institutional Effectiveness and Student Success is to conduct analytical studies and provide information in support of institutional planning, policy formulation, and decision making. In addition, the office provides leadership and support in research related activities to members of the NOVA community engaged in planning and evaluating the institution’s success in accomplishing its mission.
When citing data from this report, the Northern Virginia Community College (NOVA) Office of Institutional Effectiveness
and Student Success must be cited as the source.
4001 Wakefield Chapel Road Annandale, VA 22003-3796
(703) 323-3129 www.nvcc.edu/oir

i
Table of Contents
Introduction ................................................................................................................................. 1
Section 1. American Sign Language to English Interpretation Annual Headcount and Student Enrollment Profile ........................................................................................................................ 2
A. American Sign Language Annual Headcount .................................................................... 2
B. American Sign Language Enrollment Profile ..................................................................... 3
C. American Sign Language Enrollment by Course and Campus .......................................... 5
D. American Sign Language Enrollment by Modality ............................................................. 8
E. American Sign Language Enrollment by Day/Night Status .............................................. 14
F. American Sign Language Enrollment by Session ............................................................ 23
Section 2. American Sign Language Student Success .............................................................. 30
A. American Sign Language Student Success by Campus ................................................. 30
B. American Sign Language Student Success by Modality ................................................. 32
C. American Sign Language Student Success by Dual Enrollment Status ........................... 36
D. American Sign Language Student Success by Session .................................................. 39
E. American Sign Language Graduation Rate ..................................................................... 43
F. American Sign Language Cumulative Mean GPA of Graduates...................................... 44
Section 3. American Sign Language FTES, Current Funded Ratio, and FTEF Requirement ..... 45
A. American Sign Language FTES, Current Funded Ratio, and FTEF Requirement Fall 2014 through Spring 2017 .............................................................................................................. 45

ii
List of Tables Table 1. Annual Headcount for All Program-Placed Students: 2012-13 through 2016-17 ............ 2
Table 2. Annual Headcount for First-time in College, Program-Placed Students: 2012-13 through 2016-17 .......................................................................................................................... 2
Table 3. ASL Student Enrollment Profile*: Fall 2014 through Fall 2016 ....................................... 3
Table 4. ASL Student Enrollment Profile*: Spring 2015 through Spring 2017 .............................. 4
Table 5. ASL Enrollment by Campus: Fall 2014 through Fall 2016.............................................. 5
Table 6. ASL Enrollment by Campus: Spring 2015 through Spring 2017..................................... 5
Table 7. INT Enrollment by Campus: Fall 2014 through Fall 2016 .............................................. 6
Table 8. INT Enrollment by Campus: Spring 2015 through Spring 2017 ..................................... 6
Table 9. ASL Enrollment by Course: Fall 2014 to Fall 2016 ........................................................ 6
Table 10. ASL Enrollment by Course: Spring 2015 to Spring 2017 ............................................. 7
Table 11. INT Enrollment by Course: Fall 2014 to Fall 2016 ....................................................... 7
Table 12. INT Enrollment by Course: Spring 2015 to Spring 2017 .............................................. 7
Table 13. ASL Enrollment by Modality: Fall 2014 ........................................................................ 8
Table 14. ASL Enrollment by Modality: Spring 2015 .................................................................. 8
Table 15. ASL Enrollment by Modality: Fall 2015 ....................................................................... 9
Table 16. ASL Enrollment by Modality: Spring 2016 .................................................................. 9
Table 17. ASL Enrollment by Modality: Fall 2016 ..................................................................... 10
Table 18. ASL Enrollment by Modality: Spring 2017 ................................................................ 10
Table 19. INT Enrollment by Modality: Fall 2014 ...................................................................... 11
Table 20. INT Enrollment by Modality: Spring 2015 ................................................................. 11
Table 21. INT Enrollment by Modality: Fall 2015 ...................................................................... 12
Table 22. INT Enrollment by Modality: Spring 2016 ................................................................. 12
Table 23. INT Enrollment by Modality: Fall 2016 ...................................................................... 13
Table 24. INT Enrollment by Modality: Spring 2017 ................................................................. 13
Table 25. ASL Enrollment by Day/Night Status: Fall 2014 ......................................................... 14
Table 26. ASL Enrollment by Day/Night Status: Spring 2015 .................................................... 15
Table 27. ASL Enrollment by Day/Night Status: Fall 2015 ......................................................... 16
Table 28. ASL Enrollment by Day/Night Status: Spring 2016 .................................................... 17
Table 29. ASL Enrollment by Day/Night Status: Fall 2016 ......................................................... 18
Table 30. American Sign Language Enrollment by Day/Night Status: Spring 2017 ................... 19
Table 31. INT Enrollment by Day/Night Status: Fall 2014 .......................................................... 19

iii
Table 32. INT Enrollment by Day/Night Status: Spring 2015 ..................................................... 20
Table 33. INT Enrollment by Day/Night Status: Fall 2015 .......................................................... 20
Table 34. INT Enrollment by Day/Night Status: Spring 2016 ..................................................... 21
Table 35. INT Enrollment by Day/Night Status: Fall 2016 .......................................................... 21
Table 36. INT Enrollment by Day/Night Status: Spring 2017 ..................................................... 22
Table 37. ASL Enrollment by Session: Fall 2014 ....................................................................... 23
Table 38. ASL Enrollment by Session: Spring 2015 ................................................................. 23
Table 39. ASL Enrollment by Session: Fall 2015 ....................................................................... 24
Table 40. ASL Enrollment by Session: Spring 2016 ................................................................. 25
Table 41. ASL Enrollment by Session: Fall 2016 ...................................................................... 26
Table 42. ASL Enrollment by Session: Spring 2017 .................................................................. 27
Table 43. INT Enrollment by Session: Fall 2014 ........................................................................ 27
Table 44. INT Enrollment by Session: Spring 2015 ................................................................... 28
Table 45. INT Enrollment by Session: Fall 2015 ........................................................................ 28
Table 46. INT Enrollment by Session: Spring 2016 ................................................................... 29
Table 47. INT Enrollment by Session: Fall 2016 ........................................................................ 29
Table 48. INT Enrollment by Session: Spring 2017 ................................................................... 29
Table 49. ASL Student Success Overall: Fall 2014 to Fall 2016 ............................................... 30
Table 50. ASL Student Success Overall: Spring 2015 to Spring 2017 ...................................... 30
Table 51. INT Student Success Overall: Fall 2014 to Fall 2016 ................................................ 31
Table 52. INT Student Success by Campus: Spring 2015 to Spring 2017 ................................ 31
Table 53. ASL Student Success by Modality: Fall 2014 ............................................................ 32
Table 54. ASL Student Success by Modality: Spring 2015 ........................................................ 32
Table 55. ASL Student Success by Modality: Fall 2015 ............................................................ 33
Table 56. ASL Student Success by Modality: Spring 2016 ........................................................ 33
Table 57. ASL Student Success by Modality: Fall 2016 ............................................................ 33
Table 58. ASL Student Success by Modality: Spring 2017 ........................................................ 34
Table 59. INT Student Success by Modality: Fall 2014 ............................................................. 34
Table 60. INT Student Success by Modality: Spring 2015 ......................................................... 34
Table 61. INT Student Success by Modality: Fall 2015 ............................................................. 35
Table 62. INT Student Success by Modality: Spring 2016 ......................................................... 35
Table 63. INT Student Success by Modality: Fall 2016 ............................................................. 35
Table 64. INT Student Success by Modality: Spring 2017 ......................................................... 35

iv
Table 65. ASL Student Success by Dual Enrollment Status: Fall 2014 ..................................... 36
Table 66. ASL Student Success by Dual Enrollment Status: Spring 2015 ................................ 36
Table 67. ASL Student Success by Dual Enrollment Status: Fall 2015 .................................... 37
Table 68. ASL Student Success by Dual Enrollment Status: Spring 2016 ................................. 37
Table 69. ASL Student Success by Dual Enrollment Status: Fall 2016 ..................................... 38
Table 70. ASL Student Success by Dual Enrollment Status: Spring 2017 ................................. 38
Table 71. INT Student Success by Dual Enrollment Status: Fall 2014 to Spring 2017 ............... 38
Table 72. ASL Student Success by Session: Fall 2014 ............................................................. 39
Table 73. ASL Student Success by Session: Spring 2015 ........................................................ 39
Table 74. ASL Student Success by Session: Fall 2015 ............................................................ 40
Table 75. ASL Student Success by Session: Spring 2016 ....................................................... 40
Table 76. ASL Student Success by Session: Fall 2016 ............................................................ 40
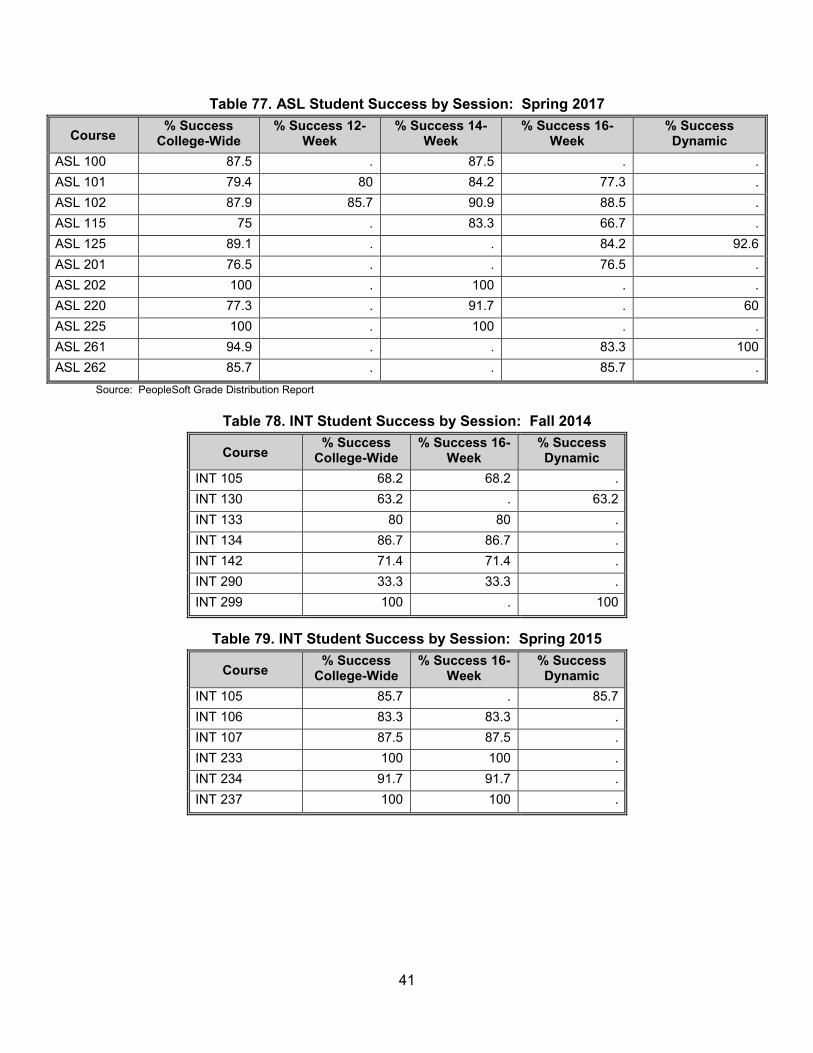
Table 77. ASL Student Success by Session: Spring 2017 ....................................................... 41
Table 78. INT Student Success by Session: Fall 2014 ............................................................. 41
Table 79. INT Student Success by Session: Spring 2015 ........................................................ 41
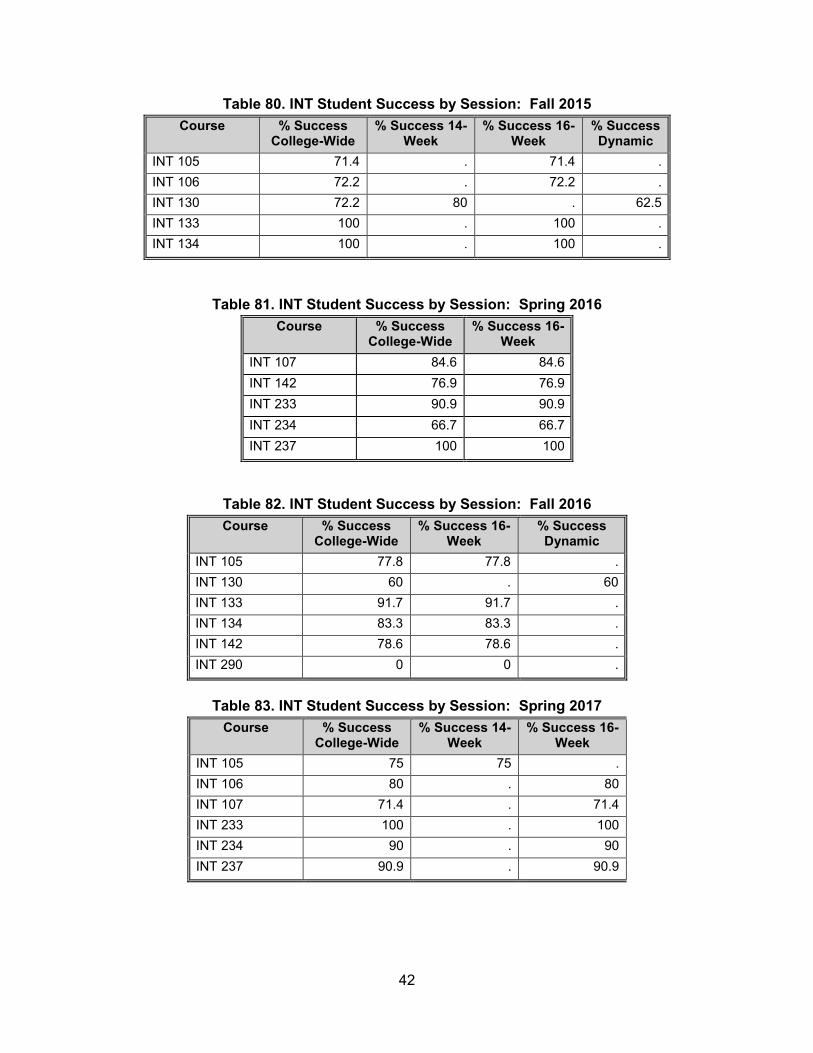
Table 80. INT Student Success by Session: Fall 2015 ............................................................. 42
Table 81. INT Student Success by Session: Spring 2016 ........................................................ 42
Table 82. INT Student Success by Session: Fall 2016 ............................................................. 42
Table 83. INT Student Success by Session: Spring 2017 ........................................................ 42
Table 84. ASL A.A.S. Graduation Rate from Any Program: Fall 2009 Cohort through Fall 2013 Cohort ....................................................................................................................................... 43
Table 85. ASL A.A.S. Graduation Rate from Same Program: Fall 2009 Cohort through Fall 2013 Cohort ....................................................................................................................................... 43
Table 86. ASL Certificate 2-Year Graduation Rate from Any Program: Fall 2011 Cohort through Fall 2015 Cohort ....................................................................................................................... 44
Table 87. ASL Certificate Graduation Rate from Same Program: Fall 2011 Cohort through Fall 2015 Cohort .............................................................................................................................. 44
Table 88. ASL Mean GPA of Graduates: 2012-13 through 2016-17 .......................................... 44
Table 89. ASL FTES, Current Funded Ratio, and FTEF Requirement by Campus: Fall 2014 ... 45
Table 90. ASL FTES, Current Funded Ratio, and FTEF Requirement by Campus: Spring 2015 .......................................................................................................................................... 45
Table 91. ASL FTES, Current Funded Ratio, and FTEF Requirement by Campus: Fall 2015 ... 45
Table 92. ASL FTES, Current Funded Ratio, and FTEF Requirement by Campus: Spring 2016 .......................................................................................................................................... 46
Table 93. ASL FTES, Current Funded Ratio, and FTEF Requirement by Campus: Fall 2016 ... 46

v
Table 94. ASL FTES, Current Funded Ratio, and FTEF Requirement by Campus: Spring 2017 .......................................................................................................................................... 46
1
American Sign Language to English Interpretation Program Data Evaluation:
2012-13 through 2016-2017 Introduction This Report presents student enrollment and success data for the American Sign Language to English Interpretation program. American Sign Language courses are offered at Annandale and ELI. Section 1 provides unduplicated enrollment data on students in the American Sign Language program for Fall 2012 through Spring 2017. Data are disaggregated by gender, race, age, enrollment status, campus, modality, day/night status, and session. Section 2 presents student success data for the American Sign Language program from 2014-2015 through 2016-2017. Student success data includes successful course completion rates disaggregated by campus, modality, dual enrollment status, and session; graduation rates by cohort, and cumulative mean GPA of graduates. Section 3 includes data on American Sign Language FTES, Current Funded Ratio, and FTEF from Fall 2012 through Spring 2017.

2
Section 1. American Sign Language to English Interpretation Annual Headcount and Student Enrollment Profile
A. American Sign Language Annual Headcount
Table 1. Annual Headcount for All Program-Placed Students: 2012-13 through 2016-17
Program Curriculum Code 2012-13 2013-14 2014-15 2015-16 2016-17 Average Percent
Change ASL to English Interp., AAS 6400 103 90 84 78 85 88 -17.5 Soc. Sci./Deaf Studies, A.S. 8823 32 34 33 29 22 30 -31.3 ASL, CSC 221-640-01 34 24 27 40 38 33 11.8 Program-Placed College Students . 61,498 60,797 59,052 57,260 54,779 58,677 -10.9 All College Students . 78,413 77,332 76,044 75,858 74,283 76,386 -5.3
Source: IRIS Files
Table 2. Annual Headcount for First-time in College, Program-Placed Students: 2012-13 through 2016-17
Program Curriculum Code 2012-13 2013-14 2014-15 2015-16 2016-17 Average Percent
Change ASL to English Interp., AAS 6400 7 5 11 11 8 8 14.3 Soc. Sci./Deaf Studies, A.S. 8823 5 2 3 3 2 3 -60 ASL, CSC 221-640-01 5 6 3 3 3 4 -40 Program-Placed College Students . 10,491 11,006 10,535 10,513 9,700 10,449 -7.5 All College Students . 13,953 14,631 15,134 16,377 16,819 15,383 20.5
Source: IRIS Files

3
B. American Sign Language Enrollment Profile
Table 3. ASL Student Enrollment Profile*: Fall 2014 through Fall 2016 Fall 2014 Fall 2015 Fall 2016
Category Subgroup # % # % # % Enrollment 104 100 101 100 101 100 Gender Male 16 15.4 11 10.9 14 13.9 Female 88 84.6 90 89.1 87 86.1 Race White 65 62.5 66 65.3 61 60.4 Black/African American 17 16.3 14 13.9 18 17.8 Asian 5 4.8 5 5 2 2 Hispanic/Latino 10 9.6 10 9.9 11 10.9 American Indian/Alaska
Native 2 1.9 2 2 1 1
Native Hawaiian/Other Pacific Islander
. . . . 1 1
Two or More Races 4 3.8 4 4 6 5.9 Not Specified 1 1 . . 1 1 Age Group Under 18 1 1 3 3 2 2 18-21 35 33.7 27 26.7 30 29.7 22-24 17 16.3 16 15.8 17 16.8 25-29 21 20.2 22 21.8 22 21.8 30-44 17 16.3 22 21.8 20 19.8 45-59 11 10.6 9 8.9 10 9.9 60 & Over 2 1.9 2 2 . . Full-Time, Part-Time Full-Time 37 35.6 30 29.7 29 28.7 Part-Time 67 64.4 71 70.3 72 71.3 Program Placement In 6400 61 58.7 59 58.4 57 56.4 In 8823 23 22.1 18 17.8 15 14.9 In 221-640-01 20 19.2 24 23.8 29 28.7
Source: IRIS Files *Curr. Code=4000/4001/4060/221-405-43/221-405-45/221-400-02/221-407-95

4
Table 4. ASL Student Enrollment Profile*: Spring 2015 through Spring 2017 Spring 2015 Spring 2016 Spring 2017
Category Subgroup # % # % # % Enrollment 94 100 86 100 95 100 Gender Male 11 11.7 8 9.3 14 14.7 Female 83 88.3 78 90.7 81 85.3 Race White 58 61.7 50 58.1 58 61.1 Black/African American 16 17 14 16.3 14 14.7 Asian 4 4.3 3 3.5 2 2.1 Hispanic/Latino 10 10.6 13 15.1 13 13.7 American Indian/Alaska Native 2 2.1 2 2.3 2 2.1 Native Hawaiian/Other Pacific
Islander . . . . 1 1.1
Two or More Races 2 2.1 3 3.5 3 3.2 Not Specified 2 2.1 1 1.2 2 2.1 Age Group Under 18 1 1.1 2 2.3 2 2.1 18-21 20 21.3 21 24.4 19 20 22-24 16 17 13 15.1 19 20 25-29 22 23.4 22 25.6 23 24.2 30-44 24 25.5 18 20.9 24 25.3 45-59 10 10.6 8 9.3 7 7.4 60 & Over 1 1.1 2 2.3 1 1.1 Full-Time/Part-Time Full-Time 33 35.1 21 24.4 29 30.5 Part-Time 61 64.9 65 75.6 66 69.5 Program Placement In 6400 56 59.6 47 54.7 60 63.2 In 8823 21 22.3 18 20.9 13 13.7 In 221-640-01 17 18.1 21 24.4 22 23.2
Source: IRIS Files *Curr. Code=4000/4001/4060/221-405-43/221-405-45/221-400-02/221-407-95

5
C. American Sign Language Enrollment by Course and Campus
Table 5. ASL Enrollment by Campus: Fall 2014 through Fall 2016
Course Fall 2014 Fall 2015 Fall 2016 AN ELI AN ELI AN ELI
ASL 100 18 0 28 0 17 0 ASL 101 51 0 88 0 101 0 ASL 102 24 0 20 0 24 0 ASL 115 13 0 10 0 12 0 ASL 125 54 22 57 29 68 41 ASL 150 13 0 11 0 0 0 ASL 201 49 0 36 0 21 0 ASL 202 14 0 11 0 12 0 ASL 220 11 11 17 9 27 6 ASL 261 21 0 20 0 19 0
Total 268 33 298 38 301 47 Source: IRIS Files
Table 6. ASL Enrollment by Campus: Spring 2015 through Spring 2017
Course Spring 2015
Spring 2016
Spring 2017
AN ELI AN ELI AN ELI ASL 100 28 0 15 0 16 0 ASL 101 76 0 69 0 68 0 ASL 102 37 0 43 0 58 0 ASL 115 22 0 22 0 24 0 ASL 125 53 32 74 40 46 27 ASL 201 17 0 11 0 17 0 ASL 202 22 0 25 0 13 0 ASL 210 13 0 14 0 . . ASL 220 18 0 7 7 22 10 ASL 225 11 0 . . 10 0 ASL 261 10 0 23 0 39 0 ASL 262 14 0 17 0 14 0
Total 321 32 320 47 327 37 Source: IRIS Files

6
Table 7. INT Enrollment by Campus: Fall 2014 through Fall 2016
Course Fall 2014 Fall 2015 Fall 2016 AN ELI AN ELI AN ELI
INT 105 22 0 14 0 18 0 INT 106 . . 18 0 . . INT 130 19 5 18 8 15 15 INT 133 15 0 13 0 12 0 INT 134 15 0 13 0 13 0 INT 142 14 0 . . 14 0 INT 290 3 0 . . 2 0 INT 299 1 0 . . . .
Total 89 5 76 8 74 15
Table 8. INT Enrollment by Campus: Spring 2015 through Spring 2017
Course Spring 2015
Spring 2016
Spring 2017
AN AN AN INT 105 7 . 9 INT 106 12 . 15 INT 107 8 13 14 INT 142 . 13 . INT 233 13 12 12 INT 234 12 13 10 INT 237 11 10 11
Total 63 61 71
Table 9. ASL Enrollment by Course: Fall 2014 to Fall 2016 Course Fall 2014 Fall 2015 Fall 2016
ASL 100 18 28 17 ASL 101 51 88 101 ASL 102 24 20 24 ASL 115 13 10 12 ASL 125 54 57 68 ASL 150 13 11 . ASL 201 49 36 21 ASL 202 14 11 12 ASL 220 11 17 27 ASL 261 21 20 19
Total 268 298 301 Source: IRIS Files

7
Table 10. ASL Enrollment by Course: Spring 2015 to Spring 2017
Course Spring 2015
Spring 2016
Spring 2017
ASL 100 28 15 16 ASL 101 76 69 68 ASL 102 37 43 58 ASL 115 22 22 24 ASL 125 53 74 46 ASL 201 17 11 17 ASL 202 22 25 13 ASL 210 13 14 . ASL 220 18 7 22 ASL 225 11 . 10 ASL 261 10 23 39 ASL 262 14 17 14
Total 321 320 327 Source: IRIS Files
Table 11. INT Enrollment by Course: Fall 2014 to Fall 2016
Course Fall 2014 Fall 2015 Fall 2016 INT 105 22 14 18 INT 106 . 18 . INT 130 19 18 15 INT 133 15 13 12 INT 134 15 13 13 INT 142 14 . 14 INT 290 3 . 2 INT 299 1 . . Total 89 76 74
Table 12. INT Enrollment by Course: Spring 2015 to Spring 2017
Course Spring 2015
Spring 2016
Spring 2017
INT 105 7 . 9 INT 106 12 . 15 INT 107 8 13 14 INT 142 . 13 . INT 233 13 12 12 INT 234 12 13 10 INT 237 11 10 11 Total 63 61 71

8
D. American Sign Language Enrollment by Modality
Table 13. ASL Enrollment by Modality: Fall 2014
Course
Face-to-Face Online N of
Sections % N of
Students % N of
Sections % N of
Students %
ASL 100 2 11.8 18 7.7 . . . . ASL 101 4 23.5 51 21.7 . . . . ASL 102 2 11.8 24 10.2 . . . . ASL 115 1 5.9 13 5.5 . . . . ASL 125 2 11.8 32 13.6 1 50 22 66.7 ASL 150 1 5.9 13 5.5 . . . . ASL 201 3 17.6 49 20.9 . . . . ASL 202 1 5.9 14 6 . . . . ASL 220 . . . . 1 50 11 33.3 ASL 261 1 5.9 21 8.9 . . . .
Total 17 100 235 100 2 100 33 100 Source: IRIS Files
Table 14. ASL Enrollment by Modality: Spring 2015
Course Face-to-Face Online
N of Sections
% N of Students
% N of Sections
% N of Students
%
ASL 100 2 10 28 9.7 . . . . ASL 101 5 25 76 26.3 . . . . ASL 102 3 15 37 12.8 . . . . ASL 115 1 5 22 7.6 . . . . ASL 125 1 5 21 7.3 1 100 32 100 ASL 201 1 5 17 5.9 . . . . ASL 202 2 10 22 7.6 . . . . ASL 210 1 5 13 4.5 . . . . ASL 220 1 5 18 6.2 . . . . ASL 225 1 5 11 3.8 . . . . ASL 261 1 5 10 3.5 . . . . ASL 262 1 5 14 4.8 . . . .
Total 20 100 289 100 1 100 32 100 Source: IRIS Files

9
Table 15. ASL Enrollment by Modality: Fall 2015
Course Face-to-Face Online
N of Sections
% N of Students
% N of Sections
% N of Students
%
ASL 100 2 11.1 28 10.8 . . . . ASL 101 6 33.3 88 33.8 . . . . ASL 102 1 5.6 20 7.7 . . . . ASL 115 1 5.6 10 3.8 . . . . ASL 125 1 5.6 28 10.8 1 50 29 76.3 ASL 150 1 5.6 11 4.2 . . . . ASL 201 2 11.1 36 13.8 . . . . ASL 202 1 5.6 11 4.2 . . . . ASL 220 1 5.6 8 3.1 1 50 9 23.7 ASL 261 2 11.1 20 7.7 . . . .
Total 18 100 260 100 2 100 38 100 Source: IRIS Files
Table 16. ASL Enrollment by Modality: Spring 2016
Course
Face-to-Face Online N of
Sections % N of
Students % N of
Sections % N of
Students %
ASL 100 1 5.6 15 5.5 . . . . ASL 101 4 22.2 69 25.3 . . . . ASL 102 3 16.7 43 15.8 . . . . ASL 115 2 11.1 22 8.1 . . . . ASL 125 1 5.6 34 12.5 1 50 40 85.1 ASL 201 1 5.6 11 4 . . . . ASL 202 2 11.1 25 9.2 . . . . ASL 210 1 5.6 14 5.1 . . . . ASL 220 . . . . 1 50 7 14.9 ASL 261 2 11.1 23 8.4 . . . . ASL 262 1 5.6 17 6.2 . . . .
Total 18 100 273 100 2 100 47 100 Source: IRIS Files
10
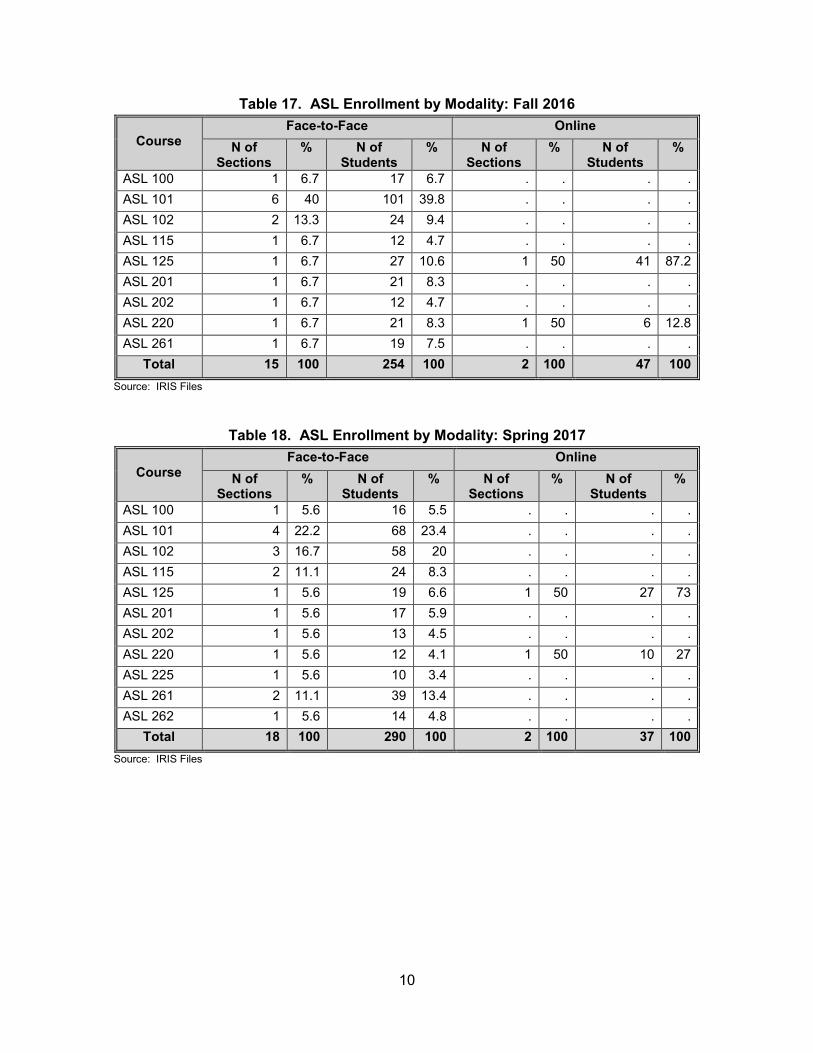
Table 17. ASL Enrollment by Modality: Fall 2016
Course Face-to-Face Online
N of Sections
% N of Students
% N of Sections
% N of Students
%
ASL 100 1 6.7 17 6.7 . . . . ASL 101 6 40 101 39.8 . . . . ASL 102 2 13.3 24 9.4 . . . . ASL 115 1 6.7 12 4.7 . . . . ASL 125 1 6.7 27 10.6 1 50 41 87.2 ASL 201 1 6.7 21 8.3 . . . . ASL 202 1 6.7 12 4.7 . . . . ASL 220 1 6.7 21 8.3 1 50 6 12.8 ASL 261 1 6.7 19 7.5 . . . .
Total 15 100 254 100 2 100 47 100 Source: IRIS Files
Table 18. ASL Enrollment by Modality: Spring 2017
Course Face-to-Face Online
N of Sections
% N of Students
% N of Sections
% N of Students
%
ASL 100 1 5.6 16 5.5 . . . . ASL 101 4 22.2 68 23.4 . . . . ASL 102 3 16.7 58 20 . . . . ASL 115 2 11.1 24 8.3 . . . . ASL 125 1 5.6 19 6.6 1 50 27 73 ASL 201 1 5.6 17 5.9 . . . . ASL 202 1 5.6 13 4.5 . . . . ASL 220 1 5.6 12 4.1 1 50 10 27 ASL 225 1 5.6 10 3.4 . . . . ASL 261 2 11.1 39 13.4 . . . . ASL 262 1 5.6 14 4.8 . . . .
Total 18 100 290 100 2 100 37 100 Source: IRIS Files

11
Table 19. INT Enrollment by Modality: Fall 2014
Course Face-to-Face Online Independent Study
N of Sections
% N of Students
% N of Sections
% N of Students
% N of Sections
% N of Students
%
INT 105 1 20 22 27.5 . . . . . . . . INT 130 1 20 14 17.5 1 100 5 100 . . . . INT 133 1 20 15 18.8 . . . . . . . . INT 134 1 20 15 18.8 . . . . . . . . INT 142 1 20 14 17.5 . . . . . . . . INT 290 . . . . . . . . 2 66.7 3 75 INT 299 . . . . . . . . 1 33.3 1 25 Total 5 100 80 100 1 100 5 100 3 100 4 100
Table 20. INT Enrollment by Modality: Spring 2015
Course
Face-to-Face N of
Sections % N of
Students %
INT 105 1 16.7 7 11.1 INT 106 1 16.7 12 19 INT 107 1 16.7 8 12.7 INT 233 1 16.7 13 20.6 INT 234 1 16.7 12 19 INT 237 1 16.7 11 17.5 Total 6 100 63 100

12
Table 21. INT Enrollment by Modality: Fall 2015
Course Face-to-Face Online
N of Sections
% N of Students
% N of Sections
% N of Students
%
INT 105 1 20 14 20.6 . . . . INT 106 1 20 18 26.5 . . . . INT 130 1 20 10 14.7 1 100 8 100 INT 133 1 20 13 19.1 . . . . INT 134 1 20 13 19.1 . . . . Total 5 100 68 100 1 100 8 100
Table 22. INT Enrollment by Modality: Spring 2016
Course
Face-to-Face N of
Sections % N of
Students %
INT 107 1 20 13 21.3 INT 142 1 20 13 21.3 INT 233 1 20 12 19.7 INT 234 1 20 13 21.3 INT 237 1 20 10 16.4 Total 5 100 61 100

13
Table 23. INT Enrollment by Modality: Fall 2016
Course Face-to-Face Online Independent Study
N of Sections
% N of Students
% N of Sections
% N of Students
% N of Sections
% N of Students
%
INT 105 1 25 18 31.6 . . . . . . . . INT 130 . . . . 1 100 15 100 . . . . INT 133 1 25 12 21.1 . . . . . . . . INT 134 1 25 13 22.8 . . . . . . . . INT 142 1 25 14 24.6 . . . . . . . . INT 290 . . . . . . . . 1 100 2 100 Total 4 100 57 100 1 100 15 100 1 100 2 100
Table 24. INT Enrollment by Modality: Spring 2017
Course
Face-to-Face N of
Sections % N of
Students %
INT 105 1 16.7 9 12.7 INT 106 1 16.7 15 21.1 INT 107 1 16.7 14 19.7 INT 233 1 16.7 12 16.9 INT 234 1 16.7 10 14.1 INT 237 1 16.7 11 15.5 Total 6 100 71 100
14
E. American Sign Language Enrollment by Day/Night Status
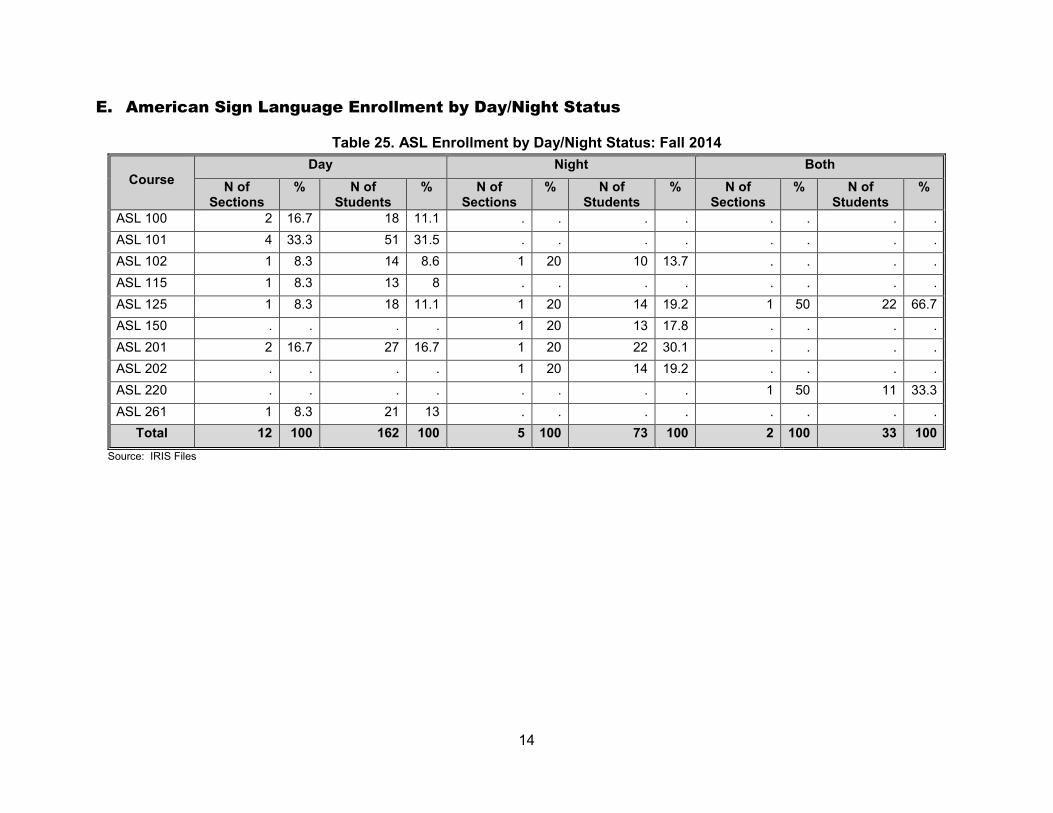
Table 25. ASL Enrollment by Day/Night Status: Fall 2014
Course Day Night Both
N of Sections
% N of Students
% N of Sections
% N of Students
% N of Sections
% N of Students
%
ASL 100 2 16.7 18 11.1 . . . . . . . . ASL 101 4 33.3 51 31.5 . . . . . . . . ASL 102 1 8.3 14 8.6 1 20 10 13.7 . . . . ASL 115 1 8.3 13 8 . . . . . . . . ASL 125 1 8.3 18 11.1 1 20 14 19.2 1 50 22 66.7 ASL 150 . . . . 1 20 13 17.8 . . . . ASL 201 2 16.7 27 16.7 1 20 22 30.1 . . . . ASL 202 . . . . 1 20 14 19.2 . . . . ASL 220 . . . . . . . . 1 50 11 33.3 ASL 261 1 8.3 21 13 . . . . . . . .
Total 12 100 162 100 5 100 73 100 2 100 33 100 Source: IRIS Files

15
Table 26. ASL Enrollment by Day/Night Status: Spring 2015
Course Day Night Both
N of Sections
% N of Students
% N of Sections
% N of Students
% N of Sections
% N of Students
%
ASL 100 1 6.7 13 6.2 1 20 15 19 . . . . ASL 101 4 26.7 57 27.1 1 20 19 24.1 . . . . ASL 102 3 20 37 17.6 . . . . . . . . ASL 115 1 6.7 22 10.5 . . . . . . . . ASL 125 1 6.7 21 10 . . . . 1 100 32 100 ASL 201 . . . . 1 20 17 21.5 . . . . ASL 202 2 13.3 22 10.5 . . . . . . . . ASL 210 1 6.7 13 6.2 . . . . . . . . ASL 220 . . . . 1 20 18 22.8 . . . . ASL 225 1 6.7 11 5.2 . . . . . . . . ASL 261 . . . . 1 20 10 12.7 . . . . ASL 262 1 6.7 14 6.7 . . . . . . . .
Total 15 100 210 100 5 100 79 100 1 100 32 100 Source: IRIS Files

16
Table 27. ASL Enrollment by Day/Night Status: Fall 2015
Course Day Night Both
N of Sections
% N of Students
% N of Sections
% N of Students
% N of Sections
% N of Students
%
ASL 100 2 18.2 28 15.4 . . . . . . . . ASL 101 5 45.5 78 42.9 1 14.3 10 12.8 . . . . ASL 102 1 9.1 20 11 . . . . . . . . ASL 115 . . . . 1 14.3 10 12.8 . . . . ASL 125 1 9.1 28 15.4 . . . . 1 50 29 76.3 ASL 150 . . . . 1 14.3 11 14.1 . . . . ASL 201 1 9.1 16 8.8 1 14.3 20 25.6 . . . . ASL 202 . . . . 1 14.3 11 14.1 . . . . ASL 220 . . . . 1 14.3 8 10.3 1 50 9 23.7 ASL 261 1 9.1 12 6.6 1 14.3 8 10.3 . . . .
Total 11 100 182 100 7 100 78 100 2 100 38 100 Source: IRIS Files

17
Table 28. ASL Enrollment by Day/Night Status: Spring 2016
Course Day Night Both
N of Sections
% N of Students
% N of Sections
% N of Students
% N of Sections
% N of Students
%
ASL 100 1 6.3 15 6.4 . . . . . . . . ASL 101 3 18.8 47 20.1 1 50 22 56.4 . . . . ASL 102 3 18.8 43 18.4 . . . . . . . . ASL 115 2 12.5 22 9.4 . . . . . . . . ASL 125 1 6.3 34 14.5 . . . . 1 50 40 85.1 ASL 201 1 6.3 11 4.7 . . . . . . . . ASL 202 2 12.5 25 10.7 . . . . . . . . ASL 210 1 6.3 14 6 . . . . . . . . ASL 220 . . . . . . . . 1 50 7 14.9 ASL 261 2 12.5 23 9.8 . . . . . . . . ASL 262 . . . . 1 50 17 43.6 . . . .
Total 16 100 234 100 2 100 39 100 2 100 47 100 Source: IRIS Files
18
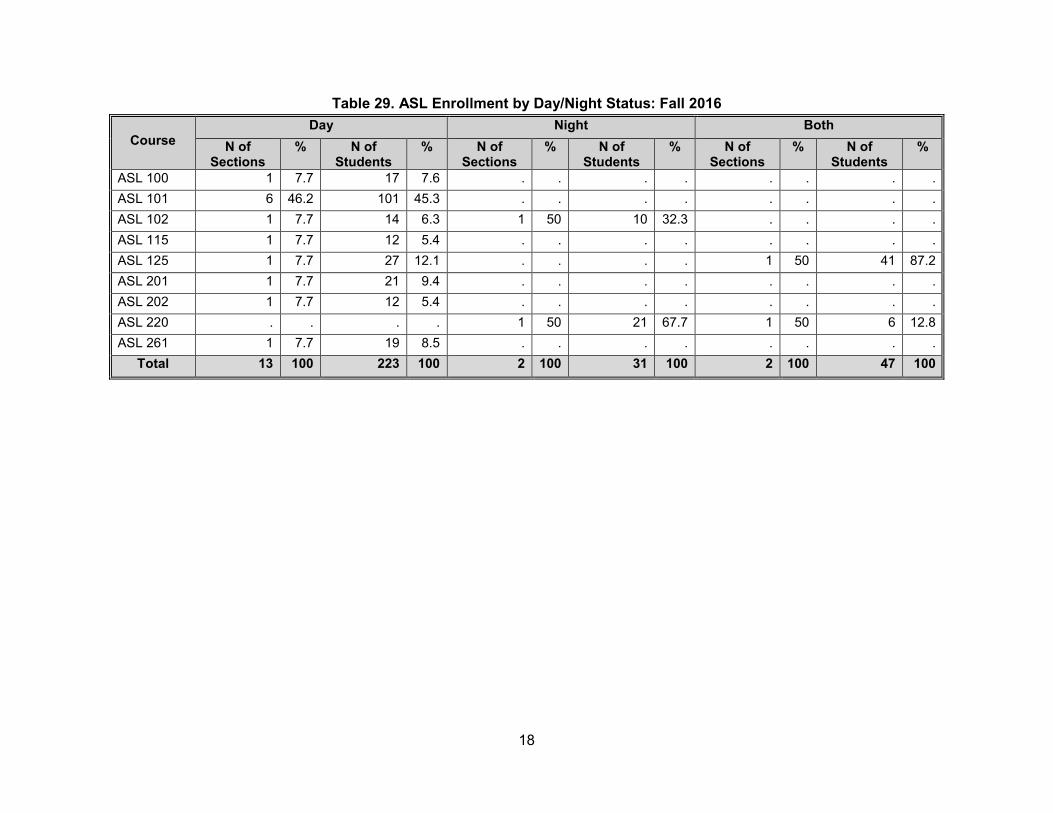
Table 29. ASL Enrollment by Day/Night Status: Fall 2016
Course Day Night Both
N of Sections
% N of Students
% N of Sections
% N of Students
% N of Sections
% N of Students
%
ASL 100 1 7.7 17 7.6 . . . . . . . . ASL 101 6 46.2 101 45.3 . . . . . . . . ASL 102 1 7.7 14 6.3 1 50 10 32.3 . . . . ASL 115 1 7.7 12 5.4 . . . . . . . . ASL 125 1 7.7 27 12.1 . . . . 1 50 41 87.2 ASL 201 1 7.7 21 9.4 . . . . . . . . ASL 202 1 7.7 12 5.4 . . . . . . . . ASL 220 . . . . 1 50 21 67.7 1 50 6 12.8 ASL 261 1 7.7 19 8.5 . . . . . . . .
Total 13 100 223 100 2 100 31 100 2 100 47 100

19
Table 30. American Sign Language Enrollment by Day/Night Status: Spring 2017
Course Day Night Both
N of Sections
% N of Students
% N of Sections
% N of Students
% N of Sections
% N of Students
%
ASL 100 1 6.3 16 6.2 . . . . . . . . ASL 101 3 18.8 49 18.9 1 50 19 61.3 . . . . ASL 102 3 18.8 58 22.4 . . . . . . . . ASL 115 2 12.5 24 9.3 . . . . . . . . ASL 125 1 6.3 19 7.3 . . . . 1 50 27 73 ASL 201 1 6.3 17 6.6 . . . . . . . . ASL 202 1 6.3 13 5 . . . . . . . . ASL 220 . . . . 1 50 12 38.7 1 50 10 27 ASL 225 1 6.3 10 3.9 . . . . . . . . ASL 261 2 12.5 39 15.1 . . . . . . . . ASL 262 1 6.3 14 5.4 . . . . . . . .
Total 16 100 259 100 2 100 31 100 2 100 37 100 Source: IRIS Files
Table 31. INT Enrollment by Day/Night Status: Fall 2014
Course
Day Both N of
Sections % N of
Students % N of
Sections % N of
Students %
INT 105 1 12.5 22 26.2 . . . . INT 130 1 12.5 14 16.7 1 100 5 100 INT 133 1 12.5 15 17.9 . . . . INT 134 1 12.5 15 17.9 . . . . INT 142 1 12.5 14 16.7 . . . . INT 290 2 25 3 3.6 . . . . INT 299 1 12.5 1 1.2 . . . . Total 8 100 84 100 1 100 5 100

20
Table 32. INT Enrollment by Day/Night Status: Spring 2015
Course Day
N of Sections
% N of Students
%
INT 105 1 16.7 7 11.1 INT 106 1 16.7 12 19 INT 107 1 16.7 8 12.7 INT 233 1 16.7 13 20.6 INT 234 1 16.7 12 19 INT 237 1 16.7 11 17.5 Total 6 100 63 100
Table 33. INT Enrollment by Day/Night Status: Fall 2015
Course Day Both
N of Sections
% N of Students
% N of Sections
% N of Students
%
INT 105 1 20 14 20.6 . . . . INT 106 1 20 18 26.5 . . . . INT 130 1 20 10 14.7 1 100 8 100 INT 133 1 20 13 19.1 . . . . INT 134 1 20 13 19.1 . . . . Total 5 100 68 100 1 100 8 100

21
Table 34. INT Enrollment by Day/Night Status: Spring 2016
Course
Day N of
Sections % N of
Students %
INT 107 1 20 13 21.3 INT 142 1 20 13 21.3 INT 233 1 20 12 19.7 INT 234 1 20 13 21.3 INT 237 1 20 10 16.4 Total 5 100 61 100
Table 35. INT Enrollment by Day/Night Status: Fall 2016
Course
Day Night Both N of
Sections % N of
Students % N of
Sections % N of
Students % N of
Sections % N of
Students %
INT 105 1 25 18 31.6 . . . . . . . . INT 130 . . . . . . . . 1 100 15 100 INT 133 1 25 12 21.1 . . . . . . . . INT 134 1 25 13 22.8 . . . . . . . . INT 142 1 25 14 24.6 . . . . . . . . INT 290 . . . . 1 100 2 100 . . . . Total 4 100 57 100 1 100 2 100 1 100 15 100

22
Table 36. INT Enrollment by Day/Night Status: Spring 2017
Course Day Night
N of Sections
% N of Students
% N of Sections
% N of Students
%
INT 105 . . . . 1 100 9 100 INT 106 1 20 15 24.2 . . . . INT 107 1 20 14 22.6 . . . . INT 233 1 20 12 19.4 . . . . INT 234 1 20 10 16.1 . . . . INT 237 1 20 11 17.7 . . . . Total 5 100 62 100 1 100 9 100

23
F. American Sign Language Enrollment by Session
Table 37. ASL Enrollment by Session: Fall 2014
Course 16-Week Dynamic
N of Sections
% N of Students
% N of Sections
% N of Students
%
ASL 100 . . . . 2 25 18 18 ASL 101 4 36 51 30.4 . . . . ASL 102 1 9.1 14 8.3 1 12.5 10 10 ASL 115 1 9.1 13 7.7 . . . . ASL 125 2 18 32 19 1 12.5 22 22 ASL 150 . . . . 1 12.5 13 13 ASL 201 2 18 37 22 1 12.5 12 12 ASL 202 . . . . 1 12.5 14 14 ASL 220 . . . . 1 12.5 11 11 ASL 261 1 9.1 21 12.5 . . . . Total 11 100 168 100 8 100 100 100
Source: IRIS Files
Table 38. ASL Enrollment by Session: Spring 2015
Course
16-Week Dynamic N of
Sections % N of
Students % N of
Sections % N of
Students %
ASL 100 1 10 13 9.4 1 9.1 15 8.2 ASL 101 2 20 31 22.3 3 27.3 45 24.7 ASL 102 2 20 27 19.4 1 9.1 10 5.5 ASL 115 . . . . 1 9.1 22 12.1 ASL 125 1 10 21 15.1 1 9.1 32 17.6 ASL 201 . . . . 1 9.1 17 9.3 ASL 202 1 10 10 7.2 1 9.1 12 6.6 ASL 210 1 10 13 9.4 . . . . ASL 220 . . . . 1 9.1 18 9.9 ASL 225 . . . . 1 9.1 11 6 ASL 261 1 10 10 7.2 . . . . ASL 262 1 10 14 10.1 . . . . Total 10 100 139 100 11 100 182 100
Source: IRIS Files

24
Table 39. ASL Enrollment by Session: Fall 2015
Course 14-Week 16-Week Dynamic
N of Sections
% N of Students
% N of Sections
% N of Students
% N of Sections
% N of Students
%
ASL 100 2 22 28 24.8 . . . . . . . . ASL 101 3 33 39 34.5 3 33.3 49 33.3 . . . . ASL 102 . . . . 1 11.1 20 13.6 . . . . ASL 115 . . . . 1 11.1 10 6.8 . . . . ASL 125 . . . . 1 11.1 28 19 1 50 29 76.3 ASL 150 1 11 11 9.7 . . . . . . . . ASL 201 1 11 16 14.2 1 11.1 20 13.6 . . . . ASL 202 1 11 11 9.7 . . . . . . . . ASL 220 1 11 8 7.1 . . . . 1 50 9 23.7 ASL 261 . . . . 2 22.2 20 13.6 . . . . Total 9 100 113 100 9 100 147 100 2 100 38 100
Source: IRIS Files

25
Table 40. ASL Enrollment by Session: Spring 2016
Course 12-Week 14-Week 16-Week Dynamic
N of Sections
% N of Student
s
% N of Sections
% N of Students
% N of Sections
% N of Students
% N of Sections
% N of Students
%
ASL 100 . . . . 1 14.3 15 15.2 . . . . . . . . ASL 101 1 50 14 53.8 1 14.3 22 22.2 2 28.6 33 26.4 . . . . ASL 102 1 50 12 46.2 1 14.3 11 11.1 1 14.3 20 16 . . . . ASL 115 . . . . 1 14.3 12 12.1 1 14.3 10 8 . . . . ASL 125 . . . . . . . . 1 14.3 34 27.2 1 25 40 57.1 ASL 201 . . . . 1 14.3 11 11.1 . . . . . . . . ASL 202 . . . . 1 14.3 11 11.1 1 14.3 14 11.2 . . . . ASL 210 . . . . . . . . 1 14.3 14 11.2 . . . . ASL 220 . . . . . . . . . . . . 1 25 7 10 ASL 261 . . . . . . . . . . . . 2 50 23 32.9 ASL 262 . . . . 1 14.3 17 17.2 . . . . . . . . Total 2 100 26 100 7 100 99 100 7 100 125 100 4 100 70 100
Source: IRIS Files

26
Table 41. ASL Enrollment by Session: Fall 2016
Course 12-Week 14-Week 16-Week Dynamic
N of Sections
% N of Students
% N of Sections
% N of Students
% N of Sections
% N of Students
% N of Sections
% N of Students
%
ASL 100 . . . . 1 16.7 17 18.3 . . . . . . . . ASL 101 1 50 13 56.5 2 33.3 31 33.3 3 42.9 57 41.3 . . . . ASL 102 1 50 10 43.5 . . . . 1 14.3 14 10.1 . . . . ASL 115 . . . . 1 16.7 12 12.9 . . . . . . . . ASL 125 . . . . . . . . 1 14.3 27 19.6 1 50 41 87.2 ASL 201 . . . . . . . . 1 14.3 21 15.2 . . . . ASL 202 . . . . 1 16.7 12 12.9 . . . . . . . . ASL 220 . . . . 1 16.7 21 22.6 . . . . 1 50 6 12.8 ASL 261 . . . . . . . . 1 14.3 19 13.8 . . . . Total 2 100 23 100 6 100 93 100 7 100 138 100 2 100 47 100
Source: IRIS Files

27
Table 42. ASL Enrollment by Session: Spring 2017
Course 12-Week 14-Week 16-Week Dynamic
N of Sections
% N of Students
% N of Sections
% N of Students
% N of Sections
% N of Students
% N of Sections
% N of Students
%
ASL 100 . . . . 1 14.3 16 17.2 . . . . . . . . ASL 101 1 50 5 19.2 1 14.3 19 20.4 2 25 44 30.6 . . . . ASL 102 1 50 21 80.8 1 14.3 11 11.8 1 12.5 26 18.1 . . . . ASL 115 . . . . 1 14.3 12 12.9 1 12.5 12 8.3 . . . . ASL 125 . . . . . . . . 1 12.5 19 13.2 1 33.3 27 42.2 ASL 201 . . . . . . . . 1 12.5 17 11.8 . . . . ASL 202 . . . . 1 14.3 13 14 . . . . . . . . ASL 220 . . . . 1 14.3 12 12.9 . . . . 1 33.3 10 15.6 ASL 225 . . . . 1 14.3 10 10.8 . . . . . . . . ASL 261 . . . . . . . . 1 12.5 12 8.3 1 33.3 27 42.2 ASL 262 . . . . . . . . 1 12.5 14 9.7 . . . . Total 2 100 26 100 7 100 93 100 8 100 144 100 3 100 64 100
Source: IRIS Files
Table 43. INT Enrollment by Session: Fall 2014
Course 16-Week Dynamic
N of Sections
% N of Students
% N of Sections
% N of Students
%
INT 105 1 16.7 22 31.9 . . . . INT 130 . . . . 2 67 19 95 INT 133 1 16.7 15 21.7 . . . . INT 134 1 16.7 15 21.7 . . . . INT 142 1 16.7 14 20.3 . . . . INT 290 2 33.3 3 4.3 . . . . INT 299 . . . . 1 33 1 5 Total 6 100 69 100 3 100 20 100

28
Table 44. INT Enrollment by Session: Spring 2015
Course
16-Week Dynamic N of
Sections % N of
Students % N of
Sections % N of
Students %
INT 105 . . . . 1 100 7 100 INT 106 1 20 12 21.4 . . . . INT 107 1 20 8 14.3 . . . . INT 233 1 20 13 23.2 . . . . INT 234 1 20 12 21.4 . . . . INT 237 1 20 11 19.6 . . . . Total 5 100 56 100 1 100 7 100
Table 45. INT Enrollment by Session: Fall 2015
Course
14-Week 16-Week Dynamic N of
Sections % N of
Students % N of
Sections % N of
Students % N of
Sections % N of
Students %
INT 105 . . . . 1 25 14 24 . . . . INT 106 . . . . 1 25 18 31 . . . . INT 130 1 100 10 100 . . . . 1 # 8 # INT 133 . . . . 1 25 13 22 . . . . INT 134 . . . . 1 25 13 22 . . . . Total 1 100 10 100 4 100 58 100 1 # 8 #
29
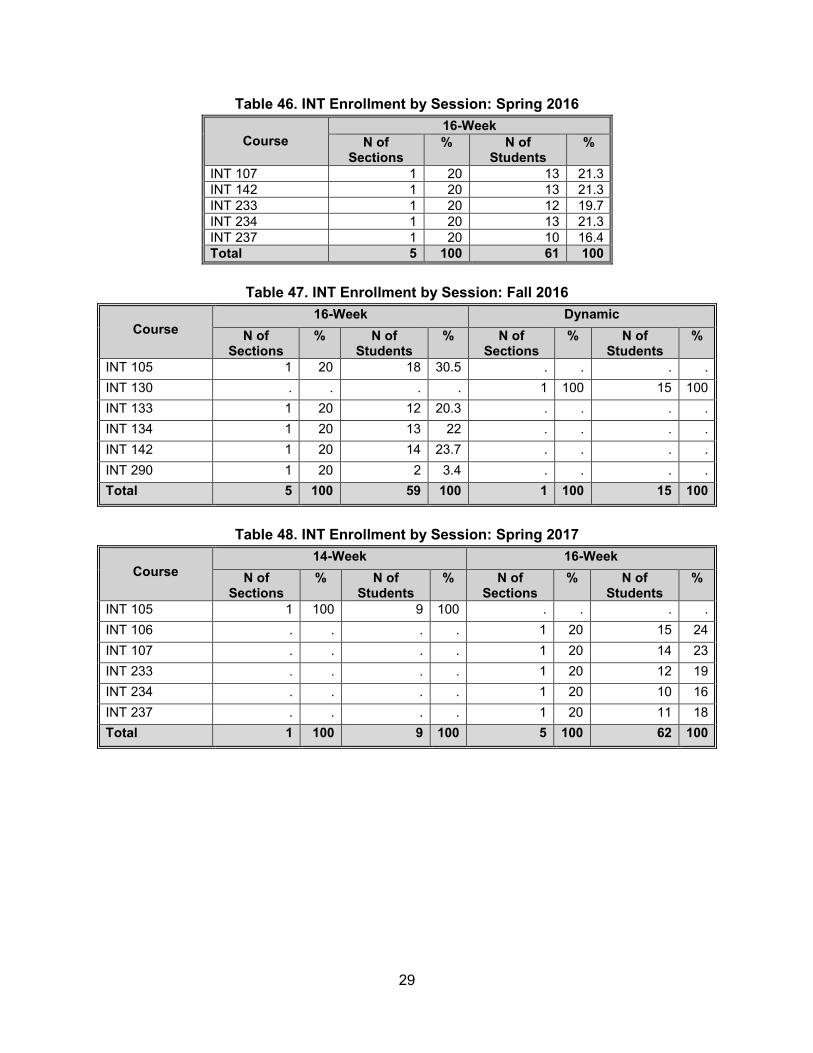
Table 46. INT Enrollment by Session: Spring 2016
Course 16-Week
N of Sections
% N of Students
%
INT 107 1 20 13 21.3 INT 142 1 20 13 21.3 INT 233 1 20 12 19.7 INT 234 1 20 13 21.3 INT 237 1 20 10 16.4 Total 5 100 61 100
Table 47. INT Enrollment by Session: Fall 2016
Course
16-Week Dynamic N of
Sections % N of
Students % N of
Sections % N of
Students %
INT 105 1 20 18 30.5 . . . . INT 130 . . . . 1 100 15 100 INT 133 1 20 12 20.3 . . . . INT 134 1 20 13 22 . . . . INT 142 1 20 14 23.7 . . . . INT 290 1 20 2 3.4 . . . . Total 5 100 59 100 1 100 15 100
Table 48. INT Enrollment by Session: Spring 2017
Course
14-Week 16-Week N of
Sections % N of
Students % N of
Sections % N of
Students %
INT 105 1 100 9 100 . . . . INT 106 . . . . 1 20 15 24 INT 107 . . . . 1 20 14 23 INT 233 . . . . 1 20 12 19 INT 234 . . . . 1 20 10 16 INT 237 . . . . 1 20 11 18 Total 1 100 9 100 5 100 62 100
30
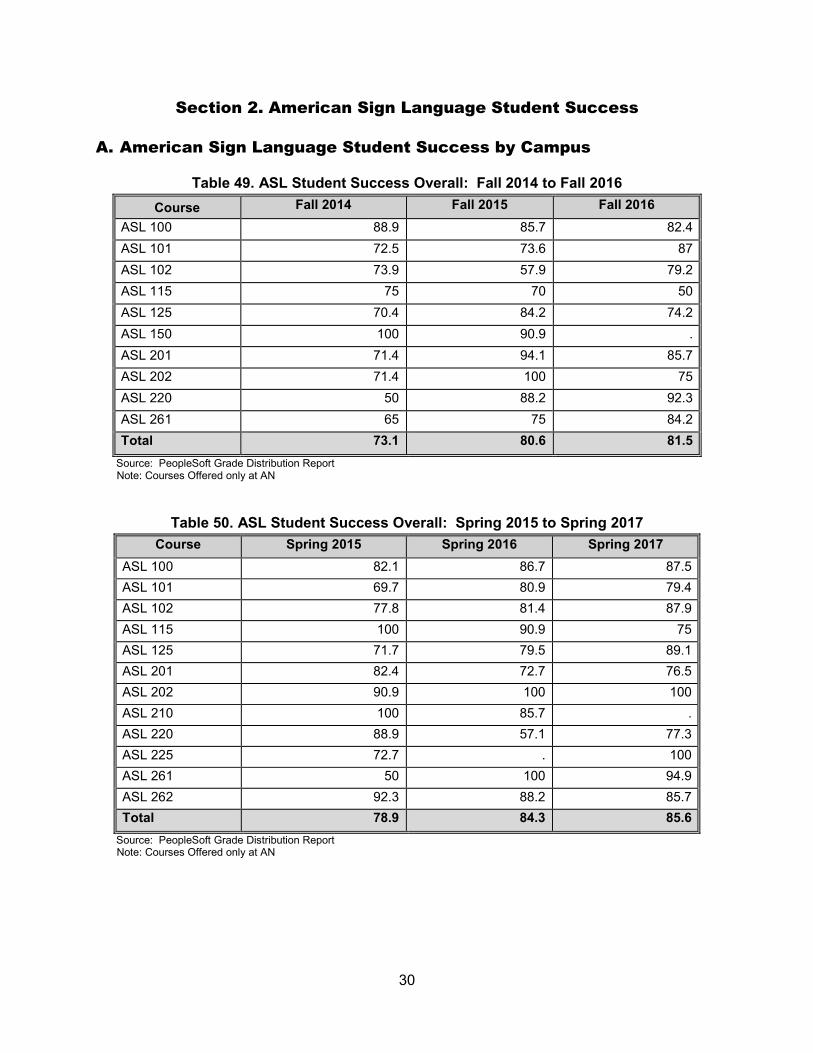
Section 2. American Sign Language Student Success A. American Sign Language Student Success by Campus
Table 49. ASL Student Success Overall: Fall 2014 to Fall 2016 Course Fall 2014 Fall 2015 Fall 2016
ASL 100 88.9 85.7 82.4 ASL 101 72.5 73.6 87 ASL 102 73.9 57.9 79.2 ASL 115 75 70 50 ASL 125 70.4 84.2 74.2 ASL 150 100 90.9 . ASL 201 71.4 94.1 85.7 ASL 202 71.4 100 75 ASL 220 50 88.2 92.3 ASL 261 65 75 84.2 Total 73.1 80.6 81.5
Source: PeopleSoft Grade Distribution Report Note: Courses Offered only at AN
Table 50. ASL Student Success Overall: Spring 2015 to Spring 2017 Course Spring 2015 Spring 2016 Spring 2017
ASL 100 82.1 86.7 87.5 ASL 101 69.7 80.9 79.4 ASL 102 77.8 81.4 87.9 ASL 115 100 90.9 75 ASL 125 71.7 79.5 89.1 ASL 201 82.4 72.7 76.5 ASL 202 90.9 100 100 ASL 210 100 85.7 . ASL 220 88.9 57.1 77.3 ASL 225 72.7 . 100 ASL 261 50 100 94.9 ASL 262 92.3 88.2 85.7 Total 78.9 84.3 85.6
Source: PeopleSoft Grade Distribution Report Note: Courses Offered only at AN

31
Table 51. INT Student Success Overall: Fall 2014 to Fall 2016 Course Fall 2014 Fall 2015 Fall 2016
INT 105 68.2 71.4 77.8 INT 106 . 72.2 . INT 130 63.2 72.2 60 INT 133 80 100 91.7 INT 134 86.7 100 83.3 INT 142 71.4 . 78.6 INT 290 33.3 . 0 INT 299 100 . . Total 71.9 81.6 75.3
Source: PeopleSoft Grade Distribution Report Note: Courses Offered only at AN
Table 52. INT Student Success by Campus: Spring 2015 to Spring 2017 Course Spring 2015 Spring 2016 Spring 2017
INT 105 85.7 . 75 INT 106 83.3 . 80 INT 107 87.5 84.6 71.4 INT 142 . 76.9 . INT 233 100 90.9 100 INT 234 91.7 66.7 90 INT 237 100 100 90.9 Total 92.1 83.1 84.3
Source: PeopleSoft Grade Distribution Report Note: Courses Offered only at AN

32
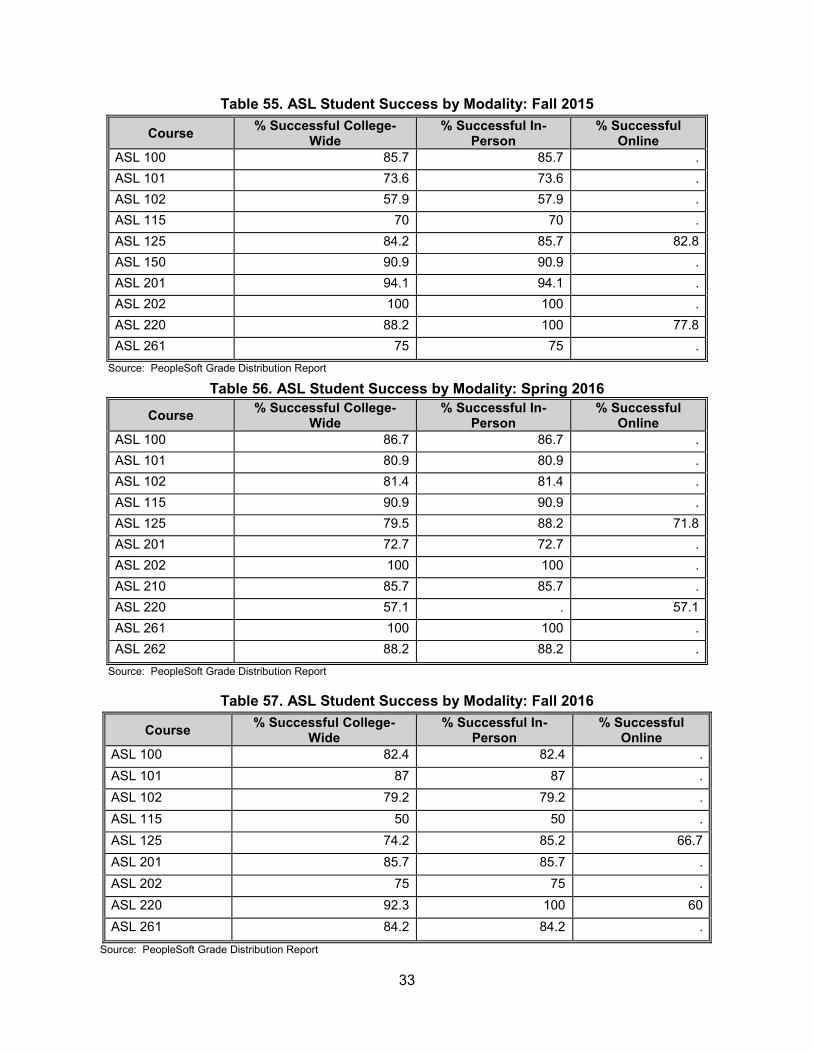
B. American Sign Language Student Success by Modality Table 53. ASL Student Success by Modality: Fall 2014
Course % Successful College-Wide
% Successful In-Person
% Successful Online
ASL 100 88.9 88.9 . ASL 101 72.5 72.5 . ASL 102 73.9 73.9 . ASL 115 75 75 . ASL 125 70.4 75 63.6 ASL 150 100 100 . ASL 201 71.4 71.4 . ASL 202 71.4 71.4 . ASL 220 50 . 50 ASL 261 65 65 .
Source: PeopleSoft Grade Distribution Report
Table 54. ASL Student Success by Modality: Spring 2015
Course % Successful College-Wide
% Successful In-Person
% Successful Online
ASL 100 82.1 82.1 . ASL 101 69.7 69.7 . ASL 102 77.8 77.8 . ASL 115 100 100 . ASL 125 71.7 71.4 71.9 ASL 201 82.4 82.4 . ASL 202 90.9 90.9 . ASL 210 100 100 . ASL 220 88.9 88.9 . ASL 225 72.7 72.7 . ASL 261 50 50 . ASL 262 92.3 92.3 .
Source: PeopleSoft Grade Distribution Report
33
Table 55. ASL Student Success by Modality: Fall 2015
Course % Successful College-Wide
% Successful In-Person
% Successful Online
ASL 100 85.7 85.7 . ASL 101 73.6 73.6 . ASL 102 57.9 57.9 . ASL 115 70 70 . ASL 125 84.2 85.7 82.8 ASL 150 90.9 90.9 . ASL 201 94.1 94.1 . ASL 202 100 100 . ASL 220 88.2 100 77.8 ASL 261 75 75 .
Source: PeopleSoft Grade Distribution Report
Table 56. ASL Student Success by Modality: Spring 2016
Course % Successful College-Wide
% Successful In-Person
% Successful Online
ASL 100 86.7 86.7 . ASL 101 80.9 80.9 . ASL 102 81.4 81.4 . ASL 115 90.9 90.9 . ASL 125 79.5 88.2 71.8 ASL 201 72.7 72.7 . ASL 202 100 100 . ASL 210 85.7 85.7 . ASL 220 57.1 . 57.1 ASL 261 100 100 . ASL 262 88.2 88.2 .
Source: PeopleSoft Grade Distribution Report
Table 57. ASL Student Success by Modality: Fall 2016
Course % Successful College-Wide
% Successful In-Person
% Successful Online
ASL 100 82.4 82.4 . ASL 101 87 87 . ASL 102 79.2 79.2 . ASL 115 50 50 . ASL 125 74.2 85.2 66.7 ASL 201 85.7 85.7 . ASL 202 75 75 . ASL 220 92.3 100 60 ASL 261 84.2 84.2 .
Source: PeopleSoft Grade Distribution Report
34
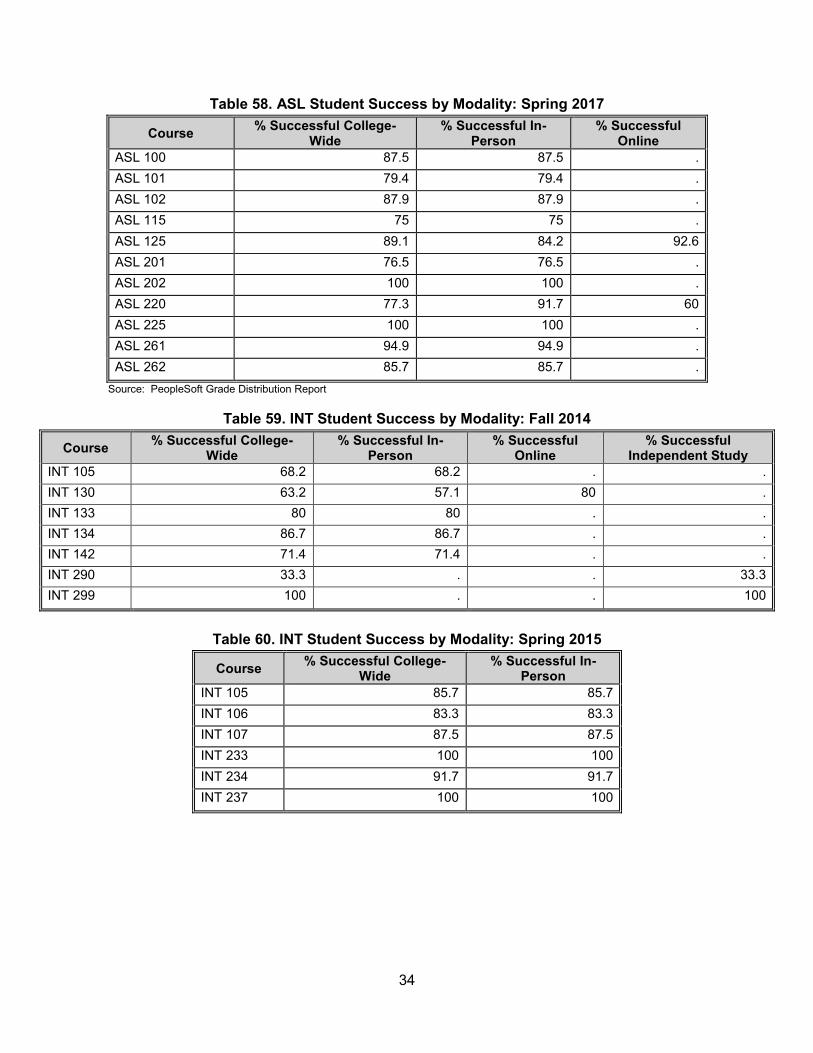
Table 58. ASL Student Success by Modality: Spring 2017
Course % Successful College-Wide
% Successful In-Person
% Successful Online
ASL 100 87.5 87.5 . ASL 101 79.4 79.4 . ASL 102 87.9 87.9 . ASL 115 75 75 . ASL 125 89.1 84.2 92.6 ASL 201 76.5 76.5 . ASL 202 100 100 . ASL 220 77.3 91.7 60 ASL 225 100 100 . ASL 261 94.9 94.9 . ASL 262 85.7 85.7 .
Source: PeopleSoft Grade Distribution Report
Table 59. INT Student Success by Modality: Fall 2014
Course % Successful College-Wide
% Successful In-Person
% Successful Online
% Successful Independent Study
INT 105 68.2 68.2 . . INT 130 63.2 57.1 80 . INT 133 80 80 . . INT 134 86.7 86.7 . . INT 142 71.4 71.4 . . INT 290 33.3 . . 33.3 INT 299 100 . . 100
Table 60. INT Student Success by Modality: Spring 2015
Course % Successful College-Wide
% Successful In-Person
INT 105 85.7 85.7 INT 106 83.3 83.3 INT 107 87.5 87.5 INT 233 100 100 INT 234 91.7 91.7 INT 237 100 100

35
Table 61. INT Student Success by Modality: Fall 2015
Course % Successful College-Wide
% Successful In-Person
% Successful Online
INT 105 71.4 71.4 . INT 106 72.2 72.2 . INT 130 72.2 80 62.5 INT 133 100 100 . INT 134 100 100 .
Table 62. INT Student Success by Modality: Spring 2016
Course % Successful College-Wide
% Successful In-Person
INT 107 84.6 84.6 INT 142 76.9 76.9 INT 233 90.9 90.9 INT 234 66.7 66.7 INT 237 100 100
Table 63. INT Student Success by Modality: Fall 2016
Course % Successful College-Wide
% Successful In-Person
% Successful Online
% Successful Independent Study
INT 105 77.8 77.8 . . INT 130 60 . 60 . INT 133 91.7 91.7 . . INT 134 83.3 83.3 . . INT 142 78.6 78.6 . . INT 290 0 . . 0
Table 64. INT Student Success by Modality: Spring 2017 Course % Successful College-
Wide % Successful In-
Person INT 105 75 75 INT 106 80 80 INT 107 71.4 71.4 INT 233 100 100 INT 234 90 90 INT 237 90.9 90.9

36
C. American Sign Language Student Success by Dual Enrollment Status
Table 65. ASL Student Success by Dual Enrollment Status: Fall 2014
Course % Success
College-Wide % Success Non-Dual Enrolled
ASL 100 88.9 88.9 ASL 101 72.5 72.5 ASL 102 73.9 73.9 ASL 115 75 75 ASL 125 70.4 70.4 ASL 150 100 100 ASL 201 71.4 71.4 ASL 202 71.4 71.4 ASL 220 50 50 ASL 261 65 65
Source: PeopleSoft Grade Distribution Report
Table 66. ASL Student Success by Dual Enrollment Status: Spring 2015
Course % Success
College-Wide % Success Non-Dual Enrolled
ASL 100 82.1 82.1 ASL 101 69.7 69.7 ASL 102 77.8 77.8 ASL 115 100 100 ASL 125 71.7 71.7 ASL 201 82.4 82.4 ASL 202 90.9 90.9 ASL 210 100 100 ASL 220 88.9 88.9 ASL 225 72.7 72.7 ASL 261 50 50 ASL 262 92.3 92.3
Source: PeopleSoft Grade Distribution Report

37
Table 67. ASL Student Success by Dual Enrollment Status: Fall 2015
Course % Success
College-Wide % Success Non-Dual Enrolled
ASL 100 85.7 85.7 ASL 101 73.6 73.6 ASL 102 57.9 57.9 ASL 115 70 70 ASL 125 84.2 84.2 ASL 150 90.9 90.9 ASL 201 94.1 94.1 ASL 202 100 100 ASL 220 88.2 88.2 ASL 261 75 75
Source: PeopleSoft Grade Distribution Report
Table 68. ASL Student Success by Dual Enrollment Status: Spring 2016
Course % Success
College-Wide % Success Non-Dual Enrolled
% Success Dual
Enrolled ASL 100 86.7 86.7 . ASL 101 80.9 80.9 . ASL 102 81.4 81.4 . ASL 115 90.9 90.9 . ASL 125 79.5 79.5 . ASL 201 72.7 72.7 . ASL 202 100 100 . ASL 210 85.7 85.7 . ASL 220 57.1 57.1 . ASL 261 100 . 100 ASL 262 88.2 88.2 .
Source: PeopleSoft Grade Distribution Report
38
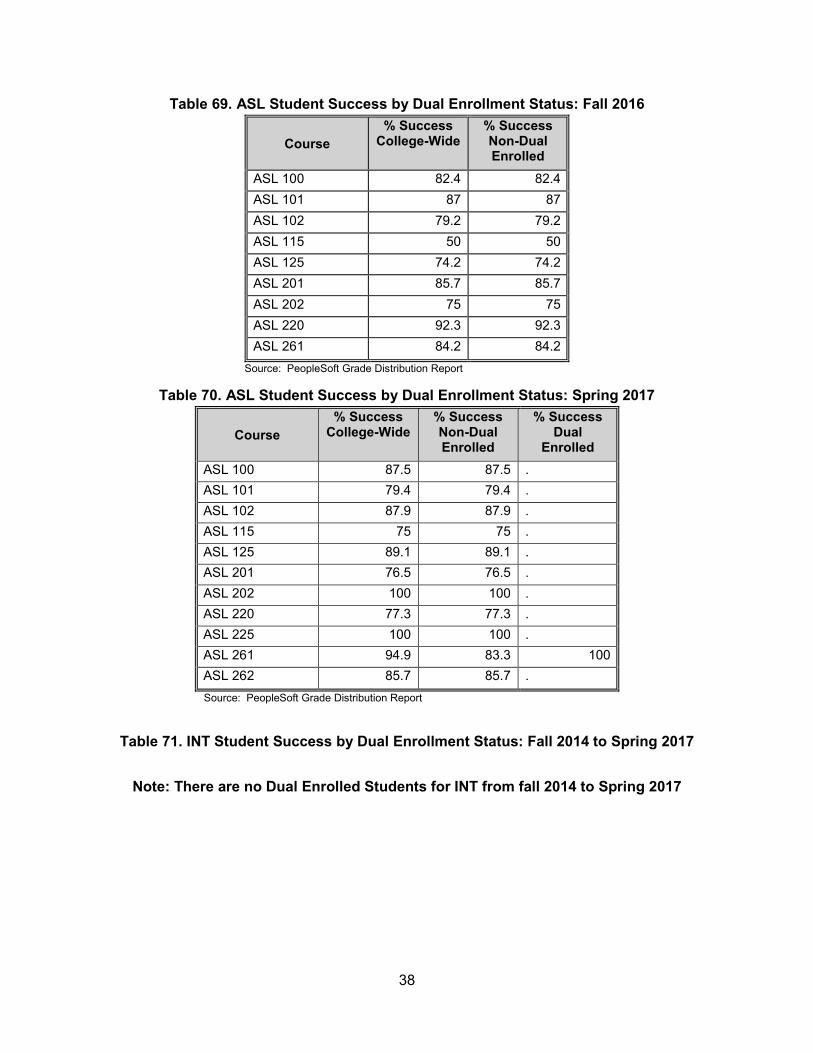
Table 69. ASL Student Success by Dual Enrollment Status: Fall 2016
Course % Success
College-Wide % Success Non-Dual Enrolled
ASL 100 82.4 82.4 ASL 101 87 87 ASL 102 79.2 79.2 ASL 115 50 50 ASL 125 74.2 74.2 ASL 201 85.7 85.7 ASL 202 75 75 ASL 220 92.3 92.3 ASL 261 84.2 84.2
Source: PeopleSoft Grade Distribution Report
Table 70. ASL Student Success by Dual Enrollment Status: Spring 2017
Course % Success
College-Wide % Success Non-Dual Enrolled
% Success Dual
Enrolled ASL 100 87.5 87.5 . ASL 101 79.4 79.4 . ASL 102 87.9 87.9 . ASL 115 75 75 . ASL 125 89.1 89.1 . ASL 201 76.5 76.5 . ASL 202 100 100 . ASL 220 77.3 77.3 . ASL 225 100 100 . ASL 261 94.9 83.3 100 ASL 262 85.7 85.7 .
Source: PeopleSoft Grade Distribution Report
Table 71. INT Student Success by Dual Enrollment Status: Fall 2014 to Spring 2017
Note: There are no Dual Enrolled Students for INT from fall 2014 to Spring 2017

39
D. American Sign Language Student Success by Session
Table 72. ASL Student Success by Session: Fall 2014
Course % Success
College-Wide % Success 16-
Week % Success Dynamic
ASL 100 88.9 . 88.9 ASL 101 72.5 72.5 . ASL 102 73.9 57.1 100 ASL 115 75 75 . ASL 125 70.4 75 63.6 ASL 150 100 . 100 ASL 201 71.4 67.6 83.3 ASL 202 71.4 . 71.4 ASL 220 50 . 50 ASL 261 65 65 .
Source: PeopleSoft Grade Distribution Report
Table 73. ASL Student Success by Session: Spring 2015
Course % Success
College-Wide % Success 16-
Week % Success Dynamic
ASL 100 82.1 92.3 73.3 ASL 101 69.7 71 68.9 ASL 102 77.8 81.5 66.7 ASL 115 100 . 100 ASL 125 71.7 71.4 71.9 ASL 201 82.4 . 82.4 ASL 202 90.9 90 91.7 ASL 210 100 100 . ASL 220 88.9 . 88.9 ASL 225 72.7 . 72.7 ASL 261 50 50 . ASL 262 92.3 92.3 .
Source: PeopleSoft Grade Distribution Report

40
Table 74. ASL Student Success by Session: Fall 2015
Course % Success
College-Wide % Success 14-
Week % Success 16-
Week % Success Dynamic
ASL 100 85.7 85.7 . . ASL 101 73.6 81.6 67.3 . ASL 102 57.9 . 57.9 . ASL 115 70 . 70 . ASL 125 84.2 . 85.7 82.8 ASL 150 90.9 90.9 . . ASL 201 94.1 85.7 100 . ASL 202 100 100 . . ASL 220 88.2 100 . 77.8 ASL 261 75 . 75 .
Source: PeopleSoft Grade Distribution Report
Table 75. ASL Student Success by Session: Spring 2016
Course % Success
College-Wide % Success 12-
Week % Success 14-
Week % Success 16-
Week % Success Dynamic
ASL 100 86.7 . 86.7 . . ASL 101 80.9 71.4 90.9 78.1 . ASL 102 81.4 100 81.8 70 . ASL 115 90.9 . 100 80 . ASL 125 79.5 . . 88.2 71.8 ASL 201 72.7 . 72.7 . . ASL 202 100 . 100 100 . ASL 210 85.7 . . 85.7 . ASL 220 57.1 . . . 57.1 ASL 261 100 . . . 100 ASL 262 88.2 . 88.2 . .
Source: PeopleSoft Grade Distribution Report
Table 76. ASL Student Success by Session: Fall 2016
Course % Success
College-Wide % Success 12-
Week % Success 14-
Week % Success 16-
Week % Success Dynamic
ASL 100 82.4 . 82.4 . . ASL 101 87 92.3 90.3 83.9 . ASL 102 79.2 80 . 78.6 . ASL 115 50 . 50 . . ASL 125 74.2 . . 85.2 66.7 ASL 201 85.7 . . 85.7 . ASL 202 75 . 75 . . ASL 220 92.3 . 100 . 60 ASL 261 84.2 . . 84.2 .
41
Table 77. ASL Student Success by Session: Spring 2017
Course % Success
College-Wide % Success 12-
Week % Success 14-
Week % Success 16-
Week % Success Dynamic
ASL 100 87.5 . 87.5 . . ASL 101 79.4 80 84.2 77.3 . ASL 102 87.9 85.7 90.9 88.5 . ASL 115 75 . 83.3 66.7 . ASL 125 89.1 . . 84.2 92.6 ASL 201 76.5 . . 76.5 . ASL 202 100 . 100 . . ASL 220 77.3 . 91.7 . 60 ASL 225 100 . 100 . . ASL 261 94.9 . . 83.3 100 ASL 262 85.7 . . 85.7 .
Source: PeopleSoft Grade Distribution Report
Table 78. INT Student Success by Session: Fall 2014
Course % Success
College-Wide % Success 16-
Week % Success Dynamic
INT 105 68.2 68.2 . INT 130 63.2 . 63.2 INT 133 80 80 . INT 134 86.7 86.7 . INT 142 71.4 71.4 . INT 290 33.3 33.3 . INT 299 100 . 100
Table 79. INT Student Success by Session: Spring 2015
Course % Success
College-Wide % Success 16-
Week % Success Dynamic
INT 105 85.7 . 85.7 INT 106 83.3 83.3 . INT 107 87.5 87.5 . INT 233 100 100 . INT 234 91.7 91.7 . INT 237 100 100 .
42
Table 80. INT Student Success by Session: Fall 2015 Course % Success
College-Wide % Success 14-
Week % Success 16-
Week % Success Dynamic
INT 105 71.4 . 71.4 . INT 106 72.2 . 72.2 . INT 130 72.2 80 . 62.5 INT 133 100 . 100 . INT 134 100 . 100 .
Table 81. INT Student Success by Session: Spring 2016 Course % Success
College-Wide % Success 16-
Week INT 107 84.6 84.6 INT 142 76.9 76.9 INT 233 90.9 90.9 INT 234 66.7 66.7 INT 237 100 100
Table 82. INT Student Success by Session: Fall 2016 Course % Success
College-Wide % Success 16-
Week % Success Dynamic
INT 105 77.8 77.8 . INT 130 60 . 60 INT 133 91.7 91.7 . INT 134 83.3 83.3 . INT 142 78.6 78.6 . INT 290 0 0 .
Table 83. INT Student Success by Session: Spring 2017
Course % Success College-Wide
% Success 14-Week
% Success 16-Week
INT 105 75 75 . INT 106 80 . 80 INT 107 71.4 . 71.4 INT 233 100 . 100 INT 234 90 . 90 INT 237 90.9 . 90.9

43
E. American Sign Language Graduation Rate
Table 84. ASL A.A.S. Graduation Rate from Any Program: Fall 2009 Cohort through Fall 2013 Cohort Fall 2009 Cohort Fall 2010 Cohort Fall 2011 Cohort Fall 2012 Cohort Fall 2013 Cohort
Graduated w
Graduated w
Graduated w
Graduated w
Graduated w
in 4 Years in 4 Years in 4 Years in 4 Years in 4 Years Associate's N # % N # % N # % N # % N # %
ASL to English Interp., AAS 4 2 50 7 1 14.3 6 0 0 4 1 25 3 0 0 Social Science/Deaf Studies, AS 1 0 0 1 1 100 3 1 33.3 4 0 0 2 1 50 All Program-Placed Associate's 6,119 1,516 24.8 5,963 1,312 22 6,438 1,517 23.6 6,907 1,589 23 7,486 1,806 24.1
Source: PeopleSoft Grade Distribution Report Note: Students who graduated from any program within the four- year time frame are counted.
Table 85. ASL A.A.S. Graduation Rate from Same Program: Fall 2009 Cohort through Fall 2013 Cohort
Source: PeopleSoft Grade Distribution Report Note: Students who graduated from any program within the four- year time frame are counted
Associate’s
Fall 2009 Cohort Fall 2010 Cohort Fall 2011 Cohort Fall 2012 Cohort Fall 2013 Cohort
N Graduated w/in 4 Yrs. N
Graduated w/in 4 Yrs. N
Graduated w/in 4 Yrs. N
Graduated w/in 4 Yrs. N
Graduated w/in 4 Yrs.
# % # % # % # % # % ASL to English Interp., AAS 4 0 0 7 0 0 6 0 0 4 0 0 3 0 0 Social Science/Deaf Studies, AS 1 0 0 1 1 100 3 0 0 4 0 0 2 0 0

44
Table 86. ASL Certificate 2-Year Graduation Rate from Any Program: Fall 2011 Cohort through Fall 2015 Cohort Fall 2011 Cohort Fall 2012 Cohort Fall 2013 Cohort Fall 2014 Cohort Fall 2015 Cohort
Graduated w
Graduated w
Graduated w
Graduated w
Graduated w
in 2 Years in 2 Years in 2 Years in 2 Years in 2 Years Certificate N # % N # % N # % N # % N # %
ASL, CSC 1 0 0 2 0 0 4 0 0 2 0 0 1 0 0 All Program-Placed Certificates 328 9 2.74 319 14 4.39 282 19 6.74 237 12 5.06 153 16 10.5
Source: PeopleSoft Grade Distribution Report Note: Students who graduated from any program within the two -year time frame are counted.
Table 87. ASL Certificate Graduation Rate from Same Program: Fall 2011 Cohort through Fall 2015 Cohort
Fall 2011 Cohort Fall 2012 Cohort Fall 2013 Cohort Fall 2014 Cohort Fall 2015 Cohort Graduated
w Graduated
w Graduated
w Graduated
w Graduated
w in 2 Years in 2 Years in 2 Years in 2 Years in 2 Years
Certificate N # % N # % N # % N # % N # % ASL, CSC 1 0 0 2 0 0 4 0 0 2 0 0 1 0 0
Source: PeopleSoft Grade Distribution Report Note: Students who graduated within the two- year time frame are counted.
F. American Sign Language Cumulative Mean GPA of Graduates
Table 88. ASL Mean GPA of Graduates: 2012-13 through 2016-17 Program Curr. Code 2012-13 2013-14 2014-15 2015-16 2016-17
ASL, A.A.S. 6400 ASL, CSC 221-640-01 3.40 3.41 3.37 3.49 Social Science/Deaf Studies, A.S.
8823
College 3.20 3.22 3.21 3.20 3.20
Source: PeopleSoft Grade Distribution Report Note: "-" GPA not provided for programs with fewer than 10 graduates
45
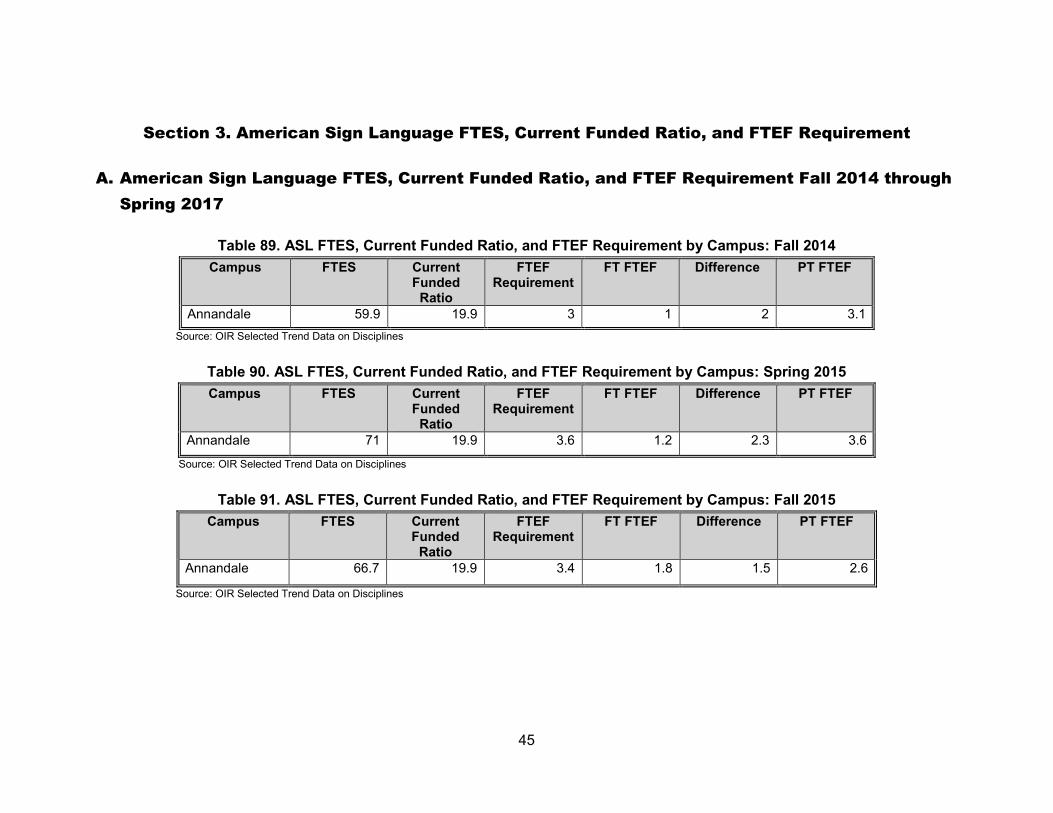
Section 3. American Sign Language FTES, Current Funded Ratio, and FTEF Requirement
A. American Sign Language FTES, Current Funded Ratio, and FTEF Requirement Fall 2014 through
Spring 2017
Table 89. ASL FTES, Current Funded Ratio, and FTEF Requirement by Campus: Fall 2014 Campus FTES Current
Funded Ratio
FTEF Requirement
FT FTEF Difference PT FTEF
Annandale 59.9 19.9 3 1 2 3.1 Source: OIR Selected Trend Data on Disciplines
Table 90. ASL FTES, Current Funded Ratio, and FTEF Requirement by Campus: Spring 2015 Campus FTES Current
Funded Ratio
FTEF Requirement
FT FTEF Difference PT FTEF
Annandale 71 19.9 3.6 1.2 2.3 3.6
Source: OIR Selected Trend Data on Disciplines
Table 91. ASL FTES, Current Funded Ratio, and FTEF Requirement by Campus: Fall 2015 Campus FTES Current
Funded Ratio
FTEF Requirement
FT FTEF Difference PT FTEF
Annandale 66.7 19.9 3.4 1.8 1.5 2.6
Source: OIR Selected Trend Data on Disciplines

46
Table 92. ASL FTES, Current Funded Ratio, and FTEF Requirement by Campus: Spring 2016 Campus FTES Current
Funded Ratio
FTEF Requirement
FT FTEF Difference PT FTEF
Annandale 71.4 19.9 3.6 1 2.6 3.1 Source: OIR Selected Trend Data on Disciplines
Table 93. ASL FTES, Current Funded Ratio, and FTEF Requirement by Campus: Fall 2016
Campus FTES Current Funded
Ratio
FTEF Requirement
FT FTEF Difference PT FTEF
Annandale 68.8 19.9 3.5 1.4 2 2.5 Source: OIR Selected Trend Data on Disciplines
Table 94. ASL FTES, Current Funded Ratio, and FTEF Requirement by Campus: Spring 2017 Campus FTES Current
Funded Ratio
FTEF Requirement
FT FTEF Difference PT FTEF
Annandale 73.1 19.9 3.7 1.1 2.5 2.9
Source: OIR Selected Trend Data on Disciplines
PATHWAY TO THE AMERICAN DREAM—NOVA’S STRATEGIC PLAN 2017-2023
THE NOVA COMMITMENT As its primary contributions to meeting the needs of the Commonwealth of Virginia, the Northern Virginia Community College pledges to advance the social and economic mobility of its students while producing an educated citizenry for the 21st Century.
THE STRATEGIC PLAN GOALS AND OBJECTIVES To deliver on this commitment NOVA will focus its creativity and talent, its effort and energy, and its resources and persistence, on achieving three overarching goals—success, achievement, and prosperity. It will strive to enable Every Student to Succeed, Every Program to Achieve, and Every Community to Prosper. To advance the completion agenda described above, thereby promoting students’ success and enhancing their social mobility, ensuring that programs achieve, and producing an educated citizenry for the 21st Century, the following goals and objectives are adopted: GOAL 1: Every Student Succeeds • Objective 1: Develop a College-wide approach to advising that ensures all students are advised and
have access to support throughout their time at NOVA
• Objective 2: Implement VIP-PASS System as the foundational technology based on NOVA Informed Pathways for student self-advising, assignment and coordination of advisors, and course registration
GOAL 2: Every Program Achieves • Objective 3: Develop comprehensive, fully integrated Informed Pathways for every program to
ensure seamless transitions from high school and other entry points to NOVA, and from NOVA to four-year transfer institutions or the workforce
• Objective 4: Develop effective processes and protocols for programmatic College-wide collective decisions that include consistent, accountable leadership and oversight of each academic program with designated “owners,” active advisory committees, clear student learning outcomes and assessments, and program reviews in all modalities of instruction
• Objective 5: Align NOVA’s organizational structures, position descriptions, and expectations for accountability with its overarching mission to support student engagement, learning, success and institutional effectiveness
GOAL 3: Every Community Prospers • Objective 6: Enhance the prosperity of every community in Northern Virginia by refocusing and
prioritizing NOVA’s workforce development efforts
• Objective 7: Further develop NOVA’s IT and Cybersecurity programs to support regional job demand and position NOVA as the leading IT community college in the nation
• Objective 8: Re-envision workforce strategies and integrate workforce development into a NOVA core focus
• Objective 9: Plan to expand the breadth and reach of NOVA’s healthcare and biotechnology programs, and prioritize future programs to support regional economic development goals economic development goals

703–323–3000 | www.nvcc.edu