
American Journal of Management - North American Business Press
130
American Journal of Management North American Business Press Atlanta - Seattle – South Florida - Toronto
-
Upload
khangminh22 -
Category
Documents
-
view
0 -
download
0
Transcript of American Journal of Management - North American Business Press

American Journal of Management
North American Business Press
Atlanta - Seattle – South Florida - Toronto


American Journal of Management
Editor Dr. Howard Miller
Editor-In-Chief Dr. David Smith
NABP EDITORIAL ADVISORY BOARD
Dr. Andy Bertsch - MINOT STATE UNIVERSITY Dr. Jacob Bikker - UTRECHT UNIVERSITY, NETHERLANDS Dr. Bill Bommer - CALIFORNIA STATE UNIVERSITY, FRESNO Dr. Michael Bond - UNIVERSITY OF ARIZONA Dr. Charles Butler - COLORADO STATE UNIVERSITY Dr. Jon Carrick - STETSON UNIVERSITY Dr. Mondher Cherif - REIMS, FRANCE Dr. Daniel Condon - DOMINICAN UNIVERSITY, CHICAGO Dr. Bahram Dadgostar - LAKEHEAD UNIVERSITY, CANADA Dr. Deborah Erdos-Knapp - KENT STATE UNIVERSITY Dr. Bruce Forster - UNIVERSITY OF NEBRASKA, KEARNEY Dr. Nancy Furlow - MARYMOUNT UNIVERSITY Dr. Mark Gershon - TEMPLE UNIVERSITY Dr. Philippe Gregoire - UNIVERSITY OF LAVAL, CANADA Dr. Donald Grunewald - IONA COLLEGE Dr. Samanthala Hettihewa - UNIVERSITY OF BALLARAT, AUSTRALIA Dr. Russell Kashian - UNIVERSITY OF WISCONSIN, WHITEWATER Dr. Jeffrey Kennedy - PALM BEACH ATLANTIC UNIVERSITY Dr. Jerry Knutson - AG EDWARDS Dr. Dean Koutramanis - UNIVERSITY OF TAMPA Dr. Malek Lashgari - UNIVERSITY OF HARTFORD Dr. Priscilla Liang - CALIFORNIA STATE UNIVERSITY, CHANNEL ISLANDS Dr. Tony Matias - MATIAS AND ASSOCIATES Dr. Patti Meglich - UNIVERSITY OF NEBRASKA, OMAHA Dr. Robert Metts - UNIVERSITY OF NEVADA, RENO Dr. Adil Mouhammed - UNIVERSITY OF ILLINOIS, SPRINGFIELD Dr. Roy Pearson - COLLEGE OF WILLIAM AND MARY Dr. Sergiy Rakhmayil - RYERSON UNIVERSITY, CANADA Dr. Robert Scherer - CLEVELAND STATE UNIVERSITY Dr. Ira Sohn - MONTCLAIR STATE UNIVERSITY Dr. Reginal Sheppard - UNIVERSITY OF NEW BRUNSWICK, CANADA Dr. Carlos Spaht - LOUISIANA STATE UNIVERSITY, SHREVEPORT Dr. Ken Thorpe - EMORY UNIVERSITY Dr. Robert Tian - MEDIALLE COLLEGE Dr. Calin Valsan - BISHOP'S UNIVERSITY, CANADA Dr. Anne Walsh - LA SALLE UNIVERSITY Dr. Thomas Verney - SHIPPENSBURG STATE UNIVERSITY Dr. Christopher Wright - UNIVERSITY OF ADELAIDE, AUSTRALIA

Volume 13(1) ISSN 21657998 Authors have granted copyright consent to allow that copies of their article may be made for personal or internal use. This does not extend to other kinds of copying, such as copying for general distribution, for advertising or promotional purposes, for creating new collective works, or for resale. Any consent for republication, other than noted, must be granted through the publisher:
North American Business Press, Inc. Atlanta - Seattle – South Florida - Toronto ©American Journal of Management 2013 For submission, subscription or copyright information, contact the editor at: [email protected] Subscription Price: US$ 325/yr Our journals are indexed by UMI-Proquest-ABI Inform, EBSCOHost, GoogleScholar, and listed with Cabell's Directory of Periodicals, Ulrich's Listing of Periodicals, Bowkers Publishing Resources, the Library of Congress, the National Library of Canada. Our journals have been used to support the Academically Qualified (AQ) faculty classification by all recognized business school accrediting bodies.

This Issue
Proactive Personality and Career Future: Testing a Conceptual Model and Exploring Potential Mediators and Moderators ...................................................................................................... 11 Veena P. Prabhu Proactive individuals actively create environmental change. In today’s challenging times several factors can be a cause for concern for a proactive employee’s career future. The purpose of the present study was two-fold: propose and test a conceptual model; test the mechanism by which extrinsic factors—managerial communication, job performance and intrinsic factors—job satisfaction intent to remain with the organization, affect the relationship between proactive personality and career future. The conceptual model exhibited a robust fit. Both managerial communication and intent to remain were strong predictors of career future. The results also supported the mediating framework of all the four factors. Implications for organizations and future research are discussed. Does Fitness and Exercises Increase Productivity? Assessing Health, Fitness and Productivity Relationship .................................................................................................... 32 Mansour Sharifzadeh As the American workforce increases, so does its waistline. It is estimated that 64% of the adults in the United States are obese, with nearly 9 million children age six and older becoming obese. With obesity come serious health problems such as heart disease, diabetes, hypertension and high blood pressure. Americans are faced with the challenge of trying to manage a higher cost of living that requires them to work more hours. They have to deal with the fact that an increase in the hours they work takes time away from their time to cook, which leads to unhealthy fast food choices and even less time to exercise. Employers are investing large amounts in employee fitness programs, but the value of physical exercise and lifestyle has yet to be established. This paper provides a critique of the applied and experimental research related to the impact of the employee fitness programs on work-related variables and discusses future research directions. More and more companies either are planning or have developed physical fitness programs for their employees. In the United States approximately 55,000 companies are involved in employee fitness and promote physical activities. Armageddon II: An Analysis of the Issues Surrounding the NHL Lockout ....................................... 53 Jordan I. Kobritz, Jeffrey F. Levine The National Hockey League locked out its players for the second time in seven years after losing the entire 2004-05 season in an effort to obtain a salary cap that was touted as the panacea for financial stability and profitability to its member teams. However, the league maintains that two-thirds of the teams lost money during the 2011-12 season, despite a 50% increase in total league revenue since 2005. This article will analyze a number of key issues between the parties and discuss the importance and potential resolution of each one during negotiations for a new Collective Bargaining Agreement.

A New Resource for Social Entrepreneurs: Technology ....................................................................... 66 Shalini S. Gopalkrishnan Social entrepreneurs have employed social capital, funding and a vision as intrinsic resources for building social enterprise. Technology is another crucial resource which has the capability to transform an idea into an operational endeavor. Technology supports in creating a new social venture, when one could not achieve scale in the past or not create one in the past without technology. Using aspects of Technology Diffusion theory, we show through several cases how technology can be another critical resource that can be utilized by Social ventures to create and broaden their enterprises and apply existing technology to leverage their businesses. Leadership Metaphors: Developing Innovative Teaching Strategies ................................................... 79 R. Wilburn Clouse, Terry Goodin, Joseph Aniello, Noel McDowell, Darlene McDowell Research conducted over the last half century has revealed that optimal learning takes place in the brain when both the left-brain and the right brain work in balance. Educators can intentionally arouse the activation of one hemisphere of the brain over the other through the use of right brain strategies in language learning. These strategies, including analogy, metaphor, synthesis, and imagery connect the two separate thought processes of the brain, linking the sequential analytical knowledge of the left brain with the conceptual patterns and images of the right brain. In 1997 Clouse and colleagues developed a teaching strategy called “Whole-Part- Whole,” where the learning is tied directly with the framework of the learner. Through “just in time teaching,” the student learns the parts of a opened-ended case. The recursive design allows students to recreate a new “whole,” which becomes new applied knowledge. The whole-brain theory and the Whole-Part-Whole strategy of learning were used as the basis for an assignment at Vanderbilt University in which graduate students were asked to write a paper using metaphors to describe leadership skills of a leader that they knew. Students were required to tie the metaphor to leadership theory. Students were very creative in the development of metaphors to describe leaders that they enjoyed and admired. Management Resistance to Innovation ................................................................................................... 93 Bruce D. Fischer, Matthew Rohde It is often management that is the greatest barrier to innovation and change in organizations. We consider the situation where non-management personnel are eager to innovate but management does not support and encourage innovation, and even discourages it. Even when upper management supports innovation, middle management and first-line supervision can thwart the organization’s efforts to innovate. We evaluate this situation and provide suggestions on how upper management can ensure that all levels of management support and encourage innovation. Constituents in Conflict: Serving External Stakeholders .................................................................... 100 Suzanne N. Cory, Thomas E. Reeves Accounting education has been criticized for several years and calls for its change have been extensive. This study obtains the viewpoints of two important constituent groups for higher education accounting programs: (1) public accountants and (2) non-public accountants, regarding the importance of topics to be covered in accounting courses. Of 22 course topics, statistically significant differences for 16 were found between the two groups. Implications for accounting educators are discussed.

Compensation as a Construct for Employee Motivation in Healthcare ............................................ 108 Allen C. Minor There is no difference between performance of those employees receiving a salary as compensation for services and those employees receiving compensation based on output by the specific employee, (Null), or alternatively, incentive compensation results in increased employee productivity. This issue has been debated historically and the debate continues. This paper reviews the issue from a historical perspective and includes contemporary research and concludes with implications for further research. The Digital Divide: Issue Framing and Policy Responses ................................................................... 112 Allan Maram, David Ruggeri The paper considers the various policy responses that are available to address the problem, and develops a multi-pronged policy implementation approach to ameliorate this issue. The digital divide is a multifaceted issue that requires a comprehensive policy response. We cannot hope to address such a complex phenomenon with any single policy approach, but rather a coordinated effort of several distinct and separate policies aimed at small businesses, NGO’s, and easing government regulation implemented contemporaneously. Developing multiple policies designed to individual entities and implementing them simultaneously by various stakeholders will increase the outcome success rate. Demographic Variables Affect Branded Product in Retail Market ................................................... 121 S. Franklin John, S. Senith This study was designed to investigate the influence of demographic variables and different dimensions of milk brand. From the careful investigation of the literature review we found out that there is an influence of demography of the sample on the purchase of the branded milk in retail market. We intend to study the influence of demography variables on purchase of branded milk in the retail market in Tamil Nadu. For this study, we prepared a questionnaire and it was distributed to 500 consumers who are all using branded milk. Out of the 500 consumers contacted, 325 questionnaires were returned with required coverage and details. The participants completed the two sets of self-reported questionnaires, including background characteristics and the variables chosen for this study in order to measure the influence of branded milk; Salience, Performance, Imagery, Judgment, Feelings and Resonance. The collected data were computed and analyzed uing a one-way analysis of variance. The findings of the study were generalized as follows: statistically insignificant differences were found in the marital status and the different brand dimensions like Salience, Performance, Imagery, Judgment, Feelings and Resonance. Also there was a statistically significant difference in the dimensions of Imagery, Feelings and respondents occupation.


GUIDELINES FOR SUBMISSION
American Journal of Management (AJM)
Domain Statement The American Journal of Management (AJM) is a peer-reviewed multidisciplinary journal dedicated to publishing scholarly empirical and theoretical research articles focusing on improving organizational management theory, practice and behavior. AJM encourages research that impacts the management field as a whole and introduces new ideas or new perspectives on existing research. Accepted manuscripts will focus of bridging the gap between academic theory and practice as it applies to improving the broad spectrum of the management discipline. Manuscripts that are suitable for publication in AJM cover domains such as business strategy and policy, entrepreneurship, human resource management, operations management, organizational behavior, organizational theory, and research methods. Submission Format
Articles should be submitted following the American Psychological Association format. Articles should not be more than 30 double-spaced, typed pages in length including all figures, graphs, references, and appendices. Submit two hard copies of manuscript along with a disk typed in MS-Word.
Make main sections and subsections easily identifiable by inserting appropriate headings and sub-headings. Type all first-level headings flush with the left margin, bold and capitalized. Second-level headings are also typed flush with the left margin but should only be bold. Third-level headings, if any, should also be flush with the left margin and italicized.
Include a title page with manuscript which includes the full names, affiliations, address, phone, fax, and e-mail addresses of all authors and identifies one person as the Primary Contact. Put the submission date on the bottom of the title page. On a separate sheet, include the title and an abstract of 200 words or less. Do not include authors’ names on this sheet. A final page, “About the authors,” should include a brief biographical sketch of 100 words or less on each author. Include current place of employment and degrees held.
References must be written in APA style. It is the responsibility of the author(s) to ensure that the paper is thoroughly and accurately reviewed for spelling, grammar and referencing. Review Procedure
Authors will receive an acknowledgement by e-mail including a reference number shortly after receipt of the manuscript. All manuscripts within the general domain of the journal will be sent for at least two reviews, using a double blind format, from members of our Editorial Board or their designated reviewers. In the majority of cases, authors will be notified within 60 days of the result of the review. If reviewers recommend changes, authors will receive a copy of the

reviews and a timetable for submitting revisions. Papers and disks will not be returned to authors. Accepted Manuscripts
When a manuscript is accepted for publication, author(s) must provide format-ready copy of the manuscripts including all graphs, charts, and tables. Specific formatting instructions will be provided to accepted authors along with copyright information. Each author will receive two copies of the issue in which his or her article is published without charge. All articles printed by AJM are copyrighted by the Journal. Permission requests for reprints should be addressed to the Editor. Questions and submissions should be addressed to:
North American Business Press 301 Clematis Street, #3000
West Palm Beach, FL USA 33401 [email protected]
866-624-2458
Proactive Personality and Career Future: Testing a Conceptual Model and Exploring Potential Mediators and Moderators
Veena P. Prabhu
California State University Los Angeles
Proactive individuals actively create environmental change. In today’s challenging times several factors can be a cause for concern for a proactive employee’s career future. The purpose of the present study was two-fold: propose and test a conceptual model; test the mechanism by which extrinsic factors—managerial communication, job performance and intrinsic factors—job satisfaction intent to remain with the organization, affect the relationship between proactive personality and career future. The conceptual model exhibited a robust fit. Both managerial communication and intent to remain were strong predictors of career future. The results also supported the mediating framework of all the four factors. Implications for organizations and future research are discussed. OVERVIEW OF PROACTIVE PERSONALITY
Proactive behavior entails a dynamic approach toward work (Frese, Kring, Soose, & Zempel, 1996; Parker, 2000) seeking to improvise the existing job along with developing personal prerequisites for furthering career success (Seibert, Crant, & Kraimer, 1999) and organizational effectiveness (Bateman & Crant, 1999). The extant work on proactive behavior advocates the fact that the construct proactive personality explicitly encompasses the varied aspects of proactive behavior and initiative (Crant, 2000).
Bateman and Crant (1993) defined the construct proactive personality “as a dispositional construct that identifies differences among people in the extent to which they take action to influence their environment” (p. 103). They further developed the Proactive Personality Scale (PPS) to measure this construct and provided evidence for the scale’s convergent, discriminant, and predictive validity with results from three studies. Since then, a number of studies have consistently demonstrated the validity of the proactive personality construct, as assessed by the PPS (e.g., Becherer & Maurer, 1999; Bateman & Crant, 1999, Crant, 1995, 1996; Crant & Bateman, 2000; Kirkman & Rosen, 1999; Parker & Sprigg, 1999).
Proactive personality is a unique disposition not captured by other typologies such as the five-factor model; Crant and Bateman (2000) found only moderate correlations with the five-factor model of personality. Furthermore, Crant (1995) found that proactive personality predicted sales performance above and beyond conscientiousness and extraversion. Additionally, Bateman and Crant (1993) showed that proactive personality is distinct from self-consciousness, need for achievement, need for dominance, and locus of control. All these studies provide further evidence for the discriminant validity of proactive personality.
Research in understanding this construct has been rapidly increasing. Its effects have been studied in varied fields such as career success (Erdogan & Bauer, 2005; Seibert, Crant, & Kraimer, 1999), job
American Journal of Management vol. 13(1) 2013 11

performance through a social capital perspective (Thompson, 2005); transformational (Bateman & Crant, 1993) and charismatic leadership (Crant & Bateman, 2000); and job search success (Brown, Cober, Kane, Levy, & Shalhoop, 2006). Chan (2006) has explored the interactive effects of situational judgment effectiveness and proactive personality on work perceptions and outcomes. Parker and Sprigg (1999) found that proactive personality moderated the interactive effect of job autonomy and demands on employee strain. Their results were consistent with the premise that proactive employees take advantage of high job control to manage the demands they face more effectively, whereas passive employees do not take advantage of greater autonomy to this end. Proactive Personality and Career Future
An idea that has recently gained much ground is the notion that work design does not simply allow employees to apply knowledge they possess, but it also promotes knowledge creation, or employee learning and development. Research suggests that individual characteristics may be the strongest predictors of engagement in development activity (Maurer & Tarulli, 1994). Evidence is accumulating for this more developmental perspective. Studies have shown a link between the greater use of personal initiative (Frese, Kring, Soose, & Zempel, 1996) and the development of more proactive role orientations (Parker, Wall, & Jackson, 1997). This learning and developmental perspective is consistent with the German Action Theory (e.g. Hacker, Skell, & Straub, 1968) which is based on the ideology that work is action-oriented. More broadly, Action Theory is substantiated by the premise that: “the human is seen as an active rather than a passive being who changes the world through work actions…” (Frese & Zapf, 1994; p. 86).
People are not always passive recipients of environmental constraints on their behavior; rather, they can intentionally and directly change their current circumstances (e.g., Buss, 1987; Diener, Larsen, & Emmons, 1984). In dynamic circumstances which tend to be less well-defined, it is reasonable to assume that individuals might mold their work characteristics to fit their individual abilities or personalities. People with a proactive personality are relatively unconstrained by situational forces (Bateman & Crant, 1993). Readiness and determination to pursue a course of action are characteristic of proactive people which are also central to models of self-development (Antonacopoulou, 2000).
The words of Bateman and Crant (1999) capture the essence of proactive personality. Proaction involves creating change, not merely anticipating it. It does not just involve the important attributes of flexibility and adaptability toward an uncertain future. To be proactive is to take the initiative in improving business. At the other extreme, behavior that is not proactive includes sitting back, letting others make things happen, and passively hoping that externally imposed change “works out okay.” (p. 63)
Careers have changed dramatically with advances in technology (Coovert, 1995; Freeman, Soete, & Efendioglu, 1995; Howard, 1995; Van der Spiegel, 1995) and increased global competition (Rosenthal, 1995). Thus in today’s borderless world characterized by technological advances wherein companies are competing for survival the assumption that an organization would provide lifetime employment has undoubtedly become a myth—‘both parties know that the [employment] relationship is unlikely to last forever’ (Cappelli, 1999, p. 3) which in turn demands that employees start charting and navigating their careers. Thus there is renewed interest in the idea of individuals taking responsibility for their career with researchers investigating the effect of various factors on careers (e.g., Sullivan, Carden, & Martin, 1998). In the present study we have concentrated on the construct of career future because in today’s competitive environment individuals are bound to be concerned about their job security and whether they anticipate ‘to climb the ladder’ if they continue to work for the same organization. Although the extant literature lacks an appropriate definition for the construct of career future, in the present study it has been operationalized as an employee’s belief about having prospects for career advancement in the present organization.
12 American Journal of Management vol. 13(1) 2013
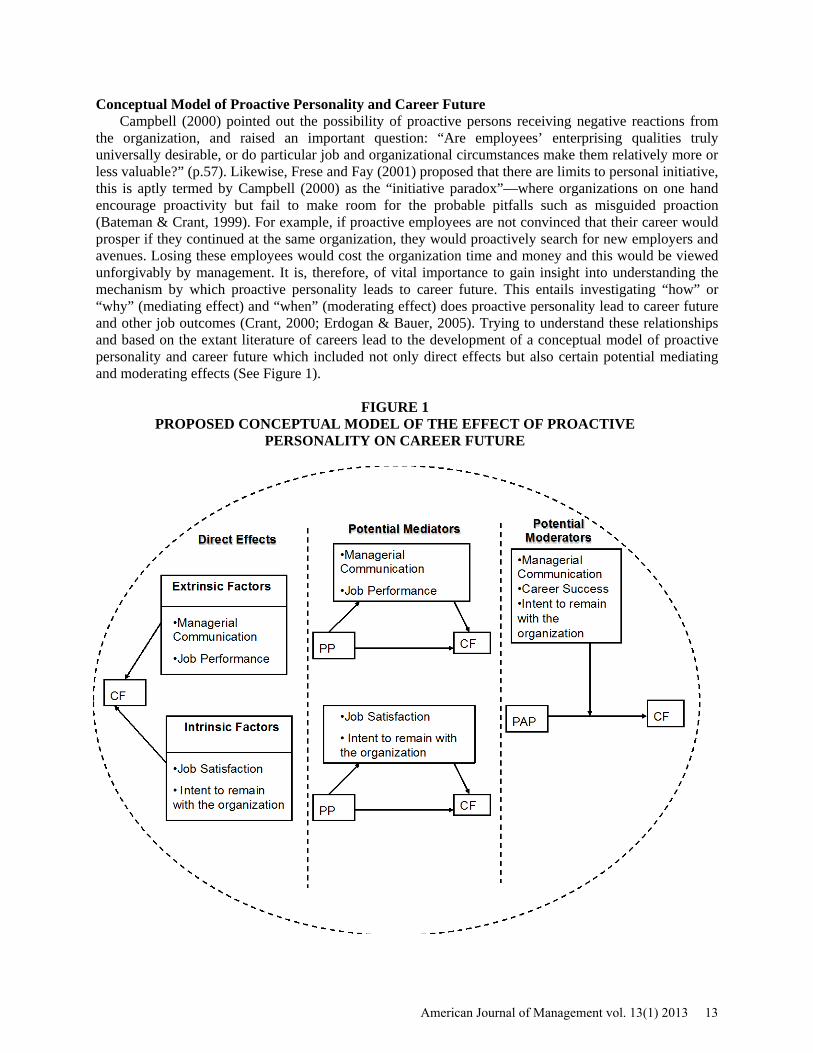
Conceptual Model of Proactive Personality and Career Future Campbell (2000) pointed out the possibility of proactive persons receiving negative reactions from
the organization, and raised an important question: “Are employees’ enterprising qualities truly universally desirable, or do particular job and organizational circumstances make them relatively more or less valuable?” (p.57). Likewise, Frese and Fay (2001) proposed that there are limits to personal initiative, this is aptly termed by Campbell (2000) as the “initiative paradox”—where organizations on one hand encourage proactivity but fail to make room for the probable pitfalls such as misguided proaction (Bateman & Crant, 1999). For example, if proactive employees are not convinced that their career would prosper if they continued at the same organization, they would proactively search for new employers and avenues. Losing these employees would cost the organization time and money and this would be viewed unforgivably by management. It is, therefore, of vital importance to gain insight into understanding the mechanism by which proactive personality leads to career future. This entails investigating “how” or “why” (mediating effect) and “when” (moderating effect) does proactive personality lead to career future and other job outcomes (Crant, 2000; Erdogan & Bauer, 2005). Trying to understand these relationships and based on the extant literature of careers lead to the development of a conceptual model of proactive personality and career future which included not only direct effects but also certain potential mediating and moderating effects (See Figure 1).
FIGURE 1
PROPOSED CONCEPTUAL MODEL OF THE EFFECT OF PROACTIVE PERSONALITY ON CAREER FUTURE
American Journal of Management vol. 13(1) 2013 13

Potential Mediators and Moderators in the Relationship Between Proactive Personality and Career Future
Several authors have noted that understanding the strategies and behaviors applied by individuals to achieve career success is of vital importance (Bell & Staw, 1989; Judge & Bretz, 1994). In today’s competitive world where there has been an increasing emphasis on protean careers, boundaryless careers, and career self-management (Hall, 1996a, 1996b; Jackson, 1996; King, 2004) proactive personality perfectly fits the bill. In an interesting study by Seibert, Crant, and Kraimer, (1999) proactive personality was associated with career success even after accounting for predictors, such as demographics, human capital, motivation, type of organization, and type of industry. In another longitudinal study they also found proactive personality to be positively related to career initiative, which consequently has a positive impact on career progression and career satisfaction (Seibert, Kraimer, & Crant, 2001).
However, it is essential to note that research on proactive career behavior primarily focused on ‘bounded careers, that is, single-employer careers with the prospect of stable employment’ (Claes, & Ruiz-Quintanilla, 1998, p. 358). It would be appropriate to conclude that today’s environment characterized by severe competition is the antonym of a stable environment. The recession has made the concept of job security obsolete and thus shifted the responsibility from employers to employees (Hall & Mirvis, 1995). In such a backdrop it would be logical to assume that employees, especially proactive employees, would remain with the organization only if they were convinced that they do have a career future in the organization. Thus in the present context it may be plausible that if the proactive employees are not convinced that they have career future they may not only be proactive in leaving the job but also searching new jobs. Thus it is of vital importance to gain insight into understanding as to how proactive personality affects career future.
Based on the extant literature four factors were chosen—two extrinsic (managerial communication and job performance) and two intrinsic factors (job satisfaction and intent to remain with the organization). Dual Role of Managerial Communication and Intent to Remain with the Organization
With the advent of globalization, companies are constantly evolving and actively changing to not only survive but also thrive in this competitive environment. Managerial communication is a significant factor in employees’ support for change. It has gained importance in recent years as researchers have found it to be predominantly vital in the entire organizational change process (Armenakis & Harris, 2002; Lewis, 1999). It is generally defined in terms of a process through which companies basically prepare employees for change by stating and clarifying issues related to the change (Lewis, 1999). Communication helps employees to gain a better understanding for the need for change, as well as to have some insights on the personal effects that may have been caused by the proposed change (Armenakis & Harris, 2002). The process perspective suggests that when employees receive adequate and suitable communication in a change context (i.e. appropriate justification for, and information about, the change and timely feedback), they will have more favorable attitudes toward the change which, in turn, provides them insights as to “how” and “when” their careers will be affected in the near future.
Another important factor to consider is an employee’s intent to remain with the organization. Past research has found career commitment as an important individual factor of turnover (Bedeian, Kemery & Pizzolatto, 1991; Cotton & Tuttle, 1986; Mobley, Griffeth, Hand, & Meglino, 1979; Price & Mueller, 1981). Furthermore studies provided support for a significant inverse relationship between career commitment and turnover (Bartol, 1979; Harrell, Chewning & Taylor, 1986).
Additionally past research has studied career related factors as a predictor of turnover intentions. However, once an employee has decided that he/she intends to remain with the company for varying reasons (personal or professional) intent to remain can also serve as a predictor. Jauch, Osborn and Terpening (1980) suggested several reasons for an employee’s intent to remain (or conversely turnover intentions) with an organization. They pointed out that it is not only identification with the organization but it can also be identification with a specific career or a particular set of peers. Furthermore, earlier studies suggested employees could be committed to either organizational or career goals but not both.
14 American Journal of Management vol. 13(1) 2013

Subsequently studies revealed commitment to neither, either, or both the career and the organization (Berger & Grimes, 1973). Additionally studies showed that individuals where able to achieve their needs by either merging their needs with organizational needs through participation (Latham & Yukl, 1975) and/or treat the organization as an instrument of his/her fulfillment (Rotondi, 1975). This suggests that intention to remain with an organization can be achieved due to several reasons and if so can then serve as a predictor of career future. For example if an employee intends to stay with the company due to peer loyalty or personal reasons such dual career couples etc s/he will find different ways to ensure a career future by using every opportunity the company provides.
Hence, in the present study we propose and test that intent to remain acts as a predictor of career future.
The moderation framework refers to a situation that includes three or more variables, such that, the presence of one of those variables changes the relationship between the other two, while in the mediation framework there is a causal process between all three variables. From the above discussion we anticipate that managerial communication and intent to remain with the organization will act as both a mediator and moderator.
Hypothesis 1: Managerial communication will mediate the relationship between proactive personality and career future. Hypothesis 2: Managerial communication will moderate the relationship between proactive personality and career future. Hypothesis 3: Intent to remain with the organization will mediate the relationship between proactive personality and career future. Hypothesis 4: Intent to remain with the organization will moderate the relationship between proactive personality and career future.
Job Performance and Job Satisfaction
The range of job-related outcomes usually considered in work design research has been criticized as being too limited. However, traditional outcomes such as job satisfaction (intrinsic) and job performance (extrinsic) will certainly remain central to the agenda; hence these two outcomes were chosen in the present study. Mainly, proactive personality has been related to extrinsic job-related outcomes such as job performance (Crant, 1995; Thompson, 2005), extrinsic career success, or actual advancements in salary and position (Seibert, Crant, & Kraimer, 1999; Seibert, Kraimer, & Crant, 2001).
Proactive personality has also been related to intrinsic career success, i.e. job and career satisfaction. Intrinsic success is also important because of its relation to life satisfaction (Lounsbury, Park, Sundstrom, Williamson, & Pemberton, 2004). In the present study job satisfaction was defined as an individual's global feeling about his or her job (Spector, 1997). Dispositional characteristics incline people to a certain level of satisfaction (see Bowling, Beehr, Wagner, & Libkuman, 2005).
Additionally several studies have provided evidence of the importance of job satisfaction in careers. For example the Career Attitudes and Strategies Inventory (CASI) developed by Holland and Gottfredson (1994) ‘‘provides an assessment of the likelihood of job stability or change’’ (p. 1). The CASI contain nine scales—job satisfaction being one of them. Holland (1996, p. 402) found that people with stable work histories (i.e., remaining in the same career) ‘‘have high scores on the Job Satisfaction scales”. Also Alexander, Lichtenstein, Joo Oh, and Ullman (1998) surveyed 1106 nursing personnel and found that job satisfaction was negatively related to career change intent. Similarly, Smart and Peterson (1994) sampled 498 professional women and found that job satisfaction was positively correlated with career persistence.
Based on the above discussion we anticipated a meditational framework:
Hypothesis 5: Job performance will mediate the relationship between proactive personality and career future. Hypothesis 6: Job satisfaction will mediate the relationship between proactive personality and career future.
American Journal of Management vol. 13(1) 2013 15
METHODOLOGY Research Setting and Participants
Cross-sectional data were collected from employees who work in the private sector in Israel. The main sectors represented in our sample are technology, pharmaceuticals, telecommunication, finance and aviation. The data were collected via a self-report online survey using the snow-ball effect. Survey administration process was initiated by sending an email information letter to 25 people in 14 private sector companies in Israel, inviting them to participate in the research study. These initial respondents were asked to disperse the survey to five other employees who worked with them in their company or to other workers in the private sector. The email cover letter contained the link to the survey and a request not to answer the survey if the recipient was not working in the private sector in Israel. Because English is a second language in Israel and is actively used and spoken in the country’s business community, the contact email and the survey were distributed in the English language. Only employees with access to email and the internet were able to receive and answer the survey. We collected 120 completed and usable surveys.
Prior to the data collection in Israel, a pilot study was conducted to test the reliability of the survey. The survey was distributed to 40 MBA students in a large, public university on the West Coast in the United States online via www.Zoomerang.com and in the classroom.
In the Israeli sample the respondents had an average age of 30 years. Of the 120 people surveyed, about 54% were female. About 59% of respondents had a Bachelor degree, 27% had a Masters degree, and only 3% had a post graduate degree. Of the 120 respondents, 23% were software engineers, about 17% customer service representatives, 15% sales and marketing people, about 8% human resource management people, 7% operations and logistics and about 6% in business development. Tables 1 and 2 provide a demographic and job positions profile of the respondents, respectively.
16 American Journal of Management vol. 13(1) 2013

TABLE 1 DEMOGRAPHIC PROFILE OF SURVEY RESPONDENTS
Variable N % Gender Female 64 53.33 Age 20-29 years 44 36.66 30-39 years 62 51.66 40-49 years 3 2.5 50-59 years 7 5.83 >60 years 4 3.33 Education High School 13 10.83 BA 71 59.16 MA 33 27.5 Higher Degree 3 2.5 Tenure ( Organization ) < 1 year 13 10.83 1-5 years 88 73.33 6-10 years 11 9.16 11-20 years 8 6.66 >20 years 0 0 Tenure ( Job Position ) < 1 year 17 14.16 1-5 years 91 75.83 6-10 years 7 5.83 11-20 years 5 4.16 >20 years 0 0 Note: N = 120
TABLE 1 (CONTINUED)
POSITIONS WITH ORGANIZATION
Variable N % Job Position -Software Engineer 24 20 -Manager 14 11.66 -Sales/Marketing 18 15 -Customer Service 20 16.66 -Operations / Logistics 9 7.5 -Human resources 10 8.33 -Business Development 7 5.83 -Others 18 15 Note: N = 120
American Journal of Management vol. 13(1) 2013 17

Measures Career Future
Career future was measured by using a part of the Index of Organizational Reactions (IOR) scale developed by Dunham and Smith (1979). The IOR assesses satisfaction with supervision, financial rewards, kind of work, physical conditions, amount of work, company identification, co-workers, and career future. Five items related to career future was used which were obtained from Cook, Hepworth, Wall, and Warr (1981, pp. 42-45). Several studies have used this scale reporting coefficient alpha values which ranged from .82 to .83 (Lee & Johnson, 1991; McLain, 1995; Taylor, Tracy, Renard, Harrison, & Carroll, 1995). The present study reported a Cronbach’s alpha of .84. Proactive Personality
Proactive personality was measured by using the shortened version of Bateman and Crant's (1993) 17-item Proactive Personality Scale (PPS) created by Seibert, Crant, and Kraimer, (1999). The shortened version consisted of 10 items which were selected as they had the highest average factor loadings across the three studies reported by Bateman and Crant (1993). These three studies presented evidence for the scale’s reliability (Cronbach’s alpha across three samples ranged from .87 to .89, and the test-retest reliability coefficient was .72 over a 3 month period) and convergent, discriminant, and criterion validity. Seibert et al (1999) mentioned that the deletion of 7 items did not result in a major effect on the reliability of the scale (17-item α = .88; 10-item α = .86). These items were summed to arrive at a proactive personality score. Responses were indicated on a seven-point Likert scale ranging from 1 ("strongly disagree") to 7 ("strongly agree"), with such items as "I excel at identifying opportunities" and "No matter what the odds, if I believe in something I will make it happen." Internal consistency (coefficient alpha) obtained in the current study was .89, in line with that reported by Bateman and Crant (1993). Managerial Communication
Managerial communication was measured by using a subscale of the Communication Satisfaction Questionnaire (CSQ) (Downs & Hazen, 1977). The CSQ is a 40-item instrument that has demonstrated a high degree of validity and reliability across a number of organizations, and in multiple contexts (Clampitt & Downs, 2004). Although several factors are identified by Downs and Hazen (1977) as indicators of overall communication satisfaction in the workplace, the focus of the present study was specifically related to the dimension that assesses employees’ satisfaction with communication with their immediate supervisor or manager. Specifically this dimension is identified as personal feedback in the original instrument. It assesses how satisfied employees are with information they receive about their job, recognition of their efforts, and how well supervisors understand problems faced by employees. A 7-point Likert response format (ranging from 1 = very dissatisfied to 7 = very satisfied) was used to measure employees’ satisfaction to the five items. Previous studies that have assessed the internal consistency of the individual dimensions of the CSQ have reported coefficient alphas of .80 (Pincus, 1986) and .84 (Crino & White, 1981) for the personal feedback dimension. A more recent study examining the psychometric properties of the CSQ (Gray & Laidlaw, 2004) reported a coefficient alpha of .86 for the personal feedback dimension. The reliability found in the present study was in tune with these studies as Cronbach’s alpha was .90. Job Performance
Job performance was measured by using self-report scale which included 7 items and was a subset of the 20-item scale prepared by Williams and Anderson (1991). The Williams and Anderson (1991) scale was originally validated on 127 employees working in varied organizations. Factor analysis resulted in three distinct behavior factors—job performance being one of them. Example questions include “fulfills responsibilities specified in the job description” and “meets formal performance requirements of the job.” Items were summed to yield a total performance score for each employee. Reliability of the scale was in the present study was .92.
18 American Journal of Management vol. 13(1) 2013
Job Satisfaction Job satisfaction was measured by using a nine item scale developed by Eisenberger, Cummings,
Armeli and Lynch (1997). Respondents indicated the extent of their agreement with each item on a 7-point Likert-type scale (1 = strongly agree, 7 = strongly disagree). Cronbach’s alpha measured for this scale was α = .94. Intent to Remain
Employee’s intent to remain with the organization was measured using a scale from Robinson (1996). This four-item scale asked employees to respond to Likert-type questions about how long the employee intends to remain with the employer, the extent to which they would prefer to work for a different employer, the extent to which they have thought about changing companies, and one binary question (“If you had your way, would you be working for this employer three years from now?”). We found a rather modest reliability with Cronbach’s alpha measuring .68. Demographic Data and Control Variables
The survey also included items inquiring about the subjects' age, gender, ethnicity, and job tenure which were used as control variables in the study. Gender was dummy coded 0 for female subjects and 1 for male subjects. (See Table 1 for a summary of the measures). Data Analysis
Data for this study were collected anonymously. Anonymity provided benefits by potentially reducing the method bias (see Podsakoff, MacKenzie, Lee, & Podsakoff, 2003). Data were analyzed using Structural Equation Modeling (SEM) implemented in AMOS and hierarchical regression analyses (See, Barron & Kenny, 1986). First the model fit was tested using several confirmatory factor analyses and comparing the goodness of fit indices. SEM was used to validate the conceptual model. Both the meditational and moderational framework were tested using hierarchical regression analysis (See Aiken & West, 1991; Cohen, Cohen, West, & Aiken, 2003; Frazier, Tix, & Barron, 2004; Holmbeck, 1997). Tests for Model Fit
The first step in the data analysis process involved running several confirmatory factor analyses and observing the fit of the data by checking whether all the goodness-of-fit indices met the respective criteria.
The goodness of fit of the models was evaluated by using absolute and relative indices. The absolute goodness-of-fit indices which were calculated are (cf. Jöreskog & Sörbom, 1993) (a) the chi-square goodness-of-fit statistic and (b) the root-mean-square error of approximation (RMSEA). Although the chi-square likelihood ratio is considered the most fundamental measure of absolute model fit, it is sensitive to sample size and thus, with larger sample sizes (more than 200), can result in significant values even when small differences exist between the model and the data (Anderson & Gerbing, 1988; Hair, Anderson, Tattham, & Black, 1998). The ratio of chi-square to degrees of freedom (χ2/df) has been suggested as an alternative, with values of 2.0 or less indicative of acceptable fit (Kline, 2005). The RMSEA is a measure of model discrepancy and takes into account the error of approximation in the population (Hu & Bentler, 1999). The relative goodness-of-fit indices which were computed are (cf. Marsh, Balla, & Hau, 1996) (a) the normed fit index (NFI) (b) the comparative fit index (CFI), and (c) the incremental fit index (IFI). The CFI is a measure of fit derived from the comparison of the hypothesized model to the independence model and adjusts for sample size. CFI values of 0.90 or greater are indicative of acceptable models (Hu & Bentler, 1999). Hypothesis Testing: Mediating and Moderating Effects
In the present study the data was analyzed by using hierarchical linear regression. To test for mediation Barron and Kenny (1986) suggested a three-step procedure: 1) the mediator was regressed on the independent variable, 2) the dependent variable was regressed on the independent variable, and finally
American Journal of Management vol. 13(1) 2013 19

3) the dependent variable was regressed on both the independent variable and on the mediator. However, to test for complete mediation the independent variable needs to be controlled in the third step. Hence a simple regression was performed for step one, but for steps two and three a hierarchical linear regression was employed. A formal test of the significance of mediation was provided by the Sobel test (see MacKinnon, Warsi, & Dwyer, 1995). Similarly for moderation, step 1 included only the IV-proactive personality and in step in addition to the moderator variable the interaction term was introduced. A significant interaction term provides support for the moderational framework. Following the regression analysis the slopes are calculated at low medium and high levels of the moderator variable. RESULTS Descriptive Statistics
Table 2 displays means, standard deviations and correlations among all the variables. Correlations among the independent and mediator variables had a median value of .19 and a maximum value of .33, with a maximum variance-inflation factor less than 2; hence, multicollinearity was not a severe problem that would preclude interpretation of the regression analyses (Neter, Wasserman, & Kutner, 1983). Proactive personality was significantly and positively related to career future (r = .37, p = .01). Given the proposed mediational framework all the four factors—managerial communication (r = .63, p = .01); job performance (r = .31, p = .01); job satisfaction (r = .59, p = .01) and intent to remain with the organization (r = .55, p = .01) were significantly correlated with career future.
TABLE 2 DESCRIPTIVE STATISTICS AND ZERO-ORDER CORRELATIONS AMONG VARIABLES
Note. N = 120 **p < .01. Model Fit
The overall fit of the measurement model was assessed following the guideline suggested by Hair, Anderson, Tatham, and Black (1998, pp. 610-612). Separate confirmatory factor analyses (CFA) (implemented in AMOS 18) were conducted to assess the psychometric properties of the constructs and to establish a baseline model. Prior to performing the analysis, all negatively worded items in the scales of all the variables were reverse scored. For all the scales in this study the loading of one indicator was set for each factor to a fixed value of 1.0.
The goodness of fit indices for the baseline model exhibited a robust fit. The chi-square test was statistically insignificant, the chi-square degrees of freedom ratio was extremely favorable (χ2 / df = .603). The other fit indices also gave evidence of a robust fit (RMSEA = .00; NFI = .99; GFI = 99; AGFI = 96).
Managerial communication (ß = .47, p <.001) and intent to remain (ß = .28, p < .001) had a significant and robust relationship with career future and explained 45% of the variance in career future after accounting for job satisfaction, job performance and proactive personality. Proactive personality had a significant relationship with managerial communication (ß = .59, p <.001) and job performance (ß = .28, p < .001) and explained 34% and 38% of the variance respectively after accounting for the remaining variables in the model. Interestingly, proactive personality and managerial communication explained a
Variables M SD 1 2 3 4 5 1 Career Future 3.63 .78 2 Proactive Personality 5.57 .63 .37** 3 Managerial Communication 5.40 1.31 .63** .59** 4 Job Performance 6.34 .66 .31** .52** .57** 5 Intent to remain 5.19 1.30 .55** .39** .57** .35** 6 Job Satisfaction 5.41 .99 .59** .50** .78** .51** .71**
20 American Journal of Management vol. 13(1) 2013

whopping 60% of the variance in job satisfaction after accounting for job performance and intent to remain with the organization.
FIGURE 2 BASELINE MODEL OF THE EFFECT OF PROACTIVE PERSONALITY ON CAREER
FUTURE WITH STANDARDIZED ESTIMATES
Note: PP = Proactive personality; CF = Career Future; JP = Job Performance; MC = Managerial Communication; JS = Job Satisfaction; IR = Intent to remain with the organization
Hypotheses Testing
Hypotheses 1 (managerial communication); 3 (intent to remain with the organization); 5 (job performance) and 6 (job satisfaction), suggested the meditational framework in the relationship between proactive personality and career future. For testing these meditational hypotheses proactive personality
American Journal of Management vol. 13(1) 2013 21
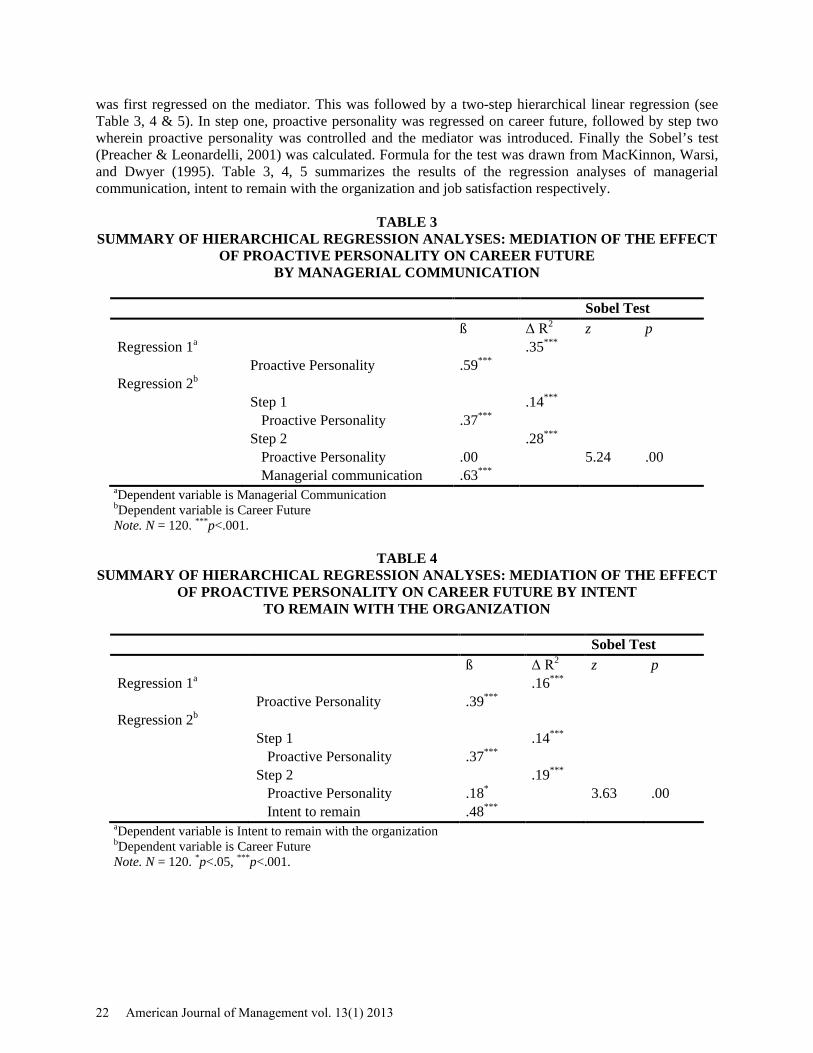
was first regressed on the mediator. This was followed by a two-step hierarchical linear regression (see Table 3, 4 & 5). In step one, proactive personality was regressed on career future, followed by step two wherein proactive personality was controlled and the mediator was introduced. Finally the Sobel’s test (Preacher & Leonardelli, 2001) was calculated. Formula for the test was drawn from MacKinnon, Warsi, and Dwyer (1995). Table 3, 4, 5 summarizes the results of the regression analyses of managerial communication, intent to remain with the organization and job satisfaction respectively.
TABLE 3 SUMMARY OF HIERARCHICAL REGRESSION ANALYSES: MEDIATION OF THE EFFECT
OF PROACTIVE PERSONALITY ON CAREER FUTURE BY MANAGERIAL COMMUNICATION
Sobel Test ß Δ R2 z p Regression 1a .35*** Proactive Personality .59*** Regression 2b Step 1 .14*** Proactive Personality .37*** Step 2 .28*** Proactive Personality .00 5.24 .00 Managerial communication .63***
aDependent variable is Managerial Communication bDependent variable is Career Future Note. N = 120. ***p<.001.
TABLE 4
SUMMARY OF HIERARCHICAL REGRESSION ANALYSES: MEDIATION OF THE EFFECT OF PROACTIVE PERSONALITY ON CAREER FUTURE BY INTENT
TO REMAIN WITH THE ORGANIZATION
Sobel Test ß Δ R2 z p Regression 1a .16*** Proactive Personality .39*** Regression 2b Step 1 .14*** Proactive Personality .37*** Step 2 .19*** Proactive Personality .18* 3.63 .00 Intent to remain .48***
aDependent variable is Intent to remain with the organization bDependent variable is Career Future Note. N = 120. *p<.05, ***p<.001.
22 American Journal of Management vol. 13(1) 2013

TABLE 5 SUMMARY OF HIERARCHICAL REGRESSION ANALYSES: MEDIATION OF THE EFFECT
OF PROACTIVE PERSONALITY ON CAREER FUTURE BY JOB SATISFACTION
Sobel Test ß Δ R2 z p Regression 1a .25*** Proactive Personality .50*** Regression 2b Step 1 .14*** Proactive Personality .37*** Step 2 .22*** Proactive Personality .10 4.47 .00 Job Satisfaction .55***
aDependent variable is Job Satisfaction bDependent variable is Career Future Note. N = 120. ***p<.001.
As shown in Table 3, the regression coefficient for managerial communication was significant in
contributing to career future when proactive personality was controlled indicating the mediating role of managerial communication (ß = .63, p = .001; R2∆ = .28, p = .00). In step 2 proactive personality was insignificant thereby indicating that managerial communication completely mediated the relationship between proactive personality and career future. The Sobel test revealed significant evidence for meditational role of managerial communication, z = 5.24, p = .00.
Similarly for hypotheses 3 and 6 significant evidence (as seen in Table 4 & 5 respectively) was found for the mediating role of intent to remain with the organization (ß = .48, p = .001; R2∆ = .19, p = .00) and job satisfaction (ß = .55, p = .001; R2∆ = .22, p = .00). In case of intent to remain the statistical significance of proactive personality reduced in step 2, confirming partial mediation. However, in case of job satisfaction, proactive personality was insignificant in step 2 indicating complete mediation. Sobel test was calculated and provided further evidence for the meditational role of intent to remain (z = 3.63, p = .04); and job satisfaction (z = 4.47, p = .000).
Hypothesis 5 which proposed the meditational role of job performance was not significant when proactive personality was introduced in the second step.
The regression coefficient for the interaction term between proactive personality/managerial communication and proactive personality/intent to remain was insignificant and hence hypotheses 2 and 4 respectively were not supported. DISCUSSION
The present study aimed at empirically testing a conceptual model and delineating the process/ mechanism through which proactive personality affects career future through managerial communication, job performance, job satisfaction and intent to remain with the organization. Managerial communication and intent to remain had a robust relationship with career future and explained 45% of the variance. Intent to remain with the organization partially mediated while managerial communication and job satisfaction completely mediated the relationship between proactive personality/career future. This study contributes to both the fields of proactive personality and careers and the results are useful for both academicians as well as practitioners.
American Journal of Management vol. 13(1) 2013 23

Practical Implications The above findings have several practical implications, especially from an applied perspective this
type of research is important as it gives more insight on how organizations can recognize and leverage from those employees exhibiting proactive personality. There is hardly any doubt that proactive people are an asset to the company, however it is up to the company to ensure that they do not lose such a valuable asset. It is important for proactive employees to be convinced that their career has a future in the company. There is a possibility that in the event of job insecurity and less scope for success proactive personality employees might seek greener pastures. Thus it is of vital importance that employers should make sure that their proactive employees are assured that they will progress in their career within the organization. The results of this study have specifically provided strong evidence for the importance of managerial communication and job satisfaction. It is therefore vital that organizations provided employees with as much information about the change and encourage a two way communication. Additionally, they should be provided with performance feedback and discuss their job satisfaction to assure they are satisfied with their job and their work performance. Last but not the least, an interesting finding of this study was that if employees intend to remain with the company they will work towards building a career in the same company. It would greatly help if such employees received career counseling so that they could achieve their career goals and be able to take advantage of the opportunities within the company. Limitations of the Study
Data for this study was collected anonymously. Although limiting any inference of causality among the study variables, protecting respondents’ anonymity provided benefits by potentially reducing the method bias (see P. M. Podsakoff, MacKenzie, Lee, & N. P. Podsakoff, 2003).
Another limitation was related to common method variance as the data was collected in one sitting—the survey included both the criterion and the predictor variables. P. M. Podsakoff, MacKenzie, Lee, and N. P. Podsakoff (2003) mentioned that one of the most common variables assumed to cause common method variance is the tendency for participants to respond in a socially desirable manner. They argue that respondents may have less evaluation apprehension and therefore are less likely to edit their responses to be more socially desirable when anonymity is assured. In the present study the responses were completely anonymous thereby protecting the respondent’s identity. Although this does not completely eradicate the problem of common method bias but it does alleviate it. This is a particularly important aspect as different organizations have varied levels of distrust and uncertainty (Buono & Bowditch, 1989), which may lead to biased responses if participants believe their identity, could be revealed to management. This, in turn, may result in a less of internal validity if respondents are hesitant to provide honest responses to the surrey questions for fear of repercussion (Green & Feild, 1976).
Data was collected using the snow-ball method and hence it was difficult to avoid impending confounding factors, such as type of industry, resources, and markets (Pritchard et al, 1988; Mukherjee, Lapre’, & Wassenhove, 1998).
In this study no support was found for moderator framework of managerial communication and intent to remain with the organization. One of the possible reasons could be due to the fact that data for this study were collected via self-report measures to assess both the predictors and outcome variables thereby raising concerns about common method variance (Spector, 2006). This poses a problem especially while detecting interactions as inflated correlations between the independent and the dependent variables reduce power to detect such interactions (Evans, 1985; Schmitt, 1994). Future studies could test these moderators by eliminating this limitation.
Further, the measure of intent to remain with the organization had disappointingly low reliability (α =.68) in this study, suggesting that an alternative measure should be used in future research. Future Research
Following are some ideas for future research. Firstly careers may be subjective—the individual’s internal apprehension and evaluation of his or her career, across any dimensions that are important to that
24 American Journal of Management vol. 13(1) 2013

individual; or objective—individual’s external perspective that describe more or less tangible indicators of the individual’s career situation (Van Maanen, 1977, p. 9). In the present study we did not take into consideration this aspect of career, hence future research could replicate this study by measuring career future both subjectively and objectively.
A natural extension of this study is to replicate it in the U.S. and conduct a cross-cultural study between the US and the Israeli sample. The study could also be replicated by comparing data across cultures such as Japan. Japanese employees exhibit higher work centrality, and give greater importance to job security and stability than do employees in the U.S. (England & Misumi 1986; Lundberg & Peterson 1994).
Further it would be interesting to observe how the results of this study vary across demographic variables especially age. Although in the present study we collected data for age we hardly had any variation in the age as a major portion of the respondents were either above 40 or 50 years. Age plays an important role especially in today’s dynamic and ever-changing environment with older workers being more resistant to changes in job. They tend to worry that they may have to start afresh especially if there is no significant value for their job experience of past working skills (Campbell & Cellini 1981; Hansson et al. 1997). Another important demographic variable is workforce diversity as careers have changed with increased workforce diversity (England & Farkas 1986; England, Reid, & Kilbourne 1996; Johnston & Packer 1987).
Crant (2000) aptly states the importance of proactive personality which can be rightly applied to an organization undergoing change—as change relates to dynamism and uncertainty: “As work becomes more dynamic and decentralized, proactive behavior and initiative become even more critical determinants of organizational success” (p. 435). This study provides an initial attempt to delineate the mechanism by which proactive personality affects career through certain job–related outcomes. The “bottom line” is to send across a message to organizations to value one of their most important assets—its proactive employees especially in a competitive and ever changing world where employees undoubtedly form the core competency of the company. REFERENCES Aiken, L. S., & West, S.G. (1991). Multiple regression: Testing and interpreting interactions. Newbury Park, CA: Sage. Alexander, J. A., Lichtenstein, R., Joo Oh, H., & Ullman, E. (1998). A causal model of voluntary turnover among nursing personnel in long-term psychiatric settings. Research in Nursing and Health, 21, 415–427. Anderson, J. C., & Gerbing, D. W. (1988). Structural equation modeling in practice: A review and recommended two-step approach. Psychological Bulletin, 103, 411-423. Antonacopoulou, E. (2000). Employee development through self-development in three retail banks. Personnel Review, 29(4), 491-508. Armenakis, A. A., & Harris, S. (2002). Crafting a change message to create transformational readiness. Journal of Organizational Change Management, 15(2), 169-183. Baron, R. M., & Kenny, D. A. (1986). The moderator–mediator variable distinction in social psychological research: Conceptual, strategic, and statistical considerations. Journal of Personality and Social Psychology, 51, 1173-1182. Bartol, K. M. (1979). Individual versus organizational predictors of job satisfaction and turnover among professionals. Journal of Vocational Behavior, 15, 55-67.
American Journal of Management vol. 13(1) 2013 25

Bateman, T. S., & Crant, J. M. (1993). The proactive component of organizational behavior. Journal of Organizational Behavior, 14(2), 103-118. Bateman, T. S., & Crant, J. M. (1999). Proactive behavior: Meanings, impact, and recommendations. Business Horizons, 42 (3), 63–70. Becherer, R.C., & Maurer, J.G. (1999). The proactive personality disposition and entrepreneurial behavior among small company presidents. Journal of Small Business Management, 38 (1), 28–36. Bedeian, A., Kemery, E. & Pizzolatto, A. (1991). Career commitment and expected utility of present job as predictors of turnover intentions and turnover behavior, Journal of Vocational Behavior, 39(3), 331-43. Bell, N.E., & Staw, B.M. (1989). People as sculptors versus sculpture: The roles of personality and personal control in organizations. In M.B. Arthur, D.T. Hall, & B.S., Lawrence, (Eds.), The handbook of career theory (pp. 232–251). Cambridge, England: Cambridge University Press. Berger, P. K., & Grimes, A. J. (1973). Cosmopolitan-local: A factor analysis of the construct. Academy of Management Journal, 16, 187-206. Bowling, N. A., Beehr, T. A., Wagner, S. H., & Libkuman, T. M. (2005). Adaptation-level theory, opponent process theory and dispositions: An integrated approach to the stability of job satisfaction. Journal of Applied Psychology, 90, 1044-1053. Brown, D. J., Cober, R. T., Kane, K., Levy, P. E., & Shalhoop, J. (2006). Proactive personality and the successful job search: A field investigation with college graduates. Journal of Applied Psychology, 91(3), 717-726. Buono, & Bowditch, J. (1989). The human side of mergers. San Francisco: Jossey-Bass Inc. Buss, D. M. (1987). Selection, evocation and manipulation. Journal of Personality and Social Psychology, 53, 1214-1221. Campbell, D.J. (2000). The proactive employee: Managing workplace initiative. Academy of Management Executive, 14(3), 52–66. Campbell, R. E., & Cellini, J. V. (1981). A diagnostic taxonomy of adult career problems. Journal of Vocational Behavior, 19, 175-190. Cappelli, P. (1999). The new deal at work: Managing the market-driven workforce. Boston, MA: Harvard Business School Press. Chan, D. (2006). Interactive effects of situational judgment effectiveness and proactive personality on work perceptions and work outcomes. Journal of Applied Psychology, 91(2), 475-481. Claes, R., & Ruiz-Quintanilla, S.A. (1998). Influences of early career experiences, occupational group, and national culture on proactive career behavior. Journal of Vocational Behavior, 52, 357–378. Clampitt, P., & Downs, C. (2004). Downs-Hazen communication satisfaction questionnaire. In C. Downs & A. Adrian (Eds.), Assessing organizational communication. New York: The Guilford Press.
26 American Journal of Management vol. 13(1) 2013

Cohen, J., Cohen, P., West, S.G., & Aiken, L.S. (2003).Applied multiple regression/correlation analysis for the behavioral sciences. (3rd ed.). Mahwah, NJ: Erlbaum. Cook, J. D., Hepworth, S. J., Wall, T. D., & Warr, P. B. (1981). The experience of work: A compendium of 249 measures and their use. London: Academic Press. Items were taken from 42-45. Coovert, M.D. (1995). Technological changes in office jobs. In A. Howard (Ed.) Changing Nature of Work, (pp. 173-208). San Francisco: Jossey-Bass. Cotton, J.L. & Tuttle, J.F. (1986). Employee turnover: A meta-analysis and review with implications for research. Academy of Management Review, 11(1), 55-70. Crant, M. J. (1995). The proactive personality scale and objective job performance among real estate agents. Journal of Applied Psychology, 80, 532-537. Crant, M. J. (1996). The proactive personality scale as a predictor of entrepreneurial intentions. Journal of Small Business Management, 34, 42-49. Crant, J. M. (2000). Proactive behavior in organizations. Journal of Management, 26, 435-462. Crant, M. J., & Bateman, T. S. (2000). Charismatic leadership viewed from above: The impact of proactive personality. Journal of Organizational Behavior, 21, 63-75. Crino, M. D., & White, M. (1981). Satisfaction in communication: An examination of the Downs-Hazen measure. Psychological Reports, 49, 831-838. Diener, E., Larsen, R.J., & Emmons, R.A. (1984). Person × situation interactions: Choice of situations and congruence response models. Journal of Personality and Social Psychology, 47, 580–592. Downs, C. W., & Hazen, M. (1977). A factor analysis of communication satisfaction. Journal of Business Communication, 14, 63-74. Dunham, R. B., & Smith, F. J. (1979). Organizational surveys. Glenview, IL: Scott, Foresman. Eisenberger, R., Cummings, J., Armeli, S., Lynch, P. (1997). Perceived organizational Support, Discretionary Treatment, and Job Satisfaction. Journal of Applied Psychology, 82, 812-820. England, P., & G. Farkas. (1986). Households, employment and gender. New York: 89Aldine Publishing Co. England, P., & Misumi, J. (1986). Work centrality in Japan and the United States. Journal of Cross-Cultural Psychology, 17, 399-416. England, P., Reid, L. L., & Kilbourne, B. S. (1996). The effect of the sex composition of jobs on starting wages in an organization: Findings of the NLSY. Demography 33(4), 511-521. Erdogan, B., & Bauer, T. N. (2005). Enhancing career benefits of employee proactive personality: The role of fit with jobs and organizations. Personnel Psychology, 58, 859–891. Frazier, P. A., Tix, A.P., & Barron, K. E. (2004). Testing moderator and mediator effects in counseling psychology. Journal of Counseling Psychology. 51(1), 115-134
American Journal of Management vol. 13(1) 2013 27

Freeman, C., Soete, L., & Efendioglu, U. (1995). Diffusion and the employment effects of information and communication technology. International Labour Review 134(4/5), 587-603. Frese, M., & Fay D. (2001). Personal initiative: An active performance concept for work in the 21st century. Research in Organizational Behavior, 23, 133–187. Frese, M., Kring, W., Soose, A. & Zempel, J. (1996). Personal initiative at work: Differences between east and west germany. Academy of Management Journal, 39, 37–63. Frese, M., & Zapf, D. (1994). Action as the core of work psychology: A german approach. In H. C. Triandis, M. D. Dunnette, & J. M. Hough (Eds.), Handbook of industrial and organizational psychology (Vol. 4, 2nd ed., pp. 271-340). Palo Alto, CA: Consulting Psychologists Press. Gray, J., & Laidlaw, H (2004). Improving the measurement of communication satisfaction. Management Communication Quarterly, 17(3), 425-448. Green, S, & Feild, H. (1976). Assessing group change under conditions of anonymity: A problem in personal research. Journal of Occupational Psychology, 49, 155-159. Hacker, W., Skell, W., & Straub, W. (1968). Arbeitspychologie und wissenschaftlich-techische revolution [Work psychology and scientific-technologic revolution]. Berlin, Germany: Deutscher Verlag der Wissenschaften. Hair, J., Anderson, R., Tatham, R., & Black, W. (1998). Multivariate data analysis (5th ed.). Upper Saddle River, NJ: Prentice-Hall. Hall, D. (1996a). The career is dead, long live the career. San Francisco: Jossey-Bass. Hall, D. (1996b). Protean careers of the 21st century. Academy of Management Executive. 10, 8–16. Hall, D. T., & Mirvis, P. H. (1995). The new career contract: Developing the whole person at midlife and beyond. Journal of Vocational Behavior, 47, 269– 289. Hansson, R.O., DeKoekkoek, P.D., Neece, W.M., Patterson, D.W. (1997). The older worker and transitions to retirement. Journal of Vocational Behavior, 51, 202–233. Harrell, A., Chewning, E., & Taylor, M. (1986). Organizational-professional conflict and the job satisfaction and turnover intentions of internal auditors, Auditing: A Journal of Practice & Theory, 5(2), 109-121. Holland, J. L. (1996). Exploring careers with a typology: What we have learned and some new directions. American Psychologist, 51, 397–406. Holland, J. L., & Gottfredson, G. D. (1994). Career attitudes and strategies inventory: An inventory for understanding adult careers. Odessa, FL: Psychological Assessment Resources. Howard, A. (Ed.) (1995). The changing nature of work. San Francisco: Jossey-Bass. Hu. L. T., & Bentler, P. (1999). Cutoff criteria for indices in covariance structure analysis: Conventional criteria versus new alternatives. Structural Equation Modeling, 10, 128-141.
28 American Journal of Management vol. 13(1) 2013
Jackson, C. (1996). Managing and developing a boundaryless career: Lessons from dance and drama. In P. Herriot and R. Strickland (Eds.). The management of careers [Special issue]. European Journal of Work and Organizational Psychology, 5(4), 617–628. Jauch, L. R., Osborn, R. N., & Terpening, W. D. (1980). Goal congruence and employee orientations: The substitution effect. Academy of Management Journal, 23, 544–550. Johnston, W., & A. E. Packer. (1987). Work force 2000: Work and workers for the 21st century. Indianapolis, IN: The Hudson Institute. Jöreskog, K. G., & Sörbom, D. (1993). Lisrel 8: Structural equations modeling with the SIMPLIS command language. Chicago: Scientific Software International. Judge, T. A., & Bretz, R. D. (1994). Political influence behavior and career success. Journal of Management, 20, 43-66. King, Z. (2004). Career self-management: Its nature, causes and consequences. Journal of Vocational Behavior, 65, 112-133.Kirkman, B.L., & Rosen, B. (1999). Beyond self-management: Antecedents and consequences of team empowerment. Academy of Management Journal 42, 58–74. Kline, R. B. (2005). Principles and practice of structural equation modeling (2nd ed.). New York: The Guilford Press. Latham, G. P., & Yukl, G. A. (1975). A review of research on the application of goal setting in organizations. Academy of Management Journal, 18, 824–845. Lee, T.W., & Johnson, D. R. (1991).The effects of work schedule and employment status on the organizational commitment and job satisfaction of full versus part time employees. Journal of Vocational Behavior, 38, 208-224. Lewis, L. (1999). Disseminating information and soliciting input during planned organizational change: Implementers’ targets, sources, and channels for communication. Management Communication Quarterly, 13(1), 43-77. Lounsbury J. W., Park, S. H., Sundstrom, E, Williamson, J. M, & Pemberton, A. E. (2004). Personality, career satisfaction, and life satisfaction: Test of a directional model. Journal of Career Assessment, 12, 395–406. Lundberg, C. D., & Peterson, M. F. (1994). The meaning of working in the U.S. and Japanese local governments at three different hierarchical levels. Human Relations, 47(12), 1459-1487. MacKinnon, D. P., Warsi, G., & Dwyer, J. H. (1995). A simulation study of mediated effect measures. Multivariate Behavioral Research, 30(1), 41-62. Marsh, H. W., Balla, J. R., & Hau, K. T. (1996). An evaluation of incremental fit indexes: A clarification of mathematical and empirical properties. In G. A. Marcoulides & R. E. Schumacker (Eds.), Advanced structural equation modeling techniques (pp.315-353). Mahwah, NJ: Lawrence Erlbaum. Maurer, T. J., & Tarulli, B. A. (1994). Investigation of perceived environment, perceived outcome, and person variables in relationship to voluntary development activity by employees. Journal of Applied Psychology, 79, 3–14.
American Journal of Management vol. 13(1) 2013 29

McLain, D.L. (1995), Response to health and safety risk in the work environment. Academy of Management Journal, 38(6), 1726-1746. Mobley, W.H., Griffeth, R.W., Hand, H.H. & Meglino, B.M. (1979). Review and conceptual analysis of the employee turnover process. Psychological Bulletin, 86, 493-522. Mukherjee, A.S., M.A. Lapre, L.N. Van Wassenhove (1998). Knowledge driven quality improvement. Management Science 44(11), S35-S49. Neter, J., Wasserman, W., & Kutner, M. H. (1983). Applied linear regression models. Homewood, IL: Irwin. Parker, S. K. (2000). From passive to proactive motivation: The importance of flexible role orientations and role breadth self-efficacy. Applied Psychology: An International Review, 49, 447-469. Parker, S. K., & Sprigg, C. A. (1999). Minimizing strain and maximizing learning: The role of job demands, job control, and proactive personality. Journal of Applied Psychology, 84, 925-939. Parker, S. K., Wall, T. D., & Jackson, P. R. (1997). “That's not my job”: Developing flexible employee work orientations. Academy of Management Journal, 40, 899- 929. Pincus, J. D. (1986). Communication satisfaction, job satisfaction, and job performance. Human Communications Research, 12(3), 395-419. Podsakoff, P., MacKenzie, S., Lee, J., & Podsakoff, N. (2003). Common method biases in behavioral research: A critical review of the literature and recommended remedies. Journal of Applied Psychology, 88(5), 879-903. Preacher, K. J., & Leonardelli, G. J. (2001). Calculation for the sobel test: An interactive calculation tool for mediation tests. From http://www.unc.edu/~preacher/sobel/sobel.htm Price, J.L. & Mueller, C.W. (1981). A causal model of turnover for nurses. Academy of Management Journal, 24, 543-565. Pritchard, R. D., S. D. Jones, P. Roth, K. Steubing, & S. Ekeberg (1988). Effects of group feedback, goal setting, and incentives on organizational productivity. Journal of Applied Psychology, 73(2), 337-358. Robinson, S. L. (1996). Trust and breach of the psychological contract. Administrative Science Quarterly, 41, 574-599. Rosenthal, N.H. (1995). The nature of occupational employment growth: 1983-93. Monthly Labor Review 118(6), 45-54. Rotondi, T. J. (1975). Organizational identification: Issues and implications. Organizational Behavior and Human Performance, 13, 95-109. Seibert, S. E., Crant, J. M., & Kraimer, M. L. (1999). Proactive personality and career success. Journal of Applied Psychology, 84, 416-427.
30 American Journal of Management vol. 13(1) 2013

Seibert, S. E., Kraimer, M. L., & Crant, J. M. (2001). What do proactive people do? A longitudinal model linking proactive personality and career success. Personnel Psychology, 54, 845-874. Smart, R., & Peterson, C. (1994). Stability versus transition in women’s career development. Journal of Vocational Behavior, 45, 241–260. Spector, P. E. (1997). Job satisfaction: Application, assessment, causes, and consequences. Thousand Oaks, CA: Sage Publications, Inc. Sullivan, S. E., Carden, W. A., & Martin, D. F. (1998). Careers in the next millennium: Directions for future research. Human Resource Management Review. 8(2), 165-185. Taylor, M.S., Tracy, K.B., Renard, M.K., Harrison, J.K., & Carroll, S.J. (1995). Due process in performance appraisal: A quasi-experiment in procedural justice. Administrative Science Quarterly, 40(3), 495-523. Thompson, J. A. (2005). Proactive personality and job performance: A social capital perspective. Journal of Applied Psychology, 88(5), 879-903. Van der Spiegel, J. (1995). New information technologies and changes in work. In A. Howard (Ed.), Changing Nature of Work (pp. 97-111). San Francisco: Jossey- Bass. Van Maanen, J. (1977). Introduction: The promise of career studies. In J. Van Maanen (ed.), Organizational careers: Some new perspectives (pp. 1-12). New York: Wiley. Williams, L. J., & Anderson, S. E. (1991). Job satisfaction and organizational commitment as predictors of organizational citizenship and in-role behaviors. Journal of Management, 17(3), 601-617.
American Journal of Management vol. 13(1) 2013 31

Does Fitness and Exercises Increase Productivity? Assessing Health, Fitness and Productivity Relationship
Mansour Sharifzadeh
California State Polytechnic University Pomona
As the American workforce increases, so does its waistline. It is estimated that 64% of the adults in the United States are obese, with nearly 9 million children age six and older becoming obese. With obesity come serious health problems such as heart disease, diabetes, hypertension and high blood pressure. Americans are faced with the challenge of trying to manage a higher cost of living that requires them to work more hours. They have to deal with the fact that an increase in the hours they work takes time away from their time to cook, which leads to unhealthy fast food choices and even less time to exercise. Employers are investing large amounts in employee fitness programs, but the value of physical exercise and lifestyle has yet to be established. This paper provides a critique of the applied and experimental research related to the impact of the employee fitness programs on work-related variables and discusses future research directions. More and more companies either are planning or have developed physical fitness programs for their employees. In the United States approximately 55,000 companies are involved in employee fitness and promote physical activities. INTRODUCTION
The scope of employee fitness programs ranges from the company paying for memberships at a private fitness club to complete on- site fitness facilities. These programs cost anywhere from $2000 to millions. Organizations that support these programs consider them as an inexpensive benefit that produces the following returns: 1) increased ability to attract competent employees, 2) improved attitudes and loyalty, and 3) increased employee productivity. The current idea has always been that there is a relationship between fitness and productivity, but is this relationship a reality? The belief that there is a relationship can easily be rationalized without much thought, as many jobs do require physical skills. Therefore, if a person is fit, he/she will be able to handle more physically demanding tasks, such as carrying more weight, or working longer and harder without having to take as many breaks. However, in today’s job market, most jobs require little or no physical exertion. Therefore fitness and productivity are not really related. For instance in an office job, would an athlete be any more productive than one who is overweight, or even obese? When productivity is measured, it can be measured in both absenteeism and presenteeism. Absenteeism is the loss of productivity due to absence, while presenteeism is the loss of productivity while present. Presenteeism is a better measure of pure productivity as it measures how productive someone is while they are working, as opposed to the loss of productivity from vacations, sick days, and lateness. The majority of scholarly articles hold the belief that there is a relationship between fitness and productivity. If fitness could be increased through some type of fitness program, there would be a noticeable increase in productivity.
32 American Journal of Management vol. 13(1) 2013

Other articles suggest that there is a relationship between fitness and productivity, yet only in the extreme cases. Still other articles suggest that a relationship may exist, but it cannot be proven without more research. REVIEW OF THE LITERATURE Aghop Der-Karabetian, University of La Verne, and Norma Gebharbp, General Dynamics, conducted a study to measure job satisfaction, body image, and sick days for those who exercised and those who did not. They selected two groups from a large Southern California company. The first group participated in a physical fitness program for six months. The three variables— job satisfaction, body image, and sick days— were measured at the start of this program and again six months later. The second group was used as a control group, to make sure no major external factors affected the variables. They found that after the six months’ time the employees who participated in the fitness program had a higher job satisfaction and body image, and had less sick days than the control group. They then suggested that every company should focus on employee fitness since it reduces absenteeism (sick days), and increases morale of the employees which will increase productivity. (Der-Karabetian and Gebharbp, Effect of Physical Fitness Program in the Workplace, Journal of Business and Psychology) Mills PR, Kessler RC, Cooper J, and Sullican S wrote in their article Impart of a Health Promotion Program on Employee Health Risks and Work Productivity that being part of a company’s fitness program increased productivity levels. This survey consisted of a variable group (n=266) and a control group (n=1242). The variable group was placed in a multi-component health promotion program which showed participants their health risks, a personalized health improvement plan, literature, and lectures focused on health improvement. Using the World Health Organization health and work performance questionnaire they concluded that those enrolled in the multi-component health promotion program reduced their health risks by 0.45, lowered their monthly absenteeism days by 0.36, and had a mean increase on the work performance scale of 0.79. These results suggest that implementing a multi-component health promotion program to increase the fitness levels of its participants, would also make noticeable differences in health risks and productivity. Wayne N. Burton MD, Katherine T. McCalister EdD, Chin-Yu Chen PhD, and Dee W. Edington PhD conducted a study in which they surveyed both people enrolled (n=854) and not enrolled in a company’s fitness center (n=4543), and asked questions based on their productivity in the workplace. They concluded that those employees who were not participating in their company’s fitness program reported higher loss of productivity due to time management, physical difficulty of the work, limitations of output, and overall loss of productivity than comparables of the same race, age, gender, and work location who were enrolled in their company’s fitness center. (The Association of Health Status, Worksite Fitness Center Participation, and Two Measures of Productivity) Christopher P. Neck and Kenneth H. Cooper believe that the higher one’s fitness is, the higher their productivity will be. They mention in their article “The fit executive: Exercise and diet guidelines for enhancing performance”, many studies which show that fitness and work productivity are related. In one study by Frew, D. R. & Brunning that measured improved productivity and job satisfaction with enrollment in an employee exercise program, commercial real estate stock brokers who participated in an aerobics program for 12 weeks had higher sales than their comparable brokers during and after the 12-week aerobic program. Another study which looked at 56 college professors, noticed that the physically active professors were able to retain information better, as well experience slower decline in memory with age. (Research Quarterly For Exercise and Sport, 64(2):144-151). Paul L. Lloyd, Lloyd & Associates and Sandra L. Foster, Success at Work suggest that there is a relationship between fitness and productivity only when fitness is extremely low. For example someone who is extremely obese, or someone who had severe diabetes, or even someone who had heart disease needs to worry about loss of productivity; yet someone who is slightly overweight, or is not fit will experience no loss of productivity. They suggest that lack of fitness is a major health risk and it could affect workplace productivity.
American Journal of Management vol. 13(1) 2013 33
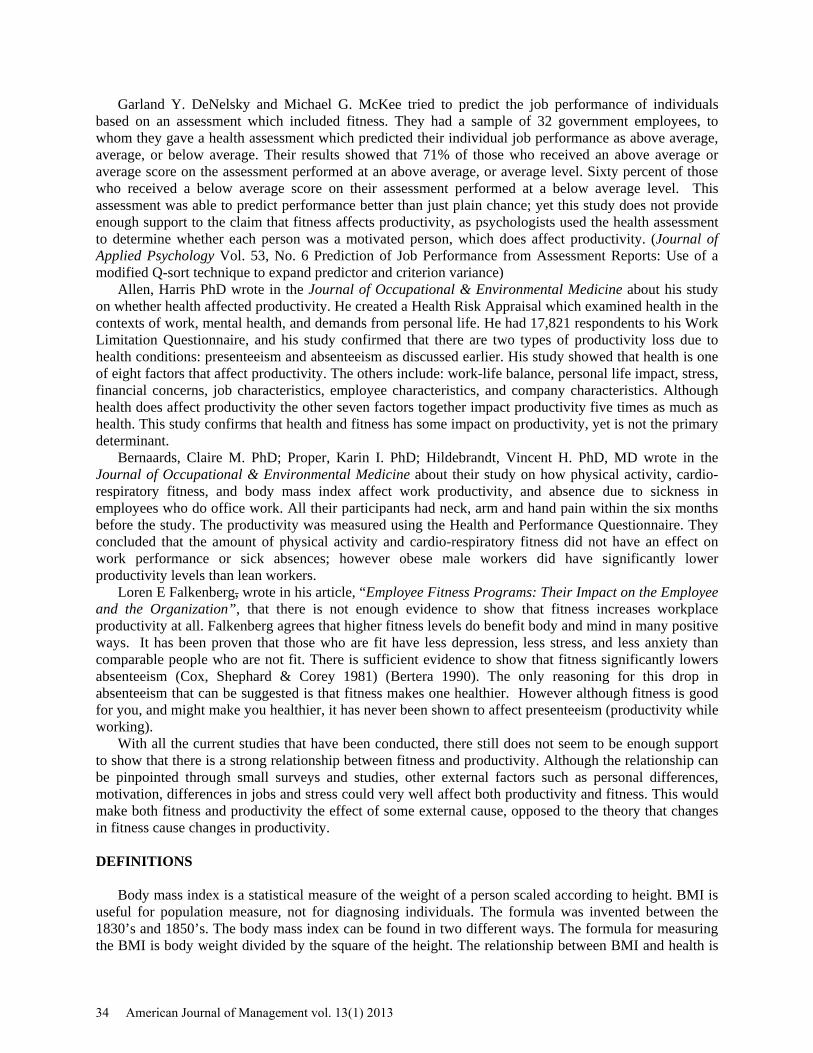
Garland Y. DeNelsky and Michael G. McKee tried to predict the job performance of individuals based on an assessment which included fitness. They had a sample of 32 government employees, to whom they gave a health assessment which predicted their individual job performance as above average, average, or below average. Their results showed that 71% of those who received an above average or average score on the assessment performed at an above average, or average level. Sixty percent of those who received a below average score on their assessment performed at a below average level. This assessment was able to predict performance better than just plain chance; yet this study does not provide enough support to the claim that fitness affects productivity, as psychologists used the health assessment to determine whether each person was a motivated person, which does affect productivity. (Journal of Applied Psychology Vol. 53, No. 6 Prediction of Job Performance from Assessment Reports: Use of a modified Q-sort technique to expand predictor and criterion variance) Allen, Harris PhD wrote in the Journal of Occupational & Environmental Medicine about his study on whether health affected productivity. He created a Health Risk Appraisal which examined health in the contexts of work, mental health, and demands from personal life. He had 17,821 respondents to his Work Limitation Questionnaire, and his study confirmed that there are two types of productivity loss due to health conditions: presenteeism and absenteeism as discussed earlier. His study showed that health is one of eight factors that affect productivity. The others include: work-life balance, personal life impact, stress, financial concerns, job characteristics, employee characteristics, and company characteristics. Although health does affect productivity the other seven factors together impact productivity five times as much as health. This study confirms that health and fitness has some impact on productivity, yet is not the primary determinant. Bernaards, Claire M. PhD; Proper, Karin I. PhD; Hildebrandt, Vincent H. PhD, MD wrote in the Journal of Occupational & Environmental Medicine about their study on how physical activity, cardio-respiratory fitness, and body mass index affect work productivity, and absence due to sickness in employees who do office work. All their participants had neck, arm and hand pain within the six months before the study. The productivity was measured using the Health and Performance Questionnaire. They concluded that the amount of physical activity and cardio-respiratory fitness did not have an effect on work performance or sick absences; however obese male workers did have significantly lower productivity levels than lean workers. Loren E Falkenberg, wrote in his article, “Employee Fitness Programs: Their Impact on the Employee and the Organization”, that there is not enough evidence to show that fitness increases workplace productivity at all. Falkenberg agrees that higher fitness levels do benefit body and mind in many positive ways. It has been proven that those who are fit have less depression, less stress, and less anxiety than comparable people who are not fit. There is sufficient evidence to show that fitness significantly lowers absenteeism (Cox, Shephard & Corey 1981) (Bertera 1990). The only reasoning for this drop in absenteeism that can be suggested is that fitness makes one healthier. However although fitness is good for you, and might make you healthier, it has never been shown to affect presenteeism (productivity while working). With all the current studies that have been conducted, there still does not seem to be enough support to show that there is a strong relationship between fitness and productivity. Although the relationship can be pinpointed through small surveys and studies, other external factors such as personal differences, motivation, differences in jobs and stress could very well affect both productivity and fitness. This would make both fitness and productivity the effect of some external cause, opposed to the theory that changes in fitness cause changes in productivity. DEFINITIONS Body mass index is a statistical measure of the weight of a person scaled according to height. BMI is useful for population measure, not for diagnosing individuals. The formula was invented between the 1830’s and 1850’s. The body mass index can be found in two different ways. The formula for measuring the BMI is body weight divided by the square of the height. The relationship between BMI and health is
34 American Journal of Management vol. 13(1) 2013

that medical professional’s use the BMI test to determine if a person is physically active or inactive. Then based on their results they can determine if their current weight is healthy for them. When an individual’s BMI is below 18.5 it commonly means the person is underweight (when a person’s BMI is below 17.5 they are classified as anorexic). When the BMI is between 18.5 and 25 it means the person is at their optimal weight. The BMI of above 25 shows that the person is overweight, and when a person’s BMI is 30 or above the person is obese (when BMI is 40 it is called morbidly obese). If the BMI were above or below the optimal zone it would reflect the current health as being good or not good.
Productivity is the measure of output from a production process per unit of input. The emphasis is on quantitative output and sometimes on input. Productivity accounts for monetary values of what is being produced and the cost of inputs being used. The formula used to determine the productivity is: “Total productivity equals output quantity divided by input quantity”. There are a variety of methods to determine the level of productivity. A common way of increasing productivity is by using computers and machines to perform more tasks for the company. The company will increase productivity because they will not have to pay employees to do the work the computer or machines are completing. The average person uses the word productivity to describe the effectiveness and ability to obtain goals for a day or a set time period. Productivity is important to management because their job is to be sure that productivity increases or stays constant. The management team has the job of making sure that workers are working effectively and that they are doing their job. Fitness is comprised of general fitness and specific fitness and is defined as the capacity to carry out the day’s activities without undue fatigue. It is the measure of the body’s ability to function efficiently and effectively in work and leisure activities, to be healthy, and to resist emergency situations. There are different levels of fitness that must be incorporated to be considered fit. The following are taken into consideration: cardiovascular, strength, muscular endurance, flexibility, and body composition. Also, the mental or emotional health as well as the age or bone structure of the individual should be taken into consideration. If a person is active on a daily basis and has good eating habits, that could help maintain their fitness. People that are fit can be overweight or fat. However, most people that are obese are not fit at all. Most people that are fit are not overweight and are conscious of their physical appearance and their health. Health is defined as optimal functioning with freedom from disease and abnormality. It is a state of complete physical, mental, and social well-being, and not merely the absence of disease or infirmity. A sick person can be fit depending on the sickness. If a person is ill with a disease or disorder they may still be fit in other areas. A person can be productive and unhealthy. Being healthy might be a benefit to being productive but is not a necessity. For example Steve Jobs, the founder of APPLE INC. was very productive during his major illness. Although he was sick he still was working and being productive. RESULTS OF THE FITNESS AND PRODUCTIVITY SURVEY The purpose of this research paper was to show that there is no correlation between fitness and productivity. A questionnaire was developed with 17 questions. The first set of questions measured BMI, the body mass index. The next set of questions measured fitness and health and the last set of questions measured productivity. Questionnaires were sent to 1765 Cal Poly College of Business alumni. A total of 355 people responded to the questionnaire, but only 328 of them were complete.
American Journal of Management vol. 13(1) 2013 35

The majority of the respondents were male, accounting for more than half of the responses totaling to 59.3%. The response from the female population surveyed accounted for only 40.7% of the surveys returned. The total number of responses with all the questions completed was 339 surveys. Only two surveys were returned with one or more incomplete answers.
Respondent were mostly in their 30’s. The youngest one was 22 and the oldest was 74 years old. The second highest category were respondent who were in their 20’s and then those who were in their 50’s.The following table shows the category of the respondent based on their age.
63 were in 20’s 182 were in 30’s 59 were in 40’s 23 were in 50’s 6 were in 60’s 2 were in 70’s
Are you male or female?
a. Male b. Female
36 American Journal of Management vol. 13(1) 2013

As far as how many times they typically exercise, a high percentage of the survey respondents, 43.3% stated that they exercised an average of 2-3 times a week. The next highest portion of respondents, 27.0%, stated that they typically exercised 0-1 times a week. This percentage is close to the portion of respondents, 24.9%, who stated that they exercised 4-5 times a week. There was only a small portion of respondents, 4.2%, who stated that they exercised 6-7 times a week. The smallest portion of respondents, 0.6%, stated that they would work out as much as 8 times or more within a week.
How many times a week do you typically exercise?
a. 0-1 b. 2-3 c. 4-5 d. 6-7 e. 8+
American Journal of Management vol. 13(1) 2013 37

All of the survey respondents stated that they participated in some form of exercise on a weekly basis. The chart above illustrates a breakdown of how long they actually engage in the exercise of their choice. The most significant percent, 27.4 %, stated that their workout was approximately 45-60 min, including warm-up and cool-down. The second largest percent, 22.6%, stated that their entire workout was as long as 60 min+. Next, 18.7 % of the respondents stated that the length of their workout was 30-45min. The second smallest portion of respondents, 16.3%, stated that the duration of the workout was 15-30 min, while the smallest portion of the respondents, 0.5%, stated that their entire workout was only 0-15min. Despite the fact that the survey revealed that 30.8% of the respondents engaged in their choice of exercise for 30 min or less, it also revealed that an overwhelming 50.5% engaged in some form of exercise for 45 min or more.
How long do you typically set aside for exercise? (Including warm-up & cool-down)
a. 0-15 Minutes
b. 15-30 Minutes
c. 30-45 Minutes
d. 45-60 Minutes
e. 60+ Minutes
38 American Journal of Management vol. 13(1) 2013

Please select the highest level of exercise you have achieved in the last week based on perceived
exertion and physical signs a. Very weak- Minimal, no perceptible sign
b. Weak- Feeling of motion
c. Moderate- Warm on cold day, slight sweat on warm day
d. Strong- Sweating but can talk without difficulty
e. Very strong- Heavy sweating, difficulty talking
f. Extremely strong- Maximal feeling of near exhaustion
g. Other
American Journal of Management vol. 13(1) 2013 39
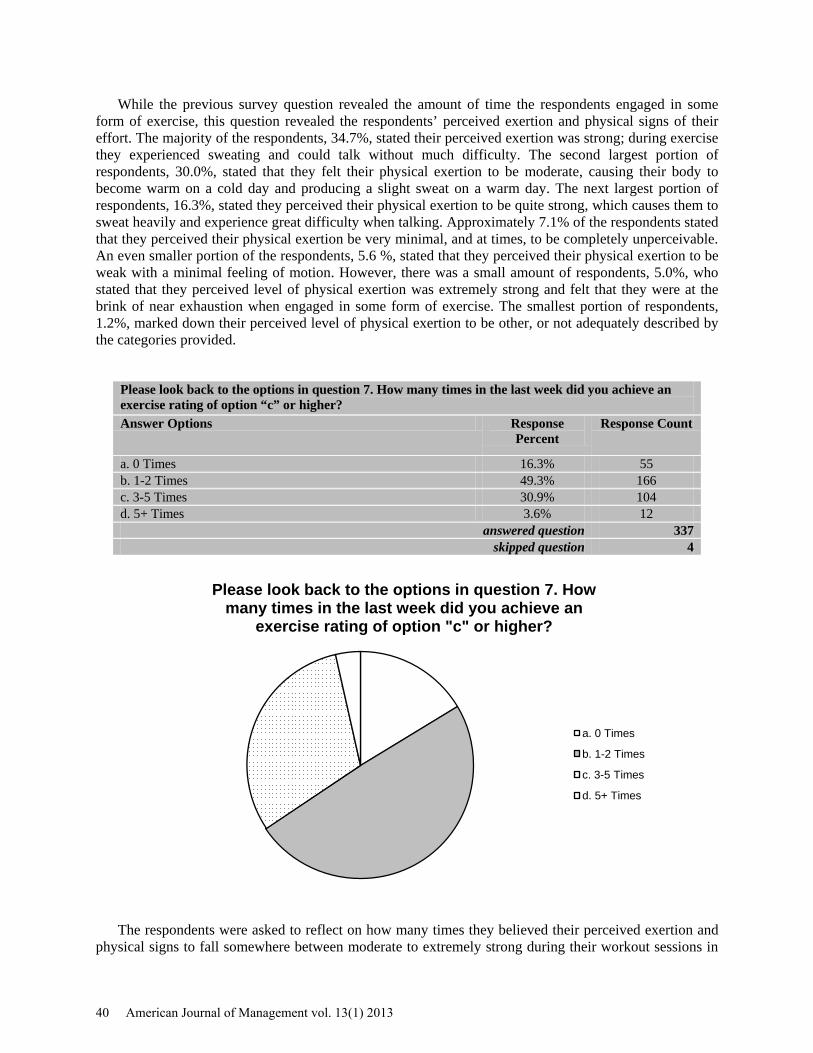
While the previous survey question revealed the amount of time the respondents engaged in some form of exercise, this question revealed the respondents’ perceived exertion and physical signs of their effort. The majority of the respondents, 34.7%, stated their perceived exertion was strong; during exercise they experienced sweating and could talk without much difficulty. The second largest portion of respondents, 30.0%, stated that they felt their physical exertion to be moderate, causing their body to become warm on a cold day and producing a slight sweat on a warm day. The next largest portion of respondents, 16.3%, stated they perceived their physical exertion to be quite strong, which causes them to sweat heavily and experience great difficulty when talking. Approximately 7.1% of the respondents stated that they perceived their physical exertion be very minimal, and at times, to be completely unperceivable. An even smaller portion of the respondents, 5.6 %, stated that they perceived their physical exertion to be weak with a minimal feeling of motion. However, there was a small amount of respondents, 5.0%, who stated that they perceived level of physical exertion was extremely strong and felt that they were at the brink of near exhaustion when engaged in some form of exercise. The smallest portion of respondents, 1.2%, marked down their perceived level of physical exertion to be other, or not adequately described by the categories provided.
Please look back to the options in question 7. How many times in the last week did you achieve an exercise rating of option “c” or higher? Answer Options Response
Percent Response Count
a. 0 Times 16.3% 55 b. 1-2 Times 49.3% 166 c. 3-5 Times 30.9% 104 d. 5+ Times 3.6% 12
answered question 337 skipped question 4
The respondents were asked to reflect on how many times they believed their perceived exertion and physical signs to fall somewhere between moderate to extremely strong during their workout sessions in
Please look back to the options in question 7. How many times in the last week did you achieve an
exercise rating of option "c" or higher?
a. 0 Times
b. 1-2 Times
c. 3-5 Times
d. 5+ Times
40 American Journal of Management vol. 13(1) 2013
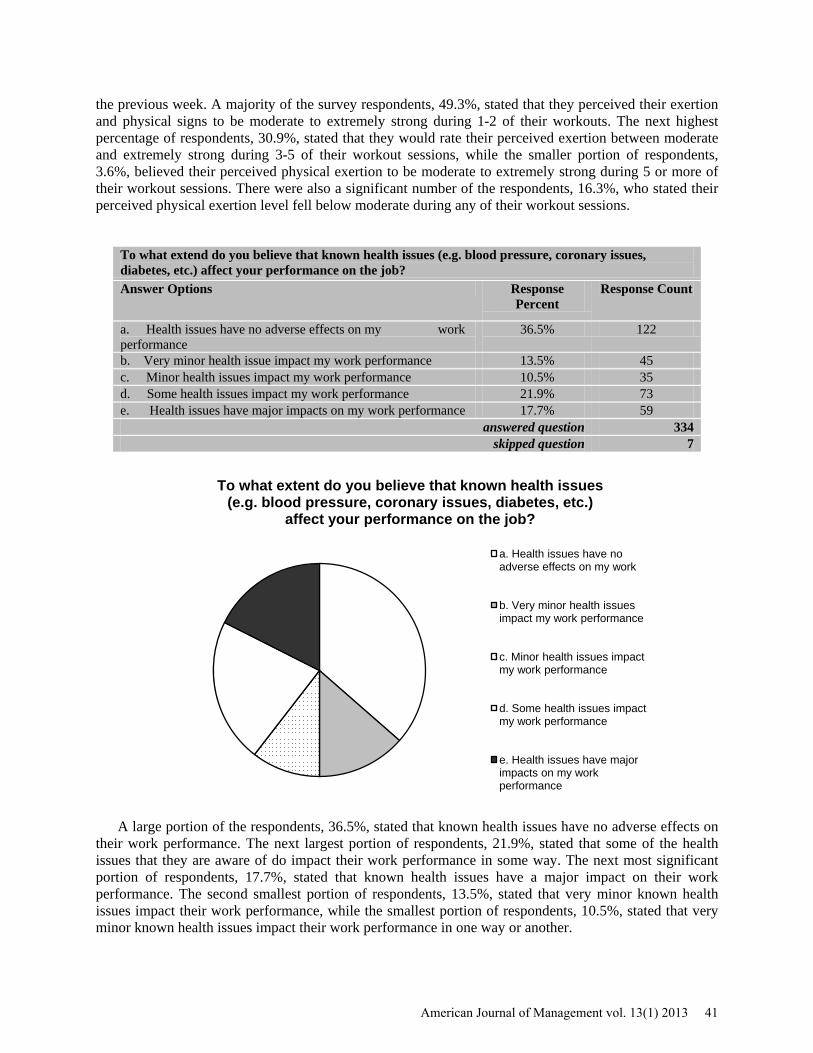
the previous week. A majority of the survey respondents, 49.3%, stated that they perceived their exertion and physical signs to be moderate to extremely strong during 1-2 of their workouts. The next highest percentage of respondents, 30.9%, stated that they would rate their perceived exertion between moderate and extremely strong during 3-5 of their workout sessions, while the smaller portion of respondents, 3.6%, believed their perceived physical exertion to be moderate to extremely strong during 5 or more of their workout sessions. There were also a significant number of the respondents, 16.3%, who stated their perceived physical exertion level fell below moderate during any of their workout sessions.
To what extend do you believe that known health issues (e.g. blood pressure, coronary issues, diabetes, etc.) affect your performance on the job? Answer Options Response
Percent Response Count
a. Health issues have no adverse effects on my work performance
36.5% 122
b. Very minor health issue impact my work performance 13.5% 45 c. Minor health issues impact my work performance 10.5% 35 d. Some health issues impact my work performance 21.9% 73 e. Health issues have major impacts on my work performance 17.7% 59
answered question 334 skipped question 7
A large portion of the respondents, 36.5%, stated that known health issues have no adverse effects on their work performance. The next largest portion of respondents, 21.9%, stated that some of the health issues that they are aware of do impact their work performance in some way. The next most significant portion of respondents, 17.7%, stated that known health issues have a major impact on their work performance. The second smallest portion of respondents, 13.5%, stated that very minor known health issues impact their work performance, while the smallest portion of respondents, 10.5%, stated that very minor known health issues impact their work performance in one way or another.
To what extent do you believe that known health issues (e.g. blood pressure, coronary issues, diabetes, etc.)
affect your performance on the job?
a. Health issues have no adverse effects on my work
b. Very minor health issues impact my work performance
c. Minor health issues impact my work performance
d. Some health issues impact my work performance
e. Health issues have major impacts on my work performance
American Journal of Management vol. 13(1) 2013 41

A large portion of the respondents, 42.4%, stated they would rate their current health to be very good. The next largest portion of respondents, 33.0%, stated they would rate their current health to be good. Out of the respondents left, 14.0% stated that they would rate their current health as excellent, 9.2% stated they would rate it as being fair while the smallest portion of respondents, 1.2%, stated they would rate it to be poor.
How would you rate your current health?
a. Excellent
b. Very Good
c. Good
d. Fair
e. Poor
42 American Journal of Management vol. 13(1) 2013
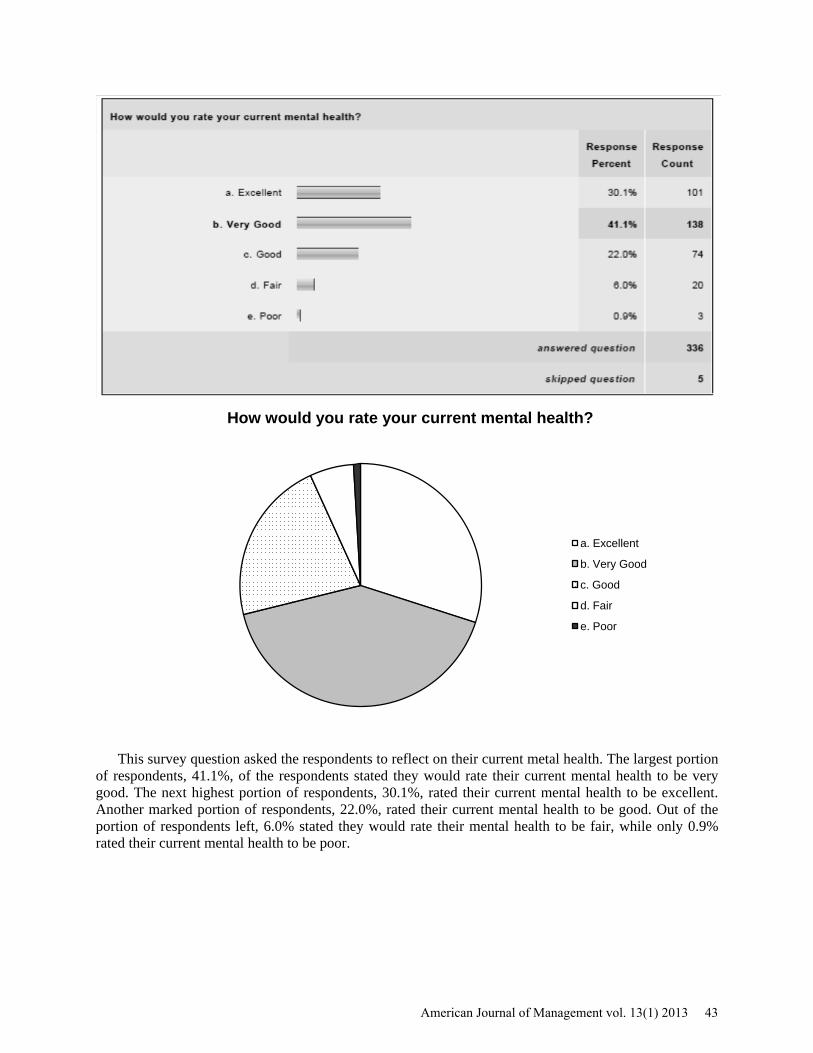
This survey question asked the respondents to reflect on their current metal health. The largest portion of respondents, 41.1%, of the respondents stated they would rate their current mental health to be very good. The next highest portion of respondents, 30.1%, rated their current mental health to be excellent. Another marked portion of respondents, 22.0%, rated their current mental health to be good. Out of the portion of respondents left, 6.0% stated they would rate their mental health to be fair, while only 0.9% rated their current mental health to be poor.
How would you rate your current mental health?
a. Excellent
b. Very Good
c. Good
d. Fair
e. Poor
American Journal of Management vol. 13(1) 2013 43

The respondents were asked if they have ever smoked. A rather large portion of the respondents, 74.0%, stated that they have never smoked. The next highest portion of respondents, 20.6%, stated that they had smoked at one time in their lives but have quit. The remaining portion of respondents, 5.4%, stated that they currently smoke.
Have you ever smoked?
a. NO, Never
b. Yes, but I quit
c. Yes, I currently smoke
44 American Journal of Management vol. 13(1) 2013
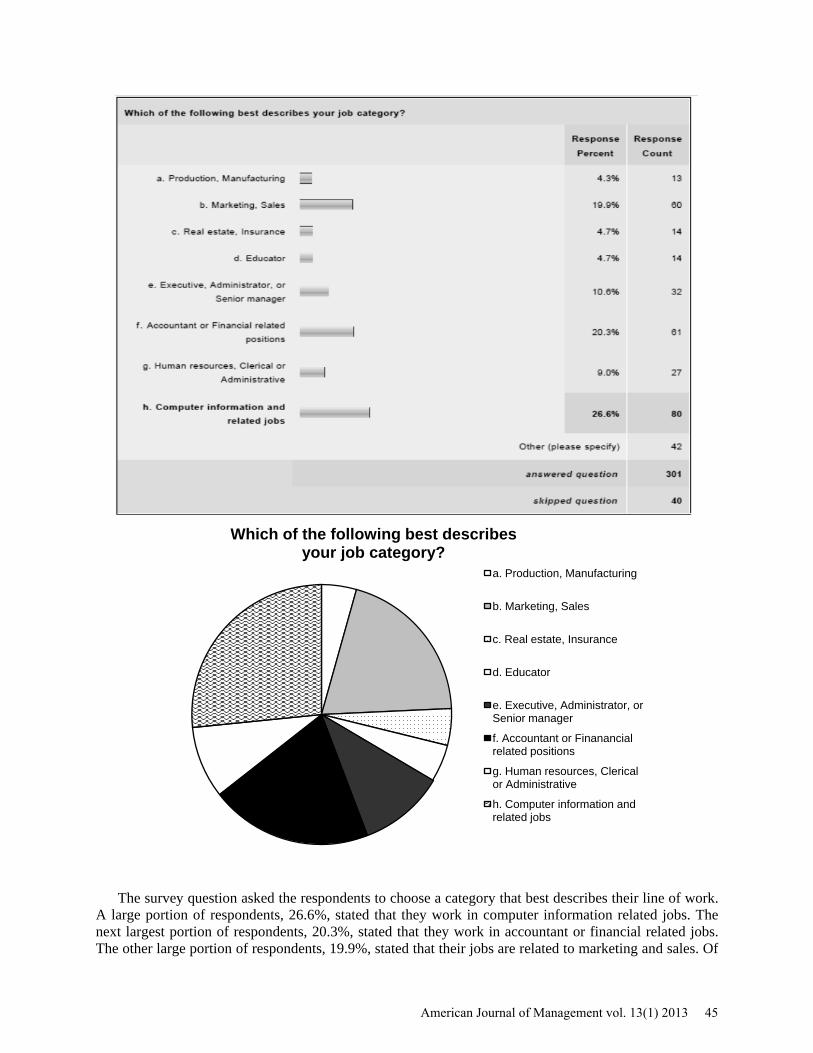
The survey question asked the respondents to choose a category that best describes their line of work. A large portion of respondents, 26.6%, stated that they work in computer information related jobs. The next largest portion of respondents, 20.3%, stated that they work in accountant or financial related jobs. The other large portion of respondents, 19.9%, stated that their jobs are related to marketing and sales. Of
Which of the following best describes your job category?
a. Production, Manufacturing
b. Marketing, Sales
c. Real estate, Insurance
d. Educator
e. Executive, Administrator, or Senior manager
f. Accountant or Finanancial related positions
g. Human resources, Clerical or Administrative
h. Computer information and related jobs
American Journal of Management vol. 13(1) 2013 45

the respondents that are left, 10.6% stated they work in executive, administrator or senior manager positions; 9.0% work in human resources, clerical or administrative positions; 4.7% work as educators; 4.7% are in real estate or insurance type positions; and 4.3% are involved in production and manufacturing positions.
46 American Journal of Management vol. 13(1) 2013

The following questions asked the respondents to reflect on their performance at their work in the past 4 weeks. When asked how often their performance was higher than most of the workers at their work, 57.7% of the respondents stated most of the time. When asked how often their performance was lower than most of the workers at their work, 54.7% of the respondents stated barely any time. The next question asked the respondents how often they were not working during the time they were supposed to be working. A large portion, 52.0%, of the respondents stated barely any time. The respondents were then asked how often they found themselves not working as carefully as they should and 51.8% of the respondents stated barely any time. The next question asked the respondents to reflect on how often the quality of their work was lower than what it should have been. A large portion of the respondents, 57.2%, stated barely any time. The last question asked the respondents how often they did not concentrate enough on their work, and 50.2% stated barely any time.
American Journal of Management vol. 13(1) 2013 47

This survey question asked the respondents to rate the typical performance of most of the workers in their workplace on a scale of 0-10, where 0 is the worst possible rating and 10 is the best possible rating. A large portion of the respondents, 51.2%, rated their co-workers’ performance at 6-7. The next largest portion of respondents, 34.8%, stated that they would rate their co-workers’ performance at 8-9. Of the remaining respondents, 10.4% rated their co-workers’ performance at 4-5; 1.8% rated it at 2-3; 1.2% rated it at 10; and the smallest portion of respondents, 0.6%, rated it at 0-1.
Rate the typical performance of most of the workers in your workplace on a scale of
0-10 where '0' is the worst possible, and '10' is the best possible.
a. 0-1
b. 2-3
c. 4-5
d. 6-7
e. 8-9
f. 10
48 American Journal of Management vol. 13(1) 2013

This survey question asked the respondents to rate their own normal job performance over the last three years by following the same scale used to rate their co-workers’ performance. The largest portion of respondents, 73.8%, rated their personal job performance at 8-9. The next largest portion of respondents, 12.3%, rated their performance at 6-7. Of the remaining respondents, 10.2% rated their job performance over the last three years at 10; 3.0% at 4-5; 0.3% at 2-3; and 0.3% at 0-1.
Using the same scale how would you rate your normal job performance in the last
three years?
a. 0-1
b. 2-3
c. 4-5
d. 6-7
e. 8-9
f. 10
American Journal of Management vol. 13(1) 2013 49

The first part of the above chart represents the average scores of the survey respondents’ BMI, fitness, health, a combination of these three elements, as well as the average score of their productivity. The respondents’ average BMI level was 1.23, their average fitness level was 3.43, their average health level was 6.51, and their average score of productivity was 13.52. The next part of the chart shows the average score of productivity by level of BMI, fitness and health. Respondents whose level of body fat percentage, fitness and health were low obtained scores of 13.52 and 13.5. Respondents, whose level of body fat percentage, fitness and health were medium, obtained scores of 13.37, 13.5, and 13.46. Finally the respondents whose level of body fat percentage, fitness and health were high obtained scores of 13.63, 13.55 and 13.62.
BMI average Fitness average Health average Average score of Fitness+Health+BMI Average score of productivity
1.231788079 3.435761589 1.84602649 6.513576159 13.52317881 Average score of productivity by level of BMI fitness and health Level Body Fat Percentage Fitness Health Low 13.52173913 13.5 Medium 13.47569444 13.50735294 13.46694215 High 13.63235294 13.55241935 13.625 ① Body Fat Percentage Description Women Men Score Level <10% <2% 0 low Essential fat 10–13% 2-5% 1 Low Athletes 13–21% 5–13% 1.5 Medium Fitness 21–25% 13–17% 2 Medium Acceptable 25–31% 17–26% 1.5 Medium Overweight 31-41% 26-37% 1 High Obese 41%+ 37%+ 0 High ② Fitness Score <3 Not fit >3 and <5.6 Medium fit >5.6 Very fit ③ Health Score <1.25 Not healthy >1.25 and <3 Medium healthy >3 Very healthy
50 American Journal of Management vol. 13(1) 2013

The next portion of the chart shows the body fat percentage of the respondents. The largest portion of respondents, 26-37% for men and 31-41% for women, had a body fat percentage description of being overweight. An even more significant portion the female respondents, 41% or more, had a body fat percentage that was at the obese level, as well as 37% or more of the male respondents. Of the female respondents, 13-21% had a body fat percentage of an athlete; 21-25% had a fit body fat percentage; while 25-31% had a percentage that was acceptable. Of the male respondents, 5-13% had a body fat percentage of the athletic level; 13-17% had a fit body fit percentage; and 17-26% had an acceptable body fat percentage. SUMMARY AND CONCLUSION The idea of a direct relationship between fitness and productivity has made companies spend billions to improve employees’ fitness. The idea of a relationship can easily be recognized without much thought as many jobs do require physical skills. However, in today’s job market when most jobs require little or no physical exertion, are fitness and productivity really related? The majority of scholarly articles hold the belief that there is a relationship between fitness and productivity. If fitness could be increased through some type of fitness program, there would be a noticeable increase in productivity. Other articles suggest that there is a relationship between fitness and productivity, yet only in extreme cases. Still other articles suggest that a relationship may exist, but it cannot be proved without more research. Questionnaires were sent to 1765 Cal Poly College of Business alumni. A total of 355 responded to the questionnaire, but only 328 of them were complete. The majority of the respondents were male, accounting for more than half of the responses and totaling 59.3%. As far as how many times they typically exercise, a high percentage of the survey respondents, 43.3%, stated that they exercise an average of 2-3 times a week. All of the survey respondents stated that they participate in some form of exercise on a weekly basis. 34.7% of the respondents stated their perceived exertion was strong, that during exercise they experienced sweating and could talk without much difficulty. A majority of the survey respondents, 49.3%, stated that they perceived their exertion and physical signs to be moderate to extremely strong during 1-2 of their workouts. A large portion of the respondents, 36.5%, stated that known health issues have no adverse effects on their work performance. 42.4% of the respondents stated they would rate their current health to be very good. 41.1% of respondents stated they would rate their current mental health to be very good. The respondents were asked if they have ever smoked. A large portion of the respondents, 74.0%, stated that they have never smoked. When asked how often their work performance was higher than most of the workers at their job, 57.7% of the respondents stated most of the time. After applying a set of statistical models and conducting an analysis, the results showed no significant correlations between the productivity of those who are fit and have a healthy BMI, and those who are not fit and have a BMI that is higher or lower than it should be. REFERENCES Der-Karabetian, Aghop & Gebharbp, Norma (1986). Effect of Physical Fitness Program in the Workplace. Journal of Business and Psychology, 1(1), 51-58. Mills PR, et al (2007). Impact of a health promotion program on employee risks and work productivity. American Journal of Health Promotion, 22(1), 45-53. Burton WN, et al (2005). The association of health status, worksite fitness center participation, and two measures of productivity. Journal of Occupational and Environmental Medicine, 47(4), 343-351. Neck, Christopher P & Cooper, Kenneth H (2000). The Fit Executive: Exercise and Diet Guidelines for Enhancing Performance. The Academy of Management Executive (1993-2005), 14(2), 72-83.
American Journal of Management vol. 13(1) 2013 51

DeNelsky, Garland Y & McKee, Michael G (1969). Prediction of job performance from assessment reports: Use of a modified Q-sort technique to expand predictor and criterion variance. Journal of Applied Psychology, 53(6), 439-445. Allen, Harris, Hubbard, David, & Sullivan, Sean (2005). The Burden of Pain on Employee Health and Productivity at a Major Provider of Business Services. Journal of Occupational and Environmental Medicine, 47(7), 658-670. Bernaards, Claire M, Proper, Karin I, & Hildebrandt, Vincent H (2007). Physical Activity, Cardiorespiratory Fitness, and Body Mass Index in Relationship to Work Productivity and Sickness Absence in Computer Workers with Preexisting Neck and Upper Limb Symptoms. Journal of Occupational and Environmental Medicine, 49(6), 633-640. Falkenberg, Loren E (1987). Employee Fitness Programs: Their Impact on the Employee and the Organization. The Academy of Management Review, 12(3), 511-522. Cox, M, Shepard, RJ, & Corey, P (1981). Influence of an employee fitness programme upon fitness, productivity and absenteeism. Ergonomics, 24(10), 795-806. Bertera, R (1990). The effects of workplace health promotion on absenteeism and employment costs in a large industrial population. American Journal of Public Health, 80(9), 1101-1105. Note: This author is also known as M. Sharif.
52 American Journal of Management vol. 13(1) 2013

Armageddon II: An Analysis of the Issues Surrounding the NHL Lockout
Jordan I. Kobritz SUNY Cortland
Jeffrey F. Levine
Southern Illinois University
The National Hockey League locked out its players for the second time in seven years after losing the entire 2004-05 season in an effort to obtain a salary cap that was touted as the panacea for financial stability and profitability to its member teams. However, the league maintains that two-thirds of the teams lost money during the 2011-12 season, despite a 50% increase in total league revenue since 2005. This article will analyze a number of key issues between the parties and discuss the importance and potential resolution of each one during negotiations for a new Collective Bargaining Agreement. INTRODUCTION
On June 22, 2009, after twenty-six years as the Executive Director of the Major League Baseball Players’ Association (MLBPA), Donald Fehr announced his retirement (“Fehr Leaving Post,” 2009). Fehr’s tenure as head of the MLBPA was marked by extreme highs—the average player salary increased from $289,194 to an average of nearly $3 million during his tenure—and lows—the 1994 World Series was cancelled after the players went on strike in August of that year (Anderson, 2010; Brown, 2010a).
Shortly after announcing his retirement from the MLBPA, Fehr agreed to assist the National Hockey League Players’ Association (NHLPA) in revamping its constitution and finding a new executive director (Piercy, 2009; “Players Hope,” 2010). For much of its existence, the NHLPA was the antithesis of the MLBPA. Hockey players were beset with incompetent and corrupt leadership that had done little over the years to protect them from the owners (Anderson, 2010; Campbell, 2009; “Players Hope,” 2010). They enjoyed fewer benefits and earned less than their counterparts in the other three major league team sports: football, baseball, and basketball.
After a year as an unpaid adviser to the NHLPA, Fehr was elected as the union’s executive director (Gross, 2009; Piercey, 2009). The timing could not have been more fortuitous for the players. Their current Collective Bargaining Agreement (CBA), the only one the players and the league have had since the end of the 2004-05 lockout that cost the sport the entire season, was set to expire on September 15, 2012 (Custance, 2011; “Donald Fehr,” 2010). With Fehr at the helm, the players have an experienced and battletested labor executive to lead them for the first time in union history. This note will point out a number of key issues that are likely to top the union’s agenda in negotiations with the owners, discuss how Fehr might approach those issues, and predict how those issues will eventually be resolved.
Fehr’s initial remarks after the announcement of his election gave little insight into how he will prioritize bargaining issues for the next round of negotiations with the owners. However, he was bullish
American Journal of Management vol. 13(1) 2013 53

that the two sides will be able to avoid a labor stoppage (Klein, 2010a). Not surprisingly, when pressed by the media, Fehr was tightlipped and failed to “reveal [any] specifics” of what he and his membership considered as key negotiating issues for the next CBA (Brehm, 2010, para. 14). When asked directly what the players have for concerns, Fehr demurred, saying:
I think what’s fair to say is there are a lot of things that they would like to see examined with the way things are working now and then following that, try to make a judgment on if they want to try to change them, and if so, to what... It would be unfair at this point to go beyond that (Brehm, 2010, para. 15).
No one expected Fehr to provide full disclosure and tip his hand even before the negotiating process
with management began, but some of the material issues to be addressed by the next CBA can be easily identified, including (A) revenue sharing, (B) escrow payments, (C) international player participation, (D) the salary cap, (E) roster sizes and guaranteed contracts, (F) unrestricted free agency, (G) player safety, (H) division realignment, (I) long-term, front-loaded contracts, (J) Fehr’s successor, and (K) negotiating strategy. A. Revenue Sharing
A major issue in the 2012 negotiations revolves around revenue sharing. The league has flourished financially since the 2004-05 lockout. League revenues have progressively increased from one season to the next and, with the much fought-over salary cap and floor being tied to league revenues, player salaries have also steadily risen since the lockout (Badenhausen, Ozanian, & Settimi, 2010). While player costs have increased at a similar rate for each NHL franchise, revenues for individual teams have not increased in lockstep with payroll. This imbalance in team revenue is becoming a major topic of discussion among owners as the next CBA looms.
One solution to this imbalance is to increase revenue sharing among teams. The major opposition to this approach may not come from the NHLPA, but rather from infighting between large and small market teams (Badenhausen et al., 2010). Proponents of increased revenue sharing are likely to find strong resistance from owners of marquee teams that enjoy the highest local revenues, such as the New York Rangers, Montreal Canadians, and Toronto Maple Leafs (Badenhausen et al., 2010). Fehr embraced the broad revenue sharing model adopted in baseball, perhaps in response to the MLBPA’s adamant opposition to a salary cap in Major League Baseball (MLB). He may wish to do the same in hockey.
It should be noted that less total revenue exists in hockey than in baseball, $2.8 billion to $7 billion in the 2010-11 NHL season and the 2010 MLB season, respectively (“Best-Ever Business,” 2011; Lackey, 2010; Mickle, 2010). The dearth of national revenues in hockey in comparison to other major league team sports, and a wide local revenue disparity among NHL teams virtually guarantees that increased revenue sharing will be a major topic of discussion in the upcoming CBA negotiations (Badenhausen et al., 2010; Bradbury, 2010).
While revenue sharing could prove to be a more contentious topic among the owners, it is an issue that has consequences for both owners and players. The players are likely to embrace an expansion of revenue sharing in an effort to allocate greater resources to teams that are struggling to meet the payroll floor (the salary floor for the 2010-11 season was $43.4 million and increased to $48.3 million for the 2011-12 season) (Gretz, 2011; “NHL Salary Cap,” 2010).
Those organizations, along with a number of teams in small markets, are likewise expected to support an expansion of revenue sharing. The 2005 CBA prevents teams that are either (1) in a market with a minimum of 2.5 million television homes, or (2) are among the top fifteen clubs with the highest gross revenues, from participating in revenue sharing (CBA between NHL and NHLPA at 164-66, 2005, “CBA FAQS,”n.d.). Thus, franchises such as the New York Islanders, New Jersey Devils, and Anaheim Ducks cannot participate in the revenue sharing process because their respective markets are too large (Botta, 2010; “CBA FAQS,” n.d.). Even so, all of those teams claim to be losing money (“Badenhausen & Ozanian, 2010).
54 American Journal of Management vol. 13(1) 2013
In an interview with SNY Point Blank in December of 2010, Deputy NHL Commissioner Bill Daly said the revenue sharing system would be addressed in the negotiations on the next CBA (Botta, 2010). The elimination of a number of teams from the revenue sharing system is “‘probably a technicality, although it’s an intentional technicality of how the revenue sharing system was originally constructed under the CBA,’ Daly suggested” (Botta, 2010, para. 2). “The concept was that, if you play in a large media market...you should not qualify for revenue sharing in part because of what your local media rights opportunities are” (Botta, 2010, para. 2). The parties who fashioned the current CBA did not contemplate the great recession that began in 2008. Now, the parties may hold a different opinion on how the revenue sharing provision should be crafted.
While some owners are desperate for a change in the revenue sharing provision to allow less wealthy teams to compete with the large market teams, a number of owners may view a change in the revenue sharing “technicalities” as a matter of rewarding teams for incompetence, in effect, welfare for those who fail to maximize their local revenue generating opportunities. Therefore, although players may find support from a number of owners on the topic of revenue sharing, the issue may end up being more of a battle pitting owner against owner rather than players against owners, something Fehr encountered during his role with the MLBPA. Look for the parties to ultimately compromise on the issue, allowing clubs who struggle even in large markets to participate in revenue sharing at some level as a means to remain competitive for player services. B. Escrow
Under the current CBA, players receive 57% of league revenues, which means that unlike the situation that exists in MLB, the amount allocated to player salaries in the NHL is a function of league revenue (CBA between NHL and NHLPA at 193-97, 2005). To ensure that salaries do not exceed the agreed upon percentage of league revenues and to hedge against lower than expected revenue projections, players are required to place a percentage of their biweekly paychecks in escrow (CBA between NHL and NHLPA at 195, 2005; “NHL Hoping,” 2011). Escrow payments were 17% of each paycheck at the beginning of the 2010-11season, although that figure was later reduced to 13.5% based on actual revenue receipts (CBA between NHL and NHLPA § 49.5(d), 2005; Dupont, 2011).
Although league revenues have increased each year since the lockout, players have repeatedly voiced their dislike of the escrow arrangement (Gross, 2011). They view the escrow system as forcing them to return money to the league “because some teams overspent and the difference has to be made up by taxing the players” (“Fehr Could Play,” 2010, “Salary Cap Issues,” para. 2). Despite this frustration with the escrow system, the NHLPA cannot argue that members have not benefitted from increased player salaries as a result of steadily rising league revenues. The salary cap has risen from $39 million dollars in 2005-06, the year coming out of the lockout, to $64.3 million in 2011-12, a nearly 65% increase in six years (“2009-10 Salary Cap,” 2009; “NHL Salary Cap,” 2011). The escrow system was implemented as part of the salary cap, which is linked to league revenues. Therefore, escrow cannot be viewed in a vacuum.
It is unclear how Fehr views escrow and how much importance his union will place on revising the system in the upcoming CBA. Even so, the league will undoubtedly seek to maintain the escrow system in some fashion in the new agreement. Escrow serves as protection from a potential revenue shortfall that, in its absence, might otherwise force teams to recover salary from players individually. The escrow system may also act as a security blanket which allows teams to spend more freely on player payroll without fear of exceeding the salary cap, a mindset which may contribute to increased player salaries. C. Player Participation in International Competition
Another issue that will undoubtedly be addressed in the negotiations is the participation of NHL players in the 2014 Olympics in Sochi, Russia. The current CBA contained commitments for NHL players to play in the 2006 and 2010 Winter Olympics, along with the annual IIHF World Championships (CBA between NHL and NHLPA § 24, 2005). All future international contests appear to be open for negotiation at the discretion of the two sides. Most players seem to favor such participation, but the
American Journal of Management vol. 13(1) 2013 55

league has remained non-committal (Campbell, 2010; Morreale, 2010). One reason for the NHL’s uncertainty may be the widespread disagreement among owners on how much Olympic hockey exposure benefits the league. This disagreement is further complicated when weighed against the financial loss incurred by the league and its member franchises when the NHL is required to shut down for a period of two weeks to accommodate the Olympics (Morreale, 2010).
The excitement and interest in Olympic hockey is obvious; but the question remains whether the enthusiasm generated by the tournament is transferrable to NHL games. Put another way, it is unclear whether the NHL can convert the casual Olympic fan who tunes in for these quadrennial contests into a loyal, money spending, NHL fan. In large part, much of the excitement generated by Olympic hockey is due to nationalism rather than to a great passion for professional hockey or specific NHL teams. Differences also exist between the Olympic and NHL game. The brand of hockey played in the Olympics—a larger ice surface, less physical play, and more wide-open style—is different from the game that is played on NHL rinks—a smaller ice surface, more physical style of play, and tighter checking. Therefore, fans of Olympic-style hockey may not transfer their interest to the NHL, and it may not be worth the NHL’s financial risk – not to mention the risk of player injury—to allow player participation in such tournaments. D. The Salary Cap
While players will address their key issues during bargaining on the next CBA, owners are also expected to look for a number of concessions from the players. One area of interest to owners may be revisions to the salary cap system. Although the owners forfeited an entire season to obtain a hard salary cap, not all teams have been profitable since the lockout. As many as eighteen NHL franchises are reportedly still losing money despite a CBA containing a salary cap, a device that was touted as a means to create “cost certainty” (“Badenhausen & Ozanian, 2010; Abrams, 2003). One reason the CBA is not achieving the level of cost certainty desired by owners may be due to the system the league uses to allocate revenues. Currently, 57% of NHL revenues are guaranteed to the players, an amount used to calculate the salary cap (CBA between NHL and NHLPA § 50.4(d), 2005; “CBA FAQS,” n.d.). In an effort to reduce the tide of red ink, owners can be expected to seek a reduction in the percentage of league revenue used to calculate the salary cap, which, if achieved, will also slow the increase to the league’s salary floor.
As mentioned, franchises have seen substantial increases in the salary cap and floor since the post lockout 2005-06 NHL season (“NHL Salary Cap,” 2011). This dizzying increase has, for the most part, occurred in the midst of the worst recession in decades (“Hefty Rise,” 2011). Management may argue that substantial changes must be made to the CBA that are designed to prevent some teams from wild spending in order to reach the salary floor (“Hefty Rise,” 2011). Despite this, a number of hockey insiders predict that the salary cap will fall at some point, which would require some teams to shed salary (“Hefty Rise,” 2011). In that event, the owners’ perceived disparity between the salary cap and the salary floor may no longer be an issue. Of course, any reduction in the percentage of league revenue that goes to the players may lead to lower average salaries. That possibility suggests Fehr and the union will be very reluctant to capitulate on this issue. While it is unlikely that Fehr will oppose the continuation of a hard salary cap in the next CBA, he may agree to a revision of the salary cap system if the players receive concessions from owners on other key issues. One such compromise may include an adjustment between the salary cap and the floor. If the percentage of revenue going to the players is reduced, and a corresponding increase in the salary floor is agreed to, the highest paid players may take a hit while the salaries of lower paid players may actually increase. Such an adjustment, if tied to increased revenue sharing, may be palatable to a majority of owners. How to address that issue will undoubtedly be on the agenda for both parties during the next CBA negotiation. In addition, after the NFL and the NBA were successful in rolling back the percentage of league revenues allocated to player salary in their respective new CBAs, NHL owners will likely attempt to accomplish the same thing in negotiations with their players (Coon, 2011; Mortensen, 2011). Even so, it took a lockout in both the NFL and NBA, with the
56 American Journal of Management vol. 13(1) 2013

loss of almost twenty percent of the 2011-12 NBA season, to convince the players to accept less revenue (“Heat, Mavericks,” 2011).
A related issue is what constitutes the base in the NHL, defined as “hockey-related revenue,” which is used to compute the portion of revenue allocated to player salaries. In every league where players receive a percentage of league revenues in salary, a certain amount of revenue is excluded from the computation. In 2011, the NHLPA exercised its right to conduct an audit of select clubs for the first time (Brooks, 2011). Reports indicate that union auditors discovered unreported revenues from the previous season. In addition, the owners and players disagree on whether the $25 million paid to the league by Glendale, Arizona each of the past two years to keep the Phoenix Coyotes in town should be considered hockey-related revenue (Brooks, 2011). The dispute delayed the issuance of escrow refunds to the players as well as the distribution of additional revenue sharing to teams that qualified for it. E. Roster Sizes and Guaranteed Contracts
Other issues that owners are likely to raise during negotiations, and the union will undoubtedly be prepared to respond to, are roster sizes and guaranteed contracts. A number of teams hardly use a fourth line in today’s game, and eliminating three players from the roster could both save teams money and increase the average salary of the remaining players. The union is unlikely to be receptive to such a move, however, because it would cost some players their jobs. The same is true for guaranteed contracts. The only major league professional sport without guaranteed contracts is football. Fehr’s experience in baseball, where all contracts are guaranteed, suggests that the union would highly contest a move that would eliminate guaranteed contracts. F. Unrestricted Free Agency
Teams may also seek to adjust the age for unrestricted free agency. Currently, players are eligible for unrestricted free agency once they reach age twenty-seven or after having spent seven years in the league (CBA between NHL and NHLPA § 10.1, 2005). Teams receive no compensation for losing an unrestricted free agent. Those rules are arguably more favorable to the players in the NHL than the free agent rules in existence in MLB, where some teams may be entitled to compensation for the loss of a free agent. That holds true despite the fact that baseball players can be unrestricted free agents after only six years of Major League service. Another issue involving player compensation that ownership may wish to revise is salary arbitration, which has helped escalate player salaries in the NHL, although not to the extent that it has in MLB (Carroll, 2001). G. Player Safety
Both sides may use these upcoming negotiations to address additional player safety issues. One safety issue that has recently taken center stage concerns “blind side hits” and targeted blows to the head, which are becoming increasingly common in professional hockey (Cole, 2011; Klein, 2011a; NHL Suffering Loss,” 2011). In recent seasons, the league has seen a growing number of skilled players miss significant time due to brutal hits delivered to the receiving player’s head. One costly example of this trend is, perhaps the best player in the league, Pittsburgh Penguins center Sidney Crosby, who missed significant time due to headshots he sustained back in early 2011 (LeBrun, 2009; Molinari, 2011). In response to this trend, the league adopted a new rule that includes a specific “major” penalty for such hits (“Rule 48,” n.d.). The league’s new chief disciplinarian, Brendan Shanahan, has sought to aggressively enforce the new rule in an effort to discourage players from engaging in conduct which, because it has sidelined some of the league’s most skilled players, has the potential to negatively affect the game’s marketability (Klein, 2011b). Time will tell if this new rule on hits, “Rule 48,” will be effective in legislating headshots and blind side hits out of the game or if collective bargaining is necessary to resolve the issue.
An emerging issue that is almost as polarizing as headshots is the physical and psychological toll that fighting seems to take on NHL players (“Hazards, Risk,” 2011). Fighting became a more pressing issue after three former NHL enforcers passed away within a four-month period in 2011; each player’s death was presumably linked to the physical and mental impact fighting had on the player over his career
American Journal of Management vol. 13(1) 2013 57

(Branch, 2011a; Branch, 2011b; Gregory, 2011). While fighting is unlikely to be legislated out of the game, the physical and mental hazards of being an “enforcer” may lead to discussions between labor and management concerning post career treatment and benefits to players. An outright ban on fighting could potentially erase a roster spot currently allocated to a fighter, something the union would undoubtedly oppose. H. Division Realignment
Another issue was raised in December of 2011 after the league’s owners approved a radical realignment plan that was designed to relieve the travel burden on teams in the central and western time zones. The league approved a four-division configuration, two with eight teams and two with seven teams (“NHL Approves,” 2011). In announcing the plan, NHL Commissioner Gary Bettman was adamant that the change did not require union approval (“NHL Approves,” 2011). However, a union spokesperson was equally as adamant that realignment does require an agreement between the league and the NHLPA (“NHL Approves,” 2011). Such is, in fact, the case in the MLB, where the MLBPA must approve any realignment, and Fehr may wish to include an ironclad clause in the next CBA that will leave no doubt as to the union’s role in future NHL realignment (Olney, 2011). I. Long-Term, Front-Loaded Contracts
An additional issue likely to be addressed in the upcoming 2012 negotiations concerns the attempt on the part of some teams to circumvent the league’s salary cap. This subject became an issue when teams began signing players to front-loaded, long-term contracts that stretched out a large sum over many years, lowering the average yearly salary and allowing teams to remain below the salary cap (LeBrun, 2009; “Luongo Signs,” 2009; “NHL Investigating,” 2009). Using this approach, teams could still pay top dollar to attract talent, but the immense wage being paid to a player during the prime of his career could be spread out over the length of the contract. In some instances, these wages would amount to an excess of eight million dollars per year at the peak of the contract. This resulted in lowering the average cap hit to a relatively manageable level. In practice, however, it was highly unlikely that the player would play throughout the contract’s entire term.
The issue of long-term contracts came to a head in July 2010 when the New Jersey Devils signed franchise free agent sniper, Ilya Kovalchuk, to a stunning seventeen-year, $102 million deal (Yerdon, 2009). The contract, if completed in full, would keep Kovalchuk in uniform until he was forty-two years old, an incredibly advanced age for a professional hockey player (Yerdon, 2009). The Kovalchuk deal, which was the fourth blockbuster deal of its kind in the NHL salary cap era, failed to gain league approval (“NHL Rejects Kovalchuk Contract,” 2010). In rejecting the contract, the NHL claimed it was merely a circumvention of the salary cap (“NHL Rejects Kovalchuk Deal,” 2010). The NHLPA then filed a grievance over the NHL’s decision (“NHLPA Files Kovalchuk,” 2010). Ultimately, the two sides reached an agreement on the structure of long-term deals in the NHL (“NHL, NHLPA,” 2010). Despite the agreement, such contracts may continue to be an issue in the future (Mirtle, 2011). Therefore, expect the sides to incorporate language into the next CBA that memorializes the rules governing long-term player contracts and salary cap compliance. J. Fehr’s Successor
An internal union issue certain to be on Fehr’s agenda is the designation of his successor as head of the NHLPA. Based on his public comments following his election, Fehr is likely to retire once the next CBA is in place (Klein, 2010b). Ideally, Fehr will be looking for someone with a hockey and labor background to succeed him. If no perfect candidate exists, Fehr could instead select a former NHL player who has shown an interest in and a commitment to union affairs to serve as his understudy during CBA negotiations. Union membership could select that individual to succeed Fehr, but even if another person were elected as executive director, an individual experienced in the CBA process, one who was at Fehr’s side throughout the 2012 negotiations, would be available in union headquarters to assist the new executive director. One potential candidate to succeed Fehr as Executive Director of the NHLPA is
58 American Journal of Management vol. 13(1) 2013

former NHL defenseman Mathieu Schneider, who has served as Fehr’s special assistant since February 2011 (“Mathieu Schneider,” 2011).
Given the amount of time, effort, and emotion that Fehr has invested in the NHLPA to date, it is unlikely that he will leave the selection of his successor to chance. It would also make sense for Fehr’s successor to serve with him in order to learn the nuances of labor law and the same negotiating tactics that Fehr learned from former MLBPA Executive Director Marvin Miller while Fehr served as counsel to the MLBPA prior to succeeding Miller as executive director.
Another of Fehr’s likely goals before he leaves the NHLPA is to create a relationship with the owners similar to the one he left behind when he retired from the MLBPA. Fehr is associated with multiple work stoppages in baseball during his time at the union, most notably the 1994 strike that resulted in the cancellation of the 1994 World Series (“1994 Strike,” 2004; “History of the Major,” n.d.). Despite this, one must also note that he retired from the MLBPA after sixteen years of uninterrupted labor peace, something that many observers thought was impossible to achieve during the early years of labor unrest in MLB (“Fehr Leaving Post,” 2009). After the 1994 strike, a labor stoppage that cost the owners an estimated one billion dollars in lost revenues and the players hundreds of millions in lost wages, Fehr helped create an environment of cooperation from which both parties have continued to prosper (“1994 Strike,” 2004). Baseball revenues increased from $1.3 billion in 1995 to over $7 billion in 2010. (Brown, 2010; Levin, Mitchell, Volker & Will, 2000).
In hockey’s salary cap era, NHL owners and players must exhibit the same level of cooperation that has been displayed by MLB and its players since the 1994 strike. The fact that players receive a fixed percentage of league revenues in the NHL serves to create a partnership between the parties: the greater the league revenues, the greater the player salaries. Therefore, it behooves both sides to bargain cooperatively in the next round of CBA talks with the ultimate goal being to grow league revenues around the globe. K. Negotiating Strategy
The tone of these negotiations may be different from the one that led to the 2004-05 lockout and subsequent owner-friendly CBA. Although the union’s executive director during the lockout, Bob Goodenow, was arguably the best leader the NHLPA ever had, he has been rightfully criticized for taking a hardline approach with the owners without a viable alternative negotiating strategy (Bernstein, 2004). On the defensive from almost the onset of negotiations, he staked his entire strategy during the 2004-05 lockout on a no salary cap platform (Liebmen, 2009). He had no apparent “Plan B” that might have salvaged a portion of the season and a portion of his membership’s lost wages (Gross, 2009).
Fehr is unlikely to make the same mistake in his negotiating strategy with the owners. Based on his track record with the MLBPA, Fehr is likely to have had a number of options and scenarios prepared on each issue prior to embarking on negotiations with the league. CONCLUSION
Today, the NHLPA finds itself in a position not unlike that of the MLBPA in 1966 when Marvin Miller agreed to represent the fledgling baseball players’ union. The NHLPA finally has the stable, competent and knowledgeable leader it has yearned for since its inception and Fehr has one more opportunity to cement his legacy as a labor leader. If Fehr can accomplish for hockey players even a fraction of what Miller was able to accomplish for baseball players, he will have done them a great service in addition to enhancing his reputation as one of the greatest, if not the greatest, sports labor leaders of all time.
It remains to be seen how much Fehr can accomplish on behalf of hockey players in the brief time he is expected to represent them as Executive Director. There are many issues that the league and players must resolve without endangering the impressive growth the NHL has enjoyed since the end of the 2004-05 lockout. Nevertheless, given his successful track record with the MLBPA, it seems certain that the
American Journal of Management vol. 13(1) 2013 59

NHLPA and the players will be better off when Fehr leaves the union than they were when he first agreed to assist them as an unpaid volunteer. REFERENCES 1994 Strike Was a Low Point for Baseball. (2004, Aug 10). ESPN. Retrieved from http://sports.espn.go.com/mlb/news/story?id=1856626 2009-10 Salary Cap Set at $56.8 Million. (June 26, 2009). NHL. Retrieved from http://www.nhl.com/ice/news.htm?id=431786 Abrams, R.I., (2003). Sports Law Issues Just over the Horizon. Virginia Sports & Entertainment Law Journal, 3(46), 61. Anderson, S. (2010, December 20). Penguins Notebook: Players Praise Fehr’s Appointment. Post-Gazette. Retrieved from http://www.postgazette.com Badenhausen, K., & Ozanian, M.K. (2010, December). NHL Team Values 2010 The Business of Hockey. Forbes. Retrieved from http://www.forbes.com/lists/2010/31/hockey-valuations-10_land.html Badenhausen, K., Ozanian, M.K., & Settimi, C. (2010, December). Hockey’s Most Valuable Teams. Forbes. Retrieved from http://www.forbes.com/2010/11/30/leafs-rangers-canadiens-business-sports-hockey-valuations-10-most-valuable-teams.html Bernstein, A. (2004) Bettman, Goodenow bet their legacies on hard-line positions. Street and Smith’s SportsBusiness Journal. Retrieved from http://www.sportsbusinessdaily.com/Journal/Issues/2004/09/20040906/Labor-Agents/Bettman-Goodenow-Bet-Their-Legacies-On-Hard-Line-Positions.aspx?hl=bet%20their%20legacies%20on%20hard-line%20positions&sc=0 Best-Ever Business Year Highlighted by Record Revenue. (2011, April 13). NHL. Retrieved from http://www.nhl.com/ice/news.htm?id=559630 Botta, C. (2010, December 17). Daly Says N.H.L. Revenue Sharing May Change. [Web log post]. Retrieved from http://slapshot.blogs.nytimes.com/2010/12/17/daly-says-n-h-l-revenue-sharing-may-change Bradbury, J.C. (2010, August 28). Encouraging the Poor to Stay Poor. The New York Times. Retrieved from http://www.nytimes.com/ Branch, J. (2011a, December 6). A Brain ‘Going Bad’. The New York Times. Retrieved from http://www.nytimes.com Branch, J. (2011b, September 2). A Deadly Riddle. The New York Times. Retrieved from http://www.nytimes.com Brehm, M. (2010, December 18). Don Fehr Overwhelmingly Approved as NHLPA Chief. USA Today. Retrieved from http://www.usatoday.com Brooks, L. (2011, November 13). NHL Union Gets ‘Book’ Smart. New York Post. Retrieved from http://www.nypost.com/
60 American Journal of Management vol. 13(1) 2013

Brown, M. (2010, December 15). MLB Avg Salary Surpasses $3M, Increases Less than 1% from 2009. The Biz of Baseball. Retrieved from http://www.bizofbaseball.com/index.php?option=com_content&view=article&id=4951:mlb-avg-salary-sur-passes-3m-increases-less-than-1a-from-2009&catid=30:mlb-news&Itemid=42 Brown, M. (2010, December 22). Revenue-Sharing in Major League Baseball Totals $404 Million for 2010. Biz of Baseball. Retrieved from http://www.bizofbaseball.com/index.php?option=com_content&view=article&id=4973:revenue-sharing-in-major-league-base-ball-totals-404-million-for-2010&catid=30:mlb-news&Itemid=42 Campbell, K. (2009, November 9). NHLPA Brings on MLBPA Executive Director Donald Fehr to Help Find Kelly Replacement and Draft New Constitution. The Hockey News. Retrieved from http://www.thehockeynews.com/articles/29192-NHLPA-brings-on-MLBPA-executive-director-Donald-Fehr-to-help-find-Kelly-replacement-and-draft-new constitution.html Campbell, K. (2010, February 27). THN at the Olympics: KHL Poised to Offer Kovalchuk Huge Contract. Hockey News. Retrieved from http://www.thehockeynews.com Carroll, M.R., (2001). In J. Erkes-Medrano (Ed.), The Concise Encyclopedia of Hockey (p.136). Location: Vancouver, British Columbia. Cole, C. (2011, December 14). Note to NHL: Concussion ‘Hysteria’ Won’t Blow Over. Vancouver Sun. Retrieved from http://www.vancouversun.com/ Collective Bargaining Agreement Between National Hockey League and National Hockey League Players’ Association July 22, 2005-September 15, 2011, Retrieved from http://www.nhl.com/cba/2005-CBA.pdf § 10.1 (2005). Collective Bargaining Agreement Between National Hockey League and National Hockey League Players’ Association July 22, 2005-September 15, 2011, Retrieved from http://www.nhl.com/cba/2005-CBA.pdf § 24 (2005). Collective Bargaining Agreement Between National Hockey League and National Hockey League Players’ Association July 22, 2005-September 15, 2011, Retrieved from http://www.nhl.com/cba/2005-CBA.pdf § 49.5(d) (2005). Collective Bargaining Agreement Between National Hockey League and National Hockey League Players’ Association July 22, 2005-September 15, 2011, Retrieved from http://www.nhl.com/cba/2005-CBA.pdf § 50.4 (2005). Collective Bargaining Agreement Between National Hockey League and National Hockey League Players’ Association July 22, 2005-September 15, 2011, Retrieved from http://www.nhl.com/cba/2005-CBA.pdf at 164-66 (2005). Collective Bargaining Agreement Between National Hockey League and National Hockey League Players’ Association July 22, 2005-September 15, 2011, Retrieved from http://www.nhl.com/cba/2005-CBA.pdf at 193-97 (2005).
American Journal of Management vol. 13(1) 2013 61

Collective Bargaining Agreement Between National Hockey League and National Hockey League Players’ Association July 22, 2005-September 15, 2011, Retrieved from http://www.nhl.com/cba/2005-CBA.pdf at 195 (2005). Collective Bargaining Agreement FAQs. (n.d.). Retrieved from http://www.nhl.com/ice/page.htm?id=26366 Coon, L. (2011). Breaking Down Changes in New CBA. ESPN. Retrieved from http://espn.go.com/nba/story/_/page/CBA-111128/ how-new-nba-deal-compares- last-one Custance, C. (2011, March 3). Showdown Between Gary Bettman and Donald Fehr Still a Ways Off. Sporting News. Retrieved from http://aol.sportingnews.com/nhl/story/2011-03-03/showdown-between-gary-bettman-and-donald-fehr-still-a-ways-off Donald Fehr Officially Takes Over NHLPA with Eye on CBA Talks. (2010). Street and Smith’s SportsBusiness Journal, 17(69). Retrieved from http://www.sportsbusinessdaily.com/Daily/Issues/2010/12/Dec-20/Leagues-and-Governing-Bodies/Fehr.aspx?hl=Donald%20Fehr%20Officially%20Takes%20Over%20NHLPA%20with%20Eye%20on%20CBA%20Talks&sc=0 Dupont, K.P. (2011, January 11). Think of All-Star Game as Money in the Bank. The Boston Globe. Retrieved from http://www.boston.com/sports/hockey/bruins/articles/2011/01/30/think_of_all_star_game_as_money_in_the_bank/?page=full Fehr Could Play Key Role in NHLPA Decision On Salary Cap Inflator. (2010). Street and Smith’s SportsBusiness Journal, 16(193). Retrieved from http://www.sportsbusinessdaily.com/Daily/Issues/2010/06/Issue-193/Leagues-Governing-Bodies/Fehr-Could-Play-Key-Role-In-NHLPA-Decision-On-Salary-Cap-Inflator.aspx?hl=Fehr%20Could%20Play%20Key%20Role%20in%20NHLPA%20Decision%20On%20Salary%20Cap%20Inflator&sc=0 Fehr leaving post after quarter-century. (2009, June 23). Retrieved from http://sports.espn.go.com/mlb/news/story?id=4278728 Gregory, S. (2011, September). After the Derek Boogaard Tragedy: Why the NHL Should Stop the Fights. Time. Retrieved from http://www.time.com/time/nation/article/0,8599,2101997,00.html Gretz, A. (2011, July 11). Teams Still Need to Reach Salary Floor. [Web log post]. Retrieved from http://eyeonhockey.blogs.cbssports.com/mcc/blogs/entry/27694626/30585199 Gross, A. (2011, June 17). NHL, Union Hope to Avoid Work Stoppage. North Jersey. Retrieved from http://www.northjersey.com/sports/124054394_NHL union_hope_to_avoid_brawl.html?csort=1 Gross, D. (2009, December 18). Donald Fehr Named New NHLPA Boss. National Post. Retrieved from http://nationalpost.com Hazards, Risk Don’t Deter NHL’s Enforcers. (2011, October 19). USA Today. Retrieved from http://www.usatoday.com
62 American Journal of Management vol. 13(1) 2013
Heat, Mavericks to be tested early. (2011, December 2011). ESPN. Retrieved fromhttp://espn.go.com/nba/story/_/id/7324752/nba-schedule-miami-heat-microscope-again-national-tv Hefty Rise in Salary Cap Bringing NHL Back to Pre-lockout Days. (2011, June 30). Ottawa Citizen. Retrieved at http://nhlnortheast.posterous.com/hefty-rise-in-salary-cap-bringing-nhl-back-to History of the major league baseball players association. (n.d.). MLB Players. Retrieved from http://mlbplayers.mlb.com/pa/info/history.jsp Hunter, B. (2010, October 5). New Rule on Head Hits Designed to Curb Concussions. NHL. Retrieved from http://www.nhl.com/ice/news.htm?id=539622 Klein, J.Z. (2010a, December 18). The N.H.L. Players Union Votes to Appoint Fehr as Its Leader. The New York Times. Retrieved from http://www.nytimes.com/ Klein, J.Z. (2010b, September 12). Fehr Expects to Lead Hockey Union in Talks Toward Labor Deal. The New York Times. Retrieved from http://www.nytimes.com Klein, J.Z. (2011a, November 17). Hit Is Still Affecting Player and League. New York Times. Retrieved from http://www.nytimes.com Klein, J.Z. (2011b, September 29). Shanahan Is Enforcing the Rules with Gusto. The New York Times. Retrieved from http://www.nytimes.com Lackey, P. (2010, December 22). MLB Revenue Sharing Dips Slightly in 2010. AOL News. Retrieved from http://www.aolnews.com/2010/12/22/mlb-revenue-sharing-down-slightly-in-2010 LeBrun, P. (2009, July 2). Hossa, Blackhawks Agree on Deal. ESPN. Retrieved from http://sports.espn.go.com/nhl/news/story?id=4300131 LeBrun, P. (2009, November 11). Group to Study Issue, Report in March. ESPN. Retrieved from http://sports.espn.go.com/nhl/news/story?id=4645119 Levin, R.C., Mitchell, G.J., Volker, P.A., Will, G.F. (2000, July). The Report of the Independent Members of the Commissioner’s Blue Ribbon Panel on Baseball Economics. Major League Baseball. Retrieved from http://mlb.mlb.com/mlb/downloads/blue_ribbon.pdf Levine, J.F. & Maravent, B.A. (2010). Fumbling Away the Season: Will the Expiration of the NFL-NFLPA CBA Result in the Loss of the 2011 Season?. Fordham Intellectual Property, Media & Entertainment Law Journal, 20(4), 1419, 1452. Liebmen, J.M. (2009) Tip Your “Cap” to the Players: 2007–2008 Off-Season Reveals NHL’s Salary Cap Benefits on Players. Sports Lawyers Journal, 16(81), 91-92. Luongo Signs 12-Year Extension. (2009, September 3). Retrieved from http://sports.espn.go.com/nhl/news/story?id=4439836 Mathieu Schneider Joins NHLPA Staff. (2011, February 23). ESPN. Retrieved from http://sports.espn.go.com/nhl/news/story?id=6152080
American Journal of Management vol. 13(1) 2013 63

Mickle, T. (2010). NHL Expects Total Revenue to Top $2.7B. Street and Smith’s SportsBusiness Journal. Retrieved from http://www.sportsbusinessdaily.com/Journal/Issues/2010/06/20100628/This-Weeks-News/NHL-Expects-Total-Revenue-To-Top-$27B.aspx?hl=NHL%20Expects%20Total%20Revenue%20to%20Top%20%242.7B&sc=0 Mirtle, J. (2011, July 6). Burke: Richards Deal Amounts to Cap Circumvention. Globe and Mail. Retrieved from http://www.theglobeandmail.com/sports/hockey/leafs-beat/burke-richards-deal-amounts-to-cap-circumvention/article2088365 Molinari, D. (2011, November 11). On the Penguins: Rule 48 Doesn’t Go Far Enough. Pittsburgh Post Gazette. Retrieved from http://www.post-gazette.com Morreale, M. (2010, February 11). Bettman: No Olympic Decision is Imminent. NHL. Retrieved from http://www.nhl.com/ice/news.htm?id=518135 Mortensen, C. (2011, June 22). Sources: 48 percent share for players. ESPN. Retrieved from http://sports.espn.go.com/nfl/news/story?id=6687485 NHL Approves Radical Realignment Plan. (2011, December 6). ESPN. Retrieved from http://espn.go.com/nhl/story/_/id/7321214/nhl-approves-radical-four-conference- alignment-plan NHL Hoping for Peaceful Labor Talks in Year Leading to CBA Expiration. (2011). Street and Smith’s SportsBusiness Journal, 17(193). Retrieved from http://www.sportsbusinessdaily.com/Daily/Issues/2011/06/17/Leagues-and-Governing-Bodies/NHL-Labor.aspx?hl=NHL%20Hoping%20for%20Peaceful%20Labor%20Talks%20in%20Year%20Leading%20to%20CBA%20Expiration&sc=0 NHL Investigating Hossa’s Contract with Blackhawks. (2009, July 31). USA Today. Retrieved from http://www.usatoday.com NHL, NHLPA Reach Agreement Governing Long-Term Contracts Kovalchuk Contract Registered. (2010, September 4). Retrieved from http://www.nhlpa.com/news/media-releases/details/2011/07/05/NHL-NHLPA-REACH-AGREEMENT-GOVERNING-LONG-TERM-CONTRACTS-Kovalchuk-Contract-Registered-Four-Circumvention-Investigations-Dropped-953 NHL Rejects Kovalchuk Contract for Salary Cap Circumvention. (2010, July 21). TSN. Retrieved from http://tsn.ca/nhl/story/?id=328025 NHL Rejects Kovalchuk Deal. (2010, July 21). ESPN. Retrieved from http://sports.espn.go.com/new-york/nhl/news/story?id=5397588 Rule 48 - Illegal Check to the Head. (n.d). NHL. Retrieved fromhttp://www.nhl.com/ice/page.htm?id=64063 NHL Salary Cap Rises $4.9 Million to $64.3 Million. (June 23, 2011). NHL. Retrieved from http://www.nhl.com/ice/news.htm?id=566927 NHL Salary Cap Set at $59.4 Million for 2010-11 Season. (2010, June 23). TSN. Retrieved from http://www.tsn.ca/nhl/story/?id=325481
64 American Journal of Management vol. 13(1) 2013

NHL Suffering Loss of Crosby, Giroux. (2011, December). Sports Illustrated. Retrieved from http://sportsillustrated.cnn.com/2011/hockey/nhl/12/14/sidney.crosby.claude.giroux.ap/index.html NHLPA Files Kovalchuk Grievance. (2010, July). Sports Illustrated. Retrieved from http://sportsillustrated.cnn.com/2010/hockey/nhl/07/26/kovalchuk.grievance/inde x.html Olney, B. (2011, June 12). The Possibility of MLB Realignment. [Web log post]. Retrieved from http://insider.espn.go.com/mlb/blog?name=olney_buster&id=6653525&action=login&appRedirect=http%3a%2f%2finsider.espn.go.com%2fmlb%2fblog%3fname%3dolney_buster%26id%3d6653525 Our Top Ten Stories: MLB Strike; Selig Cancels World Series. (2004). Street and Smith’s SportsBusiness Journal, 11(7). Retrieved from http://www.sportsbusinessdaily.com/Daily/Issues/2004/09/Issue-7/Special-Report-Brsbds-10Th-Anniversary/Our-Top-Ten-Stories-MLB-Strike-Selig-Cancels-World-Series.aspx Piercy, J. (2009, November 12). Fehr Agrees to Help NHLPA. CBC Sports. Retrieved from http://www.cbc.ca/sports/hockey/story/2009/11/12/sp-nhlpa-fehr.html Players Hope Fehr Takes Leadership Position with NHLPA. (2010, July 12). TSN. Retrieved from http://tsn.ca/nhl/story/?id=327377 Yerdon, J. (2009, July 19). Ilya Kovalchuk’s Stunning Contract with the Devils: By the Numbers. NBC Sports. Retrieved from http://prohockeytalk.nbcsports.com/2010/07/19/ilya-kovalchuks-stunning-contract-with-the-devils-by-the-numbers
American Journal of Management vol. 13(1) 2013 65
A New Resource for Social Entrepreneurs: Technology
Shalini S. Gopalkrishnan University of Central Florida
Social entrepreneurs have employed social capital, funding and a vision as intrinsic resources for building social enterprise. Technology is another crucial resource which has the capability to transform an idea into an operational endeavor. Technology supports in creating a new social venture, when one could not achieve scale in the past or not create one in the past without technology . Using aspects of Technology Diffusion theory, we show through several cases how technology can be another critical resource that can be utilized by Social ventures to create and broaden their enterprises and apply existing technology to leverage their businesses. INTRODUCTION Social Entrepreneurship
“There is nothing as powerful as a new idea in the hands of a first-class entrepreneur” Ashoka website. Social Entrepreneurship combines the finest of private enterprise with constructive social impact. It has seen an unprecedented growth in the last decade or so. Mixmarket alone has 92.1million borrowers with over $52.5billlion dollars in loans. (Mixmarket.org Oct 3rd 2012). The potential for this industry increases with the current economic situation. With such high numbers employed and impacted by this set of enterprises; it is becoming imperative that the best practices be applied.
Countries such as UK, USA are all encouraging individuals to set up such enterprises. It is estimated that there are over 80,000 such firms in the UK alone, with a turnover of 24 billion pounds and employing 800,000 people. (Social Enterprise UK) Estimates for the USA have over 1.4 million nonprofit organizations with revenues exceeding $1.36 trillion.( Wing, Pollak, Blackwood,2007). Even if a fraction of these are social ventures, the numbers are huge. Prime Minister Cameron has urged 1 million public sector employees to start new firms in this sector. (N Timmins, 2011).
Social entrepreneurs relate conventional, profitable entrepreneurial doctrines to solve social issues. “Social enterprises can help create jobs, devise innovative development solutions, and inspire young people to act as citizens who are both economically productive and socially engaged – all with the ultimate aim of promoting human dignity and greater social equity” notes the Brookings Institute. (Abdou, Nelson, Fahmy & Greenwald , 2010).
Resources
Social entrepreneurship employs numerous resources, all of which are not similar to a normal business. These include Symbolic vision, Social capital and financial resources. Symbolic vision is an important resource to enable such an enterprise taking off. The vision of the founder, to visualize the future, or ‘What could be?’ and communicate it to the group is essential to its being. The importance of
66 American Journal of Management vol. 13(1) 2013

social capital for this sector is crucial as it is only through such connections that the enterprise can thrive, grow and impact society. They are also doing it for that social community who would benefit from it and thus is a vital component of the enterprise. The need for financial resources is well-known in all enterprises.
Technology as a Resource
We would like to introduce an additional new resource to this mix: ‘Technology’. Now, in the traditional sense one would deploy technology using financial resources. In the case of social enterprises, where finances can be a strain and not easily attainable, utilizing the right technology has the possibility of helping the social enterprise take off at a lower cost, at a quicker pace, and in some cases, the enterprise could not exist without the technology (mPesa). In several other cases, having a newer/ cheaper technology makes it financially possible for the enterprise to grow /survive (technologies such as Social media used for Kiva etc.). Technology makes individual inspirations real on a larger scale.
To make an impact at a faster pace we need to leverage technology as the key growth force. Information technology has impacted banking (mobile banking/ mobile phones) to a degree, but Social media and Cloud Computing can change communities. Entrepreneurs comprehend that the surest way to grow is to innovate and use technology with a social purpose.
As Tim O ‘Reilly aptly puts it “What new technology does is create new opportunities to do a job that customers want done.(Brainyquote.com) “# Information #Technology has the ability to have everyone access information which is required for education, training, health and social issues. With software becoming more innovative, the progress made in mobile technology presents unparalleled prospects to offer this to everyone.
We will examine many cases where technology has been deployed successfully and what we could learn from this. We also examine the Technology Diffusion Theory which helps us understand and create a framework for social entrepreneurship.
Technology Diffusion Theory
French sociologist Gabriel Tarde first explained why some innovations spread in a culture and others do not. (Laws of Imitation-1903). Tarde came up with the S-shaped curve and also introduced the concept of innovations being more easily accepted by individuals with a broad-based or “cosmopolitan” outlook. (pp 392)
In 1943, Ryan/Gross conducted an experiment with corn seeds to explain technology diffusion. Their explanation of this was- several factors such as “well-established interpersonal ties” and habitual exposure to mass communication (p 127/ Rogers 1995). They validated Tarde’s model of an S shaped curve and added the 4 types of adopters and the five steps for successful innovation adoption. The main steps are:
Awareness Interest Evaluation Trial and Adoption
Rogers (1976), explains diffusion as “the process by which an innovation is communicated through
certain channels over time among the members of a social system.” Rogers goes on to explain that innovation is “ an idea, practice or object perceived as new by an individual or other unit of adoption. “
The focus is on the perceived as new by a group/individual. So the critical issue is “new” for the enterprise which could be achieved using the five stage AIETA process. - Innovators have been classified as: “(1) Innovators (venturesome), (2) Early Adopters (respectable), (3) Early Majority (Deliberate), (4) Late Majority (skeptical), and (5) Laggards (traditional)” (Rogers, 1995, pp. 183-185), based on their innovativeness.
American Journal of Management vol. 13(1) 2013 67

In the evolution of technology, social contacts are important as they bring different perspectives and ideas to the entrepreneur.
Stacks, Salwen (2009) note that:
a critical mass occurs when the diffusion process becomes self-sustaining. After the critical-mass point, individuals in a system perceive that “everybody else” has adopted the interactive innovation. With each successive adopter of an interactive innovation, the new idea becomes more valuable not only for each future adopter, but also for each previous adopter (p. 427).
This theory will be applied to the Social entrepreneurship sector and we shall evolve a framework
which would be useful for new and existing ventures. We now discuss the role of technology and the case studies briefly.
H1: Technology has been a significant growth driver for social enterprises in the last 5 years.
Role of Technology
Ten years ago if one needed feedback from customers, say to introduce a new product or how their services were being evaluated, it would involve a huge amount of manpower, time and cost, in addition, to the data being slightly outdated. With newer software products such as Buzz metrics this could be almost instantaneous at a fraction of the cost.
Apple’s new iPhone has “Siri” ,a technical assistant,- one could talk to in English, French, or German, and it provides answers for your queries. Even a month ago this wasn’t possible. This opens up large portions of illiterate humanity who can utilize the power of mobile networks and its benefits from banking to health care needs or education. Microsoft is in the process of refining GUI software which will again enable illiterates to access mobile technology. The focus of a large number of social enterprises is this section of society, and technology will enable them to come into mainstream banking/ information which are the lynchpins of modern society. Even rural agriculture benefits from information dissemination and accessing data from markets.
As pointed out on Benentech’s website, the world has the knowledge to solve our problems, but what is required are innovative solutions and match it with present technology at a low cost.
The following case studies give us a glimpse of what individuals and social enterprises have done using technology. This is just a sampling. Many organizations are now educating themselves about the merits of technology, learning what it can do for you and utilize it effectively. As one Technology CEO put it” Ask us what you need and we will find a technology that works for you”. (MPWS conference Oct. 4th 2011)
Sharing of experiences, learning process is so effortless with technology. One does not need to train thousands of trainers to impact a larger set of people all thanks to technology.
Our challenge is to create a network that the appropriate technology, at the right price, is made available to the sectors which need them. Today, this sector is being ignored by pure commercial ventures as being unprofitable. (Though examples such as Safari have shown us that due to high volumes and smart pricing, this can be an extremely profitable sector). The other vital challenge is to connect social entrepreneurs with Research and Development teams to redefine technologies for them or even invent new ones for their communities. CASE STUDIES
H2: Technology has been an effective tool in sectors such as education, health , environment, banking, communication, energy and agricultural markets for social enterprises.
68 American Journal of Management vol. 13(1) 2013
For a new start up – such as “Not for sale” the issues of incorporating technology are essential to achieving scale and effectiveness. Its survival may depend on use of technology for sheer numbers and reach. For existing social entrepreneurs, using technology to automate, informate and transform the business - Vital voices and several other examples show us how this was done. For mature social ventures, this could be a way to revitalize their user base and programming and perhaps even reinvent the firm. “Technology can act as an accelerant” comments Jared Cohen of Google.
Education
Khan Academy.org is a very cost effective way of education reaching millions of students around the world. This simple model uses a camera and Logitech head phone and a computer device and ONE single individual who sits in front of it and shows us how to solve various math/ economic problems and helps you study. They have over 2,300 videos now and have grown in employees since then. If one had to it without technology, we would need millions of dollars and over thousand teachers in all parts of the world. (it began with an investment of less than 200 dollars).
Students can view those videos over and over till they feel comfortable- they may practice and take tests. It is individualized, measures progress, and self learning and / or with help from a teacher. Over 2 million students watch these videos. Many of these are watched by teachers’ worldwide, who have not been trained well enough to teach the subject. They have, at no cost to people, improved the quality of education for millions around the world.
Others in the same field are MIT OCW (free), so the best education is available to millions at no cost. Apps for education through Apple University are being created and now number in the thousands.
Digital study hall Urvashi Sahni has created a digital study hall. This is an after school project for the poorer slum girls (and it is subsidized by a full time school during the day for middle income families) The Digital Study Hall has 3 technological parts:
The Postmanet: because of poor connectivity they get DVD’s and other storage media to educate them, EdTV allows them to turn regular TVs into computers ,eliminating the issue of investing in computer display, The Learning eBay a website that unites students and teachers/staff across geographical locations as well as time zones.
Benentech’s goal is simple- to use technology effectively for society. They are technology geeks who have used their skills and knowledge in education and other fields. They have created Bookshare, which has over 80,000 users (in US and India primarily), for people who have print disabilities to be able to read traditional books. This is the “world’s largest accessible digital library of scanned material”. Another service offered is Route 66 Literacy, which enables teenagers and older souls to be trained to read and write using web- based technologies.
MILLEE: Education and Mobile Phone Games Mobile and Immersive Learning for Literacy in Emerging Economies (MILLEE), uses cell phone games to improve English literacy skills .With 600 million phones in India, this is the perfect technology to reach the masses. With the world moving to English based commerce, such skills could mean employability. This is being used in India, China and Kenya.
DotNetFunda.Com is a popular website for online tutorials and guide for latest Microsoft® technologies aimed for beginners and intermediate level professionals. DotNetFunda.com offers articles on diverse areas of SDLC. This typically includes software development, tutorials (including video tutorials), Career Advice, interview questions, code snippets and discussion forum. They attract over 2, 00,000 visitors every month from 188 countries. Food/Agricultural Markets
World food program has partnered with many private sector companies to manufacture very high protein based food distributed easily, potatoes/bananas being grown with inbuilt vaccines, and Digital Food where a simple swipe card is given to undernourished people who use it at their local groceries and those groceries are replenished by world food programs.
COOPEUMO, a 350 member farmer’s cooperative - has created a database - DatAgro- to generate
American Journal of Management vol. 13(1) 2013 69

information for its members through the use of SMS. This covers prices on products and inputs, weather as well as global markets. Mobile phones, with their ubiquitous reach (90% in Chile) have become very valuable technological tools.
In Indonesia, Hamzah has used a very basic method of using old bottles to refashion them as a drip irrigation system. The cost of making such devices is less than 10% of conventional systems. This has benefited farmer cooperatives immensely.
José Roberto da Fonseca e Silva of Brazil through Eco-Engenho Institute has encouraged small scale farming through “solar-powered micro-irrigation system “thus leading to profitable small farmers. They have worked in Northeast Brazil, a semi-arid rural region, where he uses renewable energy and technology to create micro-irrigation systems via solar energy (H2Sol). In Baixas, they used a hybrid hydroponics system and a sprinkler irrigation set (using energy from the sun) to cultivate high value crops. He has also introduced biodigesters to improve the quality of soil and thus produce better crop.
Environment
Benentech has created a software program called “Miradi” which is used to aid environment conservation projects. This is a project management tool to monitor progress. This has been implemented in projects in Jillin, China and Puget Sound USA.
In Nepal, Babu, an engineer by training has created solar powered tukis, replacing expensive petroleum based kerosene as a source for lighting. He has also revived a traditional rotational trench composting and uses organic trash to produce compost for farmers thus generating revenue from this process.
Health
With fraud in pharmaceuticals, it could mean a matter of life and death if you buy a spurious medication. Illiteracy in these matters compounds the problem further. Bright Simmons in Ghana has set up the first SMS-telecom database to combat this. Customers send the code, via text, on the medication to the company and get an instant reply on its authenticity. This is a quick, easy and free way to prevent contaminated medicines being sold and saving millions of lives. It has also pushed the pharmaceutical companies to become more careful about producing quality products.
Howard Weinstein of Brazil has set up a manufacturing center to produce hearing aids using solar power instead of expensive zinc batteries. The manufacturing and distribution is done by deaf consumers.
Andres Martinez Fernandez in Spain has designed video microscopes; stethoscopes which can be used virtually and many other diagnostic tools to promote efficiency of health services in some areas of Colombia, Peru, and Nicaragua.
In Indonesia. Agus Gunnarto has developed sewage treatment plants which are small and affordable. Governments today do not have investments to do large scale projects and he has created a self financed model to improve sanitation in this village. Agus has set up treatment plants which gives the community clean water and fertilizers for the community and now there are catfish swimming there which has become another source of income-through fishing, which has helped pay for the maintenance costs. By- products include manure, chicken feed etc. As this has been very successful they are being replicated in other parts too.
In Kenya, David has developed “technology-enabled sanitation "kiosks"” to reduce diseases and environmental degradation. In these areas it was expensive to even build a toilet. So David built these kiosks- which were designed in the community workshops- which generate revenue. They have advertisements, a telephone booth leased out and newspaper vendors which reduces the cost per user to use these sanitation kiosks. Urine is used for composting and human waste is converted into gas which is pumped back into the kiosk for electricity.
70 American Journal of Management vol. 13(1) 2013
Government The Indian government, for its 12th 5 year plan, has created a web portal to receive inputs from
individuals all across the country to ensure more inclusive growth ideas. Even USA’s super committee on deficit reduction is doing the same. Energy
Imagine if 75% of the population does not have access to electricity. This is the case in Nicaragua. Over 2.5 million people are bereft of this fundamental resource for growth .Given the high cost of investment in this sector they have found it impossible to attract investors. Blue energy initiated a locally based project to create hybrid natural resources energy devices, powered by wind and solar. These are manufactured, maintained at the community level. This is a much lower cost energy and is also continuously available as they have combined wind and solar together with the assistance of The National Technological Institute of Nicaragua (INATEC). The cost is in the 10,000-15000 dollar range which has come from donors and Kiva etc. The individual families buy a kit (a battery electric bulbs etc.) with a deposit and have to pay 3-5 dollars for a 10-21 day period to access electricity. This would give them access to communications (radio/TV computers) to clean drinking water and so much more.
Banking
Mpesa uses the mobile phone to help farmers /rural workers in far flung villages with no access to banking to save time money and to conduct all their banking needs over the cell phone. They have amassed a large number of laborers who had no access to banking and now have access to a savings account through the cell phone. He can access his money, make payments, receive his wages and receive interest. They saved on average US $ 6.67 per transaction (survey by Safari com) and 24% of them said they bought more food with their savings. Time was freed to work more and earn additional income. M-Pesa contributed to 9% of Safaricom’s annual revenue (around 90 million dollars and have over 8 million users.). As can be clearly seen, this has become a major profit generator. There are more than 15 other mobile banking services such as Afghanistan’s M-Paisa, Brazil: Bradesco and Caixa, Cambodia: WING Money, Cote d’Ivoire: MTN Mobile Money, Orange Money, India: WING Money, Cote d’Ivoire: Eko, and Zap, Pakistan.
Communication
Village Telco: used a very unique way of building a telecommunication system. It is a plug and play system for any new village. This group designed a new communication device and gave it away to a manufacturer for free, only if they would further distribute the design free to anybody. They have over 500 people working on various aspects of it, on a volunteer basis using freely available Wi-Fi networks. Around 1,000 units have been sold on ‘Mesh Potato’, which covers applications such as disaster relief, cyber café, telephone for the community. The Mesh Potato is a Mesh enabled WiFi device with an RJ11 port to connect an inexpensive regular phone and an RJ45 to connect any IP device. (Stanford Innovation series)
Rural Telecom Foundation (RTF), founded by Madan Mohan Rao, brings connectivity to the rural parts of India, which allows it to be part of the mainstream commercial/economic social and even cultural activities RTF uses a customized party line system via BSNL (Government corporation), to offer communication to a town as a group –up to 15 people. Using an efficient cheap design, in which a single line is spilt into many and is easily enlarged, is what makes this affordable and unique. As this is matched with the CDOT exchange, there is no need to add cost-prohibitive hardware. There is also no need for additional power.
MXit IM is a mobile instant messenger and social networking software application that allows you to chat anywhere on earth from your mobile or PC for free. This has been immensely popular and has over 13 million users. It is a fun IM, but has been used for many aspects such as remote drug counseling too. Their aim is to be a largest global community of mobile users. This is very powerful to bring about social change. (Gopalkrishnan 2010)
American Journal of Management vol. 13(1) 2013 71
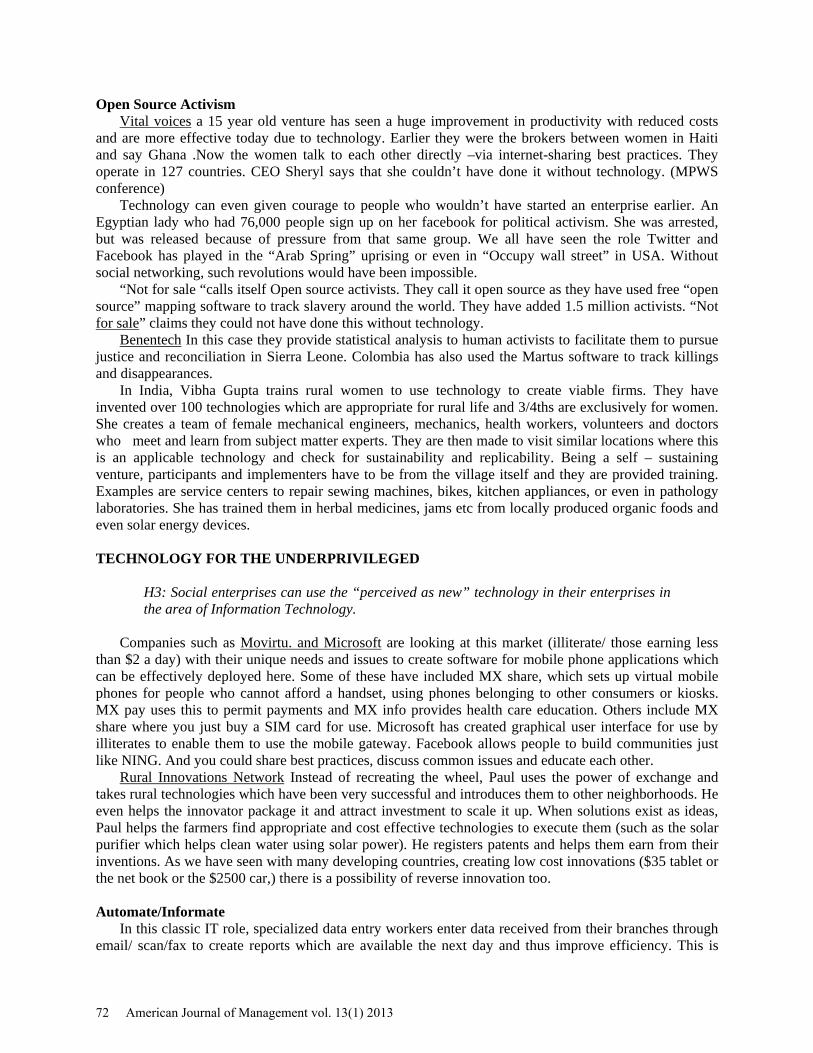
Open Source Activism Vital voices a 15 year old venture has seen a huge improvement in productivity with reduced costs
and are more effective today due to technology. Earlier they were the brokers between women in Haiti and say Ghana .Now the women talk to each other directly –via internet-sharing best practices. They operate in 127 countries. CEO Sheryl says that she couldn’t have done it without technology. (MPWS conference)
Technology can even given courage to people who wouldn’t have started an enterprise earlier. An Egyptian lady who had 76,000 people sign up on her facebook for political activism. She was arrested, but was released because of pressure from that same group. We all have seen the role Twitter and Facebook has played in the “Arab Spring” uprising or even in “Occupy wall street” in USA. Without social networking, such revolutions would have been impossible.
“Not for sale “calls itself Open source activists. They call it open source as they have used free “open source” mapping software to track slavery around the world. They have added 1.5 million activists. “Not for sale” claims they could not have done this without technology.
Benentech In this case they provide statistical analysis to human activists to facilitate them to pursue justice and reconciliation in Sierra Leone. Colombia has also used the Martus software to track killings and disappearances.
In India, Vibha Gupta trains rural women to use technology to create viable firms. They have invented over 100 technologies which are appropriate for rural life and 3/4ths are exclusively for women. She creates a team of female mechanical engineers, mechanics, health workers, volunteers and doctors who meet and learn from subject matter experts. They are then made to visit similar locations where this is an applicable technology and check for sustainability and replicability. Being a self – sustaining venture, participants and implementers have to be from the village itself and they are provided training. Examples are service centers to repair sewing machines, bikes, kitchen appliances, or even in pathology laboratories. She has trained them in herbal medicines, jams etc from locally produced organic foods and even solar energy devices.
TECHNOLOGY FOR THE UNDERPRIVILEGED
H3: Social enterprises can use the “perceived as new” technology in their enterprises in the area of Information Technology.
Companies such as Movirtu. and Microsoft are looking at this market (illiterate/ those earning less
than $2 a day) with their unique needs and issues to create software for mobile phone applications which can be effectively deployed here. Some of these have included MX share, which sets up virtual mobile phones for people who cannot afford a handset, using phones belonging to other consumers or kiosks. MX pay uses this to permit payments and MX info provides health care education. Others include MX share where you just buy a SIM card for use. Microsoft has created graphical user interface for use by illiterates to enable them to use the mobile gateway. Facebook allows people to build communities just like NING. And you could share best practices, discuss common issues and educate each other.
Rural Innovations Network Instead of recreating the wheel, Paul uses the power of exchange and takes rural technologies which have been very successful and introduces them to other neighborhoods. He even helps the innovator package it and attract investment to scale it up. When solutions exist as ideas, Paul helps the farmers find appropriate and cost effective technologies to execute them (such as the solar purifier which helps clean water using solar power). He registers patents and helps them earn from their inventions. As we have seen with many developing countries, creating low cost innovations ($35 tablet or the net book or the $2500 car,) there is a possibility of reverse innovation too.
Automate/Informate
In this classic IT role, specialized data entry workers enter data received from their branches through email/ scan/fax to create reports which are available the next day and thus improve efficiency. This is
72 American Journal of Management vol. 13(1) 2013
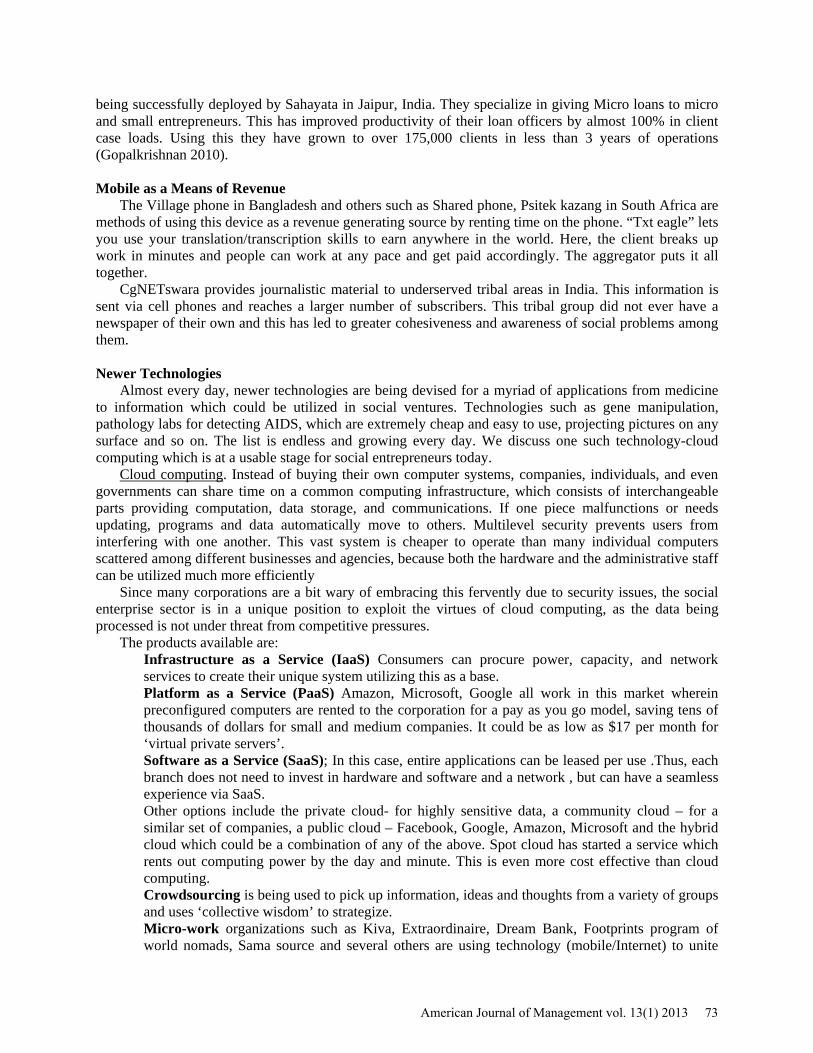
being successfully deployed by Sahayata in Jaipur, India. They specialize in giving Micro loans to micro and small entrepreneurs. This has improved productivity of their loan officers by almost 100% in client case loads. Using this they have grown to over 175,000 clients in less than 3 years of operations (Gopalkrishnan 2010).
Mobile as a Means of Revenue
The Village phone in Bangladesh and others such as Shared phone, Psitek kazang in South Africa are methods of using this device as a revenue generating source by renting time on the phone. “Txt eagle” lets you use your translation/transcription skills to earn anywhere in the world. Here, the client breaks up work in minutes and people can work at any pace and get paid accordingly. The aggregator puts it all together.
CgNETswara provides journalistic material to underserved tribal areas in India. This information is sent via cell phones and reaches a larger number of subscribers. This tribal group did not ever have a newspaper of their own and this has led to greater cohesiveness and awareness of social problems among them.
Newer Technologies
Almost every day, newer technologies are being devised for a myriad of applications from medicine to information which could be utilized in social ventures. Technologies such as gene manipulation, pathology labs for detecting AIDS, which are extremely cheap and easy to use, projecting pictures on any surface and so on. The list is endless and growing every day. We discuss one such technology-cloud computing which is at a usable stage for social entrepreneurs today.
Cloud computing. Instead of buying their own computer systems, companies, individuals, and even governments can share time on a common computing infrastructure, which consists of interchangeable parts providing computation, data storage, and communications. If one piece malfunctions or needs updating, programs and data automatically move to others. Multilevel security prevents users from interfering with one another. This vast system is cheaper to operate than many individual computers scattered among different businesses and agencies, because both the hardware and the administrative staff can be utilized much more efficiently
Since many corporations are a bit wary of embracing this fervently due to security issues, the social enterprise sector is in a unique position to exploit the virtues of cloud computing, as the data being processed is not under threat from competitive pressures.
The products available are: Infrastructure as a Service (IaaS) Consumers can procure power, capacity, and network services to create their unique system utilizing this as a base. Platform as a Service (PaaS) Amazon, Microsoft, Google all work in this market wherein preconfigured computers are rented to the corporation for a pay as you go model, saving tens of thousands of dollars for small and medium companies. It could be as low as $17 per month for ‘virtual private servers’. Software as a Service (SaaS); In this case, entire applications can be leased per use .Thus, each branch does not need to invest in hardware and software and a network , but can have a seamless experience via SaaS. Other options include the private cloud- for highly sensitive data, a community cloud – for a similar set of companies, a public cloud – Facebook, Google, Amazon, Microsoft and the hybrid cloud which could be a combination of any of the above. Spot cloud has started a service which rents out computing power by the day and minute. This is even more cost effective than cloud computing. Crowdsourcing is being used to pick up information, ideas and thoughts from a variety of groups and uses ‘collective wisdom’ to strategize. Micro-work organizations such as Kiva, Extraordinaire, Dream Bank, Footprints program of world nomads, Sama source and several others are using technology (mobile/Internet) to unite
American Journal of Management vol. 13(1) 2013 73
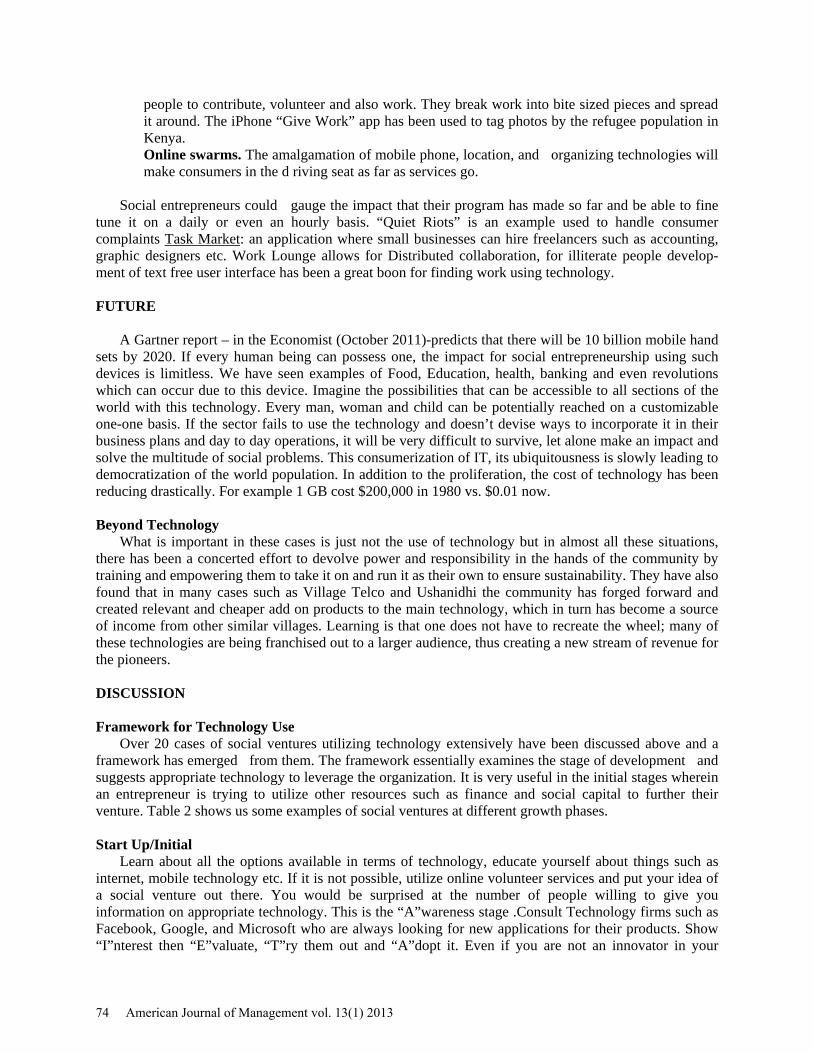
people to contribute, volunteer and also work. They break work into bite sized pieces and spread it around. The iPhone “Give Work” app has been used to tag photos by the refugee population in Kenya. Online swarms. The amalgamation of mobile phone, location, and organizing technologies will make consumers in the d riving seat as far as services go.
Social entrepreneurs could gauge the impact that their program has made so far and be able to fine
tune it on a daily or even an hourly basis. “Quiet Riots” is an example used to handle consumer complaints Task Market: an application where small businesses can hire freelancers such as accounting, graphic designers etc. Work Lounge allows for Distributed collaboration, for illiterate people develop-ment of text free user interface has been a great boon for finding work using technology. FUTURE
A Gartner report – in the Economist (October 2011)-predicts that there will be 10 billion mobile hand sets by 2020. If every human being can possess one, the impact for social entrepreneurship using such devices is limitless. We have seen examples of Food, Education, health, banking and even revolutions which can occur due to this device. Imagine the possibilities that can be accessible to all sections of the world with this technology. Every man, woman and child can be potentially reached on a customizable one-one basis. If the sector fails to use the technology and doesn’t devise ways to incorporate it in their business plans and day to day operations, it will be very difficult to survive, let alone make an impact and solve the multitude of social problems. This consumerization of IT, its ubiquitousness is slowly leading to democratization of the world population. In addition to the proliferation, the cost of technology has been reducing drastically. For example 1 GB cost $200,000 in 1980 vs. $0.01 now.
Beyond Technology
What is important in these cases is just not the use of technology but in almost all these situations, there has been a concerted effort to devolve power and responsibility in the hands of the community by training and empowering them to take it on and run it as their own to ensure sustainability. They have also found that in many cases such as Village Telco and Ushanidhi the community has forged forward and created relevant and cheaper add on products to the main technology, which in turn has become a source of income from other similar villages. Learning is that one does not have to recreate the wheel; many of these technologies are being franchised out to a larger audience, thus creating a new stream of revenue for the pioneers. DISCUSSION Framework for Technology Use
Over 20 cases of social ventures utilizing technology extensively have been discussed above and a framework has emerged from them. The framework essentially examines the stage of development and suggests appropriate technology to leverage the organization. It is very useful in the initial stages wherein an entrepreneur is trying to utilize other resources such as finance and social capital to further their venture. Table 2 shows us some examples of social ventures at different growth phases.
Start Up/Initial
Learn about all the options available in terms of technology, educate yourself about things such as internet, mobile technology etc. If it is not possible, utilize online volunteer services and put your idea of a social venture out there. You would be surprised at the number of people willing to give you information on appropriate technology. This is the “A”wareness stage .Consult Technology firms such as Facebook, Google, and Microsoft who are always looking for new applications for their products. Show “I”nterest then “E”valuate, “T”ry them out and “A”dopt it. Even if you are not an innovator in your
74 American Journal of Management vol. 13(1) 2013

venture you could pick up technology – which may be old in the commercial markets- and apply it here. In order to “Recognize opportunities”, technology savviness is a given in this decade. Some examples in this phase are Saaf Paani, mPesa, Cybercapital, Kiva, MILLEE.
Growth
Utilize Zuboff’s: automate/informate model, if you have investments in hardware software, instead of upgrading- look at options such cloud computing, Open source software, Crowdsourcing etc. to reduce cost. Reexamine your strategy and examine holes which need to be fixed and check if technology can provide an answer. COOPEUMO, Fundraising using Twitter and Facebook are apt examples for this phase.
Maturity/Reinvent
Vital voices a 15 year old venture was using enormous resources to act as a broker of best practices between women in all parts of the world. Social media has eliminated this onerous task and freed them to do more core work. They could not have survived so spectacularly if they hadn’t reinvented themselves with technology. One can formulate a totally different business model based on the use of technology. Let’s take education- access; supplies were a very big roadblock. Now with India launching the $35 tablet, supplies such as paper books/ pencils are replaced by just tablets. Worksheets get replaced by webisodes or online work. Look at “purdah education”. Millions of girls today cannot study as they cannot leave the house. Once such technologies are made available to them, they could not only study from the safe confines of their “Purdah”, but even potentially work. If you haven’t utilized technology become a “Late Adopter”, by going through the five step process. CONCLUSION
In a year or so from now, my fervent desire would be that Technology is not spoken of in awe, or something we do not understand but be part of the basic literacy of starting a venture. Technology will and needs to be a vital part of the resources available to social ventures. It is highly profitable, impactful at a larger scale at a quicker pace. These cases have shown us that most of these have been decade old and everyday with new technologies being created in the core technology sector, we will have more options available to us. The entrepreneurs need to assess their needs and communicate widely with technology geeks and let their imaginations soar to create magnificent and sustainable institutions. Technology has to become an integral part of an overall strategy for social entrepreneurs. Future research can examine if technological resources are complementary or supplementary to a firm.
Implications for Policymakers and Practitioners
Policy makers need to become “A”ware and onto “E”valuation stage of the model. They need to assess the stage they are at and move up. More importantly, policy makers and practitioners need to understand the implications of technology for their enterprises. They do not have to become techno-geeks, but how it can be used to further their ventures. They have to level the playing field with Technology. In addition, existing ventures need to be evaluating their automation/ informating and transformative assessments to enable them to move ahead. The aim of this paper was to Create the “A”wareness for people in this sector about technology and get them “I”nterested through relevant and appropriate examples of situations in their industry. To also enable them to “E”valuate and then onto “T”rial and “A”doption. Theory tells us that the more knowledgeable /cosmopolitan the group is, there is a greater likelihood of them creating the ‘A’wareness and ‘I’nterest part of the model. Knowing this, we need to educate those entrepreneurs specifically in technology and applications for them will flow forthwith. Table 1 shows a list of examples for some representative technologies. Potentially each of these examples listed above could become franchisees of their technologies and ideas to other social entrepreneurs with similar needs. As the theory states, perhaps the board of the venture should have “Cosmopolitan” members who could provide a perspective on this, or even better have a technologist on the board.
American Journal of Management vol. 13(1) 2013 75

REFERENCES Ehaab, A, Nelson, J., Fahmy, A., and Greenwal, D. (April 2010). “The Status and Potential of Social Entrepreneurship in the Middle East.” Brookings Institution. pp 5. Gopalkrishnan, S. (2010).” TRANSFORMING SOCIAL ENTREPRENEURS: TECHNOLOGY AND INNOVATION” 36th ASBE conference. Kasturi Rangan V, Leonard H, McDonald S. (2008). The Future of Social Enterprise Harvard Business School Working Paper. Paul, R., Clay, A. (Sept 26 2011). “Scaling Social Impact by Giving Away Value “Stanford Social Innovation Review http://www.ssireview.org/opinion/entry/scaling_social_impact_by_giving_away_value Rogers E. M. (March 1976). J New Product Adoption and Diffusion, Journal of Consumer Research Inc, Vol. 2, No. 4 pp. 290-301: http://www .jstor.org/stable/2488658 . Rogers, E. M. (1995). Diffusion of innovations (4th Ed.). New York: Free Press. Sahni U, Rahul Gupta, Glynda Hull, Paul Javid, Tanuja Setia, Kentaro Toyama, and Wang R. (2008). Using Digital Video in Rural Indian Schools: A Study of Teacher Development and Student Achievement. Annual Meeting of the American Educational Research Association. Stacks, D., Salwen, M. B. (2009). An integrated approach to communication theory and research 2nd edition Routledge NY. Tarde, Gabriel de; Parsons, Elsie Worthington Clews. (1903). The laws of Imitation. New York: H. Holt and Company. Timmins, N. (2011, October 4th). “Soft form of Capitalism” Financial times pp.13. Wing, Kennard T., Thomas H. Pollak, and Amy Blackwood. The Nonprofit Almanac (2008). Urban Institute Press. Zuboff, S. (1989). In the age of the smart machine: The future of work and power, The Academy of Management Executive. Benenetech website www.benentech.org/about/ Proof mobile money can make money? M-PESA earns serious shillings for Safaricom http://technology.cgap.org/2010/06/07/proof-mobile-money-can-make-money-m-pesa-earns-serious-shillings-for-safaricom/ http://www.fastcompany.com/multimedia/slideshows/content/profitspurpose.html?page9 http://images.businessweek.com/ss/09/04/0403_social_entrepreneurs/26.htm Social Enterprise UK: http://www.socialenterprise.org.uk/pages/frequently-asked-questions.html Cohen, J Oct 8th 2011 Special report personal technology Economist, pp 20.
76 American Journal of Management vol. 13(1) 2013

Ashoka website: http://www.ashoka.org/lemelson2 Khan academy http://www.wired.com/magazine/2011/07/ff_khan/all/1; www.khanacademy.org/ MIT OCW http://www.cs.washington.edu/education/courses/cse590f/06au/docs/dsh-tr1.pdf MPWS conference Oct. 4th 2011 www.fortuneconferences.com/mpws/program.html ocw.mit.edu/ Mobile and Immersive Learning for Literacy in Emerging Economies (MILLEE) www.millee.org World food Program www.wfp.org
TABLE 1
A few Successful social entrepreneurial applications of technology Successful applications Technology Nepal- tukis for light Solar power/Wind Power Caribbean-Blue energy- electricity for coastal Brazil- energy for hearing aids Philadelphia- Big Belly solar trash compactors Brazil- for micro irrigation Kenya- Banking, easypaisa, caixia Mobile Phones Ghana- Detecting Fraudulent medicines Bangladesh - Market prices / inventory India- education apps COOPEUMO- database with access to latest crop prices NAFIS- agricultural practices India- CgnEtswara News -Tribe in India Infotrade Uganda, SMS sokoni, Infoprix Benin -Markets Buy/sell products Grameen phone - renting mobile .Kenya- Iphone ‘Give work’ app Vibha Gupta –training groups Social Media Fund raising using twitter Forming communities via facebook Vital voices Women in similar situations share knowledge. Facebook Causes- TxTeagle- selling transcription services online World wide- Craft network USA- Ground Report – Digital reporting Literacy – Bookshare for disabled Internet Mxit IM – Remote drug counseling Kiva- Loans from across the world Denmark- Cybercapital raises loans ($15 m India-Rang De- Loans Work lounge – distributed Collaboration. Task market- Freelancers
American Journal of Management vol. 13(1) 2013 77

USA- Better world Books USA- Academic earth Middle east- digital food UNFP India- Sahayata Microfinance Automation/Software America/Africa-digital Green P2P 7500 videos on how to farming Not For sale Durban- Urban Ministries Location Technologies (Raise awareness of homeless) Red Cross- donate blood __________________________________________________________________________________
TABLE 2
Growth phase and technology enabled corporations __________________________________________________________________________________ Phase Example __________________________________________________________________________________ Start Up/ initial Kiva; Cybercapital Mpesa; Not for sale Growth Vital voices World vision‘s LMMS (Last Mile Mobile solutions) in Haiti saved significant time/money Mature /Reinvent Urban Ministries __________________________________________________________________________________
78 American Journal of Management vol. 13(1) 2013

Leadership Metaphors: Developing Innovative Teaching Strategies
R. Wilburn Clouse Vanderbilt University
Terry Goodin
Middle Tennessee State University
Joseph Aniello Francis Marion University
Noel McDowell
McDowell & Associates
Darlene McDowell McDowell & Associates
Research conducted over the last half century has revealed that optimal learning takes place in the brain when both the left-brain and the right brain work in balance. Educators can intentionally arouse the activation of one hemisphere of the brain over the other through the use of right brain strategies in language learning. These strategies, including analogy, metaphor, synthesis, and imagery connect the two separate thought processes of the brain, linking the sequential analytical knowledge of the left brain with the conceptual patterns and images of the right brain. In 1997 Clouse and colleagues developed a teaching strategy called “Whole-Part- Whole,” where the learning is tied directly with the framework of the learner. Through “just in time teaching,” the student learns the parts of a opened-ended case. The recursive design allows students to recreate a new “whole,” which becomes new applied knowledge. The whole-brain theory and the Whole-Part-Whole strategy of learning were used as the basis for an assignment at Vanderbilt University in which graduate students were asked to write a paper using metaphors to describe leadership skills of a leader that they knew. Students were required to tie the metaphor to leadership theory. Students were very creative in the development of metaphors to describe leaders that they enjoyed and admired. INTRODUCTION
The simplest way for one person to communicate a message or idea to another person is to use
sentences containing words having their literal senses or meanings. But one may also use words figuratively, for example using analogies and metaphors to convey thoughts or ideas. By combining ordinary vocabulary in unusual ways, a figure of speech can sometimes communicate meaning more
American Journal of Management vol. 13(1) 2013 79
effectively, and consequently can enrich literary and conversational experiences. Metaphors especially make something new out of ordinary words or phrases – something that cannot be said without recourse to the metaphor itself.1
As defined by Aristotle, the term “metaphor” meant the transfer of a term, naming one thing in terms of another on the basis of a perceived similarity. Traditionally, the Aristotelian metaphor was considered to be a figure of speech in which parallels were drawn between two unlike entities as in the phrase by Aristotle, “the lion leapt” with the lion referring to Achilles (see Poetics 1457b; Rhetoric 1406b, 1410b, 1412a). In this metaphor a literal reference (Achilles) is replaced by a metaphorical reference (the lion). What makes the metaphorical identification of Achilles with a lion possible is that Achilles and lions have something in common, namely, their strength and bravery. Metaphor, in the Aristotelian concept, was used for artistic and rhetorical purposes only, a conscious and deliberate use of words to embellish or decorate language. It was not something that was essential to language or to human thought and reasoning (Kövecses, 2002; Ortony, 1993). Aristotle believed that to use metaphor well required special talent. In his words: “The greatest thing by far is to have command of metaphor. This alone cannot be imparted by another; it is the mark of genius.”
This classical Aristotelian definition of metaphor as a figure of speech was the universally accepted perception of metaphor in both scholarly circles as well as popular minds until the early 19th century (Gozzi, 1999). Around the turn of the century a group of English poets (including Shelley, Keats, and Coleridge) began to publish their views on metaphor. Maintaining that metaphor was basic to communication, their theory was in direct contradiction to Aristotle’s analysis that metaphor was merely an appendage to language. These poets were credited with precipitating the eventual split that occurred between the classical view held by Aristotle and the emerging romantic view that envisioned language to be an integral part of man’s conceptualizing and communicating (Hawkes, 1972).
It was not until 1936 with the work of I. E. Richards and an extension of his work by Max Black in 1962, however, that linguists, psycholinguists and cognitive psychologists developed an interest in metaphor (Gozzi, 1999). Using Richards’ terminology of a topic and a vehicle which are linked by a common ground, these interactionists, as they were later called, found at the root of every metaphor some kind of juxtaposition. By way of example, in Shakespeare’s “Juliet is the sun,” Juliet is the topic, sun is the vehicle, and the ground is composed of such properties as warmth, centrality, sustenance, brilliance, and so on.
In the late 1950s, the inception of a new field of study called “cognitive science” approached learning from a multidisciplinary perspective. New experimental tools allowed scientists – anthropologists, linguists, philosophers, psychologists, neuroscientists – to begin serious study on the functioning of the mind and to test their theories rather than simply speculate about thinking and learning (Bransford, Brown, & Cocking, 2000). Although philosophers, including Locke and Kant, frequently wrote about the cognitive attributes of metaphors, it was the seminal study by George Lakoff and Mark Johnson in 1980 that changed the way many people perceived of the metaphor. Entitled Metaphors We Live By, Lakoff and Johnson’s study showed convincingly that metaphor is a pervasive aspect of both thought and ordinary language and is consequently the primary vehicle for language change (Kövecses, 2002). Their notion of metaphor has become known as the “cognitive linguistic view” of metaphor.
Lakoff and Johnson’s study challenged almost every characteristic of the commonly accepted use of metaphor as conceived by Aristotle. They argued that metaphor is a property of concepts and not just words and therefore is often not based on similarity. Its purpose is not for artistic and aesthetic purpose but rather an inevitable process in “the creation of our social, cultural, and psychological reality” (Kevocsis, 2002, p. xi). Lakoff and Johnson concluded that metaphor is used effortlessly in everyday life by ordinary people, not just by the gifted, as Aristotle asserted. In their words:
Metaphor is pervasive in everyday life, not just in language but also in thought and action. Our ordinary conceptual system, in terms of which we both think and act, is fundamentally metaphorical in nature…The way we think, what we experience, and what we do every day is very much a matter of metaphor. (p. 3)
80 American Journal of Management vol. 13(1) 2013

Since 1980, thousands of treatises by hundreds of philosophers, linguists, literary critics, rhetoricians, and psychologists have attempted to construct singular theories on metaphorical thinking. While all approach the subject from not only different disciples but different perspectives within those disciplines as well, most (but not all) base their work on the cognitive approach. The great numbers of multidimensional strands used to describe metaphors attest to the fact that metaphor is not something that can be easily confined and that it is an indispensable basis of language and thought today (Goatly, 1997). While not many decades ago the legitimacy of metaphors was vigorously debated, today metaphors are widely accepted as proper cognitive devices and valuable teaching tools (MacCormac, 1985). For a systematic introduction to, or critique of, theories of metaphor, the reader is directed to studies by Gibbs (1994), Gibbs and Steen (1999), Haskell (1987), Johnson (1981), and Ortony (1993).
In looking specifically at the ways in which metaphors can be used as teaching tools in classrooms, much of the research has centered on what has been discovered in the last twenty years about split-brain functions.
TEACHING WITH METAPHORS
Research on teaching and learning indicates that learning takes place in two separate areas of the
brain. In other words, each side of the brain has its own mode of thinking and learning. One part, called the right brain (because the functions appear to reside in the brain’s right hemisphere), controls visual thinking, holistic concepts, and pattern recognition. The other hemisphere, the left-brain, controls verbal and linear thinking. Researchers have been able to assign individual mental functions to each side of the brain through extensive research. These functions are summarized in the following table.
TABLE 1 LEFT BRAIN AND RIGHT BRAIN FUNCTIONS
Source: Adapted from Sanders and Sanders (1984), p. 18.
Left-brain dominated people focus on logical thinking, analysis, and accuracy. They often choose professions such as engineering, accounting, and the law. Right-brained people, on the other hand, focus on aesthetics, feeling, and creativity and are consequently drawn to the arts pursuing careers as writers,
Left Brain Right Brain Logical/orderly process Random processes Sequential Intuitive/simultaneous Rational Holistic Analytical Synthesis Objective Subjective Looks at parts Looks at wholes Practical Emotional Serious Playful Structured/Systematic Flexible Judgmental Nonjudgmental Recognizes names Recognizes faces Responds to verbal instruction Responds to visual and kinesthetic cues Uses language for memory Uses images for memory Dependent upon words for Interprets body language meaning
American Journal of Management vol. 13(1) 2013 81
musicians, and artists. There are some people, however, who are whole-brained and equally adept at both modes.
A pioneer in the study of brain functions was Dr. Roger Sperry, who won the 1981 Nobel Prize in Medicine for his work on the duality of the brain. Sperry’s research began in 1958 and provided momentum for the proliferation of left brain/right brain studies now emerging in psychology, neurology, and education. The resultant findings questioned assumptions previously held on how we learn. The most relevant question for teachers, of course, is what does it mean in terms of the way we teach children? For discussions on hemisphere lateralization and their implication on teaching see especially Bottini et al. (1994), Bransford, Brown, & Cocking (2000), Caine & Caine (1994) (2001), Danesi (1989), Gopnik, Meltsoff & Kuhl (1999), Ornstein (1997), and Rose and Myer (2002).
Left-brain vs. right-brain research has distinct relevance for today’s educators. Although teaching and learning research is filled with a rich vocabulary, addressing critical and creative thinking, analytical and holistic thinking, convergent and divergent thinking, etc., research indicates that in general, the educational system has traditionally focused on the development of left-brain modes of thinking over right-brain ones (Pugh, Hicks, Davis, & Venstra, 1992). This is understandable when research suggests that 90% of all people are left-brained and that most individuals indicate a preference for one style over another (McCarthy, 1981). For optimal learning to take place, however, research indicates that both hemispheres need to be employed equally (Sanders & Sanders, 1984).
According to Haskell (2001), “research literature on metaphorical, analogical reasoning, and the study of figurative language focus on structures and cognitive processes involved in encoding and retrieval of information that operate during learning, not on the implications for instruction” (p. 79). One instructional tool that is recognized in almost all domains of study as an effective learning device, however, is the metaphor.
The metaphor speaks to both sides of the brain and can therefore be used to develop and balance the thinking process. Sanders and Sanders (1984) explain that metaphors, along with analogies, synthesis, and imagery are specific strategies in written language that can be used to intentionally stimulate function of the right hemisphere of the brain. With the metaphor, the sequential, analytical, verbal knowledge of the left brain becomes “real” to the right brain, which relies on holistic conceptual patterns and images to understand what the “big picture” means. Sanders and Sanders go on to state that metaphor acts as a bridge to connect these two separate thought processes of the brain, connecting the literal with the figurative, the factual with the imaginative, and the rational with the intuitive.
The metaphor, therefore, can be used as a model to offer students a familiar image that demonstrates how a given concept actually works. Derived from familiar examples of everyday living, the metaphor aids the learner in internalizing new knowledge and information, assisting in the recall of facts and ideas in the process. Sanders and Sanders (1984) assert that the metaphor “is perhaps, the fastest and most effective route we have to link the right brain with left” (19). Metaphor allows imagery (right brain) to be verbalized and creates imagery for specific facts (left brain). Thus metaphor conjures a sensual image of the new concept by bridging the new knowledge to past ideas, images, and experiences already safely stored in the brain (Pugh et al., 1992).
Metaphors help to identify similarities between conceptual categories that may not be obvious at first glance – seeking to find what Aristotle called “similarities in dissimilarities.” Lakoff and Johnson (1980) called this mapping, using a mental map to make complex ideas easier to understand by synthesizing disparate ideas in the right brain that sequential thinking in the linear functions of the left brain often exclude. Lakoff and Johnson refer to metaphor as mapping structure from a source domain onto a target domain.
In order to create a metaphor, one must understand the core of the issue before it can be contrasted with something else. In fact, Bransford, Brown, and Cocking (2000) state that “all learning involves transfer from previous experiences. Even initial learning involves transfer that is based on previous experiences and prior knowledge” (p. 236). The right brain perceives relationships – it specializes in holistic, conceptual understanding. In other words, if we are to teach concepts as opposed to merely
82 American Journal of Management vol. 13(1) 2013
encouraging students to memorize definitions, a real-life model that shows how the concept can be applied is necessary.
The very fact that metaphor illustrates through comparison is what makes it such a powerful teaching tool. As students move from the concrete toward the abstract, they can use the metaphor tool to understand complex issues and to express abstract thoughts, conversation, and writing. The construction of analogy and metaphor, according to Piirto (2002), is an important part of information processing. A study by Lakoff and Turner (1989) found that the way humans conceptualize language is essential to an understanding of how humans process images. In fact, metaphors are vital in order for students to comprehend and digest sophisticated literature and poetry (Lakoff and Turner, 1989). Sanders and Sanders explain it this way:
Thinking in metaphors links concept and imagination; it expresses thoughts otherwise unexpressed; thinking in metaphors is a teachable skill – a skill than can motivate students to learn multiplication tables or value the principles of social interdependence. Metaphor thought provides an understanding of concepts not possible in the more passive activities of reading or writing. Indeed, metaphors are tools for insight, for creativity, for concept development, for learning, for true understanding. It is with the metaphor that we can unlock the part of our minds that schools have traditionally left closed and untapped, the part of our minds where conceptual imagery resides, the right hemisphere. (1984, p. 4)
Another interesting thing about teaching students to use metaphors is that metaphors require students to not only use all of the levels of Bloom’s (1984) taxonomy for cognition, they also pull the affective domain into the learning process.2 The affective domain includes the manner in which we deal with things emotionally, such as feelings, values, appreciation, enthusiasms, motivations, and attitudes. By having students pull their feelings and previous experiences into the learning process, their learning is enhanced. The way we interpret any situation or fact is influenced by how it affects us emotionally (Caine and Caine, 2001). Referring again to Lakoff and Johnson’s study (1980), metaphors are only understood in the context in which they are experienced. Their meaning comes from a complex set of responses and connections that are set up, some of which are emotional.
Pugh et al. (1992) contend that “metaphorical thinking cuts across subject and discipline boundaries by making knowledge in one domain a guide for comprehending knowledge in another, with some transfer of meaning taking place in both directions” (pp. 4-5). It is this transfer, this bridging, that makes metaphor a tool that can be used to express abstract thoughts (Haskell, 2001). “To be a metaphorical thinker,” according to Pugh et al., “is to be a constructive learner, one who actively builds bridges from the known to the new” (p. 5).
Similar to the work of Bransford, Clouse and colleagues have further developed the process and named it the Whole-Part-Whole learning process. The learner builds the new concept to be learned around some ideas or concepts that he/she already knows and then learns the pieces or parts of the new learning, thus developing a new concept attached to the previous knowledge base. The following figure provides a schema to show the Whole-Part-Whole process. A major portion of Clouse’s research work is designed to investigate ways in which entrepreneurship can be taught in various learning environments. His work is based on the following assumptions and learning theories.
Clouse’s work has been based on a set of assumptions about how people learn and how schools prepare students to live in the real world, the first of which is that much of traditional schooling in America is built around systems of compliance and control. This control approach tends to stifle students' creative and entrepreneurial instincts. The work of Clouse, Goodin and colleagues involves capturing the interest of the student through the use of problem- and project-based instruction delivered via the Internet. Much of their work has centered on a program called Entrepreneurs in Action!™ This program seeks to involve students in an entrepreneurial problem at the outset and to promote learning of traditional subject areas as a part of the problem solving activities that are undertaken. This strategy is designed to teach students to think entrepreneurially by the use of local cases and/or scenarios. Unlike many curriculum
American Journal of Management vol. 13(1) 2013 83

strategies that teach conformity, structured learning and unrelated learning, these strategies support creative and entrepreneurial thinking across the curriculum (Clouse & Goodin, 2001).
The Entrepreneurs in Action!™ program emphasizes the whole-part-whole instructional strategy that has been developed out of this research. We provide a situation where students see the entire picture of the opportunity, break the opportunity into parts and then move back to a new whole as developed from his or her own research regarding the opportunity. This approach involves seeing the big picture first, breaking it into parts (instructional units) and then putting it back together again into a new whole (See Figure 1).
FIGURE 1 WHOLE-PART-WHOLE LEARNING
This instructional design supports the Clouse theory where the concept being taught is connected (hooked) to the framework of the learner. Students learn and then apply new knowledge in situations that will reinforce their learning. Termed "recursive design," this strategy supports long-term learning of important concepts versus short-term memorization learning (See Figure 2).
FIGURE 2 RECURSIVE LEARNING MODEL
In addition to using our whole-part-whole concept and a recursive design, just-in-time learning techniques are also used by presenting curricular content just at the moment when the need for it arises; this feature addresses the issue of maintaining the relevance of the content being learned (Clouse, 2004). With these theories and assumptions in mind, students in a graduate course were given an assignment to
Mathematics
Science
Language Arts
Others
Whole Whole Part
Problem Context
Problem Solution
Learn -- Apply
84 American Journal of Management vol. 13(1) 2013

demonstrate their knowledge of leadership theory and behavior by using metaphors to describe a leader with whom they were familiar. Metaphors Profiling Leadership Skills
The students were asked to form their own metaphorical expressions relating to a person they have been associated with who has exhibited some form of leadership skill. The concept of metaphor in this assignment is used in its popular context asserting that A is B or that A is like B, for example: “The principal was a lighthouse.” In regards to expressive metaphors like these, a useful distinction between the source and target domain have been put forward by Lakoff and Johnson (1980). A metaphor implies that the target domain (the principal) is like the source domain (a lighthouse). While dissimilar in physical respects, they can both exhibit commonalities such as reassurance, comfort, light to guide the way, etc. This similarity between the domains is a central aspect of the process of using figures of speech. Metaphors relate one area of experience to another and in so doing can create new meaning and better understanding. Expressive metaphors describe by throwing new light on the target domain. They evoke by asking the recipient to draw on their own experience in the base domain and extend it to the new.
The students were asked to create the metaphors of their own accord. They were encouraged to follow their first instincts in forming lexical associations depicting the essential characteristics of a leader. The number of lexical items in each metaphor was unlimited. For the target domain, many chose past coaches, teachers, employers, or relatives who had influenced their lives. In addition, the students were asked to describe the organizational setting in which this person operated, the leader’s role within the organization, and the lessons learned from the person they chose. For purposes of this study, the metaphors are grouped into different clusters based on their semantic properties. The content analysis of the metaphors of leadership provided the following seven categories:
1) People: Archeologist/bulldozer operator, artist, Attila the Hun, big brother, boat captain, campaign manager/strategist, coach, father, gardener, general, gentle giant, the good shepherd, heptathlete, horticulturalist, king and his castle, King Arthur, man-child, master craftswoman, musical conductor, musician, opportunist, physician, pioneer, runner, sculptor, shopper, surgeon, task master, teacher
2) Nature: Magnolia tree, Mother Nature, mountains, river, tornado, tree, wind 3) Animals: Catskill eagle, hawk, head lion, head lioness, mother hen, spider, stork 4) Transportation: bi-plane, sailboat, spaceship, Swedish Sloop tugboat 5) Creativity and Energy: Delicate dance, energizer bunny, motion picture, multi-plug power
strip, television commercial 6) Objects: child’s growing mouth, china cup with a crack, hard-boiled egg, inflatable clown, iron
fist in a velvet glove, rolling pin, rope, steel fist in a kid glove, white lightning (alcohol) 7) Guidance: Automobile headlights, bridge, compass, lighthouse, pendulum/clock, pipeline
Following are three examples – horticulturist, a rope, and a Catskill Eagle – illustrating how students
were able to use metaphors to profile leadership skills. The Horticulturist
First appearances revealed an expansive, well-maintained garden. Each section of the garden seemed to be fed, but only enough to sustain life as the majority of the garden’s resources were used to maintain
American Journal of Management vol. 13(1) 2013 85

the large oak tree in the center of the garden. Although the oak tree nourished and protected the rest of the garden, the discerning eye of the horticulturist could see that the venerable tree was diseased.
In this paper, the horticulturist was used as a metaphor for a school superintendent who faced many challenges following a retiring superintendent of eleven years. The diseased oak tree represented administrative abuse of power, lack of respect for educators, lack of involvement by the community and parents, and the misuse of resources. The new superintendent (the horticulturist) had to plant seeds to grow programs, cull the abusive power prevalent at the top, develop and empower educators to take greater action, invite parent and community involvement to nurture new potential, and finally alter the flow of resources to better encourage growth.
After pruning the great oak, the horticulturist found that more resources were available for other sections of the garden. Where shade provided protection for young seedlings, he found that lasting sunshine was required for continual growth. The previously administered small amounts of water may have reduced the chance of flooding, but now healthy plants were capable of absorbing more water and the oak required less. Thus, the garden grew strong and beautiful and was able to rejuvenate itself each year.
The author of this paper realized that the superintendent helped to shape his leadership character by demonstrating his ability to ascribe to an integrity of principle, by strengthening his ability to avoid system abuse, and by recognizing and utilizing the power of people within the system to create improvement and excitement for change.
A Rope
Another paper used the analogy of a rope to describe the dean of students at a small boarding school. Like a rope, the dean was woven of many individual strands – he was multidimensional. It was this interweaving of all his parts that made him stronger. When pulled on by the pressures of students, staff, friends, and family, he (the rope) was pulled taut in opposite directions but did not snap. Instead, he became stronger with added tension – like a rope showing its greatest strength when it is stretched and pulled.
Another rope-like characteristic seen in the dean was his ability to tie things, people, and ideas together. Serving as dean of students involves a great deal of people management in terms of both students and staff. This dean was able to find common threads and pull out ideas that were designed to help all participants see things from a new perspective. He had the ability to draw a group together, wrap them around a common goal and interweave their differences. In the process, he used their assets and ideas to add to the uniqueness of the group. He braided them into a unified idea to which people were able to hold.
Like a rope, the dean was flexible. A rope is not a single solid shape but can be molded and adapted to serve varying purposes at any given time. This, rather than detracting from his strength, added a new dimension to the dean’s character. Like a rope that becomes a knot, loop, or lasso to serve a specific function, the dean bent to the process that worked best in any given situation.
A trained, guiding hand can take a rope and tie it into complicated knots, or form a lasso, or use it to scale a mountainside; but only the person who knows how to prepare the rope can successfully use it for its designed purpose. Like the rope, the dean depended on an outside force to move and guide him – the leadings of the Lord in his daily life.
If a rope is to be moved, it must be pulled, not pushed along. Similarly, the dean gently introduced new ideas to his organization and then allowed others to grab hold. The author of this paper stated that the dean “has woven himself into the framework of my life and is someone I will knot forget.” Catskill Eagle
Using Moby Dick for inspiration, one student compared his pastor to the Catskill Eagle described by Melville:
86 American Journal of Management vol. 13(1) 2013

There is a wisdom that is woe; but there is a woe that is madness. And there is a Catskill Eagle in some souls that can alike dive down into the blackest gorges, and soar out of them again and become invisible in the sunny spaces. And even if he forever flies within the gorge, that gorge is in the mountains; so that even in his lowest swoop the mountain eagle is still higher than the other birds upon the plain, even though they soar.
The author of this paper described the pastor of his church as diving into the gorge of his parish’s
poor and homeless to lift them from their suffering. He flew low enough to see the challenges firsthand yet high enough to soar over common objections. His vision was tremendous. Like the Catskill Eagle who knows no boundaries, the pastor ignored previous lines of demarcation between Christian denominations and enlisted the help of the entire religious community.
No matter what it is doing, whether it is soaring or diving, or perhaps even perched, the Catskill Eagle is a majestic creature that can awe the spectator at any time. Like the Eagle, the pastor’s leadership was always visible and it manifested itself in countless ways. He treated all people as equals, he listened with compassion and concern for his fellow man, and he opened the church to transients.
This student related how a terrible tragedy in the pastor’s life (his mother was murdered) led to the Catskill Eagle soaring higher than the author had ever seen anyone fly. He referred again to Moby Dick where Melville warns of the danger of flying in the gorge and feeling the sorrows of life: “Give not thyself up, then, to fire, lest it invert thee, deaden thee; as for a time it did me.” Gradually, as the years passed by, the Catskill Eagle managed to pull himself up from the fire that consumed him. Finding forgiveness in his heart and reiterating his belief in the inherent value of all human life, he emerged from the ashes like the mythological phoenix, continuing his crusade to help the poor.
The lessons the student learned were many. The pastor taught this student that a leader has strength, courage and determination. He taught that a leader must have vision and challenge boundaries. Most of all, he taught that for the right cause, a leader must be willing to sacrifice himself completely.
The metaphorical language used in these three papers as well as the other papers studied, is superior to literal language because it captures experiences and emotions better and it communicates meaning in complex, ambiguous situations where literal language is inadequate. Thus, metaphors are very useful instruments in studying people’s attitudes and thought processes. Moreover, metaphors suggest ways of defining and using concepts. Through metaphors we are able to understand how people, in this case, define the term “leadership skills” in their everyday language.
The following list provides twelve selective examples of metaphors the students used to describe leaders. While the students were describing one particular individual in their papers, the concepts related through the metaphors are transferable to almost anyone who exhibits leadership skills.
Leadership Profile Metaphors
Bridge Evokes security, strength, empowerment, vision and reliance to the followers who cross because of its solid foundation
Provides greater access to new ideas and challenges by crossing many mediums
Rises above to provide access and avenue to another side
Permits new things to be seen; vision of the
road ahead becomes clear
American Journal of Management vol. 13(1) 2013 87

Dancer Requires knowing the moves well enough to make the performance appear
natural, graceful, beautiful and unrehearsed
Uses fancy footwork to keep everyone happy
Hawk Swift in action Careful, diligent, and expeditious Keen vision Powerful grip Lighthouse Unique Strong Dependable Comforting Visual Assuring Source of light and comfort Serves small vessels as well as large
showing no partiality Magnolia Tree Provides shelter Germinates seeds Furnishes branches for climbing Demonstrates flexibility Yields beautiful blossoms Multi-plug Power Strip Generates and distributes energy Maximizes the amount of power and energy
Allows others to maximize their talents and abilities
Provides potentially greater outcome than originally planned
Musician Selects the melody Sets the tempo Establishes the key Invites the players
Brings together sections to create harmony and to complete the other players
Provides new artistic opportunities to balance the old standards
Makes changes through creative license River Wends its way through obstacles and
treacherous terrain Pushes through what stands in the way Moves gently and toward something
promised around the bend
88 American Journal of Management vol. 13(1) 2013

Dodges foothills and mountains Pushes through impeding earth Makes way for those who would follow Runner Exhibits endurance and stamina to effect
change Relies on preparation, discipline, and
knowledge Trains all muscles, not just the legs Measures improvement in increments Keeps going even when experiencing
difficulty in situations Never loses concentration Understands that only after completion of
the season does a runner truly understand the level of improvement
that has occurred with his ability to cope with problems associated with running
Scaffold Provides temporary support until learners
can become independent Provides freedom in learning through
structure Grows with the student Shopper Has the skills of a hunter Pursues tasks with patients and single-
mindedness Exhibits the determination of an explorer Finds the best deals Demonstrates joy in the hunt for better
deals Looks for guarantees Willingness to pay for quality Patient about making a decision;
willingness to shop around Informed about what is available Wind Invisible and yet her effects are observable Unpredictable—sometimes productive,
sometimes destructive Can be a source of relief on a hot day or a
source of terror during a tornado
Several identifiable threads or characteristics were exhibited in the majority of the papers. The person or object selected invariably exhibited leadership skills such as empowerment, vision, pursuit of excellence, and integrity. They led by example, giving detailed attention to planning and organization. They were compassionate and nonjudgmental, earning respect and giving it back. They encouraged growth and nurtured new potential in others. The papers attest to the fact that leaders value people, they empower others, they collaborate, they are good listeners and they are responsive. Inevitably, they are
American Journal of Management vol. 13(1) 2013 89
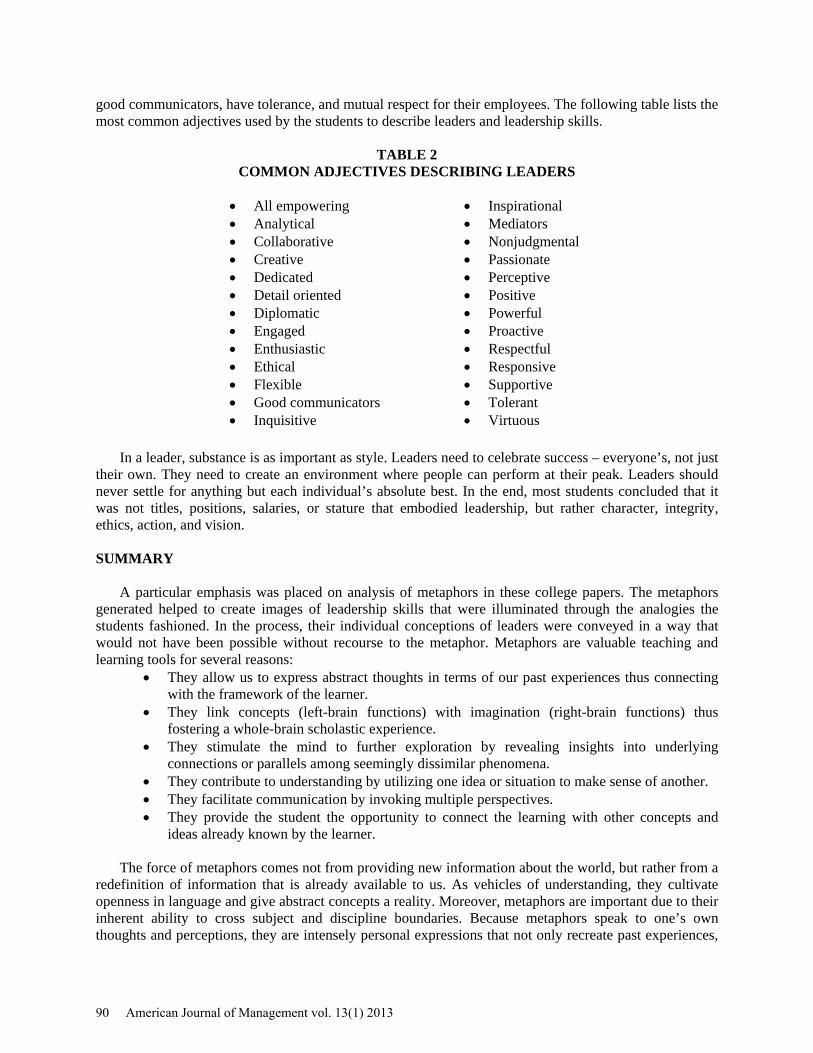
good communicators, have tolerance, and mutual respect for their employees. The following table lists the most common adjectives used by the students to describe leaders and leadership skills.
TABLE 2 COMMON ADJECTIVES DESCRIBING LEADERS
In a leader, substance is as important as style. Leaders need to celebrate success – everyone’s, not just their own. They need to create an environment where people can perform at their peak. Leaders should never settle for anything but each individual’s absolute best. In the end, most students concluded that it was not titles, positions, salaries, or stature that embodied leadership, but rather character, integrity, ethics, action, and vision. SUMMARY
A particular emphasis was placed on analysis of metaphors in these college papers. The metaphors generated helped to create images of leadership skills that were illuminated through the analogies the students fashioned. In the process, their individual conceptions of leaders were conveyed in a way that would not have been possible without recourse to the metaphor. Metaphors are valuable teaching and learning tools for several reasons:
• They allow us to express abstract thoughts in terms of our past experiences thus connecting with the framework of the learner.
• They link concepts (left-brain functions) with imagination (right-brain functions) thus fostering a whole-brain scholastic experience.
• They stimulate the mind to further exploration by revealing insights into underlying connections or parallels among seemingly dissimilar phenomena.
• They contribute to understanding by utilizing one idea or situation to make sense of another. • They facilitate communication by invoking multiple perspectives. • They provide the student the opportunity to connect the learning with other concepts and
ideas already known by the learner. The force of metaphors comes not from providing new information about the world, but rather from a
redefinition of information that is already available to us. As vehicles of understanding, they cultivate openness in language and give abstract concepts a reality. Moreover, metaphors are important due to their inherent ability to cross subject and discipline boundaries. Because metaphors speak to one’s own thoughts and perceptions, they are intensely personal expressions that not only recreate past experiences,
• Inspirational • Mediators • Nonjudgmental • Passionate • Perceptive • Positive • Powerful • Proactive • Respectful • Responsive • Supportive • Tolerant • Virtuous
• All empowering • Analytical • Collaborative • Creative • Dedicated • Detail oriented • Diplomatic • Engaged • Enthusiastic • Ethical • Flexible • Good communicators • Inquisitive
90 American Journal of Management vol. 13(1) 2013

but also actually extend them. Metaphors are at the root of creativity. They provide alternative ways of seeing things that go beyond the reach of literal language. ENDNOTES
1. It is not within the scope of this study to go into the fine distinctions traditionally made by linguists, grammarians, and philosophers on the differences between analogies, metaphors, and similes. It is sufficient for our purposes to accept the popular meaning of metaphor as A is B (e.g. the man is a bear).
2. Bloom identified three domains of educational activities: cognitive (mental skills), affective (growth in feelings or emotional ideas), and psychomotor (physical skills). He then divided these domains into subdivisions, starting with the simplest behavior to the most complex. The cognitive domain involves knowledge and the development of intellectual skills in degrees of difficulties; that is, the first one must be mastered before the next one can take place. The six categories in the cognitive domain listed in order of difficulty include knowledge, comprehension, application, analysis, synthesis, and evaluation.
REFERENCES Black, M. (1962). Models and metaphors. Ithaca, New York: Cornell University Press. Bloom, Benjamin S. (Ed.) (1984). Taxonomy of educational objectives (two vols: The affective domain & The cognitive domain). New York: David McKay. Bottini, G. et al. (1994). The role of the right hemisphere in the interpretation of figurative aspects of language: A positron emission tomography activation study. Brain. 117(6), 1241-1253. Bransford, J. D., Brown, A. L., & Cocking, R. R. (Eds.) (2000). How people learn: Brain, mind, experience, and school. National Research Council. Washington, DC: National Academy Press. Caine, G. and Caine, R. N. (1994). Making connections: Teaching and the Human brain. Menlo Park, CA: Addison Wesley Longman. Caine, G. and Caine, R. N. (2001). The brain, education, and the competitive edge. Lanham, MD: Scarecrow Press. Clouse, R. W. & Goodin, T. L. (2001-2002). “Entrepreneurs in action: A web case model.” Journal of Educational Technology Systems, 30 (3), 311-321. Clouse, R. W. & Goodin, T. L. (2001). Creating an entrepreneurial culture: Breaking the disciplinary boundaries. Proceedings of the 2001 American Society for Engineering Education Annual Conference and Exposition. Clouse, R. W. & Goodin, T. L. (2001). Entrepreneurs in action: A case-based model. Proceedings of the Academy of Free Enterprise Education, 5(1). Clouse, R. W. (2004). Entrepreneurs in action!; An on-line cross-discipline problem based learning environment for entrepreneurship. Proceedings of the 2004 American Society for Engineering Education Annual Conference and Exposition. Danesi, M. (1989). The neurological coordinates of metaphor. Communication & Cognition. 22, 73-86. Gibbs, R. W. (1994). The poetics of mind: figurative thought, language, and understanding. Cambridge: Cambridge University Press.
American Journal of Management vol. 13(1) 2013 91
Gibbs, R. W. & Steen, G. (Eds.) (1999). Metaphor in cognitive linguistics. Amsterdam: John Benjamins. Goatley, A. (1997). The language of metaphors. London: Routledge. Gopnik, A., Meltsoff, A. N., & Kuhl, P.(1999). The scientist in the crib: Minds, brains, and how children learn. New York: William Morrow. Gozzi, R. Jr. (1999). The Power of metaphor in the age of electronic media. Cresskill, NJ: Hampton Press. Haskell, R. E. (1987). Cognition and symbolic structures: The psychology of metaphoric transformation. Norwood, NJ: Ablex Publishing. Haskell, R. E. (2001). Transfer of Learning: Cognition, Instruction, and Reasoning. New York: Academic Press. Hawkes, T. (1972). Metaphor. London: Methuen. Johnson, M. (Ed.) (1981). Philosophical perspectives on metaphor. Minneapolis: University of Minnesota Press. Kövecses, Z. (2002). Metaphor: A practical introduction. Cambridge: Oxford University Press. Lakoff G. & Johnson, M. (1980). Metaphors we live by. Chicago: University of Chicago Press. Lakoff, G. & Turner, M. (1989). More than cool reason: A field guide to poetic metaphor. Chicago: University of Chicago Press. Mac Cormac, E. R. (1985). A Cognitive theory of metaphor. Cambridge: MIT Press. McCarthy, B. (1981). The 4MAT system: Teaching and learning styles with right/left mode techniques. 2nd Ed. Oak Brook, Illinois: EXCEL. Ornstein, R. (1997). The right mind: Making sense of the hemispheres. New York: Harcourt Brace. Ortony, Andrew. (Ed.) (1993). Metaphor and thought. Cambridge: Cambridge University Press. Piiort, J. (2002). “My teeming brain:” Understanding creative writers. Cresskill, NJ: Hampton Press. Pugh, S. L., Hicks, J. W., Davis, M. & Venstra, T. (1992). Bridging: A teacher’s guide to metaphorical thinking. Bloomington, IN: National Council of Teachers of English. Richards, I. E. (1936). The Philosophy of Rhetoric. New York: Oxford University Press. Rose, D. H. & Meyer, A. (2002). Teaching every student in the digital age. Alexandria, VA: Association for Supervision and Curriculum Development. Sanders, D. A. and Sanders, J. A. (1984). Teaching creativity through metaphor: An integrated brain approach. New York: Longman.
92 American Journal of Management vol. 13(1) 2013
Management Resistance to Innovation
Bruce D. Fischer Elmhurst College
Matthew Rohde
Elmhurst College
It is often management that is the greatest barrier to innovation and change in organizations. We consider the situation where non-management personnel are eager to innovate but management does not support and encourage innovation, and even discourages it. Even when upper management supports innovation, middle management and first-line supervision can thwart the organization’s efforts to innovate. We evaluate this situation and provide suggestions on how upper management can ensure that all levels of management support and encourage innovation. BACKGROUND
Prior research (McGourty, Tarshis, & Dominick, 1996) found that companies and managers who encourage innovation demonstrate four specific behaviors. These organizations and managers are inquisitive, advocative, collaborative, and goal-oriented. Furthermore, McGourty, Tarshis, and Dominick found that innovative companies are deliberate about fostering these behaviors, and usually use programs or activities designed to bolster actions that are inquisitive, advocative, collaborative, and goal-oriented.
It was found that leadership and vision, not just technical competency, helped managers cultivate innovation (McAdam, Keogh, Reid, & Mitchell, 2007). McAdam, et al. noted that having leadership support innovation was a driving force behind successful innovation in small and medium-sized enterprises. Managers must not only support innovation, but understand that a commitment to innovation is a long-term project. The understanding that implementing innovation in the short-term may lead to decreased efficiency is key, and managers must have a future oriented mindset to reap the full benefits of innovation (Klein & Knight, 2005).
Developing a clear and concise definition of what comprises innovation is key, given that innovation can mean a variety of things to different individuals. If managers are to cultivate innovation within their organization there must also be commitment from upper level management to support innovation programs (Oke, 2002). Developing a set process for employees to express ideas is of great importance. Following up on each idea can help keep employees motivated and ensure that ideas are not forgotten about (van Dijk & van den Ende, 2002). Klein and Sorra (1996) list a climate for implementation, the fit between innovation and values, and the effectiveness of innovation and implementation as key aspects of an organization’s innovative effectiveness.
Other organizational constructs such as regularly scheduled meetings to share ideas, innovation education sessions, and clear recognition or rewards for innovation, help to create an environment that
American Journal of Management vol. 13(1) 2013 93
fosters innovation (Tushman & Nadler, 1986). Alternatively, the lack of effective innovation measures makes managing innovation difficult. Getting the support of upper level management may also hinder managers trying to foster innovation. A lack of employee acceptance was also seen as an obstacle (Oke, 2004).
However, when employee acceptance is achieved, it can be a powerful motivator for innovation. That being said, acceptance must be companywide, from top to bottom (Campbell-Allen, Houston, & Mann, 2008). Celebrating successes was also found to be a key motivator for innovation (Campbell-Allen, Houston, & Mann, 2008).
Along the same lines as upper-level management support, Bjorn found that employees must believe their company truly wants them to be innovative. When employees think that their company expects them to innovate, they are inclined to think of ways to improve the products, processes, and operations of the company (Bjorn, 2006).
Innovation may also be tied to the extent to which employees feel supported by their company. When employees feel truly valued and cared for by their company, they are more likely to perform their routine job responsibilities, be engaged in the company, and generate ideas for company improvement without the use of rewards (Eisenberger, Fasolo, & Davis-LaMastro, 1990).
The sense of value and support that Eisenberger, Fasolo, and Davis-LaMastro stressed can also be referred to as psychological safety, and it was the centerpiece in Baer and Frese’s research. If a company wants to realize the greatest benefits from innovation and boost its profitability, it must also establish climates of psychological safety and initiative (Baer & Frese, 2003). Bolstering the amount of resources, personnel, and management concentration on innovation may also help to ensure that innovation is a successful part of the organization (Repenning, 2002).
Innovation and the management of innovation may also depend on the type of job one holds. When a person’s job is relatively secluded, specialized, and steady, the person may have difficulty understanding the importance of innovation (Van de Ven, 1986). METHODOLOGY
Our research was conducted at a large utility company. We scheduled interviews with employees and asked them questions regarding the culture of innovation, motivation for innovation, their direct manager’s ability to manage innovation, etc.
The company established an email address for employees to submit their ideas, which we input into an Excel spreadsheet. Our objective was to determine key factors affecting the value of ideas submitted. Ideas were split into various functional groups based on whether they pertained to administration, safety, human resources, etc. From there, the ideas were discussed and approved or disapproved by a team made up of various departmental employees. The team was also asked to rate each idea based on the initial estimates of cost savings or potential profits. RESISTANCE TO INNOVATION
Resistance to innovation by management generally occurs in two ways. It may be in the resistance to ideas and their approval, or it may be through resistance to the implementation of approved ideas. Resistance to the introduction of ideas may not be detected since the ideas will be deterred before they have a chance to blossom. Resistance to implementation or ineptitude in the management of change will eventually become evident in a low percentage of successful implementations.
It is our belief that the innovation process is inherently positive and we are reluctant to dwell on negative factors. However, that said, we have found that the resistance to innovation by managers is a critical barrier. Often this barrier obstructs the positive actions of well meaning and creative members of the organization. This paper addresses that problem and recommends solutions.
94 American Journal of Management vol. 13(1) 2013

RESISTANCE TO IDEAS
The reasons for management resistance to ideas are numerous. When managers resist ideas they will discourage the suggestion of ideas or find ways to block the approval of ideas. This may be due to a general resistance to change on the part of managers.
Some of the common reasons for resistance to change by managers, based on our interviews and observations, are presented below: Bosses Are Supposed to Have All of the Ideas
Even in this era of employee empowerment, there are managers who have been taught that they are expected to have all of the answers and all of the ideas. They feel threatened by the ideas of employees, and may even see the submitters as rivals. Managers will feel especially threatened by the more prolific idea generators. If There Were Any Good Ideas, I Would Have Already Had Them
In time, people become habituated to the status quo. Managers who have been in their positions for a long time are especially prone to this habit. Ego and defensiveness also may cause resistance to ideas suggested by subordinates. An innovative culture encourages ideas, and a sure sign of a culture lacking in innovation is when managers state that there are no ideas to be suggested. Ideas Are Usually Self-Serving and Are a Nuisance
It is often true that many ideas suggested early on in an innovation program are for the convenience and comfort of the suggesters. This is not necessarily bad, however, as these ideas may also improve productivity or safety. It is essential that managers feel free to reject ideas that are not in the interest of the organization. As a result, they will not be entered into the innovation system and management need not worry about approval of inappropriate ideas. I’m Too Busy to Deal with Ideas
Managers may have a short-term perspective that considers ideas to be a time consuming intrusion in their daily routine. Ideas should benefit the organization and be an eventual saver of time. When a new idea involves a growth opportunity, the organization should provide the necessary resources to expand the business. Innovation Is a Fad. I’ll Wait and It’ll Pass Like Many Other Programs Have
Innovation programs that are not supported can fail and may be viewed as fads. An innovation program that is run properly has little danger of becoming a fad since an organization’s survival is dependent on consistent innovation. Managers who do not engage in the innovation process will find their departments failing to keep pace with the competition. It is essential that managers at all levels have a strong commitment to an innovation program. When programs are introduced but not well supported, their lack of success will result in a lack of confidence and even cynicism toward future program introductions. What’s in It for Me?
Motivation is based on some return. If managers do not recognize any benefit from supporting an innovation program, they will be unlikely to enthusiastically support it. The program has to reward managers whose departments are innovative. Managers need to have the perception that it is in their interest to support innovation. It’s Better to Do Nothing Than to Risk a Public Failure
Fear of failure can be a powerful disincentive, given that public humiliation is not something that most people handle well. It is necessary to change a culture that is too critical of failure. Failures are a real
American Journal of Management vol. 13(1) 2013 95

part of innovation. It is typical of the scientific method to try something repeatedly until a way is found that works. Successive tries should be viewed as experiments, not failures. The organization should reward trying and create a culture that encourages experimentation and experimenters. They are the lifeblood of innovation. Where in My Job Description Does It Say I’m Supposed to be Innovative?
The organization should expect every member to be engaged in innovation. Managers especially should encourage innovation in their departments. They should be measured on this dimension of their management ability and their promotions, raises, and bonuses should be significantly dependent upon it. I’m Not Sure the Company Really Supports Innovation
There is no doubt that a lack of support for innovation from upper level management can have serious detrimental effects on how middle and first line managers perceive innovation. Perception is often reality, so top management must demonstrate their support for ideas and innovation. A lot of Ideas Suggested by Others Are Just Plain Dumb
It is rare that an idea is really dumb. Many ideas that aren’t accepted at first come back with modifications and are accepted. It is a manager’s job to provide encouragement and support for idea generation, and to help those who are struggling to come up with ideas. Innovation is an iterative process. Management Is Too Committed to the Status Quo
People at all levels of the organization can become habituated to the way things have always been. They resist change because they see no reason to abandon a system that has rewarded them and seems to be working. It is necessary to call attention to the possibility of obsolescence and to learn the discipline of creative destruction. Managers May Subtly Resist Creative Changes
People who have advanced in management education and experience frequently have a bias toward linear and logical thinking. They may avoid creative activity because it is not their strength and is not in their comfort zone. They are better and therefore more comfortable performing more traditional management activities such as implementation. It is important for managers to have a balance of skills and abilities including imagination and creativity. The absence of these skills will lead to a hidebound organization. STEPS IN OVERCOMING MANAGEMENT RESISTANCE TO IDEAS
We believe that the ten steps to overcoming managerial resistance to ideas shown in Exhibit 1 will reduce much of resistance caused by the reasons discussed above.
EXHIBIT 1 OVERCOMING MANAGERIAL RESISTANCE TO IDEAS
•Managers should be rated on innovation by the value of the ideas that are generated by the people in their departments. •Create an idea review process that gives constructive criticism to ideas that are not accepted. •Ideas that involve growth should be supported by appropriate resources to avoid straining the personnel and facilities of the organization. •Managers who have innovative departments should be rewarded appropriately with salary increases, bonuses, and promotions. •Create a culture that does not fear failure and rewards reasonable risk taking in the pursuit of innovation. •Make it clear that innovation is part of everyone’s job.
96 American Journal of Management vol. 13(1) 2013

•Top management must promote innovation and then “walk the talk.” •Make the innovation process exciting with contests and recognition. •Impress managers with the necessity of continuous change just to keep up with the competition. •Hire and promote balanced managers who are both creative thinkers and competent implementers. RESISTANCE TO IMPLEMENTATION
Innovation is a dyad that includes both ideation and implementation. Ideas are terrific but they must be implemented to create an innovation. Many organizations have no problem getting ideas but they stall during the implementation process. We found that the implementation process can be a graveyard for ideas. In some organizations, most of the effort on innovation is focused on how to get more ideas. Then once the ideas have been accepted and pass through the various testing stages and economic analyses, their implementation should be a routine management effort. They require change and that can be challenging, but the implementation process is generally a project management effort. Thus, when implementation fails, it is a management failure and responsibility should lie with the manager who was assigned responsibility for the implementation.
Implementation failure was common during our field research. Five common reasons are listed below: We’re Too Busy to Implement Ideas
This might be a reasonable explanation for a delay, but we found that often the delays were indefinite. If there is a seasonal aspect of the department’s work, then delaying makes sense but if the busyness is perpetual, it is procrastination or avoidance. Frequently, a disproportionate number of projects are assigned to a few departments. A good project scheduling process will identify which managers are bottlenecks and alert the organization to the need to reschedule projects to other managers. Unforeseen Problems Delay or Derail Projects
All projects have an element of uncertainty, and it is expected that challenges will emerge at points during implementation that will threaten the success of the project. A good project management planning system will anticipate and control idea implementation projects and handle the predicable occasional turbulence. Technical or Economic Surprises Arise During Implementation
When there is a pattern of repeated cost overruns and technical glitches, it is evidence that the necessary testing and economic analyses were probably not sufficiently thorough. Increase the effort on piloting, modeling, and testing. Depending on the type and scale of idea, it may be necessary to run more tests before implementation begins. Make sure that the economic analyses include sensitivity analyses and contingency plans, if needed. A Manager’s Implementation Projects Often Encounter Resistance to Change
Implementation projects, especially large scale ones, must deal with organizational resistance to change. Some organizations, especially larger ones, will have a large amount of institutionalized resistance to change. Resistance to change is a normal occurrence, and good execution requires skill in handling it during the implementation of ideas. When a manager has a succession of delayed or failed implementation projects, it may indicate a need for some management development. Managers View Implementation Projects as Optional Activities
Some managers may consider an innovation program as an elective activity. Since managers are responsible for implementation projects, they have the fate of the ideas of others in their hands. If they do not have a sense of urgency about implementation, it can be demoralizing to the suggesters of ideas and others who are interested in the innovations. Managers should promote a culture of creativity and
American Journal of Management vol. 13(1) 2013 97

innovation throughout the organization. They must be engaged in innovation. Often a project champion is necessary to sustain momentum during the inevitable slowdowns and over occasional speed bumps that occur in all projects, especially larger ones. STEPS IN OVERCOMING MANAGEMENT RESISTANCE TO IMPLEMENTATION
We present six steps to overcoming manager resistance to implementation in Exhibit 2 that will overcome much of resistance caused by the five reasons for implementation failure shown above.
EXHIBIT 2 OVERCOMING MANAGER RESISTANCE TO IMPLEMENTATION
•Schedule implementation projects with finite completion dates. Don’t just place the ideas in a hopper without any prioritization. They will languish in limbo. •Avoid overburdening one manager with too many implementation projects. Assign small projects to upcoming managers and use them as a way of developing managerial talent. •Use a good project management planning system. Break large projects into more manageable parts or phases. •When there are technical failures and cost overruns, increase the effort for testing and piloting ideas and cost-benefit analyses. •Provide training in change management to managers who fail with implementation projects. •Make sure managers are supportive of innovation. It should be part of the organization’s culture. Managers control the resources that are necessary for the implementation of ideas. If they are not motivated to implement ideas in a timely way, it will be extremely demotivating for an innovation program. CONCLUSIONS
Ideas are needed to advance innovation; however, a more systematic approach is needed in many companies to stimulate innovation. In our research there was much discussion of innovation by top management, but it did not result in significant idea implementations. Employees had ideas but they were not making it through the system to become innovations. This contradiction could be explained by a failure at the middle and lower levels of management.
Our research showed that, although input from all employees is necessary, management performance is the critical variable in achieving high levels of innovation. Top management must, of course, be supportive of innovation. However, without commitment and action on the part of middle management and first-line supervision, an innovation program is not likely to succeed.
We looked at key resistance factors of managers in both the ideation and the implementation stages of innovation. There were frequent failures of idea creation and implementation in our study that could be corrected by proper management action. Employees responded well to a manager that was supportive of innovation and competent in generating and implementing ideas in their departments. We recommend some solutions to overcome key resistance factors of managers that should allow for a high innovation level in their organizations. REFERENCES Baer, M. & Frese, M. (2003). Innovation is Not Enough: Climate for Initiative and Psychological Safety, Process Innovations, and Firm Performance. Journal of Organizational Behavior, 24, 45-68.
98 American Journal of Management vol. 13(1) 2013
Bjorn, W.A. (2006). The Influence from Corporate Entrepreneurship and Intrapreneurship on White-collar Workers’ Employee Innovation Behaviour. International Journal of Innovation and Learning, 3, (3), 284-298. Campbell-Allen, N., Houston, D., & Mann, R. (2008). Best Practices in New Zealand Organizations for Rewarding and Recognizing Employee Innovations and Achievements. Total Quality Management, 19, (1-2), 123-137. Eisenberger, R., Fasolo, P., & Davis-LaMastro, V. (1990). Perceived Organizational Support and Employee Diligence, Commitment, and Innovation. Journal of Applied Psychology, 75, (1), 51-59. Klein, K.J., & Knight, A.P. (2005). Innovation Implementation: Overcoming the Challenge. Current Directions in Psychological Science, 14, (5), 243-246. Klein, K.J., & Sorra, J.S. (1996). The Challenge of Innovation Implementation. Academy of Management Review, 21, (4), 1055-1080. McAdam, R., Keogh, W., Reid, R., & Mitchell, N. (2007). Implementing Innovation Management in Manufacturing SMEs: A Longitudinal Study. Journal of Small Business and Enterprise Development, 14, (3), 385-403. McGourty, J., Tarshis, L. A., & Dominick, P. (1996). Managing Innovation: Lessons from World Class Organizations. International Journal of Technology Management, 11, (3-4), 354-368. Oke, A. (2002). Making It Happen: How to Improve Innovative Capability in a Service Company. Journal of Change Management, 2, (3), 272-281. Oke, A. (2004). Barriers to Innovation Management in Service Companies. Journal of Change Management, 4, (1), 31-44. Repenning, N.P. (2002). A Simulation-based Approach to Understanding the Dynamics of Innovation Implementation. Organization Science, 13, (2), 109-107. Tushman, M., & Nadler, D. (1986). Organizing for Innovation. California Management Review, 28, (3), 74-92. Van de Ven, A. (1986). Central Problems in the Management of Innovation. Management Science, 32, (5), 590-607. van Dijk, C., & van den Ende, J. (2002). Suggestion Systems: Transferring Employee Creativity into Practicable Ideas. R&D Management, 32, (5), 387-395.
American Journal of Management vol. 13(1) 2013 99

Constituents in Conflict: Serving External Stakeholders
Suzanne N. Cory St. Mary’s University, Texas
Thomas E. Reeves
Analytic Focus
Accounting education has been criticized for several years and calls for its change have been extensive. This study obtains the viewpoints of two important constituent groups for higher education accounting programs: (1) public accountants and (2) non-public accountants, regarding the importance of topics to be covered in accounting courses. Of 22 course topics, statistically significant differences for 16 were found between the two groups. Implications for accounting educators are discussed.
INTRODUCTION
Ideally, business school faculty deal with their external constituents in a positive manner. For many
members of the faculty, practitioners of their respective disciplines represent a large percentage of vocal external stakeholders. In the case of accounting, practitioners have voiced what they feel are justifiable concerns about the quality of accounting graduates provided by universities and colleges. These individuals are the constituents that hire accounting graduates and consequently they have certain expectations regarding knowledge that students should have acquired during their academic careers. Many accounting practitioners have expressed their frustration with the topics covered in courses offered to accounting undergraduates and feel justified in voicing their opinions about what their new-hires’ educational experience should entail. According to Nelson (1995), this group has issued fervent calls for accounting education changes since the “inception of university programs” (p. 63), citing various deficiencies in graduates.
Accounting programs have been especially inundated in the past two and a half decades with studies and position papers addressing the quality of education available for accounting students and recommending changes in the approach to providing it. The 1980s and 1990s saw the release of the Bedford Committee’s Report (1986), followed by the (then) Big 8 accounting firms’ issuance of their White Paper, “Perspectives on Accounting Education,” the creation of the Accounting Education Change commission (AECC), the creation and growth of the American Accounting Association’s Teaching and Curriculum Section and the release of joint study results from the Institute of Management Accountants and the Financial Executives Institute in 1994 (Siegel and Sorensen).
During the same period of time, in 1988, the American Institute of Certified Public Accountant’s (AICPA) membership amended their bylaws making 150 semester hours of education a requirement for all new members of their professional organization after the year 2000. When this bylaw change was made, only two states (Florida and Hawaii) required 150 hours of education for a candidate to sit for the
100 American Journal of Management vol. 13(1) 2013

CPA exam, but subsequent to the AICPA’s action, many states and jurisdictions modified their requirements to agree with the AICPA’s expectations. Since then, the District of Columbia, Guam, Puerto Rico and 45 states have either implemented revised accountancy laws requiring 150 hours of education to sit for the CPA exam, or have enacted the law and it will take effect in the near future. Ten years later, the AICPA (1998) issued their top five issues for the public accounting profession in their Vision Project, also offering guidance for changes in higher education for aspiring CPAs.
Academic accountants have addressed some of the issues raised, but with varying degrees of success. However, in 2000 Albrecht and Sack (A&S) published their seminal study reporting that, in general, accounting education had not changed substantively in response to the demands of accounting practitioners and expressing concern about the future of accounting programs. Their work spawned a flurry of studies about accounting education and was expected to mobilize accounting educators to make necessary changes in accounting curricula. In fact, Johnson and Halabi (2009) determined that A&S was cited in 29.3% of published research papers during the seven-year period between the beginning of 2001 and the end of 2007. During the same time period, inadequate accounting education was partially blamed for the Enron, Equity Funding, WorldCom, Sunbeam, Arthur Andersen and HealthSouth debacles (Russell and Smith, 2003).
Adding to the controversy, in 2002 Gabbin decried the continued resistance of accounting educators to change and noted little improvement in accounting programs. He also feared that the academic community’s resistance to change had contributed toward the loss of top students to other business disciplines. However, as a result of the accounting scandals in recent years as well as the passage of Sarbanes-Oxley, neither the dire predictions of A&S nor Gabbin came to fruition, partially because the need for high quality accountants actually increased (Hargadon and Fuller, 2007; Brausch, 2009).
Others have also expressed concern that accounting programs across the country have geared their accounting curricula solely for students interested in public accounting and excluded a focus on students who are more interested in the non-public accounting arena (Tatikonda, 2004). However, there does not seem to be a great deal of consensus about the courses that should be completed in order to ensure success in the non-public accounting arena (see, for example, Frecka et al., 2004; Cheng, 2007; and Hurt, 2007). Accounting educators thus face the dilemma of devising a curriculum that satisfies the needs of students wishing to sit for the CPA exam, especially for those in the numerous 150-hour states, as well as the needs of those students wishing to pursue an accounting career path that does not include the public arena. Resource limitations, especially with many states cutting higher education budgets, prevent many accounting programs from offering more than a limited number of accounting classes, thus being unable to fully satisfy the needs of both groups. The purpose of this paper is to report the findings of a study examining the viewpoints of public accounting and non-public accounting professionals regarding course topics that students should successfully master prior to graduation. Perspectives of practicing accountants, both in public accounting and in other areas of accounting, were gathered in order to gain insight into this question.
METHOD
The A&S study referenced above created a great deal of turmoil within the accounting education
community, resulting in several studies attempting to replicate or repudiate their findings and addressing the issues they raised. This study was also based on their questionnaire. Other surveys that used the A&S approach include Burnett (2003), who surveyed West Texas CPAs and employers regarding their ranking of specific skills desired of new accounting hires and Ulrich, Michenzi, and Blouch (2003), who performed a nationwide survey of public accounting firms to determine specific skills (as identified by the AECC, 1990) they desired of entry-level accountants, and their assessment of how well academic accounting developed those skills. Madison et al. (2008) also based their survey about required knowledge and skills of accounting graduates on A&S while Cory (2009) used the A&S questionnaire as the basis for her investigation of course topics that practicing CPAs believed were essential in accounting education and their preference as to what kind of degree should be earned by accounting graduates.
American Journal of Management vol. 13(1) 2013 101

Finally, as recently as 2011, Cory and Huttenhoff based their investigation of the educational interests of non-public accountants on the A&S study.
Local external constituents currently practicing accounting should be well-informed about the course topics that should be included in accounting programs to ensure success in their respective fields. Lending further support to this approach, A&S indicate that each accounting program has the responsibility of determining the needs of its own key stakeholders, incorporating internal and external environments that are unique to each. Finally, the mission-based emphasis for achieving AACSB accreditation reinforces the concept that curricula must consider constraints and opportunities that may be specific to a particular business program.
Surveying local accounting professionals regarding perceptions as to the importance of completed course topics needed for their new-hires should provide valuable insight into the curriculum required of accounting programs in the local area. The results presented by Burnett (2003) are probably limited to the West Texas employment environment, and Ulrich et al.’s (2003) use of a nationwide sample makes it difficult to extrapolate their results with strong promise of being effective locally. Neither the Burnett nor the Ulrich et al. studies distinguished between accountants employed in public accounting and those employed in nonpublic accounting careers. Cory (2009) reported results of her study about course topics and degree preference, but limited the analysis of responses from her survey participants to only those currently practicing public accounting. Similarly, Cory and Huttenhoff (2011) based their analysis solely on responses from non-public accountants. This study compares perspectives of both groups of external stakeholders.
Practicing public and non-public accountants represent members of the group to survey in this particular instance. However, in the case of public accountants, the size of the public accounting firm was of importance. For example, the A&S (2000) study has been criticized for concentrating on the concerns of large public accounting firms and only the views of large research universities. Many accounting students do not matriculate in large, research institutions and only a small proportion of graduates will be employed in Big Four firms. Alternatively, because small firms are the predominant form of public accounting practice, as reported by Huefner (1998), samples drawn from CPA membership lists will likely be primarily composed of members practicing in small firms. Similar issues may arise with non-public accountants. Therefore, size of company where the non-public accountant is employed is also of interest.
The survey was distributed to 2,300 individuals who were either members of a large, regional CPA society in south Texas, members of the Institute of Management Accountants in the same area, or employers who had interviewed on a south Texas university campus during the previous three years. A total of 464 usable surveys was returned, which is a response rate of approximately 19%. This rate is comparable to that reported in similar studies (20% for A&S (2000), 27.7% and 21.75 for Burnett (2003), 27.2% for Ulrich et al. (2003) and 16% for Sedki et al. (2003)). Approximately 46% of the surveys were completed by individuals currently practicing public accounting and 54% by individuals who were employed in the non-public accounting arena.
The sample is limited to a geographic area, but the respondents should provide a broad viewpoint of accounting education. Analysis of firm size for the public accounting respondents indicated the median number of full-time employees was 11, but 46 of these respondents reported being employed with firms with at least 50 employees. The median company size for non-public accountants was 155 full-time employees, but 45 worked for companies that employed at least 100 on a full-time basis. Respondents were also asked to indicate the most recent year in which they had been enrolled in a college or university course. The median year was 1987, which indicated that the typical respondent should have sufficient employment experience in order to express an opinion as to the topics in courses to which recent accounting graduates should be exposed.
Respondents were asked to indicate, from the standpoint of their organization’s business, how important it was that newly hired professional staff members had completed courses that included 22 different topics. Respondents were asked to rank each topic on a four-point scale, with one indicating “not important (no courses),” two indicating “somewhat important (part of a course),” three indicating
102 American Journal of Management vol. 13(1) 2013

“moderately important (one college course),” and four indicating “very important (more than one course).” A fifth column was available if the respondent did not know the importance of the topic. The responses were coded according to the column chosen and any response in the “Do Not Know” column was eliminated from analysis.
RESULTS
The mean average for both groups for each of the 22 topics is shown in the second and third columns
of Table 1. Keeping in mind that a rating of “3” indicates that the topic is moderately important and one college course should be devoted to it, 10 of the 22 topics in the public accountants’ column had a mean of at least 3 and 9 of the topics in the non-public accountants’ column had a mean of at least 3. However, only 6 topics had a mean of at least 3 for both groups. The lowest mean for the public accountant group was associated with operations supply-chain management (2.0510, e.g., “somewhat important”) and the lowest mean for the non-public accountant group was associated with personal income tax topics (2.0833, e.g., “somewhat important”). Differences between several mean averages between the two groups were also apparent. Therefore, t-scores were computed to determine whether the difference in the means for each topic was significantly different between the two groups. T-scores are shown in the third column of Table 1 and their level of significance is shown in the last column. For the 22 topics, the means of 16 were significantly different between the two groups, but they were in basic agreement on the remaining six. For example, both groups agreed that basic financial accounting topics (e.g., intermediate accounting), which has the highest mean score for both groups, were very important, deserving of more than on course (mean averages of 3.9180 for public accountants and 3.8919 for non-public accountants). They also agreed on the importance of business strategy, economics, ethics, cost/managerial accounting and Sarbanes-Oxley.
Notably, however, public accountants felt much more strongly about the importance of (1) auditing, (2) business law, (3) advanced financial topics (e.g. consolidations and partnerships), (4) financial accounting research (FASB or AICPA databases), (5) international business, (6) personal income tax topics, (7) corporate tax topics (8) fraud examination and (9) tax research than did the non-public accountants. Conversely, the non-public accountants felt much more strongly about the importance of (1) electronic commerce, (2) finance, (3) internal auditing, (4) information systems, (5) operations supply-chain management, (6) organizational behavior/human resource management and (7) and statistics/quantitative methods.
Of course, using t-tests for differences in the rating for each of 22 topics is a univariate analysis. In order to further analyze the data, discriminant analysis was used to determine whether group membership could be reliably predicted. Discriminant analysis uses a linear function in order to predict group membership, rather than analyzing each individual variable for differences between groups. The model classified 40 public accountants and 50 non-public accountants. As shown in Table 2, the results of discriminate analysis strongly support the results of the t-tests. The model correctly classified public accountants with 90% accuracy and non-public accountants with 92% accuracy. This is strong evidence of differences between the two groups in their perceptions of the importance of these topics in accounting education.
There may be several reasons for these differences in the perception of importance of these 16 topics between the two groups. For example, certain accounting topics are emphasized in different certification examinations. Income tax topics are tested on the CPA examination, the certification necessary for success in public accounting. However, finance is more heavily emphasized on the certified management accountant (CMA) examination, which is a certification that many non-public accountants aspire to attain. Further, public accountants perform the audit function and it is logical that public accountants place more emphasis on that topic than do the non-public accountants. However, reasons for these differences are not as important as the differences themselves.
American Journal of Management vol. 13(1) 2013 103
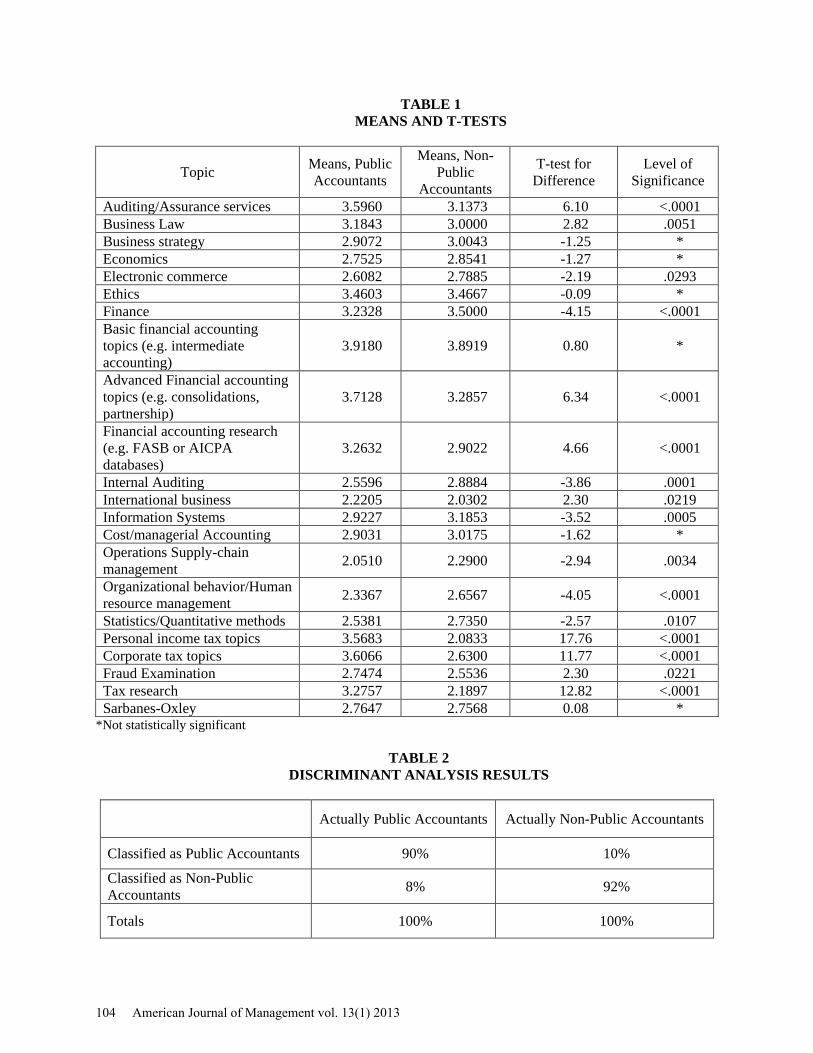
TABLE 1 MEANS AND T-TESTS
Topic Means, Public Accountants
Means, Non-Public
Accountants T-test for
Difference Level of
Significance Auditing/Assurance services 3.5960 3.1373 6.10 <.0001 Business Law 3.1843 3.0000 2.82 .0051 Business strategy 2.9072 3.0043 -1.25 * Economics 2.7525 2.8541 -1.27 * Electronic commerce 2.6082 2.7885 -2.19 .0293 Ethics 3.4603 3.4667 -0.09 * Finance 3.2328 3.5000 -4.15 <.0001 Basic financial accounting topics (e.g. intermediate accounting)
3.9180 3.8919 0.80 *
Advanced Financial accounting topics (e.g. consolidations, partnership)
3.7128 3.2857 6.34 <.0001
Financial accounting research (e.g. FASB or AICPA databases)
3.2632 2.9022 4.66 <.0001
Internal Auditing 2.5596 2.8884 -3.86 .0001 International business 2.2205 2.0302 2.30 .0219 Information Systems 2.9227 3.1853 -3.52 .0005 Cost/managerial Accounting 2.9031 3.0175 -1.62 * Operations Supply-chain management 2.0510 2.2900 -2.94 .0034 Organizational behavior/Human resource management 2.3367 2.6567 -4.05 <.0001 Statistics/Quantitative methods 2.5381 2.7350 -2.57 .0107 Personal income tax topics 3.5683 2.0833 17.76 <.0001 Corporate tax topics 3.6066 2.6300 11.77 <.0001 Fraud Examination 2.7474 2.5536 2.30 .0221 Tax research 3.2757 2.1897 12.82 <.0001 Sarbanes-Oxley 2.7647 2.7568 0.08 *
*Not statistically significant
TABLE 2 DISCRIMINANT ANALYSIS RESULTS
Actually Public Accountants Actually Non-Public Accountants
Classified as Public Accountants 90% 10% Classified as Non-Public Accountants 8% 92%
Totals 100% 100%
104 American Journal of Management vol. 13(1) 2013
Given the size and restricted budgets of most universities in today’s economic environment, it may not be feasible to offer accounting degrees with dual tracks. In other words, a college or university offering an educational track for aspiring CPAs that requires courses emphasizing the topics of importance to public accountants and also offering a separate educational track emphasizing the topics of importance to aspiring non-public accountants may not be possible. CONCLUSION
Implications for accounting educators are immense, especially because the debate over accounting curricula has continued for decades and it seems it will continue for the foreseeable future. First, like all business school faculty, academic accountants are expected to respond to the needs and concerns of their constituents and stakeholders. However, results indicate that satisfying the demands of both public and non-public accountants may be difficult. Thus, many practitioners may not be satisfied with curricular changes initiated by accounting faculty because external stakeholders do not have uniform expectations about topics to be covered in courses. The most notable differences, where p values were <.0001, are the greater importance placed on auditing, advanced financial accounting topics, financial accounting research and tax (personal, corporate and research) topics for public accountants and the emphasis on finance and organization behavior/human resource management by the non-public accountants.
Second, preparing students for a successful professional career should be paramount for accounting faculty. It may be impossible to ensure that students are exposed to topics of importance, as defined by those currently practicing in their respective field, prior to graduation. For example, if accounting graduates enter the non-public accounting arena, but have been prepared primary for the public accounting profession, they may be at a serious disadvantage as they begin their professional careers. Thus, many internal constituents would not be served.
Third, external constituents often rely on accounting programs to provide the essential foundation for new-hires to pass necessary certification examinations. Again, in many cases, this is another difficulty for accounting faculty to address due to the differences in testing emphasis on various certification exams. Further, it is doubtful that focusing simply on course topics that will be tested for a selected certification would benefit the students as preparation for a successful professional career.
Fourth, few would claim that even extensive exposure to only these 22 topics would guarantee graduates success in any accounting career. There are additional skill sets, other topics and knowledge that are essential to their success.
Fifth, results associated with basic financial accounting topics (e.g. intermediate accounting) clearly indicate agreement between these two groups as to the level of its importance. Therefore, accounting faculty should be careful about suggesting changes in coverage for this topic. Additionally, many intermediate accounting textbooks have recently integrated information about international financial reporting standards (IFRS), which may serve as the first in-depth exposure to them for many accounting students. As the U.S. moves towards universal adoption of IFRS, this accounting topic will certainly increase in importance, for both public and non-public accountants.
Finally, this study has some limitations that should be addressed. Responses were obtained from individuals in only one geographical area, which may make findings difficult to generalize to a wider population. Only 22 course topics were listed on the survey, but additional course topic information could have been gathered with the research instrument. Further, information about additional skills and knowledge necessary for a successful accounting career could be gathered. However, these short-comings can certainly be the seeds for future research. REFERENCES
Accounting Education Change Commission (AECC) (1990). Objectives of Education for Accountants: Position Statement Number One. Issues in Accounting Education, 5 (2), 307-12.
American Journal of Management vol. 13(1) 2013 105

Albrecht, W. S. & Sack, R. J. (2000). Accounting Education: Charting the Course through a Perilous Future. Accounting Education Series, 16. Sarasota, FL: American Accounting Association. American Institute of Certified Public Accountants (AICPA) (1998). CPA Vision Project Identifies Top Five Issues for Profession. The CPA Letter, 1, (12), 1. Arthur Andersen and Co., Arthur Young, Coopers and Lybrand, Deloitte Haskins and Sells, Ernst and Whinney, Peat Marwick Main and Co., Price Waterhouse, & Touche Ross (1989). Perspectives on Education: Capabilities for Success in the Accounting Profession (The White Paper), New York: N.Y. Bedford Committee, American Accounting Association, Committee on the Future Structure, Content, and Scope of Accounting Education (1986). Future Accounting Education: Preparing for the Expanding Profession. Issues in Accounting Education, 1 (1), 168-95. Brausch, J.M. (2009). CMA Champion. Strategic Finance, 91, (2), 31-61. Burnett, S. (2003). The Future of Accounting Education: A Regional Perspective. Journal of Education for Business, 78, (3), 129-34. Cheng, K.W. (2007). The Curriculum Design in Universities from the Perspective of Providers in Accounting Education. Education, 127, (4), 581-590. Cory, S.N. (2009). What do Public Accounting Practitioners Really Want? An Exploratory Investigation. Journal of Business Issues, (1), 47-56. Cory, S.N. & Huttenhoff, T. F. (2011) Perspectives of Non-Public Accountants about Accounting Education and Certifications: An Exploratory Investigation. Journal of Finance and Accountancy, 6, 77-89. Frecka, T.J., Morris, M.H. & Ramanan, R. (2004). Back to the Future: Implementing a Broad Economic Inquiry-Based Approach to Accounting Education. Journal of Education for Business, 80, (2), 69-74. Gabbin, A.L. (2002). The Crisis in Accounting Education. Journal of Accountancy, 193, (4), 81-86. Hargadon, J.M. & Fuller, L.R. (2007). Take Two! Strategic Finance, 88, (10), 48-54. Huefner, R. J. (1998). The Future of Non-CPA Ownership. CPA Journal, 68, (2), 14-19. Hurt, B. (2007). Teaching What Matters: A New Conception of Accounting Education. Journal of Education for Business, 82, (5), 295-299. Johnson, G.F. & Halabi, A.K. (2009). A Citation Analysis Measuring the Impact of Albrecht & Sack (2000). Journal of Modern Accounting and Auditing, 5, (9), 21-29. Madison, T., Cory, S.N., & Persellin, M.B. (2008). Educating tomorrow’s Accountants: A Survey of Employers’ Perspectives on the Knowledge and Skills Required of Entry-Level Accountants, Midwestern Business and Economic Review, 39, 19-26. Nelson, I.T. (1995). What’s New about Accounting Education Change? An Historical Perspective on the Change Movement. Accounting Horizons, 9, (4), 62-75.
106 American Journal of Management vol. 13(1) 2013

Russell, K.A., & Smith, C.S. (2003). It’s Time for a New Curriculum! Strategic Finance, 85, (6), 1-5. Sedki, S., Madison, T. F. & Treacy, W. (2003). Crossing the Border: An Update on Reciprocal International Licensure. Today’s CPA, 31, (3), 28-34. Siegel, G. & Sorensen, J.E. (1994). What Corporate America Wants in Entry-level Accountants. A Joint Research Project of the Institute of Management Accountants and the Financial Executives Institute. Montvale, NJ: The Institute of Management Accountants. Tatikonda, L.U. (2004). Naked Truths about Accounting Curricula. Management Accounting, 5, (4), 62-73. Ulrich, T. A., Michenzi, A.R. & Blouch, W.E. (2003). CPAs Assess the Development of Professional Skills of Recent Accounting Graduates. Journal of the Academy of Business Education, (Spring), 126-137.
American Journal of Management vol. 13(1) 2013 107

Compensation as a Construct for Employee Motivation in Healthcare
Allen C. Minor Misericordia University
There is no difference between performance of those employees receiving a salary as compensation for services and those employees receiving compensation based on output by the specific employee, (Null), or alternatively, incentive compensation results in increased employee productivity. This issue has been debated historically and the debate continues. This paper reviews the issue from a historical perspective and includes contemporary research and concludes with implications for further research.
Employee motivation has been debated since the inception of management as a discipline. The Chinese bureaucracy 1000 B.C. developed a theory of management based on rewards and Punishments as a way to manage productivity. Confucius, in the period 552 B.C. through 479 B.C. advocated that employee productivity could be managed by improving morale (Wren, p. 14). In 35 A.D., the Egyptians used wage incentives to motivate workers (Lee, p. 42).
In a study completed by Mercer, incentive compensation plans increased morale and increased productivity for those plans including all employees but not for firms offering incentive pay programs to only high-ranking managers (Wall Street Journal). Whitney argues that because of prejudices on the part of executives, wage and salary programs are poorly designed and, in most companies, are not true pay-for-performance programs. Evans argues that governmental regulations in unions demanding rewards based on seniority have eroded the pay-for-performance compensation programs (Evans, p. 726). Short-term incentive plans, however, are gaining popularity in the health care industry (Hospitals). Cash incentives have increased 5% to 10% in 2008 (Evans). Bonus payments are an (integral part of compensation) in healthcare. (Healthcare Facility Management) as bonuses will increase quality of healthcare and reduce costs (Armstrong). There are no consistent policies or body of theory regarding incentive compensation programs followed and practiced by organizations. It is clear, however, that incentive compensation programs are effective in increasing productivity if properly designed for the situation or goal to be accomplished. (Haman).
One such method of incentive compensation is payment based on the profitability of the organization. Charles Babbage “On the Economy of Machinery and Manufacturer” indicated “the mode of payment could be so arranged that every person employed should drive advantage from the success of the whole; that the profits of each individual should advance as the factory itself produces profit, without the necessity of making any change in wages” (Wren, p. 61). This was seen as a way to develop a synergy between the employee goals and the company goals from an economic point of view. Whitney maintains that good performance deserves a higher pay, and therefore poor performance should result in lower pay. If an organization’s profits were reduced, compensation should also be reduced. Because this is taboo in America’s culture, such plans will not work (Whitney p. 36). He argues that a bonus system would be a more effective way of rewarding high performers with a reduction in this program should the
108 American Journal of Management vol. 13(1) 2013

performance not be achieved. Whitney also argues that management rewards are based on power, compensation and prestige opposed to technical excellence and therefore such plans may not provide the appropriate incentives for executives to achieve the goals of the organization. If compensation is ‘based upon individual performance, cooperation among team members may be inhibited, whereas if compensation is based on team objectives, individuals may not work as diligently and may lean on other team members. Bonus systems are a way to achieve both team and individual performance based on appropriate measures and evaluations. However, if profitability drops and bonuses are not given, this may result in turnover or a feeling of mistrust on the part of the employee. This works successfully in the Japanese system, however, they have a concept of lifetime employment (Whitney, Part II, p. 47). Because there is not a direct relationship between individual employee performance and compensation, the typical employee is unable to see a relationship between merit increases and his/her level of performance and therefore may not provide the incentive to increase productivity (Evans).
Another system of rewarding employees for performance is the merit system. This is a system whereby employees are evaluated based on their merit each year and given an increase based thereon. However, the typical employee is unable to see a relationship between the merit increase and his/her level of performance in most cases. Based on a study of certain Fortune 500 companies that contributed approximately 40% of the Gross National Product in the United States in 1968, “job performance is not the primary determinate of wage and salary progression for non-supervisor employees”. This is true even though “93# of the firms claims that they subscribe to the merit reward philosophy by advancing wage and salaries on the basis of job performance” (Evans, p. 730). Therefore, it appears that those companies, although of the opinion that incentive wage and salary programs influence employees to produce more, do not implement such programs in such a way as to increase productivity. Studies have indicated that “there is no significant link between paid performance and common merit pay programs” (Markham, p. 172).
One system of rewarding employees is to reward departments based on departmental productivity opposed to rewarding employees based on the organization’s profits. Henry R. Towne thought that profit sharing was inappropriate because it did not reward individuals for their efforts. He proposed a method of payment that would reward work units or departments for their efforts and to split productivity gains by departments; 50% to the employer and 50% to the workers (Wren, p. 91). Incentive compensation advocated by Towne was based on the thinking of See who promoted paying “higher wages to attract better workers” (Wren, p. 87). Edward Atkinson, an American economist, suggested that “the cheapest labor is the best – paid labor” (Wren, p. 90) because more productivity will result and therefore unit cost will be lower leading to the concept that higher wages led to more productivity and therefore lower unit cost.
The individual performance incentive of compensation plans are the most attractive. Frederick Taylor suggested that the piece-rage system had failed because standards were poorly set and employers would game the system by cutting rates when productivity increased. This caused inefficiency and gaming of the system by the employees. Taylor developed his differential piece-rate incentive plan system at Midvale Steel (Wren, p. 106) based on time studies and set a rate where the standard for each element was determined b the time study. “This rate moved job performance from guess work and tradition to a more rational basis. The principle of the differential rate worked two ways: it forced those who did not meet the standard or receive a low rate of pay and greatly rewarded those who did attain the standard” (Wren, p. 109). Taylor strongly opposed paying individuals based on averages of the group and therefore opposed union attempts to set quotas. He advocated that higher paid workers would be more productive and therefore lower unit cost and suggested that workers be paid “from 30% to 100% according to the nature of the work which he does, beyond the average of his class” (Wren, p. 110).
Gantt, a disciple of Taylor, also advocated incentive compensation as a way to increase employee performance. “Gantt devised his ‘task work with a bonus’ system that paid the worker a bonus of $.50 per day if he did all the work assigned for a particular day” (Wren, p. 134). He modified this plan to increase productivity by increasing wages for employees for completing a job below the standard as an incentive to increase productivity. In addition, foremen would receive a bonus if the workers performed better the standard providing an incentive for the foremen to teach the workers to be more productive. Harrington
American Journal of Management vol. 13(1) 2013 109

Emerson installed an individual reward system in the Burlington Railroad Company. In two years, output increased by 57%, average pay increased by 14% and the cost decreased by 36% (Wren, p. 148).
Physicians are highly motivated by compensation plans (Helman, Hemenway). Physicians’ concerns should be primarily for the patient’s well being, however, “physicians do appear to respond to economic stimuli occasioned by their contractual obligations to third party insurers” (Helman, p. 86). Health Maintenance Organizations (HMO) have been designed as a way to reduce health care costs by paying physicians and other health care providers based on the number of enrollees in a plan as opposed to the number or quantity of services provided to patients. Therefore, physicians, in such a plan, are paid for not rendering services. One study showed that physicians on a salary based payment showed a reduction in hospital days of 13.1% and those on a capitation basis, i.e. paid for the subscribers in the program, also showed a reduction in hospital days (Helman, p.88). The study also showed there was a higher use of primary outpatient visits that are less expensive than inpatient care for HMO physicians. Bonuses were not found to be significant in terms of productivity. “Distribution of bonuses of may lack effect because such incentives delay any reward. Physicians, like anyone else, respond to economic stimuli that are immediate rather than delayed” (Helman, p. 91). The Affordable Care Act has created Accountable Care Organizations. Organizations can apply for this program providing financial incentives to reduce health care cost through wellness programs for Medicare /Healthcare government. Also the JCAHO has provided financial incentives to reduce cost through core measures sets.
In a study of physician financial incentives in a for-profit care center, it was determined that “substantial monetary incentives based on individual performance may reduce a group of physicians to increase the intensity of their practice, even though not all of them benefit from the incentives” (Hemenway, p. 1059). Therefore, it is clear that individual incentive compensation plans, if properly designed, do result in increased productivity.
There are other factors that influence employee productivity in addition to compensation. (Whitney) Williams hypothesized that motivation for employees was based on their feelings rather than their thoughts (Wren, p. 167). He said that a person’s social standing is determined by his job. He indicated that “beyond a certain point, the increased wages are quite likely to lessen as to increased effort” (Wren, p. 168). Thus, salary is a negative motivator. Over-payment will not necessarily increase productivity but under-payment will cause decreased productivity, soldiering and turnover. Continuing this socialistic viewpoint, Henry DeMan viewed that work itself was a motivator and it was management’s job to remove the hindrances such inequitable wage systems that prevent workers from finding joy in work (Wren, p. 172).
Winn looked at incentive to increase sales opposed to incentives to increase net income. He hypothesized that because of “personal self interest” factors, managers tend to increase sales opposed to increase compensation based on incentives. In other words, executive salaries appear to be more closely “correlated with the scale of operations of a firm than and with their profitability (Winn).
Taylor and Gantt concepts of compensation based on individual performance including accurate and fair standards is worth further research and study. IMPLICATIONS FOR FURTHER RESEARCH
Current research on compensation plans is sketchy and in many cases flawed. There are many factors that affect employees’ motivation including political, social and economic. An attempt to isolate economic factors is difficult and the research therefore is not conclusive as to whether incentive compensation programs positively or negatively affect employee productivity. Managers have developed principals of wage and salary administration based on inadequate research and individual bias indicating that the academic community has not provided appropriate guidance for the practitioner in this area. This area is right for research and should include not only the economic factors but the social factors as barriers to implementing the programs to positively motivate employees. It is clear that unless American companies and American industry respond appropriately to a threat of international competition, it will not remain as a predominate economic power.
110 American Journal of Management vol. 13(1) 2013

REFERENCES Armstrong et.al. (June 12, 2009) “Realigning U.S. Health Care Incentives To Better Serve Patients and Taxpayers” Health CEO’s for Health Reform. Evans (September, 1970) “Pay for Performance: Fact or Fable,” Personnel Journal Vol. 49, Number 9. Evans (July, 2008) “We just don’t see a Slowdown” Modern Healthcare Vol 38, Issue 30. Freundt (1990) “Merit Increases for Top Executives to Average 5.2% in 1990,” Hospitals. Hanman, Krishnan, Newman “(July 2008) “The Effect of Disseminating Relative Performance Feedback in Tournament and Individual Performance Compensation Plans” The Accounting Review Vol 83 No 4. Healthcare Facility Management 7/2009 Vol 22 Issue 7 “Bonus Pay No Longer an Afterthought. Healthcare, gov (March 31, 2011) “Accountable Care Organizations: Improving Care Coordination for People with Medicare. Hemenway, Killen, Cashman, Parks Bicknell (April, 1990) “Physicians Response to Financial Incentives” New England Journal of Medicine. Hillman, Pauly and Kerstein (July 13, 1989) “How do Finanical Incentives Affect Physicians Clinical Decisions and Financial Performance of Health Maintenance Organizations” New England Journal of Medicine. Hospitals (September 5, 1990) “Merit Increase of Top Executives to Average 5.2% in 1990. JCAHO (October 20, 2010) “Core Measure Sets.” Markham (1988) “Pay for Performance Dilemma Revisited: Empirical Example of the Importance of Group Effects” Journal of Applied Psychology Vol. 73, No. 2. Whitney (March-April, 1988) “Pay Concepts for the 1990’s Part I” Compensation and Benefits Review Vol. 20 Number 2. Whitney (May-June, 1988) “Pay Concepts for the 1990’s Part II” Compensation and Benefits Review Vol. 20 Number 3. Winn, Shoenhair (February, 1988) “Compensation-Based (DIS) Incentives for Revenue-Maximizing Behavior: A test of the ‘Revised” Baumol Hypothesis” The Review of Economics and Statistics, Vol. 70, No. 1. Wisdom, Denton (July-August, 1989) “Compensation Management In Practice” Compensation and Benefits Review Vol. 21, No. 4. Wren (1987) Evolution of Management Thought. Wall Street Journal (May 5, 1992).
American Journal of Management vol. 13(1) 2013 111

The Digital Divide: Issue Framing and Policy Responses
Allan Maram University of the Witwatersrand
David Ruggeri
East Central College
The paper considers the various policy responses that are available to address the problem, and develops a multi-pronged policy implementation approach to ameliorate this issue. The digital divide is a multifaceted issue that requires a comprehensive policy response. We cannot hope to address such a complex phenomenon with any single policy approach, but rather a coordinated effort of several distinct and separate policies aimed at small businesses, NGO’s, and easing government regulation implemented contemporaneously. Developing multiple policies designed to individual entities and implementing them simultaneously by various stakeholders will increase the outcome success rate. INTRODUCTION - THE DIGITAL DIVIDE
The advent of the web browser in 1994 made access to the Internet possible through a few clicks of a
mouse for many people. But what about those who have not gained access to this ever-growing informational and educational resource? In 1995, the National Telecommunications and Information Administration (NTIA) published the first in a series of reports entitled, “Falling through the net: A survey of the “Have Nots” in rural and urban America.” This report revealed inequities in access to personal computers and the Internet. Some segments of the population whom are less likely to have access to the Internet are the elderly, nonwhite race and ethnic groups, and low-income (Watson, Bell, Kvedar, & Grant, 2008). This disparity of access to information and communications technology (ICT) has commonly been referred to as the “digital divide” (DiMaggio & Hargittai, 2001; Eastin & LaRose, 2000; Selwyn, 2004; Warschauer, 2004). This lack of access can be classified into four areas: 1) lack of any digital experience, 2) no possession of computers and network connections, 3) lack of digital skills, and 4) lack of significant usage opportunities (van Dijk & Hacker, 2000).
These groups listed above are also more likely to be socially disadvantaged in areas such as economically, poor job prospects, and education levels. Therefore, being more negatively disadvantaged through a lack of accessibility to valuable electronic information and education will continue to further the gap between the haves and the have nots. Studies have demonstrated that high-income, younger, and persons with higher levels of education are more likely to be on-line (Agarwal, Animesh, & Prasad, 2009). Thus, the global digital divide is primarily determined by income (Chinn & Fairlie, 2004).
Does this inequity in access to information constitute a market failure worthy of government interference? In order for a condition to qualify as a public policy issue, there must be something at stake for the broader society (Mossberger, Tolbert, & Stansbury, 2003). This paper argues that the digital divide
112 American Journal of Management vol. 13(1) 2013

does constitute a market failure considerable enough to warrant government interventions. Policies must be implemented in various areas of the political system simultaneously in order to narrow the digital divide. These initiatives include reducing government regulations to encourage more companies to begin offering Internet services and personal computers to consumers in disadvantaged areas. Also, governments should provide incentives for NGO’s to begin working to ameliorate this problem through grants or other funding initiatives. By encouraging competition in the private sector, while simultaneously encouraging non-profits to focus on this issue, the digital divide will begin to shrink rather than continue to grow and further disadvantage an already overlooked population.
Some argue that the digital divide is a public policy issue because computers and the Internet are tools for participation in the economy and the political arena. Differences in Internet access across different groups affects their ability to participate and benefit from the growing information and communications technology available to many (Hoffman, Novak, & Schlosser, 2000). Furthermore, some social scientists note that technology disparities merit policy attention because they have important implications for normative issues such as equality of opportunity and democracy. Information technology and access are public goods in the sense that they have positive externalities associated with economic growth and democratic governance. Economists justify government intervention in the case of positive externalities, or effects that ripple beyond the individuals who are directly involved in a transaction; where with the market unregulated, commodities that would lead to positive externalities will likely be under produced (Mossberger et al., 2003). Therefore, government intervention in the form of public provision or public subsidy is more efficient in the sense that it is able to better capture the spillover benefits for the greater society. However, some argue that the proper role of the government with regard to information technology is less clear and that it is advisable to wait and see whether the market is able to essentially close the gap (Mossberger et al., 2003). REVIEW OF THE LITERATURE
The digital divide is a phenomenon that has a significant impact on human and social capital. The digital divide not only encompasses access to computers and the Internet, but also the value added output created from its use. One study consisting of a survey of 18,439 Americans demonstrated that high-income and higher-educated persons were more likely to have adopted the Internet prior to 2001; however, lower-income and lower-educated persons spent a larger amount of time on-line (Goldfarb & Prince, 2008). The authors argue that variables such as the value of leisure time, overall amount of leisure time, and usefulness of on-line activities contribute to this disparity. Due to the pricing structure of Internet access, low-income persons are more likely to spend more time using the Internet participating in inexpensive on-line activities rather than participating in other more expensive leisure activities (Goldfarb & Prince, 2008).
In 2009 the American Recovery and Reinvestment Act authorized approximately $30 billion to create a national system of electronic healthcare records for hospitals and physicians. This initiative is intended to improve health outcomes by increasing efficiencies and reducing errors. However, as some hospitals are unable to implement electronic health records (EHRs), the digital divide is infiltrating other areas of society’s well being. Hospitals that care for a disproportionate number of low-income patients are lagging behind in adopting EHRs (Jha et al., 2009). Large financial barriers also inhibit implementing technology in community health centers, public hospitals, and some unaffiliated public hospitals (Miller, D'Amato, Oliva, West, & Adelson, 2009). These healthcare providers are more likely to serve persons who are low-income, low-education levels, and minorities.
It is important to note that the digital divide produces negative externalities not only in developed countries, but also in less developed and developing countries as well. For example, Africa makes up more than 14% of the world population, but accounts for only 2.6% of all Internet users worldwide (Fuchs & Horak, 2008). This number is dramatically lower than approximately 70% of the U.S. population which uses the Internet (Watson et al., 2008). One reason for this low level of Internet usage may be a result of the high cost of Internet access in Kenya and Nigeria. In 2002 the average cost of a
American Journal of Management vol. 13(1) 2013 113

dial-up Internet account in Kenya and Nigeria was approximately $60 per month, which is more expensive than the average cost in the United States (Oyelaran-Oyeyinka & Adeya, 2004). This supports the conclusions concerning Internet usage and the price of leisure presented by Goldfarb and Prince.
Further examination of the digital divide globally has demonstrated that developing countries have been slower in the diffusion of PCs and the Internet (Dewan, Ganley, & Kraemer, 2009). Contrary to previous studies, the authors argue that although the diffusion rate has been slower in developing countries, evidence exists to indicate that the digital divide will in fact narrow in the future and not widen. This is due to the complementary nature of technologies found with PCs and the Internet. To further narrow this gap, developing countries need to utilize a systems approach to technology access and use by bundling low-cost systems with access to the Internet (Dewan et al., 2009).
Some developing countries have initiated policies to narrow this digital divide. In 2000, New Delhi in partnership with an information technology company, provided computer access to the city’s street children in an initiative titled “Hole-in-the-Wall” (Warschauer, 2002). This project consisted of volunteer manned computer kiosks located in one of the most impoverished slums in New Delhi. The purpose of this initiative was to provide 24-hour access to computers and the Internet to youths residing in this area without formal educators. This minimally invasive education model designed for youths to teach themselves basic computer skills can lead to an accelerated learning of such skills, and youths seldom want formal computer education (Mitra, 2000). However, the reality of this program included little implementer organization, no community groups involvement, language barriers, unreliable Internet connection, and the majority of the youths spent their time at the computer drawing with basic graphic programs and video games (Warschauer, 2002).
Some argue that the measurement of the digital divide, relative versus actual, is in fact part of the overall problem. The relative divide is the ratio of information technology stock in developed countries divided by the stock in developing countries; where the absolute divide is the stock of information technology in developed countries minus by the stock in developing countries (James, 2009). By using this methodology the author demonstrates where the absolute divide can increase while the relative divide appears to decrease. This can lead to the perception that the problem is shrinking when in fact it has worsened. Overcoming the relative digital divide can be relatively easier in developing countries due to the fact that their technology base starting point is very low (James, 2009).
Caution must also be taken is comparing developed and developing countries with regards to the digital divide. Demographic variables and population distribution have demonstrated to be contributing variables in Internet access and PC usage. Most developing countries have substantially more persons residing in rural areas than in the US, and developing countries are also comprised of a higher population of children (Chinn & Fairlie, 2004). If these developing countries mirrored the age and population distribution of the US the digital divide gap would be 6.1 to 13.7 percent larger (Chinn & Fairlie, 2004).
Other factors have also been implicated in an individual’s decision not to use the Internet. One such variable in determining individual choice to abstain from accessing the World Wide Web is social influences radiating from the individuals neighborhood or region (Agarwal et al., 2009). In an effort to explain wide variations of Internet usage throughout the US the authors examined the peer effect using data from approximately 56,000 households in 2001 and 2003. This study demonstrated that those individuals who are surrounded by person who choose to not access the Internet are themselves less likely to do so (Agarwal et al., 2009).
The majority of the literature examining the digital divide has examined the effects on the adult population. Access to technology by children and young adults can have tremendous social benefits. For persons within the age ranges of 9-11 and 18-19, Internet non-users are more likely to be from working class households, where only half of the non-users have access at school and only a small minority have home access (Livingstone & Helsper, 2007). This lack of on-line usage by youths can partially be explained by the overall lack of access.
114 American Journal of Management vol. 13(1) 2013

THE FEDERAL RESPONSE AND ISSUE FRAMING
There are essentially two theoretical approaches underlying the notion of policymaking. The first is termed the “rational actor model,” in which individual behavior is interpreted as rational decision: individuals consciously formulate goals, gather information about alternative means to achieve them, evaluate the alternatives, and choose the one most likely to succeed. Related to this perspective on individual behavior is the assumption that information is neutral and unbiased. In terms of this perspective, policymaking “is a straightforward, technical exercise conceived of as agenda setting, followed by policy formulation, adoption, implementation, and assessment” (Courtright & Robbin, 2001).
The agenda-setting model emphasizes the values dimension that motivates and drives human behavior. Of particular relevance here is the social construction of knowledge and the ways in which ideas and images influence human perceptions and inspire individual and collective action. Based on this perspective, the agenda-setting model sees the struggle over ideas as the essence of political conflict. Ideas are said to be a powerful medium of exchange and mode of influence. Shared meanings motivate people to action and meld individual striving into collective action (Stone, 1988). In terms of the agenda-setting model, policymaking “is an iterative process, characterized by three components: whether a problem exists, and if so, what it consists of; what must be done; how it must be done” (Courtright & Robbin, 2001).
Consistent with the agenda-setting model is the idea that social problems such as the digital divide are not objective phenomena; rather they are social constructs. Though we know that that the digital divide is a real phenomenon, the course of action the policy should accept in combating the problem will depend largely on how we define and conceptualize it. Furthermore, the values we espouse are directly related to the definitions we formulate. An important point to note is that there is no universal definition of the digital divide. Rather, various stakeholders have framed the issue differentially. As a result, the solutions proposed by various stakeholders to address the problem, vary considerably.
Defining and setting the parameters of a particular problem aid in including or excluding specific parties and stakeholders. Thus, how the issue of the digital divide is framed largely contributes to the selection of resources called upon as part of the solution. Some argue that a degree of moral responsibility needs to be woven throughout the question of the digital divide. For example, Keniston and Kumar (2004) suggest that the question should include consideration to how technologies can be use to ensure the fulfillment of basic human needs and further basic human rights.
In the United States the issue was partially framed in response to the 1995 NTIA report entitled, “Falling through the net: A survey of the “Have Nots” in rural and urban America.” Due to this report, the Telecommunications Act of 1996 extended telecommunications policy beyond issues of phone service to new digital media (Mossberger et al., 2003). The Telecommunications Act constituted the first government response to the issues outlined in the report. This Act framed the problem of the digital divide as one of access (Mossberger et al., 2003). As a result, “access concerns predominate in programs as well as research addressing the technologically disadvantaged” (Mossberger et al., 2003). Based on the Act, the E-Rate program was established. The E-Rate, which is the largest federal program, provides significant discounts on telecommunications technologies to schools and libraries throughout the United States (Carvin, Conte, & Gilbert, 2001). This program, which began in 1998 as part of the 1996 Telecommunications Act, is administered by a nonprofit organization known as the Universal Services Administrative Corp., and is overseen by the Federal Communications Commission (FCC).
A number of services are covered by E-rate including Internet access and high-speed data connections. However, a host of other services such as computer hardware and electrical upgrades are not covered. “Two other federal programs, the Technologies Opportunity Program (TOP) and the Community Technology Centers (CTC), assist communities with other needs such as hardware, software, content development, and training. Together, the TOP and CTC programs only constitute 5% of the amount allocated to the E-Rate program.
The problem statement with regards to the digital divide varies even between developed nations. For example, in the United States the problem of access has largely been defined as a lack of infrastructure or
American Journal of Management vol. 13(1) 2013 115
equipment (PC, telephone, modem, etc.) and specific demographic characteristics (rural, urban, Hispanic, etc.); where in European Union the problem of access has been more broadly defined as a lack of access to services or information for their entire population, which calls upon a more broad base of stakeholders such as the states and the public (Stewart, Gil-Egui, Tian, & Pileggi, 2006). Leading to the US response of relying more heavily on the forces of the free market to increase competition and lower the costs of access to the end-user.
Caution should also be taken in the classification of “haves” and “have-nots.” This oversimplification can lead to solutions that do not ameliorate the root of the problem. Previous studies have generalized solutions for the digital divide as simply providing “have-nots” with access to ICT and their education, health, and income will become improved (Cecchini & Scott, 2003). ISSUE DEFINITION
According to Mossberger et al, “an issue definition based primarily on access contains an implicit assumption that the policy problem is affordability rather than ability to use technology (Mossberger et al., 2003). In a similar vein, Di Maggio and Hargittai, propose that the digital divide should be defined more broadly than access (DiMaggio & Hargittai, 2001). They propose that there are essentially five categories of inequality that are relevant to the digital divide. These include, for example, Inequality in technical apparatus, which refers to the manner in which hardware, software and connections, limit the ways in which different kinds of users can utilize the Internet. “As bandwidth increases and more and more Web sites require late-model browsers to display java applications, sophisticated graphics, or streaming audio and video, to what extent can users without access to expensive systems access the full range of Internet content?” (DiMaggio & Hargittai, 2001). Inequality in autonomy of use refers to the location at which people access the Internet e.g., from their homes, business or libraries. Location influences, for example, the hours at which an individual can access the Internet as well as the filters that serve as technical impediments to access.
The third refers to the inequality in skill that people bring to their use of the Internet. Internet skills involve, for example, how to conduct searches, download information, and integrative knowledge about the manner in which the Web is structured so as to enable users to navigate more effectively. According to Servon, federal efforts to date have focused on getting computers and Internet into the schools, not on developing IT skills through training (Servon, 2002). She notes that IT literacy the ability to use IT for a range of purposes is an important component of the digital divide. Servon also points out that another dimension of the digital divide has to do with content. “When disadvantaged groups log on, they often find there is no content there. The kind of information they seek – information that is directly related to their lives and communities and cultures – does not exist” (Servon, 2002).
It is interesting to note that Courtright and Robbin conducted research to uncover the extent of consensus that exists among a sample of policy stakeholders regarding the issue of the digital divide (Courtright & Robbin, 2001). Policy stakeholders were identified through news stories and opinion pieces published in 5 US newspapers during the year 2000. The term digital divide was included in the headlines or lead paragraphs of these newspapers. Most of the stakeholders defined the digital divide as a lack of access to computers and Internet. However, some of the groups disputed the existence of a digital divide. Still others agreed that a digital divide exists but they claimed that skills and education are either more or equally as important as access. Lastly, two stakeholders noted that a lack of useful Internet content was an important component of the digital divide. POLICY RESPONSES
There are four main policy responses to the problem of the digital divide. One potential solution involves allowing the free market to address the issue through the laws of supply and demand. In 2001 the then Chairman of the Federal Communications Commission, Michael Powell, publically stated that he was strongly committed to creating policy that is centered around market economics (Stewart et al.,
116 American Journal of Management vol. 13(1) 2013

2006). Within this framework, the role of the government should entail nurturing competition and funding basic research. The United States has been on the forefront of global telecommunications deregulation policy, leading to increased private sector competition (Shaw, 2001). Examples of the market approach include the proliferation of free Internet access companies such as NetZero, Juno and DotNow.com (Kuttan, 2003). As the business models of Internet access shift from a monthly payment service, to advertising based revenue stream, the cost of consumer access has fallen dramatically.
Another possible solution involves government action on a federal, state and local level. Advocates of government action argue that the public goods nature of the problem, justifies government involvement. For example, the E-Rate is the largest federally funded program to address the problem of the digital divide. Servon notes that while a formal evaluation of the E-Rate program has not yet been conducted, a number of preliminary studies suggest that the program has several accomplishments (Servon, 2002). This program has encouraged states to promote and invest in telecommunications technologies for schools and libraries. As a result, the percentage of public schools, classrooms and libraries connected to the Internet has mushroomed over the years since the onset of the E-rate program. This has helped defray the costs of telecommunications equipment for underserved educational institutions in the United States. A number of positive spillover effects have been observed from the program such as greater parental involvement in children’s learning as well as an increased community interest and investment in the Internet, prompted by the presence of access points created in public schools. Based on the success of the E-Rate program, this paper recommends that federal funds should continue to be allocated for the program.
These improvements caused by technologies being introduced and/or enhanced in the classroom have not been experienced in developing countries. One reason is due to the lack of years that youths spend in educational institutions. For example, the average number of years of school in Sub-Saharan Africa is 3.7, compared to 12.1 years in the US (Chinn & Fairlie, 2004).
A third perspective argues that outside of the free market and government action, the digital divide can be bridged through community efforts and philanthropy. Bill Gates’ donation of $1 billion to fund minority scholarships in technology fields is a good example of individual philanthropy. An example of corporate philanthropy includes the fact that Ford Motor Company provides most of its employees with a computer, printer and Internet access for $5.00 a month.
The last perspective focuses on private/public partnerships. This involves building collaboration between the government, nonprofit and business sectors in order to address the digital divide. For example, PowerUp is an amalgamation of business, nonprofits and government agencies. The goal of the program is to establish community-level computer and Internet centers across the US. The program is funded by donations from AOL, philanthropic foundations as well as the states of Illinois and Virginia (Kuttan, 2003). CONCLUSION
Based on the information presented in this paper it is evident that the digital divide is a multifaceted issue. As a result, the policy response must be comprehensive in order to address the various aspects of the problem. It is the opinion of this paper that we need to consider all the potential responses outlined above. We cannot hope to address such a complex phenomenon with any single policy approach, but rather a coordinated effort of several policies implemented contemporaneously.
Government regulations in developing countries must be structured to provide incentives for organizations to develop lower cost alternatives to access digital media. This includes implementing statutes and a firm legal framework to aid in protecting intellectual property. Additionally, local governments must work to ensure that many agents are incentivized to provide Internet access and computers to consumers. Assuring that no single company is in the position to grow into a monopoly can prevent prices above market equilibrium and encouraging rapid growth in the industry. By taking these steps, innovation and research and development will be encouraged, thus leading to cost reductions and
American Journal of Management vol. 13(1) 2013 117

increased efficiencies. The business community can play an important role towards ameliorating the problem of the digital divide.
In addition to these steps the government must play a role in encouraging collaboration with the business and nonprofit/philanthropic sectors. To date, government responses have mainly addressed the access dimension of the problem. It is essential, however, that greater funds be allocated to address other dimensions, such as skills/education, Internet content and computer ownership/home Internet access. Investments in human capital, as well as the telecommunications and regulatory infrastructure can aid in advancing both PC and Internet use (Chinn & Fairlie, 2004). For example, as noted above, the TOP and CTC programs only constitute 5% of the amount allocated to the E-Rate program. Therefore, increased funds need to be allocated to these programs. Furthermore, it is imperative that the government partners with grassroots organizations such as CDC’s and other local nonprofits in order to effectively implement these programs. By incentivizing NGO’s to join in improving the digital divide they can reach a population who will most likely be overlooked by the private sector.
It is important that public policy efforts do not stifle efforts to lessen the digital divide. A comprehensive policy response that addresses the various dimensions of the digital divide is needed to nurture the strengths of both the public and private sectors. REFERENCES Agarwal, R., Animesh, A., & Prasad, K. (2009). Social interactions and the "digital divide": Explaining variations in Internet use. Information Systems Research, 20(2), 18. Carvin, A., Conte, C., & Gilbert, A. (2001). The E-Rate in America: A tale of four cities. In A. Carvin (Ed.), The Digital Divide: Facing a Crisis or Creating a Myth? London: The MIT Press. Cecchini, S., & Scott, C. (2003). Can information and communications technology applications contribute to poverty reduction? Lessons from rural India. Information Technology for Development, 10(2), 13. Chinn, M. D., & Fairlie, R. W. (2004). The determinants of the global digital divide: A cross-country analysis of computer and Internet penetration. Yale University: Economic Growth Center. Courtright, C., & Robbin, A. (2001). Deconstructing the digital divide in the United States: An interpretive policy analytic perspective. Paper presented at the International Association of Media and Communication Research and International Communication Association "Symposium on the Digital Divide". Dewan, S., Ganley, D., & Kraemer, K. (2009). Complementarities in the diffusion of personal computers and the Internet: Implications for the global digital divide. Information Systems Research, published online ahead of print June 12, 2009, 18. DiMaggio, P., & Hargittai, E. (2001). From the 'digital divide' to 'digital inequality': Studying internet use as penetration increases. Center for Arts and Cultural Policy Studies, Woodrow Wilson School, Princeton University. Eastin, M. S., & LaRose, R. (2000). Internet self-efficacy and the psychology of the digital divide. Journal of Computer-Mediated Communication, 6(1), 14. Fuchs, C., & Horak, E. (2008). Africa and the digital divide. Telematics and Informatics, 25(2), 8. Goldfarb, A., & Prince, J. (2008). Internet adoption and usage patterns are different: Implications for the digital divide. Information Economics and Policy, 20(1), 15.
118 American Journal of Management vol. 13(1) 2013

Hoffman, D. L., Novak, T. P., & Schlosser, A. (2000). The evolution of the digital divide: How gaps in Internet access may impact electronic commerce. Journal of Computer-Mediated Communication, 5(3). James, J. (2009). From the relative to the absolute digital divide in developing countries. Technological Forecasting & Social Change, 76(8), 6. Jha, A. K., DesRoches, C. M., Shields, A. E., Miralles, P. D., Zheng, J., Rosenbaum, S., et al. (2009). Evidence of an emerging digital divide among hospitals that care for the poor. Health Affairs, 28(6), 11. Keniston, K., & Kumar, D. (2004). IT experienced in India. Bridging the digital divide. New Delhi: Sage Publications India Pvt. Ltd. Kuttan, A. (2003). From Digital Divide to Digital Opportunity. Oxford: The Scarecrow Press, Inc. Livingstone, S., & Helsper, E. (2007). Gradations in digital inclusion: Children, young people and the digital divide. New Media & Society, 9(4), 26. Miller, R. H., D'Amato, K., Oliva, N., West, C. E., & Adelson, J. W. (2009). California's digital divide: Clinical information systems for the haves and have-nots. Health Affairs, 28(2), 12. Mitra, S. (2000). Minimally invasive education for mass computer literacy. Paper presented at the Conference on Research in Distance and Adult Learning in Asia. Mossberger, K., Tolbert, C. J., & Stansbury, M. (2003). Virtual Inequality: Beyond the Digital Divide. Washington D.C.: Georgetown University Press. Oyelaran-Oyeyinka, B., & Adeya, C. N. (2004). Internet access in Africa: Empirical evidence from Kenya and Nigeria. Telematics and Informatics, 21(1), 15. Selwyn, N. (2004). Reconsidering political and popular understandings of the digital divide. New Media & Society, 6(3), 22. Servon, L. J. (2002). Bridging the Digital Divide: Technology, Community, and Public Policy. Oxford: Blackwell Publishers, Ltd. Shaw, J. K. (2001). Telecommunications deregulation and the information economy (2nd ed.). Norwood: Artech House, Inc. Stewart, C. M., Gil-Egui, G., Tian, Y., & Pileggi, M. I. (2006). Framing the digital divide: A comparison of US and EU policy approaches. New Media & Society, 8(5), 22. Stone, D. A. (1988). Policy Paradox and Political Reason. Glenview: Scott Foresman & Co. van Dijk, J., & Hacker, K. (2000). The digital divide. As a complex and dynamic phenomenon. Paper presented at the Conference of the International Communication Association. Warschauer, M. (2002). Reconceptualizing the digital divide. First Monday, 7(1), 12. Warschauer, M. (2004). Technology and Social Inclusion: Rethinking the Digital Divide. Cambridge: The MIT Press.
American Journal of Management vol. 13(1) 2013 119

Watson, A. J., Bell, A. G., Kvedar, J. C., & Grant, R. W. (2008). Reevaluating the digital divide: Current lack of Internet use in not a barrier to adoption of novel health information technology. Diabetes Care, 31(3), 3.
120 American Journal of Management vol. 13(1) 2013

Demographic Variables Affect Branded Product in Retail Market
S. Franklin John Bharathiar University, Nehru College of Management
S. Senith
Bharathiar University, Nehru College of Management
This study was designed to investigate the influence of demographic variables and different dimensions of milk brand. From the careful investigation of the literature survey we found out that there is an influence of demography of the sample on the purchase of the branded milk in retail market. We intend to study the influence of demography variables on purchase of branded milk in the retail market in Tamil Nadu. For this study, we prepared a questionnaire and it was distributed to 500 consumers who are all using branded milk. Out of the 500 consumers contacted, 325 questionnaires were returned with required coverage and details. The participants completed the two sets of self-reported questionnaires, including background characteristics and the variables chosen for this study in order to measure the influence of branded milk; Salience, Performance, Imagery, Judgment, Feelings and Resonance. The collected data were computed and analyzed uing a one-way analysis of variance. The findings of the study were generalized as follows: statistically insignificant differences were found in the marital status and the different brand dimensions like Salience, Performance, Imagery, Judgment, Feelings and Resonance. Also there was a statistically significant difference in the dimensions of Imagery, Feelings and respondents occupation. INTRODUCTION
Retailing is a customary form of exchange process practiced in India right from the days of the barter system. It is a process by which the title of the product (or service) is transferred by an individual, group or business to the final customers in the necessary variety structure, in the right quantity, and at the time of necessity, which in turn satisfies consumption needs. The retailers buy the products from the manufactures or wholesalers in bulk, and restructure them to the final customers in small lots (Ramanathan, 2009). Retailing is the world’s largest private industry with total sales of dollar 6.6 tn. In India too; the industry is large, accounting for around 10% of GDP, which is the second largest after agriculture. Annual retail sales in India are anticipated at dollar 340 bn and have been growing at 5% annually. India has one of the highest densities of retail outlets in the entire world. (C.V Krishna, 2009). When we say retail, we mean both organized as well as unorganized retail. Organized retail is limited predominantly to the urban areas and comprises only 5% of the total retail sector, which presently amounts to around dollar 365 bn per annum. India is the fifth largest retail market globally, and has been ranked 2nd after Vietnam as the most attractive emerging market target for investment in the retail sector. Developments in the retail sector have gripped the population in urban areas to such a degree that the
American Journal of Management vol. 13(1) 2013 121

retail players are now bandying about differentiation, branding and customer satisfaction almost continuously (Tripurai pandey, 2009).
In 1980s branded milk was an indication of high regard. Currently in 2007 large part of households in cities depend upon the mother dairy or amul for their daily milk supply. (Bhara, 2008). India milk products for the global market using world class technology with the delicensing of the milk industry in the 90s, Global players like Nestle, Britannia, Smithkline, Beecham and others plugged into the thriving milk products market, which was thoroughly documented through the operation flood programme has turned into a household name with global position, hundreds of small and medium players also have made a raid into this industry. (Vinod, 2004)
Milk was at first sold door to door by the local milk man .When the dairy cooperatives at first fixed advertising branded milk. It was sold in glass bottles preserved with foil. Over the years several developments in packaging media have taken place. In the early 80’s plastic pouches replaced the bottles. Plastic pouches replaced the bottles. Plastic pouches made carrying and storage very convenient besides reducing costs. Milk packets in plastic pouches/bottles have shelf life of just 1-2 day that too only refrigerated. In 1996, Tetra packs were introduced in India Tetra packs aseptic lamination packs made of aluminium paper, board and plastic. Milk stored in tetra packs and treated under Ultra-high temperature (UHT) technique can be stored for four months without refrigerator Most of the dairy consumer –operatives in Andra Pradesh, Tamil Nadu, Punjab and Rajasthan sell milk in tetra packs. OBJECTIVES OF THE STUDY
1. To study the influence of Occupation of the respondents on dimensions of Milk branding. 2. To study the influence of marital status of the respondents on dimensions of Milk branding
HYPOTHESIS
Following are the test Hypothesis proposed for the research study. These hypotheses will help us to understand the retail milk brand.
H1: Respondents Occupation is influenced by the different dimensions of milk brand. H2: Respondents Marital Status is influenced by the different dimensions of milk brand.
RESPONDENT SAMPLE
The questionnaires were given to 500 consumers who were are all using branded milk. Respondents of the samples where above 18 years using branded milk only. Out of 500 consumers contacted, 325 questionnaires were received with necessary coverage and details. INSTRUMENT FOR STUDY
The instruments of this study involved two parts: the first section of the instrument consisted of forced-choice questions about demographic characteristics: gender, marital status, age, occupation, monthly income level. The second section variables chosen for this study in order to measure the influence of branded milk in Indian retail markets are taken from branding milk dimension contains of 60 items and characterized into six sub scales: (a) Salience (items 1 to 7), (b) Performance(items 8 to 13), (c) Imagery (items 14 to 18) ,(d) Judgment (items 19 to 36), (e) Feelings (items 37 to 42), (f) Resonance (items 43 to 60).The milk branding dimension 60 items are evaluated on a five-point Likert scale ranging from 1 to 5 ,using the anchors “5=stronglyagree,4=agree,3=Neutral,2=Disagree ,1= Strongly disagree”.
Cronbach Alpha is a coefficient (a number between 0 and 1) that is used to rate the internal consistency (homogeneity) or the correlation of items in a test. If the test has a strong internal consistency most measurement experts agree that it should show only moderate correlation among items (0.70 to 0.90). The reliability coefficients for the variables chosen for the study should have to be more than 0.70,
122 American Journal of Management vol. 13(1) 2013
to consider it as an acceptable value (Nunally, 1978). In this study the reliability analysis shows that all the factors have shown an alpha value greater than 0.7, indicating the evidence of reliability and the overall reliability of the instrument is 0.92. So, the items constituting each variable under study have reasonable internal consistency and shows that all the dimensions of branded milk have a positive reliability. The factors and dimensions included for analysis carry a good degree of reliability to support the objectives formulated. All dimensions have got significant relationship to make the real representation of the study. Hence it is concluded that the data collected in this study is highly reliable. DATA ANALYSIS
The Statistical Package for the Social Science (SPSS) for Microsoft Windows 16.0 was used to complete the analysis of the collected data. Descriptive statistics, including means, standard deviations were implemented in order to investigate the demographic data, and the influence of branded milk-test, one-way analysis of variance (ANOVA) were used to determine whether any significant relationships exist among respondents. In addition, the .05 level of statistical significance was set on all statistical tests in the present study.
1. To Study the Significant difference in Various Dimensions of Branding by the Marital Status of Respondents.
The Group statistics table (see below) provides some very useful statistics including the mean, standard deviation for the dependent variables when two groups (married, unmarried) and the combined (Total). Salience of the product does not reveal statistically significant difference by marital status of respondents.Table-1 shows that consumers who married have more aware of branded milk (mean=3.92) than unmarried consumers the mean score is less (mean=3.86), performance of the product have no statistically significant difference by marital status of the respondents. Table-1 shows that consumers who married (mean=3.60) and unmarried (mean=3.60) have same satisfaction towards performance of branded milk. Imagery of the product has no statistically significant difference by gender of the respondents. Table-1 shows that consumers who married are more attached with branded milk (mean=3.27) than unmarried respondents the mean score is less (mean=3.15), judgment of the product have no statistically significant difference by marital status of the respondents. Table-1 shows that consumers who married are more satisfied with the quality of the product and creditability is high towards the producers, and their opinion about brand of milk is superior than other brand of milk (mean=3.66) than unmarried respondents the mean score is less (mean=3.63), feelings of consumer about their brand of milk have no statistically significant difference by marital status of the respondents. Table-1 shows that consumers who unmarried have high positive feelings towards brand of milk (mean=3.61) than unmarried respondents because the mean score is less (mean=3.57), resonance of product have no statistically significant difference by marital status of the respondents. Table-1 shows that consumers who unmarried are more loyal and commitment towards brand of milk (mean=3.48) than married respondents because the mean score is less (mean=3.46).
American Journal of Management vol. 13(1) 2013 123

TABLE 1 GROUP STATISTICS
Homogeneity of Variances Table & T-Test For Equality of Mean
The table Test of Homogeneity of Variances (see below) shows the result of Levene's Test of Homogeneity of Variance, which tests for similar variances. If the significance value is greater than 0.05 (found in the Sig. column) then we have homogeneity of variances. We can see from this that Levene'sF Statistic has a significance value of Salience is 0.867, Performance is 0.145, Imagery is 0.846, Judgment is 0.622, Feelings is 0.857, Resonance is 0.889 and, therefore, the assumption of homogeneity of variance is met.
TABLE 1.1 TEST OF HOMOGENEITY OF VARIANCES & T-TEST FOR EQUALITY OF MEAN
Hence homogeneity of variance is met from the T-test for Equality of mean. Equal variance is assumed for sig (2-tailed). As in all statistical tests, the basic criterion for statistical significance is a "2-tailed significance" less than 0.05. significance level of Salience is 0.416 (P =0.416), which is above 0.05 and, therefore, there is no statistically significant difference between salience of branding by marital status of respondents, significance level of performance is 0.998(P=.998) which is above 0.05 and, therefore, there is no statistically significant difference between performance of branding by marital status of respondents , significance level of Imagery is0.182 (P=.182) which is above 0.05 and, therefore, there is no statistically significant difference between Imagery of branding by marital status of respondents , significance level of Judgment is 0.667 (P=.667) which is above 0.05 and, therefore, there is no statistically significant difference between judgment of branding by marital status of respondents , significance level of feelings is0.567 (P=.567) which is above 0.05 and, therefore, there is no statistically significant difference between Feelings of branding by marital status of respondents, Significance level of resonance is .824 (P=.824) which is above 0.05 and, therefore, there is no statistically significant
124 American Journal of Management vol. 13(1) 2013

difference between resonance of branding by marital status of respondents, so we fail to reject H0. That is, there is insufficient evidence to claim that some of the means may be different from each other. 2. To Study the Significant difference in Various Dimensions of Branding by the Occupation of the Respondents.
The descriptive table (see below) provides some very useful descriptive statistics the mean, standard deviation for the dependent variables for all the groups and when all groups are combined (Total). Salience of the product have no statistically significance difference by occupation of the respondents.Table-2 shows that house wives are more aware of brand of milk (mean =3.96) and students are less aware of brand of milk (mean =3.85), performance of the product have no statistically significance difference by occupation of the respondents.Table-2 shows that house wives are more satisfied with brand of milk (mean=3.67) and students are less satisfied with brand of milk (mean=3.56), Imagery of the product have statistically significance difference by occupation of the respondents. Table-2 shows that house wives are highly attached with brand of milk (mean=3.40) and students are less attached with brand of milk (mean=3.18), judgment of consumer towards their brand milk has no statistically significance difference by occupation of the respondents. Table -2 shows that house wives are more satisfied with quality of brand milk, high creditability towards producers and they consider their brand as more superior than other brand of milk (mean=3.74) and professional are low satisfaction towards brand of milk (mean=3.62), feelings of consumer towards their brand milk have no statistically significance difference by occupation of the respondents. Table -2 shows that house wives have more positive feelings towards brand of milk (mean=3.66) and professional and student have less positive feeling towards brand of milk (mean=3.51), resonance has no statistically significance difference by occupation of the respondents. Table -2 shows that house wives are more loyal and commitment towards their brand of milk (mean=3.51) and students, professional are less loyal and commitment towards their brand of milk (mean=3.45).
TABLE 2 ANALYSIS OF VARIANCE (ANOVA)
Note: G1-student, G2-Professional, G3-House wife, N –Number of sample size.
From the above table we can see that in this the significance level of salience is 0.534 (P =0.534), which is above 0.05. So we accept null hypothesis and, therefore, there is no statistically significant difference between salience of branding by occupation of respondents, significance level of performance is 0.376 (P=.376) which is above 0.05 so we accept H0 and, therefore, there is no statistically significant difference between performance of branding by occupation of respondents , significance level of imagery is 0.038 (P=.038) which is below 0.05 so we reject Ho and, therefore, there is statistically significant difference between imagery of branding by occupation of respondents , significance level of Judgment is 0.215 (P=.215) which is above 0.05 and, therefore, there is no statistically significant difference between judgment of branding by occupation of respondents , significance level of feelings is 0.083 (P=0.083)
American Journal of Management vol. 13(1) 2013 125

which is above 0.05 so we accept Ho and, therefore, there is no statistically significant difference between feelings of branding by occupation of respondents, Significance level of resonance is 0.594 (P=.594) which is above 0.05 so we accept Ho and, therefore, there is no statistically significant difference between resonance of branding by occupation of respondents. Homogeneity of Variances
The table Test of Homogeneity of Variances (see below) shows the result of Levene's Test of Homogeneity of Variance, which tests for similar variances. If the significance value is greater than 0.05 (found in the Sig. column) then we have homogeneity of variances.
TABLE 2.1 TEST OF HOMOGENEITY OF VARIANCE
We can see from this that Levene'sF Statistic has a significance value of Salience is 0149, Performance is 0.062, Imagery is 0.168, Judgment is 0.330, Feelings is 0.400, Resonance is 0.412 and, therefore, the assumption of homogeneity of variance is met. Post Hoc Test
Since we rejected the null hypothesis in Imagery dimension (we found differences in the means), we should perform a Turkey’s W multiple comparison to determine which means are different. Using the previous output, here is how such an analysis might appear.
TABLE 2.2 MULTIPLE COMPARISONS
Image of the product Tukey HSD
(I) Occupation of the respondent
(J) Occupation of the respondent
Mean Difference (I-J) Std. Error Sig.
95% Confidence Interval
Lower Bound Upper Bound Student Professional -.001 .100 1.000 -.24 .23
House Wife -.222 .114 .126 -.49 .05 Professional Student .001 .100 1.000 -.23 .24
House Wife -.220* .090 .039 -.43 .00 House Wife Student .222 .114 .126 -.05 .49
Professional .220* .090 .039 .01 .43
126 American Journal of Management vol. 13(1) 2013

The above table indicates that significant differences existed among imagery dimension and Occupation of the respondents. According to the results of the Turkey’s W multiple comparison analysis, significant differences existed among the groups of “Professional” and “House wife” The mean scores reveal that the group house wives are highly attached with brand of milk (mean=3.40) among three different groups. FINDINGS AND DISCUSSIONS
With reference to the objective in this study, the findings and discussions were summarized as follows:
• Salience of the product does not reveal statistically significant difference by Marital status of respondents. Table-1 shows that consumers who married have more aware of branded milk (mean=3.92) than unmarried consumers the mean score is less (mean=3.86). Table-1.1 shows that salience of the product met the homogeneity of variance. (i.e.) Variance is similar Table-1.1 shows the t- test for equality of mean in that salience has no statistically significant difference by marital status of the respondents.
• Performance of the product have no statistically significant difference by marital status of the respondents. Table-1 shows that consumers who married (mean=3.60) and unmarried (mean=3.60) have same satisfaction towards performance of branded milk. Table-1.1 shows that performance of the product met the homogeneity of variance. (i. e) Variance is similar.Table-1.1 shows the t-test for equality of mean, in that performance has no statistically significant difference by Gender of the respondents.
• Imagery of the product has no statistically significant difference by gender of the respondents. Table-1 shows that consumers who married are more attached with branded milk (mean=3.27) than unmarried respondents the mean score is less (mean=3.15). Table-1.1 shows that Imagery of the product met the homogeneity of variance. (i.e.) Variance is similar.Table-1.1 shows the t-test of equality of mean, in that Imagery has no statistically significant difference by Marital status of the respondents.
• Judgment of the product has no statistically significant difference by marital status of the respondents. Table-1 shows that consumers who married are more satisfied with the quality of the product and creditability is high towards the producers, and their opinion about brand of milk is superior than other brand of milk (mean=3.66) than unmarried respondents the mean score is less (mean=3.63). Table-1.1 shows that Judgment of the product met the homogeneity of variance. (i.e.) Variance is similar. Table-1.1 shows the t-test of equality of mean, in that Judgment has no statistically significant difference by marital status of the respondents.
• Feelings of consumer about their brand of milk have no statistically significant difference by marital status of the respondents. Table-1 shows that consumers who unmarried have high positive feelings towards brand of milk (mean=3.61) than unmarried respondents because the mean score is less (mean=3.57). Table-1.1 shows that feelings of the product met the homogeneity of variance. (i.e.) Variance is similar. Table-1.1 shows the t-test of equality of mean, in that feelings has no statistically significant difference by marital status of the respondents.
• Resonance of product has no statistically significant difference by marital status of the respondents. Table-1 shows that consumers who unmarried are more loyal and commitment towards brand of milk (mean=3.48) than married respondents because the mean score is less (mean=3.46). Table-1.1 shows that resonance of the product met the homogeneity of variance. (i.e.) Variance is similar. Table-1.1 shows the t-test of equality of mean, in that resonance has no statistically significant difference by marital status of the respondents. Significant differences existed among imagery dimension and Occupation of the respondents. According to the results of the Turkey’s W multiple comparison analysis, significant differences existed among the groups of
American Journal of Management vol. 13(1) 2013 127
“Professional” and “House wife” The mean scores reveal that the group house wives are highly attached with brand of milk (mean=3.40) among three different groups.
CONCLUSION
From the above analysis and discussions it was found that the marital status is not influencing the preference towards the branded product in the Indian retails industry. Based on the India marriage culture it is evident that most of the time, the house hold wife will make the decision of purchasing milk in the house. The brand which the person is exposed to in her house before marriage will have the influence even after the marriage. But when we conducted post hoc test among the three groups the housewives are influenced by the image of the branded milk. This may have occured because Indian housewives are highly exposed to the serials which are telecasted on the TV. On the television everyday, they are exposed to different branded milks, and there is a chance the image of the product that is close to their thought process will influence them to buy the product. This study proves that branding has a significant influence in the Indian retail industry. REFERENCES Armitt, Claire. (2004) Case Study, New Media Age. P28-28, 1/2p, 1 Color Photograph. Beck, Robert, L. (1974) Consumer Gain From Private Labeling Of Milk, Journal Of Consumer Affairs, Vol.8, Issue 2, P194, 4p. Benton et al. (2007) Impact Of Consuming A Milk Drink Containing A Probiotic On Mood And Cognition, European Journal Of Clinical Nutrition, Vol. 61, Issue 3, P355-361, 7p, 1 Chart, 3 Graphs. Bianco, David, Ed (1993) PR News Case Book: 1000 Public Relations Case Studies Gale Research. Bittar, Christine (2003) Milk, Hold The Cholestral, Brand Week, Vol 44, Issue 21, P10, 1/3p. Blattberg, Robert C, Scott A, Neslin. (1990) Sales Promotion: Concepts, Methodsand Strategies, Prentice Hall. Bokale, Jemima. (2007) Waitrose Invests In Eco-Friendly Milk Packaging, Marketing (00253650), P4-4, 1/5 P, 1 Color Photograph. Brian Beattie .(2002) Arla Lifts Lid On Database Drive For Milk Brand, Precision Marketing, Vol. 14, Issue 44, P6, 1/6p, 1 Color Photograph. Bruce Harte. (2001) Milk Packaging Its More Than A Container, Dairy Foods, Vol 102, Issue 6, 5p, 3 Color Photo Graphs. Cal Crandall. (1986) Marketing Briefs, Marketing New, Vol. 20, Issue 22, P15-15, 1/7 P. Carol Wham. (2000) Changing New Zealanders Attitudes To Milk. Thesis Submitted In Fulfillment Of The Requirements For Phd. Carolyn Dimitri and Kathryn M. Venezia. (2007) Retail And Consumer Aspects Of The Organic Milk Market/Ldp-M-155-01, Economic Research Service /Usda.
128 American Journal of Management vol. 13(1) 2013
Cartons are Cat’s Whiskers, Packaging Magazine; 9/9/2004, Vol. 7, Issue 16, P14-14, 1/4p. Central Statistical Organization (Cso) 2006, Growth Rates: Goldman Sach’s Bric Report. Chaitanya Prasad Giri (2009) Branding Strategies For The Future, A Lesson From Past Experience, Advertising Express, P40-40. Cherish Mathew (2009) Organized Retail Business Opportunity Or Threat? Marketing Mastermind, The Icfai University Press, Reference#10m-2009-06-06-01. Chiara Taglioni (2010) Influence Of Brand Equity On Milk’s Choice: A Survey Through Choice. Churning Up Awards. Dairy Industries International, Feb2006, Vol 71, Issue 2, P6-6, 1/9p. S.A CHUNAWALLA (2008) Compendium Of Brand Management, Himalaya Publishing House Private Ltd. Daniel Thomas (2005) Milk Development Council Ads To Target Teenage Girls, Marketing Week (01419285) Vol 28, Issue 2, P6-6, 1/3p. David Diggens (2005) Superheros To Front Milk Drink Brand, Marketing Week (01419285), Vol. 28, Issue 32, P6-6, 1/5 P, 1 Color Photograph. Denford Chimboza And Edward Mutandwa (2007) Measuring The Brand Preference In A Dairy Product Market, Issn 1993-8233@2007 Academic Journals. Dominkowski, John (2001) Wmmb Gives Away Bug To Promote Milk, Dairy Foods, Vol. 102, Issue 10, P16, 1/2p, 1 Color Photograph. Dudlicek, James (2009) Pushing The Line, Dairy Foods, Vol 110, Issue 4, P70-71, 2p, 1 Color Photograph. Daul Fraser (2008) Dairy Crest Set To Rebrand Milk Lines As Country Life, Marketing Wee k(01419285), Vol. 31, Issue 40, P5-5, 1/5p. Gupta, S.L. (2005) Brand Management (An Indian Perceptive) Himalaya Publishing House. Pelletier, David L, Kendal and Anne (1999) Nutrition And Dairy Industry Benefits Associated With Promoting Lowfat Milk, Family Economics & Nutrition Review, Vol 12, Issue 1, P3, 11p, 4 charts, 1 graph. Penny Baker (2006) Wake Up To Weight Loss, Frozen Food Age, Vol. 54, Issue 11, P27-29, 2p. Philips, David (2005) Wrap It Up, Dairy Foods, Vol. 106, Issue 6, P24-30, 5p. Pradip Kumar Deb (2010) Managing Brands In A Changing World, The Journal Of Aima (All India Management Association) Vol. 49, Issue 7. Quackenbush, Gerald G. (1966) The Ada/Usda Milk Promotion Study, Journal Of Farm Economics; Aug (Part1) Vol. 48, Issue 3, P756, 3p.
American Journal of Management vol. 13(1) 2013 129

Ramanathan (2009) The New Face Of Unorganized Retailers In India, Marketing Mastermind, Reference#10m-2009-05-08-01. Rentas-Giusti, Laura (2003) Local Milk Producers Launch First Branded Advertising Efforts, Caribbean Business, Vol. 31, Issue 18, P38, 2p, 6 Color Photograph. Repetto, Paul (1999) New Promotion, Dairy Foods, Vol. 100, Issue 8, P18, 1/2p, 1 Color Photograph. Retail Industry In India (2010) A Report On Indian Retail Industry, Corporate Catalyst India.
130 American Journal of Management vol. 13(1) 2013