
American College of HealthCare Architects Summer Leadership Conference 2014
90
The hospital (and community) as a healing environment Accelerate the co-production of health and health care with patients, families, communities and… architects, and designers Paul Barach, MD, MPH July 25, 2014 American College of Healthcare Conference
Transcript of American College of HealthCare Architects Summer Leadership Conference 2014

The hospital (and community)
as a healing environment
Accelerate the co-production of health and health care with patients, families, communities and…
architects, and designers
Paul Barach, MD, MPH July 25, 2014
American College of Healthcare Conference

I Have a Dream: What’s Yours? • All health care environments should be healing
environments • They should feel more like home • They should help make getting better easier, not
harder. • They should help restore joy in work. • They should help people get what they really,
really want – to have more choice and control, and less anxiety and confusion.
• Whether a patient is in our care for an hour, a day, a week, or a year, they deserve an optimal healing environment
After Blair Sadler

Politics and medicine
“Medicine is a social science and medicine is nothing but poli4cs on a grand scale”
Rudolf Virchow, (1821-‐1902) Prussian physician, one of the originators of the
cell theory, worked out the mechanism of pulmonary thromboembolism, wri4ng
about the 1848 typhus epidemic in Upper Silesia

HEALTH SYSTEMS COMPARATIVE DATA

Concurrent Revolutions • Harm prevention • Patient centeredness--salutogenesis • Increasing Patient Expectations • Paying for Value instead of Volume • Reducing variations • Value (Quality/cost) Safety, reliability • Transparency of Outcomes and Scores • Environmental Sustainability is Now Mainstream • Discouraged, Unhappy Workforce, Vendors and …
Architects

Our Challenge: Key System Drivers
Health
Social Economic
Population Health/Patient
Politics, regulations and agencies
6

THREE CONCURRENT REVOLUTIONS

Health care consumes 18% of US energy annually
Slide: 8 © 2009 Perkins+Will

PATIENT CENTERED
TIMELY EFFICIENT
EFFECTIVE
SAFE
EQUITABLE
QUALITY
Components of Quality
QUALITY
FURNISHINGS
LIGHT MATERIALS
WAYFIN
DIN
G
AROMA
ART

The Translational Initiatives
Public Health Sciences
Drug Development /
Cancer
Biomedical Engineering
Device Development
Personalized Medicine
Core Resources And
Competencies

Popula'on Health Management System of Care

Wellness Model

IGNAZ SEMMELWEIS – USE OF CHLORINATED LIME HAND WASHING FOR PREVENTION OF PUERPERAL FEVER (THE MIDWIVES’ WARD LOWER THAN DOCTORS’)

Semmelweis – the mortality rate in April 1847 was 18%; after hand washing was instituted in mid-May, the rate in July was 1%

DR IGNAZ SEMMELWEIS’S FATE
Semmelweis was outraged by the indifference of the medical profession to pa4ent suffering and death ... His contemporaries, including his wife, believed he was losing his mind, and in 1865 he was commiPed to an asylum.. he died there of sep4caemia only 14 days later, possibly from the result of being severely beaten by guards
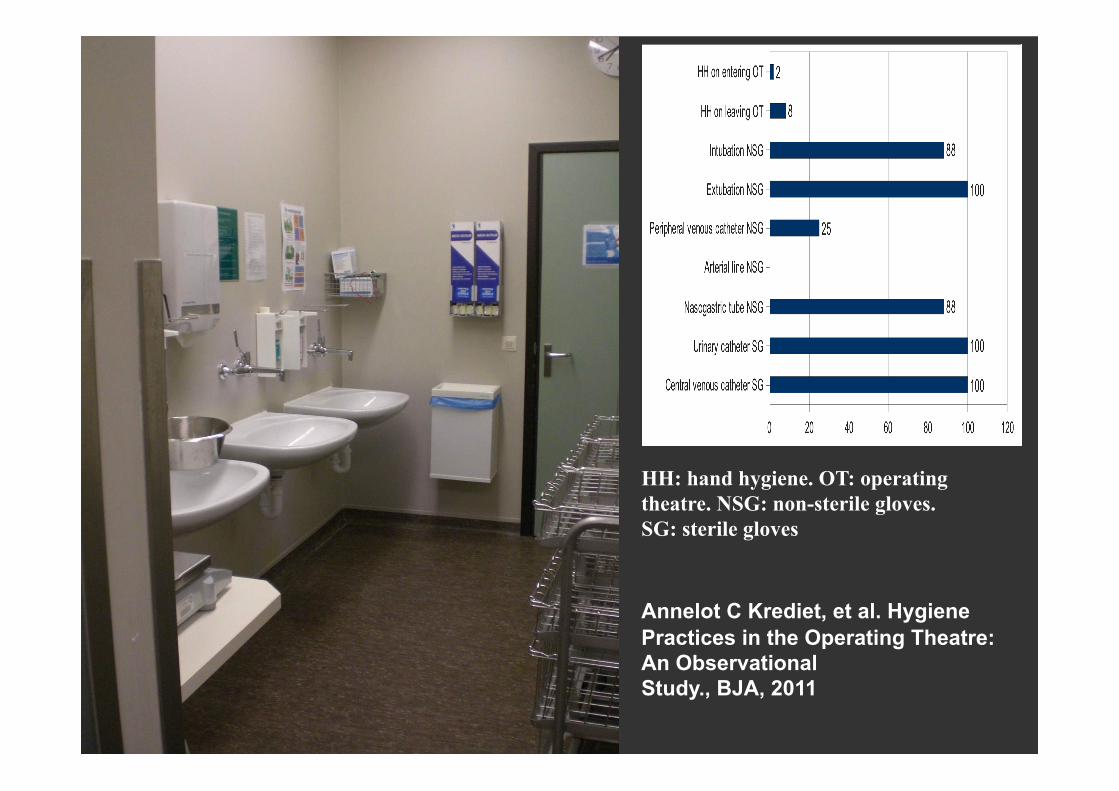
HH: hand hygiene. OT: operating theatre. NSG: non-sterile gloves. SG: sterile gloves Annelot C Krediet, et al. Hygiene Practices in the Operating Theatre: An Observational Study., BJA, 2011

Normalized Deviance • By a deviant organizational behavior, we refer to “an
event, activity or circumstance, occurring in and/or produced by a formal organization, that deviates from both formal design goals and normative standards or expectations, either in the fact of its occurrence or in its consequences.”
• Once a community normalizes a deviant organizational practice, it is no longer viewed as an aberrant act that elicits an exceptional response; instead, it becomes a routine activity that is commonly anticipated and frequently used.
Diane Vaughan, 1999: 273. ; Barach, Phelps 2013

How does it start? • The normalization literature distinguishes
between factors that lead to the genesis of organizational deviance and factors that cause deviance to become routine, rather than idiosyncratic, behavior.
• A permissive ethical climate, an emphasis on financial goals at all costs, and an opportunity to act amorally or immorally, all contribute to managerial decisions to initiate deviance.

Active Event
Reporting
Passive Indicators Discharge
Data
Passive Triggers Medical Records
Truth?
Looking for Harm

Operations performed on Fridays were associated with a higher 30-day mortality rate than those performed on Mondays through
Wednesdays: 2.94% vs. 2.18%; Odds ratio, 1.36; 95% CI, 1.24–1.49)

No system
beyond this point
10-2 10-3 10-4 10-5 10-6
Civil Aviation
Nuclear Industry
Railways
Chartered Flight
Drilling Industry
Chemical Industry (total)
Fatal risk
Anesthesiology ASA1
Innovative medicine (grafts, oncology …) ICU Trauma centers
Very unsafe Ultra safe
Professional fishing
Average rate per exposure of catastrophes and associated deaths in various industries and human ac'vi'es
Unsafe Safe
Hymalaya mountaineering
Combat A/C, war time
Medical risk (total)
Scheduled surgery Chronic care
Radiotherapy, Biology Blood transfusion
Finance Fire Fighting Food Industry
Processing Industry
Amalberti R. et al.: 5 System barriers to achieving ultra-safe health care. Ann Intern Med. 2005;142:756-764.

Assuming a system is 99.9% safe; How Safe is “Safe Enough” for surgery???
• 84 unsafe landings /day
• 1 major plane crash every 3 days
• 16,000 mail items lost/hr
• 37,000 bank transaction errors/hr

23

24

Slide: 25
“Sprawl is taking a toll on Americans' hearts, lungs, air, drinking water, sense of community, psychological well-being and physical safety.” Frumkin& Jackson The Built Environment & Public Health
“During the Atlanta Olympics, restrictions on single occupancy vehicles correlated with a 30% decrease in emergency room asthma visits.”
© 2009 Perkins+Will

I. Busch-Vishniac, J. West, C. Barnhill, T. Hunter, D. Orellana, R. Chivukula, "Noise levels in Johns Hopkins Hospital," JASA 118 (6), December 2005.
Trends in hospital noise since1960
è

NREM2 , NREM3, REM

Poor acoustics (long reverberation times) might increase medical errors by: l Reducing speech intelligibility, increasing comprehension errors l Increasing staff fatigue and stress l Worsening performance in situations involving high load in
working memory

Model of speech intelligibility in hypothetical “zero reverberation” acoustic conditions

Model of speech intelligibility in short reverberation time acoustic conditions

“If an error is possible, someone will make it. The designer must assume that all possible errors will occur and design so as to minimize the chance of the error in the first place, or its effects once it gets made” Norman, The Design of Everyday Things, 2001

Guide to Human factors
• ‘Hard Stuff’: • people interac4ng with machines • People interac4ng with computers • People interac4ng with automa4on
• ‘SoP Stuff’: • People working with people:
• Team performance • handovers • Culture
Barach P, et al. 2013

Reason – Complex Systems

Conceptual model based on Reason’s model showing the role of the environment as a latent condition or barrier to adverse events in health care settings. Sources: Dickerman and Barach (2008); Joseph et al 2008; Patti and Barach (2011); Cassin and Barach (2012); Sanchez and Barach (2012)
Socio-technical approach to safety and quality

Solet J. and Barach P., 2012

Evidence Based Design
Evidence-based design is the deliberate attempt to base building decisions on the best available evidence.
Design decisions are research-informed: § Patient outcomes § Patient satisfaction § Clinical quality and safety § Staff satisfaction § Operational efficiency § Financial performance

The “Rational” Planning Process
Historical UtilizationPatterns
StrategicPlanning
Assumptions
SupportSystems/Services
WorkloadScenarios
EstimateNumber of
O.R.’s
Space andFunctionalProgram
DesignAlternatives/
Cost
Evaluation/Decisions
Analysis ofExisting
O.R.’s/Space
OperationalAnalysis
Ext
erna
l Ana
lysi
sS
ynth
esis
Inte
rnal
Ana
lysi
s
Construction
InfrastructureCapacity
InterventionalComponents
InfectionControl
Assessment
ICRAPlan
TechnologyAssessment
After Zilm F, Tingwald, Barach P.

Nursing Units/Patient Rooms
Cluny 12th C
Friedriks, Copenhagen
Hotel Dieu Ospedale Maggiore, Milan
Antwerp

• “…the very first requirement in a Hospital [is] that it • should do the sick no harm.”
• – Notes on Hospitals, 1863
Florence Nightingale
EBD Perspective

Scutari, former Turkish barracks, 43% die
Crimean Quagmire

The answer: Isambard Kingdom Brunel
Those clever Brits

Military Hospital Ward, Rentkioi
§ Methodical investigation § Testing (EBD old bloke?) § Materials selected for cleanliness § Prefabricated offsite, shipped to Crimea § Removing waste an issue § Ventilation 10,000 CFM § Dramatically improved survival rates – mortality
reduced to 3%
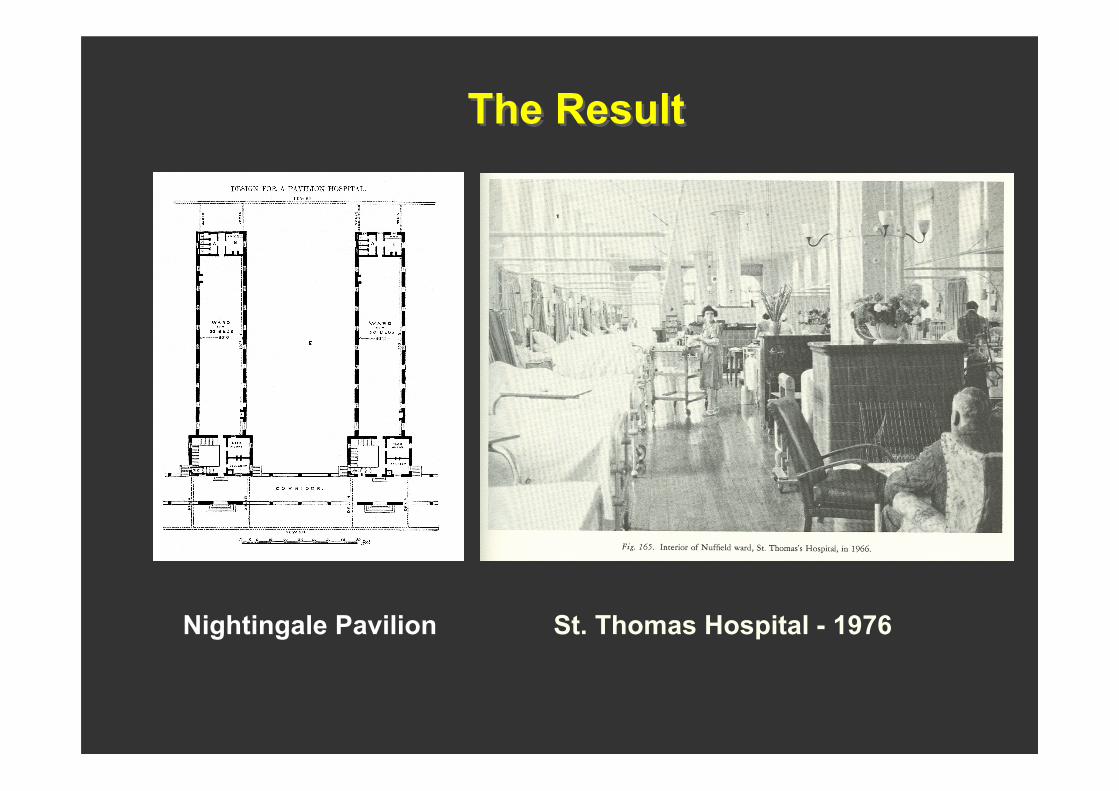
The Result
Nightingale Pavilion St. Thomas Hospital - 1976

2.25%
2.50%
2.75%
3.00%
3.25%
3.50%
3.75%
4.00%
4.25%
Erro
r R
ate
480 lux
Medication Dispensing Error Rates by Illumination Level (Buchanan et al., 1991)
1100 lux 1550 lux (Lighting on task, not ambient)
250 lux

Open bay Old singleroom
New singleroom
0%
60%
50%
40%
30%
20%
10%
27%
38%
47%
28% increase
42% increase
74% total increase
Han
dwas
hing
rat
e Preliminary Findings (Quan and Ulrich, 2005)

Placing alcohol gel dispensers in hallways next to patient doors does not appear to increase hand washing (Muto, Sistrom and Barr, 2000)
For busy preoccupied persons, out-of-sight may be out-of-mind

Old ICU • Combination of open bay
and small single-bed rooms
gel dispenser sink

Four building blocks towards moving Networks towards a “high reliability” healthcare organization
The definition of a high reliability organization extends beyond patient safety to encompass quality care – and ultimately value.
‘High reliability’ organizations:
48
After Berg M and KPMG Report

Conceptual Model of Evidence-Based Practice Implementation, Aarons, 2011

Conceptual Model of Evidence-Based Practice Implementation, Aarons, 2011

Value Compass Thinking
• Do we use these important types of metrics to measure the right things in our Networks?
Results
Satisfaction (Staff and Patients)
Costs
Productivity/Efficiency
Adapted from Nelson et al 2002 51

Challenges in Building Industry Delivery of Services
• Despite BIM, LEAN, forward thinking, scheduling/costing software, design enhancements
Most projects: • Run over budget and time • Expensive • Controlled by legal tools • Limited trust between parties • Maximum uncertainty • Normalised devaince
Slide: 52
Egan Report (1998), Latham Report (1994), Kashiwagi (2006)

Delivery system of services • Client wants low price/high value, vendor wants
minimum performing systems • Price based signals has lower performance because
the client who knows less is giving directions to the vendor who is supposed to be expert
• When minimum requirements are used in combination with low price awards, the quality degrades, trust is absent, and an adversrial relationship between client and vendor is formed
• When quality decreases, client’s control increases • Performance and value decrease with more client
control
Slide: 53

Deming 1982 • Minimisation of deviation and NOT
minimum standards will lead to optimising value
• Minimal standards in directions coupled with the award to the lowest bidder results in degeneration of vendor quality and skill
Slide: 54

The Ladder of Inference (Peter Senge)
55

Information Management theory (IMT)
• Inabiltiy to control, manage, direct others
• Aligns supply chain to minimise cost and transactions
Slide: 56

Increased performance
• Recognises the vendor as expert • Increased vendor accountability • Preplanning • Measurement of performance • Quality and risk management
Slide: 57

Value
• Quality • Customer satisfaction • Project deviations • Project management • Risk management efforts • Price
Slide: 58

Role of the Contract
• Minimises risk instead of controlling, directing, and inspecting vendor
Slide: 59

Best Value Procurement (BVP) • Price AND performance vs. Price ALONE • Limits client control of vendor • Does not use contract to control the vendor • Requires vendor to write contract and define delivered product • Vendors administer their own contract by limiting cost and time
deviations • Gives the vendor full control of the project • Minimizes the time and cost to vendors to prepare for
procurement process • Defines QA as ensuring that the contractor/vendor is running
their quality control/risk management system • Forces the vendor to communicate in simple, non-technical
language, using performance measurements easily understood by non experts
• Measures the performance of the other entities in the supply chain that interface with the contractor
Slide: 60

Outcomes of BVP
• Commodities, professional services, IT • 98% client satisfaction with no vendor
caused deviation • Minimized up to 90% of the client’s risk
and project management • Vendor’s increased profits up to 100%
without increasing the cost to the client
Slide: 61

Tools to Facilitate Understanding Steps from the beginning Program (numbers and narrative) Adjacency and Flow Diagrams Plans and Reflected Ceiling Plans Elevations and Equipment Placement 3D Modeling and Scale Models Full Scale Models and Simulation Mock-ups with Equipment and Finishes

Communications Consensus Building
Vision (from the top) Alignment of Surgery/ Medicine Alignment of Surgery/Radiology Cardiac Catheterization buy in Playing by Surgical Rules Code/Operational Issues
Culture Shock

Scenario Modeling Components
Simulation Engine
I
Demographics
Reimbursement
Technology
Service Rates
Affiliations
Staffing Mix
Input Drivers
I
Units of Service
Financial Ratios
Income Statement
Balance Sheet
Quality Measures
Community Engagement
Outcomes Case Mix Productivity
Capacity Financial Performance
Base Line Variables
Behavior Modification Health Education
Risk Mitigation Variables
PCMH Model ACO

Input
Variations
Scenario Development Process
Capture the Schema
Inputs Baseline Outputs
Formal Model
Variables Drivers Implications
Integration
Implications KPIs
Business Model
Performance
Transformation Plan
Knowledgebase
Educ
atio
n
Initi
al R
un
Form
al R
evie
w
Team
Dev
elop
men
t


600 sf O.R.: Net or Gross sq.ft.?
Response Chart Percentage Count
Net Square Feet 31% 99
Gross Square Feet 69% 221
Total Responses 320
After Frank Zilm

?

Scale of Drawing? AORN
Response Chart Percentage Count
2 to 4 feet 36% 121
5 to 6 feet 47% 157
7 to 8 feet 12% 40
I’m not sure 5% 15
Total Responses 333

Communications Scales of Consensus
The Big Idea (guiding principles) Change as normative (big idea) Establishing a new hierarchy Understanding group loss Leveling an unlevel playing field Establishing small group alliances Understanding individual loss

Tools to Facilitate Understanding Plans and Reflective Ceiling Plans
After George Tingwald

Tools to Facilitate Understanding 3D Modeling

Tools to Facilitate Understanding 3D Modeling

Tools to Facilitate Understanding
3D Modeling

Mock-Up Neuro OR1

Mock-Up OR2

LPCH Mock-Up IMRI

Regenerative Buildings
Living Buildings
“do no harm”
_ = + Regenerative
Buildings
“heal”
+ R
esou
rce
Dep
letio
n +
Res
ourc
e G
ener
atio
n High Performance Green Buildings
“do less harm”
RESILIENCE
© 2009 Green Guide for Health Care
Standard Practice
The future of healthcare

Next frontier -- Wicked Challenges
• Work sharing • Infection prevention • Transitions of care • Physical room and equipment design • Culture of safety

Stages in the development of a safety culture
CALCULATIVE We have systems in place to
manage all hazards
PROACTIVE Safety leadership and values drive
continuous improvement
REACTIVE Safety is important, we do a lot every time we have an accident
PATHOLOGICAL Who cares as long as
we're not caught
GENERATIVE (High Reliability Orgs) HSE is how we do business
round here
After Ron Westrum

High Reliability Organizations
• Environment rich with potential for errors • Unforgiving social and political
environment • Learning through experimentation difficult • Complex processes • Complex technology
Weick, KE and Sutcliffe, KM, 1999

The Five Dysfunctions of (healthcare) Teams
After Patrick Lencioni, 2007
82
Absence of trust
Fear of Conflict
Commitment
Accountability
Results

Shaping the environment for engagement and loyalty
Employees really enjoy working with one
another but don’t feel particularly challenged.
Here the focus is on collaboration and learning
in the service of high-performance outcomes.
Employees tend to be apathetic and spend
their time jockeying for position.
People fear to offer tentative ideas, try new
things, or ask colleagues for help.
Accountability
Safety
Low
High
Low High
After Amy Edmonson


Ebd 2.0: High priority
research directions
Center for Health Design and HERD Conferences

86
1 Develop an an assessment and evidence implementation program 2 Conduct a noise audit and develop a noise reduction plan
3 Install high performance sound absorbing ceiling tiles
4 Install circadian (cycled) lighting in the NICU
5 Install hand washing dispensers at each bedside & in all patient areas
6 Use virtual reality images and artwork to provide positive distractions
7 Incorporate social networking spaces or age appropriate play areas
8 Improve way finding through enhanced signage
9 Where structurally feasible, install HEPA filters in areas housing immunosuppressed patients
Priority Design Recommendations to Implement ANYTIME

87
1 Build single family patient rooms
2 Provide adequate space for families to stay overnight in patient rooms
3 Build accessible indoor or outdoor gardens
4 Design age appropriate play areas and amenities
5 Increase visual access and accessibility to patients (decentralized nursing stations)
6 Optimize natural light in staff and patient areas
7 Install HEPA filters in areas housing immuno-suppressed patients
8 Install effective way finding systems
9 Install ceiling lifts to reduce workforce injuries
10 Reduce patient transfers through acuity adaptable rooms
Priority Design Recommendations to Implement DURING CONSTRUCTION / RENOVATION

§ Risk of failure is inherent in complex systems § Risk is always emerging § All risk is not foreseeable § People are fallible …no matter how hard they try
not to be § Systems are fallible § All care is delivered at the microsystem level § Hospitals can help to design out the impact of
human errors § Culture eats strategy for breakfast
A New Model of Procurement

Conclusion
• Barriers to change-culture eats strategy for breakfast (Peter Drucker)
Slide: 89

More • More on topic and references for talk
see https://www.linkedin.com/in/paulbarach
• Key research papers are downloadable at Research Gate athttps://www.researchgate.net/profile/Paul_Barach/publications/?pubType=article&ev=prf_pubs_art
• Email me at [email protected] or contact me at Tel: 773 612 7039
Slide: 90