Alternative Funding Policies for the Uninsured: Exploring the Value of Hospital Tax Exemption
28
2. Alternative Funding Policies for the Uninsured: Exploring the Value of Hospital Tax Exemption NANCY M. KANE and WILLIAM H. WUBBENHORST Harvard School of Public Health T he number of people lacking health insurance in the United States continues to grow, largely owing to failed efforts to enact universal national coverage and the reduction in employment-based health insurance benefits. In 1998, 44.3 million Americans were without health insurance, and the numbers are still rising, despite a healthy economy and growing employment (Campbell 1999). State and federal policy makers are seeking alternative sources to finance or provide health services for uninsured populations. The Children’s Health Assistance Program, which Congress authorized in 1997, provided $24 billion in new federal funding for a five-year period, ending in 2002. This program has extended coverage to approximately two million previously uninsured children (Thorpe 1997). However, it is not clear whether there will be added coverage or whether the program will be extended past 2002. Meanwhile, the pressure on states to assure access to health services for those without adequate insurance is escalating (American Health Line 1997; 1998; 1999a; 1999b). The tax exemption accorded nonprofit hospitals constitutes an invest- ment of public resources for charitable purposes, one of which is care for the millions of uninsured. Considerable controversy exists, both over the extent to which the public is benefiting from tax-exempt hospitals and The Milbank Quarterly, Vol. 78, No. 2, 2000 c 2000 Milbank Memorial Fund. Published by Blackwell Publishers, 350 Main Street, Malden, MA 02148, USA, and 108 Cowley Road, Oxford OX4 1JF, UK. 185
-
Upload
independent -
Category
Documents
-
view
5 -
download
0
Transcript of Alternative Funding Policies for the Uninsured: Exploring the Value of Hospital Tax Exemption
2. Alternative Funding Policies for theUninsured: Exploring the Value ofHospital Tax Exemption
NANCY M. KANE andWILLIAM H. WUBBENHORST
Harvard School of Public Health
The number of people lacking health insurancein the United States continues to grow, largely owing to failedefforts to enact universal national coverage and the reduction
in employment-based health insurance benefits. In 1998, 44.3 millionAmericans were without health insurance, and the numbers are stillrising, despite a healthy economy and growing employment (Campbell1999). State and federal policy makers are seeking alternative sourcesto finance or provide health services for uninsured populations. TheChildren’s Health Assistance Program, which Congress authorized in1997, provided $24 billion in new federal funding for a five-year period,ending in 2002. This program has extended coverage to approximatelytwo million previously uninsured children (Thorpe 1997). However, itis not clear whether there will be added coverage or whether the programwill be extended past 2002. Meanwhile, the pressure on states to assureaccess to health services for those without adequate insurance is escalating(American Health Line 1997; 1998; 1999a; 1999b).
The tax exemption accorded nonprofit hospitals constitutes an invest-ment of public resources for charitable purposes, one of which is care forthe millions of uninsured. Considerable controversy exists, both over theextent to which the public is benefiting from tax-exempt hospitals and
The Milbank Quarterly, Vol. 78, No. 2, 2000c© 2000 Milbank Memorial Fund. Published by Blackwell Publishers,350 Main Street, Malden, MA 02148, USA, and 108 Cowley Road,Oxford OX4 1JF, UK.
185
186 N.M. Kane and W.H. Wubbenhorst
the form these benefits are taking.1 (Gaul and Borowski 1993; Pimley1997; Frizzell 1998). The increasingly competitive environment facedby hospitals raises concerns that their commitment to the most vulnera-ble members of the community, as demonstrated by the provision of freecare and essential community services, may be waning (Mann, Melnick,Bamezai, et al. 1995).
Total uncompensated care provided by hospitals (which includes bothfree care and provision for bad-debt expenses) was estimated to exceed$18 billion in charges in 1996 (Fagnani and Tolbert 1999), or 6.1 per-cent of total hospital costs, a ratio that has not changed much in tenyears. This reflects care that is hospital based only; the value of othersources of care (i.e., free-standing community health centers and publicclinics) and of necessary care forgone by the uninsured is not part of thiscalculation.
One traditional means of financing hospital-based uncompensatedcare has been to raise charges to privately insured and self-paying patients;the Prospective Payment Assessment Commission (ProPAC) estimatedthat this source generated roughly $12 billion to cover uncompensatedcare in 1992 (ProPAC 1994). However, growth in this source of financingis limited by the increasingly stringent cost-containment efforts of manyprivate payers (Mann et al. 1995). In addition, hospitals serving relativelymore uninsured patients experience a competitive price disadvantagewhen they try to finance uncompensated care by charging higher pricesto relatively fewer privately insured patients.
Another major source of financing uncompensated care is federaldisproportionate-share spending, which dispensed close to $14 billionin 1995 to hospitals serving high proportions of Medicaid and uninsuredor low-income patients. These payments in aggregate could cover morethan 80 percent of hospital-reported uncompensated care (Thorpe 1997).However, federal disproportionate-share payments that might alleviatethe burden of uninsured people are not distributed evenly among eitherthe states or hospitals: 11 states receive the bulk of these payments,leaving 39 states with disproportionate-share payments that are well be-low the average cost incurred per uninsured person (Thorpe 1997). The
1Hospitalization Utilization Project v. Commonwealth of Pennsylvania, 487 A.2d 1306 (1985);Utah County v. Intermountain Health Care, Inc., 709 P.2d 265, 267 (1985); Medical CenterHospital v. City of Burlington [Vermont], 566 A.2d 1352, 1356 (1989); Rideout HospitalFoundation v. Los Angeles County [California], 10 Cal. Rptr. 2d 141, 8 Cal. App.4th 214(1992).
Alternative Funding Policies for the Uninsured 187
formula for distribution of these funds is based on the level of hospitalinpatient treatment of elderly patients who are eligible for Medicaid andSupplemental Security Income (SSI), and on state priorities (i.e., a quarterof all federal disproportionate-share payments go to mental institutions),rather than on where the uninsured populations are (Thorpe 1997). Un-compensated care and outpatient care are not included in the formula,which further distorts the distribution of funds, to the detriment of hos-pitals serving larger proportions of low-income patients (Fagnani andTalbert 1999).
While the federal government considers additional measures for ex-panding health insurance coverage or subsidizing providers of uncom-pensated care—which range from allowing people under 65 to buyinto Medicare or the federal employees’ health plan to expanding taxbenefits for individuals and small groups purchasing health insurance—some states (e.g., Massachusetts, New York, California, Missouri,Pennsylvania, and Texas) are demanding greater accountability of tax-exempt hospitals. Accountability is taking the form of requesting quanti-fication of hospital benefits to the community (including free care andbad debt, as well as other benefits) and of debating whether the particularmix of benefits reported is an appropriate reflection of the community’smost pressing needs (Noble, Hyams, and Kane, et al. 1998; Greene1995).
Our research is intended to provide useful, credible information andinsights for policy makers, community advocates, and private, nonprofithospital trustees who are exploring the feasibility and desirability of in-creasing hospital-based care to the under- and uninsured, at least to thelevel of the value of their tax exemptions. We build on prior researchby analyzing a multistate sample of hospitals (most previous researchused data from only one state per study), by including a broad set ofquantifiable tax sources (property and sales taxes, as well as incometaxes), and by separating “uncompensated care” into its two policy-relevant components (bad debts and free care). Besides comparing taxbenefits with uncompensated care provided by tax-exempt hospitals, theresearch addresses the geographic distribution of tax benefits in excess ofuncompensated care (“excess tax benefits”), as reflected in the distribu-tion of low-income populations. The study clarifies the extent to whichhospitals with excess tax benefits are located in areas with high propor-tions of low-income populations. Where this is the case, a strong argu-ment can be made for local community advocates and hospital trustees

188 N.M. Kane and W.H. Wubbenhorst
to press for increases in the hospital’s level of charity care and to requestaccountability from the hospital regarding its community benefit pri-orities. Alternatively, hospitals with excess tax benefits that are locatedareas with relatively few low-income people are less likely to be acces-sible to the communities that most need charity care. Some mechanismof redistributing excess tax benefits, such as requiring contributions toa free-care pool or to programs that expand Medicaid eligibility, mightbe considered. However, redistribution policies would have to be imple-mented by states, rather than by local communities; the likelihood ofachieving statewide political consensus for redistribution is lower thanthe chances of local communities’ obtaining more charity care from theirhospitals.
On the one hand, because many hospitals are sensitive to pressuresfrom the local media, community health and advocacy organizations, andtheir own community-based boards, they would be expected to respondconstructively to pressures to do more for the under- and uninsuredpopulations within their service area. Thus, there is a strong politicalargument for leaving community-benefit accountability to local forces.On the other hand, as our findings will indicate, the most burdensomeunder- and uninsured populations can be found in the local service areasof hospitals with little or no excess tax benefits. Thus, a policy designedto redistribute resources across local boundaries, probably at the statelevel, would be a more efficient way to match excess tax benefits to theareas most in need of charity care.
Defining and Quantifying the Valueof Hospital Tax Exemption
Hospital Sample
We relied on the American Hospital Guide (American Hospital Asso-ciation 1994), which lists the distribution of 3,100 acute, nonprofit,private hospitals, to determine the target bed size, region, and teach-ing status (i.e., membership in the Council of Teaching Hospitals, asreported in the AHA Guide) of the 500 hospitals that we selected foranalysis. We were primarily limited by the availability of audited finan-cial statements. We were successful in obtaining reasonable representa-tion for all bed-size categories, teaching categories, and regions, except
Alternative Funding Policies for the Uninsured 189
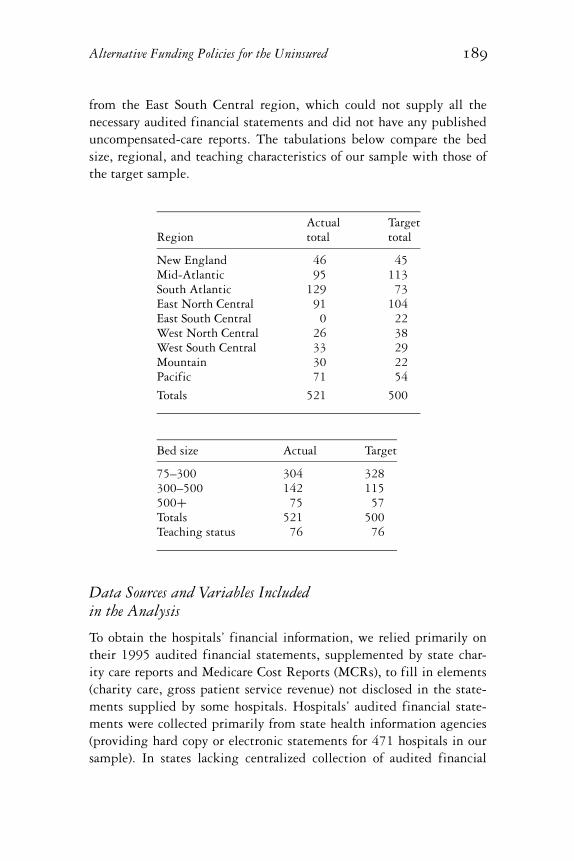
from the East South Central region, which could not supply all thenecessary audited financial statements and did not have any publisheduncompensated-care reports. The tabulations below compare the bedsize, regional, and teaching characteristics of our sample with those ofthe target sample.
Actual TargetRegion total total
New England 46 45Mid-Atlantic 95 113South Atlantic 129 73East North Central 91 104East South Central 0 22West North Central 26 38West South Central 33 29Mountain 30 22Pacific 71 54
Totals 521 500
Bed size Actual Target
75–300 304 328300–500 142 115500+ 75 57Totals 521 500Teaching status 76 76
Data Sources and Variables Includedin the Analysis
To obtain the hospitals’ financial information, we relied primarily ontheir 1995 audited financial statements, supplemented by state char-ity care reports and Medicare Cost Reports (MCRs), to fill in elements(charity care, gross patient service revenue) not disclosed in the state-ments supplied by some hospitals. Hospitals’ audited financial state-ments were collected primarily from state health information agencies(providing hard copy or electronic statements for 471 hospitals in oursample). In states lacking centralized collection of audited financial

190 N.M. Kane and W.H. Wubbenhorst
statements (50 hospitals in our sample), we corresponded directly withhospitals to obtain their statements. From the audited financial state-ments we collected the following variables: bad debts (generally reportedas an expense, valued at charges); free care (generally disclosed in foot-notes, valued at charges); the hospital’s overall markup of charges over costratio (dividing the sum of gross patient service revenue plus other op-erating revenues by operating expenses less bad debt expense); earningsbefore depreciation, amortization, and interest (for estimating the value ofproperty-tax exemptions, as described below); excess revenues over expenses(for estimating the value of income-tax exemptions, described below);and supplies expenses, when reported (for estimating the value of sales taxexemptions, also described below). Bad-debt and free-care charge valueswere divided by the markup ratio to approximate the hospital’s averagecost of uncompensated care.
We based our valuation of uncompensated care on average cost, inaccordance with the literature, which generally uses this measure tovalue uncompensated care for research or community benefit purposes(Catholic Health Association 1989; Boles 1990; Sanders 1993; Clement,Smith, and Wheeler 1994; Mann et al. 1995). State policy makers also useaverage cost in the various guidelines and legislation that define char-ity care. For instance, in Texas, New Hampshire, and Massachusetts,charity care is valued at average cost for community benefit reportingpurposes. The appeal of average cost is that it is calculable with publiclyreported financial data (charges and markup ratios), and it approximatesthe long-run costs that the hospital must cover to provide services topatients. However, average cost is greater than the short-term marginalcost of an additional patient. It can be argued that hospitals’ tax-exemptbenefits should be compared with the marginal, rather than the average,costs of providing uncompensated care because marginal cost representsthe additional financial burden imposed upon the hospital for one ad-ditional patient. A number of state regulatory payment schemes in the1980s used the concept of marginal cost as a basis of payment for vol-ume increases beyond a base year (e.g., New York, Massachusetts, andMaryland). However, marginal cost is not as straightforward to calculateas average historical cost because its definition varies with the time frameassumed (more costs are marginal as the time frame lengthens), with thespecific services provided (e.g., outpatient surgery, routine inpatient care,ancillary services), and with the cost structure of each institution (hospi-tals employing mostly per diem nurses incur higher marginal costs than
Alternative Funding Policies for the Uninsured 191
those employing mostly salaried nurses; hospitals at full capacity mayhave higher marginal costs than hospitals with excess capacity). Thus,use of marginal cost requires making difficult-to-substantiate assump-tions about the proportion of average cost that is marginal. In practice,a wide range of “reasonable” assumptions has been used for a variety ofpurposes. A hospital consulting-company executive estimates, based onextensive experience with hospital cost-accounting systems and behavior,that roughly 30 percent of average cost is variable with volume, althoughthe percentage varies with the particular accounting systems and behav-ior of each hospital department (R. Siegrist, HealthShare Technologies,1999: personal communication with N.M. Kane). State payment sys-tems in use during the 1980s generally allowed “marginal cost” volumeadjustments of anywhere from 20 to 80 percent of average cost, depend-ing on the unit of payment and the incentives intended. This wide rangeof possible assumptions led us to conduct our analyses on the basis ofaverage cost. However, we will discuss the marginal-cost implications ofour key findings as well.
According to the accounting principles guiding the preparation ofhospital financial statements, charity or free care is care provided tothose who qualify based on financial eligibility standards established byhospitals, which are guided in some states by regulations. Charges arenever recognized and collection is not attempted (American Instituteof Certified Public Accountants 1994). Bad debts represent care forwhich the patient was billed, but the hospital was unable to collect. Theinclusion of bad debt as a measure of charitable benefit is controversial;some of what is classified as bad debt might have been categorized asfree care if the hospital had been able to capture the relevant informationabout the patient’s financial situation. Some studies suggest that as muchas 50 percent of bad debt may actually be charity care when the patients’income and insurance status are taken into account (Epstein, Lukas, andWeissman 1992; Sanders 1995). However, others indicate that many baddebtors are not indigent, and that hospital factors associated with a highlevel of bad debts are different from the factors associated with a highlevel of free care (Buczko 1994). We calculate the benefits side of ouranalysis, both without bad debt and with varying percentages (25, 50,75, 100) of bad debt added to free care. Our supplemental analyses ofthe characteristics of hospital services and location include 50 percent ofbad debt as a way to simplify the presentation of results, based on whatthe literature suggests is a reasonable figure.

192 N.M. Kane and W.H. Wubbenhorst
It is important also to acknowledge that the definition of eligibil-ity for free care across our sample is not uniform. For instance, inMassachusetts, free or “charity” care guidelines issued by the state defineeligibility for a 100 percent discount if the patient’s family income isless than 200 percent of federal poverty levels, and a sliding-scale dis-count applies for families with incomes between 200 percent and 400percent of federal poverty levels. In Washington, patients are eligiblefor 100 percent discounts if their family income is 100 percent of fed-eral poverty levels; partial discounts are allowed for patients with fam-ily incomes between 100 percent and 200 percent. In Texas, the stateguidelines for determining charity-care eligibility require the hospitalto index its criteria to federal poverty guidelines and stipulate that theincome level for eligibility must be neither lower than the county re-quirements nor higher than 200 percent of federal poverty guidelines.There are few clear state standards; in most states, the eligibility defini-tion is up to the hospital board’s discretion (Access Project 1999). Thus,the distinction between free care and bad debt, as recognized in auditedfinancial statements, does not uniformly distinguish patients by incomelevel.
We used other data sources, including state income-tax and sales-taxrates, which we obtained from the state tax guide published by the Com-merce Clearing House. The 1994 AHA Hospital Guide was our sourcefor the bed-size, region, and teaching-status characteristics of our sam-ple hospitals. We also used the Guide to determine the availability ofessential community services that incur substantial operating deficits:burn units, neonatal intensive care units (NICUs), and level III traumaunits.
To obtain information on property taxes, initially we collected 1995hospital property-assessment values and tax rates directly from the countyand local assessor’s offices for each hospital in our sample. After collect-ing and reviewing the data for 296 hospitals, we concluded, with theadvice of consultant property-tax experts, that the information grosslyunderestimated the value of property-tax exemptions. Assessors do notregularly reassess tax-exempt property, and when they do, they pay littleattention to the accuracy of the values. In addition, a given property maybe subject to several different tax rates (county, city, special district),and it is difficult to get a rate that encompasses all property-tax levies(Gaskell and Kitchen 1997). Instead, we used an income approach toestimate the market value of each hospital (Pecesky 1991).
Alternative Funding Policies for the Uninsured 193
The specific model for estimating hospital value is as follows:
EBITDA/Capitalization rate
where:
EBITDA = 1995 earnings before interest, taxes , depreciation, andamortization.
Capitalization rate = .128, a rate chosen by our property-tax consultantsas a reasonable rate applicable to commercial pro-perties in general.
To this model we applied statewide, aggregate, effective property-taxrates (the ratio of aggregate property taxes levied to the full market valueof taxable commercial property in each state), which were published bythe Advisory Commission on Intergovernmental Relations (ACIR). Thisratio covered a range from $1.03 per $100 of value (Nevada) to $2.92(New Hampshire), with a national average of $1.53. It is possible thatthese tax rates, which were based on state information from 1991, mayhave changed somewhat between 1991 and 1995; unfortunately, theACIR stopped publishing state aggregate tax rates after 1993. Anotherdrawback is that the state rates are aggregated and thus do not reflectwithin-state variations.
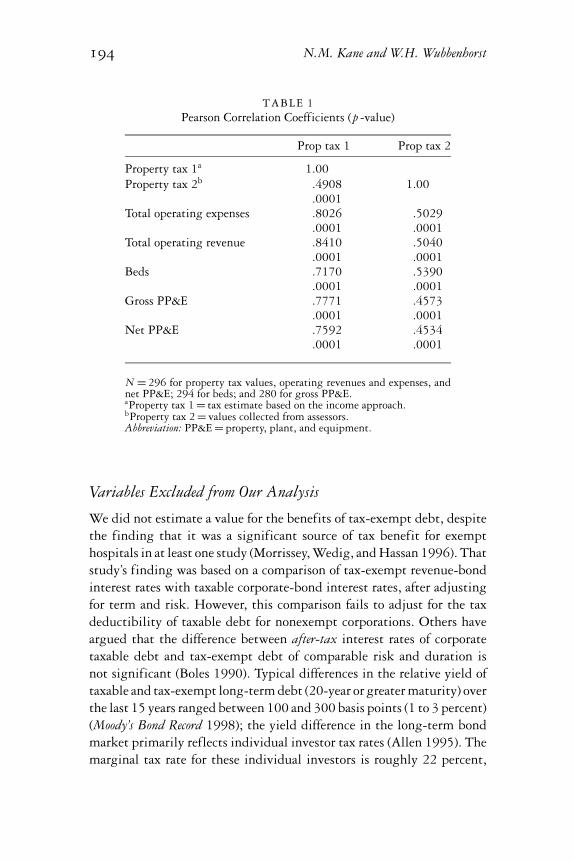
The values derived from this estimating technique closely approxi-mated (1.3 percent higher) the tax assessments we received from hospi-tals in Connecticut, a state whose hospital property-tax assessments arerelatively accurate because they are used by local authorities to nego-tiate local payments in lieu of taxes made by hospitals. Table 1 showsthat the Pearson correlation coefficients between the two alternativeproperty-tax values are significant and moderately correlated (coefficientof .4908). Other financial measures that are considered highly related toproperty-tax values (Boles 1990; Gaskell and Kitchen 1997), includingtotal operating expenses, total operating revenues, beds, and gross andnet property, plant, and equipment (PP&E), were all much more highlycorrelated to the property-tax estimate based on the income approach(property tax 1 in table 1) than to the property-tax values provided bylocal assessors (property tax 2 in table 1). Thus, we used the estimatedtax values (property tax 1) for both the 296 hospitals with assessed valuesand the 225 hospitals for which no local property-tax assessment datawere available.
194 N.M. Kane and W.H. Wubbenhorst
TABLE 1Pearson Correlation Coefficients (p -value)
Prop tax 1 Prop tax 2
Property tax 1a 1.00Property tax 2b .4908 1.00
.0001Total operating expenses .8026 .5029
.0001 .0001Total operating revenue .8410 .5040
.0001 .0001Beds .7170 .5390
.0001 .0001Gross PP&E .7771 .4573
.0001 .0001Net PP&E .7592 .4534
.0001 .0001
N = 296 for property tax values, operating revenues and expenses, andnet PP&E; 294 for beds; and 280 for gross PP&E.aProperty tax 1 = tax estimate based on the income approach.bProperty tax 2 = values collected from assessors.Abbreviation: PP&E = property, plant, and equipment.
Variables Excluded from Our Analysis
We did not estimate a value for the benefits of tax-exempt debt, despitethe finding that it was a significant source of tax benefit for exempthospitals in at least one study (Morrissey, Wedig, and Hassan 1996). Thatstudy’s finding was based on a comparison of tax-exempt revenue-bondinterest rates with taxable corporate-bond interest rates, after adjustingfor term and risk. However, this comparison fails to adjust for the taxdeductibility of taxable debt for nonexempt corporations. Others haveargued that the difference between after-tax interest rates of corporatetaxable debt and tax-exempt debt of comparable risk and duration isnot significant (Boles 1990). Typical differences in the relative yield oftaxable and tax-exempt long-term debt (20-year or greater maturity) overthe last 15 years ranged between 100 and 300 basis points (1 to 3 percent)(Moody’s Bond Record 1998); the yield difference in the long-term bondmarket primarily reflects individual investor tax rates (Allen 1995). Themarginal tax rate for these individual investors is roughly 22 percent,
Alternative Funding Policies for the Uninsured 195
whereas the marginal tax rate for corporations is close to 46 percent(Allen 1995). Thus an Aa-rated 20-year bond might have an interestrate for a tax-exempt borrower of 6.2 percent, the average yield fromthe Revenue Bond Index for 1995 (Bond Buyer Yearbook 1998, 33); anonexempt borrower of similar risk class might pay 250 basis pointshigher interest, or an 8.7 percent interest rate, on taxable debt. However,at a 46 percent marginal tax rate, the taxable borrower’s after-tax rate ofinterest is only 4.7 percent (.087 interest rate ∗ .54), which is below thetax-exempt interest rate.
Arguments can be made on broader (and difficult to quantify) groundsthat a nonprofit would have to make major financial and organizationalchanges in order to attract private-equity capital, or to become tax-able, and thus take advantage of the corporate tax deductibility of inter-est expenses (P. Dennett, American Private Pension and Welfare Plans,1997: personal note to N.M. Kane). The availability of tax-exempt debtshelters the nonprofit from having to make that investment. Unfortu-nately, it is not possible to quantify the size of such an investment forindividual tax-exempt hospitals. Our omission of the value of havingaccess to tax-exempt debt thus understates the tax-benefit side of ouranalysis.
Also excluded is the value of charitable donations to the hospital,which are tax deductible to the donor. Others have dismissed donationsas being an insignificant amount: 1 percent of total hospital revenues(Boles 1990). Unfortunately, we do not really know how insignificantdonations might be because of the difficulty of capturing total dona-tions benefiting the hospital. Many donations to hospitals are givento, or held by, parent or foundation affiliates of the hospital entity;thus, an analysis based on hospital-entity revenues alone do not in-clude the bulk of hospital donations. We excluded donations as a tax-exempt benefit, which again understates the tax-benefit side of ouranalysis.
Our analysis did not enable us to quantify reasonably from publiclyavailable data a number of elements that have been included as charitablecommunity benefits in some studies: the unreimbursed costs of teach-ing and research, money-losing services, and other community services,such as health education and screening programs, are some examples.However, at least some of these services do not target low-income orunderserved communities; many are implemented primarily as compet-itive tactics to gain market share, obtain managed-care contracts, or
196 N.M. Kane and W.H. Wubbenhorst
minimize losses incurred in the acute sector (e.g., subacute or homecare). Some commonly included elements, like the provision of servicesto Medicaid patients, are not unique to tax-exempt hospitals (Pattisonand Katz 1983; Renn, Schramm, Watt, et al. 1985; Shortell, Morrison,Hughes, et al. 1986; Arrington and Haddock 1990). For example, wetested for differences in proportions of Medicaid recipients to total pa-tients in 1996 in four states where a large number of tax-exempt andinvestor-owned hospitals were located. We found no significant differ-ence in Medicaid participation between private tax-exempt and investor-owned hospitals, a finding that is reflected in other studies we havecited. The Catholic Health Association distinguishes basic services andstandard promotional activities, which are performed by all health careorganizations, from “true” community benefits, which are expected oftax-exempt organizations. The latter category must demonstrate the fol-lowing criteria:
• They are financed through philanthropic contributions, volunteerefforts, or endowment.
• They respond to a unique or particular health problem in the com-munity.
• They generate a low or negative margin.• They respond to the needs of special populations, such as minori-
ties, the frail elderly, poor persons with disabilities, the chronicallymentally ill, and persons with AIDS.
• The service or program would likely be discontinued if the decisionwere made on a purely financial basis. (Trocchio 1996)
Unfortunately, many hospitals do not report community benefits accord-ing to a standardized and meaningful framework, such as that providedby the Catholic Health Association. We did not have any publicly avail-able, uniformly defined data on these types of community benefits, sothey were not quantified in our analysis.
We did identify both teaching hospitals and hospitals that provide thethree types of specialized care of frequently mentioned in the literatureas essential, but generally unprofitable, community services: burn units,level III trauma units, and NICUs. Although our analysis recognizeshospitals providing these services, we cannot quantify the losses theyincur as a result of doing so. Further research is needed to address thefinancial implications of providing these services.
Alternative Funding Policies for the Uninsured 197
Another potential benefit we explored was an amount that could beattributed to pricing differences between tax-exempt and investor-ownedhospitals. In the 1980s, investor-owned hospitals were consistently foundto charge higher prices (gross charges) than did tax-exempt hospitals(Eskoz and Peddecord. 1985; Renn et al. 1985; Pattison and Katz 1983;Watt, Derzon, Renn, et al. 1986; Clement, Smith, and Wheeler 1994).However, Clement also noted that, as price competition increased inCalifornia during the late 1980s, the differences in prices actually paidby third parties to tax-exempt and investor-owned hospitals diminishedsignificantly; by 1986–87, the difference was barely perceptible.
We explored the 1996 net price differential (net revenues per case-mix-adjusted discharges, adjusted for outpatient activity) between pri-vate tax-exempt and investor-owned hospitals in four states (California,Florida, Virginia, and North Carolina) with a good sample of investor-owned hospitals as well as information on the case mix of all payers.The price differential in that analysis was not significant between thetwo ownership categories (see Appendix). Thus, we did not include afavorable price differential of nonprofits as a community benefit.
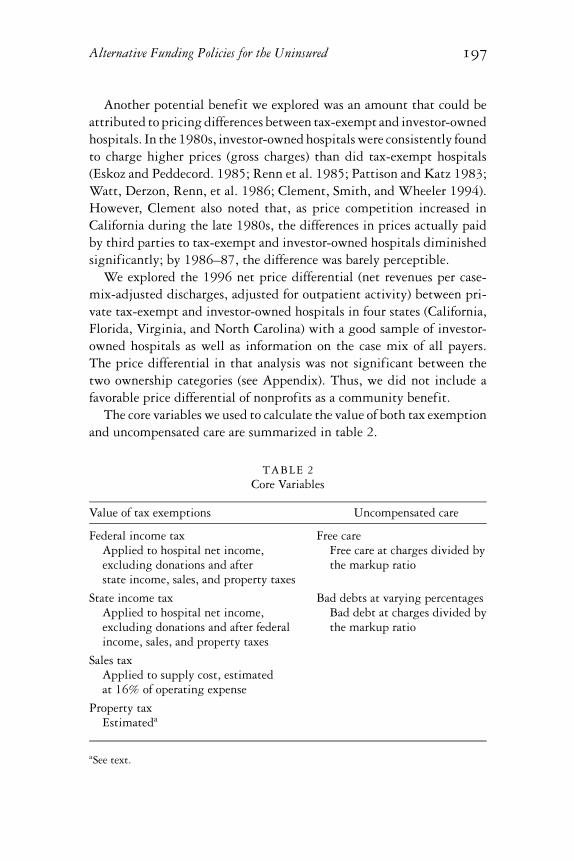
The core variables we used to calculate the value of both tax exemptionand uncompensated care are summarized in table 2.
TABLE 2Core Variables
Value of tax exemptions Uncompensated care
Federal income tax Free careApplied to hospital net income, Free care at charges divided byexcluding donations and after the markup ratiostate income, sales, and property taxes
State income tax Bad debts at varying percentagesApplied to hospital net income, Bad debt at charges divided byexcluding donations and after federal the markup ratioincome, sales, and property taxes
Sales taxApplied to supply cost, estimatedat 16% of operating expense
Property taxEstimateda
aSee text.
198 N.M. Kane and W.H. Wubbenhorst
Key Findings
Aggregate Relation of the Value of TaxExemption to Uncompensated Care Provided
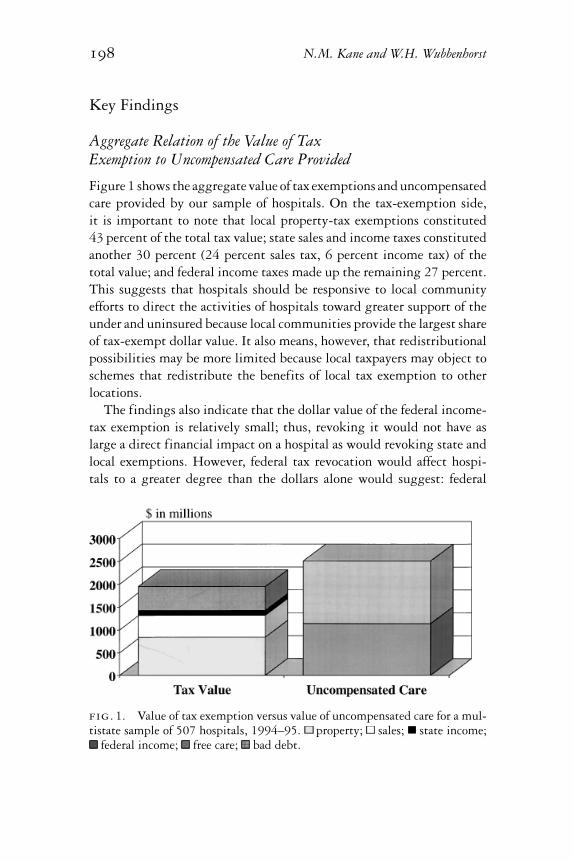
Figure 1 shows the aggregate value of tax exemptions and uncompensatedcare provided by our sample of hospitals. On the tax-exemption side,it is important to note that local property-tax exemptions constituted43 percent of the total tax value; state sales and income taxes constitutedanother 30 percent (24 percent sales tax, 6 percent income tax) of thetotal value; and federal income taxes made up the remaining 27 percent.This suggests that hospitals should be responsive to local communityefforts to direct the activities of hospitals toward greater support of theunder and uninsured because local communities provide the largest shareof tax-exempt dollar value. It also means, however, that redistributionalpossibilities may be more limited because local taxpayers may object toschemes that redistribute the benefits of local tax exemption to otherlocations.
The findings also indicate that the dollar value of the federal income-tax exemption is relatively small; thus, revoking it would not have aslarge a direct financial impact on a hospital as would revoking state andlocal exemptions. However, federal tax revocation would affect hospi-tals to a greater degree than the dollars alone would suggest: federal
fig. 1. Value of tax exemption versus value of uncompensated care for a mul-tistate sample of 507 hospitals, 1994–95. property; sales; state income;
federal income; free care; bad debt.
Alternative Funding Policies for the Uninsured 199
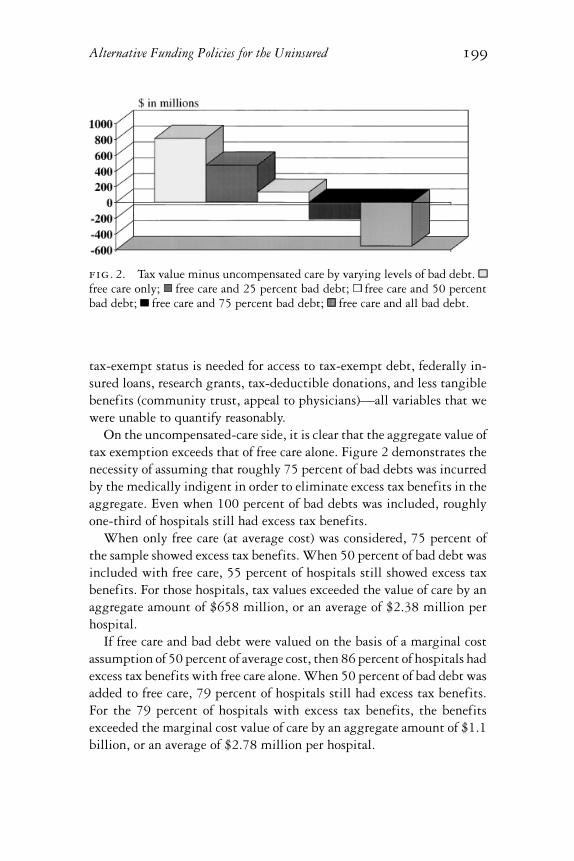
fig. 2. Tax value minus uncompensated care by varying levels of bad debt.free care only; free care and 25 percent bad debt; free care and 50 percentbad debt; free care and 75 percent bad debt; free care and all bad debt.
tax-exempt status is needed for access to tax-exempt debt, federally in-sured loans, research grants, tax-deductible donations, and less tangiblebenefits (community trust, appeal to physicians)—all variables that wewere unable to quantify reasonably.
On the uncompensated-care side, it is clear that the aggregate value oftax exemption exceeds that of free care alone. Figure 2 demonstrates thenecessity of assuming that roughly 75 percent of bad debts was incurredby the medically indigent in order to eliminate excess tax benefits in theaggregate. Even when 100 percent of bad debts was included, roughlyone-third of hospitals still had excess tax benefits.
When only free care (at average cost) was considered, 75 percent ofthe sample showed excess tax benefits. When 50 percent of bad debt wasincluded with free care, 55 percent of hospitals still showed excess taxbenefits. For those hospitals, tax values exceeded the value of care by anaggregate amount of $658 million, or an average of $2.38 million perhospital.
If free care and bad debt were valued on the basis of a marginal costassumption of 50 percent of average cost, then 86 percent of hospitals hadexcess tax benefits with free care alone. When 50 percent of bad debt wasadded to free care, 79 percent of hospitals still had excess tax benefits.For the 79 percent of hospitals with excess tax benefits, the benefitsexceeded the marginal cost value of care by an aggregate amount of $1.1billion, or an average of $2.78 million per hospital.
200 N.M. Kane and W.H. Wubbenhorst
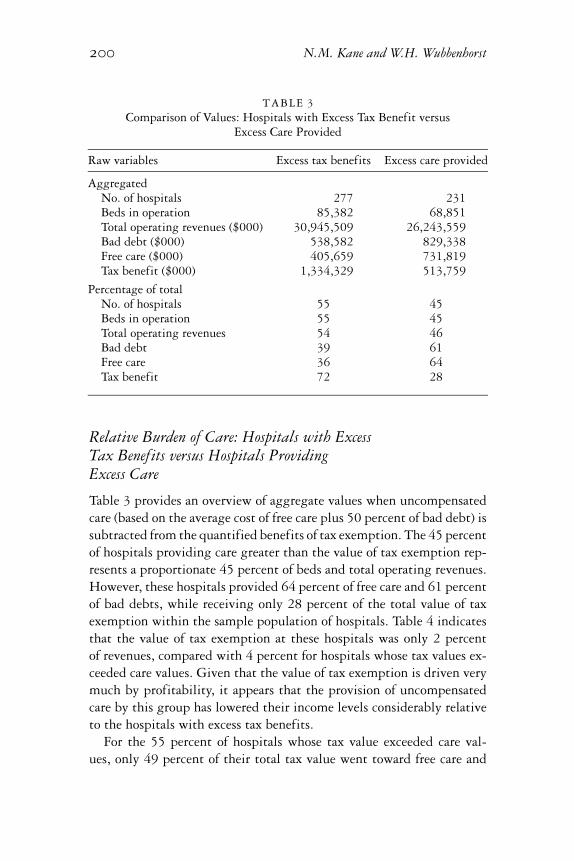
TABLE 3Comparison of Values: Hospitals with Excess Tax Benefit versus
Excess Care Provided
Raw variables Excess tax benefits Excess care provided
AggregatedNo. of hospitals 277 231Beds in operation 85,382 68,851Total operating revenues ($000) 30,945,509 26,243,559Bad debt ($000) 538,582 829,338Free care ($000) 405,659 731,819Tax benefit ($000) 1,334,329 513,759
Percentage of totalNo. of hospitals 55 45Beds in operation 55 45Total operating revenues 54 46Bad debt 39 61Free care 36 64Tax benefit 72 28
Relative Burden of Care: Hospitals with ExcessTax Benefits versus Hospitals ProvidingExcess Care
Table 3 provides an overview of aggregate values when uncompensatedcare (based on the average cost of free care plus 50 percent of bad debt) issubtracted from the quantified benefits of tax exemption. The 45 percentof hospitals providing care greater than the value of tax exemption rep-resents a proportionate 45 percent of beds and total operating revenues.However, these hospitals provided 64 percent of free care and 61 percentof bad debts, while receiving only 28 percent of the total value of taxexemption within the sample population of hospitals. Table 4 indicatesthat the value of tax exemption at these hospitals was only 2 percentof revenues, compared with 4 percent for hospitals whose tax values ex-ceeded care values. Given that the value of tax exemption is driven verymuch by profitability, it appears that the provision of uncompensatedcare by this group has lowered their income levels considerably relativeto the hospitals with excess tax benefits.
For the 55 percent of hospitals whose tax value exceeded care val-ues, only 49 percent of their total tax value went toward free care and
Alternative Funding Policies for the Uninsured 201
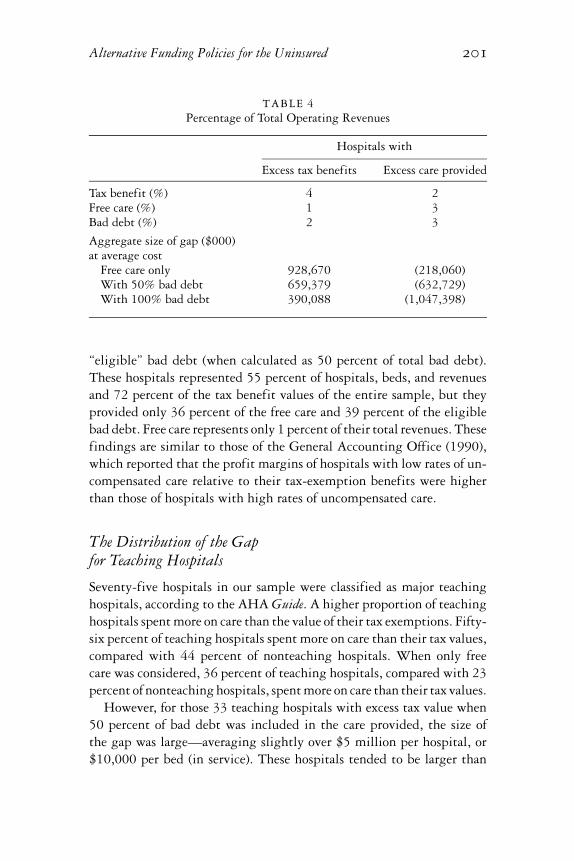
TABLE 4Percentage of Total Operating Revenues
Hospitals with
Excess tax benefits Excess care provided
Tax benefit (%) 4 2Free care (%) 1 3Bad debt (%) 2 3
Aggregate size of gap ($000)at average cost
Free care only 928,670 (218,060)With 50% bad debt 659,379 (632,729)With 100% bad debt 390,088 (1,047,398)
“eligible” bad debt (when calculated as 50 percent of total bad debt).These hospitals represented 55 percent of hospitals, beds, and revenuesand 72 percent of the tax benefit values of the entire sample, but theyprovided only 36 percent of the free care and 39 percent of the eligiblebad debt. Free care represents only 1 percent of their total revenues. Thesefindings are similar to those of the General Accounting Office (1990),which reported that the profit margins of hospitals with low rates of un-compensated care relative to their tax-exemption benefits were higherthan those of hospitals with high rates of uncompensated care.
The Distribution of the Gapfor Teaching Hospitals
Seventy-five hospitals in our sample were classified as major teachinghospitals, according to the AHA Guide. A higher proportion of teachinghospitals spent more on care than the value of their tax exemptions. Fifty-six percent of teaching hospitals spent more on care than their tax values,compared with 44 percent of nonteaching hospitals. When only freecare was considered, 36 percent of teaching hospitals, compared with 23percent of nonteaching hospitals, spent more on care than their tax values.
However, for those 33 teaching hospitals with excess tax value when50 percent of bad debt was included in the care provided, the size ofthe gap was large—averaging slightly over $5 million per hospital, or$10,000 per bed (in service). These hospitals tended to be larger than

202 N.M. Kane and W.H. Wubbenhorst
the sample generally (6 percent of the hospitals, with 11 percent of thebeds and 13 percent of the revenues), and to have higher incomes (taxbenefit came to 5 percent of revenues, compared with the sample averageof 3 percent). Although it seems possible that the unreimbursed costs ofteaching programs might absorb some of that positive gap, it is unlikelyto absorb all of it. Thus, a substantial proportion of teaching hospitalsmay have room for more charitable care within the value of their taxexemptions, if they could be so persuaded.
The Distribution of the Gap between Tax-ExemptValue and Uncompensated Care
A key issue that we explored was the distribution of tax-exempt valuesthat exceeded the amount of uncompensated care hospitals provided (“ex-cess tax benefits”) in relation to residence of poor populations. We assumethat poor populations would be associated with more under- and unin-sured people. Figure 3 provides an overview of the relation between hos-pital location and excess tax benefits. Hospital location is categorized bythe percentage of people living below federal poverty levels in the county.Hospitals located in counties with low poverty percentages showed ag-gregate excess tax benefits when 50 percent bad debt was included.
fig. 3. Tax value minus uncompensated care by poverty level of county. freecare only; free care and 50 percent bad debt; free care and all bad debt.
Alternative Funding Policies for the Uninsured 203
Hospitals located in counties with the second lowest percentages of poorpeople had excess tax benefits, even when 100 percent of bad debt wasincluded. In contrast, hospitals in counties with the highest poverty-level percentages provided care in excess of tax values, even when no baddebt was included. Clearly, there is a strong relation between a hospital’sexcess tax-benefit levels and the level of poverty in its local area (whichis not necessarily its primary service area). This complicates the logisticsof matching excess tax value with uncompensated care to under- anduninsured populations.
On the other hand, analysis of disaggregated hospitals indicates thatopportunities to encourage hospitals to do more exist even in the coun-ties with the highest poverty levels. At a 50 percent bad-debt level,45 percent of hospitals located in the poorest counties still had excesstax benefits, and 27 percent remained in “excess,” even at 100 percentbad-debt levels. Fifty-five percent of hospitals in counties with the sec-ond highest poverty levels had excess tax benefits at 50 percent debt,and 36 percent remained in excess, even when 100 percent of bad debtwas included.
Nonquantifiable Benefits: Characteristicsof Hospital Service Mix
Hospitals with excess tax values might provide financial benefits in theform of burn units, trauma centers, and NICU units. As in the case ofteaching, we cannot quantify the financial impact of these services on oursample of hospitals. However, we did find that a substantial proportionof hospitals with excess tax benefit provided at least one such service.Thirty-four percent offered one service, 19 percent offered two services,and 12 percent offered all three services to their communities; 36 percentdid not offer any of the three services. The most common was an NICU,followed by trauma, and then burn units. The hospitals with excess taxbenefits were significantly more likely to have these units than werehospitals with excess care: 46 percent of hospitals with excess care didnot offer any of the three services. This analysis suggests that it wouldbe useful to quantify the losses sustained by hospitals that provide essen-tial and unprofitable community services when determining whether ahospital has met its charitable obligations to the community. It is alsoa reminder that the full value of excess tax exemption is unlikely to be
204 N.M. Kane and W.H. Wubbenhorst
captured in the form of free care to uninsured populations because thereare other charitable benefits that are valued by communities.
Influence of the Availability of Public Hospitals
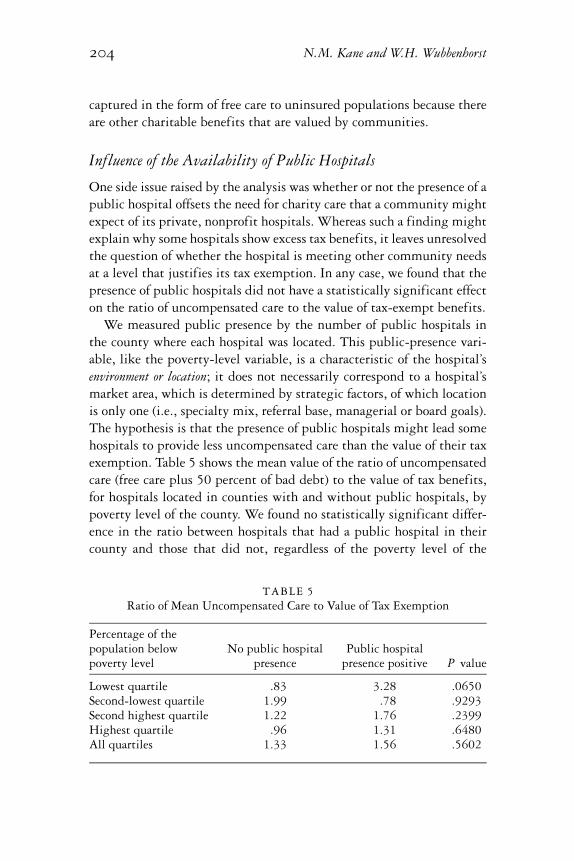
One side issue raised by the analysis was whether or not the presence of apublic hospital offsets the need for charity care that a community mightexpect of its private, nonprofit hospitals. Whereas such a finding mightexplain why some hospitals show excess tax benefits, it leaves unresolvedthe question of whether the hospital is meeting other community needsat a level that justifies its tax exemption. In any case, we found that thepresence of public hospitals did not have a statistically significant effecton the ratio of uncompensated care to the value of tax-exempt benefits.
We measured public presence by the number of public hospitals inthe county where each hospital was located. This public-presence vari-able, like the poverty-level variable, is a characteristic of the hospital’senvironment or location; it does not necessarily correspond to a hospital’smarket area, which is determined by strategic factors, of which locationis only one (i.e., specialty mix, referral base, managerial or board goals).The hypothesis is that the presence of public hospitals might lead somehospitals to provide less uncompensated care than the value of their taxexemption. Table 5 shows the mean value of the ratio of uncompensatedcare (free care plus 50 percent of bad debt) to the value of tax benefits,for hospitals located in counties with and without public hospitals, bypoverty level of the county. We found no statistically significant differ-ence in the ratio between hospitals that had a public hospital in theircounty and those that did not, regardless of the poverty level of the
TABLE 5Ratio of Mean Uncompensated Care to Value of Tax Exemption
Percentage of thepopulation below No public hospital Public hospitalpoverty level presence presence positive P value
Lowest quartile .83 3.28 .0650Second-lowest quartile 1.99 .78 .9293Second highest quartile 1.22 1.76 .2399Highest quartile .96 1.31 .6480All quartiles 1.33 1.56 .5602
Alternative Funding Policies for the Uninsured 205
county; the only weakly significant result (p value = .065) contradictsthe hypothesis that some hospitals provide less uncompensated care be-cause of the presence of a public hospital. In counties that had the lowestpercentage of households with incomes below federal poverty levels, theratio of uncompensated care to tax-exempt benefits was higher in countieswith public hospitals.
Policy Discussion and Conclusions
The debate over the value of tax exemption and whether it should moredirectly benefit those lacking health insurance seems likely to continuein the near future, as competitive forces squeeze hospitals and privateinsurance coverage continues to erode. This analysis indicates that lessthan half of our nonprofit community hospitals provide care to the med-ically indigent or uninsured at levels in excess of tax benefits, even when50 percent of bad debt is included in the care value. If marginal ratherthan average cost were used to value free care and bad debt, even morehospitals would have excess tax benefits.
Our analysis also shows that the distribution of tax benefits is notpositively related to the burden of uninsured care. Some hospitals, par-ticularly those in the poorest communities, provide considerably moreuncompensated care than the value of their tax exemptions; others,particularly those in wealthier communities, provide considerably less.However, even hospitals in poor communities do not all share the bur-den equally. Those with the greatest tax benefits (generally, the mostprofitable) offer the least uncompensated care commensurate with thevalue of tax exemption. Obviously, the two are related: the more uncom-pensated care an institution provides, the lower its income, and hence thelower its tax values. Although “no margin, no mission” is a frequentlyrecited mantra of the hospital industry, having a larger margin is no guar-antee that the charitable mission will be better served. Charity provisionmust constantly compete for resources that might otherwise be channeledinto competitive goals, such as investing in the latest technology, acquir-ing physician practices and absorbing the subsequent operating losses,paying “competitive” salaries to hospital executives, or contracting withmanaged-care plans at rates below cost in order to capture market share.
If one accepts the concept that the value of tax exemption should bedirected first toward care for the under- and uninsured, what leverage
206 N.M. Kane and W.H. Wubbenhorst
can be most usefully applied to persuade hospitals to provide the amountof free care that is commensurate with the value of their tax exemptions?The federal government could take intermediate steps (short of tax re-vocation) to stimulate greater hospital provision of uncompensated care.One option is to revise Medicare participation requirements to includefederally established standards of uncompensated care to financially el-igible populations. These standards should reasonably approximate thevalue of tax benefits, adjusting for teaching, essential community ser-vices, and other acceptable and quantifiable community benefits, net ofdonations. A penalty option that would fall short of revoking Medicareparticipation might be the imposition of federal income taxes to offsetshortfalls between tax value and care provided. Resources thus generatedcould be earmarked for expansions in Medicaid or Medicare eligibility.
However, the costs of monitoring and enforcing such a policy at anational level would be significant. There would have to be some way ofobtaining reasonably current and accurate local property-tax assessments.Patients’ eligibility for “charity” would have to be standardized and morethoroughly documented. More challenging still would be the need todevelop a standard definition of a nonprofit hospital’s “taxable income,”raising the specter of nonprofit hospitals’ having to maintain the kindof convoluted and expensive tax-accounting systems that are kept bythe for-profits. The clash of Medicare reimbursement ambiguities andIRS accounting requirements, already a major source of legal actionamong for-profit hospitals, would no doubt become a major factor in thenonprofit hospital sector as well.
There is no federal reporting mechanism in place for collecting suchinformation. Although the MCR is useful for determining Medicarecosts and payments, it is woefully inadequate for measuring the finan-cial performance of hospital entities (American Hospital Associationand Arthur Andersen 1998). Hospitals’ financial performance can bemeasured according to generally accepted accounting principles, but ac-counting practices for measuring and reporting their charitable activitiesand ascertaining the value of tax exemptions are not well established. Theexperience with MCRs suggests that federal policy makers may not beup to the task of monitoring hospitals’ charitable benefits and activitiesat a relevant level of detail.
A weaker, but perhaps more feasible, federal policy would encour-age hospitals and their boards to become more accountable to their localcommunities through grants, demonstration programs, and best-practice

Alternative Funding Policies for the Uninsured 207
awards. States and localities could be rewarded financially for becom-ing more involved in determining how hospitals should earn their taxexemption. Providing federal funds for states to develop and imple-ment effective charitable accountability programs, with active federaloversight of their content, would encourage such initiatives and evenprovide a needed boost to existing programs.
Local communities, which provide the largest quantifiable tax ex-emptions and are in the best position to identify and set priorities fortheir own health-care access problems, should be encouraged to holdhospitals accountable for their charitable activities. Hospital trustees aresupposed to represent the community; they have a duty to respond toa well-presented community argument for greater accountability withrespect to returns on tax-exempt values. However, many, if not most,communities are not organized to exert pressure effectively on their localhospitals in order to obtain better health-care access for the most vulner-able; nor do community groups generally have the necessary informationfor presenting the best argument to their health care institutions.
Local municipalities could act in a number of ways to persuade hos-pitals to be more accountable for the charitable services they offer theuninsured. The simplest would be to maintain updated property-tax-assessment values for hospitals and related nonprofit entities and assurepublic access to those records. A second measure would be for the mu-nicipality to require all nonprofit hospitals to file annually, on a timelybasis, both their audited financial statements and any community benefitstatements they might have. These documents would be offered to thepublic, along with property-tax information. Municipalities could initi-ate or participate in community-needs assessments, particularly of theirunder- and uninsured populations, and they could also be prepared toestablish priorities, with public input, for the allocation of charitabledollars. Finally, at the most activist level, municipalities could challengehospitals with excess tax benefits to explain their charitable prioritiespublicly and then negotiate “payments in lieu of taxes,” which would bedesignated for critical health services for the uninsured. To date, mostmunicipalities that challenge hospital tax exemptions are simply seekingnew revenue sources for general municipal functions; removing resourcesfrom the health system in this way does not result in good public healthpolicy, although it may make good fiscal policy.
States are in a good position to encourage local communities to takeaction: they can mandate uniform reporting of hospital free care and other
208 N.M. Kane and W.H. Wubbenhorst
community benefits and create or estimate the tax-value data that are sodifficult to generate on a national level. States also can combine the valueof state and local exemptions by requesting accountability commensuratewith tax values; the combination represents a meaningful proportion ofhospital tax benefits. Some states have begun to raise general awarenessand to demand uniform reporting of free care and bad debts, as well asother community benefits; however, they are far from setting standardsor enforcing sanctions in the event that hospitals fail to achieve a standard(Noble, Hyams, and Kane 1998). Policy makers should work to improvethese early state initiatives, rather than declaring failure based on progressto date. Changing the environment and raising public expectations ofhospitals’ accountability for their charitable performance require timeand sustained effort.
Another policy that states might consider is the notion of free-carepools, like the ones already in place in Massachusetts, New York, Florida,and New Jersey. Our research shows that many hospitals with excess taxvalues are not located in the areas that most need free care; a redistributivemechanism can best be developed at the state level. We noted that, withinour sample of hospitals, those in states with free-care pools had ratios ofuncompensated care to tax-exempt values that were two to three timeshigher than hospitals in states with no redistributive pools. Althoughwe cannot claim causality, the strong possibility exists that hospitals aremore open to providing charity if there is some way of “leveling theplaying field” in terms of income redistribution.
Finally, our research findings do not support the notion that coercingmore charity care out of hospitals will solve the nation’s problem of financ-ing care for the uninsured. Although there is plenty of opportunity forlocal communities to pressure hospitals to offer more uncompensated carefor medically indigent patients, the level of resources provided throughhospital tax exemptions falls short of the mark for funding universal cov-erage. Even if all 3,000-plus nonprofit community hospitals in the coun-try were required to provide care equal to the value of their tax exemp-tions, extrapolating our findings to all of these hospitals brings the totalamount of new care to less than $100 per uninsured person per year. Thiswould have paid for less than one month of a health insurance premiumin 1997 in a major metropolitan area (St. Louis Area Business HealthCoalition 1999). Even if marginal cost were used to value care provided,such that the dollar amount doubled, converting the excess tax valueinto care for the uninsured would not purchase much health insurance.

Alternative Funding Policies for the Uninsured 209
Both the federal government and the states have begun to stem thesteady erosion in private health insurance that has resulted from fun-damental changes in the practices of employers who have traditionallyprovided private health insurance. These efforts must continue. The curefor the problem of funding the uninsured must be found outside the re-sources of our nonprofit institutions.
References
Access Project. 1999. Factsheet: The Free Care Safety Net. http://www.accessproject.org.
Allen, D.S. 1995. Industrial Revenue Bonds: Tests of the Bank ArbitrageHypothesis, the Miller Hypothesis, and Segmentation of the Tax-Exempt Bond Market. Journal of Applied Business Research 11(2):110–21.
American Health Line. 1997. Kiddie Care: States Consider Expan-sion Options. (August 4 daily briefing.) National Journal Group:www.cloakroom.com.
American Health Line. 1998. Access/Quality/Cost—Texas: Indigent CareSystem in Trouble. (November 2 daily briefing.) National JournalGroup: www.cloakroom.com.
American Health Line. 1999a. Uninsured: Report Warns of Crisis inMilwaukee. (March 16 daily briefing.) National Journal Group:www.cloakroom.com.
American Health Line. 1999b. Access/Quality/Cost—Arizona: UninsuredStruggles with Soaring Numbers. (May 19 daily briefing.) NationalJournal Group: www.cloakroom.com.
American Hospital Association. 1994. The 1994 American Hospital Guide.Chicago.
American Hospital Association and Arthur Andersen. 1998. FinancialViability Measures for Hospitals and Health Systems: Report of theNational Advisory Panel Meeting. Knowledge Leadership Series (1).Chicago.
American Institute of Certified Public Accountants. 1994. Audits ofProviders of Health Care Services: Audit and Accounting Guide. Chicago:CCH, Incorporated.
Arrington, B., and C.C. Haddock. 1990. Who Really Profits from Non-profits? Health Services Research 25(2):291–305.
Boles, K. 1990. A Benefit-Cost Analysis of Tax Exempt Hospitals inMissouri. (Public policy working paper no. 90-6.) Columbia: Uni-versity of Missouri.
210 N.M. Kane and W.H. Wubbenhorst
Bond Buyer 1998 Yearbook. 1998. Bond Buyer Indexes, 1990–1997. NewYork.
Buczko, W.S. 1994. Factors Affecting Charity Care and Bad DebtCharges in Washington Hospitals. Hospital and Health Services Ad-ministration 39(2):179–91.
Campbell, J. 1999. Health Insurance Coverage, 1998. Current PopulationReports. Washington, D.C.: U.S. Department of Commerce, Bureauof the Census.
Catholic Health Association. 1989. Social Accountability: Budget for Notfor Profit Healthcare Organizations. St. Louis.
Clement, J.P., D.G. Smith, and J.R.C. Wheeler. 1994. What Do WeWant and What Do We Get from Not-for-Profit Hospitals? Hospitaland Health Services Administration 39(2):159–76.
Epstein, A., C.V. Lukas, and J. Weissman. 1992. Bad Debt and Free Carein Massachusetts Hospitals. Health Affairs 11(2):148–61.
Eskoz, R., and K.M. Peddecord. 1985. The Relationship of HospitalOwnership and Service Composition to Hospital Charges. HealthCare Financing Review 6(3):51–8.
Fagnani, L., and J. Tolbert. 1999. The Dependence of Safety Net Hospitalsand Health Systems on the Medicare and Medicaid Disproportionate ShareHospital Payment Programs. (Pub. no. 351.) New York: Common-wealth Fund.
Frizzell, J.L. 1998. Nonprofit Hospitals and Charitable Tax Exemp-tions: Re-examining the Quid Pro Quo. New Hampshire Bar Journal(December): 30–5.
Gaskell, D., and T.R. Kitchen. 1997. An Estimation of Property Taxes forNon-Profit Hospitals. Paper presented to the Massachusetts HealthResearch Institute, October. Boston.
Gaul, G.M., and N. Borowski. 1993. Free Ride: The Tax-Exempt Economy.Kansas City, Mo.: Andrews and McNeel.
General Accounting Office. 1990. Nonprofit Hospitals: Better Stan-dards Needed for Tax Exemption. GAO/HRD-90-84. Washington,D.C.
Greene, J. 1995. Tax-Exempts Feeling the Heat. Modern Healthcare25(47):46–7.
Mann, J., G. Melnick, A. Bamezai, and J. Zwanziger. 1995. Uncompen-sated Care: Hospitals’ Responses to Fiscal Pressures. Health Affairs14(1):263–70.
Moody’s Bond Record. 1998. (November): 1030–4.Morrisey, M.A., G.J. Wedig, and M. Hassan. 1996. Do Nonprofit Hos-
pitals Pay their Way? Health Affairs 15(4):132–44.Noble, A., A.L. Hyams, and N.M. Kane. 1998. Nonprofit Hospital
Tax Exemption: A Review of Legal and Policy Developments in
Alternative Funding Policies for the Uninsured 211
Defining Hospital Responsibilities to Provide Charity Care. Journalof Law, Medicine, and Ethics 26(2):116–37.
Pattison, R.V., and H. Katz. 1983. Investor Owned and Not-for-Profit Hospitals. New England Journal of Medicine 309(6):347–53.
Pecesky, E.J. 1991. An Income Approach Model for Ad Valorem HospitalEvaluation. Assessment Digest (May/June):2–12.
Pimley, D.W. 1997. Boise Hospital Loses Tax-Exempt Status as CountyClaims. It Fails Charity Test. BNA Health Law Reporter 6 (August14):1257–8.
Prospective Payment Assessment Commission (ProPAC). 1994. Medi-care and the American Health Care System: Report to the Congress.Washington, D.C.
Renn, S.C., C.J. Schramm, J.M. Watt, and R.A. Derzon. 1985. TheEffects of Ownership and System Affiliation on the Economic Per-formance of Hospitals. Inquiry 22(3):219–36.
St. Louis Area Business Health Coalition, Z. Dyckman, and CHIPSConsulting. 1999. St. Louis Health Care: A Regional Comparison.Vol. 1. St. Louis.
Sanders, S.M. 1993. Measuring Charitable Contributions: Implicationsfor the Nonprofit Hospital’s Tax-Exempt Status. Hospitals and HealthServices Administration 38(3):401–18.
Sanders, S.M. 1995. The “Common Sense” of Nonprofit Hospital TaxExemption: A Policy Analysis. Journal of Policy Analysis and Man-agement (14)3:446–66.
Shortell, S., E.M. Morrison, S.L. Hughes, B. Friedman, J. Coverdill,and L. Berg. 1986. The Effects of Hospital Ownership on Nontra-ditional Services. Health Affairs 6(4):97–111.
Thorpe, K.E. 1997. Sources of Financing for Incremental HealthCare Reforms. Paper presented to the Council on EconomicCharges in the Healthcare System, October 9, WashingtonD.C.
Trocchio, J. 1996. What Are True Community Benefits? Health Progress77(5):34–8.
Watt, J.M., R.A. Derzon, S.C. Renn, C.J. Schramm, J.S. Hahn, andG.D. Pillari. 1986. The Comparative Economic Performance ofInvestor-Owned Chain and Not-for-Profit Hospitals. New EnglandJournal of Medicine 314:89–96.
Address correspondence to: Nancy M. Kane, DBA, Department of Health Policyand Management, Harvard School of Public Health, 677 Huntington Avenue,Boston, MA 02115 (e-mail: [email protected]).
212 N.M. Kane and W.H. Wubbenhorst
Appendix
The dependent-variable denominator was defined as (case-mix-adjusteddischarges [CMAD] * [Gross Patient Service Revenue/Gross InpatientService Revenue]). The numerator was Net Patient Service Revenue (netof contractual adjustments, free care, and bad-debt expenses), as reportedin the 1996 MCR. Case-mix-adjusted discharges were for 1996, providedby each state’s case-mix-adjusted discharge data sets. We predicted thedependent variable, Net Patient Service Revenue/CMAD adjusted forOutpatient Activity, based on a general linear regression model withthe following predictor variables: ownership (public, private nonprofit,for-profit), percent of Medicare patients, percent of Medicaid patients,length of stay, occupancy, and state. Length of stay, occupancy, percentMedicare, and state were significant predictors (R2 of .407) of the de-pendent variable. Neither private nonprofit nor for-profit ownership wasa significant variable with respect to the dependent variable.