


Alter n atives fo r the Fu tu r e - Forgotten Books
534
-
Upload
khangminh22 -
Category
Documents
-
view
1 -
download
0
Transcript of Alter n atives fo r the Fu tu r e - Forgotten Books


T he South’
s Fou r th Fo rest
Alte r na t ives fo r the Fu tu re

For ewor d
T he or iginal for est , the one that str etched w ithou t end acr oss
the Sou th when settlem en t began w as har vested by theear ly 1900 ’
s . T he“
second for est , the one that supplied thewood fr om the 1930
’
s th r ough the 1960 ’
s for the r apidlygrow ing pu lp and paper indu stry and for the other w ood
using indu str ies, has alm ost en tir ely been cu t . Now the“
th ird for est” is being har vested . Tim ber fr om th isforest is the m ost im por tan t agr icultur al cr op in the Sou th .
T he for est industr ies using th is tim ber lead al l o ther
m anu factu r ing industr ies i n n um ber s of em p loyees an d i nwages and salar ies paid to wo rker s.
T he th ird for est w il l con tinue to be the sou r ce of the tim berharvested in the Sou th du r ing the r est of th is cen tu ry . T he
forest that w i ll com e after that— the Sou th’
s“
fou r th for est
— c an take alm ost any form desir ed .
T he changes now taking place in the th ir d for est are cause
for great concern . Ou r m ost r ecen t su r veys of for est
r esou r ces show that net an nua l tim ber gr ow th , after r isingfor decades, has begu n to decl ine . Softw ood tim berrem ovals ar e above net annu al grow th over lar ge ar eas
,and
in ven tor ies ar e begin n ing to decr ease . A sim i lar situationis developing for hardwoods. If these r ecen t trends con tinue ,

T he pr eface to T he Sou th’
s Th ir d For est H ow It Can
Meet Fu tu r e Dem ands”(Sou ther n For est Resour ce Analy'
sisComm ittee 1969 ) began :
T he analysis w as developed to lear n how the
Sou t - t ach ieved i ts vastly impr oved , i f not who lly‘ favor able ,
tim ber position over the past sever aldecades and how th is tr end cou ld be con tinued .
In a gener al sense , th is is also the basic pu rpose of the present study .
Concer n abou t the tim ber situ ation in the Sou th began i n theear ly l 9oo’
s, when i t becom e eviden t that for ests over m uchof the Sou th wer e not r egener atin g after har vest . Th is concern led to a ser ies of n ational and r egional analyses thatpr ovided an analytical basis for developing pol ic ies and pr ogr am s to r enew and sustain the Sou th ’
s tim ber resou r ce .
As descr ibed in the second par t of th is study ,these polic ies
and pr ogr am s— fire pr otection , techn ical and fin anc ial assistance , r esear ch , edu cation , and the establishm en t of m an agedindustry , public ,
and other pr ivate for ests— have been effec
tive . They r esu lted i n the r egener ation of the second for est i nthe Sou th and m ade possible the establishm en t and gr ow th ofthe pu lp and paper and softwood plywood industr ies. Theyhave also shaped the th ir d for est— the for est that w i ll be thesour ce of m ost of the tim ber har vested in the Sou th i n the r estof th is cen tury .
T he kind of for est that w ill exist after that— the fou r th for est
still r em ains to be determ ined . Developm en t of the fou r thfor est can be m anaged , and the for est i tself can take alm ostany form desir ed . And that is the cen tr al focus of th is study :what kind of for est is evo lving , what kind of for est w ill be ofgreatest benefit to the economy and soc iety in the South , and
how can i t be ach ieved?
T he study has five m ajor par ts dealing w ith these questions.
T he fir st is concer ned w ith the econom ic impor tan ce of the
for ests in the Sou th . It descr ibes the uses of the for est ; the
ar ea , location , and char acter istics of the tim ber land ; the vo lume and value of r oundwood pr oducts; and the con tr ibu tionof tim ber - based m anufactu r ing in term sof em ploymen t , w agesand salari es, and value of sh ipm en ts. Th is m ater ial documents the great im por tance of the for est r esour ce and the
timber - based industr ies to the econom y and society in al l
Sou ther n States.
T he second par t of the study descr ibes past changes in thefor est r esou r ce and for est industr ies. It r elates these changesto sh ifts i n the use of land for cr ops and pastu r e; r esear ch andtechno logical developm en ts; and pr ogr am s from the Feder al ,State , for est industry , and other pr ivate sector s on m an age
men t , assistance , and education . Th is par t of the study ex
plains how the tim ber situation has tur ned ar ound in the Sou th ,
fr om the lack of r egener ation of the r esour ce in the late 1800 ’
s
and ear ly 1900 ’
s to successfu l r egener ation and the gr eatincr eases in tim ber gr ow th that have occurr ed in the last fewdecades.
T he mater ial in th is chapter also pr ov ides a m eans of appr aisi ng the effects of the polic ies and pr ogr am s that have been i nplace and a per spect ive for gu iding po lic ies and pr ogr am s inthe futu r e .
T he fifth par t of the study qu an tifies the econom ic oppor tun it ies for in cr easin g tim ber supp lies by tr eatm en t oppor tu n ity ,
m anagem en t type ,and ow ner sh ip . Th i s pr ov ides the data
n eeded for select in g the tr eatm en ts that w i ll m ost econom i
T he th ir d par t of the study i s con cer n ed w ith pr ojections ofchanges in the timber r esou r ce— tim ber supplies (har vests) ,net annual gr owth , t im ber r em ovals, and tim ber inven tor ies.
These pr ojection s— the base pr ojection s— show what wou ldhappen to the tim ber r esour ce given pr esen t expectations abou tbasic changes in dem and determ in an ts such . as popu lation ,
econom ic activity , incom e , and pr oduct pr ices; and changesin supply determ in an ts such as the ar ea of tim ber land ,
m an
agemen t in ten sity , gr owth r espon ses, and stum page pr ices.
T he effects of a ser ies of other fu tu r es or other expectations(abou t chan ges in var ious dem and determ inan ts such as econom ic activity and supply determ inan ts such as ar ea changeand m anagem en t in tensities) ar e also simulated .
These pr ojection s pr ovide a m eans of iden tifying fu tu r e or
developing tim ber problem s. They pr ovide gu idance for m anydec ision s on long - r an ge comm itm en ts such as investm en ts inplan t and fac ilities and tim ber m an agem en t pr actices whoseeffects ar e r ealized over an extended per iod of tim e . Fin ally ,
they also provide the data needed for an alyzing the econom ic ,
soc ial , and envir onm en tal im pl ication s of the var iou s fu tu resthat have been sim u lated .
T he fou r th par t of the study i s con cer ned w ith these im pl ication s. It descr ibes the im pacts of the fu tu r es an alyzed on ther esour ce ,
stum page and pr odu ct pr ices, lum ber and plywoodpr oduction , r oundwood pu lpwood con sum pt ion , employm en tand w ages and salar ies i n the tim ber -
processing industr ies,needed investm en ts for tim ber m an agem en t and plan t andequ ipm en t , State and local gover nm en t r evenues, and w ildlife ,
fish , for age , and w ater . Th is pr ovides a qu an titative basis form oving tow ar d gr ow in g the forest that w ill be of gr eatestbenefit to the econom y and the soc iety ,
as wel l as for estowner s, for est i ndu str ies, and State and local gover nm en ts in
the Sou th .

cally ach ieve the ki nd of for est desir ed . It also pr ovides thein form at ion necessar y for assessin g public and pr ivate op
tion s for in cr easin g t im ber suppl ies.
T he For est Ser vice has for a long t im e pr epar ed per iodicn ational stud ies of the tim ber situation that have in cludedanalyses for the Sou th and the other major tim ber -
pr oduc ingr egion s. T he last such study ,
“
An Analysis of the Tim berSitu ation i n the Un ited States, 1952—2030 ,
w as pr epar ed in
the late 1970 ’
s (USDA For est Ser vice In the ear ly1980
’
s, new sur vey data and r esear ch on pr ojection m ethodology ind icated that the chan ges i n the t im ber r esou r ce situ ationi n the Sou th wer e l ikely to be sign ifican tly d iffer en t fr omthose show n i n th is latest n at ional an alysis. T he n ext nation alan alysis of the tim ber situation w i ll be pr epar ed in the late1980
’
s. In view of the im por tan ce of the tim ber r esou r ce inthe Sou th and after d iscussionsw ith r epr esen tat ivesofFeder al ,State , and pr ivate for estr y or gan ization s, i t w as dec ided that acompr ehen sive new an alysis— th is study— w as needed .
l
Repr esen tatives of Feder al and State for estr y or gan ization s,for est indu str ies, for estry schools, and other major inter estscon cer ned w ith the tim ber situat ion i n the Sou th h ave pr ovided advice , gu idan ce , and techn ical an d financ ial assistan ce for the study . T he in ten t i n m ak ing th is a co l labor ativeeffor t w as to r each a br oad con sen su s on the m ajor tim berr esour ce problem s and oppor tun it ies. It is hoped that w ithth is con sen sus, the study can ser ve as an effect ive basis forgu id in g public and pr ivate t im ber pol ic ies and pr ogr am s in
the Sou th du r in g the r est of the cen tur y .
T h is work,w ith r espect to t im ber , is i n compl ian ce w ith Section 3 (b) of
the Renew ab le Resour ces Resear ch Act of 1978, wh ich di r ec ts the Secretar y of Agr icu l tur e to m ake and keep curr en t a comprehensive surveyand anal ysis of the presen t and pr ospective conditi ons of an d r equ ir emen tsfor the renew able r esour ces of the forest and r angelan ds of the Uni ted Statesand of the suppl ies of such renew able r esour ces, in c luding a determ ina
tion of the present and poten tial pr oductivity of the land , and of such other
factors as m ay be necessary and usefu l in the determ i nat ion of w ays an d
means needed to ba lance the dem and for an d supp ly of these r enew ab le
resou rces, benefits and u ses in meet ing the needs of the peop le of the
Un ited States.
”
Sou ther n For est Resou r ces Ana l ysis Com m ittee. 1969
forest H ow i t can meet fu tu r e dem an ds. [Place 0
unknown ] : Sou ther n For est Resou r ces Ana lysis Com r
U .S. Depa r tm en t of Agr icu l tu r e , For est Ser vi ce. 1982 .
t imber situ ation in the Un ited States, 1952—2030 . For
23 . Wash ington , DC : U S . Departm en t of Agri cu ltu r i499 p .

Th is study is the pr oduct of a co llabor ative effor t am ongpeople in Feder al and State for estry or gan izations, for estindustr ies, forestr y schoo ls, and other m ajor in ter estsconcer ned w ith the for estry situ ation i n the Sou th .
An execu tive gr oup pr ovided gu idance on the needs and
concer n s of the in ter ests they r epr esen ted , ser ved as a
comm un icating link w ith those in ter ests, and m adear r angem en ts for exper ts to ser ve on ad hoc
_
techn ical r eviewgroups. Mem ber s inc luded : J . Lam ar Beasley 1 (Chairm an ) ,Leonard A . Kilian , Jr . (South Car o lina For estryComm ission ) , Am ett C . Mace ,
-
'
Ir . (Schoo l of For est .
Resour ces and Conser vation , Un iver sity of Flor ida) , WilliamF. Milliken (Milliken For estry Company , Donald F.
Sm ith (Bo ise Cascade Corp or ation ) , B . Jack War r en (Forest
Farm er s Assoc iation ) , Thom as H . El l is (ex offic io) , andDw ight Hair (secr etary) . T he execu tive gr oup also helpedr eso lve d iffer ing views abou t the study and provided adviceand gu idance on al l par ts of the study and the use of m ajorstudy find ings.
“
T he au thor of ch apter 1, T he Econom ic Im por tan ce of
Forests in the Sou th , was Joan G . McAndr ew . Richar d A .
B irdsey , Denn is M . May ,Wi ll iam H . Mcw il l iam s,
Herber t A . Kn ight , Cec il C . Hu tch ins, Jr . , John B . Tansey ,
and Rober t T . Br ooks, Jr . (Tennessee Val ley Au thor ity)con tr ibu ted data on the vo lum e of r oundwood tim berproducts ou tpu t . J . Michael Vasievich pr ovided product pr iceinform ation for estim ating the value of roundwood ou tpu t .
S taffs at each of the S tate for estry agenc ies i n the Sou threviewed the vo lum e and value data and suggestedadjustm en ts as necessary . T he compar isons of tim berproducts w ith other agr icu ltu r al cr ops and o ther
m anufactu r ing industr ies updates ear lier work by Bennett B .
Foster . War r en A . Flick (Aubu r n Un iver sity) developed them u ltipl ier s for estim ating the. im pact of for est industryemploym en t and wages and salar ies on State econom ies.
T he au thor s of“
chapter 2 , T he Changing For est Resou r cesand For est Industr ies in the Sou th , wer e Denn is M . Roth ,
H . R . Josephson (ret ir ed fr om the For est Ser vice) , andHaro ld K . Steen (For est H istory Soc iety) . Near ly al l of the
m ater ial i n th is chapter w as abstr acted fr om the detai ledrepor ts on var ious aspects of the for est h istor y of the Sou thlisted i n the fir st par agr aph of chapter 2 . Joan G .
McAndr ew , Kar en L . Hanson , David E . Alligood ,Geor ge
N . Brooks,Linda Sm ith , Elinor Mar tin , David M . Belcher
,
Wi ll iam Thom pson , Joan D . Miller,and John B . Tansey
Named con tr ibu tor s are employees of the USDA For est Service un less
o therw ise spec ified .
com p i led and r eviewed data for the suppor t in g tables.
Wil liam C . S iegel , Clifford A . H ickm an and Ter ry K .
Haines provided suppor ting m ater ial on for est taxation and
legislation .
T he pr inc ipal au thor s of chapter 3 , Pr ojected Changes inthe Tim ber Resour ce , wer e: Rober t B . Phelps (basicassumptions and pr ojected chan ges i n dem and) , Ralph J .
Alig (r ecen t and projected changes in tim ber land area) , andHer ber t A . Kn igh t and Richar d A . B ir dsey (r ecen t andprojected changes in tim ber r esour ces) . T he pr ojections ofdem and for tim ber pr oducts and r oundw ood wer e pr epar ed
by Richar d W . Haynes. T he Tim ber As'sessm en t Market
Model , used in m aking these projection s, w as developed byDari us M . Adam s (Un iver sity of Wash ington ) and RichardW . Haynes. T he projections of changes in tim ber land ar ea
and the Sou ther n Acr eage Model u sed i n m aking theseprojections wer e developed by Ralph J . Alig . T he
pr ojections of r esour ce changes -
at the national and r egionallevels wer e p r epar ed by Rich ar d W . Hayn es, Jon n a C .
Kincaid (Un iver sity of Wash ington ) , Dar iusM . Adam s, andJohn R . Mills. T he Tim ber Resou rce Inven tory Model usedi n m ak ing these pr ojection s w as developed by Ph i l ip L .
Tedder and Richar d M . LaMon t wh i le at Or egon S tateUn iver sity , and Jonna C . Kinca id . T he projections of tim berr esou r ce changes by S tate and the S tate Allocat ion of
Regional Inven tory Model , used in m aking these projectionswere developed by Rober t C . Ab t (Un iver sity of Flor ida) .
T he com pr ehensive and detai led tim ber r esou r ce data baseused in pr ojecting r esou r ce changes for chapter 3 w asmanaged and com pi led by Herber t A . Kn ight , Richard A .
B irdsey ,Joseph F. Glover , An ne W . Jenkin s, Car o lyn D .
Steppleton , Lar r y A . Royer , and Wil liam H . Mcw i ll iam s.
T he data base for estimating tim ber yields w as com piledby Joe P . McC lu r e and Her ber t A . Kn igh t . C . Den iseIngr am , Tim othy'D . Mart y , and Br ian C . Mur r ay assem bleddata and assisted in m odel developm en t for pr ojecting areachanges.
T he fo llow ing exper ts fr om the for est indu str ies, for estryschoo ls, and State and Feder al for estry agen c ies pr ovidedtechn ical assistance i n the developm en t and testing of them odels u sed i n projec tin g r esou r ce changes, tim ber landarea changes, and tim ber dem ands: Rober t C . Abt , Edw inH . Bar r on (Texas For est Ser vice) , Rober t L . Bailey(Un iver sity of Geor gia) , David M . Belcher , Rober t T .
Brooks, Jr . , Ralph E . Co lber g (Mead Corpo r ation ) , Lar ryG . Davis (Cham p ion In ter nat ion al Corpo r ation ) , Jer r y J .
Green (Buckeye Cellu lose) , Ger ald T . Ham i lton (S im psonTim ber Com pany) , S teve L . Harp (Geor g ia Kr aftCom pan y) , Wa lter Jar ck (Geor gia Pac if ic Co rpo r ation ) ,

Dav id N . Kelly (Flo r ida Div ision of For estry) , Wi ll iam J .
Lange (Nat ion al Fo r est Pr odu cts Assoc iation ) , Rober t J .
Len tz , Dav id K . Lew is (Oklahom a State Un iver sity) , AndyJ
.Malm qu ist (Westvaco Corpor ation ) , Edw ar d E . Mathew s
(Con ta iner Corpor ation of Am er ica) , Thom as B . Mon tzka
(Bo ise Sou ther n Corpor ation ) , Dav id B . Nor r is (Un ion Cam pCorpor ation ) , Jeffr ey T . Olson (Bo ise CascadeCorpor ation ) , Richard N . P ier son (Weyer haeu ser Com pany) ,B ryce E . Sch l aegel , Rober t W . S locum , Jr . (Am er icanForest Council) , Don W . Sm ith (Am er ican For est Counc il) ,Donald F. Sm ith (Bo ise Cascade Corpor at ion ) , Kar l E .
S toneking ,William L . Whar ton , Jr . (Scott Paper Company) ,
and Herber t I. Winer (Mead C orpor ation ) .
These exper ts also pr ov ided in fo rm at ion and gu idan ce i ndeveloping the data used i n these an a lyt ica l system s,
and
par ticu lar ly the data o n tim ber y ields and m an agem en tin ten sity sh ifts used in the Tim ber Resou r ce In ven tor yModel . T he assistance r eceived fr om these exper ts w assubstan tive ,
and i t has r esu lted in im pr ovem en ts that cou ldnot have been ach ieved w ithou t their par t ic ipation .
T he pr inc ipal au thor s of chapter 4 , Im pl icat ions of theProjected Base Level Changes in the Tim ber Resou r ce and
of Other Selected Fu tu r es, w er e Richar d W . Haynes and
Dw igh t Ha i r . T he pr ice and pr odu ct ou tpu t pr ojection s ofr esou r ce ch anges w er e pr epar ed by Richar d W . Hayn es,
Jonn a C . K in ca id , and John R . Mills. T he pr oject ion s ofem ploym en t and w ages and salar ies w er e pr epar ed by JoanG . McAnd r ew and Fr ed r ick W . Cubbage (Un iver sity of
pr ojec tions of in vestm en ts in forestm an agem en t wer e pr epar ed by J . Michael Vasievich . T he
project ion s of in vestm en ts i n plan ts an d equ ipm en t w er epr epar ed by Clark C . Row and Per ry R . H agen stei n (bothfrom the In st itu te for For est Analysis, Plann ing andPo l icy) . Pr oject ion s of w i ld life popu lat ion s w er e pr epar edunder the di r ect ion
'
of Thom asW . Hoekstr a by Cu r t is H .
Flather , pr oject ion s of fish popu lation s by Patr icia A .
Flebbe , pr oject ions of for age pr oduction by Linda A . Joyce ,
and pr ojection s of w ater qu an t it ies by S tan ley J . Ur sic .
Geor ge E . Dissm eyer and Glen E . Br ink also assisted in thedevelopmen t of these pr oject ion s. T he projection s ofchanges i n S tate and loca l gover nm en tal r even u es w er epr epar ed by Cl ifford A . Hickm an and Wi ll iam C . S iege] .
T he a u tho r of chapter 5 , Oppor tu n it ies for Incr easing NetAnnual Tim ber Grow th Th r ough Mor e In ten sive For estry ,
was J . Michael Vasievich . Peter D . Schr oeder , C . Den iseIngr am ,
Au r el ia B . Har r is,Tim othy D . Mar ty , Joan G .
McAndr ew , and John B . Tan sey assisted w ith datacollection and an alysis. Spec ial data on poten tials for t im beron m arginal c r opland and pastu r e wer e pr ov ided by John
vi
H . Stiem a , Pau l E . Fuglestad , Dav id Post , J . Jeffr eyGoebel , and Ter r y John son (al l of the USDA So ilConser vation Ser vice) . Geor ge F. Du trow (Duke Un iver sity)pr ovided invaluable cou n sel and gu idance on plann in g thestudy and the analysis of oppor tun ities.
Alabam a
Ar kan sas
Edw in E . Waddell', Arkan sas For estry Comm ission(chairm an )
Jam es H . Fr an c is, Con su lting For esterJam es A . Gayle ,
In ter national Paper Com pany (r et ir ed)Richard A . Kluerider , Un iver sity of Arkansas at Mon ticelloJim J . Neeley , Neeley For estry Ser vice , Inc .
B . J . Pavlov ich , Arkan sas For estry Associat ionR . L . Wi llett , Un iver sity of Arkansas at Mont icello
Flor i da
John M . Bethea , Flor ida D ivision of Fo r estry (chairm an )Boyd Close , Buckeye Cel lu lose Corpor ationDuane R . Dippon , Un iver sity of Flor idaDav id N . Kelly , Flori da Division of For estry
Raym ond K . Mason
H . W . Sapp , St . Regis Paper Com panyGeor giaJohn W . M ixon , Geor g ia For estry Comm ission (chairm an )
Jam es I . A l fr iend , Con su lting For esterFr eder ick W . Cubbage , Un iver sity of Geor giaLynn B . Hooven , Geor gia Fo r estry Com m ission
For chapter 5 , data on for est pr actice costs, econom ies oftr act size , tim ber m arket cond ition s, avai lability of vendor
ser vices, tim ber yields, site -
pr epar ation needs, r egener ationm ethods, fo r est m anagem en t tr eatm en ts, and m uch of the
o ther in form ation necessary for an alyzing econom icoppor tu n ities by S tate wer e fu r n ished by study groupsform ed in each S tate . T he m em ber s of these State studygr oups follow :
C . W . Moody , Alabam a For estry Comm ission (chairm an )John M . Br ad ley ,
Jr . , Resou r ce Managem en t Ser vice , Inc .
Leonar d G . Br eem an ,H amm erm i l l Paper Com pany
Jer ry L . John son , USDA So il Con ser vation Ser viceWilliam C . Jones, III , A labam a For estry AssociationAllen W . Layson ,
Weyer haeu ser Com panyC . W . (B i ll) McKee , Aubu r n Un iver sityEmm ett F. Thom pson ,
Aubu r n Un iver sity

S . B . Kinne , III , Geor gia Kr aft Com panyRichard L . Malm , Un ion Cam p Co rpo r ationAlber t A . Mon tgom ery , Geor gia State Un iver sityGary L . Tyr e , USDA So i l Conser vation Ser vice
Lou isian a
Michael P . Mety ,Lou isian a Office of For estr y (cha irm an )
Thom as A . Hansbr ough ,Lou isiana S tate Univer sity
Rober t C . JoslinDonald F . Sm ith , Bo ise Cascade Co rpo r ationZ ebu lon W . Wh ite , Z ebu lon Wh ite Com panyM ississippi
Rober t S . (Si d ) Moss, Mississipp i Fo r estry Com m ission(chairm an )
Thom as J . Ebner , Weyer haeu ser Com panyJohn G . Gu th r ie , Gu th r ie and Sons
Rober t L . Iz lar , Mississipp i For estry Assoc iationTo rn H . Monaghan ,
Mississipp i State Un iver sityDouglas P . Richar ds, Mississippi State Un iver sityGene A . Si r rn on
Nor th Ca r ol in a
Har r y F. Laym an ,Nor th Car ol in a Div ision of For est
Resou r ces (chairm an )Stephen G . Boyce , For estry Con su ltan tEr ic L . Ellwood , Nor th Car o lin a S tate Un iver sityC . Rober t Gr ady ,
Nor th Car o l ina Division of Fo rest
Resou r ces
Jay Car l Jessup , Jr . , Weyer haeuser Com panyGeor ge A . OlsonHen ry Plotkin , For estry Consu ltan tR . R .
“
Bob Richar dson , Feder al Paper Boar d Corpor ationJer r y G . William s, Coastal Lum ber CompanyOklahom a
Roger L . Davis, Oklahom a For estry D ivision (chairm an )Ku r tis L . Atkinson , Oklahom a For estry DivisionJohn C . Bu rwell , Oklahom a Fo r estry Assoc iationStan ley B . Carpen ter , Oklahom a State Un iver sityMichael J . Dah lem , Weyer haeuser Com panyDave Elkin , Weyer haeu ser Com pany" u intus H . Her ron , Her r on Indu str iesEdgar R . H u r l im an , For estry Con su ltan tRober t M . LaVal
Dav id K . Lew is, Oklahom a State Un iver sity
Sou th Ca r ol i n a
Leonard A . Kilian ,Ir . , Sou th Caro lina Forestry Com m ission
(chairm an )Joseph M . Cr ockett , Westvaco Corpo r at ionWilliam F. Milliken , Milliken Forestry Com pany,Inc .
C . R . Nicho ls, Sou th Caro l ina For estry Com m issionS teve K . Nod ine , Clem son Un iver sityTen n essee
Roy C . Ash ley ,Tennessee Div ision of For estry (chairm an )
Har t W . Applegate ,Ten nessee Div ision of For estry
Jam es H . H ill,H iw assee Land Com pany
Char les E . McGee
David M . Osterm eier , Un iver sity of Tennessee
Texas
Vi r gin ia
Jam es W . Garner , V ir gin ia Division of For estr y (chairm an )T . Nelson Fl ippo , Fl ippo Lum ber Corpor ationShar on R . Miller
,Chesapeake Corpor ation
David A . Tice, Mi d - Atlan tic For estry Ser vices,
Inc .
Har o ld W . W isdom ,Vir gin ia Po lytechn ic In st itu te an d
S tate Un iver sityMem ber s of the S tate study gr oups a lso r eview ed stu dy
m ater ial as i t w as developed . T he r eview commen ts and
suggest ion s of these gr oups wer e par t icu lar ly he lpfu l i ndeveloping the tim ber land ar ea pr ojections.
v i i
Br uce R . Miles,Texas Forest Ser vice (chai rm an )
Ken t T . Adair , S tephen F . Austin S tate Un iver sityGlenn A . Chancel lo r , Tem ple - EasT ex , Inc .
T om L . Har t , Cham pion In ter nat ional Corpor ationEd D . Holcom be , USDA So i l Con ser vation Ser viceRon H . Hu fford , Texas For estry Assoc iationJay O
’
Laughl i n , Texas A . M . Un iver sity
T he gener al p lann in g , d ir ection , and m anagem en t of the
study wer e by Dw ight Hair . Joan G . McAndr ew con tri bu tedi n m any im por tan t w ays in c lud in g w r it in g and r ev isin gtext , plan n ing gr aph ics and other ar twork ,
and m anaging thepr epar at ion of the r eview an d fin al d r afts o f the stu dy .
Janet S . Win term u te ed ited the study . Syble M . K incannonprovided the pr im ary suppo r t assistance for the pr epar at ionof gr aph ics, text , an d other m ater ials. Joan D . M i l ler ,Johnetta I . Wor rn ley ,
Lo ida De l Rio , Rachel G . Redm on ,

Shar on C . Johnson , Peggy E . Gw in n , Alice H . Ul r ich ,
Linda D . Rodger s, S teven R . Bou tcher , Seabel le J . Bal l ,Lau r ie Gar nett , and Renee Y . B lue pr ovided assistance on
m ajor par ts of the study .
Many other s have pr ovided suppor t and assistance for th isstudy . T he au thor s specifically w an t to expr ess theirappr eci ation for th is help to John E . Alcock , J . Lam ar
Beasley , Rober t E . Buckm an , Thom as H . Ellis, T hom as E .
Ham ilton , H . Fr ed Kai ser , Jr . ,Wi lliam J . Lange (National
Forest Pr oducts Assoc iat ion ) , and Don ald F . Sm ith (Bo iseCascade Corpor ation ) .
viii

H ighl i gh ts
Chapter 1 : T he Econ om ic Impo r tan ce of
For ests in the Sou th
Over view of the Im por tan ce of the
For est Resou r ce
Tim ber land Ar ea Locat ionLocation by Region and State
Com par ison W ith Cr op land and Pastu r e
Majo r For est Managem en t TypesOwner sh ip Char acter istics
Volum e and Va lu e of Rou n dwood T im berP r oducts
Estim ates of the Vo lum e and Value of
Roundwood Tim ber Pr oductsRelative Impor tance of Products
Relative Im po r tance of Regions and States
Va lu e of T im ber P r od u cts Com par ed Wi thTh at of Agr icu l tu r a l C r ops
Con tr i bu t ion of For est In du str ies to th e
Sou ther n Econ om y
Scope of For est Indu stry Manu factu r ingCon tri bu tions to the Economy Sou thw i deCompar isonsWith Other Manufactu r ingRelative Impor tance of For est Industr ies by
TypeRelative Impor tance of For est Indu stri es by
Region and S ta te
Recent Tr ends for For est Indu str ies in theSouth
T he Impor tan ce of the Sou th for For estIndustr iesNationw ide
L i ter atu r e C i ted
Chapter 2 : T he Ch an g i n g Fo r est Resou r ces
an d For est In du st r ies i n th e Sou th
T he Lesson s of the Past
Ea r l y Use of Sou ther n For ests
Comm er c i a l Uses of Sou ther n For estsExpan sion of the Lum ber In du str ySoftwood Lum ber Pr oductionHardwood Lum ber Pr oductionTechno logical Br eakthr oughs
Developm en t of Con ser vat ion P r og r am s
T he Weeks Law
Lum ber Tr ade Assoc iation sT he Clarke—McNary Act
Reforestation and Wildl ife HabitatImpr ovemen t
For est Fi r e Con tr o l in the Sou th
Woods- Bum ing vs. Fir e Pr otectionFir e Pr otection in the Th ir ties and For tiesPr escr ibed Bur n ingResearch and Educational Effor ts
Refor esta tion Pr ogr am s
Feder al Assistance for Refor estationSta te Refor estation Pr ogr am s
Refor estation Tr ends
For estr y Resea r ch
o o ooo o o o o
0 0 0 0 0 0 0 0 0 0 0
0 0 0 0 0 0 0 0 0 0 0 0
For estr y Edu cat ion an d Exten sion
Ro le of Extension Pr ogr am s
Con tinu in g Education Pr ogr am s
Influence of Pr ofessional Or gan izat ion s andIndu stry
Fu nd ingTim ber Man agemen t Resear chInven tory and Econom ics Resear chInsect and D isease ResearchFir e- Related Resear chFor est Pr oducts and Uti l i zation Resear chOther Resear ch
Un iver sity Resear chIndustry Resear ch

Tech n ica l Assistan ce in For est Man agem en t
an d Ut i l i zat ion
Ro le of State Ser vice Fo r ester sForestry Industry AssistanceConsu ltin g For ester sEffectiveness of Assistance Pr ogr am s
In sect an d Disease Con tr o l
Taxa t ion Mod i fi cat ion s
State For est T ax Law sFeder al Taxes on Tim ber
Nat ion a l For est an d Other Pu b l icLan d Man agem en t
Expan sion of th e For est In d u st r ies an d
In du st r ia l For estr y
T he P u lp and Paper Indu str yTimber Sou r ces for the Fo r est Industr iesIndustr ial For ester sFor estry Assoc iationsPr oducts Over view
Non t im ber Uses of T im ber lan ds
Stum page P r ice Tr en ds in the Sou th
Con c lu d i n g Obser va t ion s
L i ter a tu r e C i ted
Ch apter 3 : P r ojected Ch an ges i n th eT im ber Resou r ce
T im ber Resou r ce P r oject ion Methods
T im ber Resou r ce P r oject ion Assum p t ion sPopu lat ionEconom ic Activ ity and Incom e
0 0 0 0 0 0 0 0 0 0 0 0
Recen t an d P r ojected H a r dwood Tim berSu pp l ies
Sou thw i de Tr endsTr ends i n the Sou theastTrends in the Sou th Cen tr al RegionTrends by State
Recen t an d P r ojected Softwood T im berRem ova ls
Sou thw i de Tr endsTrends in the Sou theastTrends i n the Sou th Cen tr al RegionTrends by S tateRecen t an d P r ojected Softwood Net An n u a l
Gr ow th
Sou thw ide Tr endsTr ends in the Sou theastTr ends in the Sou th Cen tr al RegionTr ends by StateSou thw ide Summ ary of Softwood Gr ow th
Trends
Recen t an d P r ojected Softwood Gr ow thRem ova l Ba lan ces
Recen t an d P r ojected Softwood In vent or ies
Sou thw i de Tr endsTr ends in the Sou theastTr ends i n the Sou th Cen tr al RegionTr ends by StateRecen t an d P r ojected H a r dwood Tim ber
Su ppl ies
Sou thw ide Tr endsTr ends in the Sou theast
In st itu tion al , Technological , and OtherChanges
Tr ends in Tim ber Use and Projected Dem andsTr ade in Tim ber Pr oductsDem ands on U S . Tim ber landAssum ptions on Ar ea of Tim ber landAssum ptibns on Tim ber YieldsOther Assum pt ions

Tr ends in the Sou th Cen tr al RegionTr ends by State
Recen t a n d P r ojected H a r dwood T im ber '
Rem ova ls
Sou thw ide Tr endsTrends in the Sou theastTr ends in the Sou th Cen tr al RegionTrends by State
Recen t an d P r ojected H a r dwood Net An n u a lGr owth
Sou thw ide Tr endsTr ends in the Sou theastTr ends in the Sou th Cen tr al RegionTr ends by S tateRecen t and Pr ojected H ar dwood Gr ow th
Rem ova l Ba lan ces
Recen t an d P r ojected H a r dwood In ven tor ies
Sou thw i de Tr endsTr ends in the Sou theastTr ends in the Sou th Cen tr al RegionTr ends by State
A " u a l ifi ed View on P r ojected Chan ges inT im ber Resou r ces
L i ter atu r e C i ted
Ch apter 4: Im p l ica t ion s of th e Base
P r oject ion s of Ch an ges in the T im berResou r ce an d of Oth er Selected
Fu tu r es
Econ om i c an d Envi r onm en ta l Im p l icat ion s
of th e Base P r ojection s of Resou r ce
Ch anges
Sawtim ber and Pu lpwood Stum page Pr icesLum ber arid P lywood Production and
Pu lpwood Consum ptionSoftwood Lum ber Im por tsEmploym en t and Wages and Salar ies in the
For est Industr ies
Investm en ts i n For est Managem en tInvestm en ts i n Plan ts and Equ ipm en tState and Local Gover nm en t RevenuesFor age , Wi ld life and Fish , and Water
Resou r ce,Econ om ic , an d Envi r onm en ta l
Im p li ca t ion s of Other Fu tu r es
L i ter a tu r e C i ted
Ch apter 5 : Oppor tu n i t ies for In cr easin gT im ber Su pp l i es T h r ou gh Mo r e
In ten sive For est r y
Econ om ic Oppor tu n i ties T o In cr ease T im ber
Su pp l ies on T im ber lan d
Im pr oved Pr ocessing Effic iencyHigh Expor ts of Tim ber Pr oductsH igh Impor ts of Tim ber Pr oductsRedu ced Tim ber land AreaReduced Tim ber Grow thRedu ced National For est Tim ber Har vestNatu r al Regener ation on Mar gin al
Cr opland and Pastur e
Plan ted P ine on Mar ginal Cr oplandand Pastur e
Econom ic Oppor tun ities on Tim ber land i nPr ivate Owner sh ip
All Econom ic Oppor tun ities on Pr ivate LandsIncr eased Managem en t In ten sity on For est
Industr y Tim ber lands i n the Douglas- fi r
RegionH igh ligh ts of the Im pl ication s of Resou r ce
Chan ges
Data Base , Analytical Str uc tu r e , and
Assumption sAr ea of Tim ber land With Econom ic Oppor tun it ies
T o Incr ease Net Annu al Tim ber Gr ow thPoten tial Incr eases i n Net Annu al Grow th With
Ut ilizat ion of Econom ic Tr eatm en tOppor tu n ities
Investm en t Oppor tun ities T o Inc r easeNet An nu al Gr ow th
Econom ic Oppor tun it ies T o Incr ease Net An nu a lTim ber Gr ow th With Con stan t S tum pagePr i ces

Econom ic Oppor tun ities T o Incr ease Net Annu alTim ber Grow th That Wou ld Yield 10 Per cen tor Mor e on the Investm en ts
Econom ic Oppor tun ities T o Incr ease Net Annua lTim ber Gr owth , by S tate
Oppor tu n i t ies T o In cr ease Net An n u a l Gr ow th
on Ma r gin a l C r oplan d an d Pastu r e
Oppor tun ities on Mar gin al Cr op land and
Pastu re
Oppor tu n ities on H igh ly Erod ible Cr opland
A " u a l ified View of the Oppor tun i t ies for
In cr easin g T im ber Su ppl ies
Mar ket Im per fection s—Cau ses an d
Im pl i ca tion s
Li ter atu r e C i ted
Appen d ix 1
Appen d ix 2
Appen d ix 3
Appen d ix 4
Appen d ix 5
L ist of Fi gu r es
List of Tab les Wi th in Ch ap ter s
L ist of Tab les Wi th i n -Appen d icesGlossa r y of Ter m s

As w ith tim ber land ar ea , the t im ber in ven tory is con centr ated on the other pr ivate ow ner sh ips— these con ta in 73
per cen t of the hardw ood and 61 per cen t of the softw ood
inven tor ies. Another 16 per cen t of the har dw ood in ven to ryand 26 per cen t of the softwood inven tor y wer e on for est
industry ow ner sh ips . Most of the r em a i n i ng i n ven tor i eswer e on the nation al for ests.
4. Tim ber is the m ost im por tan t agr i cu ltu r a l cr op i nthe Sou th . It h as tw ice th e va lu e of soybean s or cotton
an d th r ee t im es th e va lu e of tobacco , wh ea t , or cor n .
In 1984 , an est im ated billion cubic feet of r oundwoodtim ber pr oducts— saw logs, veneer logs, pu lpwood , fuelwood , and other r ou nd pr odu cts
— w er e har vested fr om the
for ests in the Sou th . Over 5 bill ion cubic feet of th is vo lum e cam e fr om softw ood spec ies, pr im ar i ly sou ther n pine ,
and near ly bill ion cub ic feet cam e fr om a var iety of
hardwood spec ies. T he value of stand ing tim ber or the tr eesfr om w h ich these pr odu cts w er e cu t in 1984 w as over $3
bill ion ,b i ll ion fo r softw oods and b i llion for
hardwoods. Th is am oun t , the stum page value ,r epresents the
value that landow ner s r eceived from the sale of tim ber .
When the value added fr om har vesting the tim ber and tr anspor t ing i t to r ail sidings, concen tr at ion yards, or other localpo in ts of delivery is inc luded , the value of r ou ndwood tim
ber ou tpu t in the Sou th w as billion in 1984 . T he valueof softwood pr oducts w as appr oxim ately billion ,
that
of har dw ood p r odu c ts, bil l ion . T he bil l ion of
rou ndwood tim ber pr oducts i n 1984 w as tw ice the valueof soybeans or cotton pr oduced and th r ee tim es the value of
tobacco ,w heat , or cor n cr 0 ps i n the Sou th (al l valu es at
local po in ts of del ivery) . With a few exception s, the valueof the t im ber har vest exceeded the valu e of these cr ops
S tate by S tate as w ell . Com par ed to total pr odu ct ionSou thw ide
, ther e w as $ 1 of r ou ndw ood t im ber ou tpu t for cvery $3 do l lar s of o ther c rop produ ct ion .
Tim ber har vested i n 1984 r anked am on g the top th r eeagr icu ltu r al cr ops in term s of value of pr oduct ion i n al l 12
Sou ther n“
S tates. It w as fi r st in value i n six States
Vir gin ia , Sou th Car o l in a , Geor gia , A labam a ,Mississippi ,
and Lou isian a . In Alabam a , r oundw ood tim ber pr oducts alm ost equaled i n value the to ta l for a l l other cr ops . In the
other five S tates, the value of r ou ndw ood pr odu cts w as
equ ivalen t to two - fifths to th r ee- fifths of other cr 0 p values.
5 . Em p loym en t an d i n com e i n th e for est i n du str ies i n
the Sou th exceed those in other m ajo r m an u fa ctu r i n g
in du str ies.
Althou gh the indu str ial base of ind iv idual S tates var iesacr oss the Sou th , for est indu str ies r epr esen t a leading secto r in near ly a l l States. For est indu str ies r ank fir st or second in im port an ce am ong m ajor in dustry gr oups i n m ost
S tates in the Sou th .
Forests and fo r est industr ies ar e c lear ly of gr eat im por tanceto the econom y and soc iety of t he Sou th . It is also c learthat they have been in cr easin g in im por tance in r ecen t
decades.
6 . T h e p r esen t econ om i c im por tan ce of for ests in th e
Sou th r eflects a g r ea t ach ievem en t i n th e h i stor y of
for estr y— th e r egener a tion an d gr ow th of the secon d an d
th i r d for ests.
In r elat ionsh ip to a l l m an u fac tu r ing i n the Sou th i n 1982 ,
for est industr ies em ployed one ou t of every n ine worker s,paid $ 1 ou t of every $ 10 in w ages and salar ies, and pr oduced $ 1 ou t of every $ 1 1 of value added to the econom y
by m an u factu r ing . Aggr egate employm en t and incom e i n thefor est industr ies acr oss the Sou th exceeded those i n other
m ajo r m anu factu r in g industr ies, such as texti les, appar el ,pr ocessed food , chem icals, electr ic and electr on icequ ipm en t , n on elec tr ica l m ach in er y ,
and tr an spo r tat ionequ ipm en t , inc lud ing sh ips, boats, and air cr aft .
T o the fir st sett ler s in the Sou th the for est w as an unend ingw i lder ness— an obstac le to the u se of the land for cr ops,gr azing , and liv ing space . Bu t i t also prov ided fuel and r awm ater ial for hou ses and fu r n itu re and comm er ce . Thu s, asthe popu lat ion gr ew an d the need for tim ber pr odu cts andcr op and gr azing land expanded , incr easing ar eas of for est
land were c lear ed . T he conver sion con tinued un til shor t lyafter Wo r ld War I .
Tim ber har vesting w as not a m ajor factor affecting the forests u n t i l after the C ivil War . Bu t as r ai lr o ads wer e ex
tended in to the vast p ine for ests on the Coastal - P la in , the
technology for saw ing lar ge vo lum es of t im ber w as pu t in topr act ice ; and , as huge m arkets for lum ber developed in theMidwest and Nor theast , tim ber har vesting acceler ated . Fr om
abou t the 1880 ’
s u n t i l the 1920 ’
s, ver y lar ge ar eas wer e
harvested . Som e of th is land w as u sed for cr ops and m uchbigger ar eas for pastu r e . Because of such u se and the uncon
tr olled fir es that bu r n ed over lar ge ar eas each year , on ly a
part of the cu tover lands cam e back to fo rests.
Som e d id , however , and the ear ly 1900 ’
s m arked the beg inn ing of what becam e the Sou th ’
s second for est— the for
est that supplied the wood for the expansion of the pu lp and
paper industr y i n the 1930 ’
s and on in to the 1960’s.
As the second for est w as developin g , changes in land use
began to have m ajor im pacts on the for est situ ation . By the
ear ly 1920 ’
s, the u se of land fo r cr ops and pastu re peakedand star ted to dec l ine . Concer n am on g for est industry and
gover nm en t leader s abou t tim ber supplies and the lack of
r egener ation of lar ge areas of cu tover lands led to ( l ) the developm en t of pr ogr am s of fir e protection ,
techn ical and finan c i a l assistan ce , r esear ch ,
and edu c at ion ; and (2 ) theestablishm en t of m anaged public , indu str y ,
and other pr i
vate for ests. Fir e pr otection and the edu cation al pr ogr am sassociated w ith fir e pr even tion were par ticu lar ly effective ,
and a lar ge par t of the cu tover and id le cropland and pas
tu r e regener ated natu r ally to pine and m ixed pine—hardwoodstands. Resear ch that led to ways to pr otect , r egener ate , and
m anage forests and u ti l ize sou ther n p ine tim ber for pr oducts such as pu lp and p lywood also had m ajor im pacts ont he resou r ce and for est industr ies.
These sam e for ces con tinued to affect the tim ber situationfor sever al decades. T he pr ogr am s of protection , techn icaland fin anc ial assistance , resear ch ,
edu cation,and m an age
m en t of p r ivate and public for ests expanded , som et im es
r apidly , fr om the 1940’
s th rough the 1970 ’
s. T he ar ea of
land used for cr ops and pastu r e con tinu ed to dr op th rou ghthe 1950
’
s, som etim es at r apid r ates, and m uch of th is landregener ated n atu r ally .
Th is com bin at ion of even ts l ed to w hat i s su r ely a gr eatach ievem en t in the h istory of forestry , the r egener ation and
the gr ow th o f the Sou th’
s th ir d fo r est . T h is fo r est i s thesou rce of the wood u sed by the for est indu str ies that ar enow such a impor tant par t of the economy of the Sou th . It
w i l l con tin u e to be the sou r ce of t im ber har vests u n t i lar ound the end of the cen tu ry .
7 . Al thou gh gr ea t p r ogr ess h as been m ade, the si tu a
t ion is ch an g in g . Net an n u a l t im ber gr owth has begu n
to dec l ine.
Although the tim ber situation i n the Sou th has show n gr eatim provem ent , ther e ar e now changes u nderw ay that ar e of
gr eat sign ificance . T he m ost recen t su r veys of for ests conducted by the For est Inven tor y and Analysis r esear ch un itsin the Sou th show that net an nual tim ber gr owth for softwoods and hardwoods, after r isin g for decades, has begunto decl ine .
Ther e ar e fou r m ajor cau ses of the decl ine in softw ood
gr owth . One im port an t fac tor sin ce the 1960 ’
s has been thelack of adequ ate r egener ation of pine stands after har veston lands in other pr ivate owner sh ips. T he n atu r al succession after har vest i n m ost of the pine stands i n the second
and th i r d for ests i s to m ixed har dwoods and p ine o r to
hardwoods. Many of the other pr ivate owner s have beenaccepting whatever spec ies n atu re provides. As a r esu lt , thelatest cycle of for est su r veys show s a 30 to 50 -
per cen t de
c line i n the n um ber s of pine sapl ings on these owner sh ips.
Th is dec line has been going on long enough to be r efl ected
in net annual grow th .
A second facto r acting tor educe net annual softwood growthis an incr ease in vo lum e of m or tal ity and cu ll trees. Overthe last 10 year s, for exam ple , ann ual pine m ortal ity in theSou th has abou t doubled . Rou gh ly 15 per cen t of the gr ossannual gr owth of pine is now lost to m or tality , com par ed to
9 per cen t 10 year s ago . Much of th is increase in m or tal itycan be attr ibuted to epidem ics of pine bark beetles. Suppres
sion of over topped tr ees becau se of incr easing stand densi ty has been another im por tant factor . Much of the incr easein cu ll vo lum e is attr ibu table to increasing stand age .
T he th ir d im por tan t factor affect ing net ann ual softwoodgr owth has been a dr op in r ad ial gr ow th on n atu r al standsin the Piedm on t and Mou n ta in r egion s of Geor gia , Sou th
Caro lina ,Nor th Car o l in a and Vir gin ia . In these r egion s,
aver age ann ual r ad ial pine gr ow th“
has been som e 20 to 30
per cen t lower du r ing the last 10 year s than i n the precedingl O-
year per iod . There i s also evidence of dec l ine on the
Coastal Plain .
T he fou rth factor , affecting bo th har dwood and softwood net
annual gr ow th , has been the con ver sion of tim ber land tocr opland and pastu re and u r ban or other non tim ber uses.
Since the ear ly 1960 ’
s, the ar ea of tim ber land in the Sou thhas declined from 197 m i ll ion acr es to 182 m ill ion . Appr oxi
m ately one- th ird of the loss can be attr ibu ted to the conversion of hardwood bottom lands to cropland , par t icu lar ly in theMississippi Delta . Most of the loss, however , w as fr ompine stands in other pr ivate ow ner sh ips.
All of these factor s affecting net ann u al gr ow th ar e the r e
su lt of for ces not easi ly o r qu ick ly ch an ged . And even
when they are changed , i t w i ll take tim e for the effects to
show as a m easu r able incr ease in net ann ual grow th . T he
effects of r egen er at ion after h ar vest on the o ther p r i vate
owner sh ips, for exam ple ,w ou ld not show up for a decade
or so ; i t wou ld take that long for the tr ees to r each 5 inches
i n d iam eter at br east he ight , . the m in im um tree size used

in m easur ing net an nu al gr ow th . T hu s i t is inevitable that therecen t tr ends w ill con tinue for a wh ile . Onl y tim e an d lar geincr eases i n cu r r en t m an agem ent pr ogram s, espec ially the r egener ation pr ogr am s, can tu r n these tr ends ar ound so that
net annual gr ow th is r ising again .
8. T im ber r em oval s have been r isin g r ap idly becau se of
in cr eased h a r vests. For softwoods, r em ova ls exceed n et
an n u a l gr ow th over la r ge a r eas i n th e Sou th .
Du r ing the last tw o and a half decades, t im ber r em ovals inthe Sou th have incr eased very r apidly to m eet the Nation ’
s
'
expanding needs for w ood products. As a resu lt of incr easedrem ovals and decl ines in gr ow th , softwood t imber r em ovals ar e now above net annu al gr ow th over lar ge ar eas in the
Sou th . Net ann ual har dwood gr ow th is sti ll aboverem ovals, bu t the tr ends ar e conver ging .
As w ith net an nual gr ow th , the longr u n tr ends in t im ber'
r e
movals ar e the r esu lt of for ces that ar e not easily or qu icklychanged . Thus the tr ends in tim ber r em ovals ar e also likelyto per sist for a tim e .
9 . T h e b ase p r ojec t i on s i n th is stu dy sh ow t im ber
r em ova ls r isin g above n et an n u a l gr owth an d i n ven tor ies decl in in g
— in the 1 990 ’s for softwoods an d beyon d
2000 for h ar dwoods. Softwood n et an n u a l gr ow th is in
cr easin g aga i n by 2000 ; h ar dwood gr ow th , by 2020 .
T he base pr ojection s in th is study— the pr ojection s that r eflect the consen su s judgm en t of the techn ical exper ts i nvolved abou t the m ost likely fu tur e changes in dem and and
supp ly determ in an ts— show that the tr en ds i n net an nu algr ow th and r em ovals do per sist . Net ann ual gr owth of soft
woods dec lines un til the ear ly 1990 ’
s, and that for har d
woods un t i l after 20 10 . Beyond those tim es, net ann ualgr ow th r ises again .
T he increases i n net annual tim ber gr ow th r esu lt fr om a levelof investm ents in m an agem en t that is m uch above that oftoday . By 2030 , the ar ea i n p ine plan tation s i s m o r e than
doubled ; lar ge ar eas of m ixed p ine—har dwoods and uplandhar dwoods ar e con ver ted to p ine . Plan t ing or conver sion of
these ar eas to pine w ou l d r equ ir e additional investm en ts onpr ivate lands of billion , w ith m ost of the investm en t c ccum
'
ng w ith in the next 15 year s. Substan tial incr eases in timber yields and in the in tensity of m an agem en t ar e al so as
sumed for lar ge ar eas of pine plan tations. Thu s, the basepr oject ions of net annual grow th r eflect what wou ld happeni f ther e continues to be m ajor progr ess i n forestry in theSou th and con tinued expansion in the techn ical and fi n anc ial assistance , pr otection , r esear ch , education , and m anage
m en t pr ogr am s that have br ou gh t abou t the im pr oved forestry situ ation i n the past .
10 . T he base p r oject ion s of r esou r ce ch an ge m ean that
th e Sou th is faci n g a fu tu r e of r isi n g stum page an d
r ou n dwood p r odu ct p r i ces, m u ch lower r a tes of gr owth
i n t im ber h a r vests, an d d ecl i n es i n em p l oym en t an d
wages an d sa l a r ies i n th e for est in dust r i es.
Softwood pu lpwood stum page pr ices rn both r egion s ri se at
abou t the sam e r ate as saw/t im ber pr ices i n the ear ly par tof the pr oject ion per iod u n ti l 2000 . They in cr ease slow lydu r ing the next two decades, and by the decade fr om 2020
to 2030 , pu lpwood stum page pr ices ar e r isin g at a per
cen t annual r ate i n the Sou th Cen tr al r egion .
Har dwood stum page pr ices show m uch differ en t tr ends fr omthose for softwoods. Pri ces for har dw oods dec line i n boththe sou thern r egion s u n ti l 2000 . They show sim i lar tr endsin the nor ther n r egion s. These tr ends r eflect the avai labilityof lar ge and incr easing inven tor ies of hardw ood tim ber . Af
Timber r em oval s con tinue to ri se thr ough the projection per iod although at a slower r ate than du r ing the last couple of
decades. Softwood r em oval s r i se above net annual gr ow thand softw ood tim ber inven tori es decr ease fr om the m id
1980’
s un til near 2000 , when a slow incr ease begins. At the
end of the projection per iod , in ven tor ies ar e still below the
level r eached i n 1985 . Har dwood in ven tori es ri se until 2000 ,
then fall throu gh the r est of the pr oject ion per iod when r e
m ovals ar e above n et an nu al grow th .
These base pr ojections show the d ir ection th in gs ar ehead ing— w hat is l ikely i f cur r en t expectation s abou t econom ic gr ow th , changes i n tim ber land ar ea , the establishm en t of pine plan tation s, m an agem en t in vestm en ts, and al l
the other factor s that affect tim ber dem and and supply ar e
realized . T he pr ojected chan ges ar e not inevitable , however .
T he pr esen t ou tlook can be changed , and ther e ar e importan t r eason s to do so .
Am ong the econom ic consequences of the projected chan gesin the tim ber r esou r ce ar e ri sing“
r eal pr ices of stumpage ,
i .e . , pri ces net of inflation or deflation . T he incr eases in thetwo sou ther n r egions ar e lar gest in the ear ly
‘
par t of the pr o
jection per i od , the t im e in wh ich softwood tim ber inven tor ies ar e dec lin in g . Between 1984 and 2000 , for exam ple ,
softwood sawt im ber pr ices ri se at an annu al r ate of per
cen t in the Sou th Cen tr al r egion . After 2000 , as in ven tor ies begin to ri se , the r ates of incr ease slow down . Between
2020 and 2030 , incr eases in the Sou th Cen tr al r egion average on ly per cen t per year .

ter 2000 , as tim ber r em ovals r ise above net annual gr owthand inven tor ies begin to decr ease , pr ices begin to r ise . In
the last two decades of the pr ojec t ion per iod , pr ices ar e
go ing up at a r ate of per cen t per year i n the Sou th Cen
tr al region and per cen t in the Sou theast .
These pr ojected pr ices inc r eases for hardwood saw tim berstumpage ar e for the sm aller , lower quality hardwood timber that com poses the bu lk of the har dwood
“
tim berin ven tor ies. T he stum page pr ice ou tlook for '
larger hardwood
tim ber of pr efer r ed spec ies, such as select wh ite and red
oak ,ash , and black cher ry ,
is d iffer en t . Rem ovals of h igherqu al ity saw tim ber of m ost p r efer r ed spec ies h ave beenc lose to or above net annu al gr ow th in r ecen t decades, and
there have been lar ge inc reases in stumpage pr ices in thepast . Th is situ ation seem s l ikely to con tinue .
Incr easin g stum page pr ices ar e r eflected i n the pr ices ofsaw logs, pu l pwood , and the other r ound pr odu cts u sed by
the for est industr ies. These r oundwood pr ice incr eases, wh ichr epr esen t incr eased costs to the pr ocessing indu str ies, arepassed on in the pr ices of produ cts, espec ially lum ber andSoftwood plywood ,
wher e stum page r epr esents a lar ge par tof the product cost .
Rising r eal pr ices of stum page and r oundw ood pr oducts haveimpor tan t econom ic , soc ial , and envir onm en tal im plications. In the h igh ly com petitive m arkets in wh ich near ly al l
t im ber pr oducts ar e so ld , r ising pr ices ac t to con str a indem ands. As a r esu lt , softwood tim ber supp lies (har vests)r ise slow ly over the pr ojec tion per iod , m u ch below the i n
creases since the ear ly 1960 ’
s. Hardwood har vests r ise i n thefir st thr ee decades; then they level off and begin to dec line .
T he incr eases i n har vests ar e too sm al l to sustain employm en t in the for est indu stri es in the South . Rising pr oductivityper em ployee over r ides the in cr eases in har vests. After1990 , employm en t drops; by 2030 total employm en t i n the
lum ber and wood pr oducts and pu lp and paper products in
dustr ies w i ll be 2 1 per cen t , som e people , below the
employm en t level of 1984 . To tal wages and salar ies alsostar t to decl ine after 2000 .
T he drop in em ploymen t and w ages and salar ies in the forest industr ies is of gr eat econ '
om ic sign ificance in theSouth . T he effects of r educed employm en t w il l be m u ltiplied as they spread thr ou gh the tr ade , ser vice , tr anspor
tation, and other par ts of the sou ther n econom y that
provide goods and ser vices to the for estry sector . It i s cu r
ren tly estim ated , for exam ple , that a loss of one job i n thelum ber and wood pr oducts industry wou ld r esu lt i n a de
c r ease of jobs th r ou ghou t the econom y i n Sou ther n
States; a one- job loss in the pu lp and paper pr oducts industry wou ld bemu ltiplied tim es as other par ts of the econom y wer e affected .
Rising r eal pr ices have other im port an t im p l ication s. Ex
por ts of m ost tim ber pr oducts ar e determ ined lar gely by thecapability of dom est ic pr oducer s to com pete on a pr ice basis w ith pr oducer s i n other coun tr ies. Consequen tly , r isingreal pr ices w i ll constr ain tim ber expor t poten tial .
Consum er s— and th is inc ludes everyone i n ou r soc iety— w illbe adver sely affected by r isin g real pr ices. Hom e buyer sw ill bear m ost of the increased costs both in term s of h igherpr ices and in adver se im pacts on the num ber , size , and quali ty of dwelling un its bu ilt .
Rising pr ices and the assoc iated econom ic and envi r onm en
tal im pacts ar e not inevitable . They sim ply show what is
likely to happen i f cur r en t expectations abou t the fu tu r e timber situation m ater ial ize . T he developm ent of the Sou th ’
s
fou rt h for est can be m an aged , and the for est can take al
m ost any form desir ed .
1 1 . Ther e a r e ver y la r ge oppor tu n i t ies to in cr ease for
est p r od u ct ivi ty i n th e Sou th an d to su sta i n the fo r est
indu str ies an d em p loym en t an d wages an d sa la r ies.
As stumpage and tim ber pr oduct pr ices r ise r elative to other
m ater ials, use of substitu te products such as concr ete , steel ,alum inum , and plastic w i ll in cr ease above the levels thatwou ld have otherw ise pr eva i led . T he m in ing , industr ialpr ocessing , and pow er gener ation assoc iated w ith increaseduse of tim ber substitu tes w i ll r esu lt in m or e ai r and water
po l lu tion . Thu s, as tim ber pr ices go up , en vironm en talcosts w i ll also r ise .
Ther e ar e now econom ic oppor tu n ities (those that wou ldyield 4 per cent or m or e net of inflation or deflation ) to i ncrease net annual tim ber gr ow th on 70 m i ll ion acres of t im
ber land ' in the Sou th . If u ti l ized , these -oppo r tu n ities wou ld ,
in tim e , incr ease net annua l tim ber gr ow th by bill ioncubic feet a year , a volum e equal to 57 per cen t of cu r r en tnet annu al softwood gr ow th . Most of the oppor tu n ities toincr ease tim ber grow th on tim ber land in the Sou th billion ou t of billion cubic feet— ar e on the other pr i vate
owner sh ips. Ther e ar e ,however , oppo r tu n it ies on a l l
owner sh ips, includ ing billion cubic feet on for est industry ow ner sh ips. T he r elatively sm al l poten t ial on the publ ic owner sh ips bill ion cub ic feet— lar gely r eflects thefact that little tim ber land i s publ ic ly ow ned in the Sou th .

Just over half billion cubic feet— o f the oppor tun itiesto in cr ease tim ber gr ow th on t im ber lan d ar e i n the Sou th
Centr al r egion . Ther e ar e econom ic oppo r tu n it ies to incr ease net an nual tim ber gr ow th by over bill ion cubicfeet a year on tim ber land in every State in the Sou th ex
cept Oklahom a and Sou th Car o l ina . T he lar gest poten tialbill ion cubic feet— is i n Alabam a .
Near ly half of the econom ic oppor tun ities to increase net annual tim ber grow th ar e in stands of the upland har dw oodtypes. Most of the r em ainder is on n atu r al pine and m ixedp ine— hardwood stands. Near ly half of the oppor tu n ities forincr easing gr ow th invo lve r egener ating (w ith site pr epar ation )nonstocked or cu tover sites. Most of the r est in volve c i
ther the har vest in g an d r egen er at ion of m atu r e stan ds o r
stocking con tr o l , c lean in g , or r elease of stocked stands.
T he total add ition al in vestm en t r equ ir ed to u ti lize the eco
nom ic oppor tun ities to incr ease net ann u al gr ow th on t im
ber land i s bil l ion . T he lar gest par t of th is, abou tthree - fi fths, wou ld fund r egener ation w ith site pr epar ation .
Although the needed in vestm en ts ar e lar ge , the r ate of r e
tu r n cm the investm en ts w ou ld equ al or exceed 4 per cen t ,wh ich approxim ates the longr un r ate of r etu r n on in vestm en ts in the pr ivate sector of the US . econom y .
Ther e ar e add it ional oppor tun ities to incr ease net annu al timber grow th i n the Sou th . Ther e ar e cu r r en tly 22 m i ll ionacr es of cr opland and pastu r e that w ou ld yield h igher r atesof r etu r n to the ow ner s i f plan ted to pine . Th is inc ludesnearly 8 m i l lion acr es of h igh ly er od ible cr op land that i ssu itable for gr ow ing tr ees. In a sen se , a l l of these 22 m i l
lion acr es ar e m ar ginal for cr op and pastu re u se . If plan tedto pine , they wou ld pr oduce abou t billion cubic feet ofnet annu al timber gr ow th .
Abou t th r ee - fifths of the oppor tu n it ies on m ar g in al andh igh ly erod ible cr opland and pastu r e ar e in the Sou th Cen
tr al r eg ion . Ther e ar e substan tial oppor tun it ies in al l Sou th
er n States. In m ost States the poten t ial is above 100 m i llion cubic feet a year .
In m aking the base pr ojections, i t w as assum ed that a littleover a th i r d of the Oppo r tu n it ies to in cr ease n et an nu a lgr ow th w ou ld be im plem en ted over the pr ojection per iod .
However , the investm en ts have not yet been m ade , and the
oppor tun ities as descr ibed do exist at th is tim e .
In total , net an nual tim ber gr ow th i n the Sou th cou ld be increased by billion cubic feet i f al l the econom ic oppor
tu n i t ies wer e u t il ized and the m ar ginal and h igh ly er od iblec r op land and pastu r e w er e p lan ted to p ine . Th is wou ld
near ly double cu r r en t n et an nu al softwood gr ow th, and i t i s
enou gh tim ber to su stain the for est indu stri es in the Sou thand em p loym en t and wages and salar ies.
Acheiving the fu ll poten tial for gr eater tim ber gr ow th wou ldalso have im portant nation al im pacts. Consum er s wou ld payless for tim ber pr oducts.
12 . Ach ievi n g th e econ om ic poten t ia l to gr ow a fou r th
for est in th e Sou th w i l l r equ i r e l ar ge in cr eases in
p r otection , tech n i ca l an d fi n an c ia l assistan ce, r esea r ch ,
edu cat ion , an d m an agem en t p r ogr am s.
In the past , soc iety“
has taken action to in cr ease t im ber supplies by supplem en ting m arket for ces, although the l im itedresponse of supplies to pri ce changes h as not been expl ic
i tly r ecogn ized as the r eason i n any of the for estr y
legislat ion , and in on ly a l im ited way i n the for estr y
Ach ievin g the poten tia l in cr ease i n t im ber gr ow th wou ldhave very positive benefi ts for the Sou th . It w ou ld help theregion ’
s gener al econom y becau se the effects of em ploym en t i n the fo r estr y secto r ar e m u lt ip l ied i n the tr ade ,
ser vice , and tr an spo r tat ion sector s, and other par ts of the
economy . Cu r r en tly i t i s estim ated that total em ploym en tis increased by abou t jobs for each job i n the lum ber andwood products industry and by jobs for each job in thepu lp and paper pr oducts indu stry .
There is c lear ly the econom ic poten tial to gr ow a fou r th for
est in the Sou th that can su sta in m uch lar ger tim ber ha'rvests. Bu t on ly a lim ited par t of th is poten tial is l ikely to berealized . Th is m ay be due in lar ge par t to m arket imper fection s i n the for estry sector . T he fr ee m arket system that so
effectively gu ides the pr odu ction of m ost goods and ser
v ices w orks i h on ly , a l im ited w ay i n in cr easin g t im bersupplies. For exam ple , the best available data show that for
each l o-
per cen t in cr ease i n stum page pr ices, ther e i s lessthan a 4-
per cen t incr ease in supplies.
Th is lim ited r espon se to pr ice chan ges lar gely r eflects thechar acter istics of pr ivate t im ber ow ner s other than for estindu str ies. Var i ou s stud ies have shown that these ow ner s
have w idely d iver se object ives and att itudes; lim ited techn ical know ledge of the w ays tim ber stands shou ld bem ar keted , har vested , r egener ated , and m an aged ; and varying w illingness and capac ity to m ake investm en ts i n m anagem en t pr actices. Ow ner sh ip tenur es ar e typical ly shor t , andm ost owner s ar e i n the o lder age gr oups. Thu s, for tim ber ,wher e the tim e betw een investm en ts and har vest i s long ,
ther e is the likel ihood that d ir ect benefi ts, such as incom efrom t im ber sales, w il l not accr ue to m any cu r r en t own er s.

liter atu r e . Near ly al l fo r estry legislation— the public pr ogr am s of pr o tec t ion , techn ica l and finan c ia l assistan ce ,
r esear ch , education , and public owner sh ip— and m any for
est indu stry progr am s ar e i n fact soc ietal adju stm en ts designed to supplem ent the m arket system and incr ease t imber suppl ies.
By any standar d , these po licies and progr am s have worked .
They have r esu lted in the r egen er ation of the second and
th ird for ests in the Sou th and m ade possible the development and growth of the forest indu stri es, wh ich now constitu te such an im por tan t par t of the Sou th ’
s econom i c base .
T he pr ogr am s have also been effi c ien t— the benefits exceedthe cost— and they have been effective i n i ncr easing the incom e of tim ber land ow ner s. If fu tu r e em ploym en t and incom e i n the for est indu stri es ar e to be su sta ined , act ionm ust be taken to expand both the public and pr ivate pr ogr am s that ar e effective i n incr easing tim ber supplies. Th iscan be done in a var iety of ways, bu t i t m ust be done if the
tim ber r esou r ce in the Sou th is to m ain tain i ts impor tan tplace in the econom y of the Sou th .


Approx im ately 40 per cen t of the tim ber land i n the Un itedStates is located in the Sou th . Th is area inc ludes the Statesof Virg in ia ,
Nor th Caro lina , Sou th Car o lina , Geor gia , and
Flo ri da in the Sou theast r egion and the States of Tennessee ,
Alabam a , Mississipp i , Arkansas, Lou isi ana , Okl ahom a , and
Texas in the Sou th Cen tr al r egion (fron tisp iece) . T he termtim ber land refer s to fo r ested land that is capable of pr o
duc ing at least 20 cubic feet of wood per acre annu al ly and
that has not been w ithdr awn fr om u ti l izat ion for tim ber bylaw or adm inistr ative r egu lation . In m any Sou ther n States,timber land cover s over 50 per cen t of the land area .
In 1976 , the latest year for wh ich com par able n ationw idedata are avai lable ,
the Sou th suppor ted over 20 per cen t of
the softwood gr ow in g stock and over 40 per cent of thehardwood gr ow ing stock in the Un ited S tates (USDA For estSer vice Th is in ven to ry accoun ted for half of thenet annual gr owth for both softwoods and har dwoods n ationw ide . Net annu al gr ow th is affected by both tim ber land ar ea
and the gr ow th and m or tality of ind ividual tr ees. T he
favor able position of the Sou th com par ed to other regions,par ticu lar ly for softwood gr owth , r eflects i ts extensive ar ea
of pr oductive t im ber land and i ts r elat ively you ng stock of
grow ing tr ees .
T he diver sity of i ts tim ber resou r ce has m ade the Sou th a
m ajo r pr oducer of v ir tual ly a l l forest products. In 1984 , the
12 Sou ther n S tates accou n ted for one—th ir d of the soft
wood lum ber and over two - fifths of the hardwood lum berproduced nation a lly . These States also accou n ted for c loseto half of nat ion a l pr oduc t ion of har dw ood and softw ood
plywood and two - th ir ds of the woodpu lp (USDC Bu r eauof the Cen su s
Sou thern for ests provide m any benefits i n add ition to t im ber .
They play a vital ro le in the social , cu ltu r al , and econom icl ife o f the peop le i n ‘
the Sou th . In 19 85 , they p r odu ced
near ly 8 m i llion tons of for age '
for dom estic livestock and
w ild life . They protect w ater sheds on over half the land ar ea
in the Sou th , and are the sou r ce of water for m uch of the
dom estic and industr ial use . They pr ovide habitat for near lyal l w ild life and fish spec ies. They also pr ovide sites for r ecreat ion for tens of m illions of people : For example , accor d
ing to the 1985 Nation al Su r vey of Fish in g ,Hun ting
, and
Wi ld life - Assoc iated Recr eation (USDI Fish and Wi ld lifeService and USDC Bu r eau of the Cen su s over 70
per cen t of the popu lation in the Sou th ( 16 year s of age and
o lder ) part ic ipate in w i ld l ife- r elated activities such as
obser v ing , photogr aph ing , or feed ing w ild l ife . Near lyone- th ird of the popu lation engage in hun ting or fish ing . Asubstan tial propor t ion of these act ivit ies occu r s ontim ber land .
For producer s and consum er s in the Sou th , tim ber ou tpu tfr om sou ther n for ests has im por tan t im pl ications for local ,S tate ,
and region al econom ies. Because the Sou th is a m a
jor pr oducer of tim ber pr oducts, changes in i ts tim ber ou tpu t have im plications fo r the n ation al econom y as wel l .
In fiscal year 1986 , the value of act ivities such as hu n t ing ,fi sh ing , natu r e study , camping , picn icking , h iking ,
w ater
Spo r ts, and other r ecr eat ion al activities on n at ion al for estlands in the Sou th w as estim ated to be over $ 124 m i ll ion .
These lands r epr esen t on ly 6 per cen t of the total t im ber landarea in the Sou th . Millions of acr es of forest i ndustry and
other pr ivate t im ber land ar e also being m an aged for w i ldlife and pr ofitably leased for hun ting . T he fish and w ild life ,
for age , water , and r ecr eation benefi ts associated w ith tim berland ar e also im po r tan t to S tate and local econom ies . For
exam ple , hun ter s and fisherm en spend m oney in localcomm un ities for food , lodging , tr anspor tation , and fees for
access to hun tin g and fish ing areas. In 1980 , appr oxim ately$750 m i llion was spen t on these item s i n the 12 Sou ther nS tates by hu n ter s of for est - r elated spec ies su ch as deer ,
w ild tu rkey , r accoon , and squ ir r el (USDI Fish and Wi ldlifeSer vice and USDC Bu reau of the Cen su s Another$85 m i ll ion was expended by tr ou t fisherm en
,who depend
on the cold - w ater stream s comm on ly found on tim ber land .
These figu res do not inc lude the substan tial am ou nts spen tby spor t ing en thu siasts for num er ous other item s r angingfrom spec ia lized equ ipm en t to m agazine subscr iptions.
Of al l the benefits associ ated w ith fo r ests, however , tim beris usual ly consider ed the m ost im por tan t in econom icterm s. Tim ber gener ates incom e and em ploym en t th rou ghou t the Sou th
’
s econom y , not on ly in jobs d irectly r elatedto tim ber m anagem en t , har vesting , and processing of pr im ary wood products
-
bu t also in the m anufactu r e of al l pr oducts con tain ing wood or wood fiber , and in who lesale and
r etai l tr ade , tr an spor tation , and constr u ction . Vir tually cv
er y hou seho ld and business com es in to da i ly con tact w ithtim ber pr oducts in bu i ld ing m ater ials, fu r n itu re , cabinets,paper , con tainer s and boxes, and thou sands of other th ingsm ade in w ho le o r i n par t from wood .

Sou ther n for ests are valuable for m anypu rposes. For example , they provide hab itatfo r w i l d l ife , pr odu ce for age for gr az ingan im a ls, pr otect w ater sheds, and pr ovidesites for ou tdoor recreation . Of al l the
benefits assoc iated w ith forests, the
product ion of t im ber is usua l ly consideredthe most impor tan t in econom ic term s.
1 1

Locat ion by Region an d Sta te
T he Sou th has over 182 m i ll ion acr es of timber land , covering 55 per cen t of the total land ar ea fr om the Atlan tic coast
to the easter n sections of Texas and Oklahom a . Tim ber landis the pr edom inan t land use , encom passing 2 to 3 ou t of cvery 5 ac r es in a l l of the Sou ther n S tates inc lud ing easter nTexas and Oklahom a .
Com pa r ison W i th C r oplan d an d Pastu r e
Sou thw ide , ther e are m o r e acr es in tim ber land than inc r op land and pastu r e com bin ed (app . table T he 85
m i ll ion acr es of tim ber land in the Sou theast r epr esen t 58per cen t of the r egion ’
s land ar ea and m o r e than tw ice thear ea of cropland and pastu re . In the Sou th Cen tr al r egion ,
inc lud in g easter n for ested par ts of Texas and Oklahom a ,
there are 65 m il lion acr es of cr opland and pastu r e and 97
m i llion acr es of tim ber land . Tim ber land r epr esen ts 53 per
cen t of that r egion ’
s total land area .
Major For est Man agem en t Types
T he Sou th’
s tim ber land is com posed of a d iver sity of for est
m an agem en t types (fig . Eyr e 1980 ,USDA Forest Ser
vice Approxim ately one- th ird of the area is cover edby pine types— 4 1 m i ll ion acr es in natu r a l pine stands and
another 2 1 m i llion acr es in plan ted pine . Loblo lly pine is byfar the m ost abundan t spec ies . It occu r s i n natu r a l standsi n m ost section s of the Coastal P lain and Piedm on t , wher ei t has fr equen tly seeded
'
i n on idle cr opland and pastu r e .
Loblolly pine has also been exten sively plan ted th r oughou tth is ar ea .
Shor tleaf pine , a comm on assoc iate of loblo lly ,becom es
an in c r easin gly im por tan t com ponen t o f stands at h igherelevations, espec ially in the Cum ber land plateau , the sou th
er n Appalach ians, and theOu ach ita Mou n tain s of wester nArkansas and sou theaster n Oklahom a .
Lon gleaf p ine w as on ce the pr edom in an t spec ies on thelower Coastal P la in . It w as par t icu lar ly w el l adapted fo rsu r viv ing fr equen t w i ldfir es. Advances in fir e con tr o ld im in ished the im po r tance of th is com pet it ive advan tage .
In tensive logg ing , land clear ing , and the establishm en t ofloblo l -l -y and slash pine plan tat ion s have gr eatly r educed the
ar ea of longleaf pine over the year s. T he lon gleaf—slashpine assoc iation is now a dom in an t for est type pr im ar ily insou theaster n Geor gia and nor ther n Flor ida .
Figu r e— Ar ea o f tim ber land in the Sou th , by region and
for est m anagem en t type , 1985
T he Sou theast region has 34 m il l ion acr es i n p lan ted and
n atu r al p ine for est types, 6 m i l l ion acr es m o r e than the
Sou th Cen tr al r egion . Geor gia and Flor ida ,i n par t icu lar ,
have h igh concen tr ations of pine plan tations, and al l States
in the r egion except Vir gin ia have over one- fou r th of theirtim ber land ar ea in natu r al p ine types.
Mixed pine—hardwood fo r est types tend to be lar gercom ponent of the for est r esou r ce in the South Cen tr al r egion than in the Sou theast . Close to two - th ir ds of the
Acr oss m uch of the Sou th , pine stands r epr esen t a tr ansitional stage in n atu r al succession to hardwood for est types.
Mixed pine—har dwood stands occupy 27 m illion acr es, or 15
per cen t of the tim ber land in the Sou th . Typ ical ly , these
stands ar e 50 per cen t or more oak and 25 to 50 per cen t p ine .
Comm on assoc iations inc lude upland oak —Shor tleaf pine ondry sites in the footh ills and plateaus, m ixed har dwoodloblol ly pine on m o ist sites, and scr ub oak— lon gleaf p inein the sandh il ls of the Caro linas, Geor gia , and Flor ida .

m ixed pine—h ardwood acr eage in the Sou th is found i n theSou th Centr al region . Th is for est type cover s appr oxim atelyone- fifth of the tim ber land in the States of Alabam a ,
Mississippi , Arkansas, and Texas.
Hardwood for est types occupy over half the timber land ar ea
in the Sou th , 93 m ill ion acr es. These for est types are espe
c ial ly impor tan t for w i ldl i fe '
habi tat . T wo - th ir ds of th is ar eais c lassified as upland hardwoods and one - th ird as
bottom land hardwoods. A typical upland hardwood association inc ludes oaks and h ickori es, w ith gum , yellow -
poplar ,elm , and m aple . Although i t occu r s th roughou t m ost of theSou th , the oak—h ickory assoc iation predom inates in h igh landareas, espec ially the sou ther n Appalach ian s and OzarkOu ach ita Moun tains. H igh - qu ality sites i n these r egions,such as coves and m o ist flats, suppor t stands of comm erc ial ly valu able spec ies of r ed and wh ite oaks and yellowpoplar .
Upland hardwoods cover abou t a th ir d of the t im ber land i nboth the Sou theast and the Sou th Cen tr al r egion s. Uplandhardwoods constitu te over half of the tim ber land inTennessee ,
Vir ginia , and Oklahom a , and over a th ir d i nAlabam a , Nor th Car o lina , and Arkansas.
Bottom land har dwoods are fou nd on the alluvial floodplainsof theMississipp i and other m ajor r iver s i n the Sou th .
Oak—gum—c ypr ess is the typical assoc iation on these sites,
w ith such spec ies as w i llow ,water , lau r el , sw amp
chestnu t , and cher rybark oaks; water tupelo ; blackgum and
sweetgum ; and bal dcypr ess. Ther e ar e 30 m i llion acr es of
bottom land hardwoods in the Sou th , abou t 17 per cent of thetim ber land . Over half of these bottom land for ests ar e located i n the S tates of Lou isian a , Flo r ida , Geor gia , and
Mississippi .
Own er sh i p Ch a r acter ist ics
Pr iva te Own er sh ips— Ninety per cen t of the tim ber land inthe Sou th i s pr ivately owned (fi g . For est indu str iesho ld 42 m i llion acr es, sligh tly less than a fou r th of the to
tal area . Th is category includes compan ies or ind ividuals thatoper ate pr im ary wood - using p lan ts and either own o r ho lda long - term lease (leased for at least one ro tation ) ontim ber land. For est industr ies own substan tial acr eages in al l
Sou ther n S tates, bu t they ow n a pr opor t ionately lar gershare of the timber land in Flor ida and Geor gia in the Sou theast r egron and Arkansas, Lou isiana , and Texas i n theSou th Cen tr al r egion .
Figu r e— Ar ea of tim ber land i n the Sou th , by r eg ion and
for est owner sh ip , 1985
13
T wo - th irds of the pine plantations i n the Sou th ar e found on
for est industry lands. In the sou theast r egion , over 40 percen t of the 19 m i ll ion acr es owned by
,
for est indu stry ar e in
plan ted pine . Bottom land har dwoods con stitu te another 20
per cen t : In the Sou th Cen tr a l r egion , natu r al pine types andpine plan tations each“
r epr esen t abou t one- fifth of the 24 m i llion acr es of industry ho ld ings.Mixed pine—har dwood and
upland hardwoods cover a lar ger shar e of industry holdingsher e than in the Sou theast r egion .
Appr oxim ately 122 m i ll ionacr es of tim ber land are ow ned
by other pr ivate ind ividu als or o r gan izations. T he“
other
pr ivate” category is extr em ely diver se and includes farm er s,al l other ind iv idu als, and corpor ation s that do not also run
wood -
pr ocessin g plan ts. Corpor ate owner s inc lude a var ietyof or gan izations ho ld in g t im ber land pr oper ty as an
investm en t , r ecreational area , or for other pu rposes, such as
u til ity com pan ies, r ailroads, r ealty firm s, hu nting ‘
c lubs, insu r an ce compan ies, and banks.

Am ong other pr ivate ow ner s, far m er s own 40 m i ll ion acr es
of t im ber lan d ; cor por ate ow n er s, 16 m i l l ion ac r es; an d
other pr ivate ind iv idu als, 66 m ill ion acr es . These acr eagesr epr esen t appr oxim ately one- fou r th , one
- ten th , and one
th ir d ,r espectively , of al l the tim ber land in the Sou th .
Ow ner sh ip of t im ber land by in d iv idu a ls oper at in g farm s
tends to be concen tr ated in No r th Car ol in a , Geor gia ,and
Vir gin ia in the Sou theast r egion and Alabam a , Mississippi ,and Tennessee in the Sou th Cen tr al r egion . A th ir d of al l
the cor po r ate- ow n ed t im ber lan d i s fou nd i n Flo r ida an d
Lou isiana . T he pr edom inan t for est m an agem en t type on tim
ber land ow ned by other pr i vate ow ner s is upland har dwoods.
Bo ttom land har dw oods, however , r epr esen t a r elat ivelylar ge shar e of the tim ber land held by corpor ate ow ner s.
Many of the pr ivate ow ner sh ips in the Sou th repr esen t sm allindiv idu al ho ldings. Accor d ing to a 197 8 su r vey of pr ivateow ner sh ips in the Sou th (B ir ch and other s 92 per
cen t of the ow ner sh ip u n its w er e less than 100 acr es . Thesesm all landho ld ings, accou n ted for on ly a fi fth of the tim berlan d ar ea ,
however . Ow ner sh ips i n the West Gu lf(Arkansas, Lou isian a , Texas, and Oklahom a) and the East
Gu lf (Geor g ia , Flor ida) , w her e industry or corpor ate tr acts
ar e m or e comm on , tended to be lar ger than in the Sou th Atlan tic (Vir gin ia , Nor th Car o lin a , and Sou th Car ol in a) andCen tr al Gu lf States (Tennessee , Alabam a
,and Mississippi) ,
where ther e w ere h igher concen tr at ions of farm ow ner sh ips.
Over half of the timber land in the West Gu lf and East Gu lfw as in un its lar ger than ac res, w her eas on ly a th irdof the tim ber land in the Sou th Atlan tic and Cen tr al Gu lf w asi n un its th is lar ge .
Pu blic Own er sh i ps—O n ly 10 per cen t of the tim ber land i nthe Sou th i s public ly ow ned . These lands in clude the na
t ion al for ests, S tate for ests and w ild life r efu ges, and other
Feder al , State , cou n ty , or m u n ic ipal lands . Nation al for estsoccupy m i llion acr es, abou t 60 per cen t of the public lyow ned land . Over h alf of the n at ional forest tim ber land islocated i n Arkan sas , V ir gin ia , Mississipp i , and No r thCarol in a . In the Sou theast r egion , n ation al for est lan ds consist pr im ar ily of upland hardw ood fo r est types in the Appalachian Moun tains . Natur al pine is the pr edom in an t for est typeon n at ion al for est lands in the Sou th Cen tr al r egion , al
though up lan d har dwoods and m ixed pin e— har dw oods alsocover lar ge ar eas.
Sou thw ide , over 7 m ill ion acr es of tim ber land are ow ned
by other public en t it ies . These lands tend to be n atu r al p ineor upland hardwoods i n the Sou theast . In the Sou th Ce
‘
n
tr al r egion ,lar ge ar eas of bottom land hardw oods as well as
up land har dwoods ar e in these o ther public ow ner sh ips.
Est im a tes of th e Vo lum e an d Va lu e of Rou n dw oodT im ber P r odu cts
T he t im ber har vested fr om the tim ber lan d of the Sou th isp r ocessed in it ial ly as logs, bo lts, an d other r ou n dwood
pr oducts. Most r ou ndw ood pr oduction com es fr om gr ow ingstock on tim ber land , althou gh th is supply i s supplem en tedby the r em ova l of dead , r ou gh , r otten , and sm a l l tr ees,
stum ps, tops, and l im bs, and trees fr om fencer ow s, u rbanar eas, and other non t im ber l and sou r ces. In 1984 ,
an estim ated billion cubic feet of r oundwood tim ber pr oductsw er e har vested in the Sou th . Over 5 billion cubic feet of th isvo lum e cam e fr om softw ood spec ies, pr im ar i ly sou ther n
pine ,and c lose to bill ion cubic feet cam e fr om a var i
ety of har dwood spec ies (app . table
T he va lu e at local po in ts of de l ivery of ther ou ndwood— saw logs, veneer logs,
pu l pwood , fuelw ood , po les, pi l ing , fence
posts and other r ound products—pr oduced
in the Sou th in 1984 w as b i l l ion .
T he value of stand in g tim ber or the tr ees from wh ich theseproducts were cu t w as over $3 billion , billion for softwoods and $400 m i l l ion for har dw oods (app . tableTh is am ou n t , the stum page valu e , r epr esen ts the value thatlandow ner s r ece ived for the sale of their tim ber . When the
value added from har vesting the tim ber and tr an spor t ing i tto r ail sid ings, concen tr ation yar ds, or other local points ofdelivery is inc luded , the value of r ou n dw ood tim ber ou tpu tin the Sou th exceeded $6 billion in 1984 . Del iver ed val
ues wer e appr ox im ately billion for softwood productsand billion for hardw ood pr oducts (app . table

Rela tive Im por tan ce of P r od u cts
T he total rou ndwood har vest in the Sou th r epr esen ts a d i
ver sity of products for both industr ial and con sumer u se .
Tr ees of su ffic ien t d iam eter to be cu t in to lum ber ar e harvested and used m ostly as saw logs. Sm aller and lower gr adetr ees ar e the pr im ar y sou r ce of the pu lpwood that pu lp ,
paper , and paper boar d m i lls pr ocess in to wood fiber .
Together , saw logs and pu lpwood accoun ted for 80 per cent
of total r oundwood production in 1984 .
For both softwoods and h ar dwoods, m o r e tim ber i s harvested for pu lpwood than for any other pr odu ct (fig .
T he Sou th pr oduced appr oxim ately billion cubic feetof softwood pu lpwood and 1 billion cubic feet of hardwoodpu lpwood in 1984 , represen t in g 42 per cen t of to talroundwood pr oduction . Saw logs constitu ted“
37 per cen t of the
roundwood har vest and inc lu ded 2 billion cubic feet of softwoods and 760 m il lion cubic feet of hardwoods.
Figu r e— Vo lum e of roundwood ou tpu t i n the Sou th by
pr oduct and spec ies gr oup , 1984
15
Aver age per - unit p r ices fo r saw logs, however , r u n near ly 70per cen t h igher than pu lpwood at loca l
lpo i n ts of del iver y
and over th r ee tim es the stum page pr ice for pu lpwood . As
the h igher valued pr oduct , saw logs c laim ed the lar ger shar eof the value of rou ndwood ou tpu t . Saw logs accou n ted for44 per cen t of the del ivered va lue for a l l roundwood pr oducts and an even lar ger pr opor tion of the stum page value .
At local po in ts of del ivery , softwood saw logs had an estim ated value of bill ion and har dwood saw logs, $600m illion . T he cor r espond ing stumpage values wer e billion for softwood saw logs and $225 m il lion for hardwoodsaw logs. Pu lpwood production w as valued at billionfor softwoods and $425 m ill ion fo r hardwoods at local “
dclivery po in ts, and $540 m i llion for softwoods and $56 m i llion for hardwoods as stand ing tim ber .
Veneer logs have an even h igher '
per- unit value than
saw logs. Lar ger , h igher qu ality logs and bolts are needed to
produce sheets of veneer for use in fu r n itu r e , cabinets, andplywood . Veneer logs constitu ted on ly 9 per cen t of the .vo l
um e bu t approxim ately 19 per cen t of the stum page valueand 13 per cen t of the del iver ed valu e of r ou ndwood ou tpu t
in the Sou th in 1984 . Th is pr oduction consisted of 6 10 m i llion cubic feet of softwoods and 60 m i ll ion cubic feet ofhardwoods, w ith estim ated del iver ed values of $750 m i llion and $70 m i ll ion , r espectively .
Other industr ial products inc lude poles and pi ling (alm ost exc lusively fr om softwood tim ber ) and fenceposts, cooper agelogs and bo lts, m ine tim ber s, sh ingle bo lts, bo lts u sed forhand les, wood tu r n ings, panel pr oducts, and a var iety ofother item s, and chem ical wood . Som e 1 10 m i l l ion cubicfeet of softwoods and 17 m i l lion cubic feet of hardwoodswere har vested for other industr ial pr oducts in 1984 . Al
though im por tant locally and for spec ific needs, these pr od
nets accou n ted for lessthan 2 per cen t of total r oundwoodpr oduction . Co llectively , they added $ 160 m illion to the total deliver ed value for a l l pr oducts, and m ost of th is am oun twas con tr ibu ted by po les and pi ling .
Fuelwood for industr ial and r esiden tial use , another m ajorproduct fr om souther n tim ber lands, increased dr am aticallyin impor tance du r ing r ecen t per iods when pr ices for m iner al fuels r ose r apidly . In 1984 ,
an estim ated 10 per cen t oftotal r ou ndwood production in the Sou th wen t forfu elwood . Th is am ou n t in c lu ded 55 m i l l ion cubic feet ofsoftwoods and 680 m ill ion cubic feet of har dwoods. Thesequ an tities r epr esen ted over one - fou r th of the h ar dw ood har
vest bu t on ly 1 per cen t of th e softwood har vest .

Most r oundwood fuelw ood i s u sed fo r r esidential heatin gbecause indu str ies gener al ly r ely on wood p lan t bypr odu ctsr ather than roundwood for fuel . Un like industr ial products,a substan tial am oun t of fuelw ood is self- cu t by hou seho ldsand com es fr om nongr ow in g stock sou r ces that do no t
otherw ise pr odu ce indu str ial t im ber (Skog and Watter son
1983 ,Rud is In addition , the m arket fo r fuelwood
is extrem ely d iver sified . Pri ces vary -w idely , depend ing uponthe vendor , spec ies m ix , season ing ,
tim e of year , qu an titypu r chased ,
availability of self- cu t w ood , po in t of delivery ,
and num er ou s other factor s.
Fuelwood is an im por tan t use of har dw oods, bu t softwoodsdom inate the m arket for indu str ial r ou ndwood in the Sou th .
Sou ther n pines supplied tw ice the volum e of pu lpwood and
th r ee tim es the vo lum e of saw logs and veneer logs compar ed to hardwood spec ies.
In 1984 ,softwood industr ial pr oducts had a stum page value
of bill ion and a value at local del iver y po in ts ofbill ion . These am ounts const itu ted 90 per cen t of the stump
age value and 80 per cen t of the del ivered value of al l industr ial r oundw ood ou tpu t i n the Sou th i n that year .
T he pr edom inance of softw oods in the value of industr ialr oundw ood r eflects not on ly the lar ger qu an t it ies of softwoods har vested bu t also the h igher propo r tion of the
har dwood har vest that goes in to lower valued pr oducts suchas pu lpwood . Of har dwood indu str ial r ou ndwood , 54
per cen t w as c lassified as pu lpwood in 1984 , com par ed w ith44 per cen t for softwoods. Pr ices for har dw ood r oundw ood
pr odu c ts a lso tend i n gener a l to be low er th an the sam e
pr oducts from softwoods. Per—unit delivered pr ices for pinesaw logs, veneer logs, and pu lpwood often r un 40 per cen t
h igher than cor r espond ing pr ices for har dw oods, and thepr ice d iffer ential for stand ing tim ber is substan t ial ly gr eater(see app . tables It shou ld be noted , however ,that the har dwood r esour ce i n -
the Sou th-
is extr em elyd iver se . Pr ices for scar ce or h igh - qu ality har dwoods m ay besever al t im es the aver age pr ices for m ixed har dw ood spe
c ies of woods- r un qu ality .
Relat ive Im por tan ce of Reg ions an d StatesIn gener al , r ou ndw ood ou tpu t fr om ind iv idu al r egions andStates r eflects the distr ibution of tim ber land and forest m an
agemen t types acr oss the Sotl th . In 1984 , States in the
Sou theast r egion pr oduced bill ion cubic feet of indu stri al pr odu cts and fuelwood , abou t 48 per cen t of the
16
Sou thw i de total . These pr odu cts had a stum page value of
bill ion and a value at local po in ts of delivery ofbill ion . T he Sou th Cen tr al r egion accoun ted for bill ioncubic feet of ou tpu t , 52 per cen t of total pr odu ct ion , w itha value of $ 1 .6 billion as stand in g tim ber and billiondel iver ed .
Although softwoods dom in ated indu str ial production in bothr egion s, the Sou th Cen tr al r egion der ived a sl ightly h igherpr opor tion of i ts tota l ou tpu t fr om h ardw ood spec ies thandid the Sou theast region . In par ticu lar , the
_
Sou th Centr al r egion pr odu ced 600 m il lion cubic feet of hardwoodpu lpwood , over 60 per cen t of the Sou th ’
s tota l for th ispr oduct . T he Sou theast r egion led in the pr oduction of soft
w ood pu lpwood w ith bill ion cubic feet , com pared w ithbill ion cubic feet fo r the Sou th Cen tr al r egion . Saw
log ou tpu t fo l low ed a sim i lar patter n . Hardwood saw logsfr om the Sou th Centr al region totalled 430 m i ll ion cubicfeet , com pared w ith 3 30 m i l l ion cubic feet fr om the Sou th
east r egion . Both r egions har vested over a billion cubic feetof softwood saw logs, w ith m ar ginal ly h igher ou tpu t i n theSou th Cen tr al r egion . For hardwood veneer logs, the Sou theast region was the pr im ary pr oducer ; for p ine veneer logs,the Sou th Cen tr al r egion .
Softwood saw logs and veneer logs together wer e the sour ce
of abou t two - th ir ds of the r etu r n s to landowner s forr ou ndwood pr odu cts in both the Sou theast and Sou th Centr al r egions in 1984 . In the Sou theast r egion , th is stum page value am oun ted to $760 m i llion for softwood saw logsand another $ 170 m il l ion for softwood veneer logs. T he
Sou th Cen tr al region had a h igher pr opor t ion of stumpagevalues i n veneer logs, w ith $380 m i llion attr ibu ted to ve
neer logs and $750 m i ll ion to saw logs. Har dwood saw logsand veneer logs added to stum page values another $ 1 10 m i ll ion in the Sou theast r egion and $ 150 m i llion i n the Sou thCen tr al region .
Pu lpwood r epr esen ted 23 per cen t of the total stum pagevalue i n the Sou theast region and 16 per cen t in the Sou th
Cen tr al r egion , bu t i t held a m u ch larger shar e of thevalue of r oundwood pr oducts after har vesting and tr an sportation to local delivery poin ts (fig . Deliver ed val ues forpu lpwood in the Sou theast r egion w er e $950 m i ll ion (3 2per cen t of the to tal value of pr odu ction ) and in the Sou thCen tr al r egion , $9 10 m i llion (29 per cen t of total ou tpu t) .
Softw oods accou n ted for 8 1 per cen t of th is va lu e i n theSou theast r egion and 73 per cen t i n the Sou th Cen tr al region .

T he im por tan ce of tim ber land and tim ber pr odu cts i n theSou th
’
s economy i s eviden t when the val ue of r oundw ood
tim ber pr oduced is com par ed w ith the val u e of other cr opsfr om agr icu ltu r al lan ds. T he bill ion of r ou ndwood
timber produ cts ou tpu t in 1984 w as tw ice the value ofsoybean or cotton pr oduct ion and thr ee t im es the value of
tobacco , wheat , or cor n cr ops i n the Sou th in that year
al l values at local po in ts of delivery (fi g . With a few
exceptions, the tim ber har vest exceeded the valu e of these
crops for ind iv idu al States as w ell . Sou thw i de , ther e was $ 1
of r ou ndwood tim ber ou tpu t for ever y $3 dollar s of othercrop production (app . table
T he tim ber har vested in 1984 r anked am on g the top thr eecr ops i n term s of va lue of pr odu ction in al l 12 Sou ther n
States (app . table and fig . It w as fir st in valuein six States— Vir gini a , Sou th Car ol ina ,
Geor gia , Alabam a,
Mississippi , and Lou isian a . In Alabam a , r oundw ood t im
ber produ cts alm ost equ aled in value the total for al l othercr ops. In the other fi ve States, the value of r oundw ood prod
ucts w as equ ivalen t to two—fi fths to thr ee- fi fths of other cr op
values. Tim ber r anked second beh ind som e of the lar gestind ividu al S tate cr ops i n the Sou th— wheat i n Oklahom a
,
cotton i n Texas, and tobacco in Nor th Car ol in a . It r anked
th ir d in Flor ida , exceeded on ly by fr u it and nu t pr odu ct ionand the har vest of comm er cial vegetables. Soybeans andr ice i n Arkansas and soybeans and tobacco in Ten n esseegener ated the h ighest cr op pr odu ction values in those S tatesbu t r oundw ood tim ber w as a close th ir d .
T he va lue of r ou ndw ood t im ber pr oduc ts
pr oduced in the Sou th i n 1984 w as tw icethat of the soybean s or cotton pr oduced , an d
three times that of tobacco ,wheat , or cor n .
T here w as $ 1 wor th of timber pr oduced forevery $3 wort h of other cr ops pr oduced .

Figu r e— Value at local po in ts of delivery of r oundwood
tim ber pr oducts and the h ighest valued agr icu ltu r al cr ops inthe Sou th , 1984
Fi gu r e— Rankin g of the value of r ou ndwood tim ber pr odu cts w ith m ajo r agr icu ltu r a l c r ops in the Sou th ,
1984
19

Scope of For est In du st r y Man u factu r i n g
T he value of r oundwood tim ber pr odu cts i s one m easu r e Of
tim ber ’s con tr ibu tion to the econom y of the Sou th .
Paym en ts to landown er s for stum page and to Oper ator s for
har vesting and hau l in g r oundwood to pr ocessing sitesr epr esen t incom e and jobs d ir ectly attr ibu tableto the for estr esou r ce .
Tim ber suppor ts incom e and em ploym en t i n m any other seetor s Of the econom y as well . Roundwood pr oducts pr ov ider aw m ater ial for a d iver sified ar r ay of m anu factu r in g industr ies. Som e indu str ies, su ch as sawm i l ls and paper m i l ls,pr ocess r ou ndwood d i r ectly in to lum ber , n ew spr in t , orother m arketable comm od ities. Other industr ies pu r chasethese pr im ary wood pr oducts to m anu factu r e m or e h igh lyfin ished goods, such as m i llwork , cabinets, fur n itu r e , pr e
fabr icated bu i ld ings, pal lets, con tainer s, boxes, bags, andh igh - gr ade paper pr odu cts. Tim ber i s also essen t ial for pr odu cer s of gum and wood chem ica ls and wood -
pr eser vin gfirms. Incom e and em ploym en t in al l of these industri es depend on the tim ber r esou r ce;
T he 1982 Cen su s Of Man u factu r es pu blished by the US .
Bu r eau Of the Censu s— the m ost r ecen t sou r ce of com pr e
hen sive data— pr ovides som e m easu r es of the con tri but ionOf these for est industr ies to the econom y Of the Sou th in
term s of the num ber of t im ber - based m anufactu r ing establ ishm en ts, the value of their sh ipm en ts and the value added
to their pr oducts in the m anu factu r ing pr ocess, and the emp loym en t and w ages an d sa lar ies they pr ovide . For est
industr ies, as the term i s used her e , en compasses al l or
par t of fou r m ain industr y gr oups u nder the Standar d Industr ial Classificati on system u sed by the Bu r eau Of the Cen
sus in co llecting data on m anu factu r i n g : lum ber and woodpr odu cts, fu r n itu r e and fixtu r es, paper and al l ied pr odu cts,and gum and wood chem i cal s. T he Censu s data r epr esen t thetotal act ivity Of for est indu stry establishm en ts, even thoughtim ber i s on ly one - Of the r aw m ater ials they use . These datado not m easur e the econom ic im por tance of for est industr ies as pr odu cer s and con sum er s of goods and ser vices fornonm anu -facturi ng sector s Of the econom y ,
includ in g wholesale and r etai l tr ade , constr uction , tr an spor tation , comm un ication s, ener gy , fin ance and bank ing ; nor do they m easur ethe add it ion al production induced thr ou ghou t the econom yby the incom e gener ated fr om jobs in for est industri es.
Con t r i bu t ion s to th e Econ om y Sou thw ide
T he mu l tipl ier s c ited for incom e and em ploymen t are T ype II m u l tipl iersreflecting di rect , ind ir ect , and induced effects, comp i led in Fl ick ( 1986unpubL) .
In 1982 there wer e near ly establishm en ts engaged insom e aspect of tim ber - based m an u factu r ing i n the Sou th .
Th is num ber r epr esen ts near ly one ou t of every five m anu
factu ri ng establishm ents. For est industr i es em ployedpeople and paid billion annu ally i n w ages and sal ari es.
Their product sh ipm en ts wer e val ued at over $49 bill ion .
T he value added by m anu factu r e am ou n ted to near ly $20bill ion . Value added i s a net m easu r e of an industry ’
s con
tr ibu t ion to pr odu ction in the econom y i n that the valu e Ofthe m ater ials r eceived fr om other firm s and u sed i n the
m anu fac tu r ing pr ocess is subtr acted fr om the value of thepr odu cts sh ipped .
In add ition to provid in g in com e and emp loym en t in timberbased m anu factu r in g , for est industri es suppor t jobs i n thosesector s Of the econom y that supply for est pr odu ct firm sw ith theser vices and m ater ials they need fo r pr odu ction ,
su ch as m ach iner y , chem ica ls, an d en er gy “
. S im i lar ly ,
wages an d salar ies paid to em ployees of for est pr oduct firm sand associated indu stri es ar e spent in par t to buy gr ocer ies,c loth ing , househo ld fu r n ish ings, and other goods and ser
vices in the comm un ity , ther eby stim u lating incom e and employm en t in those sector s. Inpu t
—ou tpu t m odels for national ,r egion al , S tate , or local econom ies ar e Often u sed to generate m easu r es Of th is in ter dependen ce am on g sector s Of aneconom y . Mu ltipl ier s from these m odels ind icate the impact Of a one
- u n it i ncr ease (or decr ease) in ou tpu t , em ploym en t , or incom e (wages and salari es) i n one sector on the
sector s fr om wh ich i t pur chases ser vices and m ater ials andon al l sector s thr oughou t the economy as hou seho ld incom eand consum ption incr eases.
State- level inpu t—o u tpu t m odels developed in r ecen t year s
for States in the Sou th show a r an ge Of m u ltipl ier s for forest indu str ies r eflect in g the m any d iffer ences am ong individu al State econom ies (app . table T he m ed ian valuefor State- level incom e m u ltiplier s in both lum ber and woodpr oducts m anu factu r in g and in pu lp an d paper m anufactu r
ing is appr oxim ately These m u ltip lier s ind icate thata $ 1 in crease in w ages and salar ies in the lum ber and woodpr oducts sector or the pu lp and paper pr oducts sector wou ldr esu lt in an expan sion of w ages and salar ies for al l sector sStatew ide of Med ian values Of emp loymen t m u ltipl ier s fr om ind ividual State m odels i n the Sou th ar e ar ound

for lum ber and wood products and for pu lp,
and pa
per pr oducts. Regional m u ltiplier s for forest indu stry incom e
and employm en t ar e pr obably h igher , since a gr eater degree of in ter dependence am on g sector s exists w ith in a re
gional econom y than With in a State .
Although the con tr ibu tion s can not be m easu r ed pr ec isely ,
i t is clear that for est industr ies hold a very im por tan t placein the sou ther n econom y th r ou gh the people they em p loy ,
the incom e they gener ate ,and the value Of the pr oducts they
m ake .
Com pa r ison Wi th Other Man u factu r in g
In r elation sh ip to al l m anu factu r ing in the Sou th , for est in
dustr ies in 1982 employed one ou t of every n ine worker s,paid $ 1 ou t Of every $ 10 i n w ages and salar ies, and pr oduced $ 1 ou t of every $ 1 1 of value added to the econom y
by m anufactu r ing (app . table Aggr egate em p loym en tand incom e fr om for est indu str ies ac r oss the Sou th ex
ceeded those in other m ajor m anufactu r ing indu str ies, suchas textiles, appar el , pr ocessed food , chem icals, electr ic and
electr on ic equ ipm en t , nonelec tr ical m ach inery , and tr an s
por tation equ ipm en t inc lud ing sh ips, boats, and air cr aft (fig .
In the Sou th , forest industr ies employed oneou t of every n ine worker s, pa id $ 1 ou t Ofevery $ 10 in wages and salar ies, and
produced $ 1 ou t of every $ 1 1 of valueadded to the economy by m anufactu r ing in1982 .
Fi gu r e— Em p loym en t and w ages and sa lar ies i n
m an u factu r i n g in the Sou th , by i ndu stry , 1982
2 1
Although the indu str ial base Of in d iv idu al S tates var iesacr oss the Sou th , for est industri es r epr esen t a lead in g sector i h near ly al l States. In 1982 , for est indu str ies r ankedfou r th or h igher i n impor tance am ong m ajor industry gr oupsfor al l States in the Sou th except Flor ida , Texas, and Oklahom a (fig .
For est indu stri es wer e the lead ing manu factu r ing indu str y inMississippi and Ar kansas, pr ovid ing appr oxim ately 18 percen t Of al l jobs and w ages and salar ies i n those States. In
Alabam a , the appar el indu stry em p loyed m or e peop le , bu t
for est industri es collectively had the h ighest payr oll am ongm anu factu r in g gr oups and gener ated $ 1 ou t of every $5 Ofvalue added by m anufactu r ing in the State ’
s econom y .
In Geor gia and Nor th Car olin a , texti le m i lls wer e theleading m anufactu ri ng industry . For est indu str ies, however ,ou tr anked al l other non texti le m anufactu r ing in jobs,incom e , and value added , except for employm en t i n appar elm anu factu r in g i n Geor gia and the value added by tobaccoproducts in Nor th Car o l ina .
In Vir gin ia and Tennessee , chem ical m anufactu r ing is a m a
jor industry . In Vir gin ia , however , for est industr i es wer e stillthe lead in g em ployer , and , i n Tennessee as well as Vir gin ia ,
on ly the chem ical industry paid ou t m or e than for est industri es i h w ages and salar ies.
Even in those States wher e tim ber repr esen ts a r elativelysm aller shar e Of the total land ar ea and m anufactu ri ng base,
for est indu str ies m ake a sign ifican t con tr ibu t ion to the
economy , especially for those sections of a State wher e timber land is concen tr ated . In 1982 , for est industr ies in Texas
Fi gu r e— Ranking of for est indu stry w ages and salar ies w ith other m anufactu r ing indu str ies in the Sou th ,
1982
Forest industri es wer e fou r th i n im port ance am ong them anufactu r ing sector s in the S tates of Lou isiana and Sou th
Car ol ina . Lou isiana i s a m ajor pr oducer of tr an spor tationequ ipm en t , petr o leum pr oducts, chem icals, and foodpr oducts. Sou th Car o lina has lar ge texti le , appar el , chem ical ,and nonelectr ical m ach inery industr ies. For est indu str ies,however , r epr esen ted over 10 per cen t of al l m anufactu r ingemploym en t and payr ol ls in Lou isiana and appr oxim ately8 per cen t in Sou th Car o lin a in 1982 .

gener ated c lose to a bil l ion do l lar s annu al ly i n w ages andsalar ies, the th ird h ighest total for any “
State i n the Sou th .
Tim ber - based m anu factu r in g in Flor ida and Oklahom a to
gether added another th r ee - qu ar ter s of a bill ion dol lar s toState and region al incom es.
Rela t ive Im por tan ce of For est In du str ies by T ype
T he gr eat d iver sity Of for est pr oducts m an ufactu r ed in the
Sou th m akes i t d ifficu lt to categor ize for est industr ies bytype . It is often u sefu l , how ever , to gr oup for est indu str iesin to those that pr oduce pr oducts m adeof so l id wood andthose that use pr im ar i ly wood fiber s. This basic d ivisionh igh l igh ts d iffer en ces betw een indu str ies in the size and
qu ality of the tim ber r equ ir ed and the degr ee of pr ocessinginvolved . Manufactu r ing of wood fur n itu r e is another indu stry that has som ew hat spec ial ized r aw m ater ial needs, product ion
'
pr ocesses, and m ar kets.
T he lum ber an d so l id wood pr odu c ts in du str y in c ludeslogger s, sawm i lls, and plan ing m ills that pr oduce the in itialr aw m ater ial as r ou ndwood and pr ocess i t d ir ectly in to m arketable goods, such as lum ber , d im ension stock , and
floor in g . It also in c ludes m anu factu r er s of other pr odu cts
fr om r oundwood , such as plywood and veneer , goods m anufactu r ed fr om pr im ar y pr odu cts su ch as m i l lw ork , na iledboxes, pallets, wood bu ild ings, and m obile hom es. Th issegm en t Of the industry also
.
inc ludes pr ocessor s of gum sand wood chem icals, and wood -
pr eser ving firms.
Wood fu r n itur e m anufactu r i ng includes al l - wood fur n itur efor hou sehold or Office u se , upho lster ed fu r n itu r e on wood
fr am es, shelv ing , par tition s, and other wood fixtu r es.
T he m anufactu r e of wood fiber o r pu lp and paper pr oducts
involves an in itial stage of pr ocessing , wher e m i lls pr oducewoodpu lp and r econ stitu te i t in to paper , paper boar d ,
bu i lding paper , or bu ild ing boar d ; and secondar y stages i n wh ichth is m ater ia l i s conver ted in to a w ide r an ge Of fin ishedproducts, su ch as fine- gr ade paper s, stationer y , con tainer s,bags, and boxes.
T he r elative im por tan ce of each Of these sector s of for est
industry in the Sou th and w ith in regions and States is showni n appendix table
Over half of the for est industry establishm en ts i nthe Sou th i n 1982 wer e loggin g con tr actor s, sawm i l ls, or
Figu r e— Distr ibu tion of employm en t am ong for est
industry sector s in the Sou th , 1982
23
p lan in g m i l ls; two—th ir ds of th is num ber “
w er e loggingcon tr actor s. Manu factu r er s of other so l id wood pr oducts,such as plywood , veneer , m il lwork , wood bu i ld ings, andcon tainer s, and wood -
pr eser ving firm s, constitu ted another
one- qu ar ter of the establishm en ts. Twelve per cen t of the forest industry establishm en ts m anufactur ed fu r n itu r e Or fixtu resfr om wood . Conver ted paper and paper boar d pr oducts accoun ted fo r 8 per cen t of the establishm en ts. Pu lp , paper ,
paperboar d , and bu ilding paper and boar d m il ls r epr esentedon ly 1 per cen t of the total . These per cen tages r eflect thechar acter of d iffer en t industr ies m or e than their im por tancein the Sou th . Logging and sawm i ll oper ation s, for exampletend to be sm aller and m or e d isper sed than pu lp and pa
per m an u factu r in g , wh ich r equ ir es lar ge- scale , cap italin tensive p lan ts.
In term s of em ploym en t , the lum ber and wood pr oducts l ndustry is the m ost im por tan t sector of the for est industr ies(fig . In 1982 , th is sector had worker s, or 42
per cen t of the total em ploym en t i n for est indu stry m anu fac
tu r ing in the Sou th . T he pu lp and paper products industryaccoun ted for em ployees, 32 per cen t Of the total .T he wood fur n itur e sector had employees, 26 percen t of total em ploym en t .

Pu lp and paper m an ufactu r er s, however , led the other for
est indu str ies i n w ages and salar ies (fi g . as well asvalue of sh ipm en ts an d va lu e added by m an u factu r e . In
1982 , they con tr ibu ted n ear ly $ 4 bi l l ion i n w ages an d
salar ies,bill ion i n sh ipm en ts, and bill ion i n
value added . These figu r es r epr esen ted 46 per cen t of theSou thw i de total for w ages and salar ies, 53 per cen t of thesh ipm ents, and 54 per cen t of the value added i n the for est
industri es. Over half of these am ounts is attri bu table to pr o
Logg ing and sawm ills
P lywood , wood
products
Wood furn iture
Figu r e — D istr ibu tion of w ages and salar ies am on gfor est i ndu str y sector s in the Sou th , 1982
T he pu lp and paper pr oducts industry is the
sou rce of near ly half of the wages and
salari es and a l itt le over hal f of the value ofsh ipmen ts an d value added by m an ufactu rein al l the for est industri es in the Sou th .
24
duct ion and in itial processin g Of woodpu lp at pu lp , paper ,
and paper boar d m i lls.
Value added by w ood fu r n itu r e i n 1982 w as bill ionwh ich inc ludes $ 1 .6 billion fr om wood hou seho ld fu r n itu r e ,
billion from upho lster ed fum i tu r e on wood fr am es, and
$400 m i llion from wood Office fu r n itu r e , shelving , par t itions, and other fixtures.
Rela t i ve Im por ta n ce of For est In du st r ies by Region an d
State
T he Sou th Cen tr al r egion c laim ed a sl ightly lar ger shar e ofemploym en t , w ages and sal ari es, an d val ue added fr om log
ging and sawm i lls and fr om p lywood , ven eer , and other
solid wood pr oducts. In add ition , thetotal value of sh ipm en ts and value added by m anu factu r in g fr om pu lp , paper ,
and paper boar d m i lls i s estim ated to be abou t 25 per cen th igher than production fr om m i l ls i n the Sou theast r egion .
For both region s, pu lp , paper and paperboar d m i lls led otherforest industry sector s i n value added to the econom y i n
1982 . For every $ 100 of value added by for est pr odu cts in
the Sou th Cen tr al r egion , $35 was attri bu table to the m i llsector ; $24 to conver ted paper and paperboard products; $ 18to plywood , ven eer , and other solid wood pr oducts; $ 13 to
Lum ber and wood pr oducts and wood fu r n itu r e accou n ted
for 29 per cen t and 16 per cen t of the to tal value added ,
r espectively . Of the billion i n value added fr om so l idwood pr oducts, billion cam e fr om sawm i lls and p laning m i lls; billion fr om m i llwork , softwood and har d
wood plywood , and cabinets; $890 m i ll ion fr om loggin goper ation s; $860 m i ll ion fr om pr efabr icated w ood bu i ld ingsand m obile hom es; $820 m i l lion fr om wood pr eser ving ,par t icleboar d , and m iscel laneous wood products; $250 m i llion fr om boxes and pallets; and $ 140 m i ll ion fr om gum
and w ood chem icals.
In 1982 the Sou theast had appr oxim ately establishmen ts pr oviding jobs i n the for est indu str ies.
T he Sou th Cen tr al r egion had for est indu stryestablishm en ts em ploying people . T he pr ofi les offor est industr ies w ith in the Sou theast and Sou th Cen tr alr egions ar e qu ite sim i lar w ith the exception of wood
fur n itu r e m anu factu ri ng , w h ich is concen tr ated in theSou theast r egion . Appr oxim ately one w orker ou t of everyfou r i n for est indu str ies i n the Sou th w as em p loyed i nfu r n itu r e m anu factu r ing . Seven ty per cen t of th is employm entwas in the Sou theast r egion , 60 per cen t in Nor th Car o linaand Vir gin ia alone .

26
21 958
Figu r e— Em ploym en t i n for est indu str ies in the Sou th , 1947 - 82
Figu r e L IZ —Wages and salar ies i n for est indu str ies in the Sou th , 1947 - 82

T he gr owth of for est industry m anu factu r in g i n the Sou thover the past 4 decades has r el ied pr im ar i ly on the piner esour ce . Softwood tim ber r em ovals near ly doubled between1962 and 1984 (fig . wh i le the num ber of acres inpine plantations near ly tri pled . Har dwood r em ovals rem ainedr elatively constant un ti l the late 1970 ’
s, when fuelwood dem ands in cr eased shar p ly w ith the r ise i n o i l pr ices andtechno logical developm ents expanded the use of har dwoods
for woodpu l p and for str uctu r al panels, such as wafer boar d
and or ien ted str and boar d .
Figu r e — Tim ber r em ovals i n the Sou th , softwoods
and har dwoods, 1952—84
T he Im po r tan ce of th e Sou th for Fo r est In d u str ies
Nationw ide
27
T he grow th of new sector s of for est indu stry in the Sou thhas enhanced i ts position as a m ajor produ cer of for est pr odnots on a national scale . T he Sou th leads the West , Nor thCen tr al , and Nor theast i n the value added fr om the m anu
factu re of both so l id wood and wood - fiber pr odu cts as wellas wood fu r n itu r e . In 1982 , the Sou ther n States accoun ted
for 57 per cen t of total em p loym en t i n the m anufactu r e of
wood fur n itu re and fixtu r es, 40 per cen t of em ploym en t inthe m anufactu r e of lum ber and other so l id wood pr oducts,and 29 per cen t of employm en t in pu lp , paper , and paper
boar d m anufactu r ing . Employm en t , w ages and salar ies, valueof sh ipm en ts, and value added by m anu factu r e for al l for
est industr ies in the Sou th r epr esen ted appr oxim ately one
th ir d of for est indu stry activities nat ionw ide .
In summ ation ,i t is c lear that for ests and for est indu str ies
ar e of gr eat im por tance to the economy and soc iety of the
Sou th . It i s also clear that they have been incr easin g inim po r tan ce i n r ecen t decades . Mater ial i n the fo l low in gchapter descr ibes the longr un changes in the for est r esou r ceand the po lic ies and pr ogr am s— fir e pr otection , techn ical andfinanc ial assistance , r esear ch , education , andm anagem en tof pr ivate and public tim ber lands— that have br ou ght the forests in the Sou th to their pr esen t state of pr odu ctivity .

Bir ch , T hom as W . ; Lew is, Dou glas G. ; Ka iser , H . Fr ed . 1982 . T he
pr ivate forest - land ow ner s of the Un ited S tates. Resou r . Bu l l . WO- l .
Wash ington , DC : U .S . Depart men t of Agri cu l tu r e ,Forest Service . 64 p .
Eyr e, F.H . , ed . 1980 . For est cover types of the Un ited States and Can ada .
Wash ington , DC : Soc iety of Am er ican For esters. 148 p .
Rud is, Victor A . 1986 . Dom estic fuelwood use in Lou isian a . In : Sm ith ,Wayne H . , ed . B iom ass ener gy developmen t : Pr oceed ings, 3d ann ua l
sou ther n b iom ass en er gy r esear ch con fer en ce ; 1985 Mar ch 12—14 ;
Ga inesvi l le , FL. New York : Plenum Pr ess: 43—55 .
Skog , Ken n eth E . ; Watter son , Ir en e A . 1983 . Residen tia l fuelw ood use
in the Un ited States 1980—81 . Mad ison , WI : U .S . Depar tm en t of Agr icu l tu re , Forest Ser vice , For est Pr oducts Labor atory . 55 p . append ices.
Sou ther n For est Resou r ce An alysis Com m ittee. 1969 . T he Sou th ’
s th irdfo r est how i t can m eet fu tu r e dem ands . [Pl ace of pub l icat ionunkn ow n ] : Sou thern Forest Resou r ce Analysis Comm ittee . 1 1 1 p .
U.S. Depa r tm en t of Agr i cu l tu r e, For est Ser vi ce. 1982 . Domestic t imberr esou r ces (chapter In : An ana lysis Of the t im ber situat ion in theUn ited States 1952—2030 . For . Resou r . Rep . 23 . Wash ington , DC : U .S.
Depar tm en t Of Agr icu l tu re , For est Service: 1 16—145 .
U.S. Depa r tm en t of Comm er ce, Bu r eau of th e Census. 1985 . Cu r ren t
industr ial r epor ts ser i es: Lum ber pr oduc t ion and m i l l stocksMA24T (84)l ; Softwood plywood MA24H (84)—l ; H ar dwood pl ywood MA24F(84) - l ;
and Pu lp , paper and boa r d MA26A(84) —l . Wash ington , DC : U .S .
Depar tmen t of Comm er ce , Bur eau of the Census.
U .S. Depa r tm en t of the In ter ior , F ish an d Wi ld l ife Ser vice, an d U .S.
Depa r tm en t of Com m er ce, Bu r eau of the Census. 1982 . 1980
Nat ional su r vey Of fish ing , hun ting , and w i ldl ife- associated recreation andState supplem en ts. Wash ington ,
DC : U .S. Depart m en t Of the In ter ior ,Fish and W i ld l ife Service , and U .S. Departm en t of Comm er ce , Bur eau
of the Census.
Fl ick , War r en A . 1986 . Reg iona l aspects of the Sou ther n T im ber Study .
Aubu rn Un iver sity , A labam a . (Unpubl ished r eport subm itted as part of
a Cooper at ive agreem en t w ith U .S . Depar tm en t of Agr icu l tu re , For estSer vice . ) 18 p . [Avai lab le fr om Forest Inven tory and Econom icsResear ch , USDA For est Service , PO . Box 96090 ,
Wash ington , DC
20090 - 6090 ]
U.S. Depar tm en t of the In ter ior , Fish an d W il d l ife Ser vi ce, an d U.S.
Depar tm en t of Comm er ce, Bu r eau of the Census. Pr el im inar y findingsfr om the 1985 national su r vey of fish ing , hun ting , and w i ldl ifeassoc iated recreat ion . [Ava i lab le from Forest Inven tory and Econom icsResear ch , USDA For est Service , PO . Box 96090 ,
Wash ington , DC
20090—6090 ]

T o the fir st settler s i n the Sou th , the for est
was a gr eat unend ing w i ldem ess— i r
str etched fr om the sea to the plains ofcen tr al T exas and Oklahom a . Bu t these
forests provided timber for homes, fu rn iture,
and fuel . T hey also pr ovided a place for
gr azing l ivestock and hab itat for gam e . T he
forests have served the people in the Sou thlong and wel l . And they do so today .
T h e Ch an g i n g For est Resou r ces an d
For est In du st r ies i n th e Sou th

Most of chapter 2 has been abstr acted fr om the fo l low ingr epor ts: Changes in For est Resou r ces and Indu stri es in theSou th by Rober t S . Maxwel l ; Impacts of State Pr ogr am s
on For est Resour ces and Indu str ies in the Sou th by JOhn
C . Bar ber ; Impacts of the National For ests on the For estResou r ces of the Sou th by A . P . Mu stian and Sh ar on
Young ; Impacts Of For est Industr ies on For est Resou r cesin the South
”by Rober t M . Nonnem acher ; “
Impact of For
estry Assoc iations on For est Pr oduct ivity i n the Sou th” byJ . Walter Myer s, Jr . ;
“ Impacts Of Resear ch on For est Re
sou r ces and Industri es i n the Sou th” by H R . Josephson ;“ Grow th Of Sou ther n Higher EducationFor estry Pr ogr am sand Their Impact on the Sou th ’
s Tim ber Resou r ces andIndustri es” by John Gr ay ; Taxes and the Sou ther n Forestby Wi lliam C . S iegel and Clifford A . Hickm an ;
“
Sou ther n
Tim ber Pr ices: A H isto r ica l Per spec tive” by J . MichaelVasievich ; and
“Evaluation of the Effectiveness of Mar ket
Respon ses to Tim ber Scar c ity Pr oblem s by Fr eder ick W .
Cubbage and Richar d W . Haynes.
Fr om the above t itles, al l bu t the S iegel r epor t ar e beingpublished separ ately as append ices to th is study . Copies ar eavai lable fr om USDA For est Ser vice , In form ation and Pub
l ications Ser vices, T - 102 10 , 4 15 Postal Ser vice Bu i ld ing ,
70 1 Loyo la Avenue , New Or leans, LA 70 1 13 .
Form er Secr etar y of Defense Rober t A . Lovett on ce ob
ser ved , Good judgem en t is usually the r esu lt of exper ienceAnd exper ience i s fr equen tly the r esu lt of bad judgem en t .
Hopefu l ly , soc iety can lear n fr om past exper iences. Thathope i s Of gr eat im por tance in for estry because dec ision shave im pacts on people ’
s l ives over long per iods of t im e .
T he dec isions and actions taken a gener ation or m or e ago
have shaped the for est of today . In the sam e w ay , cu r r en t
dec isions and action s w i ll have impor tan t con sequences decades from now . Histor ical study can pr ovide insights on thepo licies and progr am s that have been effective in the past .
Su rely dec isions m ade w ith such know ledge w ill be w iserand the needs of fu tur e gener ations better ser ved .

T he Sou th’
s fir st for est str etched fr om the Atlan tic'
Coast
to the plains of cen tr al Texas and Okl ahom a . T he for est was
as r ich i n var iety as in exten t . Ther e wer e longleaf andslash pine on the Coastal Plain ; loblo lly and Short leaf pineand oak on the Piedm on t ; oak , h ickory , and chestnu t in the
m ountains; and oak , gum , and cypr ess in the bottom lands.
Fr om the tim e of the fir st settlem en ts in the Sou th , the for
ests provided tim ber for hom e bu i ld in g and m any other
uses, a place for gr azing livestock , and habitat for gam e . In
colon ial days, p ine lum ber pr oduced by hand and i n sm allwater -
power ed m i l ls, together w ith cypr ess lum ber andsh in gles, wer e used for m ost local con str uct ion , as wellas for lim ited expor ts fr om the r egion . Bar r els and casks
pr ovided a m eans of tr anspor t of tobacco and other agr icu ltu r al pr oducts. T he naval stor es indu stry fu r n ishedtu rp en tine and r osin for the navies of Br itain , the Un itedStates, and other coun tr ies. Sh ipbu i lding and con structionof por t facil ities r ounded ou t the ear ly comm er c ial uses ofboth pine and har dwood tim ber . In add ition , cu tting tim berfor fuel r epr esen ted a m ajor use of sou ther n for ests.
As m igr ating settler s pu shed in land fr om the coast , they
clear ed consider able por tions Of the sou ther n for est for cr opsand pastur es, tow ns, r oads, and other uses. By 1860 , som e
43 per cen t of the tota l land ar ea of the Sou th was repor tedto be in farm s. A substan tial part of the land in farm ho ldings r em a ined i n for est , however , and both the or igin alstands and subsequen t r egr ow th of you nger stands becam ea sour ce of tim ber for the for est pr odu cts industr ies. S inceco lon ial tim es, farm er s have also u sed forests, whether
owned or not , for gr azin g livestock , w ith annual bu r n ing toim pr ove for age a w idespr ead pr actice .
With con tinued expan sion of settlem en t and the har vest oftim ber , the ar ea of cr op land and pastur e con tinued to incr ease , r each ing a peak ar ound 1920 . Ther eafter , w ith thespr ead of the bo ll weevil and the agr icu ltu r al depression of
the ear ly 1920 ’
s, lar ge ar eas of cr opland and pastu r e be
cam e idle . In ar eas such as the P iedm on t , cu ltivation ledto severe er osion and add itional cr opland abandonm en t . Du ring the har d tim es of the 1930
’
s Depr ession and for a pe
r iod after Wor ld War II , add itional ar eas of cr oplands andpastu r e wer e left id le . A factor con tr ibu ting to land abandonm en t was Feder al r ec lam ation pr ogr am s that ir r igatedwester n lands, wh ich then gr ew cotton and other pr oducts
in com petition w ith sou ther n agr icu ltu r e .
Becau se of u ncon tr olled fir es and the lack of for estry pr ogr am s, on ly par t Of the cu tover and idle cr op land and pastu r e cam e back to for ests. Tr ees did r egener ate in ,
m any
ar eas, however , and the ear ly 1900 ’
s m arked the beginn ingof what becam e the Sou th ’
s second for est— the“
for est that
suppl ied the wood for the expansion of the pu lp and paper
indu stry in the 1930 ’
s th r ough the 1960 ’
s.
These sam e for ces con tinued to affect the tim ber situationfor sever al decades. T he progr am s Of protection , techn icaland fin anc ial assistance , r esear ch , educat ion , and m anagem en t expanded , som etim es r apid ly , fr om the 1940
’
s thr oughthe late 1970 ’
s. T he ar ea of land u sed for crops and pas
tu r e con tinu ed to dr op th r ou gh the 1950 ’
s, som etim es atr ap id r ates, and m uch of the ar ea r egener ated n atu r al ly .
In t im e i t also becam e c lear that m u ch of the so i l in theSou th was not well su ited for far rning . So ils in the CoastalPlain and Piedm on t ar e m ostly str ongly leached ,
r ich in ir onand alum inum oxide bu t deficien t in m any of the nu tr ientsessen t ial for the pr oduct ion of field cr ops . Most of the
m oun tain ar eas ar e also unsu ited for field cr ops. Bu t these
soils ar e su itable for grow ing tr ees, espec ially in . the CoastalPlain and the Piedm on t and in the valleys and coves of them oun tain s. Loess so i l ar eas Of the Mississippi Val ley and
bottom lands along the m ajor str eam s have better soi ls forcr ops. However , because of wetness and per iod ic flood in g ,par t of the bottom lands is also su itable on ly for gr ow ingtr ees.
As the second for est was developing , a num ber of changeswer e taking place that had m ajor im pacts on the for estsituation . Gr ow ing concer n am ong for est industry and
gover nm en t leader s abou t tim ber suppl ies an d the lack of
regeneration of lar ge ar eas of cu tover and idle cr oplandsand pastu re led to ( 1) the developm en t of pr ogr am s of fir epr otection , techn ical and financ ial assistance , r esear ch ,
and education ; and (2 ) the establishm en t of m an agedfor ests owned by the public sector , for est industr y , and
other pr ivate firm s and ind ividuals. Fir e pr otection and
the educational pr ogr am s assoc iated w ith fir e pr even tionwer e par ticu lar ly effective , and a lar ge par t of the cu toverand id le cr opland and pastu r e r egener ated n atu r al ly to pineand m ixed p ine—har dwood stands. Resear ch that led to w ays
to pr otect and regener ate for ests and u ti lize sou ther n pinetim ber for Woodpu lp and plywood also had m ajor impactson the r esour ce and for est indu str ies.

In 1962 , the tim ber land'
ar ea in the Sou th r eached a
postwar peak of 197 m i ll ion acr es. S ince then , the ar ea of
timber land has once again dec lined . Never theless, i n 1985tim ber land stil l compr ised abou t m il lion acr es, or 55
per cen t of the total land ar ea of the Sou th (app . tableT he m ajor causes of the r ecen t decl ine in tim ber land ar eas
have been new clear in gs for cr opland and pastu r e and con
tinu ing expansion of u r ban and other non tim ber uses.
Extr acting gum Or pitch is har d on tapped tr ees. Un ti l theear ly l 9oo’
s, w orker s cu t deep boxes i n you n g tr ees togather the gum that dr ipped down , bu t the pr ocess al m ost
always destr oyed the tapped tr ee by adm itting d isease and
in sects and by r educ ing r esistance to w indstorm s. Cu stomary annual bur n ings to “ gr een up the gr ass fr equen tly destr oyed the
“
tu rpentine or char ds” as well as other for ests.
In 190 1 , the destr uctive m ethods of tapp ing and the depletion of r esour ces pr ompted a young chem ist , Char les Her ty ,
to adapt to the sou ther n for estsi
a Fr en ch m ethod of gathering gum . Using two galvan ized ir on gu tter s and a c lay cup ,
Her ty dem onstr ated that boxin g w as not necessary and that
T he pr oduct ion of p ine gum for n avalstores— turpen tine and r osin—was one Of the
ear ly and im port an t uses of p ine for ests inthe Sou th . T h is con t inued for a long t im e ,
bu t since 1930 , gum production hasdecl ined stead ily . T he sou ther n pu lp industry
is now the pr im ary sour ce of turpen tin e andr osin .
The comm er cial u ti lization of the sou ther n for est has a longh istory , beginn in g in the colon ial er a . Ear ly sett ler s soond iscover ed the pr ofitability of gum n aval»stor es extr ac tedfrom p ines near the coast of the Car o l in as. T he industr yalso r eceived a boost in 1705 ,
when England Offer ed
boun ties to co lon ial pr oducer s to incr ease n aval stor espr oduction and fr ee the Br itish Navy fr om i ts dependence
on supplies from Baltic coun tri es. Like m ost extr activeindustri es, nava l - stor es pr oducer s per form ed l ittle pr ocossing and m ain ly expo r ted gum r ather than r osin and
tu rp en tine . T he industry gr ew slow ly unti l the 1840 ’
s,
when new producer s began oper ations in Geor gia , Flor ida ,
and the Gu lf States.

34
T housand 50 -
ga llon ba r rels
1 92 0 1 940
Fi gu r e— Tu rpen tine pr odu ction in the United States, by type , 1900—84

In term s of acr eage and volum e of tim ber har vested , m ostof the tim ber har vested from the fir st sou ther n for est w asused by the lum ber indu stry . Beginn ing w ith the 1880 ’
s,
sawm i l ls becam e the dom in an t indu str y in the sou ther n
econom y . Dem and for lum ber gr ew r ap id ly in the Nor ther n States at a tim e when the o l d - gr ow th tim ber stands ofthe Nor theast and Lake States r egions wer e near in g exhau stion . T he postbellum r ailr oad boom laid tr ack al l over theSou th , open ing up lar ge ar eas of Ol d - grow th for ests. En tre
pr eneur s bought lar ge acr eages of h igh - qua l ity t im ber fornom inal sum s like to $ 10 per acr e , the going r ate forundeveloped land .
T he sw itch to steam power m ean t m or e than the expansionOf r a i lr oad in g . Lar ge sawm i l ls and loggin g oper at ion sadopted steam -
power ed steel band saws that m ade possiblethe m anufactu r e Of accu r ately cu t lum ber in qu an tity . T he
m any lar ge sawm il ls bu ilt in the r egion to har vest the o ld
grow th tim ber typically inc luded two or m or e band saws,
and Often gang saws as wel l , w ith capac ity to pr oduce in ex
cess of boar d feet of lum ber per day . Usu al ly timber firm s found i t necessary to bu i ld a com pany town , w ithhousing , a com pany stor e , schoo ls, and chu r ches.
Most Of the timber harvested fr om the
fir st for est i n the Sou th w as u sed by thelumber indu stry . In the 1880
’
s, w ith thedevelopm en t of m arkets for
'
lum ber in the
Nor th , a r ai l road system in the Sou th , and .
steam -
powered band saws, incr easinglylarge volumes of Old -
gr ow th t imber wereharvested and cu t in to lumber . Pr oduction
peaked in 1909 , when m or e than 2 1 b i l l ionboar d feet of lumber were sawed .
In m any cases, p r essur es to r educe indebtedness an d toho ld down taxes on Ol d - gr ow th tim ber con tr ibu ted to r apidc lear cu tting and l iqu idation of the tim ber r esou r ce . Whenavai lable timber was exhausted , the firm s m oved their Oper ation s to new sou r ces of supply and Often abandoned theircom pany towns. Dism an tled m ills and deser ted comm un ities wer e num er ou s and eloquen t r em inder s of the m igr atory n atu r e of th is ear ly lum ber industry .
T he lum ber pr odu ced by the lar ge m i l ls th at Oper ated i nsou thern Ol d - grow th for ests was of h igh qual ity ,
w ith m uchof i t destined for expor t to for eign coun tr ies as well as todestination s in the Nor ther n Un ited S tates. Add it ion al ly ,
lar ge num ber s of sm all “ peckerwood m i l ls pr oduced generally lower gr ade lum ber for local u ses, especial ly in periods of str on g m arkets and h igh pr ices. Du r ing tim es of low
lum ber pr ices, these sm all m i l ls stood id le , as their oper ator s r esor ted to farm ing to tide them over .
T he r ecor d of lum ber pr oduction i n the - Sou th is shown i n
appen d ix tables In 1869 , the ear l iest year forwh ich vo lum e data ar e avai lable , total pr oduct ion am ou n ted
to bill ion board feet . Th is inc luded billion boar dfeet of softwoods, near ly al l pine , and 357 m i llion board feetof har dwoods, m ostly oak . In the fol low in g decades, pr oduction incr eased r apidly and by 1899 am oun ted to over 12bill ion board feet (fig . Softwood pr oduction w asbill ion boar d feet ; har dwood , bill ion .
Pr oduction con tinued to incr ease un til 1909 , when i t r eached
a peak of billion board feet billion of softwoods
and billion of har dwoods) . Pr oduction con tinued at veryh igh levels thr ough the 1920 ’
s, bu t in the ear ly 1930 ’
s, i t
dr opped sharp ly as the effects of the Depr ession h i t thein dustry . Ther e w as a slow r ecovery ,
and du r in g Wor ldWar II the vo lum e pr oduced exceeded 15 billion boar d feetin som e year s. T he 1950
’
s saw another dec line i n ou tpu t .
Although com plete data by spec ies have not been availablesince 1954, avai lable inform at ion ind icates that total production was ar ound 10 bill ion boar d feet (abou t 7 bill ion of
i t softwoods) in m ost year s fr om the m i d - 1950’
s thr oughthe ear ly 1980 ’
s. Ther e has been an in cr easein the last fewyear s . Ou tput in 1986 w as estim ated to exceed 15 bill ionboard feet .
Billion boa rd feet, lumber ta lly
Al l ha rdwoods
“
19 45
Figu r e — Lum ber pr oduction in the Sou th , by softw oods and har dwoods, 1869—1984 ,and by m ajor species 1869— 1965
36

Softwood Lum ber P r odu ct ion
Sou ther n yellow pine has alw ays composed m ost of the lumber pr oduced in the Sou th , and i n m ost year s near ly al l Of
the softwood lum ber pr odu c t ion (app . table In the
1870’
s“
pine (yel low p ine) lum ber pr oduction in the Sou theast r egion exceeded that in '
the Sou th Cen tr al r egion , w ithGeor gia the leading State (app . table By _
1889 , how
ever , the Sou th Centr al region had h igher pr oduction . In that
year , both Texas and Alabam a joined Geor gia in pr oduc ingover a half bill ion boar d feet of pine lum ber .
Just after the tur n of the cen tury,seven Sou ther n States wer eeach pr oduc in g a bi l l ion boar d feet of p in e lum ber peryear . Peak production in a State w as r eached in 19 13 , when
billion board feet wer e pr oduced in Lou isiana , the leading State for pine lum ber pr oduction fr om the ear ly 1900 ’
s
un til the m id- 1920’
s. Dur ing th is tim e, production occasionally exceeded 2 billion boar d feet in Mississippi and Texas, .
and 1 bill ion board feet in al l States in the Sou th exceptSou th Caro lina , Tennessee , and Oklahom a .
In the ear ly 1900 ’
s and in to the 1920 ’
s, cypr ess lum ber pr oduction gener ally r an ged between 600 m i ll ion and 800 m i l
lion board feet a year (app . table Most of the cypr ess
was cu t fr om the bottom land for ests in Lou i si an a , althoughpr odu ction exceeded 100 m i l l ion board feet for m any year s
in Flor i da .
In r ecen t decades, w ith the recovery Of the for ests in the
Sou th , the pr odu ct ion of softwood lum ber has in cr easedabove the low levels of the ear ly 1930 ’
s:However , the har
vest of the young- gr ow th stands has yielded lum ber Of lowerqu al ity than that pr odu ced fr om the Ol d - gr ow th stands .
Never theless, sou ther n pine lumber has con tinued to find aplace in con str uction m arkets, and in r ecen t year s espec ial lythose m arkets using pr eser vative tr eated lum ber .
H a r dwood Lum ber P r odu ction
As in the developm en t of the sou thern pine lumber industr y ,
the depletion of ol d - grow th har dwood tim ber i n the Nor theast and Lake States cau sed m anufactu r er s to tu r n to the
Sou th for a new sou r ce of hardwood supply . Nor thCar o lina sawthe developm en t of an im por tan t fu r n itur em anufactu r ing cen ter whose ou tpu t even tually r ivaled bothin quan tity and qual ity the fu r n itu r e m ade i n New Englandand Mich igan . T he or gan ization of the Nat ion al Har dwoodLumber Assoc iation in 1898 di d m uch to br in g order andenfor ce gr ad ing standar ds w ith in the industry .
Har dwood production hasbeen spr ead am on g a num ber ofspecies. T he lar gest pr odu ction has been oak and h ickory(app . table Red gum , tupelo , ash , cottonwood , and elm
have also been impor tan t spec ies in term s of volum es cu t(app . tables and Ten nessee , Arkansas, and Virgin ia have been the m ost impor tant pr odu c ing States.
Fu r n itu r e and r ai lr oad cr ossties have long been princ ipaluses Of har dwood lum ber . Other m ajor u ses inc lude item ssuch as pal lets and m anufactu r ed pr oducts for both dom estic and expor t m arkets.
Tech n ologica l Br eakth r ou ghs
37
In term s Of vo lum e , har dwood lum ber pr oduction in theSou th has never appr oached that Of softwoods. Fr om 1900
through the 1920 ’
s, pr oduction gener ally r anged between2 billion and 3 billion boar d feet a year (app . table As
w ith softwoods, pr oduction dr opped du ri ng the Depr ession ,
bu t i n the late 1940 ’
s, pr oduction r ose and since then hasr em ained between 3 billion and 4 bill ion board feet in m ostyear s.
T he m ajor ro le played by the lum ber industry in the Sou thhas been suppor ted i n par t by con t in u in g techn o logicaldevelopm en ts. In add ition to ear ly im pr ovem en ts i n loggingand m i lling equ ipm en t , developm en t of wood -
pr eser vationchem icals and techn iques helped bu i ld and hold m arkets for
products such as r ailr oad cr ossties and sawn timber s, po les,pi ling , and posts. A m ajor pr oblem of d isco lor ation of sou th
er n p in e lum ber , blue sta in ,w as el im in ated i n the late
1930’
s. Resear ch conducted at the Sou ther n Fo rest Exper i
m en t Station in New Or lean s led to pr actical m ethods Of
con tro ll ing the fu ngus causing the pr oblem .
Later developm en t of log debarker s, logging equ ipm en t , andm il l m ach inery by both equ ipm en t m anufactur er s and tim
ber com pan ies i n the Sou th , and their w idespr ead adoptionby the for est indu str ies, helped r educe costs and incr easeu t i l ization Of ava i lable t im ber supp l ies. Thu s the slabs,edgings, and sim i lar m ater ial pr odu ced at sawm i lls, wh ichpreviously had been wasted , becam e in timean impor tan tpar t of the r aw m ater ial used by a r apid ly expand ing pu lpand paper indu stry , as well as a sou r ce of incom e to lumber m anufactu r er s. Resear ch on lam in ated beam s and t im
ber s at the For est Pr oducts Labor atory in Madison ,WI
,and
the subsequen t developm en t of m an u factu r ing fac i lities i nsou ther n m i l ls to pr odu ce these new pr oducts led to the u se
of you ng - gr ow th sou ther n p ines fo r h igh - qu ality end
produc ts.
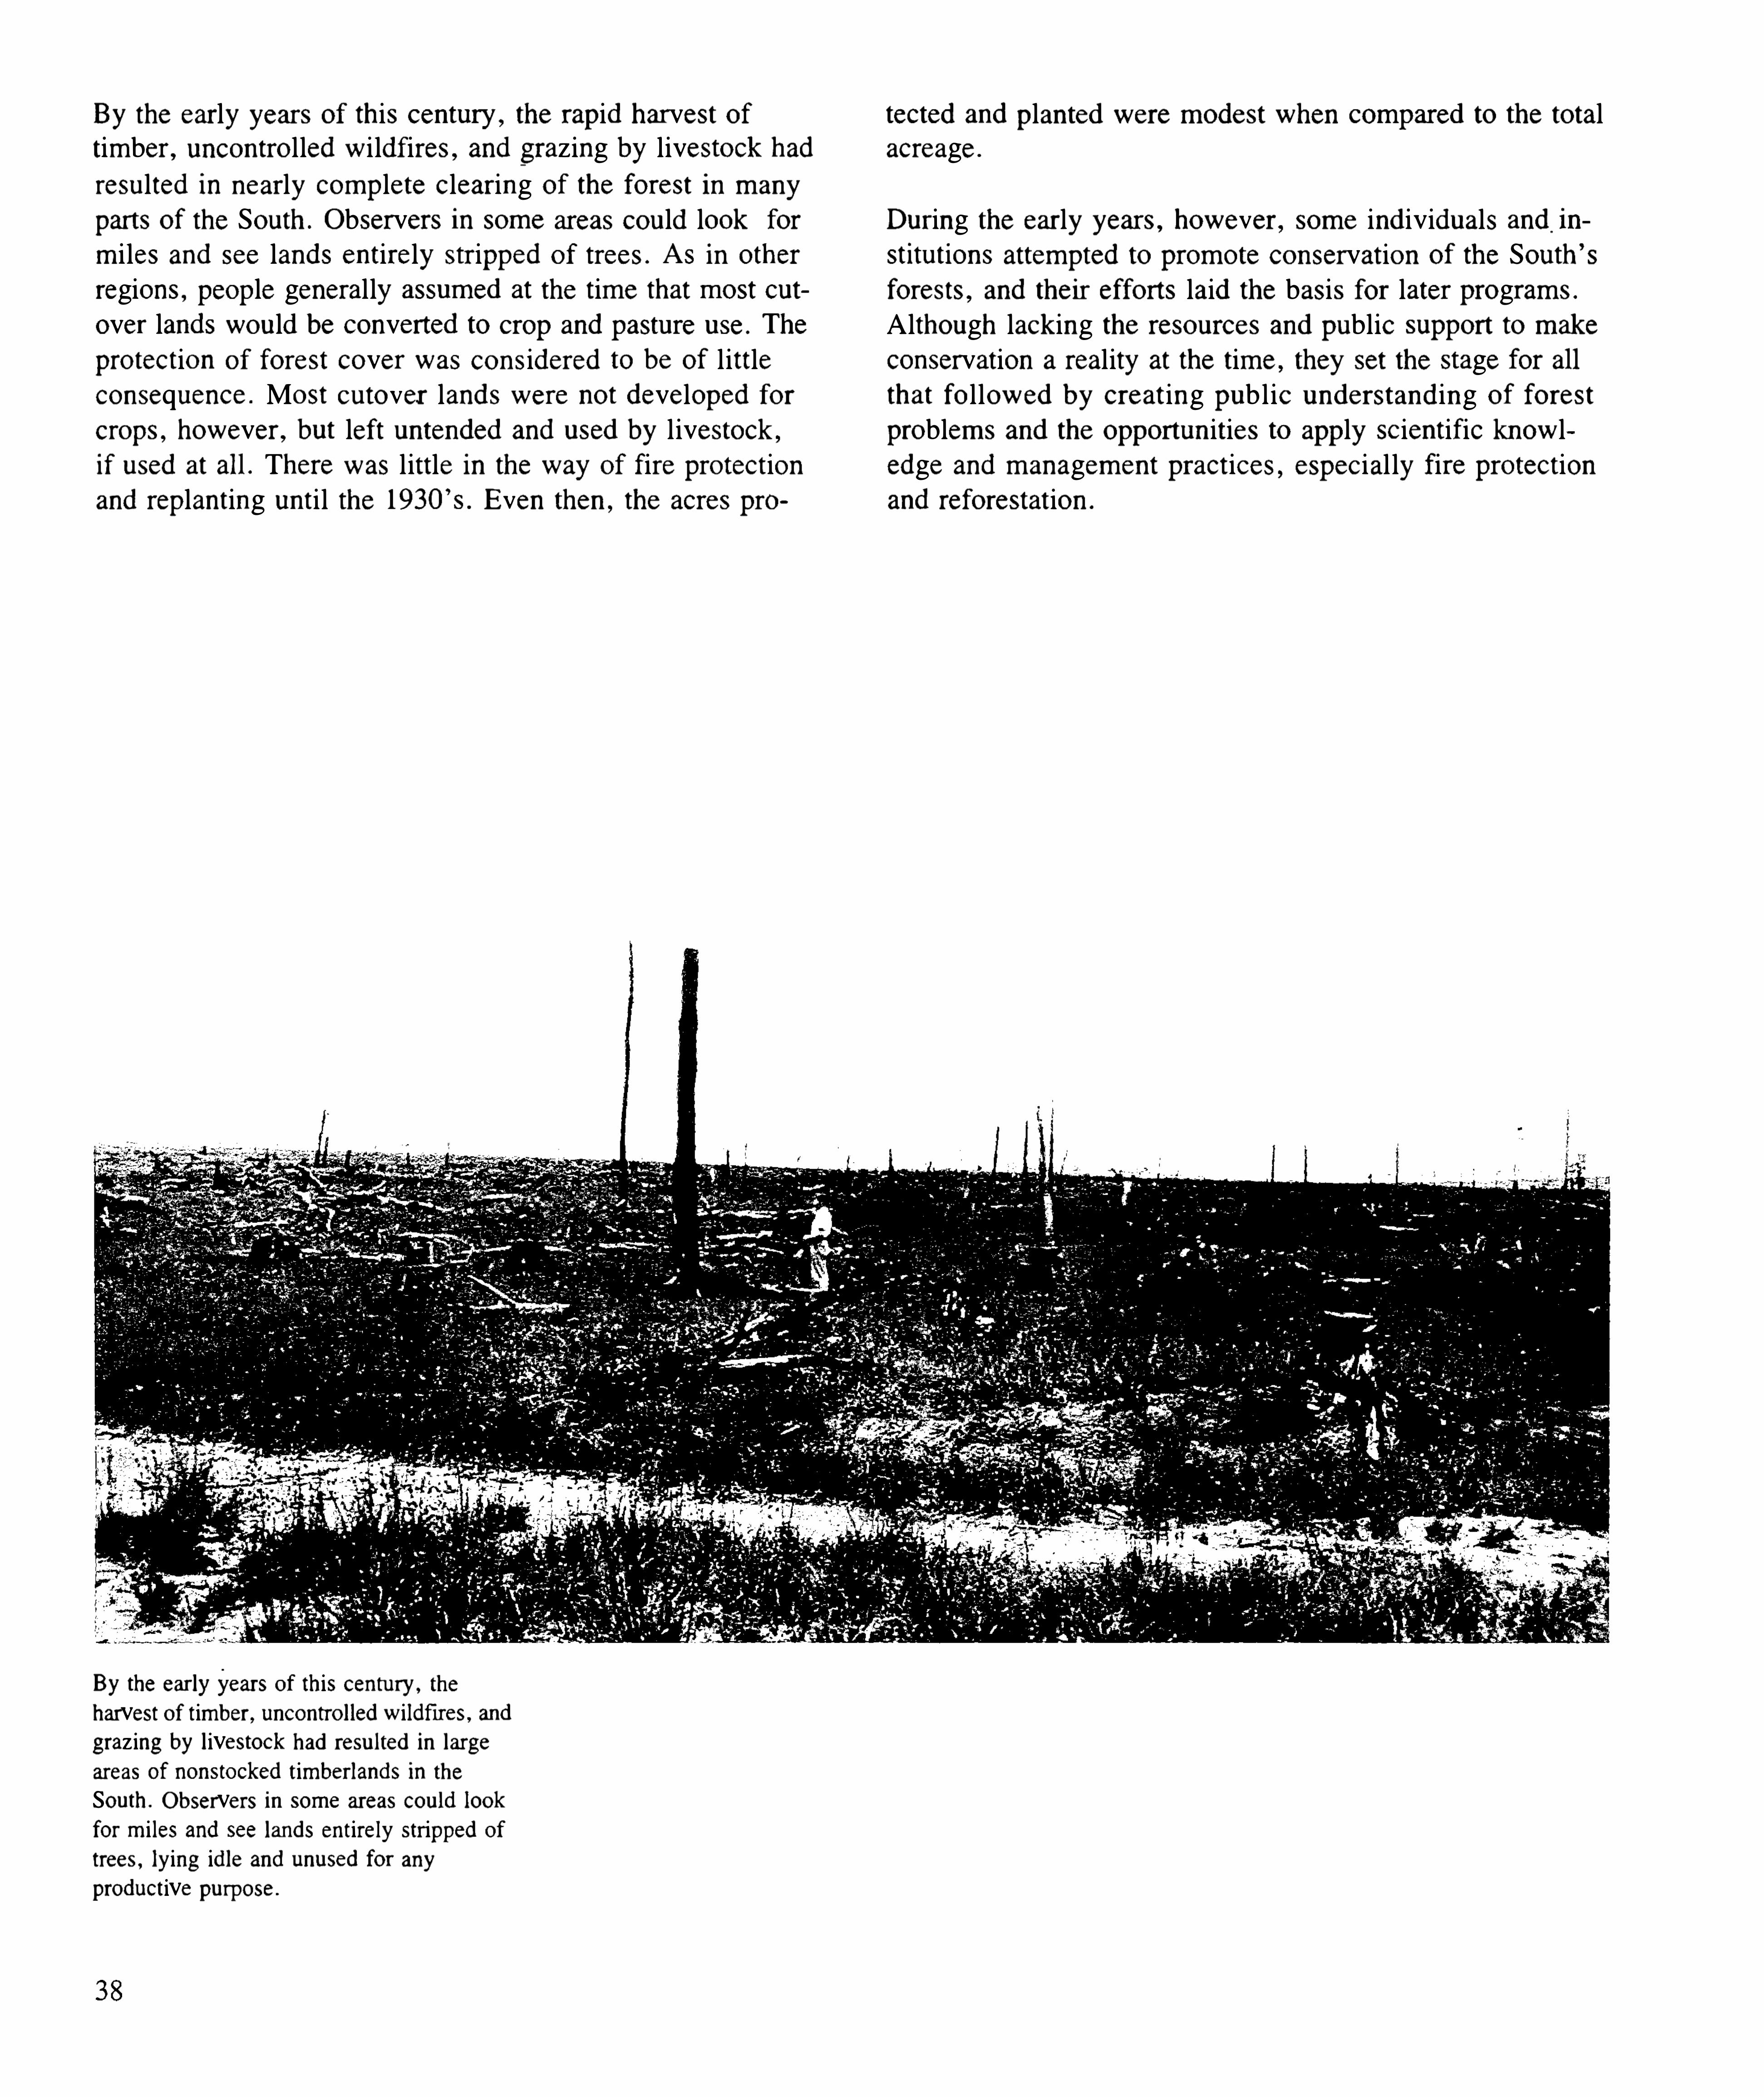
By the ear ly year s of th is cen tu ry , the r apid har vest Of tected and plan ted wer e m odest w hen com par ed to the totaltim ber , uncon tr o lled w i ldfir es, and gr azing by livestock had acr eage .
resu lted i n near ly com plete c lear ing of the for est i n m any
part s of the Sou th . Obser ver s in som e ar eas cou ld look for
m i les and see lands en tir ely str ipped Of tr ees. As in other
regions, people gener ally assum ed at the tim e that m ost cu tover lands wou ld be conver ted to cr op and pastu re u se . T he
pr otection of for est cover w as con sider ed to be of l ittleconsequence . Most cu tover lands wer e not developed forcr ops, however , bu t left u n tended and used by l ivestock ,
i f used at al l . Ther e w as l ittle in the way of fir e pr otectionand r eplan ting un ti l the 1930 ’
s. Even then , the acr es pr o
By the ear ly year s of th is cen tury , the
harvest of timber , uncontr o l led w i ldfir es, and
gr azing by l ivestock had r esu l ted in lar gear eas of nonstocked t im ber lands in theSou th . Observers in some ar eas cou ld look
for m i les and see lands en tir ely str ipped of
trees, lying id le and unused for anypr oductive pu rpose .
Du r ing the ear ly year s, however , som e ind ividu als and i nst itu tion s attem pted to pr om ote con ser vation of the Sou th
’
s
forests, and thei r effor ts laid the basis for later pr ogr am s.
Although lacking the r esou r ces and public suppor t to m ake
conser vation a r eality at the tim e , they set the stage for al lthat fo l low ed by cr eat in g pu blic u nder stan d in g Of for estpr oblem s and the oppor tun ities to apply sc ien tific know ledge and m an agem en t pr act ices, espec ial ly fir e pr otectionand r eforestat ion .

Ear ly effo r ts to awaken the Am er ican public to the needto r enew forest r esour ces included the work of Fr ankl in B .
Hough ( 1878 , 1 880 , 1 882 ) i n h i s com pr ehen sive 1878Repor t Upon For estry . It was the fir st deta iled gener al as
sessm en t of the for est situation . Later , the For est Servicein the U .S. Depar tm en t of Agr icu ltu r e began the lon g- term
process of studying Am er ican for ests and pr om otin g forestry thr ough an incr easing flow of r epor ts, ar t ic les, andother inform ation on the Nation ’
s for est situ ation and the
need for for est conser vation .
Another im petu s for for est pr otection and m anagem en t inthe Un ited States cam e in the form of new or gan izations. Anumber of lum berm en and sc ien tists cr eated the Am er icanFor estry Assoc iation in 1875 through the influence of JohnAston War der . In 1885 , the Am er ican For estry Associationmerged w ith the Am er ican For est Congress and in 1888 w iththe Sou ther n For estry Congr ess. Taking a cue fr om th isnational or gan ization , a Nor th Car o lina For estry Assoc iation was form ed in the sam e year w ith the encou r agem en t
Of State Geo logist J .A . Ho lm es. Th is w as the fir st of a se
r ies of State for estry assoc iations established i n fo l low ingyear s. Like their national cou n terpar ts, these gr oups workedto advance the cause of for estry and to encou r age passageOf S tate and Feder al for estry legislat ion .
Som e ind ividu als sought to spr ead the gospel of sound forestr y by example as well as by word . Gifford Pinchot , thefir st tr ained Am er ican - bor n for ester , cam e in 1892 to Nor thCar ol ina ,
wher e he m anaged the fo r ests of Geor geVander bilt ’s B iltm or e estate . In 1898 , P inchot becam eCh ief of the D ivision of For estr y in the Depar tm en t Of the
In ter ior (upgr aded to Bu r eau i n 190 1 ) and soon conver tedPresiden t Theodore Roosevelt to the cause of a nationalconser vation cr usade . In 1905 , the for est r eser ves wer etr ansfer r ed fr om the Depar tm ent Of the In ter ior to theDepar tm en t of Agr icu ltur e ’
s new ly created For est Ser vice ,
w ith Pinchot as Ch ief .
At the t im e , ther e wer e no for est r eser ves i n the Sou th .
However , in the.
1890’
s, a m ovem en t had begun in Nor th
Car o lina and N ew Ham psh ire suppor t ing the cr eation of na
tional parks and for est r eser ves in the East . T he D ivision of
For estry , in cooper ation w ith the Geological Sur vey of the
U .S. Depar tment of the Inter ior , conducted a field investigation of the Sou ther n Appalach ian r egion
,Their repor t , sub
m i tted to Congr ess in 1902 by Presiden t Roosevelt , detailedw idespr ead dam age to the r egion ’
s for ests. T he r epor t alsoc ited c leared and abandoned farm lands and lar ge - scale er o
sion and flood ing as ever - incr easin g pr oblem s.
T he creation of Sou ther n State for estry agenc ies followed then ation al lead . In Alabam a , c it izen s in c lu d in g Char lesMoh r , the au thor of an ear ly U .S . Division of For estry study
on p ines of the Sou ther n Un ited S tates, pr ompted the cr eation of a State for estry comm ission . In Lou isian a in 1907 ,
Hen ry E . Har dtner , a pioneer lum berm an , helped or gan izethe Lou isiana For estry Assoc iation ,
wh ich began to play an
im por tant r ole in sou ther n for estr y .
39
T he m ovem en t for easter n for est r eser ves m ade l ittle pr ogr ess for sever al year s becau se m any Congr essm en felt i t w asin appr opr iate , i f not uncon stitu tion al , for the Feder al Gover nm en t to acqu ir e pri vate land . There w as, however , pr ogr ess in other w ays. In 1908, Presiden t Roosevelt conveneda Con ference Of Gover nor s on the Conser vation of Natu r alResou r ces at the Wh ite House . Near ly 500 people attended ,
including 22 gover nor s, 1 1 per son al r epr esen tat ives ofgovern or s, and 98 r epr esen tatives of 3 1 S tate com m issions.
T he Gover nor s’ Confer ence , fo llowed by a Join t Conser vation Con fer ence w ith a w ide var iety of par tic ipan ts, stim ulated m any State Gover nm en ts to th ink abou t establish in gState for estry agenc ies.
S im i lar for estry com m ission s or assoc iat ions wer e in tim eestablished i n al l the Sou ther n States. Am ong ear lycr usader s, Austin Cary o f the USDA For est Ser vice playeda str on g role in advanc ing for est conser vation th r ou ghoutthe Sou th and has Often been cal led the father of sou ther nfor estr y . H is m essage was simple— good forestry is goodbusiness. " et Har dtner and Car y wer e the except ions. As a
gener al r u le , ther e was l ittle in ter est in leaving seed tr ees,as Har dtner suggested , or in pr actic ing com pr ehensive fir econ tr o l , a favor ite them e of Car y ’
s.

T h e Weeks Law
Never theless, the gr ow ing concer n over for est cond it ionsexpr essed by c itizen s’ gr oups, the incr easin g flow of fo r
estry in vest igation s and r epor ts from the For est Ser vice ,
an d r ecomm endations of the Gover nor s’ Con ference of 1908r esu lted in the enactm en t of the Weeks law in 19 1 1 . Th isact pr ov ided Feder al m atch ing funds to coOper ate w ith Stateagenc ies in pr otect in g for ests fr om w i ldfir e and au thor izedFeder al acqu isit ion of land for n at ional for ests in the w atersheds of n avigable str eam s .
Pr ogr ess in or gan izing State fir e pr otection under the
Weeks law w as slow i n the Sou th , both becau se Feder alfunding w as lim ited and because State legislatu r es were r e
luctan t to appr opr iate m atch ing m oney for progr am s that r an
counter to pr evai lin g att itudes tow ar d u se of fir e in sou th
ern forests. Never theless, add it ional Sou ther n S tates gr adua l ly established for estry agenc ies to car r y ou t fir e con tr o land other for estr y pr ogr am s, begin n in g i n Vi r gin ia and
Texas in 19 15 . T he last State to establish such an agencyArkansas— c r eated i ts S tate Fo r estry Comm ission i n 193 3w ith m oney fr om pri vate con tri bu tions.
Sett ing up S tate forestry agen i ces to car ry ou t for est protec
tion and m anagem en t pr ogr am s in the Sou th w as gr eat lyaided by the exper ience of pr ogr essive industr i allandow ner s. Henry Har dtner
’
s su ccess i n pr otect ion ,
One gf the ear ly impor tan t pieces of forestr yleg islation w as the Weeks law of 19 1 1 .
T hi s act provided for Feder al m atchi ngfunds to cooper ate w ith States in protectingfor ests and for est l ands fr om f ir e . Su chprotection was the fir st essen t ial step inr egener ating sou thern forests .
40
Lum ber Tr ade Associat ion s
Incr easing concer n over cond it ion s on the vast ‘
ar ea of cu t
over and unpr odu ctive lan d in the Sou th led the Sou ther nPine Assoc iation i n 19 17 to jo in w ith the Sou ther n Sett lem en t and Developm en t Or gan izat ion for a con fer en ce on
lan d use . Not su rpr isingly , pr i nc ipal atten tion focused onpossible cr op and pastur e u se of cu tover lan ds. Much
educat ion , r esear ch , and exper ience had to occur befor e theuse of sou ther n for ests for susta ined tim ber pr oduction gotser iou s atten t ion . Later , i n the Depr ession year s of the1930
’
s, the Sou ther n P in e Assoc iation played a lead ing r olein developing ar tic le 10 of the shor t - lived Nat ional Industri al Recovery Act . T he ar tic le set standar ds Of appr oved
plan ting , and su sta ined -
yield cu tting on lands Of the Ur an iaLum ber Com pany in Lou isian a st im u lated other s to im
prove for est pr act ices. In 1920 , the Gr eat Sou ther n Lum berCom pany at Boga lu sa , LA , began u nder Ch ief RangerF.O . Batem an a pr otec tion and tr ee -
p lan tin g pr ogr am that
r esu lted i n thou sands of ac r es of pine p lan tations. T h iseffor t ser ved as a successfu l for er u nner for the m oderntr ee-
plan tin g pr ogr am s conducted thr ou ghou t the Sou th .
Other com pan ies, such as Ar kansas’
s Cr ossett Lum berCompany , wh ich in 19 15 established a c lose and fr u itfu lr elationsh ip w ith Pr ofessor H . H . Chapm an of the YaleFor estry Schoo l , wer e also in the for efr on t of ear ly indu str ial for estr y effo r ts.
Du r ing th is sam e peri od , lum ber m anu factu r er s sou ght tostr engthen their fr agm en ted and com pet it ive indu stry byform ing industr ial tr ade assoc iat ion s. A gr oup of lum berm anufactu rer s in Missou r i and Arkan sas or gan ized an
assoc iation as ear ly as 1883 . Th is w as succeeded by a r e
gional o r gan ization , the Sou ther n Lum ber Manufactu r er s’
Association , wh ich becam e the Sou ther n P ine Associationin 19 15 and later chan ged i ts n am e to the Sou ther n For
ests Products Assoc iation to r eflect i ts br oader cover age of
wood pr oducts. In the Mississippi Val ley , an or gan izationOf hardw ood lum ber m anu factu r er s established in 1899 laterbecame the Har dwood Lum ber Man u factu r er s Assoc iation .
In tim e , al l comm er c ial spec ies and pr oducts wer e r epr esented by tr ade associations. These r egional associations hadcomm on char acter istics and , in m any cases, comm on
m em ber sh ip , w ith sim i lar gr oups in the r est of the Nation .
They sought to establish lum ber - gr ad in g r u les and inspection pr ocedu r es; com p i le stat istics on lum ber pr oduct ion ,
sh ipm en ts, and pr ices; deal w ith or gan ized labor ; pr om otewood products; and lobby Con gr ess and State legislatur es toadvance the industry ’
s in ter ests.
~

In the l 93o’
s, the C ivi l ian Con servat ionCorps r eplan ted and protected for ests;
con str ained soi l er osion , and improvedw i ldl ife hab itat . T he Corps played an
import an t r ole in con servat ion in the Sou thand in the Nation .
42

Fir e has always been an im por tan t for ce shaping sou ther nfor ests. T he u se of fir e by Ind ian s to c lear land and im
pr ove hu n ting con tr ibu ted to m ain tain ing the pine for estsfound by ear ly Eu r opean explo r er s. In n atu r al successionw ithou t fir e ,
var iou s tree spec ies com pete w ith pines i n a
pr ocess that yields fir st m ixed pine—har dwood and , in tim e ,
har dwood for ests.
Woods- Bu r n i n g vs. Fi r e P r otect ion
Colon ial settler s and their descendan ts adopted the Ind ian u se
Of fir e and expanded the pr actice for such pu rposes as improvem ent of gr azing and con tr o l of pests. Use of fir e gr ewin to a deep
- seated par t Of the sou ther n r u r al cu ltu r e , and
ear ly effor ts at fir e-
pr even tion education and legislation facedstr on g opposition , par ticu lar ly fr om u ser s of the for est
r ange . Ar son was also com m on over m uch'
of the Sou th .
Lack of fund in g w as the m ajor hand icap to ear ly effor ts by
State and Feder al agen cies to chan ge the woods- bum ing hab
i ts Of sou them er s. Although the Weeks law offer ed m atch
ing financing for fir e protection , the am oun t of Feder al fir econ tr o l spend ing cam e to on ly a few thousand do llar s i n1920 . Passage of the Clarke—McNary Act of 1924 gave a
needed boost , and Feder al cooper ative fu nd ing for con tr o lof w i ldfir e i n the Sou th gr ew to abou t $5 m i l l ion ( 1982do llar s) in 1930 . State fund ing had incr eased m or e r apidly ,
to near ly $ 10 m ill ion (fig . and app .
”
table Re
su l ts accr ued qu ickly as the annu al num ber of acr es bu r neddr opped below the low of a decade ear l ier . Feder al fir econ tr o l spendin g con tinued to grow r ap idly ,
to near ly $ 18m ill ion du r ing the 1960 ’
s, bu t ther eafter dr opped sharplyin the ear ly 1980 ’
s, to on ly m il l ion in 1983 .
State expend itur es in the Sou th r ose fr om abou t m i l
lion ( 1982 do llar s) in 1930 to over $90 m illion in the ear ly1980
’
s.
T he in cr eases in funding for for est fir e pr otection enabledfire pr otection or gan izations to stead ily increase the ar ea of
State and pri vate land given pr otection fr om w ildfire . Areaspr otected r ose fr om 70 m illion acr es in 1930 to m ore than
23 3 m i llion ac r es i n the 1980’
s (app . table
These incr eases in fu nd in g and areas pr otected over the pasthalf cen tu ry r esu lted i n a great reduction in acr eage bu r n edby w i ldfi r es . After 19 30 , ac r eage of t im ber land bu r n eddropped fr om m o r e than 2 m i l l ion per year to as low as
acr es i n 1983 (fi g . and app . table T he
reduction in ar ea bu r n ed th rough m or e effective fire proteotion was the m ost im po r tan t single factor i n obtain ing natur al r egener ation in the Sou th ’
s second and th ird forests.
Much of the success i n m eetin g the pr oblem of w ildfir em ust be attr ibu ted to both Feder al and State for estry agenc ies and fo r estry assoc iation s i n their cr u sades to per suader u r al people to stop woods
- bum ing . In 19 16 , for example ,
v ar iou s con ser vat ion gr oups i n the Sou th , together w ith theAm er ican For estry Assoc iation and the Soc iety of Am er ican Forester s, or gan ized a Sou ther n Forest Congr ess to workfor the pr otection of sou ther n fo r ests— the fir st of a ser iesof sim i lar congr esses that wer e held th r ou gh 1930 . Thesewer e later r eplaced i n a sense by the found ing i n 1920 of
the Association of State Forester s, wh ich con tinued to workto advance for estry pr ogr am s th r oughou t the Sou th . In the
1950’
s, a confer en ce , also spon sor ed by the Am er ican Forestry Assoc iation and deal ing m ain ly w ith fir e legislationand l aw en for cem en t , helped br in g abou t legislat ive and
cou r t action to cu r b fir e- setting by ar son ists. T he Am er ican Forestry Assoc iation and var iou s other assoc iations andcon ser vation gr oups h ave con tinued to p lay a sign ifican tr o le in fir e pr even tion th rou gh publications, m eetings,confer ences, and r epo r ts on the for est situation and po licyalter natives.

Million 1 982 dolla rsExpend itu res
1 960 1 9 65 1 970 1 975 1 980 1 981
Million acres
Area“
bu r ned
19 16 1920 1 925 1 93 0 1 93 5 1 940 1 945 1 950 1 955 1 960 1965 1 970 1 975 1 980 1 981 1 982 1 983
Figu r e— Expend itu r es for pr otection fr om w ildfir e and ar ea bu rn ed in the Sou th , selected year s, 19 16—83

Meetings of pr ofessionals who under stood the techn icaland econom ic impact of woods- bum ing w as one th ing , bu tgetting the aver age r ur al sou them er to view the issue thesam e w ay w as an other . Go in g to the people i n personseem ed the on ly way to succeed . In 1928 , Ovid Bu tler ,execu tive secr etary of the Am er ican For estry Assoc iation ,
pr oposed a m u lti - S tate tour to edu cate r u r al fo lk abou t thedanger s Of woods- bu r n i ng . For the next 3 year s, W .C .
McCorm ick led the D ixie Cr usader s, bam stor rn ing
Woods- bum ing to improve gr azing , contr ol
pests, and c lear u nderbr u sh to improvehun ting was a deep—seated par t of sou ther ncu l tu re . Much Of the success in con tro l l ingw i ldfires in the Sou th m ust be attri bu ted to
effor ts by publ ic and pr ivate agen c ies toeducate r u r a l people abou t the danger s of
fire . Educat ion al tr ucks equ ipped to show
movies and co lor ed lan tern sl ides tou red theSou th in the late 1920 ’
s and ear ly 1930’
s
and were an effective par t of the pr ogr am .
45
th r ough Geor gia , Flo r ida ,and Mississippi , coveri ng
m iles, and r each in g som e 3 m il l ion people . T he Cr u sad
er s used every m eans of comm u n ication available to get theirm essage acr oss: speeches, r al l ies, leaflets, pr ess, poster s,essay con tests, and m otion pictu r es. T he Am er ican For estryAssoc iation pr oduced i ts own m ovies and em ployed p lot ,humor , r om ance , even m elodr am a , to get the m essageacr oss.
Fi r e P r otection in th e Th i r t ies an d For t ies
Fir e pr otection effor ts du r ing the 1930 ’
s wer e also gr eatlyassisted by the work Of the Civilian Con ser vation Corps.
You ng m en of the Co rps fou gh t fir es; bu i lt r oads, tr ai ls,br idges, fir e tower s, and telephon e lines; and plan ted tr ees.
At the peak of the pr ogr am s, ther e w er e 3 1 1 for estry cam ps
in the Sou th— 125 on n ation al for ests and . 1 86 cam ps um
der State for ester s, who d ir ected pr ojects located m ain ly on
pr ivate lands. Geor gia had m or e cam ps than other Sou th
er n States because Of the lar ge ar ea of land given fir e pr oteotion by local t im ber pr o tec t ive or gan ization s that helpedfund cooper ative w ork .
With the on set of Wor ld War 11 , pr otec tion effor ts in the
Sou th becam e m or e d ifficu lt b ecau se per son n el dem ands
elsewher e left fewer fir efighter s to pr otect the for ests. T he
disband ing of the Civilian Con ser vation Corps in 1942 tookaw ay a m ajor sou r ce of cr ew s for con tr ol ling fires, a blowcompou nded by the loss Of State for ester s and seasoned fir egu ar ds to the m i l itar y an d defen se in du str ies . Sou ther n
S tate for estry agen c ies attem pted to fi l l the gaps by r ecr u iting lar ger vo lu n teer cr ew s and pr om otin g the u se of techn i
cal innovations, espec ial ly the tr actor—plow .
Ther e w as an added n eed to p r otec t m i l itar y Oper at ion s:sm oke had to be r educed at air fields and m ilitar y bases andfires near the coast had to be preven ted to avo id si l hou et
ting sh ipping to subm ar ines . Fir e agenc ies u sed the th r eatof legal action under the Feder al Subver sives Act to deterpoten tial ar son ists.
Appeals to patri otism to pr otect against fir e co in '
c ided w iththe gr ow ing valu e of pu lpw ood to feed the paperm akin gindu str y . Pu lp an d paper com pan ies,
in vest in g i n n ew
plan ts and the for ests to feed them ,w an ted better pr oteo
tion than befor e . With r i sing dem ands for fir e pr otection ,
both Feder al fu nd ing and S tate expend itu r es stead i l y/
i n
cr eased th r ou ghou t the w ar year s.
Never theless, at the end of Wor ld War 11 , ther e wer e stillm illion s of acr es of for est i n the Sou th w ithou t fir e pr otection and
'
substan ti al ar eas of id le cr op land and pastu r e r e
ver t ing to tr ees. However , the gr ow in g r eal izat ion of the
value of for ests for expand ing indu str ia l u ses stim u latedS tate legislatu r es to str engthen pr otection and m anagem en t
effor ts, w ith a con sequ en t m ar ked ri se in funding and ar eas
pr otected and a decr ease in acr eage bu r ned (app . table
In car rying ou t these expanded fir e pr otection pr ogr am s, for
estry agen c ies i n m any States worked w ith tim ber pr otec
46
tive or gan izations usu al ly m ade up of lar ge for est own er s.
In som e location s, owner s funded fir e pr otection by sim
ply paying a per - acr e assessm en t to the State . Elsewher e , lo
cal or gan izations car r ied ou t pr otection pr ogr am s w ith theirStates r eim bu r sin g a shar e of the cost .
P r escr ibed Bu r n in g
Resear ch an d Edu cat iona l Effor ts
Another factor i n the con tr o l of w i ldfir es w as the developm en t of pr escr ibed bum l ng as a for est m anagem en t pr ac
tice . T he ear ly goal of fir e exc lu sion in sou ther n for ests set
by the For est Ser vice and other ear ly for ester s pr oved tobe u nr eal istic . Field obser vations and exper ien ce plu s studies by r esear cher s at the Sou ther n For est
'
Exper im en t Sta
tion and elsewher e poin ted to per iodic pr escri bed bu r n ing asa pr actical w ay to lim it destr u ctive w i ldfir es. In the ear lyyear s, settler s had foun d that l ight bu r n in g i n p ine for estspr even ted the accum u lat ion of flam m able m ater ia l thatcou ld fuel r aging w i ldfir es . Bu r n in g the woods also benefi ted gr azing by br in gin g gr een gr ass i n the spr ing .
Although opposed for a tim e by som e for est adm in istr ator s,who fear ed the fight against w i ldfir e wou ld be comprom ised ,
pr escr ibed bu r n in g has been w idely adopted and has effec
tively r educed fir e hazar ds and acr eage bu r n ed wh i le sav
ing on the costs of fir e con tro l . Losses of tim ber and other
r esour ces have been r edu ced . Wher e p ine stands ar e desir ed ,
stand com position has been im pr oved by favor in g p inesover unwan ted har dwoods and other vegetation . Wi ld lifevalues, l ivestock gr azing , and r ecr eation also have beenenhan ced . It i s est im ated th at sever al m i l l ion acr es h aveunder gon e pr escr ibed bu r n ing an nu ally i n r ecen t year s.
Passage of fenc ing law s i n var iou s S tates also has helpedr educe the fr ee r angin g of livestock and lessened the i ncentive for gener al burn ing to impr ove l ivestock for age .
Fir e pr ogr am s of pr even t ion , suppr ession , and pr escr ibedbu r n ing have been enhanced by m any r esear ch and developm en t effor ts of public agenc ies, edu cat ional institu tions, andthe for est indu str ies. T he
'
techno logy of fir efigh ting develOped r apid ly after Wor ld War II w ith the use of tr actor s and
fire plow s, im pr oved access, use of air cr aft for fir e detootion and d ir ection of gr ou nd cr ew s, developm en t of two
w ay r ad io com m un icat ion , and successfu l exper ience w ithu se of fir e r etar dan ts dr opped fr om a ir cr afts. Recen t con
cer n abou t sm oke fr om for est fir es also st im u lated r esear chwh ich in d icated that im pacts can be lessened by r edu c in gw i ldfir es and u sin g pr escr ibed bu r n in g at pr oper tim es.

Fol low ing the Dixie Cr u sader s, var iou s edu cational pr ogr am s have been car r ied on by pr ivate gr oups and govemm en t agen cies. One of the m ost successfu l is the Sm okeyBear pr ogr am of the Nat ional Adver t isin g Cou n c il , theUSDA For est Ser vice , an d S tate for estr y depar tm en ts,wh ich was star ted du r ing Wor ld War II as a w ay to public ize the danger of hum an - cau sed for est fir es. T he KeepGr een and Tr ee Farm pr ogr am s of indu str ial and other pr i
vate owner s and effor ts Of or gan izations su ch_
as the TallTim ber s Resear ch Station in Flor ida have likew ise helped getacr oss the m essage of w ildfire pr even tion .
S ince 1956 ,fir e pr otection effor ts have also in c luded a se
r ies of r egional com pacts between gr oups of States and theFeder al Gover nment . Two m u lti - State‘
fir e compacts in the
Southeast and the Sou th Cen tr al regions have ser ved well incoordinating effort s and r esour ces am ong al l the State and
Feder al agenc ies concer ned in fir e pr otection . T he m echa
n ism for cooper ation in u se of per sonnel and equ ipm en tunder em er gency cond itions worked well in the destr uctivefir e season of 1985 .
As a supplem en t to gener al fir e pr otection on forest lands,the Ru r al Developm en t A '
ct of 1974 pr ovided F eder al funds
for u se by State for ester s in or gan izing , tr ain ing , and equ ipping vo lun teer fir e compan ies to pr otect comm u n ities in r u
r al ar eas. These fir e com pan ies also have been'
in tegr ated
in to the fir st l ine of attack on near by forest and br ush fires.
In summ ation , i t can be fair ly said that fir e pr otection is them ost w idespr ead and m ost effective timber man agem ent aotivi ty pr acticed in the Sou th . It m ade possible the natu r al r egener ation of m uch of the Sou th
’
s second and th ird for ests.
In'
add ition , con tr o lled fir e or prescr ibed bu rn in g has becom e a
_
w idely used m an agem en t pr actice . With appl icationin the r edu ction of fire hazar d , site pr epar at ion for standr egener at ion , and con tr o l of u ndesir able vegetation , pr e
scr ibed fir e has becom e an im por tan t too l in r egener at in gpine after har vest .
47
It can be fair ly said that fir e pr otection and
the use of prescr ibed bu r n ing are the m ostw idespr ead t im ber - m an agem en t act ivit ies
pr acticed in the Sou th , an d the m ost
effective . Con tr o l led fir e has m ade possiblethe n atu r a l r egener at ion of m u ch of the
Sou th ’
s second and th ird forests. W ith thedecl ine in r andom and destr uctive w i ldfir es,con tr o l led fir e or pr esc r ibed bu r n ing hasbecome an essen tial , relatively inexpensive,
and effective m anagem en t tool in pineforests.

T he extensive ar eas Of cu tover and non stocked lan ds thatchar acter ized m u ch of the Sou th in the 1920
’
s have ,for the
m ost par t , been r egener ated to som e- form Of for est gr ow th .
Most Of th is pr ogr ess w as the r esu lt of n atu r al r estock ingfo l low ing the spr ead of in cr easingly effect i ve pr otectionfrom w i ldfire . T he establ ishm en t of p in e p lan tat ion s,however , also accou n ted for exten sive r efor estation after
Wo r ld War 11 .
Feder a l Assistan ce for Refor esta t ion
T he Clark—McNar y Act pr ov ided lim ited fu nds for Cooper ation w ith the States i n obtain in g seeds and seed lin gs for r efor esting denuded farm lands . T he Agr icu ltu r al Con ser vationPr ogr am (ACP) beg inn ing in the 1930 ’
s and the So i l BankPr ogr am of the 1950
’
s also m ade possible add it ion al p lan ti ng Of farm lands .
These ear ly r efor estation effor ts, as w el l as ear ly for estryexten sion an d techn ical assistan ce pr ogr am s, w er e fu ndedth r ou gh the U .S . Depar tm en t Of Agr icu ltu r e and app liedon ly to farm forests. In 1985 ,
for exam p le , ther e wer e som e
40 m il l ion acr es of t im ber lands i n far m er ow n er sh ips, orabou t 22 per cen t of the total tim ber land ar ea in the Sou th
at that tim e (app . tables and In ear lier year s, theacr eage of tim ber land ow ned by farm er s Was m u ch h igher .
T he ho ld in gs Of other ind iv idu al pr ivate ow n er s i n 1985
com pri sed 66 m i llion acr es, or 36 per cen t of al l tim ber landsin the Sou th . These hold ings w er e in c luded in the For estr yIn cen tives Pr ogr am (FIP) adopted i n the 1970 ’
s to pr ovideadd itional Feder al fund in g for r efor estation and tim ber standim pr ovem en t .
Ar eas plan ted or seeded to for est tr ees pr ior to the m i d1930
’
s am ou n ted to on ly a few thou sand acr es annually (fig .
and app . tables P lan t in g by the CivilianCon ser vat ion Corp s cr ew s br ou gh t abou t an in cr ease in ar eas
r efo r ested du r in g the late 1930 ’
s, bu t-
tr ee -
p lan t in g’ pr ogr am s near ly stopped du r i n g Wor ld War 11 . After the w ar
,
plan tin g and seed in g effor ts incr eased sharp ly , par t icu lar lydu r ing the So il Bank Pr ogr am of the 1950
’
s, to a peak of
m i l l ion acr es i n 1959 . Althou gh p lan t in g dec l in edgr eatly ther eafter , i t has been on the r i se sin ce the m i d
1970’
s w ith the expan sion of incen tives su ch as State and
Feder al cost - shar es, for est m an agem en t assistance pr ogr am s,
and the r efor estat ion tax cr ed it en acted i n 1980 . In 1985 ,
over 2 m ill ion acr es wer e plan ted or seeded .
Tree plan ting du r in g r ecen t decades was gr eatly aided bydevelopm en t of r elatively in expensive tr ee-
plan t ing m ach in esand avai lability of con tr actor s to do the plan tin g . Heavy
equ ipm en t to pr epar e p lan tin g sites and effective herbic idesto con tr o l com petin g h ar dwoods also becam e available .
After 1974 ,Agr i cu ltu r al Con ser vation Pr ogr am funds
wer e supp lemen ted by Feder al fund in g thr ou gh the For estryIncen tives Pr ogr am ,a cost - shar ing effor t specifically aim ed
at im pr oving the cond ition Of both farm er and o ther ind ividu al pr ivate tim ber land owner sh ips by p lan tin g , standim pr ovem ent , site pr epar at ion for n atu r al r egen er ation , and
fir ebr eak constr u ction .
A m ajor par t Of the ar ea plan ted i n the Sou th , par ticu lar lyin r ecen t year s, is ow ned by the for est industri es and other
lar ge com pan ies. In 1985 , for exam p le , som e 60 per cen t
of the ar ea plan ted or seeded in the Sou th w as on lands ofthe for est industr ies and cer tain corpor ate ow ner s su ch as
r ai lr oad and u til ity com pan ies, com par ed to 3 5 per cen t onother pr ivate owner sh ips and abou t 5 per cen t on n ation alfor ests and other public ho ld ings. T he expan sion of r efor e
station effor ts, par ticu lar ly by the for est indu str ies, r eflectedeconom ic pr essu r es to in cr ease the pr odu ctiv ity of tim berland , availability of cap ita l for lon g—term “ in vestm en ts, and
im pr oved techno logy lead ing to r elatively h igher yields oftim ber on lands i n p lan tation s.
Par t Of the plan t in g and tim ber stand im pr ovem en t workon farm er and other ind ividu al pr ivate ow ner sh ips is attr ibu tab le to Feder al assistan ce u nder the Agri cu ltu r alCon ser vation Pr ogr am . Th is pr ogr am to en cou r age farmconser vation pr act ices in cluded som e lim i ted cost - shar e
paym en ts for tr ee p lan ting , tim ber stand im pr ovem en t and
w i ldlife- habitat im pr ovem en t . T he Agr icu ltu r al Conser vation Pr ogr am funding r ose fr om abou t ( 1982
dollar s) i n 1946 , for exam p le , to a peak of over $ 15
m i llion in 1959 du r in g the So i l Bank Pr ogr am (app . tableIn r etu r n for r etir in g agri cu ltur al land u nder th is
pr ogr am , farm er s r eceived assistan ce in plan tin g tr ees andannual paym en ts ther eafter du r i n g a con tr act per iod thatusually r an for 10 year s. Over a m i llion acr es wer e plan tedin 1959 under th is special pr ogr am . A peak of
acr es of stand im pr ovem en t work w as r eached in 1958 .
Up to 65 per cen t Of plan tin g costs and tim ber standim pr ovem en t costs ar e paid by Feder al fu nds and ther em ainder by landow ner s. Th is cooper ative pr ogr am i s
adm in ister ed join tly by two USDA agen c ies— the For est
Ser vice and the Agri cu ltur al Stabilization and Con ser vat ionSer vice— and S tate for estry agen c ies. Under the Agr i cu ltur al Conser vation and For estry Incen tives Pr ogr am s, tr ee
plan ting took p lace on m or e than acr es and tim berstand im pr ovem en t on abou t acr es i n 1980 and

ar e avai lable fr om Feder al sour ces such as the For estry In
cen tives Pr ogr am and Agr icu ltu r al Con ser vat ion Pr ogr am .
Com plem en ti ng Vir gin ia ’
s r efor estation act i s i ts lon gstan d in gSeed Tr ee Law , aim ed at en su r in g pr om pt r egener at ion of
har vested tim ber land . Th is l aw app l ies to any land w her eloblol ly , Shor t leaf , pond , or wh ite pine , and tu l ip poplarcon st itu te 10 per cen t or m or e of the l ive trees 6 in ches orm or e i n d iam eter at stum p height .
T he l aw r equ ir es th at a m i n im um num ber of seed tr ees peracr e be kept un cu t for 3 year s foll ow ing har vest . An am end
m en t i n the ear ly 1950 ’
s perm its lan dow ner s to c lear cu tw ithou t leav in g seed tr ees, pr ovided they secu r e the State
For ester’
s appr oval of a tr ee-
plan ting plan to be car ri ed ou t
fol low ing tim ber cu tt in g . S ite pr epar at ion i s r equ ir ed to en
su r e th at th e you n g p in e or pop lar tr ees w i l l be fr ee togr ow w ithou t com pet ition fr om u ndesi r able vegetation .
Another im por tan t par t of V i r gin ia ’
s r efor estation pr ogr ami s the public or ar ea for ester . Vir gin ia assigns at least onear ea for ester to each pineland cou n ty . T he ar ea for ester en
for ces the Seed Tr ee Law an d in form s landown er s of avai lable for estrytechnology and fin an c ial assistan ce . T he ar ea
for ester often gives inform at ion on alter n ative t im ber m an
agem en t pr escr ipt ion s and on the avai labil ity of pr ivate forestry con su ltan ts and ven dor s
,and can help landow ner s Ob
tain cost shar i n g .
Abou t thr ee- qu ar ter s of the pine stands har vested i n Vi rgin ia ar e r egen er ated to pine— substan t ial ly above the r ate
in other States. Sou thWide , onl y a l ittle over half of the pineand m i xed p in e—har dw ood stands har vested in r ecen t year s
have been r egener ated to p in e .
Mississippi , Nor th Car o l in a , an d Sou th Car ol in a also haveState cost - shar e for estr y in cen tive pr ogr am s. Texas andFlor ida ar e som ewhat d iffer en t . T he Texas For estr y Assoc i ation has form ed the Texas Refor estat ion Foundat ion topr ov ide financ ial assistan ce to landow n er s i n r etur n for a
comm itm en t to r efor est and m an age their land for at least10 year s. T he pr ogr am ,
w h ich r u n s in cooper at ion w ith theTexas For est Ser vice , i s funded by indu stry con tr ibu t ion s.
T he Flor ida For estr y Assoc iat ion and the Flor ida D iv isionof For estry also adm in ister a fund der ived fr om don ation sby tim ber com pan ies to supply landow ner s w ith seedlingsT he con tri bu tions and don ation s ar e deductible as bu sin essexpenses fr om Feder al in com e taxes.
50
In 1985 Sou thw i de , over acr es of other pr ivatelan ds w er e p lan ted w ith non - Feder al cost - sh ar e assistan ce ,
com par ed w ith acr es p lan ted w ith Feder al assistan ce (app . table
Refor esta t ion Tr en ds
T he r efor estat ion pr ogr am s in the Sou thover the past hal f cen tury have pr oduced a
sizable ar ea of p in e pl an tat ion s, som e of
whi ch have alr eady been har vested . In 1985 ,
exist ing pl an tat ions cover ed m i l l ionacr es— 1 1 per cen t of the total area of
timber land . Som e p in e plan tations, andpar t icu lar ly those on other pr ivateow ner sh ips, n atu r al l y r egener ate to m ixed
pin e—har dwoods or har dwoods after harvest .
The r efor estat ion pr ogr am s conducted i n the Sou th over thepast hal f cen tu r y h ave pr oduced a sizable ar ea of p lan tations of sou ther n p ines, som e of wh ich h ave alr eady beenhar vested . In 1985 , tr ee plan tations cover ed m i l l ionacr es— o r 24 per cen t of the total ar ea of p in e and pinehardw ood types in the Sou th (app . tables and On
for est i ndu stry lands, plan tations totaled m i ll ion acr es,
or 47 per cen t of the 2 8 m i ll ion acr es of p ine and pinehar dw ood stands i n indu stry ow ner sh ips. Plan tations onother pr ivate and public ow ner sh ips amoun ted to m i l
l ion acr es, Or 13 per cen t of the m i ll ion acr es of pine
and m ixed p in e—h ar dw ood for ests i n these ho ld ings.

Coun ter act ing the substan tial expan sion of pine plan tationsin r ecen t decades i s the fact that m any p ine stands havebeen conver ted to har dwood types by har vesting the pinesand allow ing the subsequen t n atur al succession of the landto m ixed pine—har dwoods or har dwoods. Between 1952 and
1985 , for exam ple , the ar ea of n atu r al pine dr opped som e3 1 m i l l ion ac r es, o r 43 per cen t , w h i le up land har dw oodtypes incr eased by m ill ion acr es (app . tables and
T he progr am s of tr ee plan ting in the Sou th have been m ateri
ally aided by an exten sive pr ogr am of r esear ch , inc lud ing ,for example , in vestigations on managem en t of tr ee nu r ser
ies that iden tified ways of lim iting seed ling losses fr om the
d iseases that often w iped ou t nu r ser ies i n the ear ly days.
Studies of genetic factor s have pr ovided gu ides to selectionof seeds fr om trees of super ior gr owth , form ; and r esistan ceto diseases such as fu siform r ust . In 1985 , for exam ple ,
over 60 per cen t of the nu r sery stock pr odu ced i n S tate n u r series consisted of genetically im proved seed lings (app . table
All Sou ther n S tates and m any m em ber s of sou ther nfor est indu str ies have established seed or char ds, and plan trng of genetically super ior stock con tinues to incr ease . Se
lection and br eeding pr ogr am s underway shou ld soon yieldfu r ther im pr oved second gen er ation p lanting stock .
Fu n d in g
T he fund ing thus m ade avai lable has suppo r ted stud ies byliter ally hund r eds of sc ien tists i n m any d isc ip l ines . For est
Ser v ice sc ien tists along w ith r esear cher s i n u n i ver sit ies and
other o r gan izations have issued thou sands of publ icat ion spr ov id ing in fo rm at ion on essen t ially a l l aspects of sou ther n
fo r est and r an ge m an agem en t and u t i l izat ion .
Form al research on problem s of sou ther n for estr y began inthe 1920
’
s, when the USDA For est Ser vice established theSou thern For est Exper im ent Station in New Or leans and theAppalach ian For est Exper im en t S tation i n Asheville , NC(r en am ed the Sou theaster n For est Exper im en t S tation i n
In pr ior year s, som e stud ies of forest and for est indu stry pr oblem s per tain in g to the Sou th had been conducted ,
including work on wood pr eser vation and n aval stor es pr oduction , bu t these effor ts wer e of l im ited exten t .
Du r ing the 1920 ’
s,the sm al l staffs at the Sou ther n Fo r est
Exper im en t S tation began a progr am of in vestigations onvar ious aspects Of tim ber m anagem en t , includ ing pr oblem sof fir e con tro l and regeneration of cu tover lands. Passageof the McSweeney
—McN ar y For est Resear ch Ac t in 1928
gave add itiona l im petu s to r esear ch on sou ther n for estry
pr oblem s by au tho r izin g incr eased fund ing of stud ies in al l
aspects of fo r estry . Also i n the 1930 ’
s , the slow ly expanding resear ch progr am in the Sou th w as m ater ially aided bywork of the Civilian Con ser vation Corpsa nd the beginn ingof long—term Cooper ation w ith sou ther n for est industr ies andsou ther n u n iver sities.
Fund ing for forestry r esear ch at both sou ther n exper im en tstations inc reased m oder ately du r ing the 1930 ’
s and 1940’
s
bu t grew r apid ly after Wor ld War 11 . Fo r est Ser v ice fu nding r ose fr om abou t m i ll ion ( 1982 do l lar s) in 1950 toa level of r ough ly $25 m i ll ion i n the sixtiesand seven ties(fig . and app . tables and Som e Of these
funds were allocated to un iver sities for cooper ative r esear ch
pr ojects. On the o ther hand , For est Ser vice funds have Of
ten been augm en ted by substan tial fin anc ial and other con
tr ibu t ions fr om S tate agenc ies and the for est industr ies.
Add i tion al Feder a l fu nds ar e m ade avai lable for r esear chth r ough the McIn t i re—S ten n is pr ogr am adm in ister ed by theUSDA Cooper ative S tate Resear ch Ser vice . These funds ar etr an sfer r ed dir ectly to for estry schoo ls in the var iou sun iversities. S im ilar ly ,
r esear ch funds have been m ade available since 1985 th r ough the For estry Com petitive Gr an tsProgr am . Competitive Gr an ts funds ar e pr ov ided thr ough theFor est Ser vice ’
s budget , bu t the pr ogr am is adm in ister edby the Cooper ative S tate Resear ch Ser vice .

52
1 93 6
Figu r e— Feder al fu nds allocated for r esear ch to For est Exper im en t Station s in the Sou th , 1929—86

T im ber Man agem en t Resea r ch
Tim ber m anagem en t r esear ch has accoun ted for the lar gestexpenditu r es of Feder al resear ch -
fu nds at the sou thern
exper im en t stations; these aver aged abou t m illion a year
( 1982 do llar s) in the per iod 1977—86 , or about one - th ird of.
the Feder al resear ch fund ing pr ov ided to the station s.
Classifications of resear ch by categor ies such as tim ber m an
agem en t are on ly appr oxim ate , however , for a given r e
search project m ay inc lude stud ies on m u ltiple aspects of
forestry .
T he r esear ch in tim ber m an agem en t has been concer n ed
w ith such problem s as fo r est r egener ation , genetic improvem en t of forest tr ees, basic plan t physio logy , n u tr ien tcyc l ing , cu ltu r al pr act ices such as con tr o l of unw an tedvegetation by chem icals and pr escr ibed bum ih g , fer ti lizationth inn ing , pr uning , and effects of t im ber har vest ingm ethods.
Ear ly tim ber m anagem en t stud ies at the Crossett Exper im enta l Fo r est i n Ar kan sas, for exam ple ,
dem on str ated tech
n iques and the econom ic feasibil ity of m an aging the youngpine stands that wer e natu r ally r egener ating on cu tover andid le cropland and pastu r e in the Sou th . Stud ies at Cr ossettand other exper im en tal for ests established by the For est Serv ice and un iver sities over the Sou th showed impr essive r atesof grow th in vo lu n teer stands of young pine,
tim ber . Un
doubted ly these find ings gave str ong im petus to both indu str ial fo r estr y pr ogr am s and effor ts to assist other pr ivateowner s, the ow ner sh ip c lass that con tin ues to ho ld m ost Ofthe tim ber land in the Sou th .
Grow th and yield tables developed by the For est Ser v iceand un iver sity r esear cher s fo r bo th natu r al stands and m an
aged plan tations have pr ov ided essen tial data fo r analysisof m an agem en t a lter n atives and investm en ts in tim bergrow ing . Other pr ojects have developed pr actic al m ethods
of con tro l l i ng undesirable vegetation by the use Of her bic ides and pr escr ibed fire . Stud ies of the si lv icu ltu r al effec tsof d ifferen t tim ber - cu tting m ethods have led to m anagem en tgu ides for var ious for est types and ow ner Objectives.
Althou gh m anagem en t for pine tim ber has been pr im ary in
souther n fo restry pr ogr am s, stud ies to gu ide m an agem en tof hardwoods have also been im por tan t in m any par ts of theSou th . Har dwood types cover m or e than half the total t imber land an d
'
pr odu ce valu able w ood p r odu c ts as we l l aspr ovid ing h abitat for w i ld l ife an d sites fo r ou tdoo r r ecr eation . Gu idel ines for r egener at ion and cu ltu r e of var iou s
hardwood spec ies have , ther efo re , been developed to a id
fo rest m anager s, par ticu lar ly for produc tion of valuable spe
c ies of bottom land hardw oods.
53
Ear ly r esear ch stud ies at the CrossettExper imen ta l For est in Arkansasdemonstr ated the techn iques and econom icfeasib i l ity of m an ag ing young pine stands
that wer e r egener at ing on cu tover lands inthe Sou th . T h is r esear ch gave strong
impetu s to both forest industry m anagement
pr ogr am s and the effor ts to assist the other
pr ivate timber owners, who ho ld most of thetimber land in the Sou th .
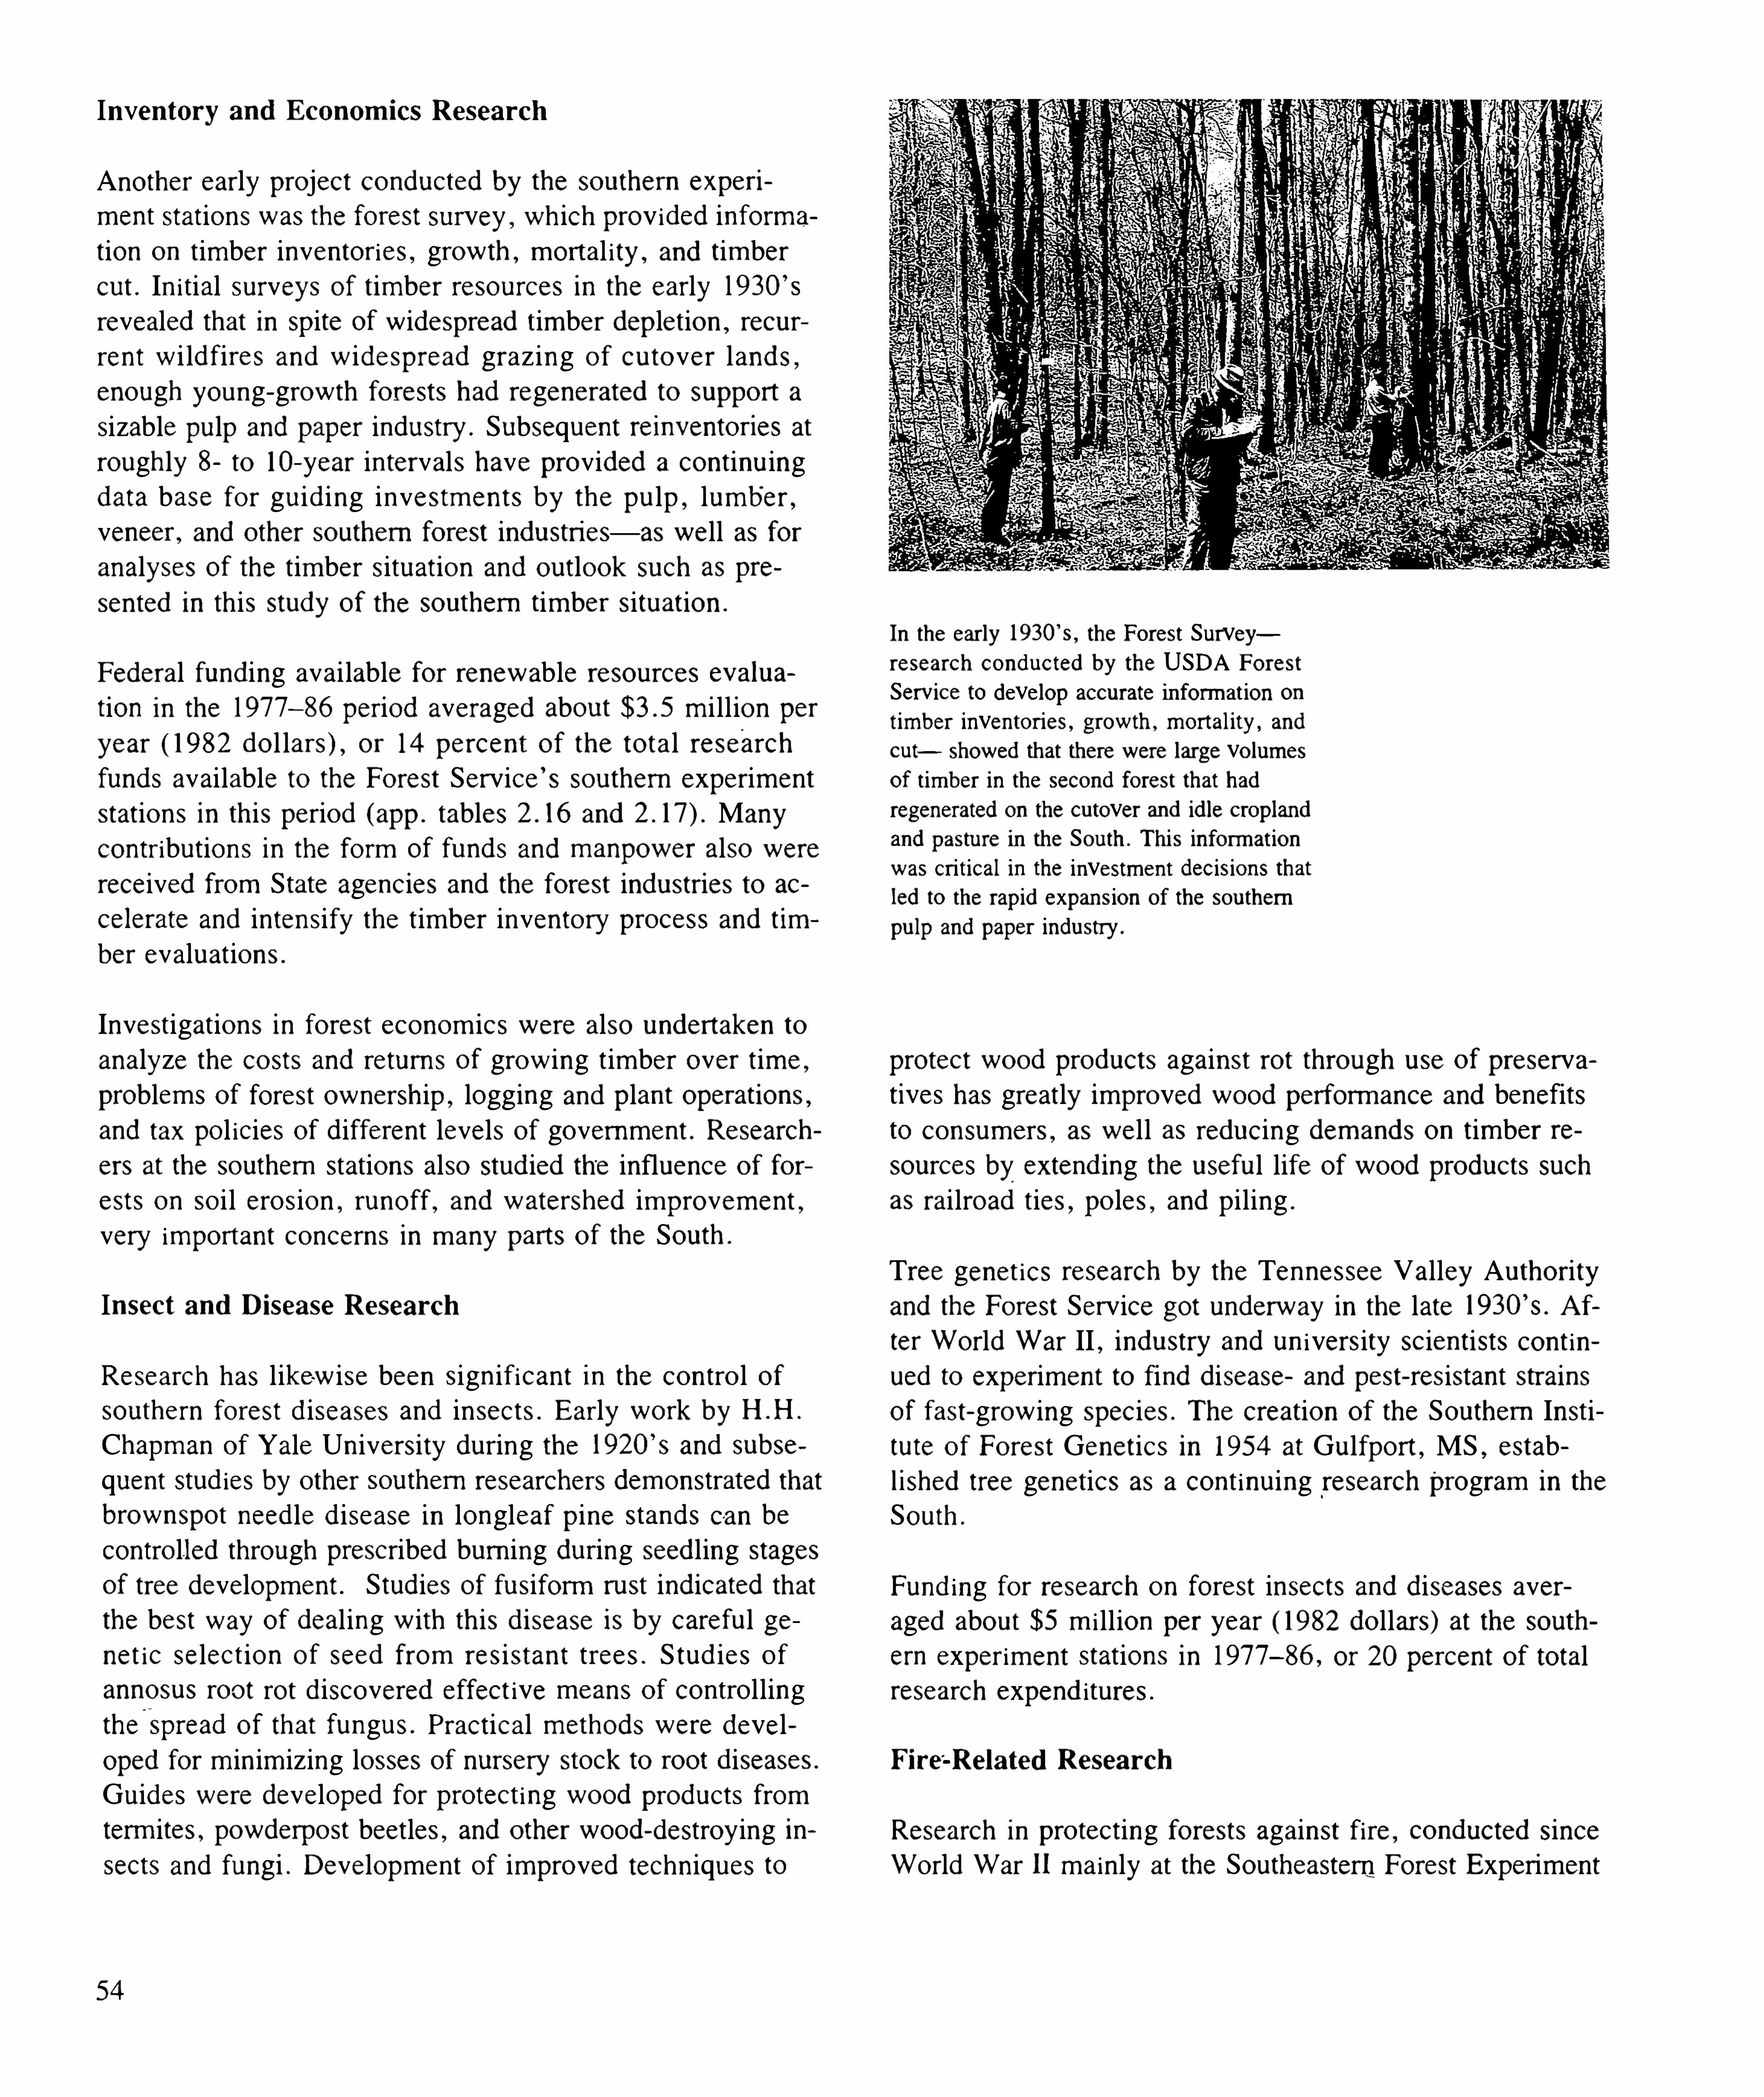
In ven tor y an d Econ om i cs Resea r ch
Another ear ly pr oject conducted by the sou ther n exper i
m en t stations w as the fo r est su r vey ,w h ich pr ov ided in form a
tion on tim ber inven tor ies, gr ow th , m or tal ity , and tim bercu t . In i tial su r veys of tim ber r esou r ces in the ear ly 1930 ’
s
r evealed that in spite of w idespr ead tim ber depletion , recu r
r en t w i ldfir es and w idespr ead gr azin g of cu to ver lands,
enough you n g - gr ow th for ests h ad r egener ated to suppo r t a
sizable pu lp and paper industry . Subsequen t r einventor ies atr ough ly 8 to l o-
year in ter vals have pr ov ided a con tin u ingdata base for gu id in g in vestm en ts by the pu lp , lum ber ,veneer , and other sou ther n forest indu str i es— as w ell as foran alyses of the tim ber situ ation and ou tlook su ch as pr e
sen ted in th is study of the sou ther n tim ber situation .
Feder al funding avai lable for renew able r esou r ces eva lu a
tion in the 1977—86 per iod aver aged abou t m i ll ion peryear ( 1982 do l lar s) , o r 14 per cen t of the tota l r esear chfu nds avai lable to the Forest Ser vice ’
s sou ther n exper im en tstation s in th is per iod (app . tables and Many
con tr ibu tion s in the form of fu nds and m anpow er also wer ereceived fr om State agen cies and the for est industr ies to ac
celer ate and in ten sify the tim ber in ven to ry pr ocess and t imber evalu ations.
In vestigation s i n fo r est econom ics w er e also u nder taken to
analyze the costs and r etu r n s of gr ow ing tim ber over tim e ,
pr oblem s of for est ow ner sh ip , logging an d plan t oper ation s,and tax pol icies Of d ifferent levels of gover nm en t . Resear ch
er s at the sou ther n stations also stud ied the influence Of fo r
ests on so i l er osion , r u noff , and w ater shed im pr ovem en t ,very im por tan t concer n s in m any parts of the Sou th .
In sect an d Disease Resea r ch
Resear ch h as l ike-w ise been sign if ican t i n the con tr o l ofsou ther n for est d iseases and in sec ts. Ear ly w o rk by H . H .
Chapm an of Yale Un iver sity du r in g the 1920 ’
s and subse
quen t stud ies by other sou ther n r esear cher s dem on str ated that
b row n spot n eed le d isease in longleaf pine stan ds ca n be
con tr o ll ed th r ough prescr ibed bu rn ing du r ing seed ling stagesof tr ee developm en t . Studies of fu siform r u st ind icated thatthe best w ay of deal in g w ith th is d isease is by car efu l genet ic selec t ion of seed fr om r esistan t t r ees . S tud ies of
annosus r oot r ot d iscover ed effec t ive m ean s of con tr ol lingthe
—
spr ead of that fu n gu s. Pr actica l m ethods w er e developed for m in im izing losses of nu r sery stock to root d iseases.
Gu ides wer e developed for protect ing wood pr oducts fromterm ites, powderpost beetles, and other wood - destroying insects and fu ngi . Developm en t of im proved techn iques to
54
pr otect wood pr oducts again st r ot th rough use of pr eser vat ives has gr eatly im pr oved w ood per form ance and benefitsto consum er s, as wel l as r edu c ing dem ands on tim ber r esou r ces by extend ing the usefu l life of w ood products such
as r ai lr oad ties, po les, and pi ling .
Fund ing for resear ch on for est insects and d iseases averaged abou t $5 m i ll ion per year ( 1982 do llar s) at the south
er n exper im ent stations i n 197 7—86 , or 20 per cen t of totalresear ch expend itu r es.
Fi r e- Rel a ted Resea r ch
Resear ch in pr o tecting for ests against fi r e ,conducted since
Wor ld War 11 m a in ly at the Sou theastern For est Exper im en t
In the ear ly 1930’
s, the For est Surveyr esear ch conduc ted by the USDA For estSer vice to develop accu r ate in form at ion on
t imber inven tor ies, gr ow th , m or tal ity , and
cu t showed that there wer e l arge vo lumesof t im ber in the second for est that had
r egener ated on the cu tover an d idle cr oplandand pastu r e in the Sou th . T h is in form at ionw as cr itical in the investmen t dec isions thatled to the r apid expan sion of the sou ther n
pu lp and paper industry .
Tr ee genet ics resear ch by the Ten nessee Valley Au tho r ityand the Fo rest Ser vice got underw ay in the late 1930 ’
s. Af
ter Wor ld War II , indu stry an d un iver sity sc ien tists con t inued to exper im en t to find disease and pest
- r esistan t str ain sof fast - gr ow ing spec ies. T he cr eation of the Sou ther n Institu te of For est Genetics in 1954 at Gu lfpor t , MS , establ ished tree genetics as a con t inu ing r esear ch pr ogr am in the
Sou th .

S tation ,has invo lved abou t m i l l ion per year ( 1982
do llar s) between 1977 and 1986 , o r 6 per cen t of total r esearch funds avai lable to the sou thern stations. Fire r esear ch
has helped in developing fi r eedanger r atin g system s that
have been of m uch pr actical value in fir e con tr o l pr ogr am s .
Sc ien tists at a regional fire r esear ch cen ter in Macon , GA ,
have im pr oved techn iques for effect ive u se Of a ir c r aft i ndropping fire r etardan ts. Measu r es have been developed forlim iting sm oke im pacts from pr escr ibed fire . Other stud ieshave concluded that per sonal con tact“ i s m ost effective i ncomm un icating fire pr even tion m essages .
For est P r odu cts an d Ut i l i zat ion Resea r ch
Research in u ti l ization of for est pr oducts has also been impo r tan t at the sou ther n exper im en t station s, par t icu lar ly inthe last 20 year s.
Fundin g du r ing the 1977—86 per iod aver aged near lym i l lion year ly ( 1982 do l lar s) , or 9 per cen t of the For estService ’
s r esear ch funds al located to the sou ther n stations.
Of spec ial im por tance was a p r ogr am of stud ies on sou th
er n pines conducted at the Sou ther n Fo r est Products
Labor atory at Alexandr ia ,LA , and r esear ch at Athen s,
GA ,conducted in cooper ation w ith the Un iver sity of
Geor gia . Th is r esear ch also has inc luded fo r est engineer ingstudies aim ed at im pr ov ing effic iency in logging .
T he Forest Products Labor atory .of the USDA Forest Ser vice ,
establ ished in Madison ,WI, in 19 10 ,
has condu cted a com
prehensive progr am of for est pr oduc ts r esear ch having num erous appl ication s in the Sou th . Rough ly a th ir d of thelabor atory ’
s fu nd in g has been used for u ti lization stud ies ofsou ther n fo r ests. Of spec ial note ar e in vestigations of pu lping of sou ther n har dwoods, im pr ovem en t Of pr ocesses for
bleaching pu lp fo r use i n pr in ting paper s, im pr ovem en ts intechno logy in lum ber m anufactu r ing and kiln drying , and deve lopm en t of techno logy for pr oduc tion of plyw ood and
other panel produc ts fr om sou ther n tim ber spec ies. Th is r esearch has been an impor tan t factor in the expansion of the
sou ther n pu lp and softwood plywood indu str ies.
Other Resear ch
Other forestry r esear ch pr ogr am s of the For est Ser vice lnc lude stud ies of the m anagem en t of for est and r elated r angelands for l ivestock , r ecr eation ,
w i ld life and w ater shed
protection ; econom ic aspects of r enewable r esou r ces m an
agem en t and uses; and insect and d isease su r veys. Abou tm illion per year ( 1982 do llar s) w as spen t for those pr o
gr am s in the per iod 1977—86 , o r 14 per cen t of al l r esear ch
expend itu res at the sou ther n station s.
Un iver si ty Resea r ch
In 1962 , the McIn ti r e—Stenn is Cooper ative For est Resear chAct was passed thr ou gh the effor ts of vari ou s State , Feder al ,and pr ivate assoc iation groups. Th is act pr ovided greatlyincr eased Feder al fund ing to land - gr an t and other S tate
suppor ted for estry schoo ls, on a m atch ing basis, forresear ch on the m anagem en t and u t i lization of for ests and
r elated r angelands, and for tr ain ing of scien tists in forestr yand r elated specialties.
55
For estry r esear ch at sou ther n u n iver sit ies also took on m a
jo r im por tance after Wo r ld War II . Fo r m any pr ior year s,the sm al l fo restry facu lties at sou ther n u n iver sities car r iedheavy loads of teach in g and extension - type r esponsibil itiesand had little tim e for resear ch pr ojec ts. A few exper im en
ta l for ests wer e established i n the 1930 ’
s by Aubu r nUn iver sity , Duke Un iver sity , Nor th Car o l in a S ta te , and
Clem son Co llege ,to condu ct dem onstr ation s and em pir ical
studies of r efo r estation and o ther pr ac tices.
T he Hatch Act of 1887 had prov ided fu nd ing fo r som e re
sear ch of forestry and r elated r ange problem s, bu t S tate o r
gan izat ions expr essed a gr eat deal of concer n over the lowlevel of th is suppor t . In 1952 , on ly o r less than1 per cen t of a l l Hatch Act fu nds received by S tate agr icu l
tu r e exper im en t stations in the Sou th ,w as al located to the
study of forestry pr oblem s. State fu nd ing of forestry r esear chw as likew ise lim ited .
In the year s after Wor ld War 11 , som e r esear ch w as never
theless car r ied ou t at sou thern un iver sit ies, in c lud ing worksuch as that by Co i le and Schum acher at Duke Un iver sityon growth and yield of sou ther n pines. Th is effor t also provi ded an ou tstand ing exam ple of r esear ch com bined w ithtr a in ing of gr adu ate studen ts . In an o ther , m or e r ecen t
exam p le , r esear ch on fo r est tr ee im pr ovem en t by B r u ce
Z obel of Nor th Car o l ina State , Ray Goddar d of the Un iversi ty of Flo r ida , and o ther s developed in to com pr ehensivecooper ative pr ogr am s of tr ee selection for seed or chards.
Fund ing avai lable to sou ther n u n iver sities incr eased r apidlyfollow ing passage of the McIn ti r e—Stenn is Act , r each ing by1983 abou t m i l l ion fr om al l sou r ces. S tate appr opr iations in that year am oun ted to m il lion , or 5 1
per cen t of the total funds avai lable , far exceed ing theFeder al—State m atch ing fu nd r equ ir em en ts of the 1962 Act .
Feder al funds avai lable through the McIn ti r e—Stenn isAct and
other Feder al sou r ces totaled m i ll ion ,or 3 1 per cen t
Of the total . Appr oxim ately m il l ion , o r 18 per cen t of
the fu nds avai lable for u n iver si ty r esear ch w as r eceivedfr om the for est indu stri es and other sou r ces.
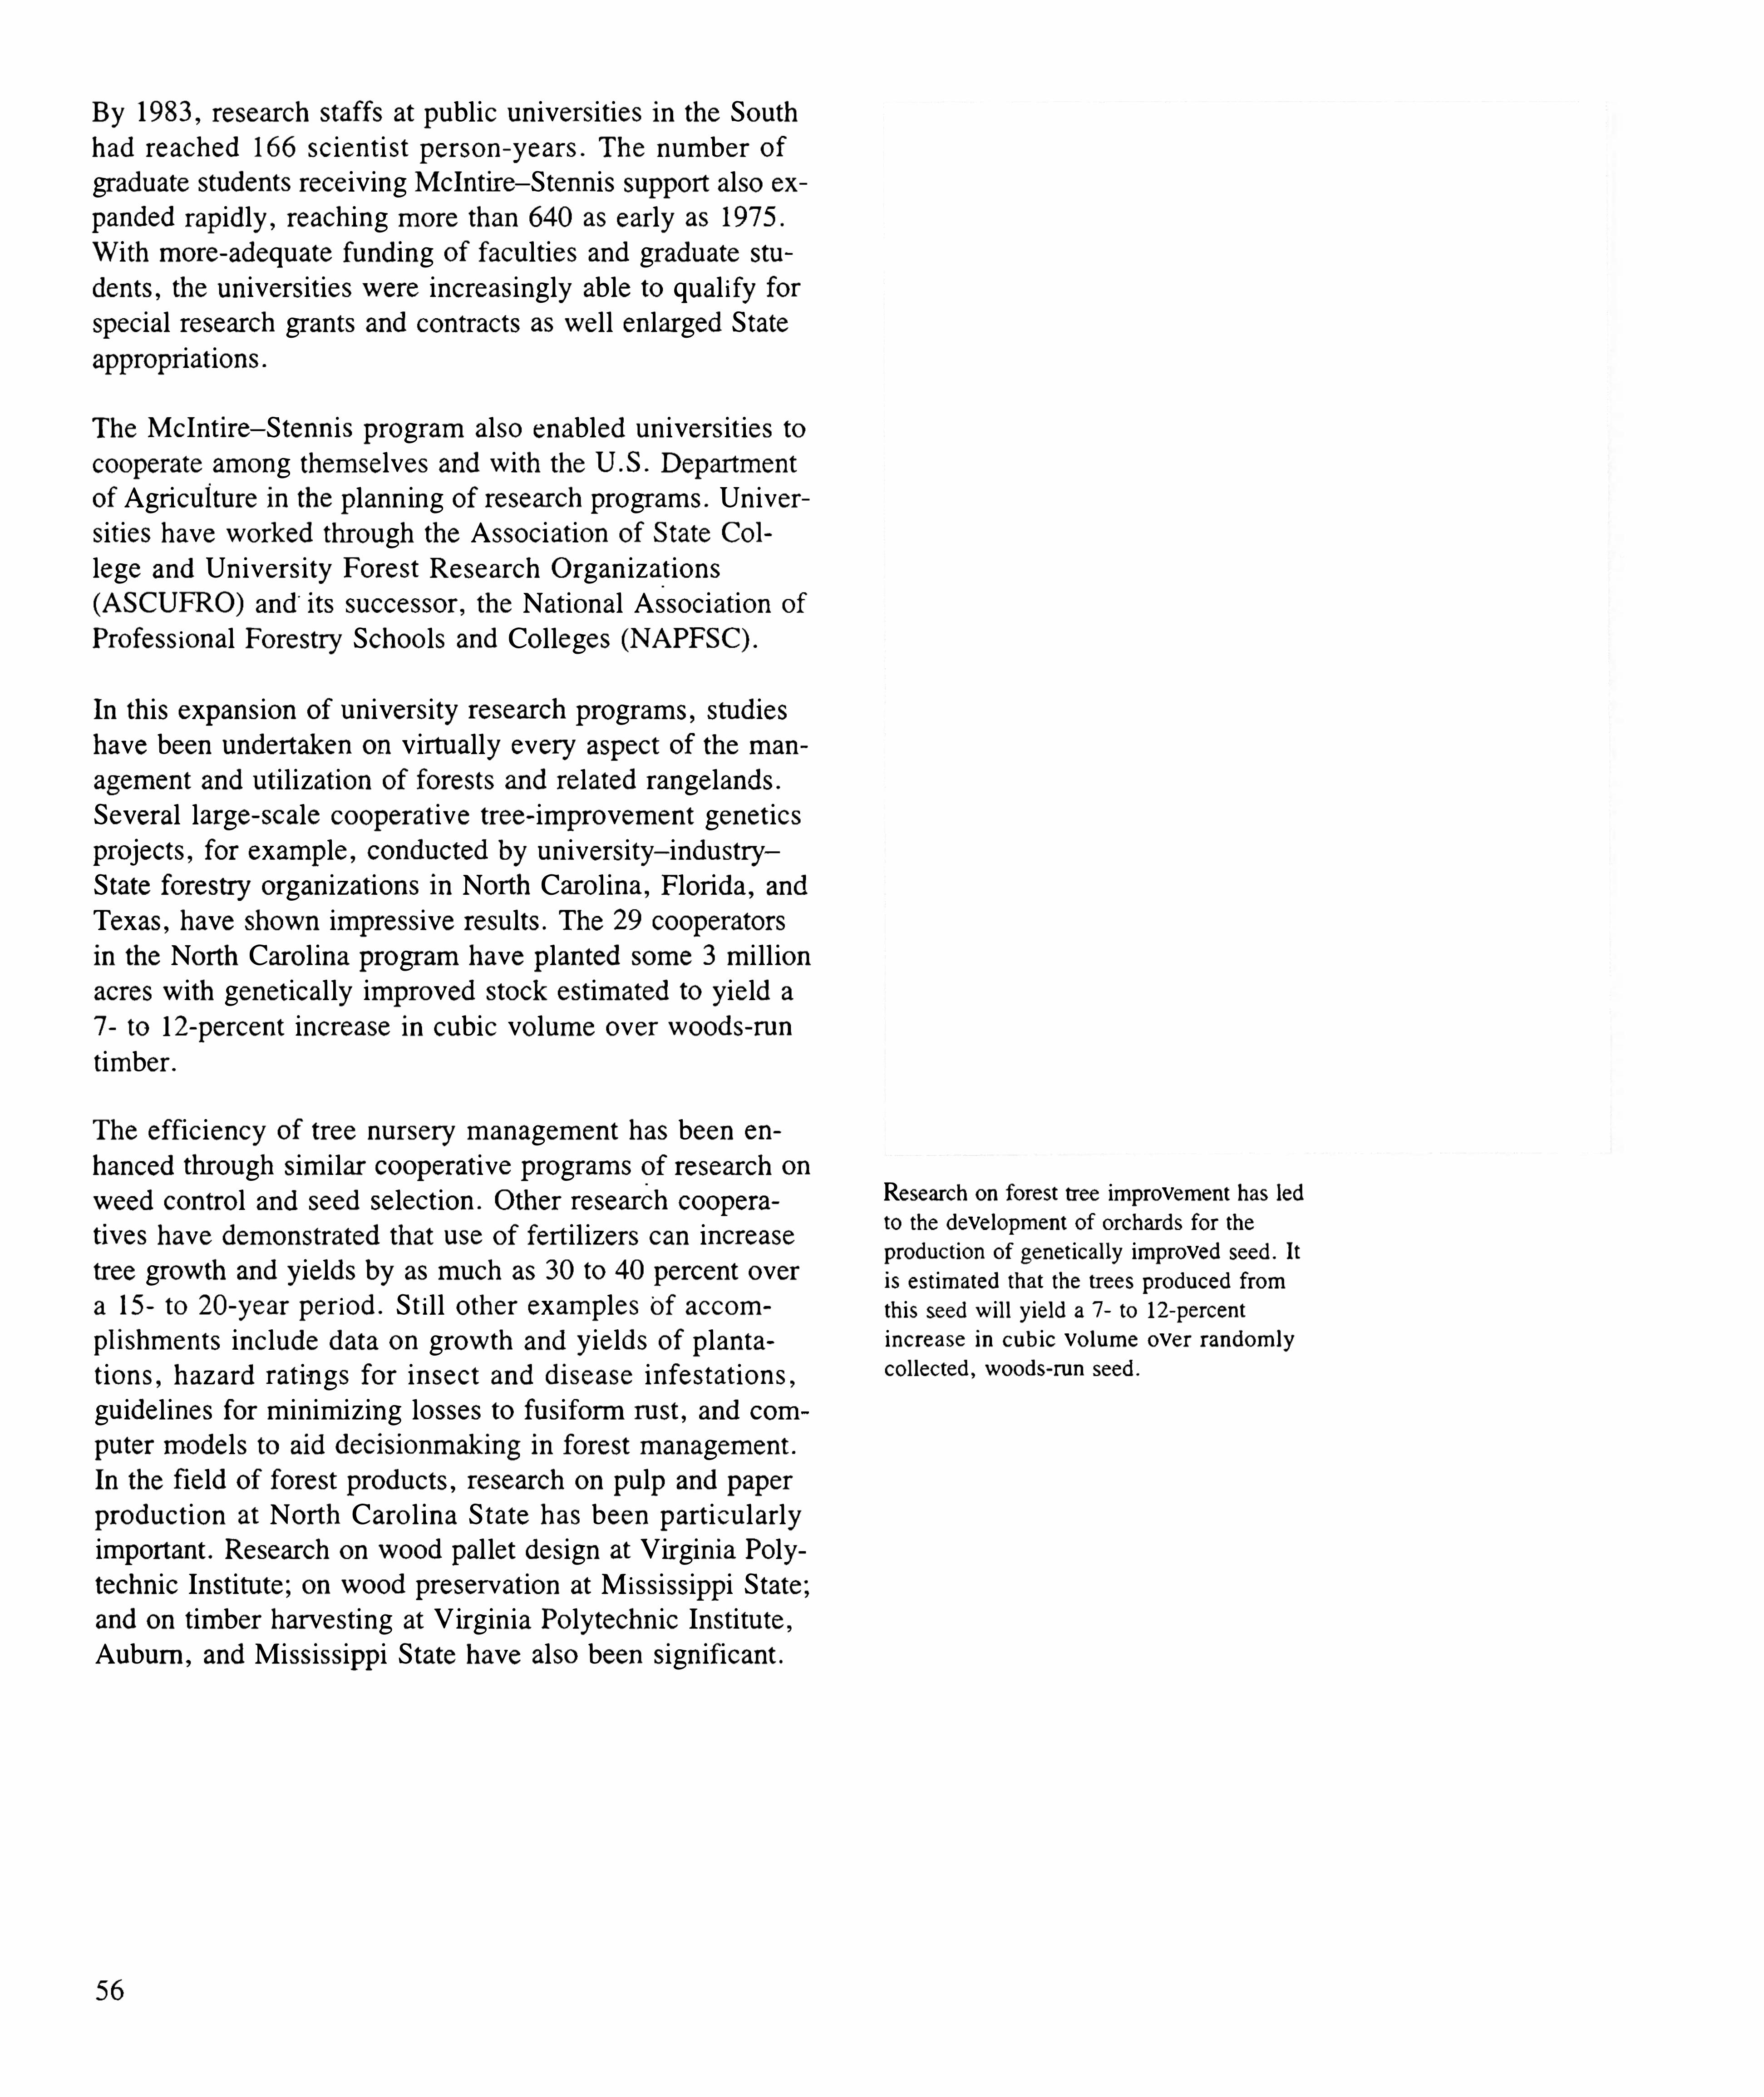
By 1983 , r esear ch staffs at public u n iver sities i n the Sou thhad r eached 166 sc ien t ist per son —year s . T he n um ber ofgr aduate studen ts r eceiving McIn tir e—Sten n is suppor t also ex
panded r apid ly , r each in g m or e than 640 as ear ly as 1975 .
With m or e- adequ ate fu nd in g of facu lties and gr adu ate stu
den ts, the un iver sities w er e in cr easingly able to qual ify forspec ial r esear ch gr an ts and con tr acts as w ell en lar ged Stateappropr iations.
T he McIn t i re—Stenn is pr ogr am also en abled u n iver sit ies tocooper ate am ong them selves and w ith the U .S. Depar tm en t
of Agr icu l tu r e in the plan n in g of r esear ch pr ogr am s. Un iversities have w orked thr ou gh the Associat ion of State Co l
lege and Un iver sity For est Resear ch Or gan izations(ASCUFRO) and i ts successor , the Nation al Association of
Pr ofession al For estry Schoo ls and Co lleges (NAPFSC) .
In th is expansion of u n iver sity r esear ch progr am s, stud ieshave been under taken on vir tu ally every aspect of the m an
agem en t and u t ilization of for ests and r elated r angelands.
Sever al lar ge- scale cooper at ive tr ee - im pr ovem en t genet icsprojects, for example , condu cted by u n iver sity—indu stryState for estr y or gan izations i n Nor th Car o lin a , Flor ida , and
Texas, have shown im pr essive r esu lts. T he 29 cooper ator s
i n the No r th Car ol in a pr ogr am have plan ted som e 3 m i ll ionacr es w ith gen etical ly im pr oved stock estim ated to yield a
7 to 12 -
per cen t incr ease i n cubic volum e over w oods- r un
tim ber .
T he effic ien cy of tr ee nu r ser y m an agem en t has been en
hanced thr ough sim i lar cooper ative pr ogr am s of r esear ch on
weed con tr o l and seed selection . Other r esearch cooper a
tives have dem onstr ated that use of fer t il izer s can in cr easetr ee grow th and yields by as m uch as 30 to 40 per cen t over
a 15 to 20 -
year per iod . S t i l l other exam ples Of aecompl ishm en ts in c lude data on gr ow th and yields of plan tation s, h azar d r at in gs for in sect and di sease in festat ion s,
gu idelines for m in im izin g losses to fu siform r u st , and com
pu ter m odels to a id dec isionm aking in for est m an agem en t .
In the field of for est pr odu cts, r esear ch on pu lp and paper
pr odu c tion at Nor th Car o l in a S tate h as been par t icu lar lyim por tan t . Resear ch on wood pal let design at Vir gin i a Polytechn ic Institu te ; on wood pr eser vat ion at M ississippi State ;and on tim ber har vesting at Vir gin ia Po lytechn ic In stitu te ,
Aubu r n , and Mississippi State have also been sign ifican t .
56
Resear ch on for est tr ee impr ovemen t has ledto the developm en t of or char ds for the
pr oduc tion of genet ical l y impr oved seed . It
i s est im ated th at the tr ees pr oduced fr omth is seed w il l yield a 7 to 12 -
percen t
incr ease in cu b ic vo l um e over r an dom l ycol lected , woods- r un seed .

of r esear ch to farm er s and other r u r al people . For m any
year s, however , effor ts devoted to sou ther n for estry wer e
very lim ited .
In 1924 , the Clarke—McNary Act au thor ed Feder al fund ingon a m atch ing basis w ith S tates to aid farm er s by pr ovid
ing inform ation on m anagem en t and u ti l izat ion of for est
r esour ces. T he act stim u lated the appo in tm en t Of the fir stfu ll - tim e pr ofessional extension forester s in m ost of the landgr an t un iver sities of the Sou ther n States. Although they wer efew i n num ber , they had an im pact , espec ially i n fir e pr even t ion pr ogr am s. In 1937 ,
the Nor r is—Doxey Farm Forestry
Act fu r ther str engthened exten sion wo rk i n forestry to becar r ied ou t thr ough var ious education al pr ogr am s su ch as
dem onstr ations and publication s.
T he Non i s—Doxey Act also m ade pr ov ision for a pr ogr amof techn ical assistance to ind ividu al owner s of farm for ests.
T he So i l Con ser vat ion Ser vice in itial ly con du c ted th ispr ogr am , bu t in 1943 i t w as tr ansfer r ed to the For est Ser
vice , cooper atin g State for estr y agen c ies, and State extension ser vices. In som e Sou ther n States, the State extensionser vices wer e r esponsible for farm for estr y education and
such techn ical assistan ce un ti l the Cooper ative For est Man
agem en t Act of 1950 expanded the techn ical ser vice r o le Ofthe State for estry agenc ies.
Am endm en ts to the Clarke—McNar y Act and the Resear ch
and Marketing Act of 1954 pr ovided for add ition al extension work w ith pr ocessor s Of for est pr oducts . Fin a l ly i n1978, the Renew able Resou r ces Extension Act gave a
spec ific char ter for edu cational pr ogr am s in for est and r angelands m anagem en t for m u ltiple pu rposes, u ti lization of for
est pr oducts, and u r ban for estry . In cr eased Feder al fund ingther eafter has been m or e than m atched by State and localcon tr ibu tor s.
For m any year s, m ost State exten sion ser vices had on ly oneto two for estry spec ial ists, althou gh the num ber s in cr easedover tim e . By 1985 , ther e wer e 84 spec ialists in for estryand for est pr oducts conducting exten sion work in 1116 5 0 111111 ;7 of the 12 Sou ther n States had 5 or m or e of these spec ialists.
Exten sion for ester s have gener ally Oper ated on a S tate or
m u lti coun ty basis thr ough such m ean s as field dem onstr a
tions of for estr y pr actices, tour s, con fer en ces, new sletter s,r ad io and television talks, and publications. Recen tly , i h
vestm en t an alysis also has been pr ovided i n at least e igh tSou ther n States to ai d landowner s i n m ak in g dec isions onr efor estation , m an agem en t , and tim ber har vesting . Work w ith
58
4- H Clubs and m or e r ecen tly w ith u rban ow ner s of for est
land and coun ty landowner o r gan izations has m ade up par t
of the for estry exten sion pr ogr am . For est pr oducts extension spec ial ists have also worked d ir ectly w ith c lien t firm s
and w ith gr oups of wood pr ocu r em en t for ester s, pr ivate logging con tr actor s, and lum ber ki ln drying Oper ator s to pr ovide inform ation on new techno logy .
Con tin u in g Edu ca tion P r ogr am s
Con tinu in g education for for ester s and r elated spec ial iststhr ough shor t cour ses, conferences, workshops, and symposia has constitu ted a sign ifican t par t of for estry extensionwork in the Sou th . These activit ies have inc luded sym posiaon fu siform r ust , the m an aged slash pine ecosystem , and
bottom l and har dwood silvicu ltur e , am ong other topics. Shor t
cour ses have inc luded a w ide var iety of topics such as ao
r ial photogr amm etr y , tim ber in ven tor ies, u se of herbic ides,pu lpwood h ar vest in g , wood d r yin g an d fin ish in g , and
taxation .
Con tinu ing education has been an impor tan tm eans of im pr oving timber m an agem en t byincr easing the effectiveness Of publ icfor ester s, consu lt ing for ester s, for estrycon tr actors, logger s, and Other sworking w ith
pr ivate t im ber land owner s. T h is educationthr ough shor t cou r ses, conferences,
workshops, and symposia has been a
sign ifican t par t of for estry extension work inthe Sou th .

Con tinu ing education pr ogr am s have been an ind ir ect m ean sof aiding pr ivate tim ber land owner s by incr easing the know ledge and effectiveness of public for ester s, consu lting for ester s, and for estry con tr actor s. In _ r ecen t year s, between 800and fo r ester s have part ic ipated an nu a l ly
-
i n su ch
tr ain ing , w ith for est indu stry pr ofessionals and con su ltingfor ester s the lar gest gr oup in attendance .
A_final activity of u n iver sity and exten sion facu lty— as i n
the case of m em ber s of Feder al and State for estry or gan izations and m any pr ivate assoc iations— m ay be defined as pub
l ic ser vice . Facu lty m em ber s, agen cy adm in istr ator s, andother pr ofessionals con tr ibu te tim e and ener gy to theadvancemen t of for estr y itself . Many have helped in obtaining legislation for progr am s of fir e pr otection and other con
ser vation activities. Lar ge num ber s h ave pr ovided techn icalassistance in developing public po l icy on for est conser vation issues.
Influ en ce of P r ofession a l O r gan i zat ion s an d In du str y
In the gener al ar ea of forestry education aim ed at the Am er ican public , the activities of a n um ber of o r gan ization s havebeen of m ajor im po r tance . As c ited elsewher e , the Am er ican For estr y Assoc iation has worked thr ough publications,confer ences, and testim ony on legislation to '
advance understand in g of for est conser vation pr oblem s and needs. T he
Soc iety of Am er ican For ester s has pr ovided a flow of ln
form at ion on al l aspects of for estr y thr ou gh'
su ch m ed ia as
the Jou r nal of For estry , For est Sc ience ,and the Sou ther n
Jour n al of Appl ied For estry .
Other jour nals such as the For est Farm er , Sou ther n Lum berm an , and the publication s of State extension ser vices, forestry comm issions, and depar tm en ts and the For est Ser vicehave helped car r y con ser vation m essages to al l par ts of the
Sou th . Cooper ative effor ts such.
as the Sm okey Bear and
Woodsy Ow l pr ogr am s have helped edu cate the public onfir e pr otection and po llu t ion con tr o l .
For est industri es l ikew ise have established both associationand company progr am s, such as the Keep Gr een and Tr eeFarm Pr ogr am s, to public ize the n eed for for est pr otectionand m anagem en t . Fo llow ing establishm en t of the fir st tr eefarm i n Wash ington State by the Weyer haeu ser Com panyin 1941 , the concept qu ickly spr ead i n popu lar ity thr oughou t the Sou th . Gr ow ing tr ees as a cr op was not new in the1940
’
s, bu t Cer t ifying landowner s who dem onstr ated goodfor estr y pr ovided r ecogn ition and a stim u lu s to better forest m anagem en t .
Giffor d Pin chot ZprOposed a Feder al pr ogr am to assist forest ow ner s in the m an agem en t of t im ber lands as ear ly as
1898 . Shor tly after he took Office as ch ief of the Divisionof For estry , Cir cu lar 2 1 , “
Pr actical Assistance to Farm er s,Lum berm en , and Other Owner s of For est Land ,
”was
issued , beginn ing the fir st of m any effor ts in Feder al cooper ative for estry.
For m any year s, the num ber of for ester s offer ing techn icalassistan ce to tim ber land owner s and operator s w as ver yl im ited . In 1937 , the Nor ri s—Doxey Cooper ative Far m For
estry Act pr ovided som e Feder al fund ing and di r ect techn ical
“
assistance for ind ividu al farm wood land owner s as wellas for exten sion educat ion . Du r in g Wor ld War II , the Forest Ser vice also established a for est ut ilization ser vice at forest exper im en t stations to help impr ove sawm i ll Oper ations,assist in locat in g tim ber for spec ial n eeds, and otherw isehelp i n the w ar effor t .
T he Cooper ative For est Man agem en t Act of 1950 greatlystrengthened the techn ical for estry assistance progr am s conducted by State for estr y or gan ization s and the For est Service . T he au tho r ization w as incr eased to $20 m i l l ion peryear , w ith Feder al fund ing to be m atched by State contr ibutions. In add ition , the act br oadened the pr ogr am to includeal l pr ivate landowner s, for est oper ator s, wood pr ocessor s,and public agenc ies involved in m u ltip le- use m anagem en t offorest lands, u tilization of fo r est produ cts, and u r ban forestry . Final ly in 1978, the Cooper ative For est Assistance Actclar ified the scope of the vari ou s Feder al—State cooper ativefor estry effor ts and established new au thor izations for Feder al cooper ative fund ing .
Feder al funds avai lable for COOper ative for est- m an agem en t
assistance in the Sou th incr eased consider ably over the year sfrom abou t $ 1 m il lion per year ( 1982 do l lar s) in the ear ly1950
’
s to a peak of .$5 .9 m ill ion in 1981 (fig . and app .
table Subsequ en tly , Feder al con tr ibu tions fell to on lym i ll ion i n 1985 . State contri bu t ions to th is cooper a
tive progr am have exceeded Feder al fu nd in g by incr easingam oun ts. S tate funds r ose from abou t m i ll ion ( 1982do llar s) per year in the ear ly 1950 ’
s to near ly $25 m ill ionin 1984 .

Figu r e — Feder al and S tate expenditu r es for for est m an agem en t assistance i n the Sou th , 195 1—85 . For est m an agem en tassistance includes Cooper at ive For est Man agem en t and Ru r al For estry Assistan ce
Role of State Ser vi ce For ester s
Car rying ou t cooper ative for est m anagem en t pr ogr am s oftechn ical and financ ial assistan ce has r equ ir ed the developm en t of a pr ofession a l
‘
cor ps of for ester s i n the S tate ,
Feder al , and pr ivate sector s. For example , in 1985 ther e
wer e som e 481 State pr ofession al “
ser vice for ester s em
ployed in these pr ogr am s in the Sou th (app . tableFor est In du str y Assistan ce
Assistance to landow ner s and other gr oups has included such
tasks as developing forest plans; m arking tim ber for cu ttin g ;advising on pr actices to enhance tim ber gr owth and qu ality ,
such as r elease , th in n in g , fer t i l izing , and pr escri bed bu r n ing ;and advisin g on tim ber sales, logging pr actices, and processing of for est pr oducts. State ser vice for ester s gener ally pr ovide a l im ited am ou n t of assistance per ow n er per year ,m ain ly to sm al l owner s who m ight not be able to afford
consu ltan ts or qu al ify for industry - suppor ted pr ogr am s.
60
State and Feder al for ester s also have worked w ith the So ilConser vation Ser vice in plan n ing and conducting cer tain forestry activ ities u nder the Water shed Pr otection and FloodContr o l Act '
of 1954 . T he So i l Conser vation Ser vice and
Soi l Con ser vat ion D istr icts have fu r n ished some techn icalassistance in for estry in connection w ith farm plann ing andother con ser vation pr ogr am s.
Many com pan ies in the for est industr ies have also pr ovidedtechn ical assistance to pr ivate tim ber land owner s. As ear lyas 1939 , the In ter n ational Paper Company designated a number of i ts field per son nel to help other pr ivate owner s in
tim ber m anagemen t and m arketing . Most of the techn ical assistance cam e fr om pu lp and paper com pan ies and industr ia l groups su ch as the Sou ther n Pu lpwood Con ser vationAssoc iat ion , now par t of the Am er ican For est Counc i l .

Such industr y assistance pr ogr am s have r anged fr om a few
ser vices to alm ost total m anagem en t of land and tim ber under m or e or less form al “ Tr ee Farm Fam i ly” ar r angem en ts.
Land enr ol led in industr ial m anagem ent assistance pr ogr am sin the Sou th in 1984 totaled some m i ll ion acr es.
Con su l tin g Fo r ester s
In add ition to public and indu stry pr ogr am s; techn ical forestr y assistance h as a lso been offer ed by m any pr ivateconsu ltants. Consu lting for estr y ser vices available to pr i vatelandowner s have increased gr eatly in the last 20 year s, andi t is estim ated that ther e
“
ar e over consu lting for ester sin the Un ited States. In Geor gia alone , m or e than 100
consu ltants ar e r epor ted to be pr ovid ing such techn icalassistance .
Forestry consu ltan ts pr ovide ser vices for a fee , in c lud ingassistance in tim ber estim atin g and m ar king , land su r veying , timber and land sales negotiations, and m any other for
estry pr actices consider ed inappr opr iate for public suppor t .
Although good estim ates of the total area ser viced by con
su l ting for ester s do not exist , i t is substan tial . For example ,
accord ing to a r ecen t study in Geor gia in 1983 ,
landowner s r eceived m anagem en t plan assistance from con
su l tan ts, for pr oper t ies w ith a total ar ea of acr es
(Cubbage and Hodges Con su ltan ts also m arkedboar d feet of tim ber and cords of pu lp
wood and helped in the ar t ificial or natur al regener ation of
acres of land in other pr ivate owner sh ips.
Cubbage and Hodges also estim ated the total levels of assistance in Geor gia in 1983 . T he total level of accomplishm en ts a nd aver age tr act size var ied sign ifican t ly am on gindustry , con su lting , and State for estry pr ogr am s. Consu ltants m arked m or e t im ber than industr y and State for ester s
and gener ally pr ovided m or e ser vices and m or e- deta iledm anagem en t plan s. Indu stry pr ogr am s assisted consider ablyfewer owner s, bu t -these owner sh ips w ere r elatively lar ge ,
aver aging 636 acr es. T he aver age tr act size ser viced by Stateforester s w as 13 1 acr es; for consu ltan ts i t was 376 acr es.
Geor gia State forester s assisted the m ost landowner s, bu tm ost of the assistance consisted of br ief plans that did not
r equ ir e intensive site exam ination s. Geor gia ’
s State ser vicefor ester s m ar ked less than 1 per cent of the tim ber har vestedin the State , compar ed w ith abou t 8 or 9 per cen t m arked byconsu ltan ts.
Effectiven ess of Assistan ce P r ogr am s
These public and pr ivate pr ogr am s of techn ical for estr yassistance , along w ith other edu cation al and cost - sh ar in g
6 1
progr am s, have u ndoubted ly stim u lated effor ts to incr easetim ber r esou r ces, although data ar e not available to show the
fu ll exten t of su ch effects. Som e r ecen t estim ates,though
of u ncer tain accuracy , show sign ifican t acr eages of tim berland receiving in term ed iate stand treatm ents, such as releaseand weed ing of stands, pr ecomm er c ial th inn ing , pr un in g ,fer tilizing , and pr escribed bu r n ing for contr ol of under storyvegetation . In the 1970
’
s, areas so tr eated var ied betweenr ough ly and acr es per year (app . tables2 19 In the per iod 1982—84 , such tr eatm en ts had in
cr eased to m o r e than a m i ll ion acr es per year . About twoth ir ds of th is stand impr ovem en t work in r ecen t year s has
been on for est indu stry and cer tain corpor ate owner sh ips,such as r ailr oad and u til ity com pan ies . A sign ifican t par t ofthe total , however , w as on lands of other pr ivate owner s,who r eceived techn ical and/o r financ ial assistance from pub
l ic pr ogr am s.
A num ber of investigations have been conducted to evalu
ate the effic iency and effect iveness of techn ical assistanceand cost - shar ing pr ogr am s. In gener al , these stud ies haveshown that the pr ogr am s ar e effic ien t— the benefits exceedthe costs— and that they ar e effective i n im pr oving for estm anagem en t and/o r in c r easin g the in com e of t im ber landowner s. A study in the Geor gia P iedm on t evalu ated theeffects of techn ica l fo r estr y assistan ce by com par in g theexper iences of assisted and nonassisted landow ner s whom ade tim ber har vests (Cubbage and other s Th is studyshow ed that h ar vests d iffer ed sign ifican t ly between theassisted and non assi sted landow ner s. Tim ber land owner s
assisted by S tate for ester s gener ally had less pine t im berr em oved vs. cubic feet per ac r e) , had m or esoftwood vo lum e left after har vest (810 vs. 226 cubic feetper acr e) , and had m or e pine seedl ings vs. 803 per
acr e) after n atu r al - stand har vests.
Har vest r etur ns also. d iffer ed sign ifican tly . Owner s assistedby State ser viée
'
for ester s r eceived an aver age pri ce of $ 108per thousand board feet of tim ber ; those m aking their ownsales aver aged on ly $66 per thou sand boar d feet . A sm allam ou n t of th is d iffer en ce cou ld be explained by d iffer ingpr odu ct d istri bu tion s; bu t even in the m ost conser vative case ,
assisted landowner s r eceived stum page pr ices 58 per cen tgr eater than landow ner s m aking their sales w ithou t assistance . Gr eater r etur n s fr om sales and gr eater r esidual vo lum es also led to a gr eater total net pr esen t value per acr eon lands whose owner s r eceived assistance com
par ed to the nonassisted gr oup at a r eal d iscou n t r ateof 4 per cen t .

Publ ic and pr ivate pr ogr am s of techn icalfor estr y assistance to pr ivate t im ber l an dow ner s, a long w ith other educat ion al andcost - shar ing effort s, have been effi c ien t
the benefits exceed the cost— and effectivein im proving fo rest m an agem en t andincr easing the incom e of t im ber ow ners.
62
A study of the Sou thw i de effects of pr ofessional for ester son pine r egener at ion r evealed that owner s m ade r egener ation investm en ts on 63 per cen t of their acr es when they hadconsu lted a for ester (Royer and Kaiser Regener ationin vestm en ts w er e m ade on on ly 12 per cen t of the acr es, i f
for ester s w er e not in vo lved .
In summ at ion , i t seem s c lear th at techn ical and fin an c ia lassistan ce ,
whether public or pri vate , has been an effectivean d incr easingly impor tan t influence on the r egener ation and
m an agem en t Of t im ber lands i n other pr ivate owner sh ips i nthe Sou th .
In another study Royer ( 1987 ) looked at the effects of m ar
kets and public pr ogr am s on r efor estat ion dec ision s bylan down er s. H e fou nd th at 60 per cen t of the var iat ion i ndecisions cou ld be explained by pr ogr am influen ces, par ti cul ar ly cost - sh ar e funds and techn ical assistan ce; 16 per cen tcou ld be explain ed by ow ner sh ip and per son al char acter i stics; an other 13 per cen t cou ld be explained by m arket for ces;and factor s influenc ing the r em ai n ing 1 1 per cen t cou ld notbe explained .
A study of the For estry In cen tives Pr ogr am show ed that in
vestm en ts in tr ee p lan t ing and stand im pr ovem en t in 1974
had an aver age an nual fin anc ial r etu r n of per cen t (Mil lsand Cain How ever , m any sm al l tr acts th at w er etr eated w er e un l ikely to yield satisfactory r etur n s; and r e
tu r ns fr om tim ber stand impr ovem ent in oak—h ickory stand
types w er e typical ly low . A later analysis of the 1979 pr ogr am fou nd that the aver age size of tr eated ar eas had in
cr eased con sider ably , and pr act ices on lower site - qu al itylands had been cu r tai led (Ri sbr udt and Ellefson Re
sear cher s conc luded that the 1979 pr ogr am wou ld r esu lt inan add ition al bil lion cubic feet of t im ber over the fir st“
r otation'
com par ed to the t im ber th at w ou ld have been pr odu ced w ithou t the pr ogr am . Ninety - thr ee per cen t of the ad
d i t ional volum e w as in softwoods.
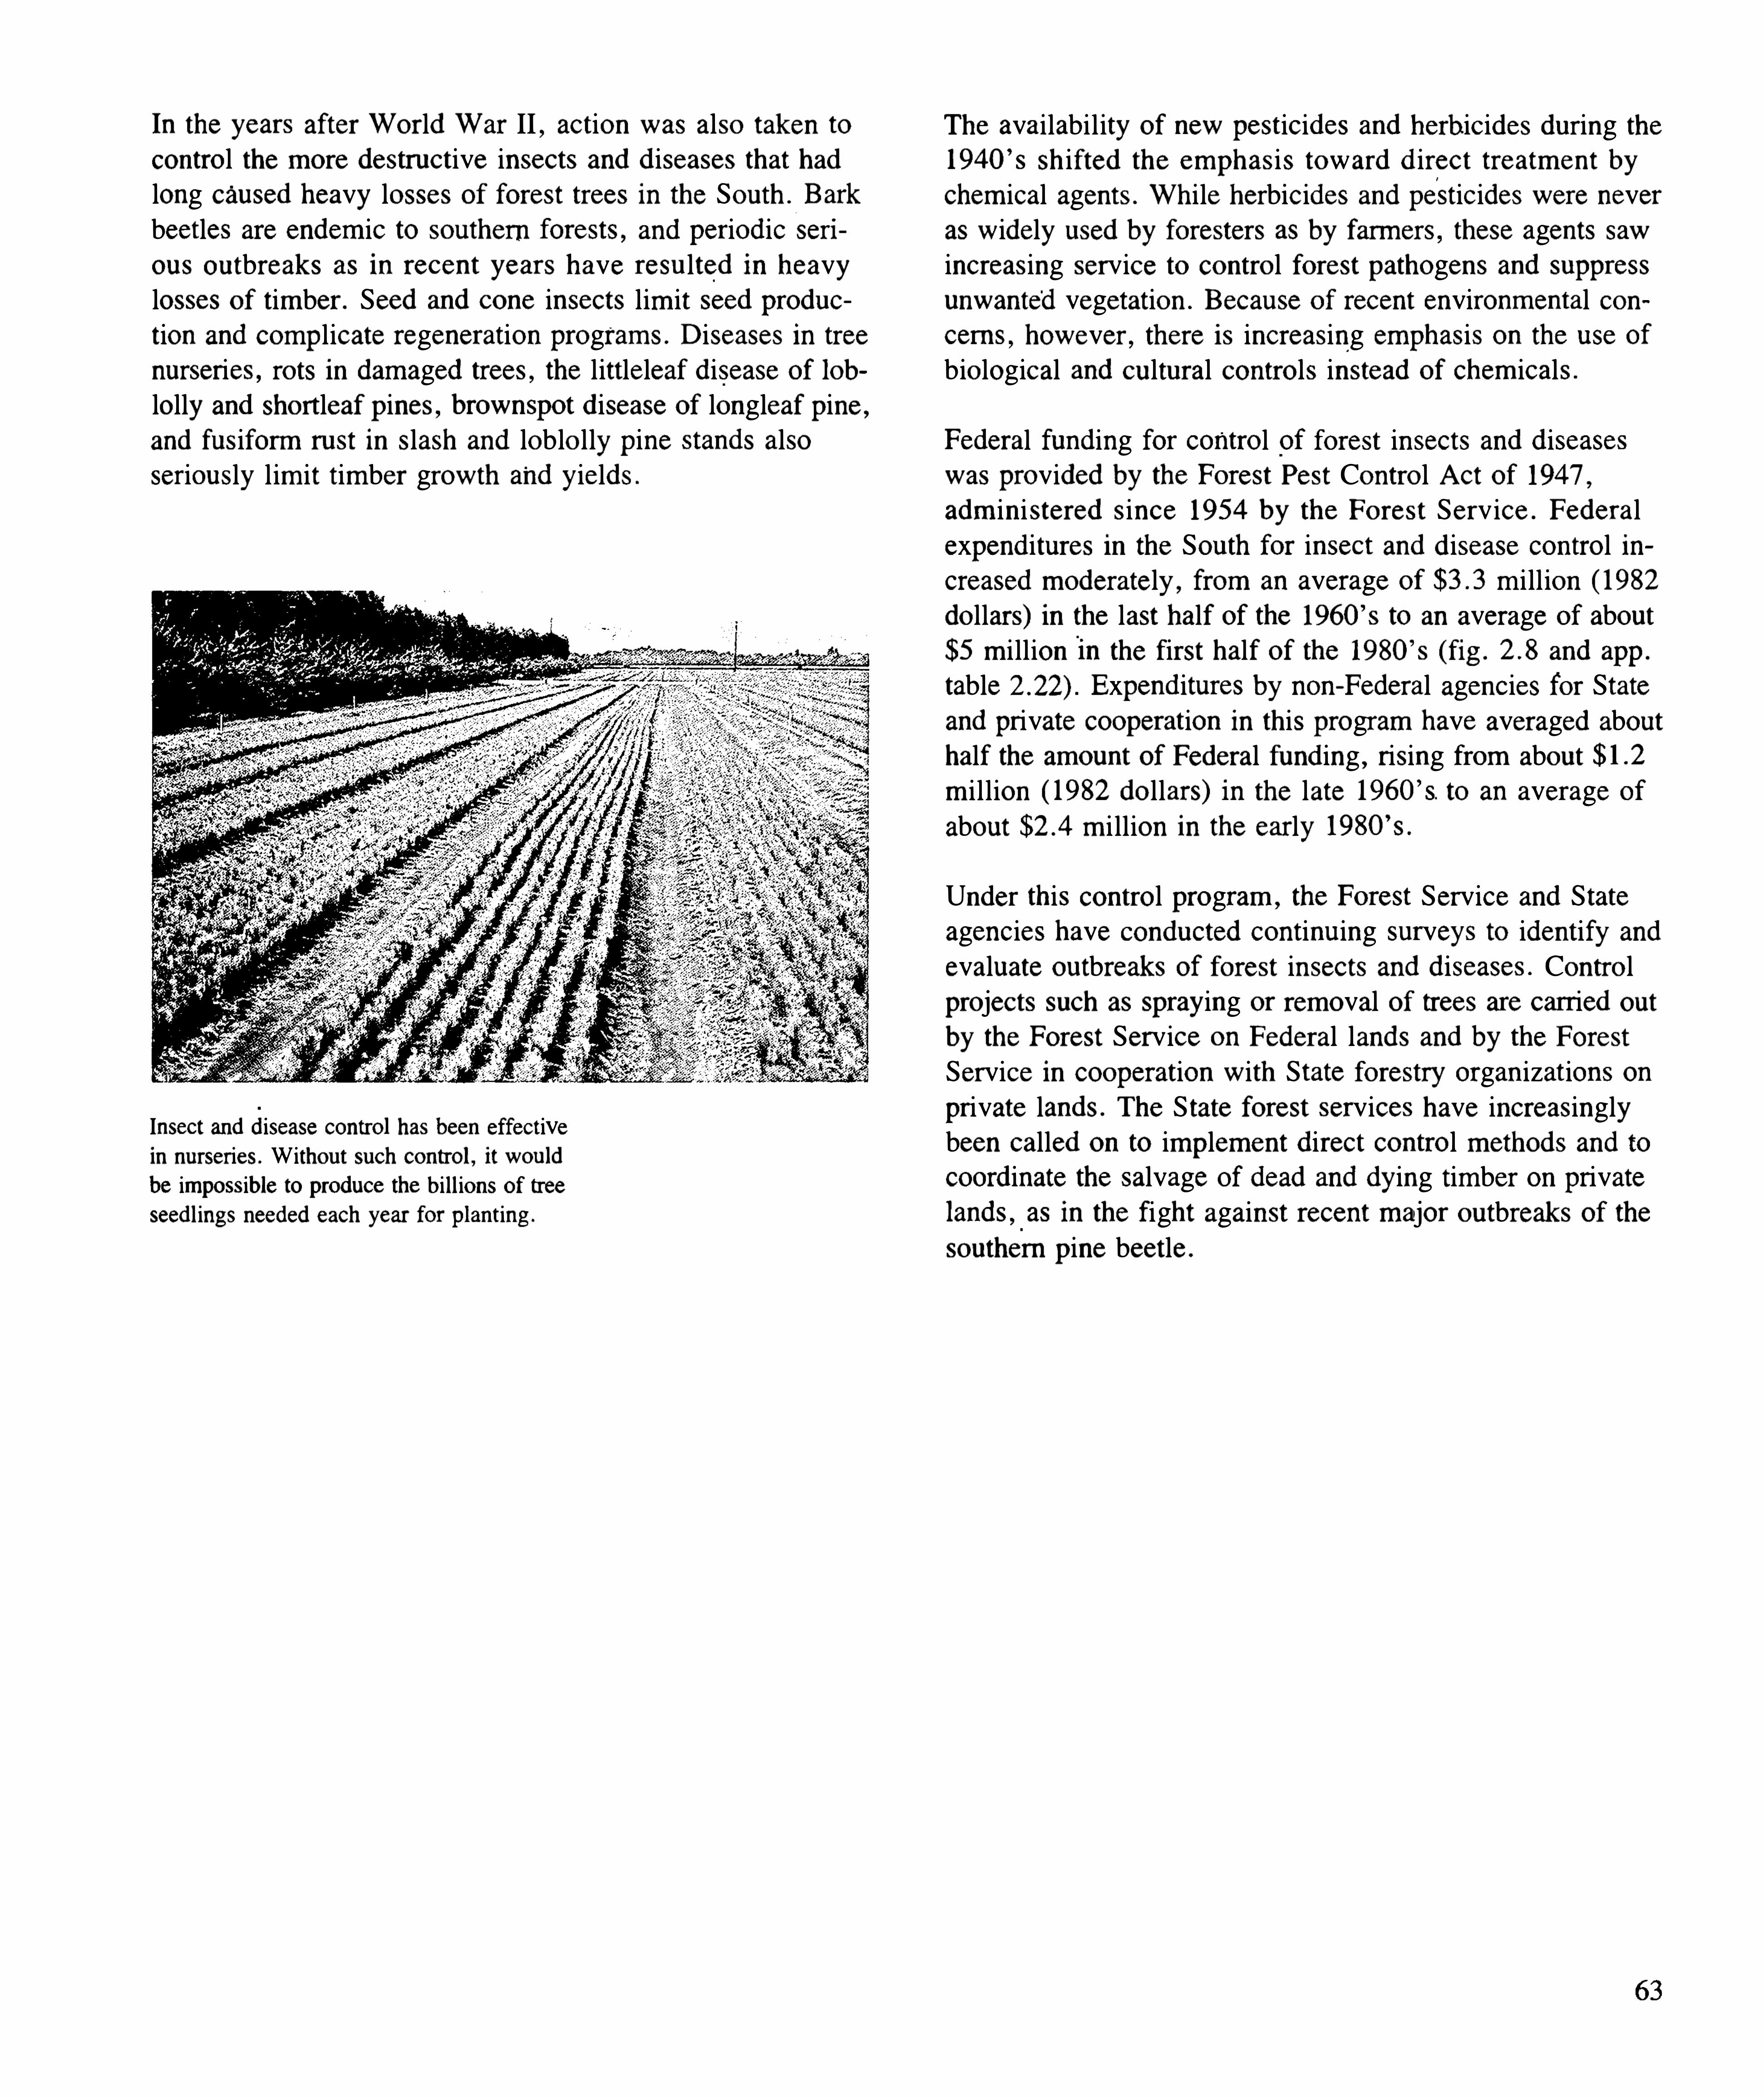
In the year s after Wor ld War II , action w as also taken tocon tr o l the m o r e destr uctive insects and d iseases that hadlong caused heavy losses of for est tr ees in the Sou th . Bark
beetles ar e endem ic to sou thern for ests, and per iodic ser r
ou s ou tbr eaks as i n r ecen t year s h ave r esu lted i n heavylosses of tim ber . Seed and cone insects lim it seed pr oduction and com plicate r egener ation pr ogr am s. Diseases in tr eenur ser ies, r ots in dam aged tr ees, the littleleaf d isease Of loblolly and Sho r tleaf p ines, br ownspot d isease of longleaf pine ,
and fusiform r u st in slash and loblo lly p ine stands alsoser iously l im it tim ber gr owth and yields .
Insect and disease contr ol has been effectivein nurser ies. Withou t such con tr ol , i t wou ldbe impossible to produce the b i l l ions of treeseedl ings needed each year for plan ting .
T he ava ilability of new pestic ides and herb ic ides du r ing the1940
’
s sh ifted the em ph asis towar d d ir ect tr eatm en t by
chem ical agen ts. Wh ile herbic ides and pestic ides wer e neveras w idely used by for ester s as by farm er s, these agents sawincr easing ser vice to con tr o l for est pathogen s and suppr ess
unwan te'
d vegetation . Becau se of r ecen t envir onm en tal concem s, however , ther e is incr easing em phasis on the use of
bio logical and cu ltu r al con tr o ls in stead of chem icals.
Feder al funding for control of for est in sects and d iseaseswas pr ovided by the For est Pest Con tro l Act of 1947 ,
adm in ister ed sin ce 1954 by the For est Ser vice . Feder alexpend itu r es in the Sou th for insect and d isease con tr o l incr eased m oder ately , fr om an aver age of m i ll ion ( 1982do llar s) in the last half of the 1960 ’
s to an aver age of abou t$5 m i llion i n the fir st half of the 1980 ’
s (fig . and app .
table Expend itu r es by non - Feder al agencies for Stateand pr ivate cooper ation in th is pr ogr am have aver aged abou thalf the amoun t of Feder al fund ing , r ising from abou tm i l lion ( 1982 do llar s) i n the late 1960 ’
s. to an aver age of
about m i llion in the ear ly 1980 ’
s.
Under th is con tro l pr ogr am , the For est Ser vice and State
agencies have condu cted con tinu ing su r veys to iden tify and
evaluate ou tbr eaks of for est in sects and d iseases. Con tr o lprojects such as spr aying or r em oval of tr ees ar e car r ied ou tby the For est Ser vice on Feder al lands and by the For estSer vice in cooper ation w ith State fo r estry or gan izat ions onpr ivate lands. T he S tate for est ser vices have incr easinglybeen called on to im plem en t d ir ect con tro l m ethods and tocoordinate the salvage of dead and dying tim ber on pr ivatelands,
_
as in the fight again st r ecen t m ajor ou tbr eaks of thesou ther n p ine beetle .

Figu r e — For est Ser vice and S tate expend itu r es for in sect and disease m anagem en t in the Sou th , 1965—84
f Nu rnber of_States
Figu r e— Num ber of S tates w ith spec ial fo r est tax law s in the Sou th , by type of tax , 1900—85
66

Most t im ber lands i n the Sou th h ave long been pr ivatelyowned by a w ide var iety of people and agenc ies, and thefor estry progr am s descr ibed in th is chapter have consequen tlybeen lar gely aim ed at these ownersh ips. National forestsand other public hold ings con tain on ly 10 per cen t of thetotalar ea of tim ber land in the Sou th ; never theless, they haveplayed a sign ifican t r o le in w ater shed protection , the developm ent of for est fir e pr otection , r ehabil itation of cu toverand er oded lands, dem onstr ation of for estr y oppor tun ities,fur n ish ing sites for ou tdoor r ecr eat ion , and pr ovid ing habitat for w ildl ife includ ing endanger ed spec ies.
T he fir st sou ther n for est lands to com e in to For est Ser vicehands wer e lim i ted ar eas of public dom ain in Arkan sas andFlor ida that wer e r eser ved as n at ion al for ests in the per iod1907— 13 . Essen tially , these consisted of u npaten ted publiclands of low site quality . With passage of theWeeks Act of
19 1 1 , lands wer e also pur chased for national for ests in theheadwater s of navigable str eam s, for water shed pr otection .
In add it ion , these lands pr ovided dem on str at ion ar eas,
wher e pr ivate owner s cou ld see forest pr actices in actiontechn iques they cou ld u se to pr otect and better m an agetheir own lands. T he Clar ke—McNary Act of 1924 au tho r
i zed the acqu isition of land for national forests for tim berprodu ction as well as for w ater shed pr otect ion .
T he national for ests in the Sou th con tainon ly 10 percen t of the timber land area .
Nonetheless, they have p layed an impor tan tr o le in develop ing for est fir e pr otect ion ,
r ehab i l itating cu tover and er oded lands,demonstr ating forestry oppor tun it ies,fu r n ish ing sites for ou tdoor r ecr eat ion , and
provid ing hab itat for w i l d l ife , inc l u d ingendanger ed spec ies.
Very little land was acqu ir ed for som e year s u nder theseau thor izations, bu t w ith the onset of the Depr ession , Con
gr ess empower ed the Forest Ser vice to under take a m ajor acqu isi tion pr ogr am in the Sou th , as well as in other r egion s.
Much of the exten sive cu tover ar ea i n the Sou th w as taxdelinquent , and m any States and pr ivate owner s welcom edthe oppor tun ity to sell land to the Feder al Gover nm en t . Du r
ing the New Deal and subsequen t year s, som e 35 nationalfor est u n its, adm in ister ed by 15 for est super visor s, wer eestablished i n the Sou th . By 1985 , they inc luded m i l
lion acr es of tim ber land , or 6 per cen t of the to tal tim berland in the Sou th .
Under the Bankhead—Jones Farm Ten an t Act of 1937 , the
Resettlem ent Adm in istr ation acqu ir ed sizable ar eas of wor nou t farm land in the Sou ther n States in or der to assist fan ner s i n r elocatin g to better jobs. In it ial ly these lands wer emanaged by the So il Conser vation Ser vice , bu t i n 1950
som e acr eage was added to the nat ion al for ests. Other par ts
of th is land wer e tr an sfer r ed to the U .S . Fish and Wildlife Ser vice for r efu ges, and m or e than acr es wer e
tr ansfer r ed to State agen c ies for m an agem en t as parks orfor ests.
Much of the land acqu ir ed by the Feder al Govern m en t fornational for ests w as obtained fr om tim ber and land - holdingcompan ies after logging . Som e pu r chases wer e fr om other
pr ivate owner s of lar ge or sm al l tr acts of cu tover for estsor idle and er od ing cr op land and pastu re . Feder al acqu isit ion s wer e typ ical ly m ixed w ith pr ivate ho ld in gs. Most
areas had also been repeatedly bu r ned by w i ldfir es and wer eeither nonstocked o r poor ly stocked w ith tim ber - qual itytrees.
For m any year s, m anagem en t of these nation al for ests w asm ain ly custod ial , w ith fir e con tro l of pr im ar y im por tance .
Con str uction of roadsand tr a i ls, cam pgr ounds, and other
facilities also opened up the for ests for r ecr eation and other
public uses,
_
In the 1930’
s, the Civilian Con ser vation Corpscon tr ibu ted in a m ajor w ay to rehabilitat ion of som e of
these lands by stand impr ovem en t work , plan tin g of nonstocked ar eas such as id le and er od ing cr opland and pastu r e,
and pr otection of for ests fr om fir e . T he Civilian Con ser vation Corps work w as the fir st effo r t to r eplan t sign ifican tacr eage i n tr ees.

T he tr en ds in r egener ation on the n ational for ests in theSou th ar e show n in append ix table Du r ing the 1930 ’
s
and ear ly 1940 ’
s, when the Civ i l ian Con ser vation Corpswas active, substan tial acr eages wer e r egener ated . Regener ation su r ged aga in i n the m i d - 1 950
’
s, r each ingacr es in 1957 . In m ost year s sin ce then , i t has flu ctuated between and acr es a year . T he lar gest par tof the r egener ation has been in the Sou th Cen tr al States.
Tr ends in stand im pr ovem en t— in term ed iate stand tr eatm en tssuch as pr escr ibed bu r n in g and th inn in g to incr ease tim bergr ow th and/or t im ber qu al ity —o n the n at ional for ests ar ealso shown in appendix table In 195 1 , the fi r st year
for wh ich data ar e ava i lable , som e acr es w er e
tr eated . Th is figu r e in cr eased to near ly acr es i n
1959 bu t has sin ce decl ined to below acr es a year .
In r esponse to m an agem en t , the national for ests in the Sou thhave gr adual ly becom e m or e productive . T he vo lum e of timber cu t , for exam p le , has in cr eased fr om 45 m il l ion boar dfeet in 1923 to bill ion in fi scal year 1985 (fig .
app . tables an d T he value of the timber has followed sim i lar tr ends. T h e peak cam e in fiscal year 1984 ,
when i t totaled $ 104 m ill ion . Most of the tim ber cu t sincehar vesting began has com e from the n ational for ests in theSou th Cen tr al r egion .
In the last few decades, a ser ies of legislative acts has sig
n ifican tly affected the m an agem en t and u se of the nationalfor ests i n the Sou th . For exam ple , the Mu ltip le Use and
Susta ined Yield Act of 1960 r equ ir ed that the n ational forests be m an aged for ou tdoo r r ec r eat ion , r ange , t im ber ,water shed , and w ild l ife and fish pu rposes.
68
National for ests had long been m an aged u nder m u ltiple- use
gu idel ines, bu t coor d in ation between tim ber m an agem en t ,w i ld life , r ecr eation , an d gr azing in ter ests becam e incr eas
ingly d ifficu lt . In the 1960’
s, for exam ple , incr easing conflicts led to litigation over c lear cu tting on theMonongahelaNational For est , and new legislation . T he Nat ional Envir omm en tal Po l icy Act of 1969 r equ ir ed the For est Ser vice(and al l other Feder al agenc ies) to assess and docum en t the
envir onm en tal im pacts of their dec isions. T he Nati onal Forest Man agem en t Act of 1976 pr ovided new gu idel ines forland m an agem en t and use , includ ing the r equ ir em ent that theFor est Ser vice pr epar e deta iled m anagem en t plan s for eachn ation al for est every 10 to 15 years. These law s afforded thepublic incr eased oppor tun it ies to par tic ipate in m anagem en t
dec isions.


T he Endanger ed Spec ies Act of 197 3 pr ovided for theconser vation of endangered or thr eatened spec ies and theecosystem s on wh ich those spec ies depend . Of the sever a lendangered or thr eatened p lan t and an im al spec ies found onthe sou ther n n at ional for ests, the r ed - cockaded woodpecker
has cr eated the gr eatest chal lenge in t im ber m anagem entplann ing . Som e acr es of m atu r e sou ther n pinetim ber in the sou ther n nation al for ests ar e being m anagedfor the r ed - cockaded woodpecker . As r ecovery of th isspec ies pr ogr esses, m or e acr es ar e likely to be affected
On January 3 , 1975 , the_
Bastem Wil der ness Act cr eated
acres of designated w i lder n ess fr om n at ional forest lands in the sou ther n r egion . Subsequen t legislation incr eased th is ar ea to acr es.
In add it ion to the nat ion al for ests, ther e ar e su bstan t ia lar eas of timber land in other public owner sh ips in the Sou th .
In 1985 , these other public tim ber lands compri sed some
m i l lion acr es. Feder al lands other than n ation al for ests pr im ar i ly inc lude ho ld ings of the Tenn essee Val ley Au thor ityand m i l itary r eser vation s: Tim ber lands in State and coun ty
ho ld ings in the Sou th cover less than a half m i l lion acr es.
Fol low ing establishm en t of the Ten nessee Va lley Author ityin 193 3 , th is Feder al agen cy acqu ir ed and adm in ister edroughl y a half m illion acr es of timber lands for pr otection of
water sheds and dam s, r ecr eation , and pr oduction of t im ber .
T he Tennessee Valley Au thor ity also has car r ied ou t si z
able pr ogr am s of plan t in g on Feder a l , S tate , and pr ivatelands; fur n ished assistance to S tate and pr ivate forest owner s in protecting for est lands in the Tennessee River Valley from fire and gr azing ; and conducted a pr ogr am of
forestry resear ch .
70
T he Endangered Spec ies Act of 1973provided for the conservation of endanger edand thr eatened spec ies and the ecosystem s
on wh ich those spec ies depend . Of the
sever al endanger ed or thr eatened plan t andan im al spec ies found on the sou ther n
national forests, one spec ies, the redcockaded woodpecker , has had the greatest
impact on t im ber r esou r ces.

With developm en t of for estry pr ogr am s and the r egener ation of the second and th ir d for ests, the Sou th has w i t
nessed spectacu lar gr ow th in the sou ther n pu lp and paper
industry , together w ith a r esu r gence of the lum ber indu stry and establishm en t of new sou ther n . p ine p lywood and
other panel boar d industr ies.
With the developm en t of for estry progr am sand the regener ation of the second and th ir dforests, the Sou th exper ienced spectacu lar
gr ow th in the pu lp and paper industry . Mil lsin the South now produce about 70 percen tof the Nat ion
’
s woodpu lp .
T he Pu lp and Paper In du str y
Among other techn ical developm en ts was the in tr odu ctionof saw log debarker s that m ade possible the pr oduct ion fr omslabs and edgin gs of c lean c
-h ips u sable by pu lp m i l ls .
Pr oduct ion of m i llion s of ton s of pu lp ch ips fr om thi s other
w ise w aste m ater i al w as equ iva len t to add in g m i ll ion s ofacr es of t im ber land to the r esou r ce base .
Sm all am ounts of woodpu l p wer e pr oduced i n the Sou thas ear ly as 1909 , when the Roanoke Rapids Pu lp Manu fac
tu r ing Com pany m ade su lfite pu lp for w r apping and other
paper s. In the fo llow ing year s, m arkets for pu lp and paper
pr oducts in the Un ited S tates con tinued to expand stead ily .
Major im pr ovem en ts in techno logy of using sou ther n pinesand the su lfate pr ocess for pu lp fl owed fr om the work of
in vestigato r s in the pu lp indu str y and the Fo r est Ser vice ’
s
For est Pr oducts Labor atory . In add ition , the fir st fo r est survey in the Sou th i n the ear ly 1930 ’
s showed that lar ge sup
plies of pu lpwood cou ld be obtained fr om the second
forest of the r egion .
These factor s, alon g w ith favo r able cond it ion s for water ,power , labor , and tr anspor tation , made possible a m ajor expansion of the sou ther n pu lp and paper indu stry to a
'
po int
wher e the Sou th soon becam e the regional leader of th isindustry in the Un ited States. By 1930 ther e wer e 15 south
er n pu lp m ills; in 1985 ther e wer e 108 . Pu lp pr oduction inthe Sou th incr eased fr om abou t ton s i n 1930 to
som e m i ll ion tons in 1984 (fig . and app . table—abou t 70 per cen t of U .S . pr oduction in the latter
year .
Markets for pu lp and paper pr oducts pr oduced in the Sou th
have been espec ially str ong for con ta iner boar d and a var iety of other brown paper s. Resear ch in pr oduction of news
pr in t fr om sou ther n pines, par ticu lar ly stud ies condu cted byC .H . Her ty , also led to constr uction of a num ber of m i llsto pr oduce newspr in t fr om sou thern pines. In r ecen t year s,
sou ther n m il ls have been pr oduc in g incr easin g am ou n ts ofbleached pu lps for u se in pr i n ting paper s.
Pine pu lpwood has been the pr im ary m ater ial used in sou th
er n pu lp m i lls, bu t the indu stry h as a lso u sed incr easingam oun ts of har dwoods i n such pr oducts as the cor r u gatingm ed ium of con ta iner boar d and i n pr in t in g paper s an d
r ayon . Developm en t of a sem ichem ical pr ocess and a h ighyield co ld soda pr ocess thr ough r esear ch at the Forest Pr od
ucts Labor atory have m ade the m ethods for pu lping har dwoods m or e effic ien t . By 1984 , u se of har dw oods had
r isen to som e 3 1 per cent of the r ound pu lpwood har vestedin the Sou th (app . table
Million short tons
Figu r e— Woodpu l p pr odu ction in the Sou th , by type , 19 10—84
T im ber Sou r ces for the For est In du str iesWhen the sou ther n pu lp and paper industry began i ts r ap idexpansion in the 1930 ’
s, i t also u nder took a m ajor landacqu isition pr ogr am to assu r e adequ ate pu lpwood suppl ies.
T im ber lands w er e acqu ir ed fr om long - term ow ner s 'in the
lum ber indu stry , fr om land com pan ies, and fr om var iou sother pr ivate ow ner s. Som e for est pr oducts com pan ies inthe Sou th con tinued to oper ate w ith l itt le o r no tim ber landbase , and in the 1980
’
s, som e sizable pr oper ties have beenoffer ed for sale . Other com pan ies, never theless, have con tinued to add to their hold ings, espec ially when avai lable t imber l ands w er e located c lose to existin g plan ts .
T he for est indu str ies also h ave leased substan t ial ar eas oft im ber lands fr om other pr ivate ow ner s to supplem en t woodsuppl ies obtain ed fr om com pany ho ld in gs “
and the open
72
m arket . In 1985 , for exam p le , abou t 4 m i l lion acr es wer e
u nder lease to for est industr ies. These leases u su al ly invo lvesom e annual paym en t to the landow n er s and m an agem en tcon tr ols by the leasing com pany .
Total tim ber land ar ea i n for est industry ow ner sh ip i n theSou th has in cr eased from m i l l ion acr es i n 1952 to
m i ll ion acr es in 1985 , in c lud ing t im ber lands leased or
u nder m an agem en t con tr acts (app . tables an d
These industry lands i n 1985 r epr esen ted 2 3 per cen t of the
total ar ea of t im ber land i n the Sou th .
With the ow ner sh ip and leasin g of m or e than 42 m ill ionacres of tim ber land , the sou ther n for est indu str ies have beenable to obtain incr easin g vo lum es of pu lpw ood , saw logs,and other pr oducts fr om com pany lands. In 1984 , softw ood
timber har vests on forest indus lands r eached bill ion

to obtain a gr eater vo ice for sm a ll ind ividu al ow ner s inlocal and n ation al m atter s affect in g their in ter ests. Th isorgan ization has also been an im por tan t for ce in the conservation of sou ther n for ests. Its fir st act ion s wer e d ir ected at
secu r ing better m arkets and pr ices for tim ber for i ts m em
ber s and at suppor t ing pr ivate for est con ser vation effor ts.
T he For est Farm er s Assoc iation has been a par ticu lar ly ef
fective for ce in suppor t of ( I) greatly expanded resear ch progr am s of the For est Ser vice and un iver sities, (2 ) for estryeducation and extension , and (3 ) str en gthened action pr ogr am s for fir e con tr o l , r efor estat ion , and techn ical assistance to landowner s.
T he For est Farm er s Assoc iation also cosponsor ed (w ith theSou thern P ine Assoc iation , Sou ther n Har dw ood Lum berManufactu r er s Assoc iation , and Am er ican P lywoodAssoc iation ) the sou ther n for est r esou r ce an alysis pr oject in1966 that r esu lted i n a r epor t on
“
T he Sou th’
s Th i r dFo r est (Sou ther n Fo r est Resou r ce An alysis Committee
Th is com pr ehensive study inc luded both an im portan t evalu at ion of pr ogr ess and gu idelines for fu tu r e actionto fu r ther advance the pr odu ctivity of sou ther n for ests. In
1969 , a Sou ther n For est Resou r ce Coun c i l w as cr eated towork for im plem en tation of r ecomm endations in th is r epor t .
A system of tr ee farm s also got i ts star t i n the Sou th in1942 , when the Am er ican For est Pr oducts Indu str ies Assoc iation (now the Am er ican For est Institu te) assum ed r e
spon sibil ity for th is vo lun tary industry pr ogr am aim ed at
encou r agin g tim ber pr odu ction by pr ov id in g education al i nform ation and r ecogn it ion of good m anagem en t of pr ivatet im ber lands. As of 1984 , ther e w er e n ear ly tr ee
farm s in the 12 Souther n States.
Over the year s, a num ber of S tate gr oups star t in g i n theear ly l 9oo’
s have also been or gan ized to advan ce par ticu
lar in terests. Today the State for estry association s ar e playingan im por tan t r o le i n pr om ot ing forest pr otection and m an
agem en t . T he Fu r n itu r e , Plywood , and Veneer Cou nc i l (nowthe Hardwood Resear ch Cou nc i l) w as established i n 1953to pr om ote r esear ch and education on the m an agem en t andu tilization of hardw ood Spec ies. In add ition to the Sou ther n Pine Assoc iation and Har dwood Lum ber Man u factu r er s
Assoc iation m en tion ed ear l ier , a Sou theastern P ine Manu
factu rer s Institu te (later m er ged w ith the Sou theaster n Lumber Manu factur er s Assoc iation ) w as form ed i n 1954 to givesm al l lum berm en a gr eater vo ice i n local and n ation al forestry affair s.
74
A system of T r ee Farm s, a vo lu n tar yfor est industry pr ogr am a im ed at encou r ag
ing t imber product ion by pr ovid ingeducational inform at ion an d r ecogn ition of
good m anagemen t of pr ivate tim ber lands,was star ted in the Sou th in 1942 . As of
1984, ther e were near ly T ree Farm s
in the 12 Sou ther n States.
Pr odu cts Over view
Du r ing the 1960 ’
s, a new sou ther n pine p lywood indu str yalso developed in the Sou th thr ough jo int effor ts of plywoodproducer s and r esear cher s at the For est Pr oducts Labor atoryin develop ing effic ien t techn iques for pr odu c ing p lyw oodfr om second - grow th sou ther n pines. In 1963 , a plan t of theGeor gia Pac ific Company in For dyce , AR , pr oduced the fir st
rotar y-
peeled , exter ior - glued str uctur al plywood fr om sou th
ern pine .
Over the next two decades, sou ther n pine plyw ood pr oduction cl im bed steeply (fig . app . table After1982 , new plan ts bu i lt to produ ce w afer boar d and or ien tedstr and boar d added to the gr ow in g softw ood str u c tu r al“
panel boar d indu stry . In 1984 , pr odu ction of softwood
plywood in the Sou th r eached billion squar e feetinch basis) , or near ly half of total pr oduction in the Un itedStates. Som e of the increase in sou thern pr oduction w as atthe expen se of pr oduction of Douglas- fi r and other western
species that had long dom inated softwood plywood m arkets.
Du r ing the 1960’
s, a new industry w asstarted in the Sou th th rough jo in t effor ts ofplywood pr oducer s and r esear cher s at the
Forest Pr oductsLabor atory . T hey developedeffic ient techn iques for produc ing softwood
plywood from second -
grow th sou ther n pine .
In 1984 , pr oduct ion of softwood plywood
in the Sou th was b i l l ion squar e feet- inch basis) , near ly half of the total
production in the Un ited States.
T he lum ber industr y has also shown a str ong upwar d tr endsince the 1930 ’
s, w ith pr oduction r each in g abou t billion board feet in 1984 (app . table Softwoods m ade
up abou t 80 per cen t of th is total and har dwoods, therem ainder .
Sou ther n for est indu str ies a lso have long been a pri n c ipalsour ce of other for est pr oducts such as po les, pil ing ,
cooper age , har dwood plywood and veneer , as well as fuelwood for both dom estic an d indu stri al u ses. Num erou swood -
pr eser ving plan ts have oper ated in the Sou th for m anydecades to pr ovide consum er s w ith tr eated po les, p il ing , r ailr oad ties, and var ious con str uct ion item s.
75
As descr i bed at the beginn ing of th is chapter , the sou ther n
pu lp and paper in du str y a lso h as becom e the sour ce of
m ost turpen tine and r osin , d isplac ing both gum and steam
d isti lled wood . T he fir st plan t to pr oduce h igh - qu al ity r osinand fatty ac ids fr om tall o i l by skimm in g off spen t cookingliquor s in the su lfate process was opened in 1949 by theIn tern ation al Paper Com pany . Recovery of tu rpen t in e fr omgases gener ated i n the su lfate pu lping pr ocess began i n1944 and also expanded stead i ly . By 1984 , tall o i l r epr esen ted 76 per cen t of the total pr odu ction of r osin , and su l
fate tu rpen tine m ade up 93 per cen t of the total pr oductionof tu rpen tine (figs. and app . tables and
Changes in the ou tpu t of sou ther n for est industr ies have r adically alter ed the r elative im por tance of d ifferent produ cts andcor r espond ing r equ ir em en ts for tim ber r esou r ces. Up to the
1930’
s, the lum ber industry w as by far the dom in an t u serof both p ines and har dwoods. Thou gh lum ber pr odu ctionin the Sou th incr eased consider ably after the low po in t of the1930
’
s, by
'
1954 the r ap id ly expand ing pu lp an d paper in
dustry was using m or e wood fiber than sawm ills. Pu lpwooduse also con tinued to c lim b r ap id ly ther eafter , to som e
billion cu bic feet of "
r ou ndwood in 1984 , or abou t 42 percen t of the total vo lum e of r oundwood har vested i n the r e
gion (fi g . 1 .-3 , app . table
Saw logs produced in the Sou th in 1984 com prised som e
bill ion cu bic feet , or 37 per cen t , of the total r oundwoodpr odu ced ; however , a substan tial por tion of these saw logsended up i n the pu lp and paper industr y in the fo rm of
ch ips. By 1984 , u se of logs for veneer and p lywood hadc lim bed to near ly billion cubic feet , or 9 per cen t of thetotal . Other r oundw ood industr ia l pr odu c ts am ou n ted tobill ion cubic feet . Use of fuelwood dr opped to low levelsin the post
-Wor ld War 11 year s bu t by 1984 had r isen to
over b i ll ion cub ic feet , o r near ly 10 per cen t of the total tim ber h ar vest i n the Sou th

Figu r e — Softwood p lywood pr odu ct ion i n the Sou th , by r egion , 1964—84
76

In addition to tim ber , the lands of both the for est indu str iesand other pr ivate and public owner s of sou ther n tim berlands have con tinued to pr ovide other pr oducts and ser vicesas well . With in tensified m an agem ent of these lands for timber after Wor ld War H and adoption of fenc in g laws in var ious Sou ther n States, l ivestock r aisin g in sou ther n tim berlands dec r eased , par t icu lar ly the r a isin g of the sem iw i ldr azorback hogs that for decades had lim ited for est r egener ation i n m any ar eas. Never theless, con sider able gr azing bycattle has con tinued on m any tim ber lands, and resear ch bythe For est Ser vice and State exper im en t station s has dem on
H un t ing has always been and con t inues tobe an impor tan t food -
pr oduc ing andrecr eational use of southern forests. A l thoughther e has been confl ict over cert a in t im berharvesting an d managem en t pr actices,resear ch has developed w ays of in tegr at ingt imber m anagemen t w ith the pr oduct ion of
w ild l ife . Many industr ia l owner s and other
pr ivate owner s now m anage their lands to
sustain and enhance w il dl ife popu lations.
str ated that l ivestock gr azing can often be successfu lly in tegr ated w ith tim ber m an agemen t .
Hunting has also con tinued to be an impo r tan t foodpr odu c ing and r ec r eat ion al u se of sou ther n t im ber lands .
Hu n ter s have opposed cer tain tim ber har vesting and m an
agem en t pr actices. Cu ttin g down hardwoods and r eplac in gthem w ith pine p lan tation s, for example , has often beenunacceptable to hu n ter s of deer , squ irr el , and tu rkey . Bu t r e
sear ch and exper ien ce have iden tified w ays of in tegr atingtimber m an agem en t w ith pr oduct ion of w i ld life , par t icu lar lyspec ies su ch as deer and qu ai l .

Many indu str ial and other t im ber land ow ner s have leasedhu n t ing r igh ts to hu n t ing c lubs or o ther s both to captu r e
som e incom e and to r educe the l ikel ihood of ar son by dis
gr u n tled hu n ter s. Other r ecr eation al u ses have also becom eincr easingly popu lar in sou ther n t im ber lands, part icu lar lyon n at ion al for ests and other publ ic lan ds . Many of the
lar ger pr ivate owner s ar e also pr ovid in g r ecr eation al opportun i ties to the public , espec ial ly to the local people .
Do lla rs per thousand board feet (1 985 dolla rs)
Fr om the above d iscu ssion , i t is appar en t that a w ide ar r ay
of for ces h as affected the t im ber r esour ce i n the Sou th .
Chan ges in stum page pr ices h ave also had im pacts, lar gelybecause ofp ri ce influ en ces on m an agem en t pr actices.
S tum page pr ice i s the sel l in g pr ice of stan d in g t im ber .
Most of the tim ber har vested in the Sou th i s so ld as stumpage by the tim ber land owner s and then logged by the forest indu str ies or independen t logger s.
Fr om the l 8oo’
s th r ough the 1930 ’
s, stumpage pr ices forpine saw t im ber in the Sou th wer e very low— on ly a few
dollar s per thousand boar d feet (fig . app . tableDu r in g m ost of th is per iod , low pr ices r eflected the plen tifu l supply of t imber in the cou n try . In the 1930
’
s, they alsor eflected the effects of the Depr ession , and to a cer tainexten t , dec l ines i n tim ber qu al ity .
Fi gu r e— Aver age stum page pr i ces for sawtim ber on pr ivately owned land in the Sou th , 1980—1985 . Pr ices ar e 5 -
year
m oving aver ages fr om sever al pr ice ser ies

Fr om the 1800’
s thr ough the 1930’
s,
stumpage pr ices for p ine saw tim ber in theSou th were very low -o n ly a few do l lar s
per thousan d board feet . Du r ing these year s,the econom ic oppor tun ities that wou ld yieldcompet itive rates of r etu r n on investm ents inmanagemen t practices mu st have been veryl im ited . By the ear ly 1950
’
s, stumpage
pr ices had reached a level wher e l ar geoppor tun it ies to m an age t imber did ex ist ,and there are stil l lar ge oppor tun ities today .
On ly par t of these opportu n ities ar e beingutil ized .
Between 1935 and 1955 , aver age pin e saw tim ber stumpagepr i ces m or e than tr ipled,
in con stan t do llar s. After a decadeor so of relat ive stability in the late 1950 ’
s and ear ly 1960 ’
s,
aver age pinesaw tim ber stumpage pr ices r ose sharp ly againand peaked in the late 1970 ’
s. They fel l in the ear ly 1980 ’
s
because of the econom ic r ecession .
The available data on har dwood sawt im ber stumpage pr icesshow a gr adu a l r ise since the ear ly 1900 ’
s, a lthou gh the
level of pr ices fo r m ost hardwood tim ber has been m uch
below that for softwoods (fig . app . tableHowever , h igh - qu al ity har dwood tim ber— lar ge size , pr e
fer r ed spec ies— has br ou ght very h igh pr ices, far abovethose for pine (app . tables and
Ther e ar e substan tial geogr aph ic d ifferences in both pine andhardwood stumpage pr ices (app . tables and m ap
accompanyin g app . table In r ecen t year s, pr ices forpine saw t im ber have been h ighest in the Coastal P lain .
Pr ices for m ixed har dwood saw tim ber have tended to beh ighest in the Mississippi Delta , cen tr al plateau , and Appal ach i an h igh lands. Softwood pu lpwood pr ices have beenh ighest in the east gu lf coastal plain and m or e r ecen tly thewest gu lf coastal plain . Har dwood pu lpwood pri ces have alsobeen r elatively h igh in these sections as well as in the Mississippi Delta . In gener al , these d iffer ences r eflect t heam oun t of com petition for the avai lable tim ber , althoughvar iations in tim ber char acter istics and logging , m anu fac
tu r ing , and tr anspor tation costs also con tr ibu te .
Pu lpwood stumpage pr ices for pine and har dwoods have r em ained low in m ost ar eas (fig . app . tablesand 2 36 T he long stable tr end in pu lpwood stum p
age pr ices r eflects a favor able tim ber supply situation duein par t to the woodpu lp indu stry ’
s incr easing use of p inech ips fr om sawm i l ls an d other pr im ar y m an u factu r in gplants and to the u se of in cr easing vo lum esof har dwood .
79
Befor e sawtim ber stumpage pr ices began to r ise i n the late1930
’
s, they were so low that econom ic oppor tun ities— the
oppor tun ities that wou ld yield r ates of r etu r n on investm en tsin tim ber managem en t pr actices com par able to those ob
tai ned in other kinds of investm en ts— m ust have been verylim ited . As pr ices r ose , th is situation changed . By the ear ly1950
’
s, pr ices had r eached a level wher e lar ge econom ic oppor tun i ties to incr ease tim ber suppl ies did exist . Th is wasquan tified by stud ies pr epar ed in the late 1960 ’
s and the late1970
’
s and also by the analysis of econom ic oppor tun itiescon tained inchapter 5 of th is study .
As stumpage pr ices have incr eased , par t of the existing econom ic oppor tu n it ies have been u t i l ized . Par t of the i n
cr eases in investm en ts that have been m ade, especially thosesince the 1940 ’
s, r eflect an econom ic or pr ice r espon se .
However , al l of the stud ies have shown that ther e con tinueto be lar ge oppor tun ities not bein g u ti lized . Th is i s i n par ta r esu lt of the m ar ket im per fections i n the for estr y sector .
These imper fection s and their im pl ication s ar e descr ibed at
the end of chapter 5 .

Figu r e— Aver age stumpage pr ices for pu lpwood on pri vately ow ned land in the Sou th , 1935—85 . Pr ices ar e 5 -
year
m ovin g aver ages fr om sever al pr i ce seri es.
80


One of the pr im ary objectives of th is stu dyis to pr oject changes in the Sou th ’
s tim berresour ce . T hese pr ojections provide a m eans
of iden tifying futu re r esou r ce problem s an d
for gu id ing dec ision s on investm en ts i ntim ber m an agement progr am s and the
constr uction of pr ocessing pl an ts.
P r ojected Ch an ges i n th e T im ber
Resou r ce

One of the pr im ary objectives of th is study is to pr ojectpr ospective changes i n the Sou th ’
s t im ber r esou r ce . Pr ojec
tions of chan ges in tim ber supplies, r em ovals, gr ow th , and
inven tor ies, along w ith pr oject ions of t im ber dem ands, pr o
vide a m eans of iden t ifying fu tu r e or develop in g t im berpr oblem s. These pr oject ion s also gu ide m any dec ision s onlong - r ange comm itm en ts such as in vestm en ts i n plan t andfacil ities, _
and'
tim ber m an agem en t p r act icesWhose effects ar er ealized over an extended per iod of tim e . Fin al ly , pr ojec
tions also pr ovide the data base n eeded for an alyzin g theecon om ic , soc ia l , an d en v ir onm en tal im p l icat ion s of ar ange of pol icy and pr ogr am option s. T he optionscu rren tlybeing con sider ed and appr opr iate to the Sou th ar e an alyzedin the fol low ing chapter .
T he pr ojections r eflect the qu an t ified r esu lts of assum ptionson the m ajor determ inan ts of changes in the tim ber r esour ce . Ther e i s n o in ten t to pr ed ict th at these pr ojectedtr ends in the t im ber r esou r ce w i ll actu ally occu r , nor that
they shou ld . In fact , i t i s expected that because '
of econom ic ,
soc ial , and envi ronm en tal imp lications assoc iated w ith thesetr ends, action s w il l be taken to change them in w ays consid
er ed m or e desir able .
T he dynam ic sou ther n for ests pr esen t com plex pr oblem s in
pr epar ing r esour ce projections. T o deal w ith th is effectively ,
a lar ge data base and in tri cate an d detai led analytical System s to sim u late r esou r ce changes have been developed .
P r oject ion Models
T he Timber Resour ce In ven tory Model r eplaces the Tim berResou r ce An alysis System (TRAS ) used in pr evious Forest Ser vice assessm en ts of th is type (Lar son and Gofor th
T he Tim ber Resou r ce Analysis System is a stand
table pr ojection m odel in w h ich the tim ber r esour ce is aggr egated by owner sh ip , by softw ood and har dwood , and by
Th r ee d istin ct bu t c losely r elated an alyt ical system s w er eut ilized . An updated ver sion of the Timber Assessm en t Mar
ket Model (TAMM) w as u sed to sim u late r oundw ood har
vest (Adam s and Haynes T he T im ber Resou r ceInventory Model (TRIM) w as u sed to sim u late changesintim ber inventory , grow th , and r em ovals (T edder and oth
er s Changes in tim ber land ar ea and owner sh ip weresim u lated w i th the Sou ther n Ar ea Model (SAM) (Al ig
T he Tim ber Assessm en t Market Model is a m arket equ i l i b
r ium system that pr ojects lon g - r ange est im ates of pr ice ,
consumption , and pr oduction of tim ber products and stum p
age for var ious r egions in the Un ited States. T he system
u ses var iables such as stumpage pr ices and gr ow ing stockinven tory to develop r oundwood supply equ ation s for softwoods and har dwoods. Tim ber r em ovals for each ow ner
sh ip gr oup ar e ca lcu lated by equ i libri um m odel ing oftim ber supply and dem and by - the Tim ber Assessm en tMarket Model . T he Tim ber Resou r ce In ven tory Model usestim ber r em oval calcu lat ion s i n pr oject in g inven toryvo lum es and gr ow th . Th is in form ation is fed back to theT imber Assessm en t Mar ket Model , wh ich then r ecalcu latesthe equ ilibr ium level of timber r em ovals. Th is pr ocess i srepeated iter at ively un ti l a toler able con ver gen ce i s attained .
T he Tim ber Assessm en t Market Model w as exten sivelyr ev ised for use in th is study . Major changes in cludedr eestim ated equ ations based on data thr ou gh 1985 for m ost
r elation sh ips, a 15 per cen t tar iff on Can ad ian expor ts to theUn ited States, r evised capac ity seri es, and a sw itch fr omnom in al to r eal Canada/U .S. exchange r ates. T he dem and
m odel w as r evised for chan ges i n var iou s end- u se factor s
and for changes in panel pr oduct c lassifi cation s in to str uc
tur al and non str uctu r al gr oup in gs. It w as cal ibrated bycompar ing i ts pr ojection s for 1977—84 w ith the actual data .
In gener al , the dem and pr ojections u sed in th isr epor t star tin 1990 .

m ovals, and suppl ies ar e pr esen ted i n separ ate tables forowner sh ip and m an agem en t type categor ies.
All h istor ical data w er e der ived fr om S tate inven tor ies conducted at vari ou s dates fr om the 1940
’
s to the pr esen t as a
par t of the For est Su r vey . S im ple in terpo lat ion and extr apo lat ion wer e u sed to adjust the data to comm on year s, in
effect updating or backdat ing the inven tor ies. For est Ser
vice plan ting r eco r ds and lon g - r ange ow ner sh ip tr ends w er eu sed to pr ovide cr oss tabu lat ion s by ow ner and for est
c lasses for som e of the ear l ier su r veys. Est im ates for al l
States for 1985 ar e str on gly influ en ced by tr ends i n them ost r ecen t S tate su r veys in the Sou th , and m i dcyc le or i n
ter im su r veys wher e available . T he Tim ber Resour ce Inventory Model pr ojection s began w ith in ven tory data fr om the
m ost r ecen t S tate sur vey . T he aver age date of these sur
veys w as abou t 1980 . T he fir st pr oject ion per iod , 1980—85 ,
was u sed to update and cal ibr ate the Tim ber Resou r ce Inven tory Model inpu t data w ith the h isto r ical data for 1985 .
Projection r esu lts ar e r epor ted fr om 1990 to 2030 .
State- Level P r oject ion s
T he Sou ther n Ar ea Model yields State- level ar ea pr ojectionsbecau se sub - S tate r egion s ar e u sed as the basic m odelun its. T he Tim ber Assessm en t Market Model oper atesr egionally (Sou theast and Sou th Cen tr al) and the Tim ber Resou r ce In ven tory Model , wh ich is capable of oper ating atthe State level , w as also r u n r egion ally . Thus, the basic pr ojections of tim ber r esou r ce changes wer e m ade r egionally .
T he projections of changes i n t im berr esou r ces in th is study ar e based on a
compr ehensive data base co l lected by the
USDA For est Service as a part of acon tinu ing inven tory of forest resou r ces—the“
For est Su rvey .
86
T he State estim ates w er e developed usin g the State Allocation of Regional Inven tory Model (SARI) .
Th is State system m ain tains consisten cy w ith the r egionalsystem s by estim ating S tate shar es of r egion al gr ow th ,
r em ovals, and in ven tory change due to ar ea chan ge . It uses
estim ates of r egional gr ow th and r em ovals by ow ner sh ip/m an agem en t type fr om the r egion al m odel , S tate acr eagepr ojection s, and h istor ical State data to m ake State i nventory pr ojections. A State ’
s gr ow th is estim ated by ( 1 ) i ts h is
tor ic gr ow th per acr e r elat ive to the o ther S tates i n the
r egion , (2 ) i ts pr ojected acr eage of tim ber land , (3 ) pr ojectedtim ber inven tor y , and (4) site qu al ity .
Tota l r egion r em ovals ar e allocated to States in a five- step
pr ocedu r e:
Industri al pr oduction w as sh ifted betw een S tates to m ai ntain h istor ical r elative stumpage pr ice d iffer en ces betweenS tates;
(2 ) Har vest w as allocated to '
States based on owner sh ip m ix ,
chan ges in inven tory , and pr opor t ion of r egion al indu str i alpr oduction ;
(3 ) State har vest w as al located to owner s based on changesin inven tor y by owner and chan ge in S tate industri alproduction ;
(4) Har vest by owner sh ip w ith in States w as adjusted proportion ately to be consisten t w ith total r egional har vest by ow n
er sh ip and pr opor tion of r egional har vest by the S tate; and(5) State har vest by owner sh ip w as allocated to m anagem en t types based on inven tory and h istor ical r em oval pr opor tions by m an agem en t type .
T he latest For est Ser vice sur vey in form at ion in each State
is used to estim ate gr ow th per acr e for each State/ow ner/m anagem en t type com bination (Abt Som e of the fac
tors affectin g State gr ow th m anagem en t in tensity and
stocking) ar e accou n ted for by r ecogn izing d iffer en ces between ow ner s (for est indu stry vs. ind iv idu al) and m anagem en t types (p ine p lan tat ion vs. n atu r al p in e) . With in an
owner/m anagem en t type c lass, the gr ow th d iffer en tial s accou n t for d iffer en ces i n site qu al ity , stocking , and spec iesm ix . Over the pr oject ion per iod ,
gr owth d iffer en tials ar eadju sted to r eflect pr ojected d iffer ences in inven tory per acr eand aver age site qu al ity between States.

In the fu tu r e , as i n the past , chan ges in the tim ber r esou r cew ill be determ ined in lar ge m easu r e by gr ow th i n popu lation ,
incom e ,and econom ic act ivity ; chan ges i n tim ber land
ar ea ; and the m an agem en t in tensity and assoc iated yieldson those lands available for tim ber production . It is r ecogn ized that fu tur e changes i n these basic determ inan ts m aybe m u ch d iffer en t fr om those“
descr ibed below . However ,these assum ptions ar e consisten t w ith the gener al soc ietalgoals of fu ll em ploym en t , con tinu ed econom ic growth , r i s
ing income ,and im proved m an agem en t of forest r esou r ces.
In lar ge par t , these assum ption s also ar e based on h istor i
cal t r ends and cu r r en t expectations that ar e the r esu lt of m assive social , political , technological , and in stitu tional for ces
Popu lat ion gr eatly affects dem and for
timber and the conver sion of t imber land toother u ses such as cropland and pastu r e ,
r ecreat ion , and u rban developm en t . By
2030 ,the U .S . popu lat ion is expected to be
3 19 m i l l ion , w ith per capita incomes morethan tw ice those of today .
not easily or qu ickly chan ged . Thu s they shou ld pr ovide a
r eal ist ic basis for gu id in g po l ic ies and pr ogr am s i n the
year s imm ed iately ahead .
Popu lation
Tr ends in total popu lat ion and chan ges i n i ts com ponen tshave im por tan t effects on activity in the m ajor tim ber pr od‘
nets m arkets and ar e one of the pr in c ipal sour ces of pr essu res on for est lands for conver sion to alter nate u ses, suchas food and fiber pr odu ction , r ecr eation , and u r ban developm en t . Over the last 55 year s, the num ber of people in theUn ited S tates h as abou t dou bled , to a cu r r en t level ofnear ly 242 m i ll ion (table fi g .

T ab le — P0 pu 1ar ion , gr oss nat ional pr odu ct , and d isposab le per sonal incom e in the Un ited S tates, spec ified year s, 1929—85 , w ith project ions
to 2030
Per cap itaPopu lat ion
' Gr oss nationa l pr oduct d isposable persona l income
B i l l ion An n ua l r a te
1982 do l la r s of change
1
Pr oject ion s
l 990
2000
20 10
2020
2030
Data for 1929 , 1933 , and 1940 exc lude A l aska and H aw ai i .
No te: An nual r ates of change cal cu l ated for var i ous per iods as ind icated .
Sou r ces: Popu l a tion : U .S. Depar tm en t of Comm er ce ,Bu r eau of the Cen su s. Popu l at ion est im ates and pr ojec t ion s. Cu r r . Pop . Reps.
Ser . P - 25 . 1 929—49—“
Est im ates of the popu lat ion of the Un ited S tates and componen ts of change: 1940 to 1978 . No . 802, 1979 .
1950- 79—“
Est im ates of the popu lat ion of the Un ited S tates and componen ts of change: 1970—84 . No . 97 1 , 1985 . 1 980—86—“
Est im atesof the popu l ation of the Un ited S tates to Mar ch 1 , 1987 . No . 1004 , May 1987 . Gr oss n a t ion a l p r odu ct , d isposab le per son a l in cdm e,
and per cap i ta d isposab le per son a l in com e: Counc i l of Econom ic Advisor s. I92 9—78— Econorn i c r epo r t of the Pr esi den t .
‘
Febr u ar y 1987 .
1979—86— Econom ic Ind icator s. Ju ly 1987 .
Pr oject ions— U .S . Depart m en t of Agr icu l ture ,For est Ser vice , based on data in Whar ton Econom etri c For ecast ing Assoc iates. Long - term
Al tem'
ative Scen ar ios and 25 " ear Extension .
”Vol . 5 , No . 1 , Febr uary 1987 .
88

dem ands of 3 20 m i l lion peop le w ith m u ch gr eater pu r chasing power than they have today . Although dem and for
services is expected to accou n t for a lar ge par t of theadd ition al dem ands gener ated by m or e peop le w ith lar gerin com es, substan tial gr ow th i n the dem ands for fu r n itu r e ,
newspaper s, m agazines, and other goods m ade i n who le or
in par t fr om tim ber pr odu cts is likely .
In st i tu t ion a l , Tech n o logi ca l , an d Oth er Ch an ges
In the past , in stitutional and technological changes have m ater ial ly influen ced the u se and avai lability of t im ber andother r enewable r esou r ces. For exam ple , incr easin g u rbanization and attendan t land constr ain ts have con tri bu ted to a
lar ger pr opor tional dem and for attached sin gle - fam i lyhou ses and apar tm en ts
— un its that ar e gener ally sm aller anduse less wood pr oducts per un it of floor ar ea than detachedhouses. S im ilar institu tional changes have influenced the design and con str u ction of lar ge u r ban bu i ld ings in wh ichw ood pr odu c ts u se i s l im ited by bu i ld in g codes or o ther
r estr ictions.
Techno logical ch an ge also has affected the dem an d fo r
tim ber . T he developm en t of econom ical w ater - r esistan t adhesives led to lar ge incr eases in plywood consum ption in the1950
’
s and 1960’
s. In tu r n , r isin g p lyw ood u se w as a m a
jor factor in holding down lum ber consum ption du r ing th isper iod . Mor e recen tly , developm en t of other panel products,such as str u ctu r al w aferboar d and or ien ted str and boar d ,
has r esu lted in the d isplacem en t of plywood for m any of thesam e u ses in wh ich i t ear lier r eplaced lum ber . New tech
no logy also has engender ed lar ge incr eases in har dw ood usein pallets and other panel pr oducts such as har dboar d and
par t ic leboar d and i n paper and boar d pr oducts.
At any tim e , poten tial institu tion al and technological changeson the hor izon cou ld affect the dem and for tim ber pr oducts.
Bu t the natu r e and effect of m any of th'
ese poten tial changesar e sim ilar to those that h ave taken place i n the past andar e accou n ted for in the h istor ical data used in pr epar ing thepr ojections.
Changes i n ener gy costs have substan t ial effects on the dem and for tim ber pr oducts, both th r ough their im pact on thelevel of econom ic activity and th r ou gh their d ir ect im pacton the use of the var iou s pr odu cts, espec ial ly fuelw ood .
Mor eover , the cu r r en t lon g - term ou tlook for ener gy costs
is clouded by the dr op i n fossi l fuel pr ices in the 1980 ’
s,
after extr em ely r apid gr ow th in the pr eced ing per iod . H ow
ever , m ost r ecent an alyses, includ ing one by Whar tonEconom etr ic For ecasting Ser vices ind icate that
90
Energy costs have substan tial im pacts on thedem ands for tim ber pr oducts, par t icu lar lyfuelwood . Most ener gy an alysts expectupw ar d pressu r e on o i l
'
pri ces i n the 1990’
s
and beyond . T h is trend w i l l su r ely lead toin creased dem ands on dom estic t im berr esour ces for fuelwood .
wo r ldw ide dem and for cr ude o i l is likely to appr oach capac
i ty levels arou nd the tu r n of the cen tu ry , even w ithou t r estr ain ts by the Per sian Gu lf coun tr ies. Th is i s expected toagain cr eate sign ifican t upw ar d pr essu r e on r eal o i l pr i cesi n the 1990
’
s and beyond to the exten t that Whar ton pr ojects that the pr oduction of syn thetic fuels w il l becom e econom ical l y viable .
Tr en ds in T im ber Use an d P r ojected Dem an ds
T he vo lum e of r oundw ood r em oved fr om the inven tor y oftim ber i n the Nation ’
s for ests is lar gely determ ined by thehar vests of t im ber for the pr odu ction of lum ber , paper andboar d , panel pr odu cts, and for fuelwood . These tim ber r em oval s and net annu al gr ow th ar e the m ajor determ inan ts ofchan ge i n t im ber r esou r ces .
Tim ber has been har vested sin ce sett lem en t began . S tar t
ing then , and for a long t im e after , tim ber w as the Nation ’
s
m ost im por tan t r aw m ater ial . It had w ideu se i n al l types
Substan tial am oun ts of capital w i ll be r equ ir ed to m ake thenecessary investm en ts in m anagem en t , physical faci l it ies,and pr ocessing plan ts to accomm odate in cr eased dem ands for
tim ber pr oducts. Bu t w ith the expected gr owth in gr oss nat ion al pr oduct d iscussed ear lier , i t does not appear that capital ava i labil ity w i l l sign ifican tly constr ain lon g - term eco
nom ic gr ow th i n gen er al or in ten sified u se of tim berr esou r ces.

of constr u ction and m anu factu r ing , r an ging fr om houses,
br idges, and even r oad su rfaces to the w agons and sh ipsthat pr ovided the ch ief m eans of tr an spor tation . It w as alsothe m ain sou r ce of fuel for dom estic and industr ial u ses.
Althou gh over the year s in du str ia l and hou seho ld u ser s
tur ned m or e and m or e to pr odu cts m ade of ir on , steel ,p lastics, and other r aw m ater ia ls and to fuel o i l , gas, andother nonwood m ater ials for power and heat ing , the dem and for tim ber pr oducts con tinues.
‘
And in total , in r ecen t
decades i t has been r ising .
Between 1950 and 1984 , U .S. consum pt ion of al l tim berpr oducts (in clud ing r ound fuelwood fr om nongr ow ing stocksou r ces) in cr eased by m or e than 50 per cen t , r isin g fr omabou t 12 bill ion to near ly 19 bill ion cubic feet . Althou ghcon sumption of r ou nd fuelwood incr eased r apid ly in thelate 1970 ’
s and ear ly 1980 ’
s, th is cam e after dec linesthr ou ghou t the 1950 ’
s and 1960’
s. In con tr ast , consumptionof industr ial tim ber pr oducts in cr eased fa ir ly stead ily overthe 35 -
year span . Du r ing th is per iod ther e w as gr ow th inconsumption for near ly al l indu str ial tim ber pr odu cts; how
ever , m o st of the in cr ease w as i n pu lp pr odu c ts and i nplywood , veneer , and other panel pr oducts.
T r en ds i n the Major T im ber P r odu cts Ma r kets
Dem ands for sol id wood pr odu cts su ch as lum ber and thevar iou s t im ber - based str u c tu r a l an d n on str uc tu r a l panelpr oducts
1ar e determ ined lar gely by tr ends in the m ajor tim
ber pr oducts m arkets— housin g , non r esiden tial constr uction ,
m anu factu r ing , and sh ippin g .
H ou si ng— In term s of vo lum es con sum ed , residen tial con
str uction long has been the m ost impor tan t m arket for m ost
S tr uctu r a l panel produ cts inc lude softwood plywood , o r ien ted str and
board , waferboard , and composite boar d— a waferboard or part ic leboar d andveneer com b ination panel . Nonstr uctu ral panel pr oducts include har dwood
plywood , par t ic leboard ,insu lat ing board , and har dboar d .
H ousing is the lar gest m arket for m ostt im ber pr oducts. Rough ly hal f of thelum ber , two - th ir ds of the stru ctu r a l panel
pr oducts, and substan tial vo lumes of nonstr uctu r a l panels ar e used in the
constr u ct ion , upkeep ,and improvem ent of
housing .
9 1

tim ber pr odu cts. Over the past decade , r ough ly half of thelum ber and tw o - th ir ds of the str u ctu r al panel pr odu cts, plu ssubstan tial volum es of n on str u ctu
'
r al pan el pr oducts, h avebeen u sed i n the pr oduct ion ,
upkeep ,and im pr ovem en t of
housing . Abou t 75 per cen t of the total tim ber pr oducts u sedin hou sin g over th is per iod w en t in to the con str u ct ion of
new hou sing u n its. T he r em ain in g 25 per cen t w as used forupkeep an d im pr ovem en t of existin g u n its .
Pr oduct ion of new hou sin g i n the Un ited States— c onven
tion al u n its and m obile hom es— aver aged m il lion un itsa year du ri ng the 1950 ’
s and 1960’
s, m oved up to over
m illion un its i n the ear ly 1970 ’
s, bu t subsequen tly dr opped
T ab le — Aver age annu al pr oduct ion of new hou sing u n its in theUn ited S tates, by type of u n it , spec ified per iods, 1950—84 ,
w ith
pr oject ions to 2030
Thousand un i ts
Conven t ion al u n its
Pr oject ion s
Note: Data m ay not add to totals becau se of r ound in g .
Sou rces: H ousin g sta r ts: 1 950—58— For est Service est im ates based on datapubl ished in U .S. Depar tm en t of Cormn er ce , Bu r eau of the Census. H ous
ing co nstr uct ion stat ist ics 1989 to 1964 . 1966 . 1 959—84— U .S. Depar t
m en t of Comm er ce , Bu reau of the Census. H ousing start s. _Cons. Reps.
Ser . C20 . Annu al .
Projections: U .S . Departmen t of Agr icu l tu r e , For est Service , based on data
in Whart on Econom etr ic For ecast ing Assoc iates. Long - term A l tern at iveScenar ios and 25 Year Exten sion . Vol . 5 , No . 1 . Febr u ar y 1987 .
92
sharply i n the late 1970 ’
s and ear ly 1980 ’
s (table fig .
In 1983 and 1984 , total ou tpu t again r ose above2 m i llion u n its.
T he type of hou si n g un its dem anded— single- fam i ly , m u ltifam ily , m obile hom e— is of m ajor im por tance in pr ojectin gdem ands for tim ber pr odu c ts becau se of the lar ge d ifferences in the aver age am ou n ts of tim ber pr odu cts u sed ineach type .
Analyses based on pr ojection s of the factor s that determ i n elongr u n dem ands for new hou sin g un its— hou seho ld form a
tions, r eplacem en t of un its lost from the hou sin g stock , and
m ain ten an ce of an in ven tory of vacan t u n its ind icate con
tinded h igh levels of dem and in the late 1980 ’
s, r esu lting inan aver age of near ly m i llion un its for the last half ofthe decade . Hou sin g dem and r em ain s at abou t m ill ionun its i n the 1990 ’
s, peaks at near m i ll ion ear ly in thenext cen tu ry , and subsequen tly dr ops to between and
m il lion thr ough 2020 . Over the last 10 year s“
of the pr ojection per iod , total dem and gr adu al ly dec l ines to abou tm i llion un its .
S ingle—fam ily hou ses ar e typ ically occup ied by hou seho ldswhose heads ar e in the m idd le age c lasses, wh ile occupan cy
of un its in m u ltifami ly bu i ld in gs and m obile hom es is h ighest am ong hou seholds headed by you nger and older per sons.
As a r esu lt of pr ospect ive sh ifts i n the age d istr ibu tion of
the popu lat ion ,
—an d the assoc iated ch an ges i n hou seh o ld
types an d in com e , the n um ber s of con ven t ion al sin glefam ily u n its dem anded ar e pr ojected to flu ctu ate bu t generally r em ain near to m i llion th r ou gh m ost of thepr oject ion per iod : T he num ber s of m u ltifam ily u n itsdem anded show the sam e tr end . Dem and for m obilehom es—
_
m ost of w h ich w il l be pr odu ced for pr im ary
r esiden tial u se an d ar e expected to becom e lar ger and m or ehou sel i ke— r em a in s r elatively con stan t at to
u n its a year th r ough the pr ojection peri od . Th is i sjust sl i ghtly lar ger than the n um ber of u n its d iscar dedeach year .
In add ition to the n um ber s of n ew un its dem anded , theirsize is also an im por tan t determ in an t of the am oun t of tim
ber pr odu cts used in housing . T he aver age size of singlefam ily hou sing un its, though show ing som e flu ctuation , h as
gr ow n fair ly stead i ly over the past 35 year s, r ising fr omnear squ ar e feet i n the ear ly 1950 ’
s to abou tsquar e feet in 1986 . Th is in cr ease in floor ar ea has r esu ltedin little loss i n aver age lum ber u se per sin gle - fam i ly un i t ,
despite a dec l in in g tr end i n u se per squ ar e foot of floorar ea . T he size of un its i n m u ltifam i ly str uctu r es alsoincr eased ; however , the r ise has been somewhat sm al ler an d

tion of offices, stor es, chu r ches, and a w ide vari ety of other
nonr esiden tial bu ildings, and i n other types of constr uctionsu ch as r oads, dam s, and w ater an d sew er system s. Al
thou gh expend itu r es for the var iou s c lasses of constr u ctionhave flu ctu ated w idely i n r espon se to chan ging econom iccond ition s, the longr u n tr end for al l types com bined hasbeen str ongly upw ar d .
Projection s based on the c lose h istor ical r elationsh ip betw eenchanges in the Nation ’
s over all econom ic gr ow th (gr ossnational pr odu ct) and changes i n expend itu r es fornon r esiden tial bu ilding and nonbu i ld ing constr u ctionind icate substan tial add ition al expend itu r es over the next45 year s. How ever , the r ates of gr ow th u nder lying theseprojections dr op th r oughou t the pr ojection per iod . Ther e i salso a dec line in new non r esiden tial con str u ctionexpend itu r es as a per cen tage of gr o ss n ational pr odu ct . Th isis con sisten t w ith tr ends since the late 1960 ’
s, and w ith
estim ates that the ser vice indu str ies w i l l accou n t for agrow in g shar e of the Nation ’
s gr oss n at ion al pr oduct in theyear s ahead .
Man ufactu r i ng— S in ce the m i d - 1970’
s abou t 10 per cen t ofthe lum ber , 5 per cen t of the str uctur al panel pr oducts, andnear ly 25 per cen t of the non str uctu r al panel pr oducts havebeen used for the m an u factu r e of a w ide r ange of pr oductssu ch as househo ld fu r n itu r e— the lar gest m an u factu r ing u seof tim ber products— spor ts equ ipm en t , gam es and toys, andcomm er cial and indu stri al equ ipm en t .
S in ce Wor ld War II ,_
as the Nation ’
s popu lat ion ,in com e ,
and gr oss n at ional pr oduct have gr ow n , dem ands for m anu
factu red pr oducts have incr eased m ar kedly . Estim ates, basedon the c lose cor r elation s betw een the valu es of sh ipm en tsof cer tain gr oups of m anufactu r ed pr odu cts and pr ojectedchan ges in the econom ic an d dem ogr aph ic var iables di scussed ear l ier , indi cate con t in ued gr ow th in the year s ahead .
However , as in the case of nonr esiden tial constr uction , the
r ates of in cr ease i n the value of sh ipm en ts for al l gr oups ofpr odu cts, inc lud in g hou seho ld fu r n itu r e , dr op sign ifican tlyover the pr oject ion per iod .
Sh ipp i ng— In r ecen t year s, n ear ly 18 per cen t of the lum ber
and abou t 3 per cen t of the str u ctu r al and n on str u c tu r alpanel pr oducts consum ed have been u sed i n the pr oductionof wooden pal lets, con tain er m anu factur e , and for du nn age ,
block ing , and br acing of goods for sh ipping . Abou t thr eefou r ths of the lum ber and n ear ly two - th ir ds of the panelpr oducts consum ed i n sh ipp in g wer e u sed for pallets.
fac il ities gear ed to the use of pallets w er e con str ucted , and
the volum es of m anufactu r ed and agri cu ltu r al goods sh ippedhave incr eased . Pr ojections of pallet ou tpu t , based on i ts hi stor ical ly c lose r elation sh ip w ith the value of m anu factu ri ngsh ipm en ts and the assum ed gr ow th in sh ipm en ts as the gr ossnat ion al pr odu ct r ises, ind icate con tinu ed gr ow th i n dem ands for pallets.
T he other tim ber -
pr odu cts sh ipp ing m arkets— w ood con
tai ner s, and dunn age , blockin g , and br ac ing— ar e l ikely todec line slow ly over the pr ojection peri od , in r espon se to
con tinued d isplacemen t by m etal and fiber barr els and pa ils,and other fiber and plastic con tainer s, and du e to the r i sing u se of palletized ,
con tainer ized, and other bu lk sh ip
m en t system s.
In r ecen t decades, pa l let p r odu c t ion hasin cr eased r ap id ly and cr eated a n ew and
Over the past thr ee decades, pallet pr odu cti on has ri sen r ap lar ge m arket for lum ber , ch iefly har dwoodidly as new m ethods of m ateri al s hand ling wer e in tr oduced ,lumber .
94
Although incr eased dem and for pallets is expected over theen tir e pr ojection peri od , the r ates of gr ow th dr op r ap idly .
In add ition to incr easing com petition fr om alter nate system s
and m ateri als, su ch a falloff m ean s that gr ow th in pal let dem and for u se in new m ateri als- hand ling system s gr adu allyends, and that expansion ther eafter depends to a lar ge degr ee on gr ow th in indu str ial and agr icu ltu r al produ ction .
Tr en ds in Un i t Use~T he pr ojected levels of activity i nthe m ajor m arkets discu ssed above ar e on ly one of the deter
m in an ts of fu tu r e dem ands for lum ber and panel pr oducts.
Also im por tan t ar e ch anges in pr odu ct un it - u se factor s, that
is, the vo lum e of tim ber pr odu cts used per squ ar e foot ofhou sing un it floor ar ea , per dollar of con str uction expen
di tur e , per pallet , or other m easu r e of m arket change .

In response to changes in the pri ce of tim ber pr odu cts, bothactual and r elative to pr ices of com petin g wood and non
wood pr oducts; im pr oving con str uction and m anu factu r ingtechno logy ,
bu ild ing codes, and other inst itu tion a l factor s;and changes“
in consum er pr efer ences and tastes, ther e havebeen w idely d iver gen t tr ends i n the un it - u se of the m ajortim ber pr odu c ts over the past 3 5 year s . Fo r exam p le , i n
housing and other types of l igh t bu ilding constr uction ,
ther e was extensive displacem en t of lum ber subfloor ing and
sheath ing by softw ood plywood i n the 1960 ’
s and ear ly1970
’
s. Lumber u se per squ ar e foot of floor ar ea i n housing also was adver sely affected by the substitu tion of car
peting for har dwood floor ing , and by the incr easing u se ofr oof tr usses and other pr efabr icated componen ts. Gr owthi n the u se of softwood p lyw ood , m eta l , an d paper boar dconcr ete - form in g m ater ia ls i n lar ge bu i ld in gs and other
str uctur es, and the substitu tion of par tic leboar d for lum bercor estock and
'
plasti cs fo r other w ood par ts i n fu r n itu r em anu factu r e also cau sed dec l ines in the un it—u se of lum berin the non r esiden t ial and m anu factu r ing m arkets. In sh ipping , lum ber u se per pal let also fel l , i n par t becau se of the
subst itu tion of o ther tim ber pr odu cts su ch as p lywood ,
har dboar d , and par t ic leboar d .
In con tr ast to the downwar d tr ends in the u n it - use of lumber ,use of the other m ajor tim ber pr oducts r ose in m ost of thekey m arkets, althou gh ,
as d iscussed above ,th is grow th of
ten r esu lted fr om their substitu tion for lum ber or other t imber pr oducts. T he incr eases i n p lywood u se per squar e footof floor ar ea in housing and per do l lar of expend itu r es inother types of con str uct ion,and the r ise i n par t ic leboard ,
m ed ium—den sity fiber boar d , and har dboar d per do llar ofm anu factu r in g sh ipm en ts wer e par ticu lar ly lar ge in the1960
’
s and 1970’
s. Mor e r ecen tly , however , softwood plywood subfloor ing and r oof and w all sheath ing have begunto be d isplaced by the r elatively newer w aferboar d and or i
en ted str and board pr oducts.
In the fu tu r e , r elative pr ices and the nonpr i ce factor s c itedabove w il l con tinue to . be the pr im ary determ inan ts ofchan ge i n the u n it - u se of t im ber p r odu cts . Accor d in gly ,
pr oject ions of pr oduct - u se factor s for the m ajor m arketshave been based on cu r r ent tr ends, judgm en tally m od ifiedto be consisten t w ith the m ost likely fu tu r e m ovem en ts ofr elative pr ices and associated changes i n the var ious nonpr icefactor s. In gener al , th is procedu r e has r esu lted in a con tinuation of r ecen t tr ends in the var iou s un it - u se factor s over thenext few years. For exam ple , add it ion al incr eases in the factor for or ien ted str and boar d/w aferboar d pr oducts in housi ng and other ligh t bu i ld in g con str uction ar e pr ojected dueto their likely con tinued penetr at ion of tr ad ition a l softwoodplywood u ses becau se of pr ice advan tages. And , i n r ecog
n i tion of th is, the use factor for softwood p lywood in thesem arkets has been pr ojected to dec line .
In r ecen t year s,l um ber con sum pt ion h as
been near l y a th ird above the levels of the1950
’
s and 1960’
s. Dem and for both soft
wood and har dw ood lum ber is expected tori se slow l y over most of the pr ojec t ion
per iod .
95
For the lon ger r u n , the pr ojected r ates of incr ease or
decr ease for the var ious pr oduct u n it - u se factor s have beenr educed in r ecogn it ion of the fact that con tinued changebecom es m or e d ifficu lt as m ar kets ar e satu r ated or as m ar
ket shar e appr oacheszer o . Th is phenom enon , wh ich can
be due to local ized pr ice or to institu tion al and other
nonpr i ce factor s, has appar en tly alr eady taken place in thecase of lum ber used for residen tial sheath ing and sub
floor i ng ,w her e ther e has been near ly a total d isplacem en t
by str uctu r al panel products. S ince th is substitution w as oneof the m ajor r eason s for the r ap id dr op in the lum ber u sefactor for housing du ri ng the 1960 ’
s and ear ly 1970 ’
s, on ly,a gr adual dec l ine due to other cau ses i s like ly du r ing thepr ojection per iod . As m arkets for a par t icu lar pr oduct becom e satu r ated , any fu tu r e r ises in i ts total u se w il l dependon the developm en t of new m arkets or incr eased act ivityi n those alr eady established .
Con sum p t ion an d P r ojected Dem an ds for Lum ber an dPan el Pr odu cts— Based on the projections and assumptionsabou t the m ajor m ar kets d iscussed ear lier in th is section ,
dem ands for lum ber and the var iou s str u ctu r al and nonstr u ctu r al panel pr oducts ar e pr ojected to fo llow som ewhat
d iver se trends over the next 45 year s. In term s of vo lum e ,
the lar gest incr eases for lum ber ar e expected to be insh ipping ; for or ien ted str and boar d/w afer boar d ,
i n r esidential constr u ction ; and for hardboar d and par t ic leboar d , i n

m anufactu r ing . For in su latin g boar d and softwood plywood ,r ise in line w ith pr ojected dem ands i n the other m arkets, ex
the dec l ines i n r esiden t ial con str uct ion ar e par ticu lar ly im cept hou sing . New hou sing w as exc lu ded because i ts depor tan t i n keepin g con sum pt ion r elatively flat thr ou gh the m and is so stron gly influ enced by popu lation dem ogr aphi cs .
pr oject ion per i od .
In add ition to the m ajor m arkets d iscu ssed above , add itional vo lum es of t im ber pr odu cts ar e u sed for a num ber ofo ther pu rposes for wh ich ther e ar e no h isto r ical data on
con sum ption . Am on g these ar e upkeep and im pr ovem en t ofnonr esiden tial str u ctu r es, r oof suppor ts and other con str uct ion in m in es, over - the - cou n ter sales for hom e w oodwo rkpr ojects, and m ade- on—the - job pr odu cts su ch as adver tisin gan d d isplay str u ctu r es .
Because of the lack of a statist ical base for pr ojecting thesem arkets i t w as assum ed that u se for these pu rposes wou ld
T ab le — Lum ber consum pt ion ,expor ts,
im por ts, and pr odu ct ion in the Un ited S tates, spec ified year s, 1952—84 ,w ith pr ojection s
to 2030
Pr oduction
T otal T otal T otal
Pr oject ion s
T otal dem and Export s Impor ts Dem and on U .S . m il ls
Inc ludes sm al l vo lum es of m i xed spec ies (not c l assified'
as softw oods or har dw oods) .
Note: Data m ay not add to total s because of r ou nd ing .
Sou r ces: Pr odu ct ion— Softwoods: 1952—76—U .S . Depar tm en t of Comm er ce , Bu r eau of the Cen sus. Lum ber product ion and m i l l stocks.
Cu r r . Ind . Reps. Ser . MA - 24T . An n u al . 1984— Wester n Wood Pr odu cts Assoc iat ion . P r odu ct ion fi H a r dwoods: U .S . Depar tmen t of
Agr icu l tur e , For est Ser vice est im ates based on data developed by CS . B inkl ey and P A . Car del l ich io ,Schoo l of For estr y and Environ
m en tal S tud ies, " a le Un iver si ty , New H aven , CT . Im po r ts an d Expo r ts: U .S . Depar tm en t of Com m er ce , Bu r eau of the Cen su s.
Imp or ts— U .S . im por ts for consumpt ion and gener al im por ts: T SUSA comm od ity by cou n try of or i g in . FT 246 . An nu al . Exp or ts
— U .S .
expor ts/schedu le E , conrr n odi ty by coun try . FT 410 . Mon thl y .
Pr oject ion s: U .S . Depar tm en t of Agr icu l tu r e , For est Service .
96
Lum ber— Lum ber consum ption i n al l u ses in 1984 w as
billion boar d feet (table fig . Th is w as alm ost30 per cen t above aver age con sum pt ion i n the 1950 ’
s and
1960’
s, and on ly sl igh tly below the al l - t im e h igh ,
bill ion ,r eached in 197 8 . Estim ated total dem ands for lum
ber r i se thr ou ghou t the pr ojection per iod , r each ing billion boar d feet i n 2030 . T he m ost r apid in cr eases occu r byear ly in the next cen tu ry ,
as the u se of softw oods in con
str uction and har dwoods in m anufactu r in g and sh ippin g continu e at r elatively h igh levels . After 20 10 , dec lin ing hon si ng star ts an d the som ew h at slow er r ates of in c r ease i neconom ic gr ow th and incom e affect both har dw ood and soft
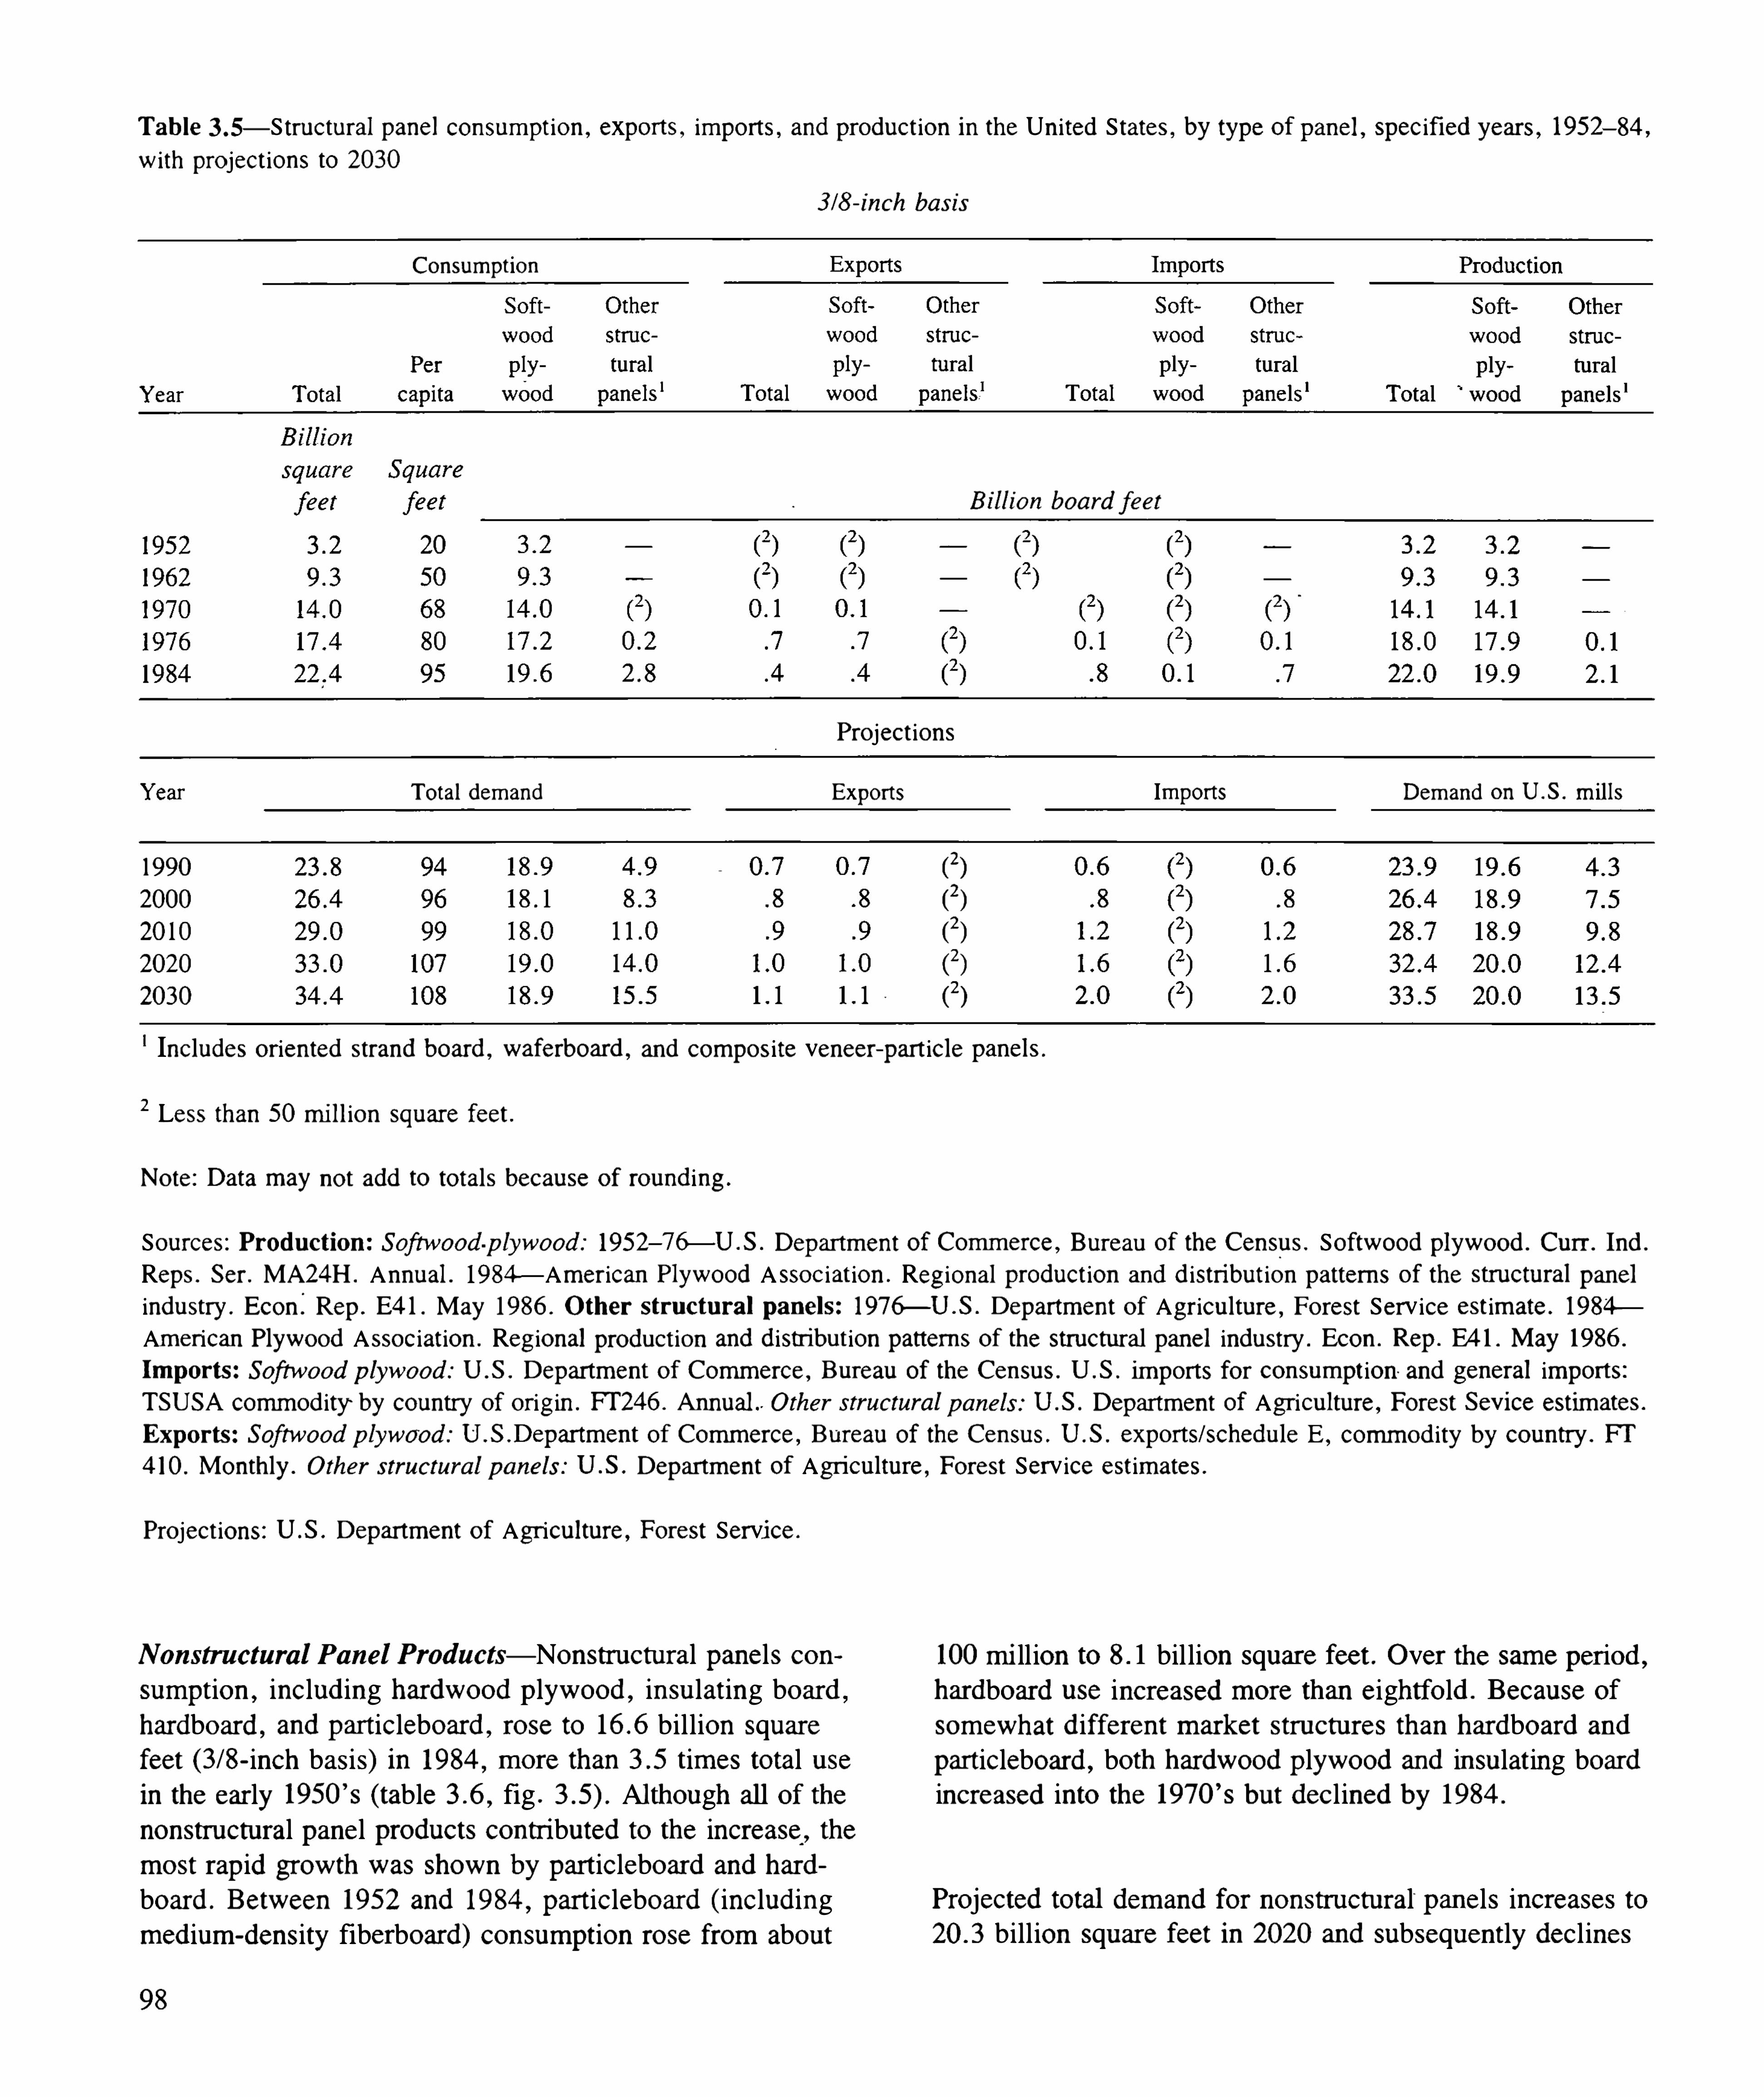
T ab le — S tr uctu r al panel con sum pt ion , expor ts, im por ts, and pr oduct ion in the Un ited S tates, by type of pan el , spec ified year s, 1952—84 ,
w ith pr oject ions to 2030
- in ch basis
Consumpt ion
B i l l ion boa r d feet
Pr oject ions
T otal dem and Expor ts Im por ts Dem and on U .S. m il ls
1990 (2)
2000 (2)
20 10 (2)
2020 (2)
2030 (2)
Inc ludes or ien ted str and boar d ,waferboard , and composite veneer—part icle panel s.
2 Less than 50 m i l l ion squ ar e feet .
Note: Data m ay not add to total s becau se of r ound ing .
Sou r ces: P r odu ct ion : Softw ood -p lywood : 1952—76— U .S. Departm en t of Comm er ce , Bu r eau of the Censu s. Softw ood plyw ood . Cu rr . Ind .
Reps. Ser . MA24H . Annu al . 1984— Am er ican Plywood Assoc iat ion . Reg ional pr oduct ion and d istri bu t ion patter n s of the str uctu r al panel
indu stry . Econ : Rep . E4 1 . May 1986 . Other st r u ctu r a l pan els: 1976— U .S . Depar tm en t of Agr icu l tu r e , For est Ser vice est im ate . 1984»
Am er ican Plywood Assoc iat ion . Reg ional produ ct ion and d istri bu t ion patter ns of the str uctur al panel indu stry . Econ . Rep . E41 . May 1986 .
Im por ts: Softwood p lywood : U .S . Depar tm en t of Comm er ce , Bu r eau of the Censu s. U .S . im por ts for con sum pt ion and gener al impor ts:T SUSA comm od ity by cou n try of or ig in . FT 246 . Ann ual Other str uctu r a l p an els: U .S. Depar tm en t of Agr icu l tur e, For est Sevice estim ates.
Expor ts: Softwood p lywood : U .S .Depar tm en t of Comm er ce , Bu r eau of the Cen su s. U .S . expor ts/schedu le E , comm od ity by coun tr y . FT
4 10 . Mon th ly . Other str u ctu r a l p a n els: U .S. Depar tm en t of Agr i cu l tu r e , For est Service est im ates.
Pr oject ions: U .S. Depar tm ent of Agr icu l tur e , For est Servi ce .
Non str u ctu r a l P an el P r odu cts— Nonstr u ctur al panels consum pt ion , includ ing har dwood p lyw ood ,
in su lat in g boar dhar dboar d , and par ticleboar d , r ose to billion squar efeet - inch basis) in 1984 , m or e than t im es total u sein the ear ly 1950 ’
s (table fig . Al though al l of the
nonstr uctu r al panel pr oducts con tri bu ted to the incr ease , the
m ost r ap id gr ow th w as shown by par t ic leboar d and har d
boar d . Between 1952 and 1984 , par tic leboar d (inc lud in gm ed ium - density fiber boar d) con sum ption r ose fr om abou t98
100 m i ll ion to bil lion squar e feet . Over the sam e per iod ,
har dboar d use incr eased m or e th an eightfo ld . Because of
som ewhat d iffer en t m ar ket str u ctu r es than har dboar d and
par ticleboar d , both har dwood p lywood and in su lating boar din cr eased in to the 1970 ’
s bu t dec l ined by 1984 .
Pr ojected total dem and for n onstr uctu r al“ panels incr eases tobill ion squ ar e feet in 2020 and subsequen tly decl ines

Figu r e— Str uctu r al panel consum ption in the Un ited States, by type, 1950—84 , w ith pr ojection s to 2030
sl ightly to billion in 2030 . Because of tr ends in theirm ajor m arkets, as wel l as the assum ption s abou t m arket penetr ation and product substitu tion d iscussed ear lier , som ewhatd iffer en t trends in dem and ar e pr ojected for the var iou spr oducts. In su latin g boar d , whose m ajor m arket is r esidential constr uction , is pr ojected to slow ly decline . Har dwood
plywood , used in m anufactur ing as well as constr uction , in
creases thr ough 2030 , wh ile par t ic leboar d r ises un ti l 20 10 ,
show s no gr owth i n the 2020 ’
s, an d ther eafter dec l in es.
Hardboar d is the on ly nonstr u ctu r al panel pr oduct to show
a steady incr ease thr oughou t the pr ojection per iod .
Con sum ption an d P r ojected Dem an ds for Pu lpwood
Pu lpwood use in the Un ited States has been incr easing fair lyr ap id ly over m ost of the past 100 year s. Mu ch of th isgr ow th has taken p lace since the ear ly 1950 ’
s, a per iod inwh ich consumption in U .S. m ills has m o re than quadr upled ,
r ising fr om abou t 27 m il lion cor ds in 1952 to m or e than 9 1
m illion in 1984 . As a r esu lt of th is gr ow th , cu r r en tly overa th ird of the indu stri al r oundw ood har vested fr om dom es
tic tim ber land is used as pu lpw ood .
Dem and for pulpwood i s a der ived dem and i n the sense
that is is determ ined by dem ands for paper , board , and other
woodpu lp- based pr oducts. Con sum ption of paper and boar d
has r isen fr om m i ll ion ton s in 1950 to m il lion in1984 . Per capita consum ption incr eased fr om -377 to 656
pounds over the sam e per iod .
Con sumption of m ost m ajor gr ades of paper and boar d hasincr eased substan tially in r ecen t year s. However , ther e havebeen lar ge d iffer ences i n the r ates of gr ow th . These d ifferences have r esu lted fr om su ch factor s as ch anges i ncon sum er tastes, developm en t of new pu lp - based pr oduc ts,inr oads of substitu tes, and varyin g r ates of gr ow th i nm ajor sector s of the econom y .
99

T ab le — Nonstr uctu r al panel con sumpt ion , expor ts, impor ts, an d pr oduct ion in the Un ited S tates, by type of panel , spec ified year 1952—84,
w ith project ions to 2030
- in ch basis
Expor ts Impor ts Production
Year
Pr oject ion s
T ota l dem and Expor ts Impor ts Dem and on U .S. m i l ls
(2)
.4 (2) . 1 . 1 .2 .4 .3 . 3 .7
.6 (2) . 1 .2 .3 .4 .4 .4 .7
.6 (2) . 1 .2 . 3 .4 .4 .4
.6 (2) . 1 .2 . 3 .3 .4 .3
Inc ludes m ed ium - density fiberboar d .
2 Less than squar e feet .
Note: Data m ay not add to to tal s because of r ound ing .
Sou r ces:P r odu ct ion : H a r dwood p lywood . 1952—84 —U .S . Depar tm en t of Comm er ce , Bu r eau of the Cen su s. [Annu al ly . ] Cu r r en t industr i al r epo r tsser ies: har dw ood plywood . M24F . Wash ington , DC : U .S. Depar tm en t of Comm er ce , Bu reau of the Cen sus.
Insu la t ing boa r d a nd ha r dboa r d : 1952—84— U .S . Depar tm en t of Comm er ce , Bur eau of the Cen sus . [An nu al l y . ] Cu r r en t indu str ial r epor tsser ies: pu lp , paper , and boar d . M26A . Washi ngton , DC : U .S. Depar tm en t of Comm er ce , Bur eau of the Cen su s.
P a r tic leboar d : 1952—75— U .S . Depar tm en t of Comm er ce , Bur eau of the Census. [Ann ual ly . ] Cur r en t industri al r eport s seri es: part icleboar d . M24L
Wash ington , DC : U .S . Depar tm en t of Comm er ce , Bu reau of the Census. 1976—84—Nati on al Par t ic leboar d Assoc iat ion . [Annual l y . ] Par t ic leboar
and m ed ium den sity fiberboar d : an nu al pr oduct ion and sh ipm en ts. Ga ither sbu rg , MD : Nat ion al Par t ic leboar d Assoc iat ion .
Expor ts: H a r dwood p lywood , in su la t ing boa r d , and ha r dboa r d : 1952—84—U .S . Depar tm en t of Com r irer ce , Bur eau of the Census. [Mon th ly . ]U .S. expor ts: schedu le B comm od ity by coun try . PI 410 . Washi ngton , DC : U .S. Depar tm en t of Comm er ce , Bu r eau of th e Censu s. 1984—Nat ionPar t icleboar d Assoc iat ion estim ate .
Im por ts: H a r dwood p lywood , in su la ti ng boa r d , and ha r dboa r d : 1952—84—U .S. Depar tm en t of Comm er ce , Bu r eau of the Census. [Annual ly . ] U .S
imports for consum pt ion and gener al im por ts: T SUSA comm od ity by coun tr y of or igin . FT 246 . Washi ngton , DC : U .S . Departm en t of Comm er ce
Bu reau_
of the Cen sus.
P a r t ic leboa r d : 1952—76—U .S. Depar tm en t of Comm er ce , Bur eauof the Cen su s. [Ann ual ly. ] U .S . impor ts for con sum pt ion and gener al impor tT SUSA comm od ity by coun tr y of ori g in . FT 246 . Wash ington ,
DC : U .S . Depar tm en t of Comm er ce ,Bu r eau of the Cen sus. 1984— Nat ional
Par t ic leboard Assoc iat ion est im ate .
100

T he woodpu lp indu stry’
s use of pu lpwood
has in creased near ly four fol d sin ce the ear ly1950
’
s. As a r esu l t , con sum pt ion i s nowabove 90 m i l l ion cor ds a year . Mor e than
a th ird of al l the in dustri al r oundwood cu tfr om dom estic tim ber lan d is u sed as
pu lpwood .
With these tr ends, dem and for w oodpu lp for the m anu fac
tu r e of paper and boar d r ises fair ly r apidly thr ough thepr oject ion per iod , in cr easin g abou t 75 per cen t , fr omm illion tons in 1984 to m il lion tons in 2030 .
Because of offsett ing tr ends r esu lting fr om changes in pu lpi ng technology , gr ades of paper pr oduced , and spec ies ofw ood used , aver age con sum pt ion of pu lpwood per ton of
pu lp pr oduced has not changed sign ifican tly over the past 60year s. How ever , i t has been assum ed that the n et effects
of con t inu in g techno logical developm en ts and fu r ther i n
cr eases in the use of h igh -
yield har dwoods w i ll cause a de
cline i n consum pti on of pu lpw ood per ton of pu lp pr oduced ,
fr om an aver age of abou t tons in the m i d - 1980’
s to
ton s in 2030 .
Given the above pr oject ion s and assumptions, the dem and
for pu lpw ood in U .S. m i lls r i ses to m i ll ion cor ds in
2000 , w ith a further incr ease to mi l lion in 2030 (tablefig . These volum es ar e , r espectively , abou t 23
per cen t and 56 per cent above the 9 1 .4 m i llion cor ds con
sum ed m 1984 . Par t of the dem and for pu lpwood has beenm et by the use of slabs, edgin gs, ven eer cor es, and other
bypr oducts pr oduced at pr im ar y m an u factu r ing plan ts. Be
tween 1952 and 1984 , use of su ch m ater ials (includin g som epu r chased ch ips pr oduced fr om r ou ndwood) incr eased fr om
m ill ion to m i ll ion cor ds. Most of the econom i
102
cal ly ava i lable supp l ies of these m ater ials ar e cu r r en t lybeing util ized , either for pu lp pr oduction , fuel , par ticleboar dm anu factur e , or for expor t . Mor eover , com petition for anynew ly available suppl ies of bypr oducts is likely to in tensify .
Nonetheless, as a r esu lt of the projected gr ow th in dom esti c lum ber pr oduct ion , the vo lum e of bypr odu cts u sed forpu lpwood is expected _
to in cr ease by m i ll ion cor ds
over the pr oject ion per iod . As a pr opor t ion of total pu lpwood use , however , bypr odu cts decl ine fr om about 40 percen t in 1984 to ju st over 34 per cen t in 2030 .
Con sum pt ion an d P r ojected Dem an ds for Other In du s
tr i a l Tim ber P r odu cts— A var i ety of other indu stri altimber pr oducts, inc lud ing poles; pi ling ; posts; r ound ur inetimber s; bolts u sed for sh in gles, hand les, and wood tumings; and chem ical wood , i s consum ed in the Un ited States.
Th is total also includes r oundwood used for or ien ted str and
board or waferboard and par t icleboar d not m anufactur ed frombypr oducts. Total consumption of r oundwood for these prod
ucts am ou n ted to an est im ated 415 m i l l ion cubic feet i n1984 . Th is was som ewhat below the gener al level of usein the 1950
’
s and l 96o’
s, when estim ated consum ption averaged m or e than 575 m i l lion cubic feet per year , an d far below the 2 billion cubic feet consum ed an nually in the ear ly1900
’
s.
Ch ips pr odu ced fr om slabs, edg ings,veneer cor es and other byproducts of
pr im ar y wood- m anufactur ing plan ts, such as
sawm i l ls and veneer plan ts, ar e animpor tan t sour ce of fiber for the woodpu lpindustr y . Most of the
'
econom ical lyavai lable suppl ies of such m ater i al ar e now
bein g u til ized . In the fu ture , the pu lp
industr y must in cr easingly tur n to r oun dwoodfor fiber .

T ab le — Pu lpwood consum pt ion , expor ts, im por ts, and product ion in the Un ited S tates, spec ified year s 1952—84 ,w ith
, project ionsto 2030
Mi l l ion cor ds
Pr oject ions
Year
1990
2000
20 10
2020
2030
Dem and for U .S. pu lpwood
Roundwood fr om U . S . timber land
Inc ludes pr im ary pr ocessing plan t bypr oducts, such as slabs, edg ings, and veneer cor es, well as unknown volumes of pu lp chips pr oducedd irectly fr om roundwood at logg ing sites and other locat ions r em ote fr om pu lpm ills.
2 Less than co rds.
Note: Data m ay not add to totals becau se of round ing .
Sour ce: U .S. Depar tm en t of Agr i cul ture , For est service . Der ived fr om data publ ished by the U .S . Depar tm en t of Comm er ce , Bur eau of
the Cen sus; the Am er ican Paper Inst itu te ; and the Am er i can Pu lpwood Assoc iat ion .
Pr oject ions: U .S. Departm en t of Agr icu l tur e ,For est Service .
T he long dow nw ar d tr end i n the u se of m iscel laneou sr oundwood products appear s to have bottom ed ou t in r e
cent year s. S ince the rn i d l 97o’
s, consum ption has beengr adually increasing . Consequen tly , i t has been assum ed that
dem and for these“
products (inc lud ing r oundwood for oriented str and boar d , waferboar d , and par tic leboar d) w ill r iseslow ly to bill ion cubic feet in 2030 . Much of the
increase is expected to com e fr om expand ing consum ptionof roundwood for these board pr oducts as com pet it ion forbyproducts for u se in their m an ufactur e becom es m or ein tense .
Consum ption an d P r ojected Dem an ds for Fu elwood
Total fuelwood con sumption in 1984 w as an est im ated 49
m i llion cords, or abou t bill ion cubic feet . Of the tota l ,
Fu elwood w as the m ajor sou r ce of en er gy i n the Un itedStates u n ti l the 1870 ’
s. However , over the n ext cen tu r yfuelwood u se dr opped shar p ly , supplan ted by fossi l fuels andelectr ic ity . By 1970 ,
less than 2 per cen t of al l the househo lds in the Un i ted States u sed wood (near ly al l r oundwood)as their pr im ar y heat in g fuel and less than 1 per cen t as
103
46 per cen t or bill ion cubic feet , w as r oundwood harvested fr om gr ow ing stock trees. T he r em ainder cam e froma var iety of sou r ces, includ ing tr ees that gr ow on land otherthan t im ber land , such as fence r ows and u r ban ar eas;
r ough , r otten , and dead tr ees on timber land ; m ater ials leftin the for est after har vests; and plan t bypr oducts. Abou t 80per cen t of the total har vested fr om gr ow in g stock washardwoods.

thei r pr im ar y cooking fuel . Althou gh ther e w as som e gr owthin the u se of bypr odu cts, bar k ,
and sim i lar m ateri als by thew ood -
pr odu cts industr ies in the 1960 ’
s— par tially stim u latedby in cr easin g con cer n s abou t the envir onm en tal effects ofw aste disposal— their d ir ect u se of r ou ndwood w as sm al l .
W ith the dr am at ic ri se in fossi l fuel pr ices
that began in the m i d- 1970
’
s, m an y hou se
holds began to u se wood for heat in g . By th e
ear ly 1980’
s, 22 m il l ion hou sehoms» over Despite con t in u in g r elatively h igh levels of con sum pt ion ,
a qu ar ter Of an househc’l ds’u sed fuelwOOd ‘
ther e ar e ind icat ionsthat the u se of w ood fuel for r esidenNear l 29 m i l l ion househo lds h ad w ood
bum izg equ ipm en t .
tral heatrng has slow ed or decl rn ed m the past 2 year s or so ,
Mi llion cords
Ha rdwood roundwood
1 9 90
Figu r e— Pu lpwood pr odu ction i n the Un ited States, by sour ce of m ater ial , w ith pr ojection s to 2030
104
W ith the dr am atic in cr eases in fossil fu el pr ices in the 1970 ’
s
and ear ly 1980 ’
s, an in cr easin g num ber of hou seholds began to u se w ood as the pr im ar y or as a secondar y sour ce of
heat . By 1981 , m ill ion hou seho lds (27 per cen t) u sedfuelw ood and m i llion had wood - burn ing equ ipm en t installed i n their hom es. Wood pr odu cts m an u factur er s and ,
to som e exten t , other indu stri es, in c lud ing u ti lities, also incr eased the ir u se of wood , as a r esu lt of the in cr easin gcosts of u sin g other fu els and factor s su ch as the in cen tivescon tained i n the Nat ion al En er gy Act of 197 8 for cogener at ion an d u se of fu els other than oi l or gas.

T ab le — Roundwood consum pt ion in the Uni ted States, by spec ies gr oup and pr oduct , specified year s 1952—84, w ith project ions of dem and
to 2030
B i l l ion cub ic feet , r oundwood equ iva len t
Inc ludes both pulpwood an d the pu lpw ood equ ivalen t of the net impor ts of paper , boar d , and w oodpu lp.
2 Inc ludes cooper age logs, po les, p i l ing ,fence posts, hew n t ies, r ound m i n e t im ber s, box _
bol ts, excel sior bol ts, chem ical w ood , sh ingle
bol ts, r oundw ood u sed in part icleboar d m anu factur e , and other m i scel l aneou s item s.
3Data show n ar e est im ates of fuelw ood har vested fr om gr ow ing stock sour ces on ly .
4 Includes imported logs n ot show n by pr oduct u se .
Note: Data m ay not add to total s because of r ound ing .
Sou r ces: U .S . Depar tm en t of Agr icu l tu r e , For est Ser vice . Der ived fr om data pub l ished by the U .S . Departm en t of Comm er ce , Bur eau of
the Cen sus; the Am er i can Paper In st itu te ; the Am er ican Pu lpw ood Assoc iat ion ; the Nat ion al For est Pr oducts Assoc iat ion ; the Am er ican
Plywood-
Assoc iat ion ; an d the Nat ion al Par t ic leboar d Assoc iat ion .
Pr oject ions: U .S . Depar tm en t of Agri cu l tu r e , For est Ser vice .
106

Figu r e— Roundwood consumption by pr oduct in the Un ited States, 1952—84 ,
w ith pr oject ions to 2030
hardwood m arkets) , har dwood r oundwood con sum ption r ose
m ost r ap id ly .
These trends ar e expected to con tinue , .w i th dem and for
both har dwoods and softwoods r ising thr ough m ost of thepr oject ion per iod . By 2030 , pr ojected dem and for soft
woods i s up 20 per cen t , to billion cubic feet ; however ,har dwood dem and ri ses 72 per cen t , to bil lion . In 2030 ,
abou t two - th irds of total dem and i s for softwoods and one
third har dwoods, com par ed to 74 and 26 per cen t , respec
tively , in 1984 .
T r ade in T im ber Pr odu cts
T he Un ited States is, at the same tim e , the wor ld ’
s lead ingimpor ter of tim ber pr oducts and a m ajor tim ber pr oductsexpor ter . T he total value of al l U .S. t im ber pr oducts 1mpor ts in 1984 was bill ion ; expor ts wer e wor thbill ion .
Pr ojected Im por ts— Am ong the var iou s pr oducts im por ted ,
softwood lum ber , near ly al l fr om Can ada , is m ost im portan t in term s of cubic vo lum e . Between 1952 and 1984 , soft
wood lumber im por ts r ose fr om b i llion to bill ionboar d feet ; however , a lar ge par t of th i s in cr ease has takenplace over the past decade . Pr ojection s show a fur ther r iseto billion boar d feet in 1990 . Cu r r en t per cept ion s ar e
107
Tr ends in impor ts and expor ts of the m ajor w ood pr oducts,lum ber , panel pr oducts, and pu lpwood in standard un its ofm easu r e ar e shown i n tables When these var iou spr oducts ar e conver ted to r ou ndwood equ ivalent , and ther oundwood equ ivalen t of pu lp , paper , and boar d is includedi t can be seen that U .S . im por ts and expor ts of t im berbased products ar e lar ge and have been incr easing over thepast th r ee decades. For exam p le , i n 1984 to ta l im por tsam oun ted to bill ion cubic feet , tr iple the vo lum e impor ted in 1952 . Over the sam e per iod , expor ts r ose abou t
tim es, to bill ion cubic feet .

Betw een the ear l y 1950’
s and 1984 , the
consumpt ion of saw logs in creased by m or ethan a quar ter , r ound pu lpwood use near ly
doubled , an d veneer log use near lyquadr upled . In the fu tu r e, dem and w il lcon t in ue to incr ease bu t at slower r ates.
that that level of pr oduction in Can ada pr obably cannot besustained . As a consequence , softwood lum ber impor ts havebeen pr ojected to dec line to abou t bill ion boar d feetby 2030 . Conver sely , har dwood lum ber im por ts ar e expectedto incr ease slow ly to billion boar d feet over the pr ojection per iod .
Im po r ts of str u c tu r al pan els of or ien ted str an d boar d o r
w aferboard ,al so fr om Can ada , incr eased r ap idly in the late
1970’
s as dem ands ou tstr ipped the sm all , bu t gr ow ing , dom est i c indu stry ’
s ability to p r odu ce them . Con t inued i ncr eases in im por ts ar e expected in the fu tu r e , bu t they ar e
l ikely to r ise m or e slow ly th an i n the past as the dom esticindu stry con t inuesto expand . Softwood plyw ood impor ts ar esm al l an d ar e n ot expected to r ise over the pr oject ionper iod .
Of the non str u ctu r al panel products, im por ts of hardwoodplywood ar e m ost im por tan t for dom est ic con sumpt ion .
Cur r en tly , abou t two - th i r ds of al l the h ar dwood p lywoodconsum ed in the Un ited States is impor ted , ch iefly fr om T ai
w an and Indon esia . Im po r ts fr om such sou r ces have r isenr apid ly over the past thr ee decades and ar e expected to con
tinue to go up , bu t m or e slow ly , in line w ith r ising dom estic dem ands. Im por ts of the other nonstr u ctu r al panelpr oducts
— in su latin g boar d , har dboar d , and par tic leboar dhave also incr eased since the ear ly 1980 ’
s bu t ar e expectedto con tinue at abou t cu r r en t levels thr ou gh 2030 .
108
For a long t im e, the Un ited States has beena net im por ter of m any t imber pr oducts.
T h is situ at ion is expected to con t inue , bu t
the Nat ion w i l l have to depend to an
incr easing degr ee on i ts dom est ic t im berr esou r ces.
Impor ts of pu lp pr oducts— pu lp , paper and boar d , and
pu lpwood— have appr oxim ately doubled over the past 30year s, r ising to the equ ivalen t of abou t bil lion cubicfeet of r oundwood . As dem ands con tinue to r ise over thenext 45 year s, such impor ts shou ld con tinue to incr ease .
In line w ith dom estic dem ands, how ever , the r ates of gr ow thar e expected to slow thr ough the pr ojection per iod .
Im po r ts of logs, both softwood and hardwood , ar e expectedto be negligible .
Expor ts of softwood plywood , thou gh show ing som e flu ctu ati on , have tr ended up since the ear ly 1970 ’
s and ar e ex
pected to con tin ue to r ise further as Eur opean m arkets growand other m arkets open up . Expor ts of or ien ted str and boardand w aferboar d have been , and ar e expected to r em a in ,
sm al l in the pr ojection per iod .
Pr ojected Expor ts— Like im por ts, softwood lum ber expor tshave in creased sin ce the ear ly 1950 ’
s. Most of the gr owthhas con sisted of sh ipm en ts to Japan , Sou th and Cen tr a lAm er ica , and Wester n Eu r ope , a tr ade that is expected tocon tinue and to in cr ease slow ly as popu lation and incom esin these coun tri es and regions r ise 1n the future . Har dwood
lum ber expor ts -have also gr ow n and shou ld r ise in the pr oject ion per iod .

T able — T im ber dem and , expor ts, im port s, and dem and on t im ber l and i n the Un ited S tates, by spec ies gr oup , spec ified year s 1952—84 ,
w ith project ions to 2030
Bi l l ion cubi c feet
2000
SoftwoodsT otal dem and
2
Expor ts3Impor tsDem and on U .S . t imber l and4
H ar dwoods
T otal dem and2
Expor ts3Impor tsDem and on U .S. t imber l and4
Al l spec iesT otal dem and
2
Expor ts3Impor tsDem and on U .S . t im ber land4
Data ar e est im ates of actual con sum pt ion and har vests.
2T otal dem and for pr oducts conver ted to a roundw ood equ ivalen t basis. T he project ion s include adjustmen ts for increased product y iel ds
per u n it of r oundwood inpu t that ar e expected to r esu l t from impr ovem en ts i n ut i l i zat ion .
3 Logs and those pr oducts m anu factur ed d irectly fr om r oundwood , inc lud ing pu lp and pu lp produ cts.
4T otal US . dem and plus expor ts m in u s impor ts.
5 Less than 50 m i l l ion cub ic feet .
Note : Data my not add to totals becau se of r ound ing.
Sour ces: Data for 1952—84 der ived fr om data pub l ished by the U .S. Depar tm en t of Comm er ce , Bu reau of the Cen sus; the Am eri can PaperInst itu te; the Am er i can Pu lpwood Assoc iat ion ; the Nat ional For est Products Assoc iat ion ; the Am eri can Plywood Assoc iation ; and the Nat ionalPar t icleboard Assoc iat ion .
Pr oject ions: U .S . Depar tm en t of Agr i cu l tu r e , For est Service .
1 10

Dem ands on U .S. t im ber lands are expectedto r ise fr om b il l ion cub ic feet in 1984to b il l ion in 2030 . Dem and goes up
for both softwoods and har dwoods;
however , in l ine w ith recen t tr ends, i t goesup m ore r ap idly for har dwoods.
and not r eser ved for other uses— ar e m ajor determ i nan ts ofchan ges i n tim ber supp l ies, net annu al gr ow th , inven tor yand other componen ts of the t im ber r esou r ce . Changes i nar ea by owner shi p , for est m anagem en t type, and site ar e alsoimpor tan t .
Past Chan ges i n T im ber l an d Ar ea— Although data forsom e States wher e for est su r veys had been com p leted wer eavai lable in the 1930 ’
s, ther e wer e no statistically accu r ateestim ates of ar ea of t imber lan d i n the Sou th pr ior to 1952 ,
the year when data fr om su r veys of al l Sou ther n S tateswere fir st compiled . T he gener al tr ends in tim ber land ar ea ,
however , ar e fai r ly c lear . Ori gin ally , near ly al l of the Sou thwas forested . As sett lem en t spr ead and incr easing ar eas wer e
c lear ed for cr ops, pastu r es, and a var iety of other u ses such
as c ities and r oads, ar ea in tim ber land dec l ined (Healy
In the depression year s of the 1930 ’
s and after Wor ld War
11 , add it iona l lar ge ar eas w en t ou t of u se for c r ops an d
pastu r e . Pr otection pr ogr am s, especial ly those aga in st fir e,
wer e also expand in g and becom in g m or e effec tive . Givenpr otect ion fr om fi r e an d an im als, exten si ve ar eas of i d lecr op land and pastu r e c am e back to tr ees, the n atu r al c lim ax
1 1 1
Th is dec l ine acceler ated i n the late 1800 ’
s,when lar ge
sawm ills m oved in to the Sou th and began har vestin g theo l d - growth for ests. By the ear ly 1920 ’
s, near ly al l the
o ld -grow th for ests had been cu t , and pr ogr am s to pr otectand r egener ate for ests wer e getting u nderway . Abou t thesam e tim e , an agr icu ltu r al r ecession and the effects of the
bo ll weevil on cotton , the r egion ’
s m ain cash cr op , led to
the abandonm en t of m u ch cr opland and pastu r e . Thesedevelopm en ts led to a r ever sal of the lon g dow nw ar d tr end :the ar ea of tim ber lan d began to incr ease .

Bi lliohadore feel
Tota l
Consumption
1 990 203 0
Consumption
1 9 50 1 960 201 0“
H a rvest
Consumption
Fi gu r e— Roundwood con sumpt ion and har vestsi n the
Un ited States, 1952—84 ,w ith pr oject ion s of dem and and
suppl ies to 2030vegetation on near ly al l of the land i n the Sou th . Much of
i t cam e back to pine , the p ion eer tr ee spec ies (fir st to becom e established) on the Coastal Plain and P iedm on t .
By 1952 , som e 193 m illion acr es, or n ear ly thr ee- fifths of
the land ar ea i n the Sou th ,w er e c lassified as t im ber lan d
(tabl e Ther e w er e fu r ther in cr eases i n the fo llow in gyear s to a total of 197 m i l lion acr es i n 1962 . Althou gh the1962 figur e w as undoubtedly far less than the or igin al ar eaof tim ber land , i t pr obably r epr esen ted the hi ghest acr eage infor ests in the 20th cen tury . Som etim e in the ear ly 1960 ’
s,
the ar ea of tim ber land began to dec line ,and th is decl ine has
1 12
Much of the Sou th ’
s second and thi r d
for ests r egener ated n atur al ly on cu tover lan dan d idle cr opland and pastu r e . Much of i t
cam e back to p in e ,the p ioneer tr ee spec ies,
the fir st to becom e estab l ished when seed
sou r ces ar e pr esen t .
con tinued . As of January 1 , 1985 , the total ar ea of tim berland in the Sou th i s est im ated at ju st over 182 m i l l ion acr es.
Appr oxim ately 85 m i l l ion acr es of the t im ber lan d i n theSou th ar e in the States i n the Sou theast— Flori da , Geor gia ,
Nor th Car o l in a ,Sou th Car o l in a , and V i r gin ia— and 97 m i l
lion acr es ar e in the Sou th Cen tr al r egion— Alabam a ,
Ar kansas, Lou isian a ,Mississippi , Oklahom a , Tennessee , and
Texas. Gener al ly , tr ends since 1952 have been sim i lar i nboth the r egion s and in the States; bu t m or e of the dec l ine7 m i ll ion ou t of 1 1 m i ll ion acr es, w as i n the Sou th Cen
tr al r egion (B ir dsey and Mcw i ll iam s By State , the
biggest losses i n tim ber land occu r r ed i n Flor ida , wher e r el
atively lar ge incr eases i n popu lat ion have taken p lace , and
in Ar kansas and Lou isian a , wher e lar ge ar eas
'
of for est in
r iver bottom land h ave been d iver ted to cr opland and other
u ses.
One m ajor cau se of the dr op in ar ea has been the conversion of t im ber land to cr opland and pastu r e . Cleari ng for soybean s i n the delta ar eas of the Sou th Cen tr al r egion hasbeen par t icu lar ly im por tan t and has h ad substan tial im pactson the bottom l and har dwood r esour ce . Other m ajor factor sin c lu de the con t in u in g in cr ease in u rban ar eas and other r e
lated u ses. T he per iod ic for est su r veys ind icate that_
ur banand bu ilt - up u ses i n the Sou th have expanded by 20 ~m i ll ion acr es sin ce 1952 . In terr egion al popu lation sh ifts andm igr ation of indu str y to the Su n Belt States have con tri bu ted to th is incr ease . In r ecen t decades, in par ticu lar , theSou th has experi en ced r elatively h igh gr ow th r ates in popu lation and per son al in com e .

forest m anagemen t type
850
23 ,03 3
Data for 1952 and 1962 ar e as of Decem ber 3 1 . Data for 1970 , 1977 , 1985 , and the project ion year s ar e as of Januar y 1 .
2 Inc ludes tim ber land leased or under m anagem en t con tracts to for est industry from other owner s for per iods of one for est rotation or longer .
T im ber land under cu tt ing con tr acts i s no t inc luded .
3Data for these other pr ivate ow ner sh ips ar e not available for the year s 1952 , 1962 , and 1970 .
Note: Data m ay not add to totals because of round ing .
P r ojected Chan ges i n T im ber lan d Ar ea— Many of the
for ces that have caused the r ecen t chan ges in ar ea of timberland w ill sur ely con tinue to influence chan ges in the fu tur e .
Thu s, in m ak ing pr ojections of ar ea changes, i t has been as
sum ed that determ in an ts such as popu lat ion , incom e , agr icu ltu r al pr odu ct iv ity , agr icu ltu r e expor ts, an d pr ices ofagr icu ltu r al cr ops and tim ber pr oducts wou ld con tinue toinfluence land - use ch an ges (Alig
T he pr ojec t ion s of t im ber lan d ar ea ch an ge for the Sou thwer e der ived fr om a r egional econom etr ic an alysis _
of h is
to r i cal r elat ion sh ips am ongm ajor land u ses and key var iables discu ssed above (Alig Ar ea pr oject ion s byState wer e developed by u sing State- spec ific values for thein dependen t var iable(s) i n the r egiona l land - u se equat ions.
Land ar eas for al l m ajor u ses w er e projected sim u ltaneously ,
w ith con str ain ts imposed to assur e that the sum of al l u ses
equ aled total land ar ea .
For each of the key var iables, assum pt ion s abou t fu tu r etr ends wer e m ade . T he assum ption s on popu lation and in
com e ar e shown in table in the pr eced ing section on ba
si c assumptions. Assum ptions per tain in g to the fu tur e r ateof change in agr icu ltu r al pr oductivity and associated land incom es wer e der ived fr om the So il Con ser vation Ser vice ’
s
Model ing ar ea changes in tim ber land for th is study pr oceeded in two stages. In the fir st stage , area changes forpr ivate for est owner sh ips wer e pr ojected as par t of the si
m u l taneou s pr ojection of al l land uses. Pr ojections of publ ic forest ar ea wer e external to the model and w ere based onthe exper t opin ions of For est Ser vice per sonnel invo lved inthe m anagem en t and acqu isition of public landsin the Sou th .
In the second stage of the ar ea m odel ing , ar ea changes wer epr ojected for for est m an agem en t types by owner sh ip . Area
changes for fo r est m an agem en t types r eflect influences ofboth n atu r al succession al for ces and land m anagem en t activi ties or d istu r ban ces (Alig and Wyan t Pr ojectionsof area changes by m anagem en t types ar e also impor tantbecau se they r eflect d iffer ences i n m anagem en t pr act ices
an alysis 1980 Appr aisal : So i l , Water and Related Resou r ces in the Un ited States (USDA Soil Conser vation Service Cr op yields w er e assum ed to incr ease byper cen t annu ally up to 2000 and then slow down som ewhat .
Real product pr ices for agr icu ltu r al pr oducts ar e assum ed tor em ain essen tially con stan t over the projection per iod . T im
ber pr odu ct pr ices r ise i n l ine w ith the base pr ojections inth is study . It was also assum ed that ther e wou ld be slowincreases i n the expor t of agr icu ltur al pr oducts.

among owner sh ips and am ong States. They dir ectly r eflecttr ee plan ting , one of the ch ief ind icator s of m anagem en tintensity .
Are'a change pr ojections by forest m an agem en t type wer e
based on assumptions abou t the probability that a par ticu laracr e w i ll receive a cer tain type of m anagem en t (inc lud ingthe probability of no active m an agem en t) and the assoc iated probabilities that an acr e so m anaged w i ll r em ain inthe sam e forest type or w ill m ake the tr ansition to other for
est types.
Pr elim inary projections of tim ber land area der ived fr om the
econom etr ic system and the assum pt ions descr ibed abovewere reviewed by the State For ester s and m em ber s of theState study gr oups established in each S tate to pr ovideassistance in th is study (see Acknow ledgm en ts) . T heeconom etr ic system and the pr ojections wer e also r eviewedby techn ical exper ts fr om the For est Ser vice , for est
industr ies, and forestr y schoo ls.
Thus, the projections of chan ges in ar ea shown in table 3 10ar e the pr oduct of the analytical system and assum ptionsm odified by the judgm en t of exper ts from the m ajor forestr y in ter ests in the Sou th and in each State . T he r esu lting projection s (table and app . tables show
a slow dec lin ing tr end . Total tim ber land ar ea , for example ,
drops fr om abou t 182 m il l ion acr es in 1985 to 174 m ill ionacres in 2030 . T he Sou th Cen tr al r egion and Southeast ar e
both pr ojected to sustain a 4- m ill ion - acr e r edu ction in forest ar ea (app . tables and
T he pr oject ions also show a downwar d tr end in alm ost al lStates (figs. and app . tables In som e
States such as Flor ida , Geor gia , and Arkan sas, wher e substan tial r elat ive incr eases in popu lation and econom ic activi ty ar e expected , the dr op in tim ber land acr eage is fair lylar ge . In m ost of the other States, pr ojected chan ges ar esm al l . In som e States, the ar ea of tim ber land is pr ojectedto ri se or essen tial ly r em ain constan t in the latter part of theprojection per iod .
The pr ojected net ar ea changes lar gely r eflect the dir ect conver sion of tim ber land to urban and developed uses, and otheracres conver ted to r eplace cr opland lost to u r ban and developed u ses. T he ar ea of cr op land i s pr ojected to r em ainessen t ial ly con stan t , wh i le ur ban an d r elated uses go up
fr om 5 1 m illion to 64 m i ll ion acr es. T he pastu r e and r angearea , on the other hand , is pr ojected to drop by abou t 7 m i llion acr es, a r esponse in par t to a con tinu in g dec line in percapita domestic consum ption of r ed m eat , wh ich affects livestock pr ices.
T ab le — T im ber land w ith h igh or m ed ium poten t ial forconver sion to cropland
Ii n the South , by State and reg ion , 1982
Thousa nd a c r es
Conver sion poten tialto cr opland
Med ium
Source: U .S. Depart m en t of Agri cu l ture , So il Conservation Ser vice,Nat ional Resou r ces Inven tory , 1982 .
1 15
T otal Sou thT he poten t ial for conver sion to cr opl and w as determ ined by a
m u l t iagency gr oup i n each cou n ty as par t of the Nat ion al Resour ces Inven tory pr ocess. T he gr oup consider ed the type of
act ion necessary for conver sion , comm od ity pr ices, costs of
developm en t and product ion , and other cond it ions affect ingconver sion to cr opland as of 1980 . Land was judged to have a
h igh , m ed ium , low , or zer o poten tial for conver sion to cropl and
over the next 10 to 15 year s'
based on these factor s and conver sionr ates for sim i lar tr acts of land in the past .
Uncer tain ty is always assoc iated w ith pr ojection s of landuse, and at the pr esen t t im e the ou tlook for cr opland needsseem s especial ly uncer tain . For example , abou t 2 3 m ill ionacres of timber land in the Sou th have h igh or m ed ium po
tential for conversion to cropland (table Al though th island i s concen tr ated to som e exten t i n the S tates w ithcoastal plains, ther e ar e substan tial acr eages in al l States. If
agri cu ltu r al expor t dem ands incr ease m or e than cu r r en tlyexpected , or i f c r op yields in cr ease at slow er r ates thanassum ed , al l or a su bstan t i al par t of th is ar ea cou ld bec lear ed and u sed for cr ops.

Flor ida
1 952 1 962 1 970 1 97 7 1 985 1 990 2000 2 01 0 2 02 0 203 0
Million acres Million acres
Geo rg i a No rth Ca ro l ina
1 952 1 952 1 970 1 9 77 1985 1 990 2 000 2 0 1 0 2 020 203 0 1 952'
1 9 62 1 970 1 977 1 985“
1 990 2000 201 0 2 020 2030
Million acres Million ac res
South Caro l ina
1 952 1 9 62 1 970 1 97 7 1 985 1 990 2000.
20 1 0 202 0 2 030 1 952 1 962 1 9 70 1 97 7 1 985 1 990 2 000 20 1 0 2020 3 2 03 0
Fi gu r e Tim ber land ar ea in the Sou theast r egion by S tate , 1952—85 , w ith pr oject ion s to 2030

Par t of the uncer ta in ty assoc iated w ith the projections of landuse include the implem entation of pr ovisions of the FoodSecur ity Act of 1985 (Farm B il l) . Thr ee m ajor provisions ofthe Farm B ill m ay sign ifican tly im pact for est ar ea in theSou th : ( 1 ) the Conser vation Reser ve Pr ogr am , (2 ) swam pbuster and sodbu ster pr ovision s, and (3 ) the conser vat ioncomp liance pr ovision (Mou lton and D icks
Abou t 8 m i l lion acres of h igh ly er od ible land in the Sou thar e su itable for forestation (table Most Sou ther n Stateshave substan tial acr eages of th is land and , u nder the Con
ser vation Reser ve Pr ogr am of the 1985 Farm B i ll , i t is assum ed that abou t 3 m i llion acr es wou ld be plan ted to treesby 1990 . Ther e i s a total of 22 m i l l ion acr es of m ar ginalcropland and pastur e in the Sou th , includ in g the h ighl y er odible land , that wou ld yield hi gher r ates of r etur n to the owner s in pine plan tations (table Th is land , d istr ibu tedin fair ly lar ge acreages thr ough m ost Sou thern States,wou ldbe another logical sour ce of land for Conser vation Reser vePr ogr ams or for pr ogr am s to incr ease tim ber suppl ies.
Impacts of the buster and compl ian ce pr ovisions are m oredifficu lt to pr oject becau se of possible changes in govem
T ab le 3 . 12r —A rea of h ighly erod ible cr opland l su itab le for tr eeplant ing in the Sou th , by r eg ion and S tate
Thousa nd acr es
Ar ea su itablefor tree plan t ing
T otal Sou thCropland c lassified by the U .S. Depar tmen t of Agr icu ltur e , So ilConservat ion Service in land capab i l ity c lasses 3e, 4e , 6e , and 7e
and also su itable for plan t ing to tr ees.
1 18
T ab le — Ar ea of cr opland and pastu r e i n the Sou th ,inc lud in g
h ighly erod ible cr opl and , that wou l d y iel d h igher r ates of r etu r n in
p in e plan tat ionsThousand acr es
Ar ea su itable fortr ee plan tin g
T otal Sou th
m en t comm od ity subsidy an d loan pr ogr am s that wou ld al
ter the attr act iveness of con ver tin g er od ible land to cr op
use .
Next to the Conser vation Reser ve Pr ogr am , the conser vation compliance pr ovision cou ld have the lar gest im pact ontimber land ar ea in the Sou th . Existing cr op land iden tified as
h igh ly er odible w il l be subject to conser vation com pliance ,
som e of wh ich w il l be tr eated under the Conser vat ion Reser ve Pr ogr am . If farm er s do not comply , they cou ld losegover nm en t subsid ies on al l acr es. T he Sou th has between2 m i l lion and 4 m i l l ion acr es of cr opland in th is category ,
al l of w h ich conceivably cou ld be sh ifted to for est . T he
m axim um add ition to t im ber land under th is Farm B il l pr ovision wou ld am oun t to appr oxim ately 2 per cen t of the ex
i sti ng tim ber land in the Sou th .
There is no w ay of know ing how the tim ber land w ith poten ti al for use as cr opland or pastu r e or the m ar ginal cr opland and
_ pastur e su itable for pine p lan tations w i ll be u sedin the fu tu r e . Ther e cou ld be either a substan tial fu r ther r eduction in tim ber land ar ea or a substant ial in cr ease . In the
follow ing chapter , two al ter native fu tur es ar e sim u lated thatshow the effects of conver ting all the tim ber land w ith h igho r m ed ium poten t ial for con ver sion t o cr op land , and of

lanting to tr ees al l of the cr opland and pastu r e that wou ldield h igher r ates of r etur n in pine p lan tation s. As descr ibedn that chapter , either of these alter n atives wou ld have m aor impacts on the tim ber r esou r ce si tu ation i n the Sou th .
r ojected Ch an ges by Own er sh ip— Pr ivate owner s havecontro lled m ost of the sou ther n timber land base for sever alcentu r ies. T he land - use and m an agem en t dec ision s of theseowner s have had a gr eat impact on the sou thern t im bersituation .
Cur r en tly , approxim ately 90 per cen t of the Sou th ’
s t im berland is'
pri vatel y owned . Th is per cen tagehas changed l i ttle since the fir st su r veys of the Sou th ’
s for est r esou r ces.
Ar ea changes am ong the m ajor groups of ow ner s— for estindu stry and o ther pr ivate owner sh ips (wh ich inc ludesfarm er , corpor ate , and other ind ividu al owner sh ips)— havebeen substan tial (table fig . app . tables
Ar ound 2 1 m i ll ion acr es,-
or 15 percen t of the
ar ea i n other pr ivate own er sh ip , has‘ been con ver ted to
other uses or tr ansfer r ed to other owner s since 1952 . Mostof th is ar ea r educt ion h as occu r r ed on farm er owner sh ips.
Farmer ow ner sh ip of tim ber land has dec l ined for sever alreasons. Many owner s of tim ber land who wer e farm oper a
tor s so ld or passed on their land ho ld in gs to new owner s
who did not secu r e their pr im ar y sou r ce of incom e fr omfarm ing . In add ition , m any farm er s incr easingly secu r ed theirlivel ihood off farm s and wer e subsequ en tly c lassified as
“
other ind ividual” pr ivate owner s, i .e . , al l owner s of pr i
vately held tim ber land except forest indu stri es, farm er s, and
corpor ations. Con ver sion to other u ses has also r edu ced
farm for est ar ea .
The timber land ar ea in farmer owner sh ip is pr ojected to decline 13 m i ll ion acr es by 2030 . T he pr ojected add ition of
appr oxim ately 3 m i llion acr es of plan ted pine under theCon ser vat ion Reser ve Pr ogr am , par t icu lar ly i n Geor gia ,
Mississipp i , Alabam a , and Sou th Car o l ina , i s not near lyenough to stem or r ever se the over al l pr ojected dec line i nfarm forest ar ea . T he pr ojected r eductions r esu lt i n par tfrom the con t inu ing over al l dr op i n the num ber of farm s,
caused by an econom ic Shakedown in the farm econom y .
Th is tr end is consisten t acr oss the Sou th and in line w ith h istori cal tr ends.
Other ind ividua l and corpor ate pr ivate own er s have ao
qu ired m any of the tim ber land acr es onceowned by farm er s.
Corpor ate owner s inc lude insur ance compan ies, banks, andother institu tional owner s; bu t to be c lassified as such , theycannot own faci lities that pr ocess tim ber .
Corpor ate owner sh ip is pr ojected to incr ease in size by ap
pr oxim ately 6 m il lion acr es, or by 38 per cen t of i ts cur
r ent size . Par t of the land i s expected to be acqu ired thr oughinvestm en t i n sou ther n p ine tim ber land . As a r esu lt , pineplantation ar ea in co rpor ate ow ner sh ip w il l m or e than tr ipleby 2030 .
Individual owner s, the r em ain ing componen t of the otherpr ivate owner sh ip group , ar e the lar gest owner sh ip c lass.
Th is diver se set of owner s ho lds over one- th ir d of the sou th
er n t im ber land base , equal to 66 m il lion acr es— fou r tim esas m uch as corpor ate ow ner s.
Un l ike the corpor ate c lass, ind ividuals in the other pr ivateowner gr oup ar e pr ojected to r educe their ho ld ings of timber land in the fu tur e . T he pr ojected r eduction i s appr oxim ately 4 m i l l ion acr es; or 6 per cen t of the ar ea i n th isowner sh ip , by 2030 .
For est indu stry has stead i ly acqu ir ed t im ber land in theSou th since 1952 . In 1985 , indu stry owned or had under
long- term lease 42 m ill ion acr es of timber land in the Sou th ,
9 m ill ion acres m or e than in 1952 . Most of indu str y ’
s ao
qu ir ed acres have been in the Sou th Cen tr al r egion , bu t the
trend is upwar d across al l the Sou ther n States.
Timber land acr eage i n the for est indu stry category i n th isstudy inc ludes land under lon g - term lease fr om other pr i
vate owner s. Leased acr eage is in c luded w i th indu stry ’
s acr e
age becau se leased lands ar e gener al ly m anaged sim i lar lyin ten sive for est m an agem en t pr ac t ices ar e appl ied ) .
1 19
Data that al low separ ate iden tification of corpor ate and
other ind ividual owner sh ips ar e avai lable since 1977 on ly .
Corpor ate pr ivate owner s now ho ld 16 m i ll ion acr es of
tim ber land in the Sou th and have added appr oxim ately 2m ill ion acr es of th is total since 1977 . Th is acqu isitionwas spr ead acr oss al l five for est m an agem en t types— p ineplan tation s, n atu r al p ine , m ixed p ine—har dwoods, up landhardwoods, and bottom land har dwoods— bu t the lar gest incr eases (28 per cen t) wer e i n p ine p lan tat ion s and uplandhardwoods.
It is u ncer tain how these corpor ate lands w i ll be :m anagedin the fu tu r e . It r em a ins to be seen whether som e corpor ate
owner s w i ll d ivest them selves of tim ber land after har vesting the cu r r en t rotation ’
s cr op , or i f they w i ll investi n pr act ices i n l ine w ith lon gr u n m an agem en t of thesetimber lands. In th is study , i t has been assum ed that these
lands w i ll be m anaged m or e in tensively than land in other
pr ivate owner sh ips.

Million acres Million acresAl l ownersh ips
"
Fo rest ind ust ry
1 952 1 962 1 970 1 9 7 7 1 985 1 990 2 000 20 1 0 2020 1985 1 990 2 000 20 1 0 2 020
*Inc ludes public ownersh ip
Farme r
Mi llion acres1 9 7 7 1 985 1 990 2000 20 1 0 2020 2030
Other p r ivate
Corporate
1 985 1 9 90 2000 2 0 1 0
1 952 1 962 1 970 1 977 1 9 85 1 990 2 000 2 0 1 0 202 0 203 0
Other lnd lwdua l
1 977 1 985 1 990 2 000 2 0 1 0 2020 2 03 0
Figu r e— Timber land ar ea in the Sou th by for est owner sh ip , 1952—85 , w ith pr ojections to 2030
120

Million acres Million acresmanagemen t types
1 952 1 962 1 97 0 2000 20 1 0 2 020 1 952 1 952 1 9 77“
1 985 1 990 2 000 201 0 2020 2 030
Mi llion acres Millions acresNatu ra l p l ne Mixed p lnk ha rdwoods
1 952 1 962 1 9 70 1 977 1 93 5 1 990 2 000 201 0 1 952 1 962 1 9 70 1 977 1 985 1 990 . 20 20 203 0
acres Million acresUp land ha rdwoods Bottom land hardwoods
1 970 1 977 1 985 1 990 2 000 2 0 1 0 2 020 203 0 1 952 1 962 1 9 70 1 9 77 1 985 1 990 2 000 20 1 0
.
202 0 203 0
Figu r e— Timber land ar ea in the Sou th by for est m an agem en t type , 1952—85 ,
w ith pr ojec tion s to 2030
122

Reforestation activities after c lear - cu t har vestof natur al pine stands on other pr ivate tim ber lands
in the Sou th , 197 1—81
(based on inform ation fr om Fecso and other s 1982 )
Refor esta tion a ctivi ty P er cen t of to ta l
a cr es c lea r cu t
ar t of,
the land go ing ou t of cr op and pastu r e u se i n the
1950’
s and ear ly 1960 ’
s cam e back n atu r al ly to m ixedpine—hardwoods and hardwoods. Conver sely , part of the de
cline in the ar ea of m ixed pine—har dwood since_
1970
r eflects conver sion to cr opland and pastur e . Par t of i t alsoreflects conver sion , m ostly after har vest of m ixed pinehardwood stands, to p ine plan tations.
T he ar ea of bottom l and har dwoods dr opped r apidly in the1960
’
s; lar gely becau se of c lear ing the land for soybean s.
S ince 1970 , the acr eage i n th is type has con tinued a slowdecl ine . T he reduction in bottom land har dwoods has beenconcen tr ated in those States in the Mississipp i River basinhaving lar ge ar eas of bottom l ands.
T he chan ges i n the o ther m an agem en t types descr ibedabove have taken p lace al l acr oss the South . Changes i neach State gener ally r esem ble the Sou thw ide changes.
T he d istr ibu tion of tim ber land by m anagem en t type is notun iform acr oss the Sou th . In gener al , p ine and m ixed pinehardwood types m ake up the h ighest propor tion of tim berland in the Coastal Plain , P iedm ont , and Ou ach ita Moun
tains (figs. and Hardwood types ar e m ost
common in coastal low land ar eas, the Mississippi RiverDelta , the centr al up land regions, and the sou ther n
Appalach ian Moun tains (figs. and
The projected changes in the ar ea of the for est m an agem en ttypes ar e consistent w ith r ecen t h istor ical trends. T he lar gest area chan ges ar e pr ojected for the pine types. T he area
in pine plan tations is pr ojected to go up by appr oxim ately27 m illion acr es, m or e than doubling by 2030 . In con tr ast ,
natur al“ pine ar ea i s pr ojected to dr op by 18 m ill ion acr es,
or near ly half . T he net chan ge i n sou ther n p ine ar ea i s anincr ease of appr oxim ately 9 m ill ion acr es by 2030 .
T he pr ojected doubling of plan ted p ine ar ea is lar gely du eto the add ition of pine plan tations on for est industry lands.
T ab le — Area of t imber land w ith evidence of ar t if ic ial r egener at ion in the Sou th , by S tate and for est m anagem en t type
l
Thousand a cr es
Oak—p ine H ardwood
T otal Sou thBased on the m ost r ecen t su r veys on for est r esou r ces i n each
State .
123
With m anagem en t in tensification on these indu str ial lands,many har vested n atu r al p ine stands ar e bein g ar t ific ial lyr egener ated . Th is conver sion to p lan ted p ine allows genetically impr oved stock to .be in tr oduced on m any acr es and
tr ees to be spaced i n a m an n er that r edu ces the cost of
subsequen t industri al oper ation s. Som e of th is incr ease inpine plan tation ar ea w il l r esu lt fr om the tr ansition of you ngstands curr en tly c lassified as oak—pine and har dwood types,
bu t wh ich have evidence of ar t ific ial r egener ation , to the
planted pine type (table
T he pr ojected dr op in natu r al p ine ar ea i s also due to an
assum ed con tinu ation of trends in substan t ial har dwood encroachm en t after har vest of pine stands on the lands inother pr ivate owner sh ips. T he other pr ivate owner sh ips contain the bu lk of the natu r al pine ar ea , and the pr ojection sassum e that cu r r en t tr ends in r efor estation (Fecso and oth
er s 1982 , Royer 1985) w i ll lar gely cont inue , i .e . , these own
er s often do not invest in r efor estation . Royer su ggested thatthe r efor estation dec ision s of su ch ow ner s ar e gover nedlargely by public pr ogr am s of financ i al an d techn icalassistance .


Som e of the pr ojected incr ease in plan tation p ine ar ea is fromthe plan tin g of p ine after m ixed pine—har dwood stands ar e
har vested . T he ar ea i n m i xed pine—har dwood is pr ojected todr op by 6 m i l lion acr es, or
'
22 per cen t , over the pr ojectionper iod . Mu ch of th is r edu ct ion occu r s on for est indu str ylan ds.
T he total har dwood ar ea in the Sou th is pr ojected to decr ease by appr oxim ately 12 m i ll ion acr es, or 13 per cent , by
2030 . Mu ch of th is r edu ct ion i s i n the up land har dwoodtype , wh ich cu rr en t ly occup ies over one- thi r d of the sou th
er n tim ber land base .
T he pr ojected dr op in upland har dwood ar ea r esu lts fromsever al factor s. Fi r st , som e of the up land har dwood ar ea is
expected to be conver ted to plan ted pine , especial ly on in
du str y lands. Second , som e of the t im ber land on farm s that
i s conver ted to cr opland is cu r r en tly in upland har dwoods.
T he last major r eason i s conver sion of up land har dw ood “
acr eage to other lan d uses such as ur ban and bu ilt - up uses.
Bottorr rl and har dw ood ar ea i s also pr ojected to decr ease , by4 m i ll ion acres. However , the r ate of cleari ng of bottom landh ar dwood for est fo r cr op land i s expected to slow dow n .
Som e bottom land har dw ood ar ea i s pr ojected to be w ithdr awn fr om the tim ber land base in States such as Lou isian a for m anagem en t by S tate agen c ies to pr otect w i ld lifehabitat and other n onm ar ket r esou r ces.
T he pr ojected changes by State ar e i n gener al con sisten tw ith the Sou thw ide changes.
P r ojected Ch an ges by Si te C lass— S ite , a m easu r e of the
inh er en t capac ity of land to gr ow tr ees, is on e of the im
por tan t determ in an ts of ch an ges i n the t im ber r esou r ce .
However , an alysis of data fir st assem bled ar oun d the m i d
1960’
s ind icates ther e have been no m ajor net chan ges in ther egional d istri bu tion of t im ber land by site c lass. T he lasttwo sur veys in the Southeast indicate that over all ther e havebeen on ly r elatively m inor sh ifts in the site- c lass d i stri bution s tow ar d the h igher c lasses.
Net changes in the d istri bu t ion of site classes by forest typehave also been r elatively sm al l except for the bottom landhar dwood c lass. A lar ge dr op in the bottom land h ar dwoodar ea i n the upper site- class was due lar gely to the con version of such h igh - qu al ity t im ber land to cr opland , in c lud ingm any acr es of soybeans in bottom lan ds.
Based on the anal ysis of hi stor ical site data , i t w as assum ed
in th is study that the d istri bu t ion of tim ber land am on g thesite classes wou ld not chan ge sign ifican tly over the pr ojec
128
tion per iod . How ever , the con ver sion of m any for est acr es
to p ine plan tat ion s im plies a sh ift tow ar d h igher site lan d .
Th is r eflects the upgr ading of substan tial acr eages of l owpr odu ctivity land i n the Coastal Plain that ar e being dr ained ,
site pr epar ed , bedded , and plan ted to pine .
Assum p t ion s on Tim ber Yi elds
T he above pr oject ions of ar ea chan ge pr ovide par t of thedata needed for pr ojectin g ch an ges i n net annu al t im bergr ow th and inven tor ies.
Com pilation of the aver age vo lum es per acr e by 5 -
year age
c lasses w as possible i n the Sou theast becau se for est sur veycr ew s ther e r ecor d th e actu al age of each t im ber stan dsam p led . Even - aged stan ds ar e assum ed , and no m ixed - agedclassification s ar e perm itted . In th e com p ilations, the age
c lass r epr esen ts the m i dpo in t of the class. For examp le , the
15 -
year age class inc ludes stands 13 to 17 year s old .
These empir i cal yields wer e subjected to w idespr ead techn ical review by r epr esentatives of the States, for est
S in ce volum e and gr ow th estim ates ar e der ived fr om acr e
age m ovem en ts thr ough assum ed yield tables, assum ptionson timber yields ar e also cr u c ial in using the Tim ber Resou r ce In ven tory Model to pr oject tim ber r esour ce changes.
Em p ir ical y ields developed for m ajor for est types i n theSou theast from for est su r vey data pr ovided m easu r es of thepr oven per form ance of fu lly stocked stan ds i n the r egion(McClur e and Kn ight Assum ptions on yields wer eder ived fr om data co llected on som e for est su r veyplots established r an dom ly thr oughou t the Sou theast . Thesedata wer e scr eened to iden tify those plots in fu lly stocked
stands based on for est su r vey standar ds. T he p lots in fu llystocked stands w er e fu r ther d ivided in to thr ee br oad siteclasses w ith in each of the five br oad m anagem en t types.
Aver age vo lum es per acr e w er e calcu lated for the fu l lystocked stands by 5
-
year age c lasses.
In the Sou th Cen tr al r egion , for est su r vey cr ew s r ecor d
l o-
year age c lasses and r ecogn ize m ixed - aged stands. The
em p ir i cal yields developed by 5 -
year age c lasses i n theSou theast were
_
used to help r efine the br oader age c lassesin the Sou th Cen tr a l r egion and enab led "
the developm en tof consisten t basic r esour ce u n its for the Tim ber Resour ceIn ven tory Model inpu t for the en t ir e r egion . For est sur veydata i n the Sou th Cen tr al r egion gen er al ly suppor ted the
em p ir ical yields developed in the Sou theast , w ith theexception of yields i n the up land har dwood m an agem en t
type . Yields for thi s type wer e r educed by 15 per cen t forthe Sou th Cen tr al r egion .

in tensity (level In these tables, hi gh sites inc lude thoseacr es capable of grow in g 85 or m or e cubic feet of wood peracr e per year ,
based on fu lly stocked , natur al stands.
Medium sites ar e capable of gr ow in g 50 to 84 cubic feet peryear ; poor sites, 20 to 49 cubic feet .
Oth er Assum p t ion s
Other key assum pt ion s affect in g the pr oject ion r esu ltsin c lu de ( 1 ) en r o l lm en t r ates in to theh i gher m an agem en t
in tensiti es, (2 ) m in im um har vest ages and the allocation - of
har vest am on g age classes, an d (3 ) the am ou n t and t im i ngof th inn ings. Althou gh r ecen t For est Su r vey find ingspr ovided som e usefu l in form at ion i n the deve lopm en t of
these assum pt ion s ,they w er e pr im ar i ly based upon the
con sen su s of techn i cal r ev iew groups com posed of m ember sfr om S tate for estry agen c ies, for est “ in du str ies, for estryschools, and other consu ltan ts. As one wou ld expect , exper top in ion s on these assum pt ion s avar i ed con sider ably , and
lim i tat ion s w ith in the pr ojection m odels r estri cted the r an geof opt ions. For exam p le , the Tim ber Resou r ce Inven to ryModel w il l accomm odate a m axim um of five m an agem en tin ten sit ies.
En r ol lm en t Rates— For pine p lan tat ions, up to five levelsof m an agem en t in ten sity w er e r ecogn ized : ( 1 ) r egu larplan t in g stock w ithou t th in n ing , (2 ) r egu lar p lan t in g stockw ith th in n in g , (3 ) gen et ica l ly im pr oved p lan t in g stock
w ithou t th inn in g , (4) gen eticall y im pr oved p lan t in g stockw ith th inni n g ,
and (5) genet ical ly im pr oved p lan t in g stockw ithou t thinn i ng bu t w ith the m ost in ten sive site-
pr epar at ionand m an agem en t pr act ices.
Althou gh the pr opor tion s var i ed by ow ner shi p , appr oxi
m ately 15 per cen t of the p ine plan tation s alr eady establishedas of the dates of the base data wer e assum ed to have beenestablished w ith gen et ical ly im pr oved p lan t in g stock an d
w er e en ter ed in m an agem en t in ten sit ies 3 and 4 . In it ially ,
no acr es w er e placed inm anagem en t in ten sity 5 . Rates of
comm er c ial thi nn in g determ in ed fr om the m ost r ecen t for est
su r veys wereu sed to est im ate the num ber of acr es in m an
agem en t in ten sit ies 2 and 4 .
In the f i r st 5 -
year pr oject ion per iod ,1 980—85 , 7 0 to 7 5
per cen t of al l new p ine p lan tat ion s w er e assum ed to be
p lan ted w ith gen et ical ly im pr oved stock . These per cen tswer e in cr eased u n t il 1995 ,
at whi ch t im e i t w as assum edall n ew pine plan tat ion s w ou ld be established w ith genet i cal l y im pr oved stock . In the fir st pr ojec t ion per iod , 20
per cen t of the n ew p ine p lan tat ion s established on for est
in du str y land w er e enr oll ed in m an agem en t in tensity 5 . Th isper cen t w as in cr eased each per iod u n t i l 1 995 . Beyond
1 30
1995 , 50 per cen t of all n ew p ine p lan tation s establ ished onin du str y land w er e enr o l led i n m an agem en t in ten sity 5 .
S l ightly low er levels of m an agem en t in ten sity w er e assum ed
on the other corpor ate land . On the farm er and other
in d ividu al pr ivate ow ner sh ips, onl y 5 per cen t of the plan tation acr eage w as enr o lled in m an agem en t in ten sity 5 .
Except for n atu r a l p ine stands on m ed ium and h igh sites,onl y one l evel of m an agem ent in ten sity w as assum ed forn atur al stands. For n atu r al p in e stands on m edium and h ighsites, a second m an agem en t in ten sity w ith th in n ing w asassum ed . Rates of comm er cial thi nn in g , by owner sh ip class,wer e developed fr om the m ost r ecen t for est sur vey dataavai lable .
T h inn i ng i s a w idel y u sed m an agem en t
pr actice . It is design ed to in cr ease the valueof the tim ber at fin al harvest and does notsign ifican tl y change yiel ds in term s of
volum e of tim ber gr owth .
Al locat i on of H a r vest— T he Tim ber Resou r ce In ven toryModel offer s the u ser sever al con tr o ls over the al locat ionof h ar vest . One of these con tr o ls i s the spec ification of a
m in im um har vest age for each gr ouped r esour ce un it (ow nertype
- site com bin ation ) . Vo lum e on acr es suppor ting tim berstands you nger th an th is m in im um h ar vest age can n ot
con tr ibu te to m eet in g the t im ber dem an ds th r ough fin alhar vest . Another con tr o l is the selection between twohar vest option s: 1) har vest o ldest stands fir st , or (2 ) specifythe per cen t of th e har vest to com e ou t of each eligibleage c lass. In the latter option , i f a par ticu lar age c lass i sexh austed befor e the dem an d i s satisfied , the r em ai nder of
the har vest fr om that r esour ce uni t is r em oved on the oldestfir st basis.

In the base pr ojecti ons, the Oldest - fir st Option w as assum edw ith the fol low ing pr otection against l iqu idating al l of theo l d stands on public ,
for est industry , and corpor ate owner
sh ips: On these owner sh ips, the m in im um har vest age forboth upland and bottom land hardwood stands on poor
'
siteswas set at 90 year s. On the farm er and o ther ind ividu a lpr ivate owner sh ips, the m in im um har vest age for bo thupland and bottom land har dwood stands on poor sites w asset at 50 year s.
On for est industr y and corpor ate owner sh ips, the m in im umhar vest age for pine and m ixed pine—har dwood stands w as
set at 20 year s. On these owner shi ps, the m in im um har vestages for har dwoods wer e 3 5 year s for h igh sites and 40year s for med ium sites. On the farm er and other individualowner sh ips, the m in im um har vest age for pine stands wasalso set at 20 year s bu t r an ged fr om 35 to 50 year s for
m ixed pine—har dwood and har dwood stands“
. On publiclands, m in im um har vest ages r anged fr om 35 to 55 year s
for p ine and m ixed p ine—har dwood stands. T he m in im umhar vest age for har dwood stands on h igh and m ed ium siteson public land was set at 60 year s.
In the Sou th Cen tr al region , the m in im um har vest age wasincr eased by 5 year s for al l owner sh ips and m anagem en ttypes. Th is decision was based on an assumption of sligh tlylonger r otations, on the aver age , and m or e em phasis onsawtimber r ather than pu lpwood pr oduction .
T h in n in gs— In those m anagemen t in tensities w ith comm er
c ial thinn ings, i t was assum ed that one- th ird of the inventorywou ld be r em oved in one th inn in g . It was also assum ed
ther e wou ld be no over all incr ease or decrease in total yieldas the r esu lt of th in n in g . T he am ou n t r em oved du r in gth inn i ng was subtr acted as a constan t r eduction at subsequentages in the yiel d tables. In those m anagem en t in tensitiescall ing for th in n ing of pine plan tation s, th inn ing w asassumed at age 20 on al l pr ivate lands i f the stands had not
been har vested ; on public lands the th inn ing age was setat 30 year s for pine plan tations.
Th inn ings of natur al pine stands on pr ivate lands wer eassum ed
'
at age 25 on h igh sites and at age 30 on m ed iumsites. Tim e of th inn in g in n atur al pine stands on public landr anged from 30 to 40 year s of age .
Ther e ar e , of cou r se , other assumpt ion s u n der lyi ng theprojected changes in t im ber resour ces pr esented below . T he
m ost im por tan t of these ar e descr ibed i n the appr opr iateplaces in the fo llow in g text .
Sou thw i de Tr en ds
Between 1962 and 1984, annual softwood supplies. c limbedto bill ion “
cu bic feet , an incr ease of 77 per cen t . Th isincrease is attr ibu ted to fu r ther expansion in the pu lp and
paper indu stry , a r evitalized lum ber indu stry , and the establ ishm en t and developm en t of the pine plywood industry .
Tim ber suppl ies— the vo lum e of tim ber har vested or available for h ar vest i n the fu tu r e— ar e one of the im por tan tm easu r es of r esou r ce change . Tim ber suppl ies ar e al l r oundwood pr oducts, r egar dless of sour ce . They inc lude industr ialr oundwood pr oducts such as saw logs, veneer logs, pu lpwood , other indu str ial r oundwood pr oducts, and fuelwood .
Althou gh m ost tim ber supplies com e fr om gr ow ing stock ,
substan t ia l qu an t it ies com e fr om o ther sou r ces: ( 1 ) tr ees
sm al ler than inches (2 )'
the stum ps, tops, and
limbs of gr ow ing- stock tr ees; (3 ) r ough and r otten trees; (4)dead tr ees; an d (5 ) tr ees that gr ow on land other than
tim ber land .
Between 1952 and 1962 , annu al softwood supplies (har vests)fr om the Sou th dec l in ed fr om bi l l ion to bi l l ioncubic feet , or by 7 per cen t (table fig . A 30per cen t decr ease in softwood saw log produ ction m or e thanOffset a 35 -
per cen t incr ease i n the annu al pr odu ct ion of
softwood pu lpwood . Hundr eds of sm al l por table sawm i l lsand m any lar ger stationar y m i lls c losed down in th is per iodas the region exper ienced a m ajor sh ift fr om lumber to pu lpand paper production .
Over the past 30 year s, other pr ivate timber land has been thepr im ary
'
sou r ce of softwood tim ber suppl ies in the Sou th ;however , the pr opor tion com ing fr om th is sour ce has beendecl in ing (fig . In 1952 , these other pr ivate timberlands pr ovided abou t 7 1 per cen t of the softwood suppl ies.
Th is pr opor tion has decr eased to 58 per cen t . In 1952 ,2 3
per cen t of har vested softw ood tim ber cam e'
fr om for est
indu stry lands; these lands now pr ovide abou t 35 per cen t .
Over th is per iod , public tim ber lands have pr ovided about 7percen t of the softwood supplies.
In the base projections, softwood timber supplies (har vests)w i ll r ise to bi ll ion cubic feet of r ou ndwood by 2000 .
Th is r epr esen ts a 15 -
per cent incr ease over cu r r en t levels.
For est industry tim ber land is expected to pr ovide m ost ofth is incr ease as softwood supp l ies fr om other pr ivatetim ber land begin to level off . Between now and 2000 ,
annual softwood suppl ies fr om for est industry land ar e
pr ojected to incr ease by 28 per cen t , fr om bill ion tobillion cubic feet .

T ab le —Softwood r oundwood suppl ies,lt im ber r em ovals,
2net annual grow th , and inven tory of softwood gr ow ing stock in the Sou th ,
by ow ner sh ip , selected year s 1952—84 , w ith pr oject ions
3to 2030
M i 'l l ion cubi c feet
132
25 ,078
Pr oject ions3

Billion cub ic feetown ersh ips
1 962 1 970 1 976
Fo rest ind ust ry
1 976 1 984 1 990 2000 20 1 0 2020 2030 . 1 952 19 62 19 7 0
Nat iona l fo rest
1 1952 1 962 1 9 70 1 97 6 1 984 1 990 2000 20 1 0 202 0 203 0 1 952 1 962 1 9 70 1 9 76 1 984 1 990 2000 20 1 0 2020
Fi gu r e — Softwood r oundwood suppl ies i n the Sou th by for est owner sh ip , 1952—84 , w ith pr ojections to 2030
134
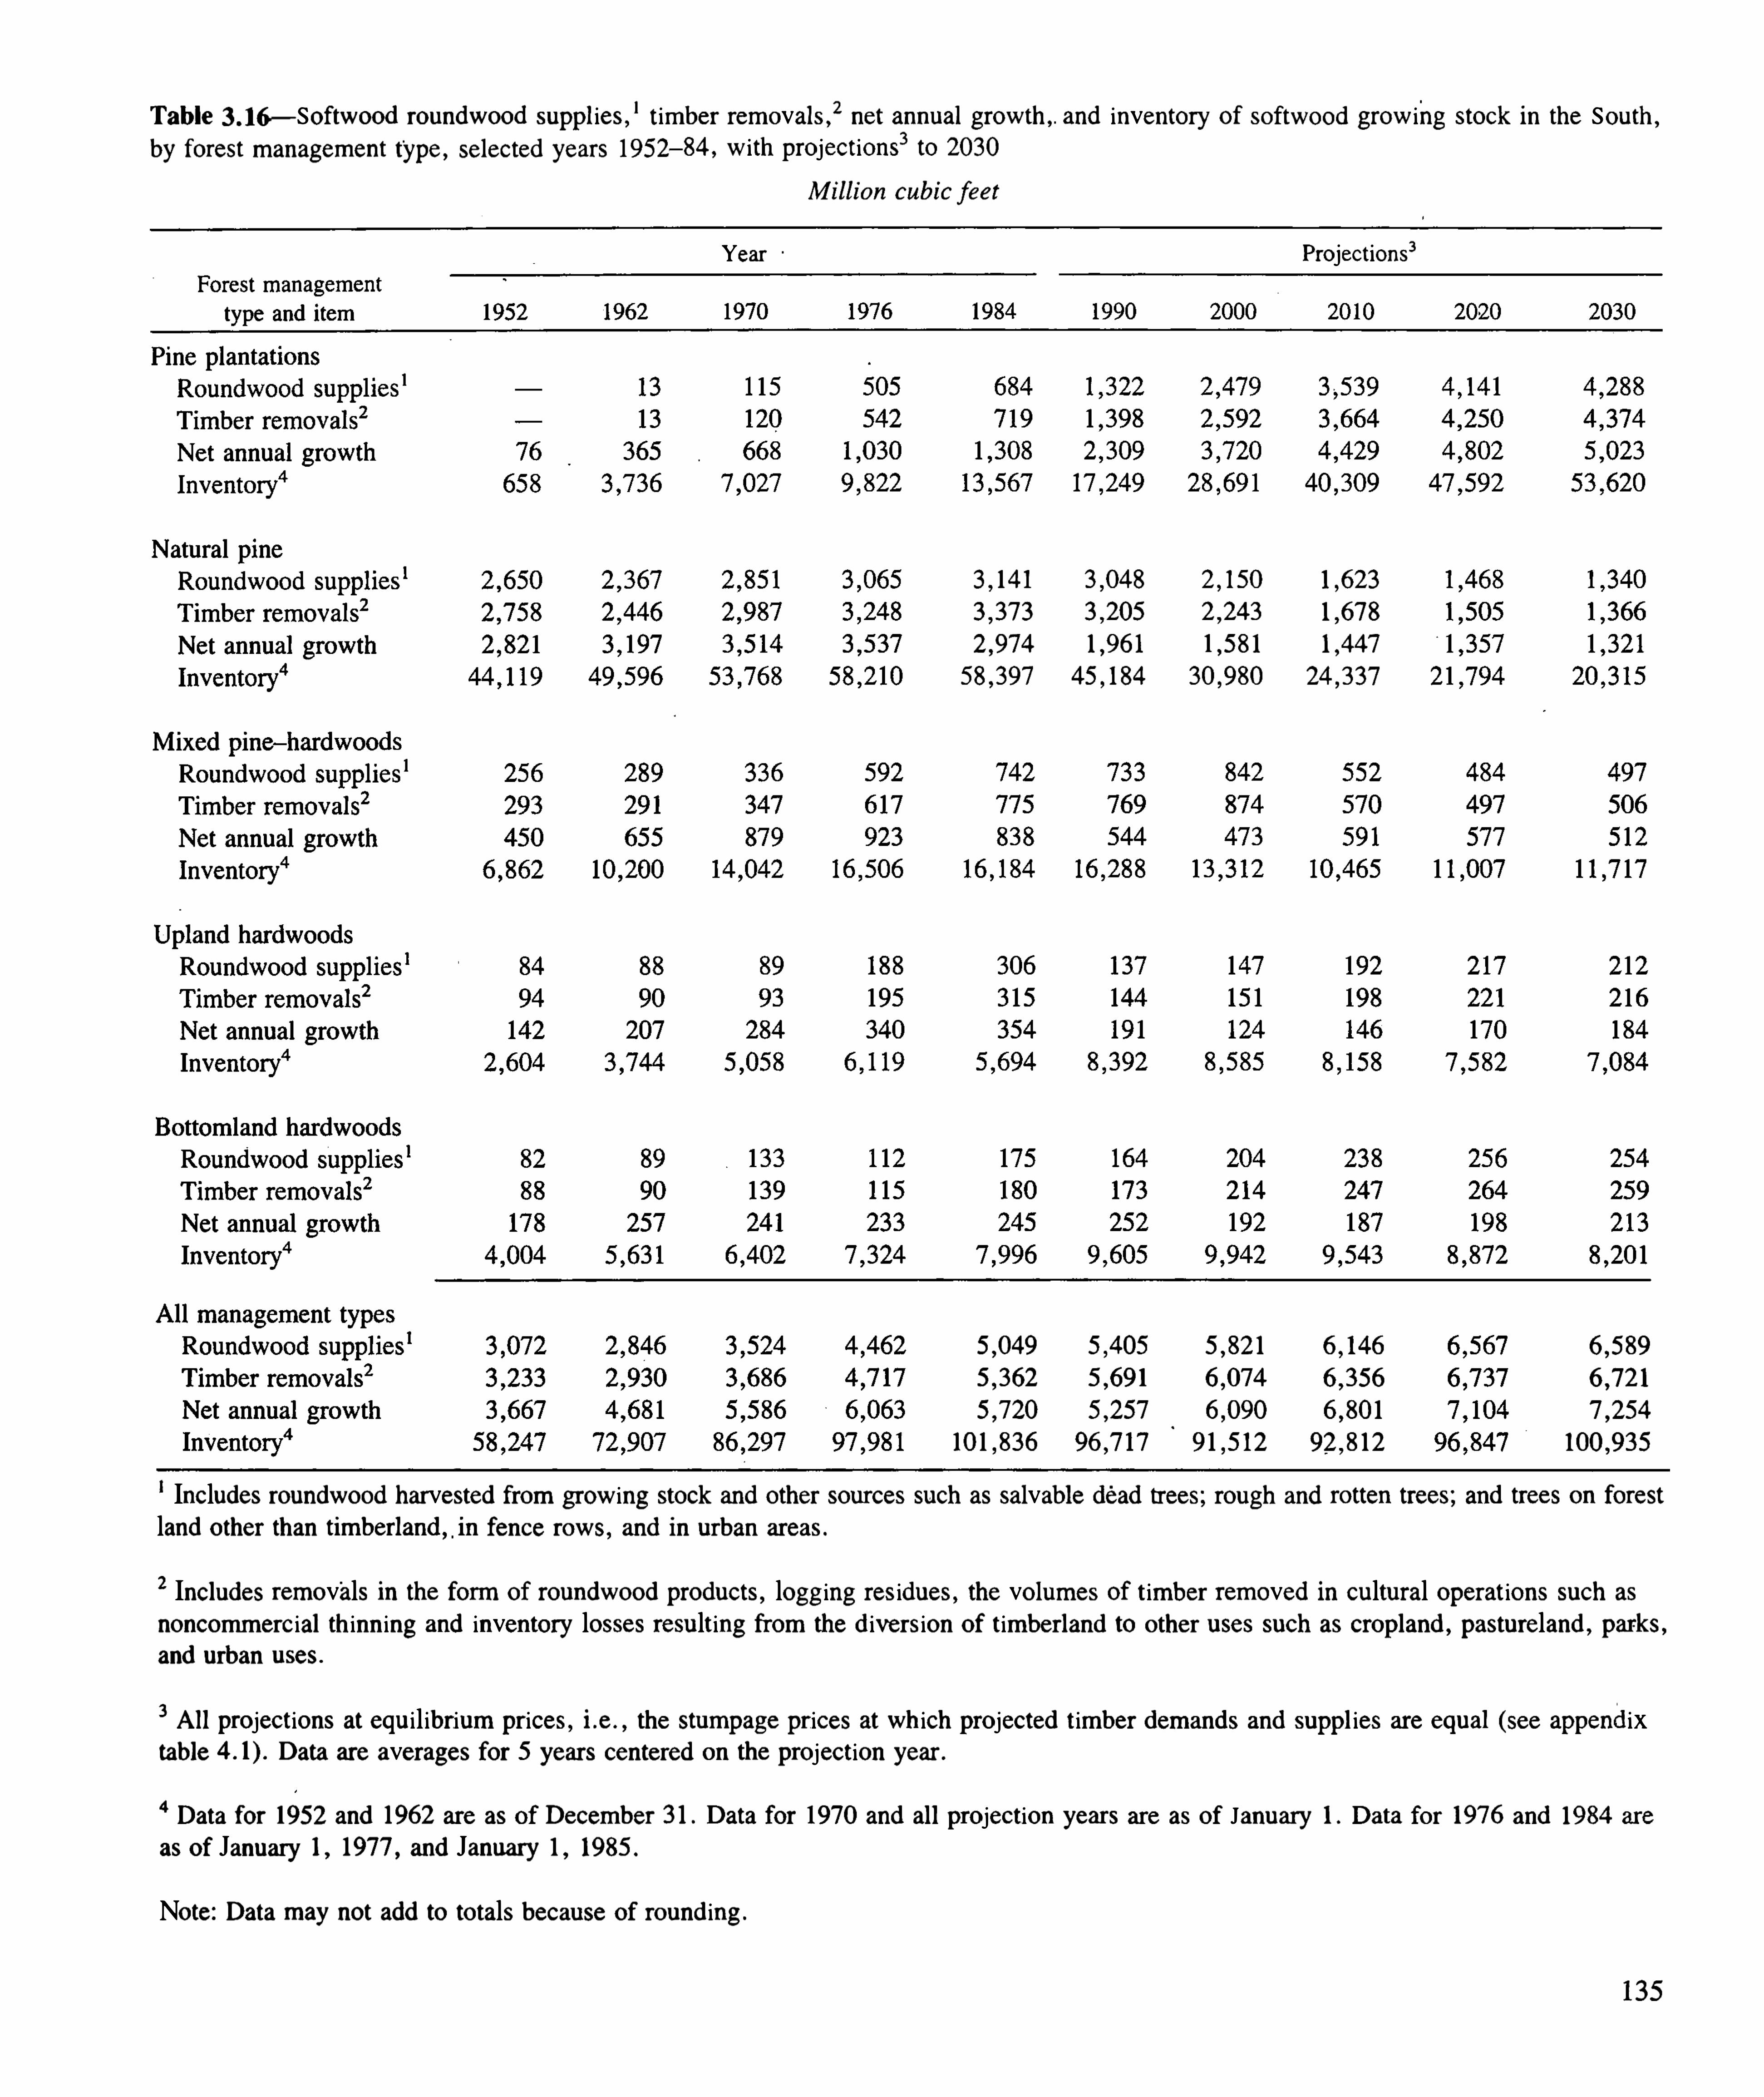
T ab le — Softwood r oundwood suppl ies,lt im ber r em ovals,
2net annual gr ow th , and inven tory of softwood gr ow ing stock i n the Sou th ,
by forest m anagemen t type , selected year s 1952—84 , w ith pr ojections
3to 2030
Mi l l ion cub i c feet
Year Projections3
9 1 ,5 12
Includes r oundwood har vested fr om grow ing stock and other sour ces such as salvable dead trees; r ough and r otten trees; and tr ees on forest
land other than tim ber land , ,i n fence r ows, and in u rban ar eas.
2 Includes r emovals in the form of r oundwood pr oducts, logg ing r esidues, the vo lum es Of t im ber r em oved in cu ltur al oper at ions such as
noncomm er c ial th inn ing and inven tory losses r esu lt ing fr om the d iver sion of t im ber land to other u ses such as cr opland , pastur eland , parks,
and u rban u ses.
3Al l projections at equ il ibr ium pr ices, i .e . , the stumpage pr ices at wh ich pr ojected t im ber dem ands and suppl ies ar e equal (see appendix
table Data ar e aver ages for 5 year s cen tered on the projection year .
4Data for 1952 and 1962 ar e as of Decem ber 3 1 . Data for 1970 and al l projection year s ar e as of Janu ary 1 . Data for 1976 and 1984 ar e
as of January 1 , 1977 , and January 1 , 1985 .
Note: Data m ay not add to totals because of r ound ing .
135

Billion cubic feet
1 962 1 9 70 1 976 1 984 1 990 2000 20 1 0 2020 203 0 1 970 1 976 1 990 2000
Natu ra l p ine
1 952 1 962 1 9 70 1 97 6 1 984 1 990 2000 1 952 1 962 70 1 976 1984
Up land hardwoods
1 952 1 962 1 970 1 976 1 984 1 990 2000 2 0 1 0 2020 2 03 0 1952 19 70 1 976 1 984 1990 2000 20 10
Figu r e— Softwood r ou ndw ood supplies i n the Sou th by for est m an agem en t type , 1952—84 , w ith pr ojection s to 2030
136

962 19 70‘
1 976 1
1952 1 962 1 970 1 984 1990 2000 2010 2020 203 0
Fi gu r e — Softwood r oundwood suppl ies in the Sou theast r egion by State , 1952—84 , w ith pr ojections to 2030
138

A few decades ago in the 1940’
s, there
wer e tens of thousands of sm al l c ir cu l arsawm i l ls in the South . Most of these m il lsar e gone . T he sawm il ls of today ar e lar gerand much more effic ien t . Many havech ipping headr igs, wh ich convert por tions ofeach log to ch ips for use in the pu lpindustry .
increase to billion cubic feet , or 25 per cen t above cu r ren tlevels. Ther e i s a sl ight dec l ine after 2020 .
Most of the pr ojected incr ease w ill be fr om for est industryland , wher e softwood supp l ies r ise 85 per cen t by 2030 .
Forest industr y land i s pr ojected to pr ovide 46 per cen t ofthe softwood suppl ies in 2030 , compar ed to the 3 1 per cent
actually suppl ied in 1984 . Softwood supp l ies fr om other
pr ivate land ar e pr ojected to decr ease by 7 per cen t . A 47per cen t decr ease in softwood
.
supplies fr om farm er
owner sh ips m or e than offsets the in cr ease fr om corpor ate
ho ld in gs. Pr ojected supp l ies fr om land owned by other
pr ivate ind ividu als show l ittle change .
The m ajor chan ge i n the sour ce of pr ojected softwood sup
pl ies by for est m anagem en t type is the sh ift from natu r alstands to p ine plan tations. Curr en tly , pine plan tations in theSou theast pr ovide abou t 430 m illion cubic feet of softwoodsuppl ies each year , or abou t 17 per cen t of the total . By2000 , pine plan tations w i ll supply alm ost half of the soft
wood ; by 2030 they w i ll supply m or e than two - th irds.
T r ends in the Sou th Cen tr al RegionIn the South
' Cen tr al r egion , softwood tim ber supp l ies wer estable at abou t billion cubic feet du ri ng the 1950 ’
s bu t
then began to r ise , reach ing a total of bill ion cubic feet
in 1984 . Th is har vest in cr ease w as pr im ar i ly due to expan
sion of the pu lp and plyw ood indu str ies and in cr easedlum ber pr oduc tion .
Softwood saw log production dr opped fr om bill ion boar dfeet to bill ion boar d feet between 1952 and 1962 as
m any sm al l sawm i ll s c losed down . Pr odu ction then beganri sing to i ts cur ren t annual level of abou t billi on boardfeet . T he softwood plyw ood indu stry becam e sign ifican t by1970 and by 1976 consum ed billion board feetann ual ly .
Of the bi ll ion cubic feet of softwood supp lied in 1952 ,
6 1 per cen t cam e from other pr i vate owner s and 29 per cen t
fr om for est indu stry (app . table Most of the har vest ,90 per cen t , cam e fr om n atur al pin e an d m ixed pine
har dwood stands (app . table Softwood saw logsaccoun ted for 53 per cen t of softw ood suppl ies.
Softwood saw log pr oduct ion had fa l len d r am at ica l ly by1962 . No m ajor chan ges i n ow ner sh ip of the softw ood
har vest were eviden t , and the sour ce of m ost of the tim berrem ained natur al p ine and m i xed p ine—har dwood stands.
By 1976 , softwood supp l ies had aga in in cr eased , to
bill ion cubic feet . T he pr opor t ion com in g fr om indu strylan ds r ose to 39 per cen t . T he pr opor t ion by fo r est typesh ifted fr om n atu r a l pine ,
wh ich fel l to 64 per cen t , tom ixed stands and pine plan tat ion s, wh ich accoun ted for 18
per cen t and 7 per cen t , r espectively .
139
Annual softwood pu lpwood production r ose fr om m i l l ioncords in 1962 to m i l l ion cords in 1984 . P lan t capac itytri pled dur in g the same per iod , fr om to ton s
per day . T he tota l num ber of pu lp m i lls rose fr om 42 to
59 , and aver age m i ll capac ity incr eased fr om 500 to m or e
than ton s per day . Most of the pu lp in g capac ityincr ease has occur r ed in the Coastal P lai n States ofAlabam a , Mississipp i , and Lou isian a , an d the easter n part
of Texas. Cu r r en tly , Alabam a leads Sou th Cen tr al Statesin pu lp ing capac ity w ith 26 per cen t of the total .
As the pu lp and paper industry expanded in the Sou th , totalsoftwood suppl ies jumped fr om to bi ll ion cubic feetbetween 1962 and 1970 . T he har vest of n atur al p ineincr eased to 74'
per cen t of r ou ndwood supp l ies, and thepr opor t ion supp l ied by fo r est indu stry in c r eased to 3 8per cen t . Alabam a , Lou isian a , and Texas led the softwood
supply incr ease (fig . Lum ber accoun ted for onl y 38per cen t of softwood suppl ies in 1970 , wh ile p u lpwoodjum ped to 48 per cen t .

B i llion cubic feet
Alabama
1 952 1 962 1 970 1 976 1 984 1 990 2000
Arkansas Lou is iana
1 952 1962 1 970 1 976“
1 984 1 990 2 000 20 1 0 2020 1 952 1 962 1 97 0 1 976 19 84 1 990 2000“
2010 2020 20
Miss iss ipp i Ok lahoma
1 962 1 970 1 976 1 984 1 990 2000 201 0 2020 203 0 1 952 1 962 1 97 6 1 984 -1 990"2000 2 01 0
T en nessee T exas
1 952 1962 1 970 1 976 1984 1 990 2000 20 10 2020 203 0 1 952 1 962 1 970 1 976 1 984 1 990 2000 2 0 1 0 2020 2030
Figu r e 3 2 0—S oftwood r oundwood supplies in the Sou th Cen tr al r egion by S tate , 1952—84 , w ith pr ojections to 2030
140

Tim ber r em ovals ar e defin ed as all hum an - cau sed r em ovalsof gr ow ing stock fr om the in ven tory on tim ber land ,
basedon the sam e m er chan tabil ity standar ds u sed in the inventory .
In add it ion to r ou ndw ood pr odu ct ou tpu t , they in c lu delogging r esidue and other r em ovals of gr ow in g stockassociated w ith land - use changes an d tim ber cu ltu r al pr actices. Generall y , these tr end - level estim ates of gr ow ing- stock
r em ovals ar e based on per iod ic r em easu r em en ts of per
m anen t sample plots at 5 to 10 -
year in ter vals.
Sou thw ide Tr en ds
Tr ends i n the an nual r em ovals of softwood gr ow ing stockin the Sou th follow a patter n sim i lar to that descr ibed forsoftwood r ou ndwood supp l ies (tables and fig .
Gener al ly , tim ber pr odu cts ou tpu t accoun ts for 85to 90 per cen t of the ann ual r em ovals of softw ood gr ow ingstock w ith the r em ainder being abou t equally d iv idedbetween loggin g r esidue an d other r em oval s. Between 1952
and 1962 , ann u al r em ovals of softw ood gr ow in g stockdecreased by 9 per cen t , fr om bill ion to bil lion cubicfeet . Th is decr ease i s attri bu ted to the dec line in the ou tpu tof Softwood saw logs du r in g the per iod and to som e
im pr ovem en t in u til ization .
S in ce 1962 , annual r em ovals of softwood have in cr eased tobill ion cubic feet , or by 83 per cen t . Most of th is
in cr ease can be attr ibu ted to in cr eases in softwood pr oduct
ou tpu t and the loggin g r esidue assoc iated w ith the har vests.
T im ber r em oval s— the vo l um e of t im berrem oved fr om grow ing stock inven tori es ont im ber land— inc lude the volum e of t im bercu t for products, logg ing r esidues (themateri al left in the woods after logg ing) , andthe tim ber r emoved fr om inven tori esthr ough land
- use changes and t im ber cu l tur alpr act ices.
Beyond 2000 , r em ovals con tinue to r ise un ti l 2020 , when
they r each bill ion cubic feet , 26 per cen t above 1984levels. Th is is fol low ed by a sm al l decline .
Again , the pr ojected incr ease in softw ood r em ovals occur sin pine plan tat ions. Betw een now and 2000 , ann u al rem ovalsof softwood fr om p ine plan tation s ar e pr ojected to incr easealm ost fou r fo ld , fr om bill ion to billion cubic feet .
Softwood r em ovals fr om natu r al pin e stands ar e pr ojected
Sti l l , ther e ar e sign ifican t qu an tities of other r em ovals. Ar apid r ate of ur ban developm en t and other land - use changesaffecting tim ber land con ti nue to r em ove substan tial quan titiesof softwood gr ow in g stock fr om the in ven tory each year .
In m any cases, the tr ees ar e not actual ly ou t bu t ar e r em ovedfrom the inven tory thr ou gh a change in land - use cl assifi
cation . In addition , substan tial am oun ts of gr ow in g stock ar er em oved i n site pr epar ation and other t im ber cu ltu r al pr actices. Gener al ly , pr oducer s r equ i r e som e m i n im um vo lum eper acr e for a profitable har vest oppor tun ity .
Ju st as w ith softwood r ou ndwood supp lies, well over halfof the softwood r em ova ls st i l l com e fr om other pr ivatetim ber land (table fi g . T he shar e fr om these
other pri vate lands i s decr easing , how ever , as m or e of the
r em ovals com e fr om for est industry lands. Not on ly ar e
forest industri es continu ing to har vest and conver t exten siveacr eages of natur al pin e stands to p ine plan tation s, they now
have m or e m er chan table- size plan tation tim ber to har vest ontheir own lands. Over the past 30 year s, the shar e of soft
w ood r em ova ls com in g fr om industry lands has incr easedfr om 2 3 to 35 per cen t , wh i le the shar e fr om other pr ivatelands has decl in ed fr om 7 1 to 58 per cen t .
By 2000 , annu al softwood r em ovals in the Sou th ar e pro
jected to incr ease to bill ion cubic feet , an estim ate 13
per cen t above cu r r en t levels. As w ith the pr oject ions ofsoftwood supplies, m uch of th is incr ease is expected to takep lace on for est indu stry lands, wher e an n u al softwoodr em ovals ar e pr ojected to incr ease fr om bill ion tobillion cubic feet , or by 26 per cen t . A 2 -
per cen t incr easeis pr ojected on other pr ivate lands. T he pr ojections suggesta 45 -
per cen t inc r ease i n softw ood r em ovals fr om publ ictim ber land between now and 2000 .
By for est m anagem en t type , the m ost sign ifican t change i nsoftw ood r em ova ls i n the Sou th h as been a sh ift fr omnatu r al pine stands to pine plan tation s (table fig .
Abou t 13 per cen t of the softwood r em ovals now com e fr om
pine plan tations, and th is shar e is expected to in cr ease in theyear s ahead . S ince 1952 , the shar e of softwood r em ovalscom ing fr om n atu r al p in e stands h as decr eased fr om 85
per cen t to 63 per cen t .


Bi llion cubic feetAl l management types Pinep lan tat ions
1 960 1 980 1 9 90 1 970 { 990 20 -1 0
Billion cubic feet
Natura l p ine
1 960 .
Bi llion cubicfeet
Fi gu r e— Softwood net ann ual gr owth and tim ber r em ovals in the Sou th by for est m an agem en t type ,
1952—84 , w ithpr oject ions to 2030
144

Billion cubic feet.
Figu r e —Softwood net ann u al gr ow th an d tim ber r em ovals in the Sou theast region by State , 1952—84 , w ith projecti onsto 2030
146

Figu r e —Softwood net annual gr ow th and t im ber r em ovals in the Sou th Cen tr al r egion by State , 1952—84 ,w ith
projections to 2030
147

Net annu al gr owth is the n et ch an ge i n m er chan table ,
gr ow ing stock vo lum e for a spec ific year in the absence of
r em ovals. In the est im ates of n et gr ow th , m or tal ity hasalr eady been dedu cted . T he m or e r ecen t est im ates of net
ann ual gr owth ar e based on peri od ic r em easu r em en ts of
perm anen t sam ple plots at 5 to 10 -
year in ter val s.
Sou thw i de Tr en dsAfter a long upward tr end in net annual gr ow th of softwood
in the Sou th , r ecen t for est su r veys have been m easu r in gdec lines i n m any ar eas (fig . tables and
Between 1952 and 1976 , n et an nual gr ow th of softwood
gr ow ing stock in cr eased fr om billion to billion cubicfeet , or by 65 per cen t . S ince 1976 , softwood gr owth haspeaked , at least tem por ar i ly , and tur ned dow nw ar d . In 1984 ,
the net annual gr ow th of softw ood totaled billion cubicfeet . These chan ges in net annu al gr ow th have sever alcauses, w h ich ar e cover ed in detail in later d iscussions.
Most of the r ecen t decl ine in softw ood gr ow th has occu r r edon timber land in other pr ivate owner sh ips (table fig .
Between 1976 and 1984 , net an nu al gr ow th of soft
wood on farm er lands in the other pr i vate category decr eased28 per cen t ; on other ind ividu al hold ings the decr ease w as6 percent . In con tr ast , net ann ual softwood gr ow th incr eased12 per cen t on for est industr y lands.
T he base pr oject ions su ggest the r ecen t down tu rn in net
annual gr ow th of softwood in the Sou th w il l cont inue un ti lnear the tu r n of the cen tu ry , at that tim e softw ood gr ow thtu r ns back up . Between 1984 an d 1990 , net annu al gr ow thof softwood is pr ojected to decr ease fr om bi ll ion tobillion cubic feet , or by abou t 8 per cen t : T h e down tu r n iscaused by actions al r eady taken or for gone . Although ther eis eviden ce of r ecen t im pr ovem en t in the r ates of piner egener ation on other pr ivate lands, i t w il l take 10 or m or e
year s for the pl an ted g
tr ees to r each m er ch an table size .
Most of the decr ease in net annual gr owth by 1990 occur son other pr ivate land , wher e i t i s pr ojected to dr op by 24per cen t . Beyond 1990 , softwood gr ow th on other pr ivateland c l im bs back to bil l ion cubic feet i n 2030 ,
ju stsl ightly lower than in 1984 . On for est indu stry land , soft
wood gr ow th in cr eases th r ou ghou t the pr oject ion per iodreach ing bi ll ion cubic feet by 2030 , som e 85 per cen t
above cur r en t gr ow th .
T he projected in cr ease in tim ber grow th on pr ivate ownersh ips is based on the expectation that investm en ts in tim berm an agem en t pr ogr am s w il l be m uch above those of today .
For examp le , i t w as assum ed that by 2030 the ar ea in p ine
On public tim ber lands, net annu al softwood gr ow th i s pr ojected to dr op abou t 1 1 per cen t by 2000 . Som e of the
pr ospective dec line is attri bu ted to the aging of pine stands
being car ri ed over long r otations for saw tim ber . Ther e i sa sm al l incr ease in gr ow th betw een 2000 and 2030 .
T he pr ospect ive dec l ine i n softwood gr ow th occu r s i n
natur al stands. Net annu al gr owth of softw ood in pineplan tations i s expected to m or e than dou ble between now
and they
ear 2000 . Mor e than 60 per cen t of the softwood
gr ow th i n the r egion w il l be in plan tations by then . Soft
wood gr owth in pin e p lan tati ons in 2030 is near ly four tim esthat i n 1984 .
Tr en ds i n the Sou th east
Recen t for est sur veys have m easur ed signi fican t reductionsin the net ann ual gt t of softwood in the Sou theast (app .
tables and After r ising for decades, net an nualgr owth of softwood gr ow in g stock seem s to have peakedar ound 1980 at abou t bil lion cubic feet and then dr oppedto bill ion cubic feet i n 1984 .
Most of the r eduction has been in n atu r al pine and m i xedpine—har dwood stands on other pr ivate tim ber lands in theP iedm on t and m oun tain s. In these par ts of the Sou theast ,
gr t of p ine is al so down on public lan d bu t shows li ttl echange on industry land . Over all , net an nu al gr owth of pine
plantation s w il l be doubled and that lar ge ar eas of m ixedpine—har dw oods and upland har dwoods w i ll be conver ted topine. T he necessary plan tin g and conver sion wou ld r equ ir eabou t bil lion . Substan tial incr eases in tim ber yields andthe in tensity of m anagem en t wer e al so assum ed for lar gear eas of
'
pine plan tations. Thu s, the pr ojected incr eases in net
annual softwood grow th show on ly what wou ld happen i fther e con tinu es to be a l o t of pr ogr ess i n for estr y i n the
Sou th and con tinu ed expan sion in techn ical and finan cialassistance , pr otection , .
r esear ch , education , and m an agem en t
pr ogr am s that have br ou gh t abou t the incr eases in gr ow thin the past .
As w ith r em ovals, the m ajor change i n softwood gr owthtr ends by for est m an agem en t type has been a sh ift fr omnatur al pine stands to pine p lan tations (fig . tableSoftwood gr ow th i n p ine p lan tation s h as n ear ly doubledover the past 15 year s and now accoun ts for alm ost onefou r th of the total . In n atur al pine and m ixed pinehar dwood stands, softwood gr owth is down 15 per cen t fr omthe level in 1976 . Onl y 10 per cen t of the softwood gr owth
occu r s i n har dwood stan ds, and th is includes the gr ow th of
cypr ess in bottom l and har dwood stands.

few er p ine and m ixed p in e—h ar dw ood stands 20 year s o ld
and younger th an sim ilar stands between 20 and 40 year s
ol d .
Based on the 1982 statistics from the Censu s of Agr i cu ltur e ,
the in cr ease i n ar ea of cr op land har vested in the Sou theasthas alm ost halted ; however , tim ber lan d is still being r apid lyd iver ted to u r ban and r elated u ses. T he pine and m ixedp in e—h ar dwood types exper ien ced a - m i l l ion - acr e n et
decr ease between 1977 and 1985 . Most of the decline hasbeen on other pr ivate land .
In adequ ate Regen er at ion on Oth er P r iva te Lan dsAnother factor c au sin g the r edu ct ion i n n et an n u al p in egr ow th i s in adequ ate r egener at ion on other pr ivate landafter har vest in g . Wh i le r ecen t fo r est su r veys show som e
impr ovem en t i n the r egener ation on such land , the recor d
du r ing the 1960 ’
s and 1970’
s w as not good . Many pri vateowner s accept whatever r egener ation natu r e pr ovides aftertim ber har vests. In m any cases, har dwoods or m ixed standsof p ine and har dwood r eplace pine w ithou t som e in ter vention on the par t of the landow ner . Changes on other pr ivateland ar e espec ially im por tan t because these owner s accoun tfor abou t two - th ir ds of the tim ber land in the Sou theast .
Over the past 10 year s, the ar ea of other pri vate landhar vested and kept in tim ber has aver aged abou tacr es each year . Th is figu r e inc lu des both fin al har vestingand h igh gr ad ing bu t exc ludes th inn ing and other in term ed iate cu tt ing . Of these acr es har vested ,
acres suppor ted p ine or m ixed p ine—har dwood stands pr iorto har vest . On other pr ivate land , the total ar ea successfu llyr egener ated to pine or m i xed pin e—har dwood aver aged abou t
acr es, or less than 55 per cen t of th e pine and m ixedpine—har dwood acr eage har vested . Over the sam e 10 -
year
peri od , ar ea r egener ated by plan tin g to p ine aver aged lessthan 20 per cen t of the acr eage of p ine and m ixed pinehar dwood har vested .
Plan ting statistics ind icate the annu al r ate of plan ting onother pr ivate lan d has in cr eased sign ifican t ly i n r ecen t
year s. Plan ting on other pr ivate land occu r r ed on appr oxi
m ately acr es in 1984 and acr es in 1985 .
Still,the r ate of plan t ing is m u ch below that of har vesting .
Abou t 1970 , the consequen ces of in adequ ate p ine r egen er ation on other pr ivate land and the absence of w idespr eadpine seeding on to id le cropland began to show up in the
for est su r vey stat istics as r edu c t ion s i n n um ber s of p inesapl ings. T he latest cyc le of su r veys show s 40 to 50
per cen t dec lines in the num ber s of pine sapl ings on other
pr ivate land . Mor e impor tant , these declines in tree num ber s
150
Much of the in cr ease in m or tal ity can be attr ibu ted toper iod ic ou tbreaks of pine bark beetles over fai r ly extensivear eas. For est su r vey statist ics su ggest th at in sects accou n tfor 35 to 40 per cen t of the softwood m or tal ity in theSou theast each year . Suppr ession i s the second lead in giden tifiable cause of death , fo l lowed c losely by d isease .
Fusiform r ust , littleleaf d isease , and annosu s r oot r ot ar e the
thr ee leading d iseases affectin g pines in the r egion .
have now pr ogr essed up in to the 6 and 8- in ch diam eter
c lasses, wher e they ar e affecting ingr owth and inven toryvo lum es (fig . S ince som e of the sharp decr ease i n
num ber s of p ines can be attri bu ted to the sh ift from dense
n atu r al stands to p lan tat ion s, pr ospect ive dec l in es i n thelar ger d iam eter c lasses ar e som ewhat sm al ler than thoseanticipated in sapl in gs. A 60 -
per cen t incr ease in the num berof 6 - inch pines on industry land over the past 10 year s on lypar t ially compen sated for the loss of 6- inch pines on other
pri vate land .
Incr ease in An n u a l “Mor ta l i ty— A th ir d factor affecting the
r eduction in net gr ow th i s a sharp incr ease in the m or tal ityof tim ber . P ines have exper ienced the lar gest in cr ease i nm or tality . Stat istics ind icate 15 per cen t of the gr oss annu algr ow th of sou ther n pine i s now lost to m or tality , compar ed
to 9 per cen t 10 year s ago . In tim ber vo lum e , the annu almor tality of pine has incr eased abou t 80 per cen t over thepast decade (table
Redu ct ion s in Gr ow th Rates— A fou r th factor affectin gthe slowdown in gr owth i s m easu r ed r edu ction s in the r atesof tr ee d iam eter and stand basal - ar ea gr ow th for natu r alp ines i n par ts of the r egion . T0 date , for est su r vey h asm easu r ed sign ifican t declines in
_
the Piedm on t and m ou ntains of Geor gia ,
Sou th Car o lin a , Nor th Car o lina , andVir gini a . In these r egions, aver age annual r ad ial in cr em en tsof pines determ i ned fr om r em easur em en ts of sam ple tr eesat br east height have aver aged som e 20 to 30 per cen t lowerover the past 10 year s than over the pr eviou s 10 .
A r eexam i nation of o lder for est sur vey data on r ates of tr ee
gr ow th ind icates the dec line extends back even fur ther thanthe past 10 year s and also show s up in par ts of the CoastalP lain i n ear l ier r em easu r em en t per iods. T he slowdow n i nd iam eter gr owth at breast height on individu al tr ees was notdetected ear lier becau se i t w as m or e than offset by incr easesi n stockin g and stand age . It i s conceded that a slowdownin the aver age r ate of gr ow th of individu al tr ees atby d iam eter c lass, i s not conc lu sive evidence of an over al lslow dow n i n softw ood gr ow th . Fu r ther stu dy , however ,show s a slowdown in aver age stand gr ow th expr essed i n

Figu r e— Per cen tage change in the num ber of l ive p ine tr ees on other pr ivate t im ber land i n the Sou theast r egion
between the m ost r ecen t for est su r veys, by d iam eter c lass
T able — Annual mor tal ity of softwood grow ing stock on tim ber
land in the Sou th ,by r eg ion and owner sh ip ,
1952—84 basa l ar ea per acr e beyond w hat has been exp lai ned byM i l l ion cub i c feet
changes in aver age stand density and age .
T he causes of the dec line in d iam eter and basal - ar ea gr ow thRegion in the Sou theast have not been determ i ned . Chan ges in stand
den sity and stand age , dr ou ght or other weather factor s, theloss of fer t i l ity i n o ld fie lds that cam e back to p ine , an
incr ease i n har dwood compet ition , and atm ospher ic deposition areal l possible con tr ibu ting factor s.
owner sh ip
Most of the fur ther dec l i ne i n softwood gr owth w il l be on
other pr ivate land‘
. In th is br oad owner sh ip category , soft
Includes m or tal ity on t imber land leased to for est industry . wood gr ow th i s pr ojected to decr ease another 25 per cen t
15 1
All of the factor s affecti ng net an nu al gr ow th ar e the r esu ltof forces that are not easil y or qu ickly chan ged . T he r ecent
downtu r n i n net annual gr ow th of softwood in the Sou theast
is pr ojected to con tinue un til 1990 , after wh ich softwood
gr ow th w i l l tu r n back up . By 1990 , net annua l gr ow th of
softwood i n the Sou theast i s pr ojected to be abou tbill ion cubic feet , whi ch m eans a fur ther decr ease of at least8 per cen t below cu r r en t levels. Beyond 1990 , annu alsoftwood gr ow th is pr ojected to c lim b back up to bill ioncubic feet towar d the end of the pr ojection per iod .

A th ir d factor causing the dec l ine i n net
annual softwood gr owth is a r ise inmortal ity— i t roughly doubled in a 10 -
year
per iod . Much of the incr ease in m or tali tyis attri bu table to losses fr om p ine barkbeetles. Suppr ession is the second - lead ingcause of loss, fol lowed closely by d isease .
before i t tu r ns back up . On for est industr y land , softwood
gr ow th con tinues to r i se thr oughou t the pr ojection per iodand c l im bs to bill ion cubic feet a year , m or e th an 75
per cen t above cu r r en t levels. Cu r r ently , for est industry lan dpr oduces abou t 32 per cen t of the softw ood gr owth . Th ispr opor t ion i s pr ojected to c l im b to abou t 47 per cen t i n2020 .
By m anagem en t type , pine plan tations ar e pr ojected topr ovide an incr easin g sh ar e of the softwood gr ow th . In
1984 , net annual gr owth of softwood on p ine plan tationstotaled bil l ion cubic feet , abou t 30 per cen t of to talsoftwood gr ow th . Softwood gr ow th on p ine p lan tation s i spr ojected to incr ease to bill ion cubic feet and eventual lyaccoun ts for 72 per cen t of
’
the tota l . Even by 2000 , pineplan tations
'
w i l l pr ovide 64 per cen t of the softwood gr ow th .
Tr ends i n the Sou th Cen tr al Region
T he m ost r ecen t inventor ies in the Sou th Cen tr al r egion havealso shown dec l ines i n softwood net ann ual gr t (app .
tables and Net an nu al softw ood gr ow th r ose
stead ily. between 1952 and 1976 bu t appear s to havepeaked ar ound 1980 , accor d in g to the m ost r ecen t data
available . Incr eases pr ior to 1976 r eflect str ong in gr owthof softwood tr ees
'
to m er chan table size on lar ge acr eages ofnew pine forests natur al ly r egener ated or plan ted on cu tovertim ber land and id le cr op land and pastu r e pr ior to 1962 .
152
These changes ar e r eflected in the tr ends in softwood grow thby m anagem en t type . Softwood net annual gr ow th on pineplantations increased by 26 per cen t between 1976 and 1984 .
In con tr ast , softwood net annual gr owth in n atur al pine and
m ixed p ine—hardwood stands dec l ined by 14 per cen t .
T he dr op i n net an nual softwood gr ow th on other pr ivatetim ber land is caused by a num ber of factor s. Fi r st , the ar ea
in pine has dec lined stead i ly since 1962 . Th is i s the r esu ltof tim ber land clear ing for other uses, lack of p ine r egencr ation after final har vest , and selective cu tt ing that pr oducesa net acr eage sh ift to har dwood types.
Pr ior to 1962 , the cr oplan d ar ea dec li ned , and m uch of the
idle land r egener ated natu r al ly or w as plan ted to p ine . As
these young stands r eached m er chan table size , h igh r atesof ingrow th con tri bu ted to incr eases in net annual gr owth .
Alm ost al l of the r ecen t dec l ine i n softw ood gr owth hasoccur r ed on other pr ivate t im ber land . For est industr yowner s have steadi ly incr eased p lan ting and the conver sionof natur al to plan ted pine , and th is is r eflected in in cr easesin softwood grow th . Softwood gr owth on public lands hasfal len slightly , pr im ar i ly because of w ithdr aw als of tim berland for Wi lder ness or other uses that r estri ct tim berhar vesting .
T he four th factor causing the dec l in e innet annual softwood growth is a r eduction20 to 30 percen t over large ar eas in the
Sou th— in the ann u al r ates of tree d iameter
gr owth . T he causes of thi s reducti on havenot been determ i ned . Changes in stand
density and age , dr ought or other weather
factor s, the loss of r esidual fer ti l i zer inold fiel ds that came back to p ine , and
atm ospher ic deposit ion ar e al l possib lecon tri buti ng factor s .

Tr en ds by Sta te
Between 1952 and 197 6 , ther e w er e lar ge in cr eases i n thenet annu al gr ow th of softwood i n every State in the Sou th(figs. and app . tables and 3 37
Tow ar d the end of th is per iod , the r ate of incr ease sloweddown and two States, Alabam a and Tennessee , experi encedsom e decr ease in softwood gr ow th . In term s of vo lum e , the
lar gest in cr eases occu r r ed i n Geor gia , Sou th Car o l in a ,
Mississippi , Lou isian a ,Alabam a , and Flor ida . Again , the
establishm en t and developm en t of pine stands on idle cr opland and pastu r e i n m ost S tates con tr ibu ted gr eatly to thelar ge incr eases.
Between 1976 and 1984 , every S tate except Flor idaexperi enced a decr ease i n softwood gr owth . In Flor ida , pinep lan tat ion s accou n t for a lar ger shar e of the softwood
r esou r ce than i n the other S tates. T he 1984 est im ates of
gr owth in Flor ida ar e also based on o lder inven tory datathan in m ost S tates.
So far , the lar gest m easur ed decl ines i n softwood gr owth interm s of vo lum e at the S tate level h ave been i n Sou thCar olina and Alabam a . Very lar ge decr eases have also beenm easu r ed i n the Piedm on t and m oun tains of Geor gia and
North Car ol ina , bu t these decr eases have been par tially offsetby incr eases in the Coastal Plain .
T he net annu al gr ow th of softwood gr ow ing stock pr ojectedfor 1990 is sign ifican tly lower than the net annu al gr owthin 1984 in al l bu t fou r States— Okl ahom a , Fl or ida ,
Vir gin ia , and Alabam a . Som e of the lar gest dec l ines ar epr ojected i n Geor gia ,
Mississipp i , Lou isiana , and Nor thCar ol ina .
Net annu al gr ow th of softw ood is in cr easin g again in al l
States by 2000 . In the base pr ojections, the lar gest percen tage incr eases above cu r r en t levels ar e ind icated forOklahom a , Vir gin ia ,
Alabam a ; Tennessee , and Lou isian a .
Of cour se ; action taken between now and 2030 cou ldcer tain ly alter these pr ospective tr ends.
Sou thw i de Sum m a r y of Softwood Gr owth Tr en ds
In summ ary , the lar ge in cr ease i n net an nu al softwoodgrow th i n the Sou th between 1952 and 1976 r eflects the h ighr ate of p ine establ ishm en t on id le cr op land and pastu r e
betwen 1945 and 1965 (Kn ight Du r in g th is per iod ,
the establishm en t of pine on o l d fields, whether n atu r allyoccu r r ing or accom pl ished thr ou gh p lan ting , tended tocompen sate for the failu r e of m any other pr ivate owner s tor egener ate their pine stands fo l low ing har vest .
154
T he lar ge incr ease in net annu al softwood
growth in the South betw een 1952 and 1976
reflects the h igh r ate of p ine establ ishm en ton id le cr opland and pastu re between 1945and 1965 . S ince 1965 the tr ends haverever sed— t imber land ar eas have beenc leared , croplan d and u rban areas haveincreased .
After 1965 , the r ate of pine establishm en t on these o ther
pr ivate lands dr opped as th is ol d - field sou r ce of p ine r egencr ation dr ied up . Many of the o ther pr ivate landow ner scon tinu ed to accept whatever r egener ation natu r e pr ovidedfo llow ing the har vest of their stands. Th is pr actice r esu ltedin m or e and m or e har dwood encr oachm en t on to p in e sitesand a r eduction in the acr eage of you n g p ine stands. Th issituation was fu r ther ed by the con tinu ing loss of tim ber landto other uses.
Although for est indu str ies have har vested and r egener atedstands on lands they own or lease at a very r ap id r ate since1965 , the incr eased gr ow th fr om their p ine p lan tation s hasnot fu l ly com pen sated for the d r opoff on other pr ivatelands. On m any public hold in gs, ther e has been a gener alagin g of the p ine stands becau se of the lon g r otat ion spr acticed . As the aver age age of pine stands on these publiclands has incr eased , ther e is som e eviden ce of a slowdownin cubic gr ow th also .
T he cu r r en t stand - age d istr ibu tion of p ine and m ixed pinehar dwood stands i n the Sou th reflects the tr ends descr ibed(table For example , abou t 45 per cen t of al l pine andm ixed p ine- har dw ood stands on other pr ivate lands ar ebetween 20 and 40 year s ol d , com par ed to 30 per cen t 20
year s and youn ger . Table a lso show s the h igher concen tr ation of you ng stands on for est indu stry lands as wellas the d ispr opor t ion ate shar e of o lder stan ds on pu bl icowner sh ips.

Changes in num ber s of al l l ive softwood tr ees by d iam eterclass between the m ost r ecen t for est su r veys i n the Sou thar e con sistent w ith the over all dec l ine in young pine stands(fig . T he decl ine i n softwood sapl ings iden tified inthe 1970
’
s has now pr ogr essed up th r ough the 6 - inch '
c lass(Boyce and Kn ight T he decl ines in num ber s of pinetrees on other pr ivate land have pr ogressed up
'
thr ough the
8- inch class. In a few ar eas, the dec l ine in l ive softwood
tr ees has alr eady r eached the 12 - inch and lar ger c lasses.
In add ition to the in adequate r egener ation on other pr ivateland fo llow in g har vest and an over all loss of tim ber land toother u ses, a th ir d factor affecting the slowdown in softwood
gr owth in the Sou th is a sharp in cr ease i n softwood m or
tality since abou t 1970 . S ince then , the an nu a l m or tal ity ofsoftwood gr ow in g stock has m or e than dou bled (table
Cu r r en tly , abou t 15 per cen t of the gr oss annualgr owth of softwood i s lost to m or tal ity . Thi s incr ease inm or tality extends acr oss the en tir e Sou th and each of the
m ajor owner sh ips. Much of the incr ease in m or tality can be
attr ibu ted to per iod ic ou tbr eaks of pine bark beetles overexten sive ar eas i n r ecen t year s. Fo r est su r vey stat ist icssuggest in sects accoun t for 35 to 40 per cen t of the softwoodm or tality each year . D isease and suppr ession ar e the other
leading cau ses of death : together , they accoun t for another
35 to 40 per cen t .
Fusiform r u st , littleleaf d isease , and annosus r oot r ot ar e the
thr ee leading d iseases affecting pine in the Sou th . Incr easesin m or tality caused by suppr ession are attr ibu ted to sign i
fican t bu ildups i n aver age stand densities and som e incr easein aver age age in r ecen t year s.
T ab le — D istr ibu t ion of p ine and m ixed pine~har dwood standsin the Sou th , by age gr oup and broad owner sh ip class, 1985
M i l l ion ac r es
Broad ow ner sh ip c lass
Figu r e— Per cen tage change in the num ber of live softwood tr ees on tim berland in the Sou th between the m ost r ecen t
for est sur veys, by d iam eter c lass155

As r ecen tly‘
as 1976 , net ann u al gr ow th of softwood in the
Sou th exceeded annual r em ovals by alm ost 30 per cent . By
1984 , thi s m ar gin had been r educed to less than 10 per cen tbecau se of the dec l in e i n gr ow th and con tinu ing incr easesi n r em ovals. By 1990 , an nu al r em ova ls w i l l exceed net
ann ual gr t of softw ood by 8 per cen t . By 2000 , gr owthan d r em ovals again appr oach a balance . Beyond 2000 ,
gr owth exceeds r em ovals by 5 to 8 per cen t .
Most of the deficit occu r s on other pr ivate land ,wher e by
1990 , annu al r em ova ls ar e pr ojected to exceed the n et
annual gr t of sofMoods by abou t 24 per cen t . A sm al lover cu t on for est indu str y lan d i s e l im in ated by 1990 .
Again , m ost of the defic it develops on natur al stands, wher e
r em ovals exceed gr owth thr ou ghou t the pr oject ion per iod .
The projected tr ends in the softwood gr owth—r em oval balancefollow the sam e gener al patter n i n both the Sou theast andSou th Cen tr al r egion s. In the Sou th Cen tr a l r egion , the
gr owth defic it extends thr ou gh 2000 .
In the tables, the gr owth—r em oval r elationsh ips and chan gesi n inven tor ies som etim e seem in consisten t . Most of these
inconsisten cies ar e caused by the tr eatm en t of t im ber landacqu isit ion s and sales i n the pr ojection m ethods. For
examp le , wher e an ow ner category i s acqu ir ing additionaltim ber land , inven tory can incr ease even thou gh r em ovalsexceed gr ow th .
Sou thw ide Tr en ds
Most of the lar ge incr ease i n softw ood inven tory between1952 and 1985 occur r ed on other pr ivate timber land , wher e
softwood in ven tor ies r ose by m o r e than 84 per cen t (tablefig . Th is incr ease i n softwood in ven tory on
other pr ivate lands occu rr ed in sp ite of a sign ifican t dec linein pine acr eage . It reflected the t imber on m i ll ions of acr esof young pine stands established between abou t 1945 and
1965 .
T he base project ions of net an nu al t im ber gr ow th and
r em ovals ind icate that the lon g upw ar d tr en d i n softwood
inven tor ies in the Sou th has r un i ts cou r se . A 10 -
per cen t
decr ease is pr ojected between n ow and 2000 . Most al l of
th is r eduction occu r s on other pri vate tim ber lan ds, wher e
Inven tor ies "
of softw ood gr ow in g stock in c lude the so l idw ood (exc lu des bark) con ten t , expr essed i n cu bic feet ,between a 1 - foot stump and a 4- in ch top d iam eter , ou tsidebar k , of al l live softwood tr ees inches d .b .h . and lar gercon tain in g at least a 1 2 - foo t l og , or two n on con t igu ou ssaw logs, each 8 feet o r longer m eet ing m in im um gr ade
r equ ir em en ts w ith at least one- th ir d of the gr oss boar d - foot
vo lum e between a l - foot stump and the m in im um saw logtop in ches ou tside bark) be in g sou nd . In add it ion ,
in ven tor ies also inc lude the so lid w ood con ten t between a
1 - foot stum p an d a 4- in ch top d iam eter of al l l ive softwood
in ches to in ches d .b .b . th at w i l l pr ospec t ivelyqu al ify u nder the above stan dar ds. All of these softw ood
tr ees m ust occu r on tim ber lan d .
Between 1952 and 1985 , the inventory of softwood gr ow ingstock in the Sou th incr eased fr om billion tobillion cubic feet , or by 75 per cen t (table fig .
Most of th is bu i ldup in inven tory occu r r ed i n the 1960’
s
and 1970’
s, when a r ap id in cr ease in softwood gr ow th kept
pace w ith the in cr ease i n softw ood r em ovals. In r ecen t
year s, as grow th tur n ed dow n and r em ovals con tinu ed toc lim b , the in cr ease i n softwood inven tor y has begun tolevel off .
Al though for est industri es acqu ir ed sever al m i l l ion add itional acr es of tim ber lan d between 1952 and 1985 , the
incr ease in softwood inven tory on indu str y lan ds, under 53per cen t , w as m u ch less than the incr ease on other pr ivatelands. The r apid r ate of har vest and conver sion of n atu r alstands to pine plan tations tended to offset par t of the bu il dupin in ven tor y on in du str y lan d . Over the sam e per iod , a
r elat ively slow r ate of h ar vest on pu blic lan ds en abledsoftwood inven tor i es to incr ease 82 per cen t .

softwood inven tor ies ar e pr ojected to dec l ine by 2 1 per cen tbetween now and 20 10 . T he base pr ojections ind icate theover all inven tory of softwood w ill c l im b back to 10 1 billioncubic feet by 2030 , a vo lum e c lose to cu r r en t levels. On
other pri vate land , the inven tor y is 5 1 billion cubic feet by2030 , 19 per cen t below cu r r en t levels.
A 2 1 - fo ld incr ease i n the inven tory of softwood i n p in eplantations has accoun ted for alm ost 30 per cen t of thebu ildup i n softwood inven tory since 1952 (fig . table
Fu r therm or e , the incr ease in softwood inven tor ies inpine p lan tat ions con tinu es. S in ce 197 7 , the inven to r y of
softwood in natu r al p ine , m ixed p ine—har dwood , and uplandhar dwood stands has either leveled off or star ted to decr ease .
T he inven tory of softw ood con tinues to incr ease i n bottomland hardwood stands, bu t a lar ge shar e of th is vo lum e iscypr ess (fi g .
Mor e and m or e of the inven tory of softwood timber w i l lbe in pine plantation s. Cu r r en tly , pine plan tations accoun tfor 13 per cen t of the softwood inven tor y ; by 2000 , th ispropor tion w ill be between 30 and 35 per cen t ; by the end
of the projection peri od , th is pr opor tion exceeds 50 per cen t .
Shor tly after the tu r n of the cen tu ry , the softwood inven toryin pine plan tation s w i ll exceed that i n n atu r al p ine stands.
Sm al l - d iameter tr ees ar e char acter ist ic of the sou ther n
softwood tim ber r esour ce . Although ther e has been som e
r ecen t m ovem en t tow ar d the lar ger d iam eter tr ees in thevolum e distri bu tion by tr ee size ,
well over 40 per cen t of thesoftwood inventory is still in 6 8 and 10 - inch tr ees (fig .
T he 10 - inch c l ass accou n ts for the lar gest por tion of
the softwood vo lum e , r eflecting the fact that m any pinesin the r egion ar e cu t for pu lpwood by the tim e they r each
th is size .
As the softwood inven tory sh ifts fr om natur al pine to p ineplantations, tim ber users w il l have to adjust to chan ging tr eechar acter istics. For examp le , p lan tation - gr own softwoods
reach m er chan table size at a younger age , and con sequen tlya h igher pr opor tion of the wood in each tr ee has juven ilequ alities. Shor ter r otation s m ay accen tuate th is sh ift .
One single species, loblo lly pine , accoun tsfor 47 per cen t of
the softwood inven to ry i n the r egion and i s the spec iesm ost w idely u sed in in ten sive m anagem en t (fig . In
term s of vo lum e , Shor tleaf pine is the second - lead ingspec ies
,
bu t now accoun ts for less than 19 per cen t of thetotal . T he vo lum e of Shor t leaf p ine has been dec l in in gr apidly over m uch of i ts r ange for a num ber of year s. S lashp ine is the on ly other spec ies that accoun ts for m or e than10 per cen t of the softwood inven tor y . S lash p ine has been
158
the lead in g species in plan tations in par ts of the sou ther n
Coastal Plain .
Tr en ds i n th e Sou theast
S ince 1952 , the inven tory of softwood gr ow ing stock in theSou theast has incr eased fr om bill ion to bill ioncubic feet , or by alm ost 50 per cen t (app . tables and
Most of th is bu i ldup i n in ven to r y occu r r ed in the
1960’
s and 1970’
s, when net annu al gr owth gr eatly exceededann u al r em ovals. In r ecen t year s, the incr ease in the i nventor y of softwood gr ow in g stock h as leveled off . Betw een
1977 and 1985 , the incr ease was less than 4 per cen t whenal l ow ner sh ips ar e included . On other pri vate land , softwood
inven tor ies decl ined sligh tly du r in g th is peri od .
In 1985 , 65 per cen t of the softwood gr ow in g stock occu r r edon other pr ivate land , 23 per cen t w as on land owned or leasedby for est indu str y , and the r em ain ing 12 per cen t on publictimber land . On other pr ivate land , a lar ge shar e of the softwoodinven tory is i n p ine andmixed pin e—hardwood stands between20 and 40 year s o ld . In th is ow ner sh ip c lass, these age classesaccoun t for m or e than 40 per cen t of al l the pine and m ixedpine—har dwood stands. Because fewer than 30 per cen t of the
pine and m ixed pine—har dwood stands on other pr ivate landar e 20 year s and younger , a substan tial dec line in the inventoryof softwood on th is ow ner sh ip i s l ikely to occu r i f past
har vestin g tr ends con t inue .
T he sou ther n softwood t imber r esou r ce ischar acter ized by sm al l - d iam eter tr ees. T he
l o- inch d iam eter c lass accoun ts for the
l argest por t ion of softw ood vo l um e , an d
wel l over 40 per cen t of the inven tory is inthat size c lass or sm al ler . Pu lp m i l l s,
sawm i l ls, and other w ood - m anu factu r in gindustr ies ar e equ ipped to use sm al l
d iameter softwood t im ber effic ien tl y .
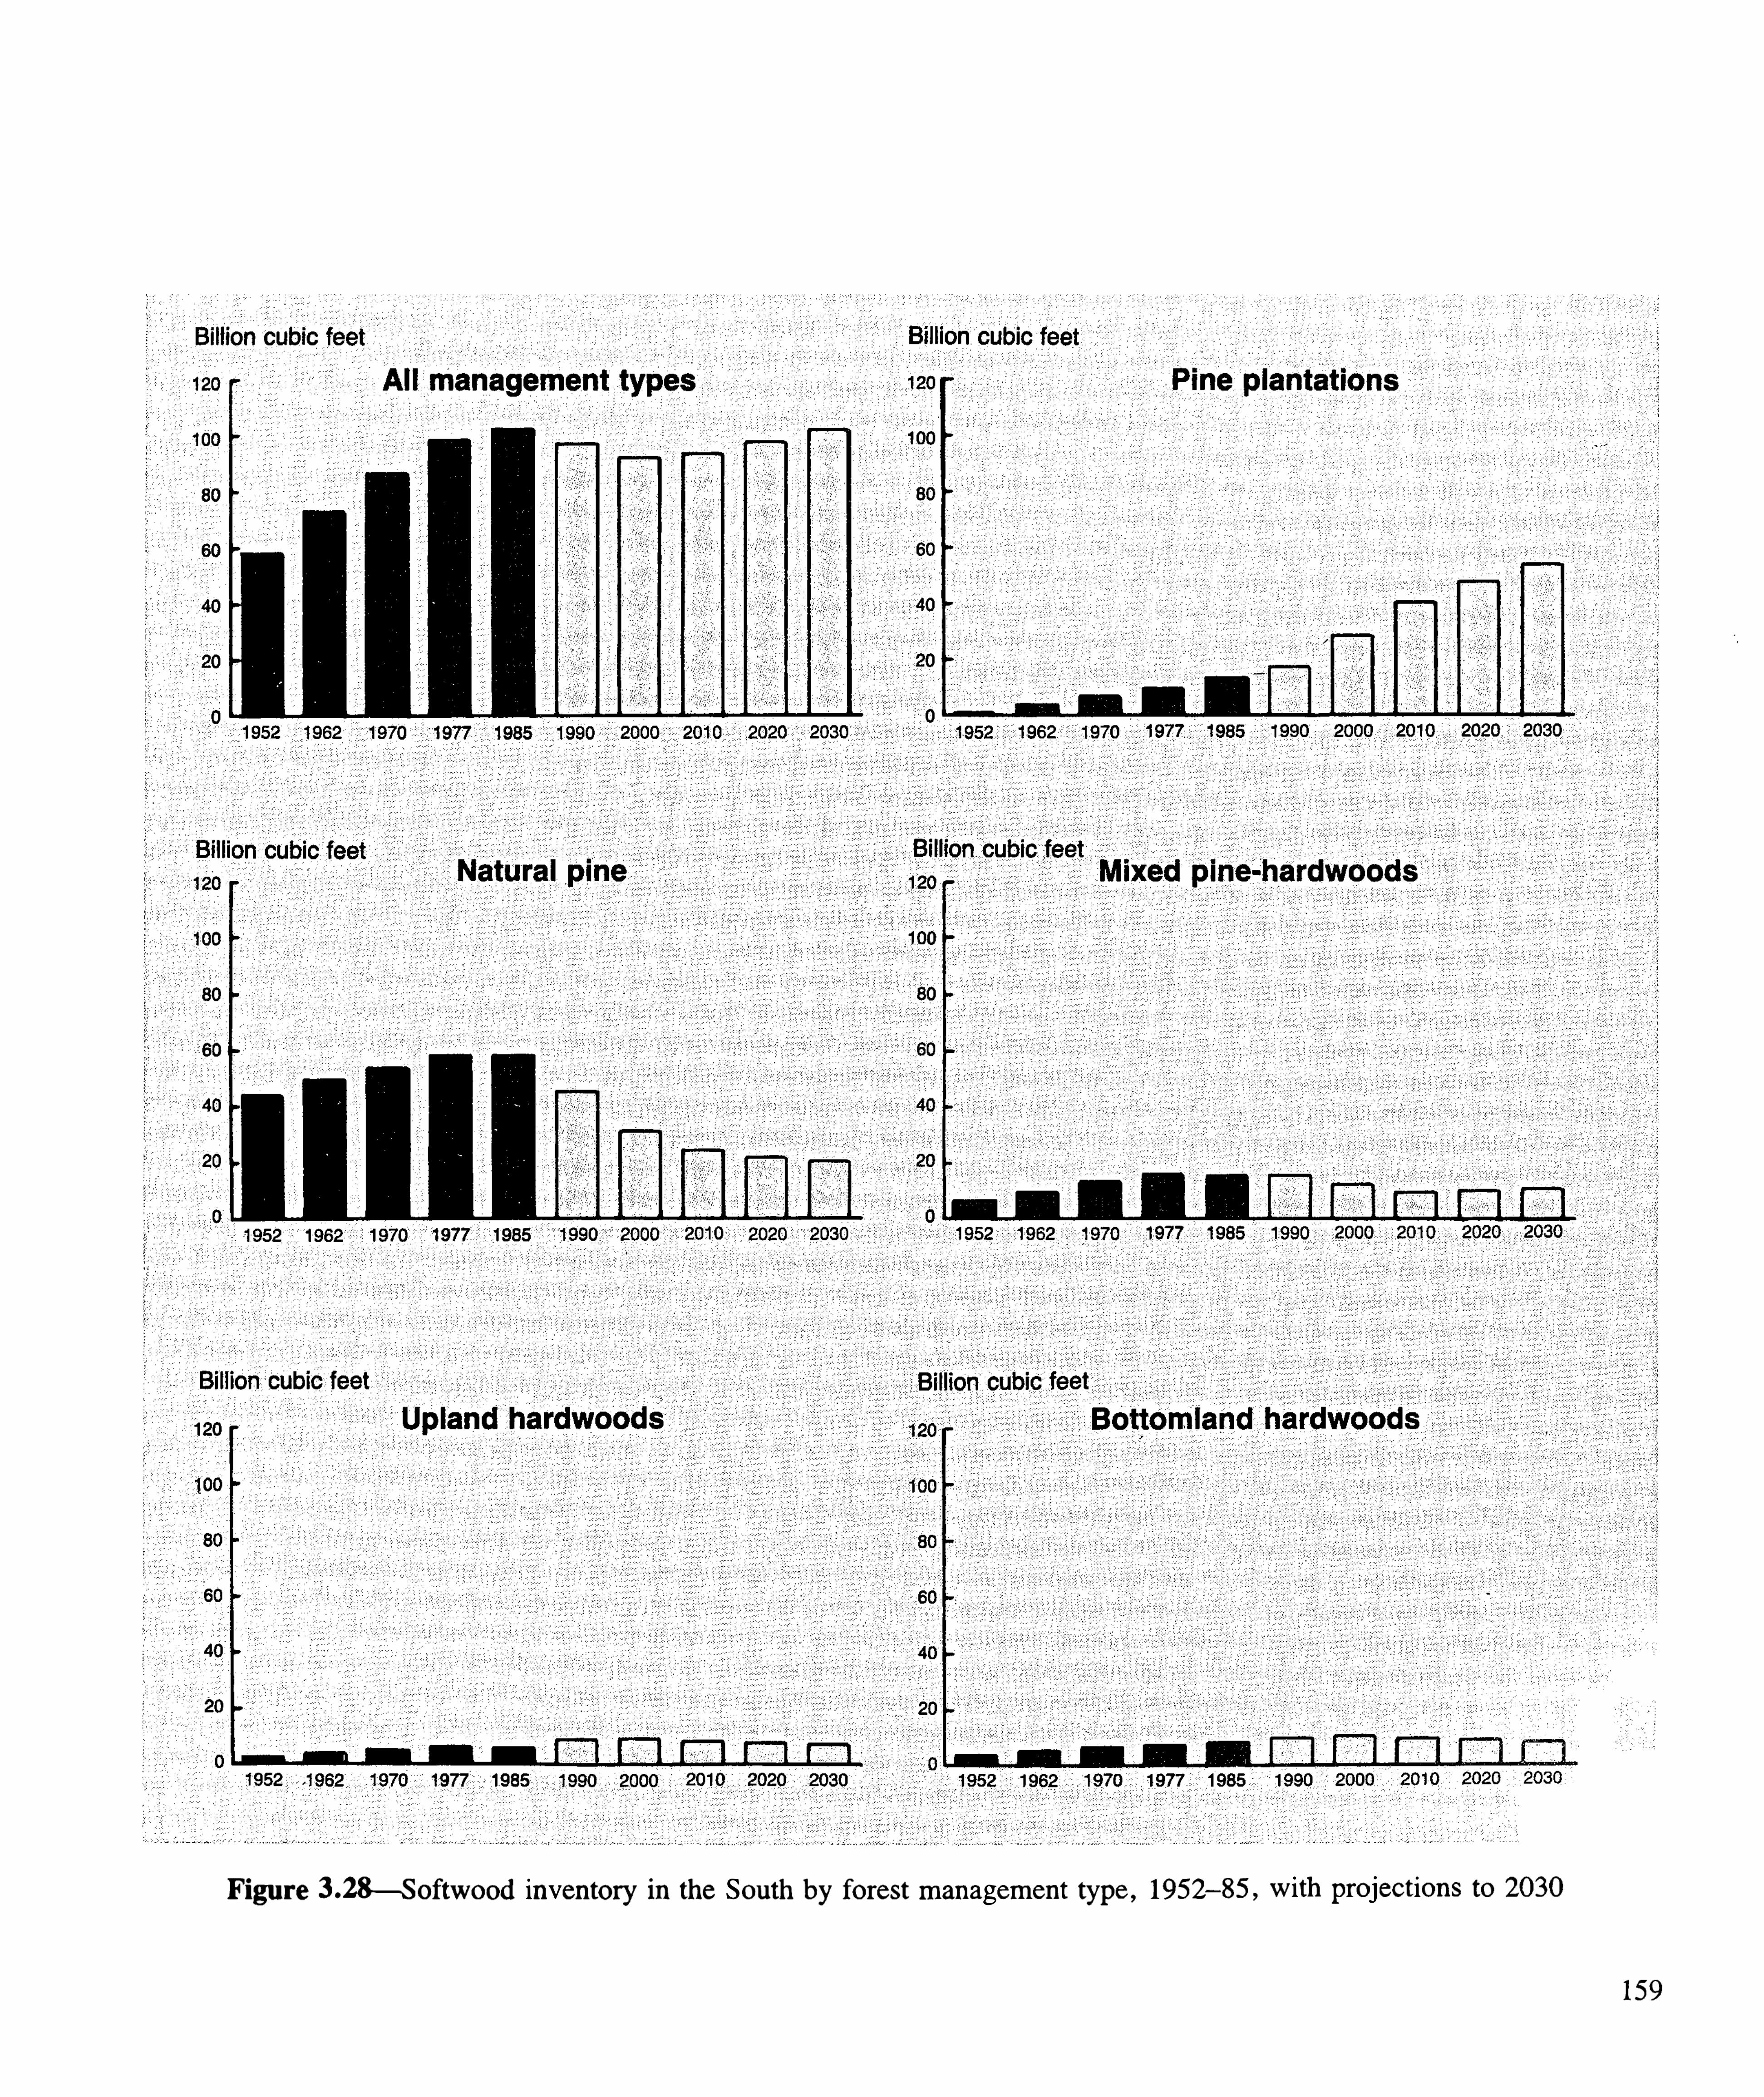
Figu r e — Softwood inven tory in the Sou th by for est m anagem en t type , 1952—85 , w ith pr oject ion s to 2030
159

In con tr ast to the other pr ivate situat ion , abou t 60 per cen t ofthe p ine and m ixed pine—h ar dwood stands on industry landar e 20 year s and you n ger . Fu r therm or e , m ost of these youngstands ar e p in e plan tat ion s . As these youn g pine plan tationsdevelop , a substan t ial in cr ease i n the in ven tory of softwood i sexpected on th is ow ner sh ip . Becau se m any of these p ineplan tat ion s ar e m an aged on r otation s of 30 year s or shor ter ,incr eases in inven tory vo lum e m ight not con tinue m uch beyondthe pr ojection per iod u n less forest industr y acqu ir es additionalacr es.
Althou gh public tim ber lan d accou n ts for on ly 12 per cen t ofthe softwood inven tory , i t accoun ts for a lar ger shar e of thebigger tim ber . Mor e than 20 per cen t of al l the p ine and m ixedpine—har dw ood stands over 50 year s o l d i n the r egion ar e on
public land . Fu r therm or e , 30 per cen t of al l pine and m ixedpine—hardwood stands on public land ar e over 50 year s o l d .
Most of th is public tim ber is on n ation al for ests and defenseinstal lation s. Str ictly fr om the bio logical standpo in t , ther e ar eoppor tun ities to incr ease the har vest of softw ood fr om publiclands; however , m ost of these lands ar e m an aged for m u ltipleuses . If the accum u lation of o lder stands on pu blic land
Percent of tota l
con tinues, som e dec l ine i n gr ow th and r ate of inven torybu i ldup can be expected .
By for est m an agem en t type , 57 per cen t of the softwood
gr ow ing stock is still in n atu r al pine stands, bu t th is pr opor tionis droppin g . Not on ly is the pr opor t ion of total softwoodinven tory in natu r al pine stands decr easing , the actual volum eof softwood in these stands is also go ing dow n . Between
1977 and-
1985 , vo lum e of softwood gr ow ing stock i n n atu r alp ine stands dec l ined 4 per cen t .
When al l for est m anagem ent types ar e com bined , sou ther n
pines accou n t for 88 per cen t of the total inven tory of soft
- 1 985
D iamete r c lass
(d iameter - b re‘
ast- height in inches)
Figu r e— Per cen tage d istr ibu tion of softwood gr ow ing stock on tim ber land in the Sou th , by d iam eter class,
1977 and 1985
160
Cur r en tly , 16 per cen t of the softwood gr ow ing stock is inp ine plan tat ions, and th is pr opor tion w ill in cr ease very r apid lyw ith the developm en t of sever al m i l l ion acr es of youngplan tation s alr eady established . Between 197 7 and 1985 ,
vo lum e of softwood gr ow in g stock i n p in e p lan tat ion sin cr eased by 58 per cen t . These estim ates of softwood vo lum ein pine plan tation s exc lude softw ood vo lum e in pine plan tation s c lassed as m ixed p in e—h ar dw ood o r h ar dw ood type
because of hardwood encr oachm en t .

Billion cubic feetFlo r ida
1952 1 962 1 9 70 1 990 2000 20 1 0 2020 203 0
Geo rg ia No rth Caro l ina
1 952 1962 1 970 1 985 1 9 90 2000 20 10 2020 2030 20
Sou th Ca ro l ina Vi rg in ia
1 952 1 962 1 970'
1 977 1 985 1 990 2000 20 1 0 2 020 203 0 1 952 1 962“
1 977 1 995“
1 990'
2000 = 2
Figu r e — Softw ood inven tory in the Sou theast r egion by State , 1952—85 , w ith pr ojection s to 2030 .
162

3 .32r~ Softwood in ven tory

Cub ic feet per acre
“
1 200
900
1 97 6
Figu r e —Aver age vo lum e of softwood gr ow ing stockin pine and m ixed p ine—har dwood m an agem en t types in theSou th Cen tr al r egion , 1952—85
bi l l ion cubic feet , or by 12 per cen t . T he dec line pr ojectedon other pr ivate land i s a bou t 20 per cen t , and i t extends to2020 . Softwood in ven tory on for est indu stry land in theSou th Cen tr al r egion is pr ojected to in cr ease on ly 10 per cen tabove cu r r en t levels by 2030 , wh ich is wel l below the 69
per cen t incr ease pr ojected in the Sou theast .
A lar ge , r apid in cr ease i n softwood inven tory in p ine plantations par allels the pr ojected tr ends in the Sou theast .
Cu r r en t ly , the inven tor y of softw ood i n p ine p lan tat ion saccou n ts for 1 1 per cen t of the total . Th is pr opor t ion i spr ojected to exceed 50 per cen t by 2030 ; i t r eaches 40per cen t befor e 20 10 .
Tr en ds by Sta te
Betw een 1952 and 1985 , every State except Vir gin iaexper ienced a lar ge in cr ease i n the in ven tory of softwood
gr ow in g stock (figs. and app . tablesand 3 37 In Vir gini a , a tigh t gr ow th—r em oval situationover m uch of the peri od held the in cr ease down to abou t15 per cen t , w ell below that of al l other States. In term s of
volum e , the lar gest bu il dup in softw ood in ven tory occur r ed
in Lou isiana , Mississipp i , Alabam a , and Geor gia .
Between now and 2000 , som e decr ease in softw ood
inven tory is pr ojected in every State . The lar gest declin es ar epr ojected for Texas, Sou th Car o l ina ,
Alabam a ,Geo r gia ,
and Arkansas. In -Flor ida , Ten nessee , and Oklahom a , the
pr ojected dec lines ar e very sm al l . After 2000 , softwood
inven tor ies ar e pr ojected to incr ease again i n m ost S tates,w ith the lar gest in c r eases pr ojec ted fo r Flor ida , Nor thCar ol ina , Vir gin ia , and Alabam a .
Sou thw ide Tr en ds
T he pr opor t ion of har dw ood suppl ies by m an agem en t typehas sh ifted over the year s (table fig . In 1952 ,
bottorr rl and har dwoods supp lied m or e hardwood r oundw oodthan any other type , 46 per cen t of the tota l . Bottom landhar dwood types sti l l accoun ted for the m ost har dw oodsupplies in 1970 , bu t the pr opor tion fell to 40 per cen t . By
Har dwood tim ber is an impor tan t r esour ce in the Sou th , bothto the t im ber owner s and for est industry . Cur r en tly , har d
w oods accoun t for abou t 3 3 per cen t of al l tim ber suppl ies(har vests) fr om the Sou th each year . In the year s ahead ,
th is pr opor tion is expected to in cr ease becau se of ( 1 ) lar gebu ildups in har dwood inven tor ies, (2 ) changes i n the useof har dwood t im ber , and (3 ) in ten sifyin g com pet it ion forsoftwood
_
t im ber and softwood stumpage pr ices above thosefor har dwoods.
Between 1952 and 1976 , the Sou th supplied fr om billionto bill ion cu bic feet of har dwood r ou ndwood ann u ally(tables and fig . S ince 1976 , har dwood
r oundwood supp lies have gone up 38 per cen t and cu r r en tlytotal bi ll ion cubic feet per year . Har dwood pu lpwood ,
l itt le u sed i n 1952 , h as becom e the lead in g h ar dw oodpr oduct and now accou n ts fo r abou t 40 per cen t of al l har dwood r oundwood suppl ies. Har dwood fuelwood pr oduct iondec lined fr om 1952 to 1976 , then doubled to cau se a sub
stan tial pr opor tion of the r ecen t incr ease in total har dwoodsupplies. Har dwood fuelw ood now accoun ts for 27 per cen t
Of al l hardw ood suppl ies.
Between 1952 and 1970 , the pr opor tion of har dwood sup
plied by vari ous ow ner s changed very l ittle (fig . Other
pr ivate ow ner s suppl ied 77 per cen t of har dw ood r ound
w ood , fo r est indu str y 18 per cen t , an d pu bl ic ow n er s the
r em ainder . Because of in cr easing fuelwood and har dwood
pu lpwood consumption , the situation changed between 1970and 1984 . Other pr ivate owner s now supply abou t 72per cen t of har dwood r oundwood , for est indu stry 22 per cen t ,and public owner s 6 per cen t (table
Hardwood supplies ar e pr ojected to in cr ease 68 per cen t by2020 , then dec l ine sl igh tly . By own er sh ip , in cr eases ar epr ojected to be lar gest for n ational for ests, other in dividu al s,and corpor ate owner s. Har dwood r oundwood suppl ies fr omthe farm er ow n er sh ips w i l l in c r ease an d then dec l ine ,
concom itan t w ith acr eage decl ines. Append ix tablesshow the h istor ic tr ends in har dwood suppl ies by
owner sh ip , a lon g w ith the pr ojection s, by r egion and State .

(app . tables and Although the tr end i n totalhar dw ood r oundw ood supp l ies w as fair ly flat du r in g th isperi od ,
ther e wer e substan tial changes in outpu t by pr oduct .
Du r in g m ost of th is per iod , the p r odu c t ion of h ar dwood
lumber , floor ing ,r a i lr oad ties and t im ber s, ven eer , pl y
wood , cooper age ,and fuelw ood tr ended dow nw ar d . Lar ge
in cr eases i n the pr odu ction of h ar dwood pu lpw ood an d
pal let stock just abou t offset those dec lines. Tow ar d the end
of th is per i od , the pr oduct ion of har dwood fuelwood tu r n edback up in respon se to lar ge in cr eases in the costs of m iner alfuels.
Between 1976 and 1984 , the annu al h ar vest of har dw oodr oundw ood fr om the r egion in cr eased 48 per cen t , pr im ar i ly
It seem s c lear that the Sou theast i s at the th r eshold of a
m ajor incr ease in dem ands on the har dwood timber r esour ce .
T ab le — H ar dw ood r oundw ood suppl ies,
ltim ber r em ovals,
2n et annual gr ow th ,
and inven tory of har dw ood grow ing stock in the Sou th ,
by ow ner sh ip , selected year s 1952—84 , w ith projec t ions
3to 2030
M i l l ion cub ic feet
Pr oject ions3
534 57 1 568 587
605 569 564 580
707 7 35 532 447
7 19 889 953 932 .
818 894 951 924
885 630 572
bec au se of a twofo ld in cr ease i n fu elw ood pr odu c t ion .
Pu lpw ood and fuelw ood su rpassed saw logs as the lead in ghar dwood pr oducts in the r egion . In 1984 , pu lpwoodaccou n ted for appr oxim ately 34 per cen t of a l l har dwoodr ou ndw ood supplies, fo llowed by fuelw ood (3 3 per cen t) ,saw logs (29 per cen t) , and veneer logs (3 per cen t) . Other
pr ivate lands pr ovide 76 per cent of the har dw ood suppl ies,down fr om past year s (app . table Upland har dwoodstan ds r eplaced bottom land hardwood stands as the lead in gsou r ce of supp l ies (app . table Nor th C ar o l in a and
Vir gin ia wer e the lead in g State supplier s (fig .

T ab le — H ardwood roundwood suppl ies, 1 tim ber r em ovals,2 net annual gr ow th , and inven tory of hardwood gr ow ing stock in the South ,
by owner sh ip ,selected year s 1952
—84 , w ith pr oject ions3to 2030—Con t inued
M i l l ion cub ic feet
Pr oject ion s3
903
T otal other pr ivateRoundwood suppl iesI
T imber r em ovals2
Net ann ual growthInven tory4Al l owner sh ipsRoundwood suppl ies
l
T im ber rem ovals2
Net annual gr owthInven tory4Inc ludes r ou ndwood harvested from gr ow ing stock and other sou r ces tr ees; rough and r otten tr ess; and
for est land other than tim ber land , in fence r ows, and in u rban areas.
2 Inc ludes remOvals in the form of r ou ndwood pr oducts, logg ing r esidues, the vol um esof t im ber r emoved in cu l tu r al oper at ions such as
noncomm er c ial th inn ing , and inven tor y losses r esu l t ing fr om the d iver sion of t im ber l and to other u ses such as cr opland , pastu r el and ,
parks, and urban u ses.
3Al l project ions at equ i l ibr ium pr ices, i .e . , the stum page pr ices at wh ich pr ojected t imber dem ands and suppl ies ar e equal (see append ix
table Data ar e aver ages for 5 year s cen ter ed on the project ion year .
4Data from 1952 and 1962 are as of Decem ber 3 1 . Data for 1970 and al l pr oject ion year s are as of January 1 . Data for 1976 and 1984
are as of January 1 , 1977 ,and January 1 , 1985 .
5 Inc ludes lands under long - term lease from other pr ivate owner s.
6Data for these and other pr ivate owner sh ips ar e not avai lable for the year s 1952 ,
1962 , and 1970 .
Note : Data m ay not add to total s because of round ing .
167

T ab le 3 2 0—H ar dwood roundwood suppl ies,lt im ber r em ovals,
2net annual gr ow th , and inven tor y of har dwood grow ing stock i n the Sou th ,
by forest m an agem en t type , selected year s 1952—84 , w ith pr oject ion s
3to 2030
M i l l ion cub ic feet
Pr oject ions3
700 877
779 879
941 944
Inc ludes rou ndwood harvested fr om gr ow ing stock and other sou r ces such as sa lvab le dead tr ees; r ough and r otten trees; and trees on forest land otherthan t imber land , in fence r ows, and in urban ar eas.
2 Includes rem ovals in the form of roundwood pr oducts, logging r esidues, the vo lum es of timber r em oved in cu l tu ra l oper ations such as noncomm er c ialth in n ing , and inven tory losses resu l t ing fr om the d iver sion of tim ber lan d to other uses such as cropland , pastu reland , parks, and urban uses.
3Al l projections at equi l ibr ium pr ices, i .e . the stumpage pri ces at wh ich pr ojected t imber dem ands and suppl ies are equ al (see append ix tab le Data
ar e aver ages for 5 year s cen tered on the pr oject ion year .
4Data for . l 952 and 1962 ar e as of Decem ber 3 1 . Data for 1970 and al l pr oject ion year s ar e as of January 1 . Data for 1976 an d 1984 ar e as of Januar y 1 , 1977 ,
and January 1 , 1985 .
Note: Data m ay not add to totals because of r ound ing .
168

Billion cubic feet
Al l management types
4952 1 962 1970 1 976“
1 984 1 990 200 0 2020 203 0
Natu ra l p ine
1 952 1 962 1 970 1 976 1 984-
1 990 2000 2020 203 0 1 952 1 962 1 970 1 9 76 1 984 1 990
Up land ha rdwoods
1952 1 962_
1 970 1 97 6 1 984 4990 2 000 2010 2020 203 0
Figu r e— Har dw ood r oundw ood suppl ies i n the Sou th by for est m anagem en t type , 1952—84 , w ith pr oject ions to 2030

Fuelwood— now one of the m ajor uses ofhardwood t imber compr ises 27 percen t ofhar dwood harvests, compar ed w ith 30
percen t for saw logs, and 39 percen t for
pu lpwood .
Constr uction of sever al new or ien ted str and boar d plants inthe r egion has been announced . In add ition , ther e w i l l befu r ther subst itu t ion of har dwood fo r p ine i n pu lp in g andsom e other pr oducts. T he r ecen t incr ease in . fuelwood u sealso seem s likely to con tinue . Between now and the year
2020 , har dwood supp l ies ar e pr ojected to in cr ease tobillion cubic feet annually , 72 per cen t above cu r r en t levels.
Annual suppl ies ar e then pr ojected to level Off .
By owner sh ip , m ost of the pr ojected incr ease in hardwoodsuppl ies com es fr om other pr ivate and public lands. Veryl ittle increase is pr ojected for forest industr y land . Incr easesin har dwood supp l ies ar e pr ojected for each har dwoodm anagem en t type . As the acr eage in natur al pine dec lines,har dwood suppl ies fr om th is type decr ease to abou t one?th ir d of cu r r en t levels by the end of the pr ojection peri od .
Tr en ds i n the Sou th Cen tr a l Reg ion
Total har dwood r ou ndwood suppl ies i n the Sou th Cen tr alr egion wer e stable from the 1950
’
s thr ough the m id 1970 ’
s,
then incr eased r apid ly to 1984 (app . tables and
T he recent tur n ar ound i s due to lar ge increases in hardwoodpu lpwood and fuelwood con sum ption . Har dwood pu lpwoodpr oduction r ose from cords in 1952 to m illioncords i n 1970 , and then dec l ined a b i t befor e r isin g to thecur r en t level of m illion cords. Har dwood fuelwood usedec l ined thr ou gh m ost of the per iod bu t then jum ped from187 m ill ion cubic feet to 308 '
m ill ion cubic feet between1976 and 1984 . Har dwood saw log pr odu ction has fluctuatedm oder ately and i s cu r r en t ly at abou t the sam e leve l as
1952 , bill ion boar d feet . Har dwood veneer productioncon tinues to dec line .
In 1952 , fuelwood compr ised abou t half of al l r oundwoodhar dwood suppl ies. Most was cu t fr om m ixed pinehar dwood , up land har dw ood , an d bo ttom land har dwoodtypes under pr ivate owner sh ip . Pr odu ct ion by State w asgener al ly determ ined by popu lat ion level and for est ar ea .
The m ajor change that o ccu r r ed by 1962 was a big increasein har dwood pu lpwood con sumption . Th is was offset bydecl ines i n the other har dwood pr odu cts. T he pr opor t ionsuppl ied fr om each m an agem en t type changed very litt le .
T he 1970’
s saw fu r ther incr eases in har dwood pu lpwoodcon sum ption and a r ever sal of the downward tr end in saw logpr oduction . Har dwood fuelwood u se w as at i ts lowest pointi n the 2oth cen tu ry . In 1976 , fuelwood totaled 13 per cen tof har dwood pr oduction , saw logs 40 per cen t , and har dwoodpu lpwood 42 per cen t .
T r en ds by State
In 1952 ,Mississipp i , Geor gia , Nor th Car o l in a ,
Arkan sas,
and Tennessee w er e the lead in g Supp lier s of har dwoodrou ndwood .
Co l lect ively , they p r ov ided 58 per cen t of ther egion ’
s total (figs. and app . tables17 1
In r esponse to incr eases in the dem and for hardwood fuelwood and har dwood pu lpwood , har vests r ose by 3 1 per cen tbetween 1976 and 1984 . T he lar gest pr opor t ion of th isincr ease occu r r ed on up land har dwood types owned by other
pr ivate individuals. Fuelwood now compr ises 23 per cen t ofal l har dwood production , saw logs 32 per cen t , and pu lpwood44 per cen t .
Ten nessee leads the Sou th Cen tr al r egion i n the u se of
har dwood fu elwood by a w ide m ar gin , fo l lowed by Missi ssippi , Alabam a , and Ar kan sas. Har dwood fuelwoodcom pr ises a sign ifican t pr opor tion Of har dwood suppl ies inal l Sou th Cen tr al States. Tr ad itional ly abou t 30 per cen t offuelwood supplies or iginate from sou r ces other than gr ow ingstock , such as fencer ow s, wooded pastur es not c lassifiedas tim ber land , and r ough or r otten cu ll trees.
T he incr ease i n har dwood suppl ies pr ojected for the Sou thCentr al r egion is sim ilar to that projected for the Sou theast .
A 64—per cen t r ise is pr ojected w ith m ost of th is incr easeoccu r r ing between now and 20 10 . Most of the incr ease ison other pr ivate land , wher e hardwood supplies ar e pr ojectedto go up by 7 5 per cen t . Most of the add it ion al t im bercom es fr om upland har dwood stands, wher e supp l ies ar epr ojected to m o r e than double .

Billion cubic feet
Geo rg ia
1 952 1 962 1 970 1 976 1984 1 990 2000 20 10
South Ca ro l ina
1 952 1
Figu r e— Har dwood r oundwood supplies in the Sou theast r egion by State , 1952—84 , w ith pr ojections to 2030
172

and 3 65 Betw een 1952 and 1976 , ther e w er e lar geincreases in har dw ood supplies fr om Vir gin ia and Alabam a
,
w ith a sm aller incr ease fr om Texas. Har dwood supp lies fr omm ost of the r em a in ing S tates either decl ined or show ed
little incr ease .
Between 1976 and 1984 , har dw ood supp l ies in cr eased i nevery State , except Arkan sas. T he lar gest incr easesoccu rr ed in Nor th Car olina ,
Vir gin ia ,and Alabam a . In 1984 ,
Vir gin ia ,Alabam a , Nor th Car o lin a , Mississipp i , an d
Tennessee wer e the leadin g suppl ier s, collectively providing63 per cen t of the total .
By 2000 , har dwood suppl ies ar e pr ojected to be h igher thani n 1984 i n each of th e 12 S tates. In actu al vo lum e , the
lar gest in cr eases ar e pr ojected for Georgia , Arkan sas, and
Nor th Car ol in a . Very lar ge per cen tage incr eases ar e pr ojectedin Flor ida and Oklahom a , bu t these ar e r elatively m inorhar dwood States.
By 2030 , five States— Vir gin ia , Nor th Car o l in a , Geor gia ,
Mississipp i , and Ten nessee— ar e pr ojected to supp ly 59per cen t of the har dwood r oundwood . The lar gest per cen tageincr ease i s pr ojected in Geor gia ; the sm allest , in Alabam a .
Althou gh the ou tpu t of r ou ndwood pr odu cts accoun ts for
a sm aller shar e of total ann ual r em ovals of har dw oods thanof softw oods, tr ends i n har dwood r em ovals sti ll fol low a
patter n sim i lar to th at descr ibed for h ar dw ood supp l ies.
Cu r r en tly , m or e than on e - thi r d of the annu al r em oval s ofgr ow ing stock ~in the Sou th i s har dwood .
Sou thw ide Tr en ds
Har dw ood r em ovals ar e p r ojected to in cr ease abou t 46per cen t over the next 35 year s. Th is is lar gely the r esu lt
-
of
incr easin g con sum pt ion of har dw ood fuelwood and pu lpw ood and cont inu in g h igh r ates of l an dclear i ng .
Hardwood r emoval pr ojections ar e not un iform by owner ship
gr oups. Har dwood r em ovals fr om other pr ivate t im ber landis expected to incr ease 56 per cen t , to bill ion cubic feet .
Most of the incr ease is on land owned by other ind ividual s.
In 2030 , tim ber fr om these owner s accou n ts for al m ost 44
per cen t of al l h ar dwood gr ow in g stock r em ovals.
In 1952 ; 45 per cen t of al l har dwood r em ovals cam e fr om
bottom land har dwoods and 3 3 per cen t fr om upland har dw oods (fi g . S in ce then ,
h ar dw ood r em ovals fr omup land har dwood types h ave incr eased to 42 per cen t , andhar dwood r em ovals fr om bottom land har dw oods havedec l in ed to 2 8 per cen t of th e to tal . These tr ends r eflectslower c lear i n g of bottom l and har dw oods and h igher
Hardwood tim ber rem ovals fr om gr ow ing stock in the Sou thstayed at abou t billion cubic feet per year fr om 1952
to 1976 (tables and fi g . In cr easing har dwood fuelwood and pu lpwood consum ption cau sed r em ovalsto go up by 24 per cen t between 1976 and 1984 . Sou thw i de ,
abou t 73 per cen t of al l har dw ood grow ing stock r em ovalsar e u sed for r ou ndwood pr oducts; the r em ainder is attri buted to loggin g r esidue , cu ltu r al pr actices, landc lear i ng ,
or other land - u se chan ges. Cu r r en tly , 53 per cen t of al l
hardwood gr ow ing Stock r em ovals occu r in the Sou th Cen tr alregion and 47 per cen t i n the.
Sou theast .
Gr ow ing stock r em ovals of har dw ood by owner sh ip show
trends that ar e sim i lar to har dwood r oundwood supplytr ends. Owner sh ip pr opor tions chan ged very little between1952 and 1970 (fi g . S ince then , the pr opor t ion of
har dw ood r em ovals fr om for est indu str y tim ber lands hasin cr eased . Cu r r en t ly 7 2 per cen t of h ar dwood r em ovalscom e fr om other pr ivate tim ber land , 2 1 per cen t fr om for est
industr y t im ber land , and 7 per cen t fr om public t im ber land .
T hese pr opor t ions‘
ar e fa ir ly consisten t betw een the SouthCen tr al and Sou theast r egion s.
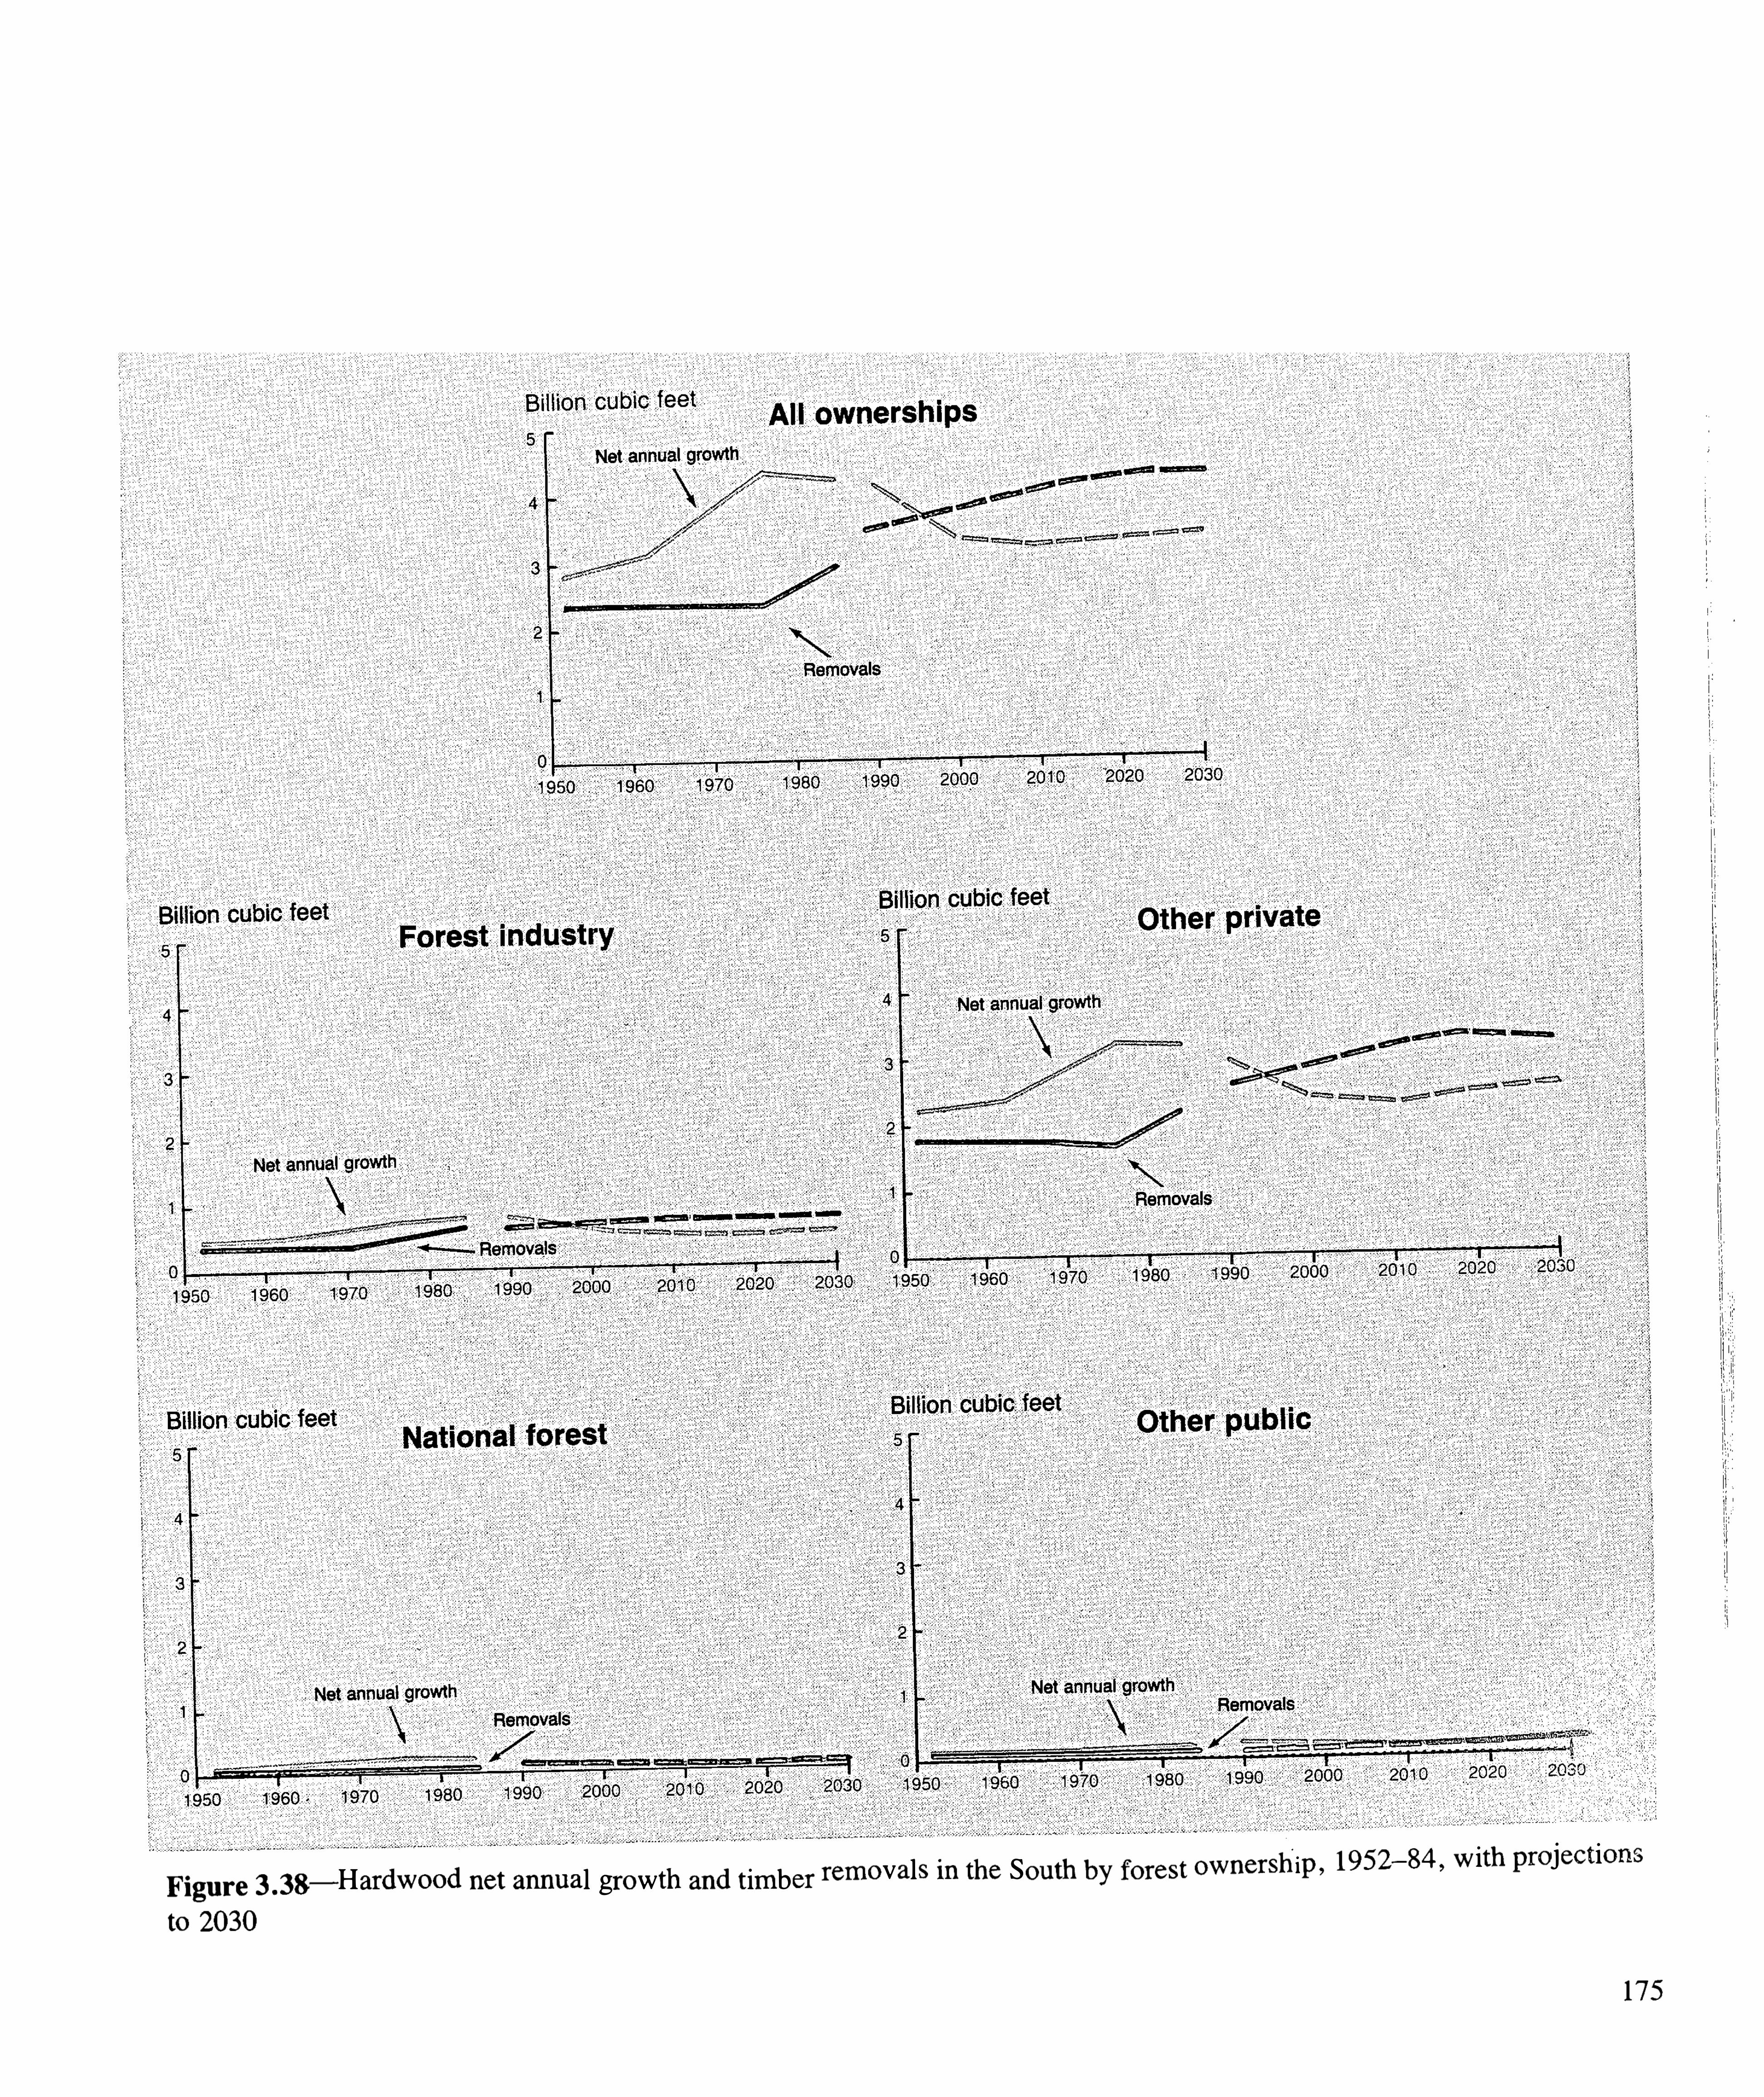
Fi gu r e— Har dwood net annu al gr owth and t im ber r em ovals in the Sou th by for est owner sh ip ,
1952—84 ,w ith pr ojection s
to 2030
175

Bi llion “
cubic feetAl l managemen t types
Net annua l growth
Removals
1 97 0 1 960 1980
Billion cubic feet
Natu ra l p ine
Net annua l growth
Billion cubic feetUp land ha rdwoods
Net annual growth
emovals
2 02 0 1-9 50 1 960
Fi gu r e— Har dw ood net annual gr ow th and tim ber r em ovals in the Sou th by for est m an agem en t type , 1952—84 , w ith
pr ojections to 2030
176

20 1 0 202 0
Figu r e— Har dwood net annual grow th and tim ber r em ovals in the Sou theast r egion by State , 1952—84 ,
w ith pr oject ionsto 2030
178

r em ovals was used for tim ber pr oducts, 13 percen t was leftas unu sed logging r esidue , and the r em ain ing 9 per cen t w asleft unu ti l ized after tim ber land c lear in g fo r nonfor est u se .
These pr opor t ion s h ave no t changed sign ifican t ly since1952 .
Removals fr om grow in g stock that ar e used for tim berpr oducts accoun t for 89 per cen t of al l tim ber supplies. T he
rem ainder com es pri nc ipal ly fr om nongr ow ing- stock sour ces
such as r ough and r otten cu l l tr ees, tr ees that arefou nd on
nonfor est land , and por tions of treessuch as lim bs that ar enot cl assified as gr ow ing stock by for est sur vey standar ds.
Hardwood r em ovals on other pr ivate tim ber land showed
the biggest ga in am on g ow ner sh ip gr oups , espec ia l ly i nTennessee . Again ,
th is reflects the incr eased con sum ptionof har dwood fuelwood . Consisten t w ith th is trend is the bigincr ease i n har dwood r em ovals fr om up lan d har dw oodtypes. By 1976 , har dwood r em ovals fr om up land hardwoodtypes exceeded har dwood r em ovals from bottom land hardwood types. Th is is r elated to activity i n Tennessee , wh ichis cover ed pr im ar i ly by up land har dwoods (fig .
Annu a l r em ovals of har dwood grow ing stock in the Sou thCentr al r egion ar e pr ojected to incr ease 46 per cen t abovecur r en t levels. Most of this incr ease w ill occu r between now
and 20 10 . By owner sh ip and m anagem en t type , the incr easein hardwood r em ovals fo l low s the sam e tr ends descr ibedfor har dwood suppl ies.
T r ends by
‘
State
Gener ally , the h istor ic tr ends in har dwood r em ovals by Statepar al lel those descr ibed for hardwood suppl ies (figs.
and app . tables and 3 65 Du r ing theper iod fr om 1952 and 1984 , ther e wer e su stained upwardtr ends i n har dw ood r em ovals i n Vir gin ia and Texas. In
Ar kansas, har dwood r em ova ls incr eased sharp ly between1952 and 1970 bu t h ave since dec l ined . T he Ten nesseetrends ar e just opposite fr om those in Arkansas. In 1984,
the lar gest am oun ts of har dwood r em ovals wer e in Vir gin ia ,
Nor th Car ol ina , Alabam a , Mississippi , and Geor gia .
179
Because of assum ed impr ovem en t in hardwood u ti lization ,
theper cen tage in cr ease i n har dw ood r em ovals i s less_
i n
every State than the per cen tage incr ease pr ojected i n har dwood suppl ies. Otherw ise , the pr ospectiv ’
e incr ease i nr em ovals by S tate i s sim i lar to the tr ends descr ibed fo rsupp l ies. In term s of vo lum e , the lar gest inc r eases ar epr ojected in Nor th Car o lina , Tennessee , Geor gia , Ar kansas,and Lou isiana . T he sm al lest incr ease i s pr ojected inAlabam a . Pr ojected har dw ood r emovals exceed pr ojectedsoftwood r em ovals i n on ly two States— Vir gin ia and
Tennessee .

1 960 ' 1 9 70 2000 2020
Figu r e— Har dwood net annu al gr ow th and tim ber r em ovals in the Sou th Cen tr al r egion by S tate , 1952—84 , w ith
pr ojections to 2030
180

T ab le — Annual m or tal ity of har dwood grow ing stock ont im ber land in the Sou th , by reg ion and ow ner sh ip , 1952—84
Mi l l ion cub ic feet
Reg ionowner sh ip 1970
Inc ludes m or tal ity on t im ber land leased to for est industry .
Many of the you ng har dw ood stands i n the r egion h avedeveloped fr om har dwood en cr oachm en t on up land sitesfo llow ing the har vesting of pine . Som e of these upland sitesar e no t well su ited for gr ow ing qu ality har dwood saw
tim ber . A fu r ther accum u lat ion of o lder hardwood stands
w ill likely cause an incr ease in m or ta l ity and a decr ease i n
gr ow th .
In 1984 , abou t 76 per cen t of the billion cubic feet ofhardwood gr owth in the Sou theast occur r ed on other pr ivate
Figu r e 3 .42r —Per cen tage change in the num ber of live hardwood tr ees on t im ber land i n the Sou th between the m ost
recen t for est sur veys, by d iam eter c lass
Wh ile the net annual gr ow th of har dwood has beenexceed in g annu al r em ovals and ther e has been a lar gebu ildup i n h ar dwood inven tor ies, ther e i s also a gr ow ingaccum u lation of o lder har dwood stands in the r egion .
Alm ost half of the har dwood stands in the Sou theast ar e over50 year s o ld , and abou t 10 per cen t ar e over 80 year s Ol d .
Many of these older har dwood stands ar e either in ther ugged sou ther n Appalach ian Moun tain s or i n sw amps in
the Coastal P la in . These adver se sites l im it - both them anagem en t and avai labil ity for h ar vest of these stands.
Even in the P iedm on t and on better sites, the absence ofstr on g har dwood m ar kets and low har vests have con tr ibu tedto the bu ildup of o lder stands. Many of these o lder standsshow evidence of per iod ic h igh - gr ad ing in the past .

land . By for est m anagem en t type , 64 per cen t occu r r ed i n
upland hardwood and m ixed p ine—har dwood stands.
Co llectively , oaks accoun t for alm ost 40 per cen t of thehardwood gr ow th in the r egion and gum s, 20 per cen t .
Yel low -
pop lar , a m ajor spec ies th r ou ghou t m ost of ther egion , accoun ts for 16 per cen t of the har dwood gr ow th .
Net annual grow th of har dwood gr ow ing stock in the Sou theast is pr ojected to decr ease fr om bill ion to billioncubic feet , or by 25 per cen t , between now and 20 10 .
Har dwood gr owth is then projected to tur n back up sl ightly ,
toward the end of the pr ojection per i od . Dec lines take placein every owner sh ip c lass except corp or ate and other pr ivate .
No sign ifican t chan ge i s pr ojected in the pr opo r t ion of
hardwood gr ow th between the m ajor hardwood types.
T r en ds in the Sou th Cen t r a l Reg ion
T he m ost r ecen t for est su r veys in the Sou th Cen tr al r egionhave shown a sign ifican t dec line in “
har dwood net annu algr ow th . Har dwood gr ow th r ose stead ily fr om to 1976
and appear s to have r eached a peak between 1976 and
1984 (app . tables and Har dwood in gr owth on
cu tover tim ber land and cr op land and pastu r e r ever sion swere strong up to the m i d 1970 ’
s, and w ith r em ovalsr elatively low , the gr ow ing stock inven tory incr eased .
Between 1976 and 1984 , net annu al gr ow th of har dwood
dec l ined 9 per cen t on o ther pr ivate t im ber land . For est
indu stry t im ber land showed a decr ease of 3 per cen t , and
public tim ber land an incr ease of 3 per cen t .
Hardwood gr ow th i s dec l in in g the m ost on bottom lan dhar dwood types. Har dwood gr owth on up land h ar dwoodtypes is stil l slowly incr easing . Th is incr ease accompan iesa con tinual sh ifting of land to the upland hardwood type fr omtwo sour ces: cr opland and pastu r e r ever sions, and cu toverpine types that ar e not regener ated to pine .
Cur r en tly , about 41 per cen t of an aver age of acr es
of cr opland and pastu r e r ever t ing each year to tim ber landar e classified har dwood du r ing the fir st 10 year s. Som e of
the up land har dwood acr eage sh ifts to oak—pine , n atur alpine , or pine plan tations by abou t age 15 . T he other m ajorsour ce of new hardwood - type acreage , cu tover pine lands,pr ovides an add itional acr es per year , fo r a total
influx of acr es of new har dwood stands annuall y .
Increased hardwood m or tal ity has also con tr ibu ted to thedown tur n i n har dwood gr ow th . Based on r ecen t su r veys,
Tr ends by State
T he pr ojected decr ease i n net annu al gr ow th of har dwoods
between 1984 and 20 10 occu r s in each of the 12 States.
In term s of vo lum e , th e lar gest decr eases ar e pr ojected inNor th Car o lin a , Vir gin ia , Geor gia , Mississippi , Tennessee ,
and Ar kansas— al l impor tan t har dwood States.
Between 20 10 and 2030 , net annu al gr ow th of har dwood is
pr ojected to incr ease aga in i n each of the 12 S tates. In
term s of vo lum e , the lar gest incr eases ar e pr ojected in Nor thCar o lina , Geor gia , Vir gin ia , and Sou th Car o l in a .
183
har dwood m or tality in cr eased by 53 per cen t between 1976and 1984 . In add it ion to m or tality ,
dam age fr om d isease ,
weather , and other destr uctive for ces has cau sed an incr easein the num ber of gr ow in g stock tr ees becom ing r ou gh or
r otten cu l ls. Cu l l incr em en t cau ses a loss of 140 m i l l ioncubic feet annual ly . Losses to m or tal ity and cu ll incr em en tcom bined tota l 634 m i l l ion cubic feet an n u a l ly , n ear lydouble the loss r ate i n 1976 .
T he r ecen t drop i n net annu al gr ow th of har dwood gr ow ingstock in the Sou th Cen tr al r egion is pr ojected to con tinuew ith a decline of 25 per cen t by 20 10 , when the net annu algr ow th of har dwood i s b i l l l on cubic feet . A
'
m odest
uptur n i s then pr ojected back to bil lion cubic feet by2030 . Dec l ines ar e pr ojected i n ever y ow n er sh ip c lassexcept corpor ate . A sm al l decr ease , fr om 47 to 42 per cen t ,
is projected i n the pr opor t ion of har dwood gr owth i n theupland hardwood type .
Between 1952 and 1976 , the gener al incr ease i n net an nu a lgr ow th of har dwood was eviden t i n ever y S tate exceptArkansas, where the tr end has been r elatively flat (figs.
and app . tables and 3 6 5 In
term s of vo lum e , the lar gest increases in har dwood gr owthoccu r r ed i n Vir gin ia and Nor th Car o lina . S ince 1976 , there
have been m easu r ed dec l ines i n har dwood gr ow th in m ostStates.

In con tr ast to the sm a l l m ar gin of softwood gr ow th overr em ova ls i n 1984 , the n et an n u al gr ow th of har dwood
exceeded annual r em oval s of har dwood in the Sou th by 5 1per cen t . With the expected incr eases in har dwood dem andand the decr eases pr ojected i n har dwood gr owth , th is gapw il l c lose very r ap id ly , an d by 2000 , har dwood r em oval sar e pr ojected to exceed h ar dw ood gr ow th by alm ost 10
per cen t . T he defic it r eaches a lm ost 25 per cen t i n 2020
before the gap again begins to c lose .
Most of the pr ojected defic it i n h ar dw ood gr ow th i s onpr i vate lan d . Cur r en tly , the net ann ual growth of har dwood
on public lands is m or e than double the r em ovals. A smal lm ar gin of gr t over r em ovals i s m a in ta ined on these
public lands u n t il the end of the pr ojection per iod . By
m an agem en t type , the har dwood grow th defic it fir st showsup i n the pine and m ixed pine—har dwood types. Next , i tshow s up in the bottom land har dw ood type . A har dwoodgr ow th defic it does not develop i n the up lan d har dw oodtype un ti l 20 10 .
Cur r en tly , the m ar gin of har dwood gr ow th over r em ovals ism uch sm al ler i n the Sou th Cen tr al r egion than in theSou theast . T he har dwood gr owth defic it also developssooner in the Sou th Cen tr al r egion than in the Sou theast .
Althou gh m any people per ceive the Sou th as pr im ar i ly a
softwood t im ber r egion , the inven tory of har dwood grow ingstock exceeds the inven tory of softwood gr ow ing stock by17 per cen t . Becau se of a lar ge qu an t ity of har dwood i n
tr ees that fail to qual ify as gr ow in g stock becau se of spec ies,poor form , or excessive rot , the d iffer en ce i s even lar gerwhen the vo lum es in al l l ive trees ar e com par ed . In al l l ivet im ber , volum e of har dwood exceeds vo lum e of softwood
by m or e than 30 per cen t .
T he m er chan tability standar ds for har dwood gr ow ing stockar e the same as those descr ibed ear l ier for softw ood , exceptfor the m in im um d iam eter s for saw t im ber . For har dwood
saw tim ber tr ees, the m i n im um d iam eter at br east height isin ch es, an d the m in im um saw log top i s in ches
ou tside bark .
Sou thw ide T r ends
T he inven tory of hardwood gr ow ing stock r ose by 52 per cen tbetween 1952 and 1985 (tables and fig .
T he r ate of incr ease w as faster i n the Sou theast than theSouth Cen tr al r egion . T he steady incr ease r esu lted fr om a
lar ge excess of gr t over r em oval s that has been sustai ned
th r ou ghou t the per iod . In 1984 , the r at io of har dwood
gr ow th to r em ovals was
T he pr ojected inven tory of hardwood gr ow in g stockincr eases to 128 billion cubic feet i n 2000 , then dec l ines to106 billion cubic feet in 2030 . T he decr ease is pr ojectedto be m uch lar ger i n the Sou th Cen tr al r egion than i n theSoutheast . Th is r eflects sign ifican tly h igher r em oval s andslower net ann ual gr owth .
In the pr ojection s by owner sh ip , har dwood inven tor ies onlands owned by for est industr y and other ind ividualsincr ease thr ough 2000 and then dec l ine . Har dwood gr ow ingstock vo lum e on public tim ber land r ises thr oughou t the
Other pr ivate owner s con tr o l 7 3 per cen t of the har dwoodr esour ce . S ince 1952 , gr ow in g stock vo lum e of har dwoodson th is owner sh ip c lass has incr eased by 43 per cen t ,compar ed w ith 65 per cen t for for est industr y lands and 126per cen t for public ly owned land (fig . On ly par t ofthe d iffer en ce can be expla ined by acr eage trends, wh ichhave been upw ar d for public and forest industry owner s
and dow nward for other pri vate owner s. Tim ber har vestinghas also been influen tia l , a lon g w ith the or igin of m any
upland hardwood stan ds i n other pr ivate owner sh ip . Many
of these stan ds or i ginated on cu tover pine sites and con tai nh igh stockin g of r ough or r otten cu ll trees th at do not con
tri bu te to gr ow in g stock .

pr ojec t ion per iod . T he har dw ood in ven tor y on corpor ate
owner sh ips does no t dec l in e un ti l after 2020 . T he farm er
owned har dwood in ven tor y declines fr om 1990 onw ar d .
S ince 1952 , har dwood gr ow ing stock vo lum e h as n ear lydoubled for the upland har dw ood type , and incr eased by22 per cen t for bottom land har dwoods (fig . Har dw ood
vo lum e has also incr eased for the m ixed p ine—har dw oodand pine types.
Pr ojection s by m an agem en t type show har dwood vo lum epeaking near 2000 for both upland and bottom land har dwood types, then dec l in in g to levels som ewhat below those
i n 1984 . T he h ar dw ood vo lum e i n n atu r al p ine stands
dec lines thr ough the per iod , wh i le i n plan tations, har dwoodvo lum e incr eases. In m ixed p ine—har dwood stands, har d
wood inven tory dec lines un til 20 10 and then incr easesslightly . Som e of these differ ences cor r espond w ith acreagetr ends. S ince p ine p lan tat ion s car r y m uch less har dwoodvo lum e , on the aver age , than n atu r al pine stands, an incr easei n th is type wou ld no t have m u ch effect on the over al lh ar dwood inven tory .
Ther e ar e impor tan t r egion al and local d iffer ences in thehar dwood tim ber r esour ce . Factor s that var y w ith localityand m anagem en t type in clude stand h istory , site quality , and
cu ll - tr ee stockin g . Species composition , tim ber quality and
d im ensions, and site factor s that m ay lim it tim ber availabilityare also qu ite var iable acr oss the Sou th . Thus, despite an
over all favor able gr ow th - to - r em ovals balance , the hardwood
inven tory situat ion m ay be cr itical for som e user s of h ighquality tim ber of pr efer r ed spec ies and adequ ate for other swho use sm all , lower qu al ity . tr ees.
In gener al , m or e of the har dwood in ven tory is in lar ge tr eeswhen compar ed to the softwood inven tory . For examp le ,
m or e than 35 per cen t of the vo lum e of har dwood grow ingstock i n the Sou th i s i n tr ees in ches an d lar ger i ndiameter at br east height . On ly 25 per cen t of the softwoodin ven tory i s i n these lar ger tr ees. With the agin g of the
har dwood stands, ther e is also a tr end tow ar d lar ger tr eesin the in ven tory (fig .
In con tr ast to the softw ood inven tory vo lum e , wher e a singlespecies, loblolly p ine , accou n ts for alm ost half the vo lum e ,
the inven tory of har dwood is m or e even ly d istri bu ted am onga num ber of spec ies (fig . Co l lec t ively , the oaks
accoun t for abou t 43 per cent of the har dwood inven tory , and
gum s accoun t for another 22 per cen t .
186
Tr en ds i n the Sou theast
Althou gh near ly al l of the in ten sive tim ber m an agem ent inthe Sou theast has been tar geted tow ar d gr ow ing m or e soft
wood , the in cr ease i n har dwood inven tori es has exceededthat of softwood . S ince 1952 , the inven tory of har dwood
gr ow ing stock has incr eased fr om bill ion to billioncubic feet , or by 67 per cen t (app . tables and
In the absence of in ter ven tion by hum ans,_
the natur alsu ccessional tr end over m ost of the r egion is tow ar d har dwood . Most concer n s abou t hardwood in ven tor ies ar e not
abou t quan tity bu t abou t qual ity and ava i labil ity .
Abou t 20 per cen t of the har dw ood t im ber in the r egionoccu r s on sites w ith year - round w ater pr oblem s or on slopesof 40 per cen t or steeper . In add ition to the d ifficu lty and
h igh cost of logging these sites, ther e ar e m any envir onm en tal concer n s assoc iated w ith these ar eas. Another factoraffecting har dwood avai lability is the m ixtu r e of so m any
d iffer en t spec ies in m any har dwood stands. Har dwood pr o
ducer s ar e often faced w ith the problem of har vesting andm ar ketin g lar ge qu an tities of less desir able spec ies in thepr ocess of har vesting cer ta in select spec ies. Many of the
older har dwood stands r eflect a h istory of per iod ich i ghgr ading .
Th e r apid increase in hardwood inven tori es over the past 30year s is not expected to con t inue . Becau se of the low use
of har dwoods r elative to softwoods, the age d istri bu tion of
hardwood stands is skewed tow ar d the Older c lasses. Recent
for est sur veys in Nor th Car o l ina , Vir gin ia , and Sou th
Car o l ina m easur ed r eduction s in the num ber of sm al ld iam eter har dwoods. Even tual ly , r eductions w il l be noted inhar dwoods of lar ger diam eter s. Wh ile som e analysts bel ievehar dwood substitution is the an swer to softwood scar c itiesencou n ter ed in the region , other s ar e skeptical of th is idea .
A perm anen t sh ift to gr eater dependence upon har dwoods
wou ld cer tam r equ ire better m anagem en t of the hardwoodstands than per iod ica l ly m in in g the best of the avai labletim ber .
By owner sh ip , 75 per cen t of the in ven tory of har dw ood
grow ing stock is on other pr ivate lan d . T he r em ain inginven tory is r oughl y even ly d ivided between for est industryhold ings and public lands. By for est m an agem en t type , 63
per cen t of the har dwood in ven tory i s in up land har dwoodand m i xed pine—hardwood stands. In 1952 , on ly about hal fof the har dwood in ven tor y w as in these types, an d alm ost40 per cen t w as in bottor rrland har dwood stands. Cu r r en tly ,
abou t 6 per cen t of the har dwood inven tory i s in har dwoodtr ees scatter ed am ong the p ine types.

Figu r e inven tory Sou th m anagem en t type , 1952—85 , w ith pr oject ions 2036

Percent of tota l
Diameter c lass
(diameter - b reast- height in inches)
Figu r e— Per cen tage d istri bu ti on of har dwood gr ow ing stock on t im ber land in the Sou th , by d iam eter c lass,
1977 and 1985
“
Sweetgum'
Other gums
Other ha rdwoods
Other fired oaks
Se lect wh ite oaks
Se lect red . oakswh ite oaks
Figu r e — Per cen tage d istri bu tion of har dwood gr ow ingstock on timber land in the Sou th , by spec ies, 1985
188
Becau se of the lar ge con cen tr at ion of har dwoods in the
sou thern Appalach ian Moun tains, Nor th Car o l in a andVir gin ia ar e the lead ing States in har dwood in ventory (fig .
app . tables and Each_
of these
S tates h as m o r e th an 17 bil l ion cub ic feet of h ar dw oodgr ow in g stock .
Co l lect ively , oaks accoun t for 40 per cen t of thecu r r en t
inven tory of hardwood grow ing stock ; gum s, 23 per cen t ; and
yellow -
pop lar , 12 per cent . Hickory , ash , and other har d
textu r ed species account for 12 per cen t . Red m aple and othersoft - textu r ed spec ies m ake up the r em ain i ng 1 3 per cen t .
A fu r ther incr ease of 6 per cen t in the in ven tory of har d
w ood gr ow ing stock is pr ojected for the Sou theast between1985 and 2000 , befor e the tr end tu rn s dow n . Much of th isin cr ease occu r s on other pr ivate land , pr im ar i ly in thecorpor ate and other in d ividual categor ies. In fact , the bu i ldupi n h ar dwood in ven tor ies i n these tw o ow n er categor iescon tinues beyond 2000 . On public land , har dwood inven

Billion cubic feet
1952 1 962 1 970 1 977 1985 1 990 2000 20 1 0 : 2020
Geo rg ia
1 952 1 962 1 9 70 1 977 1995 1 990 . 2000 201 0 2020 203 0 1 970'
. 1 977
South Ca rol ina
1952“
1 962" 1 970 197 7 1985
I
1990 20 1 0 2020
Fi gu r e— Har dwood in ven tor y in the Sou theast r egion by State , 1952—85 , w ith pr oject ions to 2030
190

aging of m any stands (total up land har dwood acr eage havingbeen qu ite stable at r ough ly 34 m il lion acr es) . T he bottomland hardwood inven tory has, over the long term , incr easeddespite a loss of 20 per cen t of the acr eage pr esen t in 1952 .
Aver age vo lum e and tr ee d iam eter s h ave bo th in cr easeddu r ing th is per iod .
T he har dwood situation is actu ally m uch m or e comp lexthan ind icated by these summ ar y stat istics. Upland har dwoods i n the in ter ior r egion s of Tennessee and Arkansas
have developed d iffer en tly fr om upland har dwoods in theCoastal P lain States (fi g app . tables and
3 65 Coastal Plain upland har dwoods tend to occupy
cu tover pine sites and ar e i n poor er cond ition than har dwoods in the in ter ior , wh ich have been per iod ical ly h ighgr aded bu t rem ain less d istu r bed over all . A r ecen t su r veyin Lou isiana showed that the aver age har dwood basal ar eaof upland hardwood types declined fr om squ ar e feetper acr e in 1974 to squar e feet per acr e i n 1984 . In
con tr ast , the data fr om Ten nessee sur veys i n 1970 and
1980 show the aver age hardwood basal ar ea Of up landhar dwood types incr easing , fr om to squ ar e feetper acr e . Du r ing the sam e per iods, stocking of r ough and
r otten up land har dwoods in Lou isiana incr eased fr om 37
per cen t to 40 per cen t of al l l ive - tr ee basa l ar ea , an d i n
Tennessee , the sam e component incr eased fr om 26 to 28
per cen t .
Bottom land har dwoods in Lou isiana ar e m uch‘
better
stocked th an upland har dwoods. Aver age stocking of har dwood gr ow in g stock tr ees is squar e feet per acr e . T he
differ ence between bottorrr l and and upland har dwoodstocking is less pronounced if softwood stocki ng is includedw ith the upland har dwood basal - ar ea aver ages. Softwood
stocking on upland har dwood types in Lou isiana w as abou t10 squar e feet per acr e i n 1974 and 8 squar e feet per acr ein 1984 . Rough and rotten cu ll stocking on bottom land typesin Lou isiana has incr eased in a compar able way to rncr eases
on upland har dwood types, fr om 34 per cen t to 3 8 per cen t
of al l l ive- tree basal ar ea .
In term s of vo lum e , the tr end has been tow ar d h ighergr ow ing stock vo lum e , espec ially am on g lar ger d iam eterclasses. T he m ost recen t sur vey i n Lou isiana showed
dec l ines i n har dwood vo lum es i n the 6 - inch and 8- in chc lasses. Dec l in in g ingr ow th coupled w ith incr easing cu l lvo lum es for etel l futu r e vo lum e dec l ines as r em ovals beginto exceed gr ow th .
In add ition to differ ences by type and r egion , har dwoods
ar e much m or e var i able in qu ality than softwoods for di f
feren t spec ies an d in differ en t localities. Har dwood pr oducer s
In gener al , the upland hardwood stands in
T ennessee and Arkansas are i n bettercond it ion than those in the Coasta l P l ainS tates i n the Sou th Cen tr a l r eg ion . T h issituat ion r eflects past cu tting pr act ices:stands in the upland States have been lessd istu rbed .
T r en ds by State
In 1952 , the inven tor y of har dwood gr ow in g stock in theSou th exceeded the inven tory of softwood i n al l bu t thr ee
States: Flo r ida ,Geor gia , and Texas (figs. and
app . tables and S ince ‘
1952 , the
19 1
ar e subject to loca l r esou r ce var iat ion s. The ir con cer n sinvo lve not on ly quality and location bu t availabil ity as well .Har dwood avai lability i s lim ited by a num ber of factor s,in c lud in g accessib i l ity , own er sh ip , locat ion , site , and a
tendency for desir ed spec ies to be scatter ed am ong standsdom in ated by other spec ies. Th is r esu lts in a situation i nwh ich statistics show m or e volum e i n the for est than m ayactually be available for har vest . Thus the hardwood supplysituation becom es cri tical well befor e gt t and r em ovalscom e in to balance .
A fu r ther incr ease of 10 per cen t i n the inventory of'
har d
wood gr ow ing stock is pr ojected for the Sou th Centr al r egionbetw een 1985 and 1990 . Du r in g th is per iod , har dwood
inven tor ies incr ease in al l owner c lasses, except corpor ate .
By m an agem en t type , the lar gest incr ease occu r s in the
bottom land har dwood type , where inventor ies incr ease by 28per cen t . Beyond 2000 , har dwood inventor ies in the Sou thCen tr al r egion tur n down very shar ply , dr opping 28 per cen tby 2030 .

1985.
-
1 99 0-
2000'
20 10 202 0 203 0
1 952 ' 1 962 1 9 70 1 977 1 985 1 990 2000“
201 0 2 020 203 0 1 952 . 1 962 1 970 1977 1 985 1 990 2000 201 0 2020 3 2030
=1 952'
1 962 -1970 ; 1 977 . 1 985 ' 1 9 90 " 2000; 2 01 0 Vl
f n
'
1 952 1 962 . 1 97 0 1 977 . 1 985“
1 990 2 000“
2 0 10 202 0 - 52930'
Figu r e — Har dwood in ven tory in the Sou th Cen tr al r egion by S tate , 1952—85 ,w ith pr ojection s to 2030
192

Abt , Rober t C . 1987 . A top- down appr oach to model ing State forest
gr ow th , rem ovals and inven tory . SCFER Work . Pap . 36 . Resear chT ri angle Park, NC : Sou theaster n Cen ter for Forest Econom icsResear ch . 25 p .
Adam s, D.M H ayn es, R .W. 1980 . T he 1980 softwood t imberassessmen t m ar ket m odel : str uctu r e , project ion s, and pol icy sim u lat ions.
For . Sc i . Monogr . 22 . Bethesda , MD : Soc iety of Am er ican For ester s.
64 p .
A l i g , R.J . 1986 . Econom etr ic anal ysis of for estacr eage tr ends i n theSou theast . For est Sc ience . 32 : 1 19—134 .
Al ig , R .J . 1985 . Model ing acr eage changes in for est ow ner sh ips andcover types in the Sou theast . Res. Pap . RM—260 . Fort Col l in s, CO: U .S.
Departmen t of Agr icu ltu re , Forest Ser vice, Rocky Moun tain Forest andRange Exper imen t S tation . 14 p .
Al ig, R .J . ; Wyan t , J .G. 1985 . Project ing regional ar ea chan ges in for estland cover in the U .S .A . Eco log ica l Model ing . 29 : 27—34 .
Bi r dsey , R .A Mcw i l l iam s, W .H . 1986 . For est ar ea tr ends in the Mid
sou th . Resour . Bu l l . SO—107 . New Or leans, LA : U .S . Depar tm en t of
Agr icu l ture , Forest Service , Sou thern Forest Experi m en t Station . 17 p .
Boyce, S.G. ; Kn i gh t , H .A. 1979 . Pr ospective ingrow th of souther n pinebeyond 1980 . Res. Pap . SE—200 . Ashevi l le , NC : U .S. Depar tm en t of
Agr icu l tu r e , Forest Service , Sou theastern Forest Exper im en t Station . 50
p .
Boyce , S.G. ; Kn i gh t , ILA . 1980 . Pr ospec t ive ingr ow th of sou ther n
hardwoods beyond 1980 . Res. Pap . SE—203 . Ashevi l le , NC : U .S .
Departm en t of Agr icu l tu r e , For est Service, Sou theaster n ForestExper im en t Station . 33 p .
C lephane, T .P . 1978 . Ow ner sh ip of tim ber : a c ri tical componen t ofindustr i al success. Forest Industr ies. 30—32 .
Coun c i l of Econ om ic Adviser s. 1986 . Econom i c repor t of the Pr esident .
Wash ington , DC : Counc i l of Econom ic Adviser s. 378 p .
Fecso , R .S. ; Ka iser , H .F . ; Royer , J .P . ; We i den ham er , M . 1982 .
Managem en t pr act ices and r efor estat ion dec isions for harvested sou ther n
p inelands. Staff Repor t AGE582 1230 . Wash ington , DC : U .S .
Depar tmen t of Agri cu l tu re , Statist ical Report ing Service . 74 p .
H ea ly, R .G. 1985 . Competit ion fOr lan d in the Am er ican Sou th :agr icu l tu re , hum an sett lem en t , and the envir onm en t . Wash ington , DC:
T he Con servation Foundation . 334 p .
Kn igh t , H A . 1985 . Sou ther n U .S . t imber suppl ies. In : Proceed ings of3d Nor th Am er ica in ter n ation al in st itu te for app l ied system s network
meeting ; 1985 Mar ch 2 1—23 ; Victor ia , BC . Vancouver , BC : Un iver sityof Br it ish Co lum b ia: 27—37 .
La r son , R .W . ; Gofor th , M .H . 1974 . TRAS : a t im ber vo lum e pr ojectionm odel . T ech . Bu l l . 1508 . Wash ington , DC : U .S. Depar tm en t of
Agr icu l tu re , For est Service . 15 p .
McClur e, J .P . ; Kn i gh t , H A . 1984 . Empi r ical yiel ds of tim ber and forestb iom ass i n the Sou theast . Res. Pap . SE—245 . Ashevi l le , NC : U .S .
Departmen t of Agr icu l tu re , Forest Service , Sou theaster n ForestExper im en t Stat ion . 75 p .
Mou l ton , Rober t J Dicks, Mi ch ael R . 1987 . Impl icat ions of the 1985Farm Act for for estry: the sleepi ng g ian t . In : Proceed ings of the 1987jo in t meet in g of the Sou ther n For est Economi cs Worker s and the
M idwest For est Econom ists, T he Blue and the Gr ay; 1987 Apr il 8—10 ;Ashevil le ,
NC . Ral eigh , NC : Nor th Car ol ina State Un iversity: 163—176 .
O’Lau gh l in , J Ell efson , P .V . 1982 . New d iver sified en tr an ts am ongU .S. wood- based com pan ies: a study of econom ic str uctu r e and corpor atestrategy . Bu l l . 541 . St . Pau l , MN : Un iversity of Mi nnesota, M innesotaAgr icu l tu r al Exper im en t Stat ion . 63 p .
Royer , J .P . 1985 . T he effects of m ar kets an d publ ic po l ic ies on ther eforestation behavior of sou ther n landow ners. Work . Pap . 12 . Resear chT ri ang le Par k , NC : Sou theaster n Cen ter for For est Econom ics Resear ch .
6 1 p .
Shef fiel d , R .M . , and other s. 1985 . P ine grow th r educt ions in theSou theast . Resour . Bu l l . SE - 83 . Ashevi l le , NC : U .S. Depar tm en t of
Agr icu l tur e , For est Service , Sou theaster n Forest Exper im en t Station .
1 12 p .
T edd er , P .L . ; LaMon t , Ri ch a r d M . ; K i n cai d , Jon n a C . 19 87 . T he
tim ber resource inven tory m odel (TRIM ) : A projection m odel for timbersupply and po l icy an a lysis. Por tland , OR: U .S. Departm en t of
Agri cu l tu r e , For est Service ,Pac ific Nor thwest Forest and Range
Exper im en t Stat ion . 82 p .
U.S. Depar tm en t of Agr i cu l tu r e, Soi l Conser vat ion Ser vi ce. 1982 . 1980
Appraisal : so i l , water , and related resou r ces in the Un ited States. Par t
1 : S tatu s, cond it ion , and tr ends. Par t 2 : An al ysis of r esou r ce tr ends.
Wash ington , Depar tm en t of Agr icu l tu r e , So il Conservat ionService . 328 and 296 p .
U.S. Depar tm en t of Comm er ce, Bu r eau of th e Cen su s. 1966 . H ou singconstr uct ion statistics 1889 to 1964 . Wash ington , DC : U .S. Depar tment
of Comm erce , Bu r eau of the Census. 805 p .
U .S. Depa r tm en t of Com m er ce, Bu r eau of th e Cen su s. [Mon th l y . ]H ousing star ts. Constr . Reps. Ser . C20 . Wash ington , DC : U .S.
Departmen t of Comm er ce , Bur eau of the Census.
U .S. Depa r tm en t of Comm er ce, Bu r eau of th e Censu s. 1985 . Popu lationestim ates and pr ojections: est im ates of the popu lation of the Un itedStates and componen ts of change: 1970 to 1984 . Cur r . Pop . Reps. Ser .
P - 25 , No . 97 1 . Wash ing ton , DC : U .S . Depar tm en t of Comm er ce ,
Bureau of the Census. 15 p .
U .S. Depar tm en t of Com m er ce, Bu r eau of the Census. 1986 . Popu lationest im ates and pr ojections: est im ates of the popu lat ion of the Un itedStates to May 1 , 1986 . Cu r r . Pop . Reps. Ser . P - 25 , No . 989 .
Wash ington , DC : U .S. Depar tment of Commer ce , Bu reau of the Census.

U.S. Depar tm en t of Comm er ce, Bu r eau of the Cen sus. 1979 .
Popu lat ion estim ates and pr oject ions: estim ates of the popu lation of the
Un ited States and com ponen ts of change: 1940 to 197 8. Cu r r . Pop .
Reps. Ser . P- 25 , No . 802 . Wash ington , DC: US . Depar tm ent of
Commerce , Bu reau of the Censu s. 14 p .
U .S. Depa r tm en t of Comm er ce, Bu r eau of the Censu s. 1984 . Popu lationestim ates and pr ojections: projections of the popu lation of the Un itedStates, by age , sex , and r ace: 1983 to 2080 . Cu r r . Pop . Reps. Ser . P- 25 ,
No . 952 . Wash ington , DC: U .S. Department of Comm er ce, Bu reau of
the Censu s. 175 p .
Whar ton Econ om etr i c For ecast in g Associ ates. 1986 . Long - term
alter native scenari os and 20 -
year extensi on . Vo l . 4 , No . 1 . Ph iladelph iaWhar ton Econometr ic Forecast ing Assoc iates. 358 p .


T he m ater ial i n the pr eced ing chapter quan t ified and de
scr ibed the kinds of chan ges in the tim ber r esou r ce— the
base pr ojections— that ar e l ikely to take place i f cu r r en t expectations abou t m ajor dem and and supply determ i n an ts ar er ealized . Tim ber is a basic r aw m ater ial i n the Sou th and
in the Nation , and the projected changes in the r esou r ce haveimpor tant r egional and n ation al econom i c and envi r onm en
tal im pacts. T he m ost sign ifican t of these ar e descr ibed i nth is chapter .
T he d iscussion of im pacts is fo llowed by a d iscussion of
som e of the effects that changing the basic dem and and
supply assumption s w ou ld have on the base pr ojectionsdiscussed i n chapter 3 . Som e of these sim u lations of otherfu tur es ar e sen sitiv ity analyses designed to show what w ou ldhappen given differ en t assumptions on tr ade or tim ber pr oduet yields. Most , however , ar e designed to show what wou ldhappen to the tim ber r esou r ce and the assoc iated part s ofthe economy and envir onm en t u nder vari ous po l ic ies,pr ogr am s, and legislation cu r r en tly bein g con sider ed . The r e
su l ting m easu res of changes in the tim ber r esour ce and the
associated changes i n pr ices, employm en t , w ages andsalar ies, and other econ om ic and envir onm en tal m easu r esprovide a quan titat ive basis for m ak in g decision s abou t legislat ion and for est po licies and pr ogr am s.
Saw tim ber an d Pu lpwood Stum page P r ices
Am ong the econom ic con sequen ces of the pr ojectedbase - level ch an ges i n the t im ber r esou r ce ar e r isin g r ealpr ices of stum page— pri ces net of inflation or deflat ion .
Ther e ar e substan tial incr eases in softwood sawtimber stumpage pr ices (fi g . app . tables an d Pri ce in
cr eases in the sou ther n r egions ar e the lar gest between 1984and 2000 , a tim e in wh ich softwood t im ber inven tor ies ar e
T he base pr ojection s of r esou r ce chan ges pr esen ted inchapter 3 w i ll influence saw tim ber and pu lpwood stumpagepr ices, lum ber and plywood pr oduction , pu lpwoodconsumption , lum ber pr ices, softwood lum ber im por ts, andemploym en t and w ages and salar ies in for est indu str ies.
T he pr ojections w i ll also affect in vestm en ts in for estm anagem en t and p lan ts and equ ipm en t , S tate an d localgover nm ent r evenues, for age ,
w i ldlife , fish , and“
w ater . T he
changes in these econom ic an d envir onm en tal m easu r es ar eimpor tan t by them selves, bu t they also pr ovide a basis forcompar ison w ith chan ges r esu ltin g fr om sim u latin g otherfu tu r es, espec ial ly those con cer ned w ith legislation and pol icies and pr ogr am s.
Because of l im ited data and assoc iated analyticalpr oblem s, m any of the estim ates quan t ifying the econom icand envir onm en ta l im p lications of the base pr ojections andthe sim u lations ar e onl y gener al appr oxim ation s. They ar e ,
however , the r esu lt of a str uctu r ed effor t to com p i le and
analyze the existing data . They shou ld pr ovide br oad m easu r es of the m agn itudes of chan ge and of the d iffer enceam ong sim u lations, both of wh ich w il l be usefu l toexecu tives, legislator s, and adm in istr ator s who m ake decisions abou t legislation and for est pol icies an d pr ogr am s.
Reader s need to keep i n m i nd also th at base pr ojectionsar e the pr odu ct of a level of tim ber land m anagem en t thatis m uch m or e in ten sive than that pr acticed today . By 2030 ,
the ar ea in pine plan tations in the Sou th is near ly doubled ;lar ge ar eas of m i xed p ine—hardwoods and upland har dwoodsar e conver ted to pin e . Plan ting or conver sion of these ar eas
to pine wou ld r equ ir e investm en ts of billion , m ost of
i t invested w ith in the next 15 year s. Substan tial incr easesin tim ber yields and in the in ten sity of m an agem en t wer ealso assum ed for lar ge ar eas of pine plan tations. Thus, thebase projections r eflect what wou ld happen if ( 1 ) for estr y inthe Sou th con tinues to pr ogr ess, and (2 ) ther e is con t inuedexpansion in the techn ical and fi n anc ial assistan ce ,
protection , r esear ch , edu cation , and m anagem en t pr ogr am s
that have br ough t abou t the impr oved for estr y situation inthe past .
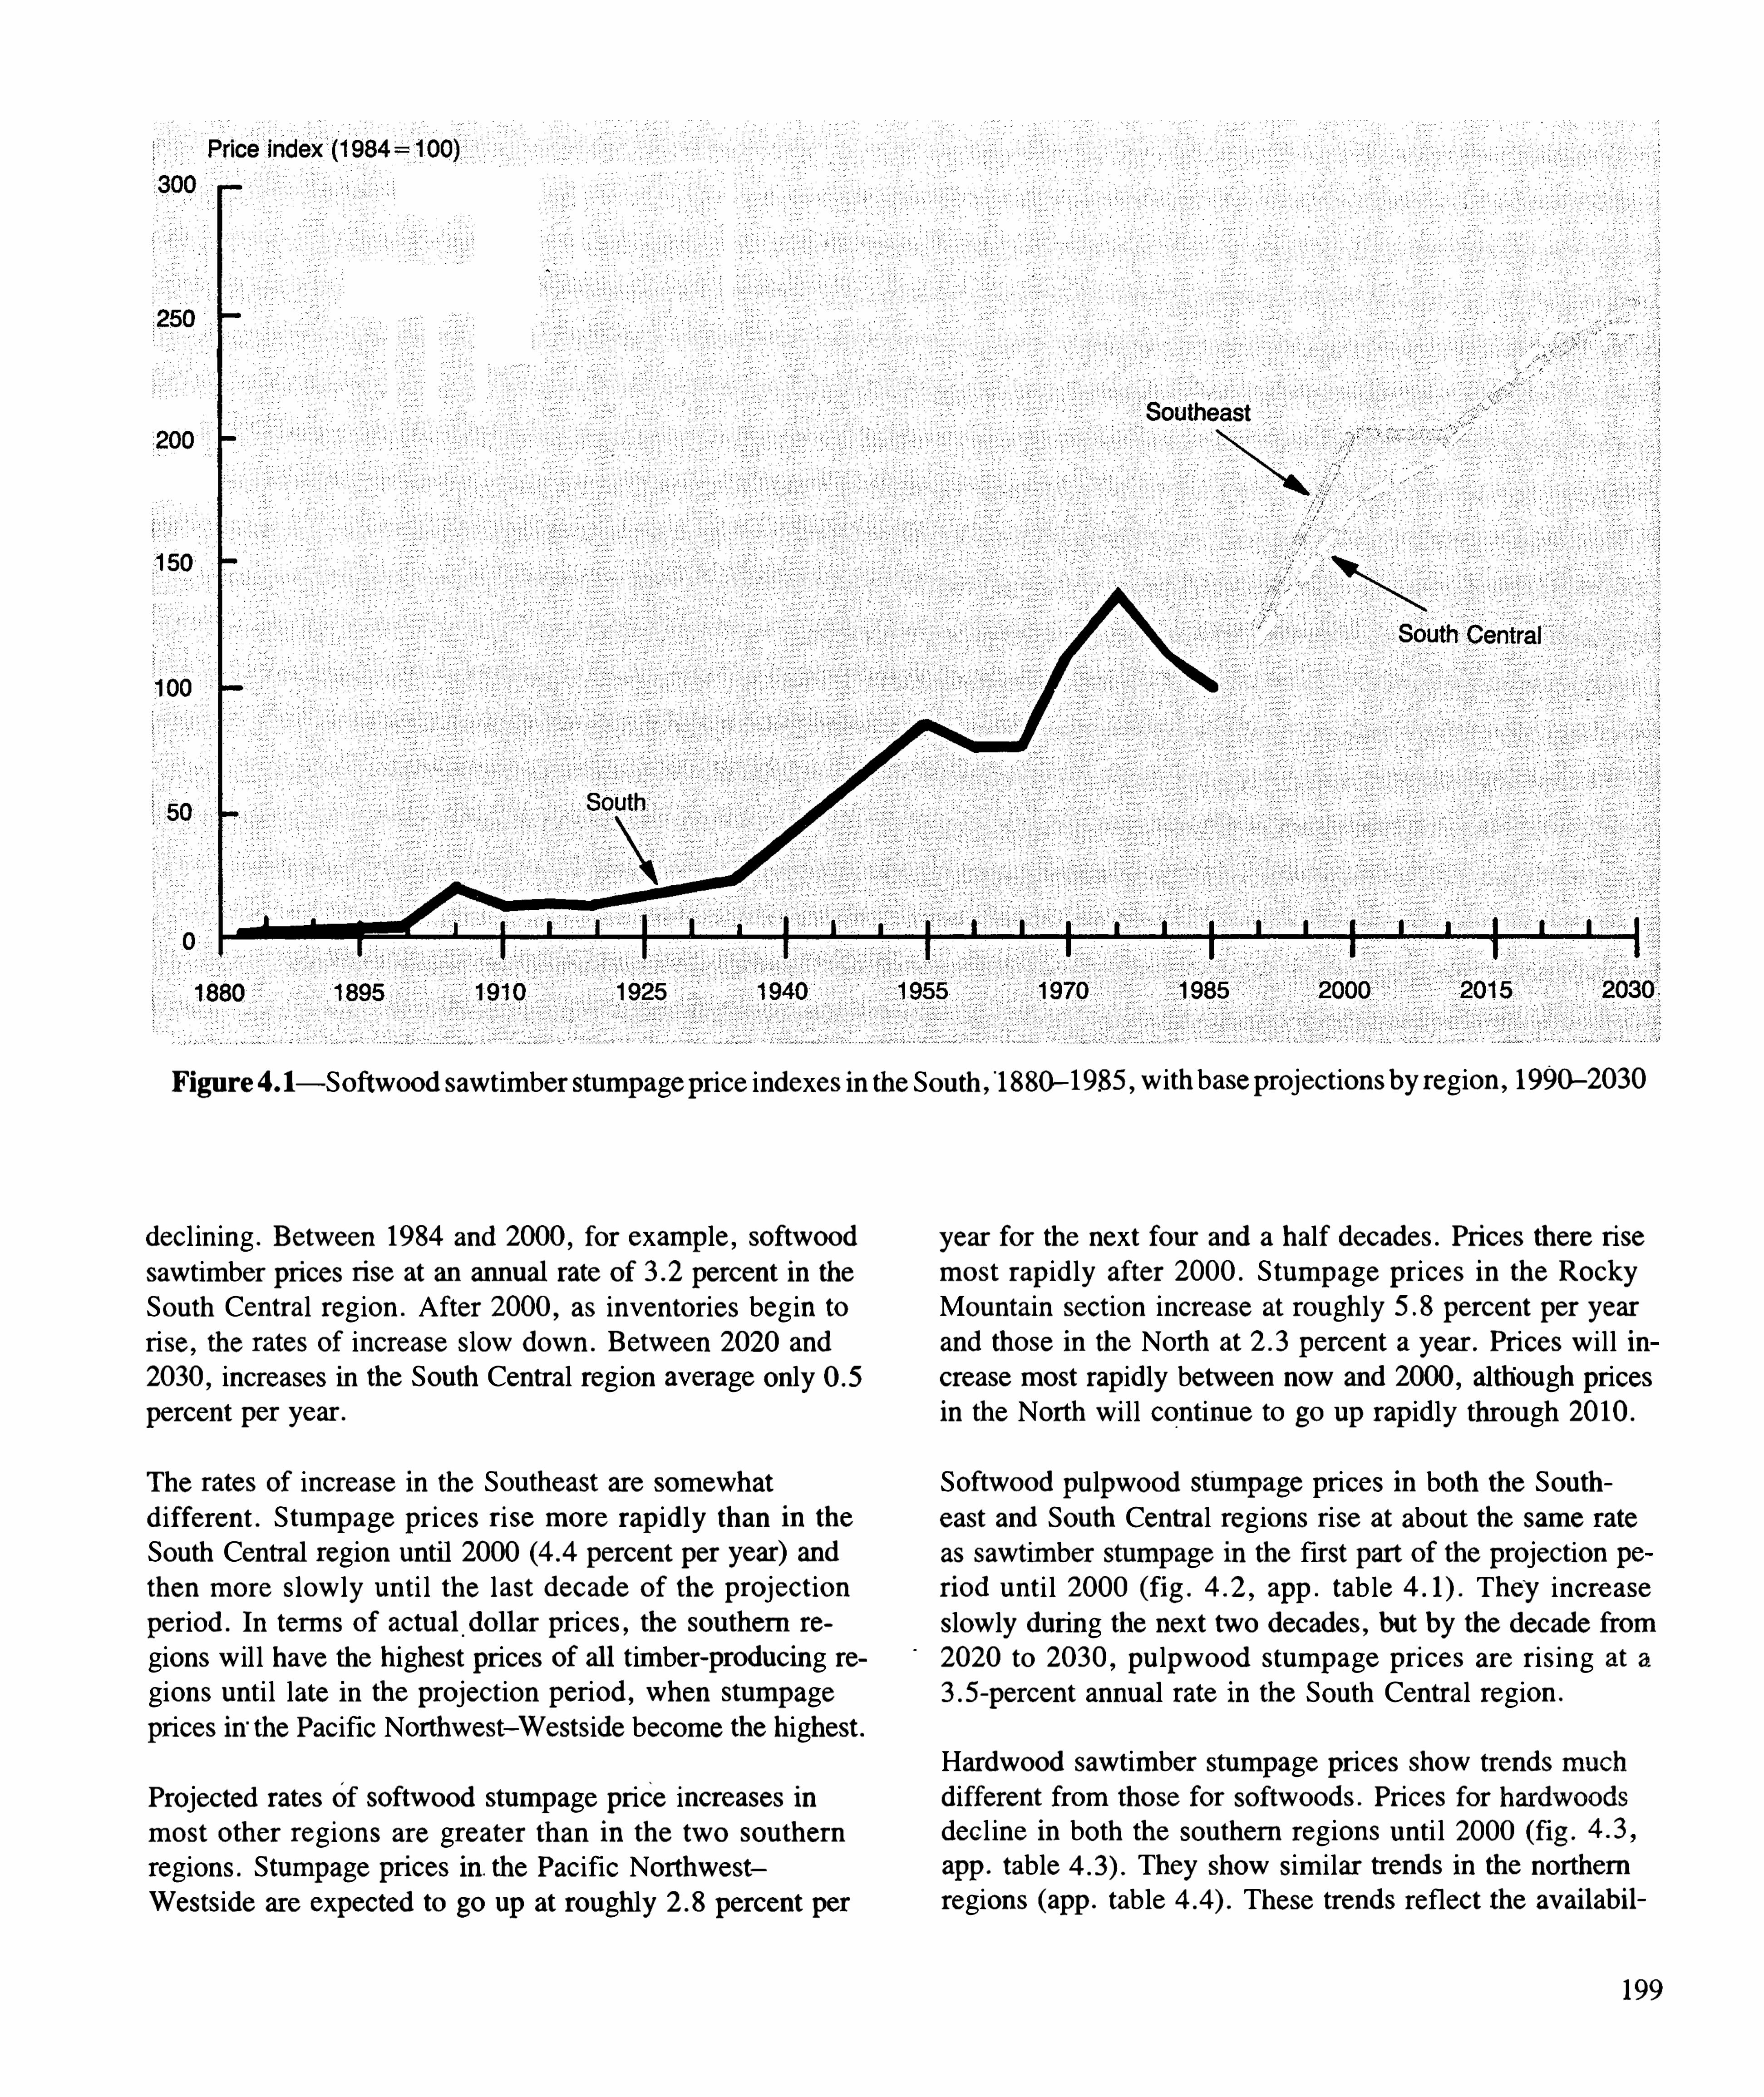
Figu r e4. l — Softwood saw tim ber stumpagepr ice indexes in the Sou th 1 880—1985 w ith basepr ojection sby r egion , 1990—2030
dec l in ing . Between 1984 and 2000 ,for examp le , softwood
sawtim ber pri ces ri se at an an nual r ate of per cen t in the
Sou th Cen tr al r egion . After 2000 , as inven tor ies begin tor ise , the r ates of incr ease slow down . Between 2020 and
2030 , incr eases in the Sou th Cen tr al r egion aver age on lyper cen t per year .
T he r ates of incr ease in the Sou theast ar e som ewhat
d iffer en t . S tum page pr ices r ise m or e r ap id ly than in theSou th Cen tr al r egion un ti l 2000 per cent per year ) andthen m o r e slow ly un ti l the last decade of the pr oject ionper iod . In term s of actu al do l l ar pr ices, the sou ther n t e
gions w il l have the h ighest pr ices of al l tim ber -
pr oducing r egions un ti l late i n the pr oject ion per iod , when stumpagepr ices in “
the Pacific Nor thwest—Westside becom e the h ighest .
Projected r ates of softwood stumpage pr ice incr eases inm ost other r egion s ar e gr eater th an in the tw o sou ther n
r egions. Stumpage pri ces in . the Pac ific Nor thwestWestside ar e expected to go up at r ough ly per cen t per
year fo r the next fou r and a half decades. Pr i ces ther e r isem ost r ap id ly after 2000 . S tum page pr ices i n the RockyMou n tain section incr ease at r ou gh ly per cen t per year
and those in the Nor th at per cen t a year . Pr ices w il l i ncr ease m ost r apid ly between now and 2000 , although pr icesin the Nor th w ill con tinu e to go up r ap idly thr ough 20 10 .
Har dwood sawtim ber stum page pr ices show tr ends m uch
d iffer en t fr om those for softwoods. Pr ices for har dwoodsdec l ine in both the sou ther n r egion s u n ti l 2000 (fi g .
app . table They show sim ilar tr ends in the nor ther n
r egions (app . table These tr ends r eflect the avai lab i l
199
Softwood pu lpwood stum page pr ices in both the Sou theast and Sou th Centr al r egions r ise at abou t the sam e r ate
as sawtim ber stumpage in the fir st par t of the pr ojection per iod u n t i l 2000 (fig . app . table They in creaseslow ly dur in g the next two decades, bu t by the decade from2020 to 2030 , pu lpw ood stum page pr ices ar e r isin g at a
-
per cen t annu al r ate in the Sou th Cen tr al r egion .

Price index
Figu r e—Softwood pu lpwood stumpage pr i ce indexes i n the Sou th , 1935—85 w ith base pr ojections by r egion , 1990—2030
i ty of lar ge and incr easin g inven tor ies of har dwood tim ber .
After 2000 , as tim ber r em ovals r ise above net annu al gr ow thand inven tor ies begin to decr ease , pr icesb egin to r ise . In
the last two decades of the pr ojection per iod , they ar e goin gup at a r ate of per cen t per year in the Sou th Cen tr alr egion and per cen t i n the Sou theast . Pr ices ar e r ising inthe Nor theast and Nor th Cen tr al r egions at a slower r ate .
These pr ojected pr ice incr eases for har dwood saw tim berstum page ar e for the sm al ler , low er quality har dwood timber that com poses the bu lk of har dwood tim ber inventor -ies.
T he stum page pr ice ou tlook for lar ger har dwood tim ber ofprefer r ed species, su ch as select wh ite and red oak , ash , and
black cher ry ,isd iffer en t . Rem ovals of h igher qu al ity saw
tim ber of m ost pr efer r ed species have been close to or abovenet a nn u al gr ow th , and ther e have been lar ge incr eases instum page pr ices in the past . Th is situ at ion seem s l ikely tocon tinue .
200
T he r egional d iffer ences in stum page pr ices in the Sou th ,
and i n the Nat ion , ar e cau sed by a num ber of com plexfor ces. In gener al , they r efleCt the in ten sity of the competition for the available tim ber ; differ ences in stumpagechar acter istics; and var iation s i n r egional loggin g ,m anufactu r ing , and tr an spor tat ion costs.
T he pr ojected incr eases in softwood an d har dwood lum
ber pr ices ar e shown in figur e and append ix tablesand T he tr ends ar e sim ilar to those for stum page . Soft
Incr eases in stumpage pr ices ar e r eflected in the pr icesof saw logs, pu lpwood ,
and other roundwood used in the for
est indu str ies . These r ou ndwood pr ice incr eases, wh ichr epr esen t incr eased costs to the pr ocessin g indu str ies, ar epassed on in the pri ces of products, espec ially those of lum
ber and softwood plywood , wher e r oundwood r epr esen ts a
lar ge par t of the pr oduct cost .

‘
i’
teoo ~1 820 42000; “
20205.
Figu r e— Aver age r elative pr odu cer pr ice index for lum ber , 1800—1984 , w ith base pr oject ions for softwood and hardwood
lum ber pr ice indexes for selected year s 1990—2030
Lum ber an d Plywood P r odu ction an d Pu lpwood
Consum pt ion
From an econom ic po in t of view , consumer s
w il l sustain the gr eatest losses fr om r isingr ea l
"
pr i ces of stum page . Ever ybody u ses
wood in some form— such as housing ,
fu r n iture, con ta iners, w r it ing paper , booksand newspaper s, fuel , and hun dreds of
other w ays— and everybody w il l be Hardwood lum ber pr oduction i ncr eases in both r egions i n
adver sel y affected '
the Sou th ,w ith the lar gest r ise in the Sou theast (app . ta
In the h igh ly com pet itive m arkets in wh ich near ly al l tim
ber pr oducts ar e so ld , r ising pr odu ct pr ices act to r educe
dem and . Th is is one of the con tr ibu ting causes to the slowing of the gr ow th i n total pr ojected dem ands for softwoodlum ber shown in table How ever , lar gely becau se of
compar ative cost advan tages over other lumber -
pr oducingsections in the Un ited States (due in par t to tim ber supplies) ,ther e ar e substan tial incr eases in softwood lum ber pr oduction in both r egions i n the Sou th . T he lar gest incr ease i s inthe Sou th Centr al r egion (app . tables and Ther ear e also substan tial in cr eases i n the Pac ific Sou thwest an din the Nor th . In con tr ast , pr odu ction in the PacificNo r thwest , the Nation ’
s other m ajor softwood lum berpr oduc ing section , show s l ittle change over m ost of thepr ojection per iod . Ther e i s also litt le change in pr ojectedpr oduction in the Rocky Mou n tain section .

ble Hardwood lum ber production incr eases even m or erapidly in the Nor theast and Nor th Cen tr al r egion s, wher elar ge har dwood inven tor ies a lso exist (app . table By
2030 ,hardwood lum ber production in the Nor th is abou t
equal to that i n the Sou th .
Softwood plywood pr oduction r ises in both sou ther n
r egion s, espec ially in the Sou th Cen tr al r egion , wher e i t
goesup 1 bill ion squar e feet - in ch basis) . As w ithlum ber , th is r ise in pr odu ction r eflects a compar atively favor able r esou r ce and stum page- cost situ ation . Softwood plywood p r odu ction also in cr eases i n the Rocky Mou n tainsection . In con tr ast , product ion dr ops in the Pac ific Nor thwest and by 2030 i s bill ion squ ar e feet under the 1984level .
Pr ojected dom estic woodpu l p pr oduct ion incr eases fr omm i ll ion tons i n 1984 to m il l ion ton s in 2030 .
Pr oduction in the Sou th ri ses from m illion tons now to
m i llion tons by 2030 . Region a l shar es of woodpu lppr odu ction (wh ich in 1984 wer e 17 , 18, and 65 per cen t for
the West , Nor th , and Sou th , r espectively) change by 2030to 12 ,
28 , and 60 per cen t .
T he pr ojected increases in consum ption of softwood
r ou ndwood pu lpw ood ar e sm al l in both sou ther n r egions,am ou n t in g to a l ittle over 300 m i ll ion cubic feet . T he con
sumption of softwood plan t bypr oducts goes up abou t 600m illion cubic feet .
T he pr ojected incr ease in consumption of har dwood
r oundwood pu lpwood is bill ion cubic feet , w ith the i ncr ease abou t equ al ly d ivided betw een the Sou theast andSou th Cen tr al r egions. T he m uch lar ger r ise in use com
par ed to softwoods r eflects the lar ge inven tor ies of har dwood tim ber and assoc iated lower stumpage and wood costs.
It also r eflects a sh ift to pu lping techno logies that can use
lar ger vo lum es of hardwoods. Pr ojected u se of hardwood
plant byproducts ri ses a little in the Sou theast and declinesby a sm al ler am ount in the Sou th Cen tr al r egion .
Softwood Lum ber Im por ts
Pr ojected softwood lum ber im por ts, near ly al l fr om
Canada , dr op fr om billion boar d feet in 1984 tobillion i n 2030 (app . table Th is decr ease is due tochanges in r elative wood costs between the pr oduc in g r egions of the Un ited States and Can ada . Canad ian pr oducer s face the prospect of r ap id ly r ising del iver ed wood costs
as Can ad ian har vests com e incr easin gly fr om the h ighercost ar eas fu r ther nor th . Risin g softwood t im ber in ven tor ies
in the Sou th after 2000 provide the r esou r ce base fo r an ex
pansion in sou thern lum ber pr oduction that also acts to r e
duce Canad ian im por ts. Fu r ther, th is expansion m itigates
som e of the dec line i n the U .S. Pac ific coast r egions.
Em p loym en t an d Wages a n d Sa l a r i es i n th e For est
In dustr ies
Em ploym en t i n the fo r est indu str ies shows lar ge dec linesover the pr ojection per iod (fi g . app . table Be
In the h igh l y competit ive m arkets in wh ichnear ly al l timber pr oducts ar e so ld , r isingpr ices constr a in dem ands. As a r esu l t ,
pr ojected tim ber harvests go up slow ly i n
the Sou th . T he incr eases ar e too sm a l l to
susta in em p loym en t in the forest indu str ies,wh ich by 2030 i s som e people
below the 1984 leve ls.
203
T he projections show ing that Canad ian softwood t im berhar vests have r eached a peak and that a falldown w ill takeplace ar e based on cu r r en t expectations abou t the Canad iantim ber situation . However , because of data and an alyticallim itations, the Canad ian tim ber situ ation has never beenadequately assessed . Thu s, the dec line in har vests and thetim ing ar e lar gely m atter s of judgm en t . A falldown at som e
po in t does seem inevitable . Bu t ther e is enough softwood
tim ber i n Can ada to susta in cu r r en t har vests fo r a fewdecades.
As in the Un ited S tates, ther e ar e m any oppor tun ities i nCanada to incr ease and su sta in softwood tim ber har vests .
However , ach ieving th is poten tial w il l r equ ire m uch lar gerinvestm en ts in r egener ation and other m anagem en t pr actices,in resear ch , and in education . It w i ll also take tim e . Ther e;as i n
_
the South , the for ces that m ake a decline in tim ber harvests inevitable ar e not easi ly or qu ickly changed .

Figu r e— Em ploym en t in lum ber and wood pr oducts and
pu lp and paper pr oducts industr ies in the Sou th , selectedyear s 1954
—85 ,w ith projection s to 2030 . Lum ber and wood
products inc lude al l industr ies i n Standar d Indu str ial Classification (SIC) 24 ,
inc lud in g m obile hom es (S IC 245 1 )beginn ing i n 1972 . Pu lp and paper pr oducts inc lude al l
industr ies in S IC 26 .
tween 1984 and 2030 , em ploym en t in the lumber and woodpr oducts industry dr ops by people and that i n pu lpand paper products industry dr ops by By 2030 , em
ploym en t in both industr ies falls by a 2 1 -
per cen t
decrease . Total w ages and salar ies also star t to dec line af
ter 2000 .
These downw ar d tr ends ar e a r ever sal of the incr eases thathave taken place i n r ecen t decades. T he pr ojected r ise i ntim ber suppl ies (har vests) i s not lar ge enough to sustain theri sing employm en t of the past thr ee decades. Rising product ivi ty per em p loyee over r ides the pr ojec ted in cr eases i nharvests.
On the other side ; r ising pr oductivity is passed on as
higher wages and salari es per employee . As a r esu lt , w agesand salar ies (in constan t do llar s) for both indu str ies incr easefor a wh ile , although at m u ch slower r ates than over thepast 30 year s (fi g . Beyond 2000 even these m od est incr eases
:
cannot be sustained , and w ages and salar ies alsobegin to dec l ine .
T he dr op in employm en t and w ages and salar ies is ofgr eat econom ic sign ificance to the Sou th . T he for estry sec
tor w i l l decr ease in im por tance . T he effects w il l be m u ltiplied as they spread thr ough the tr ade , ser vice ,
tr anspor tation , and other par ts of the sou ther n econom y that
provide goods and ser vices to the for estry sector . It is cu r
Figu r e— Wages and salar ies in lum ber and wood
products and pu lp and paper pr oducts indu stri es in the
Sou th , selected year s 1954—85 , w ith pr ojection s to 2030 .
Lumber and wood pr oducts inc lude al l indu stri es in StandardIndu stri al Classification (SIC) 24 , inc lud ing m obile hom es(SIC 245 1) beginn ing in 1972 . Pu lp and paper pr oducts
include al l i ndustr i es'
in S IC 26 .
ren tly estim ated ,for exam p le , that a loss of one job in the
lumber and wood pr oducts indu str y wou ld r esu lt i n a de
cr ease of jobs th r oughou t the economy in the Sou ther n
States. A one - job loss in the pu lp and paper products in
dustry wou ld be m u ltipl ied tim es as other par ts of theeconom y ar e affected .
In vestm en ts in For est Man agem en t
As descr ibed i n the pr ecedin g chapter of th is study , the
base tim ber r esou r ce pr ojections ar e the r esu lt of a set of assum pti ons on m anagem en t pr actices, inc lud ing lar ge i ncr eases i h the ar ea of p ine p lan tation s and tim ber yields.
These increases can be ach ieved only thr ough add itional ihvestm en ts in r egener at ion , inc lud ing site pr epar ation wher eneeded , stand conver sion , pr ecomm er c ial and comm er c ialth inn ing , stocking con tr o l , har vest of m atu r e stands, and salvage har vest and r egener ation .
T o ach ieve the incr eases i n gr ow th shown in the basepr ojections, an investm ent of billion wou ld be neededto establish p ine plan tation s on pr ivate tim ber lands between1984 and 2030 , w ith m ost of the investm en ts m ade in the
next 15 year s. Lar ge add itional investm en ts wou ld be neededfor in term ed iate stand tr eatm en ts, tr eatm en ts not invo lvin gar ea change in m an agem en t types, and tr eatm en ts on publ i c lands.

T he projected changes in the t im ber r esou rceand assoc iated changes in timberm an agem en t w i l l have import an t effects onfor age ,
w i ldl ife ,w ater , and in some degree
on a l l the pr oducts and uses of forest lands
and w ater s.
206

gr am s for these resour ces bu t on ly the i mpacts assoc iatedw ith changes in land use and the tim ber r esour ce .
T he estim ates of impacts r eflect changes in land use and
timber stand cond itions on the tOtal land base . Changes i nland u se , in for est
-m anagem en t types, and in timber ageclasses ar e the ch ief determ in an ts of chan ges in for agepr oduction , w ildlife and fish distri bu tion and abundance , and
water quan tity . T he over all patter n s of land u se and for est
types ar e sim ilar in the Southeast and Sou th Cen tr al regions:tim ber land and pastu r e ar eas decl ine over the pr oject ionper iod . T he ar eas w ith in tensive hum an - r elated use , such as
ur ban ar eas and r oads, show sign ifican t gains.
T he m ost notable change in for est m anagem en t types isthe conver sion of natu r al stands to p in e p lan tations. T he
lar gest par t of the conver sion com es fr om n atur al p ine , bu t
substantial acr eages of m ixed p ine—har dw oods and up landhardwoods ar e also conver ted . Changes in age c lasses di ffer between regions lar gely because of d iffer ences i n theage
- c lass d istr ibu tions at the star t of the pr ojection per iod .
The lar gest chan ges over the pr ojection per iod ar e the gainsin theo lder har dwood age c lasses in the Sou th Cen tr al r egion and the loss of pine in the o lder age c lasses, m ostlyin the Sou theast .
1
For age Pr odu ct ion— For age pr odu ct ion on al l lands, in
c lud ing pastu r e , r ange , and tim ber land , show s a sm alldec l ine— fr om m i l l ion to m i l l ion
'
ton s i n the
Sou theast and fr om m illion to m illion ton s i n theSou th Cen tr al r egion— o ver the pr ojection per iod (app . ta
ble These decreases r eflect a dr op in the acr eage ofpastu r e and r an ge in both r egions.
For age pr oduction on tim ber lands r ises over m ost of thepr ojection year s. T he bu lk of the in cr ease i s i n the Sou thCen tr al r egion , wher e for age pr oduction goes up fr omm i l l ion to m i ll ion ton s by 2020 . T he incr ease in theSou theast is m u ch sm aller— fr om m il lion to m i l
lion tons in 2000 . Ther e is som e decline in both r egions after the peak year s in 2020 and 2000 . For age on timber land
T he m ater ial in th is chapter on for age , wh ite- tai led deer , w ild tu rkey ,
red—cockaded woodpecker , cold- water fish, and water has been taken fr om
the fol low ing office reports: “ Reg ional For age Response to T imberManagemen t
”by Linda A . Joyce ,
“ Regional W i ld l ife Response to T imber Management
” by Cu r t is H . Flather ,“ Reg ional Cold -Water Fish Re
sponse to T imber Managem en t by Patr ic ia A . Flebbe , and“ Reg ion alWater Response to T imber Managem ent by Stan Ur sic . Cop ies of these
office repor ts can be obtained from Linda A . Joyce , USDA Forest Service ,Rocky Moun tain Forest and Range Exper im en t Station , 240 W . Pr ospect ,
For t Co l l ins, CO 80524 .
is produced pr im ar ily in younger stands; thus the changes inproduction fo l low the sh ifts in acr es acr oss both ol d and
you ng age c lasses.
Using for age from tim ber lands year r ound is possible . Bu t
i t w ill r equ ir e the im plem en tation of m easu r es such as m or e
fr equ en t bu r n ing of tim ber land , the use of fer t i lizer s to incr ease the qu an tity and qu ality of for age , and the plan tingof for age spec ies, su ch as subter r anean c lover , wh ich ho ldnu tr itional qual ity better .
Wi ld Tu r key— Wild turkey popu lat ions also show a sm al ldecl ine over the pr oject ion per iod , fr om to tu rkeys
per squ ar e m ile in the Sou theast and fr om to tu rkeys
in the Sou th Cen tr al r egion (app . table In the ear lydecades of the pr oject ion per iod ,
tu rkey popu lat ion s ar e
207
Du r ing par t of the year i n the Sou th , when the nu tr itional qu al ity of the for age on tim ber land is low , pastu r e i s
often u sed to m ain tain livestock . T he ar ea of pastu re in the
Sou th , however , decr eases over the pr ojection year s.
Uti lization of the incr eased for age produ ction on tim ber landm ight r equ ir e m or e in ten sive m an agem en t of the r em aining ar ea of pastu r e and incr eased use of cr op afterm ath and
supp lem en tal feeding .
Wh i te- Ta i led Deer — By 2030 , the aver age den sity of
wh ite - ta i led deer per squ ar e m i le dr ops fr om to
in the Sou theast and fr om to in the Sou th Cen
tr al r egion (app . table Th is dec line is due i n par t tothe decrease i n the ar ea of up land hardwoods and the con
ver sion of n atu r al pine and oak—p ine to p ine p lan tat ion s.
T he m ajor land use change con tr ibu ting to decl ine i n deerpopu lation s is the grow th i n the ar ea w ith in tensive hum an
r elated u se , par ticu lar ly u r ban and road use . T he added acr e
age in su ch u ses d ir ect ly r edu ces avai lable deer habitat .
T he assoc iated incr eases in hun t ing (legal and illegal) andother hum an - r elated d istu r ban ce a lso r aise deer m or tality .
T he dec line in deer num ber s also r eflects the assum ption of
ho ld ing investm en ts in w ild l ife m anagem en t pr ogr am s atcu r r en t levels. Mo r e in tensive m anagem en t cou ld m ain tainand in som e ar eas incr ease deer popu lations. Measur es such
as those descr ibed for im pr ovin g for age w i ll a lso benefitdeer . In add ition , con tr o l lin g the size , shape , and distr i bu
tion of c lear cu ts and pine plan tings; th inn ing stands;m ain tain ing m anagem en t types that pr oduce m ast ; andplan ting the food plan ts deer pr efer cou ld m ain tain or
incr ease deer popu lation s. Impr oving en fo r cemen t of gam elaws and pr oviding tim ber land owner s w ith techn icalassistance on desir able m an agem en t p r ac t ices cou ld also “
con tr ibu te .

even lower th an the levels i n 2030 . After 20 10 , tu rkey
popu lations increase sligh tly i n the Sou theast . They m ake
a sign ifican t r ecovery i n the Sou th Cen tr al r egion in respon se
to incr eased har dwood acr eage i n both o lder and youn gerstands.
Wi ld tu rkey h ave habitat r equ ir em en ts m or e specific thanthose for deer an d closely tied to the hardwood m an agem en t
types. Although in cr eases in in ten sive hum an - r elated landuse undoubted ly con tri bu te to the ear ly decl ine in popu l ation , the gener al decr ease i n the ar ea in upland har dwoods,young har dwoods, and o lder har dwood stands i s pr obablythe pr im ary influen ce on tu rkey popu lation levels.
As w ith deer , w i ld tu rkey popu lation s can be m ain tain ed andincr eased w ith m or e inten sive m an agem en t . Many pr acticesand pr ogr am s such as those that in cr ease m ast pr oduction ,
better en for cem en t of gam e laws, and in cr eased techn icalassistance to pr ivate tim ber land ow ner s on desir able m an
agem en t pr actices w ou ld benefit both deer and tu rkey . Ther ear e som e add itional th in gs that can be done . For example ,
ther e ar e still som e ar eas of su itable tu rkey habitat that needr estocking . Cr eatin g Open in gs in tim ber land w i l l p r ovidegood br ood habitat and incr ease sum m er food . Pr ov id in gw ater sou r ces i n d r y ar eas and takin g act ion to r edu ce
hum an d istu r bance i n tu rkey habitat w il l also help . Maintain ing har dw ood stands, par t icu lar ly along str eam s and on
bottom l ands, wou ld also gr eatly benefit turkey .
Red - Cockaded Woodpecker— T he r ed - cockaded wood
pecker fol low s the tr ends for deer and tu rkey . T he num berof coun ties suppo r t ing r ed - cockaded woodpecker co lon iesis pr ojected to dr op fr om 1 14 to 35 in the Sou theast and
fr om 56 to 48 in the Sou th Cen tr al r egion (app . tableT he dec l ines take p lace i n the ear ly par t of the pr oject ionper iod .
T he red - cockaded w oodpecker has h igh ly spec ialized habitatneeds. It r equ ir es o l d—grow th p ine stands for nest ing andsurvival . T h e decl ine r eflects the r ap id conver sion of o l d
gr ow th n atu r al p ine stands on pr ivate owner sh ips to plan tedpine and you nger age classes .
Som e of the for est indu str y tim ber lands in the Sou thcu r r en tly have su itable w oodpecker habitat ; i n som e ar eas,
such as in Ar kan sas, m ost of the kn ow n colon ies ar e onindustry lands. Over the pr ojection per iod , however , i t doesno t appear l ikely that m any o l d - gr ow th p in e stands of
su ffic ien t size to suppo r t co lonies w i l l be m ain ta ined on
pr ivate lands . Thu s, the r elative stability in the num ber ofcoun ties that suppor t active co lon ies i n the latter par t of theprojection per iod r eflects the con tinu ed r eten t ion of old
208
gr ow th p ine stands on Feder al ow ner sh ips, espec ia lly thoseon the national for ests. Som e plan ted p in e r otation s on thenational for ests r un 80 year s .
Actions to m ain tain and in cr ease cold - w ater fish popu lationsinc lu de the pr oper locat ion and m a in ten an ce of r oads,
leav in g pr o tective vegetation alon g str eam s, an d locatingdevelopmen t act iv ities ou tside r ipari an zones. Habitatim pr ovem en t in str eam s can also con tr ibu te , espec ially byim pr oving u ndesir able cond ition s caused by past land u se
pr act ices.
Water " u an ti ty— An nu al w ater yields or r u noff increase byinch or 3 per cent in the Sou theast and by inch or
4 per cen t i n the Sou th Cen tr al r egion over the pr ojectionyear s (app . table Most of the in cr ease in the Sou theast takes place by 2000 , m ost of that i n the Sou th Cen tr alr egion , after 2000 .
T he in cr ease i n w ater y ields r eflects land u se ch anges,espec ia l ly the in cr ease i n the ar ea of u r ban land and the
decr ease in timber land . T he tim in g of the r egion al incr ease
2T he an alysis w as confined to the m oun tainous areas of wester n Vir g in ia ,
North Car ol ina , Sou th Car ol in a , an d Geor gia , w her e stream s w ith su itablehabitat for col d - w ater fish exist . No su itable data on co ld - w ater fish ar e
cur r en tly ava ilab le for S tates in the Sou th Cen tr al r eg ion .
Main tain ing r ed - cockaded w oodpecker popu lation s r equ ir eslong pine r otation s, r eten tion of m atu r e stands for nesting ,con tr o l of r rridstory har dwood encr oachm en t in co lony sites,and m a in ten ance of adequ ate for aging h abitat . Popu lat ionau gm en tat ion and tr an sp lan t ing bir ds between popu lat ion swou ld also be r equ ir ed to m ain tain gen etic d iver sity . Su ch
m easu r es w ou ld be costly for pr ivate ow ner s. It seem s c learthat the pr eser vation of viable popu lations of the r ed
cockaded woodpecker w i ll depend on the m an agem en t of theFeder al ow ner sh ips.
Tr ou t— As w ith the w i ldlife spec ies an alyzed , tr ou t popu l at ion s dr op over the pr oject ion year s (app . table In
the co ld - w ater str eam ar ea of the Sou theastz, they fall fr om
17 1 tr ou t per acr e of str eam in 1985 to 1 19 tr ou t in 2030 .
Th is dr op lar gely r eflects a decr ease in the o lder agec lasses of har dw oods (over 50 year s) and i n cr eases i n thear ea of in ten sive hum an - r elated u se . T he h ighest tr ou tden sity i s associated w ith a h igh pr opor t ion of o lder har dwoods; the lowest i s assoc iated w ith land u ses other than
tim ber land . Imp l ic it in these r elation sh ips ar e factor s suchas cold w ater tem per atu res, in - str eam cover , and shadin g thatar e positive for tr ou t w ith o ld har dwoods and negative fortr ou t near in tensive hum an - r elated u ses.

6 . Reduced tim ber gr ow th . T he fu tu r e as descr ibed bythe assum ption s in chapter 3 , m od ified by r edu cin g by 25per cen t the net an nu al gr owth on pine p lan tations, n atu r alpine , and m ixed pine—har dw ood stands show n in the
empir ical yield tables used i n developin g the basepr ojections.
7 . Reduced n ation al for est har vest . T he fu tu r e as
descr ibed by the assum pt ion s i n chapter 3 , m od ified byr edu c in g t im ber h ar vests on the n at ion al for ests tobil lion boar d feet in 1990 and m ai n tain ing th is level thr ough2030 .
8 . Natur al r egener ation on m ar ginal cr opland and
pastu r e . T he fu tu r e as descr ibed by the assumptions inchapter 3 , m od ified by assum ing that al l m ar ginal cr oplandand pastu r e in the Sou th w ou ld natu r ally r ever t to timberland by 2000 (70 per cen t natu r al pine , 30 per cent har dwoods
in the Sou theast ; 40 per cen t n atu r al p ine , 60 per cen t
har dwoods i n the Sou th Cen tr al) .
9 . P lan ted p ine on m ar gin al cr opland and pastu r e . T he
fu tu r e as descr ibed by the assum pt ion s in chapter 3 ,
m od ified by assum in g that al l the m ar gin al cr op land and
pastu re in the Sou th wou ld be plan ted to pine .
10 . Econom ic oppor tu n ities on pr i vate t im ber lands. T he
fu tu r e as descr ibed by the assum ptions i n chapter 3 ,
m od ified by assum in g the u ti lization of al l the econom icoppor tun ities (except those invo lv ing in term ediate stand
tr eatm en t and those not invo lvin g ar ea changes in m an agem en t types) for incr easin g t im ber supplies on tim ber land inpr ivate ow ner sh ips th at y ield 4 per cen t or m or e n et of
inflation or deflation .
1 1 . All econom ic oppor tun ities on pri vate land . T he futu r e
as descr ibed by the assum ption s i n chapter 3 , m od ified byassum ing th at 1 ) a l l the econ om ic oppor tun it ies (exceptthose invo lving in term ed iate stand tr eatm en t and those not
invo lvin g ar ea chan ge in m anagem en t types) for incr easingtim ber suppl ies on tim ber land i n pr ivate owner sh ip thatwou ld yield 4 per cen t or m or e n et of inflation or deflationwou ld be u ti lized , and (2 ) a l l the m ar gin al cr opland and
pastu r e wou ld be plan ted to p ine .
12 . Incr eased m an agem en t in ten sity on for est in du str ytimber lands in the Douglas- fir r egion . T he
“
futu r e as
descr ibed by the assum pt ion s i n ch apter 3 , m od ified byassum i ng that al l the econom ic oppor tun it ies to in cr easetim ber Supplies on for est industr y tim ber lands in theDouglas- fi r r egion wou ld be u ti lized .
2 10
Im p r oved P r ocessin g Efficien cy
In r espon se to such v iew s, i t w as assum ed for th is sim ulation that the in cr ease i n softw ood lum ber and plywoodyields w ou ld be 2 5 per cen t over the pr oject ion per iod ,
r ather th an the 10 per cen t in cr ease inc lu ded i n the base
Im provements in u til ization that increase theou tpu t of lum ber and p lywood per u n it oflog inpu t can have a substan t ial impact onthe economy . T hey can r educe the dem and
on dom est ic t im ber r esou r ces, con str a in
pri ce in cr eases, and in cr ease both the
pr oduct ion and consum pt ion of lum ber and
plywood .
T he im pl ication s of each of these selected fu tu r es ar e discussed below . T he d iscu ssion i s d ir ected at the im por tan td iffer en ces i n the r esou r ce ch an ges and econ om ic and
envir onm en tal effects fr om those show n i n the base pr oject ion s. Most of the data on r esour ce ch an ges ar e show n
on ly for the pr ivate owner sh ips— for est indu stry and other
pr ivate . Most of the selected fu tu r es wou ld not havesign ifican t impacts on the r esou r ces in n ation al for ests andother public ow ner sh ips.
T he l im ited h istor ical data th at ar e ava i lable show that
lum ber and plywood ou tpu ts per cubic un it of log inpu t havebeen in cr easing in m ost m ajo r pr oduc ing sect ion s. Past
assessm en ts and the base sim u lat ion in th is study haveassum ed that such im pr ovem en ts i n u ti l ization w ou ld i n thefu tu r e incr ease at 2 per cen t per decade . Noting that risingstumpage costs w il l pr ovide an incen tive for m or e efficien tu t il ization and that the techno logy i s cu r r en tly avai lable ,
som e obser ver s ar gue that r ecover y im pr ovem en t i n the
fu tu r e shou ld aver age c loser to 5 per cen t per decade .

simu lation . Rates of incr ease per decade dec line over theprojection per i od in the pr ogression 9 , 7 , 5 , 3 ,
and 1 per cen t
per decade . Th is dec lin ing trend pr esum es that r ising woodcosts i n the im m ed iate fu tu r e and cu r r en t ava i lab il ity of
substan tially m or e effic ien t technol ogy lead to r apidadoption of new techno logy in the near term w ith a gr adu alslow ing as cost pr essu r es ar e r edu ced . Chan ges in r ates of
r ecovery impr ovem en t wer e m ade for al l regions, inc lud in gCanada .
Under th is sim u lat ion ther e i s very l ittle change fr omthe base pr ojection s in softwood har vest levels (tim bersupplies) and tim ber in ven tor ies on pr i vate owner sh ipsin the Sou th (app . table However , softwood inventor ies ar e con sider ably h igher in the Pac ific Nor thwest(app . table where a h igher pr opor t ion of the soft
wood har vest is used for lum ber and plywood “
.
Although har vests on pr ivate owner sh ips ar e belowthe base because of the in cr eased pr oduct yields, pr odu ction of softwood lum ber and softwood plywood i s upi n m ost pr odu c in g sec t ions , par t icu lar ly i n the laterpr ojection year s. Con sum ptionof softwood r oundwood
pu lpwood is also h igher i n _the Sou th because im pr oved
pr oduct r ecovery r edu ces the volum e of byproducts fromm il l oper ations avai lable to pu lp m i lls.
Lower har vests r esu lt i n a substan tial r eduction in soft
wood stum page an d softwood lum ber pr ices r elative tobase pr ojections i n the Sou th and other section s (fig .
Impr ovem en ts in pr ocessin g effic iency affect em
ploym ent and wages and salar ies in the Sou th ’
s lumberand wood pr oducts indu stry (app . table Both ar e
lower by abou t 13 per cen t by 2030 . Most of the other
m easu r es of econom ic and envir onm en tal chan ge ,
however , ar e c lose to the base pr ojections.
Th is sim u lation di d not inc lude impr ovem en ts in theeffic iency of pu lp m an ufactu re , such as incr easing use ofhardwoods to r ep lace softwoods, beyond the assump
tions used in the base pr ojections. T he base pr ojectionsinc lude near ly the level of har dwood - for - softwood sub
st i tu t ion i n pu lp in g that H aygr een and other s ( 1986)identified in their study “
of how technologies cou ld eitherincrease the effic iency of wood use or substitu te cheaper
har dwoods fo r softwoods. In the Sou th , for exam ple ,
th is assum ption in the base sim u lation is that pu lp fu '
r
n ish w ill sh ift fr om the cur r ent 24 per cen t har dwood to
35 per cen t har dwood by 2030 .
T he effects of industry adoption of the techno logiesidentified by H aygr een and other s ( 1986) have been
sim u lated usin g the Tim ber Assessm en t Market Modeland descr ibed by Skog and Haynes Skog andHaynes found that softwood har vest wou ld ,
be r educed byon ly 15 per cen t i f the pu lpin g techno logies wer eadopted .
H igh Expor ts of T im ber P r odu cts
Th is sim u lation assum es that in the Un ited States, cond ition s have developed that ar e conduc ive to , and suppor t iveof , expanded expor t tr ade . These inc lude gover nm en t action s to fac il itate the or gan izational , in form ation , fin anc ial ,and tr anspor tation aspects of tr ade com par able to those available for other pr odu cts (notably agr icu ltu r e) . Another cond ition is the con tinued effor t to el im in ate tr ade bar r ier s.
A doublin g of expor ts of the m ajo r tim ber pr oducts(except softw ood logs) over '
the pr oject ion year s h as theobviou s effect of in cr easin g dem ands and har vests (tim bersupp l ies) over the base pr oject ion s for softwoods and
2 1
Th is sim u lation of the effects of im pr oved processingeffic ien cy is of consider able impor tance fr om the policyand pr ogr am standpo in t . Pr ogr am s can be developedto : ( 1) incr ease the usefu l l ife of wood pr oducts by pr e
ser vative tr eatm en ts, im pr oving designs of newstr uctur es, and r enovatin g and m ain tain ing existingstr uctu res r ather than r eplac ing them ; (2 ) impr ove effic iency i n har vesting , m il ling , constr u ction , and
m anufactu r ing ; and (3 ) u t il ize unu sed wood m ater ialssuch as logging r esidues; tr eetops and l im bs; r ou gh ,
r otten , and sa lvable dead tr ees; tr ees in u r ban ar eas,
fencer ows, and low -
pr oductivity for est ar eas; and urbanwood wastes. By extending tim ber suppl ies and r edue
ing dem and on tim ber r esou r ces, such progr am s c lear lyhave the poten tial to constr ain fu tu r e incr eases in stump
age and tim ber pr oduct pr ices.
In r ecen t year s dom estic pr odu cer s have m ade or gan izedeffo r ts to expan d expo r ts of lum ber , p lyw ood , pu lp an d
paper , and other t im ber pr odu cts to Eur opean and Asiancoun tr ies. Poten tial in these m arkets is gener ally thought tobe gr eat , per haps tw ice cu r r en t expor t levels. At the sam e
tim e , i t is gener al ly r ecogn ized that the cond it ions wh ichwou ld induce expan sion of lum ber and plywood tr ade w illlikely lead to a cor r espond ing reduction in U .S. log expor ts.
Realizing the poten tial for expanded tr ade also depends onthe w illingness of dom estic firm s to en ter new m ar ket ar eas,
elim ination of cu r r en tly r estr ict ive tr ade barr ier s in im po r ting coun tri es, and the ability of U .S. pr oducer s to captu r e
a larger expor t m arket shar e i n the face of pr ice and other
kinds of com petition fr om other wor ld suppl ier s.

Pr ice index
Pfice index ( 1 984 1 00 )
Base
Fi gu r e— Pr ojections of softwood lum ber and saw tim ber stum page pr ice indexes i n the Sou th , w ith and w ithou t add ition alimpr ovem ents i n pr ocessin g effic ien cy
2 12

Billion cubic feet
Increased experts
Figu r e— Pr oject ions of r ou ndwood pu lpwood con sum ption in the Sou th , w ith and w ithou t incr eased expor ts of t im ber
pr oducts
tial is ther e to double U .S. impo r ts of pu lpw ood ,inc lud
ing pu lp and paper , and th is pr ospect i s of som e concer n to
the pu lp indu stry and for est owner s in the Sou th .
In con tr ast to a doublin g of export s, a doubling of impor ts r edu ces dem ands on dom estic r esour ces. Both soft
w ood and har dw ood tim ber har vests (supp lies) dr op -belowthe base pr ojection s in most tim ber -
pr oducing sections. On
the other hand , inven tor ies r ise and ar e above the base number s in m ost section s and r egion s. T he lar gest in cr ease i sin the Sou th— softw ood tim ber in ven tori es in 2030 ar e som e
16 per cen t above the base .
T he lower har vests and h igher in ven tor ies lar gely r eflectchanges in the con sum ption of pu lpwood r oundwood in theSou th . By 2030 , softwood r ou ndwood con sumption is downby near ly 700 m il lion cubic feet and that of har dwoods, byc lose to 600 m i l lion . As a r esu lt ther e ar e also substan tiallylower softwood pu lpwood stum page pr ices. In fact , they
stay below or c lose to the 1984 levels i n both sou ther n r e
2 14
gions u n ti l near the end of the pr ojection peri od . Pri ces
for softwood and har dwood saw tim ber stumpage ar e also below the base n um ber s, bu t the d iffer ence is m uch sm al lerthan for pu lpwood .
Em ploym en t in the lum ber and w ood pr oducts industryis above the base levels, a r espon se to the h igher lum berpr odu ct ion . Bu t th is in cr ease i s m or e th an offset by de
c lines in the pu lp and paper indu stry ,w her e em ploym en t i s
19 per cen t below the base pr ojection s i n 2030 because ofthe incr eased im por ts of pu lp and paper (fig . Wages
In r espon se _
to lower saw tim ber stum page pr ices, andsom ewhat low er lum ber pr ices, ther e i s som e in cr ease i nsoftwood lum ber pr odu c tion i n the Sou th . In m ost other
lum ber -
pr odu cin g sect ion s, ther e i s l itt le change fr om the
base . Softwood plywood pr odu ction i s also above the basei n the Sou th bu t abou t the sam e i n the other pr odu c ingr egion s. Softwood lum ber im por ts ar e r educed below the
base projections.

Figu r e— Pr ojections of em ploym en t i n‘
the pu lp and paper pr oducts indu stry in the Sou th , w ith and w ithou t incr easedimpor ts of tim ber pr oducts
and salar ies in the pu lp and paper industry show the sam e
per cen tage decr ease .
Tota l State and ldcal gover nm en t r evenues ar e near ly $9billion below the base by 2030 ,
r eflecting the lower level ofpu lp pr oduction in both the Sou theast and Sou th Cen tr alr egions. Investm ents in the lum ber and wood pr oducts industr y show a sm all incr ease; those in the pu lp and paper prod
ucts industry , a smal l decr ease .
Redu ced T im ber lan d Ar eaAs descr ibed i n chapter 3 , ther e i s alw ays m ajor uncertain ty assoc iated w ith land - use changes. At the presen t tim ethe ou tlook for the cr opland that w i ll be needed to m eet do
m est ic and expor t dem ands for farm pr oducts seem s espe
c ial l y uncert ain . Ther e ar e two m ajor causes of th is: ( 1) futu re tr ends in cr op yields, and (2 ) expor t dem ands.
In the base projections, i t was assum ed that the cr op landar ea in the Sou ther n States (exc lud in g w ester n Texas and
Any fu r ther c lear ing of tim ber land in theSou th wou ld in time r educe net annua l
timber gr ow th and inven tor ies and incr ease
pr ices for stumpage and fin ished pr oduc ts.
H owever , i f th is kind of change occu r s
g r adu a l l y , m ost of the im pac ts wou l d bebeyond 2030 , the end of the projection
peri od in th is stu dy .
2 15
Oklahom a) w ou ld r em ain close to the pr esen t level , abou t53 m i ll ion acr es. Accor d in g to a r ecen t au thor itative study
of cr opland needs (Join t Counc i l on Food and Agri cu ltu r alSc ien ces cr opland needs n ationw ide m ay r ise by 50m i l l ion ac r es by 2020 . Th is est im ate i s the in term ed iatepr ojection of that study . It w as based on lon g - term tr ends
adjusted judgm en tally to con form w ith w hat w as consider edto be plau sible in cr eases in yields. T he Sou th
’
s sh ar e of
su ch an incr ease i n cr opland cou ld add abou t 16 m illion acres
to the cr oplan d acr eage assum ed in the base pr ojections.
In th is sim u lation ,i t w as assum ed that cr opland needs in
the Sou th w ou ld r ise in l ine w ith the Jo in t Counc il ’s project ion and that abou t 5 m il lion a cr es w ou ld com e fr om pas
tu r e and id le land . It w as fu r ther assum ed that 1 1 m i l l ionacr es of cr opland wou ld com e fr om the 23 m ill ion acr es of
t imber land in the Sou th that have h igh or m edium poten
tial for con ver sion to cr opland (table T he conver sionto cr opland w as spr ead even ly over the next 35 year s.
Under th is sim u lation , ther e ar e r educt ions i n net annualgrow th and in ven tor ies fr om the base levels in the last decades of the pr ojection per iod . For softwoods the decr eases
ar e not lar ge enough to have m uch im pact on stum pagepr ices. For har dwoods, however , ther e i s a sign ifican t effect over t im e . T he 2030 pr ice of har dw ood saw tim berstum page i n the Sou theast i s 18 per cen t above the base .
T he relatively sm al l im pact on the tim ber r esour ce situ ation fr om th is sim u lation lar gely r eflects the tim in g of theassum ed r eduction s i n ar ea . T he chan ges i n the fir st decades ar e too sm all to show up i n a sign fican t w ay in net
annu al gr ow th and inven tory . In the latter par t of the pr oject ion per iod ,
ther e ar e sign ifican t r edu ction s in both net annu al gr ow th and in ven tor ies. T he biggest im pacts ar e on
har dwoods. In the decades imm ed iately beyond 2030 , th isfu tu r e w ou ld show lar ge im pacts on both softw oods and
har dw oods.
T he r edu ction in inven tor ies over the pr oject ion year s i sn ot
'
l ar ge en ou gh to h ave m u ch im pact on the ou tpu t of
pr odu c ts, or on the assoc iated em p loym en t , w ages and
salar ies, _and investm en ts in plan ts and equ ipm en t . Ther e ar e
substan tial reduction s in State and local gover nm en t r even u es fr om the t im ber lan d and t im ber base . Pr esum ably ,
however , these r educt ion s w ou ld be offset , perhaps m or e
than offset , by the r evenues fr om the land in other u ses.
T he r eduction i n tim ber land ar ea does h ave sign ifican tim pacts on for age ,
w i ld life , and f ish and w ater (app . tableFor age pr odu ction on tim ber land dec l ines i n both r e
gions fr om the base levels. Deer density show s d iffer en t
2 16
tr ends. In the Sou theast , the incr eased fr agm en tation of thetim ber land base r esu lts i n m or e- favor able habitat cond it ion sand h igher deer den sit ies . In the Sou th Cen tr al r egion ,
however , ther e are less- favor able cond itions and deer popu lation s ar e below those i n the base pr oject ion s.
T he in cr ease i n cr opland and the r edu ction in har dw oodar ea r esu lt i n sl igh t ly r edu ced den sit ies fo r tu rkey in theSou theast . Popu lation s in the Sou th Cen tr al r egion , however ,ar e not Sign ifican tly d iffer en t . T he n um ber of coun ties w ithr ed - cockaded w oodpecker co lon ies i n the Sou theast ar e abou tthe sam e as in the base . In the Sou th Cen tr al r egion , ther e
is a fu r ther dr op , a r espon se to the add ition al loss of ar eain the natu r al pine type .
Water qu an tity in both r egions i s above the base becau seof the incr eased cr opland ar ea— r unoff i s gr eater on cr op
land than ou tim ber land . Tr ou t density is substan tially abovethe base , in par t becau se of the incr ease in w ater qu an tityIt a lso r eflec ts ch an ges i n the age d istr ibu t ion of t im berstands.
Redu ced T im ber Gr owth
In r ecen t year s, m easu r ed d ec l ines in the r ates of p iner ad ial gr ow th in par ts of the Sou th have att r acted ser iou s
Reductions in r ad ial gr ow th of p in e of 20 to30
_ per cen t have been m easur ed over l ar gear eas in the Sou th . If these r educt ionscon t inue and occu r thr oughou t the r eg ion ,
they wou ld have m ajor im pacts. Inven tori eswou l d be gr eat ly r educed , and p r ices forstumpage an d pr oducts wou ld r ise shar ply .
Employmen t and w ages and sal ari es in the
lumber and wood products in dustr y wou l dalso be gr eatly r educed .

r esu lt in a lar ge incr ease in softwood stum page pr ices overthe base pr ojections, especially for pu lpwood stum page . In
2030 , for example , pri ces for softwood pu lpwood stum p
age i n the Sou theast ar e 109 per cen t above the base (fi g .
Softwood sawtim ber stum page pr ices in the r egionare 7 1 per cen t h igher than the base . Softwood lum ber pr icesar e 19 per cen t above the base in 2030 .
Higher stumpage pr ices in the Sou th cause a“
sharp dr op in
softwood lum ber and plywood pr oduction . Ou tpu t in 2030
in the Sou th is billion boar d feet and billion squar efeet , respectively , under thebase : Rou nd pu lpwood con
sum pt ion for both har dwoods and softwoods is above thebase figur es as r oundwood r eplaces bypr odu cts obtainedfr om the m anufactu r e of lum ber and plywood .
Pr odu ct ion of softw ood lum ber ou tside the Sou th i s upslightly fr om the base levels. Softwood lum ber im ports ar em uch h igher— by billion board feet i n 2030 . H igher softwood stumpage pri ces also sh ift som e dem and to the har d
Price index (1 984 100)
wood r esou r ce i n the Sou th . Con sum pt ion of h ar dw ood
roundwood pu lpwood i s 300 m i ll ion cubic feet above thebase .
Reduced softwood tim ber har vests and the assoc iated r edue
tion s in lum ber and plywood pr oduc tion have a dr am aticim pact on em ploym en t and wages and salar i es i n the lumber and wood pr oducts industry (fi g . By 2030 , they
are on ly 66 per cen t of the base . In contr ast , ther e is littlechan ge i n em p loym en t i n the pu lp an d paper pr odu cts
indu stry .
Ther e ar e sim i lar effects on investm en ts in plan ts and equ ipm en t . Those i n the lum ber and wood pr oducts industry ar e
m uch r educed , by 24 per cen t in 2030 , wh i le those in thepu lp and paper indu stry ar e abou t the sam e . State and localgover nm en t revenues ar e m u ch r educed over the pr ojectionyear s, and by 2030 ar e over $ 12 bi ll ion below the baseestim ate .
Reduced tim er g rowth
Figu r e— Pr ojections of softwood pu lpwood stum page pri ce indexes i n the Sou theast , w ith and w ithou t r edu ced tim ber
gr ow th
2 18

Figu r e— Pr ojections of em ploym ent i n the lum ber and wood products industry in the Sou th , w ith and w ithou t r educed
timber gr ow th
For age pr oduc tion on t im ber land by 2030 is 2 1 per cen th igher than the base i n the Sou theast and 12 per cen t h igherin the Sou th Cen tr al r egion (app . table T he r educt ioni n tim ber gr ow th slow s dow n c losu r e , and the m o r e Open
canopy r esu lts i n incr eased for age pr oduction . Deer densities in the Sou th Cen tr al r egion ar e also slightly above thebase , a r eflection of the in cr eased acr eages in the ear ly forest successional stages. T he im pacts on deer i n the Sou theast and on tu rkey , r ed—cockaded woodpecker , and w ater
quan tity i n both r egions ar e sm al l . T he pr ojection sw ith r e
duced tim ber gr owth ar e abou t the sam e as those i n the
base .
Redu ced Nation a l For est T im ber H a r vestIn appr oxim ately the last two decades, i t has becom e incr easingl y clear that the futu r e of tim ber pr odu ction on the
nation al for ests depends i n par t on ( 1 ) su ccess i n find in gsu itable ways to in tegr ate tim ber pr odu ction w ith other u ses
of for est land , and (2 ) the need to pr otect and m a in tain the
for est en vir onm en t , in clud in g endan ger ed and th r eatened
spec ies. T o m any i t seem s likely that , as in the r ecen t past ,
ther e w i ll be incr easing constr a in ts on tim ber pr odu ction .
2 19
Th is sim u lation r esponds to such expectations by redu c ingthe base har vests fr om
,billion boar d feet a year to
billion . Th is decr ease in n ation al forest har vest is par tly off
set by changes in har vests of other owner s or i n other r e
gions. In r egion s wher e ther e ar e suffic ien t pr ivate tim bersupplies, decr eases in national for est har vest lead to h igherstumpage pr i ces that , i n tu r n ,
incr ease tim ber har vests fr ompr ivate lands. For examp le , the nat ion al for est har vest i nthe Pac ific Nor thwest—Westside is r edu ced by 96 m i ll ioncubic feet per year . Total ann u al har vest , how ever , is r educed by on ly 40 m i llion cubic feet by 2000 — pr ivate harvests having incr eased by 56 m ill ion cu bic feet per year . In
the Pac ific No r thwest ’sWestside ,these offsetting changes
can not be su stained after 2000 because of a w or sen ingtimber in ven tory situ ation . In other sec t ions, su ch as the

Rocky Moun tain , the r edu ct ion in nation al for est har vest i spar t ly offset thr oughou t the pr oject ion per iod .
Under th is sim u lation , softwood in ven tor ies ar e down fr omthe base n umber s in the Sou th an d the wester n section s, w iththe biggest dr op in the Pac ific Nor thw est . These declinesar e r eflected in intensified competition for the avai lable timber and h igher pr ices for softw ood sawt im ber stum page .
Those in the Pac ific No r thw est , .for exam ple , ar e 17 per
cen t above the base by 2030 (fig .
Softwood lum ber pr ices ar e 4 per cen t h igher in 2030 thanin the base sim u lation . Becau se of the lum ber pr ice in creases,total lum ber consum ption is dow n 2 per cen t and lumber impor ts fr om Can ada ar e up 1 1 per cen t by 2030 . T he incr easein lum ber im port s com es pr ogr essively after 2000 becausedom estic pr oduction i s r edu ced as a con sequen ce of the
lower tim ber inven tor ies and the associated h igher pr ices. By
2030 , dom estic lum ber pr oduction is 4 per cen t less than the
Pr iceinde-x (1 984 = 1 00)
Reduced nationa l forest ha rvest
base sim u lation . Ther e ar e differ en t im pacts am on g r egions.
T he lar gest im pacts ar e in the wester n sections, par ticu lar lythe Pac ific Nor thwest w ith i ts lar ge n at ion al for est r esou r ces.
Ther e ar e no sign ifican t impacts on the har dw ood r esou r ce
assoc iated w ith th is sim u lat ion . Im pacts on m ost other
econom ic and envir onm en tal m easu r es of change i n theSou th , such as in vestm en ts in plan ts and equ ipm en t , andw i ld life and fish popu lation s ar e also not lar ge enou gh tobe sign ificant .
Natu r a l Regen er at ion on Mar gi n a l C r op lan d an d Pastu r e
As show n i n tables and the Sou th h as abou t 22m i llion acr es of m ar gin al cr oplan d and pastu r e , in cludingh igh ly erod ible cropland , that wou ld yield h igher r ates of r etu r n to the owner s i f plan ted to pine . If cr op su rplu ses andthe associated depr essed far m cond it ions con tinue , th is landcou ld logically be expected to be am ong the fir st to be left
Figu r e — Pr ojec tions of softwood saw tim ber stum page pri ce indexes in the Pac ific Nor thw est , w ith and w ithou tredu ced n ational for est tim ber har vest

Billion c'
ub ic feet
Econom ic oppo rtun itieson cropland and pastu re
Fi gu r e— Pr ojections of softwood inven tori es on pr ivate tim ber land in the Sou th ,
w ith and w ithou t u til izing the econom icoppor tu n it ies on cr opland and pastu r e
im plem en ted, wou ld r aise net an nu al timber gr ow th bybill ion cubic feet , a 50 -
per cen t i n cr ease over cu rr en t softw ood gr ow th . Most of these oppo r tu n it ies— 50 m i l l ionacr es, b i l l ion cub ic feet— ar e on the other pr ivate ow n ersh ips.
These ar e the oppor tun ities that exist now , and som e of them
have been im plic it ly included in the base pr ojection s. As
descr ibed‘
i n chapter 3 , i t w as assum ed in m akin g the basepr oject ions that ther e w ou ld be lar ge in cr eases i n the ar eaof p in e p lan tat ion s,
in c lud in g the conver sion to p ine of
m ixed p ine—har dw ood and upland har dwood stands, and i ncr eases in tim ber yields r esu lt ing fr om gener al m an agem en tin ten sificat ion . These m an agem en t chan ges w ou ld ,
of
cou r se , be con cen tr ated on the lands w ith the h ighest potential for econom i c r etum s— the tim ber lands iden tified in chap
ter 5 . Despite the l im itation s descr ibed above , the im pacts of thesim u lation of the econom ic oppor tu n ities on pr ivate tim ber
T he an alysis of econom ic oppor tun it ies in chapter 5 w as lands ar e substan tial . Softw ood tim ber suppl ies (har vests) ,m ade w i th the base pr ojections of stum page pr ices. As the net annu al gr ow th , and in ven tor ies ar e al l h igher than the
222
econom ic oppor tu n ities ar e u ti lized an d t im ber in ven tor iesin cr eased in th is sim u lation , stum page pri ces ar e lower ed .
Con sequen tly , the econom ic oppor tun it ies ar e r educed . In the
final equ i libr ium so lu t ion i n th is sim u lat ion , the poten tialin cr ease in net annu al gr ow th on pr ivate t im ber land is m uchbelow the bill ion cubic feet show n i n append ix table
In addition , i t w as not pr act ical to qu an tify the impacts of the in term ediate stand tr eatm en ts, and those not
invo lving ar ea change in m anagem en t types, in the analyt i
cal system s used i n pr ojecting r esou r ce chan ges. Th is factis im por tant because i t r esu lts in exc ludin g abou t hal f of thear ea w ith econom ic oppor tu n ities to in cr ease net annu algr owth . Finally , because of the t im in g of im plem en ting theoppor tun ities, the fu ll incr ease i n t im ber gr ow th cou ld not
be r ealized by the end of the pr oject ion per iod .

base pr ojection s— 48 per cen t for in ven tor ies in 2030 (fig .
T he in cr ease in net annu al gr ow th i s billion cu
b ic feet , less than half the total poten tial . T he incr eases i ninventor ies and in net annu al grow th ar e con cen tr ated on
the other pri vate owner sh ips. Th is mean s that the bu lk of the
econom ic oppor tun ities on for est industry lands have beenimpl icitly in cluded i n the base pr oject ions.
As a r esu lt of the incr ease i n inven tor ies and har vests,stum page pr ices for saw tim ber and pu lpwood in the Sou thar e r educed below the base and substan tially so for pu lpwood . In add it ion , pr ices for softwood saw t im ber stum pagear e lower i n the western section s, espec ially in the Pac ificNor thwest . Softwood lum ber pr ices ar e also down .
In r esponse to the lower pr ices, softwood lum ber pr oduction in the Sou th r ises and by 2030 i s billion boar d feetabove the base . Softwood plywood pr oduction and consump
tion of softwood p lant byproducts ar e also up , but consum p
tion of softwood r oundwood pu lpwood i s down sl ightly .
Softwood lum ber im por ts in 2030 ar e r educed by abou tbill ion boar d feet fr om the base pr ojection s.
In r esponse to incr eased pr odu ction of softwood lum berand plywood , em ploym en t and w ages and salar ies in thelumber and wood pr oducts industr y ar e 14 per cen t above“
the
base levels. Investm en ts i n plan ts and equ ipm en t in the industry ar e also som ewhat h igher . In add ition , State and 10
Figu r e— Projection s of softwood inven tor ies on pr ivate ow ner sh ips i n the Sou th ,
w ith and w i thou t u t i l izin g the econom icoppor tun ities on pr ivate t im ber land
22 3
A substan tial par t of the econom ic oppor tun ities invo lve theconver sion of m ixed pine—har dwood or hardwood stands to
pine plan tat ions or the establishm en t of pine plan tations after har vest . As a r esu lt , har dwood inventor ies in the Southar e r edu ced fr om the
'
base by over 30 bill ion cubic feet by2030 . Most of the dec l ine i s in the sou theast . Ther e i sanassoc iated incr ease in har dwood stumpage pr ices, by 65 percen t by 2030 i n the Sou theast . Ther e is a r elated decr easei n pr odu ction of hardwood lum ber and in con sum pt ion of
har dwood pu lpwood .

cal gover nm en t r evenu es ar e up , by near ly $9 bill ion by2030 .
For age pr odu ction on tim ber land is abou t 15 per cen tabove the base levels i n bo th r egion s over the pr ojec tionper iod . Tu rkey popu lations in the Sou th Cen tr al r egion and
trou t num ber s i n the Sou theast ar e up abou t 5 per cen t and10 per cen t , r espectively . Deer popu lation s ar e also h igherin the Sou theast . T he num ber of cou n ties w ith r ed - cockaded
woodpecker co lon ies, on the other hand , i s dow n i n bothr egions and par t icu lar ly so in the Sou th Cen tr al r egion , a r e
sponse to the incr eased loss of ar ea i n n atu r al pine .
Water yields in the ear ly par t of the pr oject ion ar e abovethe base bu t fal l below i n the latter par t of the per iod .
Al l Econ om ic Oppor tu n i t ies on P r i vate Lan ds
T he two pr eced ing sim u lation s descr ibe the im pacts ofim plem en tin g the econom ic oppor tun ities to p lan t p in e on
Billion cubic feet
Econom ic opportun itieson private timber land ,cropland and pastu re
m ar ginal cr opland and pastu r e and to in cr ease tim ber suppl ies on pr ivate tim ber lands (except ing in term ed iate stand
tr eatm en ts and those not in vo lving ar ea change) . In th issim u lat ion , bo th types of oppor tun it ies ar e com bined . It
seem s r easonable to expect that policies an d pr ogr am s w il lbe developed i n the fu tu r e that w i ll lead at least in par t tothe u tilization of both types of oppor tu n it ies.
Figu r e— Pr ojection s of softw ood inven tor ies on pr ivate owner sh ips i n the Sou th ,
w ith and w ithou t u til izing the econom icoppor tun ities on pri vate tim ber land , cr opland and pastu r e
224
As m ight be expected , th is sim u lation show s the lar gestimpacts on the softwood t im ber r esou r ce and the assoc iatedpar ts of the econom y of al l the fu tu r es tested . For exam ple ,
by 2030 , the softwood in ven tor y i n the Sou th is n ear lydoubled , go ing up fr om the base level of 89 bill ion cubicfeet to 168 billion (fig . app . tables and Th isr ise r eflects an incr ease i n net annu al gr ow th ,
w h ich goesup by a th ird over the base by 2030— fr om to billion cubic feet . All of the incr eases in net ann ual gr ow th ar e
on the other pr ivate owner sh ips. Ther e i s a sm all dr op i ngr ow th on the for est indu stry ow n er sh ips.

Economic opportun ities on pr ivate
. 1 990
Figu r e — Pr ojection s of softwood pu lpwood stumpage pr ice indexes in the Sou theast r egion , w ith and w ithou t u ti l iz ingthe econom ic oppor tun ities on pr ivate tim ber land , cr opland , and pastu r e
Implem en t in g the econ om ic oppor tun ities to in cr ease timber suppl ies on tim ber land w ou ld in volve the conver sion of
substan tial ar eas of pr esen t m ixed p ine—har dwoods and up
land har dwood stan ds to p ine plan tat ion s. As a r esu lt , netannu al har dwood gr ow th and inven tor ies ar e r educed . By
2030 , for exam ple , the har dwood inven tor ies on pr ivate timber l ands ar e 29 per cent , or som e 28 bill ion cubic feet , below the base pr oject ion s.
T he r edu ction in har dwood net an nu al gr ow th and inven
tor ies causes fair ly lar ge in cr eases in the pri ces of har dwoodsaw timber stum page . T he in cr eases ar e lar gest in the In cr eased Man agem en t In ten si ty on For est In du str ySou theast , wher e by the end of the pr oject ion per iod they T im ber l an ds in the Dou glas- fir Reg ion
ar e 62 per cen t above the base level . These h igher stum page pr ices in tur n ar e r eflected in h igher pr ices for har d T he above sim u lation show s the im pacts th at flow fr omwood lum ber and i n low er lum ber dem and and pr oduction . u t ilizing the econom ic oppor tu n it ies to in cr ease net ann ualHar dwood lum ber pr odu ction i n 2030 i s n ear ly a half bil tim ber gr ow th in the Sou th . It also indicates that n ear ly al l
lion boar d feet below the base pr ojection . Har dwood pu lp of the econom ic oppor tu n ities to establish pine plan tationsw ood con sum ption , both r oundw ood and plan t bypr odu cts, on indu stry lands ar e al r eady in the base pr oject ions. Th isis also r educed . in tu r n r eflects the fact that the exper ts w ho developed the
226
As a r esu lt of the incr ease in softwood lum ber pr odu ction ,
em ploym en t in 2030 in the lum ber and w ood pr oducts indu stry i s up by people over base employm en t .
Wages and salar ies in the industr y show a pr opor tional ri se .
In vestm en ts in plan ts and equ ipm en t ar e also up
substan tially . Ther e is l ittle change , however , i nem ploym ent , w ages and salar ies, and investm en ts in the pu lpand paper pr odu cts indu stry . By 2030 ,
State and local gover nm en t r evenues ar e $38 bill ion above the base , w ith m ostof the incr ease i n the Sou theast .

tim ber supply assum ptions for the base projections expectedthat for est indu str ies ar e likely to u ti lize the econom ic op
por tun i ties to incr ease net ann ual gr ow th on their lands.
What is likely on the for est indu stry owner sh ips in theSou th i s pr obably equ ally likely on the for est indu stryowner sh ips in the Douglas- fi r r egion in Or egon and
Wash ington ,the Nation ’
s other m ajor tim ber - gr ow ing ar ea .
Th is sim u lation r esponds to that possibil ity : What wou ldhappen i f for est industry owner s took advan tage of al l the
econom ic oppor tun ities to incr ease tim ber grow th on theirlands i n the Douglas- fi r r egion?
Th is sim u lation does not show m uch im pact on tim berr esour ces in the Sou th or i n tim ber -
pr odu cing r egions otherthan the Pacific Nor thwest . Ther e , net annual softwood timber gr ow th is incr eased by 64 per cen t by 2030 (fi g .
and softw ood inven tor ies by 4 1 per cen t over the baseproject ions.
Althou gh the r esou r ce is not m uch affected i n the Sou th ,
softwood saw tim ber and pu lpwood stumpage pr ices decr easei n the Sou th Cen tr al r egion and incr ease sl igh tly i n theSou theast fr om the base . T he biggest im pact on softwood
stumpage pr ices is in the Pacific Nor thwest . In 2030 ,those
pr ices ar e 29 per cen t under the base .
Because of the l im ited impacts on the tim ber r esou r cein the Sou th , ther e ar e no sign ifican t chan ges in the assoc iated econom ic and envir onm en tal m easu r es su ch as employ
Figu r e - Pr ojections of softwood net an nu al gr ow th on pr ivate tim ber land i n the Pac ific No r thwest , w ith and w ithou tincr eased m anagem en t in tensity on for est indu stry ow ner sh ips in the Douglas- fi r r egion
227
Th is stum page pr ice dec line affects softwood lum ber pr oduction i n the Pac ific No r thwest . In 2030 ,
i t is bill ionboar d feet above the base level . Softwood lum ber production i s abou t the sam e as the base levels in the Sou th and
in the other produc ing sections. Softwood lum ber pr ices ar ereduced but ar e on ly5 per cen t below the base in 2030 . Soft
wood lum ber impo r ts ar e also dow n , by abou t billionboard feet in 2030 .

m en t and investm en ts. They ar e al l m uch the sam e as the
base .
H igh l i gh ts of the Im p l i cat ion s of Resou r ce Ch an ges
T he h igh ligh ts of the im p l ication an al yses ar e:
l . T he base pr ojection s of r esou r ce changes ar e thepr oduct of tim ber land m anagem en t that i s m u ch m or e imtensive than that pr acticed today . They r eflect what w ou ldhappen i f ther e con tinues to be m ajor pr ogr ess i n for estr yin the Sou th and con tinued expan sion in the techn ical andfinancial assistance , pr otect ion , r esear ch , edu cation , and
m anagem en t pr ogr am s that have br ough t abou t the impr ovedforestr y situation in the Sou th in the past .
Incr eases i n tim ber har vests even w ith th is m o r e in tensive m anagem en t ar e too sm al l to sustain pr esen t levels ofemploym en t in the for est industri es. By 2000 , em ploym en tis dr opping ; by 2030 , employm ent w ill be som e 2 1 per cen t ,
or people , below 1984 levels. Wages and salar iesalso decline after 2000 .
T he dr op in em ploym en t and in com e is of gr eat econom ic impor tance in the Sou th . T he effects w i ll be m u ltiplied as they ar e spr ead thr ough other sector s of the econ
om y providing goods and ser vices to for est in du str ies . A lossof em ploym en t i n the lum ber and wood pr odu cts industrywou ld be m u ltipl ied by a factor of a loss in the pu lpand paper indu stry , by
2 . T he analyses qu an tified the extensive in ter dependen ceam on g r egion s, ownersh ips, and tim e peri ods. Any changein the dem an d—supp ly situ at i on i n on e r egion affects the
dem and—supply situ ation i n al l other r egions. Likew ise , any
change on public or pr ivate lands w il l be offset i n part by
changes on other ow ner sh ips. Changes i n the dem andsupply situ ation in any on e tim e per iod w i l l affect the situa
tion in follow in g per iods. As a r esu lt of th is i n ter dependence , a
_
chan ge , su ch as the r ecen t im posit ion of a
Canad ian tax on softw ood lum ber expor ted to the Un itedStates, that m ay be desir able fr om on e standpo in t can have
effec ts,.
su ch as h igher dom est ic stum page and pr odu ct
pr ices, that ar e undesir able fr om another standpo in t .
3 . Many of the al tem ative fu tur es analyzed have l itt leor lim ited impact on the tim ber r esou r ce and the assoc iatedpar ts
r
of the econom y and the envi r onm en t . Som e ,
however , do have sign ifican t im pacts.
228
Impr ovem en ts in pr ocessin g effic iency can extend t im bersupplies and r esu lt i n a substan tial r edu ction i n the r ates of
incr ease in softwood lum ber an d softwood stum page pr ices.
T he stum page pr ice incr eases have r elatively l ittle effecton the pu lp and paper industr y . Roundwood pu lpwood consum pt ion for bo th softw oods and har dwoods i s above thebase figu r es as r ou ndw ood rep laces bypr oducts lost w iththe r edu ction in lum ber and plywood pr oduction . Ther e ar e
very sm al l incr eases in em ploym en t and w ages andsalar ies.
T he r eductions i n tim ber land ar ea sim u lated i n th is an al ysis have r elatively l ittle im pact on the t im ber r esou r ce and
the associated par ts of the econom y and envir onm en t .
However , th is lar gely r eflects the t im ing of the assum ed
r eductions i n area— the changes i n the fir st decades ar e toosm al l to show up in a sign ifican t w ay . In the last decadesof the pr ojection per iod , ther e ar e sign ifican t r eductions inboth net an n u al gr ow th and in ven tor ies . In the decades
beyond 2030 , the assum ed loss i n tim ber land ar ea (11 m i l
lion acr es) wou ld have lar ge im pacts on the r esou r ce and theeconomy .
T he 25 -
per cen t r eduction i n net an nual gr ow th on pineplan tations, n atu r al p ine , and m ixed p ine—har dw ood stands
sign ifican tly affects the r esou r ce situation and the assoc iated par ts of the econom y and en v ir onm en t . By 2030 ,
softwood inven tor ies ar e 3 1 billion cubic feet , or 35 per cen t ,below the base pr ojections. Ther e ar e r elated and lar geincr eases in stum page and lum ber pr ices. These in cr eases,in tu r n , cau se a sharp dr op i n lum ber and p lywoodpr odu ction . Softwood lum ber p r odu c t ion i n the Sou th i n2030 , for example , is r educed fr om billion boar d feetto billion . Th is has a dr am atic im pact on em ploym en tand wages and salar ies i n the lum ber and wood pr oductsindustry ; by the year 2030 , they ar e on ly 66 per cen t of thelevels in the base pr ojections.
Ther e ar e oppor tun it ies to in cr ease net annu al tim bergr ow th by bill ion cubic feet by plan t in g p ine on m ar
gin al cr opland and pastu re , includ ing h igh ly er odible land .
Becau se of the tim i n g of the p lan tin g , not al l of th is can ber ealized in the pr ojection per iod . However , the im pacts ar esubstan tial . By 2030 , softwood tim ber in ven tor ies ar e 38 b ill ion cu bic feet , o r 43 per cen t , above those i n the basepr oject ion s. Softw ood lum ber and plywood pr oduction in theSou th ar e also up ; i n the case of lum ber , by bill ionboar d feet , or 8 per cen t . Em ploym en t - and w ages and salar ies w ou ld also be above the base bu t sti ll show a big decl ine fr om pr esen t levels.

reduced tim ber gr ow th ; the sm al lest dr op is assoc iated w ithplan ting p ine on m ar gin al cr op lan d and pastu r e com binedw ith implem en tin g the econ om ic Oppor tun ities on pr ivatetim ber land .
Finally , the analyses show that i t takes lar ge changes inthe factor s affecting timber dem and or supply to sign ifican tlyalter the upw ar d trends in pr ices and the dec lin in g tr endsin employm en t . Bu t lar ge chan ges
_can be accomplished . For
example , i f al l the econom ic oppor tun it ies to incr ease net
ann ual gr ow th tim ber on tim ber land w er e u ti lized and
m ar ginal cr opland and pastu r e w er e plan ted to p in e , as
descr i bed in chapter 5 , net an nu al t im ber grow th cou ld intim e be incr eased by bill ion cubic feet . Th is is enoughtimber to sustain the for est in du str ies i n the Sou th and em
ploym en t and w ages and salar ies.
As descr i bed in the fo llow ing chapter , con tinued incr easein tim ber gr owth in the Sou th can be ach ieved , and i t can
be ach ieved econom i cally . T he r ates of r etu r n on the investm en ts necessary to im plem en t the oppor tun ities to incr easenet annual gr owth wou ld be com par able to the lon gr un average in the pr ivate sector . Bu t ach iev ing the poten tial w i llr equ ir e an expansion i n the public and pri vate pr ogr am s of
techn ical an d fin an c ial assistan ce , pr otection , r esear ch ,
edu cation , and m anagem en t that goes far beyond anyth in gexper ienced to date .
Jo in t Cou n c i l on Food an d Agr icu l tu r a l Sc ien ces . 1984 . Refer encedocum en t : needs assessm en t for the food and agr icu l tu r al sc iencesWash ington , DC : Jo in t Counc i l on Food and Agr icu l tu r al Sc iences.
3 28 p .
H aygr een , J G r eger sen , H . ; H ol lan d , I . ; Ston e, R . 1986 . T he eco
nom ic im pact of t im ber u t i l izat ion r esear ch . Fo r est Pr oduc ts Jou r n a l .12—20 .
Skog , K . ; H ayn es, R . 1 987 . T he stum page m arket impact of t imberu ti l ization r esear ch . For est Pr oducts Jou rn al . 54—60 .
U.S. Depar tm en t of Agr icu l tu r e, For est Ser vice . 1982 . Analysis of thetimber situation in the Un ited States, 1952—2030 . For . Resou r . Rep .
Wash ington , DC : U .S. Depar tmen t of Agri cu l tu re , Forest Service .
499 p .

Oppor tu n i t ies for In c r easi n g T im ber
Su ppl ies T h r ou gh Mor e In ten sive
For estr y
Lar ge acreages of tim ber land in the Sou thar e not pr oduc ing at their poten tia l . Suchstands can be overr n atur e , poor ly stocked ,
stocked w ith undesir able spec ies, orsuppressed by competing vegetation .
Substan tial areas that cou ld prOfitably growtimber are not stocked at al l .
T he pr eced ing m ater ial i n th is study has descri bed whatis likely to happen to the sou ther n tim ber r esou r ce , and the
assoc iated sector s of the econ om y and other r en ew abler esour ces, i f cu r r en t expectat ion s abou t econ om i c gr ow th ,
changes in tim ber land , tim ber m an agem en t pr actices, andal l the other factor s affecting tim ber dem and and supply ar e
realized . As explained ear l ier , th is ou tlook can be changedthr ough the imp lem en tation of var i ou s pol ic ies, pr ogr am s,or legislation option s cu r r en tly being consider ed . T he ef
feets of those pol ic ies and pr ogr am s pr esen ted in chapter 4
show that i f econom ic gr t i n the for estry sector— in em
ploym en t and i n w ages and salar ies— i s to be su stained i nthe Sou th , i t w i l l be necessary to incr ease tim ber suppl iesgr eatly .
T he basic pu rpose of th is chapter is to qu an t ify the op
por tu n i ties to incr ease tim ber suppl ies th r ough the pr act iceof m or e in tensive for estry . T he an alysis is divided in to twopar ts: (1) the econom ic oppo r tu n ities on tim ber land , and
(2 ) the oppor tun ities on m ar ginal cr opland an d pastu r e ,
inc lud ing h igh ly er od ible land , that wou ld yield h igher r atesof r etu r n to the ow ner s i f p lan ted to p i ne or al lowed to n atu
r ally r ever t to for ests.
Data Base, An a l ytica l Str u ctu r e, an d Assum p t ion s
For the pu rpose of an alyzing the econom ic Oppor tun ities,the acr es need ing tr eatm en t wer e c lassified on the basis ofn ine tr eatm en t needs, fou r owner sh ips, thr ee site classes, andsix for est m an agem en t types, inc lud in g non stocked land ,
as detailed below , an d 52 sub - State r egion s as show n in figu r e
Past stud ies and data col lected as par t of the in ven tor iesof the for est r esou r ces of each State show that ther e ar e m i l
lion s of acr es of tim ber land in the Sou th that ar e not pr o
du c ing tim ber at their poten tial . Lar ge acr eages cou ld bem anaged to gr ow h igher wood vo lum es per acr e , m or e pr e
fer r ed species, or h igher valued pr odu cts. Oppor tun ities toincrease t im ber supp l ies exist on stands that ar e poor lystocked , have competing vegetation , have offsite species, ar eover rn atur e , or ar e in som e other less pr oductive cond ition .
The acr es that cou ld be tr eated , thei r location and owner sh ip ,
r ates of retu r n on r ecomm ended tr eatm en ts, and the add itional vo lum es of t im ber that cou ld be pr odu ced thr ou ghm or e in tensive m anagem en t ar e descri bed below .
Tim ber lan d Ar ea Need i n g Tr ea tm en t— T he pr im arystatistical base for the an alyses of Oppor tu n ities to incr easetim ber suppl ies w as the data on tim ber land ar eas need in gtr eatm en t to im pr ove pr oductivity com piled for each S tateby the For est In ven tory and An alysis u n its of the Sou theaster n and Sou ther n For est Exp eri m en t Station s. Though them ost r ecen t S tate data available at the star t of th is studywere used , the year of co llection r an ged fr om 1976 to 1986 .
T he acr es need ing tr eatm en t ar e show n i n table for
each S tate , by owner sh ip . T he data i n table 5 . 2'
show the
d istr ibu tion of acr es for the en ti r e Sou th , by for est m an agem en t type and tr eatm en t n eed .
In the Sou theast , - the for est inven tor y ,field cr ew s exam
ined sam ple p lots and r ecomm ended spec ific tr eatm en t oppor tu n i t ies to cor r ect stand deficiencies and im pr ovepr odu ct ivity . They iden t ified 43 per cen t of al l Sou theasttim ber land , abou t 37 m il lion acr es, as'
needing som e
tr eatm en t . In the Sou th Cen tr al r egion , tr eatm en t oppor tun ities wer e determ i ned by applying tr eatm en t selecti on cri ter iabased on spec ific plot cond ition s of for est m an agem en t type,
tr ee size , stock in g , an d o ther stan d par am eter s . In the
Sou th Cen tr al r egion , 46 per cen t of t im ber land , abou t 45m il l ion acr es, needed tr eatm en t . Both m ethods pr odu ced
compar able in form at ion on tr eatm en ts needed to in cr easetim ber pr odu ction .

Figu r e— Sub - S tate r egions used in an alyzin g econom ic
tr eatm en t Oppor tu n ities
Tr eatm en ts:
Regener ate w ith site pr epar ation .
Regener ate w ithou t site pr epar ation .
Conver t stand to pr efer r ed species.
Pr ecomm er cial th in seed l in gs and sapl ings.
Comm er c ial th in polet im ber stands.
Stockin g con tr o l , c lean in g , or r elease .
Clear cu t overm atu r e tim ber and r egener ate .
Salvage dam aged tim ber and r egener ate .
NO tr eatm en t needed .
Ow ner sh ips:
Nation a l for est .
Other public .
1 .
2 .
3 . For est indu stry , inc lud in g leased p r ivate lands.
4 . Other pr ivate , in c lu d in g farm er , cor po r ate , an d
other ind ividu al .
S ite c lasses:
1 . H igh sites (those gr ow ing 85 cubic feet per acreper year ) .
2 . Medium sites (those grow ing 50—85 cubic feet peracr e per year ) .
2 34
3 . Low sites (those gr ow in g 20—50 cubic feet peracr e per year ) .
For est m anagem en t types:
1 . Nonstocked land .
2 . Pine plan tation s ( lob lo l ly/Shor tleaf and longleaf/slash ) .
3 . Natu r al pine (loblo l ly/Shor tleaf and longleaf/sl ash ) .
4 . Mixed pine—har dwoods (oak—p ine) .
5 . Upland har dwoods (oak—h ickory) .
6 . Bottom land hardwoods
Man agem en t Opt ion s— Tim ber m an agem en t opt ion s, or
sets of m an agem ent pr actices, wer e developed for each combin at ion of tr eatm en t , for est m an agem en t type , and sitec lass. Althou gh m any m an agem en t options ar e possible ,
on ly one option w as selected and evalu ated for each gr oupof acr es. In m ost c ases, bu t not al l , the selected m anagem en t option w as to establish pine plan tations.
All m an agem en t Options for tr eated stands wer e car r iedou t for th r ee to five fu l l r otat ion s, a m i n im um of 150
year s . In cases w her e p in e p lan tat ion s w er e establ ished ,
these wer e con tinued i n subsequen t ro tat ions. Th is m ethodwas used to establish a con sistent investm en t per iod for compar ison w ith cost and r evenue expectation s fr om sim ilar ,bu t un tr eated , stands.
Bottom land har dwood stands wer e not con ver ted to pineexcept in cases wher e stand conver sion w as r ecomm endedas the needed tr eatm en t by for est inven tory data . Natur alp ine ,
m ixed p ine—har dwood ,
“
and upland har dwood for estm an agem en t types on low sites w er e assum ed to be m an
aged by n atu r al r egen er at ion m ethods i n m ost in stances.
On ly i n cases wher e site pr epar at ion w as r equ i r ed forr egener ation , salvage , or type conver sion of low sites forthese types d id m anagem en t option s include ar tificial regencr ation to pine plan tations.
T he same base Option s wer e u sed for al l owner sh ips andpr odu ction r egion s because data avai l ab le w er e in suffic ien tto develop con sisten t sets of options for d iffer en t ownersh ip classes or r egions . Each m an agem en t Option spec ifiedthe m anagem en t activities r equ ir ed , t im in g of tr eatm en tsand har vests, timber yields, for est types, and stocking levels.
These factor s wer e u sed to develop pr ojected cash - flow s.
Separ ate options wer e developed for m an aged andunm an aged stands. T he tr eated Option w as u sed to pr ojectr esu lts i f spec ific m anagem en t pr actices wer e app l ied to increase pr oductivity . T he un tr eated option was used to determ ine expected tim ber har vests for u n tr eated stands.

Managem en t option s wer e also developed for each u h
treated stand cond ition to r eflect oppo r tun ity costs. Min im al cu stod ial m anagem en t w as assum ed to con tinue forthese cases indefin itely . In m ost cases, r otation ages wer elonger , yields and stocking levels wer e lower , expected r evenues wer e lower , and costs were m in im al or zer o . These untr eated stands wer e car r ied for two to four r otation s, alsoa m in im um Of 150 year s for c om par abil ity . For al l for est
m anagem ent types except upland and bo ttom landhardwoods, for est succession w as assum ed to occu r followi ng har vest . Natu r al p in e stan ds wer e assum ed to r ever t
even tu ally to upland hardwoods after 100 to 150'
year s i f
not tr eated follow ing har vest . T he fin anc ial con sequences ofthese cond itions wer e factor ed in to the fin anc ial an alyses.
Many spec ific assum ptions on cu r r en t stand ages, stocking levels and vo lum es, r otation ages, r egener ationsur vival , th inn ing ages, and r esponses to tr eatm en ts wer er equ ir ed in order to constr uct each m anagem en t option . Al
though al l assum ption s ar e not detai led her e , the stand cond itions and m anagem en t opt ions com m on ly assoc iated w itheach tr eatm en t ar e br iefly descr ibed next .
Regen er a te Wi th Si te P r ep a r a ti on— These acr es lack a
m an ageable tim ber stan d -becau se o f in adequ ate gr ow in gstock . Gr owth w ill be consider ably below poten tial for thesite i f the ar ea is left alone . Th is tr eatm en t Category con
T he largest oppor tun ity to incr ease net
annual timber gr ow th in the Sou th is thr oughsite pr epar ationand r egener ation . Fou r
kinds of pr oper t ies can benef it fr om th istreatment : nonstocked tim ber lands w ithcompeting vegetat ion , cu tover l ands w ithr esidual tr ees, poor ly stocked lands severelyovercu t or h igh -
gr aded in the past , and
stands w ith few tr ees to be clear ed befor e
reforestation .
235
ta ins the gr eatest n um ber of ac res . Exam p les of thesestands ar e non stocked lands w ith com peting“ vegetation r e
qu ir ing site pr epar ation , cu tover sites w ith r esidu al stem s,
poor ly stocked stands sever ely over cu t or h igh - gr aded in thepast , and stands w ith low stocking r equ ir ing c lear ing befor e refor estation . T he r ecomm ended tr eatm en t is to prepar e
the site and r egener ate by natu r al or ar tific ial m ethods. Al
though natu r al r egener ation i s a viable Option for som e sites,the establishm en t of pin e p lan tations on m ost sites w asevaluated . Th is tr eatm en t r epr esen ted a conver sion to plan tedpine for most for est m an agem en t types. Natu r al r egener ation was evaluated for bottom land har dwoods on h igh sites.
Regen er a te Wi thou t Si te P r epa r a tion— These acr es lacka m anageable tim ber stand because of inadequ ate gr ow in gstock . Althou gh these stands w i ll even tu ally r egener ate nat
u r al l y w ithou t tr eatm en t , gr ow th w i ll be consider ably belowpoten tial i f they ar e left alone . Pr ospects ar e not good foradequate natu r al r egener ation on m ost sites. Exam ples ofthese sites inc lude nonstocked land w ith l ittle vegetat ion ,
r ecen tly har vested stands w ith few r esidu a ls, fa i led n ew
plan tation s, and sim i lar stands. T he r ecomm ended tr eat
m en t is to plan t w ith little or no site pr epar ation . T he m an
agem en t option eva luated on m ost sites w as to plan t pine .
Natu r al r egener ation was evaluated for al l bottom land har dwood sites and upland har dwood or m ixed p ine—har dwoodstands on low sites.
Con ver t Stan ds of Un desi r able T r ees to P r efer r edSpecies
— These ar e stands of undesir able , chr on icallyd iseased , or offsite spec ies . Gr owth an d qu al ity w i l l becon sider ably below poten tial i f these stands ar e left alone .
Examples of these stands inc lude slash pine in ar eas subjectto sever e idez storm s, p ines heavily in fested w ith fu siformor other d iseases, som e har dwood stands on pine sites, andstands w ith less prefer r ed spec ies d istri butions. No inform at ion was ava i lable fr om su r vey data to ind icate spec ificlim itations on these acr es. T he r ecomm ended treatm en t is
to conver t stands to a d iffer en t forest m anagem en t type or
spec ies. Establishm ent of pine plan tations was evaluated foral l sites.
P r ecomm er cia l T h i n Over stocked Seedl ing a n d Sap l ing
Sta nds— These stands ar e densely stocked and likely to stag
nate i f not tr eated . Exam p les of these sites inc lude p ineplan tations w ith m any vo lun teer stem s, doghar
'
r n atu r al p inestands, har dwood th ickets, and sim i lar young , u nm er chan table stands w ith too m any tr ees per acr e . T he r ecomm ended
tr eatm en t i s to r educe stockin g by pr ecom m er c ia l th inn ingto help cr op tr ees attain dom in ance .

Comm er c ia l T h in Den se P o letim ber Sta nds— These ar e
po l et im ber stands w ith den se gr ow in g stock . Exam ples ofthese stands ar e over stocked n atu r al and plan ted pine standsin need of th inn ing and well - stocked har dwood stands needing pu lpwood r em oval . T he r ecomm ended tr eatm en t is to
r edu ce stocking by comm er cial th inn ing to pr even t stagn ation and con fin e gr ow th to few er bu t h igh - qu al ity cr op
tr ees. Th is m an agem en t option inc luded th in n ing , gr ow ingto r otation age , and then conver tin g to pine plantations w ithsite pr epar ation on al l sites. Bottom land har dwood sites andm ixed pine—har dw ood or up land har dw ood stands on low
sites wer e n atu r ally r egen er ated after fin al har vest .
Con tr o l Stocki ng of Un desi r able T r ees— These ar e
stands w ith adequ ate seed l in g , sapl in g , and/or po letim bergr ow ing stock m ixed w ith com peting vegetation either overtopp in g or otherw ise inh ib itin g the deve lopm en t of cr op
tr ees. These stands ar e adequ ately stocked , bu t less desirable stem s i n the stand ar e lim iting the gr ow th of crOD '
trees.
Exam ples ar e pine stands w ith en cr oach ing har dw oodcompet it ion , m ixed p ine—h ar dw ood stan ds i n w h ich p inegr ow th i s r edu ced by less desir able har dwood tr ees, andhar dwood stands w ith com petit ion fr om undesir able spec iesor trees w ith poor form . These stands need deaden ing orr emoval of cu lls, wolf trees, or other stem s that w ill not ear nan adequ ate r etu r n . T he r ecomm ended tr eatm en t is to
con tr o l stocking of u ndesir able tr ees w ith m echan ica l o rchem ical m ethods in or der to r elease over topped tr ees, topr event stagn ation , and/or impr ove composit ion , form , or
gr ow th of the r esidual stand . Managem en t option s evaluated the timber stand impr ovem en t tr eatm en t and subsequen tr egener ation to pine on m ost sites fol low ing final har vest .
Many acr es of over stocked stands in the
Sou th need th inn ing to preven t standstagnation and enh ance the gr ow th of
fewer , bu t h igher qual ity , trees.
236
H a r vest Ma tu r e or Overm a tu r e Sawtim ber Stan ds a n d
Regen er a te— These ar e m atu r e or overm atu r e sawtim ber
stands w ith suffic ien t volum e to ju stify a comm er c ia lhar vest . They ar e adequ ately stocked older stands past financ ial m atu r ity . Most stands con tain valuable saw tim ber andcou ld be held , bu t the volum e an d value gr ow th r ate of a
r eplacem en t stand wou ld be h igher . T he r ecomm ended treat
m en t is to c lear cu t the stan d and r egener ate by n atu r al orar tific ial m ethods. Establishm en t of new pine plan tationsw as assum ed on m ost sites, w ith n atu r al r egener at ion on
som e low sites and bottom land har dwood sites.
Sa l vage Dam ag ed T im ber a n d Reg en er a te— These ar e
stands w ith excessive dam age to m er chan table tim ber due tofi r e , insects, d isease , w ind , ice , o r other destr uctive agen ts.
These stands m ay con tain u npr odu ctive ar eas wher e tim berhas been lost , tr ees have br oken tops,
or wher e dam agefr om insects or d iseases w i ll incr ease u n less the stand i s
har vested . Becau se these stands ar e sever ely dam aged , av
er age gr ow th and yields of h igher valu ed produ cts ar e sigmifican tl y r educed . T he r ecomm ended tr eatm en t i s har vest orr em oval of dam aged or th r eaten ed t im ber , fo l lowed byregener ation . T he managem ent option s cal led for imm edi
ate har vest of r em ain in g t im ber and plan ting to p ine i nm ost cases.
Most of the m anagem en t option s descr ibed above ar e di
rected toward pine pr oduction . Many , bu t not al l , of these
can yield r etur n s on the needed investm ents that wou ld m eetor exceed the lon gr un aver age r ate of r etur n to capital inthe pr ivate sector . An infin ite var iety of stand cond ition sexists, and som e of these tr eatm en ts m ay be in appr opr iatefor som e acr es w ith in each category . Many other m anagem en t Options, includ in g n atu r al r egener at ion , m ay be
feasible and yield adequate r etur n s on in vestm en t . Howeverthe m anagem en t options evalu ated wer e l im ited pr im ar ilybecause a goal of th is study w as to determine poten tial incr eases i n tim ber volum e , par ticu lar ly pine , from m or e in
ten sive m anagem en t . T he pr ocess used thr oughou t thi s studycou ld be u sed equ a lly w el l to assess other m anagem en toptions.
P r ices— Stumpage pr ices used for anal yses of tim ber investm en t oppor tun ities w er e based on aver age 1985 stum pagepr ices taken fr om Tim ber Mar t— Sou th (Nor r is T he
r ange of 1985 stumpage pri ces u sed for each S tate i s shownin table Fu tu r e expected r eal pr ices wer e based on the
base pr ice pr ojection s shown i n chapter 4 . Indexes of pr iceswer e developed for p ine pu lpw ood , p ine saw tim ber , an dhar dw ood saw tim ber . Har dw ood pu lpw ood pr ices wer ekept at constant 1985 levels. Con stan t 1985 do llar s wer eused for al l stum page pr ices, and al l effects of infl ation or

T ab le — Ranges of d i rect costs for th r ee tr eatm en t cost levels of m an agem en t pr act ices to inc r ease net an n u al
tim ber grow th in the Sou th1 985 do l la r s p er a c r e
T r eatmen t cost level
Managemen t pr act ice
S ite prepar at ion for p ine on non stocked land
S ite pr epar at ion for p ine on cu tover p ine sites 20—25 45—85 90—150
S ite pr epar at ion for p ine on cu tover hardw ood sites 45—85 90—150 1 10—180
P lan t p ine 32—48 40—60 48—72
Natu r al regener at ion of p ine 24—48 30—50 36—60
Natur al r egener at ion of hardw ood 28—56 35—70 42—84
Precomm erc ia l th in 30—40 48—60
H ar dwood con tro l 32—56 40—70 48—84
Release seed l ings and sapl ings 3 2—40 40—50 48—60
Comm erc ia l th in fixed cost 3 2—40 40—50 48—60
T ab le — Mean annual incr em en t of grow ing stock tr ees for w el lgr oup r ather than Site- specific yields. Yield tables in cluded
stocked stands in the Sou th , by for est m an agem ent type an d site gr ow in g StOCk vo lum e , per cen t pine stockin g ,and per cen t
c lass for selected stand ages of gr ow ing stock vo lum e in saw t im ber .
Cubi c feet/a c r e/yea r’
Natur al p ine
Upland har dwoods
Bottom land har dwoods
Mean an n u al incr em en t in c ludes grow ing stock tr ees on l y . T otal
b iomass y ield are h igher .
2See text for descr ipt ion of for est types and site c lasses.
3" ields for p ine plan tat ion s r eflect aver age survival and stocking for
al l plan ted p ine types and the use of genet ical ly improved p lan t ingstock .
Managem en t option s wer e com bined w ith “
tr eatm en t costs
and stumpage pri ces for each pr oduction r egion to constr uct
Econ om i c Assum pt ion s an d An a l ysi s— Man agem en t option s wer e analyzed to determ ine pr esen t net w or th and in
ter n al r ate of r etu r n . All analyses wer e conducted in r ealterm s, and inflation effects wer e excluded . No incom e taxes,ad valor em taxes, or land costs w er e included i n the an aly
ses. A 4-
per cen t r eal r ate of r etu r n w as u sed for d iscoun ting al l costs and r evenues. Thi s 4-
per cent r ate appr oxim ates
the aver age lon gr un r ate of r etu r n to capital in the pr ivatesector . All m anagem en t Option s w er e pr ojected for long per iods of tim e so that tr eated and u n tr eated cases w er e comparable . All costs w er e assum ed to r em ain con stan t i n r ea lterm s.
Althou gh 4 per cen t appr oxim ates the aver age lon gr un r ate
of r etu r n on investm en ts in the pr ivate sector of the econ
om y , i t is an aver age , and m any m anagem en t Opt ions yieldh igher r ates of r etu r n . Som e of the in vestmen ts i n stan d
tr eatm en ts cou ld yield r ates of r etu r n i n the r an ge of 15 to20 per cen t . In or der to pr ovide som e m easu r e of the size of
the econom ic oppor tun ities to in cr ease net annu al tim bergr ow th w ith h igh r ates Of r etu r n , al l opt ion s w er e also an a
l yzed w ith a 10 -
per cen t r ate of r etu r n .
tables of cash - flows for each in vestm en t Oppor tun ity . Cashflows wer e an alyzed to determ ine pr esen t net wor th ,
inter n al r ate of r etur n ,net vo lum e changes, and im pac ts of
capital costs on a per- acr e basis. Financ ial r esu lts for 34
production r egions were com bined w ith acr eage data for 52State subr egions to estim ate fin anc ial r etu r n s fo r al l acr esin each subr egion . S im i lar an a lyses wer e also conducted to
figu r e financ ial r etu r ns for constan t real stum page pr ices.
Ar ea of Tim ber land Wi th Econ om i c Oppor tun i ties T oIn cr ease Net An n u a l Tim ber O r t h
T he r esu lts of the analyses descr ibed '
above show that ther e
ar e“
econom ic oppor tun ities— those that wou ld yield 4 percen t or m or e in con stan t dollar s on the investm en ts— to in
crease net an nu al tim ber gr ow th on 70 m i ll ion acr es, or 38
per cen t of al l the tim ber land in '
the Sou th (table fig .
app . table Ther e ar e another m i l lion acr es
needing tr eatm en t that wou ld yield less than 4 per cen t on theinvestm en ts.
A little over half of the ar ea w ith econom ic oppor tun itiesm ill ion acr es— i s in the Sou th Cen tr al r egion (app . ta
ble T he r em ain in g acr es— som e m i ll ion— ar e in
the Sou theast (app . table T he lar gest acr eage i s i nAlabam a
, m i ll ion acr es. Econom ic Oppor tun ities existon over 4 m ill ion acr es in al l Sou ther n States except Oklahom a (table
Over 50 m i l lion acr es, n ear ly th r ee - qu ar ter s of the ar ea
w ith econom ic Oppo r tu n ities, ar e i n the other pr ivate owner
T her e ar e econom ic oppor tun it ies— those
that wou l d yield’
4 percen t or mor e on the
investmen ts— to incr ease net annual tim ber
gr owth on 70 m il l ion acr es of tim ber land in
the South . T h is is 39 percen t of al l thet imber land in the area .
Fi gu r e— Ar ea of tim ber land w ith econom ic oppor tun ities
to incr ease net annu al gr ow th in the Sou th , by r egion
sh ips; another 13 m illion acr es, or near ly a fifth of the totalar e in the for est industr y ow ner sh ip (fig . Most of ther em a in in g ar ea w ith econom ic oppo r tun ities is in n at ion alfor ests.
T he lar gest econom ic tr eatm en t oppor tun ity in the Sou thsom e 30 m illion acr es, or 43 per cen t of the total— is r egener ation w ith site prepar ation (fig . Stocking con tr o l ( 14m i llion acr es) , clear cu t m atur e stands and r egener ate ( 13 m i llion acr es) , and com m er c ial th inn ing of po letim ber stands(5 m i ll ion acr es) accoun t for m ost of the r em a in ing tr eatm ent oppor tun it ies.
T he r elative r ank ing of the e conomic tr eatm en t Oppor tun ities in the r egion s and m ost States is m uch the sam e as th at
for the Sou th as a who le , al thou gh ther e ar e som e d ifferences. For exam p le , r egener ation w ith site pr epar ation
239
T he ownersh ip d istri bu tion is abou t the sam e in both of the
sou ther n r egion s and i n m ost S tates. Ther e ar e , however ,some State d iffer ences. For example , for est industry owner
sh ips w ith econom ic Oppor tun ities r an ge fr om 8 per cen t of
the total i n Ten nessee to 3 1 per cen t i n Lou isiana . In al l
States, the lar gest ar ea w ith Oppor tun ities is in the other pr i
vate owner sh ips.

T ab le — T im ber land need ing tr eatm en t to im pr ove product iv ity in the Sou th , the ar ea of t im ber land w ithOpport u n it ies for in cr easing net annu al t im ber gr ow th w h ich w i l l y ield 4 per cen t or m or e ,
1and the assoc iated
tr eatm en t cost and net an n u al gr ow th incr em en t , by r eg ion and S tate
Sou thw ide total
Financ ia l yiel ds are m easu red in constan t do l lar s, net of inflat ion or deflat ion .
Figu r e— Ar ea of tim ber land w ith econom ic Oppor tun ities
to in cr ease net an n u al t im ber gr ow th i n the Sou th,by Figu r e
— Ar ea of t im ber land With econom ic Oppor tun itiesowner sh ip to incr ease net annual t im ber gr ow th i n the Sou th , by
tr eatm ent
240

Most of the econom i c oppor tun ities toincr ease net annu al t imber gr ow th i n the
Sou th ar e on the other pr ivate owner sh ips.
T h is pr im ar i ly r eflects the lar ge acr eages of
t imber land in those ow ner sh ips and lessin tensive m anagem en t pr actices.
tr y ow ner sh ips, w ith the r em ainder bi l l ion cubicfeet— o n the public ow ner sh ips.
T he distr ibution of the econom ic Oppor tun ities by owner sh ipin both r egions and i n m ost States i s m uch the sam e as that
for the Sou th . In m ost States, ar ound thr ee- qu ar ter s of theOppor tun ities ar e on the o ther pri vate owner shi ps, bu t ther e
are som e exceptions. In Tenn essee , 84 per cen t of the oppor
tun i ties ar e on the other pr ivate owner shi ps; i n Ar kansas, 54per cen t . As in the Sou th , ther e ar e oppor tun ities to incr easenet ann ual gr owth on al l ow ner sh ips in ever y Sou ther n State .
Near ly half of the econom ic oppor tu n ities to incr ease net
ann ual gr ow th , billion cubic feet , consists of r egener ation of cu tover and nonstocked sites (fig . Abou t halfof the r egener ation oppor tun ities ar e on cu tover sites in theupland har dw ood m an agem ent type . Th er e ar e also Opportun i ties on the m ixed pine—har dwood m an agem en t type (248
m illion cubic feet) and the n atu r al pine type (202 m i ll ioncubic feet) . On the r elat ively sm all acr eages of nonstockedland , ther e ar e Oppor tun it ies to incr ease net an nu al tim bergr t by 154 m i l lion cubic feet . Regener ation oppor tun itieson p ine p lan tat ion s ar e on ly 24 m i l l ion cubic feet , anindication of the h igh success r ate of plan ting . Thr ee- qu ar ter sof the oppor tun ities for r egener ation ar e on the other pr ivateowner sh ips. Near ly al l of the r est ar e on the for est indu str yowner sh ips.
After r egener ation , the next lar gest tr eatm en t oppor tun ityis har vest and r egener ation of existin g stands (819 m illi on
242
cubic feet) . Most of th is oppor tun ity i s har vest of m atu r e
stands, althou gh salvage of stands dam aged by fir e , insects,disease , and other destr uctive agen ts is also impor tan t . Alittle over a th ir d of the oppor tun it ies for har vest and r egener ation are i n stands in the n atur al pine m anagem en t type .
Another th ir d ar e in upland har dwood stands. T he r em ainderar e abou t equ ally d iv ided between m i xed pine— har dwoodand bottom land har dwood stands.
T wo—th irds of the har vest oppor tun ities ar e on other pri vatelands and another fifth ar e on for est industry ho ld ings. Be
cau se of the po l icy of gr ow ing tim ber on lon ger r otat ion s,ther e is also a substan tial poten t ial to incr ease net annu algr ow th thr ough har vest and r egener at ion on n ational for esthold ings.
Billion'
cub ic feet
Figu r e— Econom ic oppor tun it ies to incr ease net annu al
gr ow th on t im ber land i n the Sou th ,by tr eatm en t
T he th ir d lar gest tr eatm en t Oppor tun ity for incr easing netannu al tim ber gr ow th is stocking con tr o l in adequatelystocked stands that also have inh ibitin g vegetat ion . Irn ple
m en t ing these tr eatm en t Oppor tun ities w ou ld in cr ease n et
annu al gr ow th by 559 m i l lion cubic feet a year . Most of
th is poten t ial , som e 279 m i l l ion cu bic feet , i s i n up landhar dwood stands, althou gh ther e ar e al so lar ge poten tial sin the m ixed pine—har dwood and n atu r al pine m anagem en t
types. As w ith other tr eatm en t Opport un ities, m ost of thosefor stocking con tr ol— thr ee—qu ar ter s of the total— ar e on the
other pr ivate ow ner sh ips.

T here ar e lar ge oppor tun it ies to incr easenet annual tim ber gr ow th i n the Sou th byhar vesting and regener at ing m ature t im berstands and stands dam aged by fir e, insects,d isease , and other destr uct ive agen ts.
Precomm er c ial and comm er c ial th inn in g of stands cou ldincrease net annu al grow th by abou t 260 m ill ion cubic feet .T he bu lk of these oppo r tu n ities ar e in natur al p ine stands
on the other pr ivate owner sh ips. Most of the gain fr om these
treatm en ts r esu lts fr om sh ifts of tim ber vo lum e to m er chan tab le gr ow ing stock and m or e intensive m an agem en t of
“
subse
quen t r otations.
In vestm en t Oppor tu n i t ies T o In cr ease Net An n u a lGr owth
Implem enting the econom ic tr eatm en t oppor tun ities wou ldr equ ir e a capital investm en t of bill ion ( 1984 do llar s)(app . table In vestor s wou ld earn a m in im um 4 -
per cen t
r ate of retu r n m easur ed in con stan t do llar s net of inflation
or deflation . Th is r ate approxim ates the longr un aver age r e
tu r n on capital invested in the pri vate sector Of the econom y .
T he investm en t oppor tu n ities in the Sou theast am ou n t toa little over $3 bill ion ; those i n the Sou th Cen tr al r egion ,
billion (app . tables and T he investm en t opportu n i ties i n the S tates go up fr om $30 1 m i ll ion in Oklahom ato $864 m illion in Alabam a (table 5 In m ost States theyr ange between $400 m i llion and $600 m il lion .
In 197 8 ther e wer e som e m ill ion other pr ivate owner s.
Ninety- two per cen t of these owner s had hold ings of less than100 acr es However , the r em ain ing 8 per cen t , som eow ner s, held 7 3 per cen t of the t im ber land i n the Sou th :Although no data have been compiled by size of owner sh ip ,
m ost of the econom ic oppor tun ities ar e undoubtedly on theselar ger owner sh ips.
Abou t 16 per cen t , som e bill ion dollar s, of the investm en t oppo r tun ities ar e on the fo r est industry owner sh ips.
Most of these investm en ts and those on public owner sh ipsare likely to be m ade .
T he lar gest par t of the,
investm ent Oppor tu n ities, abou t thr eefifths of the total , are for stand r egener ation (fig . Th isin par t r eflects the h igh cost of r egener at ion w ith site pr epar ation : $ l 34 per acr e . T he assoc iated incr ease in net annu algrowth is 48 cubic feet per acr e .
Near ly a qu ar ter of the in vestm en t oppor tu n it ies ar e fo r
har vest in g and r egen er at ion of m atu r e stands an d stands
needing salvage . T he aver age cost to har vest and regener atem atu r e stands is $98 , that for sa lvage and r egen er ation is$ 1 15 per acre . Most Of the needed har vest investm en ts, l ikethe investm en ts fo r al l tr eatm en t Oppo r tu n ities, ar e on the
other pr ivate ow ner sh ips.
243
Near ly th r ee- quar ter s of the investm en t Oppor tun ities are on
the other pr ivate owner sh ips. On ly a l im ited par t of theseOppor tu n it ies m ay be im p lem en ted . These ow ner s havew idely d iver se objectives and attitudes; l im ited techn icalkn ow ledge of the w ays t im ber stands shou ld be har vested ,
r egener ated , and m anaged ; and “
a varyin g w i llin gness andcapac ity to m ake in vestm en ts i n m an agem en t pr act ices.
Owner sh ip tenu res ar e typical ly shor t , and m ost owner s ar e
in the o lder age gr oups. Thus, for m ost tr eatm en t opportu n i ties, espec ial ly r egener ation , wher e the t im e betweeninvestm en ts and har vest is long , ther e i s l ittle l ikelihoodthat d ir ect benefits, such as incom e fr om tim ber har vest , w i llaccr ue to cu r r en t owner s.

Figu r e— Investm en t oppor tun ities to incr easen et annu al
gr ow th on tim ber land i n the Sou th , by tr eatm en t
Most of the r em ain in g in vestm en ts needed for econom ictr eatm en t oppor tun ities ar e for stockin g con tr ol . T he aver agecost. of th is pr actice i s $48 per acr e . T he assoc iated incr easein net annu al gr ow th i s 40 cubicfeet per acre.
Near ly half Of the investm en t Oppor tun ities, billion , ar e
i n the up lan d h ar dwood m an agem en t type , m ost ly forr egener at ion w ith site pr epar at ion . Ther e ar e a lso lar geOpportun ities, again m ostly for r egener ation , in
'
the natur alp ine , m ixed pine—har dwood , and bottom l and har dwoodmanagem en t types. Investm en t oppor tun ities on pine plan tationsar e r elat ively sm al l , $ 152 m i l l ion . Over a th ir d Of th isam oun t is for r egener at ion and abou t a quar ter for har vestof m atu r e stands.
T he lar ge oppor tun ities to incr ease t im ber suppl ies in theSou th r eflect gener al silvicu ltu r al and econom ic cond it ions.
In m ost cases, tr eatm en ts ar e pr ofitable becau se they i ncr ease net annu al t imber gr ow th . How ever , som e profitableoppor tu n it ies also sh ift t im ber vo lum e to h igher valu epr odu cts, and/or
.
acceler ate ear n ings fr om stands.
T he~
differ ence between yields of m an aged and unm an agedstands ind icates that im pr ovem en ts in biological pr oductivitycan be m ade on m any acr es th r ou ghou t the Sou th . Many
stan ds can pr odu ce h igher t im ber y ields th r ou gh m or e
in ten sive m an agem en t . By incr easing stocki ng and by m ore
car efu lly m anaging stand gr ow ing stock ,landowner s can
incr ease tim ber yields and the econom ic r etu r n s.
Many stands have pr ofitable oppor tun ities becau se they havebeen h igh—gr aded or over cu t in the past w ithou t subsequentm an agem en t to r esto r e p r odu c t iv ity . Har vest in g w ithou tadequ ate r egener ation has left m any stands poor ly stocked ,
often w ith the least desir able tr ees, and pr oduc ing far belowpoten tial . Withou t r estor ation of tim ber stands fol low ingcu tting on these sites, longr un pr oductivity i s im pair ed .
Econ om i c Oppor tu n i ties T o In cr ease Net Annu al Tim berGr ow th Wi th Con stan t Stum page P r ices
Econ om ic Oppor tu n i ties T o In cr ease Net Ann u a l Tim berGr ow th That Wou l d Yiel d 10 Per cen t or Mor e on the
In vestm en ts
T he data in append ix tables descr ibed in the pr evious section , show the econom i c Oppor tun ities that wou ld
Yield ga ins fr om tr eatm en ts do n ot alone accoun t for the
m any pr ofitable investm en t oppor tu n it ies. Mar ket factor s
prom ise better r etur ns fr om tim ber stum page in the fu tur e .
Tim ber m arkets ar e good and im pr ovin g in m any ar eas of
the Sou th . T he base pr oject ion s ind icate th at r eal pr icei ncr eases for p ine tim ber w i l l con tinue i n the fu tur e . As
stumpage pr ices increase; the value of added tim ber yieldsalso r ises, bu t th is m ar ket effect accoun ts for on ly par t ofthe economic Oppor tu n it ies. As descr ibed below , m any
treatmen ts r em ain pr ofitable even i f stum page pr ices rem ainconstan t .
T he estim ates Of acres Of econom i c tr eatmen t oppor tuni tiesdescr ibed above wer e based on expec tation s that r eal pri cesfor stum page wou ld r ise thr ough 2030 as show n by thebase pr ojections in chapter 4 . Because these pri ce assump
tions have a sign ifican t effect on poten tial profits fr om m or e
in tensive m anagem en t , the en t ir e set of tr eatm en t Oppor tun ities was also analyzed w ith stump
’age pri ces held constan tat 1985 levels. Although these r esu lts ar e not fu lly detail edin th is r epor t , they ar e summ ari zed below .
For con stan t r ea l pr ices, Sou thw i de in vestm en t opt ion spoten tial ly ear n ing 4 per cen t above inflat ion or m or e ar e
found on m i ll ion acr es, com par ed w ith m i l lionacr es when r eal pri ce incr eases ar e factor ed in to the an al y
ses. These acr es cou ld ann ual ly pr odu ce an added billioncubic feet of t im ber for an in vestmen t of bil l ion .
Ther efor e , 89 per cen t of the acr es w ith investm en t Opportuni ties ear n ing 4 per cen t or m or e w ith r ising r eal pr ices w i llstil l ear n at least 4 per cen t w ith constan t r eal pr ices.

retu rn 1 0% retu rn
Othe r pr ivate
Pub lic
Figu r e— Area of tim ber land w ith econom ic Oppor tun ities
to incr ease net an nu al gr ow th i n the Sou th , by r ate of r etu r n
and ow ner sh ip
Oppo r tu n it ies to h ar vest an d r ep lan t m atu r e t im ber andr elat ively l itt le ch an ge i n the ar ea of the o ther tr eatm en t
oppor tu n it ies.
Uti lization of the tr eatm en t Oppor tun ities on t im ber landthat wou ld yield 10 per cen t or m o r e on the investm en tswou ld incr ease net an nu al gr ow th by bill ion cubic feet ,56 per cen t of the gr ow th atta in able fr om the in vestm en ts
at the 4-
per cen t r ate . T he r egional d istr ibu tion of the
Oppor tu n ities to incr ease net annual gr ow th i s m u ch the sam eat both r ates of r etur n . How ever , at the l O-
per cen t r ate the
pr opor t ion of the gr ow th on the other pr ivate owner sh ips isreduced and that on for est industry ow ner sh ips is incr eased(fig . Th is sh ift appar en tly r eflects d iffer en ces in sitequality , tr eatm en t oppor tun ities, and tr eatm en t costs .
At the l O-
per cen t r ate of r etu r n , the oppor tun ities to i ncr ease net annu al gr ow th on upland har dwood stands ar e
on ly 38 per cen t of the tota l at the 4-
per cen t r ate (fig .
T he oppor tun ities ar e also gr eatly r educed on bottom landhardwood and m ixed pine—hardwood sites and on non stocked
land . Pine plan tat ions ar e the least affected by the h igherr ate .
246
Natu ra l pine
Million acres
Figu r e— Ar ea of t imber land w ith econom ic oppor tu n i
ties to incr ease net annu al gr owth in the Sou th , by r ate of
r etu r n and for est m anagem en t type
T he econom ic oppor tu n ities to in cr ease n et annu algrow th by r egener ation w ith site pr epar ation at the
l O-
per cen t r ate of r etu r n ar e on ly a th ir d of those at the
4-
per cen t r ate (fig . Pr esum ably , th is decr easelar gely r eflects the h igh per - acr e cost of th is kind of
tr eatm en t . Ther e i s also a big r edu ction in the oppor tu n itiesfor stocking con tr ol . T he oppor tun ities to har vest m atu r e
stands ar e u nchanged,and m ost of the other Oppor tun ities
r em ain c lose to those at the 4-
per cen t r ate .
T he capital in vestm en t for the oppor tu n it ies w ith a 10
per cen t r ate of r etu r n wou ld be billion , 42 per cen t of
that at the 4-
per cen t r ate . T he aver age tr eatm en t cost peracr e also declines fr om $98 to $80 , an 18-
per cent dr op . Th isdec l ine m ean s that m any of the h igher cost oppor tun ities,par t icu lar ly those for r egener ation w ith site pr epar ation , ar e
scr eened ou t . T he patter n of the in vestm en t Opport un itiesby r egion , ow ner sh ip , m an agem en t type , and tr eatm en t ar e

Figu r e— Ar ea of tim ber land w ith econom ic oppor tu n i
ties to incr ease net annual gr owth i n the Sou th , by r ate of“
r etu r n and tr eatmen t
m uch the sam e as those desc r ibed above for ar ea and net
annual gr ow th .
Econ om ic Oppor tu n i t ies T o In cr ease
Net An n u a l T im ber Gr ow th , by State
Econom ic Oppo r tu n ities to in cr ease net annual gr ow th ex
ist in every State in the Sou th , bu t they ar e not equally distr ibuted (tables and No single r eason can be givenas the pr im ary determ inant of econom ic oppo r tun ities in theStates. In som e cases, stands ar e already in r easonably productive cond ition i . and , ther efor e , the Options to increase net
annual gr ow th th r ou gh m o r e in ten sive m an agem en t ar e
few . In other cases, m arkets ar e r elatively weak , and th is,too , m ay lead to a r educed num ber Of econom icoppor tun ities.
Deta iled data sim ilar to that in append ix tableson the econom ic oppor tu n it ies for incr easing net an n u a lgrowth by owner sh ip , for est m an agem en t type , and tr eat
ment ar e available for each Of the 12 Sou ther n States. These
Fi gu r e 5 . 12r — Econom ic opport un ities to inc rease net an nualgrow th on t im ber land in the Sou th , by r ate of r etu r n and
owner sh ip
Fi gu r e— Econom ic oppo r tun it ies to in cr ease net an nu algr ow th o n t im ber land i n the - Sou th ,
by r ate of r etu r n and
fo r est m an agem en t type
247
Regeneration withsite prepa ration
Regene ration withoutsite prepa ration
Convert stand
P recommercia lth inn ing
th inn ing
C lea rcut
Bil lion cub ic feet
Figu r e— Econom i c Oppor tuni ties to incr ease net annual
growth on t im ber land in the Sou th , by r ate of r etu r n and
tr eatm en t
data can be obtained by r equest fr om J . Michael Vasievi ch ,
USDA For est Ser vice , 1407 Sou th Har r ison Ro ad , East
Lansing , MI 48823 . T he h ighligh ts of these data ar e br ieflysumm ar ized below .
Flor ida— Flo r ida has m i ll ion acr es of tim ber landneed ing som e tr eatm en t to in cr ease pr odu ctiv ity . Ther e ar e
econom ic Oppor tun ities‘
that“
wou ld ear n 4 per cen t or m or e
on m ill ion acr es. Tr eating these acr es w ou ld r equ ir e investmen ts of $645 m i l l ion . These in vestm en ts cou ld incr ease n et ann u al gr ow th by 27 1 m i ll ion cubic feet . On a
per—acr e basis, costs for tr eatm en ts in Flor ida aver age $89 ,
and incr em en tal yields ar e 37 cubic feet ann u ally .
Ther e ar e econom ic oppor tun ities at a l O-
per cen t r ate of
retu r n on 3 m il lion acr es. Im plem en ting these Oppor tun it ieswou ld cost $ 170 m il lion and pr oduce 1 18 m i ll ion cubic feetOf tim ber an nually .
About m i ll ion acr es i n Geor gia cou ld be tr eated and
ear n 10 -
per cen t above inflation . T he in vestm en t needed totr eat these acr es i s $379 m i l l ion . Annu al t im ber gr owthwou ld go up by 256 m il lion cubic feet .
Nor th Ca r ol in a— T he ar ea of tim ber land need ing tr eatm en t in Nor th Car ol in a is m il lion acr es. Alm ost 7 m i llion acr es cou ld be tr eated at a 4-
per cen t r ate . These tr eatedacr es wou ld pr oduce 32 1 m i ll ion cubic feet annu ally for aninvestm en t of $652 m il lion . T he aver age cost per acr e is
$93 , and the aver age gr ow th incr em en t is 46 cubic feet .
Near ly m i llion acr es cou ld ear n a l O—per cen t r etu r n
and pr odu ce 204 m i ll ion cubic feet each year for an investm en t of $356 m i llion .
Sou th Ca r o l i n a— Th is S tate has m i l lion acr es need
i ng tr eatm en t and m i ll ion acr es th at cou ld ear n 4 percen t or m or e . T he aver age cost for these acr es is $95 , and
the aver age incr ease in yield is 4 1 cubic feet annu ally . T he
total in vestm en t -
r equ ir ed is $420 m i ll ion to pr odu ce an an
n u al gr ow th in cr em en t of 183 m i l lion cubic feet .
Abou t m i ll ion acr es in Sou th Car o l in a cou ld ear n 10
per cen t or m or e on the investm en ts. Tr eatm en t of theseh igh - r etum acr es w ou ld r equ ir e $ 155 m i ll ion . Th is investm en t wou ld in cr ease t im ber gr ow th by 97 m il l ion cubicfeet each year .
Vi r gi n ia— Abou t m i ll ion acr es i n Virgin ia n eed
som e tr eatm en t . Of these acr es, m i ll ion cou ld ear n 4
per cen t or m or e on the investm en ts. T he total in vestm en t
needed for these tr eatm en ts is $53 1 m illion , and the addit ion al yield attain able is abou t 272 m i ll ion cubic feet . Av
er age per—acr e costs for Vir gin ia ar e $94 , and the aver ageyield incr em en t is 48 cubic feet annually .
Investm en ts on 3 m i l lion acr es cou ld ear n a r etu r n of 10
per cen t or m or e . These acr es wou ld add 150 m i ll ion cu
b i c feet of n et an n u al gr ow th fo r an in vestm en t of $27 5
m i ll ion .
Geor gia— Geor gia has abou t 10 m il lion acr es of
tim ber land that need tr eatm en ts; ther e ar e oppor tun ities onm il l ion acr es that cou ld ear n 4 per cen t or m or e . T he
in vestm en ts n eeded fo r these tr eatm en ts wou ld be $797m i l lion , and net annual tim ber gr ow th wou ld incr ease 4 19m il l ion cubic feet T he aver age tr eatm en t cost i s $87 peracr e ; aver age yields w ou ld go up by 46 cubic feet eachyear .

Oppor tu n i t ies on Ma r gin a l C r op lan d an d Pastu r e
In addition to the oppo r tu n ities on tim ber land descr ibedabove , there ar e lar ge po ten t ia l timber pr oduc tion Oppor tu
n i t ies on m ar gin al cr opland and pastu r e , inc lud in g h igh lyer od ible cr opland , th roughou t the Sou th . For th is an alysis,m ar gin al lands wer e defined as c r opland and pastu r e that
cou ld produce a h igher fin anc ial r etu r n in pine plan tation sthan in their best cr op or pastu re u se .
All h igh ly erodible cr oplands wer e consider ed m ar gin alfor c r op pr oduction . In gener al on these lands the cost of
conservation pr actices and/or redu ced yields m akes sustainedcu ltivation uneconom ic . Records of plots taken for the 1982Nation al Resou r ces Inven tory by the So il Conser vat ion Service wer e exam ined to determ ine the n um ber of acr es thatw er e not pr im e agr icu ltu r al lands and that m igh t be consider ed m ar gin al in poten tial ear n ings. These plot r ecords werescr eened to include on ly lands in Land Capability Classes3e ,
4e,6
, and 7 . Excessively wet lands (c lass 5 ) and landsnot su itable for plan ting of tr ees w er e exc luded fr om the
in itial acr eage scr een ing .
’
Benchm ark so i ls were assign ed for each Land Capab i li ty Class i n each Major Land Resou r ce Ar ea in the Sou th .
So i l—site assoc iation s wer e u sed for these benchm ark so ilsto assign poten tial pine site indexes. Net cr op r etu r n s per
acr e w ere der ived fr om in form at ion pr ov ided by the So ilCon ser vation Ser vice for each Major Land Resou r ce Ar eaon norm al ized cost s, yields, and m arket pr ices for six m ajor c r ops (co r n ,
w heat , co tton , soybean s, so r ghum , and
peanu ts) . These crop r etum s exc luded land costs and wer e
net of any public pr ice - suppor t pr ogr am s. Net cr op r etu r ns
wer e screened to iden tify thebest r etu r n in g cr op for eachland class. Acr es and cr op r etu r n s wer e m apped to each for
est su r vey un it based on the d istr ibu tion of Major Land Resou r ce Ar eas fal ling w ith in each sur vey un it .
Land Capab il ity Classes ar e designat ions used by the So i l Conservation Service to r ate the su itab i l ity of so i ls for agr icu l tu r a l product ion fromah igh of 1 to a low of 8. T he letter e subc lass design ation ind icates so i lswhere excessive erosion is a m ajor l im itation to use Of the land for cr op
production . Under the So i l Conservation Service defin it ions, c lass 4 soi lshave very sever e l im itations for agr icu l tu r al use that r estr ict the cho ice of
plan ts, requ ir e very carefu l m anagemen t , or both . When these so ils arecu l tivated , car efu l m anagem en t is r equ ir ed , and conservation pr act ices ar em or e d ifficu l t to app ly and m ain tain . Class 3c lands have less- sever e er o
sion l im itations than 4e . Class 6 so i l s have l im itat ion s that m ake them
gener al ly unsu ited to cu l tivation . Som e so i ls in c lass 6 can be safely used
for cr ops provided u nusu al ly in tensive managemen t is u ti l ized . Class 7 so ilshave very severe l im itat ions that m ake them u nsu ited to cu l t ivat ion .
T her e ar e near ly 22 m il l ion acres of
marg inal cr oplan d and pastu r e in the Sou ththat wou ld yiel d h igher r ates of r etu r n tothe ow ner s i f plan ted to p ine . T hese lands,
i f plan ted , wou ld add to the for est weal th
of the Sou th and gr eatly benefit the economyof the r eg ion by incr easing t im ber - based
employm en t and w ages and salar ies.
Tim ber r etu r n s for plan ting m ar gin al lands to .pine wer ecompu ted for each tim ber pr oduction r egion . These r etur nsl ike the cr op r etu r n s, exc luded land costs and wer e ex
pr essed on an annu al basis by conver ting capital ized tim berear n ings to an ann ual tim ber r en t .
Fin ally , al l acr es that cou ld pr oduce h igher r etu r n s in timber pr oduction wer e con sider ed m ar ginal lands for th is portion Of the study . W ith few exceptions, al l acr es i n c lasses3e th r ough 7 appear l ikely to be m o r e pr ofitable for tr eeplan ting than for cr ops, given r ising stum page pr ices.

T he r esu lts, shown in table ind icate that i n theSou th 22 m illion acr es of cr opland and pastu r e cou ld ear n
gr eater retu r ns in pine plan tations. If plan ted to pine , these
acr es wou ld yield abou t b i -l l iOn cubic feet of add itionaltimber gr ow th per year , abou t 94 cubic feet per acr e peryear . Th is vo lum e exceeds the cu r ren t net annu al growth on
pine plantations in the Sou th billion cubic feet) by 62per cen t .
Th is cr opland and pastur e is open land and can be
plan ted w ith m ach ines. Ther e ar e no site-
pr epar ation or
other r elated costs. As a r esu lt , the aver age cost of establ ish i ng p ine plan tat ions i s m u ch below th at on har vestedtim ber land per acr e com par ed to $ 129 per acre . It is
also m uch below the aver age $94 per~acr e cost of conver t
T ab le — A rea of m arg inal cr opland and pastu re ,
I inc lud ingh igh ly erod ible cr opland , in the Sou th , the cost Of establ ish ing
pine plan tat ions on th is land , and the r esu l t ing net annu a l t im ber
grow th if th is land wer e plan ted to p ine or a l lowed to r ever t
natu r al ly to for est , by State and r eg ion
Net annual
Marg ina l T reatm en t Net annual gr ow th from
cropland and cost to gr ow th from natu r a l
pastu r e p lan t p ine plan ted p ine r egener ation
Thousand M i l l ion M i l l ion Mi l l ion
a c r es do l la r s cub ic feet cub ic feet
T otal
Sou thw ide total
Cropland and pastu r e cl assified by the U .S . Depar tmen t of
Agr icu l tur e , So i l Conservat ion Service in Land Capab il ity Cl asses3e ,
4e , 6 , and 7 that cou ld y iel d h igher r ates of'
r etu r n i n p ine
plan tat ions than in cr op or pastur e u se .
ing to pine plan tations tim ber land stocked w ith low - qualitytr ees.
Aver age tim ber r etu rn s for plan tation s established on m ar
ginal cr opland an'
d pastu re in the South ar e abou t 1 1 to 15per cen t above inflation on h igh sites, fr om 8 to 12 per cen t
on m ed ium sites, and abou t 5 to 9 per cen t above inflationon low sites. Actu al r ates of r etu r n , however , dependon location , cost of plan tation estab l ishm en t L and other
production factor s.
If al l of th is m ar gin al cr op land and pastur e wer e al lowedto r ever t natur al ly to for est cover , abou t 781 m i ll ion cu
b ic feet of tim ber wou ld even tual ly be pr odu ced per year(table fig . Th is gr ow th am oun ts to an aver agepr oduction of abou t 3 6 cubic feet of t im ber per acr eannual ly , bu t the d ir ect investm en t costs wou ld be n i l . Theseestim ates inc lude assum ptions that som e sites wou ld r ever t
25 1
Plan ting of m ar gin al c ropland and pastu r e sites to pineis the m ost pr ofitable investm en t Option iden tified th r oughou t the Sou th ,
even w ithou t cost- shar e paym en ts, becauseon ly m in im al site pr epar at ion is needed . These oppo r tu n i
ties also offer the m ost extensive and cost - effect ive Oppo rtun i ty for expansion of softwood tim ber suppl ies.
Appr oxim ately thr ee - fifths of the cr op land and pastu r e that
wou ld yield h igher r ates of r etu r n i f plan ted to '
pine ar e in
the Sou th Cen tr al r egion , and two - fifths ar e in the Sou thea
-
st r egion . Nine of the 12 States in the Sou th have m or ethan a m i llion acr es of such land .
T he South Cen tr al r egion also accoun ts for a lar ger shar eof the poten tial incr ease in net annu al gr ow th fr om the establ ishmen t of pine plan tations on these lands, 60 per cen t '
or
1 2 bill ion cubic feet (fig . T he Sou theast r egion ’
s
shar e wou ld be bill ion cubic feet of add itional tim bergr owth . T he leading S tates ar e Tennessee, Vir gin ia ,
Mississippi , Alabam a , and Nor th Car o lina , each w ith net annual grow th increm en ts estim ated near or in excess of 200m il lion cubic feet .
Aver age costs to establish pine p lan tations tend to beh igher in the Sou th Cen tr al r egion than in the Sou theast . T o
plan t pine on al l m ar ginal cr opland and pastu r e wou ld r e
qu ir e an investm en t of appr oxim ately $889 m il l ion i n theSouth Centr al r egion and $508 m ill ion in the Sou theast . In
term s of aver age cost per un it incr ease in net annual gr ow th ,
Flor ida and Geor gia have som e of the best opport un ities fortimber production on m ar ginal acr es in the Sou theast . Texasand Alabam a , in the Sou th Cen tr al r egion , also have r elatively low costs per u n it of gr owth incr ease .

r Planted pine [2 Natura l regeneration
South
Southeast
South Centra l
Million cubic feet
Figu r e — Poten tial net ann u al gr owth fr om plan ted p ine or n atur ally r egener ated p ine and
har dwoods on al l m ar gin al cr opland an d pastu r e in the Sou th , by r egion
Oppor tu n i ties on H i gh ly E r od ib le C r op lan d
If the m ar g inal cr oplan d and pastu re in theSou th wer e al lowed to r ever t n atu r al ly totr ees, i t wou ld in t im e grow abou t 780
m i l l ion cub ic of t im ber a year . Whi le t hi s i s
m uch below the net an nu a l gr ow th th at
w ou ld be attained i f the land were plan tedto p ine , the di r ect investm en t costs ar e n i l .
252
to pine wh i le other s wou ld becom e pr edom inan tly har dwoodstands. For the Sou theast r egion , i t w as assum ed that 70
per cent of the sites w ou ld r ever t to p ine and 30 per cen t to
upland har dwoods; for the Sou th Cen tr al r egion , 40 per cen t
to pine and 60 per cen t to up land har dwoods. T he r egion alshar es of the net annual gr ow th fr om natur ally r egener atedstands ar e 467 m il lion cubic feet (60 per cen t) for the Sou thCen tr al S tates and 3 15 m i ll ion cubic feet (40 per cen t) forStates in the Sou theast .
Tim ber pr oduction Oppor tun it ies on h igh ly er od iblecr opland ,
included in m ar gin al cr op land and pastu r e ,w er e
also exam i ned separ ately . Estim ates of h ighl y er odible cr opland acr es wer e based Ou figu r es fr om the So il Con ser vation Ser vice on cr op land i n the Sou th i n Land Capabil ityClasses 3e , 4e , 6e , and 7e that w ou ld be su itable for p lan ting to tr ees. On these lands, er osion i s a m ajor l im itati onto keeping the land in cu lt ivat ion for cr ops. Cr oplan d acr es
in these land c lasses ar e likely to be el igible for the Conser vation Reser ve Pr ogr am .

T he aver age cost is $63 per acr e , abou t the sam e as on
econom ical ly m ar gin al cr opland and pastu r e and m u ch be
low the aver age on h ar vested tim ber land .
In summ ar y , net annual tim ber gr ow th in the Sou th cou ldin cr ease by billion cubic feet i f p ine plan tat ion s wer eestablished on al l of the m ar gin al cr opland and pastu r e , in
c luding the h igh ly er od ible land ident ified in th is an alysis.
Total vo lum e is alm ost tw o - th ir ds of the net annu al gr ow thpoten tial fr om u ti lizing al l of the econom ic Oppor tun itieson timber lands. Taken together , oppor tun ities on tim ber landand cr opland and pastur e cou ld incr ease net annual gr ti n the Sou th by bill ion cubic feet . Most Of th is increasewou ld be pin e gr owth . Th is vo lum e , billion cubic feet ,wou ld r epr esen t a 53 per cent in cr ease in cu r r en t net annu algr ow th for al l spec ies i n the Sou th and w ou ld near ly double cu r r en t net annu al gr owth for softwoods (fig .
Bil lioncubic feet
Figu r e— Econom ic oppor tu n it ies to in cr ease cu r r en t
net annual tim ber gr ow th in the Sou th
In appr aising the econom ic Oppor tun ities for incr easingtim ber supplies pr esen ted in th is chapter , r eader s shou ld keepi n m i nd tw o th in gs. Fir st , these oppor tuni ties ar e estim ates
based lar gely on the judgm en ts of exper ts dr awn fr omun iver sities, for est indu str ies, the For est Ser vice , and State
for estr y agencies. Second , the estim ates include al l the tim
ber land in the defined stand conditions w ithout r egar d to thesize or accessibility of tr acts, the objectives of the owner s,or public ly im posed env ir onm en tal constr ain ts.
In view of these lim itation s and con str aints, i t i s obvious that the est im ates are not an exact m easur e of the eco
nom ic Oppor tun ities that exist i n the Sou th . Nonetheless,even after allow ances for possible uncer tain ties, i t i seviden t that very lar ge oppor tun ities do exist to invest intimber m anagem en t pr actices that w il l yield good r ates of r etu r n and r esu lt in m ajor incr eases i n the Nation ’
s t im bersupplies. It i s also clear that the poten tial exists to dr am ati
cally change the t im ber ou t look i n the Sou th i n the nexthalf- cen tu ry . In that peri od , w ith in tensified m an agem en t ,enou gh tim ber cou ld be pr odu ced to gr eatly d im in ish or
elim inate the adver se soc ial , econom ic , and r enew able r esou r ce effects that ar e l ikely w ith the base pr oject ion s.
With the imp lem en tation of the econom ic oppor tun ities ontim ber land and m ar ginal cr op land and pastu r e ,
inc lud in gthe h igh ly er od ible cr opland , i t wou ld also be possible tosustain indefin itely the for estry sector in the Sou th ,
in c luding employm en t and w ages and salar i es.
Bu t on ly par t of these Opportun ities ar e l ikely to ber ealized . S tud ies pr epar ed i n the late 1960 ’
s and the latel 97o
’
s and th is analysis show that lar ge Oppor tun ities continue to be u nu tilized . Th is m ay be due in lar ge par t to m arket im per fection s i n the for estr y sector . T he m arket system
th at so effectively gu ides the pr odu ct ion of m ost goods andser vices works in on ly a l im ited w ay in incr easing tim bersupp lies .

T he best quan titative m easur e of m arket imper fection fortim ber supp l ies i s the coeffic ien t of pr ice elast ic ity of
supply . Th is coeffic ien t i s a m easu r e of the per cen tagechange i n stumpage (tim ber ) supply r esu lting from a per
centage change in stumpage pr ices. For exam ple , w ith a
10'
-
percen t increase in stumpage’
pr ices, i f stumpage suppliesincr ease 3 per cen t , the coeffic ien t of pri ce elasticity wou ldbe In simpler term s, i t is a m easu r e of the r espon siveness of for est owner s to pr ice changes. T he fu r ther the
coefficien t fal ls below the m or e unr esponsive or
imper fect the m arket .
Relatively few studies of the pr ice elastic ity Of stum pagesupply have been m ade . T he fund ings of the m ajor onesare summ ari zed in Cubbage and Haynes
’
r epor t Evalu ationof Market Responses to Tim ber Scar city Pr oblem s”(r efer enced at the star t of chapter These stud ies haveshown that the pr ice elastic ities of stum page supp ly ar e
inelastic , gener al ly r an ging below Th is m eans that thefr ee m arket system does not work ver y wel l for tim bersupply— i t is to a lar ge degr ee un r esponsive to pr icechanges.
Ther e ar e five m ajor causes of im per fection in tim bermarkets:
1 . Failu r e of the stumpage m arket pr ice to r eflect al l benefits assoc iated w ith forests, such as the pr ovision of w i ldlife habitat , scen ic beau ty ,
and im pr oved water qu al ity ; andal l costs su ch as the po l lu t ion r esu lting fr om the u se of
chem icals and fir es.
2 . T he shor t tim e-
pr eference of individu al landowner s,wh ich constr ain s investm en ts in m an agem en t options yielding rewar ds after an extended per iod of tim e .
3 . Lack of in vestm en t cap ital and m arket and m anagem en tknow ledge am ong pr ivate tim ber owner s.
4 . Owner sh ip object ives that l im it or constr a in tim berpr oduction .
5 . Lim ited competition am ong tim ber buyer s.
T he m ar ket system also has no m ean s of adequatelyrecogn izin g soc ietal in ter ests in the pr otection of the for est
envir onm ent and the m ain tenance of the r esou r ce base andthe productive
_
capabi l i ty of for est land .
Mar ket imperfections and the assoc iated low pr ice elasticity of stum page supply have been the ch ief cause of the
increases in the r elative pr ices Of stum page and m ost tim
ber pr oducts that have taken p lace for decades, and evencentu r ies in the case of lum ber . These longrun r ising r ealpr ices ar e simp ly another qu an t itative m easu r e of the low
pr ice elastic ity of stum page supply . Th is low pr ice elastici ty i s also r eflected in r ap id changes in the pr ices of stum page and m any tim ber products. Lim ited supply r espon ses,along w ith inelastic dem and for m any timber pr oducts, havebeen the ch ief cause of the lar ge cyc lical sw ings in stum p
age and lumber pr ices r eferenced in chapter 2 and shown in
the h istor ical data in the assoc iated append ix tables .
Rising r eal pr ices and pr ice cyc les have impor tan t and ad
ver se impacts on the econom y and the envir onm en t . In r e
sponse to the need to constr ain these effects and to pr otect
the forest envir onm ent and the pr oductive capability of for
est land and the tim ber r esou r ce , soc iety has developed an
ar r ay Of po l ic ies and pr ogr am s to incr ease forest pr odu ctivi ty . These inc lude t he pu blic and pr ivate pr ogr am s ofpr otection , r esear ch , education , techn ical and fin ancialassistance , public owner sh ip , and spec ial tax laws and forest pr actices acts that have been descr ibed in the pr eceding chapter s. Although i t has not been r ecogn ized in any of
the suppor ting legislation , and in on ly a lim ited way in thefor estr y l iter atur e , al l of these th ings ar e m ean s of deal ingw ith m arket imper fections.
By any standard , these po l ic ies and pr ogr am s haveworked . They have r esu lted in the r egener ation of the sec
ond and th ird for ests and m ade possible the developm en tand gr ow th of the for est industr ies, wh ich now const itu tesuch an im por tan t par t of the Sou th ’
s econom ic base . T he
pr ogr am s ar e also effic ien t— the benefits exceed the cost
and they are effective in incr easing the income of tim berland owners.
Bu t they ar e not enough . If fu tu r e em ploym en t and incom e in the for est indu str ies ar e to be sustained , action m ustbe taken to expand both public and pr ivate pr ogr am s that
are effective in incr easing tim ber suppl ies. Th is can be donein a var iety of w ays, bu t m ar ket for ces m u st besupp lem en ted . Ther e i s simply no alter native i f the tim berr esour ce is to m ain tain i ts im po r tan t place in .the economy
of the Sou th .

McClu r e, J .P . ; Kn i gh t , H . 1984 . Em pi ri cal y ields of t im ber and for estb iom ass in the Sou theast . Res. Pap . SIS- 245. Ashevi l le , NC : U .S. De
par tmen t of Agr icu l tu r e , For est Service , Sou theaster n For est Exper iment Stat ion . 75 p»
.
Nor r is, F.W. 1985 . T imber Mar t—Sou th . l’
O( l—l 2 ) .

T able —Est im ated vo lum e of r ou ndw ood t im ber pr oductsin the Sou th , by pr oduct , softwoods and har dwoods, r eg ion , and S tate , 1984
Mi l l ion cubi c feet
pi l ing , fenceposts, cooper age logs,
2 Less than cub ic feet .
Note: Data m ay not add to tota ls because of r ound ing .
258

T able — Est im ated stumpage value of r oundwood t im ber produc ts in the Sou th , by p roduct , softw oods and hardwoods, r eg ion , and
S tate . 1984
Mi l l ion dol la r s
fenceposts,
2 Less than
Note: Data m ay not add to tota ls because of r ound ing .
259
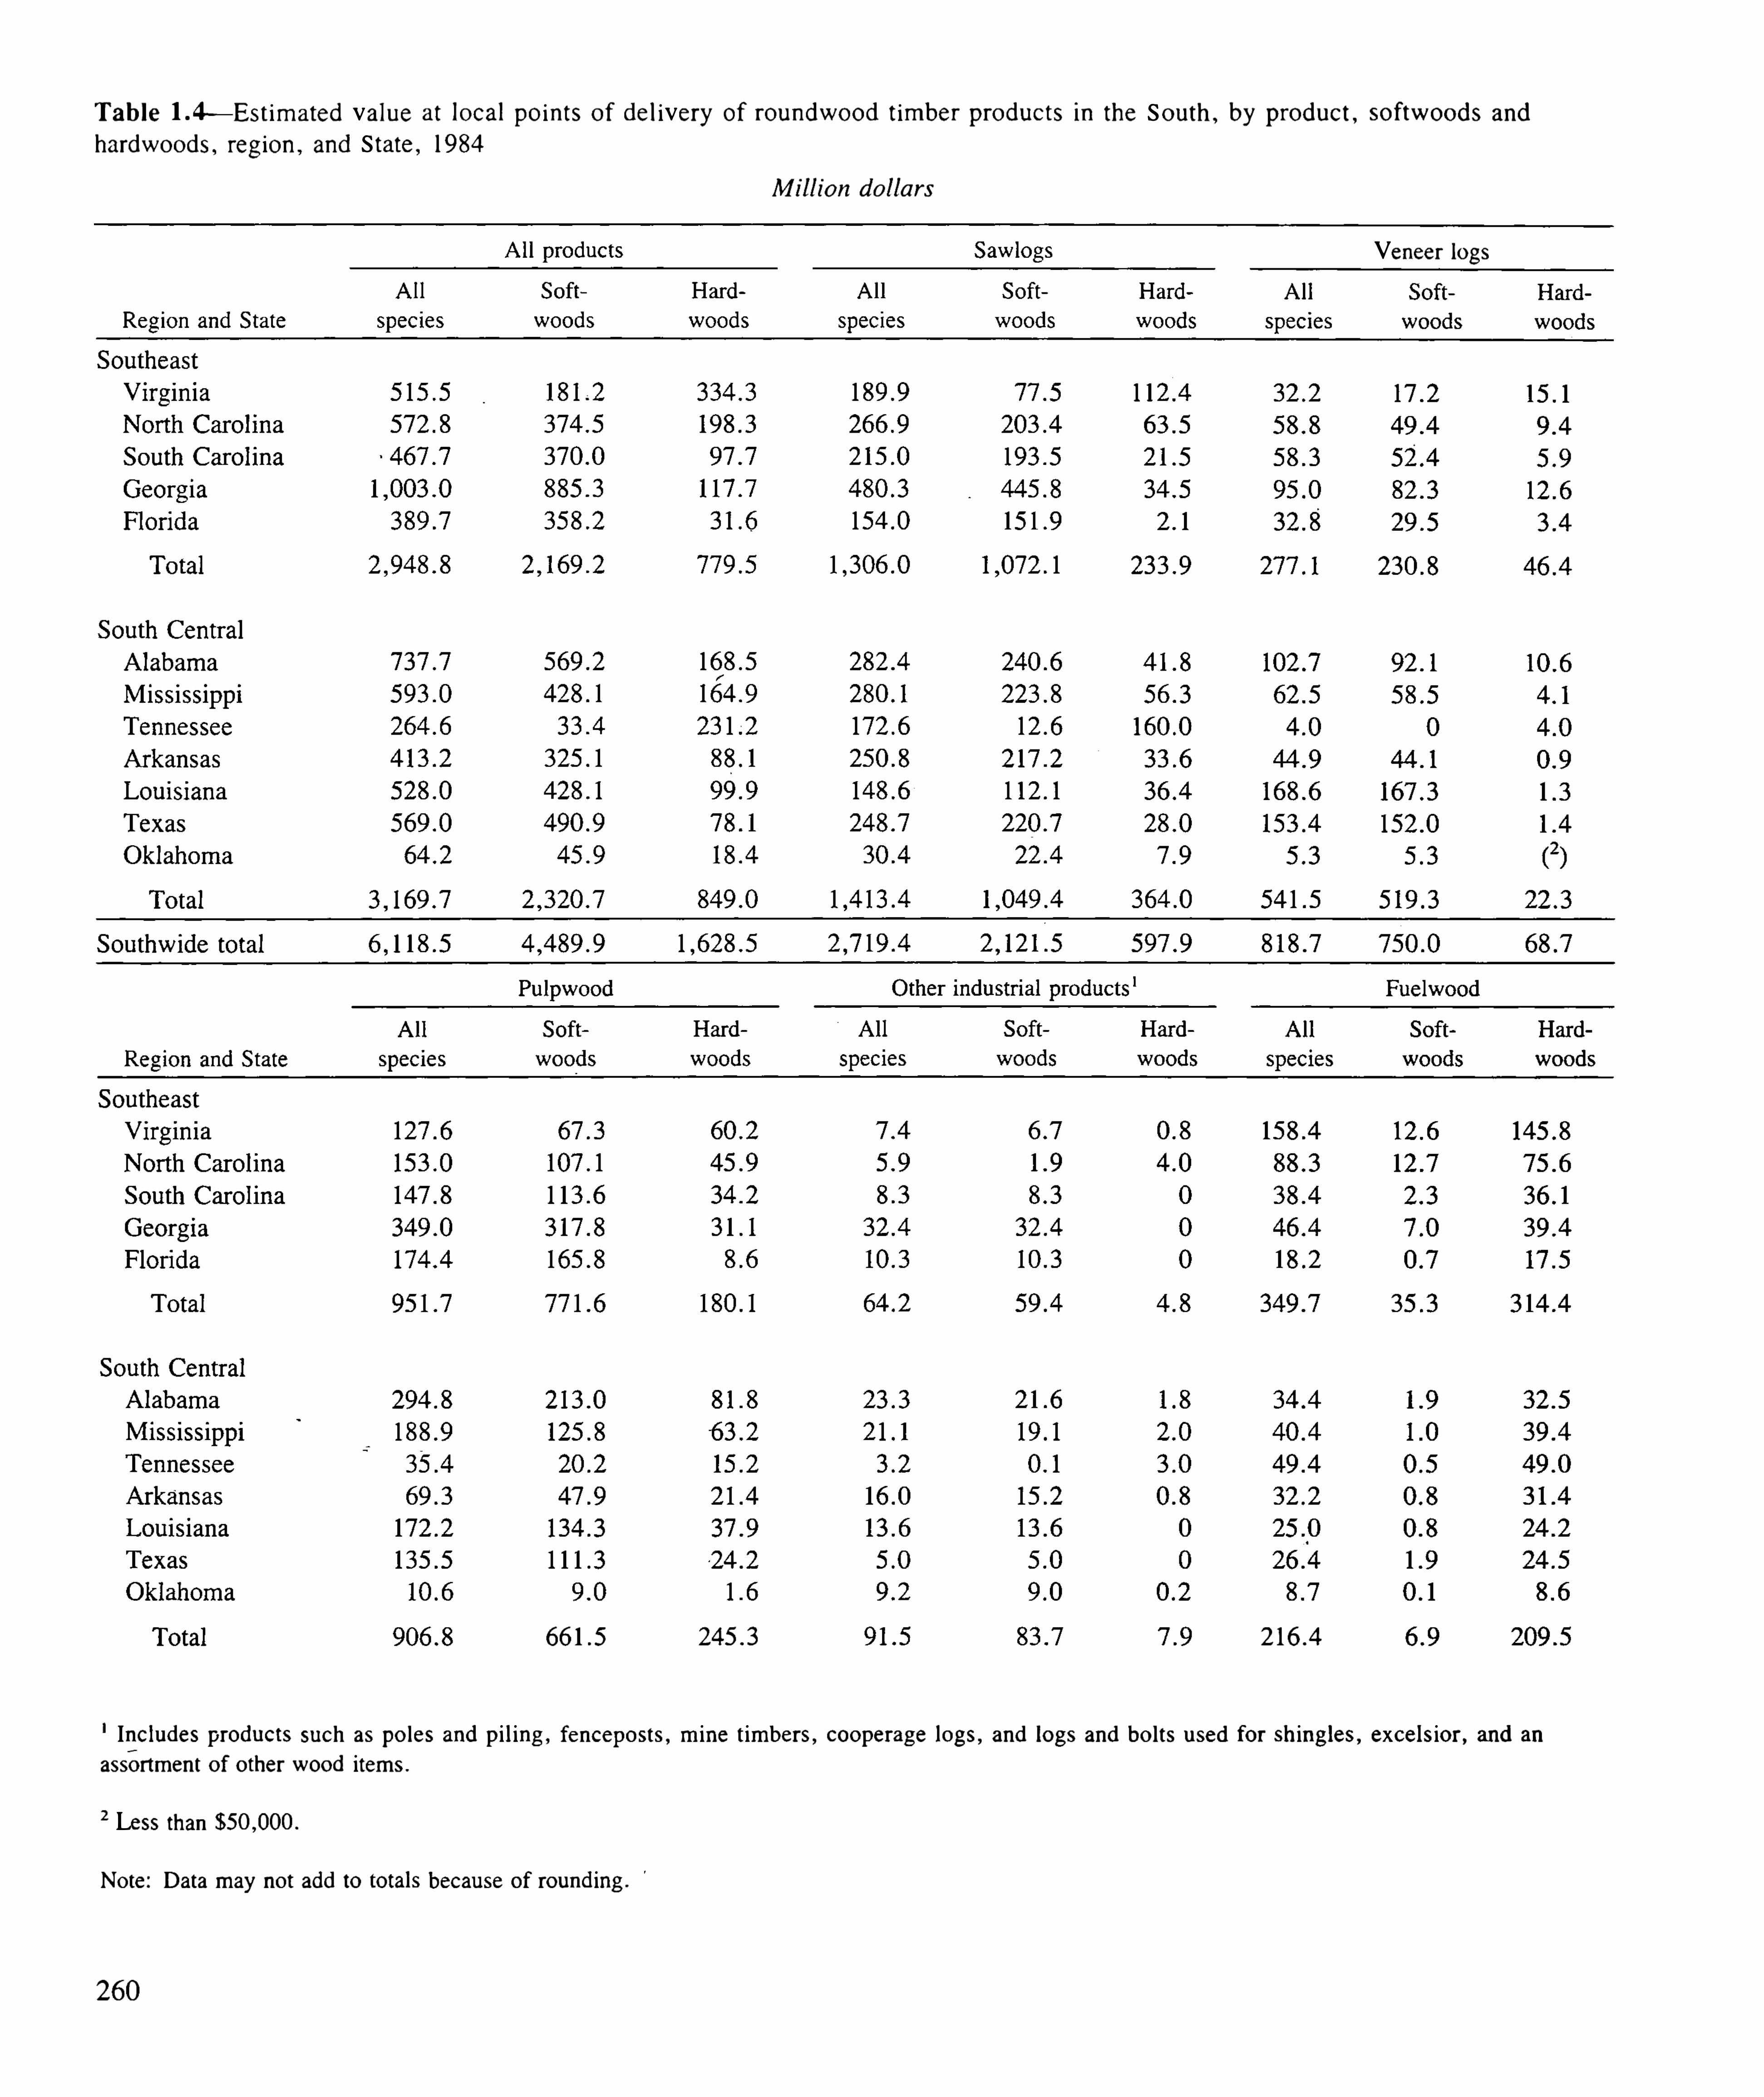
T ab le — Est im ated va l u e at loca l po in ts of del iver y of r ou n dwood t im ber pr odu c ts in the Sou th , by pr odu ct , softw oods and
hardw oods, reg ion , and S tate , 1984
Mi l l ion do l la r s
Veneer logs
In c ludes pr odu cts such as po les and p i l ing , fenceposts, m in e t im ber s, cooper age logs, and logs and bo l ts u sed for sh ingles, excelsior , and an
assor tmen t of other wood item s.
2 Less than
Note: Data m ay not add to totals becau se of r ound ing .
260

T ab le — Est im ated values at local pbin ts of del ivery of r oundw ood t im ber products and the h ighest valued
agr icu l tu r al cr ops for r eg ions and S tates in the South , 1984
Mi l l ion do l la r s
Sou theast
Flor ida Geor gia
Nor th Car o l in a Sou th Car ol in a Vir g in ia
Sou th Cen tr a l
A labam a Ar kansas
Lou isiana M ississipp i Okl ahom a
T ennessee T exas
262

T able — T ype II outpu t , incom e , and employm en t m u lt ipl ier s for S tates in the Sou th , by type of forest industr y ,
19841
Ou tpu t Incom e Employm en t
Lumber and Pu lp and Lum ber and Pu lp and Lumber and Pu lp and
wood pr oducts paper products wood products paper pr oducts wood products paper products
Sou th Cen tr alAlabam aArkansasLou isiana
Mississipp i
Oklahom aT ennessee
T exasNumber s m arked by an aster isk are taken from inpu t—ou tpu t m odels developed for ind ividual States since 1964 . T he other s ar e
estim ates developed by Fl ick ( 1986 T hese m u l tipl ier s reflect d ir ect , ind ir ect , and induced effects of a one- un it change inoutput , income , or employmen t .
Sour ce: Fl ick ( 1986
263

T able —Num ber of establ ishm en ts, employmen t , wages and sa lar ies, value of shi pmen ts, and value added for al l m anufactu ri ng and for
forest industr ies1 in the Sou th , by r eg ion and S tate , 1982
Establ ishments Employmen t Wages and salar ies Value added by manufacturr
Al l m anu Al l m anu Forest Al l m an u Al l manu Al l m anu
Region and State factu r i ng factu r ing industr ies factu r ing factu ri ng fac tu r i ng
Thousand Thousand Mi l l ion Mi l l ion Mi l l ion Mi l l ion Mi l l ion Mi l l ion
Number Number P er cen t2
emp loyees emp loyees Per cen t2
dol la r s dol l a r s P er cen t2
dol la r s dol la r s Per cen t2 do l la r s dol la r s Per cei
Sou th Cen tra l
Alabam aMississippiT ennessee 17 ,84 l .6
ArkansasLou isiana 830 57 ,058 . l
T exas 3 2
Oklahoma 281
T otal 36 1
Sou thw ide total
Logging con tr actor s and m anu factu rers whose pr im ary products inc lude r ough and dr essed lumber , floor ing , d imension stock , r ai l r oad ties, fu r n itu refr ames, wood lath , wood ch ips, pu lp , paper , paperboard , bu ild ing paper and boar d , veneer , plywood , m i l lwork , wood fu r n itu re an d fixtur es, woodcon tainers, pal lets, pr efabr icated wood str uctu res and m ob i le hom es, sh ing les, excelsior , par t ic leboard , gums and wood chem icals, wood preserving , and
convert ed paper and paperboar d pr oducts.
2Forest industri es figu r e as a percen tage of al l m anu factu r ing .
Note: Data m ay not add to totals because of r ound ing .
Sour cez' Der ived fr om data pub l ished by the U .S . Depar tm en t of Comm er ce , Bu r eau of the Census, Census of Manu factu r es, 1982 . For categori es where
the Bu reau of the Cen sus w ithhel d data to avo id d isc losure of inform at ion abou t par t icu lar compan ies, estim ates were m ade based on approxim ate em ploymen tfigu res, industry aver ages, and inform ation ava i lable on c losely related industr ies.
264

T ab le — Num ber of establ ishm en ts, employm en t , w ages an d sal ar ies, val ue of shi pm en ts, and val ue added by m anu factu r e in the
forest indu str ies i n the Sou th , by r eg ion , S tate , and type of industr y , 1982— Con t inu ed
Reg ion , State an d type Offorest industry Establ ishmen ts
Num ber
Sou th Cen tr a l
A labam a
Logg ing and sawm i l lsl
Plywood ,veneer , and wood pr oducts
2
Wood fum i tur e and fixtu r es3Pu lp , paper , and boar d m i l ls
"
Paper and paperboar d pr oducts5
T otal , al l for est industri es
Mississipp iLogg ing and sawm i l lsl
Pl ywood , veneer , and w ood pr oducts2
Wood fu r n itu r e and fixtu res3
Pu lp , paper , and boar d m i l ls4Paper and paperboard pr odu cts
5
T otal , al l for est industr ies
T ennessee
Logg ing and sawm i l ls1
Plywood , veneer , and w ood products2
Wood fu r n itu r e and fixtu res3Pu lp , paper , and boar d m i l ls
4
Paper and paper boar d pr oducts5
T otal , al l for est industr ies
Arkansas
Logg ing and sawm i l ls1
Plywood , veneer , and wood products2
Wood fu r n itu r e and fixtu r es3Pu lp , paper , and boar d m i l ls
"
Paper and paperboard products5
T otal , al l for est indu str ies
Lou isianaLogg ing and sa i l ls
1
Plywood , veneer , and“
Wood produ cts2
Wood fu r n itu r e and f ixtu r es3Pu lp , paper , and boar d m i l ls
"
Paper and paperboar d products5
T otal , al l for est indu str ies
T exasLogg ing an d saw rrri l ls
I
Plywood , veneer , and wood produ cts2
Wood fu r n itu re and fixtu r es3Pu lp , paper , and boar d rr ri l ls
"
Paper and paperboar d products5
T otal , al l for est industr ies
266
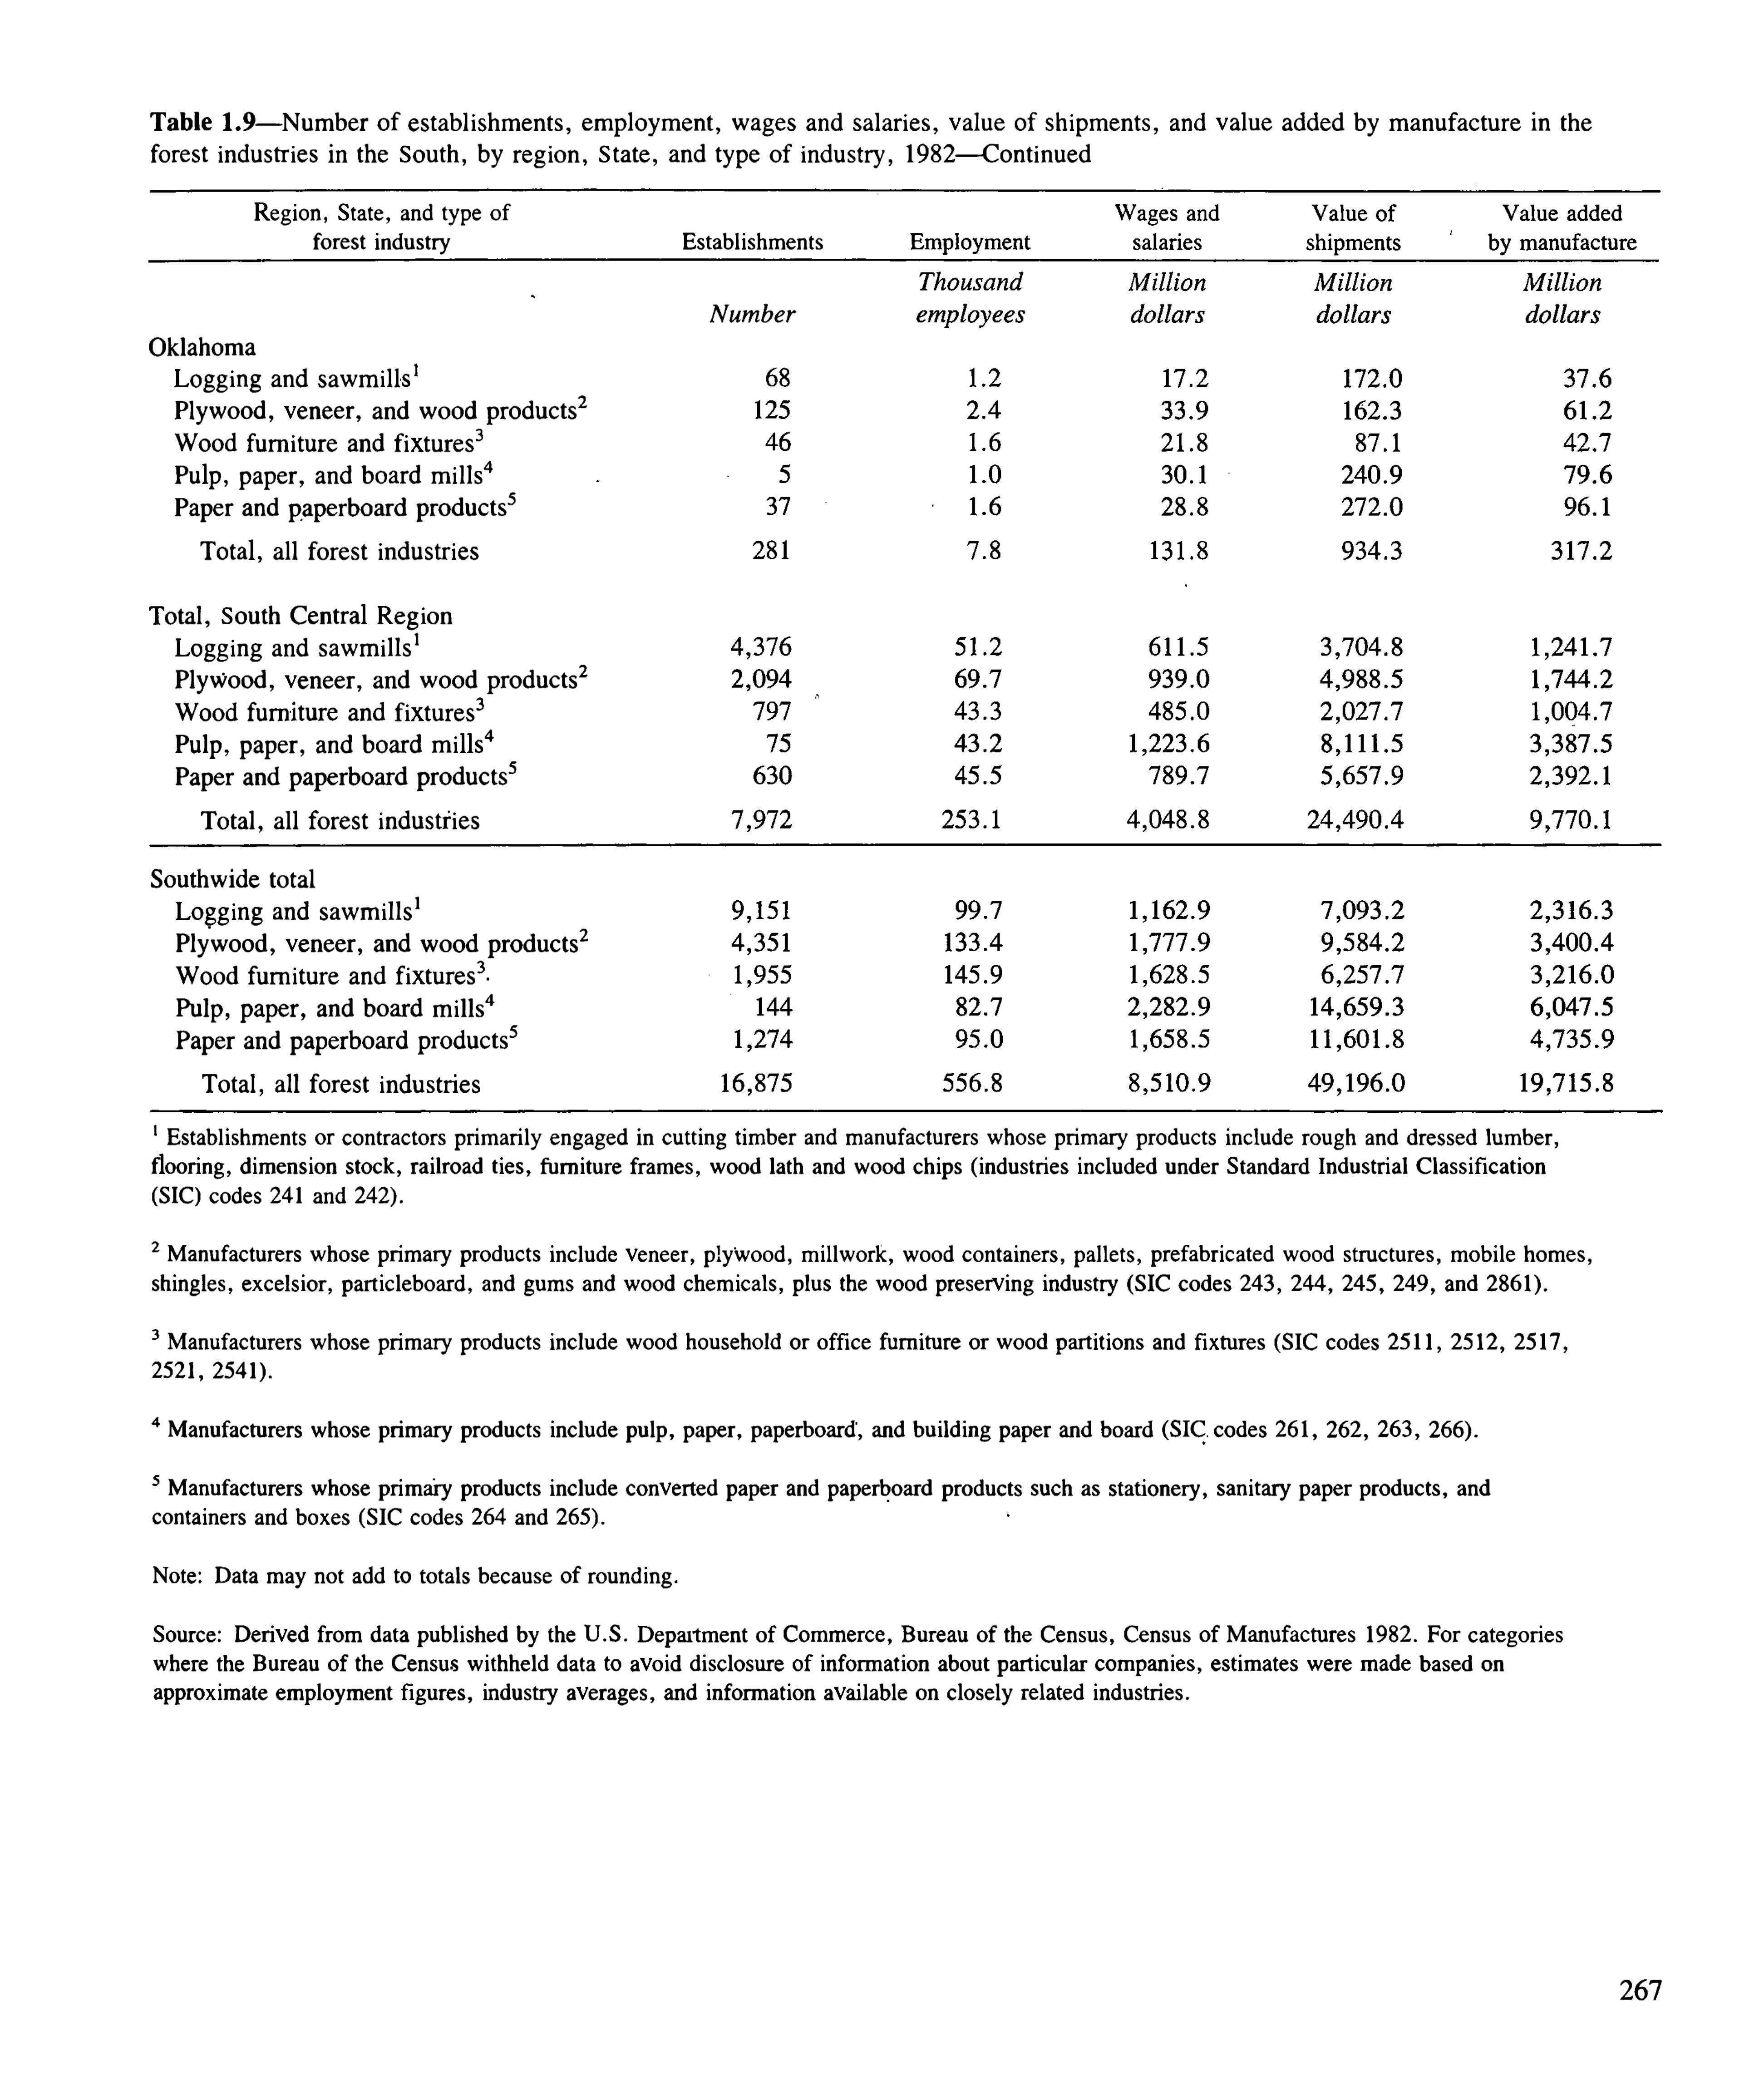
T ab le — Num ber of estab l ishm en ts, em ploym en t , w ages and salar ies, value of sh ipm en ts, and value added by m anu factu r e in the
forest industr ies i n the Sou th , by reg ion , S tate , and type Of indu stry , 1982—Continued
Reg ion , State , and type of
fo rest indu stry Establ ishmen ts
Number
Oklahom a
Logg ing and sawm i l l -s1
Plywood ,veneer , and wood products
2
Wood fu r n itu r e and fixtur es3Pu lp , paper , and board m i l ls
"
Paper and paperboar d products5
T otal , al l for est industr iesT ota l , Sou th Cen tr al Reg ionLogg ing and sawm i l ls1
Plywood ,veneer , and wood pr oducts
2
Wood fum -i tur e and fixtur es3Pu lp , paper , and boar d m ills"Paper and paperboard pr oducts
5
T otal , al l forest industr ies
Sou thw i de total
Logg ing and sawm il ls1
Plywood , veneer , and wood products2
Wood fu r n itur e and fixtures3Pu lp , paper , and board m il ls
"
Paper and paperboar d pr oducts5
T otal , al l for est indu str ies
Estab l ishmen ts or con tr actor s pr im ar i ly engaged in cu tting timber and m anufactu r er s whose pr im ary products include r ough and dressed lumber ,
floor ing , d imension stock , r ail road t ies, furn iture fr ames, wood lath and wood ch ips ( industr ies inc luded u nder Standar d Indu str ial Classification(SIC) codes 241 and
2 Manufactu rer s whose pr imary products inc lude veneer , ply'
wood , m il lwork , wood con tainer s, pal lets, pr efab r icated wood str uctu res, m ob i le homes,sh ingles, excelsior , par t ic leboar d , and gum s and wood chem icals, plus the wood pr eserving indu stry (SIC codes 243 , 244 , 245 , 249 , and
3 Manufactu r er s whose pr im ary pr oducts inc lude wood househo ld or office furn iture or wood par t it ion s and fixtu r es (SIC codes 25 1 1 , 25 12 , 25 17 ,
252 1 ,
Manufactu r er s whose pri m ar y pr oducts inc lude pu lp , paper , paperboar d'
, and bu ild ing paper and boar d (SIC . codes 26 1 , 262 , 263 ,
5 Manufacturer s whose pr im ary pr oducts inc lude conver ted paper and paperboar d pr oducts such as stat ionery , san itary paper products, andcon tainer s and boxes (SIC codes 264 and
Note: Data m ay not add to totals because of r ound ing .
Sou rce: Der ived from data publ ished by the U .S. Depart men t of Commer ce, Bu reau of the Census, Censu s of Manufactu r es 1982 . For categor ieswhere the Bu reau Of the Census w ithhel d data to avo id d isclosur e of inform at ion abou t par t icu lar compan ies, estim ates were m ade based on
approximate employmen t figu res, industry aver ages, and inform ation available on closely r elated industri es.
267

T ab le — Em ploym en t in m an u factu r ing of lum ber and w ood pr oductsIand pu lp and paper pr oducts
2in the Sou th , by r eg ion
and S tate , se lected year s 1947—82
Thousan d emp loyees
Reg ion and S tate 1954
Sou theast
Vi rg in iaLum ber and wood productsPu lp and paper pr oducts
Nor th Caro l in aLum ber and w ood productsPu lp and paper productsSou th Caro l inaLumber and wood productsPu lp and paper pr oducts
Geo rg iaLumber and wood pr oductsPu lp and paper pr oducts
Flor idaLumber and wood pr oductsPu lp and paper pr oducts
T ota l
Lum ber and wood pr oductsPu lp and pape r pr oducts
Sou th Cen t r a l
A labam aLumber and wood pr oductsPu lp and paper pr oduc ts
Mississipp iLumber and wood produc tsPu lp and paper pr oducts
T ennessee
Lum ber and wood pr oductsPu lp and paper products
A rkansasLum ber and wood products .
Pu lp and paper pr oducts
Lou isianaLum ber and wood productsPu lp and paper pr oducts
T exas"
Lum ber and wood prgductsPu lp and paper products
Oklahom a
Lumber and wood pr oductsPu lp and paper products
T otal
Lum ber and wood productsPu lp and paper pr oducts
268

Tab le — Wages and salar ies in m anufactu r ing of lum ber and w ood productsland pu lp and paper pr oducts
2in the Sou th , by
and S tate , selected year s 1947—82 . Data ar e shown in cu r r en t do l lar s and constan t 1967 do l lar s.
Mi l l ion do l la r s
Virg in iaLum ber and wood productsPu lp and paper pr oductsNor th Car o l inaLum ber and wood productsPu lp and paper productsSou th Car o l inaLum ber and wood pr oductsPu lp and paper products
Georg iaLum ber and wood productsPu lp and paper pr oducts
Flor idaLumber and wood pr oductsPu lp and paper products
T otal
Lumber and wood productsPu lp and paper products
Sou th Cen tr a l
A labam aLum ber and wood productsPu lp and paper products
Mississipp iLum ber and wood productsPu lp and paper products
T ennessee
Lum ber and wood productsPu l p and paper pr oducts
A rkansasLum ber and wood pr oductsPu lp and paper pr oducts
Lou isianaLumber and w ood productsPu lp and paper pr oducts
T exasLum ber and wood productsPu lp and paper products
Oklahom a
Lum ber and wood produc tsPu lp and paper products
T otalLumber and wood productsPu lp and paper products
270

Vi rg in iaLumber and wood productsPu lp and paper productsNorth Car o l inaLumber and wood pr oductsPu lp and paper pr oductsSou th Carol inaLum ber and wood productsPu lp and paper pr oducts
Georg iaLumber and wood pr oductsPu lp and paper pr oducts
Flor idaLumber and wood pr oductsPu lp and paper pr oducts
T otal
Lumber and wood pr oductsPu lp and paper pr oducts
Sou th Cen tr a l
AlabamaLum ber and wood pr oductsPu lp and paper pr oducts
Mississipp iLumber and wood pr oductsPu lp and paper products
T ennessee
Lumber and wood pr oductsPu lp and paper pr oducts
ArkansasLum ber and wood pr oductsPu lp and paper pr oducts
Lou isian aLum ber and wood pr oductsPu lp and paper products
T exasLum ber and wood pr oductsPu lp and paper products
Oklahom a
Lum ber and wood pr oducts
_
Pu lp and paper productsT otalLumber and wood pr oductsPu lp and paper pr oducts
Southw ide totalLumber and wood pr oducts
1982
M i l l ion 1 967 do l la r s3
1963
27 1

T able — Wages and sal ar ies i n m anu factur ing of lumber and w ood pr oducts1an d pu lp and paper pr oducts
2in the Sou th , by
and S tate , selected year s 1947—82 . Data ar e show n in cu r ren t dol l ar s and con stan t 1967 do l l ar s — C on t inued
Man ufactu r ing industri es inc luded u nder Standar d Industr i al Cl assification (SIC) code 24 in the Census of Man ufactu r es for each year , w ith th ifo l low ing exceptions. Data for SIC 24 1 1 , logg in g camps and logg ing con tr actor s, were not co l lected by the 1947 censu s. T h is category r epreser
1 1 per cent of employmen t under SIC 24 in the 1954 census. Data for SIC 245 1 m ob i le homes, were inc luded under SIC 24 for the fir st t ime i tcensus. T o improve com par ab i l ity w ith ear l ier census year s, data for SIC 245 1 ar e not inc luded in the figu r es for censu s year s 1972 , 1977 , and
24 does not inc lude wooden fu rn itu r e and fixtu r es.
2 Man ufactu r ing industr ies inc luded under SIC code 26 in the Census of Manu factur es for each year , such as pu lp , paper , and paperboar d m il ls,paperboard con ta iner s an d boxes, and conver ted paper products.
3Converted to constan t do l lar s by d ivid ing cur r en t dol lar s by the Consumer Pri ce Index for al l items as r epor ted by the U .S. Depar tm en t of Comm e
of Econom ic Ana lysis, 1967 100 .
Source: U .S. Depar tmen t of Comm erce , Bu r eau of the Census, Censu ses of Man ufactu r es.
272

T ab le — Value added in m anufactu ri ng of lum ber an d wood pr oductsIand pu lp and paper products
2in the Sou th , by r eg ion and S tate ,
selected year s 1947—82 . Data ar e show n in cu r r en t do l lar s and con stan t 1967 do l lar s— Con t in ued
M i l l ion 1 967 do l la r s"
Region and S tateSou theast
Virg in iaLumber and w ood pr oductsPu lp and paper pr oducts
Nor th Car o l inaLum ber and w ood pr odu ctsPu lp and paper produc tsSou th Car o l inaLumber and w ood pr oductsPu lp and paper pr oduc ts
Geor g iaLum ber and wood pr oductsPu lp and paper pr oducts
Flo r idaLum ber and w ood pr oductsPu lp and paper products
T otal
Lum ber_and wood pr oducts
Pu lp and paper pr oducts
Sou th Cen tr al
Alabam aLumber and wood productsPu lp and paper pr oducts
M ississipp iLum ber and wood pr oductsPu lp and paper products
T ennessee
Lum ber and w ood pr oductsPu lp and paper pr oducts
Ar kansasLum ber and w ood pr oductsPu lp and paper pr oducts
Lou isian aLum ber and w ood pr oductsPu lp and paper pr oducts
T exasLumber and wood pr oductsPu lp and paper pr oducts
Okl ahom a
Lum ber and w ood pr oductsPu lp and paper pr oducts
T otal
Lum ber and wood productsPu lp and paper products
274

T ab le LI Z — Val ue added i n m anu factu r i ng o f lum ber and wood pr oducts1and pu lp and paper pr oducts
2i n the Sou th , by r eg ion and
State , selected year s 1947—82 . Data ar e shown in cu r r en t dol lar s and constan t 1967 do l lar s — Con t inued
Manufactu ri ng industr ies inc luded under Standar d Industr ia l Classification (SIC) code 24 in the Census of Manu factures for each year , w ith the fo l low ingexceptions. Data for SIC 241 1 , logg ing camps and logg ing con tr actors, were not col lected by the 1947 censu s. T h is category repr esen ted abou t 1 1
per cent of employmen t under SIC 24 in the 1954 census. Data for SIC 245 1 , m ob i le hom es, were included under SIC 24 for the fir st t ime in the 1972 census.
T o improve compar ab il ity w ith ear l ier census year s, data for SIC 245 1 are not inc luded in the figu res for census _year s 1972 , 1977 , and 1982 . SIC 24 does
not inc lude wooden fu r n iture and fixtures.
2 Manufactur ing industr ies inc luded under SIC code 26 in the Censu s of Manufactu res for each year , such as pu lp , paper , and paperboar d m il ls, paperboardcon tainer s and boxes, and conver ted paper pr oducts.
3Due to a change in instr uctions for reporting inven tory values for the 1982 Econom ic Censuses, value added figu res for 1982 may not be stri ctly compar able
to figures for pr ior year s.
Conver ted to constan t dol lars by d ivid ing cu r r en t do l lar s by the Producer Pr ice Index for al l industr ial comm od it ies as repor ted by the Depar tmen t ofCommer ce, Bu reau of Econom ic Analysis, 1967 100 .
Sou rce: U .S. Depar tm en t of Commerce , Bu reau of the Census, Censuses of Manufactu r es.
275

T ab le — Em ploym en t , w ages and sa lar ies, and value added by m anufactu r e in for est industr ies in the Sou th , by indu stry gr oup ,
reg ion and S tate , 1982 and 19851
Change3
Change3
P er cen t P er cen t
Sou theast
Sou th Cen tr al
276

[Th is page in ten tionally left blank ]
278

Tab le — Rosin pr oduct ion in the Un ited States, by sou r ce ,
selected years 1900—84
Steam - d ist il led
pro Pr o Pro Pro
Year l duct ion duction duction duction
Thousand Thousand Thousand
51 7 520 520
Thousand pound pound pound
dr ums d r ums P er cen t dr um s Per cen t d r ums P er cen t
Cr op year Apr i l—Mar ch 1900—75 , calendar year 1980—84 .
2Pr oduction fr om the g iven sou r ce as a per cen tage of total pr oduction .
Note: Data m ay not add to totals becau se of r ound ing .
Sour ces: I9OO—6 1 —King , D .E . ; Wagner , H .B . ; Goldsbor ough , G .H . 1962 .
T he ou tlook for naval stor es. Wash ington , DC : U .S. Depar tmen t of
Agr icu l tu re , Forest Service , Agr icu l tu r al Stab i l izat ion and Conservat ionService, an d Stat istical Repor t ing Service: 63 . 1955—74— U .S. Depar t
men t of Agri cu l tu r e , Cr op Repor t ing Boar d , Statist ical Repor t ing Service .
1977 . Naval stor es a summ ary of annua l and m on th ly statistics, 1954—74.
Stat . Bu l l . 567 . Wash ington , DC : U .S. Departm en t of Agr icu l tu r e: 5 .
1 968—79— Ul ri ch , AH . 1983 . T im ber product ion , trade, consumption , and
pr ice statistics 1950—81 . Misc . Publ . 1424. Wash ington , DC: U .S. Depar t
men t of Agr icu l tu r e , Forest Service: 76 . 1 980—84— [Der ived fr om ] NavalStores Review . 1984 . Naval stor es r eview in tern ational year book . New
Or leans: Naval Stores Review : 5 .
T able — T u rpen t ine pr oduct ion i n the Un ited S tates, by type ,
selected year s 1900—84
Su l fatepr o Pr o Propor Pro Pr o
Year 2 duct ion duction tion 3 duction duct ion
Thousand Thousand Thousand Thousand
50 -
ga l lon 50 -
ga l lon 50 -
ga l lon 50 -
ga l lon
ba r r els ba r r els Per cen t ba r rels P er cen t ba r r els P er cen t
Data for 19 19—56 inc lude sm al l amoun ts of destr u ctively d ist il ledturpentine .
2Cr op year Apri l—Mar ch 1900—75 , calendar year 1980
—84
3Pr oduction from the g iven sou rce as a percen tage of total pr oduction .
Less than 1 per cent .
Sou rces: See footnote on append ix table

T ab le — Report ed lum ber product ion i n the South , by m ajor spec ies or spec ies group , selected year s 1869— 1984
M i l l ion boa r d feet , l umber ta l ly
Softwoods H ar dwoods
Data not availab le .
2Exc ludes T ennessee .
3Exc ludes elm .
Note: Data m ay not add to totals because of r ound ing .
Sources: — S teer , H enr y B . 1948. Lumber productioni n the Un ited States 1799—1946 . M isc . Pub l . 669 . Wash ington ; DC: U .S. Depar tm en t of Agr ic233 p . 1950- 84 U .S. Depar tment of Comm er ce , Bu reau of the Census. [Annual issues ] Cu r ren t industr ial repor ts seri es: lum ber pr oduction and m i l l stocks
[M13G befor e Wash ington , DC : U . S . Depar tmen t of Comm er ce , Bur eau of the Census. (Sou ther n yel low p ine en tr ies for 1954—65 ar e fr om Souest Resou rce An alysis Comm ittee . 1969 . T he Sou th ’
s th ird for est how i t can m eet fu tur e dem ands. [Place of publ ication unknow n ] : Sou thern For est ReAnalysis Comm ittee. 1 1 1 p . )
280

T ab le — Reported yel low p ine lumber product ion in the Sou th , by r eg ion and State , selected year s 1869—1954
Mi l l ion boa r d feet , lum ber ta l ly
Sou theast Sou th Cen tr al
A labam a Ar kansas Lou isian a Mississippi T ennessee T exas
Data not avai lable .
2 Inc luded in Arkansas tota l .
3Exc ludes T ennessee .
Note: Data m ay not add to tota ls because of round ing .
Sou rces: 1869—1945— Steer , H enry B . 1948 . Lum ber production i n the Un ited States 1799—1946 . Misc . Publ . 669 . Wash ington , DC: U .S. Depar tm en t of
Agr icu l ture . 233 p . 1 950—54— U .S. Depar tmen t of Commerce, Bu r eau of the Cen sus. [Annua l issues ] Cu rr en t industr ial repor ts ser ies: lumber productionand m i l l stocksM13G. Wash ington , DC : Depar tm ent of Commer ce , Bu reau of the Census.
282

T ab le — Reported cypr ess lum ber pr oduct ion i n the Sou th , by r eg ion and State , selected year s 1869—1954
M i l l ion boa r d feet , l umber ta l ly
Sou theast Sou th Cen tr a lT ota l T otal
T otal Sou th Nor th Sou th Sou thYear Sou th east Flor ida Georg ia Car o l ina Caro l ina Vir gin ia Centr al A labam a Arkansas Lou isiana Mississippi Oklahom a T ennessee T exas
1879 105 35 9 7 7 10 (1)
1889 226 7 3 35 10 10 15
1899 483 147 85 15 19 26 1
1904 723 147 66 38 10 3 1 22 (1)
Data not ava ilable .
Note: Data m ay not add to totals because of round ing .
Sour ces: See footnote on append ix table

T ab le — Repor ted oak—h ickory l um ber pr oduct ion i n the Sou th , by r eg ion and S tate , selected year s 1869— 1954
Mi l l ion boa r d feet , lum ber ta l ly
Sou theast Sou th Cen tr al
Okla T ennes
hom a see
Data not avai lab le .
2 Inc luded in Arkansas tota l .
Note: Data m ay not add to totals because of r ound ing .
Sour ces: See footnote on append ix tab le
284
Nor th Sou th T ota l
Car o Caro V i r Sou th Ala
l ina l ina g in ia Cen tr a l bam a
155 U)235 2
5 16 8
902 68
841 53
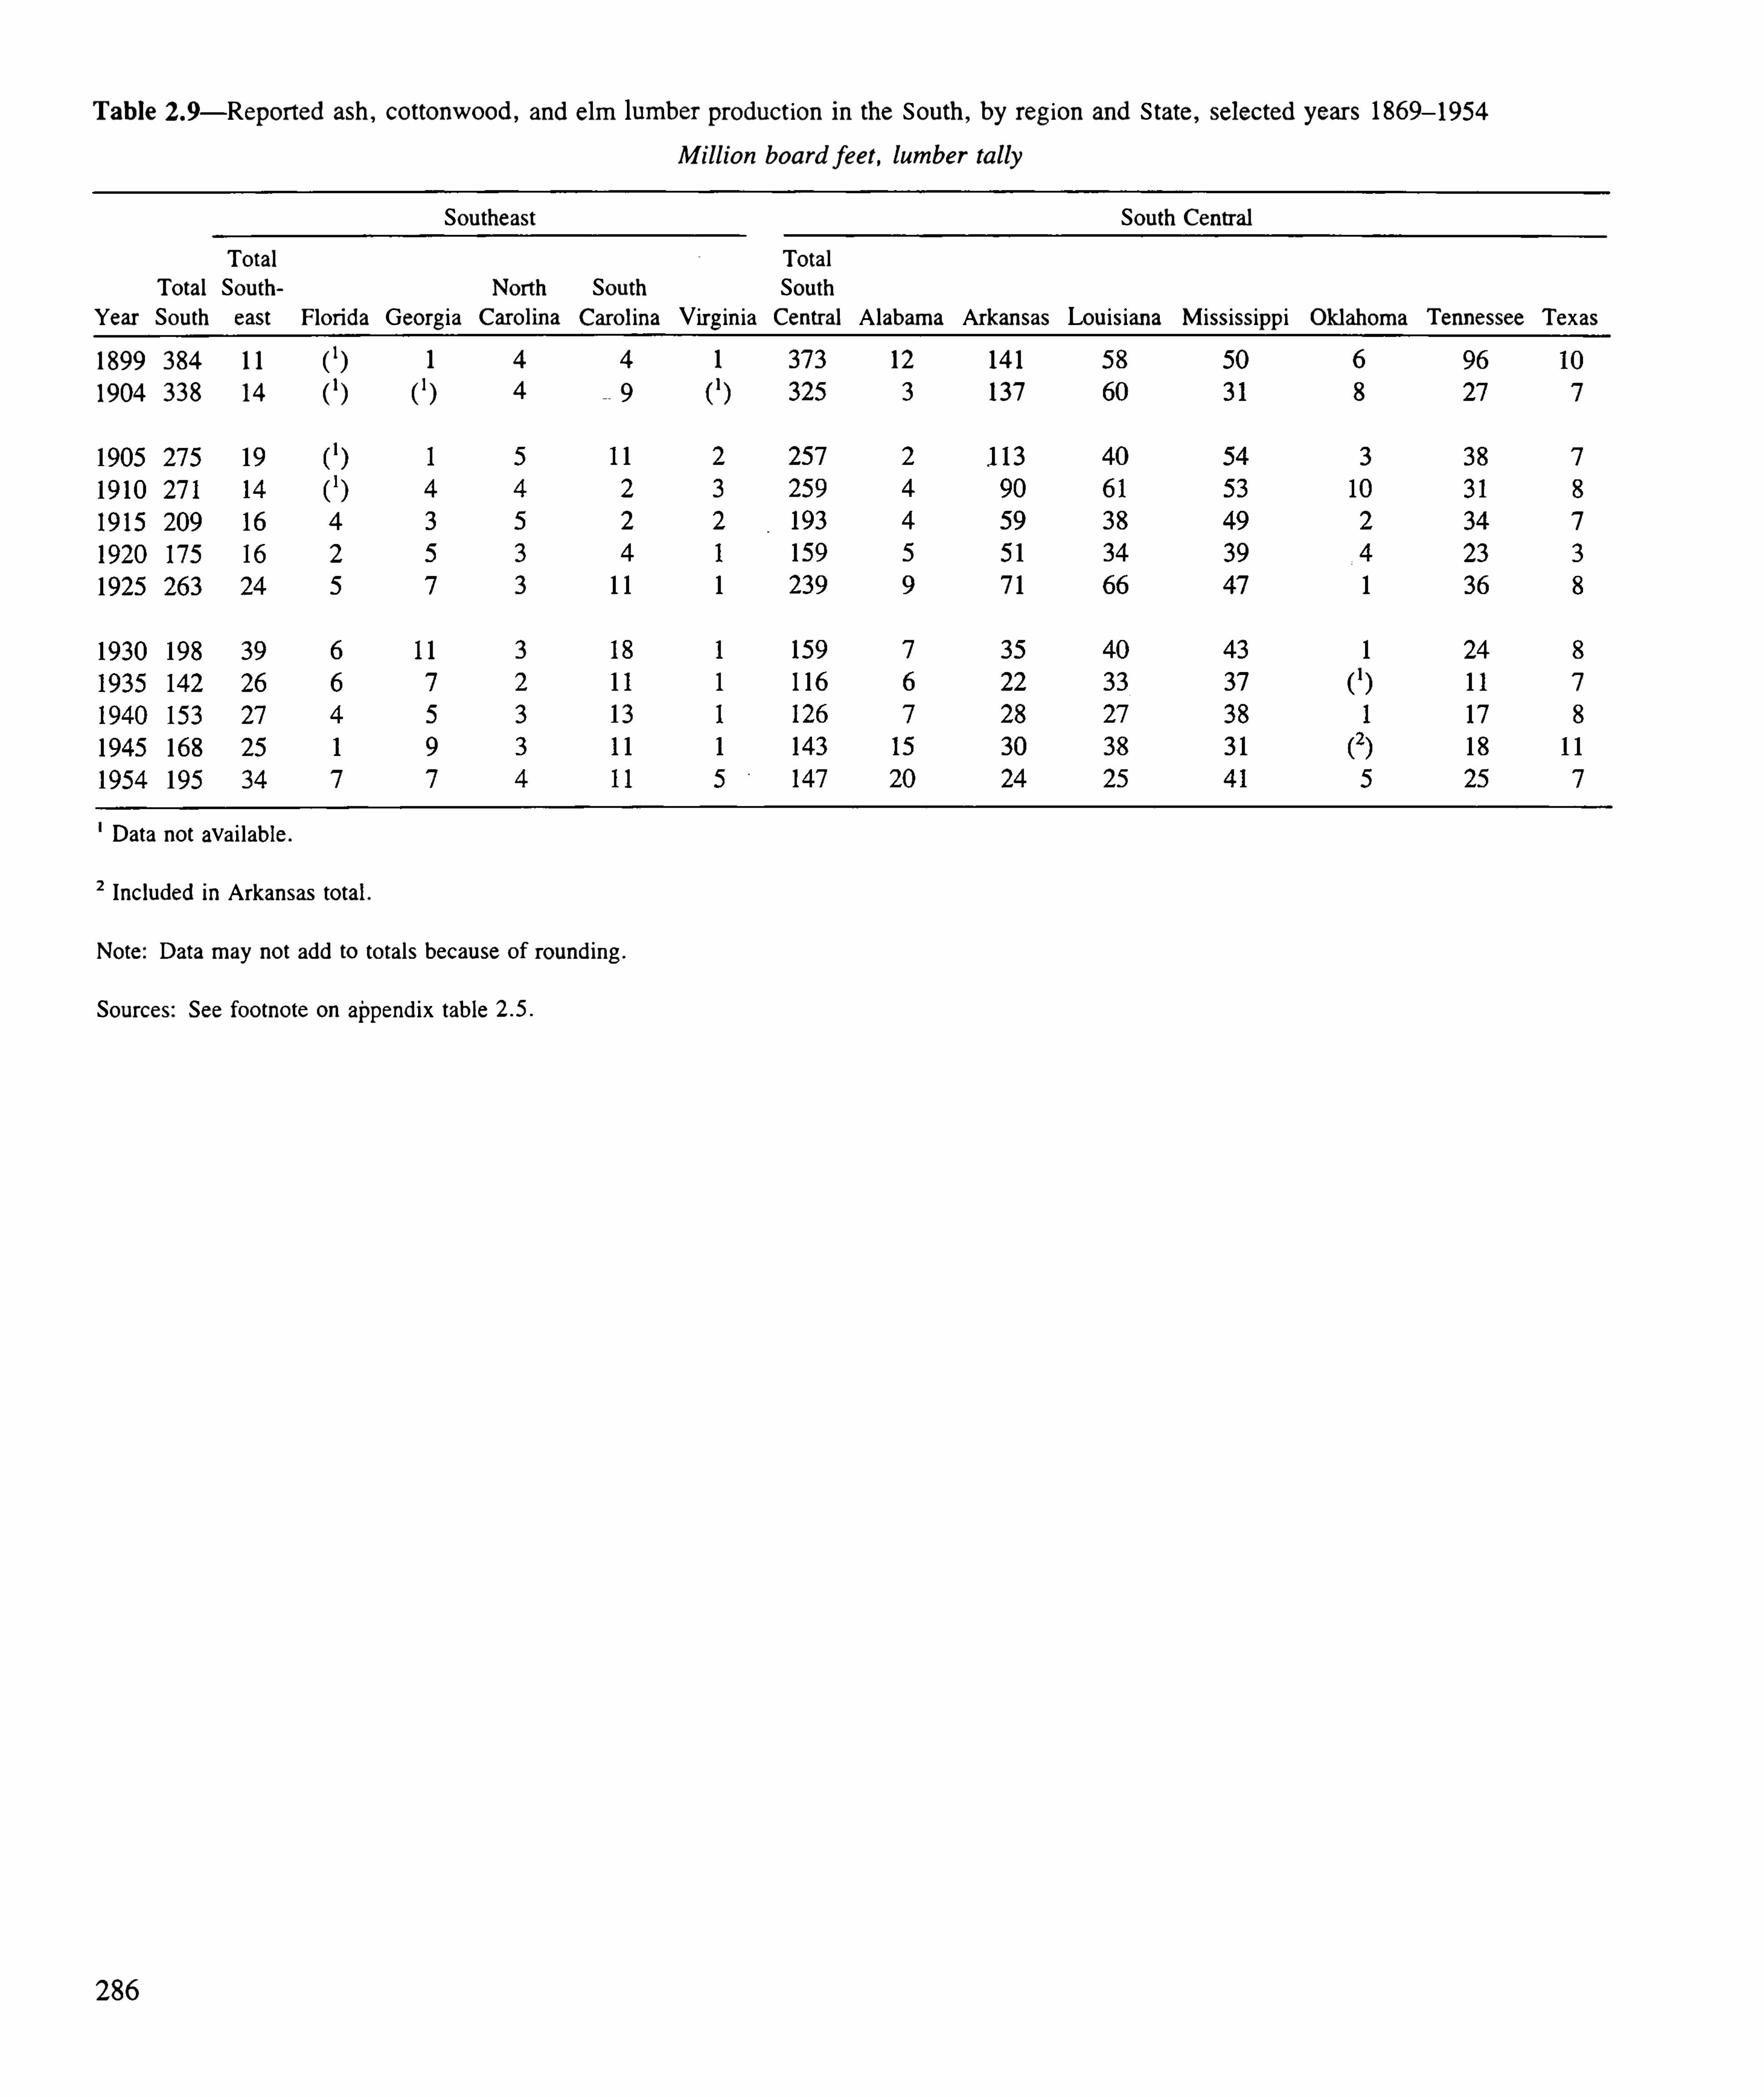
T ab le — Repor ted ash , cottonw ood , and elm lumber pr oduct ion i n the Sou th , by r eg ion and S tate , selected year s 1869— 1954
M i l l ion boa r d feet , lumber ta l ly
Sou theast Sou th Cen tr alT otal T otal
T otal Sou th North Sou th Sou thYear Sou th east Flori da Geor gia Car ol ina Car o l ina Vir g in ia Centr al A labam a Ar kan sas Lou isian a Mississipp i Oklahom a T ennessee T exas
1899 384 1 1 (1) 1 4 4 1 12 14 1 6
1904 3 38 14 (1) (
1) 4 _ 9
13 137 8
Data not ava i lab le .
2 Inc luded in Arkansas total .
Note: Data m ay not add to totals because of r ound ing .
Sour ces: See footnote on append ix table
286

T ab le — Feder al and S tate expend itu res for pr otect ion ‘ fr om w il dfir e , total acr es pr otected , total acr es bur ned , and acr es of t im ber l andbur ned on non - Feder al protected lands2 i 'n the Sou th , by r eg ion , selected year s 19 16
—83
Sou thExpend itur es
Feder al3 Acr es
Sou theast
287

T ab le — Feder al and S tate expend itu r es for pr otect ion ‘fr om w i l dfi r e , total acr es protected , total acr es bur ned , and acr es of t imber landbu r ned on non - Feder al pr otec ted lands
2i n the Sou th , by r eg ion , selected year s 19 16
—83— Con t inued
Sou th Cen tr alExpend itu res
Feder al3 Acres
1Al l fir e protect ion act ivit ies: pr evention , other pr esuppr ession , suppr ession , fuels r eduction or m od ificat ion , and assistan ce to ru r al comm u n it ies.
2Non - Feder al protected lands ar e forest industry , other pri vate ,
and State and local governmen t lan ds under the ju r isd iction of State fir e pr otect ion progr am s.
Some Feder al lands protected by these pr ogr am s m ay be inc luded .
3A l l Feder a l expend itur es for adm i
'
n istr ation , techn ical assistance , cooper ative pr ojects, gr an ts to States, and the va lue of Feder al proper ty g iven or loaned
to States.
State expend itu r es as repor ted to the For est Service . State expend itu r es start fr om the year each S tate establ ished i ts cooper ative progr am : 19 15—NC ,
VA ; 19 l 6—TX; 19 18—LA ; 192 1—T N ; 1924—AL; 1925—GA ; 1926—MS, OK; 1927—SC; 1928—FL; 1933—AR .
3 Conver ted to 1982 dol lar s by d ivid in g the expend itu r es in cu r r en t do l lar s by the impl ic it pri ce deflator s for gr oss n at ional pr oduct for total Feder a lGover nmen t pur chases of goods and ser vices thr ough 197 1 and for nondefense Feder al Gover nm en t pur chases of goods and ser vices for 1972- 83 ,
as repor ted by the U .S. Depar tm en t of Comm er ce , Bu r eau of Econom i c Analysis. T here is no impl ic it pr ice deflator for gr oss n ational pr oduct for year s pri orto 1929 .
6T imber land data ava ilable fr om 1926 to pr esen t ; pri or to 1926 acr es burned ar e for for est l and w ith no d istinct ion m ade between t im ber l an d and otherforest land .
7Data not avai lable.
Note : Data may nOt add to totals because of r ound ing .
288

T able — Regener at ion 1 in the Sou th , by ow ner sh ip and r eg ion , 1925—85— Con t inued
Thousa nd a cr es
Sou th Sou th east Sou th Cen tr al
Other Other Other Other Other Other
T otal In dustry3pri vate Feder al publ ic T otal Indu stry
3pr ivate Feder al publ ic T otal In dustry
3
pr ivate Feder al publ ic
496 57 1 1 82 1 22 1 569 24 7 743 274 43 1 34 4
547 57 8 54 14 647 293 325 2 1 9 545 254 253 34 5
816 381 341 76 19 403 194 17 3 23 13 413 187 168 53 5
793 436 263 72 22 434 257 137 22 18 359 178 126 50 4
757 435 232 72 18 449 269 13 3 32 15 309 167 98 40 4
Inc ludes plan t ing and d ir ect seed ing . Exc ludes site pr epar at ion for n atu r al r egener ation .
2Fiscal year .
3Forest industry and m in in g , r a il r oad , an d u ti l ity com pan ies.
Less than 500 acr es.
3None repor ted .
Note: Data r eported in the sour ces l isted below vary con sider ably in qual ity an d accu r acy . T her efor e , the data shown in th is table m ay be in com plete . Data
m ay not add to total becau se of r ound ing .
Sour ces: 1 980—85— U .S.Depar tm en t of Agr icu l tu r e , For est Service . [Ann u al issues ] 1980 (etc . ) U .S . for est plan t ing r epor t .
—Wash ington ,-
‘
DC : U .S . De
par tm en t of Agr icu l tu r e , For est Service . 1 925—79— U .S . Depar tm en t of Agr i cu l tu r e , For est Ser vice . 1980 . A statistica l h istory of tr ee p lan t ing in the Sou th1925—1979 . Misc . Rep . SA -MR- 8. Atlan ta ,
GA : U .S . Depar tm en t of Agri cu l tu r e , For est Ser vice , Sou theaster n Ar ea , State an d Pr ivate For estry . 36 p .
290

T ab le L IZ — Regener at ionlin the Sou theast reg ion , by owner sh ip and S tate , 1925—85
Thousand ac r es
Sou theastOther pri vate Feder al Other .publ ic
(4)
(5)
(4)
Other pr ivate
1 16
147
252
365
620
Feder al
18
22
25
32
3 1
Other pub l ic
5
9
6
9
10

Tab le — Regener ationlin the Sou theast r eg ion , by ow ner sh ip and S tate , l 925—85— Con t inued
Thousand a c r es
Vir gi n ia
Other pri vate Feder al Other pub l ic Other pr ivate Feder al C
(4) (
4) (
4)
(5) (
5) (
5)
(4) (
5) (
4)
(4) (
4) (
4)
(4) (
4) (
4)
292

T ab le 2 1 2— Regener ationlin the Sou theast r eg ion , by ow ner sh ip and S tate, 1925—85 —Con t inued
Thousand a c r es
Sou th Car ol in aOther pr ivate Feder al Other publ ic Year 2
(5) (
4) 1955
(5) (
5) 1956
(5) (
5) 1957
(5) (
5) 1958
(5) (
5) 1959
294

T ab le L IZ —Regener ationlin the Sou theast r eg ion , by ow ner sh ip and S tate , l 925—85— Con t inued
Thousand a cr es
Geor gia
Other pr ivate Feder al Other publ ic Year 2 T otal Industry3
Other pr ivate Federal Other pub l ic
(3) 1955 48
(5) (
5) (
5) 1956 62 4
(5) (
5) (
5) 1957 47 1
(4) (
5) (
5) 1958 135 1
1 (5) (
5) 1959 295 1
295

Tab le —Regener at ionlin the Sou theast r eg ion , by owner sh ip and S tate , 1925—85— Con t inued
Thousand a cr es
Flor ida
Includes plan ting and d ir ect seed ing . Exc ludes site prepar at ion for natu r al regener ation :
2Fiscal year .
3Forest industry and m in ing , r ai lr oad , and u t il ity com pan ies.
Less than 500 acres.
3None repo r ted .
Note: Data reported in the sou rces l isted below var y consider ably in qual ity and accu r acy . T herefore , the data show n in th is tab le m ay be incomplete .
Data m ay not add to total becau se of round ing . Sou r ces: See footnote on append ix table
296

T ab le — Regener ationli n the Sou th Cen tr a l r eg ion , by ow ner sh ip and S tate , l 925—85— Con t inued
Thousa nd a c r es
A labam a
298

T able2 13— Regener ationlin the Sou th Cen tr al r eg ion , by ow ner sh ip and S tate
, l 925—85— Con t inued
Thousand acr es
Ar kan sas
Other pr ivate Feder al Other publ ic
(5)
(5)
(5)
(5)
(5)
Other pr ivate Feder al Other pub l ic
(4)
(5)
(4)
(4)
(4)

T able —Regener ationlin the Sou th Cen tr al r eg ion , by ow ner sh ip and S tate , 1925—85— C on t inued
Thousa nd a cr es
Lou isian a
300

T ab le — Regener at ionlin the Sou th Cen tr al region , by owner sh ip and S tate , 1925—85— C on t inued
302
Other pr i vate
(5)
(5)
(5)
(4)
Thousand a cr es
T en n essee
Feder al Other publ ic
(5)
(5)
(5)
(5)
(4)
(5)
(5)
(5)
(5)
(4)
T otal
23
32
38
62
64
Industry3
2
1 1
15
19
12
Other pr ivate
16
16
22
40
49
Feder al Other pub l ic
1
1
1
1


T ab le — Regener at ion'in the Sou th Cen tr al reg ion , by O
3
wner sh ip and S tate , 1925—85— Con t inued
Thousand acr es
Okl ahom a
Inc ludes plan ting an d d ir ect seed ing . Exc ludes site pr epar at ion for natur al r egener at ion .
2Fiscal year .
3Forest in dustry and m in ing , r ai l r oad , and u t il ity com pan ies.
Less than 500 acres.
3None r epor ted .
Note; Data r epor ted in the sour ces l isted below vary consider ably in qual ity an d accur acy . T her efor e , the data show n in thi s tab le m ay be incomplete . Data
m ay not add to total because of r ound ing .
Sou rces: See footnote on append ix table
304

T ab le —Feder al expend itur es for regener at ion and stand im provem en t1and acr es treated on other pr ivate owner sh ips in the Sou th , by
reg ion , 1936—85—C on tinued
Sou thExpend itu r es
For estr y In cen t ivesPr ogr am Acr es tr eated
Regener at ion im pr ovem en t
306

T ab le —Feder al expend itur es for .
r egener ati on and stand im pr ovem en t1and acr es tr eated on other pr ivate ow ner sh ips in the Sou th , by
reg ion , 1936—85—Con t inued
Sou theastExpend itu res
Forestry IncentivesPr ogr am Acr es tr eated
Regener ation
307

T ab le — Feder al expend itu r es for r egener at ion and stand im pr ovem en t1and acr es tr eated on other pr i
-vate ow ner sh ips in the Sou th , by
r eg ion , l 936—85— C on t inued
Sou theastExpend itu r es
For estry Incen tivesProgr am Ac r es tr eated
Stand
308

Tab le 2 1 4— Feder al expend itu r es for regener at ion and stand im pr ovem ent1and acres treated on other pr ivate ow ner shi ps in the Sou th , by
reg ion , 1936—85—C on t inued
Expend itu r es
For estr y Incen tivesProgr am
1975
1976
1977
1978
1979
19801981
1982
1983
1984
198510
Regener ation inc ludes plan t ing and d ir ect seed ing for al l year s and site prepar at ion for natu r a l r egener at ion fr om fiscal year 1982 forwar d ; stand impr ovement in c ludes in term ed iate stand tr eatm en ts to increase t imber gr ow th or enh ance timber qual ity . Feder al cost- shar es cover up to a m ax im um of 75 per
cen t of the treatm en t costs under AGP or 65 percen t under FIP . Feder al cost- shar es m ay be set below the m aximum level at the opt ion of ind ividual Stateprogr am s.
2Fiscal year .
3Conver ted to 1982 dol lar s by d ivid ing the expend itu res in cu r r en t do l l ar s by the impl ic it pri ce deflator s for gross nat ional pr oduct for al l Feder al Govem
ment pur chases of goods and services for 1945—7 1 an d for nondefense Feder al Gover nm en t pu r chases of goods and services for 1972—85 , as r epor ted by the
U .S.Depar tm en t of Comm erce , Bu r eau of Econom ic Analysis.
Data not avai lable .
3No pr ogr am in that year .
3None r epor ted .
7 Less than 500 acres.
3 Inc ludes tr ee p lan t ing under the So i l Bank Progr am .
9FIP activities in 1975 inc luded With 1976 FIP act ivities.
10Pr el im inary figur es.
Note: Data m ay not add to totals becau se of r ound ing .
3 10

der al cost - shar es
Non - Federal cost- shar es
Num ber of fu l l—t im eequ ivalen t posit ions
T housand do l lar s
T housand seedl ings
Per cen t of total
3 1 1

T able — Act iv it ies of S tate for estr y agenc ies i n the Sou th , by r eg ion and S tate , fiscal year 1985—C on t inued
Sou thAct ivity Un it of m easur e Cen tr al A labam a Mississippi T ennessee Arkan sas Lou isiana T exas Okl ahc
State- em ployed pr ofessional Num ber of ful l - t im e
service for ester s equ ivalen t posit ions
Sta te expend itu res for cooper ative for est m an agem en t Thousand dol lar s
T housand seedl ings
Per cen t of total
T hou sand dol lar s
Acr esNon - Federal cost- shar es T housand dol l ar s
Acr es
T imber stand improvem en t onnon industri al pr ivate l andsFeder al cost- shar es Thousand do l l ar s
Acr esNon - Feder al cost- shar es T housan d do l l ar s
Acr es
3 12

T ab le — Feder al funds a l located to the Sou thern For est Exper im en t Stat ion for for est r esear ch , by funct ional act iv ity ,1922—86—Con t inued
T imber Forest
Insect Disease m anagemen t eng ineer ing Other3
Cu r r ent 1982 Cu rr en t 1982 Cur r en t 1982 Cur r en t 1982 Cur r ent 1982 _Cu r r en t 1982 Cu rr ent 1982 Cu r ren t 1982 Cur r en t 1982 Cur r ent 1982
" ear'do l lar s do l lar s
2dol lar s do l lars
2do l lar s do l lar s
2do l lar s do l lar s
2dol l ar s do l lars
2 do l l ar s do l lar s2 do l lar s do l lar s
2do l lar s do l lar s
2dol lars do l lar s
2dol lar s dol lar s
1965 299 425 2 16 767 265 942
1966 29 1 432 ,22 1 750 270 920
1967 288 472 254 83 1 296 97 1
1968 278 60 1 268 830 329
1969 272 62 1 277 819 340
37 2 860 995
4 13 986
394
390 786 776
364 773 735
1985 (7) 335
1986 (7) 328
T he years 1922—76 ar e on a Ju ly- Ju ne fisca l year ; year's 1977—presen t are on an October—September fiscal year .
2Conver ted to 1982 do l lars by d ivid ing the appropri ations in cu r r en t do l lar s by the impl ic it pr ice deflators - for gross national pr oduct for total Feder a l Govem mepurchases of goods and services from 1922—7 1 and for nondefense Feder al Gover nmen t pur chases of goods and services from 197 2—86 ,
as repor ted by the De
par tmen t of Commer ce , Bu r eau of Econom ic Analysis. T here is no impl ic it pr ice deflator for gr oss n at ional product for years pr ior to 1929 . Fiscal year s wer edeflated w ith ca lendar year im pl ic it pr ice deflator s.
3 Inc ludes funds al located for cooper at ive aid ; insect and d isease con tr ol detect ion and appr aisal ; r ange ; recreat ion ; r equ ir em en ts and supply ; r esear ch constr uctiowatershed activit ies such as so i l er osion , for est influences, and flood con tr o l ; w i ld l ife and fish hab itat ; and m iscel laneous.
Data not avai lab le .
3Proposed a l locat ion .
3For est m anagemen t and r ange for these year s wer e estim ated .
7 Inc luded in insect r esear ch start ing in 1974 .
3Comb ined i n to Forest Products and H arvest ing in 1985 .
Note: Data m ay not add to tota ls because of round ing .
3 14

ble — Feder al fu nds a l located to the Sou theaster n For est Exper imen t S tat ion for for est r esear ch , by funct ional act ivity , 1932—86
Insect Disease
Cur r en t 1982 Curr ent 1982 Cu r r en t 1982 Cu r r en t 1982 Cu r r en t 1982 Cu r r en t 1982 Cu r r ent 1982 Cu rr en t 1982 Cur rent 1982
ar’do l lars dol lars
2 do l lars dol lars2do l lars do l lars
2do l lars do l lars
2do l lar s do l lar s
2do l lar s do l lars
2do l lar s dol lars
2do l lars dol lars2 do l lars dol lars
2
Thousands
3 15

T ab le — Feder a l funds al located to the Sou theaster n Forest Exper im en t Stat ion for for est r esear ch , by funct ional act ivity , 1932—86
Con t inued
Functional activity
l nsect Disease
Cu r r ent 1982 Cu r r ent 1982 Cur r en t 1982 Cu r r ent 1982 Cur ren t 1982'
Curr ent . 1982 Cu rr en t 1982 Curr en t 1982 Cu r r ent 1982
" ear'do l lars dol lars
2do l lars do l lars
2do l lar s do l lars
2do l lars do l lars
2do l lars do l l ars
2do l lars do l lars
2dol l ars do l lars
2do l lars do l lar s2 do l lars do l lar s
2
Thousands
857
842
929
97 1
96 1
1970 480 550
1971 1 509 587
1972 1 570 646
1973 1 649
1974 9 18
1975 979
1976
1977
1978 13 ,380
1979
1980
198 1 1
1982
1983
1984
1985
1986
T he year s 192 1—76 ar e on a Ju ly—June fiscal year ; year s 1977—pr esen t ar e on an October—Septem ber fiscal year .
2Convert ed to 1982 dol lar s by d ivid ing the appropr iat ions in cu r r en t do l lar s by the impl ic it pr ice deflators for gr oss nat ional product for total Feder al Govem
men t purchases of goods an d services fr om 1932—7 1 and for nondefense Feder al Gover nm en t pu r chases of goods and services from 1972—86 , as reported by thDepar tmen t of Commerce, Bu reau of Econom ic Analysis. Fisca l year s were deflated w ith calendar year impl ic it pri ce deflator s.
3 Inc ludes funds al located for cooper ative ai d ; in sect and d isease con tr ol detection and appr aisal ; r ange; recr eation ; requ ir ements and supply; r esear ch construction ;water shed activities such as so il erosion , for est influences, and flood con tr o l ; w i l dl ife and fish hab itat; and m iscel laneous.
Data not ava ilable .
3Pr oposed al location .
3Forest management and r ange for these year s wer e est im ated .
7 Included in insect r esear ch star t ing in 1974 .
Note : Data m ay not add to totals because of round ing .
3 16

T ab le —Stand i r rrpr ovem en t 1 in the Sou th , by ow ner sh ip and r eg ion , 1974—85
Thousand ac r es
3 Inc ludes in term ed iate stand tr eatm ents -to incr ease timber gr ow th or to enhance tim ber qu al ity , such as r elease an d weed ing ,
pr un ing , fer t i l izing , an d pr escr ibed bur n ing for con trol of under story spec ies.
2Fiscal year .
3Forest industry and m in ing , r ail road , or u t il ity compan ies.
Less than 500 acres.
Note: Data m ay not add to totals because of round ing . Data repor ted in the annual plan ting r epor ts ar e fr om a w ide var iety Of sou r ces and varyconsiderabl y in qual ity and accur acy . T herefore, data in thi s table may be incomp lete .
Sour ce: U .S. Depar tmen t of Agri cu l tur e , Forest Service . [Annual repor ts ] Nat ional For est System r efor estation and timber stand impr ovem en t . Wash ington ,
DC: U .S. Departm en t of Agr icu l tu re , Forest Ser vice . U .S. Depar tm en t of Agr icu l tur e, For est Service . [Ann ual r epor ts ]“
1980 (etc . ) Forest plan tingrepor t . Wash ington , DC : U .S. Depar tmen t of Agri cu l ture, Forest Service .
3 18

T ab le 22 0— Stand impr ovem en t1i n the Sou theast reg ion , by owner sh ip and S tate , 1974—85
1
Thousand a cr es

T able 22 0— S tand im pr ovem en t 1 in the Sou theast reg ion , by owner sh ip and S tate , 1974—851—C on t inued
Thousa nd a cr es
National Other National
Includes intermed iate stand treatm en ts to increase tim ber grow th or to enh ance timber qual ity , such as release and weed ing , precomm ercial th inn ing , pr un ing ,
fert il izing , and pr escri bed bu r n ing for con tro l of under story spec ies.
2Fiscal year .
3For est industry and m in ing , r a i l road , or u ti l ity compan ies.
4None r epor ted .
5 Less than 500 acres.
Note: Data m ay not add to totals due to rou nding . Data repor ted in the annual plan t ing reports ar e fr om a w ide var iety of sou r ces and var y consider ablyin qual ity and accur acy . T her efor e, data in th is tab le m ay be incomplete .
Sou rces: See footnote on append ix table
320

T ab le — S tand im pr ovem en t ’ in the Sou th Cen tr al r eg ion, by ow ner shi p and State , l 974—85— Con t inued
Thousand ac r es
T exas Oklahom a
Industr y3
Inc ludes in term ed iate stand tr eatments to incr ease timber gr ow th or to enhance t imber qual ity , such as r elease an d weed ing , precomm erc ial thi nn ing , pr un ing ,
fert i l izing , and pr escr ibed bu r n ing for con tr o l of under story spec ies.
2Fisca l year .
3Forest industry and m in ing , r ail r oad , or u ti l ity compan ies.
4None r eport ed .
5 Less than 500 acres.
6Ouach ita Nation al Forest in Oklahom a is inc luded in Arkansas.
Note: Data m ay not add to totals because of r ound ing . Data r eported in the an nual plan ting r eports ar e from a w ide var iety of sou r ces and var y consider ab lyin qual ity and accu r acy . T her efor e , data i n th is tab le m ay be incom plete .
Sou r ces: See footnote on append ix tab le
322

T ab le 2 2 2—For est Ser vice and State expend itur es for for est insect and d isease m anagem en t i n the Sou th , by r eg ion , 1965—84
Cu r r en t 1982 Cu r r en t
Sou t‘hFor est Service l
1982 Cur r en t 1982 Cu r rent
Sou theastForest Service 1
1982 Cu r r ent 1982 Cur r en t
State21982 Cu r ren t
Sou th Cen t r a lForest Service 1
1982 Cu r r en t 1982 Cu r ren t 1982
Year 3 dol lars dol lar s“ do l lar s do l lar s“ do l lar s do l lars“ do l lar s do l lar s“ do l lars do l lar s“ do l lar s dol lar s“ do l lar s do l lar s“ do l l ar s dol lar s“ do l lars do l lar s“
1965
1966
1967
l 968
1969
1970
1971
1972
1973
1974
1975
1976
1977
1978
1979
1980
1981
1982
1983
1984
6 15
7 ,843
8,002
484
60 1
536
597
738
837
873
902
Thousands
47 1
608
629
656
267
230
244
246
542
856
667
796
405
527
937
742
589
955
726
578
52 1
503
559
676
787
589
794
704
334 908
307 77 1
353 754
806
988
3 ,415
778 778
Forest Service expend itures for techn ical assistan ce and contro l '
work on national for est , other Feder a l , and State and pr ivate lands.
2Expend itu res by non - Feder al agenc ies for State and pr ivate Cooper at ive progr am s, as r epor ted to the For est Service .
3Fisca l year .
Converted to 1982 dol lars by d ivid ing the expend itu res in cur ren t dol lar s by the impl ic it pr ice deflator s for gross national pr oduct for total Feder al Governmen t
pur chases of goods and services from 1965—7 1 and for nondefense Feder al Governmen t pu r chases of goods and services from 1972—84 , as repor ted by the
U .S. Depa1tment of Comm erce, Bu reau of Econom ic Analysis.
Note: Data m ay not add to totals because of round ing .

T ab le 2 2 3—Major t im ber - r el ated provisions of cur r en t Feder al incom e tax l aw
Pr ovision
T ax r ates on ordinary
income
T ax r ates on long - term
cap ital gai n s incom e
Deduct ib il ity of
m an agem en t costs
Refor estat ion incen ti ves
324
Cur r en t law
Ind ividual s, depend ing on their incom e , dependency , and m ar ital status, w il l be taxed at one of
5 r ates, r ang ing fr om 1 1 to 38 per cen t , in 1987 ; an d at one of two r ates— 15 or 28 per cen t
— in
1988 and l ater year s. Beg inn i ng i n 1989 ,r ate pr ogression w i l l be adju sted ann ual ly for inflati on .
Corpor ate tax r ates al so var y w ith incom e , bu t in m ost in stances fo r al l taxable incom e i nexcess of — the r elevan t r ate w il l be 34 per cen t beg inn i ng Ju ly 1 , 1987 . Ratepr ogr ession is not adjusted for infl at ion .
Beginn ing i n 1988 for som e ind ividuals and in 1987 for other s, and on Ju ly 1 , 1987 , for
corpo r at ions— al l long- term cap ital gains incom e , includ ing that r eal i zed fr om cu tt ing or sel l in g
t imber , w il l be taxed at the same r ate as or d inary incom e .
Except as pr ovided for in the refor estat ion incen t ive pr ovisions d iscu ssed below , al l m an agemen t
costs di r ectly assoc iated w ith stan d establ i shi nen t m ust be“
cap ital ized . T h is m eans that su chcosts can on ly be r ecover ed by deduct ing them from the incom e that is r eceived when the t imberto wh ich they ar e r elated is cut and/or sol d . In con tr ast , m ost m an agem en t costs incu r r ed after
stand establ ishm en t ar e expensab le”for cert ai n taxpayer s. T hi s m eans that such costs can be
r ecover ed i n the sam e year as pa id by deduct ing them fr om ord in ary incom e fr om any sou r ce .
T he exact r u les var y by taxpayer category . If the taxpayer i s an act ive bu siness, al l m anagementcosts, pr operty taxes and in ter est ar e fu l l y deduct ible each year expensab le . For act iveinvestor s, pr oper ty taxes ar e fu l ly deduct ible; m anagem en t expenses m ust be aggr egated w ithother
“
m i scel laneou s item i zed deduct ion s” and the total is dedu ct ible on ly to the exten t i texceeds 2 per cen t of adjusted gr oss in com e; and in ter est char ges assoc iated w ith the timberinvestm en t ar e deduct ib le onl y to the exten t of total investm en t incom e for the year . Passive
par t ic ipan ts in a t im ber investm en t or busin ess m ay onl y deduct pr oper ty taxes, in ter est andm an agem en t costs to the exten t of passive in com e for the year .
Owner s have the opt ion , on up to of qual ifying r efor estat ion expend itur es per year , oftaki ng a 10
-
per cen t tax cr ed it and am or t iz ing 100 per cen t of the costs over 84 m on ths. " ual ify ingr efor estat ion expend itu r es include site pr epar at ion , plan t ing , and seed or seedl ings.

T ab le —Nat ional for est expendi tur es for r egener at ion and stan d im pr ovem en t1and acr es tr eated on n at ional for ests in the Sou th , by
r eg ion , 1934—85— Con t in ued
Sou th Sou th east
Regener at ion in cludes plan tin g , d irect seeding , an d natu r al regener ation ; stand im pr ovemen t in c ludes in term edi ate stand tr eatm ents to incr ease tim ber gr ow thor enh an ce t im ber qual ity . Pr escr ibed bur n ing to con tr o l under story spec ies is not inc luded for 1962—77 .
2Fiscal year .
3Cu r r en t do l lar s conver ted to 1982 do l lar s by d ivid ing the expend itu res in cu r r en t do l lar s by the im pl ic it pr ice deflator s of gr oss n at ion al pr oduct for totalFeder al Gover nm en t pu r chases of goods and services thr ough 1972 and for nondefense Federal Gover nm en t pu rchases of goods an d services for 1973—85 ,
as r epor ted by the U .S. Depar tm en t of Comm er ce , Bu r eau of Economi c Analysis.
Data not avai lable .
5 Less than 500 acr es.
6None repor ted .
Note: Data m ay not add to totals becau se of round in g .
326

T ab le — Volum e and valueof t imber cu t fr om Nat ional Forest Systemlands in the Sou th ,
11923—43
Value
Thousands
2
Excludes Nat ional Forest System lands in Vir g in ia .
2Fiscal year .
3Converted to 1982 dol lar sbyd ivid ingexpend itur esin cur r entdol lar sby the im
pl ic i tpr icedeflator sfor gr ossnati onal pr oduct for tota l Feder al Gover nmen tpu rchasesofgoodsand ser vi ces asrepor tedby theU .S Depar tmen tofComm er ce ,Bu
reau ofEconom ic Analysis. T her e isno impl ic itpr icedeflator for gr ossnational
pr oduct for year spr ior to 1929 . For 1930—36 ,.the impl ic itpri cedeflator for 193 3 is
used .
327

T ab le — Volum e and val ue of timber cu t fr om Nat ional For est System l ands in the Sou th ,
1by r eg ion , 1944—85
Sou th Sou theast Sou th Cen tr alVal ue Val ue Value
Forest System lands in Vir gin ia excluded pr ior to fiscal year2 Fiscal year .
3Conver ted to 1982 dol l ar s by d ividing expenditur es in cur r en t dol l ar s by the impl ic it pr ice deflator s for gr oss nation al pr oduct for total Federal Govem
men t pur chases of goods and servi ces thr ough 197 1 and for nondefense Federal Governm ent pur chases of goods an d services for 1972—85 , as reported bythe U .S.Departmen t of Comm er ce, Bur eau of Econom ic Anal ysis.
328

T able — Softwood plywood pr oduct ion in the Sou th , by reg ion and State , 1964—84
Mi l l ionsqua r e feet , - inch basis
Sou th Cen tr al ‘
T otal Vir g ini a Geor g ia Flori da Al abam a Mississipp i Ar kan sas Lou isiana T exas Okl ahom a
1No softwood plywood is pr oduced in T enn essee .
Sou rces: 1 964—82 Ander son , Rober t G . 1984 . Reg ional pr oduct ion and d istr ibut ion pattern s of the sn'
uctu r'
al panel industry . T acom a , WA : Am er icanPlywood Assoc iation . 34 p . 1 983—84 [Der ived fr om estim ates of plywood sh ipm en ts in ] U .S. Depar tm en t of Comm er ce , Bur eau of the Census. 1986 .
Cur ren t industri al r epor ts: softwood plywood MA- 24H (84) Wash ington , DC : Depart m en t of Commer ce , Bur eau of the Cen sus. 7 p .
3 30

ab le Aver age“
p ine stumpage pr ices for saw tim ber and pu l pwood in the Sou th , by sou r ce of pr ice data , selected year s 1880—1985
Sawtimberl
Pu lpwoodl
Sou th pri vate2
NC/VA pri vate3 Sou th pub l ic
“ Lousiana pr ivate5 Sou th pr ivate
6 Sou th pub l ic7 Lou siana pr ivate
5
Cu r r en t 1985 Cur ren t 1985 Cu r r en t 1985 Cur r en t 1985 Cu r r ent 1985
dol lar s do l lar s8
dol lar s do l lar s8
dol lar s do l lar s8
dol lar s do l lar s8
do l lar s dol lar s8
Un it measu re for saw tim ber is thou sand boar d feet . See footnotes 4 and 5 for log r u le used . Un it m easur e for pu lpwood is standar d cords.
3Pr ices for pr ivately owned , second -
gr ow th souther n p ine stumpage in the sou thern pine region (A labam a , Arkansas, Flor ida, Georgia , Lou isian a , Mississippi ,Oklahom a, and T exas) as r epor ted in Steer , B B . 1 938. Stumpage pr ices of pr ivately owned t im ber in the Un ited States. T ech . Bu l l . 626 . Wash ington ,
DC: U .S. Departm en t of Agri cu l tu r e . 162 p .
3Pr ices for pr ivately owned , second—grow th sou ther n pine stumpage in Nor th Carol ina and Vir gin ia , as reported by SteerPr ices for national for est tim ber sales, al l spec ies, 1935—49 , Scr ibner C log r u le , as r epor ted in U .S. Depar tmen t of Agr icu l ture , Forest Service . 1964 .
The dem and and pri ce situat ion for forest pr oducts, 1964 . Misc . Publ . 983 . Wash ington , DC: U .S. Depar tm ent of Agr icu l tu r e , Forest Service . 50 p . Pri ces
for nat ional for est tim ber sales, sou ther n pine on ly , 1950—84, Scri bner C log r u le , as r epor ted in U .S. Depar tmen t of Agr icu l tu re , For est Service . 1985 .
U .S. timber pr oduction , tr ade , consumption , and pri ce statistics. Misc . Publ . 1450 . Wash ington , DC : U .S. Depar tmen t of Agr icu l tu r e , For est Serv ice:84 p .
3Pr ices for pr ivatel y owned p ine stumpage in Lou isiana , Doyle log r u le for saw tim ber , as repor ted by Lou isiana Depar tmen t of Agr icu l tu re , Office ofMarketing . [" uar ter ly issues ] " uar ter ly for est pr oducts r eport s. Baton Rouge , LA : Lou isiana Depar tmen t of Agr icu l ture , Office of Marketing .
6Pr ices for pr ivatel y owned sou ther n p ine , 1937—55 , as r eport ed by USDA Forest Service .
7Pri ces for national forest timber sales, sou ther n p ine, 1935—55 , as repor ted by USDA For est Service .
3Der ived by d ivid ing the pr ice in cu r r en t do l lar s by the Bureau of Labor Stat istics pr oducer pr ice index for al l comm od ities ( 1985
Note: Pr ices are compu ted as a 5—year m oving aver age for avai lable year s of each ser ies.
33 1

T ab le — Aver age hardwood stumpage pri ces for sawt im ber and pu lpwood in the Sou th , by sour ce of pri ce data , selected year s 1905—85
Sawt im berl
Lou isian a —pr ivate3 Sou th— publ ic“
Uni t measur e for sawtimber is thousand boar d feet . See footnotes 3 and 4 for log r u le used . Un it measu re for pu lpwood is standar d cor ds.
2Pri ces for pr ivatel y owned har dwood stumpage in the sou ther n p ine r eg ion (Al abam a, Ar kansas, Fl or i da , Georg ia , Lou isiana, Mississippi , Okl ahom a , and
T exas) , as r epor ted in Steer , H .B . 1938 . Stumpage pr ices of pr ivately owned t im ber in the Un ited States. T ech . Bu l l . 626 . Wash ington , DC : U .S.
Departmen t of Agr icul ture . 162 p .
3 Pr ices for pr ivatel y owned har dwood , al l spec ies, 1935—49 , Scri bner C log r u le , as r eported in U .S. Depar tm en t of Agr icu l tu re, Forest Service . 1964. T he
demand and pr ice situation for forest products, 1964 . Misc . Publ . 983 . Washin gton , DC : U .S. Depar tm en t of Agri cu l tur e , Forest Service . 50 p . Pr icesfor national forest t imber sales, sou ther n pine on ly, 1950- 84, Scr ibner C log r ule, as repor ted in U .S. Departm en t of Agr icu lture , Forest Ser vice . 1985 . U .S.
timber production , tr ade, consumption , and pr ice , statistics. Mi sc . Publ . 1450 . Washi ngton , DC: U .S . Depar tm en t of Agr icu l ture , Forest Service . 84 p .
Pr ices for national for est t imber sal es, all easter n har dwoods, easter n an d sou thern r egi ons , Scr ibner C log r ul e , as r epor ted by USDA For est Service ,
Misc . Publ . 1450 , 1985 .
5Der ived by divid ing the pr ice in cur r ent dol lar s by the Bur eau of Labor Statistics producer pri ce in dex for al l comm od iti es ( 1985Note: Pri ces are compu ted as a 3
—year moving aver age for avai l able year s in each ser ies.
332

T ab le 2 3 2— Aver age har dwood stum page pr i ces1for sawt im ber sold fr om nat ional forests in the Sou th , by S tate for selected year s 1950—85
A labam a Arkansas Flor ida
Cur r ent 1985 Cur r en t 1985 Cur r en t 1985
do l lar s doll ar s2
dol lar s dol lar s2
dol lar s dol l ars2
Do l la r s p er thousand boa r d feet , Scr ibn er log r u le
Nor th Carol in a South Car o l in a T ennessee T exas
1Pri ces compu ted as a 5
—year m oving aver age of volum e—weighted pr ices deri ved fr om h igh b ids for nat ion al for est timber sales.
3Der ived by d ivid ing the pri ce in cur r en t do l lar s by the Bu reau of Labor Stat istics producer pr ice index for al l comm od it ies ( 1985
Sou rce: U .S. Depar tm en t of Agri cu l tu r e , Forest Service .
3 34

[Th is page in ten tionally left bl an k ]
335

T ab le 23 3— Aver age p ine stumpage pr ices for saw t im ber , veneer t im ber , and pu lpwood in the Sou th , by r eg ion1and product , 1977
—85
Nor ther n East Gu l f West Gu lf P iedmon t Cen tr al Appalach ianSou th coastal plain coastal p lain coastal plai n and uplands plateaus h ighl ands
Cu r r en t 1985 Cu r r en t 1985 Cur r en t 1985 Cur r ent 1985 Cu r rent 1985 Cur r en t 1985 Cu r r en t 1985 Cu r r ent 1985
dol lar s dol lar s3 do l lar s dol l ar s
2dol lar s doll ar s
3dol lar s dol lar s
3do l lar s do l lar s
3dol lar s do l l ar s
3dol lar s dol l ar s
3dol lars dol lar
Dol la r s
See accompanying figur e for areas in cluded in pri ce r eg ions.
3Deri ved by d ivid ing the pr ice in cur r ent doll ar s by the Bur eau of Labor Statist ics pr oducer pr ice index for al l commod iti es ( 1985 = 100)
Sour ce: Pri ces ar e based on aver age an n ual stumpage pri ces repor ted by T imber Mar t—Sou th .
336
Ven eer t im ber
p er thousand boa r d feet , Scr ibn er
105
12 1
142
126
145
140
160
152
146

T able —Aver age m i xed har dwood l stumpage pr ices for saw t im ber , veneer tim ber , and pu l pw ood in the Sou th , by r eg ion2an d product , 197
Cu rr en t 1985
do l lar s dol lar s3
Saw tim ber
Do l la r s p er thousand boa r d feet , Doy le log r u le
Ven eer t im ber
Do l la r s p er thousa nd boa r d feet , Doy le log r u le
3 Mixed har dwoods inc lude ash , beech , cottonwood ,w il l ow , elm , gum s, locust , hackber ry , m agno l ia , m aples, pecan , h ickory , sassafr as, sycam ore, tupelo , an
3See figur e accompanying append ix table for areas included in pri ce reg ions.
3Der ived by d ivid ing the pr ice in cur r en t do l lar s by the Bur eau of Labor Stati st ics pr oducer pr ice index for al l comm od ities ( 1985
Sour ce: P ri ces ar e based on aver age annual stumpage pr ices r eport ed by T im ber Mart - Sou th .
3 38

Tab le — Aver age select har dwood" stumpage pr i ces for sawt im ber and veneer t im ber i n the Sou th , by r eg ion3and pr oduct , 1977
—85
Cu r rent 1985
dol lar s do l lar s3
Sawtim ber
Do l la rs p er thousa nd boa r d feet , Doy le log r u le
Ven eer tim ber
Do l la r s p er thousa nd boa r d feet , Doy le log r u le
Select hardwoods inc lude wal nu t , cher r y , chestn u t , and som e pr ime gr ades of cypress, nor thern red oak , cher rybark oak , an d wh ite oak .
3See figu r e accompanying append ix table for ar eas included in pr ice r eg ions.
3Der ived by d ivid ing the pri ce in cur ren t dol lar s by the Bureau of Labor Statistics pr oducer pr ice index for al l comm od it ies ( 1985Sou rce: Pr ices are based on aver age ann ual stumpage pri ces for select har dwoods r epor ted by T im ber Mart - Sou th .

T able — Aver age pine stumpage“
pr i ces1for pu lpwood sol d fr om nat ional for ests in the Sou th , by S tate for selected year s 1950- 85
Ar kan sas
Pri ces compu ted as a 5 -
year m oving aver age of volum e- weighted pr ices der ived fr om h igh b ids for n ational for est timber sales.
3Deri ved by d ivid ing the pr ice in cur ren t do l lar s by the Bur eau of Labor Statistics pr oducer pr ice index for al l comm od ities ( 1985Sour ce: U .S. Depar tm ent of Agr icu ltu r e, For est Ser vice .
340
Flori da
Cur ren t 1985 Cur r en t 1985
dol lar s dol l ar s3
dol l ar s doll ar s2
Do l la r s per standa r d co r d
Sou th Car ol in a T ennessee


T able — A r ea of t imber land ,by owner sh ip and for est m anagem en t type in the Sou theast r eg ion , selected year s 1952
—85 , w ith
pr oject ions to 20301
Thousand a cr es
Projections
966

T ab le — Ar ea of t im ber l and , by owner sh ip and for est m an agem en t type in the Sou theast r eg ion,selected year s 1952—85 ,w ith
project ions to 2030—Con t inued
T housa nd a cr es
Pr ojections
T ota l other p r iva te
P ine pl an tat ions 47 1
Natur al p ineMixedp ine—har dw oods 5 ,369 8,473 7 , 187 7 ,354 7 ,789 7 ,747
Upland har dwoods
Bottom l and har dwoods
T ota l
Data for 1952 and 1962 ar e as of Decem ber 3 1 . Data for 1970 , 1977 , 1985 , and the pr oject ion year s are as of Januar y 1 .
3 Includes t im ber land leased or u nder m an agem en t con tr acts to for est industry fr om other ow ner s for per iods of one for est r otat ion or longer .
T imber land under cu tt ing con tr acts is not inc luded .
3Data for these other pr ivate owner sh ips ar e not avai lab le for the year s 1952 , 1962 , an d 1970 .
Note: Data m ay not add to totals because of r ound ing .
344

T ab le —Ar ea of t im ber l and , by ow ner shi p an d for est m anagem en t type in the Sou theast reg ion , selected year s 1952—85 , w ith
project ions to 2030‘
-Con t inu ed
Thousand acr es
Pr oject ions
T ota l other pr ivate
P ine plan tat ion s 379
Natur al p ineMixedp ine—hardwoodsUpland har dwoodsBottom l and har dw oods
T ota l
Data for 1952 an d 1962 ar e as of Decem ber 3 1 . Data for 1970 , 1977 , 1985 , and the pr oject ion year s ar e as of Janu ary 1 .
3 Inc ludes t im ber land leased or under m an agem en t con tr acts to forest industry“
from other ow ner s for per iods of one for est r otat ion or longer . T imber landunder cu tt ing con tr acts is not inc luded .
3Data for these other pr ivate owner sh ips ar e not avai lable for the year s 1952 , 1962 , and 1970 .
Note: Data m ay not add to totals because of rou nd ing .
346

T ab le —Ar ea of t imber land , by ow ner sh ip and for est m anagem en t type in A labam a , selected year s 1952—85 ,
w ith pr oject ions to 20301
Thousa nd acr es
Year Projections

T ab l e — A r ea of t im ber l and , by ow ner sh ip an d for est m an agem en t type i n A l abam a , selected year s 1952—85 , w ith pr oject ion s to
2030— Con t inued
Thousand ac r es
Data for 1952 an d 1962 ar e as of December 3 1 . Data for 1970 , 1977 , 1985 , and the project ion year s ar e as of Jan uary 1 .
Pr oject ions
779 818 954
3Inc ludes timber land leased or under m anagemen t con tr acts to for est in dustry fr om other owner s for peri ods of one forest r otation or longer . T im ber l and
under cu tt in g con tracts is not in cluded .
3Data for these other pr ivate ow ner shi ps ar e not avai lable for the year s 1952 , 1962 , and 1970 .
Note: Data may not add to total s becau se‘
of r ound in g .
348

T ab le — Ar ea of t im ber l and , by ow ner sh ip and for est m an agem en t type in Ar kansas, selected year s 1952—85 , w ith projecti ons to2030
1—Con t inued
Data for 1952 and 1962 ar e as of December 3 1 . Data for 1970 , 1977 , 1985 , and the projection year s ar e as of Januar y 1 .
T housand acr es
256 415 990
Pr ojections
3 Inc ludes timber land leased or u nder m an agem en t con tr acts to forest industry fr om other owner s for per iods of one for est r otation or longer . T im ber landunder cu tt ing con tr acts is not inc luded .
3Data for these other pri vate owner sh ips are not avai lable for the year s 1952 , 1962 , and 1970 .
Note: Data m ay not add to tota ls because of r ound ing .
350

T ab le —Area of t im ber land , by owner sh ip and for est m anagem en t type in Flor ida , selected year s 1952—85 , w ith project ion s to 2030
1
T housand a cr es
Project ions
“w
e

T ab le — A r ea of t im ber l and ,by ow ner sh ip and for est m an agem en t type i n Fl or ida , selected year s 1952
—85 , w ith pr oject ion s to2030
'— C on t inued
Thousand a cr es
Pr oject ions
Data for 1952 an d 1962 ar e as of Decem ber 3 1 . Data for 1970 , 1977 , 1985 , and the project ion year s ar e as of Janu ar y 1 .
3 Inc ludes t imber land leased or under m an agem en t con tr acts to forest industry fr om other ow ners for peri ods of one for est r otat ion or longer . T imber landunder cu tt ing con tr acts is not inc luded .
3Data for these other pr ivate owner ships ar e not avail able for the year s 1952 , 1962 , and 1970 .
Note: Data m ay not add to tota ls because of rou nd ing .

T ab le — A r ea of t im ber l and , by ow ner sh ip and for est m an agem en t type in Georg ia , selected year s 1952—85 , w ith project ion s to
2030'—Con t inued
Thousa nd a c r es
Pr ojections
1977
3 Inc ludes timber lan d leased or under m an agem en t con tr acts to forest industr y fr om other ow ner s for per iods of one for est r otat ion or longer . T imber landunder cu tting con tr acts is not inc luded .
3Data for these other pr ivate ow ner sh ips ar e not avai lable for the year s 1952 , 1962 , and 1970 .
Note: Data m ay not add to totals becau se of r ou nd ing .
354

T able — A r ea of t imber land , by owner sh ip and forest m anagem en t type i n Lou isiana , selected year s 1952—85 ,
w ith pr oject ions to 2o3ol
Thousand a cr es
Project ion s
355

T ab le — Ar ea of t im ber l and , by ow ner sh ip and for est m an agem en t type i n Lou isian a , selected year s 1952—85 ,
w ith project ion s to2030
1— Con t inued
Thousan d acr es
Pr oject ions
3 Inc ludes t im ber land leased or under m an agem en t con tr acts to for est industry fr om other owner s for per iods of one for est rotation or longer . T imber landunder cu tt ing con tr acts is no t inc luded .
3Data for these other pr ivate owner sh ips ar e n o t avai lable for the year s 1952 , 1962 , and 1970 .
Note: Data m ay not add to tota ls because of rou nd ing .
356

T ab le — A r ea of t im ber l and , by ow ner sh ip and for est m an agem en t type in M ississipp i , selected year s 1952—85 , w ith project ions to2030
1— Con t inued
3 Inc ludes timber land leased or under m anagem en t contr acts to for est industry fr om other ow ner s for peri ods of one for est r otat ion or longer . T imber landunder cu tt ing con tr acts i s not inc luded .
3 Data fo r these other pr ivate ow nersh ips ar e not available for the year s 1952 , 1962 , an d 1970 .
Note: Data m ay not add to totals becau se of r ound ing .
358
Thousand ac r es
460 53 1 609 866
Pr oject ions

T ab le — Ar ea of t imber land , by lowner ship and for est m anagem en t type in Nor th Car o l ina , selected year s 1952
—85 ,w ith project ions to
20301
Thousand acr es
Pr ojection s
57 1

T ab le — Area of t im ber land , by owner sh ip and for est m anagemen t type in Nor th Car ol in a , selected year s 1952—85 , w ith project ions t l
2030— Con t inued
Thousand a c r es
Project ions
230 293 468 724
year s ar e
3 Inc ludes t imber land leased or under m an agem en t con tr acts to forest indu stry from other owner s for peri ods of one forest r otation or longer . T imber l and
under cu tting con tr acts is n ot inc luded .
3 Data for these other pr ivate ow nersh ips ar e not avai lable for the year s 1952 , 1962 , and 1970 .
Note: Data m ay not add to totals because of r ound ing .
360
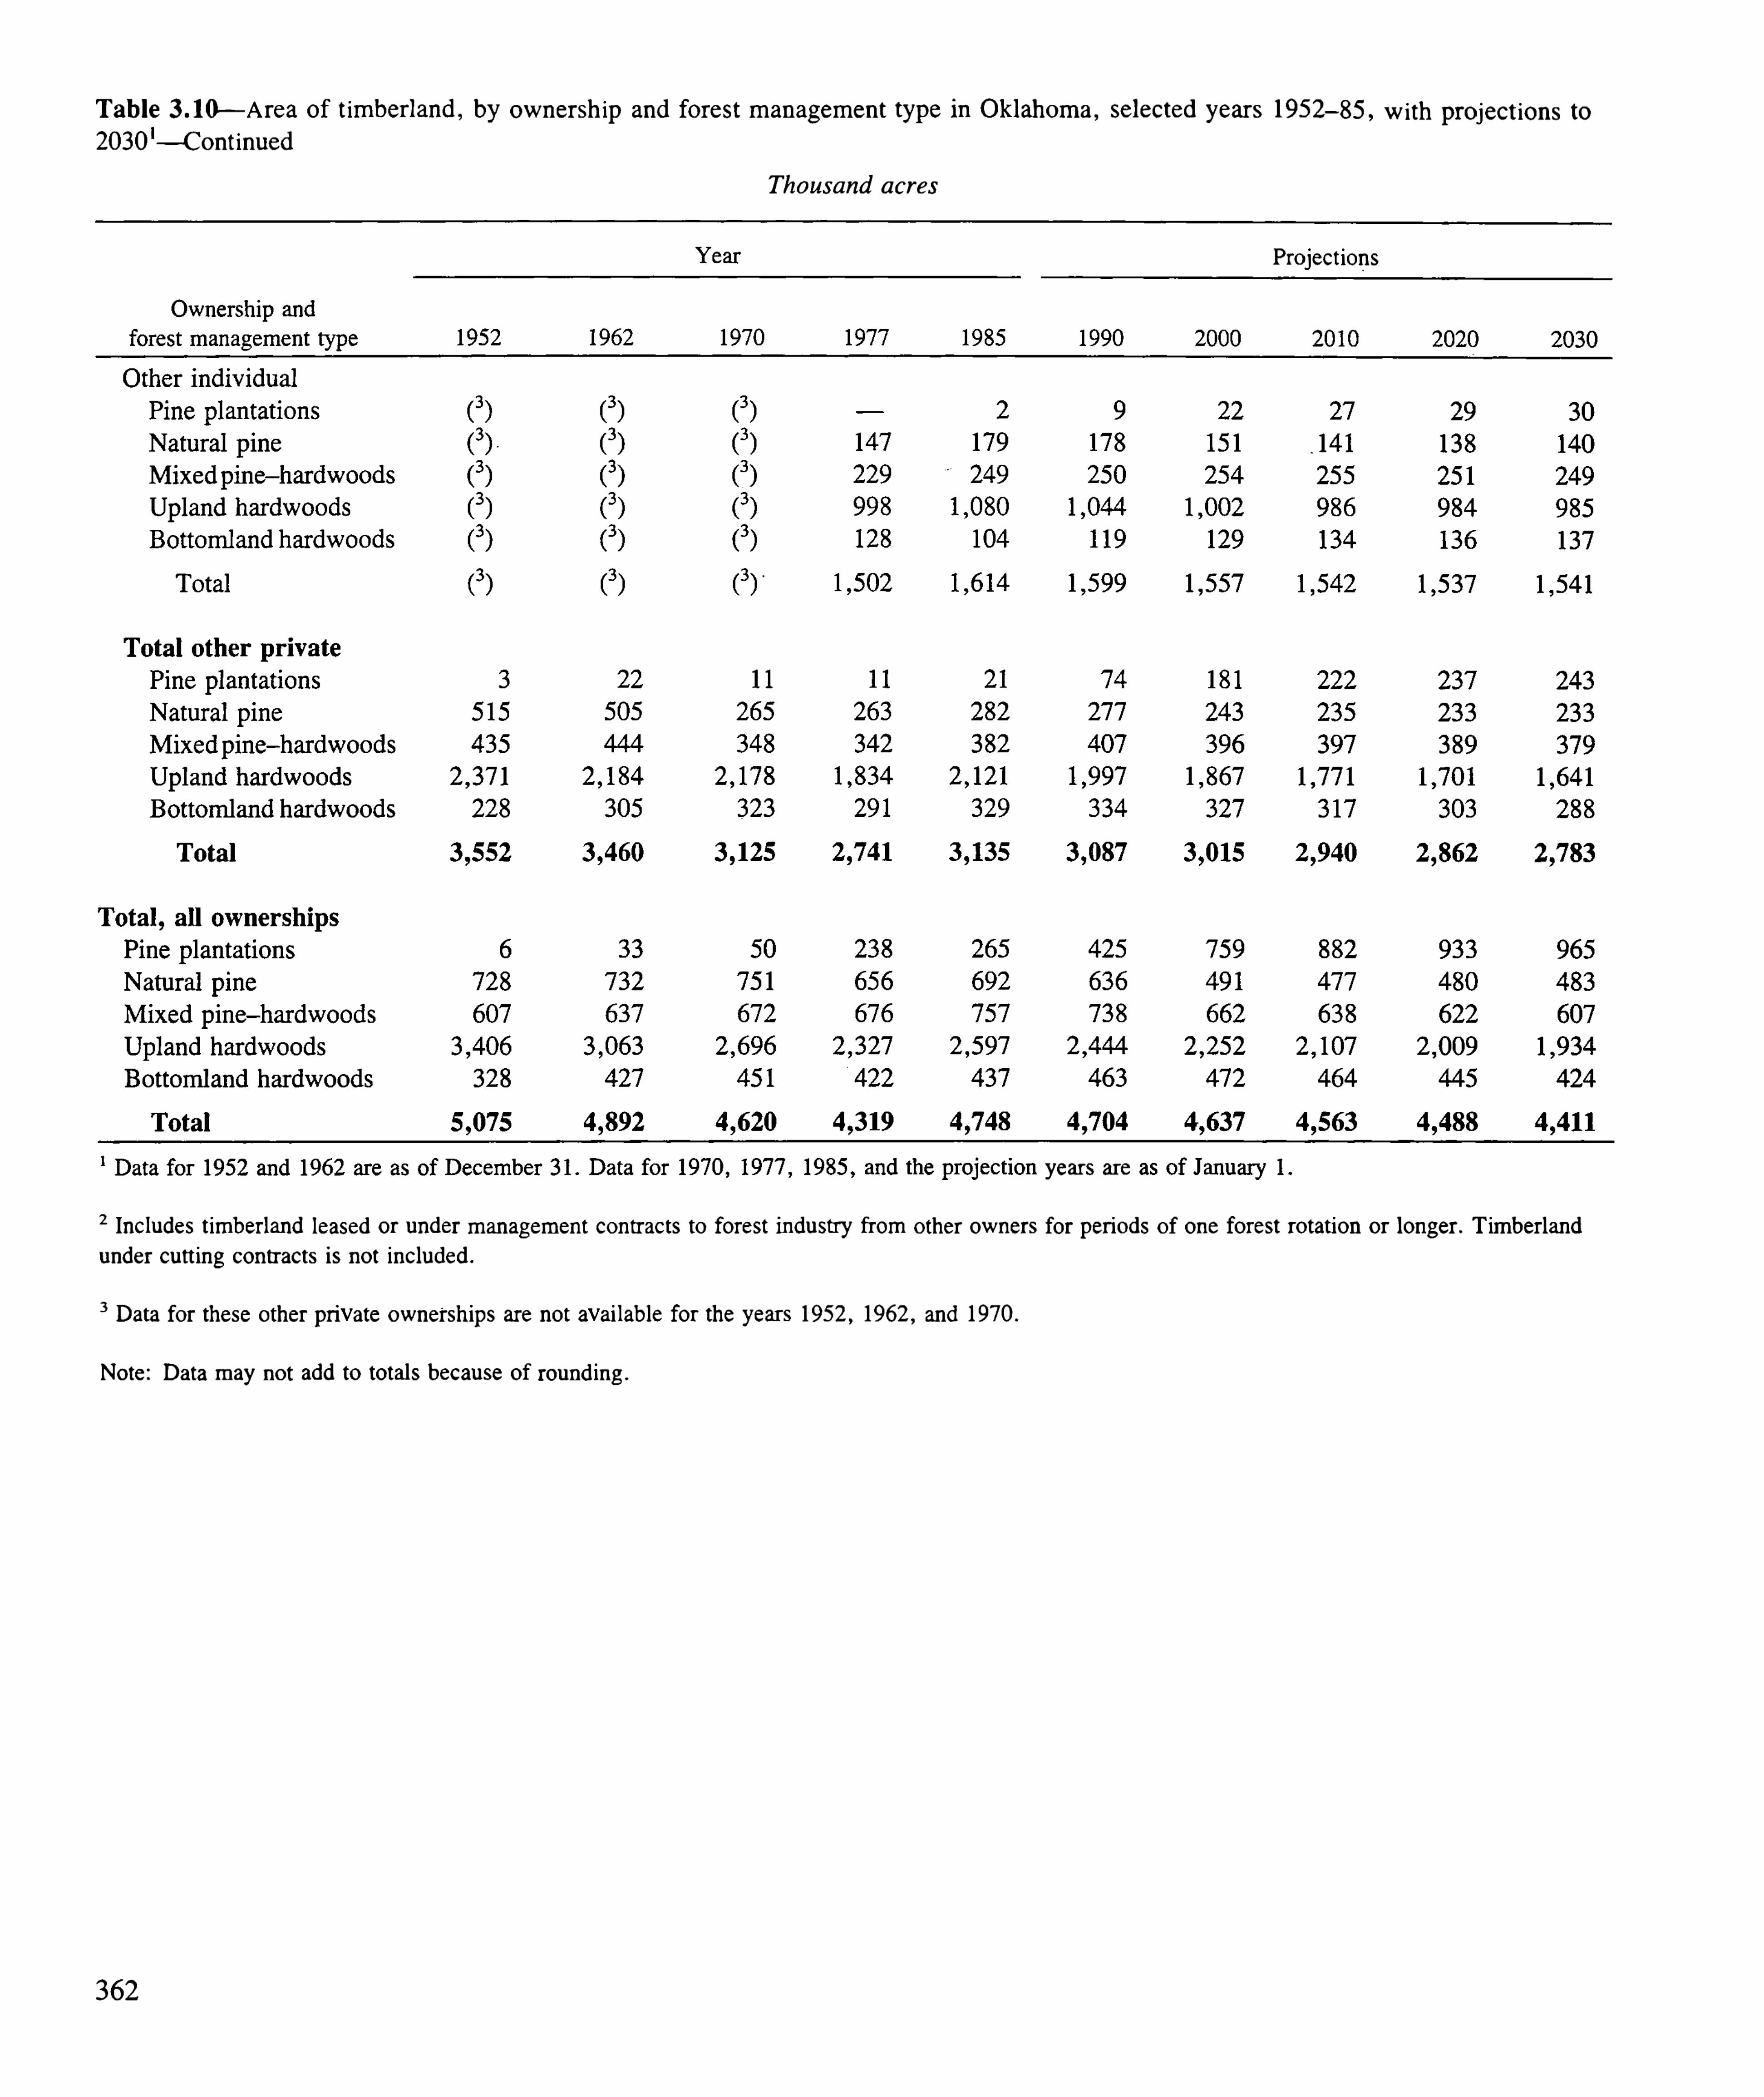
T ab le — A r ea of t im ber land , by owner sh ip and for est m an agem en t type in Oklah om a , selected year s 1952—85 ,
w ith pr oject ions to2030
'— Con t inued
T housa nd a cr es
Pr ojections
year s ar e
3 Includes t imber land leased or under m anagem en t con tr acts to for est industry fr om other owner s for per iods of one for est r otation or longer . T im ber landunder cu tt ing con tr acts is not included .
3Data for these other pri vate ownersh ips ar e not avai lable for the year s 1952 , 1962 , an d 1970 .
Note: Data m ay not add to totals because of r ound ing .
362

T ab le — A r ea of timber land ,by owner sh ip and for est m anagem en t type in Sou th Caro l ina , selected year s 1952—85 , w ith pr oject ions to
20301
Thousand acr es
Pr oject ions
369

T ab le — Ar ea of t im ber l and , by owner shi p and for est m anagem en t type in Sou th Car o l in a , selected year s 1952—85 , w ith pr oject ions to
20301— Con t inued
Thousa nd a cr es
Project ions
3 Inc ludes t imber lan d leased or under m an agem en t con tr acts to for est in dustry fr om other owner s for per iods of one forest rotat ion or longer . T imber landu nder cutt ing con tr acts i s not in c luded .
3Data for these other pr ivate ow ner sh ips ar e not avai lable for the year s 1952 , 1962 , an d 1970 .
Note: Data m ay not add to totals because of round ing .
364

T ab le — A r ea of t im ber land , by ow ner sh ip and for est m an agem en t type i n T ennessee , selected year s 1952—85 ,
w ith pr oject ions to2030
'—Con t inued
Thousa nd a cr es
Project ions
22 1 180 159 223 359 403
790 82 3 826 834 724 693
968 97 1
599 652 601 593 599
3 Inc ludes t imber land leased or under m anagem en t con tr acts to for est industr y fr om other owners for peri ods of one for est rotat ion or longer . T imber landunder cu tt ing con tr acts is not inc luded .
3Data for these other pr ivate ownershi ps ar e not avai lablefor the year s 1952 , 1962 , an d 1970 .
Note: Data m ay not add to totals because of r ound ing .
366

T ab le — Ar ea of tim ber land , by owner sh ip and for est m anagem en t type in T exas, selected year s 1952—85 , w ith pr oject ions to 20301
Thousand a cr es
Project ions
158

T ab le — A r ea of t im ber l and , by ow n er sh ip and for est m an agem en t type i n T exas, selected year s 1952—85 , w ith pr ojec t ions to2030
1—Con t inued
Thousa nd a cr es
Pr ojections
Ownersh ip and
3 Inc ludes t im ber land leased or under m an agem en t con tr acts to forest industry fr om other owner s for per iods of one forest r otat ion or longer . T imberl andunder cu tt ing con tr acts is not inc luded .
3Data for these other pr ivate ow ner sh ips ar e n ot avai lable for the year s 1952 , 1962 , and 1970 .
Note: Data m ay not add to totals becau se of r ound ing .
368

T ab le —A r ea of t im ber l and , by own er sh ipand for est m an agem en t type in Vir g in ia , selected year s 1952—85 , w ith pr oject ion s to
2030'—C on t inued
Thousand a cr es
Pr ojections
194 303 509 692
939
407 6 19 525 597 599 604
3 Inc ludes tim ber land leased or under m anagem en t contr acts to for est industr y from other owner s for per iods of one forest rotation or longer . T imber land undercutting con tr acts is not inc luded .
3Data for these other pr ivate owner sh ips ar e not ava ilable for the year s 1952 , 1962 , and 1970 .
Note: Data m ay not add to totals because of r ound ing .
370

T ab le — Emp ir ical y ields of grow ing stock assum ed for p ine T able — Em pi r ica1 y ields of gr ow ing stock assumed for p ine
plan tat ionson forest industry , other corpor ate , and publ ic owner sh ips plantations on pr ivate non indu str ial ow ner sh ips
S ite c lass S ite c lass
ac r e a cr e
37 1

T ab le — Em p ir ical y iel ds of gr ow ing stock assum ed for natu r al T ab le — Em pi r ical y iel ds of gr ow ing stock assum ed for m i xedp ine stands on al l owner sh ips p ine—har dwood stands on al l owner sh ips
S ite c lass S ite c lass
a cr e a cr e
372

T ab le — Softw ood r oundw ood supp l ies,lt im ber r em ovals,
2net annual gr ow th , and inven tory of softwood gr ow ing stock in theSou theast r eg ion , by owner shi p , selected year s 1952
—84 ,w ith pr oject ions
3to 2030
M i l l ion cub i c feet
Pr oject ions3
tim ber land , in fence r ow s, and in u rban ar eas.
3 Inc ludes rem ova ls in the form of r oundwood pr oducts, logging r esidues, the vo lum es of t im ber r em oved in cu l tu r al oper at ions su ch as nonco
th inn ing , and inven tory losses r esu l t ing fr om the d iver sion of timber l and to other u ses such as cr opland , pasturelan d , par ks, an d u r ban uses.
3Al l pr ojections at equ i l ibr ium pr ices, i .e .
, the stumpage pr ices at wh ich pr ojected t imber dem ands and suppl ies ar e equal (see append ix tab le 4 .
ar e aver ages for 5 year s cen ter ed on the pr oject ion year .
Data from 1952 and 1962 ar e as of Decem ber 3 1 . Data for 1970 and al l pr oject ion year s are as of Jan uar y 1 . Data for 1976 an d 1984 ar e as of
1 , 1977 , and Januar y 1 , 1985 .
3 Inc ludes lands under long - term lease fr om other pri vate owner s.
6Data for these an d other pr ivate ow ner sh ips ar e not avai lab le for the year s 1952 , 1962 , and 1970 .
Note: Data m ay not add to totals because of r ound ing .
374
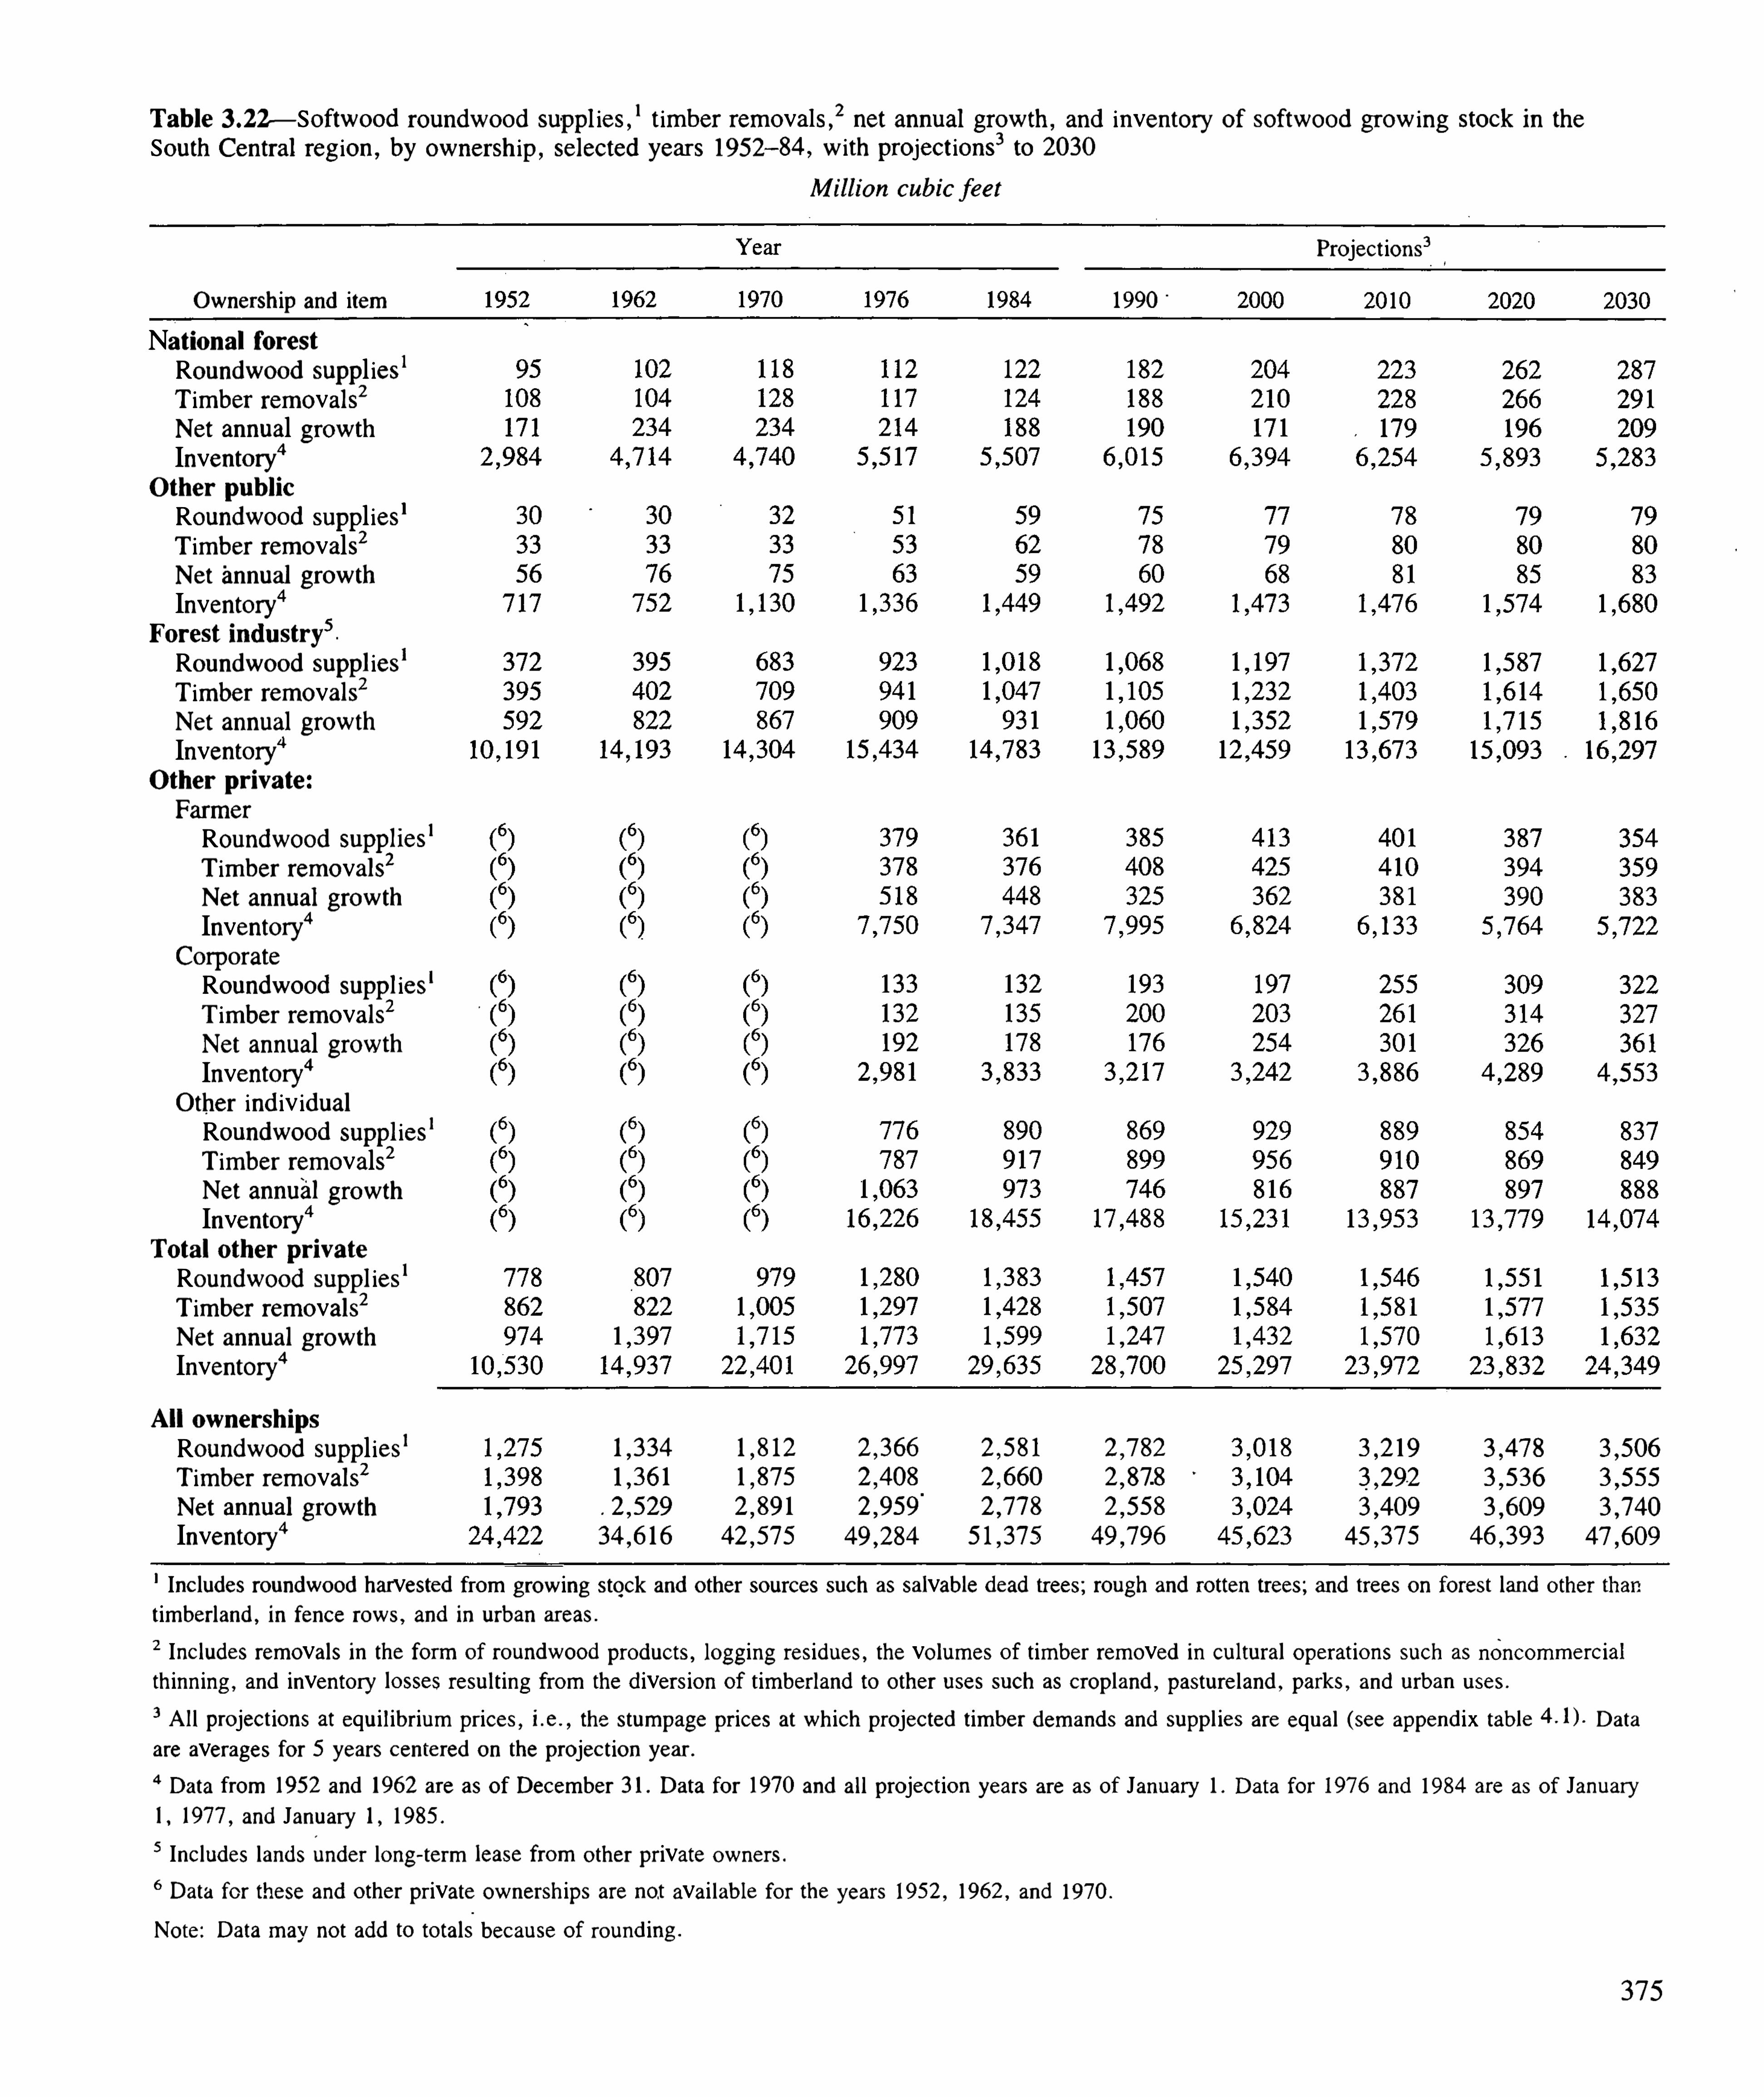
T able — Softwood r oundwood suppl ies,1t imber r em ovals,
3net annual grow th , and inven tory of softwood gr ow ing stock in theSou th Cen tr al r eg ion , by owner sh ip , selected year s 1952
—84 , w ith pr oject ions3to 2030
Mi l l ion cub ic feet
Project ions3
Owner sh ip and item 1990
Nat ion a l for estRoundwood suppl ies1T im ber r em oval s3
Net annual growthInven tory“Other pu b l icRoundwood suppl ieslT im ber r emovals3Net annual grow thInven tory“
For est indu str y5
Roundwood suppl ies1
T imber remova ls2
Net annual gr ow thInven tory“Other p r ivate
Farmer
Roundwood suppl iesI
T im ber r em ovals3
Net annual gr ow thInven tory“Corpor ateRoundwood suppl ies
l
T im ber rem ovals3
Net annual gr owthInventory“Other ind iv idualRoundwood suppl ies1T im ber rem ovals2Net annual growthInven tory“
T ota l other p r ivateRoundwood suppl ies1
T imber rem ovals3
Net annua l growthInven tory“Al l own er sh ipsRoundwood suppl ieslT im ber r em ovals2
Net annual grow thInven tory“ 49 ,284 45 ,375 46 ,393
Inc ludes r oundwood harvested from grow ing stock and other sour ces such as salvable dead tr ees; rough and rotten trees; and trees on forest land other thantim ber land , in fence r ows, and in u rban ar eas.
3 Inc ludes r emovals in the form of r oundwood pr oducts, logging residues, the vo lumes of timber r em oved in cu l tur al oper at ions such as noncomm er c ia lth inn ing , and inven tory losses r esu l ting fr om the d iver sion of tim ber land to other uses such as cr opland , pastu r eland , parks, and u rban u ses.
3Al l project ions at equ i l ibr ium pr ices, i .e . , the stumpage pr ices at wh ich projected tim ber dem ands and suppl ies ar e equ a l (see append ix table Data
are aver ages for 5 years cen tered on the projec tion year .
Data from 1952 and 1962 ar e as of Decem ber 3 1 . Data for 1970 and a l l pr ojection years ar e as of Jan uary 1 . Data for 1976 and 1984 are as of Jan u ary1 , 1977 , and January 1 , 1985 .
3 Inc ludes lands under long - term lease from other pr ivate ow ner s.
6Data for these and other pr ivate ow ner sh ips are not avai lab le for the year s 1952 , 1962 , and 1970 .
Note : Data m ay not add to totals because of r ound ing .
375

Table — Softw ood r ou ndw ood suppl ies,1t im ber r em ovals,
3. net annual gr ow th , and inven tory of softwood gr ow ing stock in A labam a ,
by owner sh ip , selected year s 1952—84 ,
w ith pr oject ions3to 2030
Owner sh ip and item
Na tion a l for estRoundwood suppl ies
1
T imber rem ovals3
Net annual gr ow thInven tory“Other pu b l icRoundwood suppl ies
I
T im ber r em ovals3
Net annual gr ow thInven tory“For est in du str y
3
Roundwood suppl iesl
T im ber rem ovals2
Net annual gr owthInven tory“Other p r ivate
Farm er
Roundwood supp l iesl
T imber r em ovals3
Net annual grow thInven tory“Corpor ateRou ndwood suppl ies
l
T im ber r em oval s2
Net annual grow thInventory“Other ind iv idualRoundwood suppl ies
l
T im ber r em oval s2
Net annual gr ow thInven tory“T ota l other p r iva teRoundwood suppl ies
1
T im ber r em ovals2
Net annu al gr ow th
Inven tory“
Al l own er sh ipsRoundwood suppl ies1
T imber r em ovals3
Net annual gr ow thInven tory“
M i l l ion cub i c feet
352 684 73 3
350 697 759
7 13 624 608
Pr oject ions3
837 867
85 1 878
9 14 953
Inc ludes roundwood harvested from gr ow ing stock and other sou rces such as sa lvab le dead trees; rough and rotten trees; and tr ees on forest land other than
tim ber land , in fence row s, and in u r ban ar eas.
3 Inc ludes r em ovals in the form of r oundw ood pr oducts, logg ing r esidues, the vo lumes of timber r emoved in cul tu r al oper at ions such as noncomm er c ialth inn ing , and inven tory losses r esu l ting from the d iver sion of t im ber land to other u ses such as cr opland , pastureland , parks, and u rban uses.
3Al l pr oject ions at equ i l ibr ium pr ices, i .e . , the stumpage pr ices atwh ich projected tim ber dem ands and suppl ies ar e equal (see append ix tab le Data
are aver ages for 5 year s cen tered on the projection year .
Data from 1952 and 1962 are as of December 3 1 . Data for 1970 and al l project ion year s are as of Jan u ary 1 . Data for 1976 and 1984 are asof January1 , 1977 , and Jan uary 1 , 1985 .
3 Inc ludes lands under long - term lease fr om other pr ivate owner s.
6Data for these and other pr ivate ow ner sh ips ar e not ava ilab le for the year s 1952 , 1962 , and 1970 .
Note: Data m ay not add to tota ls because of round ing .
3 76

T ab le — Softw ood r oundwood suppl ies,It im ber removals; 3 net annu al gr ow th , and inven tory of softwood gr ow ing stock in Flor ida ,
by owner sh ip , selected year s 1952—84 ,
w ith pr oject ion s3to 20 30
Mi l l ion cub ic feet
Year Pr oject ions3
Owner sh ip and item
Nat ion a l for estRoundwood suppl ies
1
T im ber r em ovals2Net annua l gr ow thInven tory“
Other pu b licRou ndwood suppl iesl
T imber r emovals3
Net annual gr ow thInven tory“For est in du str y
3
Roundwood suppl ieslT imber r em oval s2
Net annual grow thInven tory“Other p r iva teFarmer
Roundwood suppl ies1
T imber r em ovals2
Net annu al gr ow thInven tory“Corpor ateRoundwood suppl ies
I
T imber r em ovals3
Net annual gr ow th
Inven tory“
Other ind ividualRoundwood suppl ies
l
T imber r em ovals3
Net annual gr ow thIn ven to ry“T ota l other p r iva teRoundwood suppl ies
1
T im ber r em ovals2
Net annual gr ow thInven tory“Al l own er sh ipsRou ndwood suppl ies
l208 340 41 1 500 572 677 667
T im ber rem ovals3 2 16 40 1 478 537 607 70 1 685
Net annual gr ow th 349 545 608 605 697 777 77 1
Inven tory“Includes roundwood harvested fr om gr ow ing stock and other sou r ces such as salvable dead trees; r ough and rotten tr ees; and b ees on for est land other than
t imber land , in fence rows, and in u rban areas.
3 Inc ludes r emovals i n the form of r ou ndwood products, logging r esidues, the volum es of t im ber rem oved in cu ltu r al oper ations such as noncomm er ci al
th inn ing , and inven tory losses r esu l t ing from the d iversion of t im ber l and to other u ses such as cr opland , pastu r elan d , parks, and u rban uses.
3 Al l projections at equ il ibr ium pri ces, i .e . , the stumpage pr ices at wh ich pr ojected t im ber demands and suppl ies ar e equal (see append ix table Data
ar e aver ages for 5 year s cen tered on the project ion year .
Data fr om 1952 and 1962 ar e as of Decem ber 3 1 . Data for 1970 and al l pr ojection year s ar e as of Janu ary 1 . Data for 1976 an d 1984 ar e as of Jan u ary1 , 1977 , and Jan u ary 1 , 1985 .
3 Inc ludes lan ds under long - term lease fr om other pr ivate owner s.
6Data for these and other pr ivate owner sh ips ar e not avail ab le for the year s 1952 , 1962 , _
and 1970 .
Note: Data m ay not add to totals because of rou nd ing .
378

T ab le — Softwood r oundwood suppl ies,1t im ber r em ovals,
3net an nual grow th , and inven tory of softwood gr ow ing stock in Georg ia ,
by owner sh ip , selected year s 1952—84 , w ith project ions
3to 2030
National for estRoundwood suppl ies
l
T imber rem ovals2Net an nual gr ow thInven tory“
Other pu b l ic
Rou ndwood Suppl ies‘
T imber r em ovals3
Net annual gr owthInven tory“For est indu str y
3
Roundwood suppl ies‘
T imber r em ovals3
Net annua l grow thInventory“Other p r ivate
Farmer
Roundwood suppl iesI
T im ber r em ovals3
Net annual gr ow thInventory“Corpor ateRoundwood suppl ies
I
T imber r em ovals3
Net annual gr ow thInventory“Other individualRoundwood suppl ies
1
T imber rem ovals2
Net a nnual gr owthInven tory“T ota l other p r ivateRoundwood suppl ies
1
T imber r em ovals2Net annual growthInventory“
Al l own er sh ipsRoundwood suppl ies1
T imber r em ovals3
Net annual gr owthInven tory“
Mi l l ion cub i c feet
7 073
570 823
592 936
809
Pr ojection s3
Includes roundwood harvested fr om gr ow ing stock and other sources su ch as salvab le dead trees; rough and rotten trees; and trees on forest land other than
timber land , in fence r ows, and in u rban ar eas.
3 Inc ludes remova ls in the form of r oundwood pr oducts, logging r esidues, the vo lumes of t im ber r em oved in cu l tu r a l oper ations such as noncom m er c ialth inn ing , and inven tory losses r esu l ting from the d iver sion of timber land to other uses such as cropland , pastu r el and , par ks, and u rban uses.
3Al l pr oject ions at equ i l ibr ium pr ices, i .e . , the stumpage pr ices at wh ich pr ojected tim ber dem ands and suppl ies ar e equa l (see append ix tab le Data
are aver ages for 5 years centered on the project ion year .
Data from 1952 and 1962 ar e as of Decem ber 3 1 . Data for 1970 and a l l pr ojec tion year s are as of Jan uar y 1 . Data fo r 1976 and 1984 ar e as of Jan u ary1 , 1977 , and January 1 , 1985 .
3 Inc ludes lands u’
nder long- term lease from other pr ivate own er s.
6Data for these and other pr ivate owner sh ipsar e not avai l ab le for the year s 1952 , 1962 ,
and 1970 .
Note: Data m ay not add to totals becau se -of rou nd ing .
379

Tab le — Softw ood r oun dwood suppl ies, I t im ber r em ovals,3 net annual gr ow th , and inven tory of softwood gr ow ing stock i n Lou isian a ,
by ow ner sh ip , selected year s 1952—84 , w ith pr oject ion s
3to 2030
M i l l ion cub i c feet
Owner sh ip and item
Nat ion al for estRoundwood suppl ies
1
T im ber r em ovals2
Net annual gr ow thInven tory
“
Other pu b l icRoundwood suppl iesl
T im ber r em oval s2
Net annual gr ow thInven tory“For est in du str y
3
Roundwood suppl iesl
T im ber r em ovals3
Net annual gr ow thInven tory“Other p r ivate
Farm er
Roundwood suppl iesl
T imber r em ovals2
Net annual grow thInven tory“Corpor ateRoundwood suppl ies
l
T im ber r em ovals2
Net annual gr ow th
Inven tory“
Other in d ividualRoundwood suppl ies
1
T im ber r em ovals2
Net annual gr ow thInven tory“T otal other p r ivateRoundw ood suppl ies
l
T im ber r em ovals3
Net annual grow thInven tory“Al l own er sh ipsRoundwood supp l ies
1
T im ber r em ovals2
Net annu al grow thInventory“
25 1 469
253 469
460 586
Pr oject ion s3
472 523 639 7 30 753473 54 1 654 742 763
544 482 7 14 767 804
Includes r oundwood har vested from grow ing stock and other sou r ces such as salvab le dead tr ees; r ough and r otten trees; and trees on forest land other than
t imber land , in fence r ow s, and in u rban ar eas.
3 Inc ludes r em ova ls i n the form of r oundwood products, logging residues, the vo lumes of t im ber r em oved in cu l tu r al oper at ions such as noncomm er c ialth inn ing , an d inven tory losses r esu l t ing fr om the d iver sion of timber land to other u ses such as cr opland , pastu r eland , parks, and u rban u ses.
3A l l pr ojections at equ i l ibr ium pri ces, i .e . , the stumpage pr ices at wh ich projected tim ber dem ands and supp l ies ar e equ al (see append ix table Data
are aver ages for 5 year s cen ter ed on the project ion year .
Data from 1952 and 1962 ar e as of Decem ber 3 1 . Data for 1970 and a l l project ion year s ar e as of Januar y 1 . Data for 1976 and 1984 ar e as of Jan uary1 , 1977 . and January 1 , 1985 .
3 Inc ludes lands under long - term lease fr om other pri vate ow ner s.
6Data for these and other pr ivate ow ner sh ips ar e not avai lab le for the year s 1952 , 1962 , and 1970 .
Note: Data m ay not add to totals because of round ing .
3 80

T ab le — Softwood r oundwood suppl ies,1t im ber r em ovals,
3net annual gr ow th , and inven tory of softwood gr ow ing stock in Nor th
Car ol ina , by ow ner sh ip , selected year s 1952—84 ,
w ith pr oject ions3to 2030
Owner sh ip and item
Nat ion al for estRoundwood suppl ies
I
T im ber r emovals3
Net annual grow thInven tory“Other pu b l icRoundwood suppl ies
l
T imber r em ovals3
Net annual growthInven tory“For est i n du str y
3
Roundwood suppl iesl
T im ber r em oval s3
Net annual grow thInven tory“Other p r ivateFarm er
Roundwood suppl iesl
T im ber r em ovals3
Net annual gr ow thInven tory“Corpor ateRoundwood suppl ies
1
T im ber r em ovals3
Net ann ual grow thInven tory“Other ind iv idualRoundwood suppl ies
l
T im ber r em ovals3
Net annual grow thInven tory“Tota l other p r ivateRoundw ood suppl ies1
T im ber r em ovals3
Net annual gr ow thInven tory“Al l own er sh ipsRoundwood suppl ies
1
T im ber r em ovals3
Net annual gr ow thInventory“
M i l l ion cub ic feet
325 377
337 413
463 545
Pr oject ions3
413 43 1 468 525
43 1 464 496 544
50 1 44 1 520 630
Inc ludes roundwood harvested fr om gr ow ing stock and other sour ces such as salvab le dead tr ees; r ough an d r otten tr ees; an d tr ees on forest.
land other than
t imber land , in fence rows, and in u r ban ar eas.
3 Inc ludesr emovals in the form of r oundwood products, logg ing r esidues, the volum es of t im ber r em oved in cu l tu r al oper at ions su ch as noncomm er c ialth inn ing , and inven tory losses r esu l t ing from the d iver sion of t imber land to other uses such as cropl and , pastu r el and , parks, and u rban u ses.
3Al l projections at equ i l ibr ium pr ices, i . e . ,
the stumpage pri ces at wh ich pr ojected t im ber dem an ds and supp l ies ar e equal (see append ix table Data
ar e aver ages for 5 year s cen ter ed on the pr oject ion year .
Data fr om 1952 and 1962 ar e as of Decem ber 3 1 . Data for 1970 and al l pr oject ion year s ar e as of Jan uary 1 . Data for 13
976 and 1984 ar e as of January1 , 1977 , and Jan uary 1 , 1985 .
3 Inc ludes l ands under long - term lease fr om other pr ivate ow ners.
6Data for these and other pri vate ow ner sh ips ar e not avai lable for the year s 1952 , 1962 , an d 1970 .
Note: Data m ay not add to totals because of r ound ing .
382

T able 3 3 0—Softwood r oundwood suppl ies,‘t im ber rem ovals,
2net annual gr t h , and inven to ry of softwood gr ow ing stock i n Oklahom a ,
by owner sh ip , selected year s 1952—84 , w ith projec ti ons3to 2030
Mi l l ion'
cub ic feet
Projections3
Owner sh ip and item
Nation a l for estRoundwood suppl ies
‘
T im ber r em ovals2
Net annual grow thInventory“Other pu b l icRoundwood suppl ies‘T im ber r emovals3
Net annual gr ow thInventory“For est in du str y
3
Roundwood suppl ies‘
T imber rem ovals3
Net annual grow thInventory“Other p r ivate
Farm er
Roundwood suppl ies‘
T im ber r emoval s2
Net annual grow thInventory“Corpor ateRoundwood suppl ies‘T im ber r emovals3
Net annual grow thInventory“Other ind iv idualRound-wood suppl ies
‘
T im ber r em oVals3
Net annual growthInven tory“T otal other p r iva teRoundwood suppl ies‘T imber r emovals2
Net annual gr owthInventory“Al l own er sh ipsRound-wood suppl ies
‘18 53
T imber r em oval s3 19 54
Net annual gr ow th 42 46
Inven tory“ 692 997
Includes roundwood har vested fr om gr ow ing stock and other sour ces such as salvable dead tr ees; rough and r otten trees; and trees on for est lan d other than
timber land , in fence rows, and in u rban areas.
3 Inc ludes r emovals in the form of r oundwood products, logging residues, the volum es of t imber rem oved in cu l tu ral oper ations such as noncomm erc ia lth inn ing , and inven tory losses resu l ting from the d iver sion of t im ber land to other uses such as cr opland , pastu r el an d , par ks, and u rban u ses.
3All projections at equ i l ibr ium pr ices, i .e . , the stumpage pr ices at wh ich projected tim ber dem ands and suppl ies ar e equ a l (see append ix tab le Data
are aver ages for 5 year s centered on the pr ojection year .
Data from 1952 and 1962 ar e as of Decem ber 3 1 . Data for 1970 and al l pr ojection year s ar e as of January 1 . Data for 1976 and 1984 ar e as of January1 , 1977 , and January 1 , 1985 .
3 Inc ludes lands under long - term lease fr omother pr ivate owner s.
6Data for these and other pr ivate owner sh ips ar e not avai lab le for the year s 1952 , 1962 , an d 1970 .
Note: Data may not add to tota ls because of r ou nd ing .
383

T ab le — Softwood r ou ndw ood suppl ies,‘t im ber r em oval s,
3net an nu al gr ow th , and inven tory of softwood gr ow ing stock i n Sou th
Caro l ina , by ow ner shi p , selected year s 1952—84 , w ith project ion s
3to 2030
Mi l l ion cub i c feet
Owner sh ip and item
Nat ion al for estRoundwood suppl ies
‘
T im ber r emovals3Net annual gr ow thInven tory“
Other pu b l icRou ndwood suppl ies‘T im ber r emova ls3
Net annual grow thInventory“For est in du str y
3
Roundwood suppl ies‘
T im ber r em ovals3
Net ann ual growthInventory“Other p r ivateFar mer
Roundwood suppl ies‘
T im ber r em ovals3
Net annual grow th
Inven tory“
Corpor ateRoundwood suppl ies‘
T imber r em ovals2
Net an nual gr ow thInven tory“Other ind iv idu alRoundwood suppl ies
‘
T imber r em oval s3
Net an nual gr ow thInven tory“T ota l other p r ivateRoundwood suppl ies
‘
T imber r em ovals3
Net annual grow thInven tory“Al l own er sh ipsRoundwood suppl ies
‘
T im ber r em oval s3
Net annual gr ow thInventory“
237
246
359
350
354
596
395
455
444
44 1
473
404
44 1
467
462
Pr oject ions3
477
494
536
486
499
539
Inc ludes roundwood har vested fr om gr ow ing stock an d other sou rces such as salvable dead trees; rough and rotten tr ees; and trees on for est lan d other than
tim ber land , in fence r ows, and in u rban ar eas.
3 Inc ludes r emovals in the form of r oundwood products, logg ing r esidues, the volum es of t imber r emoved in cul tu r al oper at ions such as noncomm er c ialth inn ing , and inven tory losses r esu l t ing fr om the d iver sion of tim ber land to other uses such as cropland , pastu r eland , par ks, and u r ban u ses.
3Al l pr oject ions at equ i l ibri um pri ces, i .e . , the stum page pr ices at wh ich projected timber dem ands and suppl ies ar e equ al (see append ix tab le Data
ar e aver ages for 5 year s cen ter ed on the projection year .
Data fr om 1952 and 1962 ar e as of December 3 1 . Data for 1970 and al l pr ojection year s ar e as of Jan uary 1 . Data for 1976 and 1984 ar e as of Janu ar y1 , 1977 , and Januar y 1 , 1985 .
3 Inc ludes lands under long - term lease fr om other pr ivate ow ner s.
6Data for these and other pri vate ow ner sh ips are not avai lable for the year s 1952 , 1962 , and 1970 .
Note: Data m ay not add to totals becau se of r ound ing .
384
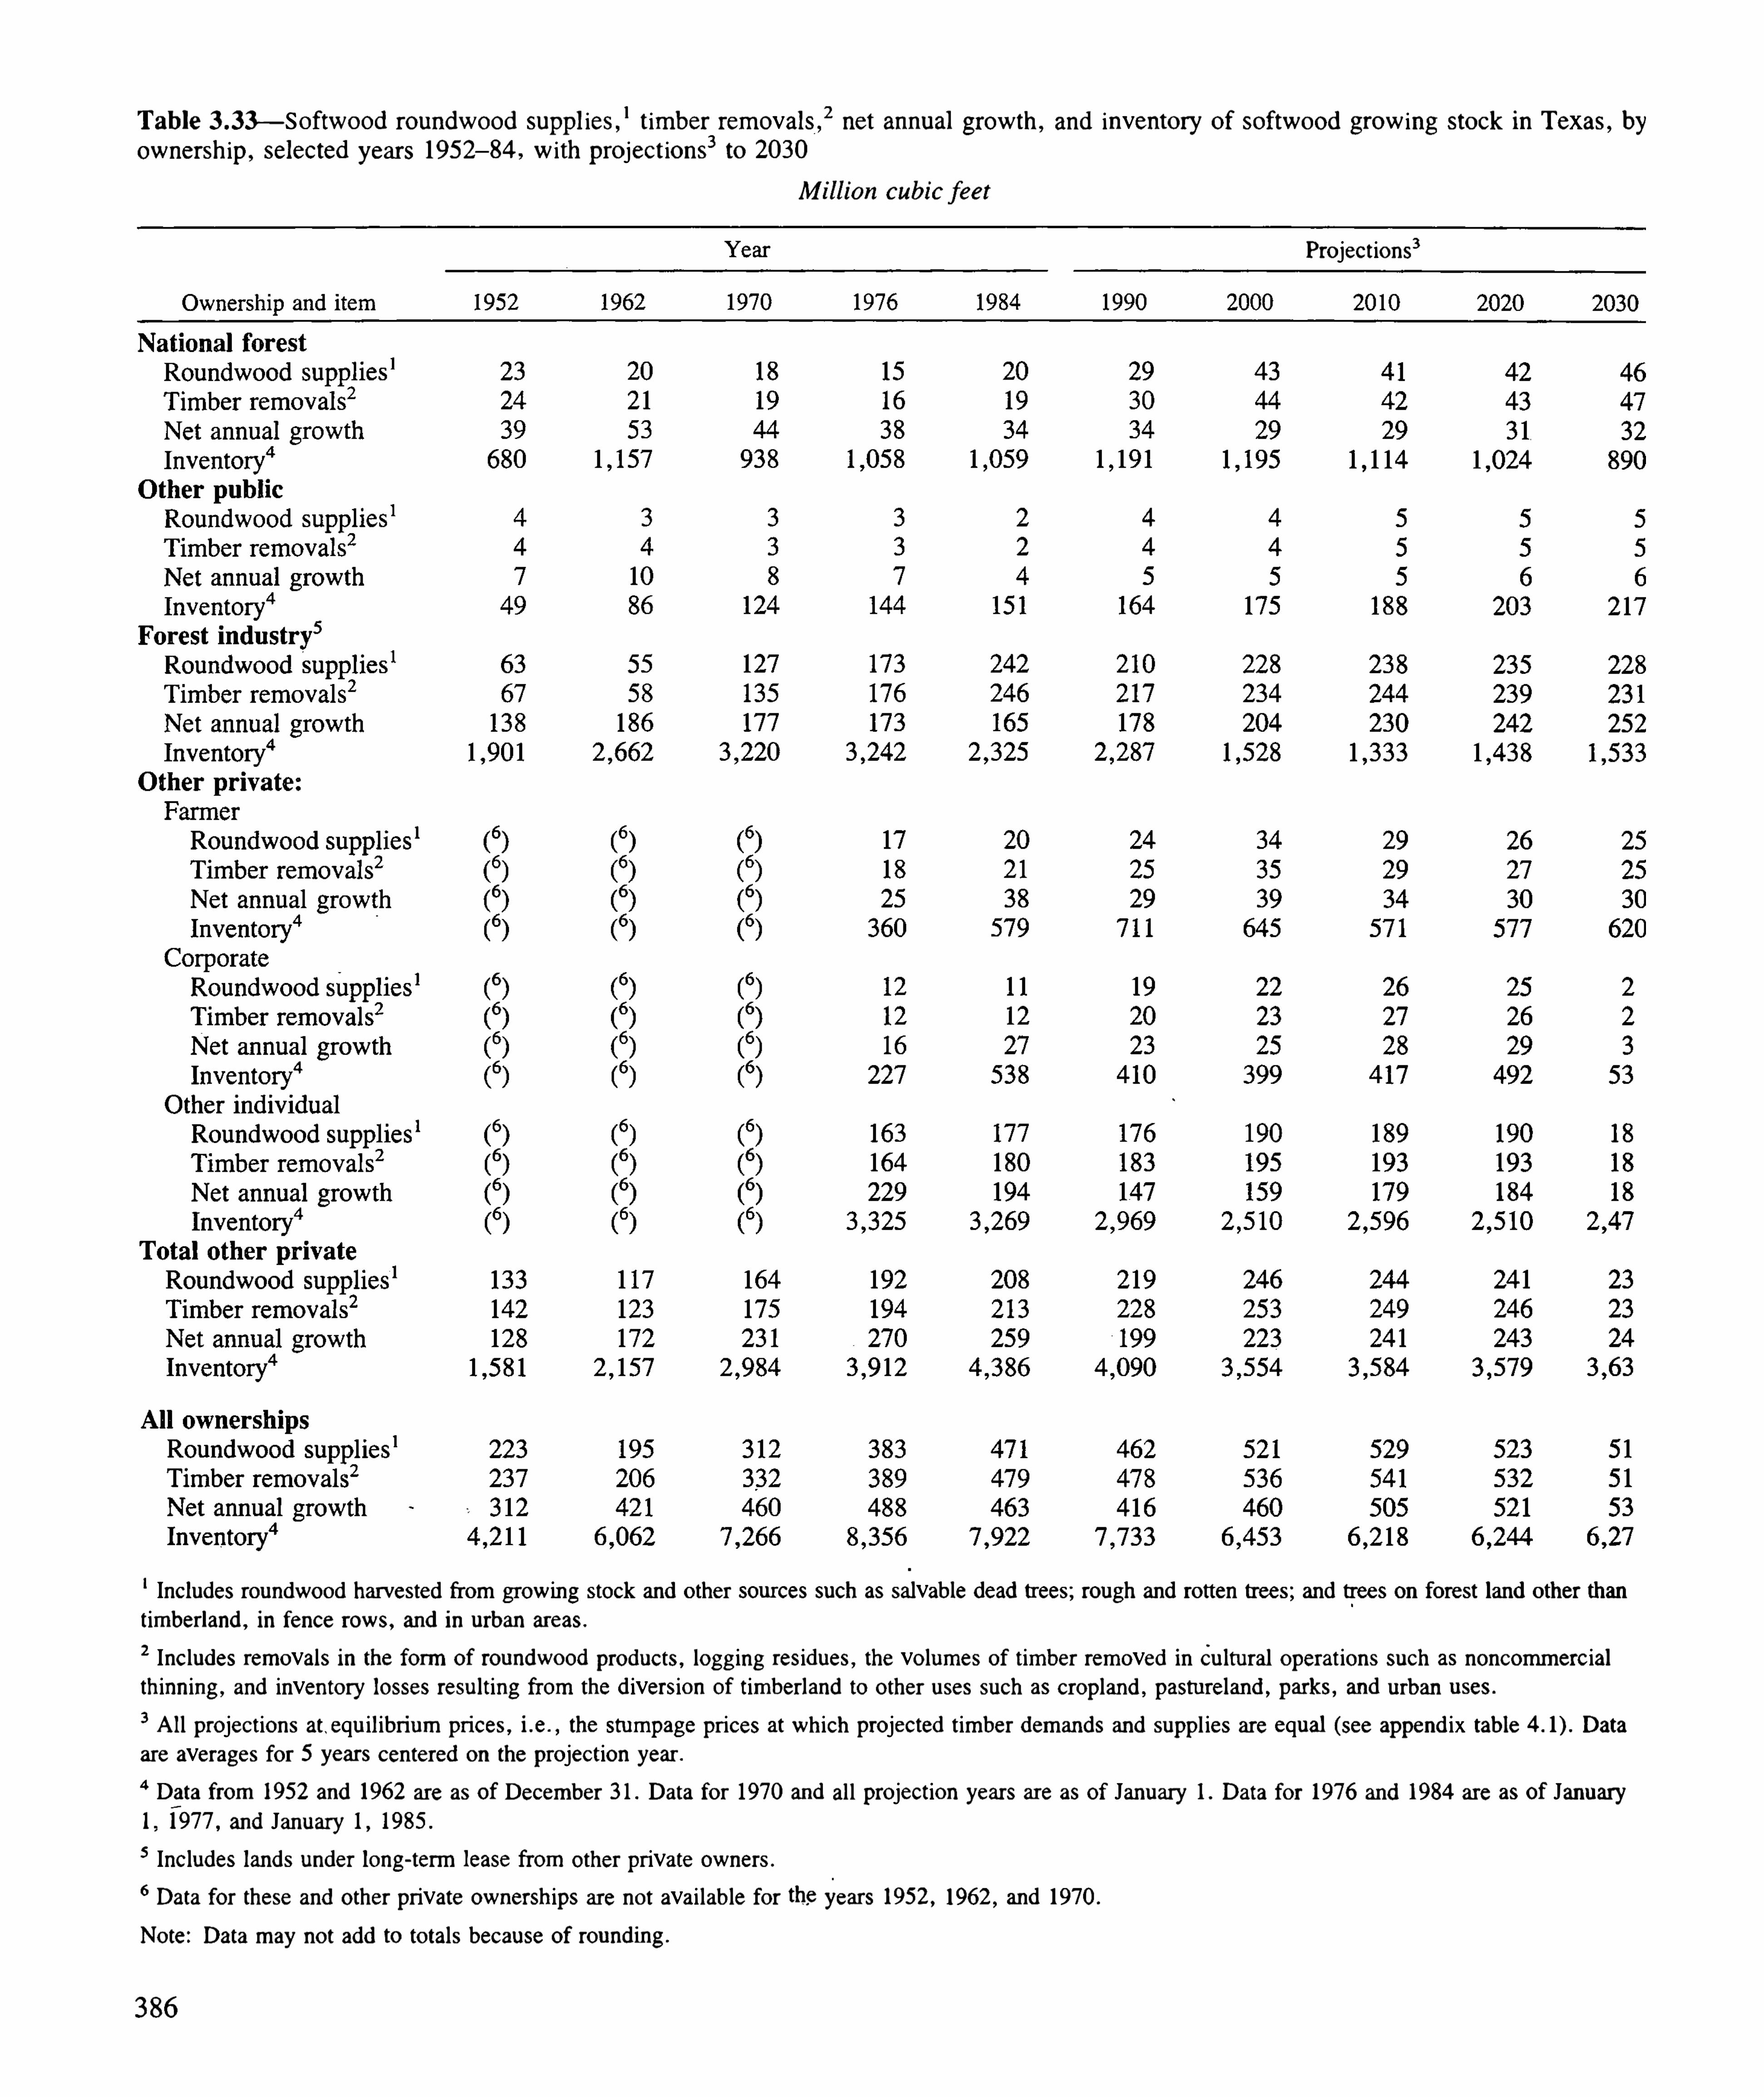
T ab le — Softwood r oundw ood suppl ies,‘t im ber r em ovals,
2net annual gr ow th , and inventory of softwood grow ing stock in T exas, by
owner sh ip , selected year s 1952—84 , w ith project ions
3to 2030
M i l l ion cub i c feet
Projections3
Includes r oundwood har vested fr om grow in g stock and other sour ces such as salvable dead trees; rough and r otten tr ees; and trees on forest lan d other thantimber land , in fence r ow s, and in urban ar eas.
3 Inc ludes r emovals in the form of r oundwood products, logg ing r esidues, the vo lumes of timber rem oved in cu ltu r al oper at ions such as noncomm erc ialth inn ing , and inven tory losses resu l ting fr om the d iver sion of tim ber land to other uses such as cr opland , pastu relan d , parks, and u rban u ses.
3Al l projections at . equ il ibri um pri ces, i .e . , the stumpage pr ices at wh ich projected t imber dem an ds an d suppl ies ar e equal (see append ix table Data
ar e aver ages for 5 year s cen ter ed on the pr ojection year .
Data fr om 1952 and 1962 are as of December 3 1 . Data for 1970 and al l pr ojection year s ar e as of Januar y 1 . Data for 1976 and 1984 are as of January1 , 1977 , and Jan uary 1 , 1985 .
3 Inc ludes lands under long - term lease fr om other pr ivate ow ner s.
6Data for these and other pr ivate owner sh ips ar e not avai lab le for the year s 1952 , 1962 , and 1970 .
Note: Data m ay not add to totals because of rou nd ing .
386

T able — Softwood r oundwood suppl ies,‘ t imber rem oval s,3 net annu al grow th , and inven tory of softwood grow ing stock in Virg in ia ,
by owner sh ip , selected year s 1952—84 ,w ith p r oject ions
3to 2030
M i l l ion cub i c feet
Project ions3
1970
227 275
206 285
229 3 38
5 ,898
Includes roundwood harvested fr om gr ow ing stock and other sou rces such as salvable dead trees; r ough and r otten tr ees; and trees on forest land other than
timber land , in fence rows, and in u rban areas.
3 Inc ludes removals in the form of r ou ndwood products, logging residues, the volum es of timber r em oved in cu l tu r a l Oper ation s such as noncomm erc ialth inn ing , and inven tory losses resu l ting from the d iver sion of timber land to other u ses such as cr opland , pastu reland , parks, and u rban uses.
3'
Al l projections at equ i l ibr ium pr ices, i .e . , the stumpage pr ices at w h ich -
projected tim ber dem ands and suppl ies are equa l (see append ix tab le Data
are aver ages for 5 year s cen ter ed on the“
project ion year .
Data fr om 1952 and 1962 ar e as of December 3 1 . Data for 1970 and a l l projection year s ar e as of Jan uary 1 . Data fo r 1976 and 1984 ar e as of January1 , 1977 , and January 1 , 1985 .
3 Inc ludes lands under long- term lease fr om other pr ivate owner s .
6Data for these and other pr ivate owner sh ips are not avai l ab le for the year s 1952 ,
1962 , and 1970 .
Note: Data m ay not add to totals becau se of r ou nd in g .
387

T ab le — Softwood roundwood suppl ies, ‘ t imber r em oval s,3 net ann ual gr ow th , and inven tory of softwood gr ow ing stock in the Sou theastreg ion , by for est m anagem en t type , selected year s 1952
—84,w ith project ions
3to 2030
Mi l l ion cub ic feet
Project ions3
Inc ludes r oundwood har vested fr om gr ow ing stock and other sour ces such as salvable dead tr ees; r ough and r o tten tr ees; and tr ees on for est land other
than t im ber land , in fence r ows, and in u r ban ar eas.
3 Inc ludes remova ls in the form of r oundwood pr oducts, logg ing residues, the volum es of tim ber rem oved in cu ltu r a l oper ations such as noncomm erc ialth inn ing , and inven tory losses r esu l ting fr om the d iver sion of tim ber land to other uses such as cropland , pastu reland , par ks, and u rban uses.
3Al l pr ojections at equ i l ibr ium pr ices, i .e . , the stumpage pr ices at wh ich projected tim ber dem ands and suppl ies ar e equa l (see append ix tab le Data
are aver ages for 5 year s cen tered on the project ion year .
Data for 1952 and 1962 ar e as of Decem ber 3 1 . Data for 1970 and a l l pr ojection year s ar e as of January 1 . Data for 1976 and 1984 ar e as of January 11977 , and January 1 , 1985 .
Note: Data m ay not add to totals because of r ounding .

T ab le — Softwood r oundwood suppl ies,‘t im ber r em oval s,
3net annual gr ow th , and inven tory of softw ood gr ow ing stock in A labam a ,
by forest m anagem en t type , selected year s 1952—84 , w ith pr oject ions
3to 2030
M i l l ion c ubi c feet
Project ion s3
1 255 1 1 12
In cludes r oundwood har vested fr om gr ow ing stock and other sour ces such as salvable dead nees; rough and rotten trees; and trees on forest lan d other thantimber land , in fence r ows, and in u rban ar eas.
3 Includes r em ovals in the form of r oundwood products, logg ing r esidues, the volumes of t im ber r emoved in _cu l tur al oper at ions such as noncomm er c ial
th inn ing , and inventory losses r esu l t ing fr om the d iver sion of t imber lan d to other u ses such as cr op lan d , pastu rel and , parks, and u rban uses.
3Al l projections at equ il ibr ium pri ces, i .e . , the stumpage pr ices at wh ich pr ojected tim ber dem ands and suppl ies ar e equal (see append ix tab le Data
ar e aver ages for 5 year s cen tered on the project ion year .
Data for 1952 and 1962 ar e as of Decem ber 3 1 . Data for 1970 and al l project ion year s ar e as of January 1 . Data for 1976 and 1984 ar e as of Jan uary 11977 , and January 1 , 1985 .
Note: Data m ay not add to totals because of round ing .
390

T ab le — Softwood r oundwood suppl ies,‘t imber rem ovals,
3net annual grow th , and inven tory of softwood grow ing stock in Arkansas,
by forest m anagemen t type , se lected year s 1952—84 , w ith pr oject ions
3to 2030
Mi l l ion cub ic feet
Pr ojections3
Forest managem en t
type and item
15

T ab le 3 .3% Softwood r oundwood suppl ies,‘t im ber r em ovals,
3net ann ual gr ow th , and inven tory of softwood gr ow ing stock in Flor ida ,
by for est m an agem en t type , selected year s 1952—84 , w ith pr oject ions
3to 2030
M i l l ion cub icfeet
Pr ojection s-
3
1 047
Inc ludes roundwood har vested from gr ow ing stock and other sou r ces such as salvable dead tr ees; r ough and r otten tr ees; and tr ees on for est 1
than t im ber lan d , in fence r ow s, and in u rban areas.
3 Inc ludes r em ovals in the form of r oundwood pr oducts, logg ing residues, the volumes of timber r em oved in cu l tu r al oper at ions such as monco
th inn ing ; and inven tory losses r esu lt ing fr om the d iver sion of t im ber land to other uses such as cropland , pastu relan d , par ks, and u rban uses.
3Al l pr oject ions at equ i l ibr ium pr ices, i .e . , the stumpage pr ices at wh ich pr ojected timber dem ands and suppl ies ar e equ al (see append ix table
ar e aver ages for 5 year s cen ter ed on the projection year .
Data for 1952 and 1962 ar e as of December 3 1 . Data for 1970 and a l l project ion year s ar e as of January 1 . Data for 1976 an d 1984 ar e as of January1977 , and Januar y 1 , 1985 .
Note: Data m ay not add to totals because of round ing .
392

T ab le — Softwood r ou ndwood suppl ies,‘ t im ber r em oval s,3 _net an nual grow th , and inven tory of softwood gr ow ing stock i n Lou isian a ,
by for est m anagemen t type , selected year s 1952—84 ,
w ith pr oject ions3to 2030
M i l l ion cub ic feet
Pr ojections3
Includes r oundwood harvested fr om gr ow ing stock and other sour ces such as salvable dead tr ees; r ough and r otten trees; and tr ees on forest land otherthan t im ber land , in fence r ows, and in urban ar eas.
3 Includes rem oval s in the form of r oundwood produ cts, logg ing r esidues, the volumes of timber r em oved in cu l tur al oper ations such as noncomm erc ialthin n ing ; and inven tory losses resu l ting fr om the d iversion of timber l and to other u ses such as cr opland , pastu reland , par ks, and ur ban uses.
3Al l pr ojections at equ il ibri um pr ices, i .e . , the stumpage pr ices at whi ch pr ojected tim ber dem ands and suppli es ar e equal (see append ix table Data
are aver ages for 5 year s cen tered on the pr ojection year .
Data for 1952 an d 1962 are as of Decem ber 3 1 . Data for 1970 and al l pr oject ion year s ar e as of January 1 . Data for 1976 an d 1984 ar e as of January 1 ,1977 , and January 1 , 1985 .
Note: Data may not add to total s because of r ound ing .
394

T ab le —Softwood roundwood suppl ies,‘t imber r em oval s,
2net ann ual grow th , and inventory of softwood gr ow ing stock in Mississipp i ,
by forest m anagem en t type, selected year s 1952—84, w ith project ions
3to 2030
M i l l ion cubi c feet
Projections3
Includes roundwood harvested from grow ing stock and other sou rces such as salvable dead tr ees; r ough and r otten tr ees; and tr ees on forest land other thantimber land , in fence r ows, and in urban areas.
3 Inc ludes r em ovals in the form of roundwood pr oducts, logging r esidues, the volumes of timber r em oved in cu l tur al oper at ions such as'
noncomm erc ia lth inn ing , and inven tory losses resu l t ing fr om the d iver sion of t im ber land to other uses such as cropland , pastu r eland , parks, and u rban u ses.
3Al l pr oject ions at equ i l ibr i um pr ices, i .e . , the stumpage pr ices at wh ich projected timber dem ands and suppl ies ar e equa l (see append ix tab le Data
are aver ages for 5 year s cen tered on the projection year .
Data for 1952 and 1962 ar e as of December 3 1 . Data for 1970 and a l l pr ojection year s ar e as of Jan u ary 1 . Data for 1976 and 1984 ar e as of Jan uary'
l ,
1977 , and Januar y 1 , 1985 .
Note: Data m ay not add to totals because of r ound ing .
395

Tab le — Softwood r ou ndw ood suppl ies,‘t im ber r em oval s,
3net annual gr ow th , and inven tory of softw ood gr ow in g stock in Nor th
Car o l ina , by for est m a nagem en t type , selected year s 1952—84 , w ith pr oject ions
3to 2030
M i l l ion cub i c feet
Pr ojection s3
a
Inc ludes r oundwood har vested fr om grow ing stock and other sour ces“
such as salvable dead tr ees; r ough and rotten tr ees; an d trees on forest lan d other
than tirnber land , in fen ce rows, and in u rban ar eas.
3 Inc ludes r em oval s in the form of r oundwood products, logg ing residues, the volum es of t im ber rem oved in cu ltu r al Oper ations such as noncomm er c ialth inn ing , and inven tory losses resu l t ing fr om the d iver sion of tim ber land to other uses such as cr oplan d , pastu relan d , par ks, an d u rban uses.
3Al l pr oject ions at equ il ibri um pr ices, i .e . , the stumpage pr ices at wh ich pr ojected tim ber dem ands and supp l ies ar e equ al (see append ixtable Data
are aver ages for 5 y ear s center ed on the pr oject ion year .
Data for 1952 and 1962 ar e as of Decem ber 3 1 . Data for 1970 and al l project ion year s ar e as of Jan uary 1 . Data for 1976 and 1984 are as of Jan uar y 11977 , and Jan uary 1 , 1985 .
Note: Data m ay not add to tota ls because of round ing .
396

T ab le — Softw ood r oundwood suppl ies,‘t im ber r em ovals,
2net an nu al gr ow th , and inven tory of softwood gr ow ing stock in Sou th
Car o l ina , by for est m anagem en t type , selected year s 1952—84 ,
w ith pr oject ion s3to 2030
M i l l ion cub ic feet
Project ions3
Includes roundwood harvested fr om gr ow ing stock an d other sour ces such as salvab le dead tr ees; r ough and rotten tr ees; an d tr ees on for est land other
than t im ber land , in fence r ows, and in u rban ar eas.
3Includes rem oval s in th e form of roundwood pr oducts, logging
'
fesi dues, the volum es of timber r em oved in cu l tu r al oper ations such as noncomm er cialth inni ng, an d inventory losses r esu l t ing fr om the d iver sion of tim ber lan d to other uses such as cropland , pastu r elan d , parks, an d ur ban uses.
3Al l pr oject ion s at equ il ibr iumpr ices, i .e . , the stumpage pr ices at whi ch pr ojected timber dem an ds an d suppl ies ar e equ al (see append ix tab le Data
ar e aver ages for 5 year s center ed on the projection year .
Data for 1952 and 1962 ar e as of December 3 1 . Data for 1970 an d al l projec tion year s ar e as of Janu ar y 1 . Data for 1976 and 1984 ar e as of Januar y 1 ,1977 , and January 1 , 1985 .
Note: Data m ay not add to totals becau se of r ound ing .
398

T able —Softwood r oundwood suppl ies,‘timber r em ovals,3 net annual gr owth , and inven tory of softwood grow ing stock i n T ennessee , byforest m anagemen t type , selected year s 1952
—84, w ith pr oject ions3to 2030
M i l l ion cub ic feet
Project ion s3
Inc ludes roundwood harvested fr om grow ing stock and other sou r ces such as salvable dead tr ees; r ough and rotten trees; and tr ees on forest land other
than t imber land , in fence rows, and in u r ban ar eas.
3 “Inc ludes rem ovals in the form of roundwood products, logging r esidu es, the vo lum es of timber r emoved in cu l tu r al oper at ions such as noncomm er c ialth inn ing , and inven tory losses resu l t ing fr om the d iver sion of t imber land to other uses such as cr opland , pastu reland , parks, and u rban u ses.
3Al l pr oject ions at equ il ibr ium pri ces, i .e . , the stumpage pr ices at wh ich projected timber dem ands and suppl ies ar e equ al (see append ix table Data
ar e aver ages for 5 year s cen tered on the pr ojection year .
Data for 1952 and 1962 ar e as of December 3 1 . Data for 1970 and al l pr ojection year s ar e as of Janu ary 1 . Data for 1976 and 1984 ar e as of Janu ar y 1 ,1977 , and January 1 , 1985 .
Note: Data m ay not add to tota ls becau se of round ing .
399

T ab le —Softwood r oundwood suppl ies,‘t im ber rem oval s,
3
_
net an nual gr ow th , an d inven tory of softwood gr ow ing stock in T exas, byforest m anagem en t type , selected year s 1952
- 84 , w ith pr oject ions3to 2030
M i l l ion cub ic feet
Pr oject ion s3
Inc ludes roundwood harvested from grow ing stock and other sour ces such as salvab le dead tr ees; r ough and r otten tr ees; an d trees on forest l an d other than
t imber land , in fence r ows, and in u r ban areas.
3 Inc ludes r em ovals in the form of r oundwood pr oducts, logging r esidues, the volumes of t im ber r emoved i n cu l tur al oper at ions such as noncomm er c ialth inn ing , and inven tory losses r esu l t ing from the d iver sion of timber land to other uses such as cr op land , pastureland , parks, _
and u rban uses.
3Al l projections at equ i l ibr ium pri ces, i .e . , the stumpage pr ices at wh ich projected t im ber dem ands and supp l ies ar e equal (see appendix tab le Data
are aver ages for 5'
year s cen tered on the project ion year .
Data for 1952 and 1962 are as of Decem ber 3 1 . Data for 1970 and al l project ion year s ar e as of Jan uary 1 . Data for 1976 and 1984 are as of Janu ary 1 ,1977 , and January 1 , 1985 .
Note: Data m ay not add to total s because of r ound ing .
400

T ab le — H ardwood r ou ndwood suppl ies,‘t im ber r em ovals,
3net an nual gr ow th , and inven tory of har dwood gr ow ing stock in the
Sou theast r eg ion , by ow ner sh ip , selected year s 1952- 84 ,
w ith project ions3to 2030
Mi l l ion cub ic feet
Pr oject ions3
tim ber land , in fence r ows, an d in ur ban ar eas.
3 Inc ludes r emovals in the form of roundwood pr oducts, logg ing residues, the vo lumes of t im ber r em oved in cu l tur al
th inn ing , and inven tory losses r esu l t ing fr om the d iver sion of t im ber land to other u ses such as cr opland , pastur eland , parks, and u rban uses.
3Al l projections at equ i l ibri um pr ices, i .e . , the stumpage pri ces at wh ich pr ojected t im ber dem an ds and supp li es ar e equal (see append ix table 4.
are aver ages for 5 year s cen ter ed on the pr oject ion year .
Data from 1952 an d 1962 ar e as of December 3 1 . Data for 1970 an d al l pr ojection year s are as of January 1 . Data for 1976 and 1984 are as of
1 , 1977 , and Janu ary 1 , 1985 .
3 Inc ludes lands under long - term lease fr om other pr ivate owner s.
6Data for these and other pr ivate ow ner sh ips ar e not availab le for the year s 1952 , 1962 , and 1970 .
Note: Data m ay not add to totals because of round ing .
402

T able —H ar dwood roundwood suppl ies,‘t im ber r em ovals,
3net
'
ann ual gr ow th , and inven tory of hardw ood grow ing stock in the Sou thCentr al r eg ion , by owner sh ip , selected year s 1952
—84 ,w ith pr oject ions
3to 2030
Mi l l ion cub ic feet
Pr ojections3
Owner sh ip and item 2020
Nation a l for estRoundwood suppl ies
‘
T im ber removals3
Net ann ual gr ow thInven tory“Other pu b l icRoundwood suppl ies
‘
T im ber rem ovals3
Net annua l gr ow thInven tory“For est i n du str y
3
Roundwood suppl ies‘
T im ber r em ovals3
Net annual gr ow thInven tory“Other p r ivate
Farmer
Roundwood suppl ies‘T im ber rem ovals3Net annual growthInven tory“
Corpor ateRoundwood suppl ies‘T imber r em ovals2
Net an nual growthInven tory“Other indiv idualRoundwood suppl ies
‘
T imber rem ova ls3
Net annual grow thInven tory“T ota l other p r ivateRoundwood su
-
ppl ies‘
T im ber rem ovals3
Net annual growthInventory“Al l owner sh ipsRoundwood suppl ies
‘
T imber r em ovals2
Net annual gr owthInven tory“ 43 ,630 49 ,808
Includes roundwood harvested from grow ing stock and other sou r ces such as salvab le dead tr ees; rough and rotten trees; and tr ees on for est land other than
tim ber land , in fence r ows, and in u rban ar eas.
3 Inc ludes rem ovals in the form of r oundwood products, logg ing r esidues, the vo lumes of timber rem oved in cu l tu r al Oper at ions su ch as non comm er c ialth inn ing , and inven tory losses r esu l ting from the d iver sion of tim ber land to o ther uses such as cr op land , pastu reland , parks, an d u r ban uses.
3A l l project ions at equ il ibr ium pr ices, i .e . , the stum page pr ices at wh ich pr ojected timber demands and supp l ies are equ al (see append ix tab le Data
are aver ages for 5 years cen tered on the project ion year .
Data from 1952 and 1962 ar e as of Decem ber 3 1 . Data for 1970 and al l pr oject ion year s ar e as of Januar y 1 . Data for 1976 and 1984 ar e as of Jan uary1 , 1977 , and January 1 , 1985 .
3 Inc ludes lands u nder long- term lease fr om other pr ivate ow ner s.
6Data for these and other pr ivate owner sh ips are not ava ilable for the year s 1952 , 1962 , and 1970 .
Note: Data m ay not add to totals becau se of r ound ing .
403

T ab le — H ar dwood rou ndwood suppl ies,‘t im ber r em oval s,
3net ann ual gr ow th , and inven tory of har dwood gr ow ing stock in
A labam a , by ow ner sh ip , selected year s 1952—84 ,
w ith pr oject ions3to 2030
M i l l ion cub ic feet
Pr oject ions3
timber land , in fence r ows, and in ur ban ar eas.
3 Inc ludes r em ovals in the form of-
r oundwood pr oducts, logging r esidues, the vo lum es of t im ber r emoved in cu l tu r al oper at ions such as nonco
th inn ing , and inven tory losses resu l t ing fr om the d iver sion of t im ber l and to other uses such as crop land , pastu r eland , par ks, and u r ban u ses.
3Al l projections at equ i l ibri um pr ices, i .e . , the stumpage pr ices at wh ich pr ojected timber dem an ds and supp l ies ar e equal (see append ix table 4 .
are aver ages for 5 year s cen tered on the pr ojection year .
Data fr om 1952 and 1962 ar e as of Decem ber 3 1 . Data for 1970 an d a l l project ion year s ar e as of Jan uar y 1 . Data for 1976 and 1984 are as of
1 , 1977 , and Jan uar y 1 , 1985 .
3 Inc ludes lands under long - term lease fr om other pr ivate owner s.
6Data for these and other pr ivate ow ner sh ips ar e not avai lable for the year s 1952 , 1962 , and 1970 .
Note: Data m ay not add to totals because of r ound ing .
404
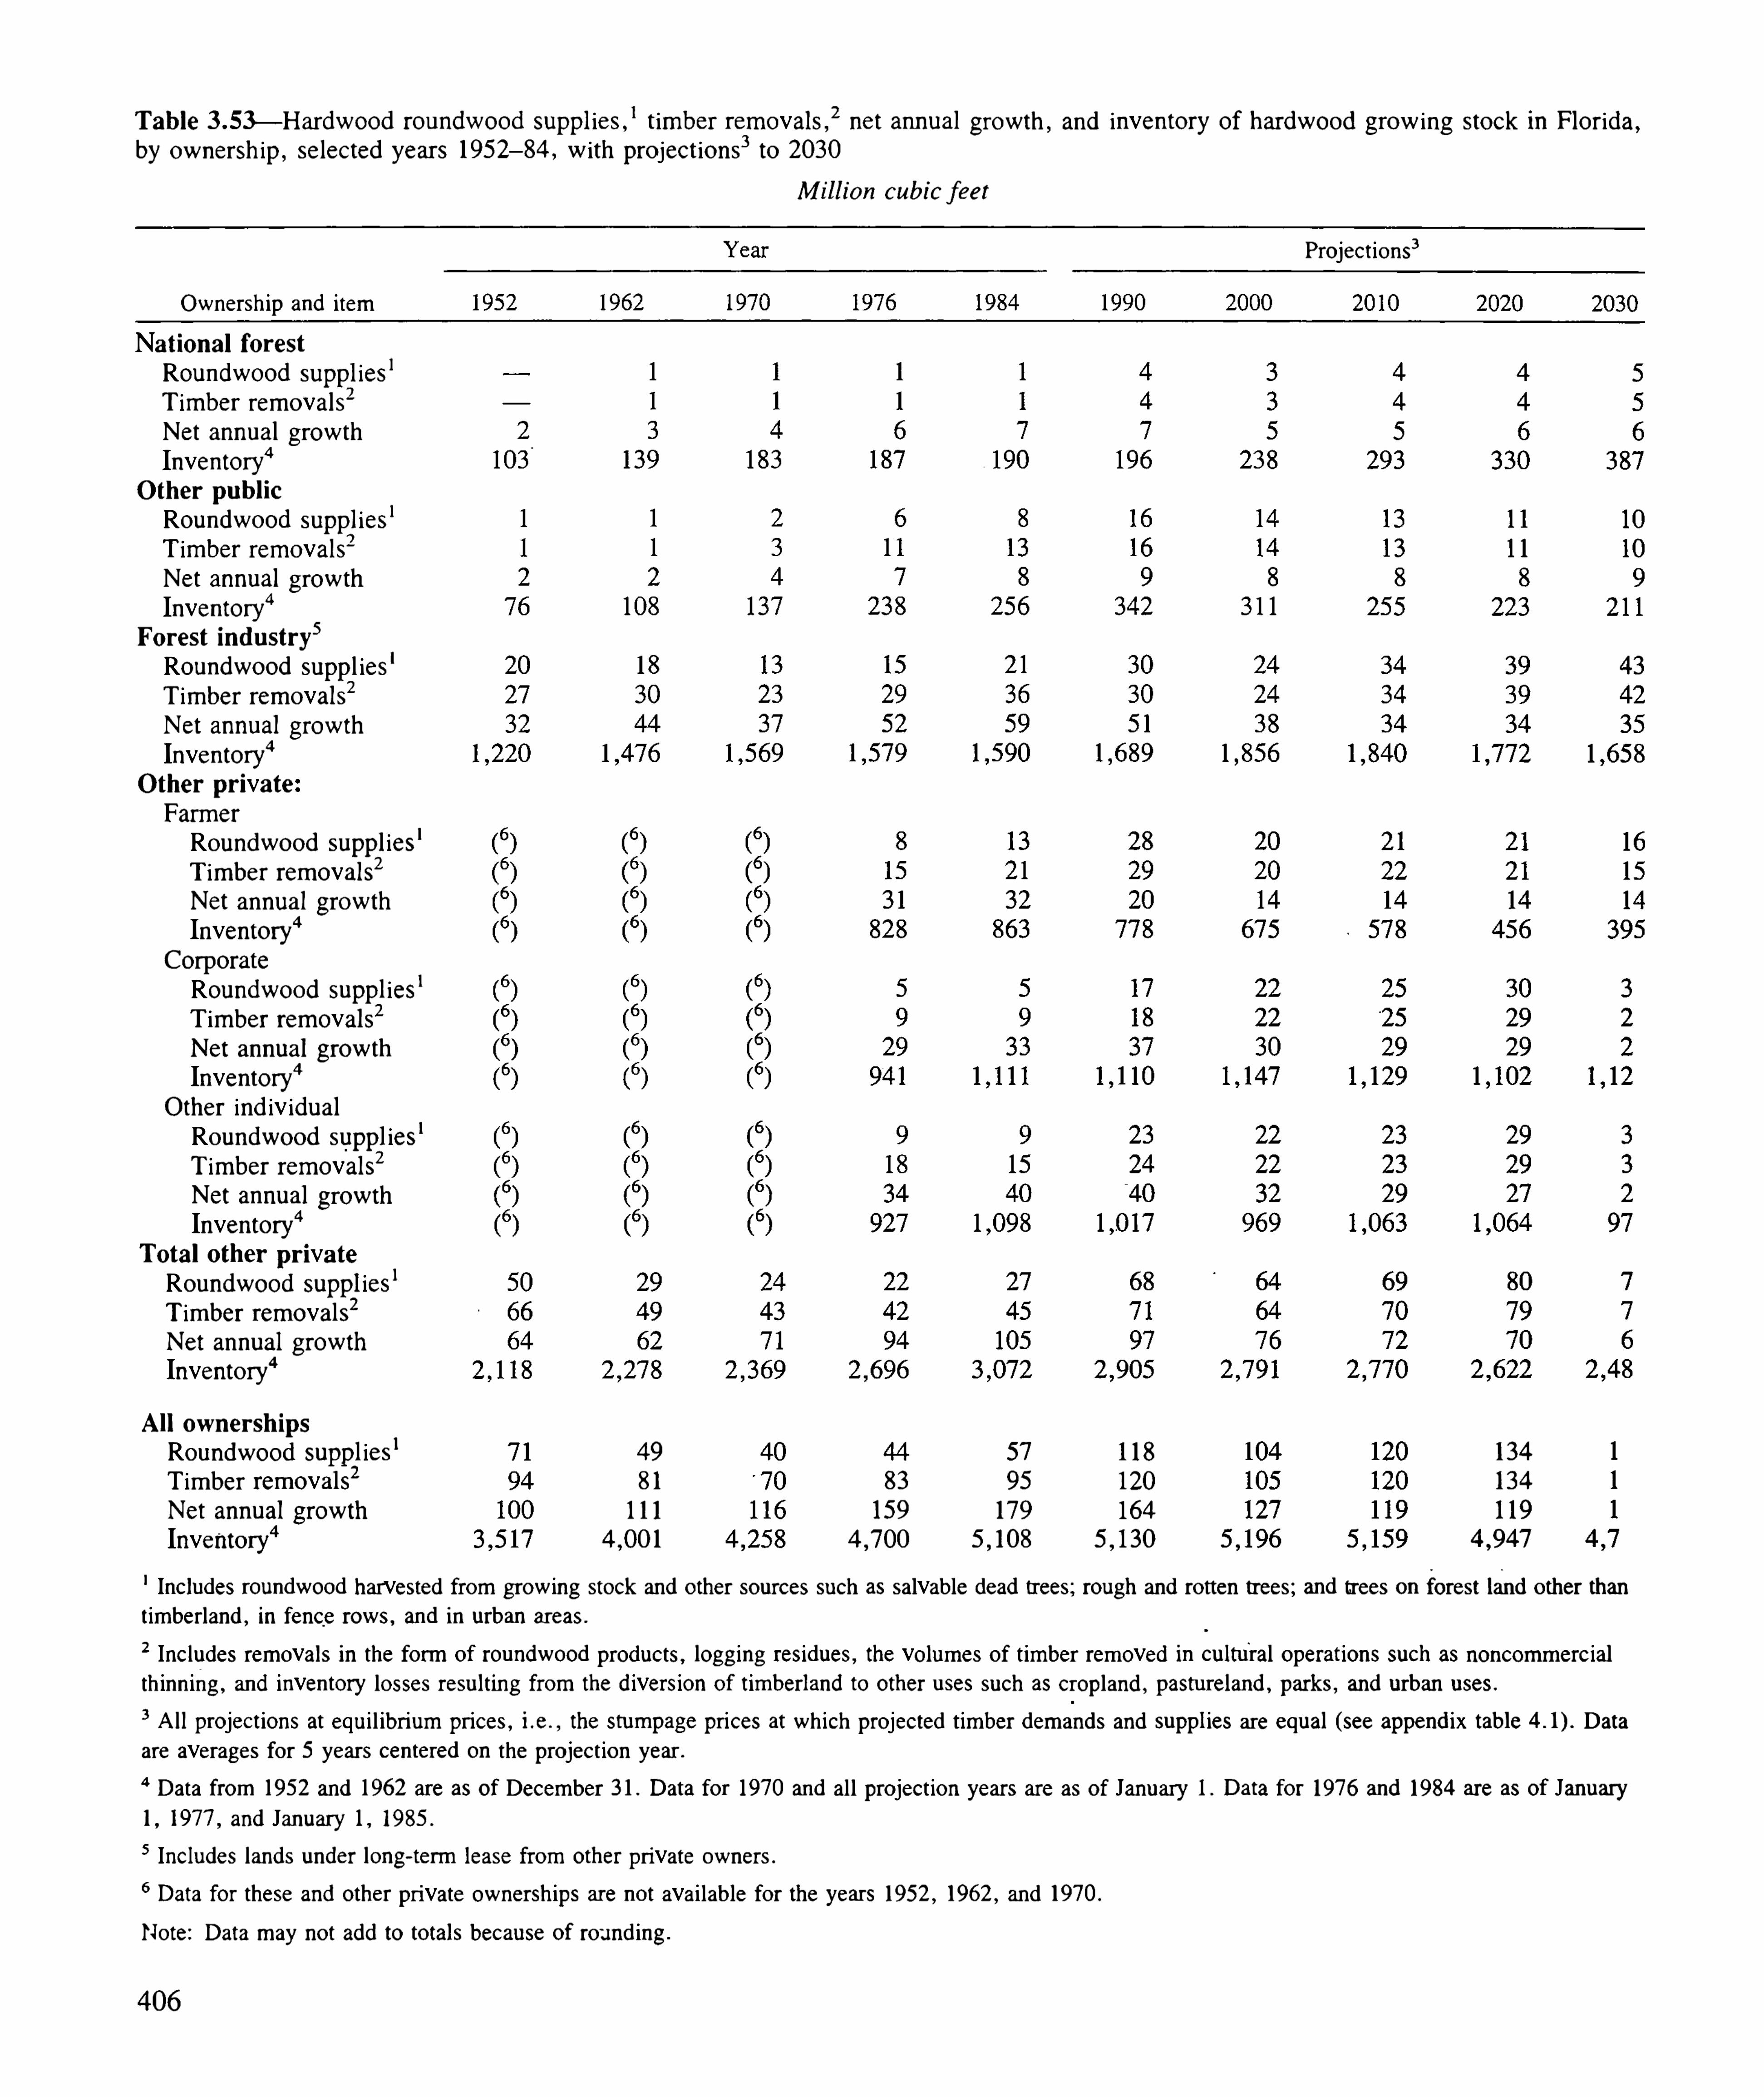
T ab le 3 5 3— H ar dwood r oundw ood suppl ies,‘t im ber r em ovals,
3net ann ual gr ow th , and inven tory of har dwood gr ow ing stock in Flor ida ,
by ow ner sh ip , selected year s 1952—84 ,
w ith pr oject ion s3to 2030
Mi l l ion cub i c feet
Project ions3
Owner sh ip and item
Nat ion a l fo r estRoundwood suppl ies
‘
T imber r em ovals3
Net ann ual grow thInven tory“Other pu bl icRoundwood suppl ies
‘
T im ber r em ovals3
Net annual grow thInven tory“For est in du str y
3
Roundwood suppl ies‘
T im ber r em ovals3
Net annual grow thInven tory“Other p r ivateFarm er
Roundwood suppl ies‘
T im ber r em ovals3
Net annua l gr ow thInven tory“Corpor ateRoundwood suppl ies
‘
T im ber r em oval s2
Net annual grow thInven tory“Other ind iv idu alRoundwood suppl ies
‘
T im ber r em ovals3
Net annual grow thInven tory“T ota l other p r iva teRoundwood supp l ies‘T im ber r em ovals3
Net annual grow thInven tory“Al l own er sh ipsRoundwood supp l ies
‘49 57 1 18 134
T im ber r em ovals3 81 83 95 120 134
Net annual gr ow th 1 1 1 159 179 164 1 19
Invento ry“Includes roundwood harvested fr om gr ow ing stock an d other sour ces such as salvab le dead tr ees; rough and r otten tr ees; and trees on for est land other than
tim ber land , in fence rows, and in u rban areas.
3 Inc ludes r em ova ls in the form of rou ndwood products, logg ing residues, the volumes of tim ber r em oved in cu l tural oper at ions such as noncomm er c ialth inn ing , and inven tory losses r esu l ting fr om the d iver sion of t im ber land to other uses such as cr opland , pastu reland , par ks, and u rban uses.
3Al l project ions at equ i l ibr ium pr ices, i .e .
, the stumpage pr ices at wh ich projected t im ber dem ands and suppl ies ar e equal (see append ix tab le Data
are aver ages for 5 year s cen tered on the pr ojection year .
Data from 1952 and 1962 ar e as of Decem ber 3 1 . Data for 1970 and al l pr oject ion year s are as of Jan uary 1 . Data for 1976 and 1984 ar e as of Jan uar y1 , 1977 , and January 1 , 1985 .
3 Includes lands under long- term lease fr om other pri vate owner s.
6Data for these and other pri vate owner sh ips ar e not avai lab le for the year s 1952 , 1962 , and 1970 .
Note: Data m ay not add to totals because of r ound ing .
406

T able —H ar dwood r oundwood suppl ies,‘t imber r em ovals,
3net annual gr ow th , and inven tory of hardwood gr ow ing stock in Georg ia ,
by owner sh ip , selected year s 1952—84 , w ith project ions
3to 2030
Mi l l ion cubi c feet
Project ions3
Owner sh ip and item 1970
Nat ion a l for estRoundwood suppl ies
‘
T im ber r emovals3
Net annual gr ow thInventory“Other pu b l icRoundwood suppl ies‘T im ber r em ovals3
Net annual growthInven tory“For
'
est in du str y3
Roundwood suppl ies‘T im ber rem ovals2
Net annual grow thInventory“Other p r ivate
Farmer
Roundwood suppl ies‘T im ber r emovals3Net annual growthInventory“
Corpor ateRoundwood suppl ies‘T imber rem ovals2
Net annual gr ow thInven tory“Other ind ividua lRoundwood suppl ies‘T imber r emovals3
Net annual growthInven tory“T ota l other p r ivateRoundwood suppl ies‘T imber removals3
Net annual gr ow thInventory“Al l owner sh ipsRoundwood suppl ies
‘179 156 2 1 1 399 506 496
T im ber rem ova ls3 294 258 3 15 407 505 49 1
Net annual gr owth 352 493 577 541 438“
443
Inven tory“Includes roundwood harvested fr om gr ow ing stock and other sources such as salvable dead trees; rough and rotten trees; and tr ees on for est land other than
timber land , in fence r ows, and in urban ar eas.
3 Inc ludes rem ova ls in the form of roundwood products, logg ing r esidues, the volum es of timber rem oved in cu l tu r al Oper at ions such as noncomm er c ialth inn ing , and inven tory losses r esu l t ing fr om the d iver sion of timber land to other uses such as cropland , pastu r eland , parks, and u rban uses.
3Al l projections at equ il ibr ium pr ices, i .e . , the stumpage pr ices at wh ich projected t im ber dem ands and suppl ies are equ al (see append ix table Data
are averages for 5 year s cen tered on the projection year .
Data from 1952 and 1962 ar e as of Decem ber 3 1 . Data for 1970 and al l project ion year s ar e as of Jan uary 1 . Data for 1976 and 1984 are as of January1 , 1977 , and January 1 , 1985 .
3 Includes lands under long - term lease from other pr ivate ow ner s.
6Data for these and other pr ivate owner sh ips are not avai lab le for the year s 1952 ,
1962 , and 1970 .
Note: Data m ay not add to totals because of r ound ing .
407
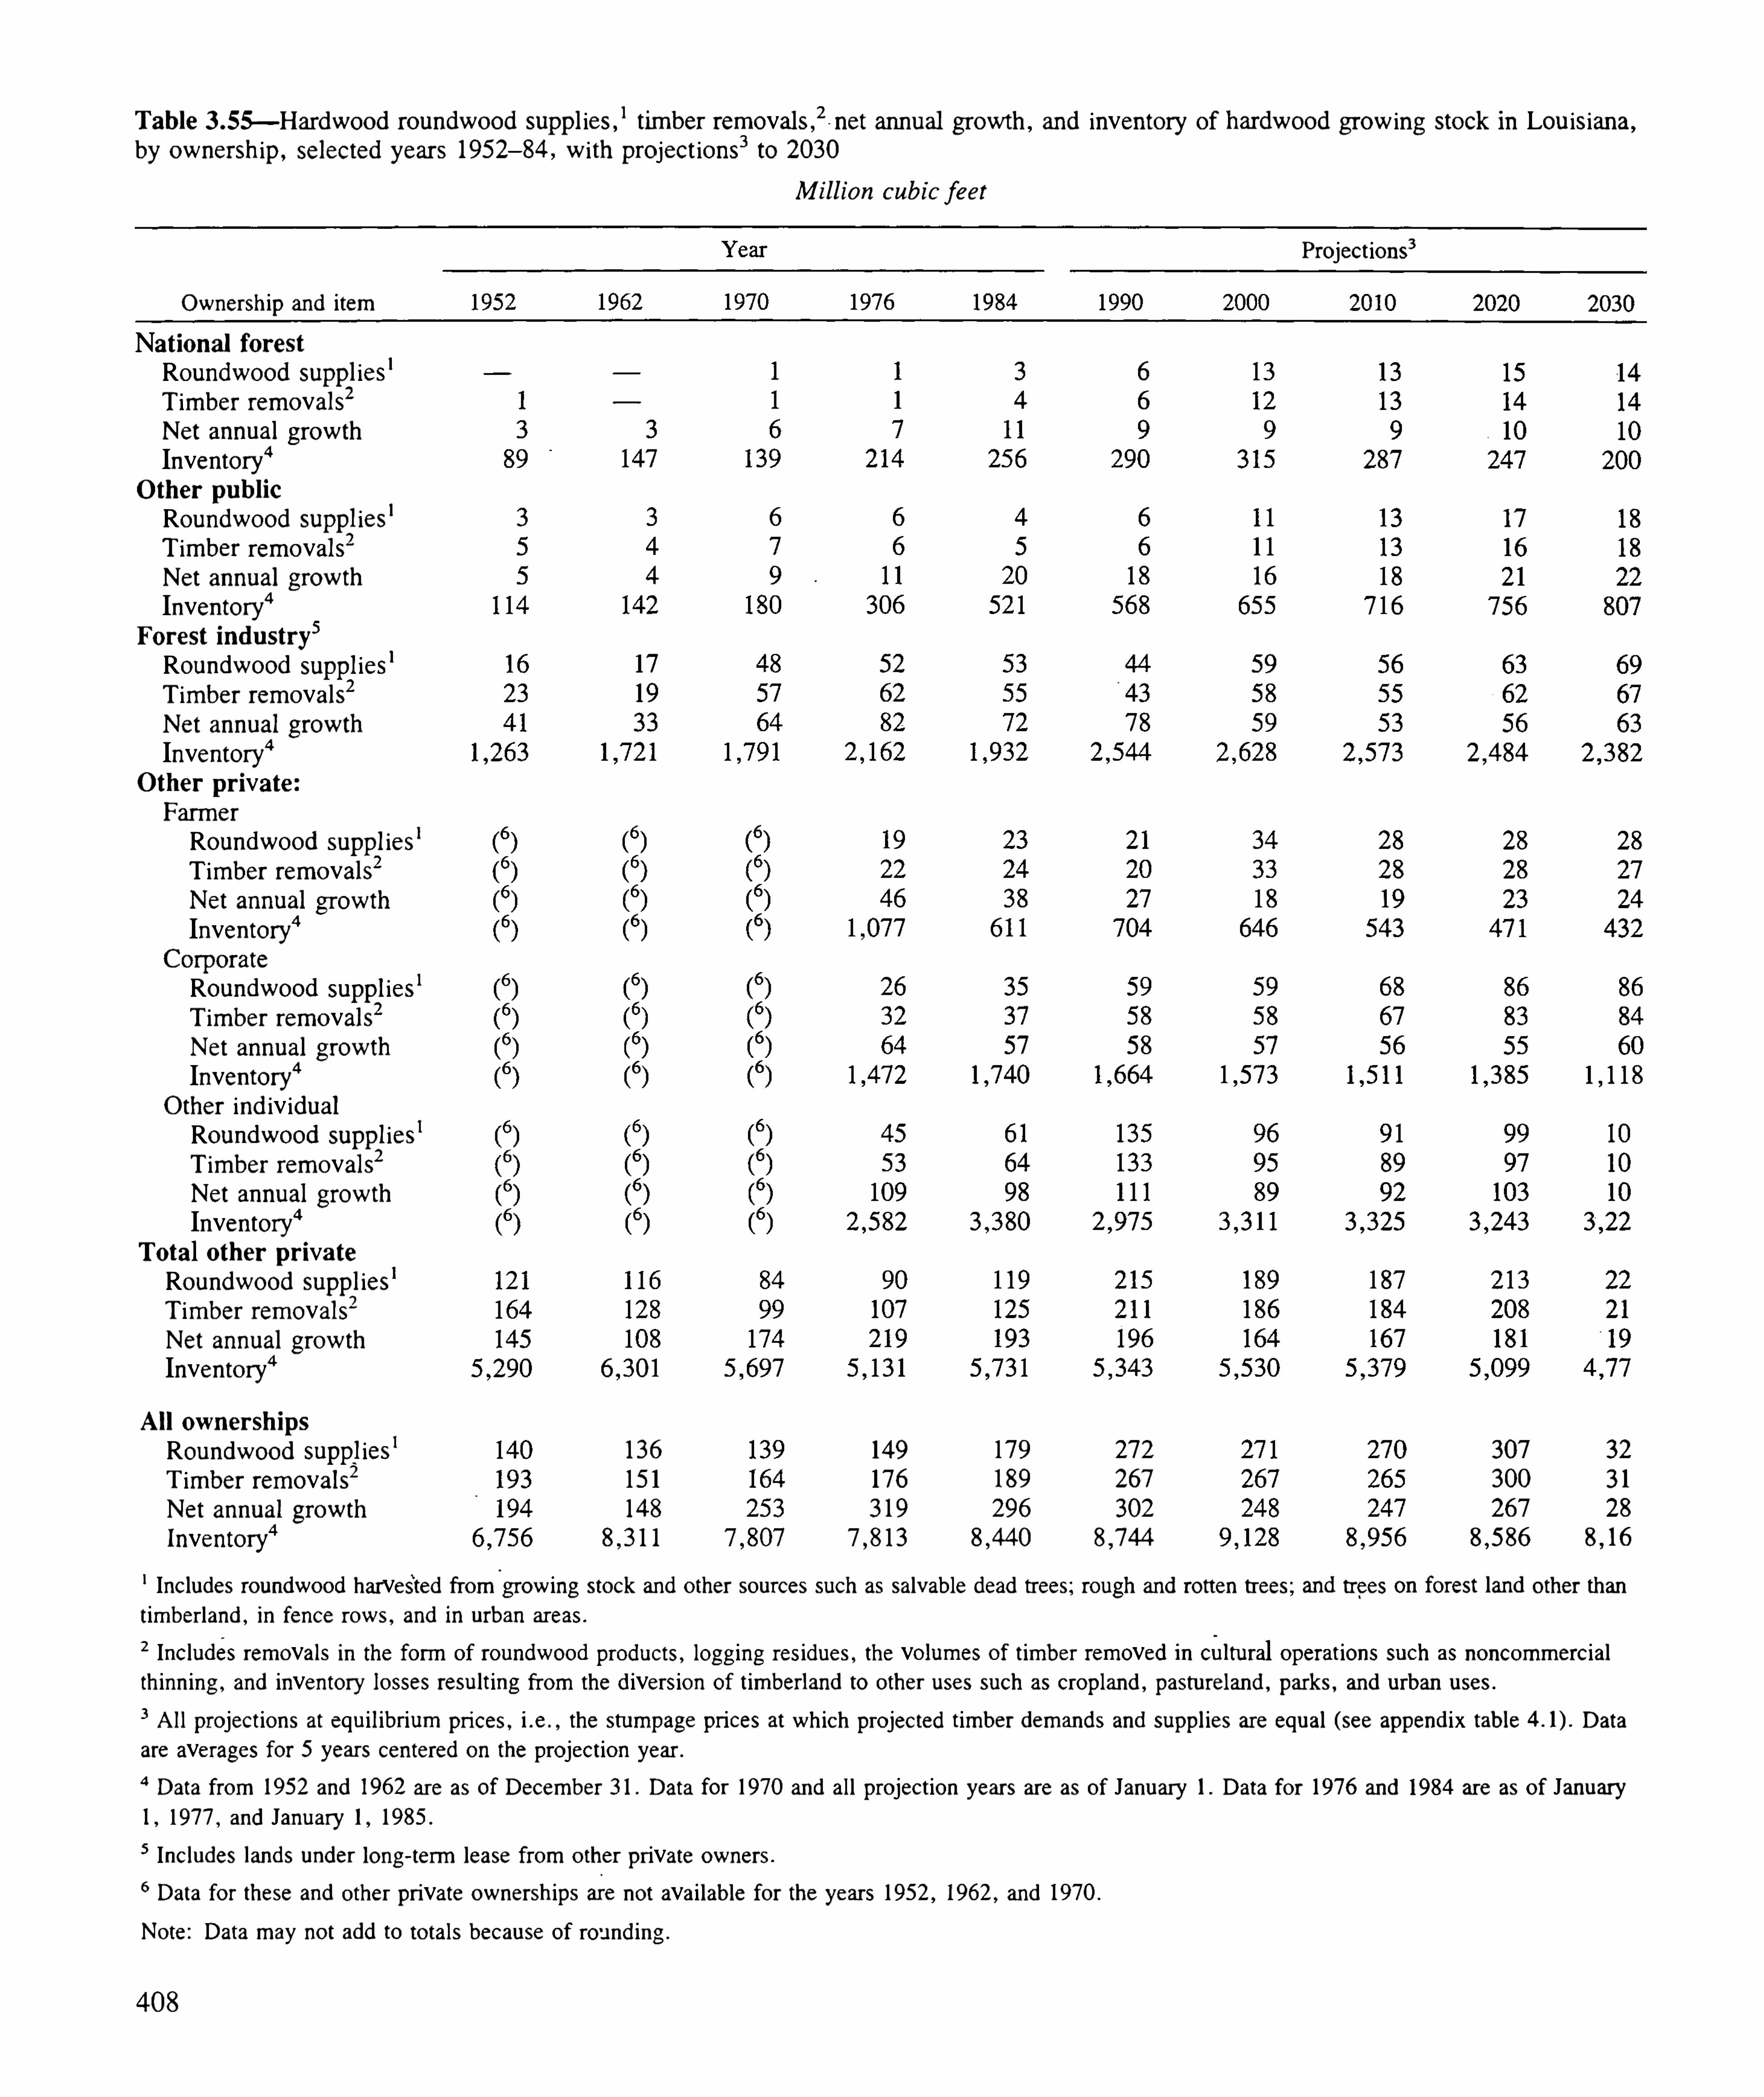
T ab le —H ar dwood roundwood suppl ies,‘timber rem ovals,
3- net ann ual growth , an d inven tory of har dwood gr ow ing stock in Lou isiana ,
by ow ner sh ip , selected year s 1952—84 ,
w ith pr oject ions3to 2030
Mi l l ion cub ic feet
Owner sh ip and item
Nat ion al for estRoundwood suppl ies
‘
T im ber r em ovals3
Net annual grow thInven tory“Other pu b l icRoundwood suppl ies
‘
T imber r em oval s3
Net annual gr ow thInven tory“For est i n du str y
3
Roundwood suppl ies‘
T im ber r em ovals3
Net annual gr ow thInven tory“Other p r ivateFarm er
Roundwood supp l ies‘
T imber r em ovals3
Net annual gr ow thInven tory“Corpor ateRoundwood suppl ies
‘
T im ber r em ovals3
Net annual grow thInven tory“Other ind ividualRoundwood suppl ies
‘
T im ber r em ovals3
Net annual gr ow thInven tory“T ota l other p r iva teRoundwood suppl ies
‘
T imber r em ovals3
Net annual gr ow thInven tory“Al l own er sh ipsRou ndw ood suppl ies
‘
T imber rem ovals2
Net annual gr ow th
Inven tory“
136 149
15 1 176
148 3 19
Project ions3
179 272 307 32
189 267 300 3 1
296 302 267 28
Inc ludes r oundwood harvested from gr ow ing stock and other sour ces such as salvable dead trees; r ough and rotten trees; and trees on forest land other than
tim ber land , in fence r ow s, and in u r ban ar eas.
3 Inc ludes r emovals in the form of r oundwood pr oducts, logging r esidues, the vo lum es of t imber rem oved in cu l tu r al Oper at ions such as noncomm er c ialth inn ing , and inven tory losses resu l t ing fr om the d iver sion of t im ber land to other uses such as cr opland , pastu r el and , parks, and u rban u ses.
3Al l pr oject ions at equ i l ibr ium pri ces, i .e . , the stumpage pr ices at w h ich pr ojected t imber dem ands and suppl ies ar e equ al (see append ix table Data
are averages for 5 year s cen ter ed on the projection year .
Data fr om 1952 and 1962 ar e as of Decem ber 3 1 . Data for 1970 an d a l l pr oject ion year s ar e as of Janu ary 1 . Data for 1976 and 1984 ar e as of Januar y1 , 1977 , and January 1 , 1985 .
3 Inc ludes lands under long - term lease fr om o ther pr ivate owner s.
6Data for these and other pri vate ow ner sh ips are not avai lab le for the year s 1952 , 1962 , and 1970 .
Note: Data m ay not add to tota ls because of round ing .
408

T ab le — H ardwood r ou ndwood suppl ies,‘t im ber r em oval s,
2net ann u a l gr ow th , and inven to r y of hardwood g r ow ing stock inNor th Car o l ina , by ow ner sh ip , selected year s 1952
—84 ,w ith project ions
3to 2030
Ow nersh ip and item
Nat ion a l for estRoundwood suppl ies
‘
T imber removals3
Net annual grow thInventory“Other pub l icRoundwood suppl ies
‘
T im ber rem ovals2
Net annual gr ow thInven tory“For est indu str y
3
Roundwood suppl ies‘
T im ber r em ovals3
Net annual gr ow thInven tory“Other p r ivateFarm er
Roundwood suppl ies‘T im ber r em ovals2
Net annual gr ow thInven tory4Corpor ateRoundwood suppl ies
‘
T im ber rem ovals3
Net annual grow thInven tory“Other ind ividualRoundwood suppl ies‘T imber r em ovals2
Net an nual grow thInven tory“T ota l other p r iva teRoundwood suppl ies‘T imber r em ovals3
Net annual grow thInven tory“Al l own er sh ipsRoundwood suppl ies
‘
T im ber r emovals3
Net annual grow thInven tory“
Mi l l ion cub i c feet
Projections3
198 166 185 330 430 559
262 274 253 350 439 557
357 425 624 627 573 487
549
543
494
Inc ludes roundwood harvested fr om gr ow ing stock and other sources such as salvable dead tr ees; rough and r otten tr ees; and trees on forest land other thant im ber land , in fence r ows, and in u rban ar eas.
3 Inc ludesr em ovals in the form of roundwood pr oducts, logging residues, the volum es of t imber rem oved in cu ltural operat ions such as noncomm er c ialth inn ing , an d inven tory losses resu l ting fr om the d iver sion of t imber lan d to other uses such as cropland , pastur eland , parks, and urban uses.
3Al l project ions at equ i l ibr ium pri ces, i .e . , the stumpage pr ices at wh ich projected timber demands and suppl ies ar e equal (see append ix tab le Data
are averages for 5 year s centered on the pr ojection year .
Data fr om 1952 and 1962 ar e as of Decem ber 3 1 . Data for 1970 an d al l pr ojection year s ar e as of Januar y 1 . Data for 1976 and 1984 ar e as of JanuaryI , 1977 , and January 1 , 1985 .
3 Inc ludes lands under long - term lease fr om other pr ivate owner s.
6Data for these and other pr ivate owner sh ips are not available for the year s 1952 , 1962 , and 1970 .
Note: Data m ay not add to totals because of round ing .
410

T ab le 35 8— H ar dwood roundwood suppl ies,‘tim ber r emovals,
3net ann ual gr owth , and inventory of har dwood grow ing stock in Okl ahom a ,
by owner sh ip , selected year s 1952—84 , w ith pr oject ions3to 2030
Mi l l ion cub i c feet
Project ions3
Ownersh ip and item
Na t ion al for estRoundwood suppl ies‘T im ber r emovals3
Net ann'
ual gr ow thInventory“Other publ i cRoundwood suppl ies‘T imber rem ovals2
Net annual gr ow thInventory“For est in du st r y
3
Roundwood suppl ies‘
T im ber r em ova ls2
Net annual grow thInven tory“Other p r ivate
Farmer
Roundwood suppl ies‘T im ber r emovals2Net annual gr owthInven tory“
Corpor ate
Roundwood suppl ies‘
T imber rem ovals2
Net annual gr ow thInventory“Other ind iv idualRoundwood suppl ies‘T imber r em ovals3
Net annual growthInven tory“T ota l other p r iva teRoundwood suppl ies
‘
T im ber r em ovals3
Net annua l grow thInven tory“Al l own ersh ipsRoundwood suppl ies‘ 17 15 27 40 44 48
T im ber r em ovals3 18 18 30 39 43 47
Net annual gr ow th 44 61 39 38 3 1 3 1
Inven tory“ 827 1 ,052 898
Includes roundwood harvested fr om grow ing stock and other sour ces such as salvab le dead trees; rough and rotten trees; and tr ees on forest land other thantimber land , in fence r ows, and in urban areas.
3 Inc ludes rem ovals in the form of r oundwood products, logging residues, the vo lumes of timber rem oved in cu l tur a l oper at ions such as noncomm er c ia l
th inn ing , and inven tory losses r esu l ting fr om the d iver sion of tim ber land to other uses such as cropland , pastu r eland , parks, and u rban u ses.
3Al l pr ojections at equ i l ibr iumpr ices, i .e . , the stum page pr ices at wh ich projected
'
timber dem ands and suppl ies are equ al (see append ix table Data
ar e aver ages for 5 year s cen tered on the project ion year .
Data fr om 1952 and 1962 ar e as of Decem ber 3 1 . Data for 1970 arid a l l pr ojection year s are as of January 1 . Data for 1976 and 1984 ar e as of Jan uary1 , 1977 , and January 1 , 1985 .
3 Inc ludes lands under long - term lease from other pr ivate owners .
6Data for these and other pr ivate owner sh ips ar e not ava ilable for the year s 1952 , 1962 ,
and 1970 .
Note: Data m ay not add to totals because of r ound ing .
4 1 1

T ab le — H ar dw ood r ou ndw ood supp l ies,‘t im ber r em ova l s,
3net ann u al gr ow th , and inven tor y of h ar dwood gr ow ing stock i nSou th Car o l in a ,
by ow ner shi p , selected year s 1952—84 ,
w ith pr oject ions3to 2030
M i l l ion cub ic feet
Pr oject ion s3
Ow ner sh ip and item
Nation al for estRoundwood suppl ies
‘
T im ber r em oval s3
Net annual gr owthInventory“Other pu b l i cRoundwood suppl ies
‘
T imber r em ovals3
Net annual gr ow thInventory“For est in du str y
3
Roundwood suppl ies‘
T im ber rem ovals3
Net annual gr owthInven tory“Other p r ivateFar m er
Roundwood suppl ies‘T im ber r em ovals2
Net annual gr ow thInventory“Corpor ateRoundwood suppl ies
‘
T im ber rem ovals3
Net annual grow thInven tory“Other ind ividualRoundwood suppl ies
‘
T im ber r em ovals2
Net annual gr ow thInven tory“T ota l other p r ivateRou ndwood suppl ies
3
T imber r em ovals3
Net annual growthInven tory“Al l owner sh ipsRoundwood supp l ies
‘100 123 168 235
T imber r em ovals3 164 137 172 240
Net annual grow th 223 3 34 249 235
Inventory“Inc ludes roundwood harvested fr om gr ow ing stock an d other sou r ces such as salvable dead trees; rough and r otten tr ees; and tr ees on forest land other than
timber land , in fence r ows, and in u rban ar eas.
3 Inc ludes removals in the form of r oundwood products, logg ing r esidues, the volum es of tim ber r em oved in cu l tur al oper at ions such as noncommer c ialth inn ing , and inven tory losses r esu lt ing fr om the d iver sion of t im ber land to other uses such as cr oplan d , pastu r eland , parks, and u rban u ses.
3Al l project ions at equ il ibr i um pr ices, i .e . , the stumpage pr ices at wh ich projected t im ber dem ands and suppl ies ar e equ al (see append ix table Data
ar e aver ages for 5 year s cen ter ed on the pr ojection year .
Data from 1952 and 1962 ar e as of Decem ber 3 1 . Data for 1970 an d al l projection year s ar e as of January 1 . Data for 1976 an d 1984 ar e as of Januar y

T ab le — H ardw ood r oundwood supp l ies,‘t im ber removals,
3net annu al grow th , and inventory of har dwood grow ing stock in T exas
,
by owner sh ip , selected year s 1952—84 , w ith project ions
3to 2030
M i l l ion cub ic feet
Ow nersh ip and item
Nation al for estRoundw ood suppl ies
‘
T im ber r em ovals3
Net annual grow thInven tory“Other pu b l icRoundwood suppl ies
‘
T im ber r em ovals3
Net annual gr ow thInven tory“For est indu str y
3
Roundwood suppl ies‘T im ber r em oval s3
Net annual growthInven tory“Other p r iva te
Farm er
Roundwood suppl ies‘
T im ber r em ovals3
Net an nual gr ow thInven tory“Corpor ateRoundwood suppl ies
‘
T im ber r em ovals3
Net annual grow thInven tory“Other ind iv idualRoundwood suppl iesT im ber rem oval s3
Net annual gr ow thInven tory“T ota l other p r ivateRoundwood suppl ies‘T imber r em ovals3
Net annual grow thInven tory“
1
Al l own er sh ipsRoundwood suppl ies‘
T im ber r emovals3
Net annual grow thInventory“
77
98
135
Pr oject ions3
106 13 3 164 194 2 14 220 209
109 13 8 161 19 1 2 10 2 15 204
248 184 188 143 140 15 1 155
Inc ludes r oundwood harvested fr om gr ow in g stock and other sour ces such as salvable dead tr ees; rough and rotten tr ees; and tr ees on forest land other thantimber land , in fence r ow s, an d in u rban ar eas.
3 Inc ludes r emovals in the form of roundwood products, logg in g r esidues, the vo lum es of t im ber rem oved in cul tu r al oper at ions such as noncommer c ialth inn ing , and inven tory losses r esu l tin g from the d iversion of t im ber l and to other uses such as cr opland , pastu reland , parks, and ur ban uses.
3Al l pr oject ions at equ il ibr ium pr i ces, i .e . , the stumpage pri ces at wh ich projected tim ber dem an ds and suppl ies are equal (see appendix table Data
ar e aver ages for 5 year s centered on the project ion year .
Data fr om 1952 and 1962 ar e as of Decem ber 3 1 . Data for 1970 and al l pr oject ion year s ar e as of Jan uar y 1 . Data for 1976 and 1984 ar e as of January1 , 1977 , and Januar y 1 , 1985 .
3 Includes lands under long—term lease fr om other pri vate owner s.
6Data for these and other pri vate owner shi ps ar e not avai lab le for the year s 1952 , 1962 , and 1970 .
Note: Data may not add to total s becau se of round ing .
414

T able — l -Iar dwood r oundwood suppl ies,‘t im ber r em ovals,
3net annu al gr owth , and inven tory of har dwood grow ing stock in V i r gin ia ,
by owner sh ip , selected year s 1952—84 , w ith pr oject ions
3to 2030
Mi l l ion cubic feet
Projections3
Ownersh ip and item 1990
Nat ion a l for estRoundwood suppl ies
‘
T im ber r emovals3Net annua l growthInventory“
Other pu b l icRoundwood suppl ies‘T imber rem ovals3Net . annual gr owthInven tory“
For est i n du str y5
Roundwood suppl ies‘
Tim ber r em ovals3Net annual gr ow thInventory“
Other p r iva te
Farm er
Roundwood suppl ies‘T imber r em ova ls2
Net annual gr ow thInventory“Corpor ateRoundwood suppl ies
‘
T im ber rem ovals3
Net annual gr owthInven tory“Other ind iv idualRoundwood suppl ies
‘
T im ber rem ovals2
Net annual growthInventory“T ota l other p r ivateRoundwood suppl ies‘T imber r em ovals2
Net annual gr ow thInventory“Al l owner sh ipsRoundwood suppl ies
‘145 258 368 360 442 547 494 494
T imber r emovals3 239 29 1 390 367 446 549 493 488
Net annual grow th 357 576 57 3 55 1 468 430 424 428
Inven tory“ 17 ,986
Includes roundwood harvested from grow ing stock an d other sou rces such as salvable dead trees; r ough and r otten trees; and trees on forest land other thantimber land , in fence rows, and in u rban ar eas.
3 Includes rem ovals in the form of r oundwood products, logg ing residues, the vo lumes of t imber r emoved in cu l tu r a l oper at ions such as noncommer c ia lth inn ing , and inventory losses resu l t ing from the d iver sion of tim ber land to other uses such as cropland , pastu r eland , parks, and u rban uses.
3Al l projections at equ i l ibr ium pr ices, i .e . , the stumpage pri ces at wh ich projected t imber dem ands and suppl ies are equal (see append ix table Data
are aver ages for 5 year s centered on the projection year .
Data from 1952 and 1962 ar e as of Decem ber 3 1 . Data for 1970 and a l l project ion year s are as of Januar y 1 . Data for 1976 and 1984 ar e as of Januar y1 , 1977 , and January 1 , 1985 .
3 Inc ludes lands ti nder long- term lease fr om other pr ivate owner s.
6Data for these and other pr ivate owner sh ipsar e not ava i lable for the year s 1952 , 1962 , and 1970 .
Note: Data m ay not add to totals because of r ou nd ing .
415

T ab le 3 63—H ar dw ood r oundw ood suppl ies,‘tim ber r em ovals,
3net annu al gr ow th , and inven tory of har dwood gr ow ing stock i n the
Sou theast r egion , by forest m an agem en t type , selected year s 1952—84 ,
w ith pr oject ions3to 2030
M i l l ion cubi c feet
Pr oject ions3
Inc ludes roundwood har vested from gr ow ing stock and other sou r ces such as salvable dead tr ees; rough and rotten trees; and tr ees on forest land otherthan tim ber land , in fence row s, and in u rban ar eas.
3 Includes rem ovals in the form of r oundw ood pr oducts, logg ing r esidues, the volumes of timber removed in cu l tu r al Oper at ions such as noncommer c ia lth inn ing
“
, and inven tory losses r esu lt ing fr om the d iversion of tim ber land to other uses such as cr oplan d , pastu reland , parks, an d u rban uses.
3Al l project ions at equ i l ibr ium pr ices, i .e . , the stumpage pr ices at wh ich pr ojected tim ber dem ands and supp l ies ar e equal (see append ix tab leData ar e aver ages for 5 year s cen tered on the project ion year .
Data for 1952 and 1962 ar e as of Decem ber 3 1 . Data for 1970 and al l project ion year s ar e as of Janu ary 1 . Data for 1976 and 1984 ar e as of
Januar y 1 , 1977 , and Janu ary 1 , 1985 .
Note: Data m ay not add to totals becau se of round ing .
4 16

T ab le — H ardw ood r oundwood suppl ies,‘t im ber rem ovals,
3net annual gr ow th , and inven tory of hardwood gr ow ing stock in A labam a ,
by for est m anagem en t type , selected year s 1952—84 , w ith pr oject ion s
3to 2030
Mi l l ion cub ic feet
Projections3
Inc ludes roundwood har vested fr om gr ow ing stock and other sour ces such as sa lvable dead tr ees; r ough and rotten tr ees; and tr ees on for est lan d otherthan t im ber land , in fence rows, and in u rban areas.
3 Inc ludes rem ova ls in the form of r oundwood pr oducts, logg ing r esidues, the volumes of t imber r emoved in cu l tu r al oper ation s such as noncomm er c ialth inn ing , and inven tory losses resu l t ing fr om the d iver sion of t im ber land to other uses such as cr oplan d , pastur eland , parks, and u rban uses.
3Al l projections at equ i l ibri um pr ices, i .e . , the stumpage pr ices at wh ich projected timber demands and suppl ies ar e equal (see append ix table Data
are aver ages fo r 5 year s cen ter ed on the pr oject ion year .
Data for 1952 and 1962 ar e as of December 3 1 . Data for 1970 and al l projection year s ar e as of Jan uar y 1 . Data for 1976 and 1984 ar e as of January 1 , 197and January 1 , 1985 .
Note: Data m ay not add to totals because of r ound ing .
418

T able 3 66— H ar dwood roundwood suppl ies,‘t im ber r em ovals,
3net ann ual grow th , and inven tory of har dw ood gr ow ing stock in A rkansas,
by forest m anagem en t type , selected year s 1952—84 , w ith pr oject ions
3to 2030
Mi l l ion cub ic feet
1984
Al l m anagem en t typesRoundwood suppl ies‘
23 8 184 160 156
T im ber r em ovals3 280 32 1 2 10 195
Net annual grow th 380 376 369 369
Inven tory“
Projections3
365 343 365 360
358 3 36 356 352
280 266 275 286
Inc ludes r oundwood harvested from grow ing stock and other sour ces such as salvab le dead tr ees; r ough and rotten tr ees; and trees on fo r est land other
than tim ber land , in fenc‘
e rows, and in u r ban ar eas.
3 Inc ludes removals in the form of r oundwood pr oducts, logg ing residues, the vo lumes of t imber rem oved in cu l tur a l oper ations such as noncomm erc ia lth inn ing , and inven to ry losses r esu l ting from the d iversion of tim ber land to other u ses such as cr opland , pastu reland , parks, and u rban uses.
3Al l projections at equ i l ibr ium pr ices, i .e . , the stumpage pr ices at which projected timber dem ands and suppl ies are equa l (see append ix tab le Data
are aver ages for 5 years cen ter ed on the pr oject ion year .
Data for 1952 and 1962 ar e as of December 3 1 . Data for 1970 and al l project ion year s are as of January 1 . Data for 1976 and 1984 ar e as of Jan uary 1 , 1977 ,
and January 1 , 1985 .
Note: Data may not add to totals becau se of r ou nd ing .
419

T ab le — H ar dwood r oundw ood suppl ies,‘t im ber r em ovals,
2net annu al gr ow th , and inven tory of har dwood grow ing stock in Flor ida ,
by for est m an agem en t type , selected year s 1952—84 ,
w ith pr oject ions3to 2030
M i l l ion cubi c feet
Pr oject ions3
Inc ludes r oundwood har vested fr om gr ow ing stock and other sou r ces such as sa lvab le dead trees; r ough and rotten trees; and tr ees on for est land other
than timber land , in fence r ow s, and in u r ban ar eas.
3 Inc ludes r em ova ls in the form of r oundwood pr oducts, logging’
r esidues, the vo lumes of t im ber rem oved i n cu l tu r al oper ations such as noncomm er c ia lth inn ing ,
“
and inven tory losses resu lt ing fr om the d iver sion of tim ber land to other u ses such as cropland , pastu reland , parks, and u rban uses.
3Al l project ions at equ i l ibr ium pri ces, i .e . , the stumpage pr ices at wh ich projected tim ber dem ands and supp l ies ar e equal (see append ix tab le Data
are aver ages for 5 year s cen ter ed on the project ion year .
Data for 1952 and 1962 ar e as of Decem ber 3 1 . Data for 1970 and al l pr ojection year s ar e as of January 1 . Data for 1976 and 1984 ar e as of January 1 , 1977 ,
and January 1 , 1985 .
No te: Data m ay not add to tota ls because of round ing .
420

T ab le 3 69— H ar dw ood r ou ndw ood suppl ies t im ber r em ovals,
3net annu al gr ow th , and inven tory of har dwood gr ow ing stock in Lou isiana ,
by for est m anagem en t type , selected year s 1952—84 ,
w ith project ion s3to 2030
M i l l ion cub ic feet
Pr ojections3
Al l m anagem en t typesRoundwood suppl ies‘
136 149 179 272 27 1 270 307 322
T im ber r em ovals3 15 1 176 189 267 267 265 300 3 15
Net annua l gr ow th 148 3 19 296 302 248 247 267 286
Inven tory“ 3
Inc ludes r oundwood har vested fr om gr ow ing stock and other sour ces su ch as salvab le dead trees; rough an d r otten trees; and tr ees on for est land other
than tim ber land , in fence r ow s, and in u rban ar eas.
3 Inc ludes r em ovals in the form of roundwood pr oducts, logg ing r esidues, the volumes of t im ber r emoved in cu l tu r al oper at ions such as noncomm er c ialth inn ing , and inven tory losses r esu l t ing from the d iver sion of t im ber land to other u ses such as cropland , pastureland , parks, and u rban uses.
3Al l project ions at equ il ibr ium pr ices, i .e the stumpage pr ices at wh ich pr ojected t imber dem ands and suppl ies ar e equal (see append ix tableData are aver ages for 5 year s cen tered on the pr oject ion year .
Data for 1952 and 1962 ar e as of Decem ber 3 1 . Data for 1970 and al l pr oject ion year s ar e as of Jan uary 1 . Data for 1976 and 1984 ar e as of January 1 ,1977 , and January 1 , 1985 .
Note: Data m ay not add to total s because of round ing .
422

T ab le —H ardwood r oundwood suppl ies,‘t imber r em oval s,
3net an nual gr owth , and inven tory of har dwood grow ing stock in M ississipp i ,
by for est m anagem en t type , selected year s 1952—84, w ith pr oject ions
3to 2030
Mi l l ion cub ic feet
Project ions3
Inc ludes roundwood harvested from grow ing stock and other sou r ces such as salvab le dead tr ees; rough and rotten tr ees; and trees on forest land other
than t im ber land , in fence rows, and in u rban ar eas.
3 Inc ludes rem ova ls in the form of r oundwood products, logging r esidues, the volumes of timber removed in cu l tu r al oper ations such as noncommer c ia lth inn ing , and inventory losses r esu l t ing from the d iver sion of timber l an d to other uses such as cr opland , pastu r eland , parks, and u r ban uses .
3Al l projections at equ il ibri um pr ices, i .e . , the stumpage pr ices at wh ich projected t im ber dem ands and supp l ies are equ al (see append ix tab le
Data ar e aver ages for 5 year s cen tered on the projection year .
Data for 1952 and 1962 are as of December 3 1 . Data for 1970 and a l l project ion year s ar e as of January 1 . Data for 1976 and 1984 ar e as of Jan uary 1 , 1977 ,
and January
Note: Data m ay not add to totals because of r ound ing .
42 3

T ab le 3 7 1— H ar dw ood r oundwood suppl ies,‘t im ber r em ovals,
3net ann u al grow th , and inven tory of har dwood grow ing stock in Nor th
Car o l ina , by for est m an agem en t type , selected year s 1952—84,w ith pr oject ion s
3to 2030
Mi l l ion cub ic feet
Pr ojections
Inc ludes roundwood harvested fr om gr ow ing stock and other sour ces such as salvab le dead tr ees; r ough and r otten trees; and tr ees on forest lan d other
than timber land , in fence r ow s, and i n u rban areas.
3 Inc ludes rem ovals in the form of r ou ndwood pr oducts, logg ing residues, the volumes of timber r emoved in cu l tu r al Oper at ions such as non commer c ia lth inn ing , and inven tory losses resu l t ing fr om the d iver sion of t imber land to other uses such as cr opland , pastu re land , parks, and ur ban uses.
3Al l pr ojections at equ i l ibri um pr ices, i .e . , the stumpage pri ces at wh ich pr ojec ted t imber dem ands and supp l ies ar e equ al (see append ix tab leData are aver ages for 5 years cen tered on the pr ojection year .
Data_
for 1952 and 1962 ar e as of Decem ber 3 1 . Data for 1970 and a l l projection year s ar e as of January 1 . Data for 1976 and 1984 ar e as of Januar y 1 , 1977and January 1 , 1985 .
Note: Data m ay not add to totals because of rou nd ing .
424

T ab le — H ar dwood r oundw ood suppl ies,‘tim ber r em ovals,
3 net ann ual gr ow th , and i nven tory‘
of har dwood gr ow ing stock in Sou thCar o l ina , by for est m anagem en t type , selected year s 1952
—84 ,w ith project ion s
3to 2030
Mi l l ion cubic feet
Pr oject ions3
Al l m anagem en t typesRoundwood suppl ies‘ 100 126 123 168 235 204 229 25 1 241
T im ber r em ovals3 164 148 137 172 240 206 230 25 1 239
Net an nual gr ow th 223 265 334 249 235 199 195 203 2 10
Inven to ry“Inc ludes r oundwood harvested fr om gr ow ing stock an d other sou r ces such as salvable dead tr ees; r ough and rotten tr ees; an d trees on forest land other
than t imber lan d , in fence r ow s, and in u rban ar eas.
3 Inc ludes removals in the form of r oundwood pr oducts, logg in g residues, the vo lum es of t imber r em oved in cu l tur al operations such as noncomm erc ialth inn ing , and inven tory losses r esu l t ing fr om the d iversion of tim ber land to other uses such as cr oplan d , pastur eland , par ks, an d ur ban uses.
Al l pr oject ions at equ il ibri um pr ices, i .e . , the stumpage pri ces at wh ich projected tim ber dem an ds and suppl ies ar e equal (see append ix tableData ar e averages for 5 year s cen ter ed on the projection year .
Data’
for 1952 and 1962 ar e as of December 3 1 . Data for 1970 and al l pr ojection year s ar e'
as of Januar y 1 . Data for 1976 and 1984 ar e as of January 1 , 1977 ,
and Januar y 1 , 1985 .
Note: Data m ay not add to total s because of r ounding .
426

T able 3 74—H ardwood r oundwood suppl ies,‘t im ber r em ovals,
3net annual gr ow th ,
”
and inven tory of har dwood grow ing stock in T ennessee ,
by forest m an agem en t type , selected year s 1952—84 , w ith pr oject ions
3to 2030
M i l l ion cub ic feet
Projections3
Inc ludes roundwood harvested from gr ow ing stock and other sou r ces such as salvab le dead tr ees; r ough and r otten tr ees; and tr ees on forest land other
than timber land , in fence r ows, and in urban ar eas.

T ab le 3 75— H ar dwood r ou ndwood suppl ies,‘t im ber r em ovals,
3net annu al gr ow th , and inven tory of har dw ood gr ow ing stock i n T exas, by
for est m anagem en t type , selected year s 1952— 84 , w ith project ion s
3to 2030
Mi l l ion cubi c feet
Pr oject ions3
1990
Al l m anagem en t typesRoundwood suppl ies‘
77 88 106 13 3 194 2 14 220 209
T imber r em ovals2 98 10 1 109 138 19 1 2 10 2 15 204
Net annual gr ow th 135 19 1 248 184 143 140 15 1 155
Inven tory“ 3
Inc ludes r oundwood harvested fr om grow ing stock and other sou rces such as salvable dead tr ees; r ough an d r otten tr ees; an d tr ees on forest land other
than timber land , in fence r ow s, and in u rban areas.
3 Inc ludes r emova ls in the form of r oundwood pr oducts, logg ing r esidues, the vo lumes of timber r em oved in cu l tu r al oper at ion s such as noncomm er c ialth inn ing , a nd inventory losses resu l ting from the d iver sion of tim ber l and to other uses such as cr oplan d , pastu r eland , parks, and u rban uses.
3A l l pr ojections at equ i l ibri um pr ices, i .e . , the stumpage pr ices at w h ich projected timber dem ands an d suppl ies ar e equal (see append ix table Data
ar e aver ages for 5 year s cen tered on the pr oject ion year .
Data for 1952 and 1962 are as of December 3 1 . Data for 1970 and al l projection year s ar e as of Januar y 1 . Data for 1976 and 1984 ar e as of Jan uar y 1 , 1977 ,
and Januar y 1 , 1985 .
Note: Data m ay not add to totals becau se of r ound ing .
428

[Th is page in ten tion ally left ‘blank . ]
430
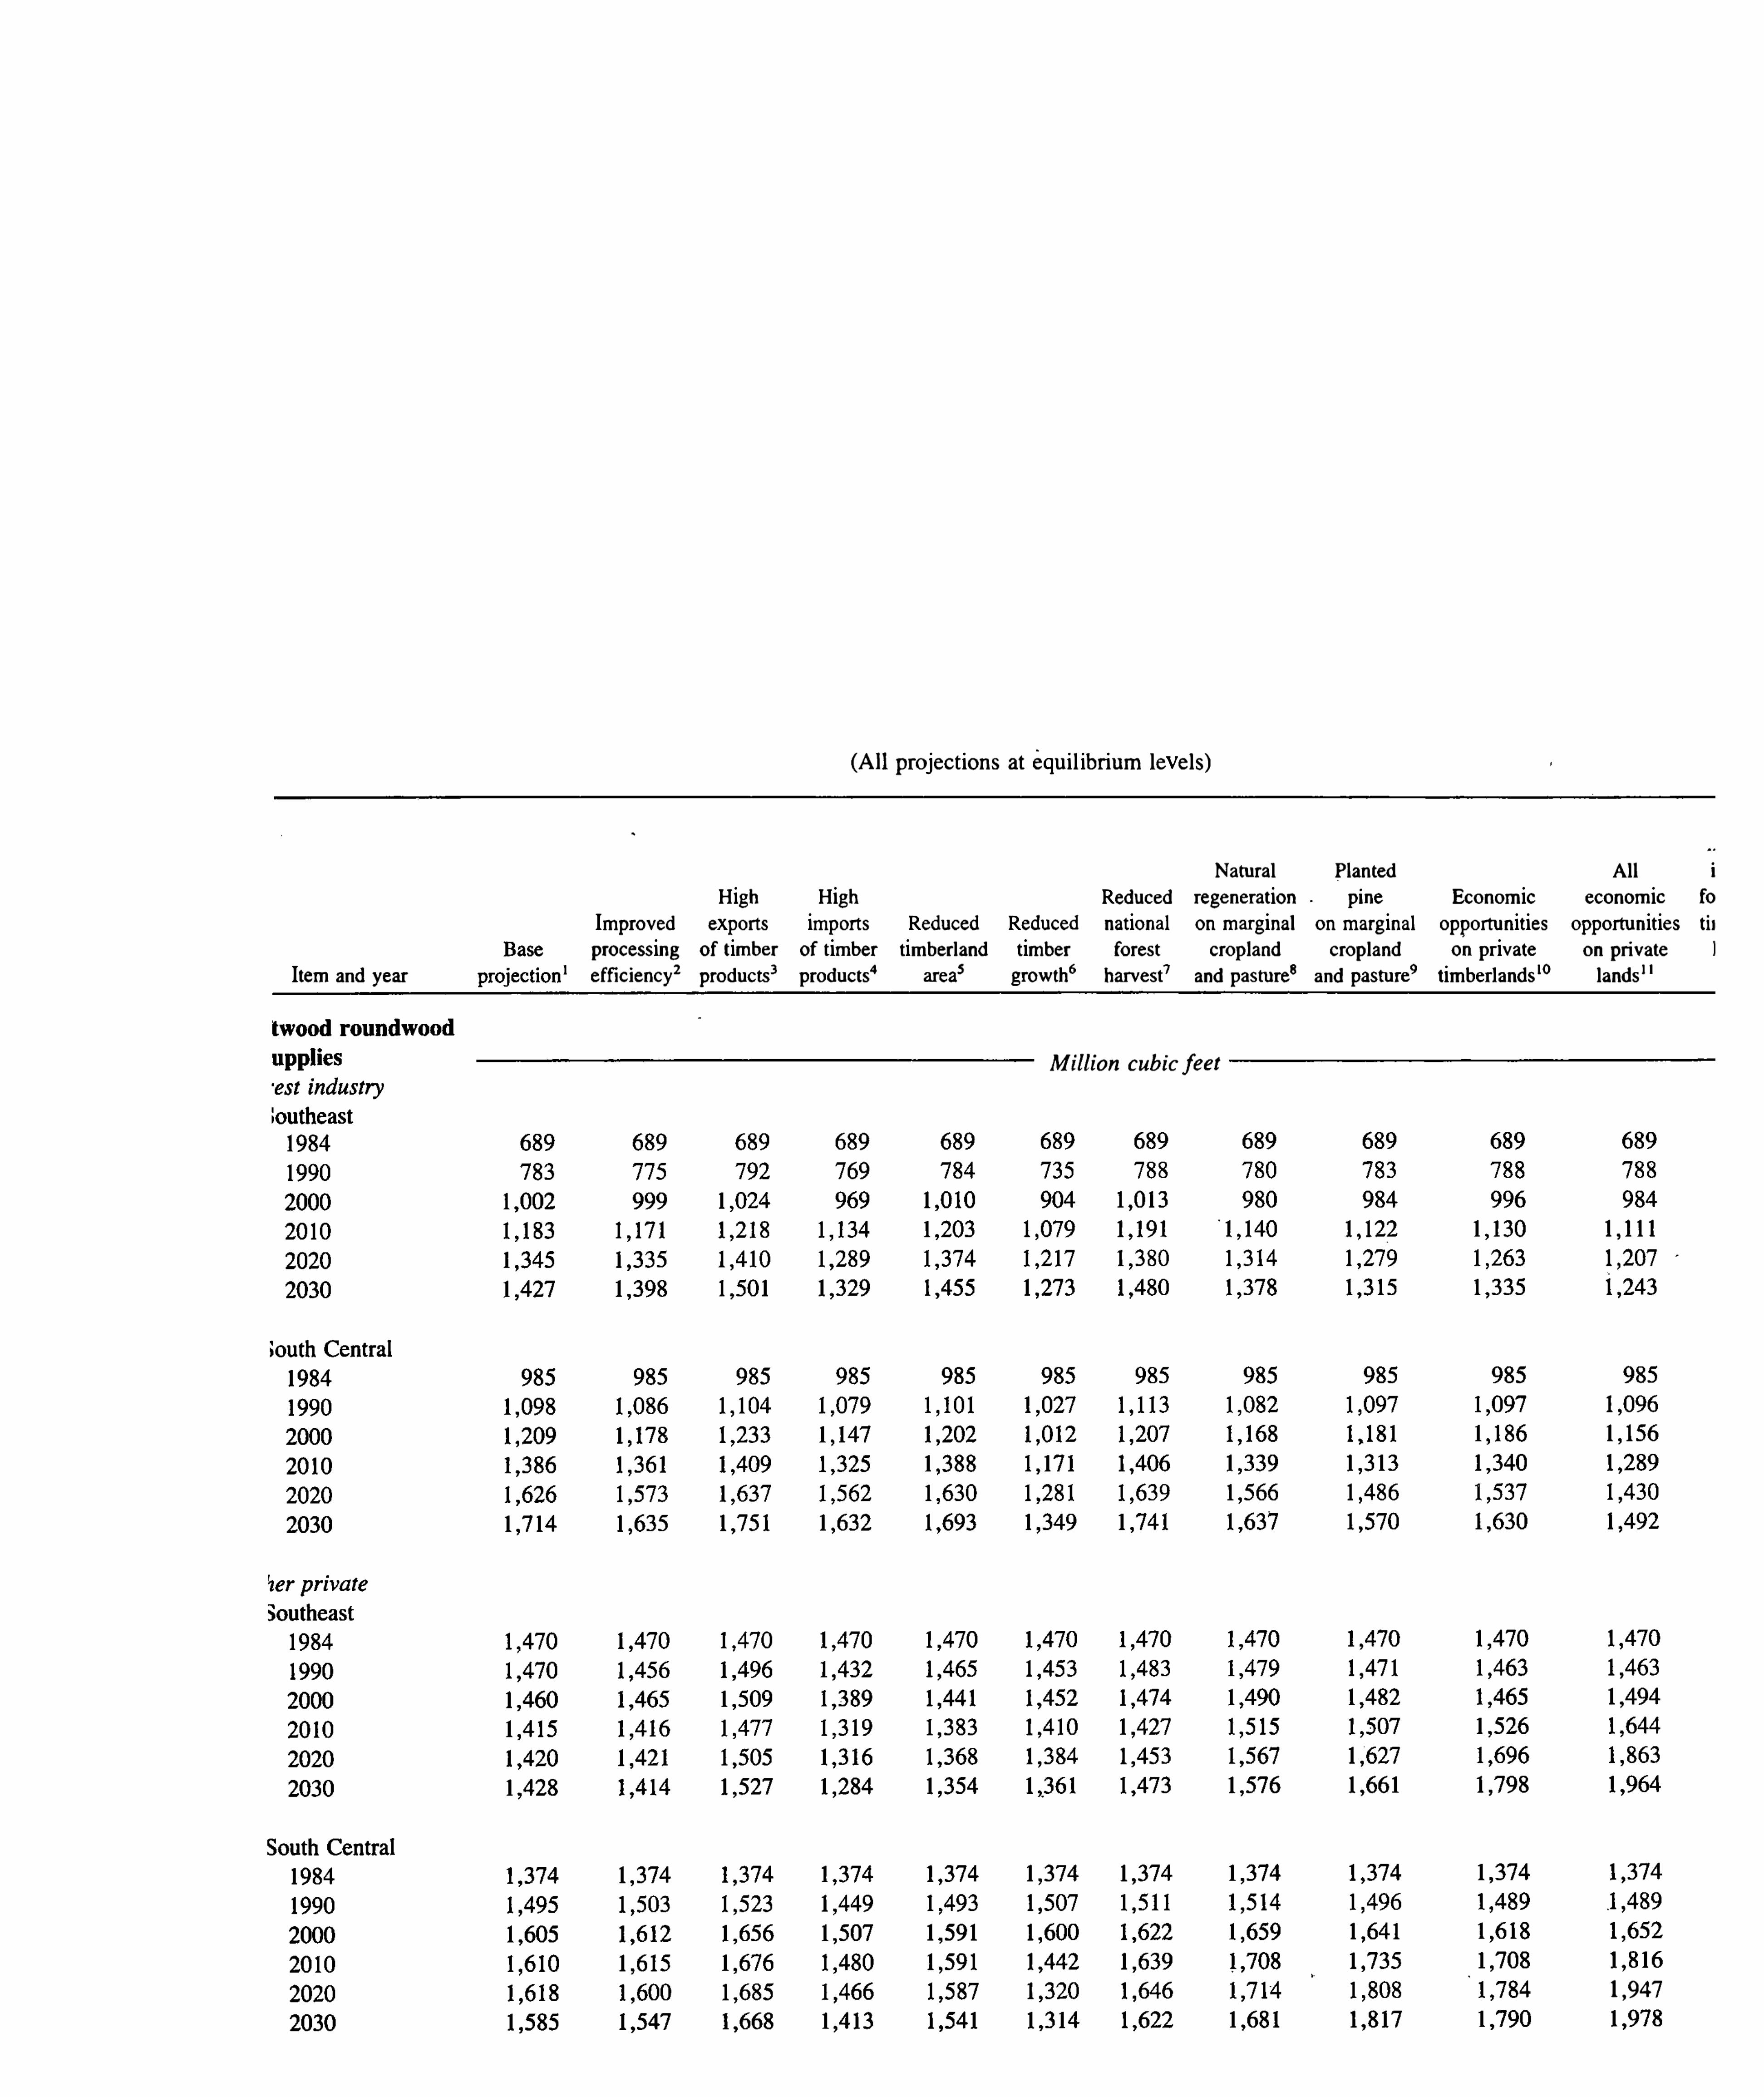
(Al l projections at equ i l ibr ium levels)
Natu ral Plan ted Al l 1High High Reduced regeneration p i ne Econom ic econom ic fo
Improved exports imports Reduced Reduced national on m ar ginal on m arginal oppor tu n ities oppor tu n ities ti r
processing of timber of tim ber timber land timber for est cropland cropland onpr ivate on pr i vate 1
Item and year effic iency3pr oducts
3pr oducts
“ar ea
3grow th
6harvest
7and pasture
8and pastu re
9tim ber lands‘" lands“
M i l l ion cub i c feet
1 ,947

T ab le — S im u lated effects of selected fu tu r es on pr ojected softwood r oundwood suppl ies on al l ow ner sh ips; net ann ual gr ow th and
inventor ies of grow ing stock by pr ivate ow ner sh ip and r egion ; and softwood stumpage pr i ce indexes, lum ber product ion , plywood produ ct ion ,
and pu lpwood consumpt ion , by r eg ion , in the South , selected year s 1984—2030—Con t inued
(Al l pr ojections at equ i l ibr ium level s)
Increasedmanagemer
Natu ral Planted Al l in tensity orHigh High Reduced regener ation pine Econom ic econom ic for est indus"Improved export s imports Reduced Reduced national on m ar ginal on m ar ginal Oppo rtun ities opportun ities tim ber landsprocessing of tim ber of tim ber timber land tim ber for est cropland cropland on pri vate on pri vate Douglas
- ri
Item and year effic iency3pr oduc ts
3produc ts
“ar ea
3gr ow th
6harvest
7and pastu re
8and pastu re
9timber lands‘" land
'
s“
reg ion‘3
432

T ab le — S im u lated effects of selected futur es on pr ojected softwood r oundwood suppl ies on al l owner sh ips; net annual growth and
inven tor ies of gr ow ing stock by pr ivate owner sh ip and r eg ion ; and softwood stumpage pr ice indexes, lum ber product ion , plywood production ,
and pu lpwood con sum pt ion , by r eg ion , in the Sou th , selected year s l 984—2030—Con t inued
434
Item and year
Improvedpr ocessing of timbereffic iency
3products
3pr oducts
“
3 1 ,085
1
25 ,422
Highexpor ts
23 , 185
(Al l pr ojections at equ il ibr ium levels)
Highimpor tsof timber
Reducedtimber land
ar ea3
25 ,846
23 , 1 12
Reducedtim bergrowth
6
Reducednationalforest
harvest7
Natur al
r egenerationon m ar ginal on m ar ginal opportu n itiescropland
Plan ted
pine
cropland
Econom ic
on pr ivateand pastu r e
8and pasture
9timber lands‘"
All
econom ic
lands‘
Increasedmanageme
in tensity cforest indus
opportun ities timber landson pr ivate Douglas
- f
region ‘3


T ab le — S im u lated effects of selected fu tu r es on pr ojected softwood r oundwood supp l ies on al l ow ner sh ips; net ann u al gr owth and
inven tor ies of gr ow in g stock by pr ivate ow ner sh ip and r eg ion ; and softwood stumpage pr ice indexes, lum ber product ion , plywood produ ct ion ,
and pu lpwood consumpt ion , by r eg ion , i n the Sou th , selected year s 1984—2030—C on t inued
(Al l pr oject ions at equ il ibr ium levels)
Increasedm anagement
Natu r al Plan ted Al l intensity onHigh High Reduced regeneration pine Econom ic econom ic forest industrImproved expor ts impo rts Reduced Reduced national on mar ginal on m arg inal oppo rtu n ities opportun ities tim ber lands i
processing of timber of timber timber land timber for est cropland cr opland on pr ivate on pr ivate Douglas- fir
436

T ab le — S im u lated effects of selected fu tu r es on pr ojected softwood r ou ndwood suppl ies on al l owner sh ips; net ann u al gr owth and
inven tor ies of gr ow ing stock by pr ivate owner sh ip and r eg ion ; and softwood stumpage pri ce indexes, lum ber product ion , plyw ood pr oduct ion ,
and pu lpw ood consumpt ion , by r eg ion , in the Sou th , selected year s 1984—2030—C on t inued
T he futu r e as descr ibed by the basic assumpt ions and other spec ified and im pl ied assumptions under l y in g the projections in chapter 3 .
3T he fu tu re as descr ibed by the basic assumptions and other spec ified and impl ied assumpt ion s in chapter 3 m od ified by incr easing softw ood lumber and plyw oodyields by 25 per cen t instead of the 10 per cen t incr ease assum ed in the 1979 Assessm en t and the Supplemen t . T he incr ease i n yiel ds w il l be staged in the progression 9 , 7 , 5 , 3 , and 1 per cen t per decade .
3T he futu re as descr ibed by the basic assumptions and other spec ified an d im pl ied assum ptions in
6
chapter 3 mod ified by increasing the pr ojected exports of lumber ,plywood , and pu lpwood ( inc ludes pu lpwood an d the pu lpwood equ iva len t of pu lp , paper , and boar d) by 20 per cen t i n 1990 , 40 percen t in 2000 , 60 per cen t in
‘
20 10 , 80 per cen t in 2020 , and 100 per cen t i n 2030 .
The fu tu re as descri bed by the basic assumptions and other spec ified and '
impl ied assum ptions in chapter 3 m od ified by increasing the pr ojected imports of plywood ,
pu lpwood (inc ludes pu lpwood and the p u lpwood equ ivalen t of pu lp , paper , and board) , an d hardwood lum ber an d logs by 20 percen t in 1990 ,40 percen t in 2000 , 60
per cen t in 20 10 , 80 per cen t in 2020 , and 100 per cen t in 2030 .
3 T he fu tur e as descr ibed by the basic assumpt ions and other spec ified an d impl ied assumption s in chapter 3 m od ified by r educ ing the projected area in t imber landin the Sou th by 2 m i l l ion acr es in 1990 , 5 m i l l ion acr es in 2000 , and 1 1 m il l ion acr es in 2030 .
6T he fu tu r e as descr ibed by the basic assum pt ions and other spec ified and impl ied assumpt ions in chapter 3 _
m od ified by r educ ing the net ann ual gr ow th on p ine
plan tat ions, n atu r al p ine , and m ixed p ine—har dwood stands show n in the emp iri cal yield tables used in developing the base level project ions by 25 per cen t .
7T he futu re as descr ibed by the basic assumpt ions and other spec ified an d impl ied assumptions in chapter 3 m od ified by reduc ing t imber harvests on the nat ionalforests to b il l ion boar d feet in 1990 an d m ai n tain ing th is level thr ough 2030 .
3T he futu r e as descr ibed by the basic assumption s and other spec ified and impl ied assumptions in chapter 3 m od ified by assum i ng that al l the m ar g inal cropland
and“
pastu r e in the Sou th that wou ld yiel d h igher r ates of r etu r n in pine p lan tations w ou ld n atu r al ly r evert to t im ber l and by 2000 (70 per cen t n atur al p ine , 30 per
cen t har dwoods in the Sou theast ; 40 per cen t natu r al p ine , 60 per cen t har dwoods in the Sou th Cen tr al r eg ion ) .9T he fu tu r e as descr ibed by the basic assumpt ions and other spec ified and im pl ied assumpt ions in chapter 3 m od ified by assum in g that al l the m ar gin al cr oplan d
and pasture in the Sou th wou ld be plan ted in p in e .
‘6T he fu ture as descr ibed by the basic assumptions and other spec ified and impl ied assumptions in chapter 3 _
modified by assum i ng that all the econom i c opportun ities,except those invo lving intermed iate stand tr eatmen t and those not involving ar ea change and m an agemen t types, for incr easing t imber suppl ies on t im ber land in
pr ivate ow ner sh ips that y iel d 4 percen t or m or e net of infl ation or deflat ion wou ld be u ti l ized .
T he fu tu re as descri bed by the basic assumptions and other spec ified and im pl ied assumptions in chapter 3 modified by assum ing that all th e econom ic opportun iti es,except those involving in term ed iate stan d tr eatmen t an d those not invo lvin g ar ea change and m an agemen t types, for incr easin g t imber suppl ies on tifnber land in
pr ivate ow ner sh ips that yield 4 per cen t or m or e net of inflat ion or deflat ion wou ld be u t i l ized , and al l the m ar g inal crop land and pastu re wou ld be plan ted in pine .
‘3T he futur e as descr ibed by the basic assumptions and other spec ified and im pli ed assumptions in chapter 3 m od ified by assum i ng that al l the econom icOppor tun ities
to increase t imber supp l ies on for est indu stry t imber l an ds in the Dougl as- fir reg ion wou ld be u t il ized .
438
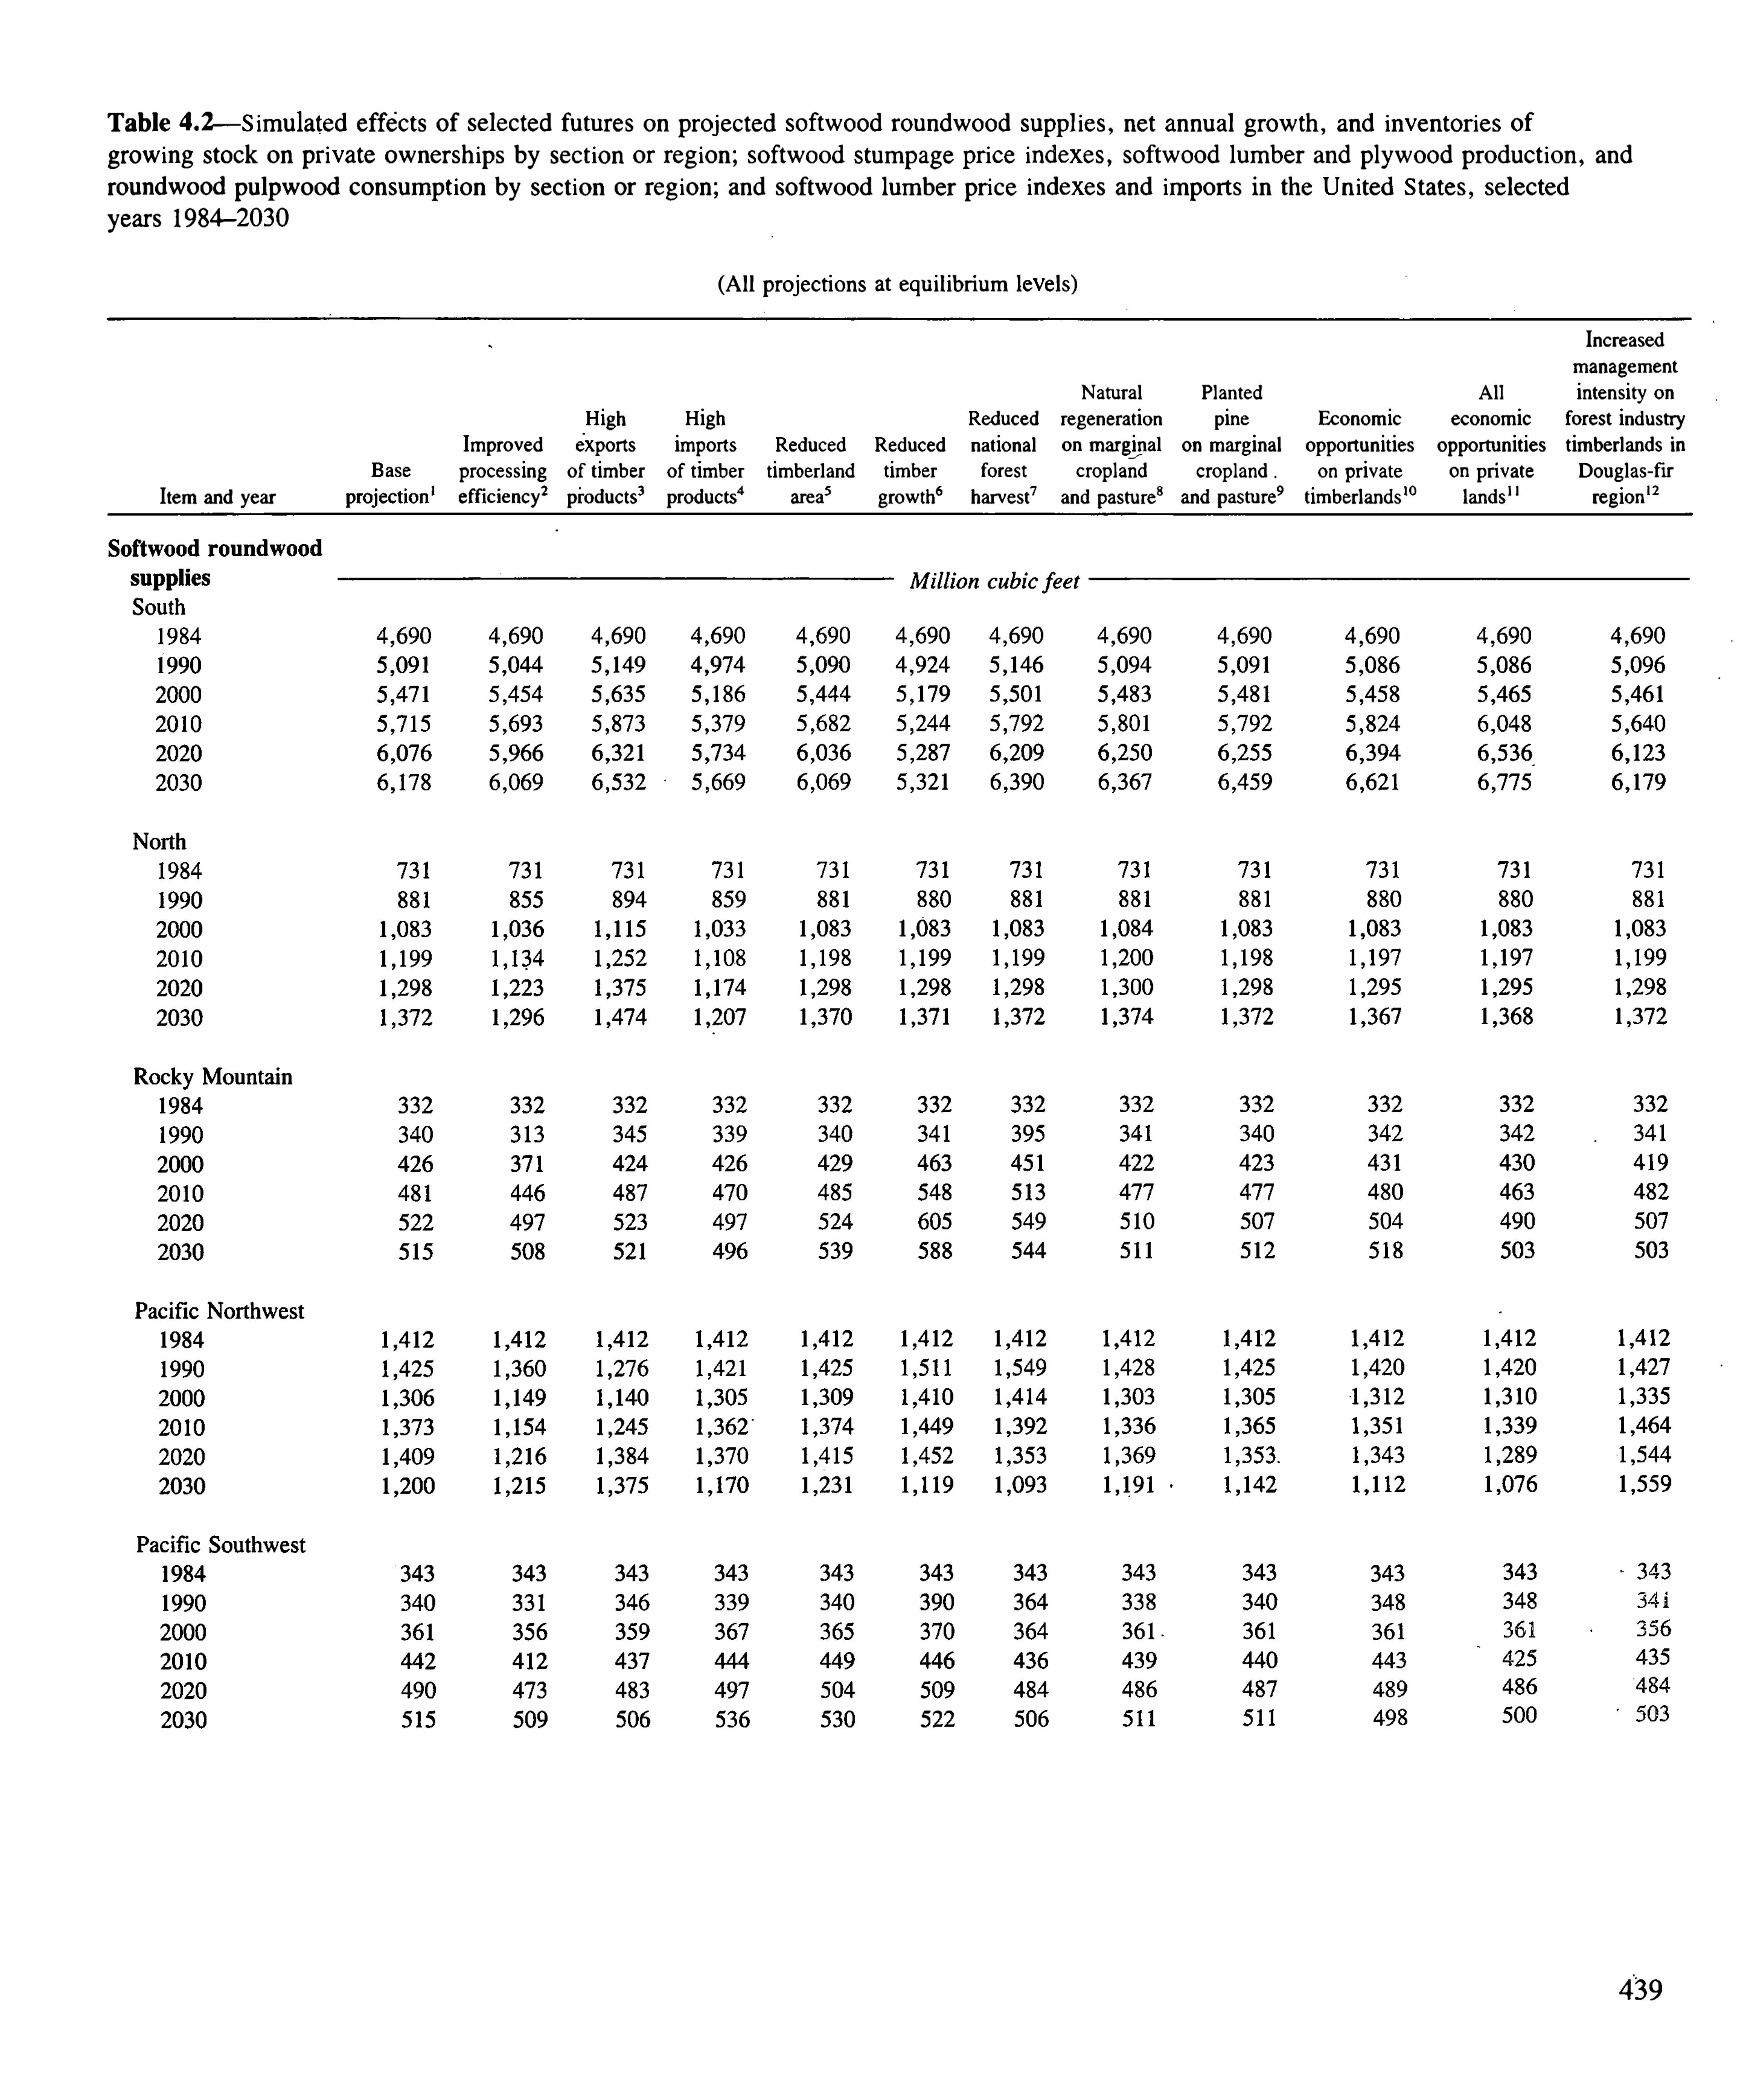
T ab le — S im u lated effects of selected fu tu r es on pr ojected softwood r oundwood suppl ies, net annu al growth , and inven tor ies of
gr ow ing stock on pr ivate ow ner sh ips by sect ion or r eg ion ; softwood stum page pr ice indexes, softw ood lum ber and plywood pr oduct ion , and
r oundwood pu lpwood consum pt ion by sect ion or r eg ion ; and softwood lum ber pr ice indexes and im por ts in the Un ited S tates, selectedyear s 1984
- 2030
(Al l projections at equ i l ibri um levels)
Increasedm anagement
Natu r al Plan ted Al l intensity onHigh High Reduced regener ation pine Econom ic econom ic forest industryImpr oved exports imports Reduced Reduced national on m ar ginal on mar ginal oppo rtun ities opportu n ities timber lands inprocessing of timber of timber timber land tim ber for est cr opland cropland on pr ivate on pr ivate Douglas
- fir
Item and year effic iency3products
3products
“area
3grow th
6har vest
7and pastu re
3and pastu re
9tim ber lands‘0 lands“ region ‘3
439

T ab le — S im u lated effects of selected fu tu r es on pr ojected softwood r oundwood suppl ies, net ann u al grow th , and inven to r ies of
gr ow ing stock on pr ivateowner sh ips by sect ion or r eg ion ; softwood stumpage pr ice indexes, softwood lumber and plywood pr oduct ion , and
roundwood pu lpwood consumption by sect ion or r eg ion ; and softwood lum ber pr ice indexes and im por ts in the Un ited States, selectedyear s 1984
—2030—C ont inued
(Al l pr oject ions at equ il ibr ium levels)
Increasedm an agement
Natu r al Plan ted Al l in tensity onHigh High Reduced r egeneration pine Econom ic econom ic forest industrImpr oved exports import s Reduced Reduced national on m arginal on m ar ginal opport u n ities oppor tu n ities tim ber l ands 11
processing'
of timber of timber tim ber l and tim ber forest cr opland cropland on pr ivate on pr ivate Douglas- fir
Item and year efficiency3
pr oducts3pr oducts
“ar ea
3grow th
6 har vest7
and pastu r e8
and pastu re9
tim ber lands‘" lands“ r egion ‘3
Mi l l ion cub ic feet
440

T ab le —S im u lated effects of selected fu tur es on projected softw ood r ou ndwood suppl ies, net annual gr ow th , and inven tor ies of
gr ow ing stock on pr ivate owner sh ips by sect ion or r eg ion ; softwood stumpage pri ce indexes, softwood lum ber an d plywood product ion , and
r oundwood pu lpw ood consum pt ion by section or r eg ion ; and softwood lum ber pri ce indexes and im por ts in the Un ited S tates, selectedyear s 1984
—2030—C on t in ued
(Al l pr oject ions at equ i l ibr ium levels)
Increased
man ageme:
Natur al Plan ted Al l in tensity 0High H igh Reduced regeneration pine Economi c econom ic forest indusImproved exports
“ impor ts Reduced Reduced national on m ar ginal on m ar ginal oppor tun iti es opportun ities timber landsprocessing of timber of tim ber timber l and tim ber for est croplan d cropland on pri vate on pr i vate Douglas
- f;
Item and year effic iency3products
3products
“ar ea
3gr owth
6harvest
7and pastu re
8and pastu r e
9timber lands‘0 lands“ region ‘3
Index ofp r ices 1 984 100
442
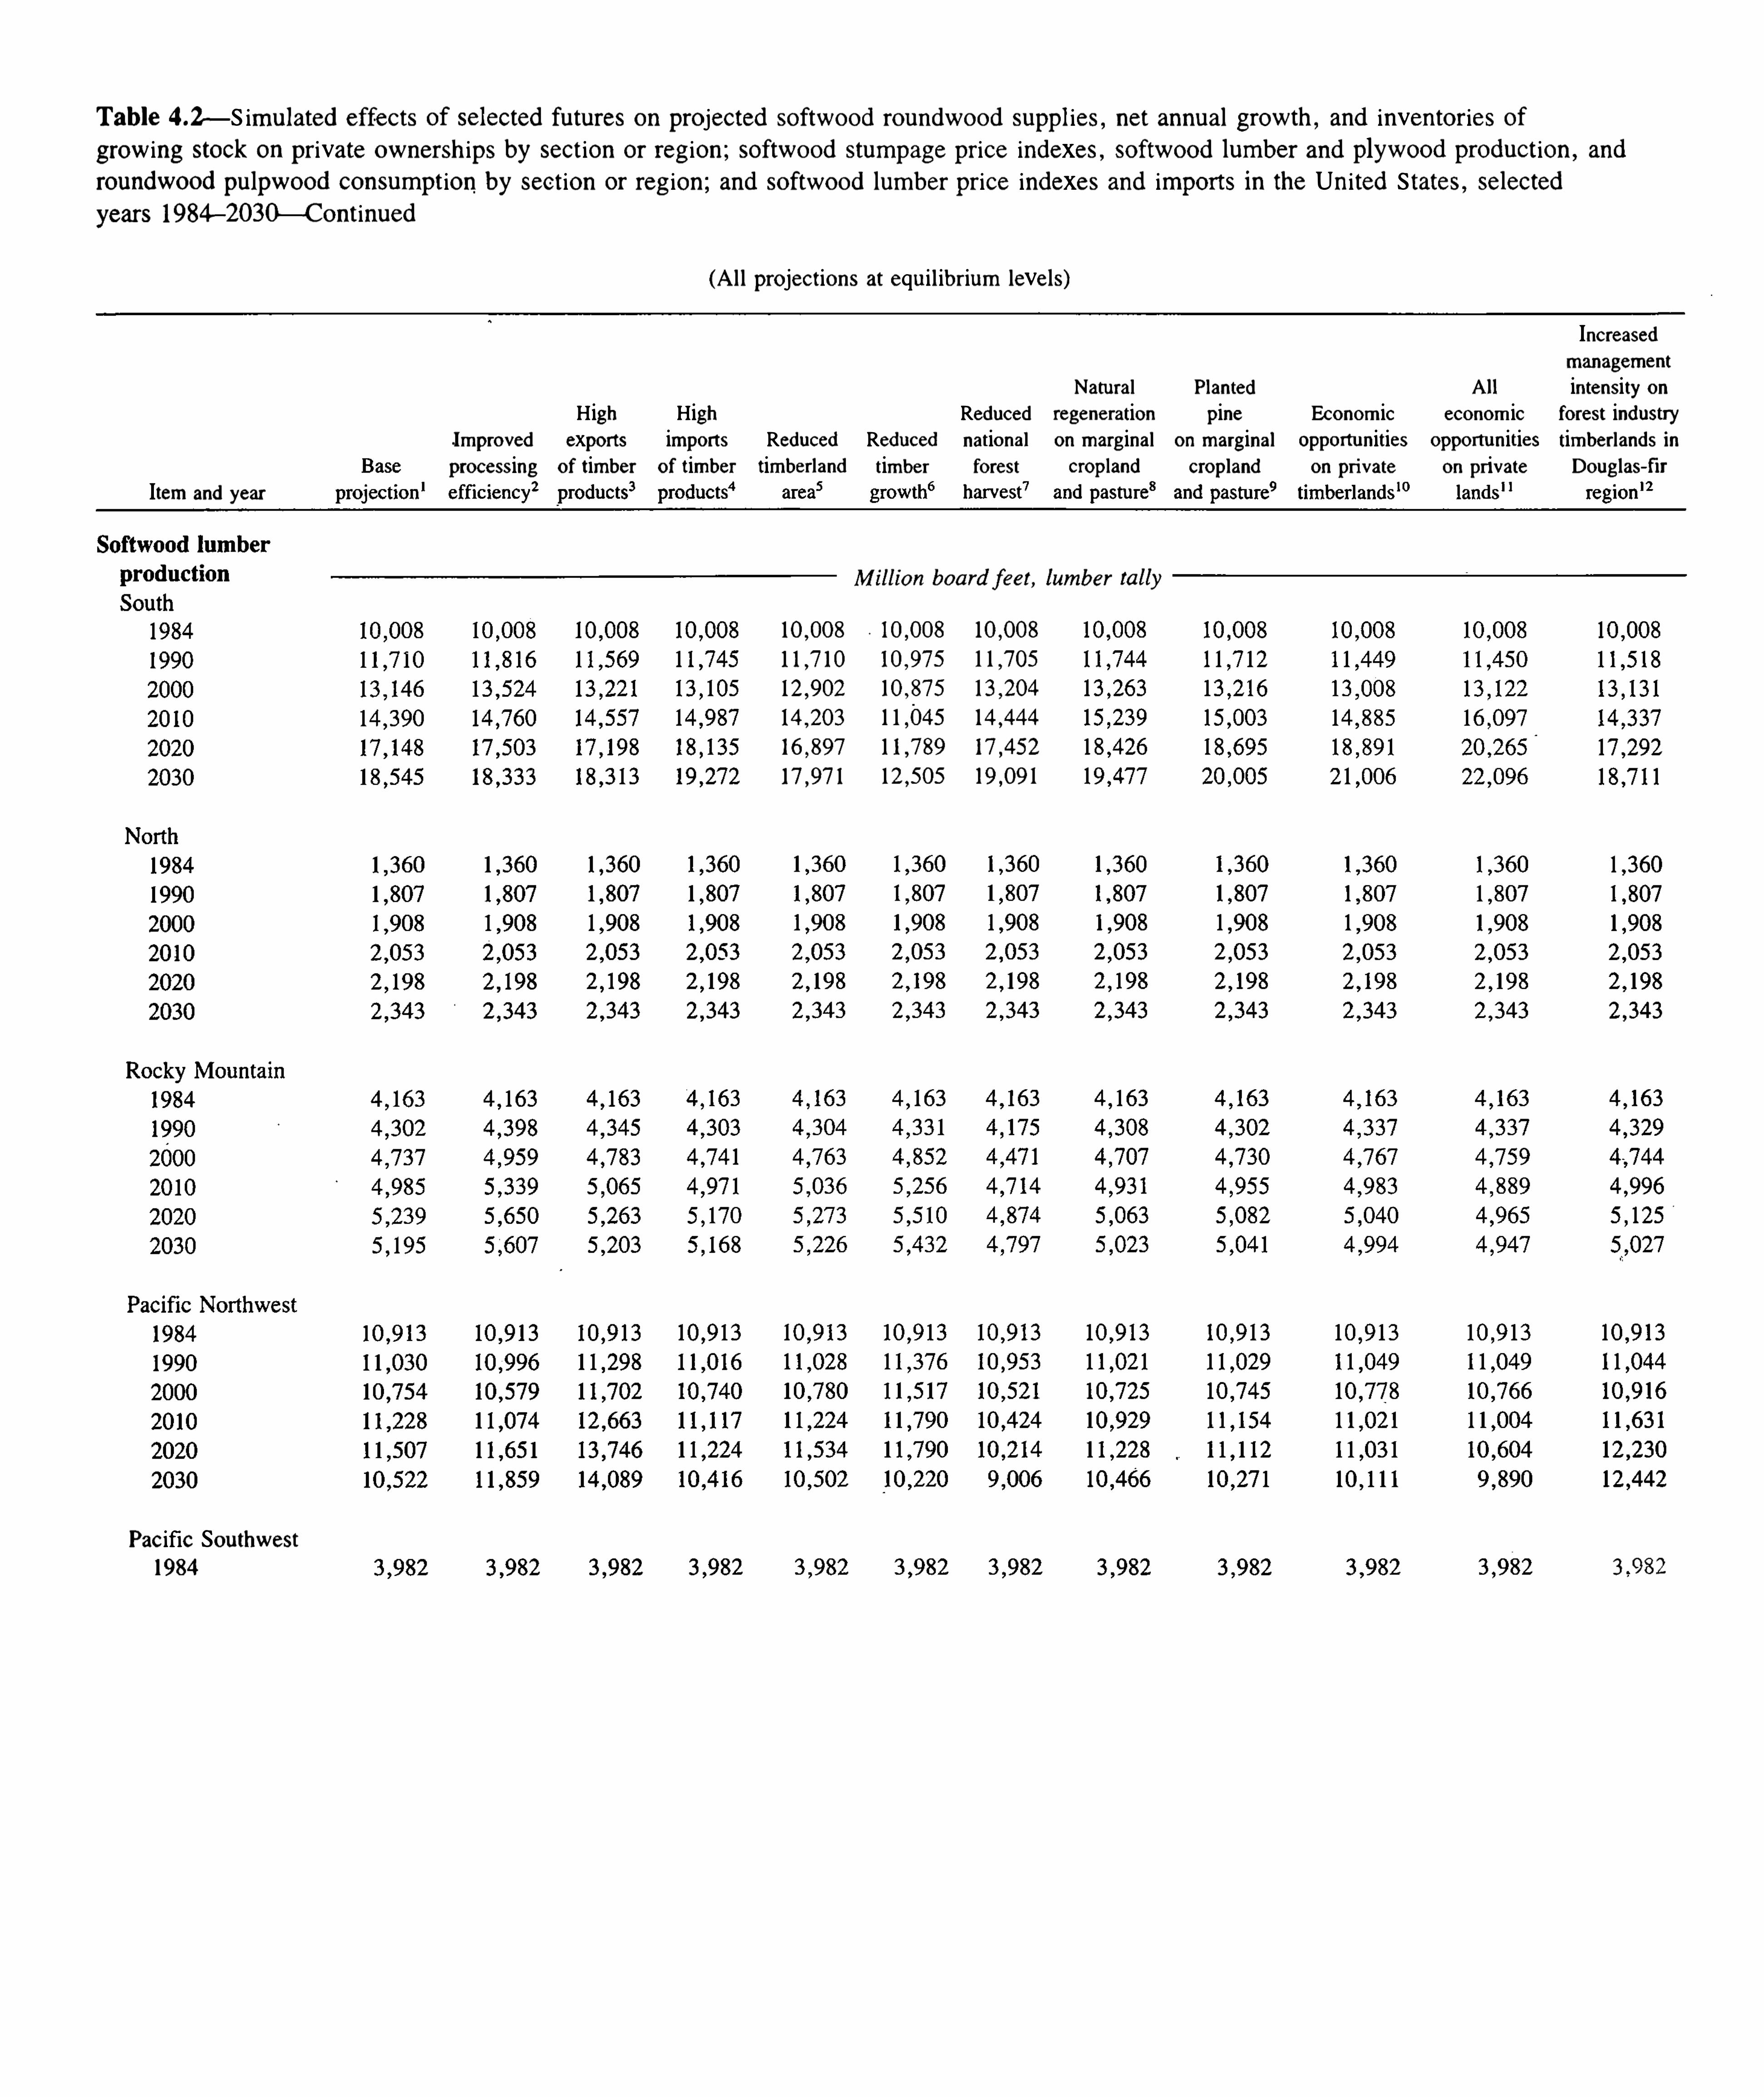
T ab le —S im u lated effects of selected fu tur es on projected softwood r ou ndwood suppl ies, net annu al growth , and inven tor ies of
gr ow ing stock on pr ivate owner sh ips by sect ion or r eg ion ; softwood stumpage pr ice indexes, softwood lum ber and plywood pr oduct ion , and
r oundwood pu lpwood consumpt ion by section or r eg ion ; and softwood lum ber pr ice indexes and impor ts in the Un ited S tates, selectedyear s 1984
—2030—C on t inued
(Al l projections at equ i l ib r ium levels)
Increasedmanagement
Natu r al Planted Al l in tensity onHigh High Reduced r egeneration pine Econom ic econom ic forest industryIm proved expor ts imports Reduced Reduced national on m arginal on m arginal Opportun ities opportun ities tim ber lands inpr ocessing of timber of timber timber land tim ber forest cropland cropland on pri vate on pr ivate Douglas
- fir
Item and year
Pac ific Sou thwest1984 3 c) 82
M i l l ion boa r d feet , lum ber ta l ly

T ab le — S im u lated effects of selected fu tur es on projected softwood r ou ndwood suppl ies, net annu al gr ow th , and inven tor i es of
gr ow ing stock on pr ivate owner sh ips by sect ion or r eg ion ; softwood stum page pr ice indexes, softwood lum ber and pl yw ood pr oduction , and
roundwood pu lpwood consum pt ion by sect ion or r eg ion ; and softwood lumber pr ice indexes and im por ts in the Un ited S tates, selectedyear s 1984
—2030—Con tinued
(Al l projections at equ il ibri um levels)
Increasedm anagement
Natu ral Plan ted Al l in tensity onH igh High Reduced regeneration pine Econom ic econom ic fo rest i ndustryImpr oved export s i m ports Reduced Reduced nationa l on marginal on m arginal Oppo rtu n ities Opport u n ities tim br ands in
processing of timber of timber timber land timber fore’
st cropland cr opland on pr ivate on pr ivate Doug las- fir
Item and year efficiency3 products3products
“area
3grow th
6har vest
’and pastu re
8and pastu re
9tim ber lands10 lands
l lregion
444

T ab le —S im u l ated effects of selected fu tu res on pr ojected softwood r oundwood suppl ies, net ann ual gr ow th , an d inven tor i es of
gr ow ing stock on pr i vate ow ner sh ips by sect ion or r eg ion ; softw ood stumpage pri ce indexes, softwood lum ber an d plyw ood pr oduct ion , and
r oundwood pu lpw ood consumpt ion by sect ion or reg ion ; an d softwood lum ber‘
pr i ce indexes and im por ts in the Un ited S tates, selectedyear s 1984
—2030— C on t inued
(Al l pr ojections at equ il ibr ium levels)
Increased
man agemen t
Natur al Plan ted Al l in tensity onH igh H igh Reduced r egener ati on p ine Economi c econom i c for est indusu'y
Impr oved export s imports Reduced Reduced nati onal on m ar ginal on m ar ginal opport u n ities opportu n iti es timber l ands inprocessing of t im ber of tim ber timber land tim ber for est cropland croplan d on pri vate on pri vate Douglas
- fir
Item and year ef fic iency3pr oducts
3products
“ar ea
3gr ow th
6har vest
7and pastu r e
8and pastu r e
9timber l ands‘" lan ds
"region‘3
Index ofp r i ces 1 967 1 00
T he futu r e as descr ibed by the basic assumpt ions an d other specified an d imp l ied assumptions u nder lyin g the pr oject ions in chapter 3 .
3T he futu r e as descr ibed by the basic assumpt ions and other spec ified an d impl ied assumptions in chapter 3 m od ified by increasing softw ood lumber an d plywood
yiel ds by 25 per cen t in stead of the l O-
per cen t in crease assum ed in the 1979 Assessmen t an d the Supp lem en t . The incr ease in y ields w il l be staged in the pro
gr ession 9 , 7 , 5 , 3 , and 1 per cen t per decade .
3T he fu tu r e as descri bed by the basic assum ptions and other spec ified and im p l ied assumpt ions in chapter 3 m odified by in cr easing the pr ojected expor ts oflumber , plywood , an d pu lpwood ( inc ludes pu lpwood an d the pu lpwood equ ivalen t of pu lp , paper , and boar d) by 20 per cen t in 1990 , 40 per cen t in 2000 , 60 per
cen t ln 20 10 , 80 percen t in 2020 , an d 100 per cen t in 2030 .
T he fu tu re as descr ibed by the basic assumpt ions and other spec ified an d imp l ied assumpt ions in chapter 3 m od ified by increasing the pr ojected im ports ofplywood , pu lpwood ( inc ludes pu lpwood an d the pu lpwood equ ival en t of pu lp , paper , and boar d) , and har dwood lumber and logs by 20 per cen t in 1990 , 40 per
cen t in 2000 , 60 per cen t in 20 10 , 80 per cen t in 2020 , and 100 percent in 2030 .
3T he fu tu re as descr ibed by the basic assumpt ion s an d other spec ified and impl ied assumptions in chapter 3 m od ified by r educing the projected ar ea in t im ber landin the Sou th by 2 m i l l ion acr es in 1990 , 5 m i l l ion acr es in 2000 , and 1 1 m i l l ion acr es in 2030 .
6T he fu tu re as descr ibed by the basic assumptions and other spec ified and im pl ied assumptions in chapter 3 m od ified by reduc in g the net annual gr owth on pin e
plan tations, natu r al p ine , and rr rixed pine—har dwood stands shown in the empir i cal yield tab les u sed in develop ing the base level project ions by 25 per cen t .
7T he futur e as descr ibed ‘
by the basic assumpt ion s and other spec ified an d impli ed assum ptions in chapter 3 mod ified by reducing timber harvests on the nationalfor ests to b il l ion boar d feet in 1990 an d m ain tai n i ng th is level thr ough 2030 .
3T he fu tu re .as descr ibed by the basic assumptions and other spec ified and impl ied assumptions in chapter 3 m od ified by assum ing that al l the m arginal croplan d
and pastu re in the Sou th that w ou l d yield h igher r ates of r etur n in p ine plan tat ions wou ld natu r all y r ever t to timber land by 2000 (70 percen t natur al p ine, 30 percen t har dwoods in the Sou theast ; 40 per cen t n atur al pine , 60 per cen t har dwoods in the Sou th Cen tr al ) .9The futu re as descr ibed by the basic assumptions and other spec ified an d impl ied assumpt ions in chapter 3 m odified by assum ing th at al l the m ar gin al cropland
and pastu r e“
in the Sou th w ou l d be p lan ted in p ine .
‘6T he fu ture as descri bed by the basic assumptions an d other spec ified and impl ied assumptions in chapter 3 m od ified by assum in g that al l the econom ic opportun i
t ies, except those invo lving in ter rnediate stand tr eatmen t and those not invo lvin g ar ea chan ge and m an agement types, for increasing tim ber suppl ies on tim ber land in
pri vate owner shi ps that~
yiel d 4 per cen t or m or e net of inflat ion or deflation wou ld be ut il ized .
T he futur e as descr ibed by the basic assumption s an d other spec ified and im pl ied assum pti ons in chapter 3 m od ified by assum i ng that al l the econom ic opportuni ties, except those involvin g in term ed iate stand treatm en t and those not invo lvin g ar ea chan ge and m an agemen t types, for increasin g t im ber suppl ies on timberlan d in pr ivate owner shi ps that yield 4 per cen t or m or e net of inflation or deflati on wou l d be u til i zed , and al l the m ar ginal cr oplan d an d pastur e wou ld be plan ted
1n pi ne .
‘3T he futur e as descri bed by the basic assumptions an d other spec ified and im pl ied assumpti ons in chapter 3 m odified by assumi ng that al l the econom ic opportu
ni ties to in crease t im ber suppl ies on forest in dustry tim ber l an ds in the Douglas- fir r eg ion wou ld be u til ized .
446

T ab le —Sim u l ated effects of selected fu tu r es on pr ojected har dwood r ou ndwood suppl ies on al l owner shi ps; net annual grow th and inven tori esof grow ing stock by pr i vate owner sh ip and reg ion ; and hardwood stumpage pr ice indexes, lumber pr oduct ion , and pu lpwood consumpt ion ,
by r egion , in the Sou th , selected year s 1984—2030
(Al l projec tions at equ i l ibr ium levels)
Increasedm anagement
Natu r al Plan ted Al l intensity onHigh High Reduced r egeneration pine Econom ic econom ic forest industryImproved expor ts import s Reduced Reduced nationa l on m arginal on marginal opportun ities oppor tun ities tim ber l ands inpr ocessing of timber of timber timber land timber forest cropland cropland on pr ivate on pr ivate Douglas
- fir
Item and year effic iency3
produc ts3products
“ar ea
3grow th
6har vest
7and pastu re
3and pastur e
9timber lands‘" lands
“region'3
Mi l l ion cub ic feet

T ab le —Sirnu lated effects of selected futures on pr ojected har dwood r oundwood suppl ies on al l ow ner ships; net ann ual gr ow th and inven tor iesof gr ow ing stock by pr i vate ow ner ship and r eg ion ; and har dw ood
‘
stumpage pr ice indexes, lumber pr oduct ion , and pu l pwood consum pt ion ,
by r eg ion , in the Sou th , selected year s 1984—2030—C on t inued
(Al l project ions at equ il ibr ium levels)
Incr eased
m anagement
Natur al Plan ted Al l in tensity onHigh High Reduced regenerati on pine Econom ic econom i c forest industryImproved expor ts impor ts Reduced Reduced national . on m arginal on m ar g inal opportu n iti es opportun ities timber lands inpr ocessing of tim ber of tim ber timber land timber for est c r opland cropland on pr ivate on pr ivate Douglas
-fi r5Item an d year effic iency
2pr oducts
3pr oducts
4ar ea gr ow th
6har vest
7
M i l l ion cub i c feet
448

T ab le — S im u l ated effects of_
selected futur es on pr ojected har dw ood r ou ndwood suppl ies on al l ow ner sh ips; net ann ual gr ow th and
inven tor ies of gr ow ing stock by pr i vate ow ner shi p and r eg ion ; and hardw ood stumpage pri ce indexes, lum ber pr oduction , and pu lpwood
consum pt ion , by reg ion , in the Sou th , selected year s 1984—2030—Con t inued
(Al l pr oject ions at equ i l ibri um levels)
Increased
management
Natur al Plan ted Al l intensity onHigh Hi gh Reduced regener ati on pine Econom i c econom i c for est industry
Impr oved export s imports Reduced Reduced national on m ar ginal on m ar ginal Oppor tu n ities opportuni ties timber lands in
processing of t imber of timber tim ber land timber forest cr oplan d cr oplan d on pri vate on pr ivate Douglas- fir
Item and year effic iencyz ‘
products3
7
produ cts4
ar ea5
gr ow th6 har vest
7and pastur e
8and pasture
9timber lands
l olandsl l region'2
45 ,000
450
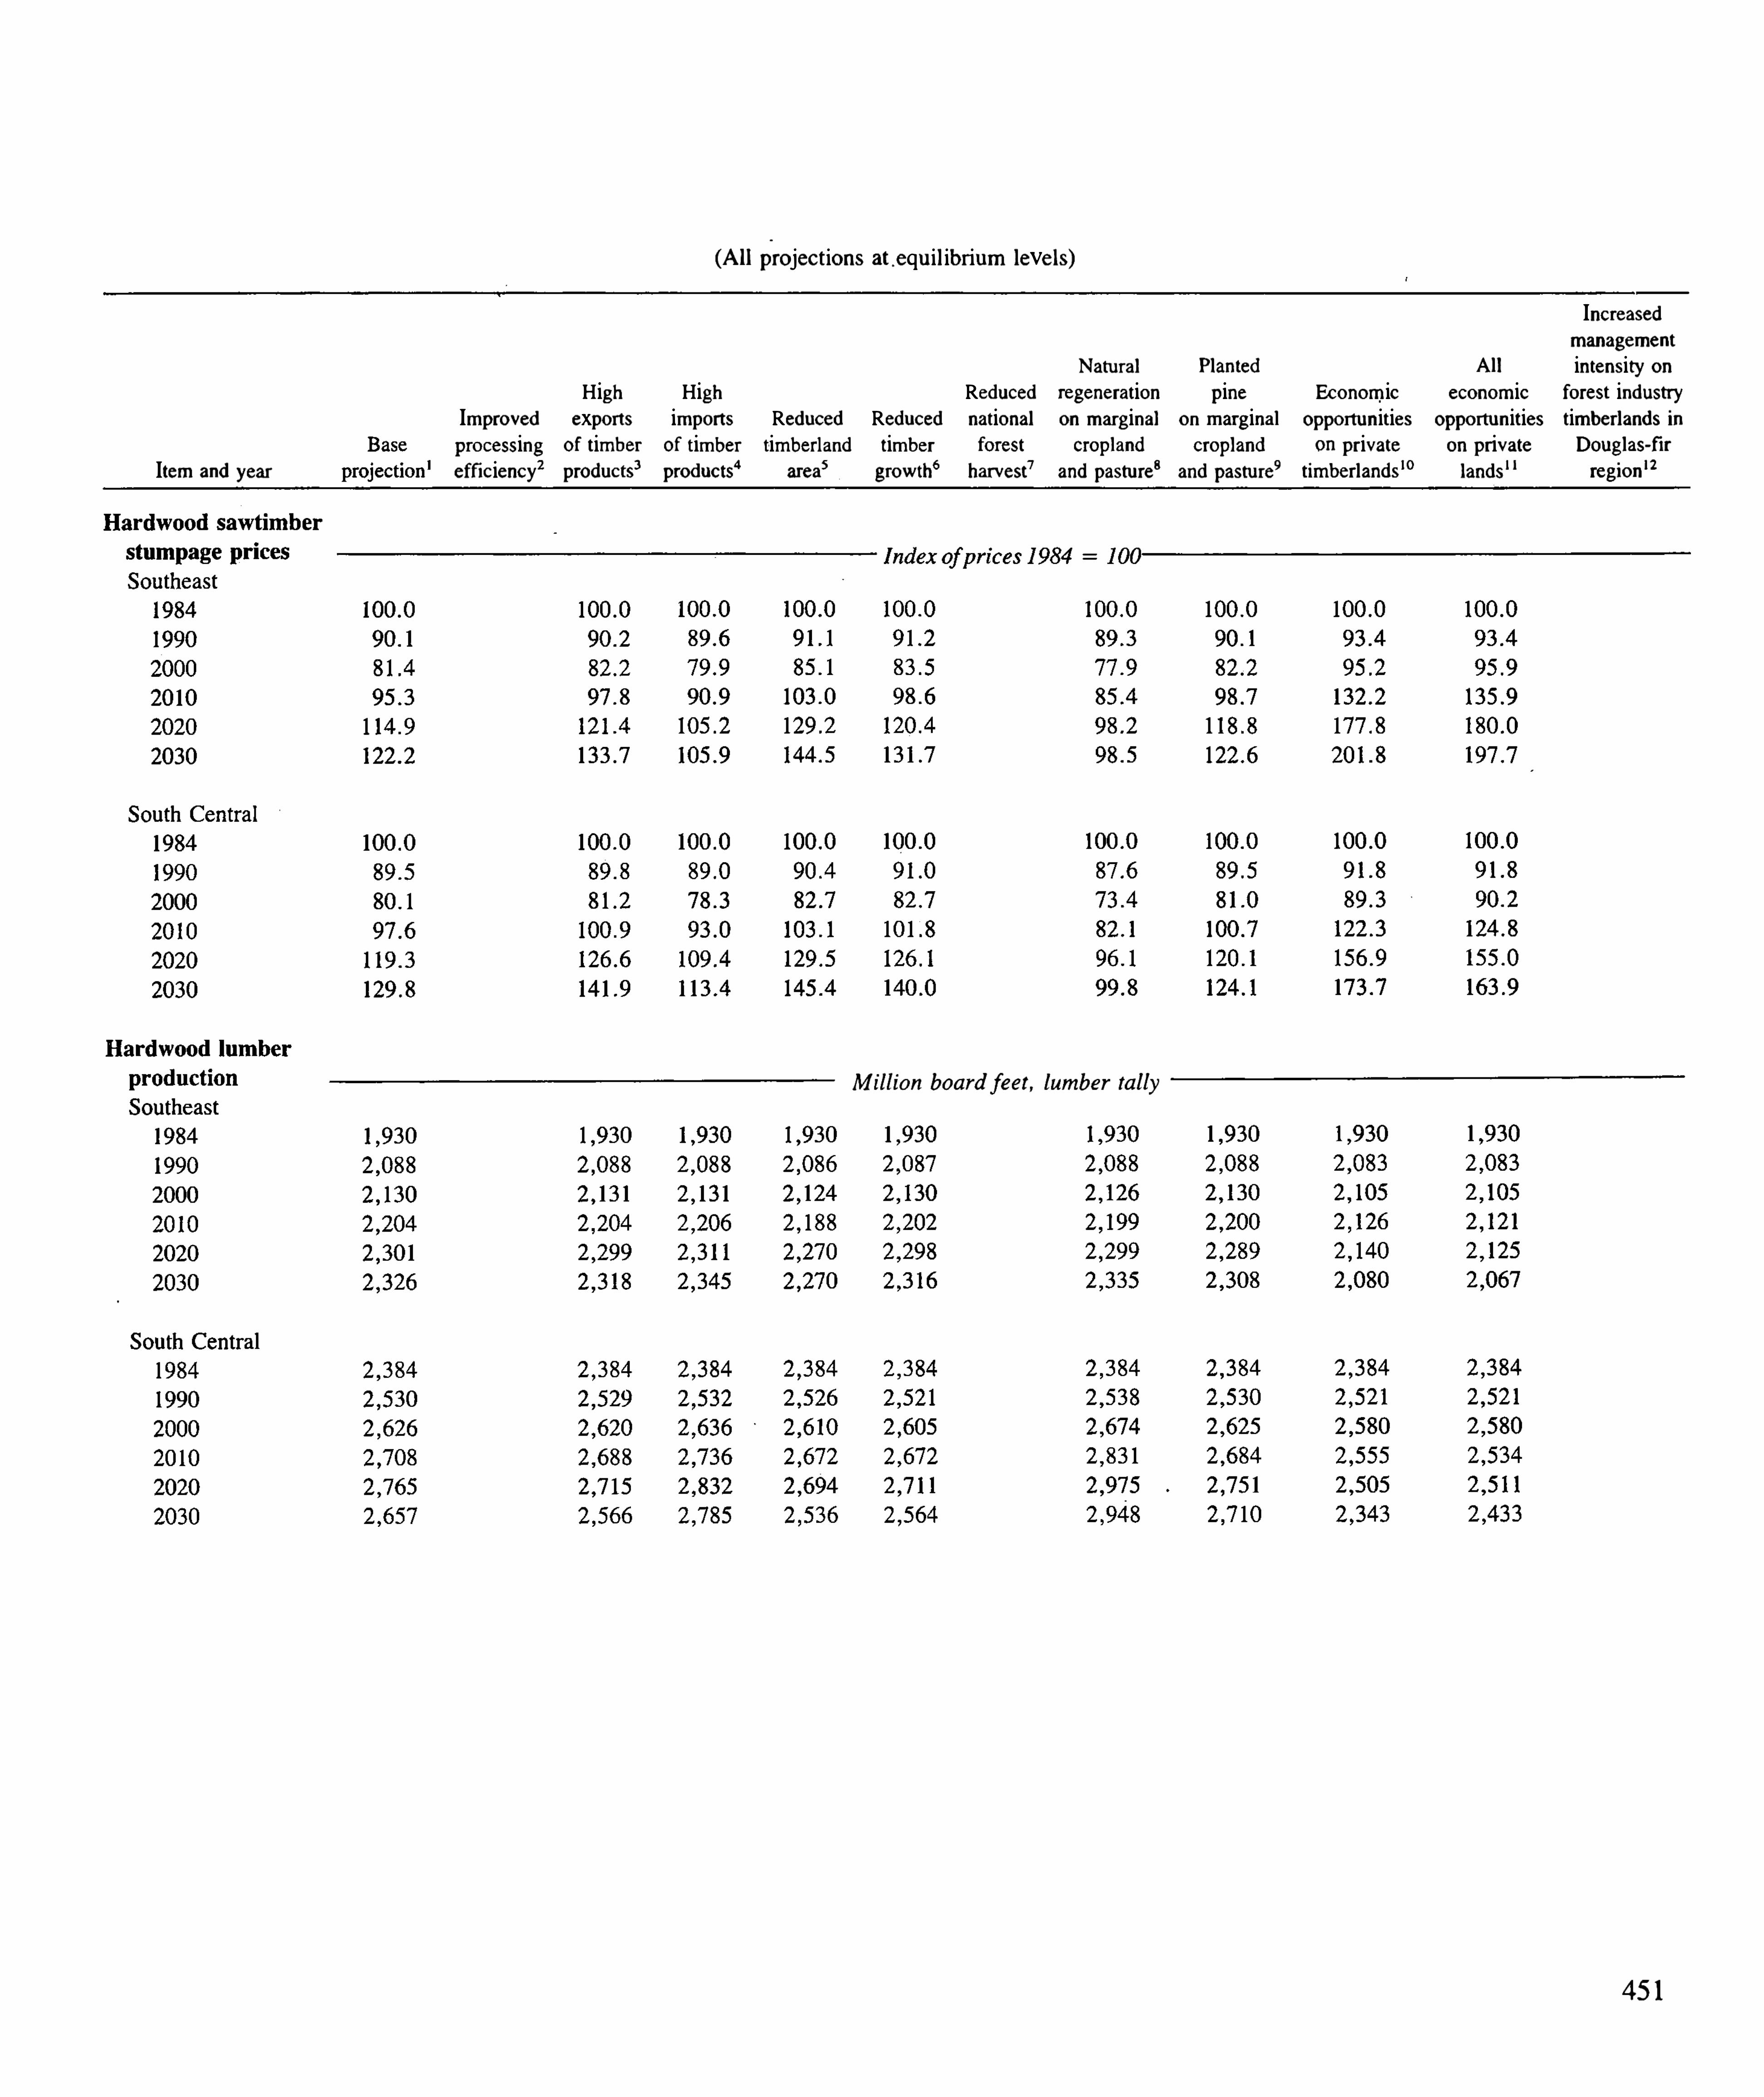
(Al l project ions “ equ i l ibr ium levels)
Incr easedmanagement
Natu r al Plan ted Al l in tensity onHigh High Reduced regeneration pine Econom ic econom ic forest industryImpr oved exports import s Reduced Reduced national on m ar ginal on m arginal Opportun ities opportu n ities timber lands inprocessing of tim ber of tim ber timber l and tim ber forest cr opland cr opland on pr ivate on pr ivate Douglas
- fi r
Item and year effi ciency2 products3pr oducts
“area
5grow th
6 harvest7
and pastur e3
and pastu re9
timber landsl o lands“
regionl 2
Mi l l ion boa r d feet , l um ber ta l ly
45 1

T ab le — S im u lated effects of selected fu tu r es on pr ojected har dwood r ou ndwood suppl ies on al l ow ner sh ips; net annual gr owth and
inven tor ies of grow ing stock by pr ivate ow ner sh ip and r eg ion ; and har dwood stumpage pr ice indexes, lum ber produ ct ion , and pu lpwood
consumpt ion , by r eg ion ,in the Sou th , selected year s 1984
—2030— Con t inued
(Al l pr oject ions at equ il ib r ium levels)
In creasedm anagement
Natu ral Plan ted Al l intensity onHigh High Reduced regeneration pine Econom ic econom ic forest industryImpr oved exports import s Reduced Reduced national on m ar ginal on m ar ginal Opportun ities oppor tun ities timber lands inpr ocessing of t im ber of t imber tim ber land timber forest cropland cropland on pri vate on pr ivate Douglas
- fir
Item and year
Mi l l ion cub ic feet
452

T ab le — S im u lated effects of selected fu tur es on pr ojected har dwood roundwood suppl ies, net an nu al gr ow th , and inventor ies of gr ow ingstock on pr ivate ow ner sh ips by sec t ion or reg ion ; har dw ood stumpage pr ices indexes, har dwood lum ber and r oundwood pu lpwood consum pt ionby sect ion or reg ion ; and har dwood lum ber pr ice indexes in the Un ited S tates, selected year s 1984—2030
(Al l pr oject ions at equ il ibr ium levels)
Increasedm an agement
Natur al Plan ted Al l in tensity onH igh High Reduced r egener ation pine Ec onom ic econom ic forest industr yImproved exports imports Reduced Reduced nati onal ou m ar ginal on m ar ginal oppo rtun ities Oppo rtu n ities tim ber lands inprocessing of tim ber
_ _
of t imber tim ber l and tim ber forest cropl and cropland on pr ivate on pr ivate Douglas- fi r
Item an d year effic iency2products
3pr oducts
“ar ea
5
grow th6
har vest7
and pastu re8
and pastu r e9
timber l an ds'" landsl l
regionI2
M i l l ion cubi c feet
454

T able —Sim u lated effects of selected fu tu r es on projected har dwood r oundwood suppl ies, net annual gr owth , and inven tor ies of grow ingstock on pr ivateowner sh ips by
'
sec t ion or reg ion ; hardwood stum page pr i ces indexes, har dwood .lumber and r oundwood pu lpwood consumpt ion
by sect ion or r eg ion ; and har dwood lum ber pr ice indexes in the Uni ted States, selected year s l 984—2030—Con t inued(Al l projec tions at equ il ibri um levels)
Increasedmanagemen t
Natu ral Plan ted Al l in tensity onH igh High Reduced r egeneration'
pine Econom ic econom ic fo r est industry
Improved exports im ports Reduced ' Reduced national on m arginal on m ar gi nal oppo rtu n ities oppo rtun ities timber lands inpr ocessing of timber of timber timber land timber for est cr opland cropland on pr ivate on pr ivate Douglas
- fir
Item and year effi ciency2 products3pr oducts
“ar ea
5grow th
6 har vest7
and pastu re8
and pastu re9
timber landslo
lands“
regionI2

T ab le — S im u lated effects of selected fu tur es on pr ojected har dwood roundwood suppl ies, net ann ual gr ow th , and inven tor ies of gr ow ingstock on pr ivate owner sh ips by sect ion or r eg ion ; har dwood stumpage pr ices indexes, har dwood lumber and r oundwood pu lpw ood consumpt ionby sect ion or r eg ion ; and har dwood lum ber pr ice indexes in the Un ited S tates, selected year s l 984—2030— Con t inued
(A l l'
pr oject ion s at equ i l ibr ium levels)
Increasedm anagement
Natu r al Plan ted Al l in tensity onH igh High Reduced r egeneration pi ne Econom ic econom ic forest industryIm proved exports imports Reduced Reduced national on m ar ginal on m ar ginal opportu n ities Oppor tun ities timber l ands inpr ocessing _
Of timber of tim ber tim ber land timber forest croplan d cropland on pr i vate on pr i vate Douglas- fi r
Item and year effi c iency2 products3products
“ar ea
5gr ow th
6har vest
7and pastu r e
8an d pastu r e
9tim ber l andsl o lands
”r eg ion 12
65 ,000 65 ,000 65 ,000 65 ,000
6 1 .562
456

Tab le — S im u l ated effects of selected futu r es on pr ojected har dwood r oundwood suppl ies, net ann ual gr ow th , and inven tor ies of grow ingstock on pr ivate ow ner sh ips by sect ion or r eg ion ; har dwood stumpage pr ices indexes, har dwood lum ber and roundwood pu lpwood consumption
by sect ion or r eg ion ; and hardwood lumber pr ice indexes in the Un ited S tates, selected year s l 984—2030—Con t inued(Al l project ions at equ i l ibr ium levels)
Increasedman agement
Natur al Plan ted All in tensity onH igh High Reduced r egeneration pine Econom ic econom ic forest indus
Impr oved exports imports Reduced Reduced national on m ar ginal on mar ginal opportu n ities opportu n iti es timber lands inpr ocessing of timber
_
of timber timber land timber forest cropland cropland on pr ivate on pri vate Douglas- fir
Item and year effic iency2products
3products
“area
5gr ow th
6 harvest7
and pastu res '
and pastu r e9
timber landsl o lands“
region 12
Mi l l ion boa r d feet , lumber ta l ly
458
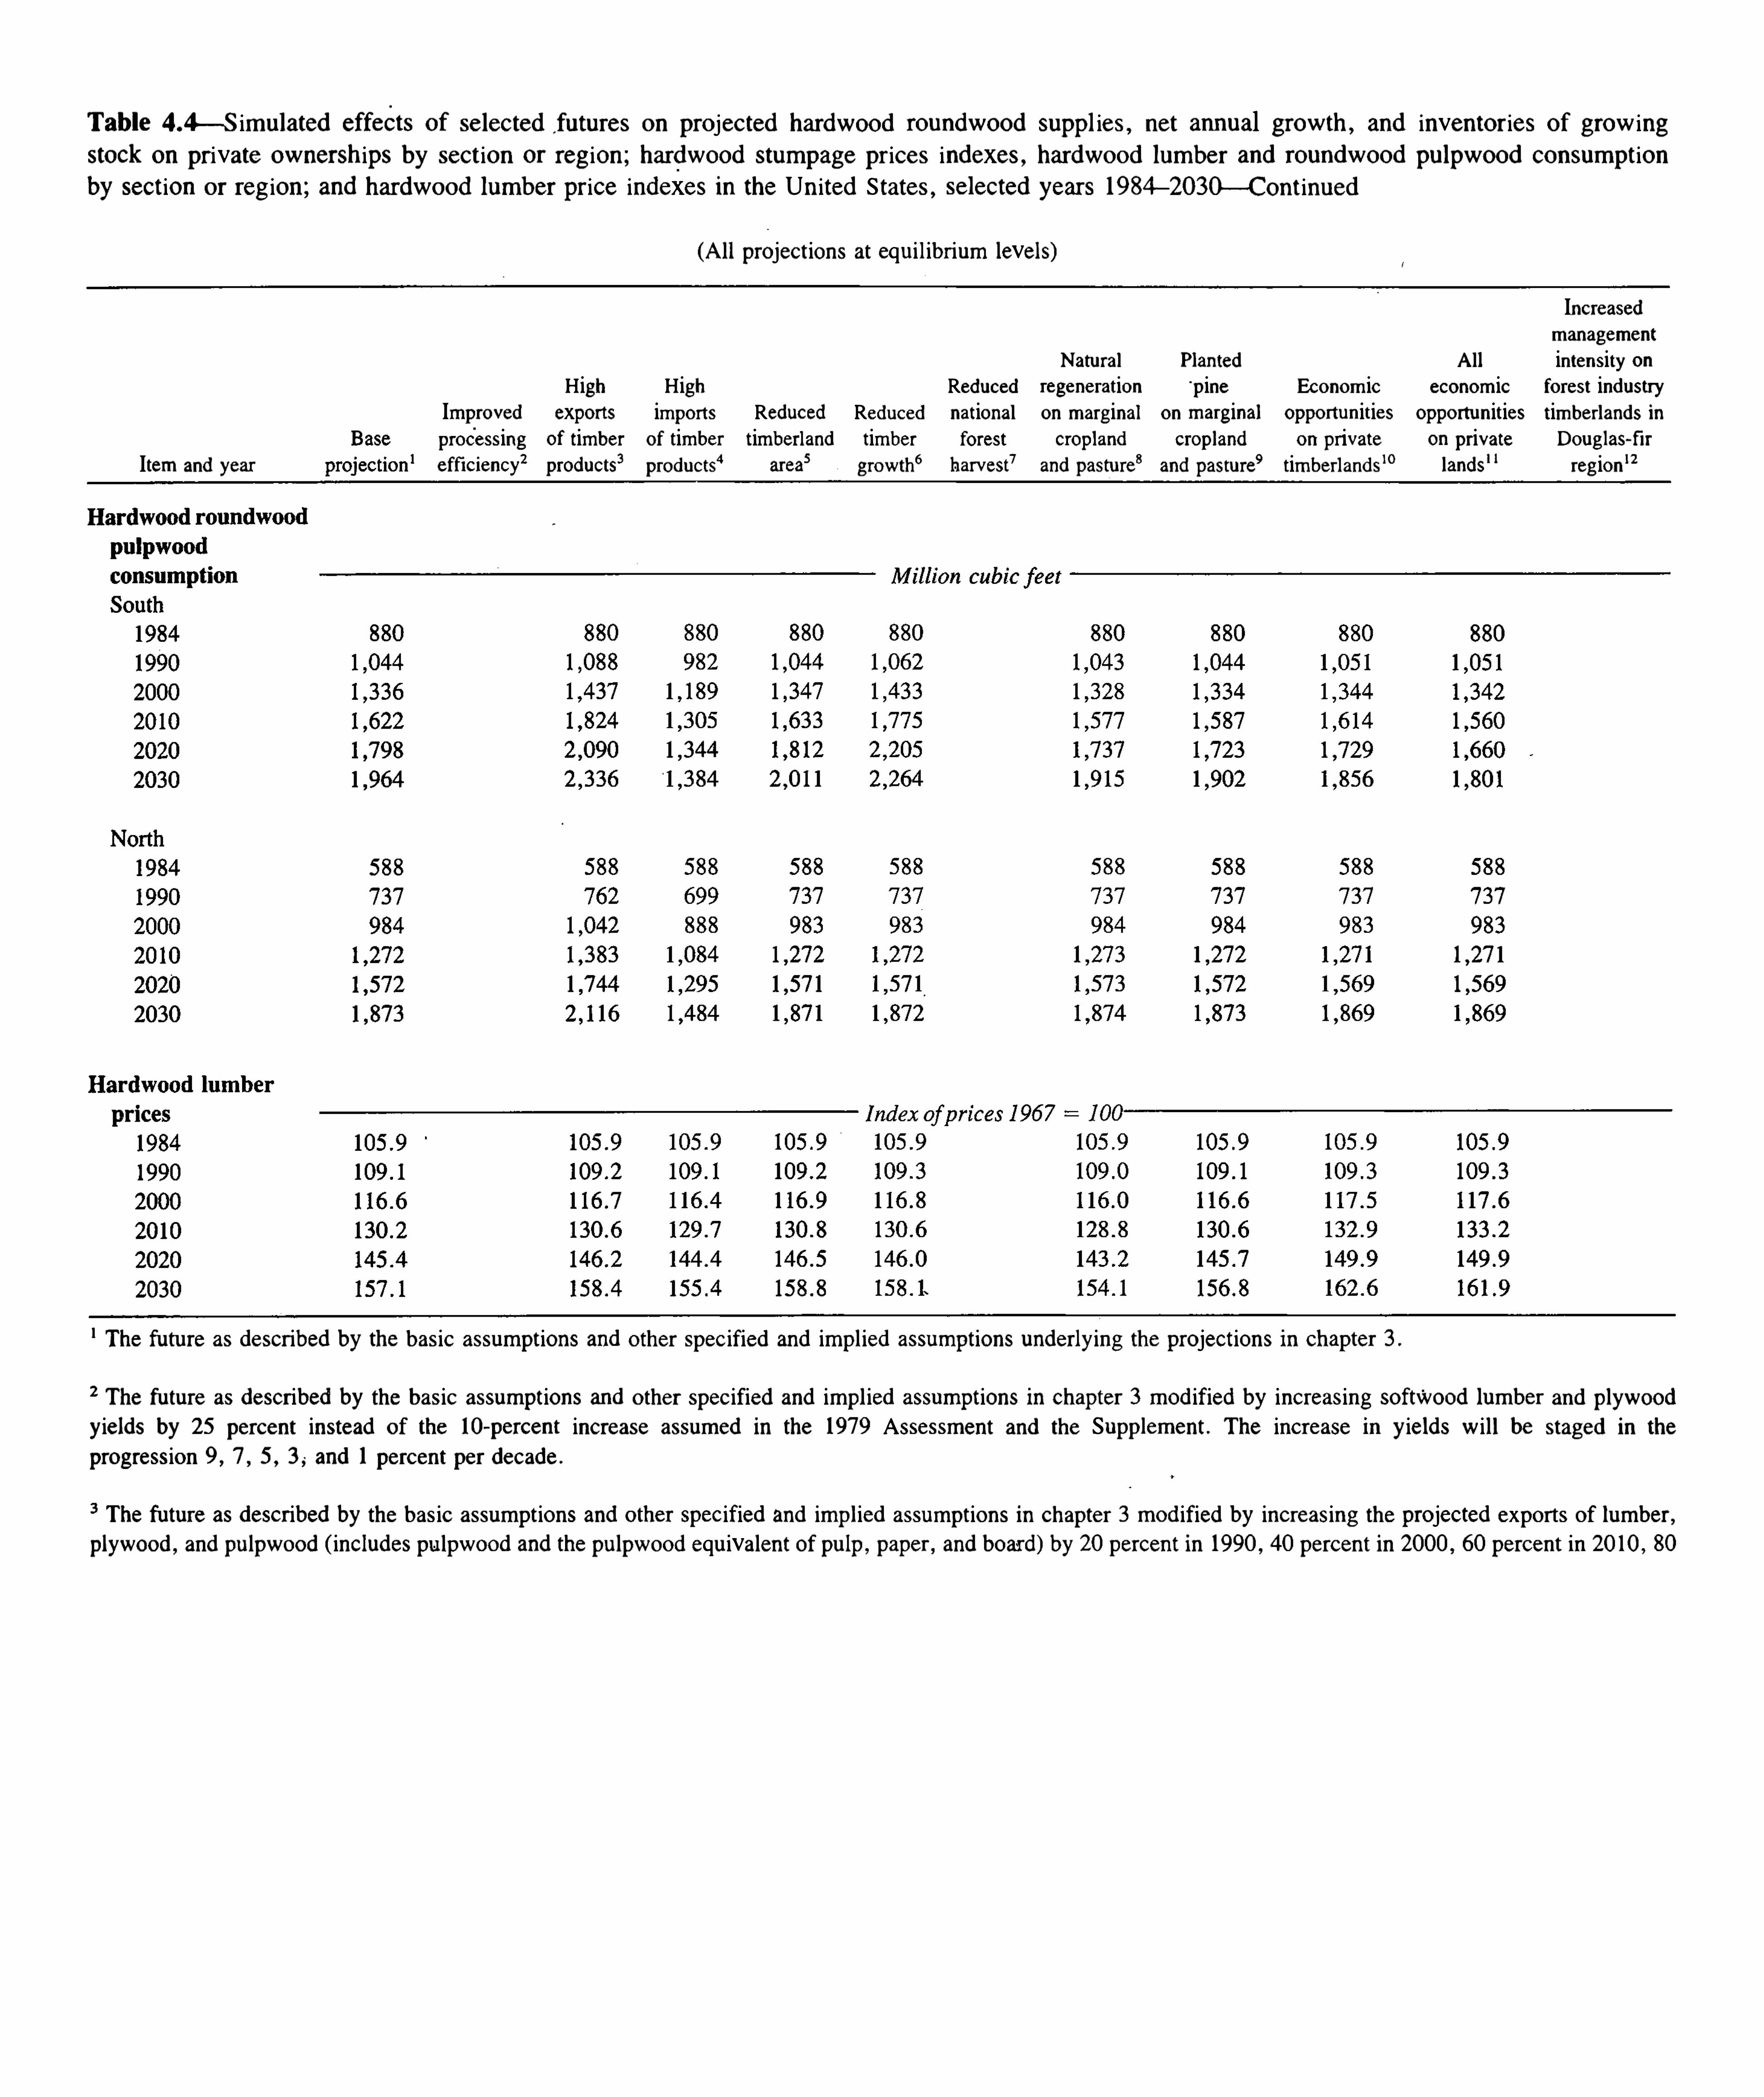
T ab le —S im u lated effects of selected fu tures on pr ojected hardwood roundwood suppl ies, net annual gr ow th , and inven tor ies of gr ow ingstock on pr ivate ow ner sh ips by sect ion or r eg ion ; hardwood stum page pr ices indexes, har dwood lum ber and r oundwood pu lpwood consum pt ion
by sect ion or reg ion ; and har dwood lumber pr ice indexes in the Un ited S tates, selected year s l 984—2030—Con t inued(Al l project ions at equ i l ibr ium levels)
In creasedman agement
Natu r al Plan ted Al l in tensity onHigh High Reduced regeneration“
pine Econom ic econom ic for est industryImpr oved export s impor ts Reduced Reduced national on m arginal on m arginal Oppor tun ities Opportun ities timber lands inprocessing of timber of timber timber land timber for est cropland cr opland on pr ivate on pr ivate Doug las
- fi r
Item and year effic iency2products
3products
“area
5gr ow th
6 har vest7 and pastu r e8
and pasture9
timber l ands10 lands”
region 12
T he fu tu r e as descr ibed by the basic assumptions and other spec ified and impl ied assumptions under lying the pr ojections in chapter 3 .
2T he fu ture as descr ibed by the basic assumptions and other spec ified and impl ied assumptions in chapter 3 m od ified by increasing softwood lum ber and plywood
yields by 25 per cen t instead of the l o-
per cen t incr ease assum ed in the 1979 Assessment and the Supplement . T he incr ease in yields w i l l be staged in the
progression 9 , 7 , 5 , 3 , and 1 per cen t per decade .
3T he fu tu re as descr ibed by the basic assumptions and other spec ified and imp l ied assumptions in chapter 3 m od ified by increasing the pr ojected expor ts of lum ber ,
plywood , and pu lpwood ( includes pu lpwood and the pu lpwood equ ivalen t of pu lp , paper , and boar d) by 20 per cen t in 1990 , 40 per cen t in 2000 , 60 per cen t in 20 10 , 80

T ab le — S im u lated effects of se lected fu tu r es on pr ojected hardw ood r oundwood supp l ies, net ann ua l gr ow th , and inven tor ies of gr ow ingstock on pr ivate ow ner sh ips by sect ion or r eg ion ; hardwood stumpage pr ices indexes, hardwood lum ber and r oundwood pu l pwood con sumptior
by sect ion or reg ion ; and hardwood lum ber pr ice indexes in the Un ited S tates, selected year s l 984—2030— Con t i-nued
7T he fu tu re as descr ibed by the basic assumpt ions and other spec ified and imp l ied assumptions in chapter 3 mod ified by reduc ing timber harvests on the nat iona
forests to b i l l ion board feet in 1990 and m a in ta in ing th is level th r ough 2030 .
8T he fu tu re as descr ibed “
by the basic assumpt ions and other spec ified and im pl ied assum pt ions in chapter 3 mod ifi ed by assum ing that al l the m ar g inal crOplanand pastu re in the Sou th that wou ld yield h igher r ates of r etu r n in pine plan tat ions wou ld n atu r al ly rever t to t im ber land by 2000 (70 per cen t natu ra l p ine30 per cen t hardwoods in the Sou theast; 40 per cen t natur a l p ine , 60 per cen t hardwoods in the Sou th Cen tr al ) .
9T he fu tu r e as descr ibed by the basic assum pt ion s and other spec ified and impl ied assumptions in chapter 3 mod ifi ed by assum ing that al l the m arg inal cr oplan
and pastur e in the Sou th wou ld be p lan ted in p ine .
'0T he fu tu re as descr ibed by the basic assum pt ions and other spec ified and im pl ied assum ptions in chapter 3 m od ified by assum ing that al l the econom ic oppor tun ities
except those invo lving in term ed iate stand treatmen t and those not invo lving'
ar ea change and m anagem en t types, for incr easing timber suppl ies on t im ber land in pr ivatow nersh ips that yield 4 per cen t or m ore net of inflat ion or deflat ion wou ld be u t i l ized .
T he fu tur e as descr ibed by the basic assumptions and other spec ified and impl ied assumptions in chapter 3 mod ified by assum ing that a l l the econom ic oppor tun itiesexcept those invo lving in term ed iate stand tr eatmen t and those not invo lving ar ea change and m an agemen t types, for increasing timber suppl ies on t imber land in pr ivatowner sh ips that yield 4 per cen t or m ore net of inflation or deflation wou ld be u ti l ized ,
and al l the m ar ginal cropland and pastu re wou ld be plan ted in pine .
'2T he fu tu re as descr ibed by the basic assum pt ions and other specified andimpl ied assumptions in chapter 3 m od ified by assum ing that a l l the econom ic oppor tun ities I
increase t im ber supp l ies on fo r est industry tim ber lands in the Doug las- fi r reg ion wou l d be u ti l ized .
460

T ab le —S im u lated effects of selected fu tur es on projected em ploym en t and w ages and salar ies in for est industr ies, investm en ts in
plan ts an d equ ipm en t , S tate an d local gover nm en t r evenues, in the Sou th , selected year s l 984—2030—C on tinued
(Al l pr oject ions at equ i l ibr ium levels)
Increasedm anagemen t
Natu r al Plan ted Al l in tensity onH igh High Reduced regener ation pine Econom ic econom ic for est industryImproved exports import s Reduced Reduced national on marginal on m argina l Opportun ities Oppo rtun ities timber lands inprocessing of timber of timber timber land timber forest cropland cr opland on pr ivate on pr ivate Douglas
- fi r
Item and year effic iency2products
3produc ts
“ar ea
Sgrow th
6har vest
7and pastu re
8and pastu re
9tim ber lands'" lands
l lregion
M i l l ion (1 982 ) do l la r s
45 ,934
462

utu re as descr ibed by the basic assumptions and other spec ified and impl ied assumptions under lying the pr ojections in chapter 3 .
utu re as descr ibed by the basic assumptions and other spec ified and impl ied assumptions in chapter 3 mod ified by incr easing softwood lumber and plywood
)y 25 per cen t instead of the l o- per cent increase assum ed in the 1979 Assessm en t and the Supplement . T he incr ease in yields w i l l be staged in the progr es7 , 5 , 3 , and 1 percen t per decade .
uture as descr ibed by the basic assumptionsand other spec ified and impl ied assumptions in chapter 3 mod ified by increasing the projected export s of lumber ,id , and pu lpwood ( inc ludes pu lpwood and the pu lpwood equ ivalen t of pu lp , paper , and board) by 20 percen t in 1990 , 40 percent in 2000 , 60 per cent in
30 percen t in 2020 , and 100 percen t in 2030 .
'
u tu re as descri bed by the basic assumptions and _other spec ified and impl ied assumptions in chapter 3 mod ified by increasing the projected imports of plywood ,
rod (includes pu lpwood and the pu lpwood equ ivalent of pu lp , paper , and board) , and har dwood lumber and logs by 20 per cent in 1990 , 40 percen t in 2000 . 60
t in 20 10 , 80 percen t in 2020 , and 100 per cen t in 2030 .
’u tu re as descr ibed by the basic assumptions and other spec ified and impl ied assumpt ions in chapter 3 mod ified by reduc ing the projected area in t imber landSou th by 2 m i l l ion acr es in 1990 , 5 m il l ion acr es in 2000 , and 1 1 m il l ion acres in 2030 .
future as descr ibed by the basic assumptions and other spec ified and impl ied assumpt ions in chapter 3 mod ified by reduc ing the net annual grow th on pineions, natu r al p ine , and m ixed pine—har dwood stands shown in the empir ical yield tables used in develop ing the base level pr ojections by 25 percen t .
futu re as descr ibed by the basic assumptions and other spec ified and impl ied assumptions in chapter 3 mod ified by r educ ing t im ber harvests on the nationalto b i l l ion board feet in 1990 and m a in tain ing th is level through 2030 .
fu ture as desc r ibed by the basic assumpt ions and other spec ified and impl ied assumptions in chapter 3 mod ified by assum ing that al l the m arg ina l cropland.sture in the Sou th that wou ld yield h igher r ates of r etur n in p ine plan tat ions wou ld natur al ly r evert to tim ber land by 2000 (70 per cen t natu r al p ine , 30 per
ardwoods in the Sou theast ; 40 percen t natu r a l pine , 60 percen t hardwoods in the Sou th Centr a l ) .fu tu re as descri bed by the basic assumpt ions and other spec ified and imp l ied assumptions in chapter 3 mod ified by assum ing that al l the m ar g ina l cropland.stu re in the Sou th wou ld be planted in p ine .
fu tu re as descr ibed by the basic assumptions and other spec ified and impl ied assumptions in chapter 3 mod ified by assum ing that al l the econom ic oppor tu n ities,those involving in term ed iate stand treatment and those not involving ar ea change and m anagemen t types, for incr easing timber suppl ies on t imber land inowner sh ips that yield 4 per cen t or m ore net of inflat ion or deflation wou ld be u ti l ized .
The fu tu r e as descr ibed by the basic assumpt ion s _and other spec ified and impl ied assum pt ions in chapter 3 mod i fied by assum ing that al l the econom ic
un ities, except those involving in term ed iate stand treatment and those not involving ar ea change and m anagem en t types, for incr easing timber suppl ies onland in pri vate owner sh ips that yiel d 4 per cent or more net of inflat ion or deflation wou ld be u t il ized , and al l the m arg inal crop land and pasture wou ld bei in pine .
fu tu re as descr ibed by the basic assumptions and other spec ified and impl ied assumptions in chapter 3 mod ified by assum ing that al l the econom ic oppor tuto increase tim ber suppl ies on forest industry timber lands in the Douglas- fir reg ion wou l d be u ti l ized .

T ab le — S im u lated effects of selected fu tu res on for age , w i ldl ife , fish , and w ater , by r eg ion in the Sou th ,selected year s 1985
—2030
(Al l pr oject ions at equ il ibr ium levels)
Increasedm anagement
Natu r al Plan ted Al l in tensity onH igh H igh Reduced r egeneration pine Econom ic econom ic forest industryImpr oved expor ts imports Reduced Reduced nationa l on marginal on m arg inal oppor tun ities oppor tun ities tim ber l ands in
_
pr ocessing of t im ber of tim ber tim ber l and timber for est cropland c r opland on pr ivate on pr ivate Douglas- fi r
Item and year effic iency2 products3products
“area
Sgrow th
6har vest
7and pastu re
8and pastu re
9tim ber lands10 lands
'lr egion
Mi l l ion tons
464

T ab le —S im ul ated effects of selected fu tu r es on for age ,w il dl ife , fish , and water , by reg ion in the South , selected year s l 985
—2030—Con tin ued
(Al l projections at equ il i br ium level s)
Increasedm anagement
Natu r al Planted Al l intensity OnHigh High Reduced regenera tion pine Econom ic econom ic forest industryImproved exports imports Reduced Reduced national on m ar g inal on m ar ginal Opportun ities oppo rtu n ities tim ber lands inpr ocessing of timber of timber tim ber land tim ber for est cropland c ropland on pr ivate on pr ivate Douglas
- fir
Item and year effi c iency2 pr oducts3products
“area
Sgrow th
6har vest
?and pastu re
8and pastu r e
9tim ber lands
lolands
“region
l 2
Number per squa r e m i le
Num ber of coun ties w i th act ive colon ies
Number per acr e of str eam
466

T able —S im u lated effects of selected fu tu r es on for age , w ildl ife , fi sh , and water , by reg ion in the Sou th , selected year s 1985- 2030—Conti nued
(Al l projections at equ il ibr ium level s)
Increasedm anagement
Natu r al Plan ted Al l intensity onH igh High Reduced r egeneration pine Econom ic econom ic forest industryImpr oved expor ts im port s Reduced Reduced national on m ar ginal on m arginal opportun ities opportun ities timber lands inpr ocessing of timber of tim ber timber land timber forest cropland cr opland on pr ivate on pr ivate Douglas
- fi r
Item and year effic iency2 pr oducts3products
“area
Sgr ow th
6harvest
7and pastu re
8and pastu re
9timber lands10 lands
l lregion
l z
In ches per yea r
T he fu tur e as descr ibed by the basic assumpt ions and other spec ified and impl ied assumpt ion s under lying the pr oject ions in chapter 3 .
2T he fu tur e as descr ibed by the basic assumptions and other spec ified and impl ied assumptions in chapter 3 mod ified by increasing softwood lum ber and plywood
yields by 25 percen t instead of the l o-
percen t incr ease assumed in the 1979 Assessmen t and the Supplemen t . T he incr ease in y ie lds w il l be staged in the progression 9 , 7 , 5 , 3 , and 1 percen t per decade .
3T he futu re as descr ibed by the basic assumptions and other specified and impl ied assumptions in chapter 3 m od ified by incr easin g the pr ojected expor ts oflumber , plywood , and pu lpwood ( inc ludes pu lpwood and the pu lpwood equ ivalen t of pu lp , paper , and boar d) by 20 percen t in 1990 ,
40 percen t in 2000 , 60
percent in 20 10 , 80 percen t in 2020 , and 100 per cen t in 2030 .
T he fu tu re -as descr ibed by the basic assumptions and other spec ified and impl ied assumptions in chapter 3 mod ified by increasing the projected import s of plywood , pu lpwood ( inc ludes pu lpwood and the pulpwood equ iva len t of pu lp , paper , and board) , and hardwood lumber and logs by 20 per cen t in 1990 , 40 per cen t
in 2000 , 60 percen t in 20 10 , 80 percent in 2020 ,and 100 per cen t in 2030 .
5T he futu re as descr ibed by the basic assumpt ions and other spec ified and impl ied assumpt ion s in chapter 3 mod ified by r educ ing the projected area in t im ber landin the Sou th by 2 m i l l ion acres in 1990 ,
5 m i l l ion acr es in 2000 , and 1 1 m il l ion acr es in 2030 .
6T he fu tu r e as descr ibed by the basic assumption s and other spec ified and im pl ied assumptions in chapter 3 m od ified by r educ ing thenet annual grow th on p ineplan tat ions, natu r al pine , and m ixed pine—har dwood stands shown in the empi r icalyie ld tab les used in developing the base level projections by 25 percen t .
7T he futu re as descr ibed by the basic assumptions and other spec ified and impl ied assumpt ions in chapter 3 mod ified by r educ ing t im ber harvests on the nationalforests to bi l l ion board feet in 1990 and m ain ta in ing th is level through 2030 .
8T he fu tu re as descr ibed by the basic assumpt ions and other spec ified and impl ied assumption s in chapter
‘
3 mod ified by assum ing that al l the m arg inal croplandand pastu re in the Sou th that wou ld yield h igher r ates of retu r n in p ine plantat ions wou ld natu r a l ly rever t to t imber land by 2000 (70 percen t natu r a l pine , 30
percen t har dwoods in the Sou theast ; 40 per cen t natu r a l pine , 60 percen t har dwoods in the Sou th Cen tr al ) .

[Th is page in ten tion ally
468

T ab le —Oppor tu n it ies for increasing tim ber suppl ies on t im ber l and in the Sou th that w i l l y iel d 4 per cen t l or m or e by owner sh ip , for est
m anagem en t type , and tr eatm en t oppor tun ity— Con t in ued
Al l ownersh ips For est industry Other pr ivate National forest Other publ ic
M i l l ion Mi l l ion M i l l ion Mi l l ion M i l l ion Mi l l ion M i l l ion M i l l ion M i l l ion Mi l l ion M i l l ion M i l l ion Mi l l ion M i l l ion Mi l l ic
a cr es do l la r s cub i c ft a cr es do l la r s cub i c ft a cr es do l la r s cub ic ft acr es do l la r s cub ic ft acr es do l la r s cub ic
470

T ab le —Oppor tun it ies for increasing t im ber suppl ies on t imber land in the Sou th that w il l y ield 4 per cen t1 or m or e by owner sh ip , for est
management type , and tr eatmen t oppor tun ity—C on t inued
Al l owner sh ips Forest industr y Other pr ivate National forest Other publ ic
Area Area Area Ar ea
Mi l l ion Mi l l ion M i l l ion Mi l l ion Mi l l ion Mi l l ion M i l l ion Mi l l ion Mi l l ion Mi l l ion M i l l ion Mi l l ion Mi l l ion Mi l l ion Mi l l ion
acr es do l la r s cubic ft acr es dol la r s cub ic ft a c r es do l la r s cubic ft acr es do l la r s cub ic ft a cres do l la r s cub ic ft
9317
1266
47 1

T ab le —Oppor tu n it ies fo r in cr easing tim ber suppl ies On t im ber land i n the Sou th that w il l y iel d 4 per cen t 1 or m or e by ow ner sh ip , forest
m an agem en t type , and tr eatm en t oppor tu n ity— C on t inued
Al l owner sh ips Forest industry Other pr ivate National forest Other publ ic
Area Ar ea Ar ea
M i l l ion M i l l ion M i l l ion M i l l ion Mi l l ion Mi l l ion Mi l l ion Mi l l ion Mi l l ion M i l l ion M i l l ion M i l l ion M i l l ion M i l l ion Mi l l ion
a cr es do l la r s cub i c ft a cr es do l la r s cubi c ft a cr es do l la r s cub ic ft a cr es do l la r s cubic ft acr es do l la r s cubic ft
Yields measu red in constan t dol lar s, net of inflation or deflat ion . Econom ic r etur n s do not inc lude l and costs, ad valor em taxes, or incom e taxes.
2Nonstocked or cu tover si tes w ith com pet in g vegetat ion and r equ ir ing site pr epar ation pr ior to regener at ion .
3Nonstocked or cu tover sites w ithou t sign ifican t competing vegetat ion not r equ ir ing site pr epar at ion for regener ation .
S ites stocked w ith low - qual ity trees or off- site spec ies’
r equ i r ing conver sion to prefer red spec ies to im pr ove pr oductivity .
5 S ites densel y stocked w ith seedl ings and/or sapl ings r equ ir ing precomm er c ial th inn ing or sim i lar tr eatmen ts to reduce stocking and favor poten tia l cr op trees.
6 S ites densely stocked w i th imm atu re bu t m er chan table tr ees.
7 S ites adequate ly stocked w ith tr ees, bu t w ith inh ib iting vegetat ion .
8 S ites w ith m atu re or overm atu re saw tim ber size tr ees.
9 S ites w ith m er chan table trees excessively dam aged by fir e , insects, d isease w ind ice or other destr uctive agen ts.
472

T ab le —Oppor tun it ies for in cr easing t im ber suppl ies on t im ber land in the Sou theast that w il l y iel d 4 per cen t 1 or m or e by ow ner sh ip ,
forest m anagem en t type , and treatm en t oppor tun ity—C on t inued
Al l treatmen ts earn ing :
less than 4 per cen t
474
Al l owner sh ips Forest industry ~Other pri vate
Ar ea
National for est Other publ ic
M i l l ion M i l l ion M i l l ion Mi l l ion Mi l l ion Mi l l ion Mi l l ion Mi l l ion M i l l ion Mi l l ion Mi l l ion M i l l ion Mi l l ion M i l l i on Mi l l ion
a c r es do l la r s cub ic ft acr es do l la r s cub ic ft acr es do l la r s cub ic ft acr es do l la r s cub ic ft acr es do l la r s cub ic ft

T ab le —Opport un it ies for increasing tim ber suppl ies on tim ber land i n the Sou theast that w ill y iel d 4 per cen t 1 or m ore by ow ner sh ip ,
forest m anagem en t type ,and tr eatm en t oppor tun ity— Con t inued
Al l ownersh ips Forest industry
Area
Other pr ivate Nation al forest Other publ ic
M i l l ion M i l l ion Mi l l ion M i l l ion Mi l l ion M i l l ion Mi l l ion M i l l i'
on Mi l l ion Mi l l io'
n Mi l l ion Mi l l ion Mi l l ion Mi l l ion Mi l l ion
do l la r s cub ic fta cr es acr es do l la r s cub ic ft acr es do l la r s cub ic ft a cr es do l la r s cub ic ft a c r es do l la r s cubi c ft
475

T able — Oppor tu n it ies for increasing t im ber suppl ies on t im ber l and in the Sou theast that w il l y ie l d 4 per cen t 1 or m ore by owner sh ip ,
for est m an agem en t type , and tr eatmen t oppor tun ity— Con t inued
Al l owner shi ps For est industry Other pr ivate National forest Other publ ic
Mi l l ion Mi l l ion Mi l l ion Mi l l ion Mi l l ion Mi l l ion Mi l l ion Mi l l ion M i l l ion M i l l ion Mi l l ion M i l l ion M i l l ion M i l l ion Mi l l ion
a c r es do l la r s cub ic ft a cr es do l la r s cub ic ft a cr es do l la r s cubic ft a cr es do l la r s cubic ft . acr es do l la r s cub ic ft
A l l treatmen ts ear n ing :4 per cen t or m or e
less than 4 per cen t
Yields measu red in constan t dol lar s, net of inflat ion or deflation . Econom ic retu r ns do not inc lude land costs, ad va lor em taxes, or income taxes.
2Nonstocked or cu tover sites w ith com peting vegetation and r equ iri ng site pr epar at ion pr ior to r egenerat ion .
3Nonstocked or cu tover sites w ithou t sign ifican t competing vegetat ion not r equ ir ing site prepar at ion for r egener at ion .
S ites stocked w ith low - qual ity tr ees or off- site spec ies r equ ir ing conversion to pr efer r ed spec ies to impr ove pr oduct ivity .
5 S ites densely stocked w ith seedl ings and/or sapl ings requ ir ing precomm er c ia l th inn ing or sim ilar treatm en ts to r educe stocking and favor poten t ial c rop tr ees.
6 S ites dense ly stocked w ith imm atu re bu t m er chan table tr ees.
7 S ites adequately stocked '
w ith tr ees, bu t w ith inh ib iting vegetation .
6 S ites w ith matu re or overm atur e saw timber size trees.
9 S ites w ith m erchan table tr ees excessively dam aged by fire , insects, d isease w ind ice or other destr uct ive agen ts.
476
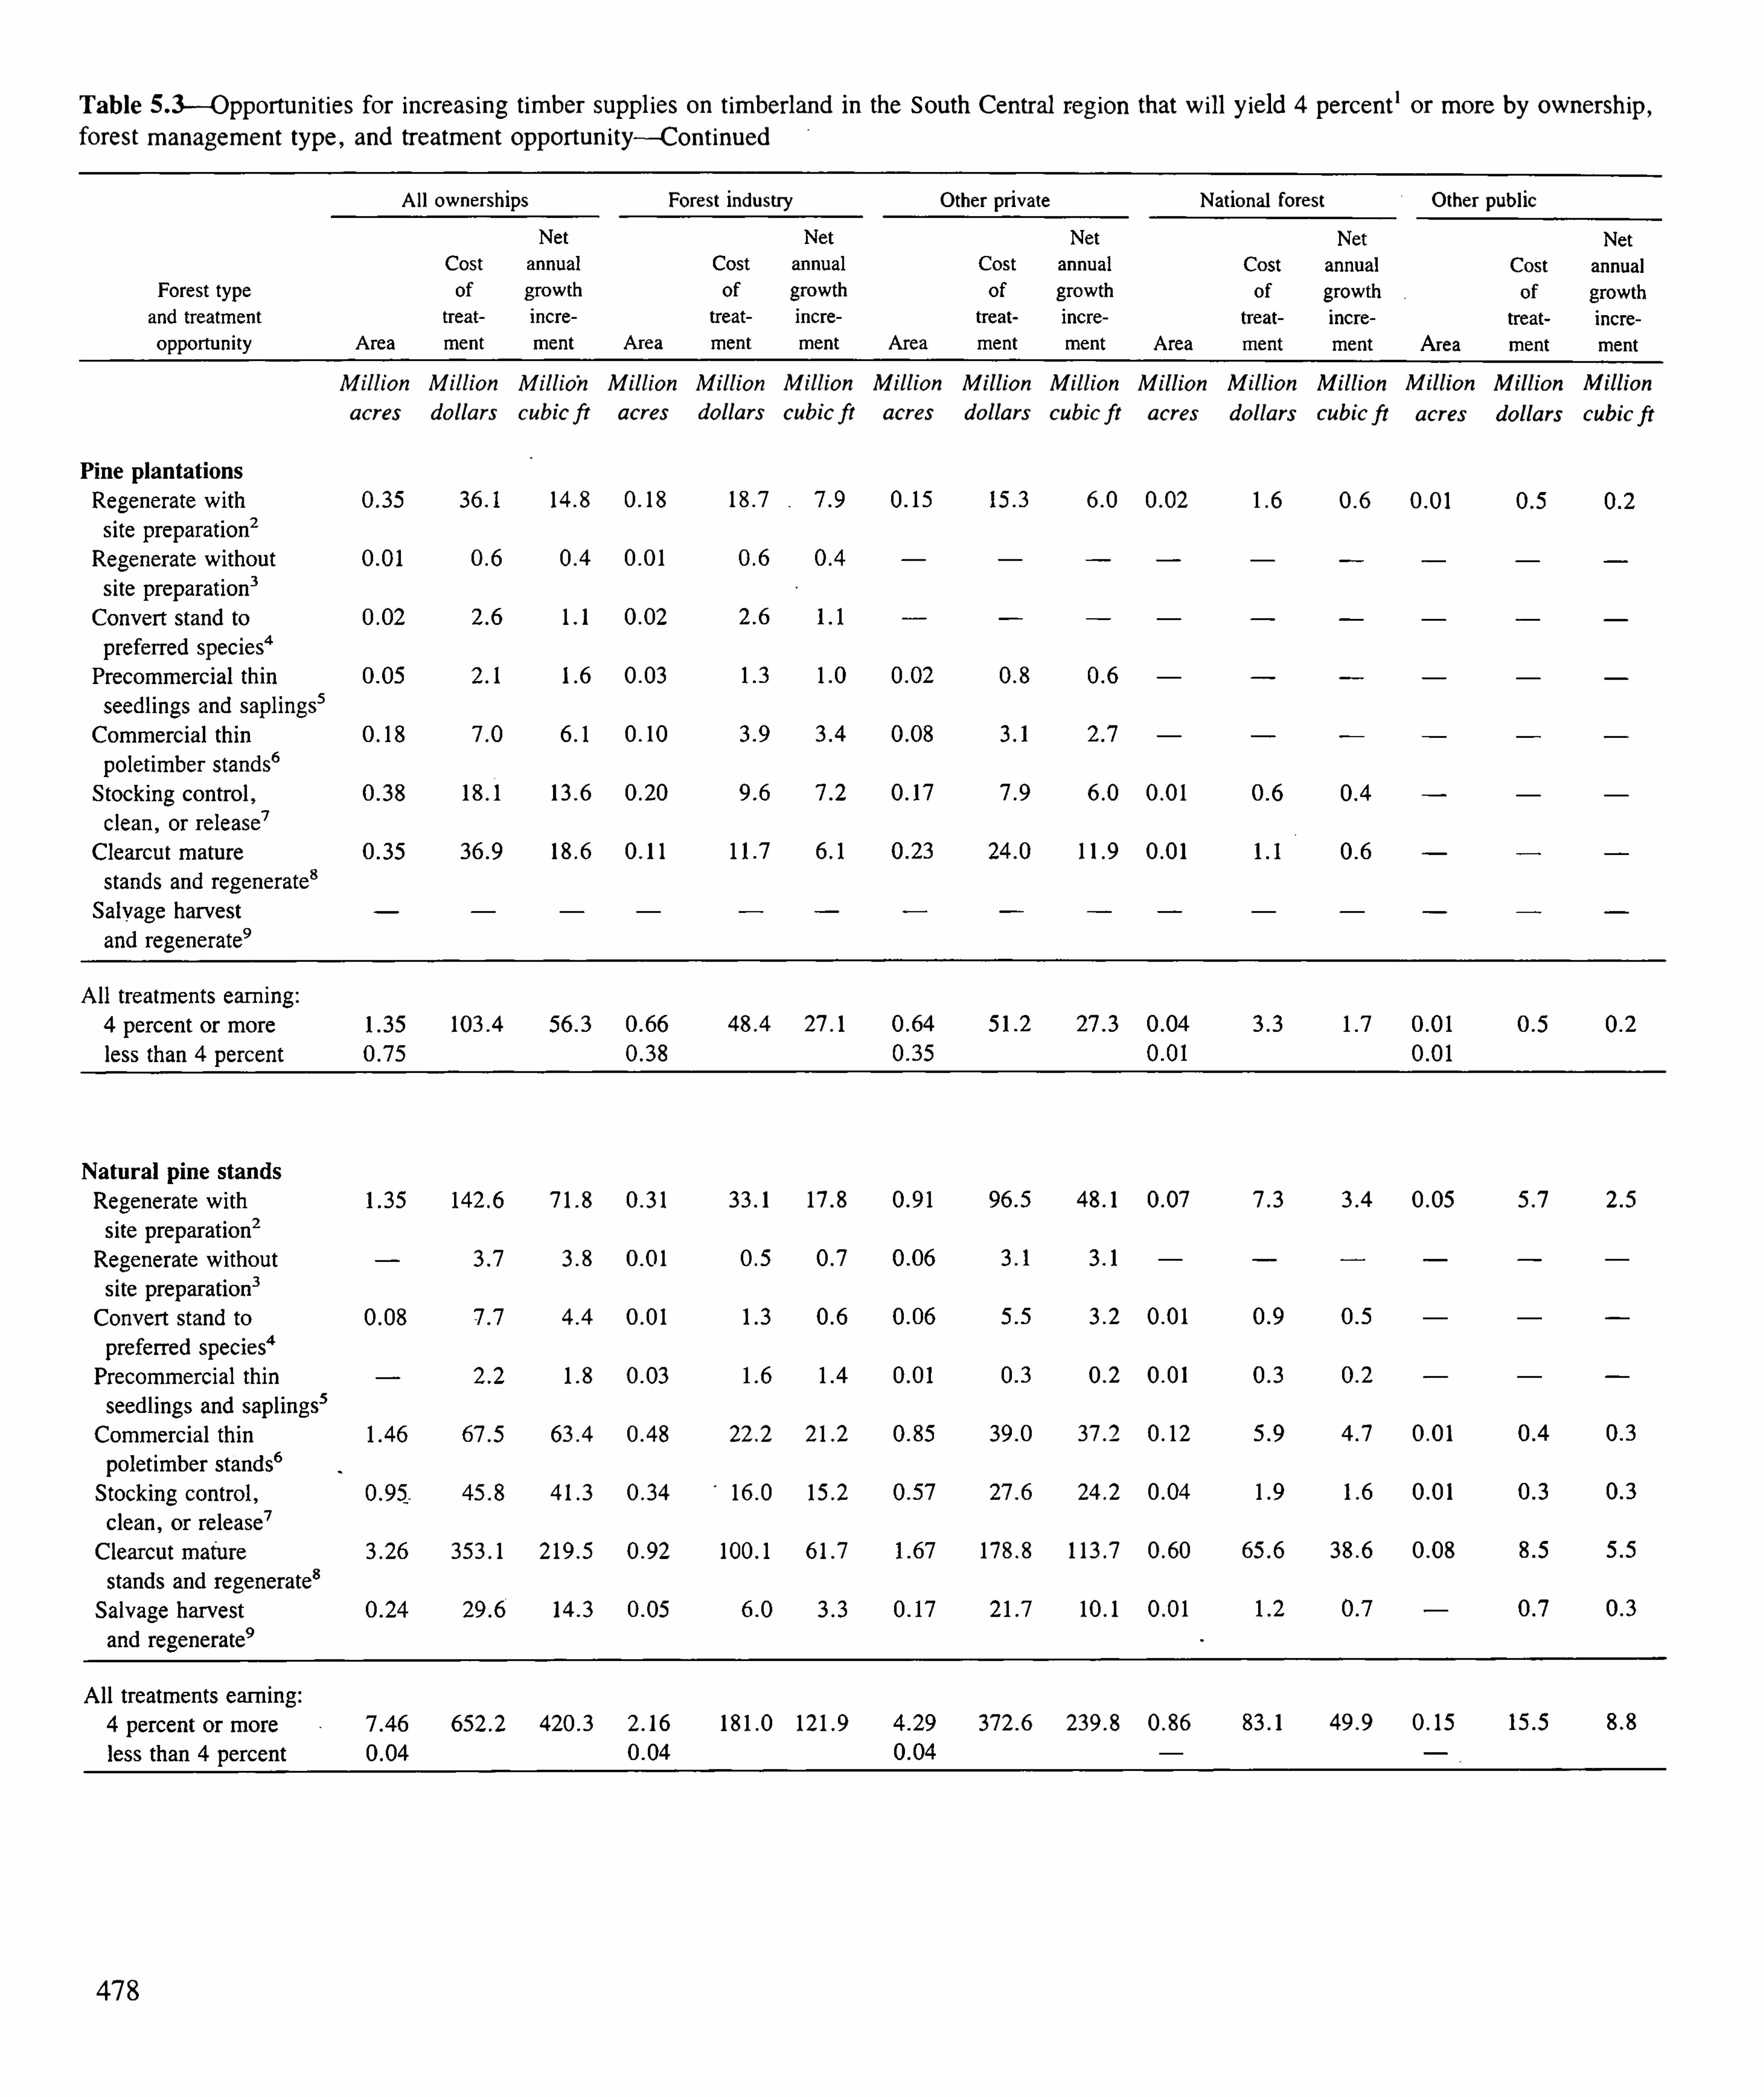
T ab le —Oppor tun it ies for increasing tim ber suppl ies on tim ber land in the Sou th Cen tr al r eg ion that w il l y ield 4 per cen t l or mor e by ownersh ip ,
for est m anagem en t type , and tr eatm en t oppor tun ity —Con t inued
All owner sh ips For est industry Other pr ivate National for est Other publ ic
Area
M i l l ion Mi l l ion Mi l l io'
n M i l l ion M i l l ion Mi l l ion Mi l l ion Mi l l ion Mi l l ion M i l l ion M i l l ion M i l l ion M i l l ion M i l l ion M i l l ion
a cr es do l la r s cub ic ft acr es do l la r s cub ic ft acr es do l la r s cub ic ft a cr es do l la r s cub ic ft acr es do l la r s cub ic ft
478

T ab le —Oppo r tun it ies for incr easing t im ber suppl ies on tim ber land in the Sou th Cen tr al r eg ion that w il l y ield 4 per cen t I or mor e by owner sh ip ,
forest m anagemen t type , and tr eatmen t oppor tun ity— C on t inued
Al l ownersh ips Forest industry -Other pr ivate National forest Other publ ic
Ar ea Ar ea Area Area
M i l l ion Mi l l ion M i l l ion Mi l l ion Mi l l ion Mi l l ion Mi l l ion M i l l ion Mi l l ion Mi l l ion M i l l ion M i l l ion M i l l ion Mi l l ion Mi l l ion
acr es do l la r s cub ic ft a cr es do l la r s cubic ft ac r es do l la r s cub ic ft acr es do l la r s cub ic ft acr es cub ic ft
0 3

T able —Opportun i t ies for incr easing t im ber Suppl ies on timber land in the Sou th Cen tr al r eg ion that w il l y iel d 4 per cen t 1 or m or e by ow ner sh ip ,
for est m anagem en t type , and tr eatm en t Oppor tun ity— Con t inued
Al l ow nersh ips For est industry Other pr ivate National forest Other publ ic
Mi l l ion M i l l ion M i l l ion Mi l l ion M i l l ion M i l l ion Mi l l ion M i l l ion M i l l ion M i l l ion M i l l ion M i l l ion M i l l ion Mi l l ion M i l l ion
ac r es do l la r s cubi c ft a c r es do l la r s cubic ft acr es do l la r s cub ic ft ac r es do l la r s cub ic ft a c r es do l lar s cubic fr
A l l treatmen ts ear n ing :4 per cen t or more
less than 4 per cen t
Yields m easu red in constan t do l lar s, net of inflat ion or deflation . Econom ic r etu r ns do not inc lude l and costs, ad valor em taxes, or incom e taxes.
2Nonstocked or cu tover sites w ith competing vegetat ion and r equ ir ing site pr epar at ion pr ior to r egener at ion .
5Nonstocked or cu tover sites w ithou t sign ifican t compet ing vegetat ion not r equ ir ing site pr epar ation for r egener at ion .
S ites stocked w ith low - qua l ity tr ees or off- site spec ies r equ iri ng conver sion to pr efer r ed spec ies to improve pr oduct ivity .
5 S ites densely stocked w ith seed l ings and/or sap l ings r equ ir ing pr ecomm er c ia l th inn ing or sim i lar tr eatm en ts to reduce stocking and favor poten t ial cr op tr ees.
6 S ites densely stocked w ith imm atu re bu t m er chan table tr ees.
7 S ites adequately stocked with tr ees, bu t w ith inh ib it ing vegetation .
8 S ites w ith m atu re or overm atu re saw t im ber size tr ees.
9 S ites w ith m er chan table tr ees excessively dam aged by fire , in sects d isease w ind ice , or other destr uct ive agen ts.
480

T able —Oppor tun it ies for increasing t im ber suppl ies in the Sou th that w il l y ield 10 per cen t 1 or m ore by ow ner sh ip , for est m anagem en t type ,
and tr eatm en t oppor tun ity— Con t inued
A11 ow nersh ips For est industry Other pr ivate National forest Other publ ic
Ar ea
Mi l l ion M i l l ion M i l l ion M i l l ion M i l l ion Mi l l ion M i l l ion Mi l l ion Mi l l ion Mi l l ion Mi l l ion Mi l l ion M i l l ion M i l l ion Mi l l ion
a cr es do l la r s cubic ft acr es do l la r s cub ic ft acr es do l la r s cub ic ft a c r es cub ic ft acr es do l la r s cub i c ft
482

T ab le —Oppor tun it ies for incr easing tim ber suppl ies in the Sou th that w il l y iel d 10 per cen t‘or m or e by owner sh ip ,for est m an agem en t type ,
and treatm en t oppor tu n ity— Con t inued
Ar ea
Al l ownersh ips
Ar ea
Forest industry Other pr ivate National forest Other pub l ic
Area
Mi l l ion Mi l l ion Mi l l ion Mi l l ion Mi l l ion Mi l l ion Mi l l ion Mi l l ion Mi l l ion Mi l l ion Mi l l ion Mi l l ion M i l l ion Mi l l ion Mi l l ion
dol l a r s cub ic ftacr es acr es do l la r s cub ic ft acr es do l la r s cub ic ft acr es do l la r s cubi c ft acr es do l la r s cubic ft

T ab le —Oppor tun it ies for incr easing t im ber supp l ies in the Sou th that w il l y ield 10 per cen t 1 or m or e by ow ner sh ip , for est m an agemen t type ,
and tr eatm en t oppor tu n ity— Con t inued
A11 ow ner sh ips Forest industry Other pr i vate National forest Other pub l ic
Mi l l ion Mi l l ion M i l l i on Mi l l i on M i l l ion Mi l l ion Mi l l ion M i l l ion Mi l l ion M i l l ion Mi l l ion Mi l l ion M i l l ion M i l l ion Mi l l ion
a cr es do l la r s cub ic ft acr es dol la r s cub ic ft acr es do l la r s cub i c ft a cr es do l la r s cub ic ft a cr es do l la r s cub ic ft
Yields m easu r ed in con stan t dol lar s, net of inflat ion or deflation . Econom ic retu rn s do not inc lude lan d costs, ad '
valor em taxes or incom e taxes.
2Nonstocked or cu tover sites w ith competing vegetat ion and requ iri ng site pr epar at ion pri or to r egener at ion .
5Nonstocked o r cu tover sites w ithou t sign ifican t compet ing vegetation not r equ iri ng site pr epar at ion for r egener at ion .
S ites stocked w ith low - qu al ity tr ees or off- site spec ies requ iri ng conver sion to pr eferr ed species to impr ove pr oduct ivity .
5 S ites densely stocked w ith seedl ings and/or sapl in gs r equ ir i ng pr ecomm er c ial th inn ing or sim i lar tr eatm en ts to r educe stocking and favor poten t ial cr op trees.
6 S ites densely stocked w ith imm atu re bu t m er chan table tr ees.
7 S ites adequatel y stocked w ith tr ees, bu t w ith inh ib iting vegetation .
6 S ites w ith m atu r e or over rn atu resaw t i in ber size tr ees.
9 S ites w ith m er chan table tr ees excessively dam aged by fir e , in sects d isease w ind , i ce or other destr uc t ive agen ts.
484

T ab le —Oppor tu n it ies for increasing t im ber suppl ies in the Sou theast that w il l y iel d 10 per cen t 1 or m or e by owner sh ip , for est
m an agem en t type , and tr eatm en t oppor tun ity— Con t inued
Al l owner sh ips Forest industr y Other pr ivate National for est Other publ ic
Ar ea Area
M i l l ion M i l l i on M i l l ion Mi l l ion Mi l l ion Mi l l ion Mi l l ion Mi l l ion M i l l ion Mi l l ion Mi l l ion M i l l ion M i l l ion Mi l l ion Mi l l ion
a c r es do l la r s cub ic ft a cr es do l la r s cub i c ft acr es do l la r s cub ic ft acr es dol la r s cub ic ft acr es do l la r s cub ic ft
486

T ab le —Oppor tun ities for incr easing t im ber suppl ies in the Sou theast that w il l y ield 10 per cent‘ or m or e by owner sh ip , for est
m anagemen t type , and tr eatm en t oppor tun ity— C on t inued
Al l ow nersh ips Forest industry Other pr ivate National fo r est.
Other publ ic
Area Area Ar ea Area
Mi l l ion M i l l ion M i l l ion Mi l l ion Mi l l ion Mi l l ion Mi l l ion Mi l l ion Mi l l ion Mi l l ibn Mi l l ion Mi l l ion M i l l ion Mi l l ion M i l l ion
acr es do l la r s cubic ft acr es do l la r s cubic ft acr es do l la r s cub ic ft acr es do l la r s cub ic ft acr es do l la r s cub ic ft
487

T ab le —Oppor tun it ies for incr easing t im ber suppl ies i n the Sou theast that w il l y iel d 10 per cen t 1 or m or e by ow ner shi p , for est
m anagemen t type , and treatmen t oppor tun ity— Con t inued
Al l ow nersh ips For est industry Other pr i vate National forest Other publ ic
Area Area
Mi l l ion M i l l ion M i l l ion Mi l l ion Mi l l ion Mi l l ion M i l l ion M i l l ion Mi l l ion Mi l l ion Mi l l ion M i l l ion Mi l l ion M i l l ion Mi l l ion
acr es do l la r s cub ic ft a cr es do l la r s cub ic ft acr es do l la r s cub ic ft ac r es do l la r s cub ic ft a cr es do l la r s cub ic ft
Yields m easu r ed in constan t do l lar s, net of inflation o r deflat ion . Econom ic r etu r n s do not inc lude land costs, ad valorem taxes or incom e taxes.
2Nonstocked or cu tover sites w ith competing vegetat ion and requ ir ing site pr epar ation pr i or to r egener at ion .
3Non stocked or cu tover sites w ithou t sign ifican t competing vegetat ion not requ ir ing site pr epar ation for r egener at ion .
S ites stocked w ith low - qua l ity trees or off- site spec ies r equ ir ing conver sion to prefer r ed spec ies to improve productivity .
5 S ites den sely stocked w ith seedl ings and/or sapl ings r equ iri ng pr ecomm er c ia l th inn ing or sim i lar tr eatm en ts to r educe stocking and favor poten t ial cr op tr ees.
6 S ites den sely stocked w ith imm atu r e bu t m er chan tab le tr ees.
7 S ites adequately stocked3
w ith tr ees, bu t w ith inh ib it ing vegetation .
6 S ites w ith m atu r e or overm atu re saw t im ber size trees.
9 S ites w ith m er chan table trees excessivel y dam aged by fir e , in sects d isease w ind ice , or other destr uct ive agen ts.
488

T ab le —Oppor tun it ies for increasing t im ber suppl ies i n the South Cen tr al r eg ion that w i l l y iel d 10 per cen t l or“ m or e by ow ner sh ip , forest
m anagem en t type , and tr eatm en t oppor tun ity— Con t in ued
490
Ar ea
M i l l ion Mi l l ion Mi l l ion M i l l ion Mi l l ion Mi l l ion M i l l ion Mi l l ion Mi l l ion Mi l l ion Mi l l ion Mi l l ion M i l l ion Mi l l ion M i l l ion
do l la r s cub ic ft acr esacr es
Al l ow nersh ips
do l la r s cub ic ft
Area
acr es
For est industry
do l la r s cub ic ft a cr es
Other pr ivate
do l la r s cub ic ft
Ar ea
a cr es
National forest Other publ ic
do l la r s cub i cfi

T ab le —Oppo r tun ities for incr easing t im ber supp l ies in the Sou th Cen tr al region '
that w i l l yield 10 per cen t1or m ore by owner sh ip ,
forest
managem ent type , and treatm en t opport un ity—Con t inued
Al l treatmen ts ear n ing10 percent or m ore
Ar ea
Al l ownersh ips
Area
Forest industry Other pr ivate
Ar ea
National forest
Area
Other publ ic
Mi l l ion Mi l l ion Mi l l ion Mi l l ion Mi l l ion Mi l l ion Mi l l ion Mi l l ion Mi l l ion M i l l ion Mi l l ion Mi l l ion M i l l ion Mi l l ion Mi l l ion
do l la r s cub ic ftacr es a cr es dol la r s cub ic ft acr es do l la r s cubic ft a c r es do l la r s cub ic ft acr es do l la r s cub i c ft
49 1

T ab le —Oppor tun it ies for increasing t im ber suppl ies in the Sou th Cen tr al r eg ion that w il l y iel d 10 per cen t 1 or m ore by ownershi p , for est
m anagem en t type , an d tr eatmen t oppor tun ity—Cont in ued
A l l owner sh ips Forest industry Other pr ivate National for est Other pub l ic
Area Area
M i l l ion M i l l ion.
Mi l l ion Mi l l ion M i l l ion M i l l ion Mi l l ion M i l l ion Mi l l ion M i l l ion M i l l ion M i l l ion Mi l l ion M i l l ion Mi l l ion
a cr es do l la r s cubic ft acr es do l la r s cubic ft a c r es do l la r s cub ic ft acr es do l la r s cubic ft acr es do l la r s cub ic ft
A l l tr eatm en ts ear n ing :
less than 10 per cen t
Yields measu red in con stan t do l lar s, net of inflat ion or deflation . Econom ic r etu r n s do not include land costs, ad valor em taxes, or in come taxes.
2Nonstocked or cu tover sites w ith competing vegetat ion and r equ ir in g site pr epar at ion pr ior to r egener at ion ,
3Nonstocked or cu tover sites w ithou t sign ifican t com pet ing vegetat ion not r equ ir ing site prepar at ion for r egener ation .
S ites stocked w ith low - qua l ity tr ees or off- site spec ies requ ir ing conver sion to pr efer r ed spec ies to im prove pr oduct ivity .
5 S ites densely stocked w ith seedl ings an d/or sapl ings requ ir ing pr ecomm ercial th inn ing or sim i lar treatm en ts to redu ce stocking an d favor poten tial cr op tr ees.
6 S ites densely stocked w ith i rmn atu r e bu t m er chan table tr ees.
7 S ites adequately stocked with tr ees, bu t w ith inh ib it ing vegetat ion .
6 S ites w ith m atu re or overm atu r e saw t im ber size tr ees.
9 S ites w ith m er chan table tr ees excessive ly dam aged by fir e , in sects d isease w ind ice or other destr uct ive agen ts.
492

2 . 12 Softwood p lywood pr oduct ion i n the Sou th , by reg ion , 1964—84
2 . 13 Aver age stum page pr ices for saw t im ber on pr ivately ow ned land in the Sou th , 1880—1985
2 . 14 Aver age stum page pri ces for pu lpwood on pr i vatel y ow ned l and in the Sou th , 1935—85
Ch apter 3—P r ojected Ch an ges in th e T im ber Resou r ce3 . 1 Popu l at ion , econom ic act ivity , and incom e i n the Un ited S tates, 1929—86with pr oject ion s to 2030
New housing un it product ion i n the Uni ted S tates, by type of uni t , 1950—84 ,w ith project ions to 2030
Lum ber con sum pt ion in the Un ited S tates, 1950—84 , w ith pr oject ions to 2030
S tr uctu r al panel con sumpt ion in the Uni ted S tates, by type , 1950—84 , w ith pr oject ions to 2030
Nonstr uctu r al panel con sumpt ion in the Uni ted S tates, by type , 1950—84 , w ith pr oject ions to 2030
— Pu lpwood pr odu ct ion in the Un ited S tates, by sou r ce of m ateri al , 1950—84,w ith projections to 2030
Roundwood consum pt ion by product in the Un ited S tates, 1952—84 ,w ith project ions to 2030
— Roundwood consum pt ion and har vests i n the Un ited S tates, 1952—84 ,w ith pr oject ion s of dem an d and suppl ies
to 2030
T im ber l and ar ea in the Sou theast r eg ion , by S tate , 1952—85 , w ith pr oject ion s to 2030
— T im ber land ar ea i n the Sou th Cen tr al r eg ion , by S tate, 1952—85 , w ith pr oject ions to 2030
3 1 1— T im ber land ar ea in the Sou th , by for est ow ner sh ip , 1952- 85 , w ith project ions to 2030
3 12— T im ber l and ar ea i n the Sou th , by for est m anagem en t type , 1952—85 , w ith project ions to 2030
— Pr opor t ion of t imber land in. p ine plan tat ion m an agemen t type
3 14— Pr opor t ion of t imber l and in natur al p ine and m ixed p ine—har dwood m anagem en t types
— Pr opor t ion of t im ber land i n upland har dwood m anagem en t type
— Pr opor t ion of t im ber land i n bottom l and har dw ood m an agem en t type
3 . 17 Softwood r oundwood suppl ies i n the Sou th , by for est ow ner sh ip , 1952—84 ,w ith project ions to 2030
— Softwood r ou ndwood suppl ies in the Sou th , by for est m anagem en t type , 1952—84 ,w ith pr oject ions to 2030
— Softwood r oundwood suppl ies in the Sou theast r eg ion , by S tate , 1952—84 ,w ith pr oject ion to 2030
Softwood r oundwood suppl ies in the Sou th Cen tr al r eg ion , by S tate , 1952—84 , w ith pr oject ions to 2030
Softwood net ann ual gr t and t imber r em oval s in the Sou th , by forest owner ship , 1952—84,w ith pr oject ions
to 2030
494

Softwood net ann ual gr owth and t im ber rem ovals in the Sou th , by for est m anagem en t type , 1952—84 ,w ith pr oject ions
to 2030
Softwood net annua l gr ow th and t imber r em ovals in the Sou theast reg ion , by S tate , 1952—84 , w ith project ions to 2030
Softwood net ann ual grow th and t im ber r em ovals in the Sou th Cen tr al reg ion , by State , 1952—84 , w ith pr oject ionsto 2030
Per cen tage change i n the num ber of l ive p ine trees on other pr ivate tim ber land in the Sou theast r eg ion between themost r ecen t for est su r veys, by d iam eter class
Per cen tage change i n the num ber of l ive softwood tr ees on t im ber land in the - Sou th between the m ost recen t for estsu rveys, by d iam eter cl ass
Softwood inven tory in the Sou th , by fo r est owner ship ,1952—85 , w ith pr ojec t ions to 2030
Softwood inven tory i n the Sou th , by forest m anagem en t type , 1952—85 ,w ith pr oject ions to 2030
Per cen tage d istr ibu t ion of softwood gr ow ing stock on t im ber l and i n the Sou th , by d iameter c lass, 1977 and 1985
Per cen tage d istri bu t ion of softwood grow ing stock on tim ber l and i n the Sou th , by spec ies, 1985
Softwood inven tory in the Sou theast reg ion , by S tate ,1952—85 ,
w ith pr oject ions to 2030
Softwood inven tory in the Sou th Cen tr al r eg ion , by S tate ,1952—85 , w i th pr oject ion s to 2030
Aver age vo lum e of'
softwood gr ow ing stock in p ine and m ixed p ine—hardwood m anagem en t types i n the Sou thCentr al reg ion , 1952—85
H ar dwood roundwood suppl ies i n the Sou th , by forest ow ner sh ip , 1952—84 , w ith project ion s to 2030
H ar dwood r oundwood suppl ies i n the South , by for est m anagem en t type , 1952—84 , w ith project ions to 2030
H ar dwood r oundwood suppl ies i n the Southeast r eg ion , by S tate , 1952—84 ,w ith project ions to 2030
H ar dwood roundwood supp l ies i n the Sou th Cen tr al r eg ion , by S tate , 1952—84 , w ith pr oject ions to 2030
H ardwood net an nual grow th and tim ber r em ovals in the Sou th , by for est owner sh ip , 1952—84 ,w ith pr oj ec t ions
to 2030
H ar dwood net annual gr ow th and t imber r em ovals i n the Sou th , by forest m anagem en t type , 1952—84 , w ith
project ions to 2030 176

H ar dwood inven tory in the Sou th , by for est m anagem en t type , 1952—85 , w ith pr oject ions to 2030
Per cen tage d istr ibu t ion of har dwood gr ow ing stock on t im ber land in the South , by d iam eter c lass, 1977 and 1985
Per cen tage d istri bu t ion of har dwood gr ow ing stock on t im ber land i n the Sou th , by spec ies, 1985
H ar dwood inven tory i n the Sou theast r eg ion , by S tate , 1952—85 ,w ith pr oject ions to 2030
H ar dwood inven tory in the Sou th Cen tr al r eg ion , by S tate , 1952—85 , w ith pr oject ion s to 2030
Ch apter 4—Im pl ica t ion s of the Base P r ojection s of Ch an ges i n the Tim ber Resou r ce an d of Oth er Selected Fu tu r es
— Softwood saw t im ber stum page pr ice indexes in the Sou th , 1880—1985 , w ith base pr oject ions by r eg ion , 1990—2030
Softwood pu lpwood stumpage pr ice indexes in the Sou th , 1935—85 , w ith base projec t ions by r eg ion , 1990—2030
H ar dwood saw t im ber stum page pr ice indexes i n the Sou th , 1905—85 w ith base pr oject ions by reg ion , 1990—2030
Aver age r el at ive producer pr ice index for lumber , 1800—1984 ,w ith base project ions for softwood and hardw ood
lum ber pr i ce indexes for selected year s 1990—2030Employm en t i n lum ber and w ood pr oducts and pu lp and paper pr oducts indu str ies in the Sou th , selected year s
1954—85 , w ith pr oject ions to 2030
— Wages and salar ies in lum ber and wood products and pu lp and paper pr oducts industri es in the Sou th , selected year s
1954—85 ,w ith pr oject ions to 2030
Pr oject ion s of softwood lum ber and saw t im ber stumpage pri ce indexes i n the Sou th , w ith and w ithou t add it ion alimprovem en ts i n processing effic iency
Project ion s of r ou ndwood pu lpw ood con sumpt ion i n the Sou th , w ith and w ithou t incr eased expor ts of t im ber pr oductsPr oject ion s of‘ em ploym en t i n the pu lp and paper products indu stry i n the Sou th , w ith and w ithou t incr eased im por ts
of t im ber pr odu cts
— Pr oject ion s of softwood inven tor ies on pr ivate t im ber l and in the Sou th ,w ith and w ithou t r educed t im ber grow th
4 1 1— Pr oject ion s of softwood pu lpwood stum page pr ice indexes i n the Sou theast , w ith and w ithou t redu ced t im ber gr ow th4 . 12 Pr oject ions of em ploym en t i n the lum ber and wood pr oducts indu stry in the Sou th ,
w ith and w ithou t r educed
t imber grow th
4 . 13 Project ion s of softwood saw t im ber stumpage pr ice indexes in the Pac ific Nor thwest , w ith and w ithou t reduced
nat ional for est t im ber har vest
4 14— Pr oject ion s of softwood inven tor ies on pr ivate t im ber l and i n the Sou th ,w ith and w ithout u t il iz ing the econom i c
oppor tun it ies on cr oplan d and pastu r e
Pr oject ion s of softwood inven tor ies on pr ivate owner sh ips in the Sou th w ith and w ithou t u t i l i z ing the econom ic
oppor tun it ies on pr ivate t imber land
4 16— Pr oject ion s of softwood inven tor ies on pr ivate ow ner sh ips i n the Sou th ,w ith and w ithou t u t il i z ing the econom i c
oppor tu n it ies on pr ivate t im ber l and , cr opl and , and pastu re
496

Chap ter 3—P r ojected Ch an ges i n th e T im ber Resou r ce
— Acr eage cel l categor ies u sed in the T im ber Resou r ce Inventory Model
Popu lat ion , gross n at ional product , and d isposable person al incom e in the Un ited S tates, spec ified year s 1929—85 ,
w ith pr oject ions to 2030
Aver age ann ual pr oduct ion of new hou sing un its in the Un ited S tates, by type of un it , spec ified per iods 1950—84 ,
w ith pr oject ions to 2030
Lum ber consum pt ion , expor ts, impor ts, and pr odu ct ion in the Un ited S tates, spec ified year s 1952—84 ,w ith
pr oject ions to 2030
S tru ctur al panel con sumpt ion , expor ts, impor ts, and pr oduct ion i n the Un ited S tates, by type of panel , spec ifiedyear s 1952
—84 ,w ith pr oject ion s to 2030
— Nonstr uctu r al panel con sum pt ion , expor ts, impor ts, and pr odu ct ion in the Un ited States, by type of panel , spec ifiedyear s 1952
—84 , w ith projections to 2030
Pu lpwood consumpt ion , expor ts, impor ts, and pr oduct ion in the Un ited S tates, spec ified year s 1952—84 ,
w ith project ions to 2030
Roundwood con sum pt ion i n the Uni ted S tates, by spec ies gr oup and pr oduct , spec ified years 1952—84 , w ith
project ions of dem and to 2030
T im ber dem and , expor ts, impor ts, and dem and on t im ber land in the Un i ted S tates, by spec ies group , spec ified
year s 1952—84 , w ith project ions to 2030
— Ar ea of t im ber land , by ow ner shi p and for est m anagemen t type in the Sou th , selected year s 1952—85 , w ith
project ions to 2030
3 1 1— T imber land w ith h igh or m ed ium poten t ial for conver sion to cr opl and in the Sou th , by S tate and r eg ion , 1982
3 . 12 Ar ea of h igh ly erod ible cr opland su itable for tree p lan t ing in the Sou th , by r eg ion and State— Ar ea of cr opland and pastur e i n the Sou th , inc lud in g h ighly er od ible cropl and , that wou l d y iel d h igher r ates
of r etu r n in p ine plan tat ions
3 . 14 Ar ea of t im ber l and w ith evidence of ar t ific ial r egener at ion in the Sou th , by State and forest m anagem en t type3 . 15 Softwood r oundwood suppl ies, t imber r em oval s, net
'
ann ual gr ow th , an d inven tory of softwood gr ow ing stock
in the Sou th , by ow ner shi p , selected year s 1952—84 , w ith project ion s to 2030
— Softwood roundw ood suppl ies, tim ber rem ovals, net annual gr ow th , an d inven tory of softwood grow ing stock
in the Sou th , by for est m an agem en t type , selected year s 1952—84 , w ith project ion s to 2030
3 . 17 Annu al m or tal ity of softwood gr ow ing stock on t im ber l and i n the Sou th , by r eg ion and ownershi p , 1952—84
— D istr ibu tion of p ine an d m i xed p ine—har dwood stands in the Sou th ,by age gr oup and br oad ow ner sh ip class, 1985
3 . 19 H ar dwood roundwood suppl ies, t im ber r em ovals, net annual gr ow th , and inven tory of har dwood gr ow ing stock
in the Sou th , by ow ner sh ip , selected year s 1952—84 ,
w ith pr oject ions to 2030

H ar dwood r oundwood supp l ies, t im ber rem ovals, net annual gr owth , and inven tory of har dwood gr ow ing stockin the Sou th , by for est m anagem en t type , selected year s 1952
—84 , w ith projection s to 2030
— Annual m ort al ity of hardwood grow ing stock on t imber l and i n the Sou th , by r eg ion and owner sh ip , 1952—84
Chapter 5—Oppor tu n i ties for In cr easin g Tim ber Su pp l ies Th r ough Mor e In ten sive For est r y— Area of t im ber land in the Sou th need ing treatm en t to im prove pr oduct ivity , by r eg ion , S tate and owner sh ip
Ar ea of t im ber l and in the Sou th need ing tr eatm en t to im prove pr oduct ivity , by forest m anagem en t type and
treatm en t need
Range of 1985 t im ber stumpage pr ices in the Sou th used for financ ial analyses of investm en t oppor tun it iesto increase net an nual growth , by S tateRanges of d ir ect costs for thr ee treatmen t cost levels of m anagem en t pr act ices to increase net annu al t im ber gr ow thin the Sou thMean annual incr emen t of gr ow ing stock trees for wel l - stocked stands i n the Sou th , by for est m an agem en t type
and site c lass for selected stan'
d ages
— T im ber land need ing tr eatm en t to impr ove pr oduct iv ity in the Sou th , the ar ea of t imber l and w ith oppor tun it ies
for increasing net annual gr ow th wh ich w il l y iel d 4 per cen t or m or e, and the assoc iated tr eatm en t cost and net
annual gr ow th incremen t , by reg ion and StateT im ber land need ing tr eatm en t to improve p rodu ctivi ty i n the Sou th , the ar ea of t imber land w ith oppor tun i t ies
for incr easing net annual gr ow th wh ich w ill y ield 10 per cen t or m or e , and the assoc iated
treatment cost and net annu al growth incr em en t , by r eg ion and S tateAr ea of m ar g inal cr opland and pastur e in the Sou th , includ ing h ighly er odible cropland , the cost of establ ish ing
p ine plan tations on th is land , and the r esu l t ing net annual t im ber growth i f th is land wer e plan ted top ine or allowed to r ever t natu r al ly to for est , by S tate and r eg ion
Ar ea of h igh ly er od ib le cropl and i n theSou th ,the cost of establ ish ing p ine plan tat ions on th is land and the
r esu l ting net ann ual t im ber gr owth , by S tate and r eg ion 253

Appen d ix l — Tab les Su ppor t in g Ch apter 1 : T h e Econ om i c Im por tan ce of For ests in th e Sou th
— T otal l and ar ea , cr opland , and pastu re ( 1982 ) and t im ber l and ( 1985) in the Sou th , by r eg ion and S tateEst im ated vo lum e of r oundw ood tim ber products in the Sou th , by produ ct , softwoods an d har dwoods, r eg ion ,
and S tate , 1984
Est im ated stum page value of r oundw ood t im ber pr oducts in the Sou th , by pr oduct , softwoods and har dwoods,
r eg ion , and S tate , 1984
Est im ated value at local poin ts of del ivery of r ou ndwood t im ber pr oducts in the Sou th , by pr oduct , softwoods and
har dwoods, r eg ion , and State , 1984
Est im ated val ue at local po in ts of del ivery of r oundw ood'
tim ber pr oducts and other agri cu l tu r al cr ops in the Sou th ,
by r eg ion and S tate , 1984
— Est im ated values at local poin ts of del ivery of r ou ndwood t im ber pr odu cts an d the h ighest valued agr i cu l tur al cr ops
for r eg ion s and S tates in the Sou th , 1984
T ype II ou tpu t , incom e , and em ploym en t m u l t ipl ier s for“ S tates i n the Sou th , by type of for est indu stry , 1984
Num ber of establ ishm en ts, em ploym en t , w ages and salar ies, value of sh ipm en ts, and value added for al l
m anu factu r ing and for for est industr ies in the Sou th , by r eg ion and S tate , 1982
Num ber of estab l ishm en ts, em ploym en t , w ages and salar ies, value of sh ipm en ts, and valu e added by m anufactu r e
in the for est industr ies i n the Sou th , by r eg ion , S tate , and type of industry , 1982
— Employm en t i n m anufactu ri ng of lumber and wood pr oducts and pu lp and paper pr oducts in the Sou th , by r eg ion
and S tate , selected year s 1947—82
— Wages and sal ari es i n m anu factu r ing of lum ber and wood products and pu lp and paper products in the Sou th ,
by r eg ion and S tate , selected year s 1947—82
Value added i n m anu factu r ing of lum ber and w ood pr oducts and pu l p and paper pr oducts in the Sou th , by r eg ion
and S tate , selected year s 1947—82
Emp loym en t , w ages and salar ies, and value added by m anu factur e in for est industr ies in the Sou th , by indu stry
gr oup , reg ion and S tate , 1982 and 1985
Appen d ix 2—Tab les Su ppor t in g Ch ap ter 2 : T h e Chan g in g For est Resou r ces an d For est In du str ies i n th e Sou th— Rosin pr oduction in the Un ited S tates, by sou r ce , selected year s 1900
—84
— T urpen t ine pr oduct ion i n the Un ited S tates, by type , selected year s 1900—84
Repor ted lum ber pr odu ct ion in the Sou th , by m ajor-
spec ies or spec ies group , selected year s 1869—1984
Repor ted lumber pr oduc t ion in the Sou th , by r eg ion , S tate , and spec ies gr oup , selected year s 1955—84
-
,Repor ted yel low p ine lumber pr oduct ion in the Sou th , by r eg ion and S tate , selected year s 1869
— 1954
— Repor ted cypr ess lumber pr oduct ion i n the Sou th ,by r egron and S tate , selected year s 1869
— 1954

— Aver age p ine stum page pr ices for saw t im ber so ld fr om nat ional forests i n the Sou th , by S tate for selected year s1950—85
Aver age har dw ood stum page pr ices for saw t im ber so l d fr om nat ional forests in the Sou th , by S tate forselected year s 1950
—85
Aver age p ine stum page pr ices for saw t im ber , veneer t imber , and pu lpwood in the Sou th , by r eg ion and product ,
1977—85 . (Sou ther n T imber Pr ice Reg ion sMap)
Aver age m i xed har dwood stumpage pr i ces for saw t im ber , veneer t imber , and pu lpwood i n the Sou th , by r eg ionand pr oduct , 1977
—85
Aver age select har dwood stumpage pr ices for sawtimber and veneer t im ber i n the Sou th , by r eg ion and pr oduct ,
1977—85
Aver age p ine stum page pr ices for pu l pwood so l d fr om nat ional for ests in the Sou th , by S tate for selectedyear s, 1950
—85
Aver age har dwood stum page pr i ces for pu lpwood sold fr om nat ional forests i n the Sou th , by S tate forselected year s 1957
—85
Appen d ix 3—Tab les Su ppor t in g Ch ap ter 3 : P r ojected Ch an ges in th e T im ber Resou r ce.
— Ar ea of t im ber land , by ow ner shi p and for est m an agem ent type in the Sou theast r eg ion , selected year s 1952—85 , w ith
pr oject ion s to 2030
Ar ea of t im ber l and , by ow ner sh ip and for est m anagem ent type in the Sou th Cen tr al reg ion , selected year s 1952—85 ,
w ith pr oject ions to 2030
Ar ea of t im ber land , by ow ner ship and forest m anagem en t type i n Al abam a , selected year s 1952—85 , w ith projecti onsto 2030
— Ar ea of t im ber l and , by ow ner shi p and for est m anagem en t type in Ar kansas, selected year s 1952—85 , w ith pr oject ion s
to 2030
Ar ea of t im ber land , by ow ner sh ip and for est m an agem ent type in Flor i da , selected years 1952—85 ,w ith pr oject ions
to 2030
— Area of tim ber land , by ow ner sh ip and forest m anagem en t type in Georg ia , selected year s 1952—85 ,w ith pr oject ions
to 2030
Area of t im ber l and , by owner ship and for est m anagem en t type i n Lou isian a , selected year s 1952—85 , w ith pr oject ions
to 2030
Ar ea of t imber land , by owner shi p and for est m anagem en t type in M ississipp i , selected year s 1952—85 ,w ith pr ojecti ons
to 2030
Ar ea of tim ber l and , by owner shi p and for est m an agem en t type in Nor th Car ol ina , selected year s 1952—85 , w ith
pr oject ions to 2030
—Area of t im ber l an d , by owner shi p and for est m anagem en t type i n Oklahom a , selected year s 1952—85 ,
w ith pr oject ions
to 2030
502
— Area of t imber land , by owner sh ip and for est m anagem ent type in Sou th Car o l ina , selected year s 1952—85 , w ith
pr oject ions to 2030
3 . 12 Ar ea of t imber land , by Owner sh ip and for est m anagem en t type in T ennessee , selected year s 1952—85 , w ith
,
project ions
— Ar ea of t im ber land , by ownersh ip and forest m anagem en t type i n T exas, selected year s 1952—85 , w ith pr oject ions
3 14— Ar ea of t imber land , by ownersh ip and forest m anagemen t type in Vir g in ia , selected year s 1952—85 , w ith pr oject ions
3 . 15 Emp iri cal y ields of gr owing stock assum ed for p ine plan tat ions on for est industr y , other corpor ate , and publ icowner sh ips
— Emp ir ical y ields of grow ing stock assum ed for p ine plan tations on pr ivate , non indu str ial owner sh ips
3 . 17 Emp ir ical y ields of grow ing stock assum ed for natur al p ine stands on al l owner sh ips
— Empir ical y ields of grow ing stock assum ed for m ixed p ine- har dwood stands on al l owner sh ips
— Emp iri cal y ields of gr ow ing stock assum ed for upland har dwood stands on al l owner sh ips
Emp ir ical y ields of gr ow ing stock assum ed for bottom land har dwood stands on al l owner sh ips
Softwood r oundwood suppl ies, tim ber r em ovals, net annual gr ow th , and inven tory of softwood gr ow ing stock
in the Sou theast reg ion, by owner sh ip ,selected year s 1952
—84 , w ith pr oject ions to 2030
Softwood r oundwood suppl ies, t im ber.
r emovals, net annual gr ow th , and inven tory of softwood grow ing stock
in the Sou th Centr al r eg ion , by owner sh ip ,selected year s 1952
—84, w ith pr oject ion s to 2030
Softwood r oundwood suppl ies, timber '
rem oval s, net annual gr owth , and inven tory of softwood gr ow ing stock
in A labam a , by owner sh ip , selected year s 1952—84,
w ith project ion s to 2030
Softwood r oundwood suppl ies, t imber r em ovals, net annual grow th , and inven tory of softwood gr ow ing stock in
Arkansas, by owner sh ip , selected year s 1952—84, w ith pr oject ions to 2030
Softwood r oundwood suppl ies, t imber r em ovals, net annual grow th , and inven tory of softwood grow ing stock
in Flor ida , by owner sh ip , selected year s 1952—84,w ith pr oject ions to 2030
Softwood r oundwood suppl ies, tim ber r em ovals, net-
annual gr ow th , and inventory of softwood gr ow ing stock
in Georg ia , by owner sh ip , selected year s 1952—84 , w ith project ions to 2030
Softwood r oundwood suppl ies, t im ber r em ovals, net annual gr ow th , and inven tory of softwood gr ow ing stock
in Lou isiana , by owner sh ip , selected year s 1952—84 , w ith pr oject ions to 2030
Softwood r oundwood suppl ies, tim ber removals, net annual gr ow th ,
‘
and inven tory of softwood gr ow ing stock
in Mississipp i , -by owner sh ip , selected year s 1952—84 ,w ith pr oject ions to 2030
Softwood roundwood suppl ies, t im ber removals, net annua l gr ow th , and inven tory of softwood grow ing stock
in Nor th Car o l ina , by owner sh ip , selected year s 1952—84,
w ith project ions to 2030
Softwood r oundwood suppl ies, t im ber r em ovals, net an nu al grow th ,and inven tory of softwood grow ing stock
in Oklahom a , by owner sh ip , selected year s 1952—84 ,
w ith project ion s to 2030 383

Softwood r oundwood suppl ies, t im ber r em oval s, net annual gr owth , and inven tory of softwood gr ow in g stock
in Sou th Car o l ina , by ow ner sh ip , selec ted year s 1952—84 ,
w ith pr oject ions to 2030
Softwood r oundwood suppl ies, t im ber rem ovals, net ann ual gr ow th , and inven tory of softwood gr ow ing stock
in T ennessee , by ow ner sh ip , selected year s 1952—84 ,
w ith pr oject ions to 2030
Softwood r oundwood supp l ies, t im ber r em oval s, net annu al gr ow th , and inven tory of softwood gr ow ing stock
in T exas, by ow ner shi p , selected year s 1952- 84 , w ith project ion s to 2030
Softwood r oundwood supp l ies, t imber rem oval s, net annu al gr ow th , and inven tory of softwood gr ow ing stock
in V i rg ini a , by ow ner sh ip , selected year s 1952—84 , w ith p r oject ions to 2030
Softw ood r oundwood suppl ies, t im ber r em oval s, net annu al grow th , and inven tory of softw ood gr ow ing stock
in the Sou theast r eg ion , by for est m anagem en t type , selected year s 1952—84 ,w ith pr oject ion s to 2030
Softwood r oundw ood suppl ies, t im ber r emOval s, net an nu al gr ow th , and inven tory of softwood gr ow ing stock
in the Sou th Cen tr al reg ion , by for est m an agem en t type , selected year s 1952—84 , w ith pr oject ions to 2030
Softwood r oundw ood supp l ies, t im ber r em oval s, net annual gr ow th , and inven tory of softwood gr ow ing stock
in A labam a , by for est m anagem en t type , selected year s 1952—84 , w ith pr oject ions to 2030
Softwood r ou ndw ood suppl ies, t im ber r em ovals, net annu al gr ow th , an d inven tory of softwood gr ow ing stock
in Arkan sas, by for est m an agem en t type, selected year s 1952—84 , w ith pr oject ions to 2030
Softwood r oundw ood suppl ies, t im ber r em ovals, net an nual gr ow th , and in ven tory of softwood gr ow ing stock
in Flor ida , by for est m anagem en t type , selected year s 1952—84 , w ith pr oject ion s to 2030
Softw ood r oundwood suppl ies, t im ber r em ovals, net annual gr ow th , and inven tory of softwood gr ow ing stock
in Georg ia , by for est m an agem en t type , selected year s 1952—84 , w ith project ions to 2030
3 4 1— Softw ood r oundwood suppl ies, t im ber r em ovals, net an nu al gr ow th , and inven tory of softwood gr ow ing stock
in Lou isiana , by for est m anagem en t type , selected year s 1952—84 , w ith pr oject ions to 2030
Softwood r oundw ood supp l ies, t im ber r em ova ls, net ann ual gr ow th , and inven tory of softwood gr ow ing stock
in M ississipp i , by forest m anagem en t type , selected year s 1952—84 , w ith pr ojections to 2030
Softwood r oundw ood supp l ies, t im ber r em ovals, net ann u al gr ow th , and inven tory of softwood gr ow ing stock
in Nor th Car ol in a , by for est m anagem en t type , selected year s 1952—84 , w ith pr oject ion s to 2030
Softwood r ou ndw ood suppl ies, t im ber r em ovals, net annual gr ow th , and inven tory of softwood gr ow ing stock
in Okl ahom a , b,y for est m an agem en t type , selected year s 1952—84 , w ith project ions to 2030
Softwood r oundwood supp l ies, t im ber r em ovals, net ann ual gr ow th , and inven tory of softwood gr ow ing stock
in Sou th Car o l ina , by for est m an agem en t type , selec ted year s 1952—84 ,
w ith pr oject ions to 2030
Softwood r oundwood suppl ies, t im ber r em ovals, net‘
ann ual gr ow th , and inven tory of softwood gr ow ing stockin T ennessee , by for est m anagem en t type , selected year s 1952
—84 , w ith pr oject ion s to 2030
Softw ood r oundwood suppl ies, t im ber r em ovals, net an nual gr ow th , and inven tory of softwood gr ow ing stock
i n T exas, by forest m anagem en t type , selected year s 1952— 84 , w ith pr oject ion s to 2030
3 48— Softwood r oundw ood supp l ies, t im ber r em oval s, net an nual gr owth , and inven tory of softwood grow ing stock
in V i r g in ia , by for est m an agem en t type , selected year s 1952—84 ,
w ith pr ojec t ions to 2030
504

H ar dwood r oundwood supp l ies, t im ber r em oval s, net ann ual gr ow th , and inven tory of har dwood gr ow ing stock
in Flor ida , by for est m anagemen t type , selected year s 1952—84 , w ith pr oject ion s to 2030
H ar dwood r ou ndwood suppl ies, t im ber r em ovals, net ann u al gr ow th , and inven tory of hardwood gr ow ing stock
in Georg ia , by for est m anagem en t type , selected year s 1952—84 ,
w ith project ions to 2030
H ar dwood rou ndwood suppl ies, tim ber r em ovals, net ann ual gr ow th , an d inven tory of har dwood gr ow ing stock
i n Lou isiana , by for est m an agem ent type , selected year s 1952—84 , w ith pr oject ions to 2030
H ar dwood r oundwood suppl ies, t im ber r emovals, net ann ual gr ow th , and inven tory of har dwood gr ow ing stock
i n M ississipp i , by for est m anagem en t type, selected year s 1952—84
,w ith pr oject ion s to 2030
3 7 1— H ar dwood r oundw ood suppl ies, t im ber r em ovals, net ann ual gr ow th , and i nven tory of har dw ood grow ing stock
in Nor th Car o l in a , by for est m anagem en t type , selected year s 1952—84 , w ith pr oject ions to 2030
H ar dwood r ou ndwood suppl ies, tim ber r em ovals, net ann ual gr ow th , and inven tory of har dw ood gr ow ing stock
in Oklah om a , by forest m an agem en t type , selected year s 1952—84 ,
w ith pr oject ions to 2030
H ar dwood r oundw ood suppl ies, t imber rem ovals, net ann ual gr ow th , and inventory of har dwood gr ow ing stock
in Sou th Car o l in a , by for est m an agem en t type , selected year s 1952—84 , w ith project ion s to 2030
H ar dwood r oundwood suppl ies, t im ber r em ovals, net annual gr owth , an d inven tory of har dwood gr ow in g stockin T ennessee , by for est m anagem en t type , selected year s 1952
—84 , w ith pr oject ions to 2030
H ar dwood r oundwood suppl ies, t im ber r em ovals, net annu al gr ow th , and inven tory of har dwood gr ow ing stockin T exas, by forest m an agem en t type , selected year s 1952
—84 , w ith project ions to 2030
H ar dw ood r ou ndwood suppl ies, tim ber r em ovals, net annual gr ow th , and inven tory of har dwood gr ow ing stockin Vir g ini a , by for est m an agem en t type , selected year s 1952
—84 , w ith pr oject ions to 2030
Appen d ix 4—Tab les Suppor t in g Ch ap ter 4: Im p l icat ions of the Base P r oject ion s of Chan ges in the T im ber Resou r cean d of Other Selected Fu tu r es
4 . 1 S im u lated effects of selected futur es on pr ojected softwood r oundwood suppl ies on al l owner ships, net annual
gr owth and inven tori es of gr ow ing stock by pr i vate ow ner shi p and reg ion ; and softwood stumpage pri ce indexes,lum ber pr oduct ion , plywood pr oduct ion , pu lpwood consum pt ion , by r eg ion , in the Sou th , selected year s 1984—2030
— S im u lated effects of selected fu tu r es on projected softwood r oundwood suppl ies, n et ann ual gr ow th and inven tori es
of grow ing stock by pr i vate ow ner shi p by section or r eg ion ; softwood stumpage pr ice indexes, softwood lum berand plywood pr oduct ion and r oundwood pu lpwood consumpt ion by sect ion or r eg ion ; an d softwood lum ber
pr ice indexes and im por ts in the Uni ted S tates, selected year s 1984—2030S im u lated effects of selected fu tu r es on pr ojected har dwood r oundwood suppl ies on al l owner sh ips, net
ann ual growth and inven tori es of gr ow ing stock by pr ivate owner sh ip and r eg ion ; an d har dwood stumpage pr i ce
indexes, lum ber pr odu ct ion , pu lpw ood consumpt ion , by r eg ion , in the South , selected year s 1984—2030
S im u lated effects of selected fu tur es on projected har dwood r oundwood suppl ies, net annual gr owth and
inven tor ies of gr ow ing stock by pr i vate owner shi p by sect ion or r eg ion ; har dw ood stumpage pri ce in dexes, h ar dwoodlum ber pr oduct ion and rou ndwood pu lpwood con sumpt ion by sect ion or r eg ion ; and har dwood lum ber pri ce indexesin the Uni ted S tates, selected year s 1984—2030
506

Sim u lated effects of selected fu tures on projected employm en t and wages and salar ies in for est industr ies,investm en ts in plan ts and equ ipm en t , and total S tate and local gover nm en t revenues, in the Sou th , selected year s
1984—2030
— Sim u lated effects of selected fu tur es on for age , w ild l ife , fish , and water , by r eg ion in the Sou th , selected year s1985—2030
Appen d ix 5—T ab les Su ppor tin g Chapter 5 : Oppor tu n i t ies for In cr easin g T im ber Su pp l ies T h r ou gh Mor e In tensiveFor estr y
5 . 1 Opportun it ies for incr easing t im ber suppl ies on t im ber land in the Sou th wh ich w i l l y ield 4 per cen t or m ore,
by owner sh ip , for est m anagem en t type , and tr eatm en t oppor tun ity
Oppor tun it ies for incr easing tim ber suppl ies on t im ber land in the Sou theast that w il l y iel d 4 per cen t or m or e ,
by owner sh ip , for est m anagem en t type , and tr eatmen t oppor tun ity
Opportun it ies for increasing t imber suppl ies on t imber l and in the Sou th Cen tr al r eg ion that w ill y ield 4 per cen tor m or e , by owner sh ip , for est m anagem en t type , and tr eatm en t oppor tun ity
Oppor tun it ies for incr easing t im ber suppl ies on t imber land in the Sou th that w il l y ield 10 per cen t or m or e ,
by owner sh ip , for est m an agemen t type ,and tr eatmen t oppor tun ity
Oppo rtuni t ies for incr easing t imber suppl ies on t im ber land in the Sou theast that w il l y ield 10 per cen t or mor e ,
by owner sh ip , forest m anagem en t type , and treatmen t oppor tun ity
— Oppor tuni t ies for incr easing t im ber suppl ies on t im ber land in the Sou th Cen tr al reg ion that w ill y ield 10 per cen tor m or e , by ownersh ip , forest m anagem en t type , and treatm en t oppor tun ity 489

[Th is page 1n ten tion a11y left blank . ]
508

For est m an agem en t type— A c lassifi cat ion of tim ber land
based upon the spec ies and sou r ce of tr ees fo rm ing ap lu r al ity of live tr ees pr esen t .
For est Su r vey— A su r vey conducted by the U .S . Depar t
m en t of Agr i cu ltu r e , For est Ser vice that 'pr ovi des acon tinu ing inven tory of the ar ea , locat ion and cond ition of
for est lands, am ou n ts and qu ality of tim ber vo lum esavailable , r ates of tim ber gr ow th , tim ber r em ovals andm or tality , ow ner sh ip of for est land t im ber , and tr ends i ntimber consum ption .
Fou r th for est — Th e for est that w ill exist in the decadesbeyond 2000 , after the har vest or c lear in g of the th ir dfor est— the one that now exists in the Sou th .
Fu elwood— T he wood— r ou ndw ood and bypr oducts— u sed
for cooking , heating , and power gener ation .
Gr ow in g stock— Live saw tim ber tr ees, po letim ber tr ees,
sap l in gs, an d seed l in gs on t im ber land m eet in g spec ifiedstandar ds of qual ity or vigor ; exc ludes cu l l tr ees.
Gr ow in g stock volum e—Net volum e i n cubic feet of l ivesawtim ber and poletim ber tr ees on tim ber land fr om stum p
to a m in im um 4- inch top (cen tr al stem ) ou tside bark or tothe po in t wher e the cen tr al stem br eaks in to l im bs.
H a r dwoods— Dicotyledonous tr ees, usually broad - leaved anddeciduou s.
H i gh ly er od i b le cr oplan d— All cr opland in Land
Capabil ity Classes (c lassification s u sed by the So i l Con servation Ser vice to r ate the su itability of so i ls for agr icu ltu r alpr odu ction ) 3e 4e , 6e , and 7e .
In du st r i a l r ou n dwood— All comm er c ial r ou ndw oodpr odu cts except fuelwood .
In du str ia l tim ber (wood) p r odu cts— Saw logs; veneer logs;pu lpwood ; cooper age logs and bo lts; p il in g and po les; m i netim ber s; posts; bo lts u sed for sh in gles, hand les, and woodtum i ngs; and panel pr oducts and chem ical wood .
In ven tor y— Net vo lum e in cub ic‘
feet of gr ow ing stock tr ees5 .0 in ches i n d .b .h and over fr om a l —foot stum p to a
m in imum - inch top d iam eter ou tside bar k of the cen tr alstem or to the po in t wher e the cen tr al stem br eaks in tolim bs.
5 10
Loca l po i n ts of del i ver y— Fir st location to wh ichr oundwood tim ber or other tim ber pr odu cts ar e tr anspor tedafter har vest , such as con cen tr ation yar ds or r ai l sid in gs.
Ma r gi n a l cr op lan d an d pastu r e—C r opland and pastur e
that wou ld yield h igher r ates of r etur n to the owner i f
plan ted to pine .
M ixed p i n e—h a r dwood— For ests i n w h ich 50 per cen t o rm or e of the stand i s har dwood , u su al ly upland oaks, andsou ther n pines m ake up 25—49 per cen t . Comm on assoc iatesinc lude u
‘
pland oak—Shor t leaf pine i n the footh ills andplateau s; m i xed har dw ood—loblol ly p ine on m o ist sites; andscr ub oak—longleaf pine i n the sand h ills of the Car o linas,Geor gia , and Fl or ida .
Mor ta l i ty— T he vo lum e of sou nd wood in tr ees that have
d ied fr om n atu r al causes du r ing a spec ified per iod .
Nation a l for est lan d— Feder al land designated byExecu tive Or der or statu te as nation al for ests or pu r chaseun its, and other lands under the adm in istr ation of the For est
Ser vice , inc lud ing experi m en tal ar eas and Bankhead—JonesTitle III lands.
Natu r al p in e— For ests in wh ich 50 per cen t or mor e of the
natu r ally established stand is loblol ly pine , slash p in e,
Shor tleaf p ine , lon gleaf p ine , or other sou ther n pines singlyOr in com bination . Comm on assoc iates include oak ,
h ickory , and gum .
Nonstocked ar eas— Tim ber land less than 10 percen tstocked w ith gr ow in g- stock tr ees.
Net ann u al t im ber gr owth— Th e net increase in the volum e
of tr ees du r ing a spec ified year . Components of net ann u algrowth include the incr em en t in net vo lum e of tr ees at the
beginn ing of the specific year sur viving to i ts end , p lus thenet vo lum e of tr ees r each ing the m in im um size c lass du r in gthe year , m inu s the vo lum e of tr ees that d ied du r ing theyear , and m inus the net vo lum e of tr ees that becam e r oughor rotten trees du r ing the year .

Nor th— A geogr aph ic ar eathat inc ludes 25 Nor ther n Statesdivided in to tw o r egions.
T he Nor theast r egion— includes 12 States—Connecticu t ,
Maine ,Massachusetts, New Hampsh ir e , Rhode Island ,
Verm on t , Delawar e ,Maryland , New Jer sey , New York ,
Pennsylvan ia , and West Vir gin ia .
T he Nor th Cen tr a l r egion— includes 13 StatesMich igan ,
Minnesota , Nor th Dakota , Sou th Dakota
(easter n ) , Wisconsin , I llino is, Ind iana , Iow a , Kansas,Ken tucky ,
Missou r i , Nebr aska , and Oh io .
Other in d ivi du a l lan ds— Lands owned by pr i vate ind ividuals except farm er s.
Other p r ivate lan ds— Lands owned by pr ivate individu alsand corpor ations except those i n the for est indu stry .
Other pub l i c lan ds—Land ow ned by the public— State ,
coun ty , m un ic ipal , and Feder al except nat ional for est .
Other r em ova ls— T he net vo lum e of gr ow in g - stock tr ees
r emoved fr om the inven tory by cu ltur al oper ations such as
timber - stand impr ovem en t , by land clear ing , and by changesin land use , such -as a sh ift to w ilder ness.
Pacific Nor thwest— A geogr aph ic ar ea that in c ludesOr egon and Wash ington .
Pacific Sou thwest— A geogr aph ic ar ea that inc ludesCal ifor n ia .
Pastu r e—Land u sed for pr oduct ion of in tr oduced or nativefor age plants for gr azing .
Piedm on t— T he geogr aph ic ar ea between the Coastal P lainand the Appalach ian Moun tains in Alabam a ,
Geor gia , the
Car ol inas, and Vir gin ia . It is gen tly slopin g w ith elevationsbetween 100 and 600 feet .
Pi ne p lan ta t ions— For ests in wh ich 50 per cen t or m ore ofthe stand is loblo lly pine , slash pine , Shor tleaf pine ,
longleafpine or other sou ther n pines, wh ich have been establishedby planting or d ir ect seed in g .
Plan t byp r odu cts— Wood m ater ial (such as slabs, edgings,tr imm ings, m iscu ts, sawdu st shavings, veneer cor es andc lippings, and pu lp scr een in gs) fr om pr im ary m anu factu r ingplan ts used for pu lp and other pr oducts.
Pu l pwood— T he wood— r oundwood and plan t byproducts
used in the m anu factu r e of woodpu lp .
Rocky Mou n ta in— T he geogr aph ic ar ea that inc ludes n ineStates— Ar izona , Idaho , Mon tana , Sou th Dakota (wester n ) ,Wyom ing , Co lor ado , Nevada , New Mexico , and Utah .
Rotten tr ees— Live tr ees of comm er c ial spec ies that do not
con tain a saw log now - or pr ospectively , pr im ar i ly becau seof r ot (e .g . when r ot accoun ts for m or e than 50 per cen t of
the total cu l l volum e) .
Roun dwood— Logs, bolts, or other r ound sections cu t fromgr ow ing stock and non gr ow in g stock sour ces such as tr ees
sm aller than 5 in ches d .b .b ; stum ps, tops, and l im bs ofgr ow ing stock tr ees; r ough and r otten tr ees; dead tr ees; and
tr ees that gr ow on land other than t im ber land .
Rou n dwood suppl ies— T he vo lum e of r oundwood
har vested or avai lable for har vest in the fu tur e.Inc ludesr ou ndwood fr om gr ow in g stock and n on gr ow in g stocksou r ces.
Rou n dwood equ iva len t— T he volum e of logs or other r oundpr oducts r equ ir ed to pr odu ce given qu an t it ies of lum ber ,plywood , woodpu lp , paper , or other sim i lar pr oducts.
Rou gh tr ees— (a) Live tr ees Of comm er c ial spec ies that do
not con ta in a saw log , n ow or pr ospect ively , pr im ar i lybecau se Of r ou ghness, poor form , spl its, and cr acks, and
w ith less than one- th ir d of the gr oss tr ee vo lum e in sound
m ater ial ; and (b) al l l ive tr ees of noncomm er c ial spec ies.
Saw log— A log used in the m anu factu r e Of lum ber .
Saw tim ber 4 tands at least 10 per cen t occup ied w ithgr ow ing - stock trees, w ith half or m o r e of total stocking insaw tim ber or po letim ber tr ees, and w ith saw timber stockingat least equal to po letim ber stocking .
Secon d for est”— T he for est that becam e established in theSou th follow ing the har vest of the r egion ’
s ori ginal for estsof vir gin t im ber . T he second for est was the sou r ce Of the
bu lk of the wood u sed by the for est indu str ies fr om th e
1930’
s thr ough the l 960 ’
s.
5 1 1

S i te p r odu ct ivi ty— A m easu r e Of the inher en t capability of
land to gr ow tim ber based on fu lly stocked n atu r al stands.
H i gh si tes— Land capable of gr ow ing 85 cubic feet ofw ood per acr e per year i n fu l ly stocked n atur al stands.
Med ium si tes—~Land capable of gr ow in g 50 to 85 cubicfeet of w ood per acr e per year i n fu lly stocked natu r alstands.
Low si tes— Land capable of gr ow in g 20 to“ '
49 cubicfeet of wood per acr e per year i n fu l ly stocked n atu r alstands.
Softwoods— Con ifer ou s tr ees, u su ally ever gr een , havin gneed les or scalel ike leaves.
Sou th —A geogr aph ic ar ea that in cludes 12 Sou ther n Statesd iv ided in to tw o r egion s.
Sou th east r egion— T he geogr aph ic ar ea th at in c lu des
five States alon g the Sou theast Atlan tic coast— Vi r gin ia,Nor th Car ol in a , Sou th Car ol in a , Geor gia , and Flor ida .
Sou th Cen tr a l r egion— T he geogr aph ic ar ea that
includes seven S tates alon g the gu lf coast and in landAlabam a , Mississipp i , Lou isiana , Arkan sas, Tennessee ,
Oklahom a, and Texas.
Stan d - size class— A classification Of for est land based on
the pr edom in an t size of tim ber pr esen t .
Stocki n g— T he degr ee of occupan cy of lan d by tr ees,
m easu r ed by b asal ar ea and/or n um ber of tr ees by size and
Spac ing , com par ed to a stockin g standar d ,i .e .
, the basalar ea and/or num ber of tr ees r equ ir ed to fu l ly u ti l ize thegr ow th poten tial of the land .
5 12
Stum page— Stand ing tim ber (tr ees) in the for est .
Stum page p r i ce— T he pr ice paid for stand ing tim ber (tr ees)
in the for est .
Th i r d for est — T he for est that becam e established i n theSou th in the per iod fr om the l 93o
’
s thr ou gh the 1960 ’
s.
Th is for est i s or w i ll be the sou r ce of the bu lk Of the wood
used by the for est indu str ies fr om the 1970’
s thr ou gh 2000 .
Tim ber lan d— For est land wh ich is pr odu c in g or is capableof pr oducin g cr ops of indu str ial wood and not w ithdr awnfr om tim ber u ti lization by statu te or adm in istr ativer egu lation . (Note: Ar eas qu alifying as tim ber land have thecapability of pr odu cing in excess of 20 cubic feet per acreper year of industri al w ood in n atu r al stands. Ar eas cu r r en tlyinaccessible and inoper able ar e inc luded . )
T im ber r em ova ls— T he n et vo lum e of gr ow in g stocktr ees r em oved from the in ven tory by h ar vest in g ; cu ltu r aloper ations, such as tim ber stand impr ovem en t ; landc lear ing ; or chan ges in land use .
T im ber suppl ies— T he vo lum e of r oundwood har vested or
available for har vest in the futu r e . In c ludes r ou ndwood fr omgr ow ing stock and nongr ow ing stock sour ces.
Ur ban an d other a r eas— Ar eas w ithi n the legal boundar iesof cit ies and town s; subu r ban ar eas developed for r esidential , industri al , or r ecr eation al pu rposes; schoo l yar dscemeter ies; r oads, r ai lr oads; a irp or ts; beaches, power l ines,and other ri ghts- of- w ay ; or other nonfor est lan d not in cludedin any other specified land u se c lass.
Ven eer logs— T he logs used in the m anu factu r e of veneer .