Leading intimate healthcare - Coloplast's Investor Relations site

ALCOHOL OUTLET DENSITY AND INTIMATE PARTNERVIOLENCE-RELATED EMERGENCY DEPARTMENT VISITS
Carol B. Cunradi, MPH, PhD1, Christina Mair, MPH, PhD1,2, William Ponicki, MA1, and LillianRemer, MA1
1Prevention Research Center, Pacific Institute for Research and Evaluation, Berkeley, CA 947042School of Public Health, University of California, Berkeley, 94720
AbstractBackground—Previous research has identified risk factors for intimate partner violence (IPV)severity, injury, and Emergency Department (ED) visits. These risk factors have been shown atboth the individual level (heavy drinking and other substance use on the part of one or bothpartners) and the neighborhood level (residence in an area characterized by poverty and socialdisadvantage). Alcohol outlet density has been linked with assaultive violence in communitysettings, but has not been analyzed in relation to IPV-related ED visits. This study examined theeffects of outlet densities on IPV-related ED visits throughout California between July 2005 andDecember 2008.
Methods—Half-yearly counts of ED visits related to IPV (E-code 967.3) were computed foreach zip code from patient-level public datasets. Alcohol outlet density measures, calculatedseparately for bars, off-premise outlets, and restaurants, were derived from California AlcoholBeverage Control records. Census-based neighborhood demographic characteristics previouslyshown to be related to health disparities and IPV (percent Black, percent Hispanic, percent below150% of poverty line, percent unemployed) were included in models. This study used Bayesianspace-time models that allow longitudinal analysis at the zip code level despite frequent boundaryredefinitions. These spatial misalignment models control for spatial variation in geographic unitdefinitions over time and account for spatial autocorrelation using conditional autoregressive(CAR) priors. The model incorporated data from between 1,686 (2005) and 1,693 (2008) zipcodes across California for 7 half-year time periods from 2005 through 2008 (n = 11,836).
Results—Density of bars was positively associated with IPV-related ED visits. Density of off-premise outlets was negatively associated with IPV-related ED visits; this association was weakerand smaller than the bar association. There was no association between density of restaurants andIPV-related ED visits.
Conclusion—Further research is needed to understand the mechanisms by which environmentalfactors, such as alcohol outlet density, affect IPV behaviors resulting in ED visits.
KeywordsIntimate partner violence; alcohol outlet density; Emergency Department; injury
Intimate partner violence (IPV) is a widespread public health problem that can result insignificant physical and mental health sequelae for one or both partners in the couple (Cokeret al., 2002; Fletcher, 2010; Reid et al., 2008; Rhodes et al., 2009; Straus et al., 2009). For
Corresponding Author: Carol Cunradi, Prevention Research Center, Pacific Institute for Research and Evaluation, 1995 UniversityAvenue, Suite450, Berkeley, CA 94704 510-883-5771, [email protected].
NIH Public AccessAuthor ManuscriptAlcohol Clin Exp Res. Author manuscript; available in PMC 2013 May 01.
Published in final edited form as:Alcohol Clin Exp Res. 2012 May ; 36(5): 847–853. doi:10.1111/j.1530-0277.2011.01683.x.
NIH
-PA Author Manuscript
NIH
-PA Author Manuscript
NIH
-PA Author Manuscript
example, IPV is estimated to result in 8 million lost days of paid work among women, andcost $4.1 billion for direct medical and mental health care services (National Center forInjury Prevention and Control, 2003). Based on a sample of married or cohabiting couples inthe general household population, annual prevalence estimates for any partner-to-partnerviolence (i.e., male-to-female or female-to-male) range from 7.8% to 21.5% (Schafer et al.,1998). In terms of demographic risk factors, younger couples are more likely to engage inphysically aggressive behavior towards each other than older couples (Cunradi, 2007; Suitoret al., 1990). Rates of IPV also appear to be higher among racial/ethnic minorities andamong households characterized by indicators of lower socioeconomic status (Caetano et al.,2000; Cunradi, 2007; Field and Caetano, 2004; Sorenson et al., 1996). Regarding personalcharacteristics, impulsivity has emerged as an important attribute that may result in orfacilitate aggressive behavior in response to couple conflict (Cunradi et al., 2002; Cunradi etal., 2009; Shorey et al., 2011). Cumulative adverse childhood experiences, such as exposureto physical, sexual, or emotional abuse, and other forms of household dysfunction, have alsobeen linked with increased likelihood of IPV in adulthood (Anda et al., 2006).
Couples in which the male engages in heavy or hazardous drinking are more likely toexperience IPV compared to couples in which the male does not engage in heavy orhazardous drinking (Cunradi, 2007; Leonard, 1993; Leonard, 2005). The evidence is lessclear concerning the contribution of the female partner’s drinking to the occurrence of IPV.For example, findings from an analysis based on a national sample of couples in the generalhousehold population showed that those in which the female partner reported alcohol-relatedproblems (i.e., social consequences of drinking and/or alcohol dependence symptoms) wereat significantly greater risk for IPV compared to couples in which the female partner did notreport alcohol-related problems, even after accounting for the male partner’s alcohol-relatedproblems (Cunradi et al., 2002). Among a sample of men and women arrested for domesticviolence, alcohol problems in male and female perpetrators and their partners were shown todirectly contribute to physical abuse (Stuart et al., 2006). Klostermann and Fals-Stewart(Klostermann and Fals-Stewart, 2006) reviewed the evidence for three proposedmechanisms underlying the alcohol-IPV association. They propose that the proximal effectsmodel, in which alcohol intoxication is a proximal agent of IPV via thepsychopharmacologic effects of alcohol on cognitive processing or through alcohol-relatedexpectancies, is the most well supported. Alcohol involvement on the part of one or bothpartners in the couple may also increase the risk of IPV severity (Mckinney et al., 2010).
Survey research indicates that severe partner aggression (e.g., beating up; kicking;punching) accounts for a minority of all IPV incidents (Schafer et al., 1998; Sorenson et al.,1996; Straus and Gelles, 1990); however, it is much more likely than moderate partneraggression (e.g., pushing, shoving, grabbing) to cause injury requiring medical attention.Although women are as likely as men to engage in physically aggressive behavior towardstheir partner, they are more likely than men to be injured as a result of IPV (Archer, 2000;Capaldi et al., 2009; Whitaker et al., 2007). Approximately 1% to 7% of all female patientswho present to the Emergency Department (ED) do so on account of an acute episode ofphysical abuse by their intimate partner (Anglin and Sachs, 2003). Not surprisingly, ED-based studies have found alcohol misuse and heavy drinking (on the part of the victim and/or perpetrator) to be strong predictors of IPV (Walton et al., 2009) and injury (Grisso et al.,1999; Kyriacou et al., 1999). Few ED studies of IPV, however, have analyzed how aspectsof the neighborhood environment may increase risk for injury (e.g., Grisso et al., 1999), andnone have considered the contribution of alcohol outlet density. Environmental factors areimportant to consider for several reasons. For example, empirical evidence suggests thatcouples who live in neighborhood characterized by higher levels of objectively measured(i.e., Census-based) poverty or unemployment are at increased risk for IPV compared tocouples residing in non-impoverished or low-unemployment neighborhoods, net individual
Cunradi et al. Page 2
Alcohol Clin Exp Res. Author manuscript; available in PMC 2013 May 01.
NIH
-PA Author Manuscript
NIH
-PA Author Manuscript
NIH
-PA Author Manuscript

and couple-level factors, such as household income or employment status (Cunradi et al.,2000; Cunradi et al., 2002; Fox and Benson, 2006; O’Campo et al., 1995). In addition,several ecological studies link alcohol outlet density with police-reported IPV (Cunradi etal., 2011; Livingston, 2010; Livingston, 2011). Greater numbers of alcohol outlets in acommunity may be a sign of loosened normative constraints against violence, promoteproblem drinking among at-risk couples, and provide environments where groups of personsat risk for IPV may form and mutually reinforce IPV-related attitudes, norms, and problembehaviors (Cunradi, 2010). Moreover, alcohol outlet density has been linked with assaultiveviolence in community settings (Gruenewald and Remer, 2006; Livingston, 2008; Zhu et al.,2004), but has not been analyzed in relation to IPV-related ED visits. The purpose of thisstudy is to examine the effects of outlet densities on IPV-related ED visits throughoutCalifornia between July 2005 and December 2008.
METHODSData Sources
IPV-Related Emergency Department Visits—Counts of IPV-related emergencydepartment (ED) visits were computed from public data available from the California Officeof Statewide Health Planning and Development (OSHPD). These public datasets include allED encounters from hospitals licensed to provide emergency medical services, excludingcases that were ultimately admitted to the hospital or where the patient left before beingseen. Public ED data is subject to masking of demographics when necessary to protectpatient confidentiality. Masking begins with age and ends with zip code to insure no recordsare unique for a combination of age, ethnicity, race, gender, quarter of service, and zip code,and affects only about 2% of zip codes. IPV-related emergency visits were identified bycause-of-injury event code (E-code) 967.3 (ICD-9-CM, 1991). This code indicates thatinjuries were sustained through alleged abuse by a domestic partner. Emergency departmentencounter records for domestic violence were aggregated to the residential zip code of thepatient for each half calendar year of data. Data were available from the second half of 2005through the end of 2008 (seven time points).
Alcohol Outlet Density—Three types of retail alcohol outlets were measured within thestate of California. These included off-premise establishments (license type 20 and 21),restaurants (license type 41 and 47) and bars/pubs (license types 23, 40, 42, 48, 61 and 75).License data were obtained from the California Department of Alcohol Beverage Control(ABC), geocoded to the premise address and spatially joined to zipcode polygons for eachyear. Estimates used in models were measures of the density of outlets of each type persquare mile within a given zip code in a specific year. As the data points for the outcomevariable, ED visits for IPV, were measured in 6-month units, the same outlet density wasassigned to the first and second half of each calendar year. As expected, correlationsbetween each type of outlet were positive, ranging from 0.794 to 0.855. The three types ofoutlets were kept separate in analyses, as the direction and strength of associations betweenoutlet types were hypothesized to differ.
Census-Based Data—Estimates of annual (intercensus) zip code-level demographic datawere collected from the America Sourcebook (CACI Marketing systems and ESRI BIS).Variables used included percent Hispanic and percent black. Measures of the percent of thepopulation below 150% of the poverty line and the unemployment rate were available at theCensus Block Group level from GeoLytic Premium Annual Estimates. To create measuresof these variables at the zip code level, we created an average percent for each variablebased on population weighting of percent values for all block groups with centroids withinthe zip code polygons for each year. Zip codes without values for total population were
Cunradi et al. Page 3
Alcohol Clin Exp Res. Author manuscript; available in PMC 2013 May 01.
NIH
-PA Author Manuscript
NIH
-PA Author Manuscript
NIH
-PA Author Manuscript
assigned a minimal population value of 5. Census-based rate variables (e.g., percent black orbelow 150% of the poverty threshold) were missing in 2.6% of zip-code observations, withmost of these being for “synthetic” zip codes (unpopulated areas such as national forests thatare not covered by official postal system routes but provided in some data sets to assurestatewide coverage); these were assigned the California state average for the year. Since theoutcome measure, IPV-related emergency department visit counts, was aggregated for 6-month periods, we used the same value for all Census-based measures for the first andsecond half of each year. For example, both halves of 2006 would be assigned the sameunemployment rate for a given zip code. Correlations between Census-based variables wereexamined; most were weak (0.1226 to 0.2983). Moderate correlations were observedbetween percent below 150% of the poverty threshold and percent Hispanic (0.5439), andbetween percent below 150% of the poverty threshold and percent unemployed (0.6395).Bivariate associations between each Census-based variable and the outcome variable werepositive and significant, except for percent unemployment (p=0.388).
The zip-code misalignment model described below accounts for changes in zip codeboundaries over time. The approach assumes that zip code boundary shifts are not causallyrelated to IPV. This assumption was tested using an estimate of the geographic instability ofa zip code’s population due to changes in the zip code boundaries between the current andprior year. An instability measure is calculated based on the year 2000 Census Blockpopulation whose centroids fall within a given year’s zip code boundaries. It measures thepercentage of year-2000 block populations within the current zip code definition that wouldnot have fallen within the boundaries of the best-matched zip code from the prior year.
Data AnalysisAnalyses relied on a spatial misalignment variant of a standard Bayesian hierarchical model.Bayesian spatial models were used for two key reasons. First, crude models of local problemrates typically involve large outlying risk estimates in sparsely-populated areas, where asingle IPV-related ED visit could result in very high local rates. Second, simple analyses failto account for the similarity of local risks between adjacent or nearby geographic areas(spatial autocorrelation) that may remain after accounting for modeled exogenous variables,violating the typical statistical assumption that model residuals are independentlydistributed. Bayesian methods for small area and disease mapping address both of theseissues by providing precise model-based estimates of local rates utilizing both local andneighboring observations. Conditional Autoregressive (CAR) random effects account forspatial autocorrelation and reduce the influence of outlying local rates by allowing eachspatial area to “borrow strength” from its neighbors (Waller and Gotway, 2004). Bayesianhierarchical models extend this framework to examine relative risks of problems over bothspace and time. These approaches typically include CAR random effects that account forcertain geographic areas tending to have higher or lower problem risks than others, plus anadditional random effect that models residual variation in risks that is not spatiallyautocorrelated (Carlin and Louis, 2000).
Standard Bayesian hierarchical models assume that geographic units are consistent acrosstime, which is not the case for zip codes. The statewide count of California zip codesincreased from 1,686 in 2005 to 1,693 in 2008, and nearly 4% of these zip codes in anygiven year experienced boundary changes affecting at least 1% of their population (asestimated using Census 2000 block centroid capture). Zhu and coauthors (Zhu et al., inpress) introduced a spatial misalignment variant of a Bayesian hierarchical model thatallows the use of zip-code data for longitudinal analysis despite frequent changes in thesegeographic units. This misalignment approach introduces a separate CAR random effect foreach time-period-specific map of spatial adjacencies. These CAR random effects are
Cunradi et al. Page 4
Alcohol Clin Exp Res. Author manuscript; available in PMC 2013 May 01.
NIH
-PA Author Manuscript
NIH
-PA Author Manuscript
NIH
-PA Author Manuscript

assumed to have mean zero and share a common standard deviation. The model also allowsfor a separate random effect that is not spatially autocorrelated.
Given that the outcome measure is the count of ED visits in a given zip code and timeperiod, a Poisson regression model is used:
where Yij represents the count of IPV-related ED visits in zip code i during half-year t andEij denotes the expected number of the IPV visits (assuming statewide IPV cases aredistributed in direct proportion to zip-code population). Hence exp(μit) may be interpretedas the relative risk of residing in spatial unit i at time point t: regions with exp(μit) > 1 willhave greater counts than expected, and regions with exp(μit) < 1 will have fewer thanexpected. Following standard generalized linear models, the log-relative risk, μit, is modeledlinearly as:
This is a linear combination of fixed covariate effects and random effects which may takeaccount of spatial and/or temporal correlation. Vector αt is a set of half-year-specificintercepts that control for statewide changes in IPV-ED risks that are not explained by othercovariates. Martix X′it contains space- and time-specific covariates and β is a vector offixed-effects estimates of the impacts of those covariates. θit and ϕit denote the pair ofrandom effects capturing spatially unstructured heterogeneity and CAR spatial dependence,respectively. Final models included off premise outlet, bar/pub and restaurant densities(number of outlets per square mile), percent below 150% of the poverty line, unemploymentrate, % black and % Hispanic. Models were estimated using WinBUGS 1.4.3 software(Lunn et al., 2000). Uninformed priors were specified for all fixed and random effects.Models were allowed to burn-in for 50,000 Markov Chain Monte Carlo (MCMC) iterations,which were sufficient for all parameter estimates to stabilize and converge between twochains with different initial values. Posterior estimates were then sampled for an additional70,000 MCMC iterations to provide model results. Traces of MCMC iterationsdemonstrated good convergence for all parameters.
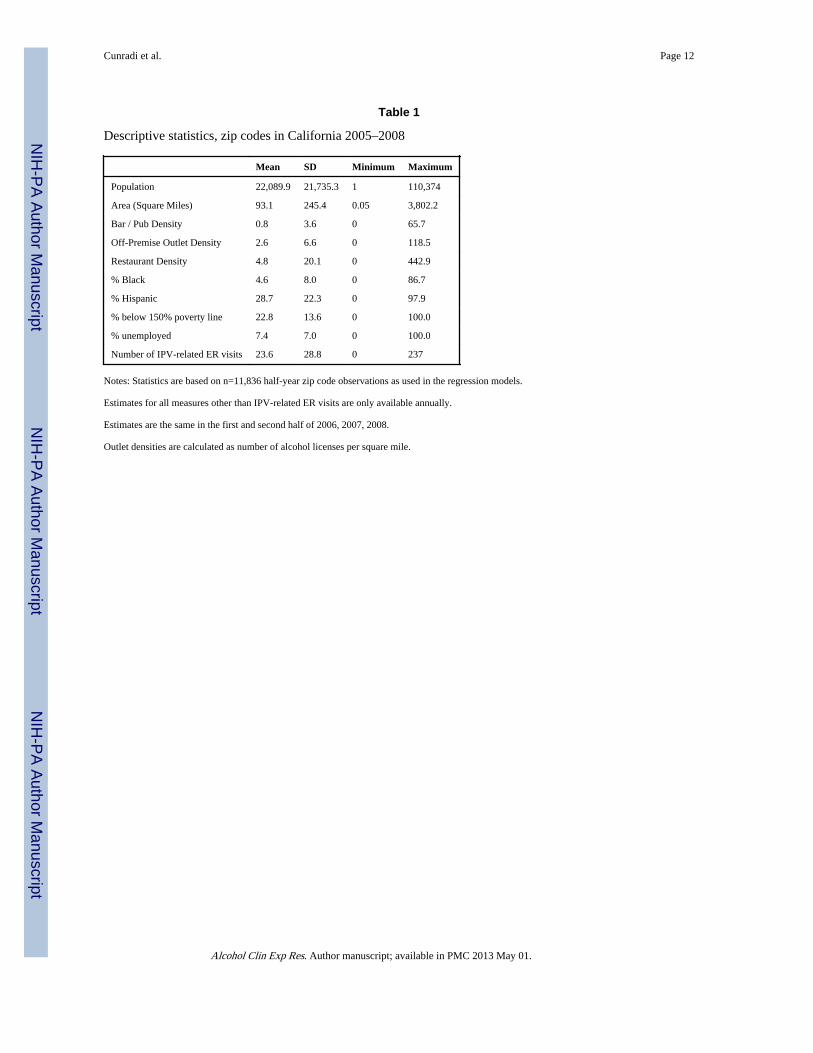
RESULTSTable 1 presents the descriptive statistics for all variables used in analyses. The data setincludes one observation per half year for each zip code in the state of California from 2005to 2008. Variables other than IPV-ED counts were only available annually and were thusassumed to have the same value in both halves of any calendar year. Means, standarddeviations and ranges are displayed for all outcome and predictor variables. Zip codes inCalifornia had an average population of 22,090 from 2005 to 2008. An average zip codereported approximately one bar, three off premise outlets and five restaurants per squaremile, with densities as high as 443 restaurants per square mile in one zip code. There was anaverage of 23.6 IPV-related ED visits per 6 month period in CA zip codes (range: 0–237).The mean unemployment rate was 7.4%, while the mean percent of individuals living below150% of the poverty line was 22.8%.
Table 2 presents the results from the final Bayesian spatial misalignment model. The lefthalf of this table presents the raw coefficients, which are interpretable as log relative risks.The right half of the table exponentiates these values to provide relative risks of IPV-related
Cunradi et al. Page 5
Alcohol Clin Exp Res. Author manuscript; available in PMC 2013 May 01.
NIH
-PA Author Manuscript
NIH
-PA Author Manuscript
NIH
-PA Author Manuscript

ED visits associated with a one-unit change in a given covariate. Median values from the70,000 sampled MCMC iterations provide coefficient estimates for each parameter. Theseestimates are followed by their 95% credible interval, defined as the 2.5th and 97.5th
percentiles of the posterior distribution. Effects are considered well-supported when thecredible interval excludes zero for raw coefficients, or equivalently excludes one for relativerisks.
An increase of one bar per square mile was associated with a 3% increased likelihood ofIPV-related ED visits in a given zip code. An additional off premise outlet per square milewas associated with a 1% reduction in the risk of IPV-related ED visits. Restaurant densitywas not associated with IPV-related ED visits. Increasing percentage black and percentageHispanic were associated with increases in ED visits, as was an increase in percentage ofindividuals below 150% of the poverty line. Higher unemployment was associated withfewer ED visits. Higher levels of IPV-related ED visits occurred in the second half of eachcalendar year, with the intercept for the second half of 2005 representing the highest rate ofED visits. Interaction effects were inconsistent in preliminary analyses, so no interactionsare included in the final model (data available from the authors upon request).
The bottom section of Table 2 displays the extent of spatial autocorrelation in the modelresults. The CAR spatial proportion of the total error variance was almost 78%, with theremaining variance coming from the spatially unstructured random effect. The CAR randomeffect exhibited strongly-positive spatial autocorrelation (Moran’s I =0.94, p < 0.0001).
DISCUSSIONThis study adds to the nascent literature that seeks to identify how environmental factors,particularly alcohol outlet density, contribute to risk for IPV. Previous ecological analyseshave used police-reported IPV events as the outcome (e.g., Cunradi et al., 2011; Livingston,2010; Livingston, 2011); this is the first study to make use of hospital records to explore theassociation between alcohol outlet density and IPV-related ED visits. Since, by definition,all cases in the analysis consisted of those who sustained IPV-related injuries requiringmedical attention, it is reasonable to assume that our outcome measure represents a greaterlevel of severity than police-reported IPV cases (although some of those cases also involveinjury). With this in mind, our results can be compared to other ecological and multilevelstudies on alcohol outlet density and IPV.
Our findings indicate that density of bars or pubs are positively associated with IPV-relatedED visits throughout California over a 3.5 year period (2005–2008), even after accountingfor Census-based neighborhood characteristics that have been shown to be related to healthdisparities (Berke et al., 2010) and IPV (Cunradi, 2010). In a multilevel study of IPV,McKinney et al. (McKinney et al., 2009) found that on-premise alcohol outlet density wassignificantly associated with male-to-female partner violence (but not with female-to-malepartner violence) among a national sample of married/cohabiting couples. Their measure ofon-premise alcohol outlets, however, included both bars and restaurants where alcohol isconsumed. It should also be noted that most of the IPV reported by couples in their sampleconsisted of ‘moderate’ aggression (e.g., pushing, shoving, grabbing), and not severe IPV,which is more likely to result in injury (Cunradi et al., 2002). A cross-sectional ecologicalanalysis by Livingston (Livingston, 2010) found that general license density (either on- oroff-premise consumption; mostly pubs and taverns) was significantly associated with police-reported IPV in Melbourne, Australia; on-premise density (mostly restaurants and smallbars) were negatively associated with the outcome. In contrast, based on a longitudinalanalysis using ecological data from Melbourne from 1996 to 2005, Livingston (Livingston,2011) found that neither general license density nor on-premise density were associated with
Cunradi et al. Page 6
Alcohol Clin Exp Res. Author manuscript; available in PMC 2013 May 01.
NIH
-PA Author Manuscript
NIH
-PA Author Manuscript
NIH
-PA Author Manuscript

police-reported IPV. Instead, packaged license density (mostly retail liquor stores) waspositively related to the outcome. Finally, Cunradi et al. (Cunradi et al., 2011), based onlongitudinal analysis of ecological data from Sacramento, California, reported that off-premise outlet density, but not bar or restaurant density, was significantly linked to bothIPV-related police calls and IPV-related crime reports.
The absence of individual-level data in this study preclude us from determining the precisemechanisms that link an increase of one bar per square mile with a 3% increased likelihoodof IPV-related ED visits in a given zip code. It is possible, for example, that men who drinkin bars that have physical or social characteristics that make violence more likely (e.g.,Quigley et al., 2003) may return home to their spouse/partner in a disinhibited, aggressivestate in which conflict can rapidly escalate to IPV. Treno et al. (Treno et al., 2007a), in amultilevel study of bars, hostility and aggression found that bars may serve to concentrateaggressive people into selected environments, and that these environments may serve toincrease levels of aggression. Individuals with increased levels of hostility and alcoholaggression are more likely to choose bars as a venue for drinking (Treno et al., 2007a).Similarly, women who are frequent bar goers may be more likely to drink heavily and useillicit drugs (Parks, 2000; Parks et al., 2009), placing them at increased risk for interpersonalaggression and victimization. The absence of individual-level characteristics in this studydoes not allow us to explore these hypotheses. Clearly, additional, multilevel research isneeded to further investigate the mechanisms that underlie the association between bardensity and IPV-related ED visits.
Our results indicate a small negative association between off-premise alcohol outlets andIPV-related ED visits, with an additional outlet per square mile reducing risks by 1%. Thisfinding is not consistent with prior research, and should therefore be seen as preliminary. Analternative explanation is that alcohol obtained from off-premise outlets is probablyconsumed at home, and therefore less likely to result in physical aggression than alcoholconsumed in the bar environment. Findings reported by Nyaronga et al. (Nyaronga et al.,2009) on drinking context and drinking problems appear consistent with this explanation.For example, male and female survey respondents who were primarily bar drinkers were atincreased risk for arguments and fighting; those who were primarily home drinkers were notat elevated risk. Moreover, Hispanic men and women and white men categorized asprimarily bar drinkers were at increased risk for reporting problems with their spousebecause of drinking; none of the primarily home drinkers were at increased risk in theadjusted models. The contribution of additional (unmeasured) socioeconomic ordemographic factors in relation to off-premise outlets and IPV-related ED visits needs to beevaluated in future analyses. Our results showing that restaurant density is not associatedwith IPV-related ED visits is consistent with findings from other studies on alcohol outletdensity and assaultive violence (Gruenewald et al., 2006; Lipton and Gruenewald, 2002).
This paper has a number of strengths and limitations. Regarding the latter, the correlationsof exogenous variables are a potential limitation of the analysis. A potential concern is theextent that ED staff utilizes the appropriate E-code to identify IPV-related cases (Weiss etal., 2004). The state of California mandates E-coding for ED injury cases (those with N-codes above 800), making California’s coding among the best in the nation (Annest et al.,2008). At least one validity study for California ED data has been conducted (Goldman etal., 2011), although it was not focused on IPV-related cases. Any bias introduced here,however, is unrelated to alcohol availability, thus mitigating this concern.
In terms of strengths, this study used a spatial misalignment variant of the standard Bayesianspatial modeling approach that allows the use of zip code data for longitudinal analysisdespite frequent changes in these geographic units. The results indicate strongly positive
Cunradi et al. Page 7
Alcohol Clin Exp Res. Author manuscript; available in PMC 2013 May 01.
NIH
-PA Author Manuscript
NIH
-PA Author Manuscript
NIH
-PA Author Manuscript

spatial autocorrelation in the errors, suggesting the possibility of serious bias in analyses thatdo not account for spatially structured errors. To our knowledge, this is the first study tomake use of these modeling techniques in order to explore the relationship of alcohol outletdensity to IPV-related ED visits. This represents a new and innovative approach to gaininginsight into how environmental factors contribute to risk for injurious IPV. While additionalresearch is needed to further refine the findings reported here, these results add to a growingbody of literature showing that alcohol outlet density is linked to many communityproblems, such as underage and young adult injures (Gruenewald et al., 2010), alcohol-related car crashes (Treno et al., 2007b), suicide (Johnson et al., 2009) and childmaltreatment (Freisthler et al., 2004). From a environmental standpoint, policy changes thatlimit alcohol availability may be a critical step to help prevent many of these communityproblems (Livingston, 2011; McKinney et al., 2009; Zhu et al., 2004).
AcknowledgmentsThe authors gratefully acknowledge Dr. Paul Gruenewald for his support and guidance on the use of Bayesianspace-time modeling techniques. The project described was supported by Grant Number 1 R01AA017705-02 fromthe National Institute on Alcohol Abuse and Alcoholism; Carol Cunradi, Principal Investigator. The content issolely the responsibility of the authors and does not necessarily represent the National Institute on Alcohol Abuseand Alcoholism or the National Institutes of Health.
ReferencesAnda RF, Felitti VJ, Bremner JD, Walker JD, Whitfield CL, Perry BD, Dube SR, Giles WH. The
enduring effects of abuse and related adverse experiences in childhood: A convergence of evidencefrom neurobiology and epidemiology. European Archives of Psychiatry and Clinical Neuroscience.2006; 256:174–186. [PubMed: 16311898]
Anglin D, Sachs C. Preventive Care in the Emergency Department: Screening for Domestic Violencein the Emergency Department. ACAD EMERG MED. 2003; 10(19):1118–1127. [PubMed:14525748]
Annest JL, Fingerhut LA, Gallagher SS, Grossman DC, Hedegaard H, Johnson RL, Kohn M, PickettD, Thomas KE, Trent RB. Strategies to Improve External Cause-of-Injury Coding in State-BasedHospital Discharge and Emergency Department Data Systems: Recommendations of the CDCWorkgroup for Improvement of External Cause-of-Injury Coding. Morbidity and Mortality WeeklyReport. 2008; 57 available at: http://www.cdc.gov/mmwr/PDF/rr/rr5701.pdf.
Archer J. Sex differences in aggression between heterosexual partners: A meta-analytic review.Psychological Bulletin. 2000; 126:651–680. [PubMed: 10989615]
Berke EM, Tanski SE, Demidenko E, Alford-Teaster J, Shi X, Sargent JD. Alcohol retail density anddemographic predictors of health disparities: A geographic analysis. American Journal of PublicHealth. 2010; 100(10):1967–1971. [PubMed: 20724696]
Caetano R, Cunradi CB, Schafer J, Clark CL. Intimate partner violence and drinking among white,black and Hispanic couples in the U.S. Journal of Substance Abuse. 2000; 11(2):123–138.[PubMed: 10989773]
Capaldi DM, Shortt JW, WIlson KJ, Tucci S. Official incidents of domestic violence: Types, injury,and associations with nonofficial couple aggression. Violence and Victims. 2009; 24(4):502–519.[PubMed: 19694354]
Coker A, Davis K, Arias I, Desai S, Sanderson M, Brandt H, Smith P. Physical and mental healtheffects of intimate partner violence for men and women. Am J Prev Med. 2002; 23(4):260–268.[PubMed: 12406480]
Cunradi CB. Drinking level, neighborhood social disorder, and mutual intimate partner violence.Alcoholism: Clinical and Experimental Research. 2007; 31(6):1012–1019.
Cunradi CB. Neighborhoods, alcohol outlets and intimate partner violence: Addressing research gapsin exploratory mechanisms. International Journal of Environmental Research and Public Health.2010; 7:799–813. [PubMed: 20617004]
Cunradi et al. Page 8
Alcohol Clin Exp Res. Author manuscript; available in PMC 2013 May 01.
NIH
-PA Author Manuscript
NIH
-PA Author Manuscript
NIH
-PA Author Manuscript

Cunradi CB, Caetano R, Clark C, Schafer J. Neighborhood poverty as a predictor of intimate partnerviolence among white, black, and Hispanic couples in the United States: A multilevel analysis.Annals of Epidemiology. 2000; 10(5):297–308. [PubMed: 10942878]
Cunradi CB, Caetano R, Schafer J. Alcohol-related problems, drug use, and male intimate partnerviolence severity among US couples. Alcoholism: Clinical and Experimental Research. 2002;26(4):493–500.
Cunradi CB, Mair C, Ponicki W, Remer L. Alcohol outlets, neighborhood characteristics and intimatepartner violence: Ecological analysis of a California city. Journal of Urban Health. 2011; 88(2):191–200. [PubMed: 21347557]
Cunradi CB, Todd M, Duke M, Ames G. Problem drinking, unemployment, and intimate partnerviolence among a sample of construction industry workers and their partners. Journal of FamilyViolence. 2009; 24:63–74. [PubMed: 22096270]
Field CA, Caetano R. Ethnic differences in intimate partner violence in the U.S. general population.Trauma, Violence, & Abuse. 2004; 5(4):303–317.
Fletcher J. The effects of intimate partner violence on health in young adulthood in the United States.Social Science & Medicine. 2010; 70:130–135. [PubMed: 19819603]
Fox GL, Benson ML. Household and neighborhood contexts of intimate partner violence. PublicHealth Reports. 2006; 121:419–427. [PubMed: 16827443]
Freisthler B, Midanik LT, Gruenewald PJ. Alcohol outlets and child physical abuse and neglect:Applying routine activities theory to the study of child maltreatment. Journal of Studies onAlcohol. 2004; 65:586–592. [PubMed: 15536767]
Goldman, LE.; Chu, PW.; Prothro, C.; Osmond, D.; Bindman, AB. Accuracy of Condition Present OnAdmission, Do Not Resuscitate, and E-Codes in California Patient Discharge Data University ofCalifornia, San Francisco Study Consultants Team. 2011. available at:http://www.oshpd.ca.gov/HID/Products/PatDischargeData/ResearchReports/PDDValidation/PDD_Validation_Study.pdf
Grisso J, Schwarz D, Hirschinger N, Sammel M, Brensinger C, Santanna J, Lowe R, Anderson E,Shaw L, Bethel C, Teeple L. Violent injuries among women in an urban area. N Engl J Med. 1999;341:1899–905. [PubMed: 10601510]
Gruenewald PJ, Freisthler B, Remer L, LaScala EA, Treno A. Ecological models of alcohol outlets andviolent assaults: crime potentials and geospatial analysis. Addiction. 2006; 101:666–677.[PubMed: 16669900]
Gruenewald PJ, Freisthler B, Remer L, LaScala EA, Treno AJ, Ponicki WR. Ecological associations ofalcohol outlets with underage and young adult injuries. Alcoholism: Clinical and ExperimentalResearch. 2010; 34(3):519–527.
Gruenewald PJ, Remer L. Changes in outlet densities affect violence rates. Alcoholism: Clinical andExperimental Research. 2006; 30(7):1184–1193.
Johnson FW, Gruenewald PJ, Remer LG. Suicide and alcohol: Do outlets play a role? Alcoholism:Clinical and Experimental Research. 2009; 33(12):2124–2133.
Klostermann KC, Fals-Stewart W. Intimate partner violence and alcohol use: Exploring the role ofdrinking in partner violence and its implications for intervention. Aggression and ViolentBehavior. 2006; 11:587–597.
Kyriacou D, Anglin D, Taliaferro T, Stone S, Tubb T, Linden J, Muelleman R, Barton E, Kraus J. Riskfactors for injury to women from domestic violence. N Engl J Med. 1999; 341:1892–8. [PubMed:10601509]
Leonard, KE. Drinking patterns and intoxication in marital violence: Review, critique, and futuredirections for research. In: Martin, SE., editor. Alcohol and Interpersonal Violence: FosteringMultidisciplinary Perspectives. National Institutes of Health; Rockville, MD: 1993. p.253-280.NIAAA Research Monograph No. 24, NIH Pub. No. 93–3496
Leonard KE. Alcohol and intimate partner violence: When can we say that heavy drinking is acontributing cause of violence? Addiction. 2005; 100:422–425. [PubMed: 15784050]
Lipton R, Gruenewald PJ. The spatial dynamics of violence and alcohol outlets. Journal of Studies onAlcohol. 2002; 63(2):187–195. [PubMed: 12033695]
Cunradi et al. Page 9
Alcohol Clin Exp Res. Author manuscript; available in PMC 2013 May 01.
NIH
-PA Author Manuscript
NIH
-PA Author Manuscript
NIH
-PA Author Manuscript

Livingston M. A longitudinal analysis of alcohol outlet density and assault. Alcoholism: Clinical andExperimental Research. 2008; 32(6):1074–1079.
Livingston M. The ecology of domestic violence: the role of alcohol outlet density. Geospat Health.2010; 5(1):139–49. [PubMed: 21080328]
Livingston M. A longitudinal analysis of alcohol outlet density and domestic violence. Addiction.2011; 106(5):919–925. [PubMed: 21205052]
Lunn DJ, Thomas A, Best N, Spiegelhalter D. WinBUGS - A Bayesian modelling framework:Concepts, structure, and extensibility Statistics and Computing. 2000; 10(4):325–337.
McKinney CM, Caetano R, Harris TR, Ebama MS. Alcohol availability and intimate partner violenceamong US couples. Alcoholism: Clinical and Experimental Research. 2009; 33(1):169–176.
Mckinney CM, Caetano R, Rodriguez LA, Okoro N. Does alcohol involvement increase the severity ofintimate partner violence? Alcoholism: Clinical and Experimental Research. 2010; 34(4):655–658.
National Center for Injury Prevention and Control. Costs of Intimate Partner Violence Against Womenin the United States. Centers for Disease Control and Prevention; Atlanta, GA: 2003.
Nyaronga D, Greenfield TK, McDaniel PA. Drinking context and drinking problems among black,white, and Hispanic men and women in the 1984, 1995, and 2005 U.S. National Alcohol Survey.Journal of Studies on Alcohol and Drugs. 2009; 70:16–26. [PubMed: 19118387]
O’Campo P, Gielen A, Faden R, Xue X, Kass N, Wang M-C. Violence by male partners againstwomen during the childbearing year: A contextual analysis. Am J Public Health. 1995; 85(8):1092–1097. [PubMed: 7625502]
Parks KA. An event-based analysis of aggression women experience in bars. Psychology of AddictiveBehaviors. 2000; 14(2):102–110. [PubMed: 10860109]
Parks KA, Hsieh Y-P, Collins RL, Levonyan-Radloff K, King LP. Predictors of risky sexual behaviorwith new and regular partners in a sample of women bar drinkers. Journal of Studies on Alcoholand Drugs. 2009; 70:197–205. [PubMed: 19261231]
Quigley BM, Leonard KE, Collins RL. Characteristics of violent bars and bar patrons. Journal ofStudies on Alcohol. 2003; 64:765–772. [PubMed: 14743938]
Reid RJ, Bonomi AE, Rivara FP, Anderson ML, Fishman PA, Carrell DS, Thompson RS. IntimatePartner Violence Among Men: Prevalence, Chronicity, and Health Effects. American Journal ofPreventive Medicine. 2008; 34(6):478–485. [PubMed: 18471583]
Rhodes KV, Houry D, Cerulli C, Straus H, Kaslow NJ, McNutt L-A. Intimate Partner Violence andComorbid Mental Health Conditions Among Urban Male Patients. Ann Fam Med. 2009; 7:47–55.[PubMed: 19139449]
Schafer J, Caetano R, Clark CL. Rates of intimate partner violence in the United States. Am J PublicHealth. 1998; 88(11):1702–1704. [PubMed: 9807541]
Shorey R, Brasfield H, Febres J, Stuart G. The Association between Impulsivity, Trait Anger, and thePerpetration of Intimate Partner and General Violence Among Women Arrested for DomesticViolence. Journal of Interpersonal Violence. 2011; 26(13):2681–97. [PubMed: 21118862]
Sorenson S, Upchurch D, Shen H. Violence and injury in marital arguments: risk patterns and genderdifferences. Am J Public Health. 1996; 86(1):35–40. [PubMed: 8561239]
Straus H, Cerulli C, McNutt LA, Rhodes KV, Conner KR, Kemball RS, Kaslow NJ, Houry D. IntimatePartner Violence and Functional Health Status: Associations with Severity, Danger, and Self-Advocacy Behaviors. JOURNAL OF WOMEN’S HEALTH. 2009; 18(5):625–631.
Straus, MA.; Gelles, RJ. How violent are American families? Estimates from the National FamilyViolence Resurvey and other studies. In: Straus, MA.; Gelles, RJ., editors. Physical violence inAmerican families: Risk factors and adaptations to violence in 8/145 families. TransactionPublishers; New Brunswick, NJ: 1990. p. 95-112.
Stuart GL, Meehan JC, Moore TM, Morean M, Hellmuth J, Follansbee K. Examining a conceptualframework of intimate partner violence in men and women arrested for domestic violence. Journalof Studies on Alcohol. 2006; 67:102–112. [PubMed: 16536134]
Suitor, J.; Pillemer, K.; Straus, M. Marital violence in a life course perspective. In: Straus, M.; Gelles,R., editors. Physical violence in American families: Risk factors and adaptations to violence in8.145 families. Transaction; New Brunswick: 1990. p. 305-317.
Cunradi et al. Page 10
Alcohol Clin Exp Res. Author manuscript; available in PMC 2013 May 01.
NIH
-PA Author Manuscript
NIH
-PA Author Manuscript
NIH
-PA Author Manuscript
Treno AJ, Gruenewald PJ, Remer LG, Johnson FW, LaScala EA. Examining multi-level relationshipsbetween bars, hostility and aggression: social selection and social influence. Addiction. 2007a;103:66–77. [PubMed: 18028523]
Treno AJ, Johnson FW, Remer L, Gruenewald PJ. The impact of outlet densities on alcohol-relatedcrashes: a spatial panel approach. Accid Anal Prev. 2007b; 39:894–901. [PubMed: 17275773]
Waller, LA.; Gotway, CA. Applied Spatial Statistics for Public Health Data. John Wiley and Sons;Hoboken, NJ: 2004.
Walton MA, Murray R, Cunningham RM, Chermack ST, Barry KL, Booth BM, Ilgen MA, Wojnar M,Blow FC. Correlates of intimate partner violence among men and women in an inner cityemergency department. J Addict Dis. 2009; 28(4):366–381. [PubMed: 20155606]
Weiss HB, Ismailov RM, Lawrence BA, Miller TR. Incomplete and biased perpetrator coding amonghospitalized assaults for women in the United States. Injury Prevention. 2004; 10:119–121.[PubMed: 15066979]
Whitaker DJ, Haileyesus T, Swahn M, Saltzman LS. Differences in frequency of violence and reportedinjury between relationships with reciprocal and nonreciprocal intimate partner violence.American Journal of Public Health. 2007; 97(5):941–947. [PubMed: 17395835]
Zhu L, Gorman DM, Horel S. Alcohol outlet density and violence: A geospatial analysis. Alcohol &Alcoholism. 2004; 39:369–375. [PubMed: 15208173]
Zhu L, Waller LA, Ma J. Spatial-temporal disease mapping of illicit drug abuse or dependence in thepresence of misaligned ZIP codes. GeoJournal. (in press).
Cunradi et al. Page 11
Alcohol Clin Exp Res. Author manuscript; available in PMC 2013 May 01.
NIH
-PA Author Manuscript
NIH
-PA Author Manuscript
NIH
-PA Author Manuscript
NIH
-PA Author Manuscript
NIH
-PA Author Manuscript
NIH
-PA Author Manuscript
Cunradi et al. Page 12
Table 1
Descriptive statistics, zip codes in California 2005–2008
Mean SD Minimum Maximum
Population 22,089.9 21,735.3 1 110,374
Area (Square Miles) 93.1 245.4 0.05 3,802.2
Bar / Pub Density 0.8 3.6 0 65.7
Off-Premise Outlet Density 2.6 6.6 0 118.5
Restaurant Density 4.8 20.1 0 442.9
% Black 4.6 8.0 0 86.7
% Hispanic 28.7 22.3 0 97.9
% below 150% poverty line 22.8 13.6 0 100.0
% unemployed 7.4 7.0 0 100.0
Number of IPV-related ER visits 23.6 28.8 0 237
Notes: Statistics are based on n=11,836 half-year zip code observations as used in the regression models.
Estimates for all measures other than IPV-related ER visits are only available annually.
Estimates are the same in the first and second half of 2006, 2007, 2008.
Outlet densities are calculated as number of alcohol licenses per square mile.
Alcohol Clin Exp Res. Author manuscript; available in PMC 2013 May 01.

NIH
-PA Author Manuscript
NIH
-PA Author Manuscript
NIH
-PA Author Manuscript
Cunradi et al. Page 13
Table 2
Results of Bayesian Spatial Misalignment Model for IPV-related ED Visits
Raw Coefficient Relative Risk
Alcohol Outlet Density Bars / Pubs 0.030 (0.014, 0.046) 1.030(1.015,1.047)*
Off-Premise −0.010 (−0.018, −0.001) 0.990(0.982,0.999)*
Restaurants 0.000 (−0.004, 0.004) 1.000(0.996,1.004)
Census-Based Characteristics % Black 0.016 (0.013, 0.020) 1.016(1.013,1.020)*
% Hispanic 0.003 (0.010, 0.005) 1.003(1.001,1.005)*
% below 150% poverty 0.019 (0.015, 0.023) 1.019(1.015,1.023)*
% unemployed −0.013 (−0.022, −0.004) 0.987(0.979,0.996)*
Zip code instability −0.015 (−0.051, 0.015) 0.986(0.951,1.016)
Period-Specific Intercepts 2005 (2nd half) −0.589 (−0.685, −0.494)
2006 (1st half) −0.730 (−0.831, −0.631)
2006 (2nd half) −0.676 (−0.777, −0.576)
2007 (1st half) −0.740 (−0.843, −0.637)
2007 (2nd half) −0.651 (−0.752, −0.550)
2008 (1st half) −0.735 (−0.837, −0.633)
2008 (2nd half) −0.700 (−0.801, −0.597)
CAR proportion of error variance 0.7756(0.7081, 0.8740)
Spatial autocorrelation of CAR effect 0.943 (z = 60.52)
Notes: The values presented above are median estimates from the posterior distribution, followed in parentheses by their 95% credible interval(2.5%, 97.5%). Raw coefficients are log relative risks, which were then exponentiated to produce relative risks.
*Indicates findings that are well-supported by the data as evidenced by credible intervals that exclude zero for raw coefficients or, equivalently,
exclude one for relative risks.
Alcohol Clin Exp Res. Author manuscript; available in PMC 2013 May 01.
Copyright © 2022 FDOKUMEN