Agroforestry Price Supports as a Conservation Tool: Mexican shade coffee
15
Agroforestry price supports as a conservation tool: Mexican shade coffee Beatriz A ´ valos-Sartorio Allen Blackman Received: 17 December 2008 / Accepted: 21 July 2009 / Published online: 19 August 2009 Ó Springer Science+Business Media B.V. 2009 Abstract Economic policies that boost profits from agroforesty, thereby creating financial incentives for land managers to favor these systems over less environmentally friendly land uses, could, in theory, have ancillary environmental benefits. This paper analyses primary and secondary data to determine whether a voluntary price support program for Mexican coffee—mostly grown in shaded systems that supply important ecosystem services—has had such ‘‘win-win’’ benefits by stemming land-use change in the coffee sector. We find that although the program attracted the types of growers associated with land-use change, it attracted only a relatively small number of them, did not target growing areas hardest hit by conversion to other land uses, and provided subsidies that were probably too small to affect land-use decisions. These results raise serious questions about the ability of an agroforestry price support program with a modest price floor to have a significant conservation impact. Keywords Agroforestry Shade-grown coffee Mexico Price supports Land use Introduction Agroforestry systems, in which crops such as coffee, cocoa, and bananas are planted side by side with woody perennials, can provide important ecosystem services. They can harbor biodiversity, sequester carbon, prevent soil erosion, and aid in flood control and aquifer recharge (Daily et al. 2003; Castro et al. 2003; Vandermeer and Perfecto 1997). In addition, they can provide biological corridors between patches of primary forests and help preserve forests by diverting extractive activities, such as hunting and foraging (Gajaseni et al. 1996; Saunders and Hobbs 1991). Hence, policies and programs that boost profits from agroforesty, thereby creating financial incentives for land managers to retain these systems instead of switching to less environmentally friendly land uses, could, in theory, have ancillary B. A ´ valos-Sartorio Polytechnic University of Morelos, Boulevard Cuauhna ´huac No. 566, Col. Lomas de Texcal, C.P. 62550 Jiutepec, Morelos, Mexico e-mail: [email protected] A. Blackman (&) Resources for the Future, 1616 P Street, N.W., Washington, DC 20036, USA e-mail: [email protected] A. Blackman Environment for Development Center for Central America, Centro Agrono ´mico Tropical de Investigacio ´n y Ensen ˜anza (CATIE), Turrialba, Costa Rica 123 Agroforest Syst (2010) 78:169–183 DOI 10.1007/s10457-009-9248-4
Transcript of Agroforestry Price Supports as a Conservation Tool: Mexican shade coffee

Agroforestry price supports as a conservation tool: Mexicanshade coffee
Beatriz Avalos-Sartorio Æ Allen Blackman
Received: 17 December 2008 / Accepted: 21 July 2009 / Published online: 19 August 2009
� Springer Science+Business Media B.V. 2009
Abstract Economic policies that boost profits from
agroforesty, thereby creating financial incentives for
land managers to favor these systems over less
environmentally friendly land uses, could, in theory,
have ancillary environmental benefits. This paper
analyses primary and secondary data to determine
whether a voluntary price support program for
Mexican coffee—mostly grown in shaded systems
that supply important ecosystem services—has had
such ‘‘win-win’’ benefits by stemming land-use
change in the coffee sector. We find that although
the program attracted the types of growers associated
with land-use change, it attracted only a relatively
small number of them, did not target growing areas
hardest hit by conversion to other land uses, and
provided subsidies that were probably too small to
affect land-use decisions. These results raise serious
questions about the ability of an agroforestry price
support program with a modest price floor to have a
significant conservation impact.
Keywords Agroforestry � Shade-grown coffee �Mexico � Price supports � Land use
Introduction
Agroforestry systems, in which crops such as coffee,
cocoa, and bananas are planted side by side with
woody perennials, can provide important ecosystem
services. They can harbor biodiversity, sequester
carbon, prevent soil erosion, and aid in flood control
and aquifer recharge (Daily et al. 2003; Castro et al.
2003; Vandermeer and Perfecto 1997). In addition,
they can provide biological corridors between patches
of primary forests and help preserve forests by
diverting extractive activities, such as hunting and
foraging (Gajaseni et al. 1996; Saunders and Hobbs
1991). Hence, policies and programs that boost
profits from agroforesty, thereby creating financial
incentives for land managers to retain these systems
instead of switching to less environmentally friendly
land uses, could, in theory, have ancillary
B. Avalos-Sartorio
Polytechnic University of Morelos, Boulevard
Cuauhnahuac No. 566, Col. Lomas de Texcal, C.P. 62550
Jiutepec, Morelos, Mexico
e-mail: [email protected]
A. Blackman (&)
Resources for the Future, 1616 P Street, N.W.,
Washington, DC 20036, USA
e-mail: [email protected]
A. Blackman
Environment for Development Center for Central
America, Centro Agronomico Tropical de Investigacion y
Ensenanza (CATIE), Turrialba, Costa Rica
123
Agroforest Syst (2010) 78:169–183
DOI 10.1007/s10457-009-9248-4

environmental benefits.1 The literature on this link is
thin, however. We know little about whether and to
what extent economic policies aimed at supporting
agroforestry effectively serve double duty as conser-
vation tools, or how they might be designed or
modified to enhance such synergies.
To help fill that gap, this paper presents a case
study of a historical episode in which a policy aimed
at raising profits from an agroforesty system had the
potential to generate ‘‘win-win’’ environmental ben-
efits. We examine Mexico’s Coffee Stabilization
Fund (Fondo de Estabilizcion del Cafe, FEC), a
voluntary program that guarantees participating
growers a set price for their crop. The FEC was
established in the 2001–2002 harvest season in
response to the coffee crisis—the precipitous decline
in world coffee prices during the 1980s and 1990s
that culminated in a 100-year low during the 2000–
2001 season. In addition to creating economic
hardship, the crisis spurred conversion of land on
and around coffee farms to cleared land uses,
including row crops and pasture. Because the Mex-
ican coffee sector is dominated by densely shaded
systems located in particularly biodiverse areas, the
end result was significant loss of tree cover along
with critical ecosystem services (Moguel and Toledo
1999; Batz 2005; Blackman 2005; Eakin et al. 2006).
In principle, the FEC had the potential to mitigate
those environmental damages by creating financial
incentives for growers to continue to cultivate shade
coffee instead switching to other land uses or
abandoning their farms and leaving them vulnerable
to encroachment. However, the program could have
stemmed tree cover loss only if it changed the
behavior of significant number of growers who
otherwise would have cleared the tree cover or
abandoned their farms. Accordingly, we use detailed
census data along with original survey data on coffee
growers to address four sets of questions about the
FEC:
1. What was the scope of the program? Did it attract
a significant percentage of coffee growers and of
the total coffee acreage?
2. What types of growers participated? Did the
program attract the growers who were responsi-
ble for tree cover loss?
3. Where were participating growers located? Were
their farms in areas where tree cover loss was
most severe?
4. Were the program’s subsidies large enough to
affect growers’ land-use decisions?
To make the analysis manageable, we focus on a
limited geographic area and time frame: the Coast
and Southern Sierra (Costa y Sierra Sur) region of the
state of Oaxaca in the 2002–2003 harvest season, the
second year of FEC program operation.
We find that although the FEC attracted the types
of growers associated with tree cover loss, it attracted
only a relatively small number of them, did not target
growing areas hardest hit by tree cover loss, and
provided subsidies that were probably too small to
affect land-use decisions. Taken together, these
results suggest that the FEC, by itself, probably did
little to stem tree cover loss in Mexico’s Coast and
Southern Sierra coffee-growing area.
The remainder of the paper is organized as
follows. The next section provides background on
the Mexican coffee sector, the FEC, and our study
area. The third section briefly discusses our data. The
fourth section presents an analysis of the four
questions listed above. The fifth section presents a
summary and conclusion.
Background
In Mexico, coffee production represents an important
source of income for some 481,000 households that
cultivate 665,000 hectares of coffee and hire at least
one million laborers annually (Consejo Mexicano del
Cafe 2004a). The lion’s share of coffee farms are
smaller than 2 hectares each and are concentrated in
some of the country’s poorest regions (Davidson
2005).
Almost 90% of Mexican coffee is cultivated in
mixed systems in which coffee bushes are planted
alongside trees, and almost 40%—including the
coffee in our study area—is cultivated in ‘‘rustic’’
1 Agroforesty systems typically provide lower levels of
ecosystem services than native forest. Therefore, policies and
programs that create incentives for land managers to convert
native forest to agroforestry can entail environmental costs
(Rapploe et al. 2002). Our focus is on policies that create
incentives for the retention of existing systems.
170 Agroforest Syst (2010) 78:169–183
123
and ‘‘traditional’’ systems characterized by relatively
dense and diverse tree cover that generates ecosystem
services on par with native forest.2 The biodiversity
benefits of Mexican shade coffee are particularly
notable. All 14 of Mexico’s main coffee-growing
regions have been designated biodiversity ‘‘hotspots’’
by the country’s national commission on biodiversity
(Moguel and Toledo 1999; Perfecto et al. 1996;
Davidson 2005).
The coffee crisis had a dramatic effect on Mex-
ico’s coffee sector. Between 1990 and 2004, coffee
production in Mexico fell 21% and exports fell 56%
(ICO 2005). During the same period, coffee export
revenue fell 80%, from US$450 million to US$250
million (SourceMex 2004). By the end of the 1990s,
prices received by many Mexican growers had
dropped to levels below average production costs,
severely affecting the economy in coffee-growing
areas.
The Mexican federal government responded to the
coffee crisis by implementing a series of programs
targeting the coffee sector beginning in the 2001–
2002 harvest season.3 The flagship initiative was the
FEC, a US$80 million permanent fund that provides
price supports to coffee growers when international
prices drop below an established floor of US$85 per
hundredweight (cwt, 100 pounds) of green coffee
(CMC 2001).4 Operated by the Mexican Ministry of
Agriculture, the FEC provides a maximum subsidy of
US$20 per cwt of Arabica coffee for up to 20 cwt per
participating producer.5 To participate, coffee pro-
ducers must be registered in the National Coffee
Census (Padron Nacional Cafetalero), must sell their
coffee to registered buyers, and must pick up their
subsidy checks in person at the designated local
government office. FEC rules establish a mechanism
for maintaining the US$80 million fund: participating
producers commit to accepting a discounted price
when the international price of coffee exceeds
US$85, and the amount of the discount is used to
replenish the FEC fund.6
This case study focuses on the Coast and Southern
Sierra region in the state of Oaxaca, which produces
about one-fifth of Mexico’s coffee (Fig. 1). According
to the most recent census, in this region, 33,000
producers grow coffee on 87,000 hectares (ASERCA
2004). Three-quarters of the region’s coffee acreage is
2 Ecosystem services aside, shaded systems have private
advantages and disadvantages for growers. Among the disad-
vantages, they generally produce yields 10–30% lower than
systems with little or no shade (Staver et al. 2001; Campanha
et al. 2004; Muschler 2004). Among the advantages, they help
conserve soil on steeply sloped land and require lower levels of
purchased inputs because tree cover harbors birds that eat
pests; generates nitrogen, leaf litter, and other organic matter
that serves as fertilizer; and helps retain moisture (Davidson
2005).3 In Mexico, coffee is harvested from October to March. In
addition to the FEC, the main government programs that
support the coffee sector are (1) the Market Promotion
Program (Programa de Promocion de Mercado), aimed at
improving coffee marketing; (2) the Program of Withholding
Inferior Quality Coffee (Programa de Retiro de Cafe deCalidades Inferiores), which exhorts producers not to sell
poor-quality coffee; (3) the Program to Promote Coffee
Production (Programa de Impulso a la Produccion de Cafe),
which provides subsidies to producers for investments that
increase per hectare yields; (4) the Plan of Producer Support to
Promote Crop Production (Esquema de Apoyo a la Producciony para Fomentar la Realizacion de la Cosecha), in which
registered producers received a one-time payment of US$95
per hectare to support harvesting costs in 2000–2001, and (5)
the Productivity Promotion Program (Fondo de FomentoProductivo) which consists of per hectare payments for all
registered producers and also encourages growers with plots
below 600 m above sea level to plant fruit or wood trees in
their coffee plots.
4 In its first year, the FEC was operated by the Mexican Coffee
Council (Consejo Mexicano del Cafe, CMC). It is now
managed directly by the Ministry of Agriculture’s Rural
Alliance (Alianza para el Campo) program.5 The price compensation for robusta coffee, a species rarely
grown in Mexico, is up to US$10 per cwt for up to 15 cwt per
participating producer.6 The discount varies from US$3 per cwt when the interna-
tional price is between US$85 and US$89.5 per cwt, to US$20
when the international price is US$140 or more. To be
continuously eligible to participate, producers must demon-
strate that they have participated in the FEC’s replenishment in
years when international prices have exceeded the price
ceiling. Starting in 2005–2006, discounts are triggered only
when the international price is greater than US$100 (AME-
CAFE 2008). International prices remained below the US$85
per cwt international ‘‘trigger price’’ for FEC subsidies well
into 2004. As a result, the FEC provided subsides in the 2003–
2004 harvest season. However, during the fourth quarter of
2004, international prices surpassed $85 per cwt and have
remained above it ever since. Between November 2004 and
November 2006, the FEC accumulated US$25 million from
reimbursements, roughly half the funds assigned to the FEC in
the 2006 federal budget. International prices rose above the
new US$100 trigger price in the fourth quarter of 2008 and
have remained above it ever since. Although the FEC has not
received funds from the federal budget since 2007, it continues
growing because of reimbursements (Comision Especial del
Cafe 2006; Perez 2006).
Agroforest Syst (2010) 78:169–183 171
123

managed by poor, small-scale growers (Nestel 1995).
The section titled, ‘‘What types of growers partici-
pated in the FEC?’’ below provides more information
about these farms’ socioeconomic and basic geophys-
ical characteristics (altitude and distance to roads).
In terms of agroecology, the typical household in
our study area manages a mixed production system
that includes shade coffee, shifting row agriculture
(primarily maize), a home garden, fallow land, and
natural forest used for hunting and foraging. Coffee is
grown in densely shaded, highly biodiverse ‘‘rustic’’
and ‘‘traditional’’ systems in which the canopy
comprises native or seminative trees and the under-
story includes a variety of wild and domesticated
useful species in addition to coffee (Aguilar-Støen
2009; Asteggiano 2008).7 The most abundant canopy
species are Inga oesterdiana Benth., Alchornea
latifolia Swartz, and Cupania glabra Swartz, and
the understory is dominated by Musa sp. (bananas),
Chamaedorea sp. (palm), and Theobroma cacao L.
(cacao) (Asteggiano 2008).
According to local stakeholders, during the coffee
crisis, most tree cover loss in the Coast and Southern
Sierra coffee region resulted from logging and
shifting agriculture (Avalos-Sartorio 2005). During
the coffee crisis, when cash income from coffee
declined, households cleared small plots of natural
forest and/or shade coffee in order to sell the timber
and grow row crops. However, the poor soils on these
plots—which are typically steeply sloped—were
quickly eroded by rainfall. As a result, households
cleared new plots within a few years. In principle,
such clearing was regulated under Mexican law,
which requires all persons wishing to clear forested
land to obtain a federal permit and in some cases a
local permit, regardless of the scale of the clearing
(NACEC 2003). In practice, however, persons clear-
ing small plots for shifting agriculture generally
ignored these requirements. Enforcement of forestry
laws mainly depended on citizen denunciations of
violators and was consequently haphazard, especially
in remote areas.
Data
We use four complementary quantitative databases to
address the four sets of questions listed in section
‘‘Introduction’’. First, we use a 2001–2004 census of
approximately 33,000 coffee growers in the Coast
and Southern Sierra region compiled by the Agricul-
tural Marketing Services agency (Apoyos y Servicios
a la Comercializacion Agropecuaria, ASERCA), a
Mexican governmental institution. The ASERCA
Fig. 1 The location of
study area
7 There is no sun coffee in our study region. The coffee
varieties grown are not compatible with the direct sunlight,
relatively low humidity, and relatively high temperatures on
full-sun plantations.
172 Agroforest Syst (2010) 78:169–183
123
census includes data on farm size, land tenure, and
location. Second, we use 1995 township-level data on
the socioeconomic characteristics of the Coast and
Southern Sierra region compiled by the National
Population Council (Consejo Nacional de Poblacion,
CONAPO), another Mexican government agency.
The CONAPO data include socioeconomic indicators
and distance to the township center from paved roads
for more than 400 townships in this region. Third, we
use a 2004 list of the study area’s coffee growers who
participated in the FEC program in the 2002–2003
harvest season. The list was compiled by the Mexican
Coffee Council (Consejo Mexicano del Cafe, CMC).
Finally, we use coffee production data provided by
local stakeholders during a series of structured face-
to-face interviews conducted by the authors in
January 2005 (Avalos-Sartorio 2005). In addition to
providing quantitative data, the structured interviews
helped frame and guide our analysis.
The interviews were conducted using a checklist
of topics to be covered, including the costs of FEC
participation, perceived implementation irregulari-
ties, the timeliness and amounts of support received,
coffee prices, and coffee production costs.8 We
interviewed 30 coffee growers, chosen by first
randomly selecting several townships in our study
area and then randomly selecting growers in these
townships from the ASERCA census. In addition to
growers, we interviewed two middlemen, the man-
agers of the two largest coffee-exporting companies
in our study area (Calvo Export and Becafisa), the
government official in charge of the rural develop-
ment office that manages the FEC in our study area,
an official of a government agricultural development
bank (Fideicomisos Instituidos en Relacion con la
Agricultura en el Banco de Mexico, FIRA), the
manager of a coffee production-marketing coopera-
tive (La Trinidad), and the manager of a local
nongovernmental organization (Fundacion Mexicana
para el Desarrollo Rural). Challenges in conducting
the interviews included growers’ limited education—
and in the case of some indigenous growers, limited
Spanish proficiency—and difficulty tracking down
randomly selected producers in remote locations.
Analysis
Scope of FEC participation
The ASERCA census lists 33,156 coffee growers in
our study region, collectively cultivating 86,956
hectares. Of these growers 27% participated in the
FEC in the 2002–2003 harvest season. These partic-
ipants cultivated 24% of the total land in coffee.
Thus, the FEC’s purview in our study area was
limited: only approximately a quarter of all growers
representing slightly more than a quarter of the land
planted in coffee participated in the program. This
finding suggests that to be effective as a conservation
tool, the FEC would have to have been particularly
effective in attracting growers responsible for
deforestation.
What types of growers participated in the FEC?
We use multiple regression analysis to identify the
characteristics of the growers who participated in the
FEC. To underpin the econometric analysis, Appen-
dix 1 presents a simple analytical model of a coffee
grower’s decision to participate. The model demon-
strates that a grower’s decision depends on two
general factors: the profits s/he obtains from coffee
absent the FEC program, and the transaction costs s/
he pays to participate (e.g., the costs of obtaining
information about the program, filling out the neces-
sary paperwork, selling to registered buyers, and
picking up subsidies in person). Both preprogram
profits and participation transaction costs depend on
the characteristics of the coffee farm and of the
grower. For example, all other things equal, growers
at high altitudes produce higher-quality coffee and
therefore earn higher profits but pay higher transac-
tion costs because they are farther from FEC offices.
The analytical model can be used to demonstrate that
as one would expect, growers who earn relatively low
preprogram profits and those who pay lower transac-
tion costs are more likely to participate in the
program.
Variables
Table 1 lists the farm and grower characteristic
variables used in the econometric analysis of program
participation (as well as in a second analysis
8 The checklist was developed based on our prior knowledge
of the FEC and of coffee growing in the Coast and Southern
Sierra region, along with results from preliminary econometric
analysis of FEC participation.
Agroforest Syst (2010) 78:169–183 173
123

discussed in the section titled, ‘‘Where were partic-
ipating growers located?’’). The variables are
FARM_SIZE, the size of the farm measured in
hectares; ALTITUDE, the altitude of the farm
measured in meters above sea level (msl); PRIVATE,
a dichotomous dummy variable indicating the farm is
privately owned (versus communally owned by a
communidad agraria or an ejido); P_INDIGENOUS,
the percentage of the population aged five and over in
the township where the farm is located who speak an
indigenous language instead of Spanish; P_WOMEN,
the percentage of the population in the township
where the farm is located who are female; and
KM_TO_ROAD, the distance from the nearest
township center to the nearest paved road.
The data set used to analyze participation in the
FEC was created by merging three of the data sets
discussed in the section titled, ‘‘Data’’ (ASERCA
2004; CONAPO 1998; CMC 2004b). Of the 33,156
coffee growers in our study area listed in the
ASERCA census, 23,284 (70%) survived this merge.
Table 1 presents summary statistics for the full
sample (n = 23,284), as well as for participants
(n = 5,741) and nonparticipants (n = 17,543). The
statistics show that the typical coffee grower in our
study area was small-scale, was located at relatively
high altitude and more than 10 km from a paved road,
was cultivating communally owned land, and was not
indigenous.
As for our expectations about the effect of grower
and farm characteristics on the probability of FEC
participation, the variables fall into two categories:
those that have unidirectional effects on this proba-
bility, and those that have countervailing effects. The
first category only includes one variable: ALTI-
TUDE. We expect ALTITUDE to be negatively
correlated with the probability of participation.
Growers at higher altitudes typically earn a relatively
high return on their coffee because they produce
better-quality beans that fetch better prices (Avelino
et al. 2005). Also, growers located at higher altitudes
pay higher transaction costs for participating in the
FEC because they have to travel longer distances to
FEC offices and banks in the cities of Pochutla and
Puerto Escondido, both of which are located on the
coastal plain.
We expect the remaining farm characteristic vari-
ables—FARM_SIZE, PRIVATE, P_INDIGENOUS,
P_WOMEN, and KM_TO_ROAD—to have counter-
vailing effects on the probability of participation. They
have one effect through returns to coffee, and an
opposite effect through transaction costs; which effect
dominates is an empirical issue. As for P_INDIGE-
NOUS, in Mexico, heavily indigenous populations do
Table 1 Variables used in econometric analyses
Variable Explanation Units Source Level Mean all
(n = 23,284)
Mean participants
(n = 5,741)
Mean
nonparticipants
(n = 17,543)
Dependent
PARTICIPATE Grower participated in
FEC ‘02–’03 season
0/1 CMC (2004a, b) Farm 0.25 1 0
Independent
FARM_SIZE Size farm ha. ASERCA (2004) Farm 2.86 2.51 2.97
ALTITUDE Altitude farm m.s.l. ASERCA (2004) Farm 1,033.15 1,021.09 1,037.10
PRIVATE Tenure farm is private 0/1 ASERCA (2004) Farm 0.11 0.09 0.12
P_INDIGENOUS % Town population
indigenous
% CONAPO (1998) Town 16.29 15.84 16.44
P_WOMEN % Town population
female
% CONAPO (1998) Town 50.19 50.07 50.22
KM_TO_ROAD Distance twn. ctr. to
paved rd.
km. CONAPO (1998) Town 14.38 14.40 14.37
P_CLEAR* % Forest in town
cleared ‘93–’02
% Blackman (2005) Town 4.39* 4.54* 4.33*
* Number of observations for P_CLEAR: all farms n = 8,193; participants n = 2,155; nonparticipants = 6,038
174 Agroforest Syst (2010) 78:169–183
123

not have equal access to public sector goods and
services, including education, technical extension,
agricultural marketing, credit, and infrastructure (Pa-
trinos 2000). As a result, such populations likely pay
higher prices for coffee inputs and receive lower prices
for their beans. Hence indigenous growers earn
relatively low returns on coffee and have relatively
strong incentives to participate in the FEC. But on the
other hand, indigenous growers also likely incur
higher-than-average transaction costs to participate in
the program.
PRIVATE also has countervailing effects on the
probability of participation. Private growers likely
earn lower returns on coffee than growers affiliated
with a communally owned and operated communidad
or ejido because they do not have the bargaining
power to negotiate favorable prices for inputs and
outputs. But such growers also pay higher transaction
costs of participating in the FEC program because
they cannot rely on cooperative institutions to gather
relevant information and assist with paperwork and
transportation.
As for P_WOMEN, a relatively high percentage of
women in the local population reflects outmigration
of men seeking nonfarm work; this variable is a
proxy for the number of coffee farms headed by
women. Because of the prevailing culture of the
region, men are often able to negotiate better input
and output prices than are women (Avalos-Sartorio
2005). Thus, one would expect women-headed farms
to earn relatively low returns on coffee and have
relatively strong incentives to participate in the FEC
program. But for the same cultural reasons, women
probably also incur higher transaction costs of
participating.
FARM_SIZE too is likely to have countervailing
effects on the probability of participation. Large
growers typically earn higher profits on coffee than
small growers because transportation, processing, and
marketing of coffee inputs and outputs exhibit econ-
omies of scale.9 But the transaction costs that large
growers pay to participate in the FEC are probably
lower than those of small growers. Unlike large
growers who typically sell to registered buyers as
required under FEC rules, small growers tend to sell
their coffee to informal middlemen who provide them
with working capital (Avalos-Sartorio 2005). There-
fore, small growers would need to identify and switch
to new buyers to participate. Just as important, small
growers are not able to spread the fixed transaction
costs of participating over as many units of output as
large growers.
Finally, we also expect KM_TO_ROAD to have
countervailing effects on the probability of partici-
pation in the FEC program. Growers located far from
paved roads obtain lower returns, all other things
equal, because of transportation costs. Such growers
have relatively strong incentives to join the FEC
program but would also pay higher transaction costs
to participate.
Regression results
Table 2 (Model 1) presents the results of a probit
regression aimed at explaining participation in the
FEC. All the variables are significant except for
KM_TO_ROAD. We had unequivocal expectations
about the sign of one variable—ALTITUDE and it
has the expected negative sign: farms at higher
altitudes were less likely to participate in the FEC.
Recall that the remaining significant variables—
FARM_SIZE, PRIVATE, P_INDIGENOUS, and
P_WOMEN—have countervailing effects on the
probability of participation, and as a result, we did
not have strong expectations about their signs.
FARM_SIZE is negative: large farms were less
likely to participate than small ones. Hence, for
FARM_SIZE, the returns effect dominates the trans-
action costs effect: the disincentive for large farms to
participate because they earned relatively high
returns outweighed the incentive due to paying
relatively low transaction costs.
For PRIVATE, P_INDIGENOUS, and P_WOMEN
the opposite is true. All are negative: growers with
privately held land and those who were indigenous and
female (to be exact, growers in townships that
were disproportionately indigenous and female) were
less likely to participate. Hence for PRIVATE,
P_INDIGENOUS, and P_WOMEN, the transaction
cost effect dominates the returns effect; that is, for
growers with privately held land and those who were
9 Also, unlike large growers, small growers sometimes sell
their coffee at a relatively early stage of processing—as natural
(dried whole cherries) or as pergamino (before the paperlike
husk covering the bean has been removed)—instead of as green
coffee.
Agroforest Syst (2010) 78:169–183 175
123
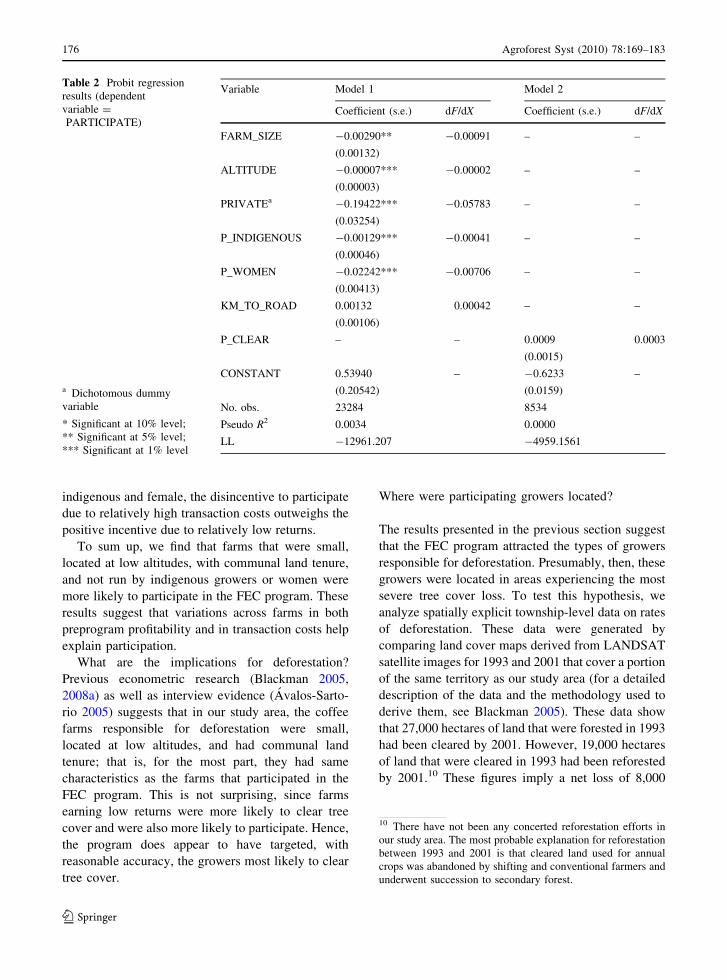
indigenous and female, the disincentive to participate
due to relatively high transaction costs outweighs the
positive incentive due to relatively low returns.
To sum up, we find that farms that were small,
located at low altitudes, with communal land tenure,
and not run by indigenous growers or women were
more likely to participate in the FEC program. These
results suggest that variations across farms in both
preprogram profitability and in transaction costs help
explain participation.
What are the implications for deforestation?
Previous econometric research (Blackman 2005,
2008a) as well as interview evidence (Avalos-Sarto-
rio 2005) suggests that in our study area, the coffee
farms responsible for deforestation were small,
located at low altitudes, and had communal land
tenure; that is, for the most part, they had same
characteristics as the farms that participated in the
FEC program. This is not surprising, since farms
earning low returns were more likely to clear tree
cover and were also more likely to participate. Hence,
the program does appear to have targeted, with
reasonable accuracy, the growers most likely to clear
tree cover.
Where were participating growers located?
The results presented in the previous section suggest
that the FEC program attracted the types of growers
responsible for deforestation. Presumably, then, these
growers were located in areas experiencing the most
severe tree cover loss. To test this hypothesis, we
analyze spatially explicit township-level data on rates
of deforestation. These data were generated by
comparing land cover maps derived from LANDSAT
satellite images for 1993 and 2001 that cover a portion
of the same territory as our study area (for a detailed
description of the data and the methodology used to
derive them, see Blackman 2005). These data show
that 27,000 hectares of land that were forested in 1993
had been cleared by 2001. However, 19,000 hectares
of land that were cleared in 1993 had been reforested
by 2001.10 These figures imply a net loss of 8,000
Table 2 Probit regression
results (dependent
variable =
PARTICIPATE)
a Dichotomous dummy
variable
* Significant at 10% level;
** Significant at 5% level;
*** Significant at 1% level
Variable Model 1 Model 2
Coefficient (s.e.) dF/dX Coefficient (s.e.) dF/dX
FARM_SIZE -0.00290**
(0.00132)
-0.00091 – –
ALTITUDE -0.00007***
(0.00003)
-0.00002 – –
PRIVATEa -0.19422***
(0.03254)
-0.05783 – –
P_INDIGENOUS -0.00129***
(0.00046)
-0.00041 – –
P_WOMEN -0.02242***
(0.00413)
-0.00706 – –
KM_TO_ROAD 0.00132
(0.00106)
0.00042 – –
P_CLEAR – – 0.0009
(0.0015)
0.0003
CONSTANT 0.53940
(0.20542)
– -0.6233
(0.0159)
–
No. obs. 23284 8534
Pseudo R2 0.0034 0.0000
LL -12961.207 -4959.1561
10 There have not been any concerted reforestation efforts in
our study area. The most probable explanation for reforestation
between 1993 and 2001 is that cleared land used for annual
crops was abandoned by shifting and conventional farmers and
underwent succession to secondary forest.
176 Agroforest Syst (2010) 78:169–183
123

hectares of forest cover, representing approximately
3% of the area of the land cover maps.11
Because we do not know the exact location
(latitude and longitude) of the coffee farms in our
data set—we only know the townships (localidades,
the Mexican jurisdictional units that comprise mu-
nicipios) in which they are located—we are not able
to analyze the correlation between participation in the
FEC program and rates of deforestation at the farm
level. Instead, we use township-level data—specifi-
cally, data on the percentage of forest cover lost for
each of 479 townships in our land cover maps. Next
we create a farm household-level variable,
P_CLEAR, that associates each farm household with
the percentage of forest cover lost in the township
where it is located. Because the land cover maps
depict only a portion of our study area, the number of
farm households in this analysis is roughly a third of
that for the econometric analysis of participation.
Finally, we use a simple probit regression to deter-
mine whether P_CLEAR is correlated with the
probability of participation in the FEC program.12
As discussed in the section titled, ‘‘Background’’,
virtually all of the land in the townships in our study
area is a managed by rural farm households that split
their land among shade coffee, natural forest (which
they use for hunting and foraging), and shifting
agriculture, and that clear their land for shifting
agriculture when coffee profits are insufficient to
meet subsistence needs. As a result, townships are
aggregations of land managed by farm households
and should reflect farm-level deforestation rates.
Table 2 (Model 2) presents the probit regression
results. P_CLEAR is not significant. Hence, FEC
program participation is not any more likely in
townships with high historical deforestation rates
than in townships with low rates. That is, our data
suggest that the FEC does not appear to geograph-
ically target the ‘‘right’’ areas from a forest conser-
vation perspective.
Were FEC subsidies large enough to affect land-
use decisions?
The 2002–2003 FEC price floor (US$85, or 756 pesos
per cwt) was well below average coffee prices during
the 1980s and 1990s (Fig. 2). This fact begs the
question of whether the FEC subsidies were suffi-
ciently large to affect growers’ land-use decisions. To
help answer this question, we constructed a simple
linear model of a representative coffee farm house-
hold and used it to develop back-of-the-envelope
estimates of the percentage of the coffee farm’s
subsistence needs that were met with income from
coffee production, assuming alternatively that the
farm did, and did not, participate in the FEC. We
developed a range of such estimates for farms of
various sizes.
We did not explicitly model the link between
deforestation and the percentage of a coffee farm’s
subsistence needs that were met with coffee profits.
However, as discussed in the section titled, ‘‘Back-
ground’’, previous research as well as plentiful
anecdotal evidence suggests that most of the defor-
estation in our study area occurs when coffee farms—
particularly small ones—are not able to meet their
subsistence needs and turn to selling timber and
shifting subsistence agriculture to help fill the gap
(Blackman 2005).13
The simulation model is parameterized with data
culled from official statistics as well as interviews
with local stakeholders (Avalos-Sartorio 2005). To
the extent possible, we assume average prices, yields,
and costs for the 2002–2003 growing season. To
ensure that our modeling assumptions are not driving
our conclusion that FEC subsidies did not signif-
icantly improve most growers’ ability to meet their
subsistence needs, we make relatively conservative
11 Equivalently, the area experienced a 0.4% average annual
deforestation rate between 1993 and 2001.12 Ideally, we could develop a simultaneous equation econo-
metric model that explains both participation in the FEC
program and deforestation. Both phenomena are driven by the
same factors (ALTITUDE, FARM_SIZE, etc.) that determine
the coffee growers’ profits. Unfortunately, however, we do not
have the requisite data. Specifically, our deforestation data are
at the town level, not the farm level, and they predate our
participation data by 1 year. Hence, the goal of our analysis is
modest. We simply want to determine whether participation is
more likely in areas where past deforestation has been most
intense.
13 Large growers, by contrast, are less frequently associated
with deforestation. Stakeholder interviews suggest that their
response to falling returns has most often been to completely
abandon their farms, not to clear them for alternative land uses.
Moreover, large growers have evidently been successful at
preventing encroachment on abandoned farms by loggers,
ranchers, and conventional farmers, presumably because they
have the requisite political power (Avalos-Sartorio 2005).
Agroforest Syst (2010) 78:169–183 177
123

assumptions about parameter values; that is, the
assumptions bias upward our estimate of the per-
centage change in subsistence needs attributable to
the FEC.
The equations and parameters for the simulation
model are detailed in Appendix 2. We summarize the
major assumptions here. We assume that growers
obtain an average yield of 4.3 cwt of pergamino coffee
per hectare; this is the region’s average yield accord-
ing to a 1991 coffee grower census (the most recent
yield data available), which is likely a significant
overestimate for the 2002–2003 harvest season.14 We
assume that growers who did not participate in the
FEC program received the 2002–2003 average market
price of 430 pesos per cwt of pergamino and that
growers who did participate received 756 pesos per
cwt, equivalent to the price floor of US$85 dollars per
cwt. As for costs, we assume that the grower carried
out the bare minimum level of maintenance activities:
two weedings and harvesting. Furthermore, we
assume that these activities could be carried out at
zero opportunity cost using family labor only, as long
as the farm was no larger than 5 hectares. Finally, we
make the conservative assumption that coffee house-
holds’ minimum subsistence needs are 28,800 pesos
per year (approximately US$3,000), the annual wage
of an unskilled male adult who works in the local
construction sector.
Figure 3 shows the model’s estimated coffee
profits as a share of household subsistence needs by
farm size and FEC participation. Several features of
the figure are notable. First, the share of annual
subsistence needs met by coffee production is
increasing in farm size up to 5 hectares because as
farm size increases, revenues increase proportion-
ately while labor costs do not change. After 5 hect-
ares, however, the share of subsistence needs met by
coffee declines because the farm must hire external
labor. Second, for any given farm size, the share of
annual subsistence needs met by coffee is higher if
the farm participates in the FEC program because in
this case, it receives higher per hectare revenues.
Hence, in our model, a farm of 5 hectares meets
the greatest percentage of its subsistence needs. The
model suggests that in the 2002–2003 crop season,
such a farm would meet 30% of its subsistence needs
if it did not participate in the FEC program, and 55%
of its subsistence needs if it did participate. However,
the median farm size in our study area was just
1.5 hectares. Such a farm would meet just 10% of its
subsistence needs if it did not participate in the FEC
program, and 20% of its subsistence needs if it did
participate. Note that the model suggests that the FEC
program enabled otherwise unprofitable large farms
to earn profits from coffee production. Farms larger
than 11 hectares lose money from coffee production
if they do not participate, but with the program, farms
up to 115 hectares generate profits.
-30
-20
-10
0
10
20
30
40
50
60
1 2 3 4 5 6 7 8 9 10 11 12 13 14 15
Farms size (hectares)
Co
ffee
pro
fits
as
a sh
are
of
ho
use
ho
ld
sub
sist
ence
nee
ds
(%) with price support
without price support
median farmer need to hire labor
Fig. 3 Coffee profits as share of household subsistence needs,
by farm size and FEC participation. Source: Authors’
calculations, based on Avalos-Sartorio (2005)
0
500
1000
1500
2000
2500
3000
1975 1980 1985 1990 1995 2000 2005
Year
Pes
os
per
cw
t
2002-2003 price floor = 756 pesos (US $85) per cwt
Fig. 2 Average pergamino coffee prices per hundredweight
(cwt), Pochutla, Oaxaca, 1978–2003, in 2000 pesos. Source:
Authors’ calculations, based on ‘‘C’’ contract quotes from the
New York Board of Trade (New York Board of Trade 1998–
2005) (http://www.nybot.com/), exchange rate data from the
Chicago Mercantile Exchange (Chicago Mercantile Exchange
1998–2005) (http://www.cme.com), inflation data from the
Banco de Mexico (Banco de Mexico 2005) (www.banxico.org.
mx/), and data on local transportation costs gathered by the
authors
14 The 1991 average yield is likely well above the 2002–2003
average. In the low-price years preceding the 2002–2003
harvest season, growers cut back on ‘‘discretionary’’ weeding
and crop maintenance, which has a lasting adverse effect on
yield.
178 Agroforest Syst (2010) 78:169–183
123

Hence, our back-of-the envelope calculations
suggest that the FEC program did not significantly
improve the ability of small growers to meet their
subsistence needs. This was due to two factors. First,
the program paid a per hectare subsidy, not a per
household subsidy, which implied that small farms
received less financial assistance than large ones.
Second, the FEC program established a per hectare
price floor that was simply too low to enable the
average household to meet subsistence needs.
Conclusion
We have used both primary and secondary data to
evaluate the potential for Mexico’s FEC to stem rapid
deforestation in the Coast and Southern Sierra region,
one of the country’s main shade-coffee areas in the
early 2000s. We found that the program attracted the
types of coffee farms that tended to earn low returns
and that were associated with deforestation: those
that were relatively small, those located at low
altitudes, and those with communal land tenure.
However, we found that the program’s reach was
limited. In 2002–2003, only approximately a quarter
of all growers in our study area representing approx-
imately a quarter of the land planted in coffee
participated in the program. Moreover, the FEC did
not target the ‘‘right’’ locations: program participa-
tion was not any more likely in townships with high
historical deforestation rates than in townships with
low rates. Finally, we estimated that participation in
the FEC did not significantly improve the ability of
the average small coffee-farm household in our study
area to meet its subsistence needs. Taken together,
these results suggest that the FEC, by itself, probably
did little to stem tree cover loss in Mexico’s Coast
and Southern Sierra coffee-growing area.
How could the FEC and programs like it be
modified to make them more effective as conserva-
tion tools? One obvious option would be to raise the
price floor to attract more growers responsible for
land-use change and provide them with sufficiently
strong financial incentives to retain their land in
shade coffee. A second option would be to comple-
ment price support programs with other initiatives,
including those that provide lump-sum payments to
help cover harvesting costs, technical assistance for
improved quality and marketing, and payments for
environmental services provided by shade-coffee.
However, large increases in government expenditure
in the coffee sector may not be politically or
economically feasible. Most coffee growers are small
in scale and poorly organized (Davidson 2005). The
average Mexican is not aware of the social, much less
the ecological, importance of coffee production in
Mexico. Even for agricultural authorities, coffee is
not considered a ‘‘basic crop’’ (like maize, beans,
sorghum, and oilseeds), and coffee exports no longer
represent a leading source of foreign exchange
(Avalos-Sartorio 2009).
A third option would be to use existing fiscal
resources devoted to the program more strategically.
The aim would be to reduce the transaction costs of
program participation for precisely the types of
growers responsible for deforestation in geographic
areas where deforestation risk is highest—that is, to
target program outreach at a subpopulation of grow-
ers. This could be accomplished by, for example,
funding more branch offices in certain areas, devel-
oping subsidy payment mechanisms that do not
require participants to travel to distant program
offices, and reducing red tape. In addition to helping
stem tree cover loss, such strategies also could further
the FEC’s stated objective of softening the economic
impact of the coffee crisis, since in our study region,
the small-scale, disadvantaged growers responsible
for deforestation were also those most affected
economically by the price shocks.
Although our analysis suggests that such targeting
would be likely to enhance the conservation benefits
of price support programs like the FEC, it does not
guarantee that the effect will be significant. Unfor-
tunately, overall, our analysis raises serious questions
about the ability of an agroforestry price support
program with a modest price floor—that is, one that is
well below historical average prices—to have a
significant conservation impact. Alternative
approaches like shade coffee certification (ecolabel-
ing) and simple command-and-control land-use
restrictions may be more effective (Heidkamp et al.
2008; Blackman et al. 2008b).
Acknowledgments This research was partially funded by Dr.
Avalos-Sartorio’s Gilbert White Fellowship at Resources for
the Future. We are grateful to our interviewees in Mexico for
sharing insights and providing data. For valuable comments
and suggestions, we thank the Associate Editor, an anonymous
reviewer, Patrick Heidkamp, and participants at meetings of
Agroforest Syst (2010) 78:169–183 179
123

the Southern Economic Association and the Latin American
and Caribbean Environmental Economic Association.
Appendix 1: Analytical model of coffee grower’s
FEC participation decision
This appendix presents a simple analytical model of a
coffee grower’s decision to participate in the FEC.
We assume that growers maximize the following
profit function each harvest season:
maxðqi ;iÞ
Pi ¼ PiðZÞqiðZÞ � CðqijZÞ � TiðZÞ i ¼ ðr; oÞ
ð1Þ
where
P expected profit
i an index of participation (r) or nonparticipation
(o)
P price of coffee
Z a vector of farm characteristics
Q coffee quantity
C a production cost function
T transaction costs associated with participation in
the FEC program
Thus, growers maximize profit by choosing an
output quantity and by deciding whether to partici-
pate in the FEC. Each component of the profit
function depends on farm characteristics, Z, and some
of these components depend on whether the grower
participates in the FEC. Coffee price, P, depends on
farm characteristics because, for example, farms at
higher altitudes are able to grow higher-quality
coffee, which fetches a higher price than bulk coffee
grown at low altitudes. In years when average coffee
prices are below the FEC price floor, price can
depend on whether the grower participates in the
program. Output, q(�), depends on farm characteris-
tics because, for example, farms at higher altitudes
typically have higher coffee yields per hectare.
Output also depends on participation in the FEC
because growers who participate and obtain price
subsidies may choose to harvest more of their crop
than they otherwise would. Production costs, C(�),depend on farm characteristics because, for example,
large farms are able to negotiate better input prices
with suppliers. Finally, growers who participate in the
FEC pay transaction costs to do so. These include
costs of obtaining information about the program,
filling out the necessary paperwork, selling to regis-
tered buyers, and picking up subsidies in person.
Transaction costs depend on farm characteristics
because, for example, larger farms are able to spread
these fixed costs over more output, and because non-
Spanish-speaking indigenous growers incur greater
informational and administrative costs.
Growers decide whether to participate in the FEC
by comparing the maximum profit that can be
obtained from participating, P*r(Z), with the maxi-
mum profit that can be obtained by not participating,
P*o(Z). Equivalently, the grower calculates
I� ¼ P�rðZÞ �P�oðZÞ ð2Þ
and will participate as long as I* [ 0. Using this
simple framework, it is easy to see that growers who
obtain relatively low profits absent the FEC program,
P*o(Z), are more likely to participate in the program.
For example, absent the program, growers at low
altitudes obtain inferior prices for their coffee and are
therefore more likely to participate. Also, growers
who pay lower transaction costs to participate in the
program are more likely to do so. Our econometric
model is a reduced form of Eq. 2:
I�j ¼ f Zj
� �ð3Þ
where j indexes individual growers. Although I* is
latent and unobserved, we do observe an indicator
variable, Ij, which takes the value of one if the grower
participates and zero otherwise; that is, we observe,
Ij ¼1 if I�j [ 0
Ij ¼0 if I�j � 0:
Using Ij as our dependent variable, we estimate Eq. 3
as a simple probit.
Appendix 2: Simulation model of a representative
coffee farm
The following equations constitute a simple linear
model of a representative coffee farm in the Coast and
Southern Sierra region of Oaxaca, Mexico, that we
use to generate a back-of-the-envelope estimate of the
percentage of the farm household’s subsistence needs
met by income from coffee production. Uppercase
180 Agroforest Syst (2010) 78:169–183
123

letters represent linear functions of parameters, and
lowercase letters represent parameters.
P ¼ PYf � Cf ð4Þ
Total profits from coffee, P, are equal to total
revenues minus total costs. Total revenues, in turn,
are equal to P, the price per hundredweight (cwt) of
pergamino coffee, times Y, the yield per hectare in
cwt pergamino coffee, times f, the farm size in
hectares. Total costs are equal to C, total variable
costs per hectare, times f. Note that we ignore
transaction costs of participating in the FEC (to
conservatively bias upward our estimate of the
percentage of subsistence covered by coffee income
and because data on these costs are not available).
P ¼ pþ s ð5Þ
P, the price per cwt of pergamino coffee is equal to p,
the market price per cwt plus s, the FEC subsidy per
cwt.
Y ¼ tn ð6Þ
Y, the yield per hectare in cwt pergamino is equal to t,
the number of cwts of pergamino produced by each
coffee plant, times n, the number of coffee plants per
hectare.
C ¼W1þW2þ H þ Rþ d ð7Þ
C, total variable cost per hectare, is equal to W1, the
cost per hectare of the first weeding, plus W2, the
cost per hectare of the second weeding, plus H, the
cost per hectare of harvesting coffee cherries, plus R,
the cost per hectare of processing coffee cherries into
pergamino, plus d, the cost per hectare of transporting
coffee to a processing center.
W1 ¼W2 ¼ cwnL ð8Þ
W1 and W2, the cost per hectare of the first and
second weeding, are equal to cw, the cost per plant of
weeding, times n, the number of plants per hectare,
times L, the percentage of total labor that is hired
(versus provided by farm household members).
L ¼0 8 f 2 0; 5f gL ¼1� 5=fð Þ 8 f 2 5;1f g
ð9Þ
L, the percentage of total labor that is hired, is zero
for farms 5 hectares and smaller and is an increasing
function of farm size for larger farms.
H ¼ YrcnL ð10Þ
H, the cost per hectare of harvesting coffee cherries,
is equal to Y, the yield of pergamino coffee per
hectare in cwt, times r, the number of cherry cans
needed to harvest each cwt of pergamino, times cn,
the labor cost per cherry can harvested, times L, the
percentage of total labor that is hired.
R ¼ mwYL ð11Þ
Finally, R, the cost per hectare of processing coffee
cherries into pergamino, is equal to m, the number
of person-days of labor needed to process one cwt,
times w, the daily wage paid to laborers, times Y,
the per hectare yield, times l, the percentage of
total labor that is hired. Below, we provide the
actual values for each parameter and, for conve-
nience, repeat the definition of each function and
parameter.
C total variable cost per hectare, in pesos
cn labor cost per cherry can harvested (20 pesos)
cw labor cost per plant of weeding (0.25 pesos per
plant)
d cost per hectare of transporting coffee to
processing center, in pesos
f size of farm, in hectares (simulated for
different sizes)
H cost per hectare of harvesting coffee cherries,
in pesos
L percentage of total labor for activity that is
hired
m person-days labor per cwt needed for
processing (1.26 days)
n plants per hectare (2,850 plants)
p market price per hundredweight (cwt) of
pergamino coffee, in pesos (430 pesos)
r cherry cans per cwt (18 cans)
R cost per hectare of processing coffee cherries
into pergamino, in pesos
s FEC subsidy per cwt pergamino coffee (326
pesos)
t cwt of pergamino per plant (0.0015 cwt)
w daily wage paid to processing laborers (60
pesos)
W1 cost per hectare of first weeding, in pesos
W2 cost per hectare of second weeding, in pesos
Y yield per hectare, in cwt pergamino coffee
P total farm profits, in pesos
Agroforest Syst (2010) 78:169–183 181
123

References
Aguilar-Støen M, Moe SR, Montalvo-Espinosa L (2009) On
farm tree management in coffee forest gardens in Oaxaca,
Mexico: a socio-ecological system approach. Ecol Soc
Apoyos y Servicios a la Comercializacion Agropecuaria (AS-
ERCA) (2004) Padron Nacional Cafetalero. www.cmcafe.
org.mx
Asociacion Mexicana del Sistema Producto Cafe (AMECAFE)
(2008) Sistema Producto Cafe. Reglas de Operacion del
Fondo de Estabilizacion del Cafe: Ciclo 2001–2002, Ciclo
2002–2003, Ciclo 2003–2004, Ciclo 2004–2005, Ciclo
2005–2006. http://www.spcafe.org.mx/wb3/wb/spc/spc_
reglas_de_operacion
Asteggiano L (2008) Woody species diversity and vegetation
structure in managed and abandoned shade coffee systems
in Coastal Oaxaca. Masters Thesis, Department of Inter-
national Environment and Development Studies, Norag-
ric, Norwegian University of Life Sciences
Avalos-Sartorio B (2005) Unpublished field survey notes for
Oaxaca. January
Avalos-Sartorio B (2009) Coffee, policy and stability in
Mexico. In: Pinstrup-Andersen P, Cheng F (eds) Case
studies in food policy for developing countries, Volume I,
Policies for health, nutrition, food consumption, and
poverty. Cornell University Press, Ithaca
Avelino J, Barboza B, Araya JC, Fonseca C, Davrieux F,
Guyot B, Cilas C (2005) Effects of slope exposure, alti-
tude and yield on coffee quality in two altitude terroirs of
Costa Rica, Orosi, and Santa Marıa de Dota. J Sci Food
Agricult 85(11):1869–1876
Banco de Mexico (2005) Inflation data. www.banxico.org.mx
Batz M, Albers H, Avalos-Sartorio B, Blackman A (2005)
Shade-grown coffee: simulation and policy analysis for
Coastal Oaxaca, Mexico. Discussion paper 05-61.
Resources for the Future, Washington, DC. http://www.
rff.org/documents/RFF-DP-05-61.pdf
Blackman A, Albers HJ, Avalos-Sartorio B, Crooks L (2005)
Deforestation and shade-coffee in Oaxaca, Mexico: key
research findings. Discussion Paper 05-39. Resources for
the Future, Washington, DC. http://www.rff.org/Docu
ments/RFF-DP-05-39.pdf
Blackman A, Albers HJ, Avalos-Sartorio B, Murphy L (2008a)
Land cover in a managed forest ecosystem: Mexican
shade coffee. Am J Agricult Econ 90(1):216–231
Blackman A, Avalos-Sartorio B, Chow J (2008b) Land cover
change in mixed agroforestry: shade coffee in El Salva-
dor. Discussion Paper 08-25. Resources for the Future,
Washington, DC. http://www.rff.org/RFF/Documents/
EfD-DP-08-25.pdf
Campanha M, Santos R, de Freitas G, Martinez H, Garcia S,
Finger F (2004) Growth and yield of coffee plants in
agroforestry and monoculture systems in Minas Gerais,
Brazil. Agrofor Syst 63:75–82
Castro K, Sanchez G, Rivard B (2003) Monitoring secondary
tropical forests using space borne data: implications for
Central America. Int J Remote Sens 24(9):1853–1894
Chicago Mercantile Exchange (1998–2005) Quotes for Mexi-
can peso futures. www.cme.com
Comision Especial del Cafe (2006) Boletın de la Camara de
Diputados 2691. February 25
Consejo Mexicano del Cafe (CMC) (2001) Reglas de Opera-
cion del Fondo de Estabilizacion Precios del Cafe.
Unpublished document
Consejo Mexicano del Cafe (CMC) (2004a) Fondo de Estab-
ilizacion de Precios del Cafe. Sistema de Administracion.
Unpublished document
Consejo Mexicano del Cafe (CMC) (2004b) Fondo de Estab-
ilizacion de Precios del Cafe. Beneficiarios 2002–2003.
www.cmcafe.org.mx
Consejo Nacional de Poblacion (CONAPO) (1998) Indices de
Marginacion en Mexico, 1995. CONAPO, Mexico City
Daily G, Ceballos G, Pacheco J, Suzan G, Sanchez-Azofeifa A
(2003) Countryside biogeography of neotropical mam-
mals: conservation opportunities in agricultural land-
scapes of Costa Rica. Conserv Biol 117(6):1814–1826
Davidson S (2005) Shade coffee agro-ecosystems in Mexico: a
synopsis of the environmental services and socio-eco-
nomic considerations. J Sustain For 21(1):81–95
Eakin H, Tucker C, Castellanos E (2006) Responding to the
coffee crisis: a pilot study of farmers’ adaptations in
Mexico, Guatemala, and Honduras. Geogr J 172:156–171
Gajaseni J, Matta-Machado R, Jordan C (1996) Diversified
agroforestry systems: buffers for biodiversity reserves,
and landbridges for fragmented habitats in the tropics. In:
Szaro R, Johnston D (eds) Biodiversity in managed
landscapes. Oxford University Press, New York, pp 506–
513
Heidkamp P, Hanink D, Cromley R (2008) A land use model of
the effects of eco-labeling in coffee markets. Ann Reg Sci
42:725–746
International Coffee Organization (ICO) (2005) Historical
coffee data. http://www.ico.org/historical.asp
Moguel P, Toledo V (1999) Biodiversity conservation in tradi-
tional coffee systems of Mexico. Conserv Biol 13(1):1–21
Muschler R (2004) Shade management and its effects on coffee
growth and quality. In: Wintegens J (ed) Coffee: growing,
processing, sustainable production. a guidebook for
growers, processors, traders and researchers. Wiley-VCH,
Weinheim, pp 391–415
Nestel D (1995) Coffee in Mexico: international market,
agricultural landscape and ecology. Ecol Econ 15:165–
178
New York Board of Trade (1998–2005) Quotes for contract
‘‘C’’ futures. http://www.nybot.com
North American Commission for Environmental Cooperation
(NACEC) (2003) Mexican law governing forests and
forest management. www.cec.org/pubs_info_resources/
law_treat_agree/summary_enviro_law
Patrinos HA (2000) The cost of discrimination in Latin
America. Stud Comp Intern Dev 35(2):3–17
Perez M (2006) Fondo Cafetalero Acumula 246 millones en
Dos Anos. La Jornada November 26
Perfecto I, Rice R, Greenberg R, Van Der Voort M (1996)
Shade coffee: a disappearing refuge for biodiversity.
Bioscience 46(8):598–608
Rapploe J, King D, Vega Rivera J (2002) Coffee and conser-
vation. Conserv Biol 17(1):334–336
182 Agroforest Syst (2010) 78:169–183
123

Saunders D, Hobbs R (1991) The role of corridors in conser-
vation: what do we know and where do we go? In:
Saunders D, Hobbs R (eds) The role of corridors. Beaty
and Sons, Surrey
SourceMex (2004) Agriculture organizations propose new
programs to address crisis among coffee growers. October
27. http://retanet.unm.edu/LADB-articles/25803.html
Staver C, Guharay F, Monterroso D, Muschler R (2001)
Designing pest suppressive multistrata perennial crop
systems: shade grown coffee in Central America. Agrofor
Syst 53:151–170
Vandermeer J, Perfecto I (1997) The agroecosystem: the need
for the conservationist’s lens. Conserv Biol 11(3):
591–592
Agroforest Syst (2010) 78:169–183 183
123