agriculture - and food economy in poland - Gov.pl
118
-
Upload
khangminh22 -
Category
Documents
-
view
1 -
download
0
Transcript of agriculture - and food economy in poland - Gov.pl


MINISTRY OF AGRICULTURE AND RURAL DEVELOPMENT
WARSAW 2011
AND FOOD ECONOMY IN POLAND
AGRICULTURE

MINISTRY OF AGRICULTURE AND RURAL DEVELOPMENT
AGRICULTURE AND FOOD ECONOMY IN POLAND
Collective work edited by: Teresa Jabłońska - Urbaniak
WARSAW, 2011

TABLE OF CONTENTS
Foreword by the Minister of Agriculture and Rural Development 5
GENERAL INFORMATION ABOUT POLAND 7
AGRICULTURE 12Land resources and its utilisation structure 12Agricultural production and economy in 2010 16Agriculture in particular regions 17Supplying the agricultural sector with means of production 19Value of agricultural production and price relations 22Agricultural production and selected foodstuffs markets 23
27272932323437404445
Consumption of foodstuffs 47
PROMOTIONAL ACTIVITIES AND QUALITY SUPPORT POLICY 50Discover Great Food programme 51Regional and traditional products 53Integrated agricultural production 55Protection of plant genetic resources in agriculture 57
BIOFUELS 60
RURAL AREAS 65Rural population 65Labour force participation and human capital in rural areas 67Rural infrastructure 68Development of entrepreneurship and agri-tourism in rural areas 70
SUPPORT FOR AGRICULTURE AND FISHERIES 75Direct payments 75Support for rural areas 76

TABLE OF CONTENTS
7778
Fisheries 81
DISCUSSING THE SHAPE OF CAP BEYOND 2013 87
50 YEARS OF COMMON AGRICULTURAL POLICY 90
AGRICULTURAL INSTITUTIONS 9494
105108110111112
ADDRESSES OF INSTITUTIONS RELATED TO AGRICULTURE 116

AGRICULTURE AND FOOD ECONOMY IN POLAND | 5
Dear readers!
-
-
-
-
-
-
Marek Sawicki

| AGRICULTURE AND FOOD ECONOMY IN POLAND

AGRICULTURE AND FOOD ECONOMY IN POLAND | 7
General information about Poland
2
st -nd
-
-
---
-
-
-
-
Fig. 1.
–2005–2006–2007–2008–2009
10
20
30
°C
I II III IV V VI VII VIII IX X XI XII średniaroczna
Fig. 1. Average monthly air temperatures in Poland(in °C); Source: Central Statistical Office (CSO)– Agriculture, Warsaw 2009
–2005 (585 mm) –2006 (579 mm) –2007 (717 mm)
–2008 (609 mm) –2009 (692 mm)
100
50
150
mm
I II III IV V VI VII VIII IX X XI XII
Fig. 2. Average monthly total precipitation in the years 2005-2009 (in millimetres). Source: Central Statistical Office (CSO) – Agriculture, Warsaw 2009
GENERAL INFORMATION ABOUT POLAND

| AGRICULTURE AND FOOD ECONOMY IN POLAND8
GENERAL INFORMATION ABOUT POLAND
-
Fig. 2. --
--
-
-
-
-3 3
3
3
-
inter alia, vil-sołectwo -
2
-2 -
2 2
Fig. 3.
Fig. 3. Territorial division units in Poland.
2478 – Number of municipalities16 – Number of voivodships

AGRICULTURE AND FOOD ECONOMY IN POLAND | 9
GENERAL INFORMATION ABOUT POLAND
-
-
Selected information on Poland’s economic situation in 2010
--
-
-
-
-

| AGRICULTURE AND FOOD ECONOMY IN POLAND10
GENERAL INFORMATION ABOUT POLAND
-
--
-
--
-
-
-
--
-

AGRICULTURE AND FOOD ECONOMY IN POLAND | 11
GENERAL INFORMATION ABOUT POLAND
-

| AGRICULTURE AND FOOD ECONOMY IN POLAND12
AGRICULTURE
Agriculture-
-
-Table 1.
-
--
Land resourcesand its use structure
-
Productionof selectedagricultural products
Share Rank
in the world in the EU in the
world in the EU
15 4rye 3 1
7 133
13 414 510 4
Stock:cattle 7
10 3
Table 1. Share and rank of Polish agriculture in the world and in the EU (27 states); Source: International Review, Central Statistical Office 2010. Data for 2009.

AGRICULTURE AND FOOD ECONOMY IN POLAND | 13
AGRICULTURE
-
Fig. 4.-
--
-
--
29,8%
20,5%
50,3% 49,7%
1,2%
34,9%
2,0%
3,1%
Arable land
AGRICULTURAL LAND
Orchards
Meadows
Pastures
Other agricultural land
Forest and forest land
Other land
8,4%
Fig. 4. Structure of land utilisation in 2010. (% of total surface area); Source: CSO. Agriculture in 2010, Warsaw 2011.

| AGRICULTURE AND FOOD ECONOMY IN POLAND14
AGRICULTURE
-
--
-
-
-
-

AGRICULTURE AND FOOD ECONOMY IN POLAND | 15
AGRICULTURE
-
Fig. 5 and 6.
-
Table 2 and 3.
-
-
-
-
--
Fig. 7.
up to
1 ha
1-5
ha
5-10
ha
10-1
5 ha
15 h
aan
d m
ore
2002 2010
10
0
20
30
40of which with the area of – % of arable land
Fig. 5. Structure of individual agricultural holdings by ar-able land area groups in 2002 and 2010 (%); Source: CSO. Agriculture in 2009 and 2010, Warsaw.
Fig. 6. Structure of individual holdings with over 1 ha of arable land in 2002 and 2010; Source: CSO. Agriculture in 2009 and 2010, Warsaw.
2002
2010
10
0
20
30
40
50
Total area (%) of which in holdings:
1-5
ha
5-10
ha
10-1
5 ha
15 h
aan
d m
ore

| AGRICULTURE AND FOOD ECONOMY IN POLAND
AGRICULTURE
Situation of agriculturein terms of productionand economy in 2010
--
-
-
--
-
-
-
-
-
Table 4.
inter alia
-
Price per 1 ha in dt
Year in PLN rye pigs forslaughter
Arable land20002005 8 2442009 17 042
Fertile 20002005 11 001 2009 20 8092000 4 92020052009 17 725
Poor 2000 2 7252005 5 8432009
Meadows2000 4 88320052009 13 724
Meadows2000 2 7532005 4 0032009 10 319
Table 2. Average prices of arable land and meadows in private trade; Source: CSO. Agriculture in 2009, Warsaw 2010.
Voivodeship TotalFertile
(classes:I, II, IIIa)
Mediumfertile
(classes:IIIb, IV)
Poor (classes:
V, VI)
Polska Dolnośląskie
Podlaskie Śląskie
Table 3. Sale prices of arable land in Q4 of 2010 in selected voivodeships (PLN/ha); Source: ARMA.

AGRICULTURE AND FOOD ECONOMY IN POLAND | 17
AGRICULTURE
1
2002 2003 2004 2005 2006 2007 2008 2009
5
10
15
tys.zł
2010
Fig. 7. Sale prices of agricultural property belonging to APA in PLN per ha between 1992 and 2009; Source: APA.
-
-
-
Table 5.
-
AGRICULTUREIN PARTICULAR REGIONS
--
Specification 2009 2010 2009 = 100%7 302 7 302
Arable land area
79 995
Table 5. Income from a family run holding in 2009 and 2010; Source: Institute of Agricultural and Food Eco-nomics – own calculations based on FADN.
Specification 2004–2006 2007–2009 2010 2010–––––––––2007–200975 909 34 782
4 9902 108 2 259
37 20329 499
20 045 23 5841 352 1 4825 118 9 750
23 811 33 903
19 734
Table 4. Economic results of Polish agriculture in 2010 (current prices, PLN million); Source: Institute of Agricultural and Food Economics, 2011, Farmers’ income in 2010.

| AGRICULTURE AND FOOD ECONOMY IN POLAND18
AGRICULTURE
18
-
--
-Table 6.
-
-
-
-Table 7.
-
---
-
Specification
Yiel
ds o
f cer
eals
from
1 h
a in
dt
Yiel
ds o
f pot
atoe
sfro
m 1
ha
in d
t Consumption of fertilizers expressed in pure component
Mineralor chemical
fertilizers in thousand
tonnes
Calcium fertilizers
in thousand tonnes
Poland 191Dolnośląskie 204
202
189191210181
215178
Podlaskie228
Śląskie 209173
175
- 227
Table 6. Yields of cereals and potatoes compared with the in-tensity of mineral and organic fertilisation; Source: Agriculture in 2010, Central Statistical Office.
Specification
Tota
l
Cere
als
Legu
min
ous
plan
ts
Pota
toes
Fodd
er
crop
s
PolandDolnośląskie
Podlaskie
Śląskie
Table 7. Area of sown crops in 2010 divided into voivodeships – percentages

AGRICULTURE AND FOOD ECONOMY IN POLAND | 19
AGRICULTURE
19
-
--
-
-
Fig. 8 and 9.
Supplying the agricultural sector with means of production
-
Zach
odni
opom
orsk
ie
Wie
lkop
olsk
ie
War
miń
sko-
maz
ursk
ie
Świę
tokr
zysk
ie
Śląs
kie
Pom
orsk
ie
Podl
aski
e
Podk
arpa
ckie
Opo
lski
e
Maz
owie
ckie
Mał
opol
skie
Łódz
kie
Lubu
skie
Lube
lski
e
Kuja
wsk
o-po
mor
skie
Dol
nośl
ąski
e
Pola
nd
0
20
40
60
80
100
2008 2009 2010
Zach
odni
opom
orsk
ie
Wie
lkop
olsk
ie
War
miń
sko-
maz
ursk
ie
Świę
tokr
zysk
ie
Śląs
kie
Pom
orsk
ie
Podl
aski
e
Podk
arpa
ckie
Opo
lski
e
Maz
owie
ckie
Mał
opol
skie
Łódz
kie
Lubu
skie
Lube
lski
e
Kuja
wsk
o-po
mor
skie
Dol
nośl
ąski
e
Pola
nd
0
50
100
150
200
250
300
2008 2009 2010
Fig. 8. – Cattle
Fig. 9. – Pigs
Stock of cattle, cows and pigs per 100 ha of arable land in particular voivodeships in 2009 1) (number of animals); Source: Agriculture in 2009, Central Statistical Office; and Results of the 2010 General Agricultural Census.
1) Stock of cattle and cows based on data from June; stock of pigs based on data from March.

| AGRICULTURE AND FOOD ECONOMY IN POLAND20
AGRICULTURE
-
-
-
Table 8.
-Table 9.
plant protection products-
-
2000
/01
2005
/06
2007
/08
2008
/09
2009
/10
2O5
2
Table 8. Use of mineral and calcium fertilisers (in pure NPK per 1 ha of agricultural land); Source: Market of Means of Produc-tion, Institute of Agricultural and Food Economics, 2011.
2005/06 2006/07 2007/08 2008/09UE -27UE-15UE-12POLAND
Table 9. Use of mineral fertilizers in the EU (million tonnes of NPK); Source: Market of Means of Production, Institute of Agricultural and Food Economics, 2011.

AGRICULTURE AND FOOD ECONOMY IN POLAND | 21
AGRICULTURE
--
--
farming machinery in Poland in 2010 --
--
-
--
--
-
Table 10.
Specification 2005 2006 2008 2009
Feed
Maintenance
Veterinary services
Table 10. Changes in retail prices of means of agricultural production (previous year = 100)
| AGRICULTURE AND FOOD ECONOMY IN POLAND22
AGRICULTURE
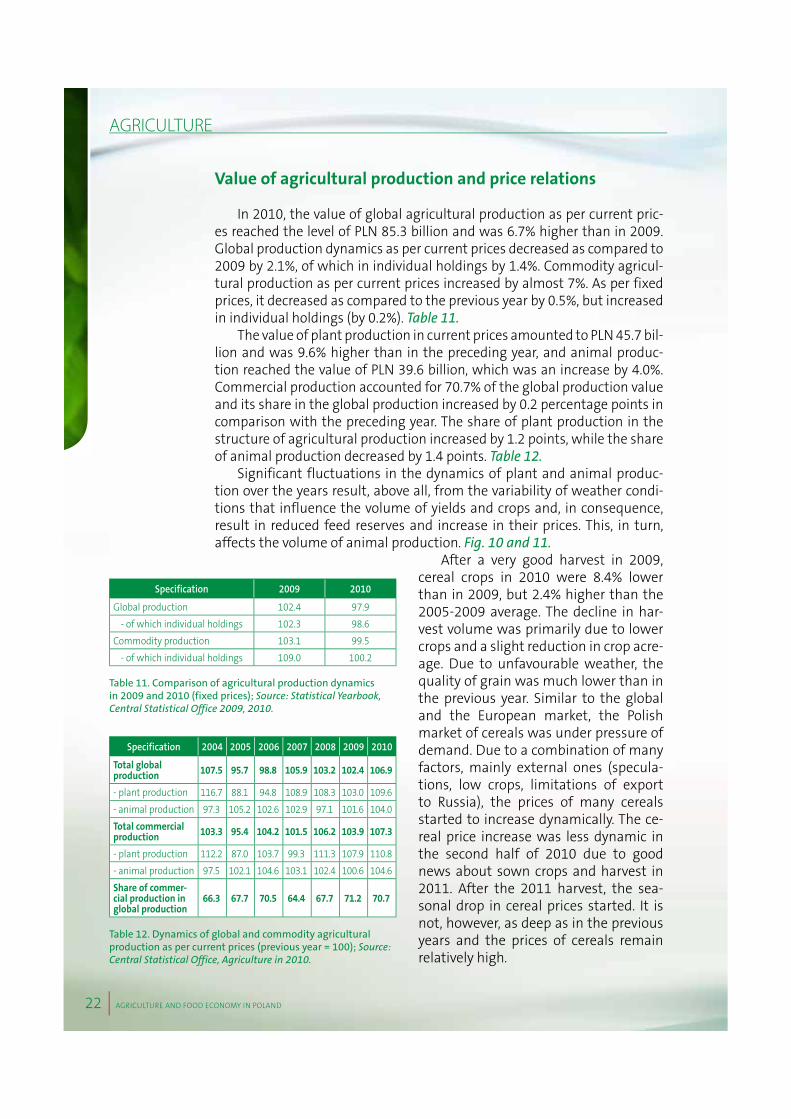
Value of agricultural production and price relations
-
-
Table 11.--
Table 12.--
Fig. 10 and 11.
-
-
-
-
-
Specification 2009 2010
Table 11. Comparison of agricultural production dynamics in 2009 and 2010 (fixed prices); Source: Statistical Yearbook, Central Statistical Office 2009, 2010.
Specification 2004 2005 2006 2007 2008 2009 2010
Total globalproduction 107.5 95.7 98.8 105.9 103.2 102.4 106.9
Total commercial production 103.3 95.4 104.2 101.5 106.2 103.9 107.3
Share of commer-cial production in global production
66.3 67.7 70.5 64.4 67.7 71.2 70.7
Table 12. Dynamics of global and commodity agricultural production as per current prices (previous year = 100); Source: Central Statistical Office, Agriculture in 2010.

AGRICULTURE AND FOOD ECONOMY IN POLAND | 23
AGRICULTURE
--
-Table 13.
-
Table 14.
AGRICULTURAL PRODUCTION AND SELECTED FOODSTUFFS MARKETS
Plant production
-
-
-
-
Fig. 10. Structure of global agricultural production in 2000, 2007 and 2009 (percentages); Source: Agriculture in 2010, Central Statistical Office, Warsaw 2011.
Cere
als
Pota
toes
Indu
stria
lcr
ops
Vege
tabl
es
Frui
ts
Oth
er p
lant
prod
uctio
n
Oth
er a
nim
alpr
oduc
tion
Slau
ghte
ran
imal
s
Cow
milk
Chic
ken
eggs
2000
10
0
20
30
% 2007 2009
Fig. 11. Structure of commercial agricultural production in 2000, 2007 and 2009 (% – current prices); Source: Agriculture in 2010, Central Statistical Office.
5
0
20
30
40% 2000 2007 2009
Cere
als
Pota
toes
Indu
stria
lcr
ops
Vege
tabl
es
Frui
ts
Oth
er p
lant
prod
ucts
Oth
er a
nim
alpr
oduc
ts
Slau
ghte
ran
imal
s
Cow
milk
Chic
ken
eggs
Specification 2004 2005 2009 2010 2010/2005TOTAL
Plant
Table 13. Price indicators of commodity agricultural pro-duction (previous year = 100); Source: Agriculture in 2010, Central Statistical Office.

| AGRICULTURE AND FOOD ECONOMY IN POLAND24
AGRICULTURE
Fig. 12. -
considerably:-
--
vealed a considerable decrease in area sown
-
-
-
Table 15.
Specification 2000 2004 2005 2007 2008 2009 2010
XX
Table 14. Price relations of agricultural products to the prices of goods and services purchased by agricultural holdings; Source: Agriculture in 2010, Central Statistical Office.
Tota
l cer
eals
Edib
lele
gum
inou
spl
ants
Pota
toes
Suga
r bee
t
Rape
and
turn
ip ra
pe
Fodd
er c
rops
Oth
er
Of w
hich
outd
oor
vege
tabl
es
2000
5
10
15
70
75
%
2008
2009
2010
Fig. 12. Crop structure in 2000, 2008, 2009 and 2010 (%); Source: Agriculture in 2010, Central Statistical Office.

AGRICULTURE AND FOOD ECONOMY IN POLAND | 25
AGRICULTURE
Cereal market and processing
-
-
-
--
-
-
-
-
-
-
-
CROP
TYPE
1996–2000
2001–2005 2008 2009 2009
Annual average1996
–2000= 100
2001– 2005 = 100
2008=100
TOTAL CEREALSA
CTOTAL WHEATA
CRYEA
CTOTAL BARLEYA
COATSA
CTOTAL TRITICALE
A
CPOTATOESA
CRAPE AND TURNIP RAPEA
CSUGAR BEETA
377 411 543C
Table 15. Area of crops, harvest and yields of basic agricultural cropsA – Area in thousand haB – Yield from 1 ha in dtC – Yield in thousand tonnes;Source: Central Statistical Office, Agriculture in 2010, Concise Statistical Yearbook 2009.

| AGRICULTURE AND FOOD ECONOMY IN POLAND
-
-
Table 16.
AGRICULTURE

AGRICULTURE AND FOOD ECONOMY IN POLAND | 27
Cereals processing
-
-
-
Sugar market
-
-
-
-
-
---
2007
/08
2008
/09
2009
/10
2010
/11
2011
/12
Proj
ectio
n
Initial stock
Yield
Domestic consumption 5.3 5.2 5.2 5.2 5.1
Final stock
Table 16. Total cereals balance in the years 2004/2005 – 2010/2011 (in thousand tonnes); Source: Institute of Agricul-tural and Food Economics, Cereals Market 2011.
AGRICULTURE

| AGRICULTURE AND FOOD ECONOMY IN POLAND28
AGRICULTURE
-
--
-
-

AGRICULTURE AND FOOD ECONOMY IN POLAND | 29
AGRICULTURE
Fruit and vegetable market
-
-
-
-
-
-
-
Table 17.
-
Specification
Aver
age
for
2001
-200
8
2009
2010
1
2011
2
Proj
ectio
n 2010
2001–2008=100
2009=100
Total harvest from trees, 2 635.7 3 103.0 2 212.0 2 645.0 83.9 71.3
Pears
Harvest of fruitfrom fruit-bearingtrees and planta-tions of berries,
480.5 543.2 526.0 415.0 109.5 96.8
Strawberries
Gooseberries
Table 17. Fruit production in Poland (thousand tonnes); Source: Market analyses by the Institute of Agricultural and Food Economics.
Specification
Aver
age
for
2001
-200
8
2009
2010
1
2011
2
Proj
ectio
n 2010
2001–2008=100
2009=100
Soil vegetablecrops, 4 636.1 4 809.7 4 250.0 4 800.0 91.7 88.4
OnionsCarrots
Yield of vegetablesgrown under glass, 670.0 790.9 760.0 715.0 113.4 96.1
Table 18. Vegetable production in Poland (thousand tonnes); Source: Market analyses by the Institute of Agricultural and Food Economics.1) Result estimation by the Central Statistical Office as of 17 December 2010.2) Projection by the Institute of Agricultural and Food Economics.

| AGRICULTURE AND FOOD ECONOMY IN POLAND30
AGRICULTURE
-
-
-
Table 18.

AGRICULTURE AND FOOD ECONOMY IN POLAND | 31
AGRICULTURE
-
-
Organisation of the Polish fruit and vegetable market
-
-
-
-
--
-

| AGRICULTURE AND FOOD ECONOMY IN POLAND32
AGRICULTURE
EU support on certain plant product markets
Tobacco market
-
-
-
Hop market
In 2010, also de minimis
Seed production market
-

AGRICULTURE AND FOOD ECONOMY IN POLAND | 33
AGRICULTURE
-
--
-
-
-
-
-
-
-

| AGRICULTURE AND FOOD ECONOMY IN POLAND34
AGRICULTURE
ANIMAL PRODUCTION
Meat market
-
--
-
-
Table 19.
-
Pig stock and pork production
-

AGRICULTURE AND FOOD ECONOMY IN POLAND | 35
AGRICULTURE
-
-
--
Table 20.
-
Table 21.
Production Exports* Imports* Trade balancePork 585 -139
390 340 22 3181 374 444 82
TOTAL 1 230 541
Table 19. Production and international trade on meat markets in 2010 (thousand tonnes); * Exports and imports in the meat equivalent. Source: Meat Market. Status and Prospects, May 2011, Institute of Agricultural and Food Economics.
Years H1 Populationover 20 kg
Livestock produc-tion in thousand
tonnes
Changes in production (%%) as compared to
the previous year2008 x 2 483 -10.5
12 081 1 33710 717
2009 x 2 202 -11.39 948 1 1159 824 1 087
2010 x 2 388 8.49 952 1 185
10 318 1 2032011 x 2 391 0
10 4919 559 1 125
Table 20. Pig population and production; Source: Institute of Agricultural and Food Economics – National Research Institute, Meat Market 2011.
Yearsand
months EU-2
7
Pola
nd
Germ
any
Denm
ark Prices in Poland as a %
of the prices in:EU-27 Germany Denmark
2007
- Dec2008
- Dec2009
- Dec2010
- Dec2011 - Jul 157.03 158.44 160.83 141.49 100.9 98.5 112.0
Table 21. Market prices of pigs in the EU (EUR/100 kg of carcass weight) and prices in Poland expressed as a% of those prices (July and December of 2007-2010 and projection for 2011); Source: Institute of Agricultural and Food Economics, Meat Market 2010.

| AGRICULTURE AND FOOD ECONOMY IN POLAND
AGRICULTURE
Cattle populationand beef production
--
-
-
-
-
-
-
-
-
-
-Table 22.
Years H1Population
over 1 year old
Livestock production in thousand
tonnes
Changes (%%) as compared
to the previous year
2008 x 2 483 -10.51 337
2009 x 2 202 -11.34 179 1 1154 228 1 087
2010 x 2 388 8.44 171 1 185
1 2032011projection x 2 391 0
4 1734 288 1 125
Table 22. Cattle population and livestock production in Poland; Source: Institute of Agricultural and Food Economics, Meat Market 2011.
Specification 2007 2008 2009 2010 2011 pro-jection
Commercial slaugh-ter, 2 221.8 2 000.4 1 859.5 2 023.0 2 020.0
cattle and calvesMeat industry output 1 451.5 1 214.5 1 101.0 1 148.0 1 136.0
and calvesProduction of meat products 1 134.9 1 116.0 1 026.2 1 168.0 1 200.0
Output of large and medium-sized companies,
Table 23. Processing of meat from slaughter animals (in thousand tonnes); Source: Institute of Agricultural and Food Economics, Meat Market 2011.
Specification 2009 2010 2009=10028 578 27 523
505 1 0295 804
8341 521 1 451
Table 24. Financial condition of the meat industry (in PLN millions); Source: Institute of Agricultural and Food Economics, Meat Market 2011.

AGRICULTURE AND FOOD ECONOMY IN POLAND | 37
AGRICULTURE
--
-
Meat processing
Table 23.
Table 24.
Poultry and egg market
-

| AGRICULTURE AND FOOD ECONOMY IN POLAND38
AGRICULTURE
Table 25.
-
Processing
--
-
-
Period Production Imports Supply Exports Domesticconsumption
2008 1 233 295 9382009 1 248 1 317 3412010 1 374 82 444 1 0122011 1 470 85 1 555 500 1 055
Table 25. Poultry meat balance (in thousand tonnes); Source: Institute of Agricultural and Food Economics – National Re-search Institute, Poultry and Egg Market 2010.
Years Poultry meat
Curedmeat
Tinned meat
Cured meat products
2008 1 41320092010 1 5502011
Table 26. Industrial production of poultry meat and selected meat products (in thousand tonnes); Source: Institute of Agri-cultural and Food Economics, Poultry Market 2011.

AGRICULTURE AND FOOD ECONOMY IN POLAND | 39
AGRICULTURE
Table 26.
Egg market
-
-
-

| AGRICULTURE AND FOOD ECONOMY IN POLAND40
AGRICULTURE
Table 27.
-
-
Milk market
-
-
Specification 2008 2009 2010 2011Total production 590 615 623 575
534 555 559 52020 29 28 25
133 150 171421 434 385127 129
Table 27. Egg balance (in thousands); Source: Institute of Agri-cultural and Food Economics, Poultry and Egg Market 2011.

AGRICULTURE AND FOOD ECONOMY IN POLAND | 41
AGRICULTURE
-
-
-
-

| AGRICULTURE AND FOOD ECONOMY IN POLAND42
AGRICULTURE
--
-
-
-
“Aid for consumption of milk and milk products in educational estab-lishments”

AGRICULTURE AND FOOD ECONOMY IN POLAND | 43
AGRICULTURE
-
-
-
Processing
-
-
--
-
-
--
-
Table 28.

| AGRICULTURE AND FOOD ECONOMY IN POLAND44
AGRICULTURE
Honey market
-
-
-
-
national apiculture support programmes -
11.7 million
13.3 million-
15.1 million
-
In the years 2010/11 – 2012/13 Conditions of applying for the refund of the costs incurred during the implementation of the mecha-nism: Support for the market of beekeeping products -
Specification 2008 2009 2010224 214 205
35 818 35 574 34 870
- net
Table 28. Economic and financial results in the milk process-ing sector; Source: Institute of Agricultural and Food Economics, Milk Market.

AGRICULTURE AND FOOD ECONOMY IN POLAND | 45
AGRICULTURE
Fish market
-
-
-
-
table 29 -
Specification 2006 2007 2008 2009 2010
-
Table 29. Fish and seafood balance in Poland (by live weight in thousands of tonnes); Source: Fish Market, Institute of Agricul-tural and Food Economics.

| AGRICULTURE AND FOOD ECONOMY IN POLAND
AGRICULTURE
-
Table 30.
-
-
-
Processing

AGRICULTURE AND FOOD ECONOMY IN POLAND | 47
AGRICULTURE
-
Table 31.-
-
FOOD CONSUMPTION
-
-
--
-
Species 2009 2010 2010/200958 843
22 528 24 747Cod 11 178 12 191
11 228414 420
Table 30. Baltic catches of major fish species (in tonnes); Source: Fish Market, Institute of Agricultural and Food Economics.
Specification 2009 2010 2010/200915 138 15 3048 357
24 71984 819
58 034
Marinades 58 195
Table 31. Production of the fish processing sector by selected product groups (in tonnes); Source: Fish Market, Institute of Agricultural and Food Economics.

| AGRICULTURE AND FOOD ECONOMY IN POLAND48
AGRICULTURE
-
--
-
-
-
-

AGRICULTURE AND FOOD ECONOMY IN POLAND | 49
AGRICULTURE
-
-
-
-
-
-
-
-
-
--
Table 32.
Specification 2005 2006 2007 2008 2009 2010
119 117 114 112 111 110
Potatoes 121 121 118 112110 109 115 115 115 108
xx
Milk 173 178 182 187 191215 214 209 205 207
Table 32. Consumption of selected foodstuffs per capita (kg/litres/products); Source: Institute of Agricultural and Food Economics - National Research Institute, 2011.

| AGRICULTURE AND FOOD ECONOMY IN POLAND50
PROMOTION ACTIVITIES AND QUALITY SUPPORT POLICY
Promotion activities and quality support policy – the Discover Great Food Programme
-
-
-
Detailed information on ex-penditures are provided in the chapter on the Agricultural Market Agency
-
--
-

AGRICULTURE AND FOOD ECONOMY IN POLAND | 51
PROMOTION ACTIVITIES AND QUALITY SUPPORT POLICY
-
-
-
DISCOVER GREAT FOOD PROGRAMME
-
--
---
Procedure of the Discover Great Food Programme
-
-

| AGRICULTURE AND FOOD ECONOMY IN POLAND52
PROMOTION ACTIVITIES AND QUALITY SUPPORT POLICY
-
--
--
-
--
-

AGRICULTURE AND FOOD ECONOMY IN POLAND | 53
PROMOTION ACTIVITIES AND QUALITY SUPPORT POLICY
REGIONAL AND TRADITIONAL PRODUCTS
-
-
-
-

| AGRICULTURE AND FOOD ECONOMY IN POLAND54
PROMOTION ACTIVITIES AND QUALITY SUPPORT POLICY
-
-
-
-
oscypek, bryndza podhalańska and redykołka truskawka kaszubska and wiśnia nadwiślańska
rogal świętomarciński, pierekaczewnik and andruty ka-liskie półtorak, dwójniak, trójniakand czwórniak
-
-
-
-
Possibilities of promotion of traditionaland regional products
-
-
-

AGRICULTURE AND FOOD ECONOMY IN POLAND | 55
PROMOTION ACTIVITIES AND QUALITY SUPPORT POLICYCHRONION
ANAZWAPOCH
ODZENIA
Protected Designation of Origin --
--
Protected Geographical Indication -
-
Traditional Speciality Guaranteed -
-
-
-
-
-
INTEGRATED AGRICULTURAL PRODUCTION
-

| AGRICULTURE AND FOOD ECONOMY IN POLAND
PROMOTION ACTIVITIES AND QUALITY SUPPORT POLICY
-
-
--
Integrated Production Notebook
--
-
-Participation of farmers in food quality schemes

AGRICULTURE AND FOOD ECONOMY IN POLAND | 57
PROMOTION ACTIVITIES AND QUALITY SUPPORT POLICY
-
-
Information and promotion activities
-
-
PROTECTION OF PLANT GENETIC RESOURCES IN POLAND
-
-
--
| AGRICULTURE AND FOOD ECONOMY IN POLAND58
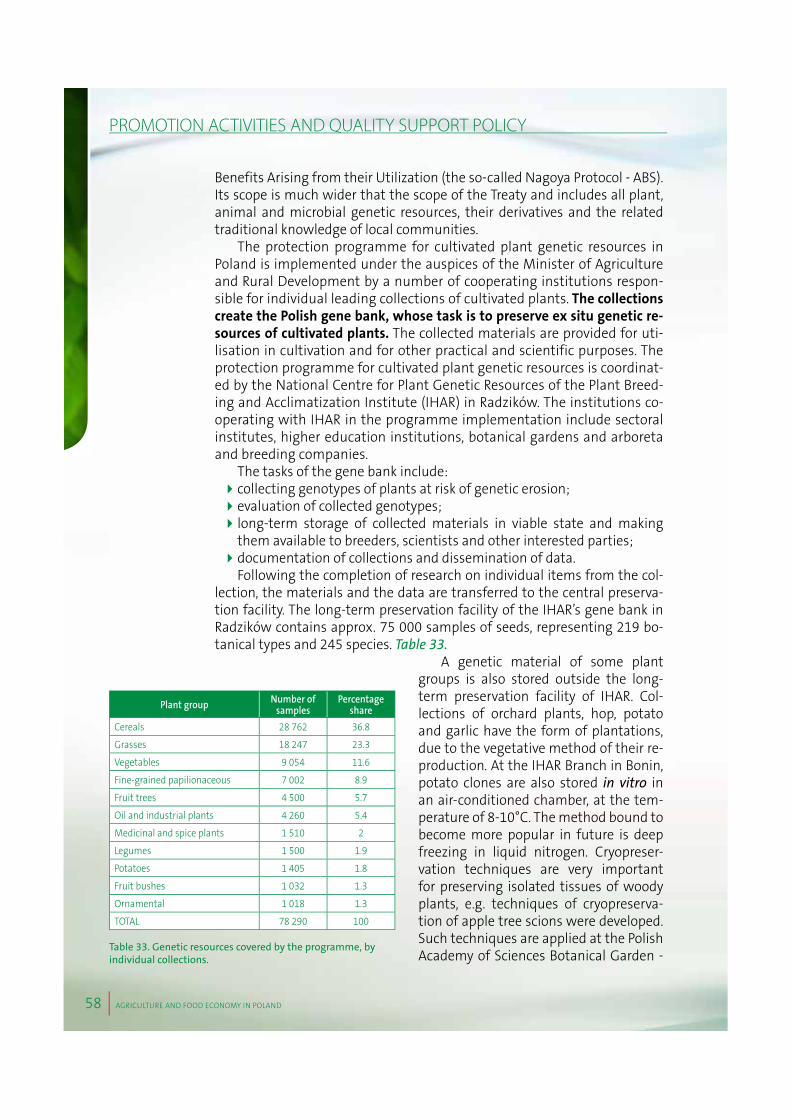
PROMOTION ACTIVITIES AND QUALITY SUPPORT POLICY
- The collections
create the Polish gene bank, whose task is to preserve ex situ genetic re-sources of cultivated plants. -
---
--
-Table 33.
-
-
in vitro in -
-
-
Plant group Number of samples
Percentageshare
Cereals
Grasses 18 247
9 054
7 002
4 500
1 510 2
1 500
Potatoes 1 405
1 032
1 018
TOTAL 78 290 100
Table 33. Genetic resources covered by the programme, by individual collections.

AGRICULTURE AND FOOD ECONOMY IN POLAND | 59
PROMOTION ACTIVITIES AND QUALITY SUPPORT POLICY
-
-
-

| AGRICULTURE AND FOOD ECONOMY IN POLAND
BIOFUELS
Biofuels
-
--
-
-
on biocomponents and liquid biofuelsMultiannual programme for promotion of biofu-
els or other renewable fuels for 2008-1014 -Programme
--
Multiannualprogramme for promotion of biofuels or other renewable fuels for 2008-1014
-
-Table 34.
Demand for 2008 2010 2020
3
Cereals
Esters
3
Table 34. Projected demand for agricultural raw materials for production of biocomponents; Source: Calculations and data of the Ministry of Agriculture and Rural Development.

AGRICULTURE AND FOOD ECONOMY IN POLAND |
BIOFUELS
-
-
Agricultural biogas
-
-
-
-
-
-
-
-

| AGRICULTURE AND FOOD ECONOMY IN POLAND
BIOFUELS
3
3
-
-3
-3
-
-
3
-Assumptions of the programme
for development of agricultural biogas plants in PolandDirections of development of agricultural biogas
plants in Poland for 2010-2020 -
Directions -
-
Directions-
-
-

AGRICULTURE AND FOOD ECONOMY IN POLAND |
BIOFUELS
-
Table 35.
-
3


AGRICULTURE AND FOOD ECONOMY IN POLAND |
RURAL AREAS
Rural areas
-
-
-
-
-
Rural population
2
-

| AGRICULTURE AND FOOD ECONOMY IN POLAND
RURAL AREAS
-
-
Rural women
---
-
-
-
-
--
-

AGRICULTURE AND FOOD ECONOMY IN POLAND |
RURAL AREAS
-
Labour force participation and human capital in rural areas
---
Table 37.-
-
-
-Table 38.
-
-
Specification 1995 2000 2005 2006 2008Q4
2009Q4
Total labour force participation ratio 58.4 56.4 54.9 54.0 54.7 55.1
Urban areas
Total employ-ment rate 50.7 47.4 45.2 46.5 51.0 51.0
Urban areas
Table 37. Labour force participation of the population aged 15 years and more (%); Source: Statistical Bulletin 2010, Central Statistical Office.
Specification 2002 2005 2006 2008Q4
2009Q4
Table 38. Unemployment rate according to BAEL (% of active population); Source: Statistical Bulletin 2010, Central Statistical Office.

| AGRICULTURE AND FOOD ECONOMY IN POLAND
RURAL AREAS
-
-Table 39.
Rural infrastructure
-
-
SpecificationAgricultural
qualifications in %
Direct aid intensity rate
Human capital aid intensity
rateEU-15EU-27
Table 39. Human capital in agriculture and aid intensity rate.* The index covers managers of agricultural holdings with complete agricultural training.Source: Uwarunkowania społeczne w rozwoju obszarów wiejskich po akcesji do UE – Synteza badań 2005-2009 [Social determinants of rural development after accession to the EU. Research synthesis 2005-2009], Institute of Agricultural and Food Economics - National Research Institute.

AGRICULTURE AND FOOD ECONOMY IN POLAND |
RURAL AREAS
-
--
-
-
table 40
--
--
Voivodeship
Total number of residential
buildings
Water supply network Sewage systemNumber of residential buildings connected to water supply network
Water supply network cover-
age rate
Number of residential buildings connected to
sewage systemSewage system coverage rate
units units % units %POLAND 2 747 141 871 737Dolnośląskie 157 313
178 57051 757 12 574
78 325274 189 248 853 39 278
270 239 102 818538 194 95 341
115 424312 228
Podlaskie 141 794 109 242 21 252
Śląskie203 830 33 151113 842 92 897 28 318337 557 308 175 103 47713 281
Table 40. The coverage of rural areas with water supply network and sewage system, by voivodeship, at the end of 2010, according to a report by RRW-2 on investment in water supply network and sanitation of rural areas in 2010.

| AGRICULTURE AND FOOD ECONOMY IN POLAND70
RURAL AREAS
-
--
-
-
-
-
Table 41.
Development of economic activity and agri-tourism in rural areas
-
-
--
SpecificationUrban areas Rural areas
2005 2007 2005 2007
Internet
Table 41. Internet users by place of residence, 2005-2007 (%); Source: Institute of Agricultural and Food Economics – National Research Institute.

AGRICULTURE AND FOOD ECONOMY IN POLAND | 71
RURAL AREAS
-
-
--
Fig. 13.
-
--
-
-
-
-
-
Agriculture, forestry and fishing
Industry and construction
Trade; repair of motor vehicles; Transportationand storage; Accommodation and catering;Information and communication
Financial and insurance activities;Real estate activities
Other service activities
7%
28%
40%
4%
21%
Fig. 13. The structure of economic entities registered Company by type of activity in 2009; Source: Central Statistical Office, Statistical Studies and Analyses, Rural Areas in Poland, Warsaw 2011.

| AGRICULTURE AND FOOD ECONOMY IN POLAND72
RURAL AREAS
-
-
-
Table 42.
-
-
--
-
YearsAgri-tourism accommodation
Facilities Accommodation places in thousand2000 5 79020022005
7 4502007 8 790
5 473
Table 42. Agri-tourism base in Poland, 2000-2010; Source: Rural tourism in 2010 and assumptions for its development, Institute of Tourism, Warsaw 2010; Tourism in 2009, Central Statistical Office 2010.*Since 2009, city/town and gmina offices have an obligation to provide information about accommodation in an electronic form via an application called the Register of Tourist Facilities. However, part of gminas, particularly those of typical tourist nature where several hundred such facilities are located, has not finished the recording of data in paper form, which is why the presented figures may be underestimated.** Data published by the Central Statistical Office, as of 31 October 2010.

AGRICULTURE AND FOOD ECONOMY IN POLAND | 73
RURAL AREAS
-
--
-
Discussion on the Common Agricultural Policy after 2013
Commu-nication from the Commission to the European Parliament, the Council, the European Economic and Social Committee and the Committee of the Regions: The CAP towards 2020: Meeting the food, natural resources and territorial challenges of the future
-
-
-
--
Europe 2020 strategy---
--

| AGRICULTURE AND FOOD ECONOMY IN POLAND74

AGRICULTURE AND FOOD ECONOMY IN POLAND | 75
Support for agriculture and fisheriesDirect payments
--
-
-
Fig. 14.
-
-
-
PLN 64 billion --
over PLN 12.5 billion Fig. 15.
SUPPORT FOR AGRICULTURE AND FISHERIES
0
20
40
60
80
100
2013
2012
2011
2010
2009
2008
2007
2006
2005
2004
complementary national payments
%
EU funds
Fig. 14. The overall level of direct support in the years 2004-2013

| AGRICULTURE AND FOOD ECONOMY IN POLAND
SUPPORT FOR AGRICULTURE AND FISHERIES
-
--
-
Table 43.
SUPPORT FOR RURAL AREAS
Rural DevelopmentPlan 2004-2006 (RDP)
--
-
-
0
2 500
5 000
7 500
0 000
2 500
2010
*
2009
2008
2007
2006
2005
2004
million PLN
national payments
payments financed by the EU
Fig. 15. The information about the amount of payments made to farmers as direct support between 2004 and 2010 is presented on the following figure.* Payments made by the ARMA as of 1 July 2011.
Type of payment Unit 2004 2005 2006 2007 2008 2009 2010225
-- - -- - -- -- - - -- - - -- -- - - - - -- - - - - -- - - - - -
Table 43. Direct payments paid out by the Agency for Restructuring and Modernization of Agriculture in 2004-20101) In the years 2005 - 2006, payment for energy crops was made from national funds (willow and multiflora rose).2) Since the reference area was exceeded in 2007, the reduction ratio of 0.7 was applied.

AGRICULTURE AND FOOD ECONOMY IN POLAND | 77
SUPPORT FOR AGRICULTURE AND FISHERIES
Table 44.
SOP Restructuring and Modernisation of the Food Sector and Rural Development, 2004-2006
“Restructuring and modernization of food sector and rural development, 2004-2006” -
-
-
-
-
---
-
Table 45.
SpecificationNumber
of ap-plications submitted
Number of decisionsgranting
aid
Amount of payment made in
PLN million58 341 54 014
- 172 728
2 007 334
- 75 500
10513
standards72 591 71 385
103 100
110
4 208 344
1 829 1 218
Total
Table 44. Implementation of the Rural Development Plan as of 31 December 2008.

| AGRICULTURE AND FOOD ECONOMY IN POLAND78
SUPPORT FOR AGRICULTURE AND FISHERIES
--
-
-
Rural Development Programme 2007-2013RDP 2007-2013)
Specification
Limit
of fu
nds f
or
2004
-200
6PL
N m
illio
n
Applications submitted
Agreements concluded
Paymentsmade
Num
ber
Amou
nt in
PL
N m
illio
n
Num
ber
Amou
nt in
PL
N m
illio
n
Amou
nt in
PL
N m
illio
n
% o
f lim
it us
ed
42 582 24 23018 858 14 151
18233
1 11457 39
1 32-
1 3 425
7 1701 308 255
4 953 3 394
435220 180143 133151 118
TOTAL: 2 80 710 50 319
Table 45. Implementation of SOP “Restructuring and Modernisation of the Food Sector and Rural Development, 2004-2006”. Source: Implementing Authorities.1) The amounts presented under measures: Land reparcelling, Rural renewal and the preservation and protection of cultural heritage and Agricultural water resources management apply only to the EU funds. The amounts do not include the na-tional co-financing; therefore, the use of the limit has been presented as a percentage of the used EU allocation part for the above mentioned measures.2) Financial limits applicable from 16 June 2009 to 30 June 2009 were converted according to 4.4910 exchange rate (Euro-pean Central Bank rate on the penultimate working day of the European Commission in the month preceding the month for which the limit on EU funds allocation is calculated).

AGRICULTURE AND FOOD ECONOMY IN POLAND | 79
SUPPORT FOR AGRICULTURE AND FISHERIES
“Restructuring and Modernisation of the Food Sector and Rural Development 2004 – 2006”
-
--
Fig. 16, Table 46.12 August
2011-
PLN 25.33 billion
36.23%
“Support for farming in mountain areas and other less favoured areas (LFAs)” 21.38%„Early retirement” 18.52% -
“Modernisation of agricultural holdings” 15.71%
„Agri-environmental programme”14.38%
Evaluation of RDP 2007-2013
-
0
5
10
15
20
25
Basi
c se
rvic
es
Rura
l ren
ewal
and
deve
lopm
ent
Oth
er
Div
ersi
ficat
ion
into
non-
agric
ultu
ral a
ctiv
ities
Affo
rest
atio
n
Agri-
envi
ronm
enta
lpr
ogra
mm
e
LFA
Supp
ort f
orse
mi-s
ubsi
sten
ce fa
rms
Incr
easi
ng th
e ad
ded
valu
e
Mod
erni
satio
n of
agric
ultu
ral h
oldi
ngs
Early
retir
emen
t
Sett
ing
up o
fyo
ung
farm
ers
%
Fig. 16. Payments from public funds made to the benefi-ciaries of measures implemented under RDP 2007-2013 (as of 12 August 2011). Source: Prepared in the Rural Development Department of the Ministry of Agriculture and Rural Development on the basis of the ARMA’s monthly reports.

| AGRICULTURE AND FOOD ECONOMY IN POLAND80
SUPPORT FOR AGRICULTURE AND FISHERIES
-
-
-
--
SpecificationNumber
of ap-plications submitted
Number of decisions issued/ agreements con-
cluded
Payments made in PLN
million
29 27928 528 19 42923 53977 911
1 088
445
3 108
18 075 14 54811 4 - -
598 578
482 051 357 38013 993 8 370
- 153
8 71015 523 4 7452 887 2 148
4 4247 228
259 1381 018 9951 101
TOTAL 4 472 981
Table 46. Processing of applications submitted under RDP 2007-2013. Source: Agency for Restructuring and Modernisa-tion of Agriculture (as of 12 August 2011).

AGRICULTURE AND FOOD ECONOMY IN POLAND | 81
-
FISHERIES
-
-
SUPPORT FOR AGRICULTURE AND FISHERIES

| AGRICULTURE AND FOOD ECONOMY IN POLAND82
SUPPORT FOR AGRICULTURE AND FISHERIES
Sectoral Operational Programme “Fisheries and Fish Processing 2004-2006”
-
“Fish processing and fishery market” consisted of four operations:
-
-
-
-

AGRICULTURE AND FOOD ECONOMY IN POLAND | 83
SUPPORT FOR AGRICULTURE AND FISHERIES
-
Examples of the most frequent investments:
--
-
-
Operational Programme “Sustainable Development of the Fisheries Sector and Coastal Fishing Areas 2007–2013”

| AGRICULTURE AND FOOD ECONOMY IN POLAND84
SUPPORT FOR AGRICULTURE AND FISHERIES
-
-
-
-
The most frequently implemented projects under the measure:
Examples of investment projects:
-
-
-

AGRICULTURE AND FOOD ECONOMY IN POLAND | 85
SUPPORT FOR AGRICULTURE AND FISHERIES
-
-

| AGRICULTURE AND FOOD ECONOMY IN POLAND

AGRICULTURE AND FOOD ECONOMY IN POLAND | 87
Discussion on theCommon AgriculturalPolicy after 2013
Commu-nication from the Commission to the European Parliament, the Council, the European Economic and Social Committee and the Committee of the Regions: The CAP towards 2020: Meeting the food, natural resources and territorial challenges of the future
-
--
-
-
-
---
DISCUSSION ON THE COMMON AGRICULTURAL POLICY AFTER 2013

| AGRICULTURE AND FOOD ECONOMY IN POLAND88
DISCUSSION ON THE COMMON AGRICULTURAL POLICY AFTER 2013
-
-
European Parliament resolution on the CAP towards 2020: meeting the food, natural resources and territorial challenges of the future -
-
-
“Direct pay-ments under the CAP 2020”
-
-
-
-

AGRICULTURE AND FOOD ECONOMY IN POLAND | 89
DISCUSSION ON THE COMMON AGRICULTURAL POLICY AFTER 2013
-
Programme of the Polish Presidency of the Council of the European UnionEuropean integration as the source of
growth, Secure Europe - food, energy, defence and Europe benefitting from openness
Secure Europe - food, energy, defence
-
-
-

| AGRICULTURE AND FOOD ECONOMY IN POLAND90
50 YEARS OF COMMON AGRICULTURAL POLICY
50 Yearsof CommonAgricultural Policy
-
-
-
-
Beginnings of the Common Agricultural Policy
-
-
-
-
-

AGRICULTURE AND FOOD ECONOMY IN POLAND | 91
50 YEARS OF COMMON AGRICULTURAL POLICY
-
Former CAP
--
-
Reforms – a difficult path
-
-
--
-
---

| AGRICULTURE AND FOOD ECONOMY IN POLAND92
50 YEARS OF COMMON AGRICULTURAL POLICY
Reorientation and new priorities
-
-
--
Current CAP
-
-
--
Work on the CAP 2014-2020
-
-
-

AGRICULTURE AND FOOD ECONOMY IN POLAND | 93
50 YEARS OF COMMON AGRICULTURAL POLICY
-
-
During the Polish Presidency…
-
-
-
What comes next
-
-

| AGRICULTURE AND FOOD ECONOMY IN POLAND94
AGRICULTURAL INSTITUTIONS
AgriculturalinstitutionsAgency for Restructuring and Modernisation of Agriculture
-
-
-
-
-
Fig. 17.-
-
-
0
5
10
15
20
25mld PLN
2004 2005 2006 2007 2008 2009 2010 I - VI2011
domestic aid domestic funds EU funds
Fig. 17. Funds paid out annually by ARMA between 2004 and 2011 (PLN billion) (as at 30 June 2011)

AGRICULTURE AND FOOD ECONOMY IN POLAND | 95
-
RDP 2007-2013
SAPARD
Fig. 18.--
-
-
-
-
AGRICULTURAL INSTITUTIONS
0
10
20
30
40
50
SOP
Fish
erie
s …
200
4-20
06
SOP
Fish
erie
s 20
07-2
013
and
com
mon
fish
erie
s po
licy
Com
mon
org
anis
atio
nof
the
mar
ket i
n fr
uits
SAPA
RD
SOP
Rest
ruct
urin
g …
200
4-20
06
RDP
2004
-200
6
Dom
estic
sup
port
RDP
2007
-201
3
Dire
ct s
uppo
rt s
yste
ms
%
Fig. 18. Percentage structure of funds paid out by ARMA from its beginnings to the end of June 2011

| AGRICULTURE AND FOOD ECONOMY IN POLAND
AGRICULTURAL INSTITUTIONS
-
-
-
--
-
-
Agricultural Market Agency

AGRICULTURE AND FOOD ECONOMY IN POLAND | 97
AGRICULTURAL INSTITUTIONS
-
-
-
-
-
-
-
--
inter alia -

| AGRICULTURE AND FOOD ECONOMY IN POLAND98
AGRICULTURAL INSTITUTIONS
-
-
1. Intervention buy-in of agricultural products and processed agricul-tural products
-
-
2. Supporting consumptioninter alia -
“Glass of milk” programme
---
-

AGRICULTURE AND FOOD ECONOMY IN POLAND | 99
AGRICULTURAL INSTITUTIONS
-
-
“School Fruit Scheme”
-
-
Provision of food surplus to the most deprived in the European Union
-
-
--
-
-
3. Producer support programmes/mechanismsSubsidies to seed material
-

| AGRICULTURE AND FOOD ECONOMY IN POLAND100
AGRICULTURAL INSTITUTIONS
-
de minimis aid -
-
-
will not be treated as de minimisSpecial measures to support the milk market
Support for the bee products market
Restructuring of the sugar industry
-
Sugar industry diversification
-

AGRICULTURE AND FOOD ECONOMY IN POLAND | 101
AGRICULTURAL INSTITUTIONS
4. Export support
-
5. Payments for raw tobacco producers and starch potato planters-
-
6. Production and processing subsidies
7. Production capping systems -
-
-

| AGRICULTURE AND FOOD ECONOMY IN POLAND102
AGRICULTURAL INSTITUTIONS
8. Administrative measures for the monitoring and control of produc-tion, processing and trade with third countries
-
sale,
--
-
-
-
-
-
9. Promotional and informational measures Support to promotional and informational measures on the markets of
selected agricultural products -
--

AGRICULTURE AND FOOD ECONOMY IN POLAND | 103
AGRICULTURAL INSTITUTIONS
-
-
--
Handling funds to promote agri-food products-
-
Promotional and informational measures under RDP 2007-2013
-
-
-
Other aspects of AMA’s operations
-
-
-

| AGRICULTURE AND FOOD ECONOMY IN POLAND104
AGRICULTURAL INSTITUTIONS
-
-
-
--
-
-
--

AGRICULTURE AND FOOD ECONOMY IN POLAND | 105
AGRICULTURAL INSTITUTIONS
Agricultural Property Agency
-
--
-
-
-
-
-

| AGRICULTURE AND FOOD ECONOMY IN POLAND
AGRICULTURAL INSTITUTIONS
-
-
--
-
--
-
Ma -skie,
Fig. 19.
0
5
10
15
20
I - IV
201
120
1020
0920
0820
0720
0620
0520
0420
0320
0220
0120
0019
9919
9819
9719
9619
9519
9419
9319
92
tys.
Fig. 19. Prices of land owned by the APA in PLN per ha.Source: APA data.

AGRICULTURE AND FOOD ECONOMY IN POLAND | 107
AGRICULTURAL INSTITUTIONS
-
-Fig. 20.
--
-
--
--
-
0
2
4
6
8
10I -
III 2
011
2010
2009
2008
2007
2006
2005
2004
2003
2002
2001
2000
1999
1998
1997
1996
1995
1994
1993
1992
Fig. 20. Average lease rent on agricultural land for agree-ments concluded by the APA between 1992 and Q1 of 2011 in dt of wheat per 1 ha; Source: APA data.

| AGRICULTURE AND FOOD ECONOMY IN POLAND108
AGRICULTURAL INSTITUTIONS
-
--
-
-
inter alia-
Agricultural Social Insurance Fund
-
-

AGRICULTURE AND FOOD ECONOMY IN POLAND | 109
AGRICULTURAL INSTITUTIONS
--
-
-
-inter alia
inter alia
--
inter alia --
-
--
--
-

| AGRICULTURE AND FOOD ECONOMY IN POLAND110
AGRICULTURAL INSTITUTIONS
-
-
-
Agricultural consultancy
-
-
-
-
--
-

AGRICULTURE AND FOOD ECONOMY IN POLAND | 111
AGRICULTURAL INSTITUTIONS
-
-
-
-
-
-
-
---
Agricultural schools
---

| AGRICULTURE AND FOOD ECONOMY IN POLAND112
AGRICULTURAL INSTITUTIONS
-
--
-
-
-
-
R&D potential
-
-

AGRICULTURE AND FOOD ECONOMY IN POLAND | 113
AGRICULTURAL INSTITUTIONS
-
-
-
-
Fig. 21.
-
-
-
-
--
---
-
Content supervision
Science financing
R&D INSTITUTIONS FOR AGRICULTURE,
AGRICULTURAL MARKETS, FISHERIES AND RURAL
DEVELOPMENT
Ministry of Scienceand Higher Education
Ministry of Agriculture
and Rural Development
OTHER MINISTRIESMin. of Economy, Min. of Health,
Min. of the Environment
R&D INSTITUTIONS FOR AGRICULTURE,
AGRICULTURAL MARKETS, FISHERIES AND RURAL
DEVELOPMENT
Polish
Academy
of SciencesMinistry
of Science and Higher
Education
Fig. 21. Organisational structure of agricultural sciences in Poland

| AGRICULTURE AND FOOD ECONOMY IN POLAND114
AGRICULTURAL INSTITUTIONS
-
Table 47.-
-
-
---
-
-
-
-
-
-
Rese
arch
Inst
itute
sof
the
MAR
D
Scie
ntifi
c Uni
ts
of th
e PA
oS
Rese
arch
Inst
itute
s sub
-je
ct to
oth
er m
inist
ries
Univ
ersit
ies
Tota
l
4 015 578 1 408 10 289151 75 71 1 034 1 331
140 47 34 575
584 132 302 3 071 4 089
Table 47. Research and development personnel in agricultural sciences
Employees
Scientificunits

AGRICULTURE AND FOOD ECONOMY IN POLAND | 115
AGRICULTURAL INSTITUTIONS
st
--
-
-
-
-
-
Food and Nutrition in the 21st Century
nd
--

| AGRICULTURE AND FOOD ECONOMY IN POLAND
ADDRESSES OF COOPERATING INSTITUTIONS
Addresses of cooperatinginstitutions
MINISTRY OF AGRICULTURE AND RURAL DEVELOPMENT (MRiRW)
AGRICULTURAL MARKET AGENCY(AGENCJA RYNKU ROLNEGO)
AGENCY FOR RESTRUCTURING AND MODERNISATION OF AGRICULTURE(AGENCJA RESTRUKTURYZACJI i MODERNIZACJI ROLNICTWA)
AGRICULTURAL PROPERTY AGENCY(AGENCJA NIERUCHOMOŚCI ROLNYCH)
FOUNDATION OF ASSISTANCE PROGRAMMES FOR AGRICULTURE(FUNDACJA PROGRAMÓW POMOCY DLA ROLNICTWA, FAPA)

AGRICULTURE AND FOOD ECONOMY IN POLAND | 117
ADDRESSES OF COOPERATING INSTITUTIONS
AGRICULTURAL SOCIAL INSURANCE FUND(KASA ROLNICZEGO UBEZPIECZENIA SPOŁECZNEGO, KRUS)
MAIN INSPECTORATE OF THE AGRICULTURAL AND FOOD QUALITY INSPECTION(GŁÓWNY INSPEKTORAT JAKOŚCI HANDLOWEJ ARTYKUŁÓW ROLNO-SPOŻYWCZYCH, GIJHARS)
VETERINARY INSPECTION – MAIN VETERINARY INSPECTORATE(INSPEKCJA WETERYNARYJNA – GŁÓWNY INSPEKTORAT WETERYNARII, GIW)
MAIN INSPECTORATE OF PLANT HEALTH AND SEED INSPECTION(PAŃSTWOWA INSPEKCJA OCHRONY ROŚLIN I NASIENNICTWA, PIORIN)
AGRICULTURAL ADVISORY CENTRE IN BRWINÓW(CENTRUM DORADZTWA ROLNICZEGO W BRWINOWIE)
NATIONAL COUNCIL OF AGRICULTURAL CHAMBERS (KRAJOWA RADA IZB ROLNICZYCH)
NATIONAL UNION OF FARMERS, CO-OPERATIVES AND AGRICULTURAL ORGANISATIONS(KRAJOWY ZWIĄZEK ROLNIKÓW, KÓŁEK I ORGANIZACJI ROLNICZYCH, KZRKiOR)