Agency Costs and the Long-Run Performance of Debt Issuers
21
AAMJAF, Vol. 9, No. 1, 67–87, 2013 © Asian Academy of Management and Penerbit Universiti Sains Malaysia, 2013 AGENCY COSTS AND THE LONG-RUN PERFORMANCE OF DEBT ISSUERS Yusnidah Ibrahim, Md Mohan Uddin * , Kamarun Nisham Taufil Mohd and Mohd Sobri Minai College of Business, Universiti Utara Malaysia, 06010 UUM Sintok, Kedah * Corresponding author: [email protected] ABSTRACT This study focuses on an agency cost explanation of the long-run performance of debt issuers based on debt issuance data in Malaysia during the period from January 2001 to October 2009. Long-run performance is measured by buy and hold abnormal return (BHAR), while growth opportunities (GO), managerial ownership (MO), ownership concentration (OC) and free cash flow (FCF) are adopted as proxies for agency costs. Using a linear regression method, this study finds that BHAR is positively influenced by GO and OC but negatively influenced by MO and FCF, which supports an agency cost explanation of capital structure. An improvement in the performance of debt issuers is found to be associated with the monitoring of debt by debt issuers. Debt issuers with more concentrated ownership and lower MO benefit from the issuance of debt through a reduction of agency costs. Keywords: capital structure, agency theory, ownership concentration, bonds, long-run performance INTRODUCTION An agency cost argument forms one of the explanations for the wealth effect of a capital structure change in an imperfect capital market. Jensen and Meckling (1976) have proposed an agency theory that argues that the ownership of a firm remains equally concentrated if the firm chooses debt over equity. This stability helps the firm to avoid the higher agency costs associated with dispersed ownership that occur in an equity financing alternative. According to this theory, in a highly concentrated ownership context, an increase in the level of debt in the capital structure of a firm should result in decreasing agency costs of equity, increasing agency costs of debt resulting from the actions of inside agents, or both of these effects. Because debt covenants already mitigate the agency costs of debt, an increase in debt would likely result in an increase in firm value. Later, ASIAN ACADEMY of MANAGEMENT JOURNAL of ACCOUNTING and FINANCE
Transcript of Agency Costs and the Long-Run Performance of Debt Issuers

AAMJAF, Vol. 9, No. 1, 67–87, 2013
© Asian Academy of Management and Penerbit Universiti Sains Malaysia, 2013
AGENCY COSTS AND THE LONG-RUN
PERFORMANCE OF DEBT ISSUERS
Yusnidah Ibrahim, Md Mohan Uddin*, Kamarun Nisham Taufil Mohd and Mohd Sobri Minai
College of Business, Universiti Utara Malaysia,
06010 UUM Sintok, Kedah
*Corresponding author: [email protected]
ABSTRACT This study focuses on an agency cost explanation of the long-run performance of debt issuers based on debt issuance data in Malaysia during the period from January 2001 to October 2009. Long-run performance is measured by buy and hold abnormal return (BHAR), while growth opportunities (GO), managerial ownership (MO), ownership concentration (OC) and free cash flow (FCF) are adopted as proxies for agency costs. Using a linear regression method, this study finds that BHAR is positively influenced by GO and OC but negatively influenced by MO and FCF, which supports an agency cost explanation of capital structure. An improvement in the performance of debt issuers is found to be associated with the monitoring of debt by debt issuers. Debt issuers with more concentrated ownership and lower MO benefit from the issuance of debt through a reduction of agency costs.
Keywords: capital structure, agency theory, ownership concentration, bonds, long-run performance INTRODUCTION An agency cost argument forms one of the explanations for the wealth effect of a capital structure change in an imperfect capital market. Jensen and Meckling (1976) have proposed an agency theory that argues that the ownership of a firm remains equally concentrated if the firm chooses debt over equity. This stability helps the firm to avoid the higher agency costs associated with dispersed ownership that occur in an equity financing alternative. According to this theory, in a highly concentrated ownership context, an increase in the level of debt in the capital structure of a firm should result in decreasing agency costs of equity, increasing agency costs of debt resulting from the actions of inside agents, or both of these effects. Because debt covenants already mitigate the agency costs of debt, an increase in debt would likely result in an increase in firm value. Later,
ASIAN ACADEMY of MANAGEMENT JOURNAL
of ACCOUNTING and FINANCE
Yusnidah Ibrahim et al.
68
Jensen (1986) advanced the free cash flow hypothesis, which claims that debt issuance results in obligatory payments of interest and principal and thus reduces the free cash flow available for managers to serve their own interests. Based on these theoretical predictions, when a firm issues a debt security, the agency costs associated with the capital structure change can be expected to affect shareholder wealth.
Several other studies have provided evidence of the association between debt financing and agency costs. According to Harvey, Lins, and Roper (2002), the level of debt and the degree of monitoring are proven to have an impact on agency costs. In addition, Leuz, Nanda and Wysocki (2003) showed that managers and controlling shareholders enjoy private control benefits in an environment of concentrated ownership and in a less-developed market with weaker investor protection. Campello (2006) emphasised that a large body of literature supports the theory that capital structure changes influence the actions of both inside agents and outside parties. Nonetheless, few robust studies specifically examine the relationship between agency costs and the wealth effect of debt issuances to determine whether a reduction in agency costs is indeed one of the sources of value creation. While prior capital structure studies such as Bharath, Pasquariello and Wu (2009), Deesomsak, Paudyal and Pescetto (2004), De Jong, Kabir and Nguyen (2008), and Frank and Goyal (2009) have mainly focused on the determinants of capital structure, studies on the determinants of the wealth effects of capital structure changes remain inconclusive (Myers, 2001; Carpentier, 2006).
Moreover, most wealth effects studies, such as Howton, Howton and Perfect (1998) and Antweiler and Frank (2006), used short-run measures of wealth effects and did not emphasise agency cost variables. Short-run wealth effects may not capture the future implications of a decision, especially when the stock markets are not efficient or semi-strong efficient. Few studies in developed markets have found evidence of long-run underperformance after security issuances. These studies linked any such underperformance to opportunistic managers manipulating the market timing of debt issuances and to slow reactions from investors resulting from the inability of investors to mitigate overvaluation in the short run (Wu & Kwok, 2007; Coakley, Hadass, & Wood, 2008; Farinós, García, & Ibáñez, 2007; Autore, Bray, & Peterson, 2009; Chou, Wang, Chen, & Tsai, 2009). Because many emerging markets such as Korea and Taiwan are shown to be weak-form efficient, while some other emerging markets, including Malaysia, are inefficient despite experiencing continuous financial liberalisation (Kim & Shamsuddin, 2008), the wealth effects in these markets should also be assessed by an evaluation of long-run stock performance.
Agency Costs and the Long-Run Performance of Debt Issuers
69
Few attempts have been made to explain the long-run wealth effects on debt issuers through an agency cost theory, especially in emerging countries such as Malaysia. The intense increase in leverage ratios in Malaysia and the shift in reliance of Malaysian companies from financial institutions to capital markets for raising debt after the 1997 financial crisis (Deesomsak, Paudyal, & Pescetto, 2004; Ibrahim & Minai, 2009), coupled with the fact that Malaysia possesses the highest ratio of corporate bonds issued per dollar of GDP (37.3%) among the emerging countries (Mohamad, Hassan, & Ariff, 2007), have raised the question of whether the active debt-financing activities of Malaysian companies are generating wealth for shareholders. Scholars such as Jensen and Meckling (1976) and Jensen (1986) have questioned, whether agency cost reduction is a source of shareholder wealth creation. Hence, this study attempts to provide answers to these questions by investigating the effects of variables related to agency costs on long-run shareholder wealth in the context of debt issuances in Malaysia.
The remainder of this paper is organised as follows. The first section reviews related literature. The second section explains the theoretical framework followed by the presentation of the methodology adopted in this study. The findings are presented next. Finally, the last section discusses the results and concludes the study.
LITERATURE REVIEW The effect of agency costs on the performance of a debt issuer can possibly be explained by the agency theory of Jensen and Meckling (1976). When management and ownership are separated, managers become the agents of owners. Because managers may not hold a significant portion of the total ownership, managers may pursue objectives other than shareholder wealth maximisation. This situation results in an agency conflict. When a firm is financed with equity issuances, ownership becomes more diluted, causing an increase in the agency conflict between managers and outside owners. Consequently, managers of unprofitable investments tend to increase their leisure, privileges, or benefits from the unprofitable investment activity, costs that are shared by the owners of these investments. These costs are called agency costs of equity. If a firm considers using debt financing instead, ownership remains as concentrated as before. In this case, managers do not find additional external owners to share the cost of increasing their own benefits. Therefore, debt financing has the benefit of reducing agency costs of equity.
Research on long-run stock return performance following a particular financing activity focuses more on equity financing such as IPOs (Yip, Su, &
Yusnidah Ibrahim et al.
70
Ang, 2009; Moshirian, Ng, & Wu, 2010), seasoned equity issues (Jo & Kim, 2008; Autore, Bray, & Peterson, 2009) and preferred equity issues (Howe & Lee, 2006). Some studies have examined the long-run performance of straight and convertible bond issuances. For example, Jewell and Livingston (1997) studied the three-year-run stock returns of debt issuers during 1980–1990. Their study revealed the strong impact of bond ratings on long-run stock returns. Lee and Loughran (1998) used a sample of convertible bond issuers in the USA during 1975–1990. Their study in contrast revealed significantly inferior stock returns and operating performance in the years following convertible bond offerings. This finding has been associated with the effects of the high free cash flow problem combined with the effects of a lack of available investment opportunities.
Spiess and Affleck-Graves (1999) documented substantial long-run post-issue underperformance for both straight and convertible debt issuers in the USA during the period from 1975 to 1989. They found that underperformance is more severe for smaller, younger firms and for firms issuing speculative-grade debt. Based on these results, they argued that similarly to equity offerings, debt offerings also signal to the market that a firm is overvalued. As a result, an initial under-reaction by psychologically biased investors is followed by a similar, but more impactful assessment in the long run. Dichev and Piotroski (1999) found no abnormal returns for straight debt issuers and a high degree of underperformance for convertible bond issuers during the five years following a debt issuance.
In response to the weaknesses of previous studies such as the biased inference of standard parametric test, Datta, Iskandar-Datta and Patel (2000a) used a more comprehensive 24-year sample based on U.S. data. They found substantial long-run underperformance, which was attributed to the market timings of issuances and significant reductions in growth opportunities following the issuances. Muradoglu and Whittington (2001) analysed the long-run performance of UK debt issuing companies during a period from 1990 to 1999. They found that companies with less leverage at the time of issuance exhibited superior three-year buy and hold abnormal returns.
Gombola and Marciukaityte (2007) have compared the long-run performance between equity issuers and debt issuers using a sample of rapidly growing firms. They claimed that the performance of the firms that finance their growth by debt issuances is significantly worse than the performance of firms that finance by equity issuances. They attributed this result to the tendency of management to issue debt when management is overly optimistic about the future growth of the firm.
Agency Costs and the Long-Run Performance of Debt Issuers
71
Chou et al. (2009) also found stock return underperformance for U.S. convertible bond issuers that were involved in earnings management during the five-year post-issue period. They argued that the temporary overvaluation of stock is corrected over the long run. The underperformance of convertible bond issuers is also evidenced in the study of Jung (2009), who noted that long-run performance depends on the type of debt security issued.
Overall, although empirical evidence shows a general agreement that long-run underperformance arises after an issuance of convertible bonds, scholars could not reach a conclusion about the long-run performance of straight debt issues and the underlying reasons for the level of performance experienced by straight debt issuers. Previous studies have tried to explain the long-run performance following debt issuances based on investor behaviour, managerial attitude, issuance timing, and variations in the types of debt securities offered; however, there is a lack of emphasis on the agency environment of firms despite strong theoretical supports for an agency theory. Moreover, no study, to the authors' knowledge, has focused on the issue of long-run performance following debt issuances in a developing country context, particularly in the context of Malaysia, which is also characterised by high debt dependence.
THEORETICAL FRAMEWORK
One-, two-, and three-year shareholder buy and hold abnormal returns (BHARs) are used as alternative dependent variables in this study to examine the influence of agency costs on the long-run performance of debt issuances over different durations. This measure has been widely used in previous studies (e.g., Chan, Ikenberry, & Lee, 2004; Datta, Iskandar-Datta, & Raman, 2000b; Lyon, Barber, & Tsai, 1999; Ritter, 1991). The explanatory variables in this study are composed of agency cost proxies. However, because agency cost effects theoretically take place in the context of capital structure changes and because not all debt issuances result in equivalent capital structure changes, the hypothesised relationship between these variables and long-run performance is moderated by capital structure changes. The theoretical arguments for the hypothesised impacts of agency cost proxies are discussed next.
Growth Opportunities According to Myers (1977) and Titman and Wessels (1988), the value of growth opportunities depends on a firm's discretionary future investments which may result when the firm seeks to redistribute wealth from the bondholders to equity holders, potentially increasing the agency costs of debt. On the other hand,
Yusnidah Ibrahim et al.
72
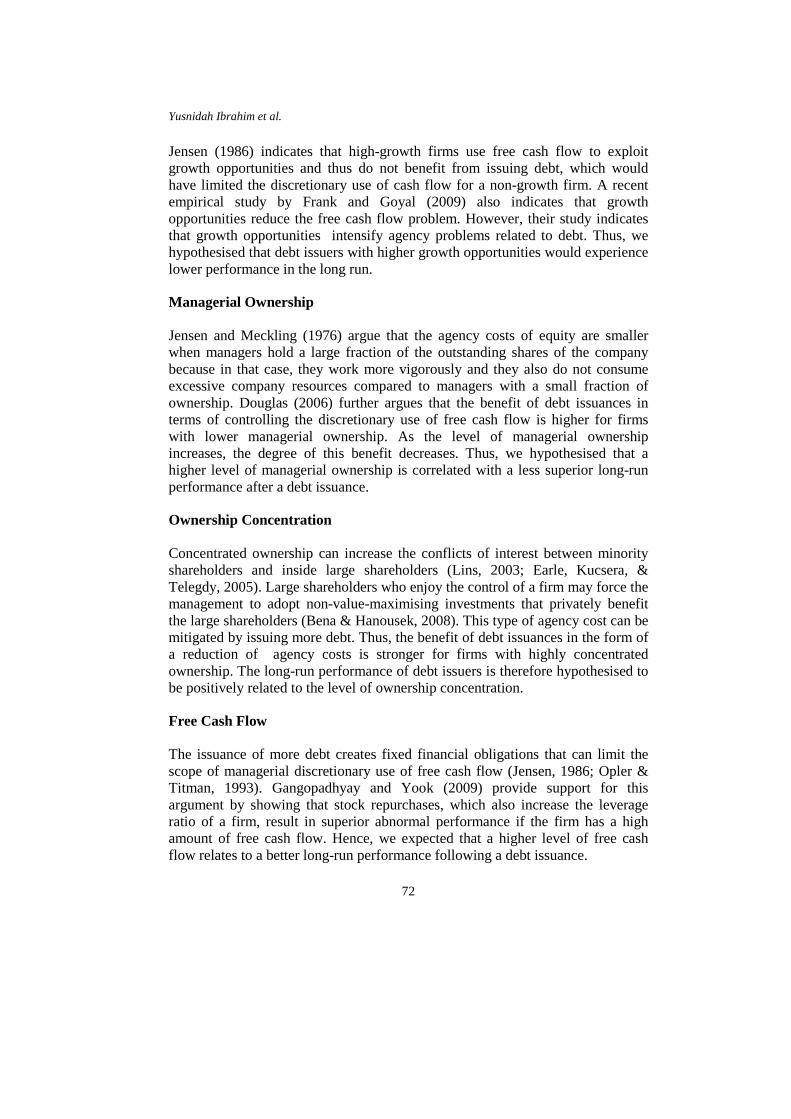
Jensen (1986) indicates that high-growth firms use free cash flow to exploit growth opportunities and thus do not benefit from issuing debt, which would have limited the discretionary use of cash flow for a non-growth firm. A recent empirical study by Frank and Goyal (2009) also indicates that growth opportunities reduce the free cash flow problem. However, their study indicates that growth opportunities intensify agency problems related to debt. Thus, we hypothesised that debt issuers with higher growth opportunities would experience lower performance in the long run.
Managerial Ownership Jensen and Meckling (1976) argue that the agency costs of equity are smaller when managers hold a large fraction of the outstanding shares of the company because in that case, they work more vigorously and they also do not consume excessive company resources compared to managers with a small fraction of ownership. Douglas (2006) further argues that the benefit of debt issuances in terms of controlling the discretionary use of free cash flow is higher for firms with lower managerial ownership. As the level of managerial ownership increases, the degree of this benefit decreases. Thus, we hypothesised that a higher level of managerial ownership is correlated with a less superior long-run performance after a debt issuance.
Ownership Concentration Concentrated ownership can increase the conflicts of interest between minority shareholders and inside large shareholders (Lins, 2003; Earle, Kucsera, & Telegdy, 2005). Large shareholders who enjoy the control of a firm may force the management to adopt non-value-maximising investments that privately benefit the large shareholders (Bena & Hanousek, 2008). This type of agency cost can be mitigated by issuing more debt. Thus, the benefit of debt issuances in the form of a reduction of agency costs is stronger for firms with highly concentrated ownership. The long-run performance of debt issuers is therefore hypothesised to be positively related to the level of ownership concentration.
Free Cash Flow The issuance of more debt creates fixed financial obligations that can limit the scope of managerial discretionary use of free cash flow (Jensen, 1986; Opler & Titman, 1993). Gangopadhyay and Yook (2009) provide support for this argument by showing that stock repurchases, which also increase the leverage ratio of a firm, result in superior abnormal performance if the firm has a high amount of free cash flow. Hence, we expected that a higher level of free cash flow relates to a better long-run performance following a debt issuance.
Agency Costs and the Long-Run Performance of Debt Issuers
73
DATA AND METHODS
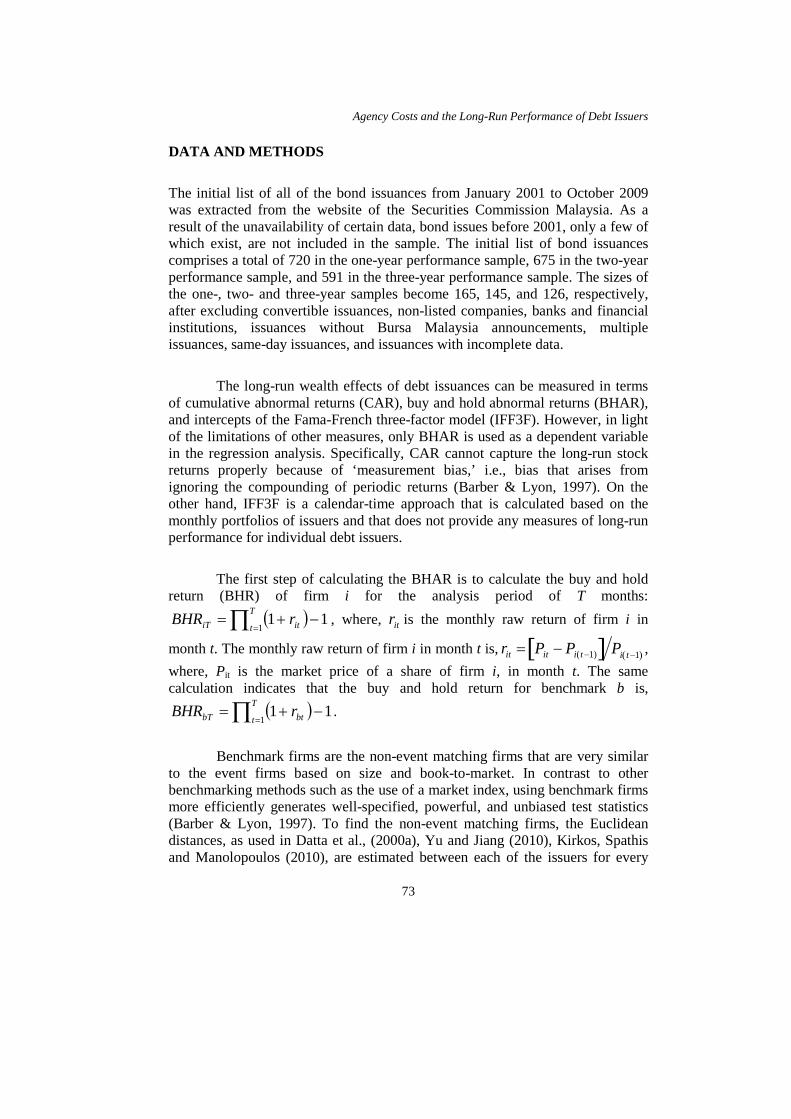
The initial list of all of the bond issuances from January 2001 to October 2009 was extracted from the website of the Securities Commission Malaysia. As a result of the unavailability of certain data, bond issues before 2001, only a few of which exist, are not included in the sample. The initial list of bond issuances comprises a total of 720 in the one-year performance sample, 675 in the two-year performance sample, and 591 in the three-year performance sample. The sizes of the one-, two- and three-year samples become 165, 145, and 126, respectively, after excluding convertible issuances, non-listed companies, banks and financial institutions, issuances without Bursa Malaysia announcements, multiple issuances, same-day issuances, and issuances with incomplete data.
The long-run wealth effects of debt issuances can be measured in terms of cumulative abnormal returns (CAR), buy and hold abnormal returns (BHAR), and intercepts of the Fama-French three-factor model (IFF3F). However, in light of the limitations of other measures, only BHAR is used as a dependent variable in the regression analysis. Specifically, CAR cannot capture the long-run stock returns properly because of ‘measurement bias,’ i.e., bias that arises from ignoring the compounding of periodic returns (Barber & Lyon, 1997). On the other hand, IFF3F is a calendar-time approach that is calculated based on the monthly portfolios of issuers and that does not provide any measures of long-run performance for individual debt issuers.
The first step of calculating the BHAR is to calculate the buy and hold return (BHR) of firm i for the analysis period of T months:
( )∏ =−+=
T
t itiT rBHR1
11 , where, itr is the monthly raw return of firm i in
month t. The monthly raw return of firm i in month t is,
rit = Pit − Pi(t −1)[ ] Pi t −1( ) , where, Pit is the market price of a share of firm i, in month t. The same calculation indicates that the buy and hold return for benchmark b is,
( )∏ =−+=
T
t btbT rBHR1
11 .
Benchmark firms are the non-event matching firms that are very similar
to the event firms based on size and book-to-market. In contrast to other benchmarking methods such as the use of a market index, using benchmark firms more efficiently generates well-specified, powerful, and unbiased test statistics (Barber & Lyon, 1997). To find the non-event matching firms, the Euclidean distances, as used in Datta et al., (2000a), Yu and Jiang (2010), Kirkos, Spathis and Manolopoulos (2010), are estimated between each of the issuers for every
Yusnidah Ibrahim et al.
74
issue in the sample and for each benchmark candidate based on the size of the candidates, which is measured by market capitalisation and market-to-book ratio.
For the BHAR estimations, the average return of the two closest available matching firms is considered to be a benchmark return. The BHAR of firm i for the analysis period T is the difference between the buy-and-hold returns of the firm and the benchmark of that analysis period,
bTiTiT BHRBHRBHAR −= . The average buy-and-hold abnormal return for analysis period T is calculated as follows,
∑=
=n
iiTiT BHARBHAR
1ω , (1)
where n is the number of observations in the sample for analysis period, and
∑= iii MVMVω , (where iMV is the market value of issuing firm i's outstanding shares before the issue).
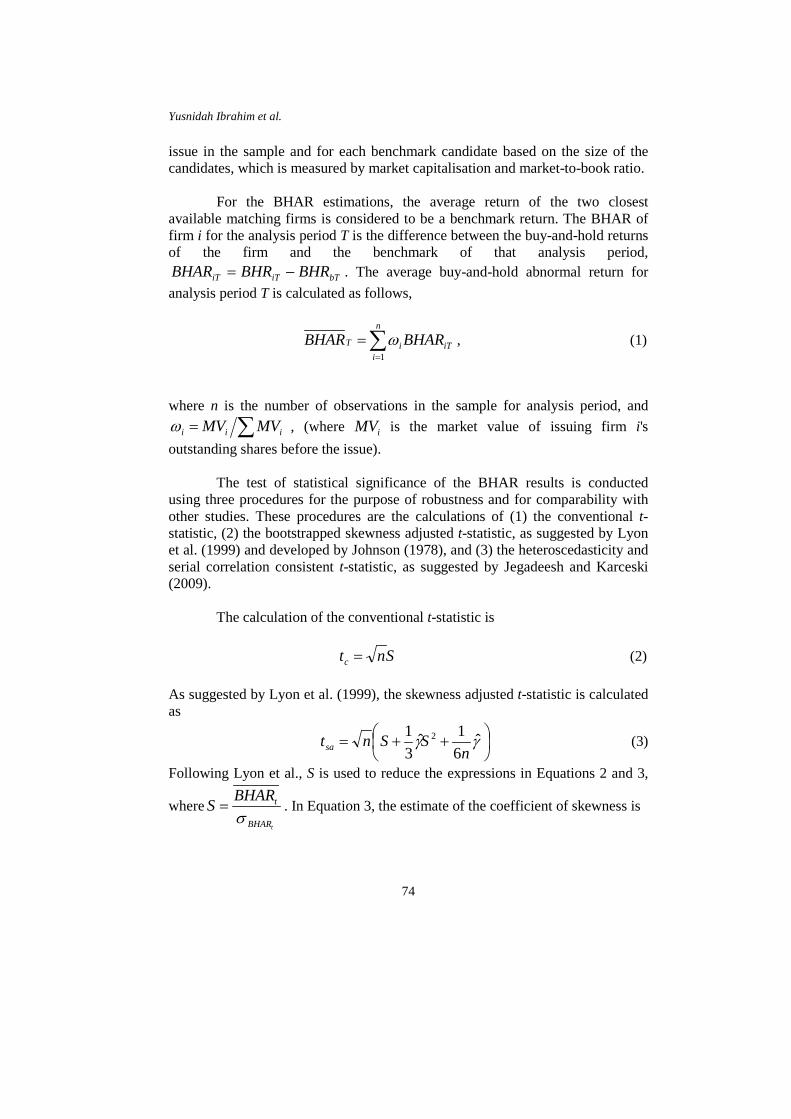
The test of statistical significance of the BHAR results is conducted using three procedures for the purpose of robustness and for comparability with other studies. These procedures are the calculations of (1) the conventional t-statistic, (2) the bootstrapped skewness adjusted t-statistic, as suggested by Lyon et al. (1999) and developed by Johnson (1978), and (3) the heteroscedasticity and serial correlation consistent t-statistic, as suggested by Jegadeesh and Karceski (2009).
The calculation of the conventional t-statistic is
Sntc = (2)
As suggested by Lyon et al. (1999), the skewness adjusted t-statistic is calculated as
++= γγ ˆ
61ˆ
31 2
nSSntsa (3)
Following Lyon et al., S is used to reduce the expressions in Equations 2 and 3,
wheretBHAR
tBHARSσ
= . In Equation 3, the estimate of the coefficient of skewness is
Agency Costs and the Long-Run Performance of Debt Issuers
75
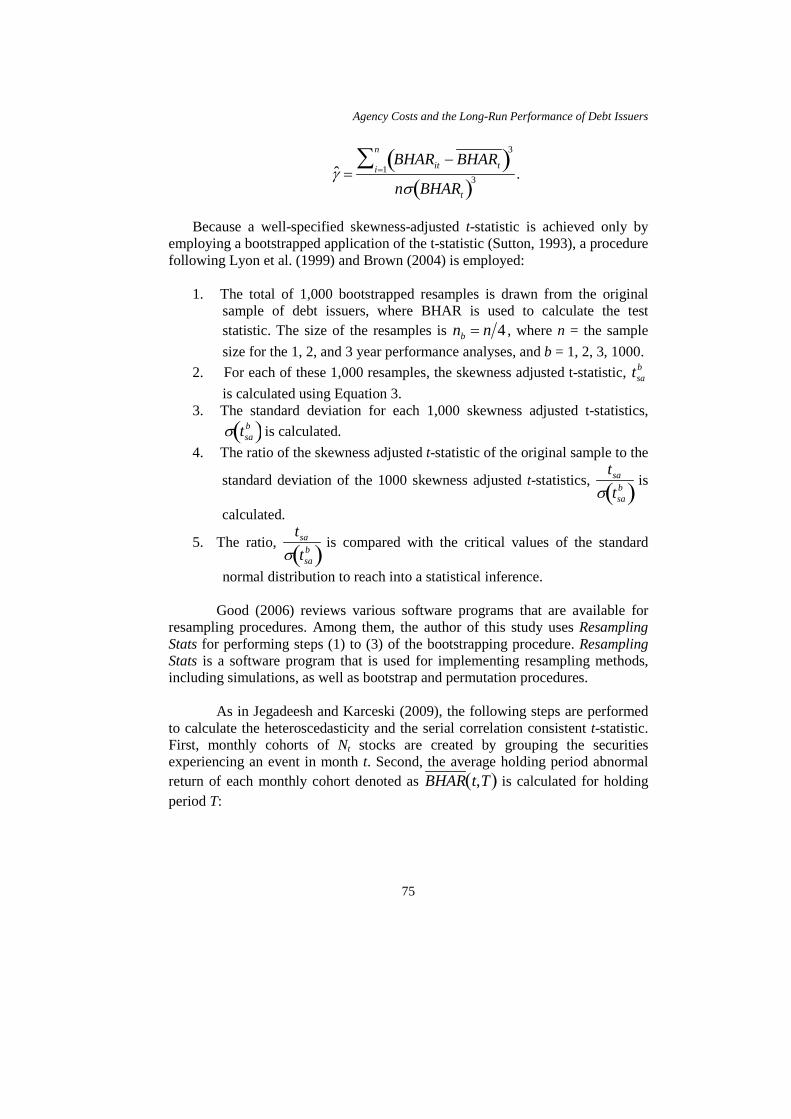
ˆ γ =BHARit − BHARt( )3
i=1
n∑nσ BHARt( )3 .
Because a well-specified skewness-adjusted t-statistic is achieved only by
employing a bootstrapped application of the t-statistic (Sutton, 1993), a procedure following Lyon et al. (1999) and Brown (2004) is employed:
1. The total of 1,000 bootstrapped resamples is drawn from the original sample of debt issuers, where BHAR is used to calculate the test statistic. The size of the resamples is 4nnb = , where n = the sample size for the 1, 2, and 3 year performance analyses, and b = 1, 2, 3, 1000.
2. For each of these 1,000 resamples, the skewness adjusted t-statistic, bsat
is calculated using Equation 3. 3. The standard deviation for each 1,000 skewness adjusted t-statistics,
σ tsab( ) is calculated.
4. The ratio of the skewness adjusted t-statistic of the original sample to the
standard deviation of the 1000 skewness adjusted t-statistics,
tsa
σ tsab( ) is
calculated.
5. The ratio,
tsa
σ tsab( ) is compared with the critical values of the standard
normal distribution to reach into a statistical inference.
Good (2006) reviews various software programs that are available for resampling procedures. Among them, the author of this study uses Resampling Stats for performing steps (1) to (3) of the bootstrapping procedure. Resampling Stats is a software program that is used for implementing resampling methods, including simulations, as well as bootstrap and permutation procedures.
As in Jegadeesh and Karceski (2009), the following steps are performed to calculate the heteroscedasticity and the serial correlation consistent t-statistic. First, monthly cohorts of Nt stocks are created by grouping the securities experiencing an event in month t. Second, the average holding period abnormal return of each monthly cohort denoted as
BHAR t,T( ) is calculated for holding period T:
Yusnidah Ibrahim et al.
76
BHAR t,T( ) =
1N
BHARi t,T( ),i=1
Nt
∑ if Nt > 0
0, otherwise
,
where ∑ =
=M
t tNN1
, T = 12, 24, or 36 months of the analysis period, and M = the number of months in the sample period. The heteroscedasticity and the serial correlation consistent t-statistic is
VwwBHARt t
hsc ′= (4)
where w is the M × 1 column vector of weights (M = the number of months in the sample period) measured as the ratio of the number of events in month t to the total sample size and V is the M × M variance covariance matrix. The ij-th element of this matrix is estimated as,
( )( ) ( )
−≤−≤=
=otherwise,0
11 if,,*, if,, 2
TjiTjBHARTiBHARjiTiBHAR
Vij
Jegadeesh and Karceski (2009) find that when the sample is not very
large, hsct tends to over reject the null hypothesis of BHAR = 0. They provide and suggest using the critical values based on the empirical distribution table for statistical inference. This study follows this empirical distribution for the statistical inferences about BHAR results.
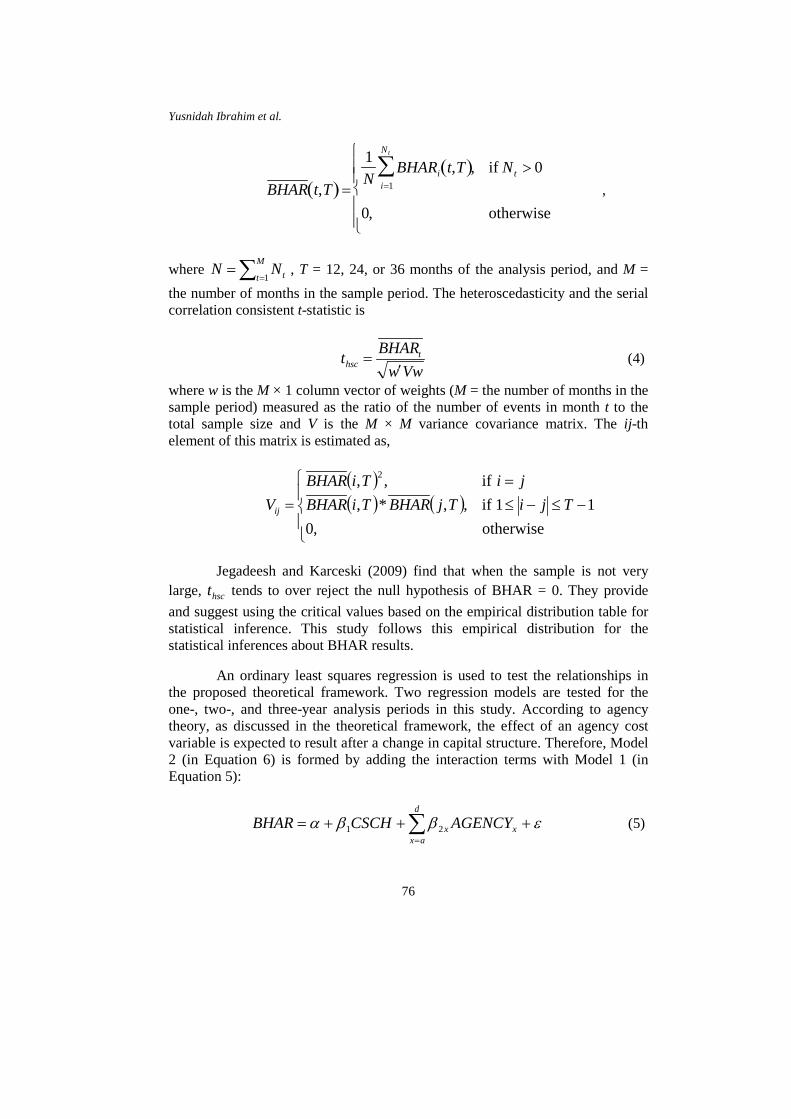
An ordinary least squares regression is used to test the relationships in the proposed theoretical framework. Two regression models are tested for the one-, two-, and three-year analysis periods in this study. According to agency theory, as discussed in the theoretical framework, the effect of an agency cost variable is expected to result after a change in capital structure. Therefore, Model 2 (in Equation 6) is formed by adding the interaction terms with Model 1 (in Equation 5):
εββα +++= ∑=
d
axxx AGENCYCSCHBHAR 21 (5)
Agency Costs and the Long-Run Performance of Debt Issuers
77
εβββα +∗+++= ∑ ∑= =
d
ax
d
ayyyxx AGENCYCSCHAGENCYCSCHBHAR 321 , (6)
where AGENCYa to AGENCYd stand for the variables related to agency costs.
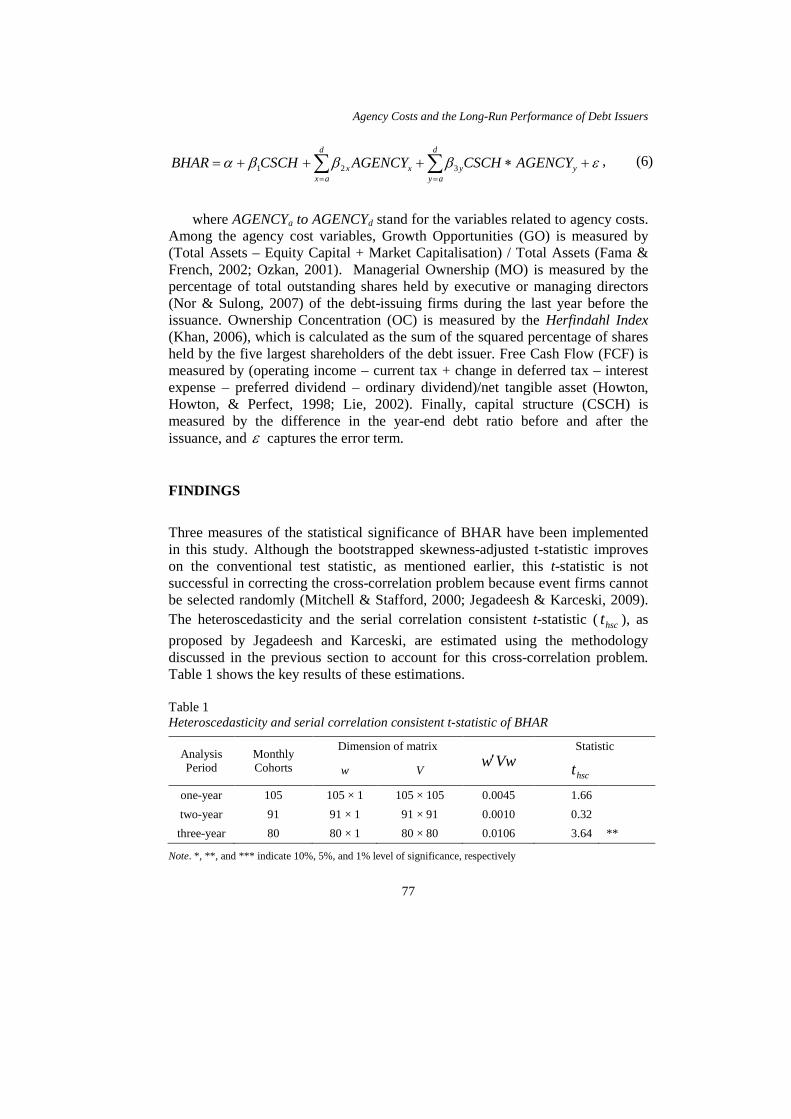
Among the agency cost variables, Growth Opportunities (GO) is measured by (Total Assets – Equity Capital + Market Capitalisation) / Total Assets (Fama & French, 2002; Ozkan, 2001). Managerial Ownership (MO) is measured by the percentage of total outstanding shares held by executive or managing directors (Nor & Sulong, 2007) of the debt-issuing firms during the last year before the issuance. Ownership Concentration (OC) is measured by the Herfindahl Index (Khan, 2006), which is calculated as the sum of the squared percentage of shares held by the five largest shareholders of the debt issuer. Free Cash Flow (FCF) is measured by (operating income – current tax + change in deferred tax – interest expense – preferred dividend – ordinary dividend)/net tangible asset (Howton, Howton, & Perfect, 1998; Lie, 2002). Finally, capital structure (CSCH) is measured by the difference in the year-end debt ratio before and after the issuance, and ε captures the error term. FINDINGS Three measures of the statistical significance of BHAR have been implemented in this study. Although the bootstrapped skewness-adjusted t-statistic improves on the conventional test statistic, as mentioned earlier, this t-statistic is not successful in correcting the cross-correlation problem because event firms cannot be selected randomly (Mitchell & Stafford, 2000; Jegadeesh & Karceski, 2009). The heteroscedasticity and the serial correlation consistent t-statistic ( hsct ), as proposed by Jegadeesh and Karceski, are estimated using the methodology discussed in the previous section to account for this cross-correlation problem. Table 1 shows the key results of these estimations. Table 1 Heteroscedasticity and serial correlation consistent t-statistic of BHAR
Analysis Period
Monthly Cohorts
Dimension of matrix Vww′
Statistic
w V hsct
one-year 105 105 × 1 105 × 105 0.0045 1.66 two-year 91 91 × 1 91 × 91 0.0010 0.32 three-year 80 80 × 1 80 × 80 0.0106 3.64 **
Note. *, **, and *** indicate 10%, 5%, and 1% level of significance, respectively
Yusnidah Ibrahim et al.
78
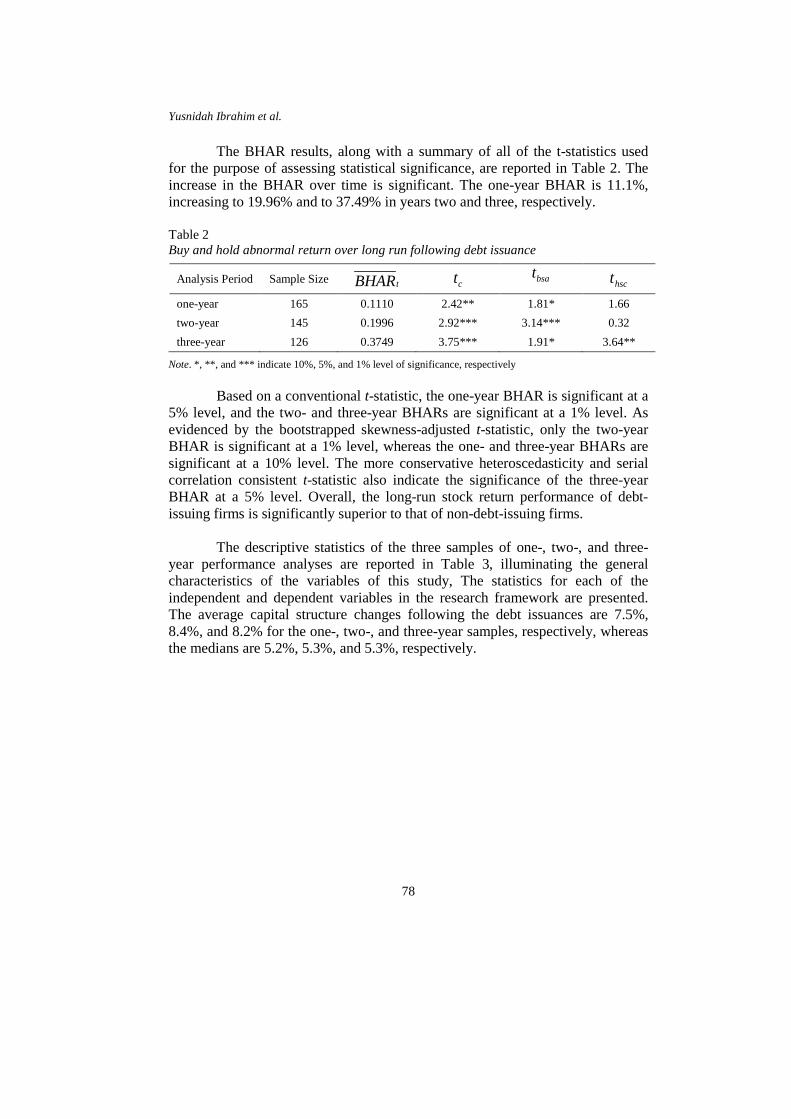
The BHAR results, along with a summary of all of the t-statistics used for the purpose of assessing statistical significance, are reported in Table 2. The increase in the BHAR over time is significant. The one-year BHAR is 11.1%, increasing to 19.96% and to 37.49% in years two and three, respectively. Table 2 Buy and hold abnormal return over long run following debt issuance
Analysis Period Sample Size tBHAR ct bsat hsct
one-year 165 0.1110 2.42** 1.81* 1.66 two-year 145 0.1996 2.92*** 3.14*** 0.32 three-year 126 0.3749 3.75*** 1.91* 3.64**
Note. *, **, and *** indicate 10%, 5%, and 1% level of significance, respectively
Based on a conventional t-statistic, the one-year BHAR is significant at a 5% level, and the two- and three-year BHARs are significant at a 1% level. As evidenced by the bootstrapped skewness-adjusted t-statistic, only the two-year BHAR is significant at a 1% level, whereas the one- and three-year BHARs are significant at a 10% level. The more conservative heteroscedasticity and serial correlation consistent t-statistic also indicate the significance of the three-year BHAR at a 5% level. Overall, the long-run stock return performance of debt-issuing firms is significantly superior to that of non-debt-issuing firms.
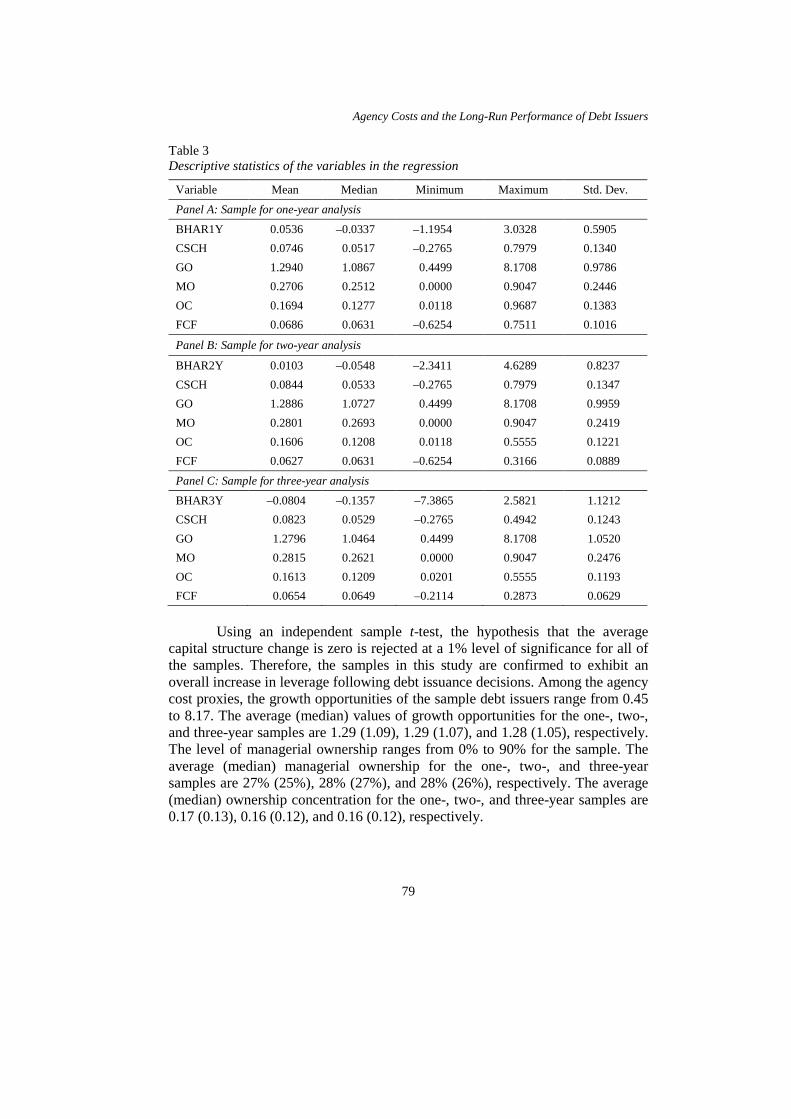
The descriptive statistics of the three samples of one-, two-, and three-year performance analyses are reported in Table 3, illuminating the general characteristics of the variables of this study, The statistics for each of the independent and dependent variables in the research framework are presented. The average capital structure changes following the debt issuances are 7.5%, 8.4%, and 8.2% for the one-, two-, and three-year samples, respectively, whereas the medians are 5.2%, 5.3%, and 5.3%, respectively.
Agency Costs and the Long-Run Performance of Debt Issuers
79
Table 3 Descriptive statistics of the variables in the regression
Variable Mean Median Minimum Maximum Std. Dev.
Panel A: Sample for one-year analysis BHAR1Y 0.0536 –0.0337 –1.1954 3.0328 0.5905 CSCH 0.0746 0.0517 –0.2765 0.7979 0.1340 GO 1.2940 1.0867 0.4499 8.1708 0.9786 MO 0.2706 0.2512 0.0000 0.9047 0.2446 OC 0.1694 0.1277 0.0118 0.9687 0.1383 FCF 0.0686 0.0631 –0.6254 0.7511 0.1016
Panel B: Sample for two-year analysis
BHAR2Y 0.0103 –0.0548 –2.3411 4.6289 0.8237 CSCH 0.0844 0.0533 –0.2765 0.7979 0.1347 GO 1.2886 1.0727 0.4499 8.1708 0.9959 MO 0.2801 0.2693 0.0000 0.9047 0.2419 OC 0.1606 0.1208 0.0118 0.5555 0.1221 FCF 0.0627 0.0631 –0.6254 0.3166 0.0889
Panel C: Sample for three-year analysis BHAR3Y –0.0804 –0.1357 –7.3865 2.5821 1.1212 CSCH 0.0823 0.0529 –0.2765 0.4942 0.1243 GO 1.2796 1.0464 0.4499 8.1708 1.0520 MO 0.2815 0.2621 0.0000 0.9047 0.2476 OC 0.1613 0.1209 0.0201 0.5555 0.1193 FCF 0.0654 0.0649 –0.2114 0.2873 0.0629
Using an independent sample t-test, the hypothesis that the average
capital structure change is zero is rejected at a 1% level of significance for all of the samples. Therefore, the samples in this study are confirmed to exhibit an overall increase in leverage following debt issuance decisions. Among the agency cost proxies, the growth opportunities of the sample debt issuers range from 0.45 to 8.17. The average (median) values of growth opportunities for the one-, two-, and three-year samples are 1.29 (1.09), 1.29 (1.07), and 1.28 (1.05), respectively. The level of managerial ownership ranges from 0% to 90% for the sample. The average (median) managerial ownership for the one-, two-, and three-year samples are 27% (25%), 28% (27%), and 28% (26%), respectively. The average (median) ownership concentration for the one-, two-, and three-year samples are 0.17 (0.13), 0.16 (0.12), and 0.16 (0.12), respectively.
Yusnidah Ibrahim et al.
80
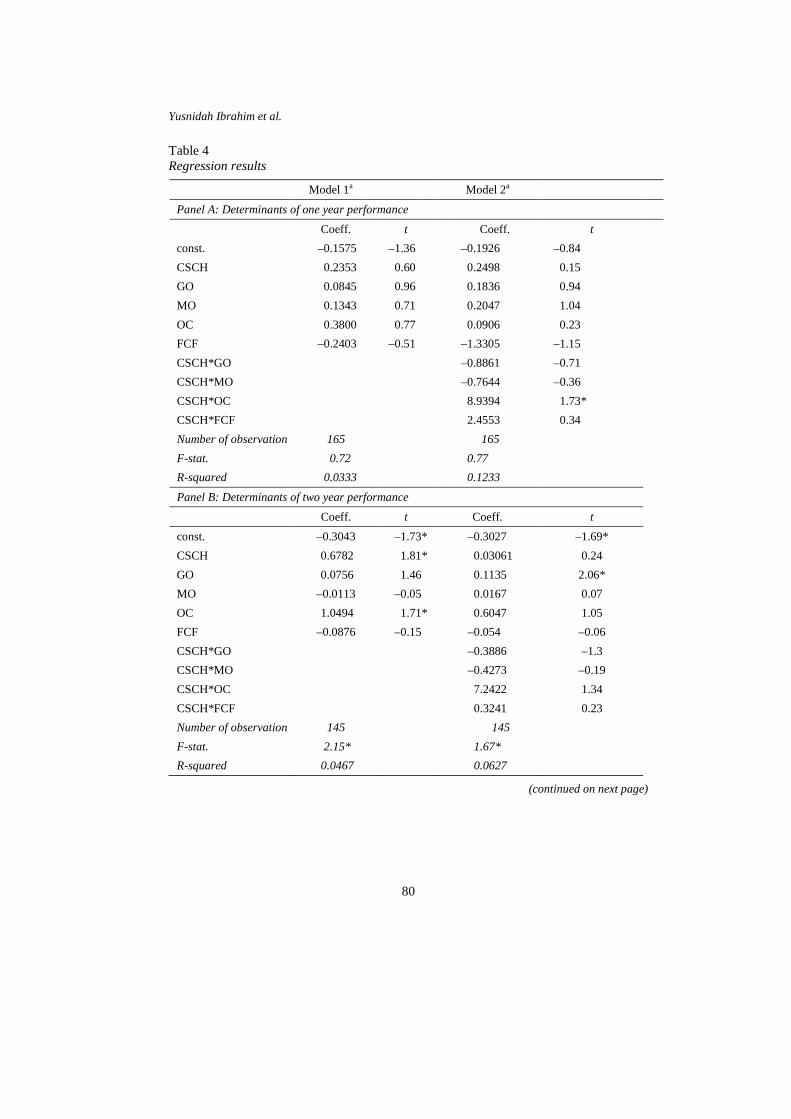
Table 4 Regression results
Model 1a Model 2a
Panel A: Determinants of one year performance Coeff. t Coeff. t const. –0.1575 –1.36 –0.1926 –0.84 CSCH 0.2353 0.60 0.2498 0.15 GO 0.0845 0.96 0.1836 0.94 MO 0.1343 0.71 0.2047 1.04 OC 0.3800 0.77 0.0906 0.23 FCF –0.2403 –0.51 –1.3305 –1.15 CSCH*GO –0.8861 –0.71 CSCH*MO –0.7644 –0.36 CSCH*OC 8.9394 1.73* CSCH*FCF 2.4553 0.34 Number of observation 165 165 F-stat. 0.72 0.77 R-squared 0.0333 0.1233 Panel B: Determinants of two year performance Coeff. t Coeff. t const. –0.3043 –1.73* –0.3027 –1.69* CSCH 0.6782 1.81* 0.03061 0.24 GO 0.0756 1.46 0.1135 2.06* MO –0.0113 –0.05 0.0167 0.07 OC 1.0494 1.71* 0.6047 1.05 FCF –0.0876 –0.15 –0.054 –0.06 CSCH*GO –0.3886 –1.3 CSCH*MO –0.4273 –0.19 CSCH*OC 7.2422 1.34 CSCH*FCF 0.3241 0.23 Number of observation 145 145 F-stat. 2.15* 1.67* R-squared 0.0467 0.0627
(continued on next page)

Agency Costs and the Long-Run Performance of Debt Issuers
81
Table 4 (continued)
Model 1a Model 2a
Panel C: Determinants of three year performance Coeff. t Coeff. t const. –0.4364 –1.42 –0.5859 –1.28 CSCH 0.8833 1.01 3.077 0.98 GO 0.1088 1.66* 0.0835 0.86 MO –0.5062 –1.66* –0.4768 –1.35 OC 1.5244 1.71* 1.422 1.16 FCF 0.6211 0.38 3.048 1.6 CSCH*GO –0.183 –0.41 CSCH*MO 1.62 0.48 CSCH*OC 0.5001 0.06 CSCH*FCF –34.9274 –2.1** Number of observation 126 126 F-stat. 2.05* 2.11** R-squared 0.0646 0.1099
aModel 1 and Model 2 are based on Equation 5 and Equation 6, respectively. The dependent variable is the BHAR in one, two, and three years following the debt issue. CSCH is the capital structure change, GO is the growth opportunity, MO is the managerial ownership, OC is the ownership concentration, and FCF is the free cash flow of the debt issuer. *, and ** indicate 10%, and 5% level of significance, respectively. The t-ratios are based on heteroscedasticity robust standard error as a remedy for the heteroscedasticity problem.
Panels A, B and C in Table 4 are used to report the regression results of the one-, two-, and three-year BHARs, respectively. Both Model 1 and Model 2 (after adding interaction terms from Model 1) are shown in the table. All of the models have been tested for heteroscedasticity using the Breusch-Pagan/ Cook-Weisberg test and for multicollinearity using variance inflation factors (VIF).
A heteroscedasticity robust standard error has been used to correct the heteroscedasticity problem. No significant multicollinearity problem is observed based on the measurements of the VIF factors for the variables in each of the models.
Consistent with the results of Panel A in Table 4, one-year performance is positively affected by interaction variable CSCH*OC at a 10% level of significance. The results of Panel B show that two-year performance is positively affected by CSCH and OC at a 10% level of significance in Model 1 but is not significantly affected by these variables in Model 2. Two-year performance is positively affected by GO at a 5% level in Model 2 but is not significantly
Yusnidah Ibrahim et al.
82
affected by this variable in Model 1. Thus, the results find evidence of the positive influence of CSCH, GO and OC on the two-year performance of a debt issuer following a debt issuance.
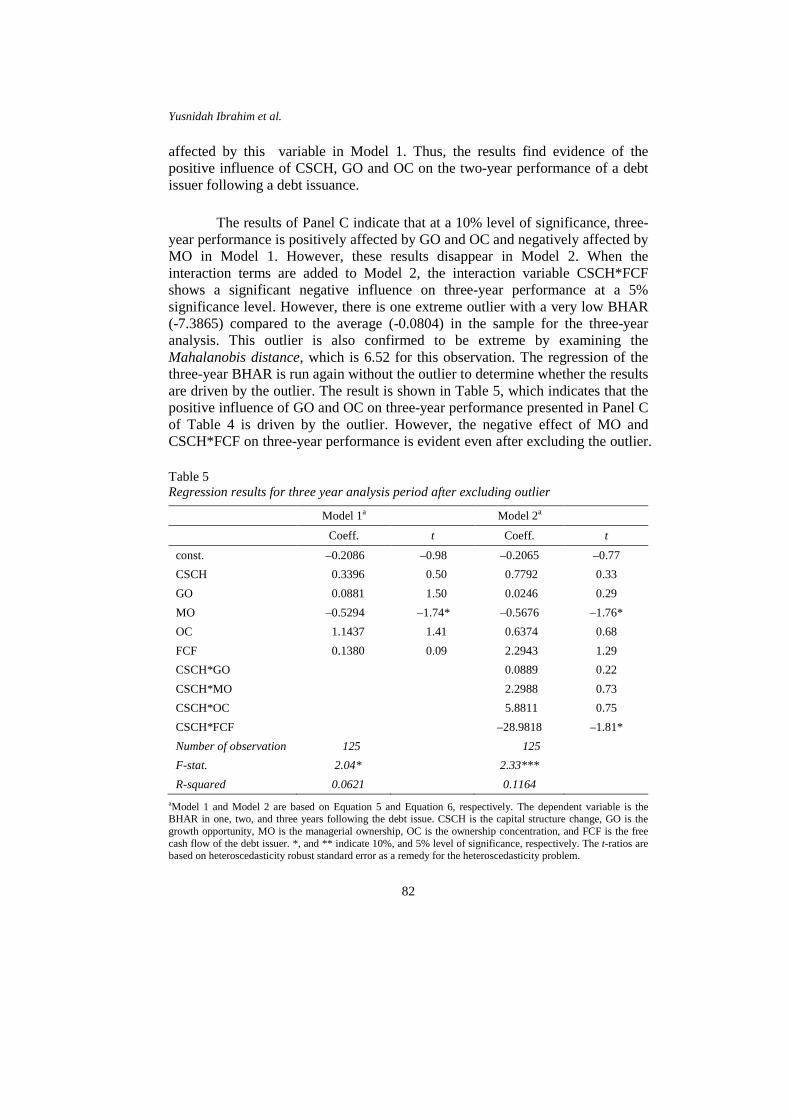
The results of Panel C indicate that at a 10% level of significance, three-year performance is positively affected by GO and OC and negatively affected by MO in Model 1. However, these results disappear in Model 2. When the interaction terms are added to Model 2, the interaction variable CSCH*FCF shows a significant negative influence on three-year performance at a 5% significance level. However, there is one extreme outlier with a very low BHAR (-7.3865) compared to the average (-0.0804) in the sample for the three-year analysis. This outlier is also confirmed to be extreme by examining the Mahalanobis distance, which is 6.52 for this observation. The regression of the three-year BHAR is run again without the outlier to determine whether the results are driven by the outlier. The result is shown in Table 5, which indicates that the positive influence of GO and OC on three-year performance presented in Panel C of Table 4 is driven by the outlier. However, the negative effect of MO and CSCH*FCF on three-year performance is evident even after excluding the outlier. Table 5 Regression results for three year analysis period after excluding outlier
Model 1a Model 2a
Coeff. t Coeff. t const. –0.2086 –0.98 –0.2065 –0.77 CSCH 0.3396 0.50 0.7792 0.33 GO 0.0881 1.50 0.0246 0.29 MO –0.5294 –1.74* –0.5676 –1.76* OC 1.1437 1.41 0.6374 0.68 FCF 0.1380 0.09 2.2943 1.29 CSCH*GO 0.0889 0.22 CSCH*MO 2.2988 0.73 CSCH*OC 5.8811 0.75 CSCH*FCF –28.9818 –1.81* Number of observation 125 125 F-stat. 2.04* 2.33*** R-squared 0.0621 0.1164
aModel 1 and Model 2 are based on Equation 5 and Equation 6, respectively. The dependent variable is the BHAR in one, two, and three years following the debt issue. CSCH is the capital structure change, GO is the growth opportunity, MO is the managerial ownership, OC is the ownership concentration, and FCF is the free cash flow of the debt issuer. *, and ** indicate 10%, and 5% level of significance, respectively. The t-ratios are based on heteroscedasticity robust standard error as a remedy for the heteroscedasticity problem.
Agency Costs and the Long-Run Performance of Debt Issuers
83
In summary, this study finds evidence that growth opportunities and ownership concentration exert a significant positive influence on long-run performance of Malaysian firms following debt issuance. On the other hand, managerial ownership is found to influence the long-run performance negatively. However, free cash flow negatively influences the long-run performance only when this variable interacts with capital structure changes. DISCUSSION AND CONCLUSION The BHAR results indicate positive long-run performance over one-, two-, and three-year periods following a debt issue. However, the positive long-run performance disappears for one- and two-year periods when the significance test of BHAR is corrected for heteroscedasticity and serial correlation problems using the method of Jegadeesh and Karceski (2009). Hence, the positive long-run performance during one- and two-year periods based on a bootstrapped skewness-adjusted t-statistic may be attributed to the lack of adjustments for heteroscedasticity and serial correlation problems. Given the drawbacks of other test statistics, the result of heteroscedasticity and serial correlation consistent t-statistics can be considered acceptable for forming the conclusion that debt issuers do not experience significant positive or negative performances during one- or two-year periods following a debt issuance, which is consistent with the findings of Spiess and Affleck-Graves (1999). However, during a three-year period, debt issuers experience significant positive performance. This finding is inconsistent with the findings for U.S. debt issuers, which either observe negative or no long-run effects on debt issuer performance after bond offerings. This disparity seems to suggest that investors underreact to debt offerings in Malaysia, which is corrected over the next three years.
Based on the regression results, there is evidence that debt issuers with high growth opportunities create significantly more wealth during two- and three-year periods, which contradicts expectations. These contradictory results can be attributed to the positive influence of the utilisation of growth opportunities and to the reduction of the free cash flow problem. The results also indicate that high growth opportunities do not intensify the agency costs of debt significantly in Malaysia.
The negative effect of managerial ownership on a three-year period of performance is consistent with the predictions of this study. This result suggests that firms with lower managerial ownership benefit more from debt issuances by mitigating agency costs of equity. However, this benefit does not appear until the third year after the debt issuance.
Yusnidah Ibrahim et al.
84
The finding regarding the positive effect of ownership concentration on one-, two-, and three-year performance supports the argument that if ownership is concentrated to a few large shareholders, the issuance of debts will improve long-run performance because creditors would monitor managerial behaviours, which helps to reduce agency costs.
Debt issuing firms with higher free cash flow and increased leverage experienced lower performance over the three-year period. However, this relationship is not evident in an analysis period of one or two years. Therefore, this study suggests that Malaysian debt issuances do not induce performance by limiting managerial discretionary use of free cash flow. Arguably, the benefit of higher financial leverage in the presence of high free cash flows should be observable even if no substitute measures for reducing agency costs are undertaken. However, Zhang (2009) provides evidence that debt and executive stock options (ESOS) are substitutes in attenuating the free cash flow problem of a firm. This study thus provides an indication that the free cash flow hypothesis may not be applicable in the presence of alternative controlling schemes for resolving agency conflicts.
This study concludes that debt-issuing firms in Malaysia outperform non-debt-issuing firms as measured by long-term shareholder wealth. A reduction in the agency costs of equity associated with dispersed ownership contribute to the superior performance of debt-issuing firms. Further study should be undertaken to investigate other sources of wealth creation in debt issuance activities, such as the tax benefits and financial distress costs. ACKNOWLEDGEMENT This research is funded by FRGS S/O code number: 11871. REFERENCES Antweiler, W., & Frank, M. Z. (2006). Do U.S. stock markets typically overreact to
corporate news stories? Working paper, University of British Columbia and University of Minnesota.
Autore, D. M., Bray, D. E., & Peterson, D. R. (2009). Intended use of proceeds and the long-run performance of seasoned equity issuers. Journal of Corporate Finance, 15, 358–367.
Barber, B. M., & Lyon, J. D. (1997). Detecting long-run abnormal stock returns: The empirical power and specification of test statistics. Journal of Financial Economics, 43, 341–372.
Bena, J., & Hanousek, J. (2008). Rent extraction by large shareholders: Evidence using dividend policy in the Czech Republic. Czech Journal of Economics and Finance, 58(3 & 4), 106–130.
Agency Costs and the Long-Run Performance of Debt Issuers
85
Bharath, S., Pasquariello, P., & Wu, G. (2009). Does asymmetric information drive capital structure decisions?. Review of Financial Studies, 22, 3211–3243.
Brown, E. (2004). Long-run performance analysis of a new sample of UK IPOs. ESE Discussion Papers no. 41. Edinburgh School of Economics, University of Edinburgh. Retrieved 25 May 2011, from http://www.econ.ed.ac.uk/ papers/ipo.pdf
Campello, M. (2006). Debt financing: Does it boost or hurt firm performance in product markets. Journal of Financial Economics, 82, 135–172.
Carpentier, C. (2006). The valuation effects of long-term changes in capital structure. International Journal of Managerial Finance, 2(1), 4–18.
Chan, K., Ikenberry, D., & Lee, I. (2004). Economic sources of gain in stock repurchases. Journal of Financial and Quantitative Analysis, 39(3), 461–479.
Chou, D, Wang, C. E., Chen, S., & Tsai, S. (2009). Earnings management and the long-run underperformance of firms following convertible bond offers. Journal of Business Finance & Accounting, 36(1) & (2), 73–98.
Coakley, J., Hadass, L., & Wood, A. (2008). Hot IPOs can damage your long-run wealth! Applied Financial Economics, 18, 1111–1120.
Datta, S., Iskandar-Datta, M., & Patel, A. (2000a). Some evidence on the uniqueness of initial public debt offerings. Journal of Finance, 55(2), 715–743.
Datta, S., Iskandar-Datta, M., & Raman, K. (2000b). Debt structure adjustments and long-run stock price performance. Journal of Financial Intermediation, 9, 427–453.
De Jong, A., Kabir, R., & Nguyen, T. T. (2008). Capital structure around the world: The roles of firm and country-specific determinants. Journal of Banking & Finance, 32(9), 1954–1969.
Deesomsak, R., Paudyal, K., & Pescetto, G. (2004). The determinants of capital structure: evidence from Asia Pacific region. Journal of Multinational Financial Management, 14, 387–405.
Dichev, I. D., & Piotroski, J. D. (1999). The performance of long-run stock returns following issues of public and private debt. Journal of Business Finance & Accounting, 26(9) & (10), 1103–1132.
Douglas, A. V. S. (2006). Capital structure, compensation and incentives. Review of Financial Studies, 19(2), 605–632.
Earle, J. S., Kucsera, C., & Telegdy, A. (2005). Ownership concentration and corporate performance on the Budapest Stock Exchange: Do too many cooks spoil the goulash? Corporate Governance: An International Review, 13(2), 254–264.
Fama, E. F., & French, K. R. (2002). Testing trade-off and pecking order predictions about dividends and debt. Review of Financial Studies, 15, 1–33.
Farinós, J. E., García, C. J., & Ibáñez, M. (2007). Is the long-run underperformance of seasoned equity issues irrational? Evidence from Spain. International Review of Financial Analysis, 16, 183–199.
Frank, M. Z., & Goyal, V. K. (2009). Capital structure decisions: Which factors are reliably important? Financial Management, 38(1), 1–37.
Gangopadhyay, P., & Yook, K. (2009). Free cash flows and the wealth effects of stock repurchase announcements (The Johns Hopkins University Carey Business School Working Paper Series, 10-01-002). The Johns Hopkins University Carey Business School, Baltimore.
Yusnidah Ibrahim et al.
86
Gombola, M., & Marciukaityte, D. (2007). Managerial overoptimism and the choice between debt and equity financing. Journal of Behavioral Finance, 8(4), 225–235.
Good, P. I. (2006). Resampling methods: A practical guide to data analysis. New York: Birkhäuser Boston.
Harris, M., & Raviv, A. (1991). The theory of capital structure. Journal of Finance, 46, 297–356.
Harvey, C. R., Lins, K. V., & Roper, A. H. (2002). The effect of capital structure when expected agency costs are extreme (Working paper). Duke University, Durham, NC.
Howe, J. S., & Lee, H. (2006). The long-run stock performance of preferred stock issuers. Review of Financial Economics, 15, 237–250.
Howton, S. D., Howton, S. W., & Perfect, S. B. (1998). The market reaction to straight debt issues: The effects of free cash flow. Journal of Financial Research, 21, 219–228.
Ibrahim, Y., & Minai, M. S. (2009). Islamic bonds and the wealth effects: Evidence from Malaysia. Investment Management and Financial Innovation, 6(1), 184–191.
Jegadeesh, N., & Karceski, J. (2009). Long-run performance evaluation: Correlation and heteroskedasticity-consistent tests. Journal of Empirical Finance, 16, 101–111.
Jensen, M. C. (1986). Agency costs of free cash flow, corporate finance, and takeovers. The American Economic Review, 76(2), 323–329.
Jensen, M. C., & Meckling, W. H. (1976). Theory of the firm: managerial behavior, agency costs and ownership structure. Journal of Financial Economics, 3, 305–360.
Jewell, J. J., & Livingston, M. B. (1997). The long-run performance of firms issuing bonds. Journal of Fixed Income, 7(2), 61–66.
Jo, H., & Kim, Y. (2008). Ethics and disclosure: a study of the financial performance of firms in the seasoned equity offerings market. Journal of Business Ethics, 80, 855–878.
Johnson, N. J. (1978). Modified t tests and confidence intervals for asymmetrical populations. Journal of the American Statistical Association, 73, 536–544.
Jung, M. (2009). Long-term equity and operating performances following straight and convertible debt issuance in the U.S. Asia-Pacific Journal of Financial Studies, 38(3), 337–374.
Khan, T. (2006). Company dividends and ownership structure: evidence from UK panel data. The Economic Journal, 116, 172–189.
Kim, J. H., & Shamsuddin, A. (2008). Are Asian stock markets efficient? Evidence from new multiple variance ratio tests. Journal of Empirical Finance, 15(3), 518–532.
Kirkos, E., Spathis, C., & Manolopoulos, Y. (2010). Audit-firm group appointment: An artificial intelligence approach. Intelligent Systems in Accounting, Finance and Management, 17(1), 1–17.
Lee, I., & Loughran, T. (1998). Performance following convertible bond issuance. Journal of Corporate Finance, 4, 185–207.
Leuz, C., Nanda, D., & Wysocki, P. D. (2003). Earnings management and investor protection: An international comparison. Journal of Financial Economics, 69(3), 505–527.
Agency Costs and the Long-Run Performance of Debt Issuers
87
Lie, E. (2002). Do firms undertake self-tender offers to optimize capital structure? The Journal of Business, 75, 609–639.
Lins, K. V. (2003). Equity ownership and firm value in emerging markets. Journal of Financial and Quantitative Analysis, 38(1), 159–184.
Lyon, J. D., Barber, B. M., & Tsai, C. L. (1999). Improved methodology for tests of long-run abnormal stock returns. Journal of Finance, 54(1), 165–201.
Mitchell, M. L., & Stafford, E. (2000). Managerial decisions and long-term stock price performance. Journal of Business, 73(3), 287–329.
Mohamad, S., Hassan, T., & Ariff, M. (2007). Research in an emerging Malaysian capital market: A guide to future direction. International Journal of Economics and Management, 1(2), 173–202.
Moshirian, F., Ng, D., & Wu, E. (2010). Model specification and IPO performance: New insights from Asia. Research in International Business and Finance, 24, 62–74.
Muradoglu, G., & Whittington, M. (2001). Predictability of UK stock returns by using debt ratios (City University Business School Faculty of Finance Working Papers No. 05), London.
Myers, S. C. (1977). Determinants of corporate borrowing. Journal of Financial Economics, 5, 147–175.
Myers, S. C. (2001). Capital structure. Journal of Economic Perspectives, 15(2), 81–102. Nor, F. M., & Sulong, Z. (2007). The interaction effect of ownership structure and board
governance on dividends: Evidence from Malaysian listed firms. Capital Market Review, 15, 73–101.
Opler, T., & Titman, S. (1993). The determinants of leveraged buyout activity: Free cash flow vs. financial distress costs. Journal of Finance, 48(5), 1985–1999.
Ozkan, A. (2001). Determinants of capital structure and adjustment to long run target: Evidence from UK company panel data. Journal of Business Finance & Accounting, 28(1) & (2), 175–198.
Ritter, J. R. (1991). The long-run performance of initial public offerings. Journal of Finance, 46, 3–27.
Spiess, D. K., & Affleck-Graves, J. (1999). The long-run performance of stock returns following debt offerings. Journal of Financial Economics, 54, 45–73.
Sutton, C. D. (1993). Computer-intensive methods for tests about the mean of an asymmetrical distribution. Journal of the American Statistical Association, 88, 802–810.
Titman, S., & Wessels, R. (1988). The determinants of capital structure choice. The Journal of Finance, 43(1), 1–19.
Wu, C., & Kwok, C. C. Y. (2007). Long-run performance of global versus domestic initial public offerings. Journal of Banking & Finance, 31, 609–627.
Yip, Y., Su, Y., & Ang, J. B. (2009). Effects of underwriters, venture capital and industry on long-term initial public offering performance. Managerial Finance, 35(8), 700–715.
Yu, Y. M., & Jiang, S. (2010). Corporate life cycle and share repurchases: Evidence from the Taiwan Stock Market. African Journal of Business Management, 4(14), 3139–3149.
Zhang, Y. (2009). Are debt and incentive compensation substitutes in controlling the free cash flow agency problem? Financial Management, 38(3), 507–541.