The cyclically adjusted budget balance in EU fiscal policymaking
Upload
independentCategory
view
4download
0
Kidney Cancer
Age-Adjusted Incidence, Mortality, and Survival Rates of
Stage-Specific Renal Cell Carcinoma in North America:
A Trend Analysis
Maxine Sun a,*,1, Rodolphe Thuret a,b,1, Firas Abdollah a,c, Giovanni Lughezzani a,c,Jan Schmitges d, Zhe Tian a, Shahrokh F. Shariat e, Francesco Montorsi c,Jean-Jacques Patard f, Paul Perrotte g, Pierre I. Karakiewicz a,g
a Cancer Prognostics and Health Outcomes Unit, University of Montreal Health Center, Montreal, Canadab Department of Urology, University of Montpellier Health Center, Montpellier, Francec Department of Urology, Vita Salute San Raffaele University, Milan, Italyd Martiniclinic, University Medical Center Hamburg-Eppendorf, Hamburg, Germanye Department of Urology, Weill Medical College of Cornell University, New York, New York, USAf Department of Urology, Kremlin-Bicetre University, Kremlin-Bicetre, Franceg Department of Urology, University of Montreal Health Center, Montreal, Canada
E U R O P E A N U R O L O G Y 5 9 ( 2 0 1 1 ) 1 3 5 – 1 4 1
ava i lable at www.sciencedirect .com
journal homepage: www.europeanurology.com
Article info
Article history:Accepted October 13, 2010Published online ahead ofprint on October 28, 2010
Keywords:
Incidence
Mortality
Survival
Epidemiology
Renal cell carcinoma
Abstract
Background: The rising incidence of renal cell carcinoma (RCC) has been largely attributed
to the increasing use of imaging procedures.
Objective: Our aim was to examine stage-specific incidence, mortality, and survival trends
of RCC in North America.
Design, setting, and participants: We computed age-adjusted incidence, survival, and
mortality rates using the Surveillance Epidemiology and End Results database. Between
1988 and 2006, 43 807 patients with histologically confirmed RCC were included.
Measurements: We calculated incidence, mortality, and 5-yr survival rates by year.
Reported findings were stratified according to disease stage.
Results and limitations: Age-adjusted incidence rate of RCC rose from 7.6 per 100 000
person-years in 1988 to 11.7 in 2006 (estimated annual percentage change [EAPC]: +2.39%;
p < 0.001). Stage-specific age-adjusted incidence rates increased for localized stage: 3.8 in
1988 to 8.2 in 2006 (EAPC: +4.29%; p < 0.001) and decreased during the same period for
distant stage: 2.1 to 1.6 (EAPC:�0.57%; p = 0.01). Stage-specific survival rates improved over
time for localized stage but remained stable for regional and distant stages. Mortality rates
varied significantly over the study period among localized stage, 1.3 in 1988 to 2.4 in 2006
(EAPC: +3.16%; p < 0.001), and distant stage, 1.8 in 1988 to 1.6 in 2006 (EAPC: �0.53%;
p = 0.045). Better detailed staging information represents a main limitation of the study.
Conclusions: The incidence rates of localized RCC increased rapidly, whereas those of distant
RCC declined. Mortality rates significantly increased for localized stage and decreased for
distant stage. Innovation in diagnosis and management of RCC remains necessary.
# 2010 European Association of Urology. Published by Elsevier B.V. All rights reserved.
1 Both authors contributed* Corresponding author. CHealth Center, 1058, rue St-Fax: +1 514 227 5103.E-mail address: mcw.sun@
0302-2838/$ – see back matter # 2010 European Association of Urology. Publis
equally.ancer Prognostics and Health Outcomes Unit, University of MontrealDenis, Montreal, Quebec, Canada, H2X 3J4. Tel. +1 514 890 8000x35335;
umontreal.ca (M. Sun).
hed by Elsevier B.V. All rights reserved. doi:10.1016/j.eururo.2010.10.029
E U R O P E A N U R O L O G Y 5 9 ( 2 0 1 1 ) 1 3 5 – 1 4 1136
1. Introduction
Kidney cancer accounts for approximately 4.0% of cancer
incidence and 2.3% of cancer morality in the United States,
with an estimated 57 760 new cases and 12 980 new deaths
as of 2009 [1]. Most adult kidney cancers that originate from
the renal parenchyma are renal cell carcinomas (RCCs). The
incidence of RCC has varied significantly over the last two
decades worldwide [2–5]. In general, incidence rates of RCC
are higher among men and persons of African American
descent [4–6].
Due to the widespread use of cross-sectional imaging in
contemporary practices, incidental diagnoses of small renal
masses have become frequent radiologic findings [7]. In
temporal trend analyses, RCC stage-specific incidence rates
support this observation, where the greatest increase across
RCC tumor stages over time are among stage I (localized)
tumors [2,4–6]. Trend analyses in survival have also
improved over time [4,5].
Although these results are highly encouraging, it may be
argued that measures of incidence and/or survival may not
be enough to indicate progress against RCC. The reported
incidence of a disease may often merely reflect changing
patterns in diagnosis and increasing activity of screening
[8–11]. Similarly, survival rates may also be flawed due to
the inclusion of patients with less malignant and benign
tumors, which creates a lead-time bias [8–11].
Several investigators support the use of age-adjusted
mortality rates as a basic measure of progress against cancer
[2,5,8–12]. Existing trend analyses reporting on mortality
rates for RCC are scarce. Those who have reported detected
an important increase in mortality rates over time [2].
Unfortunately, a crucial oversight in the selection criteria of
that study may have precluded the relevance of their
findings [13]. Other investigators also examined the
mortality rates and reported an increase across all race
and sex groups over time [5]. However, the study period
covered in that study (1975–1995) is outdated.
To address the limitations just described, we sought to
reevaluate the age-adjusted incidence, mortality, and 5-yr
survival rates of stage-specific RCC in North America using
the Surveillance Epidemiology and End Results (SEER)
database of the National Cancer Institute (NCI) program.
2. Methods
2.1. Patient population
Relying on 17 registries from the SEER database, we identified persons
diagnosed with renal cell carcinoma from 1988 to 2006. The SEER
database, as part of the NCI program, routinely collects patient
demographics and publishes cancer incidence and survival data from
population-based cancer registries covering approximately 10% of the
US population up to the year 2000, and 26% from that time on [14].
The study included histologically confirmed cases of invasive cancers
of the kidney parenchyma or kidney, not otherwise specified (Interna-
tional Classification of Disease for Oncology, Second Edition [ICD-O-2] side
code: C64.9). Case ascertainment was 96% for cancers diagnosed in
hospitals situated within the areas covered by the SEER program [15].
Patients underwent surgical intervention, local tumor destruction,
observation, or unknown treatment type. Tumor stage was defined
using the historic SEER staging system, which classifies tumors as in situ
(noninvasive, intraepithelial), localized (invasive cancer confined to the
kidney cortex and/or medulla), regional (lymph node involvement),
distant (metastasis), or unstaged (unknown).
For the purpose of the study, renal pelvic tumors identified with
histologic codes for transitional cell, squamous cell, or papillary
carcinoma (ICD-O-2 code: 8050–8130) were excluded from the study.
In situ and unstaged disease cases were also removed. Analyses were
restricted to patients diagnosed at �18 yr of age.
2.2. Statistical analyses
Annual RCC incidence (new RCC diagnoses/population that year) and
incidence-based mortality (number of RCC-specific mortality/popula-
tion at risk) were age adjusted to the 2000 US standard population. Age-
adjusted rates represent a weighted average of the age-specific rates in
which the weights are the proportions of persons in the corresponding
age groups of the standard population. Age-adjusted rates reduce the
potential confounding effect of age. The 5-yr cancer-specific survival
rates (proportion of patients alive at the time specified) were calculated.
Temporal trends of age-adjusted rates were quantified using the
estimated annual percentage change (EAPC) with the least squares
linear regression [16]. Linear regression models were fitted to assess the
statistical significance of 5-yr survival rates over time. All trend analyses
(1988–2006) were stratified according to disease stage: localized versus
regional versus distant. Figures depicting the age-adjusted incidence and
mortality trends were prepared by plotting the rates against a logarithm
scale on the y-axis so rates of change could be visually compared [17].
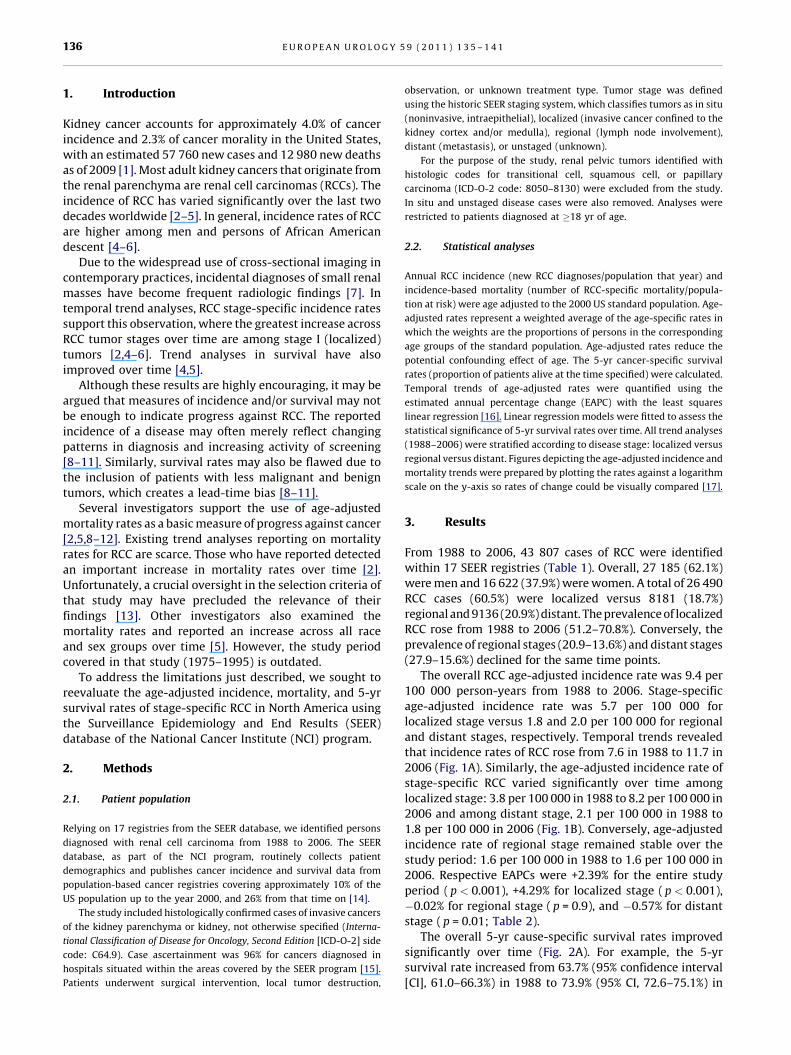
3. Results
From 1988 to 2006, 43 807 cases of RCC were identified
within 17 SEER registries (Table 1). Overall, 27 185 (62.1%)
were men and 16 622 (37.9%) were women. A total of 26 490
RCC cases (60.5%) were localized versus 8181 (18.7%)
regional and 9136 (20.9%) distant. The prevalence of localized
RCC rose from 1988 to 2006 (51.2–70.8%). Conversely, the
prevalence of regional stages (20.9–13.6%) and distant stages
(27.9–15.6%) declined for the same time points.
The overall RCC age-adjusted incidence rate was 9.4 per
100 000 person-years from 1988 to 2006. Stage-specific
age-adjusted incidence rate was 5.7 per 100 000 for
localized stage versus 1.8 and 2.0 per 100 000 for regional
and distant stages, respectively. Temporal trends revealed
that incidence rates of RCC rose from 7.6 in 1988 to 11.7 in
2006 (Fig. 1A). Similarly, the age-adjusted incidence rate of
stage-specific RCC varied significantly over time among
localized stage: 3.8 per 100 000 in 1988 to 8.2 per 100 000 in
2006 and among distant stage, 2.1 per 100 000 in 1988 to
1.8 per 100 000 in 2006 (Fig. 1B). Conversely, age-adjusted
incidence rate of regional stage remained stable over the
study period: 1.6 per 100 000 in 1988 to 1.6 per 100 000 in
2006. Respective EAPCs were +2.39% for the entire study
period ( p < 0.001), +4.29% for localized stage ( p < 0.001),
�0.02% for regional stage ( p = 0.9), and �0.57% for distant
stage ( p = 0.01; Table 2).
The overall 5-yr cause-specific survival rates improved
significantly over time (Fig. 2A). For example, the 5-yr
survival rate increased from 63.7% (95% confidence interval
[CI], 61.0–66.3%) in 1988 to 73.9% (95% CI, 72.6–75.1%) in

Table 1 – Overall and stage-specific distribution of renal cell carcinoma within the US Surveillance Epidemiology and End Results, 1988–2006
SEER stage
Overall Localized Regional Distant
No. of patients (%) 43 807 (100.0) 26 490 (60.5) 8181 (18.7) 9136 (20.9)
Gender, No. (%)
Male 27 185 15 925 (58.6) 5386 (19.8) 5874 (21.6)
Female 16 622 10 565 (63.6) 2795 (16.8) 3262 (19.6)
Race, No. (%)
White 36 670 22 001 (60.0) 6984 (19.0) 7685 (21.0)
Black 4354 2870 (65.9) 604 (13.9) 880 (20.2)
Other 2783 1619 (58.2) 593 (21.3) 571 (20.5)
Year of diagnosis, No. (%)
1988 1584 811 (51.2) 331 (20.9) 442 (27.9)
1989 1667 859 (51.5) 371 (22.3) 437 (26.2)
1990 1708 887 (51.9) 401 (23.5) 420 (24.6)
1991 1791 956 (53.4) 383 (21.4) 452 (25.2)
1992 1870 1003 (53.6) 430 (23.0) 437 (24.4)
1993 1887 1032 (54.7) 425 (22.5) 430 (22.8)
1994 2010 1141 (56.8) 413 (20.5) 456 (23.7)
1995 2034 1157 (56.9) 402 (19.8) 475 (23.4)
1996 2153 1200 (55.7) 451 (20.9) 502 (23.3)
1997 2078 1200 (57.7) 384 (18.5) 494 (23.8)
1998 2267 1343 (59.7) 419 (18.5) 499 (22.0)
1999 2246 1342 (59.8) 448 (19.9) 456 (20.3)
2000 2610 1605 (61.5) 474 (18.2) 531 (20.3)
2001 2686 1728 (64.3) 434 (16.2) 524 (19.5)
2002 2757 1780 (64.6) 469 (17.0) 508 (18.4)
2003 2910 1912 (65.7) 449 (15.4) 549 (18.9)
2004 2983 1984 (66.5) 511 (17.1) 488 (16.4)
2005 3205 2164 (67.5) 529 (16.5) 512 (16.0)
2006 3361 2380 (70.8) 457 (13.6) 524 (15.6)
Row percentages are listed
E U R O P E A N U R O L O G Y 5 9 ( 2 0 1 1 ) 1 3 5 – 1 4 1 137
2002 ( p < 0.001). The stage-specific 5-yr cause-specific
survival rates improved over time for localized stage
(Fig. 2B): 91.7% (95% CI, 89.3–93.6%) in 1988 to 92.8% (95%
CI, 91.5–93.9%) in 2002 ( p = 0.01). In contrast, the 5-yr
survival rates remained unchanged for regional stage: 63.7%
(95% CI, 57.6–69.1%) in 1988 to 64.2% (95% CI, 61.0–67.1%) in
2001 ( p = 0.2) and for distant stage: 12.1% (95% CI, 8.8–16.0%)
in 1988 to 11.9% (95% CI, 10.0–14.0%) in 2001 ( p = 0.6).
Overall age-adjusted mortality rate was 4.7 per 100 000
for the entire study period. Stage-specific mortality rate was
1.8 per 100 000 for localized stage versus 1.1 and 1.8 per 100
000 for regional and distant stages, respectively. The age-
adjusted mortality rates for RCC of all stages (Fig. 3A)
Table 2 – Age-standardized incidence and mortality rates of renal cell c
No. of cases Incidencey EAPC, % (95% CI)
Overall
All stages 43 807 9.4 +2.39 (2.13, 2.66)
Stage specific
Localized 26 490 5.7 +4.29 (3.93, 4.65)
Regional 8181 1.8 �0.02 (�0.54, 0.49)
Distant 9136 2.0 �0.57 (�0.95, �0.18)
CI = confidence interval; EAPC = estimated annual percentage change.* Stratified according to disease stage within the US Surveillance Epidemiology ay Rates were age adjusted to the US standard population.
increased slightly from 1988 (4.4 per 100 000) to 2001 (5.2
per 100 000) and stabilized in 2006 (4.8 per 100 000).
Overall age-adjusted mortality rates for RCC of localized
stage increased over the study period: 1.3 per 100 000 in
1988 to 2.4 per 100 000 in 2006. In comparison, mortality
rates for RCC of distant stage decreased in a significant
fashion over time: 1.8 per 100 000 in 1988 to 1.6 per 100
000 in 2006. Finally, mortality rates for regional stage
remained unchanged: 1.0 per 100 000 in 1988 to 0.8 per 100
000 in 2006. The EAPCs for RCC of all stages, localized,
regional, and distant, respectively, were +0.78% ( p < 0.001),
+3.16% ( p < 0.001), �0.46% ( p = 0.2), and �0.53%
( p = 0.045; Table 2).
arcinoma and corresponding estimated annual percentage changes*
p Mortalityy EAPC, % (95% CI) p
<0.001 4.7 +0.78 (0.46–1.10) <0.001
<0.001 1.8 +3.16 (2.77, 3.56) <0.001
0.9 1.1 �0.46 (�1.07, �0.07) 0.2
0.01 1.8 �0.53 (�1.02, �0.04) 0.045
nd End Results, 1988–2006.

[()TD$FIG]
Fig. 1 – Age-adjusted incidence rates of renal cell carcinoma (RCC) of (A) all stages and (B) stratified according to disease stage, US SurveillanceEpidemiology and End Results database, 1988–2006. Closed circles = overall incidence; open circles = incidence of localized RCC; upside-downtriangles = incidence of distant RCC; squares = incidence of regional RCC.
E U R O P E A N U R O L O G Y 5 9 ( 2 0 1 1 ) 1 3 5 – 1 4 1138
4. Discussion
Previous studies demonstrated an increase in the incidence
of RCC and attributed it to the result of increasing
incidentally detected tumors [2,4–6]. Indeed, with the
increase in the use of cross-sectional imaging, small renal
masses have become common radiologic findings [18]. It is
estimated that approximately 13–27% of abdominal imag-
ing studies incidentally identify a renal lesion [19,20]. Most
of these lesions represent small cysts that do not require
any treatment. With the rise in incidence of localized RCC,
trend analyses in survival also demonstrated significant
improvements over time [4–6]. Although these results are
highly encouraging, the use of such measures may be
inappropriate due to its associated biases (ie, lead-time bias,
changes in diagnosis) [8,12]. In contrast, age-adjusted
mortality rates represent a more valid assessment of
progress against the disease [8,12].
Studies that investigated age-adjusted mortality rates in
RCC are scarce [2,5]. One reported on rising mortality rates
(1.6 per 100 000 in 1983 to 6.5 per 100 000 in 2001) using
data from the SEER program [2]. However, rates reported in
that study may be misleading due to an oversight in the
selection criteria that artificially inflated the mortality rates
[13]. After reassessment, the increases in mortality were
much less remarkable: 4.6 per 100 000 in 1983 to 6.8 per
100 000 in 2001 [13]. In another study, Chow et al also
reported an increase in mortality rates between 1975 and
1995 [5]. However, these results may have changed in the
21st century. Consequently, we reevaluated the RCC stage-
specific, age-adjusted incidence, mortality, and 5-yr cause-
specific survival rates using contemporary data.
Our results indicated an increase in the overall incidence
of RCC (EAPC: +2.39%; p < 0.001), which was mainly the
consequence of a remarkable rise in the incidence of
localized RCC from 1988 to 2006 (EAPC: +4.29%; p < 0.001).
Interestingly, the incidence rates of distant stage signifi-
cantly decreased over time (EAPC: �0.57%; p = 0.01),
whereas those of regional stage remained unchanged.
The overall 5-yr survival rates significantly improved over
time ( p < 0.001). However, when assessing stage-specific
survival rates, results showed that those of localized RCC
largely drove the observed survival improvements. Con-
versely, the survival rates within regional and distant RCC
remained unchanged over time. Finally, the overall age-
adjusted mortality rates increased over the study period
(EAPC: +0.78%; p < 0.001). When stratifying according to
disease stage, mortality rates of localized RCC significantly
increased (EAPC: +3.16%; p < 0.001); those of distant RCC
significantly decreased (EAPC:�0.53%; p = 0.045) over time.

[()TD$FIG]
Fig. 2 – Five-year cause-specific survival rates for patients with renal cellcarcinoma (RCC) of (A) all stages and (B) stratified according to diseasestage, US Surveillance Epidemiology and End Results database, 1988–2006. Closed circles = RCC of all stages; open circles = localized RCC;upside-down triangles = distant RCC; squares = regional RCC. The 95%confidence intervals are represented by vertical bars.
E U R O P E A N U R O L O G Y 5 9 ( 2 0 1 1 ) 1 3 5 – 1 4 1 139
In contrast, mortality rates of regional stage were un-
changed.
These findings corroborate previous reports where
stage-specific trends support the observation that an
increasing number of RCC tumors are being diagnosed at
a localized stage [2,4–6]. Indeed, between 48% and 66% of all
renal tumors that are diagnosed represent small renal
masses [21,22]. Previous reports suggest that this phenom-
enon may be indicative of overdiagnosis [11,23].
Overdiagnosis is often difficult to assess for each
individual but easily detectable in population-based analy-
ses. It is crucial to recognize that cancer overdiagnosis
reflects the ability to technologically advance the time of
diagnosis to a tumor’s presymptomatic stage. However, this
does not necessarily translate into efficacy of treatment
[11,12,23]. Overdiagnosis has played a role in the soaring
health care costs in the United States [23]. For example, in
patients with small renal masses who undergo active
surveillance, which involves the monitoring of tumor size
by means of serial ultrasonography, computed tomography,
or magnetic resonance imaging [24], the typical recom-
mendation is to perform repeat imaging at intervals of 6–12
mo [18]. One should consider the financial costs of serial
imaging, not to mention the risks associated with radiation
from serial CT scanning [25]. Currently it is estimated that
approximately $1.9 billion is spent in the United States
annually on the treatment of kidney cancer [26]. It may be
postulated that overdiagnosed patients are unable to
benefit from unnecessary treatment, and it may even cause
harm [11].
The rise in incidence, mortality, and survival rates in
localized RCC cases merely signify that more cases are
detected at an earlier stage. Unfortunately, it does not
represent proof of efficacy for early treatment [11,12,23].
When early treatment is effective, patients live longer to an
older age and mortality decreases. When early treatment is
not as effective, patients die at the same age and mortality
remains unchanged. This phenomenon has been observed
in other tumor sites [27–30]. It is also possible that
overtreatment of small renal masses also affected the
current series. For example, excessive cancer-specific or
other-cause mortality in patients treated with radical
nephrectomy has been observed previously [31,32]. In-
creasing incidence may often be associated with slightly
increasing mortality rates. The advancement of new
diagnostic modalities is known to affect the coding of the
primary cause of death. Therefore, following the advent of
these technological improvements, the diagnosis is more
frequently considered the primary cause of death in highly
prevalent malignancies, even if death may have been due to
another cause. Finally, improved 5-yr survival rates often
reflect the effect of lead-time or length-time biases. In the
context of RCC, the duration of survival was improved
overall. When survival rates were stratified according to
disease stage, improvements were only recorded among
localized RCC stage and not among regional or distant
stages. It may be argued that both biases contributed to this
observation and that the progress in survival may have been
a mere reflection of earlier diagnoses [23].
The observations just described are commonly associat-
ed with the overdiagnosis phenomenon [11], which may be
explained by physicians’ motivation to prevent disease
progression and death, as well as patients’ fear of cancer.
However, this early detection is not always better.
Improvements in the specificity of diagnostics and innova-
tion in management of RCC are clearly needed [9].
Our findings also demonstrated a significant decrease in
the incidence rate of distant RCC over time. This favorable
phenomenon could not be adequately examined in previous
studies due to an insufficient length of follow-up [4]. Our
report represents the first formal confirmation of this
improvement. The change in incidence rates of distant stage
is consistent with the reports of stage migration that other
investigators have described [33]. The change in mortality
rates of distant stage may be explained by the usual
decrease in mortality rates that is heralded by a decrease in
incidence rates [8]. However, it cannot be rejected that
improvements in the treatment of advanced RCC may also
have contributed to this phenomenon.
Our study is not devoid of limitations. As in all
epidemiologic research relying on the SEER database, the

[()TD$FIG]
Fig. 3 – Age-adjusted mortality rates of renal cell carcinoma (RCC) of (A) all stages and (B) stratified according to disease stage, US SurveillanceEpidemiology and End Results database, 1988–2006. Closed circles = RCC of all stages; open circles = localized RCC; upside-downtriangles = distant RCC; squares = regional RCC.
E U R O P E A N U R O L O G Y 5 9 ( 2 0 1 1 ) 1 3 5 – 1 4 1140
exclusion of patients with missing data, lack of more
detailed information on staging, and nonstandardized
histopathologic review represent important potential
biases that may have affected the current findings.
5. Conclusions
Taken together, our findings strongly indicate changes in
the diagnosis of RCC over time. Unfortunately, the rising
incidence was not accompanied by decreasing mortality
rates over time. Although RCC is detected at an earlier stage,
early treatment efficacy was not shown. Future age-
adjusted analyses on RCC incidence and mortality rates
are needed to confirm or refute the current trends.
Author contributions: Maxine Sun had full access to all the data in the
study and takes responsibility for the integrity of the data and the
accuracy of the data analysis.
Study concept and design: Sun, Thuret, Abdollah, Lughezzani.
Acquisition of data: Sun.
Analysis and interpretation of data: Sun, Tian.
Drafting of the manuscript: Sun, Karakiewicz.
Critical revision of the manuscript for important intellectual content:
Thuret, Abdollah, Schmitges, Patard.
Statistical analysis: Sun, Tian.
Obtaining funding: Perrotte, Karakiewicz.
Administrative, technical, or material support: Perrotte, Karakiewicz.
Supervision: Karakiewicz, Patard, Shariat, Montorsi.
Other (specify): None.
Financial disclosures: I certify that all conflicts of interest, including
specific financial interests and relationships and affiliations relevant to the
subject matter or materials discussed in the manuscript (eg, employment/
affiliation, grants or funding, consultancies, honoraria, stock ownership or
options, expert testimony, royalties, or patents filed, received, or pending),
are the following: Pierre I. Karakiewicz is partially supported by the
University of Montreal Health Center Urology Specialists, Fonds de la
Recherche en Sante du Quebec, the University of Montreal Department of
Surgery, and the University of Montreal Health Center (CHUM) Foundation.
Funding/Support and role of the sponsor: None.
References
[1] Jemal A, Siegel R, Ward E, et al. Cancer statistics, 2009. CA Cancer J
Clin 2009;59:225–49.
[2] Hollingsworth JM, Miller DC, Daignault S, et al. Rising incidence of
small renal masses: a need to reassess treatment effect. J Natl
Cancer Inst 2006;98:1331–4.
[3] Mathew A, Devesa SS, Fraumeni JF, et al. Global increases in kidney
cancer incidence, 1973–1992. Eur J Cancer Prev 2002;11:171–8.
[4] Chow W-H, Devesa SS. Contemporary epidemiology of renal cell
cancer. Cancer J 2008;14:288–301.
[5] Chow WH, Devesa SS, Warren JL, et al. Rising incidence of renal cell
cancer in the United States. JAMA 1999;281:1628–31.
E U R O P E A N U R O L O G Y 5 9 ( 2 0 1 1 ) 1 3 5 – 1 4 1 141
[6] Chow W-H, Dong LM, Devesa SS. Epidemiology and risk factors for
kidney cancer. Nat Rev Urol 2010;7:245–57.
[7] Gill IS, Aron M, Gervais DA, et al. Small renal mass. N Engl J Med
2010;362:624–34.
[8] Measurement of progress against cancer. Extramural Committee to
Assess Measures of Progress Against Cancer. J Natl Cancer Inst 1990;
82:825–35.
[9] Esserman L, Thompson I. Solving the overdiagnosis dilemma. J Natl
Cancer Inst 2010;102:582–3.
[10] Bailar JC, Gornik HL. Cancer undefeated. N Engl J Med 1997;336:
1569–74.
[11] Welch HG, Black WC. Overdiagnosis in cancer. J Natl Cancer Inst
2010;102:605–13.
[12] Welch HG, Schwartz LM, Woloshin S. Are increasing 5-year survival
rates evidence of success against cancer? JAMA 2000;283:2975–8.
[13] Chow W-H, Linehan WM, Devesa SS. Re: Rising incidence of small
renal masses: a need to reassess treatment effect. J Natl Cancer Inst
2007;99:569–70, author reply 570–1.
[14] About SEER. Surveillance Epidemiology and End Results Web site.
http://seer.cancer.gov/about/.
[15] Zippin C, Lum D, Hankey B. Completeness of hospital cancer case
reporting from the SEER program of the National Cancer Institute.
Cancer 1995;76:2343–50.
[16] Kim H, Fay M, Feuer E, et al. Permutation tests for joinpoint regression
with applications to cancer rates. Stat Med 2000;19:335–51.
[17] Devesa SS, Donaldson J, Fears T. Graphical presentation of trends in
rates. Am J Epidemiol 1995;141:300–4.
[18] Jewett MAS, Zuniga A. Renal tumor natural history: the rationale
and role for active surveillance. Urol Clin North Am 2008;35:
627–34, vii.
[19] Hara A, Johnson C, MacCarty R, et al. Incidental extracolonic find-
ings at CT colonography. Radiology 2000;215:353–7.
[20] Tada S, Yamagishi J, Kobayashi H, et al. The incidence of simple
renal cyst by computed tomography. Clin Radiol 1983;34:437–9.
[21] Nguyen MM, Gill I, Ellison L. The evolving presentation of renal
carcinoma in the United States: trends from the Surveillance,
Epidemiology, and End Results program. J Urol 2006;176:2397–
400.
[22] Lee C, Katz J, Shi W, et al. Surgical management of renal tumors
4 cm. or less in a contemporary cohort. J Urol 2000;163:730–6.
[23] Black WC. Randomized clinical trials for cancer screening: rationale
and design considerations for imaging tests. J Clin Oncol 2006;24:
3252–60.
[24] Volpe A, Jewett MAS. The role of surveillance for small renal masses.
Nat Clin Pract Urol 2007;4:2–3.
[25] Brenner D, Hall E. Computed tomography—an increasing source of
radiation exposure. N Engl J Med 2007;357:2277–84.
[26] Brown M, Riley G, Schussler N, et al. Estimating health care costs
related to cancer treatment from SEER-Medicare data. Med Care
2002;40(Suppl 2), IV104-17.
[27] Zackrisson S, Andersson I, Janzon L, et al. Rate of overdiagnosis of
breast cancer 15 years after end of Malmo mammographic screen-
ing trial: follow-up study. BMJ 2006;332:689–92.
[28] Andriole GL, Crawford ED, Grubb RL, et al. Mortality results from a
randomized prostate-cancer screening trial. N Engl J Med 2009;
360:1310–9.
[29] Fontana R, Sanderson D, Woolner L, et al. Screening for lung cancer. A
critique of the Mayo Lung Project. Cancer 1991;67(Suppl):1155–64.
[30] Schroder FH, Hugosson J, Roobol MJ, et al. Screening and prostate-
cancer mortality in a randomized European study. N Engl J Med
2009;360:1320–8.
[31] Zini L, Perrotte P, Capitanio U, et al. Radical versus partial nephrec-
tomy: effect on overall and noncancer mortality. Cancer 2009;115:
1465–71.
[32] Thompson RH, Boorjian SA, Lohse CM, et al. Radical nephrectomy
for pT1a renal masses may be associated with decreased overall
survival compared with partial nephrectomy. J Urol 2008;179:
468–71, discussion 472–3.
[33] Patil S, Ishill N, Deluca J, et al. Stage migration and increasing
proportion of favorable-prognosis metastatic renal cell carcinoma
patients: implications for clinical trial design and interpretation.
Cancer 2010;116:347–54.
Copyright © 2022 FDOKUMEN


![[2021] 45 IAC 3.1 Adjusted Gross Income Tax - IN.gov](https://static.fdokumen.com/doc/165x107/631ecbe61aedb9cd850feba1/2021-45-iac-31-adjusted-gross-income-tax-ingov.jpg)