Afya Ziwani - PDF Server
79
i Afya Ziwani SEMIANNUAL PROGRESS REPORT (JANUARY–MARCH 2020) AWARD/CONTRACT No: AID-615-C-17-00002 Adolescent girls and young women attending a sensitization session on COVID-19 at a safe space hosted in a local administration’s compound in Kisumu County on April 5,2020. Photo: PATH.
-
Upload
khangminh22 -
Category
Documents
-
view
2 -
download
0
Transcript of Afya Ziwani - PDF Server

i
Afya Ziwani
SEMIANNUAL PROGRESS REPORT
(JANUARY–MARCH 2020)
AWARD/CONTRACT No: AID-615-C-17-00002
Adolescent girls and young women attending a sensitization session on COVID-19 at a safe space hosted in a local
administration’s compound in Kisumu County on April 5,2020. Photo: PATH.

ii
Afya Ziwani
SEMIANNUAL PROGRESS REPORT
(JANUARY–MARCH 2020) Prepared for Dr. Stanley Bii US Agency for International Development/Kenya c/o American Embassy United Nations Avenue, Gigiri PO Box 629, Village Market Nairobi 00621 Kenya Prepared by PATH’s Country Office in Kenya ACS Plaza, 4th Floor Lenana and Galana Road PO Box 76634 Nairobi 00100 Kenya DISCLAIMER
The authors’ views expressed in this report do not necessarily reflect the views of the US Agency for International Development or the US Government.

iii
Contents
Abbreviations ................................................................................................................................................ v
List of tables ................................................................................................................................................. vii List of figures ................................................................................................................................................. x Executive summary ....................................................................................................................................... 1
Overview ................................................................................................................................................... 1 Prevention ................................................................................................................................................. 1
HIV testing services................................................................................................................................... 3 Antiretroviral therapy ................................................................................................................................. 4
Viral load services ..................................................................................................................................... 4 TB/HIV ....................................................................................................................................................... 5 Prevention of mother-to-child transmission of HIV .................................................................................... 5 Early infant diagnosis ................................................................................................................................ 5
Key achievements ......................................................................................................................................... 7 1. High-priority population intervention: Adolescent girls and young women ........................................... 7 2. High-priority population intervention: Fisherfolk .................................................................................. 13
3. Voluntary medical male circumcision .................................................................................................. 15 4. Pre-exposure prophylaxis ................................................................................................................... 17
5. HIV testing services ............................................................................................................................ 18 6. HIV care and treatment ....................................................................................................................... 24 7. Laboratory support .............................................................................................................................. 33
8. TB/HIV ................................................................................................................................................. 34
9. Elimination of mother-to-child transmission of HIV ............................................................................. 37 10. Commodity security ........................................................................................................................... 45 11. Health systems strengthening ........................................................................................................... 48
12. Strategic monitoring and evaluation .................................................................................................. 50 Performance monitoring: Data tables ......................................................................................................... 54
Constraints and opportunities ..................................................................................................................... 55 Progress on gender strategy ....................................................................................................................... 56
Number of people receiving post-gender-based violence clinical care minimum package .................... 56 Adolescent girls and young women/adolescent boys and young men ................................................... 56
Provision of activities to prevent and respond to gender-based violence ............................................... 56 Progress on environmental mitigation and monitoring ................................................................................ 58 Progress on links to other USAID and Centers for Disease Control and Prevention programs ................. 59
Progress on links with Government of Kenya agencies ............................................................................. 60 Global development alliance (if applicable) ................................................................................................ 61 Subsequent quarter’s work plan ................................................................................................................. 62
Budget and expenditure details ............................................................................................................... 64
Actual expenditure and future projections details ................................................................................... 65 Expenditure notes ................................................................................................................................... 65
Activity administration ................................................................................................................................. 66 Personnel ................................................................................................................................................ 66 Contract amendments ............................................................................................................................. 66

iv
Subcontractors ........................................................................................................................................ 66 Other significant approval(s) from USAID ............................................................................................... 66
GPS information .......................................................................................................................................... 67 Success story: Viral resuppression in a child and an adolescent in Nyamira County ................................ 68

v
Abbreviations
AGYW adolescent girls and young women
AIDS acquired immune deficiency syndrome
ANC antenatal care
ART antiretroviral therapy
ARV antiretroviral
C&T care and treatment
CALHIV children and adolescents living with HIV
CME continuing medical education
DATIM Data for Accountability, Transparency and Impact Monitoring
DCM differentiated care model
DHIS2 District Health Information Software 2
DREAMS Determined, Resilient, Empowered, AIDS-Free, Mentored and Safe
EBI evidence-based intervention
ECHO Extension for Community Healthcare Outcomes
EID early infant diagnosis
EMR electronic medical record
FF fisherfolk
FMATT facility missed appointment tracking tool
FY fiscal year
GBV gender-based violence
HCW health care worker
HEI HIV-exposed infant
HF health facility
HIV human immunodeficiency virus
HIVST HIV self-testing
HTS HIV testing services
iHRIS integrated human resources information system
IPT isoniazid preventive therapy
KEMSA Kenya Medical Supplies Authority
LIP local implementing partner
MER Monitoring, Evaluation, and Reporting
MOH Ministry of Health
MSP male sex partner
MTCT mother-to-child transmission of HIV
MWENDO Making Well-informed Efforts to Nurture Disadvantaged Orphans and Vulnerable Children
NASCOP National AIDS & STIs Control Programme
OTZ Operation Triple Zero
OVC orphans and vulnerable children
PCR polymerase chain reaction
PEPFAR US President’s Emergency Plan for AIDS Relief

vi
PLHIV people living with HIV
PMTCT prevention of mother-to-child transmission of HIV
PMTCT_ART HIV-positive pregnant women on antiretroviral therapy
PMTCT_STAT women attending their first ANC visit who knew their HIV status
PMTCT_STAT_POS HIV-positive pregnant women with known status
PNS partner notification services
PrEP pre-exposure prophylaxis
PrEP_NEW newly on PrEP treatment
PrEP_NEW_AGYW newly on PrEP treatment among the AGYW
PSSG psychosocial support group
Q quarter
SAPR semiannual progress report
SASA start, awareness, support, and action
STF suspected treatment failure
TB tuberculosis
TX_CURR number of individuals currently enrolled in treatment
TX_NEW number of individuals newly enrolled in treatment
USAID US Agency for International Development
VL viral load
VLS viral load suppression
VMMC voluntary medical male circumcision

vii
List of tables
Table 1. AGYW who accessed services (FY20 SAPR). ............................................................................... 2
Table 2. FF who accessed services (FY20 SAPR). ...................................................................................... 2
Table 3. VMMCs conducted (FY20 SAPR). .................................................................................................. 3
Table 4. PrEP_NEW services (FY20 SAPR). ............................................................................................... 3
Table 5. HIV testing services (FY20 SAPR). ................................................................................................ 3
Table 6. ART services (FY20 SAPR). ........................................................................................................... 4
Table 7. Viral load services (FY20 SAPR). ................................................................................................... 4
Table 8. TB/HIV services (FY20 SAPR). ...................................................................................................... 5
Table 9. PMTCT services (FY20 SAPR). ...................................................................................................... 5
Table 10. EID services (FY20 SAPR). .......................................................................................................... 6
Table 11. Number of AGYW reached by county and against targets (FY20 SAPR). ................................... 8
Table 12. Key behavioral evidence-based interventions. ............................................................................. 8
Table 13. AGYW who received behavioral interventions by county (FY20 SAPR). ..................................... 8
Table 14. Number of AGYW who knew their HIV status through HTS, by age and county (FY20 SAPR). . 9
Table 15. Number of AGYW who received financial capability training (FY20 SAPR). .............................. 10
Table 16. AGYW with complete primary layering (FY20 SAPR). ............................................................... 10
Table 17. PrEP_NEW_AGYW (FY20 SAPR). ............................................................................................ 11
Table 18. Number of MSPs of 15- to 24-year-old AGYW reached with services, by county (FY20 SAPR).
.................................................................................................................................................................... 12
Table 19. Enrollment of eligible OVC in DREAMS, by county and age cohort (FY20 SAPR). ................... 13
Table 20. AGYW co-enrolled in OVC program, with complete primary layering (FY20 SAPR). ................ 13
Table 21. FF currently supported (FY20 SAPR). ........................................................................................ 14
Table 22. FF HTS results (FY20 SAPR). .................................................................................................... 14
Table 23. FF services, per Kisumu County area (FY20 SAPR). ................................................................. 14
Table 24. VMMC performance by county (FY20 SAPR). ........................................................................... 15
Table 25. VMMC performance by age bands (FY20 SAPR). ..................................................................... 15
Table 26. PrEP_NEW performance by county (FY20 SAPR). .................................................................... 17
Table 27. PrEP_CURR performance by county (FY20 SAPR). .................................................................. 17
Table 28. Project-supported HTS results, by county (FY20 SAPR). .......................................................... 18
Table 29. Pediatric HTS results by county (FY20 SAPR). .......................................................................... 19
Table 30. HTS_TST_POS results by county (FY20 SAPR). ...................................................................... 19
Table 31. HTS_TST_POS yield by county (FY20 SAPR). .......................................................................... 19
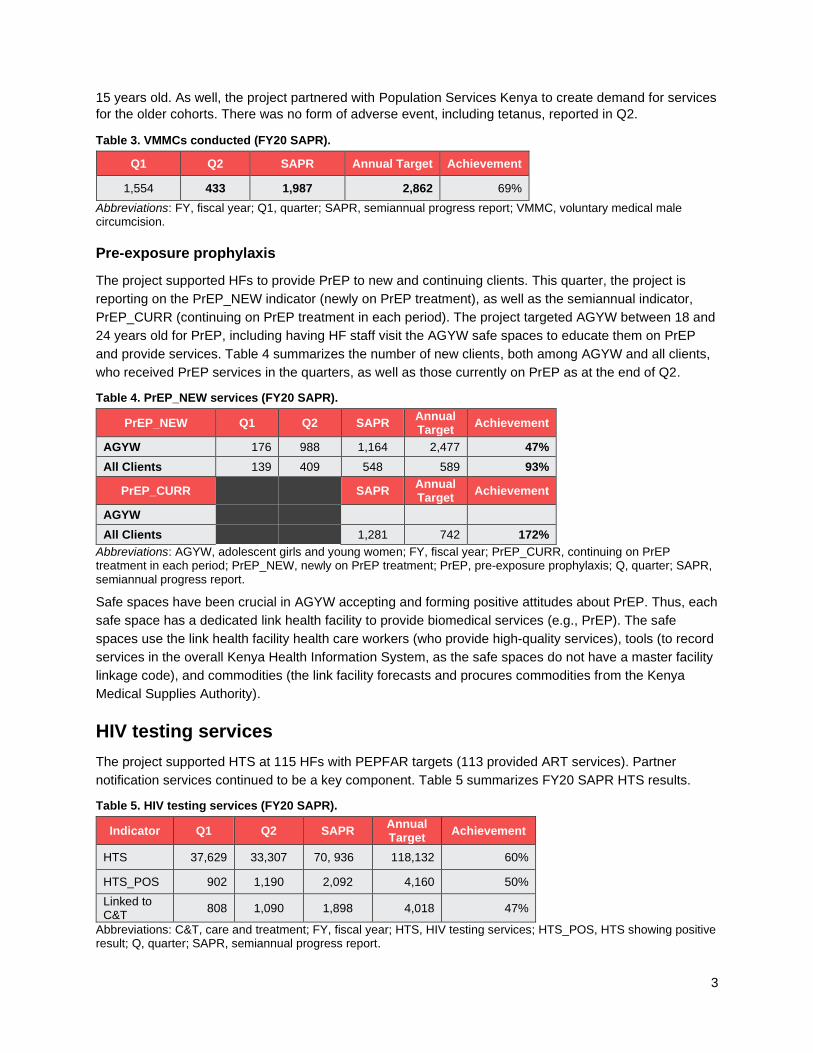
Table 32. HTS linkage results against proxy indicator HTS_TST_POS (FY20 SAPR). ............................. 20
Table 33. HTS linkage results (FY20 SAPR). ............................................................................................. 20
Table 34. PNS cascade of services, overall, by quarter (FY20 SAPR). ..................................................... 21
Table 35. PNS contribution to HIV positives and positive yield (FY20 SAPR). .......................................... 22

viii
Table 36. PNS summary of cascade by sex (FY20 SAPR). ....................................................................... 22
Table 37. PNS cascade per tested population (FY20 SAPR). .................................................................... 22
Table 38. PNS cascade of services by county, ≥ 15 years old (FY20 SAPR). ........................................... 23
Table 38. HIVST kits distributed (FY20 SAPR)........................................................................................... 24
Table 39. New clients on ART, by county (FY20 SAPR). ........................................................................... 25
Table 40. New pediatric clients on ART, by county (FY20 SAPR). ............................................................ 25
Table 41. Twelve-month cohort retention (FY20 SAPR). ........................................................................... 25
Table 42. Total current clients on ART, by county (FY20 SAPR). .............................................................. 26
Table 43. Current pediatric clients on ART, by county (FY20 SAPR). ....................................................... 26
Table 44. Current ART net gain by county (FY20 SAPR). .......................................................................... 27
Figure 1. Overall net ART retention (March 2020). ..................................................................................... 27
Table 45. Monthly changes in current on ART by county and overall (FY20 Q2). ..................................... 28
Table 46. Overall performance of 39 sites in Operation Triple Zero (FY20 Q2). ........................................ 29
Table 47. CALHIV enrolled/virally suppressed in MWENDO/OVC program (FY20 SAPR) ....................... 29
Table 48. PLHIV enrollment in PSSGs (FY20 Q2). .................................................................................... 30
Figure 2. Differentiated care cascade (FY20 Q2). ...................................................................................... 31
Table 49. VL uptake by county—routine and targeted testing against current on treatment (FY20 Q2). .. 32
Table 50. VLS by county, routine and targeted VL testing (FY19 Q3 to FY20 Q2). ................................... 32
Table 51. VLS by age group for routine VL testing (FY20 Q1 and Q2). ..................................................... 32
Table 52. VLS by cadre for routine VL testing (FY20 Q1 and Q2). ............................................................ 32
Table 53. Key TB/HIV performance indicators (FY20 SAPR). .................................................................... 35
Table 54. TB cascade (FY20 SAPR). ......................................................................................................... 35
Table 55. TB screening by county (FY20 SAPR). ...................................................................................... 36
Table 56. IPT for TB (FY20 SAPR). ............................................................................................................ 37
Table 57. PMTCT uptake by county (FY20 SAPR). ................................................................................... 37
Table 58. PMTCT_STAT summary achievements (ANC1) by county (FY20 SAPR). ................................ 38
Table 59. PMTCT_ART summary achievements by county (FY20 SAPR). ............................................... 38
Table 60. Average VLS among PMTCT clients (FY20 Q2). ....................................................................... 38
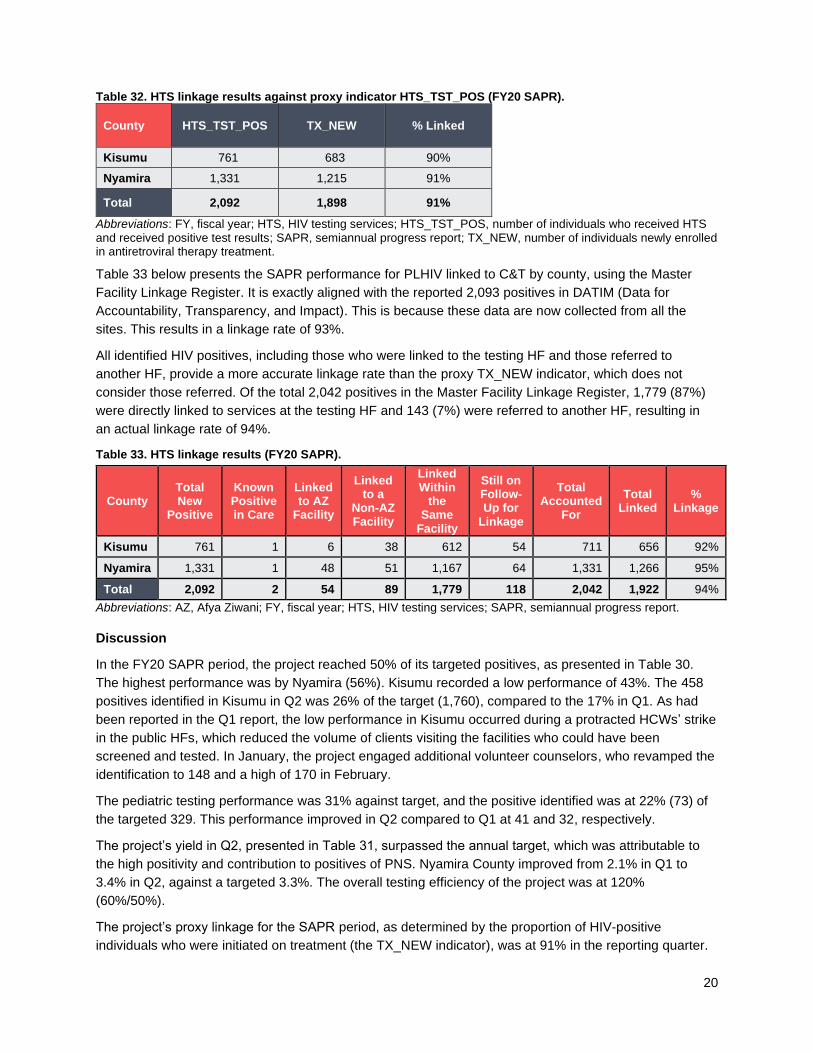
Table 61. PMTCT cohort analysis (FY20 Q2). ............................................................................................ 39
Table 62. Overall EID tests between 0 and 12 months old (FY20 SAPR). ................................................. 40
Table 63. EID test performance by monthly periods (FY20 SAPR).* ......................................................... 40
Table 64. Early infant diagnosis cascade—initial tests only (FY20 SAPR). ............................................... 41
Table 65. Outcome of HEI positivity audits (FY20 Q2). .............................................................................. 43
Table 66. HEI analysis of 12-month cohort (FY20 Q2). .............................................................................. 44
Table 67. HEI analysis of 18-month cohort at 24 months (FY20 Q2). ........................................................ 44
Figure 3. Central and satellite ART commodity sites’ reporting rates into KHIS (FY20 Q2). ..................... 47
Table 68. HF staff participation in CME by topics covered (FY20 Q2). ...................................................... 49
Table 69. Health care professionals contracted (FY20 Q2). ....................................................................... 50
Table 70. Health care lay workers contracted (FY20 Q2). .......................................................................... 50

ix
Table 71. Non-health-care lay workers contracted (FY20 Q2). .................................................................. 50
Table 72. EMR distribution at service delivery points, by county (FY20 Q2). ............................................. 52
Table 73. Provision of post-GBV clinical services (FY20 SAPR). ............................................................... 57
Table 74. Government ministries and departments that Afya Ziwani collaborated with (FY20 Q2). .......... 60
Table 75. Work plan activities and statuses for increased and expanded high-quality HIV services (FY20
Q2). ............................................................................................................................................................. 62
Figure 4. Expenditure status and financial projections (pipeline) in US dollars (FY20 Q2). ....................... 64
Table 76. Actual expenditure details, in US dollars (FY20 Q2). ................................................................. 65
Table 77. Expenditure notes. ...................................................................................................................... 65

x
List of figures
Figure 1. Overall net ART retention (March 2020). ..................................................................................... 27
Figure 2. Differentiated care cascade (FY20 Q2). ...................................................................................... 31
Figure 3. Central and satellite ART commodity sites’ reporting rates into KHIS (FY20 Q2). ..................... 47
Figure 4. Expenditure status and financial projections (pipeline) in US dollars (FY20 Q2). ....................... 64

1
Executive summary
Overview
Afya Ziwani is a US Agency for International Development (USAID) project funded by the US President’s
Emergency Plan for AIDS Relief (PEPFAR). It is implemented by a PATH-led consortium of Kenyan
nongovernmental organizations. The project is a five-year project from October 1, 2017, to September 30,
2022. Afya Ziwani aligns its activities with PEPFAR’s 95-95-95 goals and the Kenyan Ministry of Health’s
guidelines and directives. The project builds the institutional capacity of communities, health facilities
(HFs), and counties to effectively conduct and sustainably manage their responses to the HIV epidemic.
In its first two project years, Afya Ziwani supported four high-burden and one moderate-burden
HIV/tuberculosis (TB) counties of western Kenya. In Quarter 2 (Q2) of fiscal year 2020 (FY20), the project
continued its support to the counties of Kisumu (in the three designated subcounties of Kisumu East,
West, and Central) and Nyamira (all its five subcounties) under the HIV service delivery arm. As well, the
project continued to support the adolescent girls and young women (AGYW) in Homa Bay, Kisumu, and
Migori through the AGYW/DREAMS (Determined, Resilient, Empowered, AIDS-Free, Mentored and Safe)
services. The AGYW work was implemented under the auspices of orphans and vulnerable
children/DREAMS, as per the PEPFAR directions for country operational plan 2019.
In FY20 (project Year 3), the project supported a total of 115 HFs, each of which had at least one
PEPFAR-assigned target, in the two counties of Kisumu and Nyamira. All HFs had HIV testing services
(HTS) targets; 111 had PEPFAR targets for antiretroviral therapy (ART); 26 had targets for TB; and 84
had targets for prevention of mother-to-child transmission of HIV (PMTCT). For prevention services, the
project prioritized four intervention areas in the reporting quarter: AGYW, fisherfolk (FF), voluntary
medical male circumcision (VMMC), and pre-exposure prophylaxis (PrEP). Only two HFs had PEPFAR-
assigned VMMC targets, but the project supported seven other satellite HFs. The project received a
contract modification to include key population interventions within the its scope of work.
Prevention
Adolescent girls and young women
AGYW services were provided through four local implementing partners that worked in 260 safe spaces,
49 wards, and 16 subcounties in the three counties of Homa Bay, Kisumu, and Migori. Table 1
summarizes the numbers of AGYW that accessed services during the reporting quarter and the
semiannual program review period.

2
Table 1. AGYW who accessed services (FY20 SAPR).
Cohort Q1 Q2 SAPR Annual Target
Achievement
9–17 years old 703 27,486 28,189 38,154 74%
18–24 years old 16,965 13,571 30,536 39,727 77%
9–24 years old 17,668 41,057 58,725 77,881 75%
Abbreviations: AGYW, adolescent girls and young women; FY, fiscal year; Q quarter; SAPR, semimanual progress report.
At the semimanual progress report (SAPR) period, the project surpassed the expected achievement for
the overall annual target for the 9- to 24-year-old cohort (75%) as well as that for the 9- to 17-year-old and
the overall 18- to 24-year-old cohorts; the respective performances in these cohorts were 74% and 77%.
This was a remarkable improvement from the 23% attained at Q1. A total of 58,725 vulnerable AGYW
received services in the last six months—at least one of the behavioral, biomedical, or structural
interventions under the comprehensive package of services for primary HIV prevention.
In the SAPR period, 23% (13,785 of 58,725) of active AGYW were fully layered (received all required
services). Age-specific results were as follows: 24% for the 9- to 17-year-old cohort and 23% for 18- to
24-year-old cohort. This performance is satisfactory, given that the AGYW have only been in the program
for less than 6 months against a desired 9 to 12 months. Secondary interventions were provided on an
as-needed basis.
Fisherfolk
Another key prevention area was the provision of services to FF located at the Lake Victoria landing sites
of Kisumu County. Afya Ziwani provided services through one local implementing partner, in collaboration
with 12 government-registered beach management units, to reach both male and female FF with a
comprehensive package of HIV prevention, care, and treatment services. Table 2 summarizes the
number of FF that accessed services in the reporting quarter. Afya Ziwani achieved 46% of its annual
target of FF accessing services by this quarter. There are no gender disaggregated targets.
Table 2. FF who accessed services (FY20 SAPR).
Q1 Q2 SAPR
Annual Target
Achievement
Male 1,244 922 2,222
Female 1,871 1,275 3,196
Total 3,115 2,197 5,418 11,868 46%
Abbreviations: FF, fisherfolk; FY, fiscal year; Q, quarter; SAPR, semiannual progress report.
Voluntary medical male circumcision
A third key prevention service supported by the project was VMMC. Afya Ziwani provided support to nine
VMMC-providing HFs in Muhoroni subcounty of Kisumu County. Of the supported HFs, two had targets
specified by PEPFAR and the remaining seven were their satellite HFs. Table 3 summarizes the number
of VMMCs conducted in the two quarters of the year.
Afya Ziwani provided VMMC services to 433 clients this quarter—69% of its annual target as at the
SAPR. For the quarter, 64% of clients were 15 years old or older; the PEPFAR target for this age group is
60%. This improvement was in line with PEPFAR direction to scale back services for those younger than
3
15 years old. As well, the project partnered with Population Services Kenya to create demand for services
for the older cohorts. There was no form of adverse event, including tetanus, reported in Q2.
Table 3. VMMCs conducted (FY20 SAPR).
Q1 Q2 SAPR Annual Target Achievement
1,554 433 1,987 2,862 69%
Abbreviations: FY, fiscal year; Q1, quarter; SAPR, semiannual progress report; VMMC, voluntary medical male circumcision.
Pre-exposure prophylaxis
The project supported HFs to provide PrEP to new and continuing clients. This quarter, the project is
reporting on the PrEP_NEW indicator (newly on PrEP treatment), as well as the semiannual indicator,
PrEP_CURR (continuing on PrEP treatment in each period). The project targeted AGYW between 18 and
24 years old for PrEP, including having HF staff visit the AGYW safe spaces to educate them on PrEP
and provide services. Table 4 summarizes the number of new clients, both among AGYW and all clients,
who received PrEP services in the quarters, as well as those currently on PrEP as at the end of Q2.
Table 4. PrEP_NEW services (FY20 SAPR).
PrEP_NEW Q1 Q2 SAPR Annual Target
Achievement
AGYW 176 988 1,164 2,477 47%
All Clients 139 409 548 589 93%
PrEP_CURR
SAPR Annual Target
Achievement
AGYW
All Clients 1,281 742 172%
Abbreviations: AGYW, adolescent girls and young women; FY, fiscal year; PrEP_CURR, continuing on PrEP treatment in each period; PrEP_NEW, newly on PrEP treatment; PrEP, pre-exposure prophylaxis; Q, quarter; SAPR, semiannual progress report.
Safe spaces have been crucial in AGYW accepting and forming positive attitudes about PrEP. Thus, each
safe space has a dedicated link health facility to provide biomedical services (e.g., PrEP). The safe
spaces use the link health facility health care workers (who provide high-quality services), tools (to record
services in the overall Kenya Health Information System, as the safe spaces do not have a master facility
linkage code), and commodities (the link facility forecasts and procures commodities from the Kenya
Medical Supplies Authority).
HIV testing services
The project supported HTS at 115 HFs with PEPFAR targets (113 provided ART services). Partner
notification services continued to be a key component. Table 5 summarizes FY20 SAPR HTS results.
Table 5. HIV testing services (FY20 SAPR).
Indicator Q1 Q2 SAPR Annual Target
Achievement
HTS 37,629 33,307 70, 936 118,132 60%
HTS_POS 902 1,190 2,092 4,160 50%
Linked to C&T
808 1,090 1,898 4,018 47%
Abbreviations: C&T, care and treatment; FY, fiscal year; HTS, HIV testing services; HTS_POS, HTS showing positive result; Q, quarter; SAPR, semiannual progress report.

4
Using the proxy numerator of TX_NEW (newly on treatment), 92% of positives in Q2 were linked to the
testing HF for HIV care and treatment (C&T) services. When referrals to other HFs are included (actual
linkage), the linkage rate for the quarter is 94%. For the SAPR, the proxy linkage is 92%.
In Q2, the project’s HIV-positive yield at 3.6% is higher than the 3.5% target, representing a 102%
performance. This is a marked improvement from the 2.4% reported in Q1. For the SAPR, the positivity is
2.9%, which is 83% against the annual target.
During Q2, a total of 2,303 index clients were screened, of which 2,242 (97%) were offered partner
notification services; 5,108 (average of 2.3 each) contacts were elicited from these clients. Of these
contacts, 3,154 were tested and 838 (27%) were newly diagnosed to be HIV positive.
Antiretroviral therapy
The project supported 113 HFs with PEPFAR targets to provide HIV C&T, including ART. Table 6
summarizes ART services for the reporting quarter. Performance in the SAPR period on TX_NEW shows
that the project reached 47% of the annual target.
Table 6. ART services (FY20 SAPR).
ART Services Q1 Q2 SAPR Annual Target
Achievement
TX_NEW 808 1,090 1,898 4,018 47%
TX_CURR 22,367 23,234 23,234 26,235 89%
Change in TX_CURR
267 867
Abbreviations: ART, antiretroviral therapy; FY, fiscal year; Q, quarter; SAPR, semiannual progress report; TX_CURR, currently on treatment; TX_NEW, newly on treatment.
The project achieved 89% of its annual target for the number of adults and children currently receiving
ART. There was a gain in the numbers on treatment in Q2, as well as the change in those currently on
treatment. To improve retention in care, the project continued to support differentiated care service
delivery. The project assisted 89 HFs (79% of ART sites) in providing the service. Overall, 11,708 ART
clients were enrolled, representing 86% of the 13,575 eligible, stable ART clients.
Viral load services
The project supported 113 HFs with PEPFAR ART targets to provide viral load (VL) testing. Table 7
summarizes the number of VL tests completed in the reporting quarter. Performance shows that the
project achieved its annual target for VL testing (the current measure of those who received a VL test
within the last year). Viral load suppression (VLS) was at 92%, which is within the targeted range of 90%
to 95% suppression rate. Of note, the project achieved 94% VLS for routine testing. Among clients who
received “targeted” VL testing (i.e., those who had initially failed on treatment and who received a
confirmatory VL test after enhanced adherence counseling), 83% were re-suppressed.
Table 7. Viral load services (FY20 SAPR).
VL Q2 Annual Target
Achievement
VL Testing 19,619 24, 331 81%
VLS 92% 95% 97%
Abbreviations: FY, fiscal year; Q, quarter; SAPR, semiannual progress report; VL, viral load; VLS, viral load suppression.

5
In the quarter, the pediatric and adolescent VLS were at 79% and 85%, respectively. It is expected that
the project-supported transition of the pediatric and adolescent ART regimens to
tenofovir/lamivudine/dolutegravir and other efficacious regimens will further improve VLS in these age
groups, which have continued to report the lowest suppression.
TB/HIV
Performance in Q2 shows that the project is on track to achieve its annual targets for the TB/HIV
indicators (see Table 8). In the FY20 SAPR period, 99% (503 of 509) of TB patients were tested for HIV
and received their results, with 37% (187) found to be coinfected with HIV, of whom 95% (178) were on
ART. At their last visit, 22,663 (98%) comprehensive care center clients were screened for TB and 506 of
536 (94%) completed their isoniazid preventive therapy.
Table 8. TB/HIV services (FY20 SAPR).
TB/HIV Services Q1 Q2 SAPR Annual Target
Achievement
TB patients tested for HIV (TB_STAT) 259 244 503 1,003 50%
TB patients coinfected 95 92 187 367 51%
TB/HIV coinfected patients on ART (TB_ART) 92 86 178 375 47%
Abbreviations: ART, antiretroviral therapy; FY, fiscal year; HTS, HIV testing services; Q, quarter; SAPR, semiannual progress report; TB, tuberculosis.
Prevention of mother-to-child transmission of HIV
The project supported 113 HFs to provide PMTCT services. Table 9 summarizes the numbers of women
that received these services in the quarter.
Table 9. PMTCT services (FY20 SAPR).
PMTCT Services Q1 Q2 SAPR Annual Target
Achievement
Pregnant women with known HIV status (PMTCT_STAT)
5,218 6,137 11,355 18,574 61%
HIV-positive pregnant women (PMTCT_STAT_POS)
294 317 611 1,492 41%
HIV-positive pregnant women on ART (PMTCT_ART)
292 315 607 1,420 43%
Abbreviations: ART, antiretroviral therapy; FY, fiscal year; PMTCT, prevention of mother-to-child transmission of HIV; Q, quarter; SAPR, semiannual progress report.
Performance in Q2 shows that the project was mostly on track to achieve its annual targets, having
achieved more than 40% toward the annual targets. Overall, 100% (11,355 of 11,355) of women who had
antenatal care (ANC) visits knew their HIV status, of which 5.4% (611) were HIV positive. Of these, 74%
(450) were known to be HIV positive at entry, which indicates that women of childbearing age who live
with HIV feel confident that they can have HIV-negative children. Overall, 99% (607) of the HIV-positive
clients were on ART.
Early infant diagnosis
The project supported HFs to provide early infant diagnosis (EID) to HIV-exposed infants (HEIs), with
emphasis on testing by 8 weeks old. Table 10 summarizes the number of EID services provided in the

6
reporting quarter. The 38% performance at SAPR shows that the project is not on track to reach its
annual target for EID testing by 12 months old. Against a target of 1,268 for EID at less than 2 months
old, the project achieved 34% (425) of tests. The coverage for EID, as measured against the number of
HIV-positive pregnant mothers at ANC and post-ANC, is at about 85% (537 of 633). Against the proxy
indicator of PMTCT_STAT_POS (HIV-positive pregnant women with known status) at ANC and post-
ANC, 67% of HEIs were tested by 8 weeks old in Q2.
Overall, for Q2, 14 (5.0%) of 282 HEIs tested HIV positive. For the 215 tested by 8 weeks old, 6 (2.8%)
were found to be HIV positive. Of the 67 HEIs tested between 2 and 12 months old in Q2, 8 were positive,
representing 12.0%. To improve on the EID indicators, the project has embarked on revitalizing the
expected date of delivery/EID-polymerase chain reaction log tool that was initiated in FY19 to track all
HIV-positive women from ANC through delivery and the postnatal period to ensure that the polymerase
chain reaction tests are done on time.
Table 10. EID services (FY20 SAPR).
EID Indicator Q1 Q2 SAPR Annual Target
Achievement
Percentage of infants, born to HIV-positive women, who received a first virologic HIV test (sample collected) by 12 months of age
POST-ANC + PMTCT POS
294 329 633
< 2 Months 207 218 425 1,268 34%
2–12 Months
58 54 112 139 81%
Total EID 265 272 537 1,407 38%
Abbreviations: ANC, antenatal care; EID, early infant diagnosis; FY, fiscal year; PMTCT, prevention of mother-to-child transmission of HIV; POS, HIV positive; Q, quarter; SAPR, semiannual progress report.

7
Key achievements
1. High-priority population intervention: Adolescent girls and young
women
Through implementation of services for adolescent girls and young women (AGYW), the project seeks to
reduce new HIV infections among vulnerable AGYW between 9 and 24 years old.1 The project used a
strategy of providing layered services, including primary individual interventions to all enrolled AGYW as
per their age cohort, as well as secondary individual interventions based on each unique individual’s
circumstances.
Primary individual interventions include evidence-based interventions (EBIs); education on pre-exposure
prophylaxis (PrEP), condoms, and contraception; HIV testing services (HTS); social asset building; and
financial capability training. Secondary individual interventions include, among others, PrEP, education
support, and vocational training.
To be fully layered, an age cohort must receive the required primary services plus one secondary service.
Age-specific requirements include the following: 9 to 14-year-olds should receive three services, 15 to 17-
year-olds should receive six services, 18 to 19-year-olds should receive seven services, and 20 to 24-
year-olds should receive seven services.
The project continued to work with the orphans and vulnerable children (OVC) partner Catholic Relief
Services/MWENDO (Making Well-informed Efforts to Nurture Disadvantaged Orphans and Vulnerable
Children) to co-enroll girls aged 9 to 17 years old; those aged 18 to 24 years old were solely enrolled by
Afya Ziwani. The project graduated 73,839 and carried over 6,017. Of those carried over, only 2,719 are
ACTIVE, meaning they have received at least one service since October 1, 2019, to date. RETAINED
refers to AGYW who were receiving secondary services, such as PrEP, school fees, and vocational
training.
1.1 Primary individual interventions
Social asset building
The project tracks the number of AGYW who come to the 260 project-supported safe spaces in 49 wards
and receive social asset building interventions. These are denoted as “active AGYW.” In the second
quarter (Q2) of fiscal year 2020 (FY20), the project engaged with 13,571 AGYW aged 18 to 24 years, for
a total of 30,536 in the semiannual progress report (SAPR) 2020 period, which is 77% of the annual
target; it also engaged with 27,486 AGYW aged 9 to 17 years who received services over the last six
months in the safe spaces, for a total of 28,189 (74% of the annual target). These totals are reported
under the social asset building indicator. These active AGYW are broken down by county in Table 11. Q2
FY20 saw a tremendous increase in the enrollment of the age group 9 to 17 years from a low of 703. The
project continued to work with the OVC partner, MWENDO, to prioritize the OVC girls aged 9 to 17 years
old; in areas where the co-enrollment was not possible, then non-OVC girls were enrolled. The project
1 In fiscal year 2020, the project will target directly AGYW between 18 and 24 years old. The project will co-enroll the AGYW between 9 and 17 years old with the orphans and vulnerable children project MWENDO.

8
also worked on providing services not ordinarily offered by the OVC partner, such as education on
contraceptives and PrEP.
The project also continued to partner with the national government to have AGYW receive important
government documents such as birth certificates and national IDs, which are critical for receiving services
such as school fees and vocational training.
Table 11. Number of AGYW reached by county and against targets (FY20 SAPR).
County
Q1 Q2 SAPR Annual
Achievement Achieved Target
9–17 years
18–24 years
9–17 years
18–24 years
9–17 years
18–24 years
9–17 years
18–24 years
9–17 years
18–24 years
Homa Bay 277 8,064 10,824 4,448 11,101 12,512 12,304 13,875 90% 90%
Kisumu 388 6,139 12,235 6,792 12,623 12,931 18,855 18856 67% 69%
Migori 38 2,762 4,427 2,331 4,465 5,093 6,995 6,996 64% 73%
Total 703 16,965 27,486 13,571 28,189 30,536 38,154 39,727 74% 77%
Abbreviations: AGYW, adolescent girls and young women; FY, fiscal year; Q, quarter, SAPR, semiannual progress report.
Behavioral evidence-based interventions
Table 12 shows the behavioral EBIs that were implemented by the project, per age group. The associated
indicator is the number of AGYW reached with standardized EBIs that are designed to promote the
adoption of HIV-prevention behaviors and service uptake.
Table 12. Key behavioral evidence-based interventions.
Behavioral (evidence-
based interventions)
Healthy Choices for a Better Future, 10 to 14 years old
My Health My Choice, 15 to 17 years old
Shuga 2, 18 to 24 years old
Afya Ziwani used certified facilitators to provide the above EBIs to AGYW. Due advantage was taken of
the weekends and the half-term holidays in the quarter to conduct sessions for the groups. Education on
biomedical HIV-prevention services—including HTS, PrEP, condoms, and contraception—continued to be
mainstreamed into these EBI sessions. During the sessions, PrEP, condoms, and contraception were
also provided by linkage health facilities (HFs) to AGYW between 18 and 24 years old.
Key results
Table 13 summarizes the key results for AGYW under the EBI indicator.
Table 13. AGYW who received behavioral interventions by county (FY20 SAPR).
County Q1 Q2 SAPR Achieved
AGYW Achievement
Homa Bay 1,932 9,486 11,418 26,179 44%
Kisumu 1,422 8,790 10,212 37,711 27%
Migori 370 2,937 3,307 13,991 24%
Total 3,724 21,213 24,937 77,881 32%
Abbreviations: AGYW, adolescent girls and young women; FY, fiscal year; Q, quarter, SAPR, semiannual progress
report.

9
Discussion
Afya Ziwani prioritized uptake of EBIs by all enrolled AGYW. The project ensured that enrollment was
accompanied with a service—for examples, group-based interventions such as EBIs or individual
biomedical interventions such as HTS. It provided eligible AGYW with the EBIs, reaching 24,937 AGYW
in the SAPR period out of the targeted 77,881 (32% achievement against target).
The project printed and distributed EBI materials (manuals and posters) to the safe spaces across the
three counties. EBI sessions continued to be conducted with requisite fidelity as guided by the US Agency
for International Development (USAID). Strategies used included working with the schools that AGYW
attend to provide sessions in the afternoon breaks. The cost-cutting measure of mainstreaming education
on PrEP, condoms, and contraceptives into the EBIs will continue.
A large improvement in service provision was seen in Q2 compared to Q1. This improvement is likely to
be blunted in Q3 due to the restrictions brought on by COVID-19. However, the project plans to
restrategize on this and introduce use of virtual spaces, especially in urban and peri-urban settings where
smartphones are owned by the AGYW; reduce the number of girls in session to 12 to adhere to the cap of
15 people meeting; and involve the police and local administration to mainstream COVID-19 messages in
the sessions.
HIV testing services
The project provides HTS as a primary intervention for AGYW between 15 and 24 years old. The project
supports AGYW to be voluntarily retested once a year, in line with the national retesting guidelines. HTS
results are summarized in Table 14.
Key results
Table 14. Number of AGYW who knew their HIV status through HTS, by age and county (FY20 SAPR).
County 15–17 years old 18–19 years old 20–24 years old Total
Homa Bay 991 2,026 2,268 5,285
Kisumu 427 1,059 2,050 3,536
Migori 555 822 1,102 2,479
Total 1,973 3,907 5,420 11,300
Target 17,072 14,707 31,779
Achievement 23% 37% 36%
Abbreviations: AGYW, adolescent girls and young women; FY, fiscal year; HTS, HIV testing services; Q, quarter, SAPR, semiannual progress report.
Discussion
The project achieved 36% for testing among the overall AGYW cohort as at the end of Q2. For the 18 to
19-year-olds, the project reached 23% (3,907) of the targeted 17,072 girls with an HIV test. The
performance was better for the 20 to 24-year-olds, compared to their younger counterparts, at 37% of the
targeted 14,707. No targets have been provided for the 15 to 17-year-olds as yet, with this service being
provided as a secondary intervention for the eligible girls.
The project held discussions with service delivery partners and the county health management teams to
ensure that HTS commodities, including HIV self-testing (HIVST) kits, were available for AGYW who use
HTS as an entry to prevention. The project prioritized participation in the allocation meetings that guide
need-based distribution of HTS commodities.

10
Financial capability training
All AGYW need to receive financial capability training as a primary intervention to build their financial
skills. The trainings are conducted in groups for both in-school and out-of-school groups to serve as a
foundation for the girls and assist in determining the kind of money management decisions they will make
in life.
Key results
In Q2, an additional 21,088 AGYW received financial capability training; thus, the project reached 32% of
the annual target of 77,881. As Table 15 below shows, the project’s overall target as well as targets for
the age cohorts were not met in the reporting quarter.
Table 15. Number of AGYW who received financial capability training (FY20 SAPR).
County 9–14 years old 15–17
years old 18–19
years old 20–24
years old Total
Homa Bay 2,407 1,272 3,230 3,259 10,168
Kisumu 2,998 1,246 2,762 4,299 11,305
Migori 663 363 1,029 1,215 3,270
Total 6,068 2,881 7,021 8,773 24,743
Targets 15,295 22,860 21,343 18,383 77,881
Achievements 40% 13% 33% 48% 32%
Abbreviations: AGYW, adolescent girls and young women; FY, fiscal year; Q. quarter, SAPR, semiannual progress report.
Discussion
The overall 32% performance against target is appreciable given that most of the enrolled girls have been
in the program for less than six months. This performance is a tremendous improvement from the 5% in
Q1. Better performance was witnessed among the 9- to 14-year-old and the 18- to 24-year-old cohorts
compared to the 15- to 17-year-old cohort. The project’s prioritization for enrollment of the 15- to 17-year-
old OVC and a paucity of this age group in the OVC project’s line list led to late enrollments of this cohort
and hence incomplete service provision. The optimal performance in this indicator may be threatened in
Q3 and possibly Q4, given the restrictions on congregating brought on by COVID-19. The project has
restrategized on this, as explained above under the EBI subsection.
Adolescent girls and young women with complete primary layering
In Q2, 13,333 girls received all of their primary individual interventions, bringing the total of AGYW that
have completed primary interventions to 13,785. This is a 23% performance against the active AGYW in
the program, as at the SAPR. Table 16 below shows the age group distribution of the number of AGYW
with complete primary layering against those active in the program.
Table 16. AGYW with complete primary layering (FY20 SAPR).
Age Group Q1 Q2 SAPR AGYW Served Achievement
9–14 years 0 4,974 4,974 15,754 32%
15–17 years 0 1,768 1,768 12,435 14%
18–19 years 162 2,729 2,891 14,423 20%
20–24 years 290 3,862 4,152 16,113 26%
Total 452 13,333 13,785 58,725 23%

11
Abbreviations: AGYW, adolescent girls and young women; FY, fiscal year; Q, quarter, SAPR, semiannual progress report.
1.2 Secondary individual interventions
AGYW secondary services are provided to the recipients based on their circumstances and risks. These
services include PrEP, combination socioeconomic approaches, education support, among others.
Pre-exposure prophylaxis uptake
PrEP was provided to eligible AGYW between 18 and 24 years old. Afya Ziwani supported health care
workers (HCWs) from link HFs to visit the safe spaces to educate the AGYW about PrEP and to
determine eligibility, using a PrEP rapid assessment screening tool (see Table 17 for results). The AGYW
also received PrEP education in the Shuga 2 EBI. The PrEP_CURR_AGYW (individuals continuing on
PrEP from the AGYW cohort) achievement at the SAPR period was 2,068 (no target).
Key results
Table 17. PrEP_NEW_AGYW (FY20 SAPR).
Age Group Q1 Q2 SAPR Annual Target Achievement
18–19 years 68 297 365 137 266%
20–24 years 108 691 799 2,340 34%
Total 176 988 1,164 2,477 47%
Abbreviation: AGYW, adolescent girls and young women; FY, fiscal year; PrEP, pre-exposure prophylaxis; PrEP_NEW_AGYW, new individuals on PrEP from the AGYW cohort; Q, quarter, SAPR, semiannual progress report.
Discussion
PrEP_NEW_AGYW, new individuals accessing PrEP in the AGYW cohort, is not a US President’s
Emergency Plan for AIDS Relief (PEPFAR) Monitoring, Evaluation, and Reporting (MER) indicator. The
data source was the PrEP register in the AGYW safe spaces, and the data were inputted into the national
DREAMS (Determined, Resilient, Empowered, AIDS-Free, Mentored and Safe) database. As such, the
project reported on all the AGYW that initiated PrEP, whether with Afya Ziwani or another HF supported
by local implementing partners (LIPs).
As shown in Table 17, the project achieved 47% of its annual target for PrEP_NEW_AGYW in the SAPR
period. The project will reactivate some of the successful strategies used last year under the PrEP surge,
such as PrEP support groups and PrEP Champs to achieve the annual target. In addition, due to COVID-
19 restrictions, the project will use virtual platforms, home delivery, and multimonth dispensing for PrEP.
Education support
The project developed and rolled out a revised criterion for the identification of eligible AGYW to be
provided school fees in the quarter. The aim was to support AGYW to remain in school (which impacts on
HIV prevention), by paying school fees and providing sanitary commodities. The Kenyan school year has
three terms: January to March, May to July, and September to November. In Q2, the project paid school
fees for 1,568 of a targeted 1,500 AGYW, reaching 105%. As well, the project provided 21,768 sanitary
commodities to 7,256 AGYW, and MWENDO supplemented for the cohort that they supported.

12
1.3 Contextual interventions
Reducing risk in male sex partners
Afya Ziwani acknowledges that men have a role in reducing AGYW’s risk of HIV infection. As such, the
project supported the LIPs to conduct outreach activities that target typical male sex partners (MSPs) of
AGYW. Using the male characterization tool, Afya Ziwani worked with AGYW between 15 and 24 years
old to characterize their MSPs, ranking them by geographical area and occupation to identify the most
common partners. The project then worked with link HFs to conduct planned outreaches at the MSPs’
meeting points to facilitate male uptake of key HIV prevention services: HTS with treatment enrollment,
voluntary medical male circumcision (VMMC) referral, and condom distribution.
Key results
Table 18. Number of MSPs of 15- to 24-year-old AGYW reached with services, by county (FY20 SAPR).
County # of MSP
Outreaches # of MSPs Reached
# of MSPs Tested
# of MSPs Positive
# of MSPs Linked to
Care
# VMMCs Conducted
# of Condoms
Distributed to MSPs
Kisumu 14 597 67 0 0 0 7,720
Homa Bay 51 2,877 226 1 1 0 55,923
Migori 8 210 110 3 3 0 1,325
Total 73 3,684 403 4 4 0 64,968
Abbreviations: AGYW, adolescent girls and young women; FY, fiscal year; MSP, male sex partner; SAPR, semiannual progress report; VMMC, voluntary medical male circumcision.
Discussion
After conducting characterization of MSPs of AGYW to identify the typical males AGYW have sex with,
the project conducted outreaches at identified MSP spots to facilitate MSPs’ access to HTS, VMMC, and
condoms, as well as linkage to antiretroviral therapy (ART).
More MSP outreaches were conducted in Homa Bay, where the project works in 33 wards, than in other
counties; thus, there was higher reach in the HTS and condom distribution in Homa Bay. The outreaches
not only provided males with an opportunity to access highly effective prevention services, they also
provided the project opportunity to work with males to mobilize their eligible partners for DREAMS.
SASA! for violence prevention
SASA!2 is an EBI that helps participants understand various types of power to better prevent gender-
based violence (GBV). SASA! comprises individual- and group-level sessions with AGYW, as well as
community-level sessions that are organized in venues like churches, chiefs’ meetings, etc. All community
members are invited, and meetings are usually attended by MSPs, boda-boda taxi cyclists, community
leaders, parents and guardians, and students and teachers.
In FY20 Q2, the project reached 23,956 community members with SASA!, including AGYW. This brings to
a total of 37,211 members reached with this intervention as at the SAPR. Of major import, SASA!
2 Sasa is a Kiswahili word that means now. SASA is also the abbreviation for start, awareness, support, and action.

13
presented the project an opportunity to reach AGYW’s MSPs among the male participants in the EBI.
Thus, the project could discuss with them how the abuse of power leads to GBV and how they can use
their power to prevent GBV.
1.4 OVC/DREAMS co-enrollment
The project, under directive from USAID, worked with the OVC partner in the region, Catholic Relief
Services/MWENDO, to foster the co-enrollment of AGYW who were enrolled in the OVC program focused
on 9- to 17-year-old OVC. Tables 19 and 20 provide a status of the co-enrolled girls and service provision
as at the FY20 SAPR.
Table 19. Enrollment of eligible OVC in DREAMS, by county and age cohort (FY20 SAPR).
County 9–14 years old 15–17 years old Total
Homa Bay 2,458 1,452 3,910
Kisumu 1,919 764 2,683
Migori 136 91 227
Total 4,513 2,307 6,820
Enrolled in cohort 15,370 11,373 26,743
Achievement 29% 20% 26%
Abbreviations: DREAMS, Determined, Resilient, Empowered, AIDS-Free, Mentored and Safe; FY, fiscal year; OVC, orphans and vulnerable children; SAPR, semiannual progress report.
Table 20. AGYW co-enrolled in OVC program, with complete primary layering (FY20 SAPR).
Age Group SAPR AGYW Served Achievement
9–14 years 2,061 4,513 46%
15–17 years 407 2,307 18%
Total 2,468 6,820 36%
Abbreviations: AGYW, adolescent girls and young women; FY, fiscal year; OVC, orphans and vulnerable children; SAPR, semiannual progress report.
The reach for co-enrollment against the total enrolled AGYW is 26%, with the reach higher among the 9-
to 14-year-old cohort compared to their older counterparts. This is due to the paucity of eligible individuals
in the 15- to 17-year-old age group in the OVC program. The project has prioritized enrolling OVC girls
and would only enroll the others if the OVC were ineligible. The enrolled girls were provided with services
from both projects as applicable. The 9- to 14-year-old cohort had a higher achievement in primary
layering (46%) compared to the 15- to 17-year-old cohort. This is also because there are more OVC of
the former age compared to the latter; thus, they were easily and earlier enrolled and provided services.
2. High-priority population intervention: Fisherfolk
The project works in collaboration with 12 beach management units (Dunga, Kichinjio, Nyandiwa, Paga,
Usare, Rota, Ngege, Usoma, Mawembe, Ogal, Nyamware, and Nduru) in Kisumu County to reach
fisherfolk (FF), which includes those engaged in fishing (mostly male) and those engaged in trading
(mostly female), with a comprehensive package of prevention services. Behavioral interventions include
Splash Inside Out and Shuga 2; biomedical interventions include HTS, VMMC, and condom use
promotion; and structural interventions include SASA!
Key results
In the FY20 SAPR, a total of 5,418 FF received services through the project’s partnership with the Kenya
Red Cross Society; this was 46% of the annual target (see Table 21). Of the total of 5,418 FF, 41%
(2,222) were male and 59% (3,196) were female. All completed the Splash Inside Out and Shuga 2 EBI

14
sessions, and 3,752 were referred for HTS. Table 22 presents the cascade of HIV testing–related
services provided to the FF through FY20 Q1 and Q2.
Table 21. FF currently supported (FY20 SAPR).
FF Q1 Q2 SAPR Annual
Achievement Target
Male 1,300 922 2,222
Female 1,921 1,275 3,196
Total 3,221 2,197 5,418 11,868 46% Abbreviations: FF, fisherfolk; FY, fiscal year; Q, quarter, SAPR, semiannual progress report.
Table 22. FF HTS results (FY20 SAPR).
FF Q1 Q2 SAPR Target Achievement
Known positive (on treatment)
185 43 228
Offered testing 2,925 2,154 5,079
Newly tested 2,083 1,669 3,752 11,868 32%
HIV positive 48 37 85 475 18%
Linked to care & treatment
48 37 85 475 18%
Abbreviations: FF, fisherfolk; FY, fiscal year; HTS, HIV testing services; Q, quarter, SAPR, semiannual progress report.
As can be seen above, all of the 85 identified HIV positives in the quarter were linked to C&T. Table 23
breaks down the numbers on FF HTS, per area of Kisumu County.
Table 23. FF services, per Kisumu County area (FY20 SAPR).
Kisumu Areas
Known Positive Newly Tested Declined
Testing/Referred Total
Tested Positive and Started on Treatment
M F Total M F Total M F Total Total M F Total
Central Kisumu Ward
9 11 20 143 187 330 75 70 145 495 1 1 2
South West Kisumu Ward
38 57 95 645
1,154
1,799 214 260 474
2,368
7 14 21
Nyalenda B 21 30 51 239 305 544 182 237 419
1,014 9 11 20
Kobura Ward 20 18 38 187 279 466 122 172 294 798 16 23 39
Kabonyo Kanyagwal
9 15 24 272 341 613 46 60 106 743 2 1 3
Total 97 131 228
1,486
2,266
3,752 639 799
1,438
5,418
35 50 85
Abbreviations: F, female; FF, fisherfolk; FY, fiscal year; M, male; SAPR, semiannual progress report.

15
Discussion
The project conducted some moonlight and mostly daylight HTS activities to cater to the availability of the
FF. During the outreaches, 3,196 FF were offered HTS, of whom 2,266 (71%) were tested. Of those
tested, 50 tested HIV positive, reflecting a positivity rate of 2.2%, which is three times the 0.8% HIV
positivity reported in the FY19 period. With 228 FF known positives and another 50 newly tested as
positive, the overall HIV prevalence was 7% among those tested, excluding the declines. All (100%) were
linked to C&T. FF were referred to their link HFs for PrEP, VMMC, sexually transmitted infection (STI)
treatment, family planning, post-GBV care, and counseling on drug and alcohol abuse.
In the next quarter, the project will directly work with the department of fisheries in Kisumu County and the
beach management units. We plan to engage HTS providers and a program assistant to run the FF
program. The project will continue working with link facilities for referrals of other biomedical services
such as STI treatment.
3. Voluntary medical male circumcision
In FY20, Afya Ziwani is targeting VMMC service provision in Muhoroni subcounty of Kisumu County—in
particular, 2,862 clients for VMMC—through its support to nine VMMC-providing HFs. Of these HFs, two
have PEPFAR targets; the remaining seven sites are satellite HFs of the targeted sites. Project support
includes provision of consumables, equipment, reporting tools, support supervision, mentorship, and
technical support. During the reporting quarter, Afya Ziwani continued to support the Government of
Kenya and recommended the dorsal slit technique.
Key results
Overall performance in VMMC by quarter for the FY20 SAPR period is presented in Table 24. The age
band performance per quarter is presented in Table 25.
Table 24. VMMC performance by county (FY20 SAPR).
County Q1 Q2 SAPR Annual Target
Achievement
Kisumu 1,554 433 1,987 2,862 69%
Abbreviations: FY, fiscal year; Q, quarter; SAPR, semiannual progress report; VMMC, voluntary medical male circumcision.
Table 25. VMMC performance by age bands (FY20 SAPR).
Reporting period
Total MCs MCs among those < 15 years old
MCs among those > 15 years old
Achievement among those
> 15 years old to total
FY20 Q1 1,557 1,119 435 28%
FY20 Q2 433 157 276 64%
SAPR 1,987 1,276 711 36%
Abbreviations: FY, fiscal year; MC, male circumcision; Q, quarter; SAPR, semiannual progress report; VMMC, voluntary medical male circumcision.
Further details of the results are as follows:

16
• All nine project-supported facilities provided VMMC in Q2 by use of their resident surgeons. The
project worked with the subcounty health management to activate Nyangori dispensary, which
had not provided these services in Q1 because of lack of skilled staff.
• 64% (276) of the 433 circumcised in Q2 were 15 years of age or older. This is above the
PEPFAR target of 60%. However, for the SAPR period, only 36% (711) of the 2,034 circumcised
met this PEPFAR target.
• 139 (32%) of the total 433 circumcised clients in Q2 returned for follow-up within the
recommended 14 days of circumcision. For the SAPR, 1,293 of the 1,987 (65%) had the 14-day
follow-up. These are markedly below the 80% threshold.
• No adverse event and tetanus cases were reported in Q1 and Q2.
• 624 (88%) of the 711 eligible circumcised males in Q1 and Q2 were tested for HIV, with none
(0%) testing positive.
Discussion
In this second quarter of the project Year 3, the project managed to reach 476 males with VMMC
services, for a total of 2,030 male circumcisions in the six months of implementation against the annual
target of 2,862. This translates to an achievement of 71% against an expected performance of 50% in the
SAPR period.
To achieve this result, the project worked to ensure optimal functioning of all the nine sites in Muhoroni
subcounty. Trained and skilled HCWs were maintained in all nine sites. In Q2, the project undertook a
mini rapid results initiative targeting the older cohort—those aged 15 years and older. Working with the
community mobilizers, the project used youth mobilizers, women mobilizers, informational materials in
youth video dens, and rewards such as branded T-shirts and reflector jackets to attract this older cohort
for VMMC. This led to a remarkable improvement of age pivoting, with 65% (309) of those circumcised
aged 15 years and older.
For the SAPR period, about 63% (1,290) of clients were 14 years old or younger. Thus, they were
ineligible for an HIV test as per the National AIDS & STIs Control Programme (NASCOP), which de-
emphasizes testing for clients aged 10 to 14 years. The testing uptake of 84% for those eligible (624),
therefore, is commendable; no client tested positive in the SAPR period.
A markedly low (29%) of the 477 VMMC clients returned for follow-up within 14 days of circumcision in
Q2. This is way below the recommended 80%. It is notable that 430 of the 477 male circumcisions (90%)
were done in the month of March. The poor follow-up rate is attributed to the restrictions of movement
during the COVID-19 period, which impacted clients visiting HFs, as well as home visits by the mobilizers.
The facility teams have been primed to undertake a phone follow-up of these clients and update the
outcome of these in the missed-appointment log.
During the period under review, there was no adverse event reported. The project and Ministry of Health
(MOH) service provision teams continued to ensure that all clients received the recommended dorsal slit
technique and ensure compliance with World Health Organization guidelines on tetanus immunization prior
to circumcision.
The project also continued to sensitize women on the benefits of VMMC, which enabled them to make
referrals, accompany partners for VMMC, and offer support during the healing period. In addition, the
project continued to strengthen intra-facility referral by referring clients for VMMC services, referring eligible
men who test HIV-negative from the different facility testing points. The project supported and participated

17
in the national, county, and subcounty VMMC technical working group activities for the purposes of
coordinating VMMC services in the region.
4. Pre-exposure prophylaxis
PrEP targets seven major population groups, most of whom are either high-priority AGYW or key
populations (female and male sex workers). The Afya Ziwani project mainly targets and reports on PrEP
offered to AGYW and discordant couples of the general population. According to NASCOP data, HIV
treatment clinics are the main service delivery points for PrEP and the main safe spaces that target
AGYW. Afya Ziwani’s mandate is to provide technical support, avail where possible the reporting tools for
PrEP, assist in timely reporting, and build capacity for county- and HF-based activities. Afya Ziwani
reports on two indicators, PrEP_NEW and PrEP_CURR (which is only reported semiannually). The
former refers to the number of individuals who have been newly enrolled on PrEP, and the latter refers to
those, including the newly enrolled, who are continuing with PrEP in each period.
Key results
Tables 26 and 27, respectively, break down the number of individuals newly enrolled and currently on
PrEP by county.
Table 26. PrEP_NEW performance by county (FY20 SAPR).
County Q1 Q2 SAPR Annual
Target Achievement
Kisumu 98 374 471 528 89%
Nyamira 41 35 75 61 123%
Total 139 409 548 589 93%
Abbreviations: FY, fiscal year; PrEP_NEW, newly enrolled on PrEP treatment; Q, quarter, SAPR, semiannual progress report.
Table 27. PrEP_CURR performance by county (FY20 SAPR).
County SAPR Annual Target Achievement
Kisumu 1,111 660 168%
Nyamira 170 82 207%
Total 1,281 742 172%
Abbreviations: FY, fiscal year; PrEP_CURR, continuing on PrEP treatment; SAPR, semiannual progress report.
Discussion
Overall, the project achieved 93% of its annual target in the FY20 SAPR for the PrEP_NEW indicator and
172% for the PrEP_CURR indicator. For PrEP_NEW, the performance was better for Q2 (409) compared
to Q1 (139). A county-level analysis showed that in Kisumu County, 71% of the PrEP was offered to
persons aged 20 to 34 years and 76% of the initiated clients were females, alluding to the contribution of
the DREAMS/AGYW program. For Nyamira, the performance on these two disaggregates stood at 59%
and 57% respectively. There were no commodity shortages reported in the quarter. With Nyamira having

18
surpassed its target, accelerated efforts will be made to attain and surpass the target in Kisumu in the
next two quarters, while maintaining the numbers currently on PrEP.
For the PrEP_CURR, the project has surpassed the annual target in both counties. Focus will be put on
ensuring that the clients on PrEP receive a multi-month supply in line with the guidance provided during
the COVID-19 period.
5. HIV testing services
5.1 Health facility–based HIV testing services
Afya Ziwani set a target of 118,132 individuals for HIV testing in FY20, with 4,160 (3.5%) expected to be
HIV positive. To achieve this, during the reporting quarter, the project supported 115 HFs with PEPFAR
targets to conduct HTS, including through deployment of HTS providers, capacity-building, provision of
data-collection tools, mentorship, and supportive supervision. The project also provided HFs with direct
service delivery support, including deployment of 97 nonclinical HTS providers (including volunteers) at
95 sites (82% coverage).
During the reporting quarter, the project continued to enhance the working strategies initiated in the
previous year. Among these was optimization of an eligibility screening tool for all clients in the outpatient
department, along with testing of those that met the criteria. HTS at the HF level were restructured,
including shifting staff to meet the need and address technical challenges. The project maintained the 52
volunteer HTS providers recruited in the previous quarter to cover sites that had shown a potential to
identify HIV-positive clients. Partner notification services (PNS) continued to be the mainstay of
identification.
Key results
Project-supported HIV testing services
In the FY20 SAPR period, the following key project-supported HTS results were achieved, as presented
in Table 28. For overall HTS, the project surpassed its PEPFAR target for number of people tested, with a
60% achievement. At county level, Kisumu achieved 44% and Nyamira achieved 71%. The number of
tests were more than expected in Nyamira because there was more than double the average monthly
testing in the month of November 2019 due to a community testing exercise initiated by The Global Fund
to Fight AIDS, Tuberculosis and Malaria. In Q2, the average monthly tests were 7,000 with a total of
21,590 tests done, a 30% performance against the annual target, compared to 41% in Q1. Kisumu
County resumed outpatient services in the public HFs, with an average of 4,000 tests per month in Q2.
Table 28. Project-supported HTS results, by county (FY20 SAPR).
County Q1 Q2 SAPR Annual Target
Achievement
Kisumu 8,394 11,810 20,204 46,396 44%
Nyamira 29,235 21,497 50,732 71,736 71%
Total 37,629 33,307 70,936 118,132 60%
Abbreviations: FY, fiscal year; HTS, HIV testing services; Q, quarter, SAPR, semiannual progress report.

19
Pediatric clients
A total of 891 pediatric clients (15 years old or younger) were counseled and tested in Q2, representing
3% of the total tested (891/33,418). This was a significant reduction compared to the 3,314 tests done in
Q1. For the SAPR period, a total of 4,205 pediatric tests have been done; this is 31% against the annual
target (see Table 29). Both counties had a reduction in the tests, Nyamira by 79% (2,260) and Kisumu by
37% (163).
Table 29. Pediatric HTS results by county (FY20 SAPR).
County Q1 Q2 SAPR Annual Target
Achievement
Kisumu 438 275 713 4,454 16%
Nyamira 2,876 616 3,492 8,806 40%
Total 3,314 891 4,205 13,460 31%
Abbreviations: FY, fiscal year; HTS, HIV testing services; Q, quarter, SAPR, semiannual progress report.
People living with HIV identified and linked to care and treatment
As Table 30 presents, 1,190 clients among those who received HTS were found to be HIV positive. This
and the 902 in Q1 reflects 50% of the annual target of 4,160.
Table 30. HTS_TST_POS results by county (FY20 SAPR).
County Q1 Q2 SAPR Annual Target
Achievement
Kisumu 303 458 761 1,760 43%
Nyamira 599 732 1,331 2,400 56%
Total 902 1,190 2,092 4,160 50%
Abbreviations: FY, fiscal year; HTS_TST_POS, number of individuals who received HTS and received positive test results; Q, quarter; SAPR, semiannual progress report.
As can be seen in Table 31 below, the project achieved an overall yield of 3.6% in Q2, which is higher
than the 2.4% in Q1 and is helping the project make progress toward the 3.5% annual target.
Table 31. HTS_TST_POS yield by county (FY20 SAPR).
County Q1 Q2 SAPR Annual Target
Achievement
Kisumu 3.6% 3.8% 3.7% 3.8% 99%
Nyamira 2.1% 3.4% 2.6% 3.3% 80%
Total 2.4% 3.6% 2.9% 3.5% 83%
Abbreviations: FY, fiscal year; HTS_TST_POS, number of individuals who received HTS and received positive test results; Q, quarter, SAPR, semiannual progress report.
Table 32 presents performance in the SAPR period for people living with HIV (PLHIV) linked to C&T by
county, using the proxy indicator of newly initiated on ART. This results in a linkage rate of 91%.
20
Table 32. HTS linkage results against proxy indicator HTS_TST_POS (FY20 SAPR).
County HTS_TST_POS TX_NEW % Linked
Kisumu 761 683 90%
Nyamira 1,331 1,215 91%
Total 2,092 1,898 91%
Abbreviations: FY, fiscal year; HTS, HIV testing services; HTS_TST_POS, number of individuals who received HTS and received positive test results; SAPR, semiannual progress report; TX_NEW, number of individuals newly enrolled in antiretroviral therapy treatment.
Table 33 below presents the SAPR performance for PLHIV linked to C&T by county, using the Master
Facility Linkage Register. It is exactly aligned with the reported 2,093 positives in DATIM (Data for
Accountability, Transparency, and Impact). This is because these data are now collected from all the
sites. This results in a linkage rate of 93%.
All identified HIV positives, including those who were linked to the testing HF and those referred to
another HF, provide a more accurate linkage rate than the proxy TX_NEW indicator, which does not
consider those referred. Of the total 2,042 positives in the Master Facility Linkage Register, 1,779 (87%)
were directly linked to services at the testing HF and 143 (7%) were referred to another HF, resulting in
an actual linkage rate of 94%.
Table 33. HTS linkage results (FY20 SAPR).
County Total New
Positive
Known Positive in Care
Linked to AZ
Facility
Linked to a
Non-AZ Facility
Linked Within
the Same
Facility
Still on Follow-Up for
Linkage
Total Accounted
For
Total Linked
% Linkage
Kisumu 761 1 6 38 612 54 711 656 92%
Nyamira 1,331 1 48 51 1,167 64 1,331 1,266 95%
Total 2,092 2 54 89 1,779 118 2,042 1,922 94%
Abbreviations: AZ, Afya Ziwani; FY, fiscal year; HTS, HIV testing services; SAPR, semiannual progress report.
Discussion
In the FY20 SAPR period, the project reached 50% of its targeted positives, as presented in Table 30.
The highest performance was by Nyamira (56%). Kisumu recorded a low performance of 43%. The 458
positives identified in Kisumu in Q2 was 26% of the target (1,760), compared to the 17% in Q1. As had
been reported in the Q1 report, the low performance in Kisumu occurred during a protracted HCWs’ strike
in the public HFs, which reduced the volume of clients visiting the facilities who could have been
screened and tested. In January, the project engaged additional volunteer counselors, who revamped the
identification to 148 and a high of 170 in February.
The pediatric testing performance was 31% against target, and the positive identified was at 22% (73) of
the targeted 329. This performance improved in Q2 compared to Q1 at 41 and 32, respectively.
The project’s yield in Q2, presented in Table 31, surpassed the annual target, which was attributable to
the high positivity and contribution to positives of PNS. Nyamira County improved from 2.1% in Q1 to
3.4% in Q2, against a targeted 3.3%. The overall testing efficiency of the project was at 120%
(60%/50%).
The project’s proxy linkage for the SAPR period, as determined by the proportion of HIV-positive
individuals who were initiated on treatment (the TX_NEW indicator), was at 91% in the reporting quarter.

21
A total of 194 clients were not initiated on treatment using this indicator. However, the actual linkage
indicates that this improves to 93%.
To meet the overall HIV identification gap, the project continued to implement the HTS surge strategies in
all the HTS facilities that optimized case identification by using high-yield approaches in high HIV
prevalence HFs and service delivery points; offering full-scale PNS at the HF and community levels;
performing targeted provider-initiated testing and counseling, following the MOH eligibility criteria through
stringent use of the screening tools, with a focus on tuberculosis (TB), STIs, and HIV exposures; using
intensified social-network testing; strengthening self-testing for men; and screening children for eligibility.
5.2 Partner notification services
To increase the uptake of PNS, Afya Ziwani continued to expand the range of providers who can provide
PNS by supporting sensitization training of HCWs, including nurses, clinicians, adherence-support
counselors, nonclinical and volunteer HTS providers, lab officers, and supervisors. The project also
worked with HF-based and roving PNS champions to mentor these providers on PNS. All project-
supported HTS sites have capacity to provide PNS. Tables 34 through 38 summarize the PNS cascades
for the quarters, contribution to HIV positives and yield, as well as breakdowns by sex, tested population,
and county.
Key results
Table 34. PNS cascade of services, overall, by quarter (FY20 SAPR).
Cascade Q1 Q2 SAPR
Total index clients offered PNS 1,813 2,303 4,116
Index clients screened/accepted PNS 1,687 2,242 3,929
PNS acceptance rate 93% 97% 95%
Contacts identified 3,668 5,108 8,776
Ratio of contacts identified 2.2 2.3 2.2
Known positives 660 1,064 1,724
Known positives (%) 18% 21% 20%
Eligible 3,008 4,044 7,052
Tested 2,339 3,154 5,493
Uptake of testing 78% 78% 78%
Newly tested positive 615 838 1,453
Newly tested positive (%) 26% 27% 26%
Linked 573 798 1,371
Linked (%) 93% 95% 94%
Abbreviations: FY, fiscal year; PNS, partner notification services; Q, quarter; SAPR, semiannual progress report.

22
Table 35. PNS contribution to HIV positives and positive yield (FY20 SAPR).
Category Q1 Q2 SAPR
Total tested 37,629 33,408 71,037
Total positive 902 1,194 2,096
Total positive yield 2.4% 3.6% 3.0%
PNS tested 2,339 3,154 5,493
PNS positives 615 838 1,453
PNS positive yield 26% 27% 26%
PNS contribution 68% 70% 69%
Abbreviations: FY, fiscal year; PNS, partner notification services; Q, quarter; SAPR, semiannual progress report.
Table 36. PNS summary of cascade by sex (FY20 SAPR).
Indicator FY20 Q1 FY20 Q2 SAPR
Male Female Male Female Male Female
Male/female ratio to total eligible tested 0.7 0.8 0.7 0.8 0.7 0.8
Contacts elicitation ratio 2.7 1.8 2.7 1.8 2.7 1.9
Percent eligible tested 75% 80% 76% 80% 76% 80%
HIV positivity 20% 32% 22% 31% 21% 32%
Percent linkage 91% 95% 95% 96% 93% 95%
Abbreviations: FY, fiscal year; PNS, partner notification services; Q, quarter; SAPR, semiannual progress report.
Table 37. PNS cascade per tested population (FY20 SAPR).
Indicator
General Population
PMTCT STF
Percent index clients screened 97% 100% 99%
Contacts elicitation ratio 2.26 2.25% 2.44
Percent eligible tested 77% 76% 77%
HIV positivity 27% 19% 34%
Percent linkage 95% 92% 98%
Abbreviations: FY, fiscal year; PMTCT, prevention of mother-to-child transmission of HIV; PNS, partner notification services; Q, quarter; SAPR, semiannual progress report; STF, suspected treatment failure.

23
Table 38. PNS cascade of services by county, ≥ 15 years old (FY20 SAPR).
Indicator Kisumu Nyamira Total
Total index clients offered PNS 1,462 2,654 4,116
Index clients screened/accepted PNS 1,398 2,531 3,929
PNS acceptance rate 96% 95% 95%
Contacts identified 3,716 4,311 8,027
Ratio of contacts identified 2.7 1.7 2.0
Known positives 853 852 1,705
Known positives (%) 23% 20% 21%
Eligible 2,863 3,459 6,322
Tested 2,123 2,728 4,851
Uptake of testing 74% 79% 77%
Newly tested positive 504 905 1,409
Newly tested positive (%) 24% 33% 29%
Linked 470 858 1,328
Linked (%) 93% 95% 94%
Abbreviations: FY, fiscal year; PNS, partner notification services; SAPR, semiannual progress report.
Discussion
The above results indicate that PNS continued to be the most effective intervention for identifying
significant numbers of PLHIV. The overall yield for PNS in the SAPR period was 26%. PNS contributed to
69% of the total of newly identified PLHIV in the SAPR period, with a slight increase in Q2 compared to
Q1. Approximately 70% of the contacts elicited were tested at the community setting using the provider
referral approach. Blind testing was occasionally used to reach the elicited contacts. The testing uptake
improved in Q2 to 78%, with the linkage of clients identified through PNS remaining high. In this reporting
quarter, it was 93%, which was above the project’s proxy linkage of 90%.
The contact elicitation ratio for the male index clients was close to the recommended 1:3, whereas for the
female index, it was low. The positivity among the female contacts was higher than among male contacts.
Among the three groups elicited through PNS [i.e., the general population, prevention of mother-to-child
transmission of HIV (PMTCT), and suspected treatment failure (STF) contacts], the performances were
comparable across all the indicators, as shown in Table 37, though the STF had a higher positivity and
linkage. The high positivity of 34% among the STF contacts was not unexpected given that the indexes
have high transmissible viral copies. The elicitation rate, now a prime factor for consideration by PEPFAR,
was 1:3 in Kisumu, which met the PEPFAR threshold, and 1:2 in Nyamira.
The challenges that continued to affect PNS testing included stigma and disclosure issues, coupled with
the lack of clear, explicit policies and guidance in such situations at the implementation level; tracing of
elicited contacts beyond the facility catchment area; and the cost incurred for community PNS, where
several home visits are required to reach out to elicited sexual partners.
5.3 HIV self-testing
In FY20 Q2, a total of 46 project-supported sites reported that the distribution of the HIVST kits reached
1,628 tests. While the target was 480 HIVST kits in the year, 5,820 have been distributed as at the SAPR

24
(see Table 38), representing 1,213%. The project continued to use the two-pronged model/strategy for
HIVST: HF- and community-based models.
For the HF-based strategy, the key focus of self-testing was to improve uptake among men by reducing
missed opportunities—especially among partners of mothers attending antenatal care (ANC) services
and partners of HIV-positive clients who are unwilling to be tested by the HCW. This was done by
providing them the option of self-testing at the HF or at home.
For the community-based model, the aim was to serve as a complementary approach to the existing HTS
by targeting men during integrated outreaches; the goal was to reach a testing ratio of over 70% men to
women. Information on HIVST was offered during outreach mobilization. HIVST kits were provided to
clients who were eligible for testing (through a screening tool) but declined to be tested; there was
secondary distribution to partners of the men who tested positive.
Key results
Table 38. HIVST kits distributed (FY20 SAPR).
County Q1 Q2 SAPR Annual Target
Achievement
Kisumu 1,078 631 1,709 52 3,287%
Nyamira 3,114 997 4,111 428 961%
Total 4,192 1,628 5,820 480 1213%
Abbreviations: FY, fiscal year; HIVST, HIV self-testing; Q, quarter; SAPR, semiannual progress report.
Discussion
The project easily surpassed the conservative target of 480 that was set for the two counties by 5,820 tests
(1,213%). This target is about one-third that for FY19 (1,457). Self-test kits were distributed at community
settings, to men in formal and informal workplaces, as well as to HCWs, partners of ANC mothers, FF, and
AGYW. The performance in Q2 was lower because the big boost that had been there in Q1, from community
distribution in the two counties that was supported by Population Services Kenya, was no longer there.
Of the 5,820 HIVST kits distributed, 4,041 (69%) were done through the directly assisted approach and
1,779 (31%) were done through the unassisted approach.
Continuing challenges with HIVST included a lack of standardized documentation tools for distributed
HIVST kits, insufficient follow-up mechanisms to verify use of the HIVST kits that had been distributed for
use away from the HF, and delays in confirmatory positive testing that would lead to linkage to C&T.
6. HIV care and treatment
6.1 New on treatment
In FY20 Q2, Afya Ziwani supported 89 HFs with PEPFAR targets to provide ART. All these HFs had
TX_CURR targets; 84 had TX_NEW targets; and only 26 had TB/HIV targets. The target for PLHIV newly
initiated on ART was 4,018, which was 97% of the newly tested PLHIV target of 4,160. Tables 39 and 40
show the number of new and pediatric clients initiated on ART in Q1 and Q2 against the annual targets,

25
by county. For the 12-month cohort of newly enrolled ART patients, the project reported 80% retention,
with 3,437 of the total cohort of 4,283 still active at 12 months at the end of FY20 Q2 (Table 41).
Key results
Table 39. New clients on ART, by county (FY20 SAPR).
County Q1 Q2 SAPR Annual Target
Achievement
Kisumu 267 416 683 1,667 41%
Nyamira 541 674 1,215 2,351 52%
Total 808 1,090 1,898 4,018 47%
Abbreviations: ART, antiretroviral therapy; FY, fiscal year; Q, quarter; SAPR, semiannual progress report.
Table 40. New pediatric clients on ART, by county (FY20 SAPR).
County Q1 Q2 SAPR Annual Target
Achievement
Kisumu 11 23 34 129 27%
Nyamira 24 31 55 184 30%
Total 35 54 89 313 29%
Abbreviations: ART, antiretroviral therapy; FY, fiscal year; Q, quarter; SAPR, semiannual progress report.
Table 41. Twelve-month cohort retention (FY20 SAPR).
County
FY20 SAPR
Net cohort On ART 12
months %
retention
Kisumu 2,227 1,763 79%
Nyamira 2,056 1,674 81%
Total 4,283 3,437 80%
Source: Ministry of Health (MOH) 731 health facility report. Abbreviations: ART, antiretroviral therapy; FY, fiscal year; SAPR, semiannual progress report.
Discussion
In Q2, 1,090 clients were initiated on treatment, for a total of 1,898 in the SAPR period, which translates
to a 47% achievement against the country operational plan 2019 target of 4,018. This is 91% of the 2,092
clients identified as HIV positive in the SAPR period. The moderately below-target performance was
contributed by Kisumu County, which achieved 41% of the target. This was directly correlated with its
below-average yield from HTS, which resulted from the HCW strikes witnessed in Q1 and January of Q2,
as well as the reduction in workload in March due to the COVID-19 restrictions. However, the Kisumu
County performance in Q2 improved by 57% compared to Q1. Nyamira performed better against the
annual target, at 52% with a proxy linkage of 95%, nearing the project’s target of 97%.
The project’s performance in the SAPR period of 91% proxy linkage is a slight improvement compared to
the Q1 achievement of 90%. This is attributable to initiated strategies, such as the nonlinked clients’
tracker that was developed to improve this linkage to over 95% (TX_NEW target is 97% of the HIV-
positive target as proxy linkage).

26
For new pediatric clients on ART, the project achieved 54 in Q2 compared to 35 in Q1. This brings the
SAPR performance to 29% (89/313). Both counties are below the 50% threshold, with Kisumu being
lowest at 27%, despite having more than doubled the Q2 initiations (23) compared to Q1 (11). This
performance is in line with that of the HTS_TST_POS (number of individuals who received HTS and
received positive test results) for pediatrics, in which the project attained 22% (73/329) against the target.
However, the proxy linkage for pediatrics was optimal at 125% (91/73).
The project continued to refine the ART enrollment strategies, including HF performance tracking to
assess gaps and opportunities. The aims are to ensure that the proxy linkage is improved to greater than
95% and that the clients are initiated on ART immediately. The reduction in the number of project-
supported staff at facility level this year is a threat to this ambitious performance. The project is using the
novel roving clinician model to circumvent this. The project also continues to engage the county
departments of health to support HIV service provision.
6.2 Currently on treatment
The project’s FY20 target for those currently on ART is 26,235. Of these, the target for pediatrics
(15 years old or younger) is 2,048 (8% of total).
Key results
At the end of Q2, the total number of HIV clients currently on ART was 23,234, which is 89% against the
annual target of 26,235. Performance through Q2 by county and target is presented in Table 42.
Table 42. Total current clients on ART, by county (FY20 SAPR).
County Q1 Q2 SAPR Annual Target
Achievement
Kisumu 8,877 9,154 9,154 9,338 98%
Nyamira 13,490 14,080 14,080 16,897 83%
Total 22,367 23,234 23,234 26,235 89%
Abbreviations: ART, antiretroviral therapy; FY, fiscal year; Q, quarter; SAPR, semiannual progress report.
Table 43 presents the total number of current pediatric clients (15 years old or younger) who were on
ART in Q2 against the annual target, by county. Of the total number of clients currently on ART, 1,530
(7%) were children 15 years old or younger; the project thus reached 75% of this age group’s annual
target (2,048).
Table 43. Current pediatric clients on ART, by county (FY20 SAPR).
County Q1 Q2 SAPR Annual Target
Achievement
Kisumu 552 535 535 674 79%
Nyamira 963 995 995 1,374 72%
Total 1,516 1,530 1,530 2,048 75%
Abbreviations: ART, antiretroviral therapy; FY, fiscal year; Q, quarter; SAPR, semiannual progress report.
Discussion
At SAPR, the project achieved a current ART cohort of 23,232 against a country operational plan 2019
target of 26,235. Across the counties, Kisumu performed above its annual target of current clients on ART

27
at 98%, and Nyamira attained the lower at 83% against its overall target and 72% against its pediatric
target. Nyamira, a low-prevalence county, has tended to achieve on its noncurrent indicators, but it is
struggling with the retention of the identified and linked clients; though, as detailed in Section 6.3, this
improved in Q2. To reach the annual target of current clients on ART, the proxy linkage in Nyamira
County must continue to improve from the 92% in Q2 to the targeted 97%, while maintaining a retention
of over 90% month by month.
6.3 Retention
Key results
Table 44 below presents a picture of the project’s current retention as at the SAPR.
Table 44. Current ART net gain by county (FY20 SAPR).
County
Current on ART (FY19 Q4)
New on ART
(FY20 SAPR)
Transfers In (FY20 SAPR)
Defaulters/LTFU brought back (FY20 SAPR)
Expected Gain (FY20 SAPR)
Expected Current on ART (FY20
SAPR)
Actual Current on ART (FY20 SAPR)
Gain/Loss (FY20 SAPR)
Kisumu 8,720 683 80 62 825 9,545 9,154 -391
Nyamira 13,400 1,215 133 319 1,667 15,067 14,080 -987
Total 22,120 1,898 213 381 2,492 24,612 23,234 -1,378
Abbreviations: ART, antiretroviral therapy; FY, fiscal year; LTFU, lost to follow-up; Q, quarter; SAPR, semiannual progress report.
Figure 1 presents the project’s retention performance on expected and net gain.
Figure 1. Overall net ART retention (March 2020).
Abbreviations: ART, antiretroviral therapy; TX_CURR, currently on treatment; TX_NEW, newly on treatment.
Table 45 presents the monthly changes in the current on treatment at county level and at the overall
project level during the reporting period.
1,090
867 , 80%
-223
-400
-200
0
200
400
600
800
1000
1200
Net ART Retention (Jan-Mar20, Q2)
TX_New
Change in TX_Curr
Difference betweenexpected and actualchange TX_Curr

28
Table 45. Monthly changes in current on ART by county and overall (FY20 Q2).
County Current on ART
(December 2019)
Monthly change in TX_CURR
January 2020
February 2020
March 2020
Kisumu 8,877 8,961 9,059 9,154
Nyamira 13,490 13,654 13,854 14,080
Total 22,367 22,615 22,913 23,234 Abbreviations: ART, antiretroviral therapy; FY, fiscal year; Q, quarter; TX_CURR, currently on treatment.
Discussion
As can be seen in Figure 1, retention performance in Q2 improved, with an increase of only 867 in the
current on treatment against a new on treatment of 1,090—a loss of 223 compared to 561 reported in Q1.
Nyamira County improved in its performance by increasing, month on month, the client currently on
treatment from 164 in January, to 200 in February and 226 in March; the county finally crossed the
14,000 mark in March. The improved performance in Nyamira is attributed to the increase in the number
of peer educators from 50 to 64. Peer educators, a lay cadre of staff, are instrumental in appointment
management at facility level. Peer educators will continue to receive the appointment management
airtime and prompt the clinicians to populate the client-level tools.
The project will scale up electronic medical records (EMR) in high- and medium-volume facilities. Working
with the Ushauri system, the project will send automated SMS reminders to clients who opt in to ensure
they are adhere to their appointments, and thus minimize the defaulter rates further.
6.4 Additional retention and adherence interventions
Care for HIV-infected children and adolescents
The project supported dedicated pediatric and adolescent clinic days and psychosocial support groups
(PSSGs) for children, adolescents, and their caregivers. The project also provided support for and scaled
up the Operation Triple Zero (OTZ) intervention, which focuses on adolescents and youth between 10
and 24 years old and emphasizes the commitment to zero missed appointments, zero missed drugs, and
zero (undetectable) viral load (VL). The project further supported pediatric and adolescent adherence
through a peer-to-peer buddy support system, adolescent literacy sessions on HIV self-management, a
case-management approach for clients with adherence issues that included directly witnessed ART
intake, and harmonization of appointments with school calendars to minimize missed appointments. The
project worked with the OVC partner Catholic Relief Services/MWENDO toward optimal enrollment of
eligible pediatrics and adolescents up to 17 years of age in the OVC program.
Key results
Overall, 896 (34%) of the 2,656 adolescents and youth currently on ART were active in OTZ clubs at 42
implementing HFs, as presented in Table 46. Table 46 also presents viral load suppression (VLS) rates
by age and sex.

29
Table 46. Overall performance of 39 sites in Operation Triple Zero (FY20 Q2).
Indicator Female 10–14 years
Male Female Male Female Male
Total 10–14 years
15–19 years
15–19 years
20–24 years
20–24 years
Adolescents current on ART
391 361 420 303 973 208 2,656
Active in OTZ 198 191 223 62 164 58 896
% of active in OTZ 51% 53% 53% 20% 17% 29% 34%
On OTZ with VL 99 84 96 32 80 14 405
Suppressed 85 79 87 31 77 13 371
VLS rate 86% 94% 91% 97% 96% 93% 92%
Abbreviations: ART, antiretroviral therapy; FY, fiscal year; OTZ, Operation Triple Zero; Q, quarter; VL, viral load; VLS, viral load suppression.
Table 47 presents the cascade for enrollment of children and adolescents living with HIV (CALHIV)/OVC
by county.
Table 47. CALHIV enrolled/virally suppressed in MWENDO/OVC program (FY20 SAPR)
County CALHIV
Active on ART
Enrolled in MWENDO/
OVC
Virally Suppressed
% Enrolled in
MWENDO/ OVC
% of Enrolled Virally
Suppressed
Kisumu 685 511 419 75% 84%
Nyamira 1,379 702 588 51% 84%
Total 2,064 1,213 1,007 59% 84%
Abbreviations: ART, antiretroviral therapy; CALHIV, children and adolescents living with HIV; FY, fiscal year; MWENDO, Making Well-informed Efforts to Nurture Disadvantaged Orphans and Vulnerable Children; OVC, orphans and vulnerable children; SAPR, semiannual progress report.
Discussion
As Table 46 shows, the cascade of outcomes for adolescents who participated in OTZ includes an overall
VLS of 96%, indicating good adherence. Females in the 10- to 14-year-old and 15- to 19-year-old age
groups still posed a challenge in attaining the group average VLS levels, with males having higher rates
compared to their female counterparts. A challenge still exists in optimizing the enrollment to OTZ across
all age groups and sex, with enrollment averaging 34% and lowest among the females aged 20 to 24
years old. The lower enrollment of pediatrics and adolescents in the OVC program in Nyamira is a result
of late start-up. The overall suppression of the enrolled is 84%.
Positive health, dignity, and prevention interventions
Key strategies/interventions
The project supported HFs to form and/or strengthen PSSGs at both community and facility levels. The
HCWs and peer educators use the PSSGs as vehicles to disseminate key positive health, dignity, and
prevention messages, which aim to enhance members’ adherence to appointments and ART and help
them cope with chronic HIV infection. This quarter, the project provided very limited logistical support to
the HCWs, peer educators, and the attendees for their engagement with PSSGs due to the reduction in
funding for this year. The enrollment of PLHIV in the PSSGs during Q2 is shown in Table 48, which
depicts suppression per cohort.

30
Key results
Table 48. PLHIV enrollment in PSSGs (FY20 Q2).
PSSG Type No. of PSSGs
No. Enrolled in PSSGs
No. Suppressed
Percent Suppression
Total general adult PSSGs 37 1,822 1,693 93%
Total PMTCT PSSGs 91 1,379 1,280 93%
Total STF PSSGs 63 637 125 20%
Total pediatric PSSGs 78 789 611 77%
Total adolescent PSSGs 88 1,972 1,543 78%
Total men only PSSGs 12 246 223 91%
Total discordant couples’ PSSGs 10 275 257 93%
Total 379 7,120 5,732 81%
Source: Facility records, including peer educator logs. Abbreviations: FY, fiscal year; PLHIV, people living with HIV; PMTCT, prevention of mother-to-child transmission of HIV; PSSG, psychosocial support group; Q, quarter; STF, suspected treatment failure; VL, viral load.
Discussion
As shown in Table 48 above, the VLS in the PSSGs is good, at 81% and, if adjusted with removal of the
STF clients who expectedly are a non-suppressed cohort, at 86%. This is indicative of the role that these
groups play in improving and maintaining good suppression, considering that they focus on high-risk
clients. The project focused support in the quarter to the pediatric and adolescent groups.
PSSGs have been found to be effective in increasing retention and defaulter tracing. They also have
facilitated the formation and running of community antiretroviral refill groups. They have been effective in
adherence and disclosure counseling. They provide important psychosocial support, including mental
health counseling, education, spiritual support, and a forum for PLHIV to express themselves freely and
share experiences and challenges. A key to the success of PSSGs is that they are run by peers in
collaboration with HCWs. The peer educators identify clients’ needs per group and develop various
educational topics for discussion during every support group meeting.
The overall VLS of the project at 92% (Table 50) is an indicator of the role played by the PSSG
intervention, among others, in addressing psychosocial factors that deter optimal VLS.
Differentiated models of care
The project supported HFs to implement differentiated care for eligible clients on ART. In differentiated
care models (DCMs), clients are given longer intervals between clinic appointments, either through HF-
based fast-tracking or through community antiretroviral refill groups. These are interventions that are
intended to better meet client needs, while decongesting overburdened ART sites.
Key results
By Q2, 89 (79%) project-supported HFs were implementing differentiated care. Figure 2 presents the
differentiated care cascade at Q2.

31
Figure 2. Differentiated care cascade (FY20 Q2).
Abbreviations: ART, antiretroviral therapy; CARGS, community antiretroviral refill groups; DCM, differentiated care model; FY, fiscal
year; Q, quarter.
Discussion
Afya Ziwani’s support for DCMs during the reporting period included mentorship and supportive
supervision, which entailed filling out the differentiated care register and monitoring outcomes. The
number of clients on DCMs in the two counties stood at 11,708, which represented 54% of the number of
current clients on ART (21,511) in the reporting sites. However, 86% of the stable clients (13,575) were
on DCMs, with the majority opting for the facility fast-track model as opposed to the community
antiretroviral refill groups. The project continued to assess, at site level, the uptake of DCMs based on the
number of current clients on ART and those stable. The project ensured that facilities continually
reviewed the stable status of their clients to improve these uptakes to greater than 60% and 90%,
respectively. Higher enrollment to DCMs has been associated with a better performance on the retention
of clients on treatment.
6.5 Viral load testing and suppression
Strategies to improve VLS include using the clinical teams to follow up on clients with high-VL by holding
specific clinic days for unsuppressed clients, providing PSSGs services, and encouraging HF and
subcounty multidisciplinary teams to meet to discuss with them.
Key results
For VL uptake, Table 49 presents the number of clients who had a valid VL test done within the past
12 months (April 2019 to March 2020) versus those eligible for the test (i.e., current on ART) in
September 2019. Table 50 presents the VLS trends over the four quarters from FY19 Q3 through FY20
Q2 for routine and targeted VL testing, against the tests done.
21,511
2,898
13,575
5,094
11,708 11,550
158
Current on ART Newly enrolled Stable Unstable Number on DCM
Number on Fast Track
Number in CARGS
0
5,000
10,000
15,000
20,000
25,000

32
Table 49. VL uptake by county—routine and targeted testing against current on treatment (FY20 Q2).
County Q2 TX_CURR FY19
Q4 Achievement
Kisumu 8,208 8,720 94%
Nyamira 11,411 13,400 85%
Total 19,619 22,120 89 %
Abbreviations: FY, fiscal year; Q, quarter; TX_CURR, number of individuals currently enrolled in treatment; VL, viral load.
Table 50. VLS by county, routine and targeted VL testing (FY19 Q3 to FY20 Q2).
County FY19 Q3 FY19 Q4 FY20 Q1 FY20 Q2
Kisumu 91% 92% 93% 93%
Nyamira 87% 89% 91% 92%
Total 89% 91% 92% 92%
Abbreviations: FY, fiscal year; Q, quarter; VL, viral load; VLS, viral load suppression.
Table 50 shows a steady improvement in VLS each quarter, leading to an overall suppression rate of
92% for FY20 Q2. Of the total VL samples analyzed, 69% (14,277) were from female clients and 31%
(6,540) from male clients. In addition, 88% were from adults, 4% from pediatric clients, and 7% from
adolescents. Table 51 presents suppression results by age group. A further breakdown of VLS by cadre
is presented in Table 52.
Table 51. VLS by age group for routine VL testing (FY20 Q1 and Q2).
Age group Q1 Q2
< 2 years 65% 69%
2–9 years 79% 81%
10–14 years 76% 78%
15–19 years 84% 85%
20–24 years 91% 90%
25+ years 94% 94%
Total 92% 92%
Abbreviations: FY, fiscal year; Q, quarter; VL, viral load; VLS, viral load suppression.
Table 52. VLS by cadre for routine VL testing (FY20 Q1 and Q2).
Cadre Q1 Q2
All VL tests 92% 92%
Routine 94% 94%
Targeted 83% 83%
Male 91% 92%
Female 92% 93%
Pediatric 77% 79%
Adolescent 85% 85%
OTZ 80% 96%
PMTCT 93% 92%

33
Abbreviations: FY, fiscal year; OTZ, Operation Triple Zone; PMTCT, prevention of mother-to-child transmission of HIV; Q, quarter; VL viral load; VLS, viral load suppression.
At Q1, a total of 20,817 clients had a VL test done over the previous 12-month period, against the
expected proxy target of 21,672 for the period, giving a coverage of 96%. An overall suppression rate of
92% was realized among clients who had a VL test. Against the VLS indicator target of 24,331, the
project achieved 19,165 (79%).
The project in the past has reported performances of over 100% for the VL coverage indicator because of
duplicates in VL tests from the MOH VL database. In this quarter, these data were abstracted from the
EMRs and facility registers and reconciled with those from the VL testing laboratories. This resulted in an
overall uptake of 96%, though the Kisumu uptake was higher at 101%. This performance comprised
clients who received a routine VL test, with a suppression rate of 94%, and those who received a targeted
VL test, with a suppression rate of 83%. By sex, females achieved an overall VLS of 92%, and males
achieved 91%. In addition, 93% VLS was achieved among women enrolled in PMTCT, and 80% was
achieved among adolescents. Data were extracted from the facility records, including the EMRs, VL
tracking logs, or client files.
Discussion
The VL uptake for the reporting period of 19,619 against a targeted 22,120, which represented 89%
coverage, was optimal. The client-level collection of these data that was mooted in FY20 helped to
mitigate the greater than 100% coverage that had been reported in the previous reporting periods. The
numerator for this indicator on coverage, as espoused in the MER 2.4, was the number of tests done in
the last one year. The denominator was the TX_CURR numbers six months ago.
There was continued improvement in VLS from previous quarters to this reporting period, from the 89%
achievement in FY19 Q3 to 92% achievement by FY20 Q2, which are within the PEPFAR target of 90%
to 95% range. Nyamira County showed the greatest improvement, from a low of 87% in the third quarter
of FY19 to 92% in this reporting period.
The project continued the pediatric ART optimization initiative to improve viral suppression among
pediatric and adolescent clients. Through this, the proportion of clients that were on a nevirapine-based
regimen dropped from 2.5% in October 2019 to 0.0% in March 2020, while the proportion of those on
dolutegravir improved from 6.5% to 12.0% over the same period.
7. Laboratory support
In FY20 Q2, the project supported several activities to ensure there was continuous quality improvement
processes related to a laboratory quality management system. The project supported quarterly technical
working group meetings for commodities in both counties, as well as other related meetings, such as
laboratory clinical interface, external quality assessment, and GeneXpert® (GeneXpert is a registered
trademark of Cepheid) utilization meetings. The project enabled an effective and robust sample
networking system to serve the project’s 115 ART/EID sites.
7.1 Key results
The transition from dried blood spot to blood plasma for VL testing remained at 100% coverage, with
115 of 115 networked facilities transitioned to blood plasma for VL testing. Remote log-in for the 113
facilities also reached 100%. The commodity reporting rate in both the District Health Information
Software 2 (DHIS2) and Health Commodities Management Platform for the eight project-supported

34
subcounties reached 100%. The commodity technical working group meetings helped in mitigating low
stock levels, overstocking, and stockouts of laboratory-related commodities.
Laboratory monitoring
In FY20 Q2, Afya Ziwani continued to support 113 HFs with ART and TB/HIV targets. The project’s
annual target was 26,235 current clients on ART (and who require access to VL and other testing, as per
the national guidelines). The national system requires that HF VL samples be sent for remote log-in at a
hub lab (typically located in a HF) before being sent on to a testing lab. The hub lab sends the VL
samples to their identified central testing lab, which includes the Kenya Medical Research
Institute/Centers for Disease Control and Prevention in Kisian and the Walter Reed Project in Kericho.
The project provided support to seven hub labs for the project’s eight supported subcounties.
7.2 Discussion
Four sites in Nyamira County continued to offer GeneXpert testing, with three of these sites (Nyamira
county referral hospital, Ekerenyo subcounty hospital, and Masaba subcounty hospital) working
continuously online. Frequent power outages in Manga subcounty hospital remained a challenge for
GeneXpert testing, resulting in an increase in number of errors reported.
Afya Ziwani continued to support sample networking of EID and VL samples from satellite sites to central
facilities remote log-in before the samples’ transportation to testing labs in Kericho and Kisumu. The
project also continued to support bundles for the hubs to enable remote log-in of samples. The project
provided airtime for subcounty medical laboratory coordinators to support reporting of lab commodities in
the DHIS2 and Health Commodities Management Platform.
7.3 HIV testing services recency testing study
The project continued to support four pilot study sites in Kisumu County that were initiated in March
2019—namely, St. Mark’s Lela, Migosi Health Centre, Nyalenda Health Centre, and Simba Opepo Health
Centre. The pilot study came to an end in February of this quarter. In January and February, six samples
were processed for recency in these sites. Migosi had three samples, with one returned and two pending;
St. Mark’s Lela had two samples both pending results; and Nyalenda had one sample whose results are
still pending. The result from the Migosi sample indicated a long-term infection.
8. TB/HIV
Afya Ziwani implemented TB/HIV services in all 26 project-supported HFs with TB/HIV targets with focus
on various capacity-building and direct service delivery initiatives, including secondment and sensitization
of HCWs, mentorship, HF continuing medical education (CME), joint supportive supervision, and
performance-review meetings to improve testing of TB patients for HIV.
8.1 TB/HIV coinfection services
The project team collected TB data from the facilities’ TB4 registers using an age-disaggregating tool.
The team uploaded data into the project’s data management system, the Program Reporting Information
System Management.

35
Key results
Results on key TB/HIV performance indicators for FY20 are shown in Table 53. Table 54 summarizes
performance on the TB cascade, by county.
Table 53. Key TB/HIV performance indicators (FY20 SAPR).
TB/HIV Performance Indicators Q1 Q2 SAPR Annual Targets
Achievement
Number of TB patients registered 262 247 509 1,003 51%
Number who knew their HIV status 259 244 503 1,003 50%
Proportion who knew their HIV status
99% 99% 99%
Number of HIV-infected TB patients 95 92 187 367 51%
Proportion of TB/HIV coinfection 37% 39% 38%
Number known HIV positive at TB diagnosis
84 82 166 240 70%
Number of TB patients counseled and tested for HIV, and received their results
175 106 281 763 37%
Number newly tested positive 11 10 21 127 17%
Number of HIV-infected TB patients on ARVs
92 86 178 375 48%
Proportion of HIV-infected TB patients on ARVs
97% 94% 95%
Source: Program Reporting Information System Management. Abbreviations: ARV, antiretroviral; FY, fiscal year; Q, quarter; SAPR, semi-annual progress report; TB, tuberculosis. Table 54. TB cascade (FY20 SAPR).
County TB
Registered Patients
TB Patient with Known HIV
Status
TB/HIV Coinfection
TB/HIV on ART
SAPR Target SAPR Target SAPR Target
Kisumu 107 105 235 49 124 48 124
Nyamira 400 398 768 138 243 130 251
Total 507 503 1,003 187 367 178 375
Abbreviations: ART, antiretroviral therapy; FY, fiscal year; SAPR, semiannual progress review; TB, tuberculosis.
Discussion
The project reached the expected 50% FY20 SAPR TB performance on all but two of the key indicators.
The number of HIV-infected TB patients on antiretrovirals (ARVs) was at 48% against the annual target,
and a 37% performance was recorded for those tested and received HIV results. In the SAPR, 99% of
newly registered and relapsed TB patients knew their HIV status, with a coinfection rate of 38%.
The project achieved 99% on the number of TB clients that know their HIV status due to the project’s
continued sensitizations on active case finding in all the supported HFs, which were done as part of
mentorship and review meetings. The project will continue working through the cough monitors, some of
whom are now supported by The Global Fund partners, to strengthen HF-level active case finding and
referral for TB diagnosis and treatment. The screening of clients for TB in the outpatient department triage
area by the HTS screeners, as well as the eligibility screening for HIV, will continue.

36
With 503 TB patients with known HIV status, the project reached 50% of the annual target of 1,003.
8.2 TB screening
All clients who receive ART are to be screened for TB at each visit using an MOH algorithm. Use of
GeneXpert for assessing suspected cases is prioritized, with those turning positive initiated on treatment.
The individuals that screen negative for TB are initiated on a six-month TB-preventive therapy.
Key results
During Q2, 22,663 of 23,234 clients currently on ART were screened for TB, representing a 98%
screening rate, as highlighted in Table 55. Additional results through Q2 include the following:
• 98% of all clients currently on treatment were screened for TB; the screening rate in the counties was
at or greater than 97%. All TB data were reviewed during the data-review meetings before
submission for uploading to the DHIS2.
• The project did not provide direct support to any cough monitors across the sites; instead, it worked
with monitors who were supported by other partners at the community level but who were linked to
the sites.
Table 55. TB screening by county (FY20 SAPR).
County TX_CURR Total TB
Screening Percentage
Screened Positive for TB
Kisumu 9,154 9,028 99% 77
Nyamira 14,080 13,635 97% 289
Total 23,234 22,663 98% 366
Source: District Health Information Software (DHIS). Abbreviations: FY, fiscal year; Q, quarter; TB, tuberculosis; TX_CURR, currently in treatment; SAPR, semiannual progress report.
8.3 Provision of isoniazid preventive therapy for TB
The project supported provision of isoniazid preventive therapy (IPT) in all project-supported counties,
with a focus on initiating asymptomatic clients on IPT, along with clear analysis of the IPT outcomes of
those initiated six months earlier. To ensure the sustainability and improvement of IPT documentation and
completion, the project provided capacity-building initiatives and mentoring of HCWs and pharmacists on
accurate documentation in IPT registers, as well as timely ordering of IPT tablets and other commodities.
The project conducted file reviews to establish the IPT status among the comprehensive care center
clients.
Key results
During Q2, 94% (506 of 536) of clients who had started IPT six months prior completed TB prophylaxis
treatment. The remaining had died or been discontinued, transferred out, or been lost to follow-up, as
detailed in Table 56 below. For the SAPR period, 95% (1,007/1,061) completed TB prophylaxis treatment.

37
Table 56. IPT for TB (FY20 SAPR).
Indicator Q1 Q2 SAPR Percentage
Total clients who started IPT 6 months ago
525 536 1,061
Total completed treatment
501 506 1,007 95%
Total dead 5 4 9 1%
Total transferred out 10 10 20 2%
Total discontinued 0 1 1 0%
Total lost to follow-up 9 15 24 2%
Abbreviations: FY, fiscal year; IPT, isoniazid preventive therapy; Q, quarter; SAPR, semi-annual progress report; TB, tuberculosis.
Discussion
The project does not have DATIM-assigned targets for this indicator in FY20. The 95% completion rate is
lower than what was achieved overall in the last FY. No clients discontinued treatment in the reporting
quarter. The majority of the clients were either transferred out or lost to follow-up.
9. Elimination of mother-to-child transmission of HIV
9.1 Prevention of mother-to-child transmission of HIV
Afya Ziwani supports 84 HFs with PEPFAR targets for PMTCT. In FY20 Q2, the project supported a total
of 29 facility-based mentor mothers, covering 26 supported PMTCT sites. There was no support to the
community mentor mothers in the reporting quarter. Support in the FY20 Q2 was also provided through
adherence-support counselors, whose services were rendered to high-VL clients. Integration of family
planning services within the comprehensive care centers was continued, including strengthening use of
the pregnancy-intention screening tool.
Key results
Through the SAPR period, 100% (11,355 of 11,355) of women who attended their first ANC visit knew
their HIV status (PMTCT_STAT), reaching 61% of the annual target of 18,574. Table 57 presents total
results by county for PMTCT_STAT, which encompasses all known and newly tested HIV positives.
Table 57. PMTCT uptake by county (FY20 SAPR).
County First ANC PMTCT_STAT Percent
Who Know Their Status
COP Target
Achievement Against Target
Kisumu 3,259 3,259 100% 6,299 52%
Nyamira 8,096 8,096 100% 12,275 66%
Total 11,355 11,355 100% 18,574 61%
Source: Ministry of Health (MOH) 711/MOH 731 reports.
Abbreviations: ANC, antenatal care; COP, country operational plan; FY, fiscal year; PMTCT, prevention of mother-to-child transmission of HIV; PMTCT_STAT, women who attended their first ANC visit and knew their HIV status; Q, quarter; SAPR, semiannual progress report.

38
Table 58. PMTCT_STAT summary achievements (ANC1) by county (FY20 SAPR).
County PMTCT_STAT Total Positives Known Positive New Positive
No. Percent No. Percent No. Percent
Kisumu 3,259 338 10% 266 79% 72 21%
Nyamira 8,096 273 3% 187 68% 86 32%
Total 11,355 611 5% 453 74% 158 26%
Source: Ministry of Health (MOH) 711/MOH 731 reports.
Abbreviations: ANC1, first antenatal care visit; FY, fiscal year; No., number; PMTCT, prevention of mother-to-child transmission of HIV; PMTCT_STAT, women who attended their first ANC visit and knew their HIV status; SAPR, semiannual progress report.
Of the 11,355 women with known HIV status at an ANC first visit, 4.0% (453) were known positives at
entry and only 1.4% (158) were newly tested HIV positive (Table 58). The higher rate of known positives
at ANC entry can be attributed to the women’s confidence that the PMTCT program enables them to have
an HIV-negative child, along with improved quality of life with good VLS. Table 59 summarizes the
number of HIV-positive pregnant women on ART, by county.
Table 59. PMTCT_ART summary achievements by county (FY20 SAPR).
County
FY20 SAPR Annual Target
Achievement Positives On ART Percent
Kisumu 337 337 100% 960 35%
Nyamira 270 270 100 % 460 58%
Total 607 607 100% 1,420 42%
Source: Ministry of Health (MOH) 711/MOH 731 reports; semiannual progress report.
Abbreviations: ART, antiretroviral therapy; FY, fiscal year; PMTCT, prevention of mother-to-child transmission of HIV; PMTCT_ART, HIV-positive pregnant women on antiretroviral therapy; SAPR, semiannual progress report.
While 100% of women at first-contact ANC knew their HIV status, the project only reached 42% of its
annual target of 1,420 pregnant women starting maternal ART. The discrepancy in performance can be
attributed to a lower-than-expected number of first ANC visits, more so in Kisumu County, as well as the
low prevalence of HIV in Nyamira County.
PMTCT cohort analysis (viral load suppression)
PMTCT cohort analysis was conducted in all PMTCT-supported sites in project Year 3 Q2 to track VLS
(Table 60).
Table 60. Average VLS among PMTCT clients (FY20 Q2).
Category
Pregnant Breastfeeding
< 15 years
15–19 years
> 20 years Total < 15
years 15–19 years
> 20 years
Total
Number samples taken
1 6 132 139 0 25 351 376
Number suppressed 0 6 119 125 0 22 319 341
% suppression 0 100 90 90 0 88 91 91
Source: National AIDS & STIs Control Programme/early infant diagnosis website. Abbreviations: FY, fiscal year; PMTCT, prevention of mother-to-child transmission of HIV; Q, quarter; VLS, viral load suppression.
39
The overall average suppression was 90% among pregnant mothers and 91% in the breastfeeding
mothers. The pregnant mothers who were younger than 15 years old had the lowest suppression at 0%
(one sample considered). The project will continue to work with the facility staff, especially the maternal
and child health staff, to ensure timely VL sample collection is done, mothers with high VL are monitored
closely with timely enhanced adherence counseling, and those eligible are switched to second line ART.
PMTCT cohort analysis (retention)
PMTCT cohort analysis was conducted in all PMTCT-supported sites to establish client retention at 3, 6,
and 12 months after enrollment (see Table 61).
Table 61. PMTCT cohort analysis (FY20 Q2).
Cadre 3-Months Cohort 6-Months Cohort 12-Months Cohort 24-Months Cohort
N+ K+ Total N+ K+ Total N+ K+ Total N+ K+ Total
Enrolled 76 92 162 70 102 172 116 119 235 109 89 198
Transferred In
0 14 14 0 25 25 0 27 27 3 19 22
Transferred Out
7 1 8 7 6 13 17 16 33 23 10 33
Net Cohort 69 105 168 63 121 184 99 130 229 89 98 187
Defaulted 3 1 4 3 2 5 2 2 4 0 0 0
LTFU 0 0 0 0 0 0 10 3 13 2 11 13
Dead 0 0 0 0 0 0 2 0 2 0 0 0
Stopped 0 0 0 0 0 0 1 0 1 1 0 1
Alive Active
66 104 164 60 119 179 84 125 209 86 87 173
% Retained 96 99 98 95 98 97 85 96 91 97 89 93
Abbreviations: FY, fiscal year; K+, known positive; LTFU, lost to follow-up; N+, new positive; PMTCT, prevention of mother-to-child transmission of HIV; Q, quarter.
As the above table presents, retention for the 3-, 6-, 12-, and 24-month cohorts was at 98%, 97%, 91%,
and 93%, respectively. Known positives continued to have better retention rates across all cohorts,
(except the 24-month cohort) leading to an overall average of 96% retention, against the new positive
retention rate of 93%.
Discussion
The strong performance on the maternal cohort analysis can be attributed to HF-level monthly reviews on
this indicator. In these monthly reviews, the project team used PMTCT cohort analysis dashboards, as
well as the regular chart reviews. The team also identified gaps for follow-up. All of these were discussed
during HF data-review forums to identify retention and suppression gaps for review.
The mentor mother and peer educator program, though currently operating with reduced numbers, was a
contributing factor in the strong performance. During this quarter, the facilities had a boost from the
community health volunteer support on defaulter tracing and household follow-up. A local community-
based organization, Daraja-Mbili, in Nyamira County extended its work with community health volunteers
to a wider region, and this has led to this improved retention. In the subsequent quarters, the project will
continue to support HFs to review PMTCT performance in their monthly data quality assessments and
during subcounty elimination-of-mother-to-child-transmission review meetings.

40
The project continued to face the following challenges: client charges for ANC profile testing in private
and faith-based organization sites, especially in Kisumu County where the project supports the more
urban facilities with clients who prefer private facilities; the limiting of universal access to PMTCT services
and retention up to the fourth ANC visit; and the limited access to community-level structures, due to
funding cuts, that hindered the project team from assisting community health volunteers in ANC mapping
and referrals, which led to community health volunteers referring only a few mothers to the HFs.
9.2 Early infant diagnosis
Key results
The number of EID tests for HEIs between 0 and 12 months old, overall and by county, is shown in
Table 62. In Q2, 272 children were tested, for a total of 537 in the SAPR period, reaching 38% of the
annual target. Breakdown of when the children were tested, by county, is shown in Table 63.
Table 62. Overall EID tests between 0 and 12 months old (FY20 SAPR).
County Q1 Q2 SAPR Annual
Target Achievement
Kisumu 120 146 266 954 28%
Nyamira 145 126 271 453 60%
Total 265 272 537 1,407 38%
Abbreviations: EID, early infant diagnosis; FY, fiscal year; Q, quarter; SAPR, semiannual progress report.
Table 63. EID test performance by monthly periods (FY20 SAPR).*
County
Period of Testing
Total Annual Target (0–2 Months)
Achievement (0–2 Months)
0–2 Months 2–12
Months
Kisumu 243 23 266 860 28%
Nyamira 182 89 271 408 45%
Total 425 112 537 1,268 34%
* The EID points of care were transitioned from the Elizabeth Glaser Pediatric AIDS Foundation to NASCOP. The point of care labs have not been operational since November 2019, which has prompted facilities to revert to the use of dried blood spot in the central testing labs in the Kenya Medical Research Institute/Kisian and Walter Reed Project/Kericho. Abbreviations: EID, early infant diagnosis; FY, fiscal year; SAPR, semiannual progress report
As Table 63 presents, EID testing for infants under 2 months old was at 33% against the annual target in
the FY20 SAPR.
Discussion
In Q2, 272 virology HIV test samples were done as initial polymerase chain reaction (PCR) to HIV-
exposed infants within 12 months of age. This was an improvement from Q1 performance, which was at
265. Against the annual targets, the project achieved 38% at the SAPR. Overall county performance as at
SAPR in Kisumu was 28% and in Nyamira was 60%. For the number of EID tests done between 0 and 12
months old, Nyamira County surpassed the expected 50% performance for the SAPR period. Kisumu
County, owing to the low performance witnessed in Q1, only managed 28% against the country
operational plan 2019 target, slightly above double its Q1 performance. This low performance in Kisumu
was largely due to industrial action that affected this county for the entire Q1. This contributed to low

41
PMTCT_POS identification, as seen across the cascade from first ANC to identification. The project plans
to intensify community activities through use of community health volunteers to do household pregnancy
screening and referral for mothers who are pregnant for confirmation and start of early ANC services.
In this FY, PEPFAR provided disaggregated targets for the EID at 0 to 2 months and 2 to 12 months. The
performance in EID by 2 months of age was, on average, 34% for the two counties. Kisumu County
performed lower than Nyamira when judged against the annual target for the 0 to 2 months, 28% versus
45%, but it had more tests done early, 243 of 266 (91%), compared to 182 of 271 (67%) in Nyamira
County.
The project continued to address an inherent challenge of late presentation to the facility by the
caregivers of infants: HCWs were deficient of skills in drawing PCR samples from infants as they were
identified. Among the strategies that were launched to address this is the system known as expected date
of delivery/early EID-PCR tracking. This system follows the PMTCT mother from pregnancy, to delivery,
to the postnatal period. It works with her to establish an expected date of PCR drawing at the
recommended sixth week after birth. The nurses and mentor mothers began using this system in FY19
Q4.
The reduction in clinical and nonclinical staff could undermine the optimal benefits of this strategy. In
addition, the near collapse of the EID point-of-care system, which had reduced the turnaround time of
results to hours, may prevent optimization of very early infant testing.
Early infant diagnosis cascade and linkage of positive infants
Key results (early infant diagnosis cascade)
Project results for the EID cascade (for initial tests of infants between 0 and 12 months old) for the quarter
are shown in Table 64.
Table 64. Early infant diagnosis cascade—initial tests only (FY20 SAPR).
Category
Q1 Q2 SAPR
Annual Target No. Percent No. Percent No. Percent
Number HIV-positive women (includes post-ANC)
304 322 626
Number initial PCR at 0–12 months old
1,407 265 272 537 38%
Number confirmed PCR positive at 0–12 months old
3 1.1% 14 4.9% 17
Number PCR tested at 0–2 months old
1,268 207 215 425 33%
Percent PCR tested at 0–2 months old, against POS mothers
> 90% 68% 67% 68%
Number confirmed PCR positive at 0–2 months
3 6 9
Number total HEI PCR POS linked to treatment
3 100% 12 86% 15 80%
Number of linked PCR POS with baseline VL
3 100% 10 13 76%
Number total HEI PCR POS died before treatment
0 0% 0 0
Number LTFU 0 0% 0 0
Source: National AIDS & STIs Control Programme/early infant diagnosis website.
42
Abbreviations: ANC, antenatal care; FY, fiscal year; HEI, HIV-exposed infant; LTFU, lost to follow-up; No., number; PCR, polymerase chain reaction; POS, positive; Q, quarter; SAPR, semiannual progress report; VL, viral load.
Using the FY20 annual EID targets for initial samples from infants 0 to 12 months old, the project has
achieved 38% against the expected 50%. This was largely attributable to the low performance in Kisumu
County due to industrial action that affected maternal child health services in the county. Also, this was
affected by low identification across the cascade.
Using the PMTCT_STAT_POS (HIV-positive pregnant women with known status) indicator as the proxy
denominator for PCR testing of infants 0 to 2 months old, Afya Ziwani recorded 215 PCR at initial testing
in Q2 (67% coverage) and 425 initial tests in the SAPR, translating to a 67% coverage. This may be
attributed to the women on follow-up at the project’s HFs (especially those in Kisumu) who had delayed,
deferred, or gone elsewhere to seek infant and child services following the facility closure. Other reasons
that contributed to this low performance were mothers who came late for follow-up; missed opportunities
for sample collection due to several issues; staff reluctance to remove samples was observed across the
regions, where some health providers, especially nurse providers, viewed this activity as not part of their
duties; a skills gap especially among staff in high-volume facilities with frequent staff rotations; and
clients, who had to travel from different locations and came late (i.e., after eight weeks) for sample
collection (some were defaulters who were traced back after eight weeks).
Of the children identified in the SAPR period, 86% have been started on treatment. Two missed
opportunities arose in Q2: one transferred out and the other had not been initiated as at the close of the
quarter but has since been followed up for initiation.
Six infants who were PCR positive in Q2 were below 8 weeks of age and eight were between 2 and 12
months of age. Ten of these infants received a baseline VL—a 71% uptake compared to 100% in FY20
Q1. This is largely attributable to lack of skills in drawing plasma samples from infants since the lab
transitioned from collecting dried blood spot to plasma sample for VL. This led to some samples being
rejected because of hemolysis. The project will continue to build the capacity of HCWs on sample
collection through on-the-job training to avoid rejections and delayed sample collection due to lack of
skills.
HIV-exposed infant positivity and HIV-exposed infant mortality audits
The project conducted the Q2 HEI audit of the 14 infants identified as positive at initial testing and 1 who
turned positive on a second PCR to better understand the possible causes of transmission and find
solutions to prevent such causes, where possible. Table 65 summarizes the findings of the positivity
audits.

43
Table 65. Outcome of HEI positivity audits (FY20 Q2).
Infant PCR Audit Report Maternal Details
General Findings General Findings
Total positive PCR 15 Total mothers audited 15
Total PCR positive audited 15 100% Attended ANC 13 87%
PCR tested < 2 months 6 40% Mother’s age group
PCR tested 2–12 months 9 60% 10–19 years 0
HEI received infant prophylaxis 12 80% 20–24 years 7
Baseline VL 10 67% 25 years and above 8
Exclusive breastfeeding by 6 months
9 60%
Known positives at ANC entry 4 27%
Outcomes Newly diagnosed 11 73%
Enrolled on treatment 14 93% Partner tested 10 67%
Dead 0 0
Maternal prophylaxis received at ANC
4 27%
Lost to follow-up and unlinked 0 0 Good adherence 8 53%
Transferred out 1 7% Hospital delivery 12 80%
Disclosure done 11 73%
Mothers with high VL at ANC 0 0
Abbreviations: ANC, antenatal care; FY, fiscal year; HEI, HIV-exposed infant; PCR, polymerase chain reaction; Q, quarter; VL, viral load.
The mother-to-child transmission (MTCT) audits have revealed different reasons for MTCT of HIV. In this
quarter, key reasons included late identification—about 60% of infants’ PCR were done after 2 months—
and missed maternal prophylaxis (73%). During this reporting period, there was good uptake of ANC
services among mothers but adherence to treatment was an issue, with only 53% reporting good
adherence. Most of these mothers were still struggling to accept their status. Some, who were struggling
with disclosure, were unable to keep clinic appointments; thus, they were late to present to the HFs for
infant PCR. Most of the women’s partners know their HIV status. PNS activities carried out among the
index clients contributed to this outcome.
Missed opportunities for prophylaxis among this cohort, of whom two-thirds were newly positive, calls for
a further qualitative survey among women to understand the plausible reasons for non-adherence to
infant and/or maternal prophylaxis. Young maternal age and low PMTCT knowledge may be contributing
factors.
The project worked with other partners to improve the care given to mothers from delivery through the
postnatal period. Sensitizations at HF and community levels on the importance of hospital delivery, as
well as exit interviews to improve service delivery, were aimed at increasing uptake of skilled delivery.
PCR testing at 2 months old or older was attributed to mothers who presented late at postnatal care,
maternal appointment adherence challenges, and/or incidences of defaulting on treatment at ANC. The
project will work with mentor mothers and peer educators, together with community health volunteers, to
make sure mothers are reminded of the PCR sample collection period for timely early infant diagnosis.
This will be done through implementation of the expected date of delivery/EID-PCR log.

44
HIV-exposed infant cohort analysis (12- and 24-month cohort review)
During the reporting period, MTCT outcome results were reviewed across the 12- and 24-month cohorts.
The primary goal was to establish MTCT rates and the percentage of infants who were retained/active in
follow-up. The HEI cohort analysis outcome data for the 12-month cohort of infants on follow-up at 12
months are presented in Table 66. HEI cohort analysis outcome data for the 18-month cohort reviewed at
24 months are shown in Table 67.
Table 66. HEI analysis of 12-month cohort (FY20 Q2).
HEI Outcome Analysis of 12-month Cohort (at 12 Months)
Absolute Numbers
% Outcomes
Total enrolled into the cohort 252
Active in follow-up 207 82%
Died between 0 and 12 months old 3 1%
Missing 12-month follow-up 8 3%
Identified as positive between 0 and 12 months 5 2%
Transferred out between 0 and 12 months 29 12%
Abbreviations: FY, fiscal year; HEI, HIV-exposed infant; Q, quarter.
Table 67. HEI analysis of 18-month cohort at 24 months (FY20 Q2).
HEI Outcome Analysis of 18-month Cohort (at 24 Months) Absolute Numbers
% Outcomes
Total enrolled into the cohort 233
Active in follow-up 187 80
Active with antibody test at 18 months 181 97
HEI antibody negative at 18 months 181 78
HEI active at 18 months but no antibody test done 6 2.6
HEI identified as positive between 0 and 18 months 7 3
HEI transferred out between 0 and 18 months 23 9.9
HEI lost to follow‐up between 0 and 18 months 11 4.7
Died between 0 and 18 months 5 2.1
Abbreviations: FY, fiscal year; HEI, HIV-exposed infant; Q, quarter.
Overall, the retention rate was 82% for the 12-month cohort and 80% for the 24-month cohort. This is a
lower 12-month retention in this cohort compared to the Year 3 Q1 cohort, which had a retention of 93%.
The MTCT rate was 2.0% for the 12-month cohort and 3.0% for the 24-month cohort (with testing
between 0 and 18 months old). The project recorded 3.0% of infants missing at the 12-month follow-up
and 4.7% at the 24-month follow-up. The transfer out was recorded at 12% in the 12-month cohort and
9.9% in the 24-month cohort.
Discussion (early infant diagnosis cascade)
These data are collected at the HF level and uploaded into DHIS2. HF staff use the data to make
decisions, like early defaulter tracing and mortality audits, to determine the causes of death and how
these can be averted to prevent future deaths.

45
Overall, this is low performance in retention at 12 months compared to the expected PMTCT cohort
analysis retention rate of 90%. This was attributable to the reduced number of mentor mothers, which
affected follow-up and mentoring of mothers to adhere to treatment through 24 months. However, there
has been continued focus on promoting retention of mother-baby pairs by strengthening appointment and
defaulter-tracing systems with the use of the facility missed appointment tracking tool (FMATT) to track
daily defaulters, functional PMTCT PSSGs, quality improvement team meetings with clinicians, mentor
mothers, and capacity-building of HCWs and peer educators/mentor mothers.
Integration of ART and HEI follow-up at maternal and child health clinics also improved retention of
mother-baby pairs, as mothers get all their services from a one-stop shop, which reduces issues of
stigma. Despite this good practice, there were still challenges that hindered high-quality provision of
services to the mothers. This included some HCWs who still viewed HIV as a LIP responsibility. The
project will continue to work with the subcounty health management team to ensure the MOH nurses take
up the PMTCT services by building their capacity through on-the-job training, site mentorship, supportive
supervision, data review meetings, and data quality assessments.
10. Commodity security
The project supports 12 ARV-ordering sites (10 central and 2 stand-alone) around 113 HFs that they link
with to improve supply chain logistics and commodity management. In FY20 Q2, the project achieved full
transition of CALHIV from the nevirapine-based regimen to the currently recommended regimen by
NASCOP. The project ensured the availability of sufficient stock of the new regimen for CALHIV through
mentorship and sensitization of the facility staff and subcounty pharmacist on the appropriate
quantification and ordering process.
10.1 Key results
Nevirapine phaseout in children and adolescents living with HIV
The project transitioned the remaining two CALHIV from FY20 Q1 to non-nevirapine-based pediatric
regimens. As at FY20 Q2, the project had a total of 1,144 CALHIV under 15 years old on treatment.
Efavirenz/abacavir/lamivudine is the most common regimen among pediatrics under 15 years old, with
54% (615) of CALHIV on this regimen. Abacavir/lamivudine/lopinavir/ritonavir is the second-most
preferred regimen, with 28% (322) of CALHIV receiving this regimen. There has been a steady increase
in the number of CALHIV being transitioned to a dolutegravir-based regimen, reaching 12% (140) of all
CALHIV as at the end of the Q2.
Progress in female ART optimization
As at FY20 Q2, the project had a total of 14,804 females above 15 years old, representing 64%
(14,804/23,217) of current on ART. With recent guidance from NASCOP to transition females above 15
years old to tenofovir/lamivudine/dolutegravir, there has been a steady increase in optimization of this age
population from tenofovir/lamivudine/efavirenz to tenofovir/lamivudine/dolutegravir. At end of the reporting
period, the project had a total of 3,447 females older than 15 years of age on
tenofovir/lamivudine/dolutegravir, representing 25% (3,447) of women of ART this age group. In the
coming quarter, the program will continue scaling up female ART optimization. It will focus on sensitizing
HCWs on the NASCOP guidelines that were provided for this population.

46
Last-mile delivery of ARVs in Nyamira County
In FY20 Q2, the Kenya Medical Supplies Authority (KEMSA) added Nyamira County to the list of four
other counties (Kisumu, Machakos, Isiolo, and Embu) for last-mile distribution of ARVs. To kick start the
process, KEMSA offered a one-day sensitization to subcounty pharmacists and facility pharmaceutical
technologists in Nyamira County on appropriate quantification for last-mile distribution.
Last-mile distribution is the process wherein the distributor delivers ordered commodities to all the
ordering HFs across the county, rather than to subcounty central stores. Deliveries are quarterly rather
than monthly; hence, each facility is expected to quantify enough commodities to last for three months
with one month of buffer stock. The process starts with subcounty pharmacists allocating each facility
enough quantities of ARVs to last the whole quarter. The orders are then reviewed by the county
pharmacist before approval and submission to KEMSA for order processing. Each facility is then
expected to receive four months of ARVs based on commodity availability at KEMSA. If any ordered
commodity is missing during initial order processing, KEMSA is expected to back order supplies once the
missing commodities have been received in the warehouse.
Last-mile distribution has helped to eliminate the logistical challenges that were associated with the
previous system, including interruption of supplies, overburdening of the central stores, and additional
costs during redistribution by county and project vehicles.
Multi-month dispensing progress
In FY20 Q2, the project scaled up multi-month dispensing. It reached 62% (14,399/23,217) of those
current on ART with three or more months of drugs. A total of 16,867 were issued two or more months of
drugs, representing 73% (16,867/23,217) of those current on ART. NASCOP provided the guidance to
increase uptake of multi-month dispensing to reduce the frequency of client visits to the health facility
during the COVID-19 period. We expect to report higher percentages in Q3.
Commodity sites’ reporting rates into the Kenya Health Information System
In FY20 Q2, the project achieved an overall 98% reporting rate for submission of monthly ARV reports
into the Kenya Health Information System. Figure 3 shows reporting rate percentages for each project-
supported county in FY20 Q2.

47
Figure 1. Central and satellite ART commodity sites’ reporting rates into KHIS (FY20 Q2).
Abbreviations: ART, antiretroviral therapy; FCDRR, facility consumption and data report & report; FMAPS, facility monthly ARVs patient ssummary; FY, fiscal year; KHIS, Kenya Health Information System; Q, quarter.
Laboratory commodities
The project attained 100% reporting rates for the rapid test kits for each county, as reported in the health
commodity management platform.
10.2 Discussion
HFs maintained a high reporting rate (99.4%) in FY20 Q2 in both project-supported counties in both ARV
and laboratory commodity reporting. The project continued to support county and subcounty pharmacists
in FY20 Q2 with monthly airtime and bundles to ensure timely uploading of reports into the Kenya Health
Information System. Afya Ziwani continued to provide financial and technical support to the monthly ARV
allocation meetings at the county level to ensure accurate commodity ordering. The project also
supported quarterly rapid test kit allocation meetings in both Nyamira and Kisumu counties.
As KEMSA is conducting last-mile ARV delivery to individual sites, the project will work closely with all
facilities to monitor stock levels at facilities and support emergency ordering and redistribution in case a
particular commodity stock is running low.
10.3 COVID-19 risk and mitigation on commodity management
During this COVID-19 period, facilities have been guided to issue up to three months of ARVs to clients.
This will likely put pressure on commodity stock monitoring and management. The project has supported
subcounties to calculate and place commodity orders with KEMSA for this period to ensure there are no
interruptions in issuing up to three months of drugs.
10.4 Capacity-building initiatives in commodity management
The project supported capacity-building initiatives, such as mentorship, on-the-job training, and CME on
commodity management; pharmacovigilance reporting; and use of the electronic ARV dispensing tool
(Web ADT). Afya Ziwani, in collaboration with the Clinton Health Access Initiative, supported updates to
100%
93%98%99%
95%98%
0.0%
20.0%
40.0%
60.0%
80.0%
100.0%
Nyamira Kisumu Project FCDRR FMAPS

48
Web ADT version 3.4, which enables direct uploading of commodity reports into the Kenya Health
Information System.
To promote high-quality reporting, the project continued to provide technical assistance and mentorship
on good commodity management practices to subcounty pharmacists and medical laboratory
coordinators. The project also provided supportive supervision to rural HFs. The project supported small-
scale printing and photocopying of pharmacy tools (e.g., daily activity register, facility consumption and
data report, and facility monthly ARVs patient summary) to improve inventory management at HFs.
11. Health systems strengthening
11.1 Providing mentorship, monitoring, and advocacy capacity-building to county health
management teams and subcounty health management teams
Continuing medical education support
Afya Ziwani used three approaches to provide CME to facility-based staff: (1) on-site short sessions at a
central site based on the NASCOP CME guidelines; (2) online CME sessions over Zoom on specialized
topics, such as short-term regimens for drug-resistant TB; and (3) linking Afya Ziwani staff to the weekly
web-based Extension for Community Healthcare Outcomes (ECHO) platform and case management
sessions hosted at Jaramogi Oginga Odinga Teaching and Referral Hospital by the ICAP project.
In FY20 Q2, 1,645 HCWs from the two counties participated in on-site CME sessions. During the
reporting quarter, 43 HCWs participated in six ECHO sessions. Table 68 shows participation in CME by
topic.

49
Table 68. HF staff participation in CME by topics covered (FY20 Q2).
CME Topic Method
Number of Participants
From AZ-Supported
Sites
Number of HFs
Orientation on EDD/EID PCR tracking tool On site
26 6
PNS sensitization/overview On site
60 12
DMOC overview and documentation On site
128 27
The standards and protocols in roving clinicians Centralized at
subcounty level 6 8
The standards in VL documentation and verification On site 127 54
Updates on pediatric ART optimization—NVP phaseout ECHO 43 11
Treatment failure and IRIS On site 52 13
Pediatric/adult ART optimization On site
45 7
HTS screening tool sensitization On site
78 24
Post-exposure prophylaxis On site
32 6
ART drug-drug interaction On site
11 2
HIV status disclosure On site
28 5
VMMC On site
0 0
Hypertension management in HIV On site
0 0
Data for decision-making On site
34 5
TB active case identification On site
61 11
APOC On site
13 2
FP, preconception care, pregnancy intention screening
On site 108 39
FP integration On site
106 33
PrEP On site
78 14
TB/HIV management On site
40 14
PMTCT package of care On site 35 5
Cervical cancer screening On site 16 4
Appointment management On site 149 52
Standard package of care On site 51 10
Retention review sensitization On site
242 84
GBV overview sensitization On site
91 46
HEI screening at Immunization at 6 weeks On site
34 12

50
Abbreviations: APOC, adolescent package of care; ART, antiretroviral therapy; AZ, Afya Ziwani; CME, continuing medical education; DMOC, differentiated model of care ; ECHO, Extension for Community Healthcare Outcomes; EDD, expected date of delivery; EID, early infant diagnosis; FP, family planning; FY, fiscal year; HF, health facility; HTS, HIV testing services; IRIS, immune response of the immune system; NVP, nevirapine ; PCR, polymerase chain reaction; PLHIV, people living with HIV; PMTCT, prevention of mother-to-child transmission of HIV; PNS, partner notification services; PrEP, pre-exposure prophylaxis; Q, quarter; TB, tuberculosis; VL, viral load; VMMC, voluntary medical male circumcision.
11.3 Human resources for health support
Quantification of staffing for prioritization and planning
In FY20 Q2, Afya Ziwani employed 282 service delivery staff, comprising 79 professional HCWs, 159 lay
HCWs, 8 data clerks, and 36 sample transport bike riders across the two supported counties. Tables 69,
70, and 71 present breakdowns of staff by county and cadre.
Table 69. Health care professionals contracted (FY20 Q2).
County Total Professional HCW
RCO RN PT MLT HRIO
Kisumu 32 13 5 2 2 9
Nyamira 47 14 9 5 5 18
Total 79 27 14 7 7 27
Abbreviations: FY, fiscal year; HCW, health care worker; HRIO, health records information officer; MLT, medical laboratory technologist; PT, pharmacy technologist; RCO, registered clinical officer; RN, registered nurse; Q, quarter.
Table 70. Health care lay workers contracted (FY20 Q2).
County Total Lay HCW
HTS ASC MM PE in CCC CM
Kisumu 53 10 4 15 24 0
Nyamira 106 24 4 14 64 0
Total 159 34 8 29 88 0
Abbreviations: ASC, adherence-support counselor; CCC, comprehensive care center; CM, cough monitor; FY, fiscal year; HCW, health care worker; HTS, HIV testing services; MM, mentor mother; PE, peer educator; Q, quarter.
Table 71. Non-health-care lay workers contracted (FY20 Q2).
County Lay Worker (Other)
Data Clerk Sample Transport Riders
Kisumu 3 8
Nyamira 5 28
Total 8 36
Abbreviations: FY, fiscal year; Q, quarter.
12. Strategic monitoring and evaluation
Key results
In the quarter, 256 HCWs were reached through on-site mentorship on documentation and reporting
tools—44 in Kisumu and 212 in Nyamira. The focus was on addressing documentation challenges in
facility registers—including Daily Activity Registers, the ART register, the ANC register, HEI Cohort
Analysis, and Defaulter Tracing and Outcome Register—and compiling the monthly reports and FMATT.

51
In Nyamira County, mentorship was done in all 90 project-supported sites, particularly on documentation
of registers and patient files and submission of weekly surge reports. In sites where project-supported
staff were not placed, there were challenges with updating patients’ files and registers, and compiling
weekly project reports, high-frequency reports, and surge reports. Weekly data collection/entry and
verification were done during the quarter. Data clerks ensured that data were submitted every Friday,
entered in the Program Reporting Information Management System (PRISM), and reviewed during the
weekly surge data review before submission.
In Kisumu, one surge sensitization meeting and 25 surge data validation and verification exercises were
conducted. The project supported site-level monthly data review meetings in 25 sites before data
submission and 22 quarterly data cross checks for HTS, PMTCT, and C&T.
The project’s two county program offices conducted six monthly data review meetings, three in Kisumu
and three in Nyamira. Data discrepancies were found in the Kenya Health Information System/PRISM.
The project engaged subcounty health records information officers and these discrepancies were
corrected by the 15th of every month. The corrections reduced validation errors at the data processing
level. Additionally, Nyamira County conducted a county MOH HIV review meeting.
The primary EMR that is used in Afya Ziwani–supported sites is KenyaEMR, which is built on top of the
OpenMRS platform. The system is built with Java programming language. It runs on a Tomcat web server
and MySQL database. The EMR is installed on servers that run the Ubuntu operating system.
Collaboration with mHealth Kenya on integrating KenyaEMR with Ushauri and mLab continued. Ushauri
is an automated appointment diary, which will be responsible for sending appointment reminders to
project patients. mLab is a lab-result transmission application that will send lab results of project patients
directly to KenyaEMR. Afya Ziwani was able to successfully integrate KenyaEMR with mLab in five of
project-supported EMR sites. The project will scale this up to all supported EMR sites, as it improves data
quality and completeness in the EMR systems. However, integration of KenyaEMR with Ushauri is yet to
be achieved. Afya Ziwani is working closely with the mHealth Kenya team to achieve this.
Afya Ziwani installed 15 new EMR sites in Nyamira County, which increased the total number of
supported EMR sites from 41 to 56. EMR training was also conducted for Nyamira County, where the
project trained 130 EMR end users and county and subcounty health managers on the registration,
enrollment, C&T, maternal and child health, HTS, and defaulter-tracing modules.
Collaboration with Palladium Group continued. Palladium Group is responsible for the development of the
EMR, and Afya Ziwani is responsible for implementing and supporting the EMR at facility level. The
piloting of the PrEP module at one of the project-supported EMR sites was a success. Palladium has
since incorporated the PrEP module into their latest release of KenyaEMR. This has been upgraded in
five of the project-supported EMR sites. Afya Ziwani will upgrade all of the project-supported EMR sites
with the latest version of KenyaEMR.
Technical support, hardware maintenance, on-site mentorship, and supportive supervision have been
done and will continue to be offered to all EMR facilities. Monthly uploads of EMR data to the national
data warehouse have also been done. Table 72 below shows the service delivery points at project-
supported facilities that implemented EMRs during the reporting period.

52
Table 72. EMR distribution at service delivery points, by county (FY20 Q2).
County # Facilities with EMRs at the Following Service Delivery Points
HTS CCC ANC/Maternity EID TB/HIV
Kisumu 0 17 0 0 0
Nyamira 23 39 3 0 0
Total 23 56 3 0 0
Abbreviations: ANC, antenatal care; CCC, comprehensive care center; EID, early infant diagnosis; EMR,
electronic medical record; FY, fiscal year; HTS, HIV testing services; Q, quarter; TB,
tuberculosis.DREAMS Program Monitoring
The DREAMS program was implemented throughout the quarter. Activities were monitored by tracking
the performance against targets per intervention in all 33 wards in Homa Bay County, 8 wards in Kisumu,
and 8 wards in Migori; the project achieved 72% on the new enrollment and 75% on the social asset
building targets. The monitoring was done daily by the monitoring and evaluation LIP using the enrollment
dashboard; data were compiled weekly for project review. The use of standard operating procedures,
guidelines, data quality checks, and the EBI checklist during sessions in the enrollment period enhanced
the quality of interventions and ensured information was correct for informed decision-making.
The project also conducted focused supportive supervision in 8 wards in Kisumu, 28 wards in Homa Bay,
and 8 wards in Migori. The aim was to ensure adherence to the data management standard operating
procedures, maintain the quality of EBIs, and ensure proper documentation in all the registers, the
database, and the service uptake forms. Training of MWENDO OVC staff on the use of Open Data Kit to
enroll girls was done to support the co-enrollment process. Ward teams, including the mentors and
community health volunteers, were also trained on the use of Open Data Kit to enroll girls. Monthly
mentors’ meetings were conducted in all 51 supported wards. In Kisumu, Kondele, Railway Ahero, and
Kolwa Central wards were put on improvement plans to accelerate enrollment and service provision. The
project produced and distributed required enrollment materials, including AGYW vulnerability and
secondary service eligibility criteria forms, consent forms, assent forms, and service uptake forms.
The project conducted routine data verification checks for data consistency, accuracy, and completeness
of information documented on the registers, service uptake forms, DREAMS database, referrals tool, and
MSP planning and monitoring tool. The project provided targeted mentorship support to the ward
coordinators on programmatic gaps and data quality issues.
The project also focused on improving data quality by conducting LIP bimonthly data review meetings for
all the 51 wards at LIP level. The meetings were conducted in a central place with participation of the
program officer LIP, monitoring and evaluation LIP, and ward coordinators. The meetings were also
supported by the PATH program staff. Kisumu County conducted eight biweekly review meetings to
monitor progress on enrollment and service provision, as well as review progress in achievement of
performance plans for four wards.
Discussion
The project has implemented various activities to ensure timely data collection and reporting. This has
included blocking the first week of each month for data collection and reporting from HFs. This has
improved the response rates and timely submission to DATIM. The project has conducted monitoring and
evaluation activities and provided tools to assist in monitoring/tracking and reporting on missed

53
appointments, defaulters, lost to follow-up, and deaths. The project engaged HFs to facilitate weekly
surge reports and review of progress to ensure that monthly summaries are consistent with the weekly
aggregates.

54
Performance monitoring: Data tables
Please refer to the performance data tables in the attachment.

55
Constraints and opportunities
In the last two weeks of the quarter, the national and county governments introduced measures that were
aimed at stopping the spread of the novel coronavirus disease, COVID-19. These measures included
social distancing, restrictions on congregating of more than 15 persons, restrictions to travel resulting in
lockdowns, handwashing, and use of protective gear among the HCWs. These measures presented a
challenge as well as an opportunity to the project. These limitations meant that most of the project
activities at the HF and community levels had to stall. In the last two weeks of March, a reduction in the
testing and identification of positive clients was seen as a result of clients’ fears of visiting HFs or being
visited for PNS in the community, as well as providers’ fears of exposure. Anticipating a high defaulter
rate for clients on ART, the project undertook the NASCOP directive of pre-calling clients and providing
three-month refills of ARV, including to those who were on PrEP. For AGYW, the project paused door-to-
door enrollments and restrategized on referrals to the safe spaces that were scantily managed by the
ward coordinators and a few mentors. Service provision was limited to the individual interventions, such
as PrEP and HTS. Secondary services, such as school fees, were stopped, awaiting school reopening.
More strategies such as virtual safe spaces are to be explored for adoption as time unfolds.

56
Progress on gender strategy
Number of people receiving post-gender-based violence clinical care
minimum package
The project’s gender strategy revolves around three key intervention areas: AGYW/adolescent boys, young
men, and GBV.
Adolescent girls and young women/adolescent boys and young men
Gender is a critical determinant of the HIV epidemic, with infection rates for adolescent girls between 15
and 24 years old significantly higher than those of their male counterparts. Also, social norms can condone
violent, nonconsensual, and unprotected sex, which, combined with gender barriers, increase vulnerability,
especially of women and girls. Vulnerability to GBV, especially for AGYW, is highlighted in the project’s
Gender, Youth, and Social Inclusion Analysis. While the analysis did not find significant barriers to access
to services, the project has found that services such as PrEP require specific support to ensure access.
The Afya Ziwani project implements a comprehensive package of service interventions for AGYW, as well
as interventions for adolescent boys and young men; the aim is to achieve primary prevention of HIV.
Provision of activities to prevent and respond to gender-based
violence
GBV interventions are implemented by Afya Ziwani in partnership with the MOH, the county governments,
and other stakeholders that undertake services at the counties. The services aim to prevent and respond
to GBV through case identification and a minimum package of clinical services, referral for psychosocial
care, legal counseling, and police services. The programmatic response by the project is at facility and
community levels. At the community level, the project collaborates with the county and subcounty
community focal person, public health officer for health promotion, reproductive health coordinators, local
community-based organizations (Daraja-Mbili in Nyamira), and the county/subcounty gender department
to conduct education/awareness sessions through trained paralegals, HCWs, peer educators, and male
champions of change.
The project also provides community-level education to provide information and create demand for facility-
level post-violence care services. Other GBV response services offered at the community include active
GBV case identification through screening by community health volunteers, peer educators, and
counselors; referrals and linkages to HFs for clinical management services; and referrals and linkages to
safe houses for psychosocial services and safe shelter services using standard community-facility referral
booklets. The project integrates gender in VMMC mobilization sessions to promote female partner
involvement. The project also continues to work with other partners and gender technical working groups
in supporting nonclinical post violence care services that are offered beyond HFs, such as legal aid, child
protection, and family integration.
Key results
FY20 Q2, Afya Ziwani supported ten sites to integrate post-GBV clinical services into comprehensive HIV
prevention and C&T, up from seven in Q1. Project-supported HFs provided post-GBV clinical services to

57
395 GBV survivors (157 from sexual violence and 163 from nonsexual physical violence). Table 73
presents overall project results for FY20 SAPR.
Table 73. Provision of post-GBV clinical services (FY20 SAPR).
Gender-Based Violence Q1 Q2 SAPR Annual Targets
Achievement
Facilities supported to conduct GBV services
Number 7 10 10
GBV survivors attended to
Total 75 320 395 2,951 13%
Sexual violence 53 157 210 830 25%
Nonsexual physical violence 22 163 185 2,121 9%
Number receiving PEP (disaggregate of sexual violence)
46 127 173
Female 34 96 130
Male 12 31 43
Abbreviations: FY, fiscal year; GBV, gender-based violence; PEP, post-exposure prophylaxis; Q, quarter; SAPR, semiannual progress report.
All 320 survivors of GBV in Q2 received a minimum package of post-GBV services, as defined by national
guidelines. However, it was noted that 30 of the sexual survivors did not receive post-exposure
prophylaxis based on eligibility; follow-up is being done to ascertain if this was an omission. Lay
counselors provided on-site trauma counselling as necessary; referrals for complex cases were provided,
as per the county’s established GBV stakeholders’ network.
Discussion
In Q2, the project undertook a review of the GBV performance in FY19 and Q1 of FY20. In FY19, the
project provided post-GBV services to 1,122 (3%) people against an annual target of 41,267; the 3%
performance in Q1 was indicative that achieving the annual target would still be elusive in FY20. Gaps in
the GBV programming were identified, including a near collapse of the reporting system that was
occasioned by lack of capacity among the HCWs, who resorted to referring all cases to county referral
hospitals. To mitigate this, the project embarked on reactivation of the GBV focal persons at county,
subcounty, and facility levels; these persons were supported to sensitize select HFs across the two
counties on GBV management; reactivate the GBV technical working groups; and conduct supportive
supervision. The project provided data capture tools such as post-rape care forms and registers. These
efforts saw an increase in the number of reporting sites to ten and a threefold increase in the reported
cases, from 75 in Q1 to 320 in Q2.
To achieve the annual target of 2,951 cases, continued effort on facility identification and reporting of all
forms of GBV is paramount. As assessment showed that 56 HFs met the criteria of providing a minimum
package of post-GBV services. These facilities are targeted for contribution to achieving the FY20 target.
The project will continue to work with the legal services, strengthen multisectoral GBV referral and linkage,
and promote ownership of the GBV service provision to improve prosecution of the perpetrators.

58
Progress on environmental mitigation and monitoring
The project supports an annual environmental mitigation, monitoring, and reporting plan as part of its
annual work plan. The focus this reporting quarter included strengthening health care waste management
at all levels of health care service delivery in supported counties, especially at the testing points, VMMC
minor theaters, and laboratories.
During the reporting period, the project provided health care waste management commodities for
infection prevention and control, supported capacity-building, and conducted supportive supervision with
focus on mentorship and on-the-job training for HTS providers, HCWs, DREAMS LIP staff, and VMMC
teams on proper waste management. The project provided bin liners to nine VMMC sites during the
acceleration period for VMMC in March 2020 and for FF outreaches to facilitate compliance with waste
management policies.
The project also mentored facility staff, especially those in pharmacy and laboratory departments, on
separating and removing expired commodities from their stores; labelling expired commodities clearly to
mitigate accidental use of expired commodities; and following correct procedures for destroying expired
commodities. The project worked closely with counties and hospital management teams to transport
waste generated at facilities without incinerators to functional incinerators.

59
Progress on links to other USAID and Centers for Disease
Control and Prevention programs
In FY20 Q2, Afya Ziwani continued to collaborate with three key programs—Human Resources for Health
Kenya, Palladium Group, and mHealth Kenya—as detailed below.
The project collaborated with Human Resources for Health Kenya to strengthen county and subcounty
human resources for health management capacities, including use of iHRIS (integrated human resources
information system). The data for the project’s contracted human resources for health were uploaded into
the system.
The project also collaborated with the Palladium Group to improve county and facility use of EMRs, which
included training project staff on selected KenyaEMR modules. The pilot of the PrEP module at one
project-supported facility was concluded in the quarter, followed by the incorporation of this module into
the latest release of KenyaEMR. This newer version was installed in five of the project-supported
facilities, with others awaiting deployment in Q3.
Finally, the project successfully worked with mHealth Kenya on the installation of two of their information
and communication technology solutions (Ushauri and mLab) into the KenyaEMR in five project-
supported sites.

60
Progress on links with Government of Kenya agencies
During the quarter, Afya Ziwani supported several county and subcounty activities and collaborations, as
presented throughout the above sections of this report. Of note, the project partnered with the MOH to
support service delivery activities at HFs and AGYW safe spaces, including capacity-building activities,
such as trainings, orientations, mentorship, supportive supervision visits, and review meetings. Key
collaborations during the reporting period are noted in Table 74 below.
Table 74. Government ministries and departments that Afya Ziwani collaborated with (FY20 Q2).
Government of Kenya Agency Component Areas of Linkage
Ministry of Health Biomedical
services
• Standards of care and SOPs.
• Distribution of key commodities and supplies.
• Facilitation of trainings.
• TWGs.
• National databases.
• Provision of biomedical outreach and referral services for AGYW.
• Support supervision.
Department of Youth and Gender,
Children Services
Youth Enterprise Development Fund
Social asset
building
• Safe spaces for girls.
• Gender-based TWGs.
• Stakeholder forums.
Ministry of Education, Science and
Technology Education
• Safe spaces.
• School fees.
• Vocational training.
Ministry of Internal Security (Kenya
Police)
Provincial administration
County government
Security and
accountability
• Post-GBV care for AGYW—accountability/legal support.
• Security at safe spaces.
• Bursaries.
Abbreviations: AGYW, adolescent girls and young women; FY, fiscal year; GBV, gender-based violence; Q, quarter; SOP, standard operating procedure; TWG, technical work group.

61
Global development alliance (if applicable)
Not applicable.

62
Subsequent quarter’s work plan
Table 75 summarizes the status of the FY20 work plan in Q2.
Table 75. Work plan activities and statuses for increased and expanded high-quality HIV services (FY20 Q2).
Key Planned Activities from Previous Quarter(s)
Actual Status Q2 Explanations for Deviations
Complete subcontracts for 4 LIPs to conduct AGYW activities at 51 wards of 24 subcounties of 3 counties
Successfully completed in Q2 N/A
Develop and submit a revised technical and cost proposal for Afya Ziwani in line with the revised geographic and activity scopes
Successfully completed and submitted in Q2
Co-enroll the 9- to 17-year-old girls with Catholic Relief Services/MWENDO
Only 6,820 girls have been co-enrolled. The performance for the 15 to 17-year-olds was not optimal
The OVC/MWENDO project has 80% of the girls enrolled as 9 to 14 years old.
Support facility mentorship activities by the mentoring teams for ART, PMTCT, HTC, lab, and pharmacy
Fully accomplished in the quarter
N/A
Support facility-based CME for TB/HIV service delivery on a quarterly basis
Fully accomplished in the quarter
N/A
Support the laboratory-networking model (CD4, EID, biochemistries, hematology, and viral load)
Fully accomplished in the quarter
N/A
Optimize the pediatric ART treatment
Transitioned all the children on NVP-based regimen and improved the dolutegravir-based regimen from 8.7% to 14.0%
N/A
Support TB/HIV reporting to meet COP19 quarterly targets
Fully accomplished in the quarter
N/A
Support accelerated ART enrollment and retention activities
Fully accomplished in the quarter
N/A
Expansion of EMRs to an additional 13 sites
Fully implemented, with expansion to 15 sites in Nyamira County for a total of 56 project sites
N/A
Support RDQA for EMRs Fully accomplished in the quarter
N/A
Support facility ART/PMTCT defaulter-tracing mechanisms (diaries, peer educators, airtime, and mobile phone–based reminders) and the revised appointment management system
Fully accomplished in the quarter
N/A
Support facility PLHIV support group monthly meetings (including pediatric, male, adolescent, PMTCT, general CCC)
Not accomplished The budget cuts affected the implementation of these activities

63
Support HIV counseling and testing of pregnant mothers and mother-baby pairs at ANC and MCH clinics
Fully accomplished in the quarter N/A
Provide HCW mentorship on elimination of mother-to-child transmission of HIV
Fully accomplished in the quarter N/A
Support nonclinical counselors Fully accomplished in the quarter N/A
Support drug-resistant TB patients to access treatment
Fully accomplished in the quarter N/A
Abbreviations: AGYW, adolescent girls and young women; ANC, antenatal care; ART, antiretroviral therapy; CCC, comprehensive care center; CD4, cluster of differentiation 4; CME, continuing medical education; COP, country operational plan; EID, early infant diagnosis; EMR, electronic medical record; FY, fiscal year; HCW, health care worker; HTC, HIV testing and counseling; LIP, local implementing partner; MCH, maternal and child health; MWENDO, Making Well-informed Efforts to Nurture Disadvantaged Orphans and Vulnerable Children; NVP, nevirapine; N/A, not applicable; PLHIV, people living with HIV; PMTCT, prevention of mother-to-child transmission of HIV; PrEP, pre-exposure prophylaxis; Q, quarter; RDQA, routine data quality assessments; TB, tuberculosis.

64
Budget and expenditure details
The project’s total expected costs are US$64,993,553. The current cumulative obligation is at
US$36,847,312. The project’s cumulative expenditure, as presented in Figure 4, is US$33,702,822.
Figure 4 also shows the project’s expenditure status and financial projections.
Source: Project financial records, March 2020.
Abbreviations: FY, fiscal year; Q, quarter.
$33,702,822
$1,543,052 $1,674,070
$8,151,603
$3,402,636
$36,847,312
$0
$5,000,000
$10,000,000
$15,000,000
$20,000,000
$25,000,000
$30,000,000
$35,000,000
$40,000,000
CumulativeExpenses (Oct-17
- Mar 20)
FY 20 Q3(ProjectedExpenses)
FY20 Q4(ProjectedExpenses)
FY20budget FY20 (ActualExpenses to Mar
20)
CumulativeObligation
Expenditure Status and Projections
Figure 4. Expenditure status and financial projections (pipeline) in US dollars (FY20 Q2).

65
Actual expenditure and future projections details
Total Expected Costs: US$64,993,553.00
Cumulative Obligation: US$36,847,311.87
Cumulative Expenditure (March 2020):
US$$33,702,821.59
Actual expenditures for the FY, against major budget line items, are presented in Table 76.
Table 76. Actual expenditure details, in US dollars (FY20 Q2).
Line Items Obligation FY20 Q2
(Cumulative Expenditures)
FY20 Q3 (Projected
Expenditures)
FY20 Q4 (Projected
Expenditures)
Personnel $6,330,979.64 $397,981.89 $318,385.51
Consultants $94,724.74 $0.00 $0.00
Travel and transportation
$609,098.93 $39,646.65 $31,717.32
Other direct costs $19,634,520.25 $853,219.68 $682,575.74
Overhead $6,115,131.03 $252,203.70 $201,762.96
Fixed fee $918,367.00 $0.00 $439,628.39
Total $36,847,311.87 $33,702,821.59 $1,543,051.92 $1,674,069.93
Source: Project financial records, March 2020.
Abbreviations: FY, fiscal year; Q, quarter.
Expenditure notes
Table 77. Expenditure notes.
Personnel The project maintained a lean staffing level during the reporting period.
Consultants The project does not anticipate hiring any consultant in the next two quarters.
Travel and
transportation
This has significantly reduced, as the project implements HIV service delivery activities in two counties, Kisumu and Nyamira. A fall in the staffing level has also contributed to the reduction in the travel and transportations costs.
Other direct costs This has reduced significantly, in keeping with the reduced FY20 funding levels. However, the project plans to make direct school and vocational education payments to support AGYW in the next quarter.
Overhead Calculated as per contract terms and conditions.
Fixed fees Earned as per contract terms and conditions. Due to be earned in Q4.
Abbreviations: AGYW, adolescent girls and young women; FY, fiscal year; Q, quarter.

66
Activity administration
Personnel There was a change in key personnel during the reporting period, with the Director of Finance and
Administration, Paul Madao, transitioning out of the project. The position was taken up, in acting capacity,
by Terry Opiyo. The project has advertised the open position and plans to fill it in Q3
Contract amendments The project received a fully executed contract modification from the USAID contracting officer on March
13, 2020. This was after submission of a revised technical and cost proposal early in Q2. The
modification expunged the positions of Deputy Chief of Party and Health System Strengthening Advisor
from the key personnel list and introduced revised requirements for the Chief of Party. The project has
commenced the recruitment of the two key personnel positions, the Director of Finance and
Administration and Chief of Party. The contract modification also bore the consent for the two key-
population LIPs, Keeping Alive Societies’ Hope, and Men Against AIDS Youth Group.
Subcontractors The project terminated the subcontract with Kenya Red Cross Society, which had been engaged in FF
programming. No other new engagements were made; however, the project kicked off the internal PATH
process of engaging the two key-population LIPs, which shall sign subcontracts in Q3.
Other significant approval(s) from USAID The contracting office approved Afya Ziwani’s fixed fee submission for FY19 Q4 of a total of US$348,132.
The project also secured an approval for the second six months of the AGYW work plan.

67
GPS information
Please see the GPS information sheet in the attachment.

68
Success story: Viral resuppression in a child and an
adolescent in Nyamira County
Case 1: Nyamusi Subcounty Hospital
This is the case of a 9-year-old male, born on May 22, 2012, who was under the care of his stepmother and
father. The child was abandoned by his mother at the age of 1 month after she was diagnosed HIV positive
in the early postnatal period. Both the child’s stepmother and father were HIV negative.
The child was diagnosed HIV infected through antibody testing at 5 years old on May 11, 2017; it was most
likely a case of vertical transmission. He was initiated on treatment on November 15, 2017, on an
efavirenz/abacavir/lamivudine regimen. The child was being brought to the clinic by his stepmother. After
six months of antiretroviral therapy, a routine viral load test on May 22, 2018, showed high copies of 46,291.
Enhanced adherence sessions commenced, including a home visit, to determine any barriers to treatment.
The sessions revealed that the child was left on his own to come to the clinic to pick up his drugs and to
take his drugs. A one-on-one talk between an adherence support counselor and the child revealed that the
child was not taking his drugs since he did not know how to take them, and his stepmother and father could
not support him. In the session, the child’s said, “Mama and Baba tell me: ‘Go away and take your drugs
sick child’’’ (translated from the Abagusii language).
After establishing this lack of positive parenting, the facility decided to fully involve the father in his child’s
treatment. The caregivers shared that they stopped supporting the child to get treatment because of the
following reasons: Stigma was the major issue; the parents did not want to be associated with an HIV-
infected child. Lack of knowledge about HIV/AIDS was the second issue; the parents were worried their
other children would be infected by this child, so they discriminated against him and prevented him from
having any social contact with other members of the household. Other issues included the challenge of
raising an HIV-positive child when the parents were both HIV negative and, for the stepmother, the fact that
she was raising someone else’s child.
In counseling sessions, the father was assured that his child would be in better health if he were on
treatment than if not and that his child would live longer if he adhered well to treatment. The father also was
reminded that the child needed the support of his caregivers to live and do well on treatment. The father
was still resistant, so the Public Health Officer was brought on board to explain to the father the Public
Health Act consequences if he refused to support the child to access and stay on treatment. With this
“threat” and continuous counseling, the father slowly developed positive thinking. He started to follow the
guidance that the providers gave him during the enhanced adherence sessions. He later offered to be a
treatment buddy for the child and invited the child’s stepmother into the counseling sessions to provide
more support to the child.
The father adhered to appointments and every intervention to monitor the child as he took his drugs. A
repeat viral load test on January 4, 2020, showed the child resuppressed, with 184 copies. At the household,
the child was accepted positively and given the chance to associate with the other children without
discrimination. The child was also linked to a program for orphans and vulnerable children for support.
The child is currently doing well on treatment. Partial disclosure has been initiated by the caregiver.

69
Lesson learnt: Caregiver literacy classes are key for caregivers to understand HIV/AIDS and their role in
supporting the infected. The facility is in the process of engaging the father as a caregiver mentor to other
caregivers.
Case 2: Kenyoro Health Center
This is the case of an adolescent client, who was born on June 15, 2003. She is 16 years old now. She has
been enrolled on a tenofovir/abacavir/lamivudine regimen for 13 years. Since May 2015, she has been
followed up at Kenyoro Health Center comprehensive care center.
The client had been adhering well to her medication until she attended boarding school. There, she became
afraid to take her medication as advised, so she left some drugs at home. Her viral load results from a
sample collected in June 2019 were 1,814 copies/mL. Since she was in school and defaulted for two
months, enhanced adherence counseling sessions were delayed. The sessions were initiated on November
20, 2019.
The major issue identified as a barrier to treatment was stigma from her peers, which resulted in her
skipping her daily medication at the appropriate time. Facility providers decided to involve one of her
confidants, preferably a teacher to monitor and guide her through her medication while at school. The client
identified the school Deputy Principal, with whom the facility collaborated to conduct directly observed
therapy sessions. The Deputy Principal could call the adolescent at the time that she needed to take her
medication so that she could take them from the Deputy Principal’s office daily. The facility and the Deputy
Principal also ensured that the adolescent had extra drugs in case the Deputy Principal was away from
school. After three months of satisfactory adherence and follow-up with the Deputy Principal by the health
provider, a confirmatory viral load test on February 20, 2020, showed that the adolescent resuppressed,
with 105 copies/mL.
After the client confirmed her HIV-positive status, she decided to be open and to serve as a role model for
the many adolescents who suffer from stigma associated with HIV. She began serving as a mentor and
champion to other adolescent clients in the facility. During an adolescent clinic that was held on April 21,
2020, the client was successful in convincing an adolescent defaulter through a phone call to come for care.
On April 24, 2020, the adolescent who had defaulted since November 2019 came back for treatment. The
client is now a treatment buddy and mentor to the adolescent who defaulted due to disclosure and stigma
issues.
The client, who is now an adolescent champion, has decided to be open and to share her HIV status in her
school and community to support other adolescents who are suffering from stigma.
Lessons learnt: Disclosure and support improve adherence to treatment, especially among children and
adolescents. Giving adolescents the chance to choose their confidant is a plus. In this case study, this built
trust between the adolescent and her confidant; thus, they achieved the Operation Triple Zero initiative
outcomes.