Advisory Editors: Why do firms pay dividends? International evidence on the determinants of dividend...
21
JOURNAL OF Financial ECONOMICS Volume 88, Issue 1, April 2008 ISSN 0304-405X Why do firms pay dividends? International evidence on the determinants of dividend policy $ David J. Denis a, , Igor Osobov b a Krannert School of Management, Purdue University, West Lafayette, IN 47907, USA b Kelley School of Business, Indiana University, Bloomington, IN 47405, USA article info Article history: Received 5 September 2006 Received in revised form 4 June 2007 Accepted 22 June 2007 Available online 15 March 2008 JEL classification: G32 G35 Keywords: Dividend policy International abstract In the US, Canada, UK, Germany, France, and Japan, the propensity to pay dividends is higher among larger, more profitable firms, and those for which retained earnings comprise a large fraction of total equity. Although there are hints of reductions in the propensity to pay dividends in most of the sample countries over the 1994–2002 period, they are driven by a failure of newly listed firms to initiate dividends when expected to do so. Dividend abandonment and the failure to initiate by existing nonpayers are economically unimportant except in Japan. Moreover, in each country, aggregate dividends have not declined and are concentrated among the largest, most profitable firms. Finally, outside of the US there is little evidence of a systematic positive relation between relative prices of dividend paying and non-paying firms and the propensity to pay dividends. Overall, these findings cast doubt on signaling, clientele, and catering explanations for dividends, but support agency cost-based lifecycle theories. & 2008 Elsevier B.V. All rights reserved. 1. Introduction Why do some firms pay dividends while others do not? Since the publication of the original Miller and Modigliani (1961) irrelevance propositions, this question has puzzled financial economists. Traditionally, finance scholars em- phasize explanations for dividends that are based on the desire to communicate information to shareholders or to satisfy the demand for payouts from heterogeneous dividend clienteles [see the Allen and Michaely (2003) survey]. Recently, however, DeAngelo, DeAngelo, and Skinner (2004) cast doubt on signaling and clientele considerations as first-order determinants of dividend policy by reporting that dividends in the US are increas- ingly concentrated among a small number of large payers. An alternative view of dividends, proposed by DeAn- gelo and DeAngelo (2006), is that optimal payout policy is driven by the need to distribute the firm’s free cash flow. They propose a life-cycle theory that combines elements of the Jensen (1986) agency theory with evolution in the firm’s investment opportunity set of the type discussed in Fama and French (2001) and Grullon, Michaely, and Swaminathan (2002). In this theory, firms optimally alter dividends through time in response to the evolution of their opportunity set. The theory predicts that, in their early years, firms pay few dividends because their investment opportunities exceed their internally gener- ated capital. In later years, internal funds exceed invest- ment opportunities so firms optimally pay out the excess funds to mitigate the possibility that the free cash flows would be wasted. Consistent with this life-cycle view, DeAngelo, DeAngelo, and Stulz (2006) find that the propensity to pay dividends is positively related to the ratio of retained earnings to total equity, their proxy for the firm’s life-cycle stage. Contents lists available at ScienceDirect journal homepage: www.elsevier.com/locate/jfec Journal of Financial Economics ARTICLE IN PRESS 0304-405X/$ - see front matter & 2008 Elsevier B.V. All rights reserved. doi:10.1016/j.jfineco.2007.06.006 $ We thank Yakov Amihud, Harry DeAngelo, Linda DeAngelo, Diane Denis, Jim Hsieh, Omesh Kini, Erik Lie, John McConnell, Lalitha Naveen, Raghu Rau, Steve Smith, Jeff Wurgler, an anonymous referee, and seminar participants at the University of Colorado, Georgia State University, and Purdue University for helpful comments. Corresponding author. E-mail address: [email protected] (D.J. Denis). Journal of Financial Economics 89 (2008) 62– 82
Transcript of Advisory Editors: Why do firms pay dividends? International evidence on the determinants of dividend...
ARTICLE IN PRESS
Volume 88, Issue 1, April 2008ISSN 0304-405X
Managing Editor:Contents lists available at ScienceDirect
JOURNAL OFFinancialECONOMICSG. WILLIAM SCHWERT
Founding Editor:MICHAEL C. JENSEN
Advisory Editors:EUGENE F. FAMA
KENNETH FRENCHWAYNE MIKKELSON
JAY SHANKENANDREI SHLEIFER
CLIFFORD W. SMITH, JR.RENÉ M. STULZ
Associate Editors:HENDRIK BESSEMBINDER
JOHN CAMPBELLHARRY DeANGELO
DARRELL DUFFIEBENJAMIN ESTY
RICHARD GREENJARRAD HARFORD
PAUL HEALYCHRISTOPHER JAMES
SIMON JOHNSONSTEVEN KAPLANTIM LOUGHRAN
MICHELLE LOWRYKEVIN MURPHYMICAH OFFICERLUBOS PASTORNEIL PEARSON
JAY RITTERRICHARD GREENRICHARD SLOANJEREMY C. STEIN
JERRY WARNERMICHAEL WEISBACH
KAREN WRUCK
Journal of Financial Economics
Journal of Financial Economics 89 (2008) 62– 82
0304-40
doi:10.1
$ We
Denis, J
Raghu
seminar
Univers� Cor
E-m
Published by ELSEVIERin collaboration with theWILLIAM E. SIMON GRADUATE SCHOOL OF BUSINESS ADMINISTRATION, UNIVERSITY OF ROCHESTER
Available online at www.sciencedirect.com
journal homepage: www.elsevier.com/locate/jfec
Why do firms pay dividends? International evidence on thedeterminants of dividend policy$
David J. Denis a,�, Igor Osobov b
a Krannert School of Management, Purdue University, West Lafayette, IN 47907, USAb Kelley School of Business, Indiana University, Bloomington, IN 47405, USA
a r t i c l e i n f o
Article history:
Received 5 September 2006
Received in revised form
4 June 2007
Accepted 22 June 2007Available online 15 March 2008
JEL classification:
G32
G35
Keywords:
Dividend policy
International
5X/$ - see front matter & 2008 Elsevier B.V.
016/j.jfineco.2007.06.006
thank Yakov Amihud, Harry DeAngelo, Lind
im Hsieh, Omesh Kini, Erik Lie, John McConn
Rau, Steve Smith, Jeff Wurgler, an anony
participants at the University of Colora
ity, and Purdue University for helpful comme
responding author.
ail address: [email protected] (D.J. Denis).
a b s t r a c t
In the US, Canada, UK, Germany, France, and Japan, the propensity to pay dividends is
higher among larger, more profitable firms, and those for which retained earnings
comprise a large fraction of total equity. Although there are hints of reductions in the
propensity to pay dividends in most of the sample countries over the 1994–2002 period,
they are driven by a failure of newly listed firms to initiate dividends when expected to
do so. Dividend abandonment and the failure to initiate by existing nonpayers are
economically unimportant except in Japan. Moreover, in each country, aggregate
dividends have not declined and are concentrated among the largest, most profitable
firms. Finally, outside of the US there is little evidence of a systematic positive relation
between relative prices of dividend paying and non-paying firms and the propensity to
pay dividends. Overall, these findings cast doubt on signaling, clientele, and catering
explanations for dividends, but support agency cost-based lifecycle theories.
& 2008 Elsevier B.V. All rights reserved.
1. Introduction
Why do some firms pay dividends while others do not?Since the publication of the original Miller and Modigliani(1961) irrelevance propositions, this question has puzzledfinancial economists. Traditionally, finance scholars em-phasize explanations for dividends that are based on thedesire to communicate information to shareholders or tosatisfy the demand for payouts from heterogeneousdividend clienteles [see the Allen and Michaely (2003)survey]. Recently, however, DeAngelo, DeAngelo, andSkinner (2004) cast doubt on signaling and clienteleconsiderations as first-order determinants of dividend
All rights reserved.
a DeAngelo, Diane
ell, Lalitha Naveen,
mous referee, and
do, Georgia State
nts.
policy by reporting that dividends in the US are increas-ingly concentrated among a small number of large payers.
An alternative view of dividends, proposed by DeAn-gelo and DeAngelo (2006), is that optimal payout policy isdriven by the need to distribute the firm’s free cash flow.They propose a life-cycle theory that combines elementsof the Jensen (1986) agency theory with evolution in thefirm’s investment opportunity set of the type discussed inFama and French (2001) and Grullon, Michaely, andSwaminathan (2002). In this theory, firms optimally alterdividends through time in response to the evolution oftheir opportunity set. The theory predicts that, in theirearly years, firms pay few dividends because theirinvestment opportunities exceed their internally gener-ated capital. In later years, internal funds exceed invest-ment opportunities so firms optimally pay out the excessfunds to mitigate the possibility that the free cash flowswould be wasted. Consistent with this life-cycle view,DeAngelo, DeAngelo, and Stulz (2006) find that thepropensity to pay dividends is positively related to theratio of retained earnings to total equity, their proxy forthe firm’s life-cycle stage.
ARTICLE IN PRESS
D.J. Denis, I. Osobov / Journal of Financial Economics 89 (2008) 62–82 63
Yet a further wrinkle in the dividend puzzle literatureis presented in Fama and French (2001). Fama and Frenchreport a substantial decline in the proportion of firmspaying dividends in the US. Although this decline is due inpart to changes in the characteristics of firms that arepublicly traded (i.e., more firms exhibit characteristicssimilar to those of nondividend-paying firms), Fama andFrench nonetheless report that, once they control for thesecharacteristics, they still find a significant decline in theresidual propensity to pay dividends. This evidence posesa further challenge to dividend theories in so far ascandidate theories should be able to explain time serieschanges in the propensity to pay dividends.
We extend this literature by examining cross-sectionaland time-series evidence on the propensity to paydividends in several developed financial markets (theUnited States, Canada, the United Kingdom, Germany,France, and Japan) over the period 1989–2002. Specifi-cally, we examine whether the characteristics of dividendpayers and nonpayers are common across countries,whether these characteristics have changed over time,and whether firms in other countries exhibit a decliningpropensity to pay dividends in recent years. In addition,the use of international data allows us to provide furthertests of the life cycle, signaling, clientele, and cateringexplanations by analyzing the concentration of dividendpayments as well as the association between the Bakerand Wurgler (2004a, b) dividend premium and thepropensity to pay dividends in other countries.
Our evidence reveals common determinants of divi-dends across countries. Like Fama and French (2001), wefind that the likelihood of paying dividends is associatedwith firm size, growth opportunities, and profitability.1 Inaddition, we find that in all six countries, the likelihood ofpaying dividends is strongly associated with the ratio ofretained earnings to total equity (the earned/contributedcapital mix). The fraction of firms that pay dividends ishigh when firms’ equity consists primarily of retainedearnings and is low when retained earnings are negative.Notably, firms in each country become more likely overtime to exhibit the characteristics of firms that do not paydividends (i.e., the average firm is less profitable and haslower earned/contributed capital).
Controlling for these characteristics, we find somehints of declines in the propensity to pay dividends inmost of the sample countries, particularly among thosefirms that appear to be at the margin for payingdividends; i.e., those with low to medium ratios ofearned-to-contributed capital. However, outside of theUS, the declines are small and the evidence is notparticularly robust. Moreover, to the extent that thereare propensity declines, they are driven primarily by thefailure of newly listed firms to initiate dividends whenexpected to do so. Dividend abandonments and the failureto initiate by existing nonpayers are economically unim-portant except in Japan. Even in Japan, however, we find
1 Benito and Young (2001), Ferris, Sen, and Yui (2006), and
Renneboog and Trojanowski (2005) find similar evidence on the
determinants of dividends in the UK, while von Eije and Megginson
(2006) report similar findings in a sample of European Union firms.
that unexpected abandonments can be plausibly ex-plained by financial difficulties experienced by Japanesefirms during the economic slowdown of the 1990s. Thebottom line, therefore, is that the data cannot reject thehypothesis that there has been no meaningful change incorporate dividend policies in the sample countries overthe 1989–2002 period. While we also cannot reject thepossibility that there have been small reductions in thepropensity to pay dividends in some countries, suchreductions are at most limited to newly listed firms.
The importance of the mix of earned/contributedequity as a determinant of dividend policies around theworld casts doubt on the importance of signaling as afirst-order determinant of dividend policies. As noted inDeAngelo, DeAngelo, and Stulz (2006), firms with lowearned/contributed equity would appear to be the idealcandidates for dividend signaling because these firms areless mature and it is, therefore, more difficult to gaugetheir future prospects. Yet, these are precisely the firmsthat do not pay dividends.
We provide further evidence on the signaling, clientele,and life-cycle explanations by examining the concentra-tion of dividends and earnings. Consistent with theDeAngelo, DeAngelo, and Skinner (2004) US evidence,we find that aggregate dividends do not decline over time.Moreover, dividends are concentrated among the largest,most profitable payers in all six countries. This concentra-tion casts further doubt on signaling as a first-orderdeterminant of dividends in that dividends appear to bepaid by precisely those firms that are least in need ofsignaling their profitability (i.e., those with the highestearnings). Even if there was reduced demand for signalingover time, this demand would presumably arise fromsmaller, less profitable firms. Similarly, the concentrationof dividends and earnings casts doubt on the centralassumption of clientele theories that investors can satisfytheir demand for dividends while still achieving suitablelevels of diversification. This conclusion is reinforced byour finding that, in recent years, dividend payers accountfor more than 90% of the aggregate market capitalizationin all countries except the US and Canada. Moreover, inthese countries, the top 20% of dividend payers accountfor virtually all of the market capitalization of dividendpayers. The concentration of dividends among the largest,most profitable firms is, however, consistent with the life-cycle theory’s central prediction that the distribution offree cash flow is the primary determinant of dividendpolicy.
Finally, we explore the catering explanation by exam-ining the association between the propensity to paydividends and the Baker and Wurgler (2004a, b) dividendpremium. Our evidence fails to provide much support forthe catering hypothesis outside of the US. Little evidenceexists that either the propensity to pay dividends or time-series changes in that propensity can be explained bychanges in investor sentiment toward dividend-payingstocks. Moreover, we find little evidence that individualfirms start and stop the payment of dividends in responseto the market’s relative valuation of dividend paying firms.
The remainder of the paper is organized as follows.Section 2 describes our sample selection procedure and
ARTICLE IN PRESS
D.J. Denis, I. Osobov / Journal of Financial Economics 89 (2008) 62–8264
provides a description of the sample firms. Section 3reports evidence on the determinants of dividends.Section 4 reports time-series trends in the propensity topay dividends in our sample countries. Section 5 providesevidence on the concentration of dividends and earnings.Section 6 reports evidence on tests of the cateringhypothesis. Section 7 concludes.
2. Sample selection and data description
Our sample is constructed using Worldscope datacollected via Thomson One Banker Analytics. The initialsample includes all firms for which Worldscope providesinformation on total assets, common equity, net income,interest expense, and either market capitalization at fiscalyear-end or the number of outstanding shares and fiscalyear-end closing price. We also require total assets to beavailable both in the current and in the preceding year, thesample firms to have nonmissing information for commondividends, and the sample firms to have nonmissinginformation on the method of reporting long-terminvestments in which they have interest in excess of50%.2 We exclude firms for which the primary outstandingsecurity is not common stock or for which information onthe type of primary outstanding security is missing. Also,following Fama and French (2001),we exclude utilities[standard industrial classification (SIC) codes 4900-4949],financial firms (SIC codes 6000-6999), and firms withnegative book equity. Finally, to alleviate distorting effectsfrom off-balance sheet operations that are possible insome countries, we include only those firms thatconsolidate their major subsidiaries.
Worldscope coverage prior to 1985 is limited. In theAppendix A, we report the average number of firms thatsatisfy our data requirements in the countries studied byLaPorta, Lopez-de-Silanes, Shleifer, and Vishny (LLSV,2000). These data confirm the sparse coverage in allcountries in the 1981–1985 period. In addition, ourexperimental design requires a sufficient number ofdividend payers and nonpayers over an approximately15-year period. This additional constraint limits the set ofcountries that we include in the sample to the US, UK,Canada, Germany, France, and Japan.
Because of the expanding coverage of Worldscope, thenumber of firms grows significantly between 1981 and2002 in all six countries. Particularly steep increases infirm counts are observed between 1987 and 1989 forCanada, the UK, Germany, and France. In addition, ourprimary tests require data on book equity, and this dataare generally not available in most of the countries priorto 1989. For these reasons, therefore, we analyze dividendpolices in the selected countries over the 1989–2002 timeperiod.
Nonetheless, the sample size in each country increasesover time. These data limitations pose two empirical
2 Specifically, we use the common dividends field when available. If
this information is missing, but information on total dividends and
preferred dividends is nonmissing, we estimate common dividends as
the difference between total dividends and preferred dividends.
challenges. First, the shorter sample period limits ourability to fully address changes in the propensity paydividends over time (though our ability to analyze cross-sectional determinants is not affected). We measure suchchanges over a 9-year period (1994–2002) as opposed tothe Fama and French (2001) 21-year period (1978–1998).Had Fama and French limited their study to a 9-yearmeasurement period, the declines in the propensity to paydividends that they show would have been roughly cut inhalf. Second, we must be concerned that increases in thenumber of firms over time that are the result of changes inWorldscope coverage might produce biases in our esti-mates of the change in dividend propensity. For example,the data in the Appendix A show that virtually all firmscovered by Worldscope in the 1981–1985 period aredividend payers. This implies that Worldscope first coverslarger, more mature firms, then adds smaller, less maturefirms over time. Because the latter firms are less likely tobe dividend payers and our model for predicting dividendpayers is imperfect, such a coverage pattern can show upempirically as a decline in the propensity to pay dividendseven if no such decline exists. Throughout the paper,therefore, we discuss the various steps that we take tomitigate concerns about the changing sample size andnote any residual caveats in the interpretation of ourfindings.
3. Determinants of the propensity to pay dividends
In this section, we describe the empirical determinantsof the propensity to pay dividends in the samplecountries.
3.1. Univariate analysis
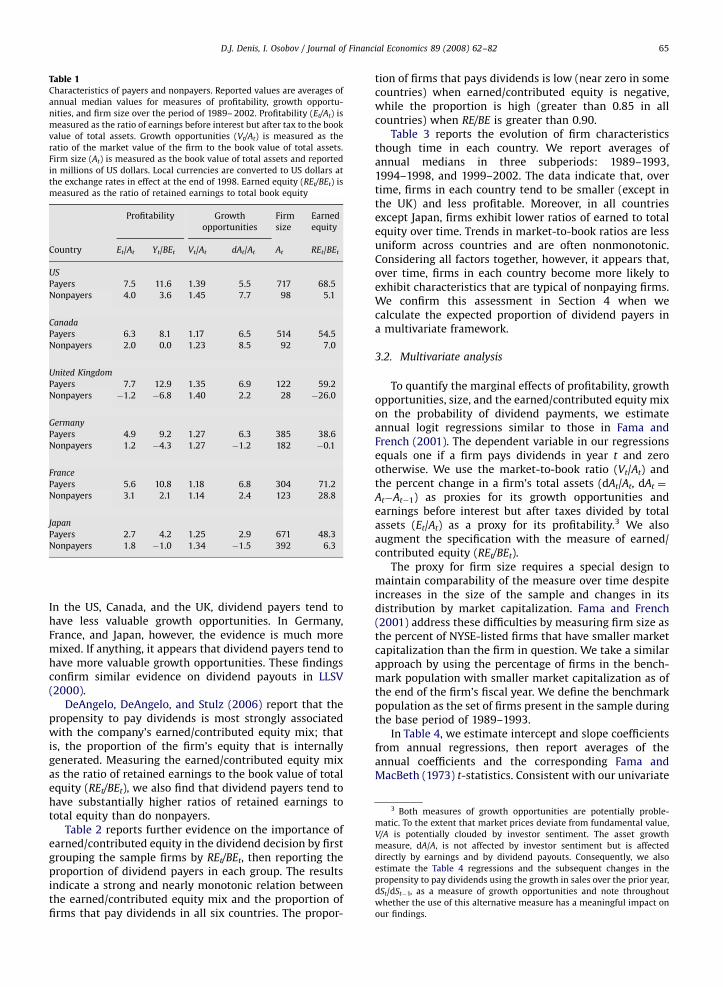
Table 1 reports average characteristics of dividendpayers and nonpayers. Fama and French (2001) report thatdividend payers tend to be more profitable, have lessvaluable growth opportunities, and are larger firms thannonpayers. We measure profitability (Et/At) as the ratio ofearnings before interest (net income+interest expense ifavailable+deferred taxes if available) to the book value oftotal assets and as the ratio of after-tax earnings to thebook value of equity (Yt/BEt), where book equity is definedas common equity plus nonequity reserves if available.Growth opportunities are measured as the ratio of themarket value of total capital (book value of total assets�book value of equity+market value of equity) to the bookvalue of total assets (Vt/At) and the percentage change intotal assets over the year (dAt/At). The market value ofequity is measured as the closing stock price at fiscal year-end times the number of shares outstanding. Firm size ismeasured as the book value of total assets (At) andreported in millions of US dollars. Local currencies areconverted to US dollars at the exchange rates in effect atthe end of 1998.
Consistent with Fama and French (2001), we find thatdividend payers tend to be larger and more profitablefirms. However, the relation between dividend paymentsand growth opportunities is not uniform across countries.
ARTICLE IN PRESS
Table 1Characteristics of payers and nonpayers. Reported values are averages of
annual median values for measures of profitability, growth opportu-
nities, and firm size over the period of 1989– 2002. Profitability (Et/At) is
measured as the ratio of earnings before interest but after tax to the book
value of total assets. Growth opportunities (Vt/At) is measured as the
ratio of the market value of the firm to the book value of total assets.
Firm size (At) is measured as the book value of total assets and reported
in millions of US dollars. Local currencies are converted to US dollars at
the exchange rates in effect at the end of 1998. Earned equity (REt/BEt) is
measured as the ratio of retained earnings to total book equity
Profitability Growth
opportunities
Firm
size
Earned
equity
Country Et/At Yt/BEt Vt/At dAt/At At REt/BEt
US
Payers 7.5 11.6 1.39 5.5 717 68.5
Nonpayers 4.0 3.6 1.45 7.7 98 5.1
Canada
Payers 6.3 8.1 1.17 6.5 514 54.5
Nonpayers 2.0 0.0 1.23 8.5 92 7.0
United Kingdom
Payers 7.7 12.9 1.35 6.9 122 59.2
Nonpayers �1.2 �6.8 1.40 2.2 28 �26.0
Germany
Payers 4.9 9.2 1.27 6.3 385 38.6
Nonpayers 1.2 �4.3 1.27 �1.2 182 �0.1
France
Payers 5.6 10.8 1.18 6.8 304 71.2
Nonpayers 3.1 2.1 1.14 2.4 123 28.8
Japan
Payers 2.7 4.2 1.25 2.9 671 48.3
Nonpayers 1.8 �1.0 1.34 �1.5 392 6.3
3 Both measures of growth opportunities are potentially proble-
matic. To the extent that market prices deviate from fundamental value,
V/A is potentially clouded by investor sentiment. The asset growth
measure, dA/A, is not affected by investor sentiment but is affected
directly by earnings and by dividend payouts. Consequently, we also
estimate the Table 4 regressions and the subsequent changes in the
propensity to pay dividends using the growth in sales over the prior year,
dSt/dSt�1, as a measure of growth opportunities and note throughout
whether the use of this alternative measure has a meaningful impact on
our findings.
D.J. Denis, I. Osobov / Journal of Financial Economics 89 (2008) 62–82 65
In the US, Canada, and the UK, dividend payers tend tohave less valuable growth opportunities. In Germany,France, and Japan, however, the evidence is much moremixed. If anything, it appears that dividend payers tend tohave more valuable growth opportunities. These findingsconfirm similar evidence on dividend payouts in LLSV(2000).
DeAngelo, DeAngelo, and Stulz (2006) report that thepropensity to pay dividends is most strongly associatedwith the company’s earned/contributed equity mix; thatis, the proportion of the firm’s equity that is internallygenerated. Measuring the earned/contributed equity mixas the ratio of retained earnings to the book value of totalequity (REt/BEt), we also find that dividend payers tend tohave substantially higher ratios of retained earnings tototal equity than do nonpayers.
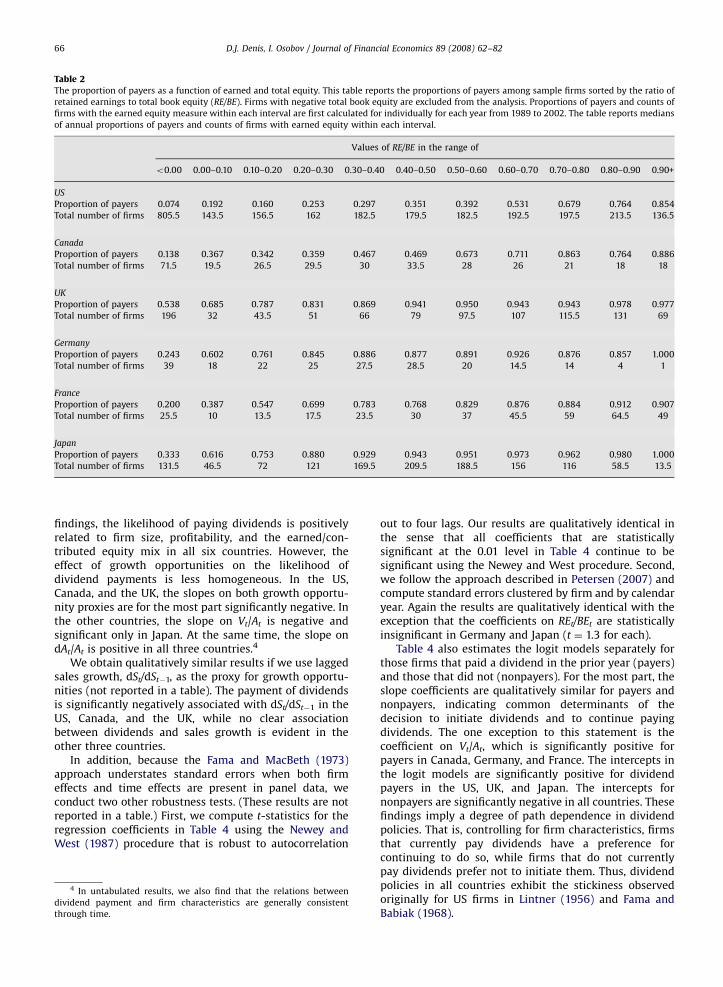
Table 2 reports further evidence on the importance ofearned/contributed equity in the dividend decision by firstgrouping the sample firms by REt/BEt, then reporting theproportion of dividend payers in each group. The resultsindicate a strong and nearly monotonic relation betweenthe earned/contributed equity mix and the proportion offirms that pay dividends in all six countries. The propor-
tion of firms that pays dividends is low (near zero in somecountries) when earned/contributed equity is negative,while the proportion is high (greater than 0.85 in allcountries) when RE/BE is greater than 0.90.
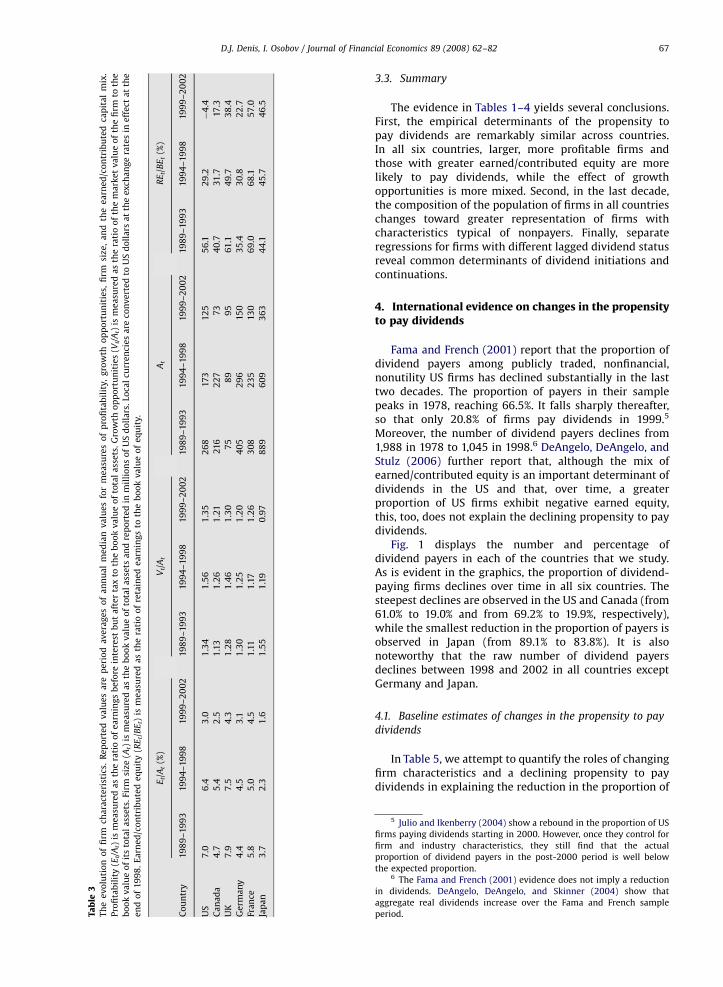
Table 3 reports the evolution of firm characteristicsthough time in each country. We report averages ofannual medians in three subperiods: 1989–1993,1994–1998, and 1999–2002. The data indicate that, overtime, firms in each country tend to be smaller (except inthe UK) and less profitable. Moreover, in all countriesexcept Japan, firms exhibit lower ratios of earned to totalequity over time. Trends in market-to-book ratios are lessuniform across countries and are often nonmonotonic.Considering all factors together, however, it appears that,over time, firms in each country become more likely toexhibit characteristics that are typical of nonpaying firms.We confirm this assessment in Section 4 when wecalculate the expected proportion of dividend payers ina multivariate framework.
3.2. Multivariate analysis
To quantify the marginal effects of profitability, growthopportunities, size, and the earned/contributed equity mixon the probability of dividend payments, we estimateannual logit regressions similar to those in Fama andFrench (2001). The dependent variable in our regressionsequals one if a firm pays dividends in year t and zerootherwise. We use the market-to-book ratio (Vt/At) andthe percent change in a firm’s total assets (dAt/At, dAt ¼
At�At�1) as proxies for its growth opportunities andearnings before interest but after taxes divided by totalassets (Et/At) as a proxy for its profitability.3 We alsoaugment the specification with the measure of earned/contributed equity (REt/BEt).
The proxy for firm size requires a special design tomaintain comparability of the measure over time despiteincreases in the size of the sample and changes in itsdistribution by market capitalization. Fama and French(2001) address these difficulties by measuring firm size asthe percent of NYSE-listed firms that have smaller marketcapitalization than the firm in question. We take a similarapproach by using the percentage of firms in the bench-mark population with smaller market capitalization as ofthe end of the firm’s fiscal year. We define the benchmarkpopulation as the set of firms present in the sample duringthe base period of 1989–1993.
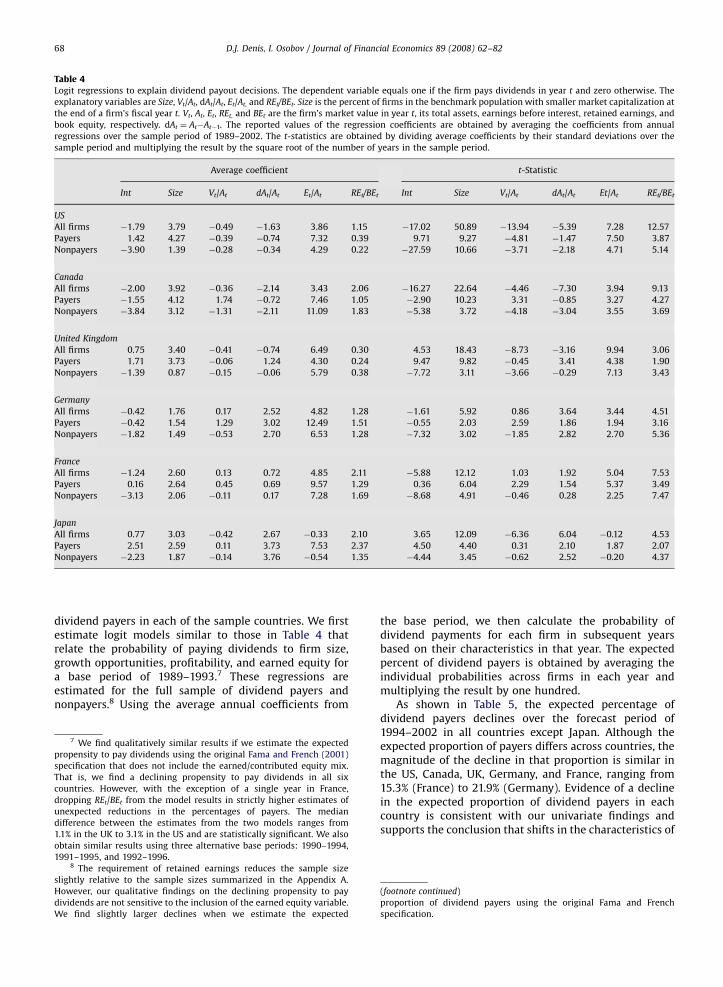
In Table 4, we estimate intercept and slope coefficientsfrom annual regressions, then report averages of theannual coefficients and the corresponding Fama andMacBeth (1973) t-statistics. Consistent with our univariate
ARTICLE IN PRESS
Table 2The proportion of payers as a function of earned and total equity. This table reports the proportions of payers among sample firms sorted by the ratio of
retained earnings to total book equity (RE/BE). Firms with negative total book equity are excluded from the analysis. Proportions of payers and counts of
firms with the earned equity measure within each interval are first calculated for individually for each year from 1989 to 2002. The table reports medians
of annual proportions of payers and counts of firms with earned equity within each interval.
Values of RE/BE in the range of
o0.00 0.00–0.10 0.10–0.20 0.20–0.30 0.30–0.40 0.40–0.50 0.50–0.60 0.60–0.70 0.70–0.80 0.80–0.90 0.90+
US
Proportion of payers 0.074 0.192 0.160 0.253 0.297 0.351 0.392 0.531 0.679 0.764 0.854
Total number of firms 805.5 143.5 156.5 162 182.5 179.5 182.5 192.5 197.5 213.5 136.5
Canada
Proportion of payers 0.138 0.367 0.342 0.359 0.467 0.469 0.673 0.711 0.863 0.764 0.886
Total number of firms 71.5 19.5 26.5 29.5 30 33.5 28 26 21 18 18
UK
Proportion of payers 0.538 0.685 0.787 0.831 0.869 0.941 0.950 0.943 0.943 0.978 0.977
Total number of firms 196 32 43.5 51 66 79 97.5 107 115.5 131 69
Germany
Proportion of payers 0.243 0.602 0.761 0.845 0.886 0.877 0.891 0.926 0.876 0.857 1.000
Total number of firms 39 18 22 25 27.5 28.5 20 14.5 14 4 1
France
Proportion of payers 0.200 0.387 0.547 0.699 0.783 0.768 0.829 0.876 0.884 0.912 0.907
Total number of firms 25.5 10 13.5 17.5 23.5 30 37 45.5 59 64.5 49
Japan
Proportion of payers 0.333 0.616 0.753 0.880 0.929 0.943 0.951 0.973 0.962 0.980 1.000
Total number of firms 131.5 46.5 72 121 169.5 209.5 188.5 156 116 58.5 13.5
D.J. Denis, I. Osobov / Journal of Financial Economics 89 (2008) 62–8266
findings, the likelihood of paying dividends is positivelyrelated to firm size, profitability, and the earned/con-tributed equity mix in all six countries. However, theeffect of growth opportunities on the likelihood ofdividend payments is less homogeneous. In the US,Canada, and the UK, the slopes on both growth opportu-nity proxies are for the most part significantly negative. Inthe other countries, the slope on Vt/At is negative andsignificant only in Japan. At the same time, the slope ondAt/At is positive in all three countries.4
We obtain qualitatively similar results if we use laggedsales growth, dSt/dSt�1, as the proxy for growth opportu-nities (not reported in a table). The payment of dividendsis significantly negatively associated with dSt/dSt�1 in theUS, Canada, and the UK, while no clear associationbetween dividends and sales growth is evident in theother three countries.
In addition, because the Fama and MacBeth (1973)approach understates standard errors when both firmeffects and time effects are present in panel data, weconduct two other robustness tests. (These results are notreported in a table.) First, we compute t-statistics for theregression coefficients in Table 4 using the Newey andWest (1987) procedure that is robust to autocorrelation
4 In untabulated results, we also find that the relations between
dividend payment and firm characteristics are generally consistent
through time.
out to four lags. Our results are qualitatively identical inthe sense that all coefficients that are statisticallysignificant at the 0.01 level in Table 4 continue to besignificant using the Newey and West procedure. Second,we follow the approach described in Petersen (2007) andcompute standard errors clustered by firm and by calendaryear. Again the results are qualitatively identical with theexception that the coefficients on REt/BEt are statisticallyinsignificant in Germany and Japan (t ¼ 1.3 for each).
Table 4 also estimates the logit models separately forthose firms that paid a dividend in the prior year (payers)and those that did not (nonpayers). For the most part, theslope coefficients are qualitatively similar for payers andnonpayers, indicating common determinants of thedecision to initiate dividends and to continue payingdividends. The one exception to this statement is thecoefficient on Vt/At, which is significantly positive forpayers in Canada, Germany, and France. The intercepts inthe logit models are significantly positive for dividendpayers in the US, UK, and Japan. The intercepts fornonpayers are significantly negative in all countries. Thesefindings imply a degree of path dependence in dividendpolicies. That is, controlling for firm characteristics, firmsthat currently pay dividends have a preference forcontinuing to do so, while firms that do not currentlypay dividends prefer not to initiate them. Thus, dividendpolicies in all countries exhibit the stickiness observedoriginally for US firms in Lintner (1956) and Fama andBabiak (1968).
ARTICLE IN PRESS
Ta
ble
3T
he
ev
olu
tio
no
ffi
rmch
ara
cte
rist
ics.
Re
po
rte
dv
alu
es
are
pe
rio
dav
era
ge
so
fa
nn
ua
lm
ed
ian
va
lue
sfo
rm
ea
sure
so
fp
rofi
tab
ilit
y,
gro
wth
op
po
rtu
nit
ies,
firm
size
,a
nd
the
ea
rne
d/c
on
trib
ute
dca
pit
al
mix
.
Pro
fita
bil
ity
(Et/
At)
ism
ea
sure
da
sth
era
tio
of
ea
rnin
gs
be
fore
inte
rest
bu
ta
fte
rta
xto
the
bo
ok
va
lue
of
tota
la
sse
ts.
Gro
wth
op
po
rtu
nit
ies
(Vt/
At)
ism
ea
sure
da
sth
era
tio
of
the
ma
rke
tv
alu
eo
fth
efi
rmto
the
bo
ok
va
lue
of
its
tota
la
sse
ts.
Firm
size
(At)
ism
ea
sure
da
sth
eb
oo
kv
alu
eo
fto
tal
ass
ets
an
dre
po
rte
din
mil
lio
ns
of
US
do
lla
rs.
Loca
lcu
rre
nci
es
are
con
ve
rte
dto
US
do
lla
rsa
tth
eex
cha
ng
era
tes
ine
ffe
cta
tth
e
en
do
f1
99
8.
Ea
rne
d/c
on
trib
ute
de
qu
ity
(RE
t/B
Et)
ism
ea
sure
da
sth
era
tio
of
reta
ine
de
arn
ing
sto
the
bo
ok
va
lue
of
eq
uit
y.
Et/
At
(%)
Vt/
At
At
RE
t/B
Et
(%)
Co
un
try
19
89
–1
99
31
99
4–
19
98
19
99
–2
00
21
98
9–
19
93
19
94
–1
99
81
99
9–
20
02
19
89
–1
99
31
99
4–
19
98
19
99
–2
00
21
98
9–
19
93
19
94
–1
99
81
99
9–
20
02
US
7.0
6.4
3.0
1.3
41
.56
1.3
52
68
173
12
55
6.1
29
.2�
4.4
Ca
na
da
4.7
5.4
2.5
1.1
31
.26
1.2
12
16
22
77
34
0.7
31
.717
.3
UK
7.9
7.5
4.3
1.2
81
.46
1.3
07
58
99
56
1.1
49
.73
8.4
Ge
rma
ny
4.4
4.5
3.1
1.3
01
.25
1.2
04
05
29
61
50
35
.43
0.8
22
.7
Fran
ce5
.85
.04
.51
.11
1.1
71
.26
30
82
35
13
06
9.0
68
.15
7.0
Jap
an
3.7
2.3
1.6
1.5
51
.19
0.9
78
89
60
93
63
44
.14
5.7
46
.5
D.J. Denis, I. Osobov / Journal of Financial Economics 89 (2008) 62–82 67
3.3. Summary
The evidence in Tables 1–4 yields several conclusions.First, the empirical determinants of the propensity topay dividends are remarkably similar across countries.In all six countries, larger, more profitable firms andthose with greater earned/contributed equity are morelikely to pay dividends, while the effect of growthopportunities is more mixed. Second, in the last decade,the composition of the population of firms in all countrieschanges toward greater representation of firms withcharacteristics typical of nonpayers. Finally, separateregressions for firms with different lagged dividend statusreveal common determinants of dividend initiations andcontinuations.
4. International evidence on changes in the propensityto pay dividends
Fama and French (2001) report that the proportion ofdividend payers among publicly traded, nonfinancial,nonutility US firms has declined substantially in the lasttwo decades. The proportion of payers in their samplepeaks in 1978, reaching 66.5%. It falls sharply thereafter,so that only 20.8% of firms pay dividends in 1999.5
Moreover, the number of dividend payers declines from1,988 in 1978 to 1,045 in 1998.6 DeAngelo, DeAngelo, andStulz (2006) further report that, although the mix ofearned/contributed equity is an important determinant ofdividends in the US and that, over time, a greaterproportion of US firms exhibit negative earned equity,this, too, does not explain the declining propensity to paydividends.
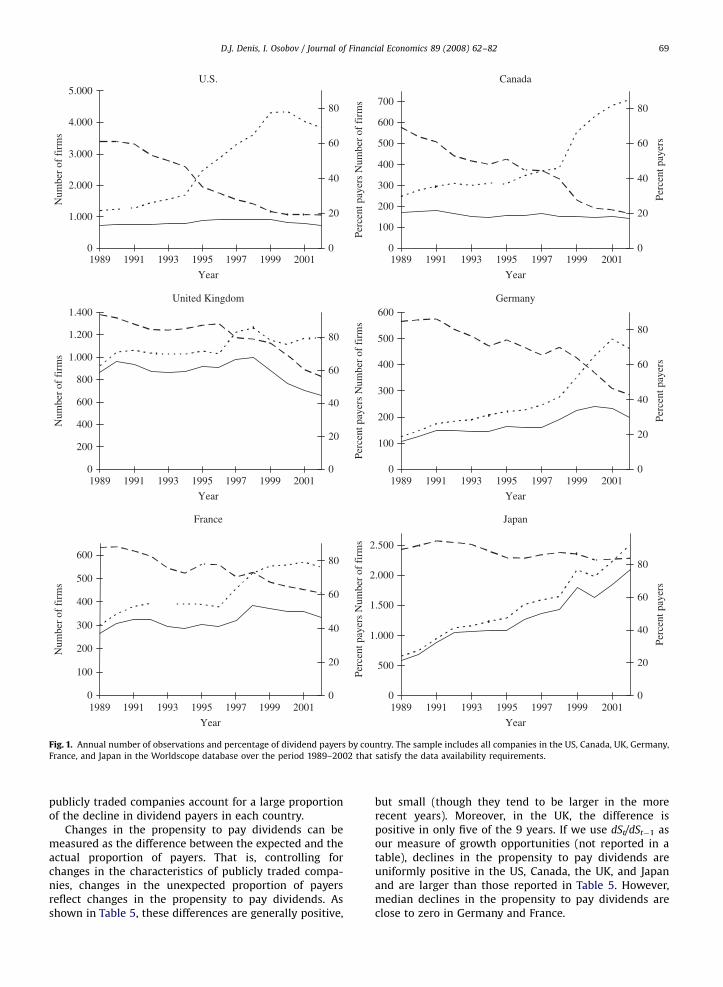
Fig. 1 displays the number and percentage ofdividend payers in each of the countries that we study.As is evident in the graphics, the proportion of dividend-paying firms declines over time in all six countries. Thesteepest declines are observed in the US and Canada (from61.0% to 19.0% and from 69.2% to 19.9%, respectively),while the smallest reduction in the proportion of payers isobserved in Japan (from 89.1% to 83.8%). It is alsonoteworthy that the raw number of dividend payersdeclines between 1998 and 2002 in all countries exceptGermany and Japan.
4.1. Baseline estimates of changes in the propensity to pay
dividends
In Table 5, we attempt to quantify the roles of changingfirm characteristics and a declining propensity to paydividends in explaining the reduction in the proportion of
5 Julio and Ikenberry (2004) show a rebound in the proportion of US
firms paying dividends starting in 2000. However, once they control for
firm and industry characteristics, they still find that the actual
proportion of dividend payers in the post-2000 period is well below
the expected proportion.6 The Fama and French (2001) evidence does not imply a reduction
in dividends. DeAngelo, DeAngelo, and Skinner (2004) show that
aggregate real dividends increase over the Fama and French sample
period.
ARTICLE IN PRESS
Table 4Logit regressions to explain dividend payout decisions. The dependent variable equals one if the firm pays dividends in year t and zero otherwise. The
explanatory variables are Size, Vt/At, dAt/At, Et/At, and REt/BEt. Size is the percent of firms in the benchmark population with smaller market capitalization at
the end of a firm’s fiscal year t. Vt, At, Et, REt, and BEt are the firm’s market value in year t, its total assets, earnings before interest, retained earnings, and
book equity, respectively. dAt ¼ At�At�1. The reported values of the regression coefficients are obtained by averaging the coefficients from annual
regressions over the sample period of 1989–2002. The t-statistics are obtained by dividing average coefficients by their standard deviations over the
sample period and multiplying the result by the square root of the number of years in the sample period.
Average coefficient t-Statistic
Int Size Vt/At dAt/At Et/At REt/BEt Int Size Vt/At dAt/At Et/At REt/BEt
US
All firms �1.79 3.79 �0.49 �1.63 3.86 1.15 �17.02 50.89 �13.94 �5.39 7.28 12.57
Payers 1.42 4.27 �0.39 �0.74 7.32 0.39 9.71 9.27 �4.81 �1.47 7.50 3.87
Nonpayers �3.90 1.39 �0.28 �0.34 4.29 0.22 �27.59 10.66 �3.71 �2.18 4.71 5.14
Canada
All firms �2.00 3.92 �0.36 �2.14 3.43 2.06 �16.27 22.64 �4.46 �7.30 3.94 9.13
Payers �1.55 4.12 1.74 �0.72 7.46 1.05 �2.90 10.23 3.31 �0.85 3.27 4.27
Nonpayers �3.84 3.12 �1.31 �2.11 11.09 1.83 �5.38 3.72 �4.18 �3.04 3.55 3.69
United Kingdom
All firms 0.75 3.40 �0.41 �0.74 6.49 0.30 4.53 18.43 �8.73 �3.16 9.94 3.06
Payers 1.71 3.73 �0.06 1.24 4.30 0.24 9.47 9.82 �0.45 3.41 4.38 1.90
Nonpayers �1.39 0.87 �0.15 �0.06 5.79 0.38 �7.72 3.11 �3.66 �0.29 7.13 3.43
Germany
All firms �0.42 1.76 0.17 2.52 4.82 1.28 �1.61 5.92 0.86 3.64 3.44 4.51
Payers �0.42 1.54 1.29 3.02 12.49 1.51 �0.55 2.03 2.59 1.86 1.94 3.16
Nonpayers �1.82 1.49 �0.53 2.70 6.53 1.28 �7.32 3.02 �1.85 2.82 2.70 5.36
France
All firms �1.24 2.60 0.13 0.72 4.85 2.11 �5.88 12.12 1.03 1.92 5.04 7.53
Payers 0.16 2.64 0.45 0.69 9.57 1.29 0.36 6.04 2.29 1.54 5.37 3.49
Nonpayers �3.13 2.06 �0.11 0.17 7.28 1.69 �8.68 4.91 �0.46 0.28 2.25 7.47
Japan
All firms 0.77 3.03 �0.42 2.67 �0.33 2.10 3.65 12.09 �6.36 6.04 �0.12 4.53
Payers 2.51 2.59 0.11 3.73 7.53 2.37 4.50 4.40 0.31 2.10 1.87 2.07
Nonpayers �2.23 1.87 �0.14 3.76 �0.54 1.35 �4.44 3.45 �0.62 2.52 �0.20 4.37
D.J. Denis, I. Osobov / Journal of Financial Economics 89 (2008) 62–8268
dividend payers in each of the sample countries. We firstestimate logit models similar to those in Table 4 thatrelate the probability of paying dividends to firm size,growth opportunities, profitability, and earned equity fora base period of 1989–1993.7 These regressions areestimated for the full sample of dividend payers andnonpayers.8 Using the average annual coefficients from
7 We find qualitatively similar results if we estimate the expected
propensity to pay dividends using the original Fama and French (2001)
specification that does not include the earned/contributed equity mix.
That is, we find a declining propensity to pay dividends in all six
countries. However, with the exception of a single year in France,
dropping REt/BEt from the model results in strictly higher estimates of
unexpected reductions in the percentages of payers. The median
difference between the estimates from the two models ranges from
1.1% in the UK to 3.1% in the US and are statistically significant. We also
obtain similar results using three alternative base periods: 1990–1994,
1991–1995, and 1992–1996.8 The requirement of retained earnings reduces the sample size
slightly relative to the sample sizes summarized in the Appendix A.
However, our qualitative findings on the declining propensity to pay
dividends are not sensitive to the inclusion of the earned equity variable.
We find slightly larger declines when we estimate the expected
the base period, we then calculate the probability ofdividend payments for each firm in subsequent yearsbased on their characteristics in that year. The expectedpercent of dividend payers is obtained by averaging theindividual probabilities across firms in each year andmultiplying the result by one hundred.
As shown in Table 5, the expected percentage ofdividend payers declines over the forecast period of1994–2002 in all countries except Japan. Although theexpected proportion of payers differs across countries, themagnitude of the decline in that proportion is similar inthe US, Canada, UK, Germany, and France, ranging from15.3% (France) to 21.9% (Germany). Evidence of a declinein the expected proportion of dividend payers in eachcountry is consistent with our univariate findings andsupports the conclusion that shifts in the characteristics of
(footnote continued)
proportion of dividend payers using the original Fama and French
specification.
ARTICLE IN PRESS
0
1.000
2.000
3.000
4.000
5.000
1989
Year
0
20
40
60
80
0
100
200
300
400
500
600
700
Year
0
20
40
60
80
0
200
400
600
800
1.000
1.200
1.400
Year
0
20
40
60
80
0
100
200
300
400
500
600
Year
0
20
40
60
80
0
100
200
300
400
500
600
Year
Num
ber
of f
irm
sN
umbe
r of
fir
ms
Num
ber
of f
irm
s
0
20
40
60
80
Perc
ent p
ayer
s N
umbe
r of
fir
ms
Perc
ent p
ayer
s N
umbe
r of
fir
ms
Perc
ent p
ayer
s N
umbe
r of
fir
ms
0
500
1.000
1.500
2.000
2.500
Year
0
20
40
60
80
Perc
ent p
ayer
sPe
rcen
t pay
ers
Perc
ent p
ayer
s
CanadaU.S.
GermanyUnited Kingdom
JapanFrance
1991 1993 1995 1997 1999 2001 1989 1991 1993 1995 1997 1999 2001
1989 1991 1993 1995 1997 1999 2001
1989 1991 1993 1995 1997 1999 2001
1989 1991 1993 1995 1997 1999 2001
1989 1991 1993 1995 1997 1999 2001
Fig. 1. Annual number of observations and percentage of dividend payers by country. The sample includes all companies in the US, Canada, UK, Germany,
France, and Japan in the Worldscope database over the period 1989–2002 that satisfy the data availability requirements.
D.J. Denis, I. Osobov / Journal of Financial Economics 89 (2008) 62–82 69
publicly traded companies account for a large proportionof the decline in dividend payers in each country.
Changes in the propensity to pay dividends can bemeasured as the difference between the expected and theactual proportion of payers. That is, controlling forchanges in the characteristics of publicly traded compa-nies, changes in the unexpected proportion of payersreflect changes in the propensity to pay dividends. Asshown in Table 5, these differences are generally positive,
but small (though they tend to be larger in the morerecent years). Moreover, in the UK, the difference ispositive in only five of the 9 years. If we use dSt/dSt�1 asour measure of growth opportunities (not reported in atable), declines in the propensity to pay dividends areuniformly positive in the US, Canada, the UK, and Japanand are larger than those reported in Table 5. However,median declines in the propensity to pay dividends areclose to zero in Germany and France.
ARTICLE IN PRESS
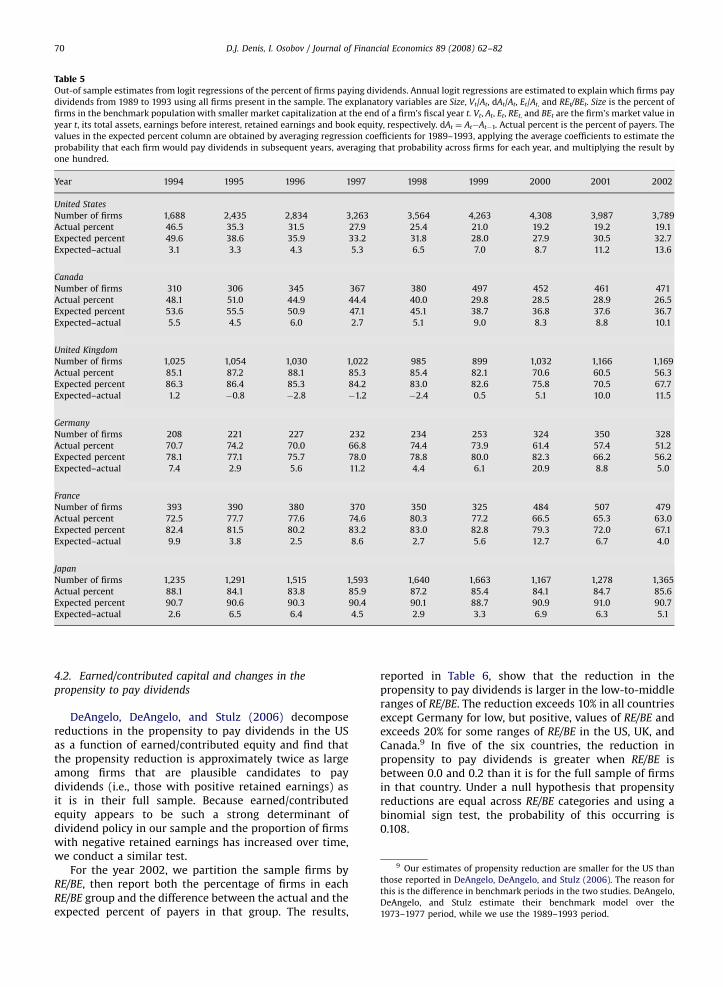
Table 5Out-of sample estimates from logit regressions of the percent of firms paying dividends. Annual logit regressions are estimated to explain which firms pay
dividends from 1989 to 1993 using all firms present in the sample. The explanatory variables are Size, Vt/At, dAt/At, Et/At, and REt/BEt. Size is the percent of
firms in the benchmark population with smaller market capitalization at the end of a firm’s fiscal year t. Vt, At, Et, REt, and BEt are the firm’s market value in
year t, its total assets, earnings before interest, retained earnings and book equity, respectively. dAt ¼ At�At�1. Actual percent is the percent of payers. The
values in the expected percent column are obtained by averaging regression coefficients for 1989–1993, applying the average coefficients to estimate the
probability that each firm would pay dividends in subsequent years, averaging that probability across firms for each year, and multiplying the result by
one hundred.
Year 1994 1995 1996 1997 1998 1999 2000 2001 2002
United States
Number of firms 1,688 2,435 2,834 3,263 3,564 4,263 4,308 3,987 3,789
Actual percent 46.5 35.3 31.5 27.9 25.4 21.0 19.2 19.2 19.1
Expected percent 49.6 38.6 35.9 33.2 31.8 28.0 27.9 30.5 32.7
Expected–actual 3.1 3.3 4.3 5.3 6.5 7.0 8.7 11.2 13.6
Canada
Number of firms 310 306 345 367 380 497 452 461 471
Actual percent 48.1 51.0 44.9 44.4 40.0 29.8 28.5 28.9 26.5
Expected percent 53.6 55.5 50.9 47.1 45.1 38.7 36.8 37.6 36.7
Expected–actual 5.5 4.5 6.0 2.7 5.1 9.0 8.3 8.8 10.1
United Kingdom
Number of firms 1,025 1,054 1,030 1,022 985 899 1,032 1,166 1,169
Actual percent 85.1 87.2 88.1 85.3 85.4 82.1 70.6 60.5 56.3
Expected percent 86.3 86.4 85.3 84.2 83.0 82.6 75.8 70.5 67.7
Expected–actual 1.2 �0.8 �2.8 �1.2 �2.4 0.5 5.1 10.0 11.5
Germany
Number of firms 208 221 227 232 234 253 324 350 328
Actual percent 70.7 74.2 70.0 66.8 74.4 73.9 61.4 57.4 51.2
Expected percent 78.1 77.1 75.7 78.0 78.8 80.0 82.3 66.2 56.2
Expected–actual 7.4 2.9 5.6 11.2 4.4 6.1 20.9 8.8 5.0
France
Number of firms 393 390 380 370 350 325 484 507 479
Actual percent 72.5 77.7 77.6 74.6 80.3 77.2 66.5 65.3 63.0
Expected percent 82.4 81.5 80.2 83.2 83.0 82.8 79.3 72.0 67.1
Expected–actual 9.9 3.8 2.5 8.6 2.7 5.6 12.7 6.7 4.0
Japan
Number of firms 1,235 1,291 1,515 1,593 1,640 1,663 1,167 1,278 1,365
Actual percent 88.1 84.1 83.8 85.9 87.2 85.4 84.1 84.7 85.6
Expected percent 90.7 90.6 90.3 90.4 90.1 88.7 90.9 91.0 90.7
Expected–actual 2.6 6.5 6.4 4.5 2.9 3.3 6.9 6.3 5.1
9 Our estimates of propensity reduction are smaller for the US than
those reported in DeAngelo, DeAngelo, and Stulz (2006). The reason for
this is the difference in benchmark periods in the two studies. DeAngelo,
DeAngelo, and Stulz estimate their benchmark model over the
1973–1977 period, while we use the 1989–1993 period.
D.J. Denis, I. Osobov / Journal of Financial Economics 89 (2008) 62–8270
4.2. Earned/contributed capital and changes in the
propensity to pay dividends
DeAngelo, DeAngelo, and Stulz (2006) decomposereductions in the propensity to pay dividends in the USas a function of earned/contributed equity and find thatthe propensity reduction is approximately twice as largeamong firms that are plausible candidates to paydividends (i.e., those with positive retained earnings) asit is in their full sample. Because earned/contributedequity appears to be such a strong determinant ofdividend policy in our sample and the proportion of firmswith negative retained earnings has increased over time,we conduct a similar test.
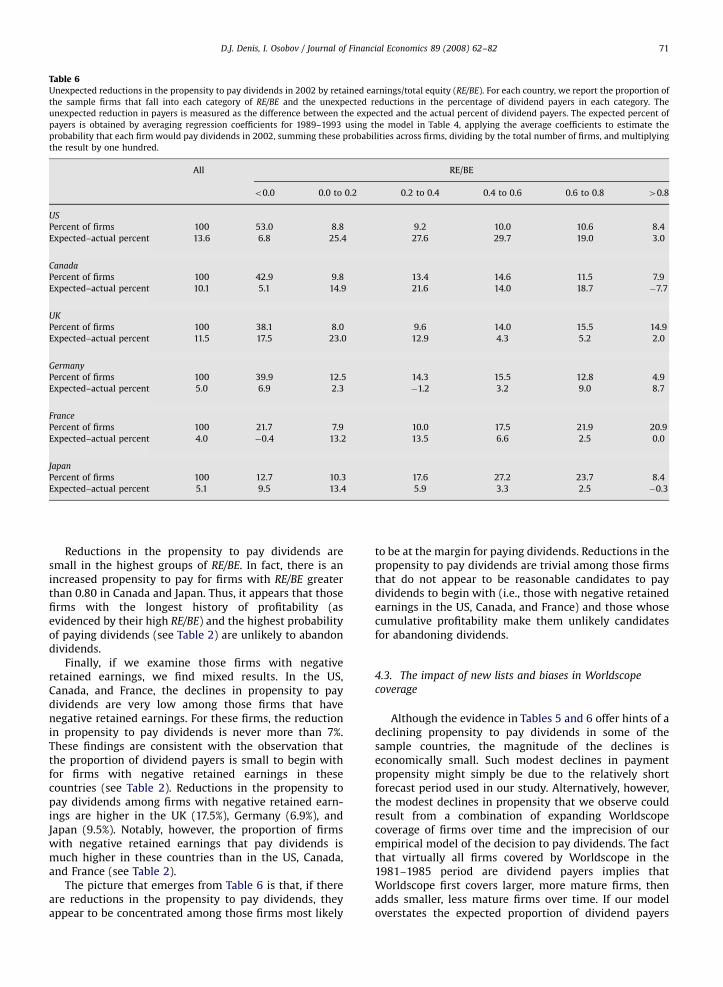
For the year 2002, we partition the sample firms byRE/BE, then report both the percentage of firms in eachRE/BE group and the difference between the actual and theexpected percent of payers in that group. The results,
reported in Table 6, show that the reduction in thepropensity to pay dividends is larger in the low-to-middleranges of RE/BE. The reduction exceeds 10% in all countriesexcept Germany for low, but positive, values of RE/BE andexceeds 20% for some ranges of RE/BE in the US, UK, andCanada.9 In five of the six countries, the reduction inpropensity to pay dividends is greater when RE/BE isbetween 0.0 and 0.2 than it is for the full sample of firmsin that country. Under a null hypothesis that propensityreductions are equal across RE/BE categories and using abinomial sign test, the probability of this occurring is0.108.
ARTICLE IN PRESS
Table 6Unexpected reductions in the propensity to pay dividends in 2002 by retained earnings/total equity (RE/BE). For each country, we report the proportion of
the sample firms that fall into each category of RE/BE and the unexpected reductions in the percentage of dividend payers in each category. The
unexpected reduction in payers is measured as the difference between the expected and the actual percent of dividend payers. The expected percent of
payers is obtained by averaging regression coefficients for 1989–1993 using the model in Table 4, applying the average coefficients to estimate the
probability that each firm would pay dividends in 2002, summing these probabilities across firms, dividing by the total number of firms, and multiplying
the result by one hundred.
All RE/BE
o0.0 0.0 to 0.2 0.2 to 0.4 0.4 to 0.6 0.6 to 0.8 40.8
US
Percent of firms 100 53.0 8.8 9.2 10.0 10.6 8.4
Expected–actual percent 13.6 6.8 25.4 27.6 29.7 19.0 3.0
Canada
Percent of firms 100 42.9 9.8 13.4 14.6 11.5 7.9
Expected–actual percent 10.1 5.1 14.9 21.6 14.0 18.7 �7.7
UK
Percent of firms 100 38.1 8.0 9.6 14.0 15.5 14.9
Expected–actual percent 11.5 17.5 23.0 12.9 4.3 5.2 2.0
Germany
Percent of firms 100 39.9 12.5 14.3 15.5 12.8 4.9
Expected–actual percent 5.0 6.9 2.3 �1.2 3.2 9.0 8.7
France
Percent of firms 100 21.7 7.9 10.0 17.5 21.9 20.9
Expected–actual percent 4.0 �0.4 13.2 13.5 6.6 2.5 0.0
Japan
Percent of firms 100 12.7 10.3 17.6 27.2 23.7 8.4
Expected–actual percent 5.1 9.5 13.4 5.9 3.3 2.5 �0.3
D.J. Denis, I. Osobov / Journal of Financial Economics 89 (2008) 62–82 71
Reductions in the propensity to pay dividends aresmall in the highest groups of RE/BE. In fact, there is anincreased propensity to pay for firms with RE/BE greaterthan 0.80 in Canada and Japan. Thus, it appears that thosefirms with the longest history of profitability (asevidenced by their high RE/BE) and the highest probabilityof paying dividends (see Table 2) are unlikely to abandondividends.
Finally, if we examine those firms with negativeretained earnings, we find mixed results. In the US,Canada, and France, the declines in propensity to paydividends are very low among those firms that havenegative retained earnings. For these firms, the reductionin propensity to pay dividends is never more than 7%.These findings are consistent with the observation thatthe proportion of dividend payers is small to begin withfor firms with negative retained earnings in thesecountries (see Table 2). Reductions in the propensity topay dividends among firms with negative retained earn-ings are higher in the UK (17.5%), Germany (6.9%), andJapan (9.5%). Notably, however, the proportion of firmswith negative retained earnings that pay dividends ismuch higher in these countries than in the US, Canada,and France (see Table 2).
The picture that emerges from Table 6 is that, if thereare reductions in the propensity to pay dividends, theyappear to be concentrated among those firms most likely
to be at the margin for paying dividends. Reductions in thepropensity to pay dividends are trivial among those firmsthat do not appear to be reasonable candidates to paydividends to begin with (i.e., those with negative retainedearnings in the US, Canada, and France) and those whosecumulative profitability make them unlikely candidatesfor abandoning dividends.
4.3. The impact of new lists and biases in Worldscope
coverage
Although the evidence in Tables 5 and 6 offer hints of adeclining propensity to pay dividends in some of thesample countries, the magnitude of the declines iseconomically small. Such modest declines in paymentpropensity might simply be due to the relatively shortforecast period used in our study. Alternatively, however,the modest declines in propensity that we observe couldresult from a combination of expanding Worldscopecoverage of firms over time and the imprecision of ourempirical model of the decision to pay dividends. The factthat virtually all firms covered by Worldscope in the1981–1985 period are dividend payers implies thatWorldscope first covers larger, more mature firms, thenadds smaller, less mature firms over time. If our modeloverstates the expected proportion of dividend payers
ARTICLE IN PRESS
D.J. Denis, I. Osobov / Journal of Financial Economics 89 (2008) 62–8272
among newly added firms, this would show up empiri-cally as a decline in the propensity to pay dividends evenif no such decline exists. Similarly, an influx of newlylisted companies over time in the sample countries couldproduce negative prediction errors even in the absence ofchanges in payment propensity.
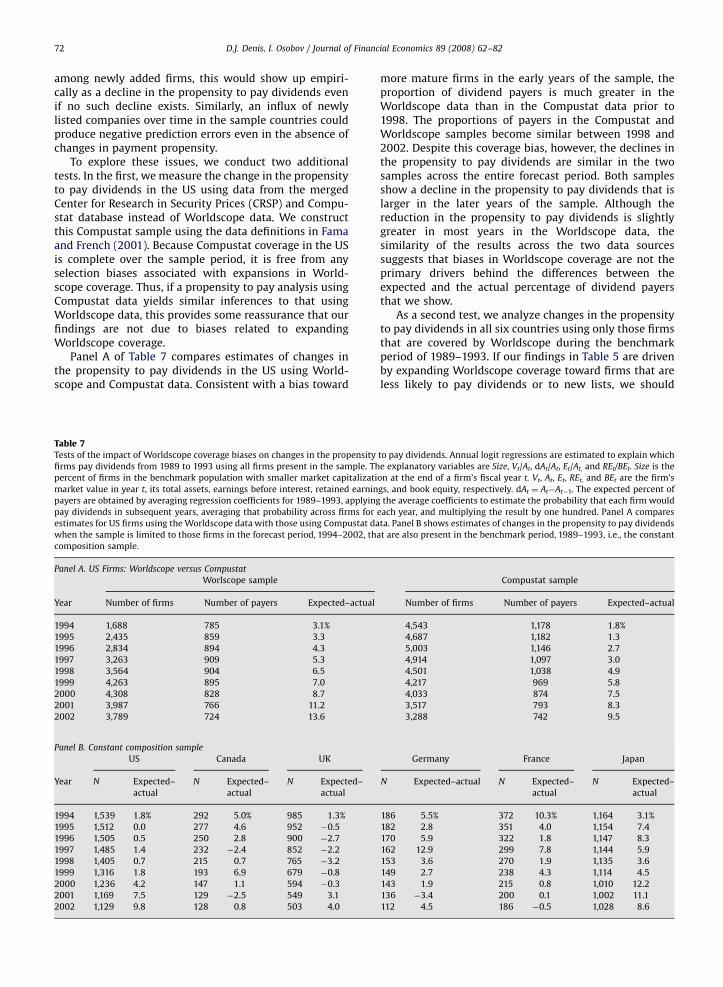
To explore these issues, we conduct two additionaltests. In the first, we measure the change in the propensityto pay dividends in the US using data from the mergedCenter for Research in Security Prices (CRSP) and Compu-stat database instead of Worldscope data. We constructthis Compustat sample using the data definitions in Famaand French (2001). Because Compustat coverage in the USis complete over the sample period, it is free from anyselection biases associated with expansions in World-scope coverage. Thus, if a propensity to pay analysis usingCompustat data yields similar inferences to that usingWorldscope data, this provides some reassurance that ourfindings are not due to biases related to expandingWorldscope coverage.
Panel A of Table 7 compares estimates of changes inthe propensity to pay dividends in the US using World-scope and Compustat data. Consistent with a bias toward
Table 7Tests of the impact of Worldscope coverage biases on changes in the propensity
firms pay dividends from 1989 to 1993 using all firms present in the sample. Th
percent of firms in the benchmark population with smaller market capitalizati
market value in year t, its total assets, earnings before interest, retained earnin
payers are obtained by averaging regression coefficients for 1989–1993, applying
pay dividends in subsequent years, averaging that probability across firms for
estimates for US firms using the Worldscope data with those using Compustat da
when the sample is limited to those firms in the forecast period, 1994–2002, th
composition sample.
Panel A. US Firms: Worldscope versus Compustat
Worlscope sample
Year Number of firms Number of payers Expected–actual
1994 1,688 785 3.1%
1995 2,435 859 3.3
1996 2,834 894 4.3
1997 3,263 909 5.3
1998 3,564 904 6.5
1999 4,263 895 7.0
2000 4,308 828 8.7
2001 3,987 766 11.2
2002 3,789 724 13.6
Panel B. Constant composition sample
US Canada UK
Year N Expected–
actual
N Expected–
actual
N Expected–
actual
1994 1,539 1.8% 292 5.0% 985 1.3%
1995 1,512 0.0 277 4.6 952 �0.5
1996 1,505 0.5 250 2.8 900 �2.7
1997 1,485 1.4 232 �2.4 852 �2.2
1998 1,405 0.7 215 0.7 765 �3.2
1999 1,316 1.8 193 6.9 679 �0.8
2000 1,236 4.2 147 1.1 594 �0.3
2001 1,169 7.5 129 �2.5 549 3.1
2002 1,129 9.8 128 0.8 503 4.0
more mature firms in the early years of the sample, theproportion of dividend payers is much greater in theWorldscope data than in the Compustat data prior to1998. The proportions of payers in the Compustat andWorldscope samples become similar between 1998 and2002. Despite this coverage bias, however, the declines inthe propensity to pay dividends are similar in the twosamples across the entire forecast period. Both samplesshow a decline in the propensity to pay dividends that islarger in the later years of the sample. Although thereduction in the propensity to pay dividends is slightlygreater in most years in the Worldscope data, thesimilarity of the results across the two data sourcessuggests that biases in Worldscope coverage are not theprimary drivers behind the differences between theexpected and the actual percentage of dividend payersthat we show.
As a second test, we analyze changes in the propensityto pay dividends in all six countries using only those firmsthat are covered by Worldscope during the benchmarkperiod of 1989–1993. If our findings in Table 5 are drivenby expanding Worldscope coverage toward firms that areless likely to pay dividends or to new lists, we should
to pay dividends. Annual logit regressions are estimated to explain which
e explanatory variables are Size, Vt/At, dAt/At, Et/At, and REt/BEt. Size is the
on at the end of a firm’s fiscal year t. Vt, At, Et, REt, and BEt are the firm’s
gs, and book equity, respectively. dAt ¼ At�At�1. The expected percent of
the average coefficients to estimate the probability that each firm would
each year, and multiplying the result by one hundred. Panel A compares
ta. Panel B shows estimates of changes in the propensity to pay dividends
at are also present in the benchmark period, 1989–1993, i.e., the constant
Compustat sample
Number of firms Number of payers Expected–actual
4,543 1,178 1.8%
4,687 1,182 1.3
5,003 1,146 2.7
4,914 1,097 3.0
4,501 1,038 4.9
4,217 969 5.8
4,033 874 7.5
3,517 793 8.3
3,288 742 9.5
Germany France Japan
N Expected–actual N Expected–
actual
N Expected–
actual
186 5.5% 372 10.3% 1,164 3.1%
182 2.8 351 4.0 1,154 7.4
170 5.9 322 1.8 1,147 8.3
162 12.9 299 7.8 1,144 5.9
153 3.6 270 1.9 1,135 3.6
149 2.7 238 4.3 1,114 4.5
143 1.9 215 0.8 1,010 12.2
136 �3.4 200 0.1 1,002 11.1
112 4.5 186 �0.5 1,028 8.6
ARTICLE IN PRESS
D.J. Denis, I. Osobov / Journal of Financial Economics 89 (2008) 62–82 73
observe smaller reductions in the propensity to paydividends within this constant composition sample. Ourfindings, reported in Panel B of Table 7, indicate thatmedian annual changes in the propensity to pay dividendsare 1.8%, 3.6%, and 1.9% in the US, Germany, and France,respectively. Although the difference between the ex-pected and actual percent of payers is positive in nearlyevery year in these countries, the differences are econom-ically much smaller than those reported for the fullsample in Table 5 and could plausibly be viewed as beingwithin the bounds of normal model error. Moreover, thereis little evidence of a systematic decline in the propensityto pay dividends in Canada or in the UK using the constantcomposition sample. These findings suggest that anyunexpected reductions in dividend propensity reportedin Table 5 are driven primarily by firms that enter thesample after 1993. The only exception is Japan, wherechanges in the propensity to pay dividends in the constantcomposition sample are slightly larger than those in thefull sample.
If we conduct the constant composition analysis for USfirms over the full Fama and French sample period(1978–2002), we obtain much smaller estimates ofreductions in the propensity to pay dividends than if weconduct the analysis using the full sample. For example,using the full sample, the median decline in thepropensity to pay dividends is 7.5% and the propensityreduction reaches a high of 14.2% in 2002. By contrast,using the constant composition sample, the highestpropensity reduction is 4.8% in 2000, while the medianpropensity reduction is �1.0% (i.e., an increase in thepropensity to pay dividends). These findings imply thatpropensity reductions observed in the US are driven byfirms that enter the sample after 1978.
4.4. Dividend abandonment or failure to initiate?
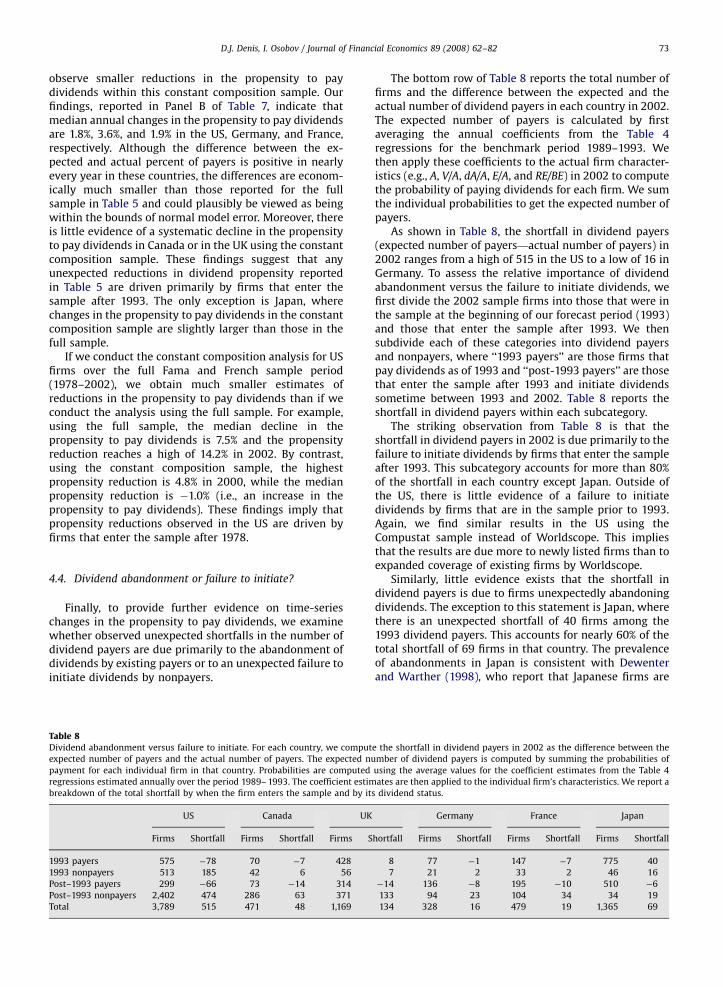
Finally, to provide further evidence on time-serieschanges in the propensity to pay dividends, we examinewhether observed unexpected shortfalls in the number ofdividend payers are due primarily to the abandonment ofdividends by existing payers or to an unexpected failure toinitiate dividends by nonpayers.
Table 8Dividend abandonment versus failure to initiate. For each country, we comput
expected number of payers and the actual number of payers. The expected nu
payment for each individual firm in that country. Probabilities are computed
regressions estimated annually over the period 1989– 1993. The coefficient estim
breakdown of the total shortfall by when the firm enters the sample and by it
US Canada UK
Firms Shortfall Firms Shortfall Firms S
1993 payers 575 �78 70 �7 428
1993 nonpayers 513 185 42 6 56
Post–1993 payers 299 �66 73 �14 314
Post–1993 nonpayers 2,402 474 286 63 371
Total 3,789 515 471 48 1,169
The bottom row of Table 8 reports the total number offirms and the difference between the expected and theactual number of dividend payers in each country in 2002.The expected number of payers is calculated by firstaveraging the annual coefficients from the Table 4regressions for the benchmark period 1989–1993. Wethen apply these coefficients to the actual firm character-istics (e.g., A, V/A, dA/A, E/A, and RE/BE) in 2002 to computethe probability of paying dividends for each firm. We sumthe individual probabilities to get the expected number ofpayers.
As shown in Table 8, the shortfall in dividend payers(expected number of payers—actual number of payers) in2002 ranges from a high of 515 in the US to a low of 16 inGermany. To assess the relative importance of dividendabandonment versus the failure to initiate dividends, wefirst divide the 2002 sample firms into those that were inthe sample at the beginning of our forecast period (1993)and those that enter the sample after 1993. We thensubdivide each of these categories into dividend payersand nonpayers, where ‘‘1993 payers’’ are those firms thatpay dividends as of 1993 and ‘‘post-1993 payers’’ are thosethat enter the sample after 1993 and initiate dividendssometime between 1993 and 2002. Table 8 reports theshortfall in dividend payers within each subcategory.
The striking observation from Table 8 is that theshortfall in dividend payers in 2002 is due primarily to thefailure to initiate dividends by firms that enter the sampleafter 1993. This subcategory accounts for more than 80%of the shortfall in each country except Japan. Outside ofthe US, there is little evidence of a failure to initiatedividends by firms that are in the sample prior to 1993.Again, we find similar results in the US using theCompustat sample instead of Worldscope. This impliesthat the results are due more to newly listed firms than toexpanded coverage of existing firms by Worldscope.
Similarly, little evidence exists that the shortfall individend payers is due to firms unexpectedly abandoningdividends. The exception to this statement is Japan, wherethere is an unexpected shortfall of 40 firms among the1993 dividend payers. This accounts for nearly 60% of thetotal shortfall of 69 firms in that country. The prevalenceof abandonments in Japan is consistent with Dewenterand Warther (1998), who report that Japanese firms are
e the shortfall in dividend payers in 2002 as the difference between the
mber of dividend payers is computed by summing the probabilities of
using the average values for the coefficient estimates from the Table 4
ates are then applied to the individual firm’s characteristics. We report a
s dividend status.
Germany France Japan
hortfall Firms Shortfall Firms Shortfall Firms Shortfall
8 77 �1 147 �7 775 40
7 21 2 33 2 46 16
�14 136 �8 195 �10 510 �6
133 94 23 104 34 34 19
134 328 16 479 19 1,365 69

ARTICLE IN PRESS
D.J. Denis, I. Osobov / Journal of Financial Economics 89 (2008) 62–8274
more willing to cut dividends than are US firms, andCharitou (2000), who shows a relatively high rate ofdividend cuts in response to accounting losses by Japanesefirms in the early 1990s. To the extent that Japanese firmsencounter an increase in financial problems during oursample period, the effects of this on dividend policy mightnot be fully captured by our benchmark model. Consistentwith this conjecture, our further analysis reveals thatfinancial troubles appear to play an important role in theabandonment of dividends by Japanese firms. Specifically,we compute interest coverage ratios (earnings beforeinterest, taxes, depreciation, and amortization/interestexpense) for firms in the subset of 1993 payers thatabandon dividends by 2002. For the 40 firms with thehighest probability of paying dividends (i.e., abandonmentis least expected), the median interest coverage ratio is2.9. By contrast, the median interest coverage ratio ofdividend payers over the same period is 15.9. Weconclude, therefore, that the higher rate of dividendabandonment in Japan appears to be driven more byfinancial distress than by a more general policy decision toback away from dividend payments.10
4.5. Summary and discussion
Overall, our evidence offers hints of a decline in thepropensity to pay dividends in some of the samplecountries, particularly among those firms that are at themargin for paying dividends. However, our more refinedanalysis raises several doubts about whether this evidencereflects systematic changes in dividend policies. First, thepropensity declines in our sample are much smaller thanthose reported for US firms in Fama and French (2001).Second, the evidence in some countries is not particularlyrobust. For example, there is little evidence of a propensitydecline in the UK, while the corresponding declines inGermany and France are not robust to alternativemeasures of firm growth opportunities. Third, unexpectedreductions in the proportion of dividend payers amongJapanese firms can just as plausibly be explained asresponses to transitory earnings problems during thatcountry’s economic slowdown of the 1990s as to anymeaningful changes in dividend policies. Fourth, in allother countries, we find no material changes in thedividend policies of firms that were listed prior to 1993.Any declines in the propensity to pay dividends that weobserve appear to be driven by newly listed firms that failto initiate dividends when expected to do so.
The shortfall in payers among new lists raises thepossibility that our findings are due more to the over-estimation of the expected numbers of dividend payers byan imprecise benchmark model than to any systematicchange in dividend policies. Although our benchmark
10 Although dividend abandonment is empirically unimportant in
countries outside of Japan, we also examine evidence of financial
troubles for firms abandoning dividends in these countries and find
similar results. That is, firms unexpectedly abandoning dividends have
significantly lower interest coverage ratios than those firms that
continue to pay dividends. This evidence reinforces the conclusion that
the model for estimating the propensity to pay dividends is imperfect.
model is as comprehensive as any others in the literature,newly listed firms could, nonetheless, exhibit somecharacteristics that are not included in the benchmarkmodel, but that make them less likely to pay dividends.Fama and French (2004) observe that the characteristics ofnewly listed firms in the US have changed such that thecross-sectional distribution of profitability is considerablymore left-skewed while that of growth is considerablymore right-skewed. Such a shift in the characteristics oflisted firms raises the probability that relevant character-istics are not picked up by benchmark models forexpected dividends, thereby resulting in measured reduc-tions in the propensity to pay dividends.
Our findings complement and extend those of otherrecent studies of payout policies outside of the US. Like us,Benito and Young (2001) and Renneboog and Trojanowski(2005) conclude that there is little evidence of a reductionin the propensity to pay dividends in the UK. However, ineach case, the samples studied by the authors aresomewhat limited and the authors do not control for allof the other potential determinants of dividend propen-sity. Specifically, the Renneboog and Trojanowski (2005)sample consists of UK firms that are present in theWorldscope data for at least three years between 1992 and1998, and they simply report the proportion of firms thatpay dividends each year. Benito and Young (2001) controlfor cash flow, leverage, profitability, firm size, and growthopportunities, but they do not control for RE/BE andforecast the propensity to pay dividends only over theperiod 1995–1999.
Two studies that analyze propensity changes overlonger periods of time are Ferris, Sen, and Yui (2006) andvon Eije and Megginson (2006). Ferris, Sen, and Yui studypayout policies in the UK between 1988 and 2002 andconclude that there has been a reduction in the propensityof British firms to pay dividends. However, a closer look attheir data reveals that their findings are driven by the last2 years of their sample period, 2001 and 2002. Themedian change in the propensity to pay dividends overtheir full forecast period is just 0.5%. Thus, their conclu-sion that there has been a reduction in the propensity topay dividends in the UK seems too strong.
von Eije and Megginson (2006) report a decline in theproportion of dividend payers among firms in the 15countries comprising the European Union between 1989and 2003. Controlling for profitability, size, and growthopportunities, they report positive differences betweenthe expected and actual proportion of payers. Theyconclude that there has been a decline in the propensityto pay dividends among European Union firms. However,their sample size also increases substantially over time. Inlight of our evidence on the role of new lists, weconjecture that the propensity declines that they observeare driven by the failure to initiate dividends by the newentrants to their sample. Consistent with this conjecture,von Eije and Megginson (2006) report no decline in thenumber of payers in their sample.
Finally, any international evidence of a decline in thepropensity to pay dividends cannot be attributed to eithera substitution of repurchases for dividends or to a reducedwillingness of managers to pay dividends that is fueled by
ARTICLE IN PRESS
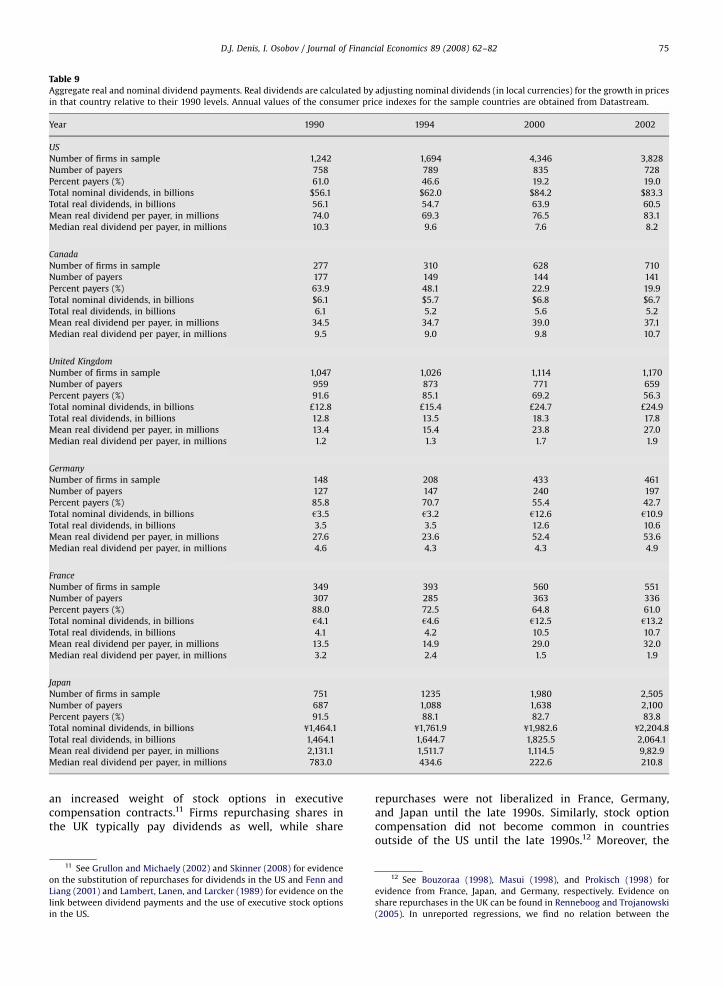
Table 9Aggregate real and nominal dividend payments. Real dividends are calculated by adjusting nominal dividends (in local currencies) for the growth in prices
in that country relative to their 1990 levels. Annual values of the consumer price indexes for the sample countries are obtained from Datastream.
Year 1990 1994 2000 2002
US
Number of firms in sample 1,242 1,694 4,346 3,828
Number of payers 758 789 835 728
Percent payers (%) 61.0 46.6 19.2 19.0
Total nominal dividends, in billions $56.1 $62.0 $84.2 $83.3
Total real dividends, in billions 56.1 54.7 63.9 60.5
Mean real dividend per payer, in millions 74.0 69.3 76.5 83.1
Median real dividend per payer, in millions 10.3 9.6 7.6 8.2
Canada
Number of firms in sample 277 310 628 710
Number of payers 177 149 144 141
Percent payers (%) 63.9 48.1 22.9 19.9
Total nominal dividends, in billions $6.1 $5.7 $6.8 $6.7
Total real dividends, in billions 6.1 5.2 5.6 5.2
Mean real dividend per payer, in millions 34.5 34.7 39.0 37.1
Median real dividend per payer, in millions 9.5 9.0 9.8 10.7
United Kingdom
Number of firms in sample 1,047 1,026 1,114 1,170
Number of payers 959 873 771 659
Percent payers (%) 91.6 85.1 69.2 56.3
Total nominal dividends, in billions £12.8 £15.4 £24.7 £24.9
Total real dividends, in billions 12.8 13.5 18.3 17.8
Mean real dividend per payer, in millions 13.4 15.4 23.8 27.0
Median real dividend per payer, in millions 1.2 1.3 1.7 1.9
Germany
Number of firms in sample 148 208 433 461
Number of payers 127 147 240 197
Percent payers (%) 85.8 70.7 55.4 42.7
Total nominal dividends, in billions h3.5 h3.2 h12.6 h10.9
Total real dividends, in billions 3.5 3.5 12.6 10.6
Mean real dividend per payer, in millions 27.6 23.6 52.4 53.6
Median real dividend per payer, in millions 4.6 4.3 4.3 4.9
France
Number of firms in sample 349 393 560 551
Number of payers 307 285 363 336
Percent payers (%) 88.0 72.5 64.8 61.0
Total nominal dividends, in billions h4.1 h4.6 h12.5 h13.2
Total real dividends, in billions 4.1 4.2 10.5 10.7
Mean real dividend per payer, in millions 13.5 14.9 29.0 32.0
Median real dividend per payer, in millions 3.2 2.4 1.5 1.9
Japan
Number of firms in sample 751 1235 1,980 2,505
Number of payers 687 1,088 1,638 2,100
Percent payers (%) 91.5 88.1 82.7 83.8
Total nominal dividends, in billions f1,464.1 f1,761.9 f1,982.6 f2,204.8
Total real dividends, in billions 1,464.1 1,644.7 1,825.5 2,064.1
Mean real dividend per payer, in millions 2,131.1 1,511.7 1,114.5 9,82.9
Median real dividend per payer, in millions 783.0 434.6 222.6 210.8
D.J. Denis, I. Osobov / Journal of Financial Economics 89 (2008) 62–82 75
an increased weight of stock options in executivecompensation contracts.11 Firms repurchasing shares inthe UK typically pay dividends as well, while share
11 See Grullon and Michaely (2002) and Skinner (2008) for evidence
on the substitution of repurchases for dividends in the US and Fenn and
Liang (2001) and Lambert, Lanen, and Larcker (1989) for evidence on the
link between dividend payments and the use of executive stock options
in the US.
repurchases were not liberalized in France, Germany,and Japan until the late 1990s. Similarly, stock optioncompensation did not become common in countriesoutside of the US until the late 1990s.12 Moreover, the
12 See Bouzoraa (1998), Masui (1998), and Prokisch (1998) for
evidence from France, Japan, and Germany, respectively. Evidence on
share repurchases in the UK can be found in Renneboog and Trojanowski
(2005). In unreported regressions, we find no relation between the
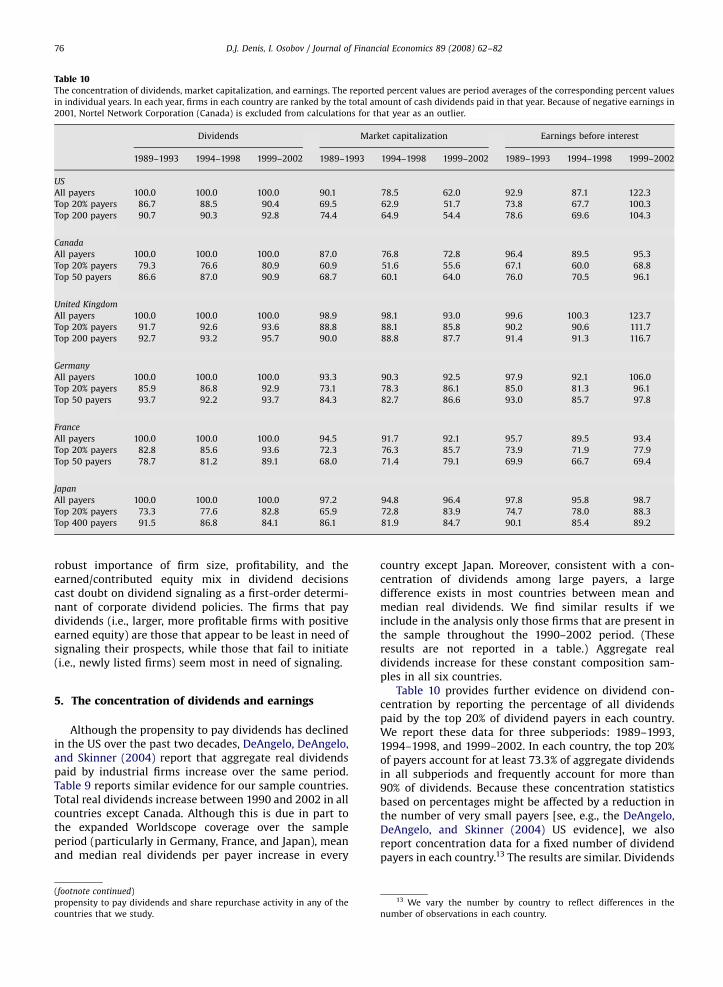
ARTICLE IN PRESS
Table 10The concentration of dividends, market capitalization, and earnings. The reported percent values are period averages of the corresponding percent values
in individual years. In each year, firms in each country are ranked by the total amount of cash dividends paid in that year. Because of negative earnings in
2001, Nortel Network Corporation (Canada) is excluded from calculations for that year as an outlier.
Dividends Market capitalization Earnings before interest
1989–1993 1994–1998 1999–2002 1989–1993 1994–1998 1999–2002 1989–1993 1994–1998 1999–2002
US
All payers 100.0 100.0 100.0 90.1 78.5 62.0 92.9 87.1 122.3
Top 20% payers 86.7 88.5 90.4 69.5 62.9 51.7 73.8 67.7 100.3
Top 200 payers 90.7 90.3 92.8 74.4 64.9 54.4 78.6 69.6 104.3
Canada
All payers 100.0 100.0 100.0 87.0 76.8 72.8 96.4 89.5 95.3
Top 20% payers 79.3 76.6 80.9 60.9 51.6 55.6 67.1 60.0 68.8
Top 50 payers 86.6 87.0 90.9 68.7 60.1 64.0 76.0 70.5 96.1
United Kingdom
All payers 100.0 100.0 100.0 98.9 98.1 93.0 99.6 100.3 123.7
Top 20% payers 91.7 92.6 93.6 88.8 88.1 85.8 90.2 90.6 111.7
Top 200 payers 92.7 93.2 95.7 90.0 88.8 87.7 91.4 91.3 116.7
Germany
All payers 100.0 100.0 100.0 93.3 90.3 92.5 97.9 92.1 106.0
Top 20% payers 85.9 86.8 92.9 73.1 78.3 86.1 85.0 81.3 96.1
Top 50 payers 93.7 92.2 93.7 84.3 82.7 86.6 93.0 85.7 97.8
France
All payers 100.0 100.0 100.0 94.5 91.7 92.1 95.7 89.5 93.4
Top 20% payers 82.8 85.6 93.6 72.3 76.3 85.7 73.9 71.9 77.9
Top 50 payers 78.7 81.2 89.1 68.0 71.4 79.1 69.9 66.7 69.4
Japan
All payers 100.0 100.0 100.0 97.2 94.8 96.4 97.8 95.8 98.7
Top 20% payers 73.3 77.6 82.8 65.9 72.8 83.9 74.7 78.0 88.3
Top 400 payers 91.5 86.8 84.1 86.1 81.9 84.7 90.1 85.4 89.2
D.J. Denis, I. Osobov / Journal of Financial Economics 89 (2008) 62–8276
robust importance of firm size, profitability, and theearned/contributed equity mix in dividend decisionscast doubt on dividend signaling as a first-order determi-nant of corporate dividend policies. The firms that paydividends (i.e., larger, more profitable firms with positiveearned equity) are those that appear to be least in need ofsignaling their prospects, while those that fail to initiate(i.e., newly listed firms) seem most in need of signaling.
5. The concentration of dividends and earnings
Although the propensity to pay dividends has declinedin the US over the past two decades, DeAngelo, DeAngelo,and Skinner (2004) report that aggregate real dividendspaid by industrial firms increase over the same period.Table 9 reports similar evidence for our sample countries.Total real dividends increase between 1990 and 2002 in allcountries except Canada. Although this is due in part tothe expanded Worldscope coverage over the sampleperiod (particularly in Germany, France, and Japan), meanand median real dividends per payer increase in every
(footnote continued)
propensity to pay dividends and share repurchase activity in any of the
countries that we study.
country except Japan. Moreover, consistent with a con-centration of dividends among large payers, a largedifference exists in most countries between mean andmedian real dividends. We find similar results if weinclude in the analysis only those firms that are present inthe sample throughout the 1990–2002 period. (Theseresults are not reported in a table.) Aggregate realdividends increase for these constant composition sam-ples in all six countries.
Table 10 provides further evidence on dividend con-centration by reporting the percentage of all dividendspaid by the top 20% of dividend payers in each country.We report these data for three subperiods: 1989–1993,1994–1998, and 1999–2002. In each country, the top 20%of payers account for at least 73.3% of aggregate dividendsin all subperiods and frequently account for more than90% of dividends. Because these concentration statisticsbased on percentages might be affected by a reduction inthe number of very small payers [see, e.g., the DeAngelo,DeAngelo, and Skinner (2004) US evidence], we alsoreport concentration data for a fixed number of dividendpayers in each country.13 The results are similar. Dividends
13 We vary the number by country to reflect differences in the
number of observations in each country.
ARTICLE IN PRESS
D.J. Denis, I. Osobov / Journal of Financial Economics 89 (2008) 62–82 77
are highly concentrated among the largest payers. More-over, if anything, this concentration has increased slightlyover time except in Japan.
Table 10 also provides evidence on the concentration ofearnings and market capitalization among dividendpayers. Consistent with the evidence for US firms inDeAngelo, DeAngelo, and Skinner (2004), a strong correla-tion exists between the concentration of dividends andthe concentration of earnings. In each country, the topdividend payers account for more than two-thirds ofaggregate earnings in the 1999–2002 subperiod. In threeof the six countries (US, UK, and Germany), top dividendpayers account for more than 90% of aggregate earnings.
Finally, the evidence in Table 10 indicates a strikingconcentration of market capitalization among the topdividend payers in the UK, Germany, France, and Japan. Inthese countries, dividend payers account for more than92% of the aggregate market capitalization in the1999–2002 period. This concentration is not evident inthe US and Canada. Because DeAngelo, DeAngelo, andSkinner (2004) find that nonpayers with high marketcapitalizations tend to be concentrated in technologyindustries, we explore this further. We identify high-techfirms as those in SIC codes 357 (computer equipment),366 (communications equipment), 367 (communicationscomponents), and 737 (software and computer services).We find that, although firms in these industries accountfor 30% and 23% of the market capitalizations in the USand Canada, respectively, in the 1999–2002 period only 5%of the high-tech firms in the US and 7% of the high-techfirms in Canada pay dividends. (These results are notreported in a table.) By contrast, high-tech firms accountfor only 5% (UK) to 18% (Germany) of the marketcapitalization in the other four countries. However, inthese countries, a greater proportion of high-technologyfirms pay dividends, between 28% (Germany) and 84%(Japan). These findings hint at the possibility thatindustry-specific growth opportunities among technologyfirms play some role in the declining propensity to paydividends in the US and Canada, but not in the othercountries.14
The evidence of concentration of dividends amongfirms with high earnings appears inconsistent withclientele and signaling explanations of the propensity topay dividends. Equilibrium clientele theories are based onthe assumption that the set of assets available to investorsallows them to build sufficiently well-diversified portfo-lios with the desired dividend level and risk character-istics. It seems implausible that investors with apreference for zero dividends could build a well-diversi-fied portfolio if over 90% of the market’s capitalization isin dividend paying stocks (as is true in the UK, Germany,France, and Japan).
Similarly, if the propensity to pay dividends wasprimarily driven by signaling considerations, we would
14 The declining propensity to pay dividends observed in the US and
Canada is not observed solely in high-technology industries. If we
exclude these industries from our analysis in Table 5, we continue to
observe propensity reductions in both the US and Canada that are of
similar magnitude to those reported in Table 5.
expect dividends to be paid primarily by those firms mostin need of signaling, i.e., smaller, less profitable firms. Infact, the patterns in the data are opposite of thisprediction. Dividends in all countries are paid by thebiggest, most profitable firms.
The bottom line is that the data provide little supportfor equilibrium clientele or signaling considerations asfirst-order determinants of dividend policies in thecountries that we study. By contrast, the concentrationof dividends among the largest, most profitable firms iswhat one would expect if the primary determinant ofdividends is the payout of free cash flow. In this sense, ourfindings provide strong support for the life-cycle theory ofdividends.
6. Can changes in the propensity to pay dividends beexplained by catering incentives?
Under the Baker and Wurgler (2004a, b) cateringhypothesis, managers cater to investor demand fordividends by paying dividends when investors place avaluation premium on dividend payers and not payingdividends when there is no such valuation premium ondividend payers. This hypothesis seems difficult toreconcile with the large-scale and concentration ofdividend payments reported in Tables 9 and 10. As arguedin DeAngelo, DeAngelo, and Skinner (2004), evidence ofconcentration of dividends and earnings suggests thatdeclines in the propensity to pay dividends cannot beattributed to ‘‘factors that put across-the-board down-ward pressure on dividends’’ (p. 452), as would be thecase with the catering explanation. Put differently, whywould investor demand for dividends be limited to themost profitable firms? Similarly, the catering hypothesis isdifficult to reconcile with our observation that reductionsin the propensity to pay in our sample countries areconcentrated among new lists.
Nonetheless, Baker and Wurgler (2004a) report thatthe dividend premium is related to the rate of dividendinitiations and omissions. Furthermore, Baker and Wurg-ler (2004b) show that the dividend premium explains asubstantial portion of the decline in the propensity of USfirms to pay dividends in the post-1977 period.15
In Table 11, we shed further light on the cateringhypothesis by reporting annual dividend premiums andthe unexpected percent of dividend payers in eachcountry. Following Baker and Wurgler (2004a, b), thedividend premium is defined as the difference betweenthe log of the weighted-average market-to-book ratio ofpayers and that of nonpayers, where the weight is thebook value of total assets. The expected percent ofdividend payers is again determined by first estimatingthe Table 4 regressions annually over the 1989–1993period, then applying the average coefficients to the actual
15 Li and Lie (2006) extend the catering theory to dividend increases
and decreases and find that the decision to change dividends is related to
the dividend premium. Contrary to the catering hypothesis, however,
Hoberg and Prabhala (2005) find that, once they control for risk, catering
incentives are no longer significant in explaining the decline in the
propensity to pay dividends among US firms.
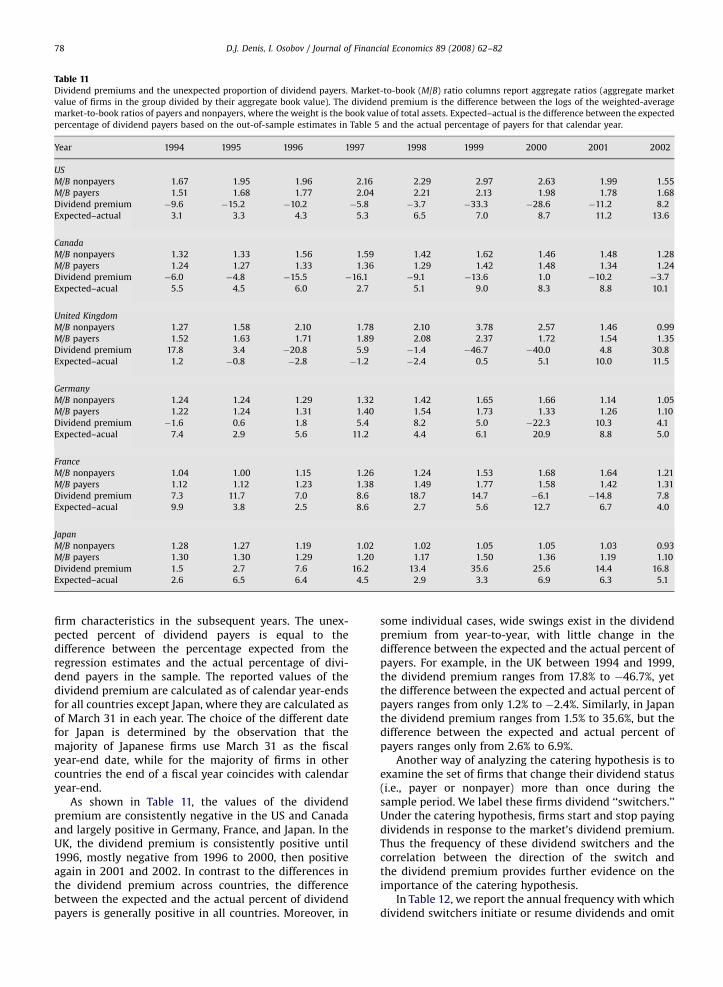
ARTICLE IN PRESS
Table 11Dividend premiums and the unexpected proportion of dividend payers. Market-to-book (M/B) ratio columns report aggregate ratios (aggregate market
value of firms in the group divided by their aggregate book value). The dividend premium is the difference between the logs of the weighted-average
market-to-book ratios of payers and nonpayers, where the weight is the book value of total assets. Expected–actual is the difference between the expected
percentage of dividend payers based on the out-of-sample estimates in Table 5 and the actual percentage of payers for that calendar year.
Year 1994 1995 1996 1997 1998 1999 2000 2001 2002
US
M/B nonpayers 1.67 1.95 1.96 2.16 2.29 2.97 2.63 1.99 1.55
M/B payers 1.51 1.68 1.77 2.04 2.21 2.13 1.98 1.78 1.68
Dividend premium �9.6 �15.2 �10.2 �5.8 �3.7 �33.3 �28.6 �11.2 8.2
Expected–actual 3.1 3.3 4.3 5.3 6.5 7.0 8.7 11.2 13.6
Canada
M/B nonpayers 1.32 1.33 1.56 1.59 1.42 1.62 1.46 1.48 1.28
M/B payers 1.24 1.27 1.33 1.36 1.29 1.42 1.48 1.34 1.24
Dividend premium �6.0 �4.8 �15.5 �16.1 �9.1 �13.6 1.0 �10.2 �3.7
Expected–acual 5.5 4.5 6.0 2.7 5.1 9.0 8.3 8.8 10.1
United Kingdom
M/B nonpayers 1.27 1.58 2.10 1.78 2.10 3.78 2.57 1.46 0.99
M/B payers 1.52 1.63 1.71 1.89 2.08 2.37 1.72 1.54 1.35
Dividend premium 17.8 3.4 �20.8 5.9 �1.4 �46.7 �40.0 4.8 30.8
Expected–acual 1.2 �0.8 �2.8 �1.2 �2.4 0.5 5.1 10.0 11.5
Germany
M/B nonpayers 1.24 1.24 1.29 1.32 1.42 1.65 1.66 1.14 1.05
M/B payers 1.22 1.24 1.31 1.40 1.54 1.73 1.33 1.26 1.10
Dividend premium �1.6 0.6 1.8 5.4 8.2 5.0 �22.3 10.3 4.1
Expected–acual 7.4 2.9 5.6 11.2 4.4 6.1 20.9 8.8 5.0
France
M/B nonpayers 1.04 1.00 1.15 1.26 1.24 1.53 1.68 1.64 1.21
M/B payers 1.12 1.12 1.23 1.38 1.49 1.77 1.58 1.42 1.31
Dividend premium 7.3 11.7 7.0 8.6 18.7 14.7 �6.1 �14.8 7.8
Expected–acual 9.9 3.8 2.5 8.6 2.7 5.6 12.7 6.7 4.0
Japan
M/B nonpayers 1.28 1.27 1.19 1.02 1.02 1.05 1.05 1.03 0.93
M/B payers 1.30 1.30 1.29 1.20 1.17 1.50 1.36 1.19 1.10
Dividend premium 1.5 2.7 7.6 16.2 13.4 35.6 25.6 14.4 16.8
Expected–acual 2.6 6.5 6.4 4.5 2.9 3.3 6.9 6.3 5.1
D.J. Denis, I. Osobov / Journal of Financial Economics 89 (2008) 62–8278
firm characteristics in the subsequent years. The unex-pected percent of dividend payers is equal to thedifference between the percentage expected from theregression estimates and the actual percentage of divi-dend payers in the sample. The reported values of thedividend premium are calculated as of calendar year-endsfor all countries except Japan, where they are calculated asof March 31 in each year. The choice of the different datefor Japan is determined by the observation that themajority of Japanese firms use March 31 as the fiscalyear-end date, while for the majority of firms in othercountries the end of a fiscal year coincides with calendaryear-end.
As shown in Table 11, the values of the dividendpremium are consistently negative in the US and Canadaand largely positive in Germany, France, and Japan. In theUK, the dividend premium is consistently positive until1996, mostly negative from 1996 to 2000, then positiveagain in 2001 and 2002. In contrast to the differences inthe dividend premium across countries, the differencebetween the expected and the actual percent of dividendpayers is generally positive in all countries. Moreover, in
some individual cases, wide swings exist in the dividendpremium from year-to-year, with little change in thedifference between the expected and the actual percent ofpayers. For example, in the UK between 1994 and 1999,the dividend premium ranges from 17.8% to �46.7%, yetthe difference between the expected and actual percent ofpayers ranges from only 1.2% to �2.4%. Similarly, in Japanthe dividend premium ranges from 1.5% to 35.6%, but thedifference between the expected and actual percent ofpayers ranges only from 2.6% to 6.9%.
Another way of analyzing the catering hypothesis is toexamine the set of firms that change their dividend status(i.e., payer or nonpayer) more than once during thesample period. We label these firms dividend ‘‘switchers.’’Under the catering hypothesis, firms start and stop payingdividends in response to the market’s dividend premium.Thus the frequency of these dividend switchers and thecorrelation between the direction of the switch andthe dividend premium provides further evidence on theimportance of the catering hypothesis.
In Table 12, we report the annual frequency with whichdividend switchers initiate or resume dividends and omit
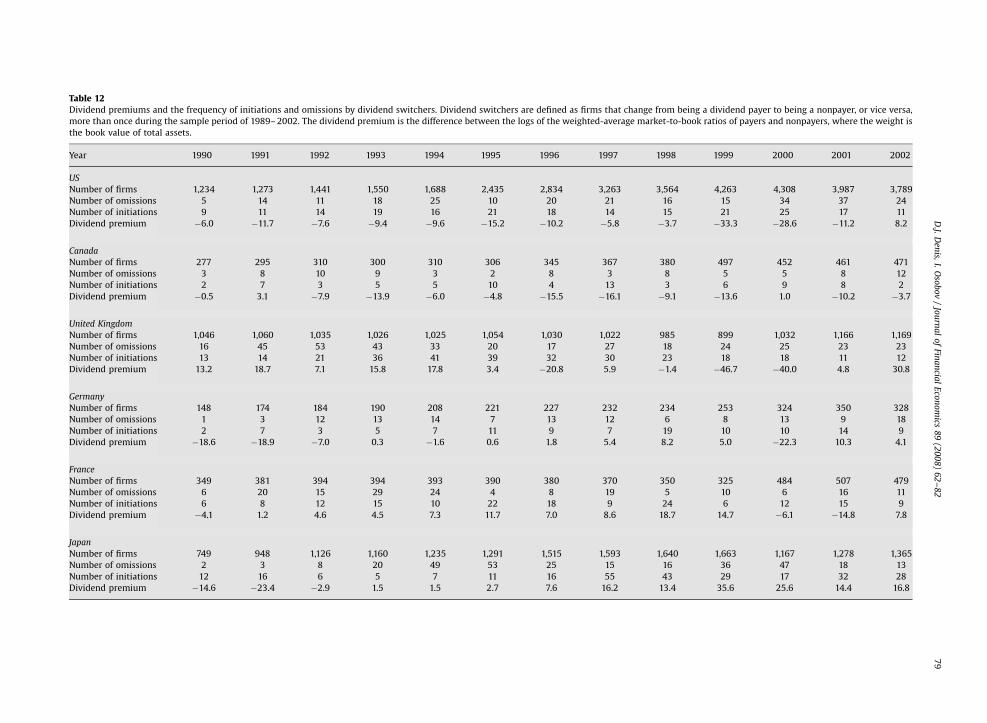
ARTIC
LEIN
PRESS
Table 12Dividend premiums and the frequency of initiations and omissions by dividend switchers. Dividend switchers are defined as firms that change from being a dividend payer to being a nonpayer, or vice versa,
more than once during the sample period of 1989– 2002. The dividend premium is the difference between the logs of the weighted-average market-to-book ratios of payers and nonpayers, where the weight is
the book value of total assets.
Year 1990 1991 1992 1993 1994 1995 1996 1997 1998 1999 2000 2001 2002
US
Number of firms 1,234 1,273 1,441 1,550 1,688 2,435 2,834 3,263 3,564 4,263 4,308 3,987 3,789
Number of omissions 5 14 11 18 25 10 20 21 16 15 34 37 24
Number of initiations 9 11 14 19 16 21 18 14 15 21 25 17 11
Dividend premium �6.0 �11.7 �7.6 �9.4 �9.6 �15.2 �10.2 �5.8 �3.7 �33.3 �28.6 �11.2 8.2
Canada
Number of firms 277 295 310 300 310 306 345 367 380 497 452 461 471
Number of omissions 3 8 10 9 3 2 8 3 8 5 5 8 12
Number of initiations 2 7 3 5 5 10 4 13 3 6 9 8 2
Dividend premium �0.5 3.1 �7.9 �13.9 �6.0 �4.8 �15.5 �16.1 �9.1 �13.6 1.0 �10.2 �3.7
United Kingdom
Number of firms 1,046 1,060 1,035 1,026 1,025 1,054 1,030 1,022 985 899 1,032 1,166 1,169
Number of omissions 16 45 53 43 33 20 17 27 18 24 25 23 23
Number of initiations 13 14 21 36 41 39 32 30 23 18 18 11 12
Dividend premium 13.2 18.7 7.1 15.8 17.8 3.4 �20.8 5.9 �1.4 �46.7 �40.0 4.8 30.8
Germany
Number of firms 148 174 184 190 208 221 227 232 234 253 324 350 328
Number of omissions 1 3 12 13 14 7 13 12 6 8 13 9 18
Number of initiations 2 7 3 5 7 11 9 7 19 10 10 14 9
Dividend premium �18.6 �18.9 �7.0 0.3 �1.6 0.6 1.8 5.4 8.2 5.0 �22.3 10.3 4.1
France
Number of firms 349 381 394 394 393 390 380 370 350 325 484 507 479
Number of omissions 6 20 15 29 24 4 8 19 5 10 6 16 11
Number of initiations 6 8 12 15 10 22 18 9 24 6 12 15 9
Dividend premium �4.1 1.2 4.6 4.5 7.3 11.7 7.0 8.6 18.7 14.7 �6.1 �14.8 7.8
Japan
Number of firms 749 948 1,126 1,160 1,235 1,291 1,515 1,593 1,640 1,663 1,167 1,278 1,365
Number of omissions 2 3 8 20 49 53 25 15 16 36 47 18 13
Number of initiations 12 16 6 5 7 11 16 55 43 29 17 32 28
Dividend premium �14.6 �23.4 �2.9 1.5 1.5 2.7 7.6 16.2 13.4 35.6 25.6 14.4 16.8
D.J.
Den
is,I.
Oso
bo
v/
Jou
rna
lo
fFin
an
cial
Eco
no
mics
89
(20
08
)6
2–
82
79
ARTICLE IN PRESS
D.J. Denis, I. Osobov / Journal of Financial Economics 89 (2008) 62–8280
or abandon dividends. Despite wide swings in thedividend premium from year-to-year, the frequency ofswitchers is low in all six countries. The median annualpercentage of firms that switch their dividend status in agiven year is less than 5% in four of the countries(US, Canada, UK, and Japan) and is below 10% in the othertwo countries (France, 6.8%, and Germany, 8.2%). More-over, the direction of the switch does not appear to be tiedclosely to changes in the dividend premium. Although thecatering hypothesis predicts a preponderance of omis-sions around negative changes in the dividend premiumand a preponderance of initiations around increases in thedividend premium, the data indicate that the number ofinitiations frequently exceeds the number of omissions inthose years in which the change in dividend premium ismost negative. Similarly, omissions frequently outnumberinitiations in those years in which the change in dividendpremium is most positive. If we calculate the difference inthe number of initiations and the number of omissionseach year (net initiations) and compute the correlationbetween this number and the change in the dividendpremium in that year, we find that the median correlationacross countries is a statistically insignificant 0.009. Themedian correlation between net initiations and the levelof the dividend premium is �0.03. The bottom line,therefore, is that few firms switch their dividend statusmore than once over the sample period and even fewerappear to do so in response to changes in the dividendpremium.
Although a full test of the catering hypothesis isbeyond the scope of this paper, these and our priorfindings cast considerable doubt on the catering hypoth-esis as a first-order explanation for the dividend paymentpatterns that we report in the sample countries.16
7. Summary and conclusions
The empirical determinants of the propensity to paydividends appear to be remarkably similar across coun-tries. In all six countries that we study, dividends areaffected by firm size, profitability, growth opportunities,and the earned/contributed equity mix. Larger and moreprofitable firms and those with a greater proportion ofearned equity are more likely to pay dividends, while theeffect of growth opportunities on the likelihood ofdividend payments is mixed. Although some prior studies(e.g., LLSV, 2000) show the importance of firm size,profitability, and growth opportunities outside of the US,our study is the first, to our knowledge, to provideinternational evidence on the importance of the earned/contributed equity mix in dividend policies.
16 Ferris, Sen, and Yui (2006) conclude that catering incentives have
an important influence on the propensity to pay (PTP) dividends in their
sample of UK firms. However, this conclusion appears to be driven by the
final two years of their 1995–2002 sample period. Between 1995 and
2000, large changes occur in the dividend premium, yet these changes
produce only trivial changes in the propensity to pay dividends. Only in
2001 and 2002 is there any evidence of a reduction in the propensity to
pay dividends and a corresponding reduction in the dividend premium.
We conclude, therefore, that little evidence exists that catering
incentives have much influence on UK dividend policies.
After controlling for the empirical determinants ofdividends and the evolution of these characteristics overtime, we find some hints that the phenomenon ofdeclining propensity to pay dividends, first reported forUS firms in Fama and French (2001), extends to otherdeveloped financial markets. That is, the actual proportionof dividend payers is below the expected proportion in allsix countries in the last few years of our sample period of1989–2002. However, these propensity declines are fairlysmall, they are not always robust, and they are driven bythe failure of new lists to initiate dividends whenexpected to do so.
We conclude, therefore, that the data do not allow us toreject the possibility that there has been no meaningfulchange in corporate dividend policies in our samplecountries. While we also cannot reject the possibility thatthere have been small propensity reductions in thesample countries, such reductions are at most limited tonewly listed firms. In this sense, one important contribu-tion of our study is that we narrow the scope of thedisappearing dividends phenomenon to the dividenddecisions of newly listed firms.
The Fama and French (2004) evidence on the char-acteristics of newly listed firms in the US offers someinsight into why these firms have been less likely toinitiate dividends in recent years. Accordingly, a promisingarea for future research would be a systematic analysis ofwhether similar changes in these same characteristics(i.e., more left-skewed profitability and more right-skewed growth opportunities) exist in other markets aswell. If so, any apparent global reduction in the propensityto initiate dividends might simply reflect secular changesin earnings and growth prospects of young firms.
The fact that aggregate dividends have not declinedover time in the sample countries and are concentratedamong the largest, most profitable firms in each countrycasts doubt on signaling and clientele explanations for thepropensity to pay dividends. Moreover, outside of the USwe fail to find much support for the hypothesis thatchanges in dividend policies are driven by managerscatering to investor sentiment for dividends. Our findingsare, however, consistent with a life cycle-based theory ofdividend policy. According to this theory, firms trade offthe flotation cost savings against the agency costs of cashretention. As firms mature (as proxied by greater earnedrelative to contributed equity), the expected costs ofretention increase, perhaps due to greater free cash flowproblems. Consequently, the propensity to pay dividendsincreases. Both the evidence of a strong positive associa-tion between the earned/contributed equity mix and thepropensity to pay dividends and the finding that divi-dends are concentrated among those firms with greatestearnings in all six countries that we study can be readilyexplained by a model (such as the life-cycle theory) inwhich the distribution of free cash flow is the primarydeterminant of dividend policies.
Appendix A
See Table A1.
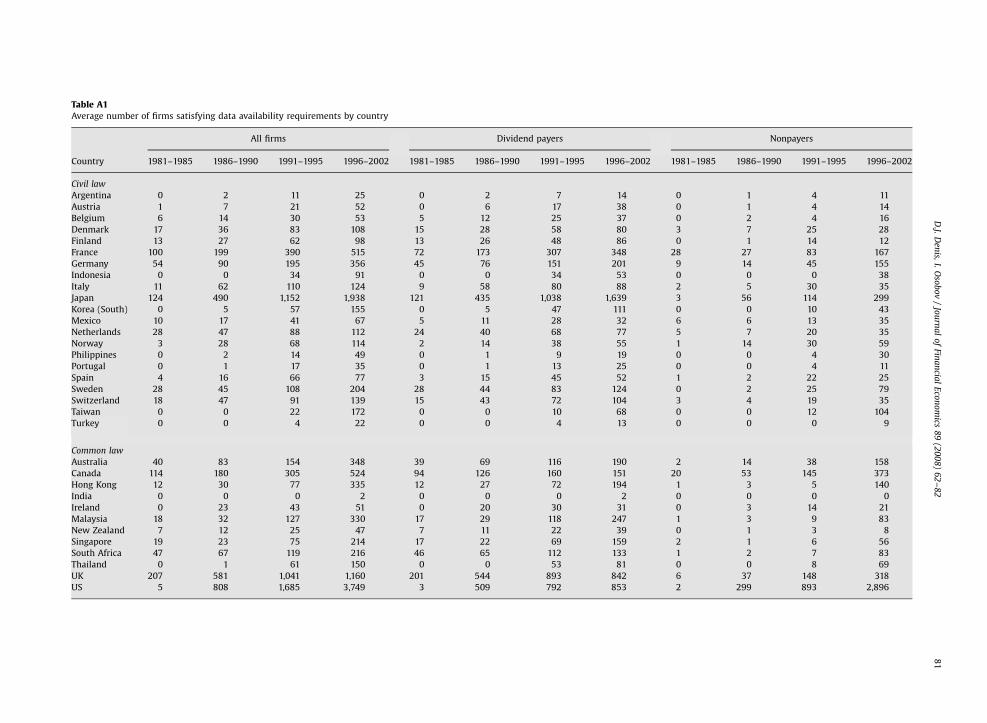
ARTIC
LEIN
PRESS
Table A1Average number of firms satisfying data availability requirements by country
All firms Dividend payers Nonpayers
Country 1981–1985 1986–1990 1991–1995 1996–2002 1981–1985 1986–1990 1991–1995 1996–2002 1981–1985 1986–1990 1991–1995 1996–2002
Civil law
Argentina 0 2 11 25 0 2 7 14 0 1 4 11
Austria 1 7 21 52 0 6 17 38 0 1 4 14
Belgium 6 14 30 53 5 12 25 37 0 2 4 16
Denmark 17 36 83 108 15 28 58 80 3 7 25 28
Finland 13 27 62 98 13 26 48 86 0 1 14 12
France 100 199 390 515 72 173 307 348 28 27 83 167
Germany 54 90 195 356 45 76 151 201 9 14 45 155
Indonesia 0 0 34 91 0 0 34 53 0 0 0 38
Italy 11 62 110 124 9 58 80 88 2 5 30 35
Japan 124 490 1,152 1,938 121 435 1,038 1,639 3 56 114 299
Korea (South) 0 5 57 155 0 5 47 111 0 0 10 43
Mexico 10 17 41 67 5 11 28 32 6 6 13 35
Netherlands 28 47 88 112 24 40 68 77 5 7 20 35
Norway 3 28 68 114 2 14 38 55 1 14 30 59
Philippines 0 2 14 49 0 1 9 19 0 0 4 30
Portugal 0 1 17 35 0 1 13 25 0 0 4 11
Spain 4 16 66 77 3 15 45 52 1 2 22 25
Sweden 28 45 108 204 28 44 83 124 0 2 25 79
Switzerland 18 47 91 139 15 43 72 104 3 4 19 35
Taiwan 0 0 22 172 0 0 10 68 0 0 12 104
Turkey 0 0 4 22 0 0 4 13 0 0 0 9
Common law
Australia 40 83 154 348 39 69 116 190 2 14 38 158
Canada 114 180 305 524 94 126 160 151 20 53 145 373
Hong Kong 12 30 77 335 12 27 72 194 1 3 5 140
India 0 0 0 2 0 0 0 2 0 0 0 0
Ireland 0 23 43 51 0 20 30 31 0 3 14 21
Malaysia 18 32 127 330 17 29 118 247 1 3 9 83
New Zealand 7 12 25 47 7 11 22 39 0 1 3 8
Singapore 19 23 75 214 17 22 69 159 2 1 6 56
South Africa 47 67 119 216 46 65 112 133 1 2 7 83
Thailand 0 1 61 150 0 0 53 81 0 0 8 69
UK 207 581 1,041 1,160 201 544 893 842 6 37 148 318
US 5 808 1,685 3,749 3 509 792 853 2 299 893 2,896
D.J.
Den
is,I.
Oso
bo
v/
Jou
rna
lo
fFin
an
cial
Eco
no
mics
89
(20
08
)6
2–
82
81
ARTICLE IN PRESS
D.J. Denis, I. Osobov / Journal of Financial Economics 89 (2008) 62–8282
References
Allen, F., Michaely, R., 2003. Dividend policy. In: Constantinides, G.,Harris, M., Stulz, R. (Eds.), Handbook of the Economics of Finance.North-Holland, Amsterdam.
Baker, M., Wurgler, J., 2004a. A catering theory of dividends. Journal ofFinance 59, 1125–1165.
Baker, M., Wurgler, J., 2004b. Appearing and disappearing dividends: thelink to catering incentives. Journal of Financial Economics 73,271–288.
Benito, A., Young, G., 2001. Hard times of great expectations? Dividendomissions and dividend cuts by UK firms. Unpublished workingpaper, Bank of England.
Bouzoraa, D., 1998. France. European Taxation 38, 393–398.Charitou, A., 2000. The impact of losses and cash flows on dividends:
evidence from Japan. Abacus: Journal of Accounting, Finance, andBusiness Studies.
DeAngelo, H., DeAngelo, L., 2006. The irrelevance of the MM dividendirrelevance theorem. Journal of Financial Economics 79, 293–316.
DeAngelo, H., DeAngelo, L., Skinner, D.J., 2004. Are dividends disappear-ing? Dividend concentration and the consolidation of earnings.Journal of Financial Economics 72, 425–456.
DeAngelo, H., DeAngelo, L., Stulz, R.M., 2006. Dividend policy and theearned/contributed capital mix: a test of the life-cycle theory. Journalof Financial Economics 81, 227–254.
Dewenter, K., Warther, ., 1998. Dividends asymmetric information andagency conflicts: evidence from a comparison of dividend policies ofJapanese and US firms. Journal of Finance 53, 879–904.
Fama, E.F., Babiak, H., 1968. Dividend policy: an empirical analysis.Journal of the American Statistical Association 63, 1132–1161.
Fama, E.F., French, K.R., 2001. Disappearing dividends: changing firmcharacteristics or lower propensity to pay? Journal of FinancialEconomics 60, 3–43.
Fama, E.F., French, K.R., 2004. New lists: fundamentals and survival rates.Journal of Financial Economics 73, 229–269.
Fama, E.F., MacBeth, J., 1973. Risk, return, and equilibrium: empiricaltests. Journal of Political Economy 81, 607–636.
Fenn, G.W., Liang, N., 2001. Corporate payout policy and managerialincentives. Journal of Financial Economics 60, 45–72.
Ferris, S., Sen, N., Yui, H., 2006. God save the queen and her dividends:corporate payouts in the UK. Journal of Business 70, 1149–1173.
Grullon, G., Michaely, R., 2002. Dividends, share repurchases, and thesubstitution hypothesis. Journal of Finance 57, 1649–1684.
Grullon, G., Michaely, R., Swaminathan, B., 2002. Are dividend changes asign of firm maturity. Journal of Business 75, 387–424.
Hoberg, G., Prabhala, N., 2005. Disappearing dividends: the importanceof idiosyncratic risk and the irrelevance of catering. Unpublishedworking paper, University of Maryland, College Park, MD.
Jensen, M., 1986. Agency costs of free cash flow, corporate finance, andtakeovers. American Economic Review 76, 323–329.
Julio, B., Ikenberry, D.L., 2004. Reappearing dividends. Journal of AppliedCorporate Finance 16 (Fall), 89–100.
Lambert, R.A., Lanen, W.N., Larcker, D.F., 1989. Executive stock optionplans and corporate dividend policy. Journal of Financial andQuantitative Analysis 24, 409–425.
La Porta, R., Lopez-de-Silanes, F., Shleifer, A., Vishny, R.W., 2000. Agencyproblems and dividend policies around the world. Journal of Finance55, 1–33.
Li, W., Lie, E., 2006. Dividend changes and catering incentives. Journal ofFinancial Economics 80, 293–308.
Lintner, J., 1956. Distribution of incomes of corporations amongdividends, retained earnings, and taxes. American Economic Review46, 97–113.
Masui, Y., 1998. Japan. European Taxation 38, 416–419.Miller, M.H., Modigliani, F., 1961. Dividend policy, growth, and the
valuation of shares. Journal of Business 34, 411–433.Newey, W., West, K., 1987. A simple, positive definite, heteroskedasticity
and autocorrelation consistent covariance matrix. Econometrica 55,703–708.
Petersen, M., 2007. Estimating standard errors in finance panel data sets:comparing approaches. Unpublished working paper, NorthwesternUniversity, Evanston, IL.
Prokisch, R., 1998. Germany. European Taxation 38, 398–403.Renneboog, L., Trojanowski, G., 2005. Patterns in payout policy and
payout channel choice of UK firms in the 1990s. Unpublishedworking paper, European Corporate Governance Institute, Brussels,Belgium.
Skinner, D.J., 2008. The evolving relation between earnings, dividends,and stock repurchases. Journal of Financial Economics, forthcoming.
Von Eije, H., Megginson, W., 2006. Dividend policy in the EuropeanUnion. Unpublished working paper, University of Oklahoma, Nor-man, OK.