Adherence to the World Cancer Research Fund/American Institute for Cancer Research guidelines and...
14
Adherence to the World Cancer Research Fund/American Institute for Cancer Research guidelines and risk of death in Europe: results from the European Prospective Investigation into Nutrition and Cancer cohort study 1–5 Anne-Claire Vergnaud, Dora Romaguera, Petra H Peeters, Carla H van Gils, Doris SM Chan, Isabelle Romieu, Heinz Freisling, Pietro Ferrari, Franc ¸oise Clavel-Chapelon, Guy Fagherazzi, Laureen Dartois, Kuanrong Li, Kaja Tikk, Manuela M Bergmann, Heiner Boeing, Anne Tjønneland, Anja Olsen, Kim Overvad, Christina C Dahm, Maria Luisa Redondo, Antonio Agudo, Marı´a-Jose´ Sa´nchez, Pilar Amiano, Marı´a-Dolores Chirlaque, Eva Ardanaz, Kay-Tee Khaw, Nick J Wareham, Francesca Crowe, Antonia Trichopoulou, Philippos Orfanos, Dimitrios Trichopoulos, Giovanna Masala, Sabina Sieri, Rosario Tumino, Paolo Vineis, Salvatore Panico, H Bas Bueno-de-Mesquita, Martine M Ros, Anne May, Elisabet Wirfa¨lt, Emily Sonestedt, Ingegerd Johansson, Go¨ran Hallmans, Eiliv Lund, Elisabete Weiderpass, Christine L Parr, Elio Riboli, and Teresa Norat ABSTRACT Background: In 2007, the World Cancer Research Fund (WCRF) and the American Institute for Cancer Research (AICR) issued recommendations on diet, physical activity, and weight manage- ment for cancer prevention on the basis of the most comprehensive collection of available evidence. Objective: We investigated whether concordance with WCRF/ AICR recommendations is related to risk of death. Design: The current study included 378,864 participants from 9 Euro- pean countries enrolled in the European Prospective Investigation into Cancer and Nutrition study. At recruitment (1992–1998), dietary, an- thropometric, and lifestyle information was collected. A WCRF/AICR score, which incorporated 6 of the WCRF/AICR recommendations for men [regarding body fatness, physical activity, foods and drinks that promote weight gain, plant foods, animal foods, and alcoholic drinks (score range: 0–6)] and 7 WCRF/AICR recommendations for women [plus breastfeeding (score range: 0–7)], was constructed. Higher scores indicated greater concordance with WCRF/AICR recommendations. Associations between the WCRF/AICR score and risks of total and cause-specific death were estimated by using Cox regression analysis. Results: After a median follow-up time of 12.8 y, 23,828 deaths were identified. Participants within the highest category of the WCRF/AICR score (5–6 points in men; 6–7 points in women) had a 34% lower hazard of death (95% CI: 0.59, 0.75) compared with participants within the lowest category of the WCRF/AICR score (0–2 points in men; 0–3 points in women). Significant inverse associations were observed in all countries. The WCRF/AICR score was also significantly associated with a lower hazard of dying from cancer, circulatory disease, and respiratory disease. Conclusion: Results of this study suggest that following WCRF/AICR recommendations could significantly increase longevity. Am J Clin Nutr 2013;97:1107–20. INTRODUCTION In 2004, WHO estimated that diet and lifestyle-related risk factors such as high blood pressure, high blood glucose, physical inactivity, overweight and obesity, high cholesterol, and low fruit and vegetable intake accounted for 18% and 25% of the world death burden in low- middle–income countries and high-income countries, respectively (1). Therefore, improving poor quality diet and lifestyle is one of the major public health goals, and national and international health or- ganizations published guidelines accordingly. Scores derived from dietary recommendations, such as the Alternative Healthy Eating Index, Diet Quality Index, and Recommended Food Score (RFS) 6 have been previously 1 From the Department of Epidemiology and Biostatistics, School of Pub- lic Health, Imperial College London, London, United Kingdom (A-CV, DR, DSMC, PV, ER, and TN); the Julius Center for Health Sciences and Primary Care, University Medical Center Utrecht, Utrecht, Netherlands (PHP, CHvG, and AM); the International Agency for Research on Cancer, Lyon, France (IR, HF, and PF); the Institut National de la Sante ´ et de la Recherche Me ´dicale, Centre for Research in Epidemiology and Population, Health, U1018, Institut Gustave Roussy, Villejuif, France (FC-C, GF, and LD); the Paris South University, Unite ´ Mixte de Recherche 1018, Villejuif, France (FC-C, GF, and LD); the Division of Clinical Epidemiology, German Cancer Research Center, Heidelberg, Germany (KL and KT); the Deutsches Institut fu ¨r Erna ¨hrungsforschung Potsdam-Rehbru ¨cke German Institute of Human Nutrition, Potsdam-Rehbru ¨cke, Germany (MMB and HB); the Danish Can- cer Society, Institute of Cancer Epidemiology, Copenhagen, Denmark (A Tjønneland and AO); the Department of Epidemiology, School of Public Health, Aarhus University, Aarhus, Denmark (KM and CCD); the Depart- ment of Cardiology, Centre for Cardiovascular Research, Aalborg Hospital, Aarhus University Hospital, Aalborg, Denmark (KM and CCD); the Public Health Directorate, Asturias, Spain (MLR); the Unit of Nutrition, Environ- ment and Cancer, Catalan Institute of Oncology, Bellvitge Biomedical Re- search Institute, Barcelona, Spain (AA); the Andalusian School of Public Health, Spain (M-JS); the Consorcio de Investigacio ´n Biome ´dica de Epide- miologı ´a y Salud Pu ´blica (CIBERESP), Spain (M-JS, M-DC, and EA); the Public Health Division of Gipuzkoa, BIODonostia Research Institute, De- partment of Health of the Regional Government of the Basque Country, San Sebastian, Spain (PA); the Department of Epidemiology, Murcia Regional Health Authority, Spain (M-DC); the Navarre Public Health Institute, Pam- plona, Spain (EA); the Clinical Gerontology Unit, University of Cambridge, Cambridge, United Kingdom (K-TK and NJM); the Cancer Epidemiology Unit, Nuffield Department of Clinical Medicine, University of Oxford, Oxford, United Kingdom (FC); the WHO Collaborating Center for Food and Nutrition Am J Clin Nutr 2013;97:1107–20. Printed in USA. Ó 2013 American Society for Nutrition 1107 at OSLO HEALTH CONSORTIUM on May 30, 2013 ajcn.nutrition.org Downloaded from 49569.DCSupplemental.html http://ajcn.nutrition.org/content/suppl/2013/04/10/ajcn.112.0 Supplemental Material can be found at:
Transcript of Adherence to the World Cancer Research Fund/American Institute for Cancer Research guidelines and...

Adherence to the World Cancer Research Fund/American Institute forCancer Research guidelines and risk of death in Europe: results fromthe European Prospective Investigation into Nutrition and Cancercohort study1–5
Anne-Claire Vergnaud, Dora Romaguera, Petra H Peeters, Carla H van Gils, Doris SM Chan, Isabelle Romieu,Heinz Freisling, Pietro Ferrari, Francoise Clavel-Chapelon, Guy Fagherazzi, Laureen Dartois, Kuanrong Li, Kaja Tikk,Manuela M Bergmann, Heiner Boeing, Anne Tjønneland, Anja Olsen, Kim Overvad, Christina C Dahm, Maria Luisa Redondo,Antonio Agudo, Marıa-Jose Sanchez, Pilar Amiano, Marıa-Dolores Chirlaque, Eva Ardanaz, Kay-Tee Khaw,Nick J Wareham, Francesca Crowe, Antonia Trichopoulou, Philippos Orfanos, Dimitrios Trichopoulos, Giovanna Masala,Sabina Sieri, Rosario Tumino, Paolo Vineis, Salvatore Panico, H Bas Bueno-de-Mesquita, Martine M Ros, Anne May,Elisabet Wirfalt, Emily Sonestedt, Ingegerd Johansson, Goran Hallmans, Eiliv Lund, Elisabete Weiderpass, Christine L Parr,Elio Riboli, and Teresa Norat
ABSTRACTBackground: In 2007, the World Cancer Research Fund (WCRF)and the American Institute for Cancer Research (AICR) issuedrecommendations on diet, physical activity, and weight manage-ment for cancer prevention on the basis of the most comprehensivecollection of available evidence.Objective: We investigated whether concordance with WCRF/AICR recommendations is related to risk of death.Design: The current study included 378,864 participants from 9 Euro-pean countries enrolled in the European Prospective Investigation intoCancer and Nutrition study. At recruitment (1992–1998), dietary, an-thropometric, and lifestyle information was collected. A WCRF/AICRscore, which incorporated 6 of the WCRF/AICR recommendations formen [regarding body fatness, physical activity, foods and drinks thatpromote weight gain, plant foods, animal foods, and alcoholic drinks(score range: 0–6)] and 7 WCRF/AICR recommendations for women[plus breastfeeding (score range: 0–7)], was constructed. Higher scoresindicated greater concordance with WCRF/AICR recommendations.Associations between the WCRF/AICR score and risks of total andcause-specific death were estimated by using Cox regression analysis.Results: After a median follow-up time of 12.8 y, 23,828 deathswere identified. Participants within the highest category of theWCRF/AICR score (5–6 points in men; 6–7 points in women)had a 34% lower hazard of death (95% CI: 0.59, 0.75) comparedwith participants within the lowest category of the WCRF/AICRscore (0–2 points in men; 0–3 points in women). Significant inverseassociations were observed in all countries. The WCRF/AICR scorewas also significantly associated with a lower hazard of dying fromcancer, circulatory disease, and respiratory disease.Conclusion: Results of this study suggest that following WCRF/AICRrecommendations could significantly increase longevity. Am JClin Nutr 2013;97:1107–20.
INTRODUCTION
In 2004, WHO estimated that diet and lifestyle-related risk factorssuch as high blood pressure, high blood glucose, physical inactivity,
overweight and obesity, high cholesterol, and low fruit and vegetableintake accounted for 18% and 25% of the world death burden in low-middle–income countries and high-income countries, respectively(1). Therefore, improving poor quality diet and lifestyle is one of themajor public health goals, and national and international health or-ganizations published guidelines accordingly.
Scores derived from dietary recommendations, such as theAlternative Healthy Eating Index, Diet Quality Index, andRecommended Food Score (RFS)6 have been previously
1From the Department of Epidemiology and Biostatistics, School of Pub-lic Health, Imperial College London, London, United Kingdom (A-CV, DR,DSMC, PV, ER, and TN); the Julius Center for Health Sciences and PrimaryCare, University Medical Center Utrecht, Utrecht, Netherlands (PHP, CHvG,and AM); the International Agency for Research on Cancer, Lyon, France(IR, HF, and PF); the Institut National de la Sante et de la RechercheMedicale, Centre for Research in Epidemiology and Population, Health,U1018, Institut Gustave Roussy, Villejuif, France (FC-C, GF, and LD); theParis South University, Unite Mixte de Recherche 1018, Villejuif, France(FC-C, GF, and LD); the Division of Clinical Epidemiology, German CancerResearch Center, Heidelberg, Germany (KL and KT); the Deutsches Institutfur Ernahrungsforschung Potsdam-Rehbrucke German Institute of HumanNutrition, Potsdam-Rehbrucke, Germany (MMB and HB); the Danish Can-cer Society, Institute of Cancer Epidemiology, Copenhagen, Denmark (ATjønneland and AO); the Department of Epidemiology, School of PublicHealth, Aarhus University, Aarhus, Denmark (KM and CCD); the Depart-ment of Cardiology, Centre for Cardiovascular Research, Aalborg Hospital,Aarhus University Hospital, Aalborg, Denmark (KM and CCD); the PublicHealth Directorate, Asturias, Spain (MLR); the Unit of Nutrition, Environ-ment and Cancer, Catalan Institute of Oncology, Bellvitge Biomedical Re-search Institute, Barcelona, Spain (AA); the Andalusian School of PublicHealth, Spain (M-JS); the Consorcio de Investigacion Biomedica de Epide-miologıa y Salud Publica (CIBERESP), Spain (M-JS, M-DC, and EA); thePublic Health Division of Gipuzkoa, BIODonostia Research Institute, De-partment of Health of the Regional Government of the Basque Country, SanSebastian, Spain (PA); the Department of Epidemiology, Murcia RegionalHealth Authority, Spain (M-DC); the Navarre Public Health Institute, Pam-plona, Spain (EA); the Clinical Gerontology Unit, University of Cambridge,Cambridge, United Kingdom (K-TK and NJM); the Cancer EpidemiologyUnit, Nuffield Department of Clinical Medicine, University of Oxford, Oxford,United Kingdom (FC); the WHO Collaborating Center for Food and Nutrition
Am J Clin Nutr 2013;97:1107–20. Printed in USA. � 2013 American Society for Nutrition 1107
at OS
LO H
EA
LTH
CO
NS
OR
TIU
M on M
ay 30, 2013ajcn.nutrition.org
Dow
nloaded from
49569.DCSupplemental.html http://ajcn.nutrition.org/content/suppl/2013/04/10/ajcn.112.0Supplemental Material can be found at:

associated with 20–45% lower mortality risk (2–6). However,results differed according to the cause of death. After 4 y offollow-up, a higher Diet Quality Index score, which was in-dicative of a poorer quality diet, was associated with higherrisk of circulatory disease mortality in American women butnot with risk of cancer mortality in either men or women (6).Similarly, subjects from the United Kingdom in the top com-pared with the bottom one-third of the Alternative HealthyEating Index score showed 40% lower mortality from cardio-vascular disease (CVD), but no association was observed withmortality from cancer (2). In Sweden, the association betweenRFS and CVD death was weaker than the association betweenRFS and cancer death in women (5) and was not significant inmen (3). Similar results were observed in American women inwhom a higher RFS was associated with a lower mortalityfrom cancer but not from coronary heart disease or stroke after9.5 y of follow-up (4).
The weaker predictive value for mortality from cancer ob-served in most of these studies could have been due to the fact thatthese indexes were based on recommendations for general healthand not for cancer prevention specifically. However, the only 2previous studies that specifically tested indexes on the basis ofcancer-prevention recommendations were performed in theUnited States and showed contradictory results as well (7, 8).Both studies included recommendations on dietary behaviors aswell as weight and physical activity. In the IowaWomen’s Healthstudy, a higher adherence to the American Institute for CancerResearch (AICR) guidelines was as expected associated withlower cancer mortality but not with CVD mortality (7). How-ever, in the Cancer Prevention study II Nutrition cohort, ad-herence to the American Cancer Society Cancer Preventionguidelines was inversely associated with both outcomes and theassociation was stronger for CVD mortality compared withcancer mortality (8). In addition, previous studies focused ondeath from cancer and circulatory disease. However, diet andlifestyle factors have previously been associated with variousother chronic diseases. It is therefore also relevant to know howadhering to those major public health recommendations couldaffect other leading causes of death.
In 2007, the World Cancer Research Fund (WCRF)/AICRissued 8 general and 2 special recommendations on diet, physicalactivity, and weight management on the basis of the mostcomprehensive collection of available evidence. The aim of therecommendations was to prevent cancer by taking into accountpreviously published recommendations designed to promotenutritional adequacy and prevent cardiovascular and otherchronic diseases (9). To our knowledge, WCRF/AICR guidelineshave been previously evaluated for cancer prevention (10) but notfor mortality. In the current study, we evaluate whether followingthe 2007 WCRF/AICR recommendations was related to totalmortality and cause-specific mortality in men and women from10 European countries enrolled in the large European ProspectiveInvestigation into Nutrition and Cancer (EPIC) cohort study.
SUBJECTS AND METHODS
The EPIC is a multi-center, prospective cohort study in-vestigating the role of metabolic, dietary, lifestyle, and envi-ronmental factors in the development of cancer and other chronicdiseases. Briefly, between 1992 and 2000, 521,330 men andwomen aged 25–70 y were recruited in 23 centers from 10European countries (Denmark, France, Germany, Greece, Italy,Netherlands, Norway, Spain, Sweden, and the United Kingdom).
Actual study populations were samples of convenience withparticipant eligibility within each center that was based essen-tially on geographic or administrative boundaries. Individualswere selected from the general population in most centers exceptin the French cohort, which was based on state-school employees,and the Utrecht (Netherlands) and Florence (Italy) cohorts, whichwere based on women who underwent breast cancer screening.Furthermore, a large proportion of participants from the centersof Spain and Italy were recruited among blood donors, membersof several health insurance programs, employees of several en-terprises, or civil servants. Most of the Oxford cohort consisted ofhealth-conscious subjects from England, Wales, Scotland, andNorthern Ireland, many of whom were vegetarians. Approval forthis study was obtained from the ethical review boards of the
Policies, Department of Hygiene, Epidemiology and Medical Statistics, Uni-versity of Athens Medical School, Athens, Greece (ATrichopoulou and PO);the Hellenic Health Foundation, Athens, Greece (A Trichopoulou, PO, andDT); the Department of Epidemiology, Harvard School of Public Health,Boston, MA (DT); the Bureau of Epidemiologic Research, Academy ofAthens, Athens, Greece (DT); the Molecular and Nutritional EpidemiologyUnit, Cancer Research and Prevention Institute, Florence, Italy (GM); theEpidemiology and Prevention Unit, Department of Preventive and PredictiveMedicine, Foundation of the Carlo Besta Neurological Institute, NationalCancer Institute, Milan, Italy (SS); the Cancer Registry and HistopathologyUnit, “Civile MP Arezzo” Hospital, Azienda Sanitaria Provinciale Ragusa,Ragusa, Italy (RT); the Human Genetics Foundation, Turin, Italy (PV); theDepartment of Clinical and Experimental Medicine, Federico II University,Naples, Italy (SP); the National Institute for Public Health and the Environ-ment, Bilthoven, Netherlands (HBB-d-M and MMR); the Department ofGastroenterology and Hepatology, University Medical Centre, Utrecht,Netherlands (HBB-d-M); the Department of Clinical Sciences in Malmo,Lund University, Malmo, Sweden (E Wirfalt); the Departments of Odontol-ogy (IJ) and Public Health and Clinical Medicine, Nutritional Research(GH), Umea University, Umea, Sweden); the Institute of Community Med-icine, University of Tromsø, Breivika, Norway (EL and E Weiderpass); andthe Institute of Basic Medical Sciences, Department of Biostatistics, Univer-sity of Oslo, Oslo, Norway (CLP).
2Funders had no role in the study design, data collection and analysis,decision to publish, or preparation of the manuscript.
3Supported by the World Cancer Research Fund, International RegularGrant Programme (grant 2009/44). In addition, European Prospective Inves-tigation into Nutrition and Cancer investigators acknowledge funding fromthe following agencies: the Institut National de la Sante et de la RechercheMedicale, Institut Gustave Roussy, the French League against Cancer, theMutuelle Generale de l’Education Nationale, and the Institut Gustave Roussy(France); the Health Research Fund of the Spanish Ministry of Health; Re-gional Governments of Andalucıa, Asturias, Basque Country, Murcia (6236)and Navarra; and Instituto de Salud Carlos III RETIC (RD06/0020) (Spain);the Italian Association for Research on Cancer, Milan (Italy); and the Hel-lenic Health Foundation and the JF Costopoulos Foundation (Greece).
4Address reprint requests to T Norat, Department of Epidemiology andBiostatistics, School of Public Health, Imperial College London, StMary’s Campus, Norfolk Place, W2 1PG, London, United Kingdom.E-mail: [email protected].
5Address correspondence to A-Claire Vergnaud, Department of Epi-demiology and Biostatistics, School of Public Health, Imperial CollegeLondon, St Mary’s Campus, Norfolk Place, W2 1PG, London, UnitedKingdom. E-mail: [email protected].
6Abbreviations used: AICR, American Institute for Cancer Research;CVD, cardiovascular disease; EPIC, European Prospective Investigationinto Nutrition and Cancer; RAP, rate advancement period; RFS, Recom-mended Food Score; WCRF, World Cancer Research Fund.Received August 20, 2012. Accepted for publication February 8, 2013.First published online April 3, 2013; doi: 10.3945/ajcn.112.049569
1108 VERGNAUD ET AL
at OS
LO H
EA
LTH
CO
NS
OR
TIU
M on M
ay 30, 2013ajcn.nutrition.org
Dow
nloaded from

International Agency for Research on Cancer and from all localinstitutions where subjects had been recruited for the EPIC study.Written informed consent was obtained from all participantsbefore joining the EPIC study. Details of the study design used inthe EPIC study have been described elsewhere (11, 12).
For the current study, we excluded participants with in-complete follow-up information (n = 2922), participants witha missing date of death (n = 538), participants who did notcomplete the lifestyle (n = 1286) or dietary (n = 5315) ques-tionnaires, and participants within the lowest and highest 1% ofthe cohort distribution of the ratio of reported total energy in-take:energy requirement (13) (n = 10,119). We also excludedpregnant women (n = 560) and participants with missing data forthe following variables: weight or height (n = 4522), physicalactivity [n = 67,797, including all participants from Umea(Sweden) and Norway where this information was not col-lected in sufficient detail], and women with no information onbreastfeeding or duration of breastfeeding [n = 22,176, includingall female participants from Bilthoven (Netherlands) where thisinformation was not collected]. Finally, to avoid confounding bypreexisting chronic diseases, we excluded 27,231 participantswho reported a history of cancer, heart disease, or stroke atbaseline. Thus, the final study included 378,864 participants.
Data collection and dietary questionnaires
At baseline, participants filled out extensive medical, dietary,and lifestyle questionnaires, including questions on alcohol use,smoking status, physical activity, education, menopausal status,breastfeeding, and previous illnesses. For the current study,education was coded as follows: none, primary school, technicalschool, secondary school, and university degree; smoking statusand smoking intensity were coded as follows: never; former, quitsmoking .20 y ago; former, quit smoking 11–20 y ago; former,quit smoking #10 y ago; smoker, 1–15 cigarettes/d; smoker,16–25 cigarettes/d; smoker, .25 cigarettes/d; and smoker, pipeor cigar; and menopausal status was coded as follows: pre-menopausal, perimenopausal, and postmenopausal. Body weightand height were measured in all centers except France and inthe health-conscious group of the Oxford center where anthro-pometric measures were self-reported (14). Usual food intakeswere measured by using country-specific validated dietaryquestionnaires (15), and individual nutrient intakes were derivedfrom the standardized EPIC nutrient database (16). To correctfor any systematic underestimation or overestimation of dietaryintake between study centers, a dietary calibration study wasconducted in a random sample of 36,308 men and women (7.4%of the sample) who completed a standardized computerized 24-hdietary recall (EPIC-Soft; IARC). Dietary exposures acrosscenters were scaled by using an additive calibration (15).Briefly, differences between sex- and center- specific means ofvalues from the food-frequency questionnaire, and means of24-h recall values were calculated and added to questionnairevalues.
WCRF/AICR score construction
A WCRF/AICR score, which incorporated 6 WCRF/AICRrecommendations for men (regarding body fatness, physicalactivity, foods and drinks that promote weight gain, plant foods,
animal foods, and alcoholic drinks) and 7 WCRF/AICR rec-ommendations for women (plus breastfeeding) was constructed.Detailed information on the operationalization of the score hasbeen previously published (10) and is shown in Table 1.
Briefly, for each component we assigned 1 point when therecommendation was met, 0.5 points when it was half met, and0 points otherwise. When available, quantitative criteria providedin the recommendations were used as cutoffs, and intermediatecutoffs defined by the authors were used otherwise. For rec-ommendations including several subrecommendations (foodsand drinks that promote weight gain or plant foods), the finalscore was the average of each subrecommendation score. Thefollowing 3 recommendations were not implemented: 1) rec-ommendation 7 on preservation, processing, and preparation offoods because of insufficient data available, 2) recommendation8 on dietary supplements, which could not be operationalized interms of cancer prevention without additional assumptions aboutthe type or dose of supplementation, and 3) the special recom-mendation S2 related to cancer survivors, which was outside thescope of cancer prevention. Because WCRF/AICR recommen-dations were not ranked according to priority, all major rec-ommendations were summed to contribute equally to the totalWCRF/AICR score. Therefore, the total WCRF/AICR scoreranged from 0 to 6 for men and from 0 to 7 for women, withgreater adherence to WCRF/AICR recommendations indicatedby higher scores.
The score was further categorized into 5 categories accord-ing to predefined cutoffs (ie, 0–2, 2.25–2.75, 3–3.75, 4–4.75, and5–6 points in men; 0–3, 3.25–3.75, 4–4.75, 5–5.75, and 6–7points in women). With this categorization, the score differencebetween the upper limit of the first category and the lower limitof the fifth category was 3 points.
Case ascertainment
Vital status and the cause and date of death were ascertained bymeans of record linkages with cancer registries, boards of health,and death indexes (in the case of Denmark, Italy, Netherlands,Spain, Sweden, and the United Kingdom) or by active follow-up(in the case of Germany, Greece, and France). Active follow-upincluded inquiries by mail or telephone to participants, municipalregistries, regional health departments, physicians, and hospitals.The last year of record linkage varied between centers and rangedbetween 2006 and 2010. In the total EPIC cohort (n = 521,330),1.5% of participants were lost to follow-up (because of with-drawal, emigration, or unknown reason). Follow-up began at thedate of enrollment and ended at either the date of death or lastcomplete follow-up. Because of a time interval between therecording of the vital status and recording of the cause of deathin some centers, the last complete follow-up for cause-specificdeaths was potentially before the last complete follow-up for all-cause deaths. For the current study, the follow-up for cause-specific deaths was considered complete when $80% of causesof deaths that occurred in the past 6 mo were recorded. Onaverage, 96% of causes of deaths that occurred in the past 6 mowere known at the last complete follow-up date in the currentstudy.
The underlying cause of death was coded according to the firstlevel of the International Classification of Diseases, 10th Re-vision hierarchy. Causes of death were analyzed separately if
ADHERENCE TO WCRF/AICR GUIDELINES AND MORTALITY 1109
at OS
LO H
EA
LTH
CO
NS
OR
TIU
M on M
ay 30, 2013ajcn.nutrition.org
Dow
nloaded from

TABLE1
WCRF/AICRrecommendations
forcancer
preventionandoperationalizationoftheWCRF/AICRscore
intheEPIC
study1
Personalrecommendations
Operationalization
Scoring
Percentage
WCRF/AICR
recommendations
1.Bodyfatness
1a.
Ensure
that
bodyweightthroughchildhoodand
adolescentgrowth
projectstowardthelower
endofthe
norm
alBMIrangeat
age21y
Insufficientdataavailable
NA
Beas
lean
aspossible
without
becomingunderweight
1b.Maintainbodyweightwithin
thenorm
alrangefrom
age
21y
BMI(inkg/m
2)of18.5–24.9
148.4
BMI:25–29.9
0.5
35.8
1c.Avoid
weight
gainandincreasesin
waistcircumference
throughoutadulthood
BMI,18.5
or.30
Insufficientdataavailable
0 NA
15.9
—
2.Physicalactivity
2a.
Bemoderatelyphysicallyactive,equivalentto
brisk
walking,$30min/d
Manual/heavymanual
job,or.2h/wkof
vigorousPA
,or.30min/d
ofcycling/sports2
139.2
Bephysicallyactive
aspartof
youreveryday
life
2b.
Asfitnessim
proves,aim
for$60min
ofmoderateor
$30min
ofvigorousPA
/d
15–30min/d
ofcycling/sports2
0.5
15.5
,15min/d
ofcycling/sports2
045.3
2c.
Lim
itsedentary
habitssuch
aswatchingtelevision
Insufficientdataavailable
NA
—
Insufficientdataavailable
NA
—
3.Foodsanddrinks
that
promote
weight
gain3
,4
Lim
itconsumptionofenergy-dense
foods;avoid
sugarydrinks
3a.
Consumeenergy-dense
foodssparingly
3b.
Avoid
sugarydrinks
3c.
Consumefastfoodssparingly,ifat
all
ED
#125kcal/100g/d
51
23.0
ED
.125–,
175kcal/100g/d
50.5
59.1
ED
.175kcal/100g/d
50
17.9
Sugarydrinksintakeof0g/d
61
21.2
Sugarydrinksintake#250g/d
60.5
61.5
Sugarydrinksintake.250g/d
60
17.3
Insufficientdataavailable
NA
4.Plantfoods3
,44a.
Eat
$5portions/servings($
400g)ofavarietyof
nonstarchyvegetablesandoffruiteveryday
4b.Eatrelatively
unprocessed
cereals(grains)and/orpulses
(legumes)witheverymeal
4c.
Lim
itrefined
starchyfoods
4d.Peoplewhoconsumestarchyrootsortubers
asstaples
shouldalso
ensure
asufficientintakeofnonstarchy
vegetables,fruit,andpulses
(legumes)
F&V
intake$400g/d
142.7
Eat
mostly
foodsofplantorigin
F&V
intakeof200to
,400g/d
0.5
38.4
F&V
intake,200g/d
Dietary
fiber
intake$25g/d
Dietary
fiber
intakeof12.5
to,25g/d
Dietary
fiber
intake,12.5
g/d
Insufficientdataavailable
Notapplicable
tothispopulation
0 1 0.5 0 NA
NA
18.9
27.3
60.5
12.2
— —
5.Anim
alfoods4
5a.
Peoplewhoeatredmeatto
consume,500g/wk,very
little,ifany,
tobeprocessed
Red
andprocessed
meat,500g/wkof
whichprocessed
meatintake,3g/d
115.0
Lim
itintakeofredmeatand
avoid
processed
meat
Red
andprocessed
meat,500g/wkof
whichprocessed
meatintakeof3to
,50g/d
0.5
35.9
Red
andprocessed
meat$500g/wkor
processed
meatintake$50g/d
049.1
6.Alcoholicdrinks
6a.
Ifalcoholicdrinks
areconsumed,limitconsumption
to
#2drinks/d
formen
and1drink/dforwomen
Ethanolintake#20g/d
(men)7
166.2
Lim
italcoholicdrinks
Ethanolintake#10g/d
(women)7
Ethanolintake.20and#30g/d
(men)7
0.5
16.1
Ethanolintake.10and#20g/d
(women)7
Ethanolintake.30g/d
(men)7
017.8
Ethanolintake.20g/d
(women)7
(Continued)
1110 VERGNAUD ET AL
at OS
LO H
EA
LTH
CO
NS
OR
TIU
M on M
ay 30, 2013ajcn.nutrition.org
Dow
nloaded from

TABLE
1(C
ontinued
)
Personal
recommendations
Operationalization
Scoring
Percentage
7.Preservation,processing,preparation
7a.
Avoid
salt-preserved,salted,orsaltyfoods;preserve
foodswithout
usingsalt
Insufficientdataavailable
NA
—
Lim
itconsumptionofsalt.Avoid
moldy
cereals(grains)
orpulses
(legumes)
7b.Lim
itconsumptionofprocessed
foodswithadded
saltto
ensure
anintake,6g(2.4
gNa)/d
Insufficientdataavailable
NA
—
7c.
Donoteatmoldycereals(grains)
orpulses
(legumes)
Insufficientdataavailable
NA
—
8.Dietary
supplem
ents
8a.
Dietary
supplementsarenotrecommended
forcancer
prevention
Notapplicable
tothispopulation
NA
—
Aim
tomeetnutritionalneedsthrough
dietalone
WCRF/AICR
specialrecommendations
S1.Breastfeeding
S1a.
Aim
tobreastfeedinfantsexclusively
upto
6moand
continue
withcomplementary
feedingthereafter
Cum
ulative
breastfeeding$6mo
135.2
Mothersto
breastfeed;children
tobebreastfed
Cum
ulative
breastfeeding.0to
,6mo
0.5
35.0
Nobreastfeeding
029.8
S2.Cancersurvivors
S2a.Allcancersurvivorsto
receivenutritionalcare
from
an
appropriately
trainedprofessional
Notapplicable
tothispopulation
NA
—
Follow
recommendationsfor
cancer
prevention
S2b.
Ifable
todoso,andunless
otherwiseadvised,aim
to
follow
therecommendationsfordiet,healthyweight,and
PA
Notapplicable
tothispopulation
NA
—
1Percentages
show
thedistributionofthepopulationbyeach
componentcategorizationoftheWCRF/AICRscore.AICR,American
Institute
ofCancerResearch;ED,energydensity;EPIC,European
Prospective
Investigationinto
CancerandNutrition;F&V,fruitandvegetable;NA,notavailable;PA
,physicalactivity;WCRF,
WorldCancerResearchFund.
2Variablesselected
tooperationalizetherecommendationonPA
arethose
included
intheCam
bridgePA
index(exceptforvigorousPA
)that
has
beenvalidated
foritsuse
inepidem
iologic
studies.
3Score
forrecommendations
3and4was
theresultofaveragingthescoresofeach
subrecommendation.
4Alldietary
variablesusedfortheconstructionoftheWCRF/AICRscore
werecalibratedusingadditivecalibration(exceptforalcoholandED).
5EDwas
calculatedas
energy
(kcal)from
foods(solidfoodsandsemi-solidorliquid
foodssuch
assoups)divided
bytheweights(g)ofthesefoods.Drinks(includingwater,tea,coffee,juice,softdrinks,
alcoholicdrinks,andmilk)
werenotincluded
inthecalculation.
6Sugarydrinksincluded
both
softdrinks
andF&V
juices.
7A
drinkcorrespondsto
10gethanol.Fortheanalysis
that
usedlifetimealcoholconsumption,thealcoholaveragelifetimeintake(g/d)was
usedwiththesamecodingas
forbaselinealcoholintake.
ADHERENCE TO WCRF/AICR GUIDELINES AND MORTALITY 1111
at OS
LO H
EA
LTH
CO
NS
OR
TIU
M on M
ay 30, 2013ajcn.nutrition.org
Dow
nloaded from

$1000 deaths were identified, which led to the following cate-gories: death from cancer (C00–D48; ie, including benignneoplasms), circulatory disease (I00–I99) and respiratory dis-ease (J00–J99). Remaining causes were combined into the cat-egory other. Results for this category are not discussed becausedeath from other causes was a very heterogeneous group and,therefore, difficult to interpret as a whole. See Table S1 under“Supplemental data” in the online issue for details of deathfrequencies in each category.
Statistical analyses
We first examined the distribution of the population’s maincharacteristics according to WCRF/AICR score categories andsex, which showed percentages within groups for categoricalvariables as well as group means6SDs for continuous variables.Associations between the WCRF/AICR score and risk of deathwere analyzed with the use of a Cox regression model, whichwas stratified according to study center, sex, and age at re-cruitment (in 5-y categories) to allow for a slight departure fromthe proportional hazards assumption. Age was used as the pri-mary time variable, with the entry time defined as the subject’sage at recruitment and exit time as he age at death or censoring(whichever came first). The WCRF/AICR score was assessed asa continuous variable (1-point increment) and as a categoricalvariable (by using the 5 predefined categories). Because ofa slightly different coding of the score in men and women,analyses were performed in men and women separately (P-interaction = 0.52). Crude models (model 0: stratified for sex,age, and center) as well as models adjusted for educational level,smoking status, and intensity of smoking (and menopausal statusin women) (model 1) were performed. We also investigated theeffect of additional adjustment for total energy intake (contin-uous) (model 2). Participants with missing data for confoundingvariables were classified as a separate category (n = 13,404 foreducational level and n = 8803 for smoking status). The effect ofa difference in the WCRF/AICR score was also calculated byusing the mortality rate advancement period (RAP) (17) by di-viding the regression coefficient of the WCRF/AICR score bythe regression coefficient of age (y). RAPs can be interpreted asthe average time period by which the death-rate level could, intheory, be postponed through a 1-unit increase in the WCRF/AICR score (in the absence of competing causes of death).
Sensitivity analyses were performed with the exclusion ofparticipants who died in the first 2 y of follow-up, participantswho reported hyperlipidemia, hypertension, or diabetes atbaseline, or participants with BMI (in kg/m2),18. When alcoholconsumption at baseline was used to determine adherence to thealcohol recommendation, alcohol abstainers included formerdrinkers who could have quit drinking because of illness.Therefore, we also evaluated whether the results were modifiedwhen lifetime alcohol consumption (18) was used to determineadherence to the alcohol recommendation. This sensitivityanalyses were performed in a subsample of 341,884 participantsfor whom lifetime alcohol consumption was available.
To evaluate the relative importance of each of the componentsof the WCRF/AICR score on risk of death, we estimated theindividual association for each mutually adjusted component ofthe WCRF/AICR score (in 3 categories of 0, 0.25–0.5, and 0.75–1) as well as by subtracting alternately one component at a time
from the original score (and including this component as a co-variate in the model). To be able to compare risk estimates tothat of the total WCRF/AICR score, these alternative scoreswere assessed as continuous variables per 1-SD increment.
Plausible effect modifications by baseline BMI category (,25,25 to ,30, and $30), age category (#50 and .50 y), educa-tional level, and smoking status (former smokers, currentsmokers, and never smokers) were explored by modeling in-teraction terms between these variables and the WCRF/AICRscore. Potential heterogeneity between countries in the associ-ation between the WCRF/AICR score and risk of death wasassessed by calculating country-specific estimates and usingrandom-effect meta-analyses (I2). Differences according to thecause of death were examined in competing risk models byusing data augmentation (19) with the same level of adjustmentas previously specified. HRs for the comparison of participantswho adhering to each recommendation (0.75–1 point) to thosewho did not (0 points) were presented.
All statistical analyses were performed with SAS 9.2 software(SAS Institute Inc) or Stata 10.0 software (StataCorp LP).
RESULTS
After a median follow-up time of 12.8 y (4,808,572 person-years of follow-up), 23,828 deaths were identified in the EPICcohort (11,430 in men and 12,398 in women). Of 19,849 deathsthat occurred before the follow-up date for cause-specific death(83.3% of deaths), 47.3% of deaths were from cancer, 26.3% ofdeaths were from circulatory disease, and 5.1% of deaths werefrom respiratory disease (see Table S1 under “Supplementaldata” in the online issue).
The distribution and characteristics of the study populationaccording to the 5 predefined categories of the WCRF/AICRscore and sex are shown in Table 2. Participants in the highestcategory of the score (5–6 points in men; 6–7 points in women)were more likely to be younger (especially in men) and havea higher educational level and less likely to be a current smokerand to report hyperlipidemia, hypertension, or diabetes atbaseline. Women within the highest categories of the score weremore likely to be premenopausal.
Participants in the highest category of the score had a 46%lower hazard of death (95% CI: 0.48, 0.61) than that of partic-ipants in the lowest category (0–2 points in men; 0–3 points inwomen) in the crude Cox model (stratified for sex, age at re-cruitment, and center; Table 3). The association was attenuatedafter adjustment for educational level, smoking status, and in-tensity of smoking and menopause status (model 1) but re-mained significant. The association was a bit stronger in womenthan men for score categories [HR (95% CI) in the highestcompared with lowest category of the score: 0.62 (0.52, 0.73)and 0.74 (0.62, 0.88), respectively)] but similar on a continuousscale. Each unit increase of WCRF/AICR score was associatedwith a 13% lower hazard of death (95% CI: 0.86, 0.88). Themortality RAP associated with a 1-unit increase of the WCRF/AICR score was 1.2 y. This result meant that the age-relatedincrease in the death rate could be postponed by 1.2 y for eachadditional WCRF/AICR recommendation that participants fol-low (for example, participants who adhered to 4 recommenda-tions reached the hazard of death of participants who adhered to3 recommendations 1.2 y later).
1112 VERGNAUD ET AL
at OS
LO H
EA
LTH
CO
NS
OR
TIU
M on M
ay 30, 2013ajcn.nutrition.org
Dow
nloaded from

TABLE2
Characteristicsofthepopulationaccordingto
WCRF/AICRscore
categories
andsex1
WCRF/AICRscore
categories
inmen
WCRF/AICRscore
categories
inwomen
12
34
51
23
45
WCRF/AICRscore
range
(minim
um–m
axim
um)
0–2
2.25–2.75
3–3.75
4–4.75
5–6
0–3
3.25–3.75
4–4.75
5–5.75
6–7
Deaths/totalsubjects(n)
2365/19,241
3328/31,111
3942/45,813
1560/21,243
235/4035
3103/51,337
3385/67,072
4166/92,707
1543/40,471
201/5834
Follow
-up(y)2
12.2
12.3
12.4
12.5
12.7
13.2
13.1
13
12.9
12.9
Age(y)
53.6
68.1
53.4
68.9
52.7
69.8
51.2
611.0
47.9
612.4
51.7
69.2
51.7
69.6
51.7
610.0
516
10.4
50.9
610.2
Totalenergy(kcal)3
25926
641
25546
656
25276
660
24626
644
23106
569
18966
553
18356
540
18056
530
17976
511
18016
499
Educational
level(%
)
None
4.8
4.7
4.8
4.3
3.2
4.5
6.2
6.6
4.7
3.3
Primaryschool
completed
32.6
32.8
31.2
26.7
15.2
28.0
27.4
25.7
22.0
17.1
Technical/professional
school
25.7
25.1
24.7
23.2
20.9
20.7
19.8
20.2
21.7
22.5
Secondaryschool
11.1
11.0
11.8
13.2
15.8
23.5
23.3
22.8
23.0
22.7
University
degreeandhigher
25.8
26.4
27.6
32.7
44.9
23.3
23.3
24.7
28.7
34.4
Smokingstatus(%
)
Never
22.3
27.1
33.1
40.0
51.6
53.6
59.5
62.4
63.9
63.8
Form
er37.6
38.0
37.3
37.1
33.0
22.2
21.3
21.8
23.2
26.0
Smoker
40.2
34.8
29.7
22.9
15.5
24.3
19.3
15.8
12.9
10.2
Hyperlipidem
ia(%
)430.2
27.6
24.1
20.2
15.0
16.1
15.8
15.4
13.7
11.5
Hypertension(%
)531.8
26.9
22.5
16.7
11.0
25.2
21.8
19.8
16.0
12.7
Diabetes
(%)6
3.8
3.8
3.5
3.6
2.6
2.7
2.6
2.3
1.6
1.5
Premenopausalwomen
(%)
——
——
—31.9
32.8
33.9
36.4
39.7
1Means6
SDsandpercentages
arepresentedforcontinuousandcategoricalvariables,respectively
(exceptwhereotherwisespecified).AICR,American
Institute
ofCancerResearch;WCRF,
World
CancerResearchFund.
2Number
ofyears
betweenrecruitmentandcensoring.Allvalues
aremedians.
3Withtheuse
ofcalibrateddietary
data.
4Self-reportedhyperlipidem
iaand/ortreatm
entofhyperlipidem
ia.
5Self-reportedhypertensionand/ortreatm
entofhypertension.
6Self-reporteddiabetes
and/ortreatm
entofdiabetes.
ADHERENCE TO WCRF/AICR GUIDELINES AND MORTALITY 1113
at OS
LO H
EA
LTH
CO
NS
OR
TIU
M on M
ay 30, 2013ajcn.nutrition.org
Dow
nloaded from

TABLE3
HRs(95%
CIs)ofdeath
accordingto
WCRF/AICRscore
andsex1
Total
Men
Women
No.ofcases/total
subjects
Model
0Model1
No.ofcases/total
subjects
Model
0Model1
No.ofcases/total
subjects
Model0
Model1
Inthetotalsample
WCRF/AICRscore
categories
15468/70,578
1(reference)
1(reference)
2365/19,241
1(reference)
1(reference)
3103/51,337
1(reference)
1(reference)
26713/98,183
0.82(0.79,0.85)
0.87(0.83,0.90)
3328/31,111
0.82(0.78,0.87)
0.88(0.83,0.93)
3385/67,072
0.81(0.77,0.85)
0.86(0.81,0.90)
38108/138,520
0.69(0.67,0.71)
0.77(0.74,0.79)
3942/45,813
0.67(0.64,0.71)
0.77(0.73,0.81)
4166/92,707
0.71(0.67,0.74)
0.77(0.73,0.81)
43103/61,714
0.60(0.58,0.63)
0.70(0.67,0.74)
1560/21,243
0.59(0.56,0.63)
0.73(0.68,0.78)
1543/40,471
0.61(0.57,0.65)
0.69(0.65,0.74)
5436/9869
0.55(0.50,0.61)
0.66(0.60,0.73)
235/4035
0.56(0.49,0.65)
0.71(0.62,0.82)
201/5834
0.54(0.46,0.62)
0.62(0.54,0.72)
P-trend
—,0.0001
,0.0001
—,0.0001
,0.0001
—,0.0001
,0.0001
HRper
1-unitincrease
of
WCRF/AICRscore
23,828/378,864
0.82(0.81,0.83)
0.87(0.86,0.88)
11,430/12,1443
0.81(0.80,0.83)
0.88(0.86,0.90)
12,398/25,7421
0.83(0.82,0.85)
0.87(0.85,0.89)
After
exclusionofsubjects
withhyperlipidem
ia,
hypertension,
ordiabetes2
HRper
1-unitincrease
of
WCRF/AICRscore
14,711/268,919
0.81(0.81,0.84)
0.88(0.87,0.90)
68,80/81,074
0.82(0.79,0.84)
0.89(0.86,0.91)
7831/18,7845
0.84(0.82,0.86)
0.88(0.86,0.90)
After
exclusionofparticipants
whodiedin
thefirst2y
offollow
-up
HRper
1-unitincrease
of
WCRF/AICRscore
22,431/377,467
0.77(0.76,0.78)
0.87(0.86,0.88)
10,621/120,634
0.81(0.79,0.83)
0.88(0.86,0.90)
11,810/256,833
0.83(0.82,0.85)
0.87(0.85,0.89)
1WCRF/AICRscore
ranges
were0–6in
men
and0–7in
women.Calibrateddatawereused.M
odel0was
aCox
modelstratified
bysex,ageatrecruitment(5-y
category),andcenter.Model1was
adjusted
asformodel
0andforeducational
level(none,
primaryschool
completed,technicalorprofessional
school,secondaryschool,university
degree,
andunknownormissing),sm
okingstatusandintensity
of
smoking(never;form
er,quitsm
oking.20yago;form
er,quitsm
oking11–20yago;form
er,quitsm
oking#10yago;sm
oker,1–15cigarettes/d;sm
oker,16–25
cigarettes/d;sm
oker,.25cigarettes/d;and
smoker,pipeorcigar;andunknow
normissing),andmenopause
status(premenopausal,perim
enopausal,andpostmenopausal).AICR,American
Institute
ofCancerResearch;WCRF,
WorldCancerResearch
Fund. 2Atbaseline,participantswereclassified
withhyperlipidem
iaifthey
reported
havinghyperlipidem
iaortakingalipid-low
eringdrug,withhypertensionifthey
reported
havinghypertensionortakingan
antihypertensive
drug,andwithdiabetesifthey
reported
havingdiabetes
ortakingan
antidiabetic
drug.
1114 VERGNAUD ET AL
at OS
LO H
EA
LTH
CO
NS
OR
TIU
M on M
ay 30, 2013ajcn.nutrition.org
Dow
nloaded from
The association between the WCRF/AICR score and hazard ofdeath was not substantially modified after additional adjustmentfor total energy intake (model 2; data not presented) with theexclusion of participants with BMI ,18 (data not presented),participants with hyperlipidemia, hypertension, or diabetes atbaseline, or participants who died in the first 2 y of follow-up.Despite the heterogeneity in country (P-heterogeneity, 0.0001;see Figure S1 under “Supplemental data” in the online issue),significant associations between a higher score and lower risk ofdeath were observed in all countries, which indicated that theheterogeneity was due to differences in the strength of the as-sociation rather than the direction.
Each individual WCRF/AICR component was inversely as-sociated with risk of death except the consumption of animalfoods for which risk of death was significantly decreased inparticipants in the middle category only (Table 4). Main dif-ferences according to sex concerned the physical activity com-ponent, which was more protective in women, and the alcoholicdrinks component ,which was more protective in men. The as-sociation between the WCRF/AICR score and risk of death re-mained relatively unchanged when individual components of theWCRF/AICR score were excluded alternatively from the overall
score. Compared with the HR per 1 SD for the global score(0.86; 95% CI: 0.85, 0.88), HRs moved slightly more toward thenull when the BMI, physical activity, or breastfeeding compo-nents were removed from the overall score [0.89 (95% CI: 0.87,0.90), 0.88 (95% CI: 0.87, 0.90), and 0.89 (95% CI: 0.87, 0.90),respectively]. None of the remaining components strengthenedthe inverse association when removed.
The association between risk of death and the WCRF/AICRscore was not significantly modified by smoking status (see TableS2 under “Supplemental data” in the online issue). However, theinverse association appeared to be slightly stronger in normalweight and obese than overweight participants [HR (95% CI) per1-unit increase of the WCRF/AICR score: 0.86 (0.85, 0.88) and0.86 (0.83, 0.89) compared with 0.91 (0.89, 0.93), respectively;P-interaction = 0.0002)], in participants aged 50–59 comparedwith,50 and.60 y [0.85 (0.83, 0.87) compared with 0.88 (0.85, 0.91)and 0.89 (0.87, 0.90), respectively; P-interaction = 0.02], and inparticipants who completed primary school [0.86 (0.84,0.88)] ortechnical/professional school [0.85 (0.83, 0.88)] compared withparticipants without education [0.89 (0.85, 0.94)], with a sec-ondary school degree ([0.88 (0.86,0.91)], and with a universitydegree or higher [0.90 (0.87, 0.92)] (P-interaction = 0.03).
TABLE 4
HRs (95% CIs) of death according to individual WCRF/AICR components and sex1
WCRF/AICR components
Total Men Women
HR (95% CI) P-trend HR (95% CI) P-trend HR (95% CI) P-trend
Body fatness
0 1 (reference) 1 (reference) 1 (reference)
0.5 0.77 (0.74, 0.79) 0.74 (0.70, 0.77) 0.81 (0.77, 0.85)
1 0.78 (0.75, 0.81) ,0.0001 0.79 (0.75, 0.83) ,0.0001 0.78 (0.74, 0.82) ,0.0001
Physical activity
0 1 (reference) 1 (reference) 1 (reference)
0.5 0.85 (0.81, 0.88) 0.88 (0.83, 0.94) 0.82 (0.78, 0.87)
1 0.85 (0.82, 0.87) ,0.0001 0.87 (0.84, 0.91) ,0.0001 0.82 (0.78, 0.85) ,0.0001
Foods and drinks that
promote weight gain
0 1 (reference) 1 (reference) 1 (reference)
0.25–0.5 0.89 (0.84, 0.95) 0.88 (0.82, 0.95) 0.91 (0.81, 1.02)
0.75–1 0.91 (0.85, 0.97) 0.14 0.95 (0.87, 1.03) 0.71 0.89 (0.79, 1.01) 0.07
Plant foods
0 1 (reference) 1 (reference) 1 (reference)
0.25–0.5 0.84 (0.81, 0.88) 0.82 (0.76, 0.88) 0.86 (0.82, 0.91)
0.75–1 0.79 (0.75, 0.83) ,0.0001 0.76 (0.70, 0.82) ,0.0001 0.81 (0.77, 0.87) ,0.0001
Animal foods
0 1 (reference) 1 (reference) 1 (reference)
0.5 0.95 (0.92, 0.98) 0.93 (0.88, 0.98) 0.96 (0.93, 1.00)
1 1.01 (0.96, 1.06) 0.60 0.98 (0.90, 1.06) 0.33 1.03 (0.97, 1.10) 0.79
Alcoholic drinks
0 1 (reference) 1 (reference) 1 (reference)
0.5 0.83 (0.79, 0.87) 0.80 (0.75, 0.86) 0.87 (0.82, 0.93)
1 0.92 (0.89, 0.95) 0.003 0.89 (0.85, 0.93) ,0.0001 0.97 (0.92, 1.03) 0.51
Breastfeeding
0 1 (reference) 1 (reference)
0.5 0.87 (0.83, 0.91) NA 0.87 (0.83, 0.91)
1 0.83 (0.80, 0.87) ,0.0001 0.83 (0.80, 0.87) ,0.0001
1With the use of calibrated data. Cox model was stratified by sex, age at recruitment (5-y category), and center and adjusted for educational level (none,
primary school, technical school, secondary school, and university degree, and unknown or missing), smoking status and intensity of smoking (never; former,
quit smoking.20 y ago; former, quit smoking 11–20 y ago; former, quit smoking #10 y ago; smoker, 1–15 cigarettes/d; smoker, 16–25 cigarettes/d; smoker,
.25 cigarettes/d; and smoker, pipe or cigar; and unknown or missing), and menopause status (premenopausal, perimenopausal, and postmenopausal), and all
WCRF/AICR components were mutually adjusted. AICR, American Institute of Cancer Research; WCRF, World Cancer Research Fund.
ADHERENCE TO WCRF/AICR GUIDELINES AND MORTALITY 1115
at OS
LO H
EA
LTH
CO
NS
OR
TIU
M on M
ay 30, 2013ajcn.nutrition.org
Dow
nloaded from
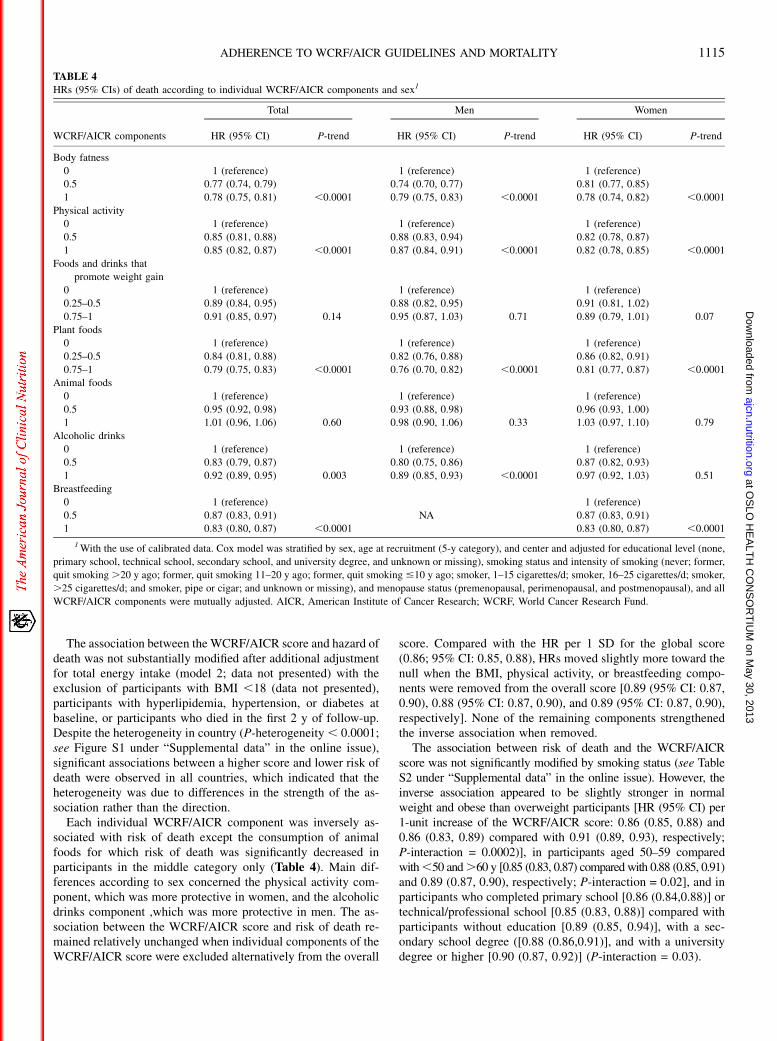
Hazards of cause-specific death according to the WCRF/AICRscore are presented in Table 5. Hazards of death from all causeswere lower in participants with a higher WCRF/AICR score (allP , 0.0001). Dose-response associations were observed for allcauses of death apart from death from cancer for which hazardsof death decreased from the first to third categories of the scoreand stagnated afterward. The strongest inverse association wasobserved for death from respiratory disease per 1-unit increaseof the WCRF/AICR score [HR: 0.79; 95% CI: 0.74, 0.85) fol-lowed by death from circulatory disease (HR: 0.83; 95% CI:0.81, 0.86) and finally death from cancer (HR: 0.91; 95% CI:0.89, 0.93). Results were similar according to sex apart for thehazard of death from respiratory disease, which decreased morestrongly with the adherence to WCRF/AICR recommendationsin women than men. Results were similar when only neversmokers were analyzed, although the association in men was notsignificant anymore (see Table S3 under “Supplemental data” inthe online issue).
Hazards of cause-specific deaths for each WCRF/AICRcomponent are presented in Table 6. The body fatness compo-nent was inversely associated with the hazard of death from allcauses and the strongest predictor of death from circulatorydisease (HR for participants with 1 point compared with par-ticipants with ,0.5 points: 0.60; 95% CI: 0.55, 0.65). Thephysical activity component was inversely associated with thehazard of death from all causes as well, but the association wasstronger for death from respiratory disease (HR: 0.53; 95% CI:0.44, 0.64). The component of foods and drinks that promoteweight gain was only significantly associated with the hazard ofdeath from respiratory disease (HR: 0.65; 95% CI: 0.48, 0.89).The plant foods component was inversely associated with thehazard of death from all causes and the strongest predictor ofdeath from cancer (HR: 0.84; 95% CI: 0.87, 0.91) and deathfrom respiratory disease HR: 0.54; 95% CI: 0.44, 0.68; along
with the physical activity component). The animal foods com-ponent was not significantly associated with any cause of death.The alcoholic drinks component was only inversely associatedwith the hazard of death from cancer (HR: 0.88; 95% CI: 0.84,0.93). However, this association was mainly observed in men. Inaddition, the alcoholic drinks component was positively associ-ated with death from circulatory disease in women. The breast-feeding component was inversely associated with the hazard ofdeath from both cancer (HR: 0.90; 95% CI: 0.84, 0.97) and cir-culatory disease (HR: 0.83; 95% CI: 0.75, 0.92) but not withdeath from respiratory disease (HR: 0.85; 95% CI: 0.68, 1.06).
When we used life-time alcohol consumption instead of al-cohol consumption at baseline to determine adherence to thealcohol recommendation, the inverse association between thealcohol component and risk of death was strengthened for allcauses of death (see Table S4 under “Supplemental data” in theonline issue). In particular, the inverse association between thealcohol component and risk of death from circulatory and re-spiratory diseases became significant. Consequently, the inverseassociation between the global WCRF/AICR score and risk ofdeath was strengthened as well.
DISCUSSION
Main findings
In this large European cohort study, adherence to WCRF/AICR recommendations on diet, physical activity, and bodyfatness was inversely related to risk of death. After 12 y of follow-up, participants in the fifth category of theWCRF/AICR score (5–6 points in men; 6–7 points in women) had a 34% lower hazardof death compared with that of participants in the first categoryof the score (0–2 points in men; 0–3 points in women). A sig-nificant lower hazard was already observed from the second
TABLE 5
HRs (95% CIs) of cause-specific death according to the WCRF/AICR score and sex1
Causes of
death
No. of
cases
WCRF/AICR score
categories
P-trend
HR per 1-unit increase
of WCRF/AICR score1 2 3 4 5
Total
Cancer 9388 1 (reference) 0.92 (0.87, 0.98) 0.82 (0.77, 0.86) 0.80 (0.74, 0.86) 0.80 (0.69, 0.93) ,0.0001 0.91 (0.89, 0.93)
Circulatory disease 5229 1 (reference) 0.84 (0.77, 0.90) 0.73 (0.68, 0.79) 0.60 (0.54, 0.66) 0.56 (0.46, 0.69) ,0.0001 0.83 (0.81, 0.86)
Respiratory disease 1004 1 (reference) 0.82 (0.69, 0.97) 0.63 (0.53, 0.75) 0.56 (0.45, 0.70) 0.50 (0.31, 0.80) ,0.0001 0.79 (0.74, 0.85)
Other causes 4228 1 (reference) 0.84 (0.77, 0.91) 0.72 (0.66, 0.78) 0.62 (0.56, 0.70) 0.55 (0.43, 0.70) ,0.0001 0.83 (0.80, 0.86)
Men
Cancer 4301 1 (reference) 0.93 (0.85, 1.01) 0.81 (0.75, 0.88) 0.81 (0.72, 0.90) 0.86 (0.69, 1.07) ,0.0001 0.92 (0.89, 0.95)
Circulatory disease 2948 1 (reference) 0.84 (0.75, 0.93) 0.73 (0.66, 0.81) 0.62 (0.54, 0.71) 0.64 (0.50, 0.82) ,0.0001 0.84 (0.80, 0.88)
Respiratory disease 493 1 (reference) 0.91 (0.70, 1.19) 0.67 (0.51, 0.87) 0.66 (0.48, 0.90) 0.85 (0.48, 1.50) 0.006 0.84 (0.76, 0.94)
Other causes 1984 1 (reference) 0.85 (0.75, 0.96) 0.68 (0.60, 0.77) 0.65 (0.55, 0.76) 0.56 (0.40, 0.79) ,0.0001 0.82 (0.78, 0.87)
Women
Cancer 5087 1 (reference) 0.91 (0.84, 0.99) 0.82 (0.76, 0.89) 0.80 (0.72, 0.87) 0.76 (0.62, 0.93) ,0.0001 0.91 (0.88, 0.94)
Circulatory disease 2281 1 (reference) 0.84 (0.75, 0.94) 0.73 (0.65, 0.82) 0.58 (0.50, 0.69) 0.44 (0.32, 0.65) ,0.0001 0.83 (0.79, 0.86)
Respiratory disease 511 1 (reference) 0.75 (0.59, 0.95) 0.63 (0.50, 0.79) 0.50 (0.36, 0.68) 0.17 (0.06, 0.52) ,0.0001 0.76 (0.69, 0.83)
Other causes 2244 1 (reference) 0.82 (0.73, 0.92) 0.75 (0.67, 0.84) 0.60 (0.52, 0.70) 0.54 (0.38, 0.76) ,0.0001 0.83 (0.80, 0.87)
1WCRF/AICR scores ranges were 0–6 in men and 0–7 in women. Calibrated data were used. Cox model was stratified by sex, age at recruitment (5-y
category), and center and adjusted for educational level (none, primary school, technical school, secondary school, and university degree, and unknown or
missing), smoking status and intensity of smoking (never; former, quit smoking .20 y ago; former, quit smoking 11–20 y ago; former, quit smoking #10 y
ago; smoker, 1–15 cigarettes/d; smoker, 16–25 cigarettes/d; smoker, .25 cigarettes/d; and smoker, pipe or cigar; and unknown or missing), and menopause
status (premenopausal, perimenopausal, and postmenopausal). AICR, American Institute of Cancer Research; WCRF, World Cancer Research Fund.
1116 VERGNAUD ET AL
at OS
LO H
EA
LTH
CO
NS
OR
TIU
M on M
ay 30, 2013ajcn.nutrition.org
Dow
nloaded from

TABLE6
HRs(95%
CIs)ofcause-specificdeathsper
1-unitincrease
ofeach
WCRF/AICRscore
componentaccordingto
sex1
Death
from
cancer
Death
from
circulatory
disease
Death
from
respiratory
disease
Death
from
other
causes
Total
Bodyfatness
0.93(0.88,0.99)
0.02
0.60(0.55,0.65)
,0.0001
0.77(0.65,0.91)
0.003
0.72(0.66,0.79)
,0.0001
Physicalactivity
0.90(0.86,0.94)
,0.0001
0.79(0.74,0.84)
,0.0001
0.59(0.51,0.69)
,0.0001
0.76(0.71,0.82)
,0.0001
Foodsanddrinks
that
promote
weightgain
1.03(0.92,1.15)
0.66
0.91(0.79,1.04)
0.17
0.65(0.48,0.89)
0.006
0.76(0.65,0.88)
0.0002
Plantfoods
0.84(0.78,0.91)
,0.0001
0.74(0.67,0.82)
,0.0001
0.54(0.44,0.68)
,0.0001
0.79(0.70,0.89)
,0.0001
Anim
alfoods
0.93(0.86,1.01)
0.09
0.97(0.88,1.08)
0.62
1.15(0.92,1.44)
0.21
1.19(1.06,1.34)
0.003
Alcoholicdrinks
0.88(0.84,0.93)
,0.0001
1.07(0.99,1.16)
0.09
1.09(0.91,1.31)
0.34
0.82(0.75,0.88)
,0.0001
Breastfeeding2
0.90(0.84,0.97)
0.004
0.83(0.75,0.92)
0.0004
0.85(0.68,1.06)
0.14
0.72(0.65,0.80)
,0.0001
Men Bodyfatness
0.98(0.90,1.08)
0.69
0.57(0.51,0.63)
,0.0001
0.93(0.72,1.19)
0.55
0.78(0.69,0.89)
0.0002
Physicalactivity
0.93(0.87,0.99)
0.03
0.84(0.77,0.91)
,0.0001
0.66(0.54,0.82)
0.0001
0.79(0.72,0.88)
,0.0001
Foodsanddrinks
that
promote
weightgain
1.09(0.94,1.26)
0.24
0.92(0.78,1.09)
0.32
0.68(0.46,1.01)
0.06
0.79(0.66,0.95)
0.01
Plantfoods
0.81(0.71,0.93)
0.002
0.70(0.60,0.81)
,0.0001
0.57(0.40,0.81)
0.002
0.67(0.56,0.82)
,0.0001
Anim
alfoods
0.87(0.75,1.00)
0.04
0.97(0.84,1.13)
0.73
1.18(0.84,1.64)
0.34
1.10(0.91,1.34)
0.31
Alcoholicdrinks
0.86(0.80,0.92)
,0.0001
1.04(0.95,1.14)
0.41
1.03(0.81,1.30)
0.84
0.76(0.69,0.84)
,0.0001
Women
Bodyfatness
0.90(0.83,0.97)
0.008
0.64(0.57,0.72)
,0.0001
0.67(0.53,0.84)
0.0006
0.68(0.61,0.77)
,0.0001
Physicalactivity
0.86(0.81,0.92)
,0.0001
0.72(0.65,0.80)
,0.0001
0.52(0.41,0.65)
,0.0001
0.72(0.65,0.80)
,0.0001
Foodsanddrinks
that
promote
weightgain
0.93(0.77,1.12)
0.45
0.92(0.69,1.22)
0.54
0.68(0.41,1.12)
0.13
0.89(0.65,1.21)
0.45
Plantfoods
0.86(0.77,0.95)
0.003
0.78(0.68,0.90)
0.0006
0.54(0.41,0.73)
,0.0001
0.87(0.75,1.01)
0.07
Anim
alfoods
0.97(0.88,1.08)
0.59
0.97(0.84,1.12)
0.69
1.17(0.86,1.58)
0.32
1.25(1.08,1.45)
0.004
Alcoholicdrinks
0.93(0.86,1.01)
0.10
1.18(1.01,1.37)
0.04
1.19(0.89,1.58)
0.24
0.92(0.82,1.04)
0.20
Breastfeeding
0.90(0.84,0.96)
0.003
0.83(0.75,0.92)
0.0006
0.86(0.69,1.07)
0.18
0.72(0.65,0.80)
,0.0001
1WCRF/AICRscore
ranges
were0–6in
men
and0–7in
women.Calibrateddatawereused.C
oxmodelwas
stratified
bysex,ageatrecruitment(5-y
category),andcenter
andadjusted
foreducationallevel
(none,primaryschool,technicalschool,secondaryschool,and
university
degree,andunknownormissing),sm
okingstatusandintensity
ofsm
oking(never;form
er,quitsm
oking>20yago;form
er,quitsm
oking
11–20
yago;form
er,quitsm
oking#10yago;sm
oker,1–15cigarettes/d;sm
oker,16–25
cigarettes/d;sm
oker,>25cigarettes/d;andsm
oker,pipeorcigar;andunknow
normissing),andmenopause
status
(premenopausal,perim
enopausal,andpostmenopausal),andallWCRF/AICRcomponentsweremutually
adjusted.HRscompared
participantswhoadhered
torecommendation(1
point)withthosewhodid
not
(,0.5
points).AICR,American
Institute
ofCancerResearch;WCRF,
WorldCancerResearchFund.
2In
women
only.
ADHERENCE TO WCRF/AICR GUIDELINES AND MORTALITY 1117
at OS
LO H
EA
LTH
CO
NS
OR
TIU
M on M
ay 30, 2013ajcn.nutrition.org
Dow
nloaded from

category of the score. All specific causes of death studied wereinversely associated with the score, but the strongest associationwas observed for risk of death from respiratory disease followedby death from circulatory disease and, finally, by death fromcancer. Recommendations on adiposity and plant foods were themost strongly associated with the hazard of death. However,associations of each WCRF/AICR score component differedaccording to the cause of death and sex.
Causes of death
In agreement with most previous studies that investigated theadherence to diet and lifestyle recommendations (2, 3, 6, 8), weshowed a weaker association between the WCRF/AICR scoreand death from cancer compared with death from circulatorydisease, which seemed to be explained, to a large extent, bya weaker association with the BMI component for death fromcancer compared with circulatory disease. Obesity has beenpreviously associated with increased risk of several cancers andhas been widely acknowledge as a major determinant of CVD andendocrine and metabolic disturbances (20). In a previous EPICstudy, RRs of death associated with a high BMI were alsostrongest for circulatory causes of death, followed by other causesand neoplasms (21). The alcohol (by using lifetime consump-tion), plant food, and breastfeeding components were inverselyassociated with hazards of death from both cancer (21%, 17%,and 9% reduced risk, respectively) and circulatory disease (10%,29%, and 8% reduced risk, respectively). A previous EPIC studyreported that 10% and 3% of the incidence of total cancer wasattributable to former and current alcohol consumption, re-spectively (22). The association with death from circulatorydisease is more controversial, but a recent meta-analysis reportedreduced risk of death frommultiple cardiovascular outcomes withlight-to-moderate alcohol consumption (23). Several studiespreviously showed reduced risk of death from cancer and CVDwith increased consumption of fiber (24), fruit, and vegetables(24, 25). To our knowledge, no previous study investigated theassociation between breastfeeding and mortality in the mother.However, a previous review suggested that a failure to breastfeedcould be associated with an increased incidence of pre-menopausal breast cancer, ovarian cancer, type 2 diabetes,myocardial infarction, and the metabolic syndrome (26). Theterminal differentiation of breast tissue because of lactogenesis(with potential long-term effects on malignant transformation),development of the Mucin 1 antigen during mastitis, and mo-bilization of adipose stores with lactation were suggested aspotential mechanisms (26).
In the current study, respiratory disease was the cause of deaththat was most strongly associated with adherence to WCRF/AICR recommendations (21% lower hazard of death per 1-unitincrease). Similar results were observed in never smokers, al-though the association in men was not significant anymore,plausibly because of the low number of death from respiratorydisease in men who never smoked (n = 71). The stronger as-sociation with risk of death from respiratory diseases seems tobe explained to a large extend by a stronger inverse associationfor the plant foods and physical activity components. To ourknowledge, no previous study investigated the association be-tween scores derived from diet and lifestyle recommendationsand death from respiratory disease. However, individual factors
have been previously analyzed. First, significant inverse asso-ciations between fiber intake and risk of death from respiratorydisease (24) and between daily total vegetable intake and risk ofchronic obstructive pulmonary disease (27) have previouslybeen reported. Fiber could positively affect the makeup of theintestinal microbiota, which is involved in the regulation ofimmune and inflammatory responses (28). Second, severalstudies showed an inverse association between physical activityand mortality (29–32). Some (29, 30) but not all (31, 32) studiesreported a stronger protective effect on death from respiratorydisease than from other causes of death. Only one (24) of thestudies performed analyses in nonsmokers only. However, withonly 90 deaths from respiratory diseases, Park et al (24) couldnot confirm the inverse association between fiber intake and riskfrom respiratory disease observed in the total sample (24).Similar to these previous studies, we did not have baseline in-formation on history of respiratory illnesses, which could haveexplained the stronger inverse association observed for deathfrom disease of the respiratory system. This result was espe-cially likely for the physical activity component because dis-eases from the respiratory system often cause reductions inphysical activity. Deaths from respiratory disease represented7% of the total death burden worldwide in 2004 (33). The po-tential protective effect of the adherence to WCRF/AICR rec-ommendations on death from respiratory diseases is of majorpublic health importance and deserves additional investigationsin studies with a history of respiratory illnesses at baselineavailable and a large sample size that would permit stratificationby smoking status.
Strengths and limitations of the study
One of the main advantages of the current study was its verylarge sample size, which provided enough power to investigatecause-specific deaths including death from respiratory diseaseand to explore various interaction factors, including smokingstatus. The WCRF/AICR score operationalizes each recom-mendation as described in the WCRF/AICR report, is easilyreplicable, is associated with a healthy lifestyle overall, and hasbeen previously associated with reduced risk of cancer asexpected (10). All components of the score were significantlyassociated with the hazard of death after mutual adjustment foreach other, except the animal foods component for whicha significant lower hazard of death was observed in the middlecategory only. The HR associated with the animal foods rec-ommendation was similar for death from cancer compared withthose previously reported for cancer morbidity (HR: 0.94 and0.93, respectively) (10). The nonsignificant result in our studywas most likely to the result of the lower number of cancer deathsthan incident cancers. The WCRF/AICR score is also the firstscore derived from public health recommendations that includesbreastfeeding as a protective factor for the mother, and weshowed that adherence to this recommendation was associatedwith reduced risk of death from cancer and circulatory disease.
Several limitations of the current study should be considered.First, we could not include all WCRF/AICR recommendations inour score, either because we had not enough data available (ie, forthe preservation, processing, and preparation recommendationand the dietary supplements recommendation) or because rec-ommendations were not applicable to the objectives of this study
1118 VERGNAUD ET AL
at OS
LO H
EA
LTH
CO
NS
OR
TIU
M on M
ay 30, 2013ajcn.nutrition.org
Dow
nloaded from

(recommendation for cancer survivors). For example, the rec-ommendation of limiting the consumption of salt could not beincluded in the score, and salt intake has been associated withincreased blood pressure and CVD risk (34) as well as stomachcancer risk (35). Therefore, the reduction in risk of death as-sociated with adherence to WCRF/AICR recommendations waslikely to be underestimated. In addition, each component wasgiven an equal weight because the WCRF/AICR report did notrank recommendations in term of priority. Therefore, the effect offactors strongly related to the hazard of death could have beendiluted by the inclusion in the score of factors less stronglyassociated with the hazard of death, which could have led to anunderestimation of the joint effect of WRCF/AICR recommen-dations. However, we also investigated associations between eachcomponent of the score and each cause of death to providea more-comprehensive picture of associations between the scoreand risk of death. We used validated questionnaires (15) to assessthe exposure, and dietary data were calibrated according tocountry. However, lifestyle was assessed at baseline only andmayhave changed overtime. Therefore, residual measurement errorand misclassification may have biased estimates toward the null.Indeed, when lifetime alcohol consumption was used instead ofalcohol consumption at baseline, results for that component werestrengthened. Our analyses were adjusted for both smoking statusand the intensity of smoking. Nevertheless, residual confoundinglinked to smoking habits or other unmeasured confounders couldnot be ruled out. This may have occurred for death from re-spiratory disease in particular and resulted in the overestimationof the inverse association between the WCRF/AICR score andrisk of death from respiratory diseases. Finally, our analysis wasperformed in a large European population, and estimates may notbe directly applicable to other populations with different life-styles and risks of disease.
In conclusion, this large European study showed a strongassociation between adherence to lifestyle and dietary WCRF/AICR recommendations at baseline and reduced hazard of death.Adherence to WCRF/AICR recommendations was not only in-versely associated with death from cancer and circulatory diseasebut also with death from respiratory disease. At least 4 of 7WCRF/AICR components were strongly associated with eachcause of death, and all recommendations were inversely asso-ciated with at least one cause of death. These results are ofprimary importance to increase the awareness and the complianceof the population to those major recommendations as well asunderstand how to reduce the mortality burden worldwide.Additional research in other large populations is needed toconfirm our findings, especially regarding death from respiratorydisease and breastfeeding in the mother.
We thank all EPIC participants and staff for their contribution to the study.
The authors’ responsibilities were as follows—TN: was the principal in-
vestigator of the project and had primary responsibility for final content; ER:
is the overall coordinator of the EPIC study, which was conceptualized,
designed, and implemented in collaboration with the main investigators in
collaborating countries; IR, HBB-d-M, NJW, K-TK, FC-C, RT, ATjonneland,
HB, A Trichopoulou, DT, PV, SP, M-JS, GH, KO, EL, and PHP: contrib-
uted to the study design, subject recruitment, and data collection and
acquisition and are responsible for the ongoing follow-up and manage-
ment of the EPIC cohort; TN, PHP, CHvG, and ER: conceived the current
study; A-CV: was responsible for the study design, analysis of data, inter-
pretation of results, and drafting of the manuscript; TN, DR, PHP, CHvG,
DSMC, PF, and ER: helped with the interpretation of results, and drafting of
the manuscript; and all authors: contributed to data interpretation and critical
reading of the manuscript and saw and approved the final version of the
manuscript. None of the authors had a conflict of interest.
REFERENCES1. World Health Organization. Global health risks: mortality and burden
of disease attributable to selected major risks. Geneva: World HealthOrganization, 2009.
2. Akbaraly TN, Ferrie JE, Berr C, Brunner EJ, Head J, Marmot MG,Singh-Manoux A, Ritchie K, Shipley MJ, Kivimaki M. AlternativeHealthy Eating Index and mortality over 18 y of follow-up: resultsfrom the Whitehall II cohort. Am J Clin Nutr Am J Clin Nutr 2011;94:247–53.
3. Kaluza J, Hakansson N, Brzozowska A, Wolk A. Diet quality andmortality: a population-based prospective study of men. Eur J ClinNutr 2009;63:451–7.
4. Mai V, Kant AK, Flood A, Lacey JV Jr, Schairer C, Schatzkin A. Dietquality and subsequent cancer incidence and mortality in a prospectivecohort of women. Int J Epidemiol 2005;34:54–60.
5. Michels KB, Wolk A. A prospective study of variety of healthy foodsand mortality in women. Int J Epidemiol 2002;31:847–54.
6. Seymour JD, Calle EE, Flagg EW, Coates RJ, Ford ES, Thun MJ. DietQuality Index as a predictor of short-term mortality in the AmericanCancer Society Cancer Prevention Study II Nutrition Cohort. Am JEpidemiol 2003;157:980–8.
7. Cerhan JR, Potter JD, Gilmore JM, Janney CA, Kushi LH, Lazovich D,Anderson KE, Sellers TA, Folsom AR. Adherence to the AICR cancerprevention recommendations and subsequent morbidity and mortalityin the Iowa Women’s Health Study cohort. Cancer Epidemiol Bio-markers Prev 2004;13:1114–20.
8. McCullough ML, Patel AV, Kushi LH, Patel R, Willett WC, Doyle C,Thun MJ, Gapstur SM. Following cancer prevention guidelines reducesrisk of cancer, cardiovascular disease, and all-cause mortality. CancerEpidemiol Biomarkers Prev 2011;20:1089–97.
9. WCRF. Food, nutrition, physical activity, and the prevention of cancer:a global perspective. Washington, DC: World Cancer Research Fund /American Institute of Cancer Research, 2007.
10. Romaguera D, Vergnaud AC, Peeters PH, van Gils CH, Chan DS,Ferrari P, Romieu I, Jenab M, Slimani N, Clavel-Chapelon F, et al. Isconcordance with World Cancer Research Fund/American Institute forCancer Research guidelines for cancer prevention related to subsequentrisk of cancer? Results from the EPIC study. Am J Clin Nutr 2012;96:150–63.
11. Riboli E, Kaaks R. The EPIC Project: rationale and study design.European Prospective Investigation into Cancer and Nutrition. Int JEpidemiol 1997;26(suppl 1):S6–14.
12. Riboli E, Hunt KJ, Slimani N, Ferrari P, Norat T, Fahey M, CharrondiereUR, Hemon B, Casagrande C, Vignat J, et al. European ProspectiveInvestigation into Cancer and Nutrition (EPIC): study populations anddata collection. Public Health Nutr 2002;5:1113–24.
13. Ferrari P, Slimani N, Ciampi A, Trichopoulou A, Naska A, Lauria C,Veglia F, Bueno-De-Mesquita HB, Ocke MC, Brustad M, et al. Eval-uation of under- and overreporting of energy intake in the 24-hour dietrecalls in the European Prospective Investigation into Cancer andNutrition (EPIC). Public Health Nutr 2002;5:1329–45.
14. Haftenberger M, Lahmann PH, Panico S, Gonzalez CA, Seidell JC,Boeing H, Giurdanella MC, Krogh V, Bueno-De-Mesquita HB, PeetersPH, et al. Overweight, obesity and fat distribution in 50- to 64-year-oldparticipants in the European Prospective Investigation into Cancer andNutrition (EPIC). Public Health Nutr 2002;5:1147–62.
15. Kaaks R, Riboli E. Validation and calibration of dietary intake mea-surements in the EPIC project: methodological considerations. Euro-pean Prospective Investigation into Cancer and Nutrition. Int JEpidemiol 1997;26(suppl 1):S15–25.
16. Slimani N, Deharveng G, Unwin I, Southgate DA, Vignat J, Skeie G,Salvini S, Parpinel M, Moller A, Ireland J, et al. The EPIC nutrientdatabase project (ENDB): a first attempt to standardize nutrient data-bases across the 10 European countries participating in the EPIC study.Eur J Clin Nutr 2007;61:1037–56.
17. Brenner H, Gefeller O, Greenland S. Risk and rate advancement pe-riods as measures of exposure impact on the occurrence of chronicdiseases. Epidemiology 1993;4:229–36.
ADHERENCE TO WCRF/AICR GUIDELINES AND MORTALITY 1119
at OS
LO H
EA
LTH
CO
NS
OR
TIU
M on M
ay 30, 2013ajcn.nutrition.org
Dow
nloaded from
18. Bergmann MM, Schutze M, Steffen A, Boeing H, Halkjaer J, TjonnelandA, Travier N, Agudo A, Slimani N, Rinaldi S, et al. The association oflifetime alcohol use with measures of abdominal and general adiposity ina large-scale European cohort. Eur J Clin Nutr 2011;65:1079–87.
19. Lunn M, McNeil D. Applying Cox regression to competing risks.Biometrics 1995;51:524–32.
20. Obesity: preventing and managing the global epidemic. Report of a WHOconsultation. World Health Organ Tech Rep Ser 2000;894::i–xii, 1–253.
21. Pischon T, Boeing H, Hoffmann K, Bergmann M, Schulze MB,Overvad K, van der Schouw YT, Spencer E, Moons KG, Tjonneland A,et al. General and abdominal adiposity and risk of death in Europe. NEngl J Med 2008;359:2105–20.
22. Schutze M, Boeing H, Pischon T, Rehm J, Kehoe T, Gmel G, Olsen A,Tjonneland AM, Dahm CC, Overvad K et al. Alcohol attributableburden of incidence of cancer in eight European countries based onresults from prospective cohort study. BMJ 2011;342:d1584.
23. Ronksley PE, Brien SE, Turner BJ, Mukamal KJ, Ghali WA. Associ-ation of alcohol consumption with selected cardiovascular diseaseoutcomes: a systematic review and meta-analysis. BMJ 2011;342:d671.
24. Park Y, Subar AF, Hollenbeck A, Schatzkin A. Dietary fiber intake andmortality in the NIH-AARP diet and health study. Arch Intern Med2011;171:1061–8.
25. Genkinger JM, Platz EA, Hoffman SC, Comstock GW, Helzlsouer KJ.Fruit, vegetable, and antioxidant intake and all-cause, cancer, andcardiovascular disease mortality in a community-dwelling populationin Washington County, Maryland. Am J Epidemiol 2004;160:1223–33.
26. Stuebe A. The risks of not breastfeeding for mothers and infants. RevObstet Gynecol 2009;2:222–31.
27. Hirayama F, Lee AH, Binns CW, Zhao Y, Hiramatsu T, Tanikawa Y,Nishimura K, Taniguchi H. Do vegetables and fruits reduce the risk of
chronic obstructive pulmonary disease? A case-control study in Japan.Prev Med 2009;49:184–9.
28. Maslowski KM, Mackay CR. Diet, gut microbiota and immune re-sponses. Nat Immunol 2011;12:5–9.
29. Rockhill B, Willett WC, Manson JE, Leitzmann MF, Stampfer MJ,Hunter DJ, Colditz GA. Physical activity and mortality: a prospectivestudy among women. Am J Public Health 2001;91:578–83.
30. Lam TH, Ho SY, Hedley AJ, Mak KH, Leung GM. Leisure timephysical activity and mortality in Hong Kong: case-control study of alladult deaths in 1998. Ann Epidemiol 2004;14:391–8.
31. Schnohr P, Lange P, Scharling H, Jensen JS. Long-term physical ac-tivity in leisure time and mortality from coronary heart disease, stroke,respiratory diseases, and cancer. The Copenhagen City Heart Study.Eur J Cardiovasc Prev Rehabil 2006;13:173–9.
32. Batty GD, Shipley MJ, Kivimaki M, Marmot M, Davey SG. Walkingpace, leisure time physical activity, and resting heart rate in relation todisease-specific mortality in London: 40 years follow-up of the originalWhitehall study. An update of our work with professor Jerry N. Morris(1910-2009). Ann Epidemiol 2010;20:661–9.
33. WHO. The global burden of disease: 2004 update. 2008. Availablefrom: http://www.who.int/healthinfo/global_burden_disease/GBD_report_2004update_full.pdf (cited 18 March 2013)
34. Appel LJ, Frohlich ED, Hall JE, Pearson TA, Sacco RL, Seals DR,Sacks FM, Smith SC Jr, Vafiadis DK, Van Horn LV. The importance ofpopulation-wide sodium reduction as a means to prevent cardiovasculardisease and stroke: a call to action from the American Heart Associ-ation. Circulation 2011;123:1138–43.
35. Wang XQ, Terry PD, Yan H. Review of salt consumption and stomachcancer risk: epidemiological and biological evidence. World J Gas-troenterol 2009;15:2204–13.
1120 VERGNAUD ET AL
at OS
LO H
EA
LTH
CO
NS
OR
TIU
M on M
ay 30, 2013ajcn.nutrition.org
Dow
nloaded from