Addressing Missing Data in Patient-Reported Outcome Measures (PROMS): Implications for the Use of...
14
ADDRESSING MISSING DATA IN PATIENT-REPORTED OUTCOME MEASURES (PROMS): IMPLICATIONS FOR THE USE OF PROMS FOR COMPARING PROVIDER PERFORMANCE MANUEL GOMES a, * , NILS GUTACKER b , CHRIS BOJKE b and ANDREW STREET b a Department of Health Services Research and Policy, London School of Hygiene and Tropical Medicine, London, UK b Centre for Health Economics, University of York, York, UK ABSTRACT Patient-reported outcome measures (PROMs) are now routinely collected in the English National Health Service and used to compare and reward hospital performance within a high-powered pay-for-performance scheme. However, PROMs are prone to missing data. For example, hospitals often fail to administer the pre-operative questionnaire at hospital admission, or patients may refuse to participate or fail to return their post-operative questionnaire. A key concern with missing PROMs is that the individuals with complete information tend to be an unrepresentative sample of patients within each provider and inferences based on the complete cases will be misleading. This study proposes a strategy for addressing missing data in the English PROM survey using multiple imputation techniques and investigates its impact on assessing provider performance. We find that inferences about relative provider performance are sensitive to the assumptions made about the reasons for the missing data. © 2015 The Authors. Health Economics Published by John Wiley & Sons Ltd. Received 27 June 2014; Revised 27 November 2014; Accepted 10 February 2015 KEY WORDS: missing data; multiple imputation; patient-reported outcome measures; provider performance; missing not at random 1. INTRODUCTION Non-response is a major concern in health surveys because individual non-respondents tend to be systemati- cally different from those providing complete data (Cohen and Duffy, 2002; Perneger et al., 2005; Schenker et al., 2006). The reasons for the non-response are rarely completely independent from both observed and un- observed values, meaning that data are not missing completely at random (MCAR). Consequently, inferences based solely on the respondents will be misleading. If the differences between respondents and non-respondents can be explained entirely by differences in the observed data, such as characteristics of the patients, data are said to be missing at random (MAR). If so, it is possible to condition analyses on observed factors, thereby correcting the bias caused by missing data. However, differences between respondents and non-respondents may depend on unobserved values, in which case data are missing not at random (MNAR). If missingness is associated with unmeasured factors, conditioning on the observed data will not eliminate entirely potential bias. One area where missing data have recently raised important concerns is in the assessment of hospital perfor- mance (Gale et al., 2011; Groene et al., 2014; Kirkham, 2008). Missing data may bias performance assess- ments through several routes. Firstly, within each provider, individuals with complete information tend to be systematically different from those with missing data. Secondly, provider assessments that are based on smaller *Correspondence to: Department of Health Services Research and Policy, London School of Hygiene and Tropical Medicine, 15-17 Tavistock Place, London WC1H 9SH, UK. E-mail: [email protected] © 2015 The Authors. Health Economics Published by John Wiley & Sons Ltd. HEALTH ECONOMICS Health Econ. 25: 515–528 (2016) Published online 5 March 2015 in Wiley Online Library (wileyonlinelibrary.com). DOI: 10.1002/hec.3173 This is an open access article under the terms of the Creative Commons Attribution License, which permits use, distribution and reproduc- tion in any medium, provided the original work is properly cited.
Transcript of Addressing Missing Data in Patient-Reported Outcome Measures (PROMS): Implications for the Use of...
ADDRESSING MISSING DATA IN PATIENT-REPORTED OUTCOMEMEASURES (PROMS): IMPLICATIONS FOR THE USE OF PROMS FOR
COMPARING PROVIDER PERFORMANCE
MANUEL GOMESa,*, NILS GUTACKERb, CHRIS BOJKEb and ANDREW STREETb
aDepartment of Health Services Research and Policy, London School of Hygiene and Tropical Medicine, London, UKbCentre for Health Economics, University of York, York, UK
ABSTRACTPatient-reported outcome measures (PROMs) are now routinely collected in the English National Health Service and used tocompare and reward hospital performance within a high-powered pay-for-performance scheme. However, PROMs areprone to missing data. For example, hospitals often fail to administer the pre-operative questionnaire at hospital admission,or patients may refuse to participate or fail to return their post-operative questionnaire. A key concern with missing PROMsis that the individuals with complete information tend to be an unrepresentative sample of patients within each provider andinferences based on the complete cases will be misleading. This study proposes a strategy for addressing missing data in theEnglish PROM survey using multiple imputation techniques and investigates its impact on assessing provider performance.We find that inferences about relative provider performance are sensitive to the assumptions made about the reasons for themissing data. © 2015 The Authors. Health Economics Published by John Wiley & Sons Ltd.
Received 27 June 2014; Revised 27 November 2014; Accepted 10 February 2015
KEY WORDS: missing data; multiple imputation; patient-reported outcome measures; provider performance; missing not atrandom
1. INTRODUCTION
Non-response is a major concern in health surveys because individual non-respondents tend to be systemati-cally different from those providing complete data (Cohen and Duffy, 2002; Perneger et al., 2005; Schenkeret al., 2006). The reasons for the non-response are rarely completely independent from both observed and un-observed values, meaning that data are not missing completely at random (MCAR). Consequently, inferencesbased solely on the respondents will be misleading. If the differences between respondents and non-respondentscan be explained entirely by differences in the observed data, such as characteristics of the patients, data are saidto be missing at random (MAR). If so, it is possible to condition analyses on observed factors, therebycorrecting the bias caused by missing data. However, differences between respondents and non-respondentsmay depend on unobserved values, in which case data are missing not at random (MNAR). If missingness isassociated with unmeasured factors, conditioning on the observed data will not eliminate entirely potential bias.
One area where missing data have recently raised important concerns is in the assessment of hospital perfor-mance (Gale et al., 2011; Groene et al., 2014; Kirkham, 2008). Missing data may bias performance assess-ments through several routes. Firstly, within each provider, individuals with complete information tend to besystematically different from those with missing data. Secondly, provider assessments that are based on smaller
*Correspondence to: Department of Health Services Research and Policy, London School of Hygiene and Tropical Medicine, 15-17Tavistock Place, London WC1H 9SH, UK. E-mail: [email protected]
© 2015 The Authors. Health Economics Published by John Wiley & Sons Ltd.
HEALTH ECONOMICSHealth Econ. 25: 515–528 (2016)Published online 5 March 2015 in Wiley Online Library (wileyonlinelibrary.com). DOI: 10.1002/hec.3173
This is an open access article under the terms of the Creative Commons Attribution License, which permits use, distribution and reproduc-tion in any medium, provided the original work is properly cited.
samples will lead to increased uncertainty in the estimation of provider effects. Indeed, providers with largeproportions of non-response will be less likely to be identified as statistically significantly better or worse thanthe benchmark. Thirdly, the reasons for the missing data may be related to the provider, not just the patient. Forexample, hospitals may differ in their data collection according to observed characteristics such as their volumeof activity and their staffing arrangements (Hutchings et al., 2014; McCall et al., 2004).
The English patient reported outcome measure (PROM) programme involves collecting survey responsesfrom patients in order to facilitate comparative performance assessment of different healthcare providers. SinceApril 2009, all providers of publicly funded inpatient care in the National Health Service (NHS) have been re-quired to collect both generic and condition-specific PROMs for four elective procedures: unilateral hip andknee replacements, varicose vein surgery, and groin hernia repairs. Patients having these procedures are invitedto report their health status before and three or six months after surgery using paper-based questionnaires. Bycomparing these before and after measures, changes in health can be identified and used to better understanddifferences in the systematic effect that health providers have on their patients’ health (Appleby and Devlin,2004). However, as with other health surveys, patients are not obliged to participate so responses will be miss-ing if some fail to do so. Data may also be missing because providers differ in the effort they exert in overseeingdata collection. Indeed, their efforts in this regard may be linked to their performance in terms of improvingtheir patients’ health status. Originally, the English PROM programme did not include a direct mechanismto police data collection, thereby opening up the possibility of gaming, either to lower the cost of data collectionor to avoid reputational damage.
Recent incentive schemes linking payments to achievements in terms of health improvements have explicitlycontemplated the issue of missing data. The English ‘best practice tariff’ (BPT) pay-for-performance scheme,based on PROM data and which started in April 2014, comprises two components (Monitor, 2013). First, pro-viders qualify for bonus payments if they do not perform statistically significantly below a national benchmarkwith respect to risk-adjusted improvements in patients’ health status. Second, in order to receive this bonus, pro-viders must ensure that they collect PROMs for over 50% of the patients eligible for the survey. This policy createsan incentive for providers to meet the minimum standard for data collection, but this does not necessary eliminatethe problem of missing data (Gutacker et al., 2015). An important concern is whether the assessment of hospital’srelative performance crucially hinges on the assumptions made about the reasons for the missing data.
This paper presents a strategy for addressing the missing data in PROMs and assesses its impact on the useof PROMs for comparing provider performance. Here, we consider multiple imputation (MI) methods that offerparticular advantages for addressing missing data in performance assessments compared with other commonlyused approaches such as maximum likelihood and inverse probability weighting. In the next section, we de-scribe the data and the different missing data patterns in the PROM survey. Section 3 presents the methodsfor estimating provider-specific outcomes and illustrates the implications of non-response for reporting pro-vider performance. Section 4 describes the approach for dealing with the missing data under MAR and sensi-tivity analyses to investigate potential departures from MAR. Section 5 reports the results on providerperformance according to different assumptions made about the missing data. The last section discusses thefindings and highlights some priorities for future research.
2. PROM DATA
Our sample includes all patients aged 12 or over, who underwent primary, unilateral hip replacement surgeryduring the period of April 2011 to March 2012. All providers of publicly funded inpatient care in the EnglishNHS are required to offer a pre-operative PROM questionnaire (Q1) to all patients deemed fit for surgery. Pa-tients complete this questionnaire, usually during the last outpatient appointment preceding the surgery or onthe day of admission. Patients are surveyed again approximately six months after surgery via another question-naire sent by mail (Q2). This post-operative questionnaire is administered at the national level by an organisa-tion contracted by the Department of Health.
M. GOMES ET AL.516
© 2015 The Authors. Health Economics Published by John Wiley & Sons Ltd. Health Econ. 25: 515–528 (2016)DOI: 10.1002/hec

Patient’s health status before and after surgery is measured using a condition-specific measure, the OxfordHip Score (OHS), and a generic quality-of-life measure, the EuroQol-5 dimensions (EQ-5D). Here, we focuson the former given that it is used for BPT arrangements (Monitor, 2013). OHS consists of 12 components(questions) on different aspects of hip problems such as pain and functioning (Dawson et al., 1996; Murrayet al., 2007). Each component has five possible responses, scored from 0 (most severe symptoms) to 4 (nosymptoms). The overall score is a simple unweighted sum of all individual components, ranging from 0 (mostsevere level and highest number of symptoms) to 48 (least symptoms).
Administrative data about all patients having hip replacement, irrespective of whether they completed aPROM survey, are available in the Hospital Episodes Statistics (HES). HES includes detailed patient-level hos-pital records about all NHS-funded inpatient care provided by public and private hospitals in England. HESdata are linked to the PROM survey responses through a matching variable provided by the Health and SocialCare Information Centre (HSCIC). This linkage allows us to (i) ascertain the full population of hip replacementpatients who were eligible to complete the PROM survey and (ii) obtain important clinical and socio-demographic information about the patients that would not otherwise be available in PROMs.
The PROM data collection and linkage process may result in different types of missing data. For example,Q1 may be missing because (i) the HSCIC was unable to match the Q1 PROM record to the HES episode, be-cause the requisite information for matching was missing (e.g. NHS number); (ii) the provider failed to admin-ister the Q1 questionnaire; or (iii) the patient refused to complete it. The post-operative Q2 questionnaire wassent only to those patients who answered the Q1 questionnaire, even if some answers were incomplete (itemnon-response). Even though patients provided a Q1 questionnaire, the Q2 questionnaire might also featuremissing data, either because the patient failed to return it or because some questions were left unanswered.
3. MISSING DATA IN THE ASSESSMENT OF PROVIDER PERFORMANCE
3.1. Estimation of provider-specific outcomes
For provider-specific outcomes to be comparable, adjustment for the different case mix of patients within eachprovider is required. This is typically undertaken using a regression framework, which we will denote as theanalysis model. In this paper, we built upon the NHS case-mix adjustment methodology to estimateprovider-specific outcomes (Nuttall and Parkin, 2013). Let y2,ij be the post-operative observed health outcomefor patient i treated in provider j. We adjusted y2,ij for key patient characteristics (Xij), such as age, gender, co-morbidities and socio-economic status (measured using an index of multiple deprivation), as well as the pre-operative health outcome (y1,ij). The analysis model is defined as
y2;ij ¼ αþ Xijβ þ y1;ijγþ uj þ εij; εij∼N 0; σεð Þ uj∼N 0; σuð Þ (1)
Both the provider-specific unobserved effects (uj) and the error term (εij) are assumed to be normally distrib-uted with zero mean and constant variance. Provider-specific effects can be estimated using a fixed effect orrandom effect model. Here, we considered the latter as it is typically more efficient.1 To estimate how providerj performs relative to the national average, we considered an indirect standardisation approach recommendedby the NHS case-mix adjustment (Nuttall and Parkin, 2013):
ey2;j ¼ ρjy2; ρj ¼1n∑n
i¼1
y2;ijy2;ij
!(2)
1Nuttall and Parkin (2013) reports coefficient estimates obtained using both fixed and random effect estimators. While the Hausman testrejects the null hypothesis that the random effect estimator is unbiased, the results on comparative provider performance are similar be-tween the two approaches.
HANDLING MISSING DATA IN PROMS 517
© 2015 The Authors. Health Economics Published by John Wiley & Sons Ltd. Health Econ. 25: 515–528 (2016)DOI: 10.1002/hec

The adjusted provider-specific outcome ey2;j� �is obtained by multiplying the national average outcome y2;
� �by a provider-specific factor ρj
� �that reflects the extent to which the provider’s observed outcome (y2,ij) com-
pares with its expected outcome (ŷ2,ij).
3.2. Funnel plots and missing data
It is common to compare provider performance using funnel plots (Department of Health, 2012b; Spiegelhalter,2005). Here, outcomes are plotted against volume (the number of patients treated) with 95 (2 standard devia-tions) and 99.8% (3 standard deviations) control limits used to indicate those providers that perform better orworse than expected (Figure 1). Accordingly, those providers located above the 95 and 99.8% control limitsare judged to have a positive alert and alarm status, respectively, while negative alerts and alarms are thoselocated below the 95 and 99.8% control limits, which are often under greater scrutiny. The pay-for-performanceBPT scheme requires that providers do not perform statistically significantly below the national average, i.e.being located outside the 99.8% control limit (negative alarm), to be eligible for bonus payments. The BPTguidance sets out the requirement to use funnel plots to report provider performance, although other approachessuch as caterpillar plots or z-scores are also available (Goldstein and Spiegelhalter, 1996).
With missing outcomes, the assessment of provider performance requires careful consideration. Ideally, wewould like to remove the impact of non-response from inferences about provider performance, in order to locatethe hospital near its ‘true’mean outcome and volume on the funnel plot. Consider a hospital with a low responserate such that its observed mean outcome and volume are at point A (in control) on a standard funnel plot (Figure1). Instead, if all patients were observed for this hospital, and the unobserved outcomes were similar to those ob-served (data were MCAR), then the hospital would be located at point B (negative alert). In this particularstylised example,2 because of the missing data, the provider would be judged to be in control rather than a neg-ative alert. From the hospital’s point of view, this is a more desirable status, but such an assessment is misleading.
The assumption that the patients with observed outcomes are similar to those who have missing outcomes(MCAR) is unlikely to hold. Missing data will be dependent on observed factors (MAR), other than those in-cluded in the analysis model, and might depend on unobserved values (MNAR). Therefore, the handling ofmissing data under MAR or MNAR may have four main effects for assessing provider performance via funnelplots.3 The first two effects refer to the location of the provider-specific effect and the other two to the place-ment of the population benchmark and control limits:
i Provider volume effect. This will always shift the provider location to the right, for example, frompoint A to B (Figure 1). Ceteris paribus, moving from the observed to the actual volume increasesthe probability of being located outside the control limits.
ii Provider mean outcome effect. Under MAR or MNAR, the provider-specific mean outcome may shiftdownwards or upwards depending on whether the outcomes for all provider’s patients (observed andimputed) are better or worse than the observed outcomes. In Figure 1, the hospital would move frompoint B to C (in control) if the patients for whom data are missing have a relatively better profile thanthose for which data are observed, or to point D (negative alarm) otherwise (Figure 1).
iii Population variability effect. The control limits will be narrower or wider depending on whether thevariability of outcomes in the full population is smaller or larger than that for the sample of patientswhose outcomes are observed.
iv Population mean outcome effect. The overall mean outcome (horizontal line) will move up or down,according to whether the actual outcomes for the entire population are, on average, better or worse thanthe observed outcomes.
2For instance, we have assumed that the missing values from this provider have no impact on the mean and variance of the overall outcomedistribution.
3All these effects also apply for assessments based on z-scores or caterpillar plots.
M. GOMES ET AL.518
© 2015 The Authors. Health Economics Published by John Wiley & Sons Ltd. Health Econ. 25: 515–528 (2016)DOI: 10.1002/hec

The impact of addressing the missing data on the location of the provider in the funnel plot will be mainlydetermined by (i) the provider’s volume effect and (ii) how different its missing outcomes are from those ob-served (the provider mean outcome effect), although (iii) and (iv) will also have some effect on that.
4. METHODS FOR ADDRESSING THE MISSING DATA
4.1. Complete case analysis
A common approach for dealing with missing data is to discard patients for whom any outcome or covariate ismissing. While complete case analysis (CCA) is simple to implement, this approach is only valid when data areMCAR. This implicitly assumes that individuals with complete data are representative of those with missingdata, conditional on the variables included in the analysis model. The current official approach to performanceassessment using PROMs is to apply CCA.
4.2. Multiple imputation
With MI, each missing value is replaced by a set of plausible values, which are drawn from the posterior dis-tribution of the missing outcomes given the observed data. Standard implementation of MI assumes that theprobability of observing the outcomes is independent of any unobserved values, given the observed data(MAR). After imputation, the analysis model is applied to each multiple imputed dataset to estimate the param-eters of interest. The multiple imputed estimates are typically combined using Rubin’s rules (Rubin, 1987),which properly reflect the variation between and within imputations.
A key feature of MI is that the model for the missing data is estimated separately from the analysis model forestimating the parameters of interest. This allows us to include in the imputation model auxiliary variables inaddition to those used in the analysis model that are associated with both the outcome and missingness. This isan important advantage of MI when compared with commonly used maximum likelihood approaches, whichmakes a potentially stronger MAR assumption that all observed factors that give rise to the missing data areincluded in the pre-specified analysis model. Including these auxiliary variables in the imputation model canreduce bias, improve precision and help make the MAR assumption more plausible. An additional advantageof MI is that its framework naturally extends to the assessment of alternative assumptions about the missingdata mechanism (Section 3.2).
For MI to provide valid inferences, the imputation model must accommodate the structure and the distribu-tion of the data. In PROMs, the imputation model needs to recognise that the probability of non-response maybe more similar within than across providers. Indeed, missingness may depend on observed patient-level char-acteristics that tend to be more similar within the provider, and on provider-level characteristics such as whether
10
20
30
40
Pro
vide
r-sp
ecifi
c ou
tcom
es
Observed volume
99.8% 95%
A
C
B
D
Provider volume effect Positive provider outcome effect
Negative provider outcome effect
Actual (observed + imputed) volume
Figure 1. Missing data and its implications for assessing provider performance via funnel plots
HANDLING MISSING DATA IN PROMS 519
© 2015 The Authors. Health Economics Published by John Wiley & Sons Ltd. Health Econ. 25: 515–528 (2016)DOI: 10.1002/hec

the provider is a public (NHS) or private hospital. Compatible with the analysis model, this can be achieved byincluding provider-specific random effects (Gomes et al., 2013).
Typically, MI assumes normality for continuous outcomes, but the post-operative OHS is left skewed with aspike at 48. Finding a suitable transformation to help normalise this outcome can be difficult. An alternativeapproach is to address the missing data in the individual components of the OHS that are ordered (0 to 4). Withordinal components, we can consider a latent normal variable for each component of the score. An importantadvantage of the latent normal approach (Albert and Chib, 1993), which is equivalent to the probit model, isthat it naturally links with the multivariate normal imputation model, easily implemented in standard software(Carpenter et al., 2011). Hence, we can impute these latent variables, assuming that their variance is restrictedto one, along with other continuous variables, for example missing covariates.
Let hkij be the observed kth component (k=1,…,K), with M ordinal categories (m=1,…,M), of the self-
reported OHS score for individual i in provider j (for the OHS score, K=12 and M=5). Let πkij;m ¼Pr hkij ¼ m� �
and γkij;m ¼ Pr hkij≤m� �
. By considering the ordered probit link model (Green, 2003), probit
γkij;m� �
¼ Φ�1 γkij;m� �
¼ αkm , then hkij can be described as a latent normal variable,ZkijeN 0; 1ð Þ, with the following
threshold model:
hkij ¼0 if Zk
ij ≤ αk1
m� 1 if αkm�1 < Zkij ≤ αkm; m¼2;…;M�1
4 if Zkij > αkM�1
8>>><>>>: (3)
The threshold parameters, αkm, define the mth category of the component k. The multivariate latent model isthen given by Zij=βXij+uj+ eij, with
eijeN 0;Ωe ¼1 ⋯ ρ
⋮ ⋱ ⋮
ρ ⋯ 1
0BB@1CCA
26643775 ujeN 0;Ωu ¼
τ21 ⋯ ϕτ1τK
⋮ ⋱ ⋮
ϕτKτ1 ⋯ τ2K
0BB@1CCA
26643775
where Zij ¼ Z1ij; …; ZK
ij , Xij ¼ X1ij; …;XK
ij are the auxiliary variables, uj ¼ u1j ; …; uKj are the provider-specificrandom effects and eij ¼ e1ij; …; eKij are the error terms. The level 1 variance (σ2k) is constrained to 1. The level 2correlation (ϕ) is often set to zero to avoid over-parameterisation at level 2. The Markov chain Monte Carlo(MCMC) algorithm to impute k ordinal components is provided in Appendix 1.
We implemented a distinct imputation model for missing data pattern at Q1 and Q2. Missing covariates such asethnicity and duration of symptoms were jointly imputed with the incomplete outcome. Both imputation models in-cluded all predictors included in the analysis model, and a number of auxiliary variables identified in previous studies(Gutacker et al., 2015; Hutchings et al., 2012; Hutchings et al., 2014) that were strong predictors of missingness andassociated with the post-operative outcome.More specifically, in the imputation model for missingness pattern at Q1,we have included two patient-level auxiliary variables: (i) hospital length of stay and (ii) elective waiting time, andthree provider-level characteristics: (i) whether the provider was an NHS or private provider; (ii) whether the providerwas a teaching hospital; and (iii) surgery volume of the hospital. In the imputation model for missingness pattern atQ2, we have included the following patient-level auxiliary variables: (i) hospital length of stay; (ii) elective waitingtime; (iii) a dummy variable to indicate previous hip replacement; (iv) a dummy to indicate Q1 was administeredbefore hospital admission; (v) whether assistance was required in completing Q2; and (vi) whether the patient livedalone. No provider-level variables were included in this imputation model.
We conducted 100 imputations and 10 000 MCMC iterations, with each set of imputed values beingdrawn from the posterior distribution at every 100th iteration of the MCMC chain. After imputation, we
M. GOMES ET AL.520
© 2015 The Authors. Health Economics Published by John Wiley & Sons Ltd. Health Econ. 25: 515–528 (2016)DOI: 10.1002/hec

combined the individual OHS components into an overall OHS score. Then, we applied the analysis model(model 1) to each multiple imputed dataset to estimate our parameter of interest, the adjusted provider-specific post-operative OHS (model 2) and combined the results using Rubin’s rules. All analyses were im-plemented in Stata, version 13, with imputations conducted in the software REALCOM-impute called fromStata (Carpenter et al., 2011).
4.3. Sensitivity analysis
The approach taken to handling missing data requires careful consideration of the different reasons as to whythey are missing (Little and Rubin, 2002). Because the true missing data mechanism is unknown, it is importantto examine whether inferences about comparative provider performance are robust to alternative assumptionsconcerning the reasons for the missing data. A practical approach is to undertake sensitivity analyses afterMI under MAR. Here, we considered a weighting approach after MI that uses the concept of importance resam-pling (Carpenter et al., 2007).
Let Rij=1 if the outcome (y2,ij) is observed, 0 otherwise. Let the probability of observing the outcome,P(Rij=1),depend on observed patient (Wij) and provider (Zj) characteristics but also on the underlying outcome, y2,ij.
P Rij ¼ 1 Wij; Zj; y2; ijÞ ¼ η0 þWijη1 þ Zjη2 þ ϕj þ y2;ijδþ ϵij���
(4)
Equation 4 collapses to a MAR mechanism when δ=0. The basic idea is to explore the sensitivity of theresults as δ departs from 0. After we have generated M multiple imputed datasets under MAR, we apply theanalysis model to each dataset and obtain M estimates. Then, instead of a simple average, a weighted averageis computed after assigning a relatively higher weight to those imputations judged to have a more plausibleMNAR mechanism (for a chosen δ).
Suppose we order the data so that patients i=1,…, n1 have missing outcomes and patients i= n1 + 1,…,Nhave complete data. For patients with incomplete data, let ymij denote the mth imputed value under MAR,m=1, 2,…, M. Under the logistic model for the missingness model described in model 4, Carpenter and others(Carpenter et al., 2007) showed that the weights can be a simple function of the imputed data and the chosen δ.Given that δ represents the log-odds ratio of the chance of observing y for each unit change in y, then the weight
for imputation m can be calculated as ewm ¼ exp �δ∑n1i¼1y
mi
� �4. For each imputed dataset, we can obtain the rel-
ative weight by normalising them as follows: wm ¼ ewm=∑mi¼1ewm.
Then, under the MNAR model implied by δ, the M parameters of interest (y2;j) are combined using Rubin’srules, but with each imputation being re-weighted according to the relative weight (wm) as follows (underMAR, all imputations are equally weighted):
eyMNAR2;j ¼ ∑M
m¼1wmey2;j VarMNARey2;j ¼ eVW þ 1þ 1M
� �eVB (5)
where eVW ¼ ∑Mm¼1wmσ2
m is the within-imputation variance, and eVB ¼ ∑Mm¼1wm ey2;j �eyMNAR
2;j
� �2is the between-
imputation variance.The weights provide, therefore, a simple mechanism to correct (re-weight) those imputations judged to have
a less plausible missing data mechanism across alternative departures from MAR. For example, when δ is pos-itive, the probability of observing y is higher for patients reporting better health (more positive y). This meansthat for imputations under MAR, patients reporting poorer outcomes will be under-represented. The weightscorrect for this by up-weighting the estimates from those imputations where the sum of the imputed valuesof y is small.
4The exponential form of the weights comes from the logistic link of model (4).
HANDLING MISSING DATA IN PROMS 521
© 2015 The Authors. Health Economics Published by John Wiley & Sons Ltd. Health Econ. 25: 515–528 (2016)DOI: 10.1002/hec
5. RESULTS
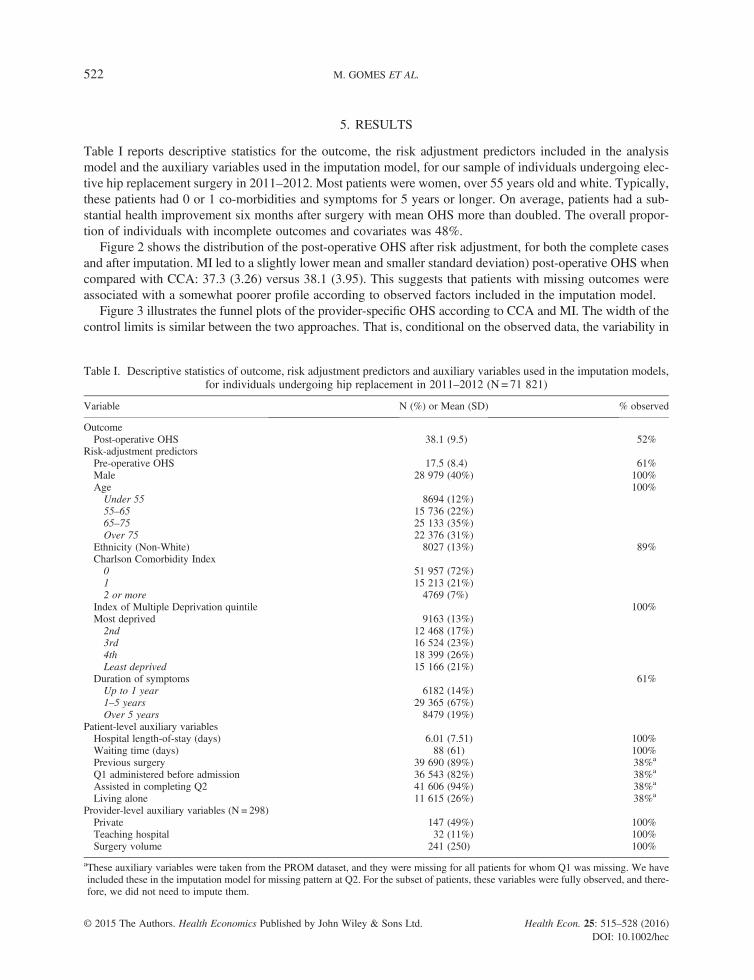
Table I reports descriptive statistics for the outcome, the risk adjustment predictors included in the analysismodel and the auxiliary variables used in the imputation model, for our sample of individuals undergoing elec-tive hip replacement surgery in 2011–2012. Most patients were women, over 55 years old and white. Typically,these patients had 0 or 1 co-morbidities and symptoms for 5 years or longer. On average, patients had a sub-stantial health improvement six months after surgery with mean OHS more than doubled. The overall propor-tion of individuals with incomplete outcomes and covariates was 48%.
Figure 2 shows the distribution of the post-operative OHS after risk adjustment, for both the complete casesand after imputation. MI led to a slightly lower mean and smaller standard deviation) post-operative OHS whencompared with CCA: 37.3 (3.26) versus 38.1 (3.95). This suggests that patients with missing outcomes wereassociated with a somewhat poorer profile according to observed factors included in the imputation model.
Figure 3 illustrates the funnel plots of the provider-specific OHS according to CCA and MI. The width of thecontrol limits is similar between the two approaches. That is, conditional on the observed data, the variability in
Table I. Descriptive statistics of outcome, risk adjustment predictors and auxiliary variables used in the imputation models,for individuals undergoing hip replacement in 2011–2012 (N= 71 821)
Variable N (%) or Mean (SD) % observed
OutcomePost-operative OHS 38.1 (9.5) 52%
Risk-adjustment predictorsPre-operative OHS 17.5 (8.4) 61%Male 28 979 (40%) 100%Age 100%Under 55 8694 (12%)55–65 15 736 (22%)65–75 25 133 (35%)Over 75 22 376 (31%)
Ethnicity (Non-White) 8027 (13%) 89%Charlson Comorbidity Index0 51 957 (72%)1 15 213 (21%)2 or more 4769 (7%)
Index of Multiple Deprivation quintile 100%Most deprived 9163 (13%)2nd 12 468 (17%)3rd 16 524 (23%)4th 18 399 (26%)Least deprived 15 166 (21%)
Duration of symptoms 61%Up to 1 year 6182 (14%)1–5 years 29 365 (67%)Over 5 years 8479 (19%)
Patient-level auxiliary variablesHospital length-of-stay (days) 6.01 (7.51) 100%Waiting time (days) 88 (61) 100%Previous surgery 39 690 (89%) 38%a
Q1 administered before admission 36 543 (82%) 38%a
Assisted in completing Q2 41 606 (94%) 38%a
Living alone 11 615 (26%) 38%a
Provider-level auxiliary variables (N = 298)Private 147 (49%) 100%Teaching hospital 32 (11%) 100%Surgery volume 241 (250) 100%
aThese auxiliary variables were taken from the PROM dataset, and they were missing for all patients for whom Q1 was missing. We haveincluded these in the imputation model for missing pattern at Q2. For the subset of patients, these variables were fully observed, and there-fore, we did not need to impute them.
M. GOMES ET AL.522
© 2015 The Authors. Health Economics Published by John Wiley & Sons Ltd. Health Econ. 25: 515–528 (2016)DOI: 10.1002/hec
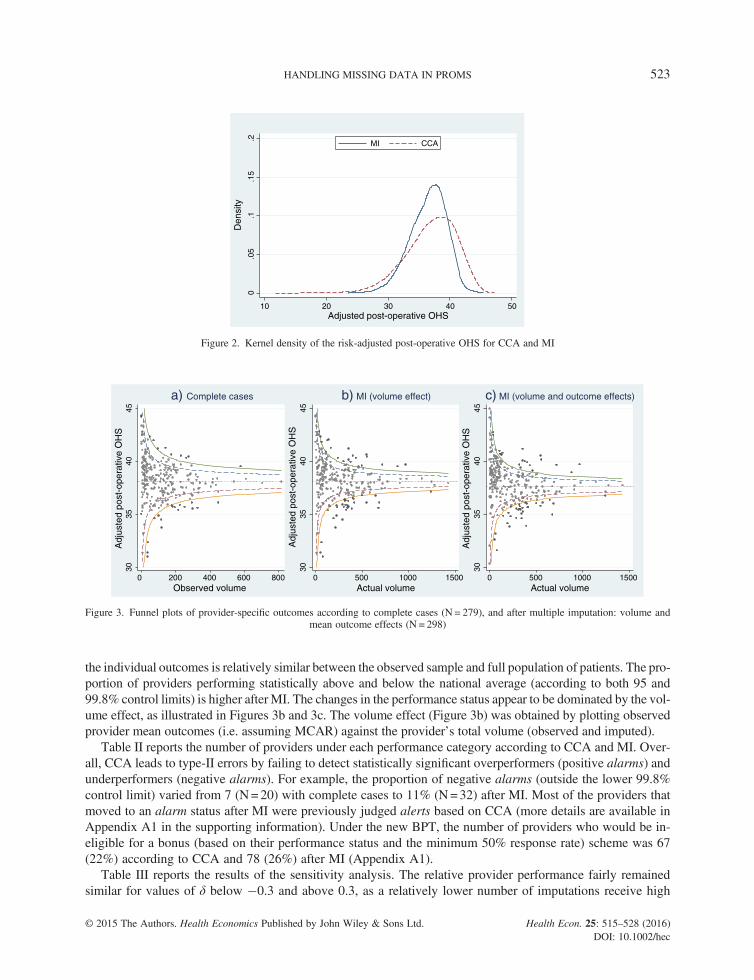
the individual outcomes is relatively similar between the observed sample and full population of patients. The pro-portion of providers performing statistically above and below the national average (according to both 95 and99.8% control limits) is higher afterMI. The changes in the performance status appear to be dominated by the vol-ume effect, as illustrated in Figures 3b and 3c. The volume effect (Figure 3b) was obtained by plotting observedprovider mean outcomes (i.e. assuming MCAR) against the provider’s total volume (observed and imputed).
Table II reports the number of providers under each performance category according to CCA and MI. Over-all, CCA leads to type-II errors by failing to detect statistically significant overperformers (positive alarms) andunderperformers (negative alarms). For example, the proportion of negative alarms (outside the lower 99.8%control limit) varied from 7 (N=20) with complete cases to 11% (N=32) after MI. Most of the providers thatmoved to an alarm status after MI were previously judged alerts based on CCA (more details are available inAppendix A1 in the supporting information). Under the new BPT, the number of providers who would be in-eligible for a bonus (based on their performance status and the minimum 50% response rate) scheme was 67(22%) according to CCA and 78 (26%) after MI (Appendix A1).
Table III reports the results of the sensitivity analysis. The relative provider performance fairly remainedsimilar for values of δ below �0.3 and above 0.3, as a relatively lower number of imputations receive high
0.0
5.1
.15
.2
10 20 30 40 50Adjusted post-operative OHS
MI CCA
Den
sity
Figure 2. Kernel density of the risk-adjusted post-operative OHS for CCA and MI
3035
4045
0 200 400 600 800Observed volume
Adj
uste
d po
st-o
pera
tive
OH
S
a) Complete cases
3035
4045
0 500 1000 1500Actual volume
b) MI (volume effect)
3035
4045
0 500 1000 1500Actual volume
c) MI (volume and outcome effects)
Adj
uste
d po
st-o
pera
tive
OH
S
Adj
uste
d po
st-o
pera
tive
OH
S
Figure 3. Funnel plots of provider-specific outcomes according to complete cases (N = 279), and after multiple imputation: volume andmean outcome effects (N = 298)
HANDLING MISSING DATA IN PROMS 523
© 2015 The Authors. Health Economics Published by John Wiley & Sons Ltd. Health Econ. 25: 515–528 (2016)DOI: 10.1002/hec
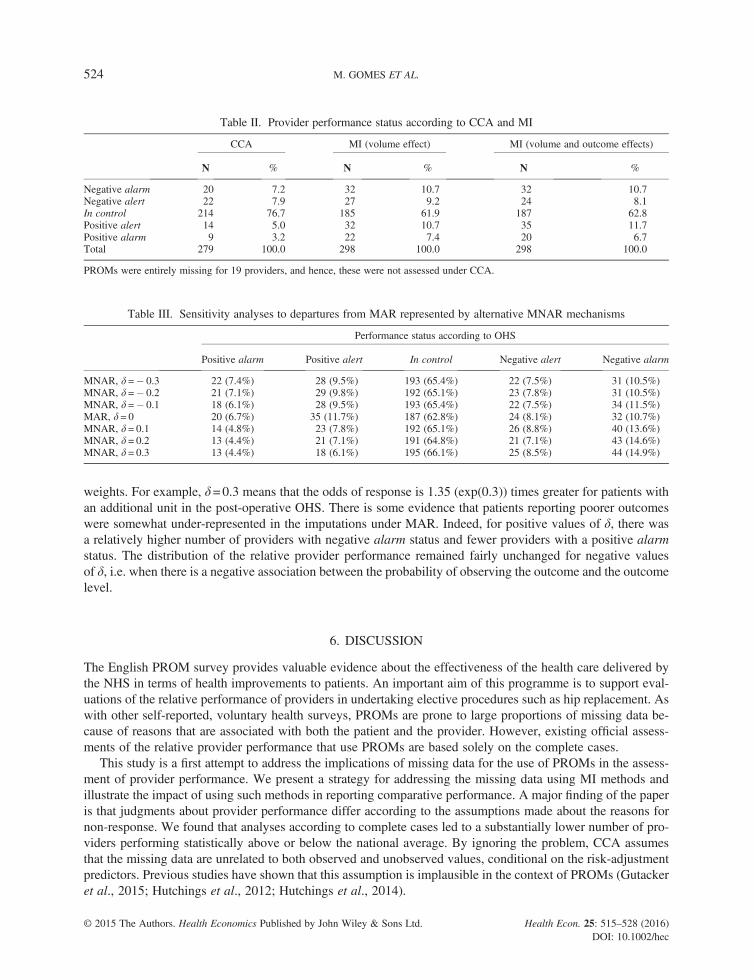
weights. For example, δ=0.3 means that the odds of response is 1.35 (exp(0.3)) times greater for patients withan additional unit in the post-operative OHS. There is some evidence that patients reporting poorer outcomeswere somewhat under-represented in the imputations under MAR. Indeed, for positive values of δ, there wasa relatively higher number of providers with negative alarm status and fewer providers with a positive alarmstatus. The distribution of the relative provider performance remained fairly unchanged for negative valuesof δ, i.e. when there is a negative association between the probability of observing the outcome and the outcomelevel.
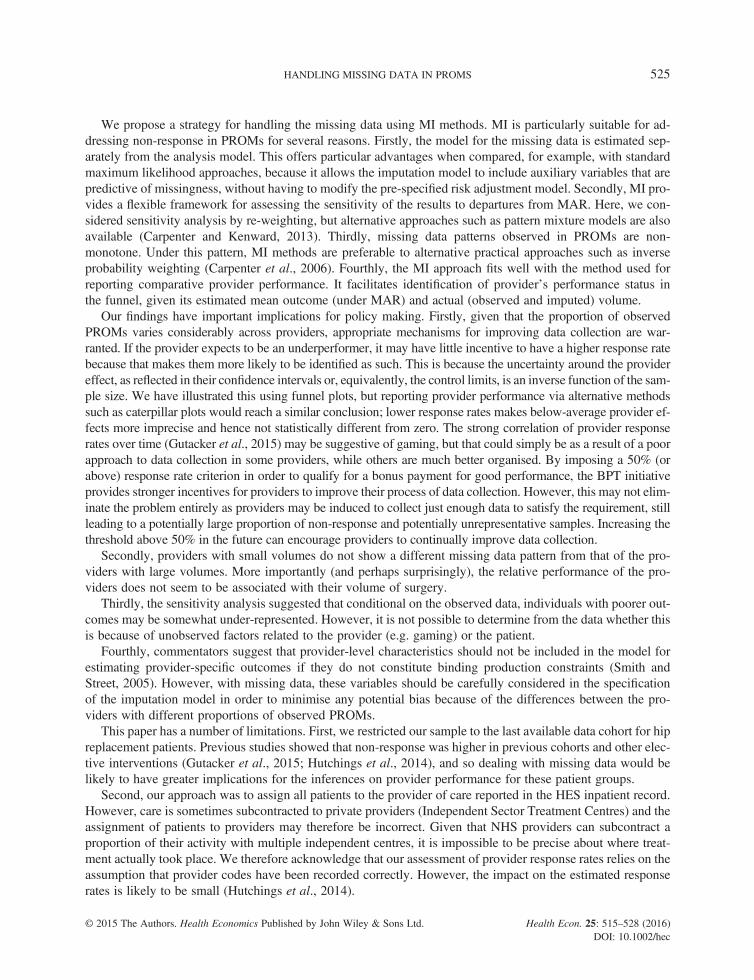
6. DISCUSSION
The English PROM survey provides valuable evidence about the effectiveness of the health care delivered bythe NHS in terms of health improvements to patients. An important aim of this programme is to support eval-uations of the relative performance of providers in undertaking elective procedures such as hip replacement. Aswith other self-reported, voluntary health surveys, PROMs are prone to large proportions of missing data be-cause of reasons that are associated with both the patient and the provider. However, existing official assess-ments of the relative provider performance that use PROMs are based solely on the complete cases.
This study is a first attempt to address the implications of missing data for the use of PROMs in the assess-ment of provider performance. We present a strategy for addressing the missing data using MI methods andillustrate the impact of using such methods in reporting comparative performance. A major finding of the paperis that judgments about provider performance differ according to the assumptions made about the reasons fornon-response. We found that analyses according to complete cases led to a substantially lower number of pro-viders performing statistically above or below the national average. By ignoring the problem, CCA assumesthat the missing data are unrelated to both observed and unobserved values, conditional on the risk-adjustmentpredictors. Previous studies have shown that this assumption is implausible in the context of PROMs (Gutackeret al., 2015; Hutchings et al., 2012; Hutchings et al., 2014).
Table II. Provider performance status according to CCA and MI
CCA MI (volume effect) MI (volume and outcome effects)
N % N % N %
Negative alarm 20 7.2 32 10.7 32 10.7Negative alert 22 7.9 27 9.2 24 8.1In control 214 76.7 185 61.9 187 62.8Positive alert 14 5.0 32 10.7 35 11.7Positive alarm 9 3.2 22 7.4 20 6.7Total 279 100.0 298 100.0 298 100.0
PROMs were entirely missing for 19 providers, and hence, these were not assessed under CCA.
Table III. Sensitivity analyses to departures from MAR represented by alternative MNAR mechanisms
Performance status according to OHS
Positive alarm Positive alert In control Negative alert Negative alarm
MNAR, δ =� 0.3 22 (7.4%) 28 (9.5%) 193 (65.4%) 22 (7.5%) 31 (10.5%)MNAR, δ =� 0.2 21 (7.1%) 29 (9.8%) 192 (65.1%) 23 (7.8%) 31 (10.5%)MNAR, δ =� 0.1 18 (6.1%) 28 (9.5%) 193 (65.4%) 22 (7.5%) 34 (11.5%)MAR, δ = 0 20 (6.7%) 35 (11.7%) 187 (62.8%) 24 (8.1%) 32 (10.7%)MNAR, δ = 0.1 14 (4.8%) 23 (7.8%) 192 (65.1%) 26 (8.8%) 40 (13.6%)MNAR, δ = 0.2 13 (4.4%) 21 (7.1%) 191 (64.8%) 21 (7.1%) 43 (14.6%)MNAR, δ = 0.3 13 (4.4%) 18 (6.1%) 195 (66.1%) 25 (8.5%) 44 (14.9%)
M. GOMES ET AL.524
© 2015 The Authors. Health Economics Published by John Wiley & Sons Ltd. Health Econ. 25: 515–528 (2016)DOI: 10.1002/hec
We propose a strategy for handling the missing data using MI methods. MI is particularly suitable for ad-dressing non-response in PROMs for several reasons. Firstly, the model for the missing data is estimated sep-arately from the analysis model. This offers particular advantages when compared, for example, with standardmaximum likelihood approaches, because it allows the imputation model to include auxiliary variables that arepredictive of missingness, without having to modify the pre-specified risk adjustment model. Secondly, MI pro-vides a flexible framework for assessing the sensitivity of the results to departures from MAR. Here, we con-sidered sensitivity analysis by re-weighting, but alternative approaches such as pattern mixture models are alsoavailable (Carpenter and Kenward, 2013). Thirdly, missing data patterns observed in PROMs are non-monotone. Under this pattern, MI methods are preferable to alternative practical approaches such as inverseprobability weighting (Carpenter et al., 2006). Fourthly, the MI approach fits well with the method used forreporting comparative provider performance. It facilitates identification of provider’s performance status inthe funnel, given its estimated mean outcome (under MAR) and actual (observed and imputed) volume.
Our findings have important implications for policy making. Firstly, given that the proportion of observedPROMs varies considerably across providers, appropriate mechanisms for improving data collection are war-ranted. If the provider expects to be an underperformer, it may have little incentive to have a higher response ratebecause that makes them more likely to be identified as such. This is because the uncertainty around the providereffect, as reflected in their confidence intervals or, equivalently, the control limits, is an inverse function of the sam-ple size. We have illustrated this using funnel plots, but reporting provider performance via alternative methodssuch as caterpillar plots would reach a similar conclusion; lower response rates makes below-average provider ef-fects more imprecise and hence not statistically different from zero. The strong correlation of provider responserates over time (Gutacker et al., 2015) may be suggestive of gaming, but that could simply be as a result of a poorapproach to data collection in some providers, while others are much better organised. By imposing a 50% (orabove) response rate criterion in order to qualify for a bonus payment for good performance, the BPT initiativeprovides stronger incentives for providers to improve their process of data collection. However, this may not elim-inate the problem entirely as providers may be induced to collect just enough data to satisfy the requirement, stillleading to a potentially large proportion of non-response and potentially unrepresentative samples. Increasing thethreshold above 50% in the future can encourage providers to continually improve data collection.
Secondly, providers with small volumes do not show a different missing data pattern from that of the pro-viders with large volumes. More importantly (and perhaps surprisingly), the relative performance of the pro-viders does not seem to be associated with their volume of surgery.
Thirdly, the sensitivity analysis suggested that conditional on the observed data, individuals with poorer out-comes may be somewhat under-represented. However, it is not possible to determine from the data whether thisis because of unobserved factors related to the provider (e.g. gaming) or the patient.
Fourthly, commentators suggest that provider-level characteristics should not be included in the model forestimating provider-specific outcomes if they do not constitute binding production constraints (Smith andStreet, 2005). However, with missing data, these variables should be carefully considered in the specificationof the imputation model in order to minimise any potential bias because of the differences between the pro-viders with different proportions of observed PROMs.
This paper has a number of limitations. First, we restricted our sample to the last available data cohort for hipreplacement patients. Previous studies showed that non-response was higher in previous cohorts and other elec-tive interventions (Gutacker et al., 2015; Hutchings et al., 2014), and so dealing with missing data would belikely to have greater implications for the inferences on provider performance for these patient groups.
Second, our approach was to assign all patients to the provider of care reported in the HES inpatient record.However, care is sometimes subcontracted to private providers (Independent Sector Treatment Centres) and theassignment of patients to providers may therefore be incorrect. Given that NHS providers can subcontract aproportion of their activity with multiple independent centres, it is impossible to be precise about where treat-ment actually took place. We therefore acknowledge that our assessment of provider response rates relies on theassumption that provider codes have been recorded correctly. However, the impact on the estimated responserates is likely to be small (Hutchings et al., 2014).
HANDLING MISSING DATA IN PROMS 525
© 2015 The Authors. Health Economics Published by John Wiley & Sons Ltd. Health Econ. 25: 515–528 (2016)DOI: 10.1002/hec

Third, we have focused our an analysis on the disease-specific OHS as this is the preferred outcome measurein the pay-for-performance BPT scheme. The impact of addressing missing data for the assessment of providerperformance was very similar for the generic quality-of-life measure, the EQ-5D. Results for this outcome canbe found in Appendix A2 in the supporting information.
Fourth, throughout, we assumed that the imputation model was correctly specified. We followed methodo-logical guidance and specified an imputation model that was compatible with the analysis model, for example,by including random effects and non-linear interactions (Carpenter and Kenward, 2013; White et al., 2011).However, the use of methods that are less sensitive to the correct specification of the imputation model, suchas Robust MI, may warrant consideration (Daniel and Kenward, 2012).
In conclusion, our analysis shows that inferences on the relative provider performance using PROMs differaccording to the assumptions made about the missing data. Assessments based solely on observed PROMs areshown to underestimate the proportion of poorly performing providers. We provide a strategy for addressingthe missing data that makes more plausible assumptions about non-response given the observed data. Consid-erable attention has been given to investigating the factors associated with patient non-response in health sur-veys. However, the reasons why health providers may differ in their ability and willingness to collect data areless well understood and should be investigated further in the context of PROMs and similar initiatives such asthe English Friends and Family test (Department of Health, 2012a). In addition, future efforts are best investedtowards increasing provider response rates so that inferences on provider performance are less dependent onmodelling assumptions.
APPENDIX 1
Below, we describe a MCMC algorithm to impute k ordinal components by sampling from the posterior normaldistribution (using a latent normal approach). Because each component may have a different missingness pat-tern, the appropriate conditional distribution will have to be derived for each component k, given all other com-ponents, ZK� 1, with k=1,…,K. While the Gibbs sampler can be used (Albert and Chib, 1993), the moregeneral Metropolis–Hastings sampler typically results in faster convergence (Cowles, 1996; Goldstein et al.,2007) and is considered here. This is particularly advantageous for estimating the threshold parameters (α)and updating level 1 and level 2 covariance matrices (Ωe, Ωu). The algorithm proceeds as follows. At each it-eration r=1, 2,…
Step 1. The first step is concerned with generating each latent normal variable, Zk, given the observed or-dinal component, hk. For each component k
(a) Sample category 0 from a standard normal distribution [�∞,α1� ẑ], categories 1, 2 and 3 from[αm� 1� ẑ, αm� ẑ] when m=2, …, M�1, and category 4 from [αM� 1� ẑ, +∞], where z ¼ βX þδZK�1 þ u.
(b) Update the threshold parameters α1,…,αM� 1. Let the component of the likelihood associated witha specific category be given by L α1;…; ; αM�1ð Þ ¼ ΠN
i¼1ΠMm¼1π
Ii;mm , where Ii,m is 1 if hij=m�1, 0
otherwise, and
πm ¼
∫α1�z
�∞φ tð Þdt; if m ¼ 1
∫αm�z
αm�1�zφ tð Þdt; if m ¼ 2;…;M � 1
∫∞αM�1�zφ tð Þdt; if m ¼ M
8>>>>>><>>>>>>::
M. GOMES ET AL.526
© 2015 The Authors. Health Economics Published by John Wiley & Sons Ltd. Health Econ. 25: 515–528 (2016)DOI: 10.1002/hec
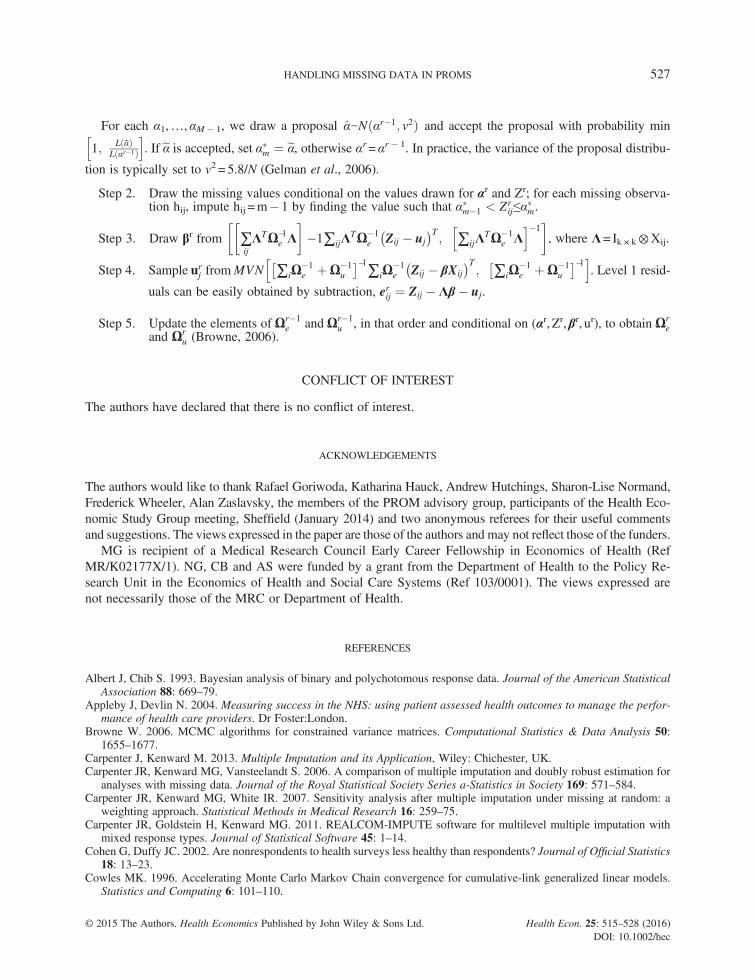
For each α1,…,αM� 1, we draw a proposal αeN αr�1; v2ð Þ and accept the proposal with probability min
1; L αð ÞL αr�1ð Þ
h i. If eα is accepted, set α�m ¼ eα, otherwise αr=αr� 1. In practice, the variance of the proposal distribu-
tion is typically set to v2 = 5.8/N (Gelman et al., 2006).
Step 2. Draw the missing values conditional on the values drawn for αr and Zr; for each missing observa-tion hij, impute hij =m� 1 by finding the value such that α�m�1 < Zr
ij≤α�m.
Step 3. Draw βr from
∑ijΛTΩ�1
e Λ�1∑ijΛ
T�1e Zij � uj� �T
; ∑ijΛTΩ�1
e Λh i�1
, where Λ= Ik × k⊗Xij.
Step 4. Sample urj fromMVN ∑iΩ�1e þΩ�1
u
� ��1∑iΩ
�1e Zij � βXij
� �T; ∑iΩ
�1e þΩ�1
u
� ��1h i. Level 1 resid-
uals can be easily obtained by subtraction, erij ¼ Zij � Λβ � uj.
Step 5. Update the elements of Ωr�1e and Ωr�1
u , in that order and conditional on (αr, Zr,βr, ur), to obtain Ωre
and Ωru (Browne, 2006).
CONFLICT OF INTEREST
The authors have declared that there is no conflict of interest.
ACKNOWLEDGEMENTS
The authors would like to thank Rafael Goriwoda, Katharina Hauck, Andrew Hutchings, Sharon-Lise Normand,Frederick Wheeler, Alan Zaslavsky, the members of the PROM advisory group, participants of the Health Eco-nomic Study Group meeting, Sheffield (January 2014) and two anonymous referees for their useful commentsand suggestions. The views expressed in the paper are those of the authors and may not reflect those of the funders.
MG is recipient of a Medical Research Council Early Career Fellowship in Economics of Health (RefMR/K02177X/1). NG, CB and AS were funded by a grant from the Department of Health to the Policy Re-search Unit in the Economics of Health and Social Care Systems (Ref 103/0001). The views expressed arenot necessarily those of the MRC or Department of Health.
REFERENCES
Albert J, Chib S. 1993. Bayesian analysis of binary and polychotomous response data. Journal of the American StatisticalAssociation 88: 669–79.
Appleby J, Devlin N. 2004. Measuring success in the NHS: using patient assessed health outcomes to manage the perfor-mance of health care providers. Dr Foster:London.
Browne W. 2006. MCMC algorithms for constrained variance matrices. Computational Statistics & Data Analysis 50:1655–1677.
Carpenter J, Kenward M. 2013. Multiple Imputation and its Application, Wiley: Chichester, UK.Carpenter JR, Kenward MG, Vansteelandt S. 2006. A comparison of multiple imputation and doubly robust estimation for
analyses with missing data. Journal of the Royal Statistical Society Series a-Statistics in Society 169: 571–584.Carpenter JR, Kenward MG, White IR. 2007. Sensitivity analysis after multiple imputation under missing at random: a
weighting approach. Statistical Methods in Medical Research 16: 259–75.Carpenter JR, Goldstein H, Kenward MG. 2011. REALCOM-IMPUTE software for multilevel multiple imputation with
mixed response types. Journal of Statistical Software 45: 1–14.Cohen G, Duffy JC. 2002. Are nonrespondents to health surveys less healthy than respondents? Journal of Official Statistics
18: 13–23.Cowles MK. 1996. Accelerating Monte Carlo Markov Chain convergence for cumulative-link generalized linear models.
Statistics and Computing 6: 101–110.
HANDLING MISSING DATA IN PROMS 527
© 2015 The Authors. Health Economics Published by John Wiley & Sons Ltd. Health Econ. 25: 515–528 (2016)DOI: 10.1002/hec

Daniel RM, Kenward MG. 2012. A method for increasing the robustness of multiple imputation. Computational Statistics& Data Analysis 56: 1624–1643.
Dawson J, Fitzpatrick R, Carr A, Murray D. 1996. Questionnaire on the perceptions of patients about total hip replacement.Journal of Bone and Joint Surgery-British Volume 78B: 185–190.
Department of Health 2012a. The NHS Friends and Family test: Implementation Guidance. Department of Health: NHSMidlands and East. UK.
Department of Health 2012b. Patient Reported Outcome Measures (PROMs) in England. A methodology for identifying po-tential outliers. Department of Health policy papers 16340: 1–30
Gale CP, Cattle BA, Moore J, Dawe H, Greenwood DC, West RM. 2011. Impact of missing data on standardised mortalityratios for acute myocardial infarction: evidence from the Myocardial Ischaemia National Audit Project (MINAP)2004–7. Heart 97: 1926–31.
Gelman A, Roberts G, Gilks W. 2006. Efficient Metropolis jumping rules. In: Bernardo J, Berger J, Dawid A, Smith A.(eds.) Bayesian Statistics V. Oxford University Press: Oxford.
Goldstein H, Spiegelhalter DJ. 1996. League tables and their limitations: statistical issues in comparisons of institutionalperformance. Journal of the Royal Statistical Society Series a-Statistics in Society 159: 385–409.
Goldstein H, Bonnet G, Rocher T. 2007. Multilevel structural equation models for the analysis of comparative data on ed-ucational performance. Journal of Educational and Behavioral Statistics 32, 252–286.
Gomes M, Diaz-Ordaz K, Grieve R, Kenward MG. 2013. Multiple imputation methods for handling missing data in cost-effectiveness analyses that use data from hierarchical studies: an application to cluster randomized trials. Medical Deci-sion Making 33: 1051–63.
Green WH. 2003. Econometric Analysis, Prentice Hall: Upper Saddle River, N.J., Great Britain.Groene O, Kristensen S, Arah OA et al. 2014. Feasibility of using administrative data to compare hospital performance in
the EU. International Journal for Quality in Health Care 26 Suppl 1: 108–15.Gutacker N, Street A, Gomes M, Bojke C. 2015. Should English healthcare providers be penalised for failing to collect
patient-reported outcome measures (PROMs)? Journal of the Royal Society of Medicine, (in press).Hutchings A, Neuburger J, Grosse Frie K, Black N, Van Der Meulen J. 2012. Factors associated with non-response in routine
use of patient reported outcome measures after elective surgery in England. Health and Quality of Life Outcomes 10: 34.Hutchings A, Neuburger J, Van Der Meulen J, Black N. 2014. Estimating recruitment rates for routine use of patient
reported outcome measures and the impact on provider comparisons. BMC Health Services Research 14: 66.Kirkham JJ. 2008. A comparison of hospital performance with non-ignorable missing covariates: an application to trauma
care data. Statistics in Medicine 27: 5725–44.Little RJ, Rubin DB. 2002. Statistical analysis with missing data, Wiley: New York, US.Mccall N, Khatutsky G, Smith K, Pope G. 2004. Estimation of non-response bias in the Medicare FFS HOS. Health Care
Financing Review 25: 27–41.Monitor 2013. National Tariff Payment System—Annex 4A: additional information on currencies with national prices:
Pages 63-70. NHS England.Murray DW, Fitzpatrick R, Rogers K et al. 2007. The use of the Oxford hip and knee scores. Journal of Bone and Joint
Surgery-British Volume, 89B, 1010-1014.Nuttall D, Parkin D, Devlin, N. 2013. Inter-provider comparison of patient-reported outcomes: developing an adjustment to
account for differences in patient case mix. Health Econ.Perneger TV, Chamot E, Bovier PA. 2005. Nonresponse bias in a survey of patient perceptions of hospital care. Medical
Care 43: 374–80.Rubin DB. 1987. Multiple Imputation for Nonresponse in Surveys,Wiley: New York, US.Schenker N, Raghunathan TE, Chiu P-L, Makuc DM, Zhang G, Cohen A. 2006. Multiple imputation of missing income
data in the National Health Interview Survey. Journal of the American Statistical Association 101: 924–933.Smith PC, Street A. 2005. Measuring the efficiency of public services: the limits of analysis. Journal of the Royal Statistical
Society: Series A (Statistics in Society) 168: 401–417.Spiegelhalter DJ. 2005. Funnel plots for comparing institutional performance. Statistics in Medicine 24: 1185–1202.White IR, Royston P, Wood AM. 2011. Multiple imputation using chained equations: issues and guidance for practice.
Statistics in Medicine 30: 377–399.
SUPPORTING INFORMATION
Additional supporting information may be found in the online version of this article at the publisher's web-site.
M. GOMES ET AL.528
© 2015 The Authors. Health Economics Published by John Wiley & Sons Ltd. Health Econ. 25: 515–528 (2016)DOI: 10.1002/hec