
ADDITIONAL STUDY OF THE SURYABINAYAK-DHULIKHEL ...
480
4R JR(先) 18-048 Federal Democratic Republic of Nepal Ministry of Physical Infrastructure and Transport Department of Roads ADDITIONAL STUDY OF THE SURYABINAYAK-DHULIKHEL ROAD IMPROVEMENT PROJECT FINAL REPORT AUGUST 2018 JAPAN INTERNATIONAL COOPERATION AGENCY CTI ENGINEERING INTERNATIONAL CO., LTD. CTI ENGINEERING CO., LTD.
-
Upload
khangminh22 -
Category
Documents
-
view
0 -
download
0
Transcript of ADDITIONAL STUDY OF THE SURYABINAYAK-DHULIKHEL ...

4R
JR(先)
18-048
Federal Democratic Republic of Nepal Ministry of Physical Infrastructure and Transport Department of Roads
ADDITIONAL STUDY OF
THE SURYABINAYAK-DHULIKHEL ROAD IMPROVEMENT PROJECT
FINAL REPORT
AUGUST 2018
JAPAN INTERNATIONAL COOPERATION AGENCY
CTI ENGINEERING INTERNATIONAL CO., LTD. CTI ENGINEERING CO., LTD.

EXCHANGE RATE
September 2017
1 NPR = 1.0900 YEN
1 USD = 112.64 YEN

-i-
Loca
tion
Map


-ii-
Photo (1/4) : Meeting and discussion with related organization
Photo-1: Explanation of Inception Report(6 AUG, 2017) Photo-2: Explanation of Technical Note and signature during
Inception report (21 AUG, 2017)
Photo-3: Explanation of Interim Report and signature on Technical Note(6 OCT, 2017)
Photo-4: Explanation of Draft Final Report for DOR (17 APR, 2018)
Photo-5: Explanation of Draft Final Report (19 APR, 2018) Photo-6: Explanation of Draft Final Report (19 APR, 2018)

-iii-
Photo (2/4) : Project site road condition
Photo-7: Start Point (Suryabinayak) Photo-8: City of Suryabinayak
(Telegraph pole and steel poles inside ROW)
Photo-9: Jagati city (Shops already setback outside ROW)
Photo-10: Existing bridge at Jagati city (Over 40 years after construction, degradation progresses,
breakage is seen)
Photo-11: Start point side bypass branch location (Planned) Photo-12: Planned west side portal location
To: Dhulikhel

-iv-
Photo (3/4) : Project site road condition
Photo-13: View from west side tunnel portal to Jagati Photo-14: Planned east side tunnel portal location
Photo-15: View from east side tunnel portal to Banepa (Junction with existing road)
Photo-16: End point side bypass branch location (Planned)
Photo-17: Banepa city (Setback of buildungs finished along road and intersection)
Photo-18: Banepa city (Flood and congestion during rainy season)
To : Dhulikhel
To : Jagati
To : Banepa
To: Jagati
To : Dhulikhel

-v-
Photo (4/4) : Project site road condition
Photo-19: Existing bridge and sewer bridge at Banepa city (Over 40 years after construction, degradation progresses,
breakage is seen)
Photo-20 : Overlook downtown Banpa from long downhill (Slope : 7%)
Photo-21 : Cut slope near Dhulikhel Photo-22 : Dhulikhel city
Photo-23 : Dhulikhel city Photo-24: End Point (Dhulikhel)
To : Sanga
Car park
To: Sanga
To : Sindhuli road
To : Dhulikhel

vii
Table of Contents Location Map Table of Contents List of Figures and Tables Acronyms and Abbreviations
CHAPTER 1 INTRODUCTION ......................................................................................... 1-1 1.1 BACKGROUND ........................................................................................................................ 1-1 1.2 PROJECT OUTLINE ................................................................................................................. 1-2
1.2.1 Project Title ......................................................................................................................... 1-2 1.2.2 Project Objective ................................................................................................................. 1-2 1.2.3 Project Features ................................................................................................................... 1-2 1.2.4 Project Area ......................................................................................................................... 1-2 1.2.5 Relevant Authorities/Organizations ..................................................................................... 1-3 1.2.6 Relevant Projects Funded by Japan ..................................................................................... 1-3
1.3 SCOPE OF THE STUDY .......................................................................................................... 1-3 1.4 STUDY OBJECTIVES .............................................................................................................. 1-3 1.5 STUDY SCHEDULE ................................................................................................................. 1-4 1.6 STUDY TEAM........................................................................................................................... 1-6
CHAPTER 2 BACKGROUND AND NECESSITY OF THE STUDY ............................. 2-1 2.1 BACKGROUND OF THE STUDY ........................................................................................... 2-1 2.2 CURRENT CONDITION OF EXISTING ROAD .................................................................... 2-1
2.2.1 Suryabinayak (Start Point) to Jagati (Km1+860) ................................................................ 2-2 2.2.2 Jagati (Km1+860) to Nalinchowk (Km4+830) ................................................................... 2-2 2.2.3 Nalinchowk (Km4+830) to Sanga pass (Km6+580) ........................................................... 2-3 2.2.4 Sanga Pass(Km6+580) to West Banepa (Km10+20) ........................................................... 2-4 2.2.5 Banepa Bazaar (West Banepa (Km10+20) to East Banepa (Km12+200)) .......................... 2-5 2.2.6 East Banepa (Km12+200) to Dhulikhel (Km14+920) ........................................................ 2-6
2.3 NECESSITY OF THE PROJECT .............................................................................................. 2-7
CHAPTER 3 TRANSPORT SECTOR OVERVIEW ........................................................ 3-1 3.1 LAND TRANSPORT ................................................................................................................. 3-1
3.1.1 Road Transport .................................................................................................................... 3-1 3.1.2 Rail Transport ...................................................................................................................... 3-3
3.2 AIR TRANSPORT ..................................................................................................................... 3-4 3.3 ROAD NETWORK AND CURRENT SITUATION OF ROAD INFRASTRUCTURE .......... 3-5 3.4 ROAD DEVELOPMENT POLICY AND PLAN ...................................................................... 3-6 3.5 ROAD DEVELOPMENT POLICY IN THE NATIONAL DEVELOPMENT PLAN .............. 3-8 3.6 RELATED PROJECTs ............................................................................................................. 3-10
CHAPTER 4 OVERVIEW OF SOCIO-ECONOMIC CONDITION AND NATURAL CONDITION ......................................................................................................................... 4-1

viii
4.1 SOCIO-ECONOMIC CONDITION .......................................................................................... 4-1 4.1.1 Population ............................................................................................................................ 4-1 4.1.2 Economy .............................................................................................................................. 4-2 4.1.3 Industry ................................................................................................................................ 4-3 4.1.4 Import and Export ............................................................................................................... 4-7 4.1.5 Transportation .................................................................................................................... 4-10
4.2 PHYSICAL PROFILE ............................................................................................................. 4-10 4.2.1 Topography ........................................................................................................................ 4-10 4.2.2 Geology ............................................................................................................................. 4-12 4.2.3 Land Classification ............................................................................................................ 4-16 4.2.4 Earthquake ......................................................................................................................... 4-16 4.2.5 Climate .............................................................................................................................. 4-17 4.2.6 Hydrology .......................................................................................................................... 4-18
CHAPTER 5 REVIEW OF IMPROVEMENT PLANS OF PREVIOUS SURVEY ....... 5-1 5.1 IMPROVEMENT PLANS OF PREVIOUS SURVEY .............................................................. 5-1 5.2 REVIEW POLICY AND ADDITIONAL ITEMS UNDERTAKEN IN THIS STUDY ............ 5-2
5.2.1 Review Policy...................................................................................................................... 5-2 5.2.2 Additional Items Undertaken ............................................................................................... 5-2
5.3 REVIEW RESULTS ................................................................................................................... 5-3 5.3.1 Objective Section and Number of Lanes ............................................................................. 5-3 5.3.2 Improvement of Alignment ................................................................................................. 5-3 5.3.3 Review of Pavement Design ............................................................................................... 5-4 5.3.4 Review Results of Other Components ................................................................................ 5-5
CHAPTER 6 ADDITIONAL TRAFFIC SURVEY ............................................................ 6-1 6.1 OUTLINE OF TRAFFIC SURVEYS ........................................................................................ 6-1 6.2 TRAFFIC VOLUME .................................................................................................................. 6-5
6.2.1 Traffic Volume ..................................................................................................................... 6-5 6.2.2 Hourly Variation of Traffic Volume ................................................................................... 6-10 6.2.3 Traffic Composition and Share of Heavy Vehicle ............................................................. 6-13 6.2.4 Share of Day–Night Time Traffic Volume ......................................................................... 6-19 6.2.5 Comparison of Weekday-Holiday ..................................................................................... 6-20
6.3 TRAVEL SPEED AND TRAVEL TIME .................................................................................. 6-23 6.3.1 Travel Speed ...................................................................................................................... 6-23 6.3.2 Travel Time ....................................................................................................................... 6-26
6.4 ORIGIN-DESTINATION PATTERN ...................................................................................... 6-27 6.4.1 Characteristics of Traffic Composition.............................................................................. 6-27 6.4.2 Origin-Destination Matrix at Road of Sanga Pass Section ................................................ 6-34
6.5 AXLE LOAD ........................................................................................................................... 6-48 6.5.1 Purpose and Survey Method .............................................................................................. 6-48 6.5.2 Survey Result .................................................................................................................... 6-48
6.6 VEHICLE EMISSION GAS .................................................................................................... 6-50 6.6.1 Purpose and Survey Method .............................................................................................. 6-50 6.6.2 Survey Result .................................................................................................................... 6-50

ix
6.7 SUMMARY OF TRAFFIC CHARACTERISTICS ................................................................. 6-52 6.7.1 Traffic Volume ................................................................................................................... 6-52 6.7.2 Traffic Composition........................................................................................................... 6-52 6.7.3 Travel Speed ...................................................................................................................... 6-53 6.7.4 OD Pattern ......................................................................................................................... 6-53 6.7.5 Impact of Sindhuli Road Opening ..................................................................................... 6-53
CHAPTER 7 TRAFFIC DEMAND FORECAST .............................................................. 7-1 7.1 APPROACH AND METHODOLOGY ..................................................................................... 7-1 7.2 SOCIO-ECONOMIC FRAMEWORK AND DEVELOPMENT PLAN ................................... 7-1
7.2.1 Socio-Economic Framework ............................................................................................... 7-1 7.2.2 Development Plan ............................................................................................................... 7-2
7.3 TRAFFIC GROWTH ................................................................................................................. 7-4 7.3.1 Passenger Vehicle ................................................................................................................ 7-4 7.3.2 Freight Vehicle .................................................................................................................... 7-5
7.4 CROSS BORDER TRAFFIC ..................................................................................................... 7-6 7.5 TRAFFIC DEMAND FORECAST .......................................................................................... 7-11
7.5.1 Traffic Growth Rate .......................................................................................................... 7-11 7.5.2 Effect of Toll Collection and Ratio of Tunnel Users......................................................... 7-12 7.5.3 Future Demand Forecast ................................................................................................... 7-13 7.5.4 Road Function Expected for SD Road .............................................................................. 7-15
CHAPTER 8 ENGINEERING SURVEY (NATURAL CONDITION SURVEY) ..... 8-1 8.1 TOPOGRAPHIC SURVEY ....................................................................................................... 8-1
8.1.1 Introduction ......................................................................................................................... 8-1 8.1.2 Scope of the Survey ............................................................................................................. 8-1 8.1.3 Methodology ....................................................................................................................... 8-2
8.2 GEOTECHNICAL Survey ......................................................................................................... 8-3 8.2.1 Objective of the Survey ....................................................................................................... 8-3 8.2.2 Survey Area ......................................................................................................................... 8-3 8.2.3 Scope of the Survey ............................................................................................................. 8-4 8.2.4 Methodology ....................................................................................................................... 8-5 8.2.5 Result of Survey .................................................................................................................. 8-8 8.2.6 Review of the Geotechnical Survey results ....................................................................... 8-14 8.2.7 Geotechnical Study along the Planned Tunnel Route ....................................................... 8-16 8.2.8 Results of groundwater survey study ................................................................................ 8-17
CHAPTER 9 PLANNING AND DESIGN POLICIES ...................................................... 9-1 9.1 GENERAL ................................................................................................................................. 9-1 9.2 POLICIES OF ROAD PLANNING ........................................................................................... 9-1 9.3 POLICIES AGAINST NATURAL CONDITIONS ................................................................... 9-7 9.4 POLICIES AGAINST SOCIO-ECONOMIC CONDITIONS ................................................... 9-8 9.5 POLICIES OF ENVIRONMENTAL AND SOCIAL CONSIDERATION ................................ 9-9 9.6 POLICIES OF CONSTRUCTION AND PROCUREMENT CONDITIONS ........................... 9-9

x
9.6.1 Construction Policies ........................................................................................................... 9-9 9.6.2 Procurement Policies ......................................................................................................... 9-10
CHAPTER 10 STUDY ON RE-ALIGNMENT AT SANGA PASS ................................. 10-1 10.1 INTRODUCTION .................................................................................................................. 10-1 10.2 ISSUES OF THE STUDY AREA .......................................................................................... 10-1 10.3 BASIC POLICIES FOR DELINEATION .............................................................................. 10-2 10.4 BASIC CONDITIONS OF THE DELINEATION ................................................................. 10-2 10.5 POLICIES FOR TYPICAL CROSS SECTIONS .................................................................. 10-3 10.6 COMPARISON STUDY OF ALTERNATIVE ALIGNMENTS ............................................ 10-4 10.7 DETAILED COMPARISON OF WEST SIDE APPROACH ROADS .................................. 10-6
CHAPTER 11 STUDY ON TUNNEL PLANNING ......................................................... 11-1 11.1 OUTLINE OF TUNNEL PLANNING ................................................................................... 11-1 11.2 ENGINEERING APPROACH ............................................................................................... 11-1
11.2.1 Design Standards ............................................................................................................. 11-1 11.2.2 Design Condition ............................................................................................................. 11-2 11.2.3 Rock Classification Method and Standard Support Patterns of the Tunnel ..................... 11-3 11.2.4 Cross-Section and Support Patterns of the Tunnel .......................................................... 11-7 11.2.5 Plan and Profile of the Tunnel ......................................................................................... 11-7 11.2.6 Design of Tunnel Portal ................................................................................................... 11-8
11.3 TUNNELING METHOD ..................................................................................................... 11-12 11.3.1 Geology, Geo-Technical and Hydrological Condition of the Tunnel ............................ 11-12 11.3.2 Excavation Method of Tunneling .................................................................................. 11-12 11.3.3 Sequence of Tunneling and Temporary Facilities for Tunnel Construction .................. 11-14
11.4 AUXILIARY METHOD ...................................................................................................... 11-15 11.5 TEMPORARY FACILITIES AND EQUIPMENT NECESSARY FOR TUNNEL
CONSTRUCTION ............................................................................................................. 11-16 11.6 FACILITIES NECESSARY FOR TUNNEL ........................................................................ 11-17
11.6.1 General .......................................................................................................................... 11-17 11.6.2 Ventilation Facilities ...................................................................................................... 11-18 11.6.3 Tunnel Lighting Facilities .............................................................................................. 11-23 11.6.4 Tunnel Emergency Equipment/Facilities ....................................................................... 11-27 11.6.5 Other Facilities .............................................................................................................. 11-35
CHAPTER 12 STUDY ON THE ROAD IMPROVEMENT .......................................... 12-1 12.1 INTRODUCTION .................................................................................................................. 12-1 12.2 ROAD IMPROVEMENT PLAN ........................................................................................... 12-1
12.2.1 ROUTE PLANNING ...................................................................................................... 12-1 12.2.2 ALIGNMENT ................................................................................................................. 12-1
12.3 CROSS SECTION ................................................................................................................. 12-2 12.4 PLANNING OF SERVICE TRACKS ................................................................................... 12-4 12.5 INTERSECTION PLAN ........................................................................................................ 12-4

xi
12.6 PAVEMENT DESIGN............................................................................................................ 12-6 12.7 DRAINAGE PLAN .............................................................................................................. 12-12 12.8 RECONSTRUCTION OF EXISTING BRIDGES .............................................................. 12-14 12.9 PEDESTRIAN BRIDGES (FOOTBRIDGES) .................................................................... 12-23 12.10 SLOPE STABILITY .......................................................................................................... 12-25 12.11 RETAINING WALL ........................................................................................................... 12-25 12.12 RIVER TRAINING WORKS ............................................................................................ 12-25 12.13 DRAINPIPE FROM JAGATI TO A RIVER ...................................................................... 12-26 12.14 ROAD ANCILLARY PLAN .............................................................................................. 12-26
CHAPTER 13 APPLICATION OF ADVANCED TECHNOLOGIES ........................... 13-1 13.1 GENERAL ............................................................................................................................. 13-1 13.2 NECESSITY OF ADVANCED TECHNOLOGIES ............................................................... 13-1
13.2.1 Necessity of Advanced Technologies in Highway Tunnels in Nepal .............................. 13-1 13.2.2 Necessity of Advanced Technology in Sanga Tunnel ...................................................... 13-2
13.3 CONCEIVABLE ADVANCED TECHNOLOGIES .............................................................. 13-3 13.3.1 Non-expansive All Ground Fastening Method ................................................................ 13-3 13.3.2 Inverter-driven Jet Fans ................................................................................................... 13-4 13.3.3 Hard Rock Excavation Machine ...................................................................................... 13-5 13.3.4 Sound-Proof Gate ............................................................................................................ 13-5 13.3.5 High Performance Lining Form ...................................................................................... 13-6 13.3.6 High Performance Lining Concrete and Curing System ................................................. 13-6 13.3.7 Flat Insulated Lining Method .......................................................................................... 13-6 13.3.8 Standard of the Safety Control in Tunnel Construction .................................................. 13-7 13.3.9 Recycling and Reuse of Spent Construction Supply, Temporary Material ..................... 13-7
13.4 ADVANCED TECHNOLOGIES APPLICABLE TO SANGA TUNNEL ............................. 13-7
CHAPTER 14 PROJECT EXECUTION ORGANIZATION ......................................... 14-1 14.1 RESPONSIBLE ORGANIZATION ....................................................................................... 14-1 14.2 MINISTRY OF PHYSICAL INFRASTRUCTURE AND TRANSPORT ............................. 14-1 14.3 DEPARTMENT OF ROADS (DOR) ..................................................................................... 14-3
14.3.1 Vision, Overall Goal and Mission ................................................................................... 14-4 14.3.2 Annual Budget of DOR ................................................................................................... 14-4 14.3.3 Organization Chart .......................................................................................................... 14-4 14.3.4 Operation and Maintenance of Roads ............................................................................. 14-8 14.3.5 Procedure of Determination ............................................................................................ 14-8
CHAPTER 15 OPERATION AND MAINTENANCE .................................................... 15-1 15.1 OPERATION AND MAINTENANCE ORGANIZATION ................................................... 15-1
15.1.1 Road O&M Organization ................................................................................................ 15-1 15.1.2 Tunnel O&M Organization .............................................................................................. 15-1
15.2 OPERATION AND MAINTENANCE PLAN ....................................................................... 15-4 15.2.1 Operation and Maintenance of Road Section .................................................................. 15-4

xii
15.2.2 Operation and Maintenance of The Tunnel ..................................................................... 15-7 15.2.3 Tunnel O&M Cost and Fund Source ............................................................................. 15-13
CHAPTER 16 ENVIRONMENTAL AND SOCIAL CONSIDERATIONS ................... 16-1 16.1 REVIEW ON ENVIRONMENTAL AND SOCIAL CONSIDERATIONS FOR FORMER
SURVEY (THE SECTION EXCEPT TUNNEL AT SANGA) ............................................ 16-1 16.1.1 Summary of Former Surveys regarding Environmental and Social Considerations ....... 16-1 16.1.2 Results of Review ............................................................................................................ 16-6
16.2 ENVIRONMENTAL IMPACT ASSESeSMENT (EIA) ........................................................ 16-9 16.2.2 EIA Outline in Nepal ..................................................................................................... 16-11 16.2.3 Legal Framework on EIA / Environmental Standard .................................................... 16-11 16.2.4 EIA Approval Procedures .............................................................................................. 16-14 16.2.5 Scoping Results ............................................................................................................. 16-14 16.2.6 TOR for EIA Surveys .................................................................................................... 16-19 16.2.7 Evaluation and Baseline of the Environmental and Social Condition ........................... 16-22 16.2.8 Results of EIA Surveys .................................................................................................. 16-41 16.2.9 Mitigation Measures on Impacts ................................................................................... 16-44 16.2.10 Environmental Management Plan (EMP) ................................................................... 16-54 16.2.11 Environmental Monitoring Plan (EMoP) .................................................................... 16-57 16.2.12 Stakeholder Meeting .................................................................................................... 16-61 16.2.13 Associated Social Issues and Actions during Construction ......................................... 16-68
16.3 LAND ACQUISITION AND RESETTLEMENT ............................................................... 16-69 16.3.1 Components Causing Resettlement ............................................................................... 16-70 16.3.2 Objectives and Scopes of the RAP ................................................................................ 16-74 16.3.3 Socio-Economic Status .................................................................................................. 16-76 16.3.4 Information Disclosure and Public Information ............................................................ 16-79 16.3.5 Domestic Law and Regulations ..................................................................................... 16-80 16.3.6 Policy Gap Analysis ...................................................................................................... 16-83 16.3.7 Compensation Policy, Eligibility, and Entitlement ........................................................ 16-88 16.3.8 Institutional Framework ................................................................................................ 16-95 16.3.9 Resettlement and Rehabilitation .................................................................................... 16-97 16.3.10 Grievance Redress Mechanism (GRM) ....................................................................... 16-98 16.3.11 Organizational Responsibilities ................................................................................... 16-99 16.3.12 Implementation Schedule and Activities ................................................................... 16-100 16.3.13 Cost Estimation ......................................................................................................... 16-101 16.3.14 Monitoring and Evaluation ........................................................................................ 16-104
CHAPTER 17 CONSULTING SERVICE PLAN ............................................................ 17-1 17.1 GENERAL ............................................................................................................................. 17-1 17.2 DETAILED DESIGN STAGE ............................................................................................... 17-1 17.3 TENDER ASSISTANCE STAGE .......................................................................................... 17-1 17.4 CONSTRUCTION SUPERVISION STAGE ......................................................................... 17-2 17.5 CAPACITY DEVELOPMENT FOR TUNNEL O & M STAGE ........................................... 17-2
CHAPTER 18 CONSTRUCTION PLAN ......................................................................... 18-1 18.1 CONSTRUCTION SCHEDULE ........................................................................................... 18-1 18.2 MAJOR MATERIALS ........................................................................................................... 18-1

xiii
18.3 MAJOR EQUIPMENT .......................................................................................................... 18-2 18.4 CONSTRUCTION CAMPS AND TEMPORARY YARD .................................................... 18-4 18.5 BORROW PIT, QUARRY SITE AND DISPOSAL SITE ..................................................... 18-4
CHAPTER 19 CONSTRUCTION COST ESTIMATE ................................................... 19-1
CHAPTER 20 PROJECT IMPLEMENTATION PLAN ................................................ 20-1 20.1 PROJECT SCOPE OF WORK............................................................................................... 20-1 20.2 IMPLEMENTATION SCHEDULE ....................................................................................... 20-1 20.3 CIVIL WORK CONTRACT PACKAGING .......................................................................... 20-1 20.4 PROJECT IMPLEMENTATION ORGANIZATION STRUCTURE AND UNIT ................ 20-1
20.4.1 Project Implementation Organization Structure .............................................................. 20-1 20.4.2 Project Management Unit (Office) .................................................................................. 20-2 20.4.3 Tunnel Management Unit (Office) .................................................................................. 20-3
20.5 FINANCIAL PLAN ............................................................................................................... 20-4 20.6 PROCUREMENT PLAN ....................................................................................................... 20-4 20.7 PROJECT IMPLEMENTATION RISKS AND COUNTERMEASURES ............................ 20-5 20.8 RECOMENDATION TO DETAILED DESIGN STAGE ...................................................... 20-7
CHAPTER 21 PROJECT EVALUATION ....................................................................... 21-1 21.1 ECONOMIC EVALUATION ................................................................................................. 21-1
21.1.1 Methodology ................................................................................................................... 21-1 21.1.2 Economic Cost of the Project .......................................................................................... 21-2 21.1.3 Economic Benefit of the Project ...................................................................................... 21-3 21.1.4 Results of Economic Analysis ......................................................................................... 21-7 21.1.5 Project Sensitivity ............................................................................................................ 21-7
21.2 FINANCIAL EVALUATION ................................................................................................. 21-7 21.3 OPERATION AND EFFECT INDICATORS ........................................................................ 21-8
21.3.1 Selection of Operation and Effect Indicators .................................................................. 21-8 21.3.2 Operation and Effect Indicators ....................................................................................... 21-8
CHAPTER 22 OVERSEAS PROGRAM .......................................................................... 22-1 22.1 INTRODUCTION .................................................................................................................. 22-1 22.2 OBJECTIVE AND EXPECTED OUTCOMES ..................................................................... 22-1
22.2.1 Purpose ............................................................................................................................ 22-1 22.2.2 Expected Outcomes ......................................................................................................... 22-2
22.3 PROGRAM PERIOD ............................................................................................................. 22-2 22.4 TARGET ORGANIZATIONS AND OFFICIALS ................................................................. 22-2 22.5 PROGRAM ............................................................................................................................ 22-3 22.6 OUTLINE OF OBSERVATIONS, TECHNOLGIES INTRODUCED AND LECTURES .... 22-4
22.6.1 Observation of Facilities along National Highway ......................................................... 22-4

xiv
22.6.2 Sinkuzakai Tunnel ........................................................................................................... 22-5 22.6.3 Aqua line and Umi-hotaru ............................................................................................... 22-6 22.6.4 Traffic Control System .................................................................................................... 22-6 22.6.5 Presentation and Lectures on Japanese Advanced Technologies..................................... 22-7
22.7 OBSERVATIONS ................................................................................................................... 22-7 22.8 GLIMPSES OF THE VISIT ................................................................................................... 22-9
【Appendix】
Apendix-1:Preliminary Design Drawings

xv
List of Figures
Figure 1.1-1 Major Road Network ............................................................................................ 1-1 Figure 2.2-1 Summary for Current Condition of Existing Road ............................................... 2-1 Figure 2.2-2 Topography of the Section .................................................................................... 2-2 Figure 3.2-1 International and Regional Airports in Nepal ....................................................... 3-5 Figure 3.3-1 Present Arterial Road Network in Nepal .............................................................. 3-6 Figure 3.6-1 Location of Nagdhunga Tunnel .......................................................................... 3-11 Figure 3.6-2 Conceptual Image of ORR .................................................................................. 3-12 Figure 4.1-1 The Population Change in Project Area ................................................................ 4-1 Figure 4.1-2 Change of Real GDP and Growth Rate by Sector ................................................ 4-2 Figure 4.1-3 Change of Real GDP per Capita .......................................................................... 4-2 Figure 4.1-4 Economic Condition ............................................................................................. 4-3 Figure 4.1-5 GDP Share by Industry Sector .............................................................................. 4-3 Figure 4.1-6 Employment Share by Industry ............................................................................ 4-4 Figure 4.1-7 Changes in the Consumer Price Index Increase Rate ........................................... 4-4 Figure 4.1-8 Changes in Number of Tourist .............................................................................. 4-5 Figure 4.1-9 Trend in the Migrant Workers and Overseas Remittance ..................................... 4-5 Figure 4.1-10 Trends in Foreign Direct Investment .................................................................. 4-6 Figure 4.1-11 Sectorial Accumulative Investment Amount by 2012......................................... 4-6 Figure 4.1-12 Changes of Volume Import and Export Value Basis ........................................... 4-7 Figure 4.1-13 Share of Country in Trade ................................................................................... 4-7 Figure 4.1-14 Share of Commodity in Trade ............................................................................. 4-8 Figure 4.1-15 Trend in Trade Value with Japan ........................................................................ 4-9 Figure 4.1-16 Trade Commodity with Japan by Import and Export ......................................... 4-9 Figure 4.1-17 Trend in Number of Visitor from Japan .............................................................. 4-9 Figure 4.2-1 Schematic Map of the Topography around Kathmandu ..................................... 4-11 Figure 4.2-2 Schematic Diagram of Road Slope Leading to Kathmandu ............................... 4-11 Figure 4.2-3 Topography of Study Area .................................................................................. 4-12 Figure 4.2-4 Geology of Sanga Pass Area ............................................................................... 4-12 Figure 4.2-5 Climate of the Kathmandu Valley ....................................................................... 4-17 Figure 6.1-1 Location of Traffic Survey Station (Traffic Volume Survey and OD Survey) ..... 6-2 Figure 6.1-2 Location of Travel Speed Survey ......................................................................... 6-3 Figure 6.1-3 Survey Route of Travel Time Survey ................................................................... 6-3 Figure 6.2-1 Daily Traffic Volume on Weekday, All Type ........................................................ 6-6 Figure 6.2-2 Daily Traffic Volume on Weekday, Excluding Motorcycle .................................. 6-6 Figure 6.2-3 Traffic Volume Survey at Dhulikhel Intersection ................................................. 6-7 Figure 6.2-4 Daily Traffic Volume on Cross Section at Dhulikhel Intersection, All Type ....... 6-8 Figure 6.2-5 Daily Traffic Volume on Cross Section at Dhulikhel Intersection, Excluding
Motocycle ........................................................................................................... 6-9 Figure 6.2-6 Daily Traffic Volume by Direction at Dhulikhel Intersection ............................. 6-10 Figure 6.2-7 Daily Traffic Volume by Direction at Dhulikhel Intersection, Excluding Motorcycle
.......................................................................................................................... 6-10 Figure 6.2-8 Hourly Variation of Traffic Volume .................................................................... 6-11 Figure 6.2-9 Hourly Variation of Daily Traffic Volume, Excluding Motorcycle .................... 6-11 Figure 6.2-10 Hourly Variation of Traffic Volume at Dhulikhel Intersection Cross Section, All
Type of Vehicle ................................................................................................. 6-12 Figure 6.2-11 Hourly Variation of Traffic Volume at Dhulikhel Intersection, Cross Section,
Excluding Motorcycle ...................................................................................... 6-12 Figure 6.2-12 Hourly Variation of Traffic Volume at Dhulikhel Intersection, By Direction, All
Type of Vehicle ................................................................................................. 6-12 Figure 6.2-13 Hourly Variation of Traffic Volume at Dhulikhel Intersection, By Direction,
Excluding Motorcycle ...................................................................................... 6-13 Figure 6.2-14 Traffic Composition at Five Survey Stations .................................................... 6-14 Figure 6.2-15 Traffic Composition of Excluding Motocycle at Five Survey Stations ............ 6-14

xvi
Figure 6.2-16 Share of Heavy Vehicle of All Type Vehicles at Five Stations ......................... 6-15 Figure 6.2-17 Share of Heavy Vehicle Excluding Motocycle at Five Survey Stations ........... 6-15 Figure 6.2-18 Traffic Composition on Cross Section at Dhulikhel Intersection ..................... 6-16 Figure 6.2-19 Traffic Composition on Cross Section at Dhulikhel Intersection, Excluding
Motorcycle ........................................................................................................ 6-16 Figure 6.2-20 Hourly Share of Heavy Vehicle on Cross Section at Dhulikhel Intersection .... 6-17 Figure 6.2-21 Hourly Share of Heavy Vehicle on Cross Section at Dhulikhel Intersection,
Excluding Motorcycle ...................................................................................... 6-17 Figure 6.2-22 Traffic Composition of Traffic by Direction at Dhulikhel Intersection ............ 6-18 Figure 6.2-23 Traffic Composition of Traffic by Direction at Dhulikhel Intersection,Excluding
Motocycle ......................................................................................................... 6-18 Figure 6.2-24 Share of Heavy Vehicle of All Type Vehicles (By Direction) ........................... 6-19 Figure 6.2-25 Share of Heavy Vehicle of All Type Vehicles (By Direction), W/O Motorcycle .. 6-
19 Figure 6.2-26 Comparison of Total Traffic Volume Excluding Motor cycle at Sta.3 Sanga ... 6-21 Figure 6.2-27 Hourly Variation of Weekday and Holiday at Sta.3 Sanga ............................... 6-22 Figure 6.2-28 Traffic Composition of Week-Day and Holiday at Sta.3 Sanga ....................... 6-22 Figure 6.2-29 Hourly Ratio of Large Size Vehicle Traffic with Week-Day and Holiday at Sta.3
Sanga ................................................................................................................ 6-23 Figure 6.3-1 Speed by Gradient on Uphill of Heavy Truck and Large Bus ............................ 6-24 Figure 6.3-2 Speed by Gradient on Uphill of Light Vehicle .................................................... 6-24 Figure 6.3-3 Comparison of Speed Reduction of Large Vehicle and Light Vehicle ................ 6-25 Figure 6.3-4 Comparison of Speed of Large Vehicle and Light Vehicle ................................. 6-25 Figure 6.4-1 Map of OD Zoning System ................................................................................. 6-28 Figure 6.4-2 Purpose of Trip by All Type of Vehicle on Weekday .......................................... 6-29 Figure 6.4-3 Purpose of Trip by All Type of Vehicle on Holiday ............................................ 6-30 Figure 6.4-4 Average Number of Passengers on Weekday ..................................................... 6-31 Figure 6.4-5 Average Number of Passengers on Holiday ....................................................... 6-31 Figure 6.4-6 Loading Rate of Truck by Direction on Weekday .............................................. 6-32 Figure 6.4-7 Loading Rate of Truck by Direction on Holiday ................................................ 6-32 Figure 6.4-8 Commodity Type of Truck on Weekday ............................................................ 6-34 Figure 6.4-9 Commodity Type of Truck on Holiday .............................................................. 6-34 Figure 6.4-10 Desire Line of All Type Vehicles on Weekday (veh./day) ................................ 6-36 Figure 6.4-11 Desire Line of All Type Vehicles on Weekday (%) ........................................... 6-36 Figure 6.4-12 Desire Line of All Type Vehicles on Holiday (veh./day) .................................. 6-37 Figure 6.4-13 Desire Line of All Type Vehicles on Holiday (%) ............................................ 6-37 Figure 6.4-14 The Concentrated Traffic Volume Generated by Each Type of Vehicle on Weekday
.......................................................................................................................... 6-38 Figure 6.4-15 The Concentrated Traffic Volume Generated by Each Type of Vehicle on Holiday
.......................................................................................................................... 6-38 Figure 6.4-16 Desire Line of Passenger Car on Weekday (veh./day) ...................................... 6-40 Figure 6.4-17 Desire Line of Passenger Car on Weekday (%) ................................................ 6-40 Figure 6.4-18 Desire Line of Passenger Car on Holiday (veh./day) ....................................... 6-41 Figure 6.4-19 Desire Line of Passenger Car on Holiday (%) .................................................. 6-41 Figure 6.4-20 Desire Line of Bus on Weekday (veh./day) ...................................................... 6-43 Figure 6.4-21 Desire Line of Bus on Weekday (%) ................................................................ 6-43 Figure 6.4-22 Desire Line of Bus on Holiday (veh./day) ........................................................ 6-44 Figure 6.4-23 Desire Line of Bus on Holiday (%) .................................................................. 6-44 Figure 6.4-24 Desire Line of Truck on Weekday (veh./day) ................................................... 6-46 Figure 6.4-25 Desire Line of Truck on Weekday (%) ............................................................. 6-46 Figure 6.4-26 Desire Line of Truck on Holiday (veh./day) ..................................................... 6-47 Figure 6.4-27 Desire Line of Truck on Holiday (%) ............................................................... 6-47 Figure 6.5-1 Distribution of Gross Vehicle Load of Bus ......................................................... 6-49 Figure 6.5-2 Distribution of Gross Vehicle Load of 2 Axle Truck .......................................... 6-49 Figure 6.5-3 Distribution of Gross Vehicle Load of 3 Axle Truck .......................................... 6-49

xvii
Figure 6.6-1 Result of Vehicle Emission Gas Test (CO) ......................................................... 6-51 Figure 6.6-2 Result of Vehicle Emission Gas Test (NOx) ....................................................... 6-52 Figure 6.6-3 Result of Vehicle Emission Gas Test (SO2) ........................................................ 6-52 Figure 6.7-1 Annual Variation of Traffic Volume at SD Road (weekday) ............................. 6-54 Figure 7.2-1 Existing Urban Function Distribution in the Valley and its Expansion ................ 7-2 Figure 7.2-2 Location of Pachkhal ............................................................................................ 7-3 Figure 7.3-1 Estimation Result of Passenger Vehicle ................................................................ 7-5 Figure 7.3-2 Estimation Result of Freight Vehicle .................................................................... 7-6 Figure 7.4-1 Investigation Section ............................................................................................ 7-7 Figure 7.4-2 Main Logistics Route .......................................................................................... 7-10 Figure 7.5-1 Procedure for Future Demand Forecast .............................................................. 7-13 Figure 7.5-2 Future Traffic Demand in SD Road Section (PCU/DAY) .................................. 7-14 Figure 8.1-1 Objective Area of Topographic survey .................................................................... 8-1 Figure 8.2-1 Survey Area .......................................................................................................... 8-3 Figure 8.2-2 Collapsed Area on the Side of the Road Valley ................................................... 8-3 Figure 8.2-3 Collapse Prevention Retaining Wall ..................................................................... 8-4 Figure 8.2-4 Location Map of Geo-Technical Survey ............................................................... 8-4 Figure 8.2-5 Geo-Technical Survey Locations .......................................................................... 8-5 Figure 8.2-6 Topographic map and Aerial Photo ...................................................................... 8-8 Figure 8.2-7 Geological Map of Project Area ........................................................................... 8-9 Figure 8.2-8 Geological Map along Tunnel Route .................................................................... 8-9 Figure 8.2-9 Drilling Log with Core Photoe ........................................................................... 8-10 Figure 8.2-10 Drilling Log with Core Photoe ......................................................................... 8-11 Figure 8.2-11 Plan of Conducting ERT ................................................................................... 8-12 Figure 8.2-12 Cross Section of ERT ........................................................................................ 8-12 Figure 8.2-13 Geo-Physical Prospecting Survey ..................................................................... 8-13 Figure 8.2-14 Results of water source survey ......................................................................... 8-14 Figure 8.2-15 Survey Position Map and Tunnel Route Geological Section ............................ 8-15 Figure 8.2-16 Relationship between Comparative Section and Planned Tunnel Cross Section .. 8-
16 Figure 8.2-17 Rock Mass Classification along planned tunnel route ...................................... 8-17 Figure 8.2-18 Concept of influence range by hydrological method ........................................ 8-18 Figure 10.1-1 Proposed Bypass at Sanga (Previous Survey) .................................................. 10-1 Figure 10.5-1 Typical Cross-Section of Road ......................................................................... 10-3 Figure 10.5-2 Typical Cross-Section of Tunnel Portal ............................................................ 10-3 Figure 11.2-1 Mutual Separation Distance of Tunnels ............................................................ 11-3 Figure 11.2-2 Geological Profile ............................................................................................. 11-6 Figure 11.2-3 Typical Cross-Section (DI-b) ............................................................................ 11-7 Figure 11.2-4 Plan of Sanga Tunnels (Outbound and Inbound) .............................................. 11-7 Figure 11.2-5 Profile of Tunnel Section .................................................................................. 11-8 Figure 11.2-6 Plan of Western Tunnel Portals (Banepa Side) ................................................. 11-9 Figure 11.2-7 Site Location Photos of Western Portal ............................................................ 11-9 Figure 11.2-8 Plan of Eastern Tunnel Portal (Banepa Side) .................................................. 11-10 Figure 11.2-9 Site Location Photos of Eastern Portal ........................................................... 11-11 Figure 11.2-10 Eastern Portal on Shortest Tunnel Plan ......................................................... 11-11 Figure 11.3-1 Road-Header as Tunneling Machine ............................................................... 11-13 Figure 11.3-2 Sequence of Mechanical Excavation .............................................................. 11-15 Figure 11.4-1 Long Span Fore-Piling in Difficult Ground (non-widening type) .................. 11-16 Figure 11.5-1 Layout of Temporary Facilities for Tunnel Construction ............................... 11-17 Figure 11.6-1 Speed & Gradient Compensation Factor and Altitude Compensation Factor . 11-20 Figure 11.6-2 Installation of Jet Fan ...................................................................................... 11-23 Figure 11.6-3 Layout of Tunnel Lighting .............................................................................. 11-26 Figure 11.6-4 Classification of Tunnel .................................................................................. 11-28 Figure 11.6-5 Tunnel Classification of Sanga Tunnel ........................................................... 11-33 Figure 11.6-6 Layout of Emergency Facilities (Inbound Tunnel) ......................................... 11-34

xviii
Figure 11.6-7 Layout of Emergency Facilities (Outbound Tunnel) ...................................... 11-35 Figure 11.6-8 Emergency Parking Bay ................................................................................. 11-35 Figure 11.6-9 Proposed Layout of Emergency Parking Bay ................................................. 11-36 Figure 11.6-10 Evacuation Connection Tunnel Cross-Section .............................................. 11-36 Figure 11.6-11 Proposed Layout of Evacuation Connection Tunnel ..................................... 11-37 Figure 11.6-12 Layout of Tunnel Management Office and Electric Room (Proposed) ........ 11-38 Figure 11.6-13 Layout of Electric Room (Sample) ............................................................... 11-38 Figure 11.6-14 Location Map of Substation at Banepa and current condition ...................... 11-40 Figure 12.3-1 Typical Cross Section at Level Difference Sections (Section 1, Section 2) ..... 12-2 Figure 12.3-2 Typical Cross Section (Without Service Tracks)(Section 1, Section 5, Section 7
and Section 9) ................................................................................................ 12-2 Figure 12.3-3 Typical Cross Section at Approach Road of Tunnel (Section 3, Section 4) ...... 12-3 Figure 12.3-4 Typical Cross Section(Section 6 Banepa Bazar) ......................................... 12-3 Figure 12.3-5 Typical Cross Section(Section 8) ................................................................ 12-3 Figure 12.3-6 Typical Cross Section(Section 10) .............................................................. 12-4 Figure 12.7-1 Drainage Facilities Where Service Tracks are Provided ................................. 12-13 Figure 12.7-2 Drainage Facilities at Cut Sections Where Service Tracks are not Provided . 12-13 Figure 12.8-1 Designed Cross Section at Bridge No.1 (Sipadol Khola) ............................... 12-18 Figure 12.8-2 Designed Longitudinal Profile along Bridge No.1 (Sipadol Khola) ............... 12-18 Figure 12.8-3 Designed Cross Section at Bridge No.2 (Bhikteswor Khola) ......................... 12-19 Figure 12.8-4 Designed Longitudinal Profile along Bridge (No.2) Bhikteswor Khola ........ 12-19 Figure 12.8-5 Designed Cross Section at Bridge No.3 (Punyamati Khola) .......................... 12-20 Figure 12.8-6 Designed Longitudinal Profile along Bridge No.3 (Punyamati Khola) .......... 12-20 Figure 12.8-7 Designed Cross Section at Bridge No.4 (Chandeshori Khola) ....................... 12-21 Figure 12.8-8 Designed Longitudinal Profile along Bridge No.4 (Chandeshori Khola) ....... 12-21 Figure 12.9-1 Outline of Footbridge ..................................................................................... 12-24 Figure 12.12-1 Outline of River Training Work .................................................................... 12-25 Figure 12.13-1 Basic idea of route of drainpipe from Jagati to a river ................................. 12-26 Figure 13.3-1 Non-expansive AGF Method ............................................................................ 13-3 Figure 13.3-2 Inverter-driven Jet Fan ...................................................................................... 13-4 Figure 13.3-3 High Performance Curing System .................................................................... 13-6 Figure 14.2-1 Organization Chart of MOPIT .......................................................................... 14-1 Figure 14.3-1 Organization Chart of DOR .............................................................................. 14-5 Figure 15.1-1 Proposed Organization of Tunnel Management Office .................................... 15-3 Figure 15.1-2 Estimated Staff Requirement ............................................................................ 15-3 Figure 15.2-1 Flow of Road Fund ........................................................................................... 15-6 Figure 15.2-2 Actions to be Taken During Emergency ......................................................... 15-10 Figure 15.2-3 Flow of Actions to be taken in Case of Fire ................................................... 15-10 Figure 15.2-4 Flow of Actions to be taken in Case of Traffic Accident, Falling Object and Vehicle
Breakdown ...................................................................................................... 15-11 Figure 16.2-1 Project Overview .............................................................................................. 16-9 Figure 16.2-2 Typical Cross-Section ..................................................................................... 16-10 Figure 16.2-3 Survey and Sampling Points ........................................................................... 16-22 Figure 16.2-4 Locations of Soil Sampling Point for Tunnel Portal ....................................... 16-26 Figure 16.2-5 Locations of Soil Sampling Point ................................................................... 16-26 Figure 16.2-6 Location Map of the Nearest National Park and the Project Site ................... 16-30 Figure 16.2-7 Location of Community Forest Zone ............................................................. 16-33 Figure 16.2-8 Location Map of Basuki Pond ........................................................................ 16-39 Figure 16.3-1 Districts included in the Project Affected Area............................................... 16-71 Figure 16.3-2 Declared ROW for the SD Road Sections ...................................................... 16-75 Figure 16.3-3 Land Acquisition Process (Based on land Acquisition Act 1977) .................. 16-80 Figure 16.3-4 Image of Policy Gap and RAP ........................................................................ 16-84 Figure 16.3-5 Proposed Organization Framework for RAP Implementation ........................ 16-95 Figure 18.1-1 Estimated Construction Schedule (Critical Path) ............................................. 18-1

xix
Figure 18.1-2 Plan of Section 3, Tunnel and Section 4 ........................................................... 18-1 Figure 18.5-1 Material Source and Disposal site .................................................................... 18-6 Figure 20.4-1 Project Implementation Organization Structure ............................................... 20-2 Figure 20.4-2 Project Management Unit Organization Chart ................................................. 20-2 Figure 20.4-3 Tunnel Management Unit Organization Chart .................................................. 20-3 Figure 21.1-1 Work flow of Economic Evaluation ................................................................. 21-1 Figure 22.6-1 Facilities along National Highway ................................................................... 22-4 Figure 22.6-2 Outline of Sinkuzakai Tunnel ........................................................................... 22-5 Figure 22.6-3 Cutting Face of Shied Machine ........................................................................ 22-6 Figure 22.6-4 Control Room ................................................................................................... 22-6

xx
List of Tables
Table 1.5-1 Study Schedule ....................................................................................................... 1-5 Table 3.1-1 Land Transport of SAARC Countries .................................................................... 3-1 Table 3.1-2 Summary Road Length in Nepal ............................................................................ 3-2 Table 3.1-3 Length of Strategic Road Network (SRN) ............................................................. 3-2 Table 3.1-4 Railway Line in Nepal ............................................................................................ 3-4 Table 3.2-1 Aviation Safety Facilities Provided by Airport in Nepal ........................................ 3-5 Table 3.3-1 Road Condition by Road Classification in Nepal .................................................. 3-6 Table 4.1-1 Population of Nepal ................................................................................................ 4-1 Table 4.1-2 Company by Investment of Japan .......................................................................... 4-8 Table 4.1-3 Transport Mode for Trade .................................................................................... 4-10 Table 4.1-4 Number of Vehicle Registered ............................................................................. 4-10 Table 4.2-1 List of Major Earthquakes Occurred in the 20th & 21st Century ........................ 4-17 Table 5.1-1 Outline of Improvement Plans of Previous Survey ................................................ 5-1 Table 5.3-1 Review Results of Components of Previous Survey .............................................. 5-5 Table 6.1-1 Description of Traffic Survey ................................................................................. 6-1 Table 6.2-1 Equivalency Factors in Terms of PCU ................................................................... 6-5 Table 6.2-2 Summary of Traffic Count Survey on Weekday .................................................... 6-5 Table 6.2-3 Summary of Cross Section Traffic Volume on Weekday at Dhulikhel Intersection 6-
8 Table 6.2-4 Summary of Daily Traffic Count by Direction at Dhulikhel Intersection .............. 6-9 Table 6.2-5 Share of Heavy Vehicle at Five Survey Stations .................................................. 6-13 Table 6.2-6 Share of Heavy Vehicle Excluding Motorcycle at Five Survey Stations ............. 6-13 Table 6.2-7 Share of Heavy Vehicle on Cross Section at Dhulikhel Intersection ................... 6-15 Table 6.2-8 Share of Heavy Vehicle Excluding Motor cycle on Cross Section at Dhulikhel
Intersection ....................................................................................................... 6-16 Table 6.2-9 Share of Light Vehicle Traffic Volume by Direction at Dhulikhel Intersection ... 6-17 Table 6.2-10 Share of Heavy Vehicle Traffic Volume by Direction at Dhulikhel Intersection 6-18 Table 6.2-11 Share of Day- Night Time Traffic Volume ......................................................... 6-20 Table 6.2-12 Share of Day- Night Time Traffic Volume on Cross Section at Dhulikhel Intersection
.......................................................................................................................... 6-20 Table 6.2-13 Share of Day- Night Time Traffic Volume by Direction at Dhulikhel Intersection 6-
20 Table 6.2-14 Traffic Volume Comparison at Sta.3 Sanga........................................................ 6-21 Table 6.2-15 Rate of Large Size Vehicle Traffic Excluding Motorcycle at Sta.3 Sanga ......... 6-22 Table 6.3-1 Result of Spot Travel Speed Survey ..................................................................... 6-23 Table 6.3-2 Travel Time Survey Result ................................................................................... 6-27 Table 6.4-1 OD Zoning Code .................................................................................................. 6-28 Table 6.4-2 Detail Data of Purpose of Trip by All Type of Vehicle on Weekday .................... 6-29 Table 6.4-3 Detail Data of Purpose of Trip by All Type of Vehicle on Holiday ...................... 6-30 Table 6.4-4 Detail Data of Average Number of Passengers by Type of Vehicle on Weekday 6-31 Table 6.4-5 Detail Data of Average Number of Passengers by Type of Vehicle on Holiday .. 6-31 Table 6.4-6 Average Loading Weight of Heavy Truck on Weekday ...................................... 6-33 Table 6.4-7 Average Loading Weight of Heavy Truck on Holiday ........................................ 6-33 Table 6.4-8 Origin-Destination Matrix of All Type Vehicles on Weekday .............................. 6-35 Table 6.4-9 Origin-Destination Matrix of All Type Vehicles on Holiday ................................ 6-35 Table 6.4-10 Origin-Destination Matrix of Passenger Car on Weekday ................................. 6-39 Table 6.4-11 Origin-Destination Matrix of Passenger Car on Holiday ................................... 6-39 Table 6.4-12 Origin-Destination Matrix of Bus on Weekday .................................................. 6-42 Table 6.4-13 Origin-Destination Matrix of Bus on Holiday ................................................... 6-42 Table 6.4-14 Origin-Destination Matrix of Truck on Weekday ............................................... 6-45 Table 6.4-15 Origin-Destination Matrix of Truck on Holiday ................................................ 6-45 Table 6.5-1 Ratio of Loading Truck and Empty Truck ........................................................... 6-48 Table 6.5-2 Average Gross Vehicle Load ............................................................................... 6-48

xxi
Table 6.6-1 Result of Vehicle Emission Gas Test .................................................................... 6-51 Table 6.7-1 Summary of Annual Variation of Traffic Volume at SD Road (weekday) ........... 6-53 Table 7.2-1 Framework of Population ....................................................................................... 7-1 Table 7.2-2 Framework of GDP ................................................................................................ 7-1 Table 7.2-3 Outline of Panchkhal SEZ ...................................................................................... 7-3 Table 7.3-1 Past Population and Traffic Volume ....................................................................... 7-4 Table 7.3-2 Future Passenger Vehicle Growth Rate .................................................................. 7-5 Table 7.3-3 Past GDP and Traffic Volume................................................................................. 7-5 Table 7.3-4 Future Freight Vehicle Growth Rate ...................................................................... 7-6 Table 7.4-1 Time Required Between Kathmandu and The Indian Border .............................. 7-11 Table 7.5-1 Traffic Growth Rate of SD Road Section ............................................................. 7-11 Table 7.5-2 Seasonal Variation Factors ................................................................................... 7-11 Table 7.5-3 Annual Average Daily Traffic in 2017 ................................................................. 7-12 Table 7.5-4 Benefit Amount and Toll Fee of Sanga Tunnel .................................................... 7-12 Table 7.5-5 Tunnel utilization Ratio for Total Traffic of Sanga Section ................................. 7-13 Table 7.5-6 Traffic Volume from The Chinese Border in 2017 (AADT) ................................ 7-14 Table 7.5-7 Traffic Volume to Change Route to Sindhuli Road in 2017 (AADT) .................. 7-14 Table 7.5-8 Future Traffic Volume by Road Section .............................................................. 7-14 Table 8.1-1 Scope of the Survey ................................................................................................ 8-1 Table 8.2-1 List of Survey Items ............................................................................................... 8-4 Table 8.2-2 Outline of the Drilling ............................................................................................ 8-6 Table 8.2-3 Outline of Electrical Resistance Tomography ........................................................ 8-6 Table 8.2-4 List of Geo-Technical Survey and Location ........................................................... 8-7 Table 8.2-5 Soil Test Conducted Quantity list ........................................................................... 8-7 Table 8.2-6 Relationship between P-wave and Rock Condition ............................................. 8-13 Table 8.2-7 Result of Soil Test ................................................................................................ 8-13 Table 9.1-1 List of Previous Projects Relevant to this Project .................................................. 9-1 Table 9.2-1 Road Classification, Terrain Conditions, and Designed Speed .............................. 9-2 Table 9.2-2 Geometric Condition (Asian Highway Standard) .................................................. 9-2 Table 10.6-1 Comparative Study of Alternative Route ........................................................... 10-5 Table 10.7-1 Comparative Study of Alternative Route ........................................................... 10-7 Table 11.2-1 List of Applied Japanese Standards for Tunnel Design ...................................... 11-1 Table 11.2-2 Geometric Condition (Tunnel Design) ............................................................... 11-2 Table 11.2-3 Rock Mass Classification System ...................................................................... 11-4 Table 11.2-4 Standard Support Patterns for Two-Lane Tunnels .............................................. 11-5 Table 11.3-1 Classification and Characteristics of Standard Excavation Method ................. 11-13 Table 11.6-1 Facilities to be Installed Tunnel ........................................................................ 11-17 Table 11.6-2 Design Condition (Ventilation Facility) ........................................................... 11-18 Table 11.6-3 Design Traffic Capacity .................................................................................... 11-19 Table 11.6-4 Design Traffic Volume per Hour ...................................................................... 11-19 Table 11.6-5 Design Values for CO and Visibility ................................................................ 11-20 Table 11.6-6 Basic Emission Factors..................................................................................... 11-20 Table 11.6-7 Required Air Volume of Outbound Tunnel ....................................................... 11-21 Table 11.6-8 Required Air Volume of Inbound Tunnel ......................................................... 11-21 Table 11.6-9 Natural Air Volume ........................................................................................... 11-21 Table 11.6-10 Number of Jet Fan of Outbound Tunnel ......................................................... 11-22 Table 11.6-11 Standard Specification of Jet Fan (JFX -1250) ............................................... 11-23 Table 11.6-12 Design Condition (Tunnel Lighting) .............................................................. 11-25 Table 11.6-13 Number of Interior Lighting and Luminance of Road Surface ...................... 11-25 Table 11.6-14 Number of Entrance Lighting and Luminance of Road Surface .................... 11-26 Table 11.6-15 Installation Standard of Emergency Facilities ................................................ 11-27 Table 11.6-16 Emergency Facilities Installed in Sanga Tunnel ............................................. 11-34 Table 11.6-17 Description of Tunnel Management Office and Electric Room ..................... 11-37 Table 11.6-18 Load Capacity for Tunnel ............................................................................... 11-39 Table 11.6-19 Load Capacity for Back-up Generator ........................................................... 11-39

xxii
Table 12.4-1 Scopes of Service Tracks .................................................................................... 12-4 Table 12.5-1 List of Objective Intersections ........................................................................... 12-5 Table 12.5-2 Intersection Types to be Applied ........................................................................ 12-6 Table 12.6-1 Axle Load Factors .............................................................................................. 12-7 Table 12.6-2 Cumulative Daily Traffic Volume of Target Period ............................................ 12-7 Table 12.6-3 Daily ESAL of Performance Period ................................................................... 12-7 Table 12.6-4 Total ESAL for Each Lane (Traffic Load:W18) ................................................. 12-8 Table 12.6-5 CBR Values ........................................................................................................ 12-8 Table 12.6-6 Design Inputs.................................................................................................... 12-10 Table 12.6-7 Results of Pavement Design on Each Section of the Main Road ..................... 12-11 Table 12.6-8 Results of Pavement Design on Each Section of the Service Tracks ............... 12-11 Table 12.7-1 Location, Type and Dimension of Cross Drainage ........................................... 12-13 Table 12.8-1 Identified Existing Bridges and Outline of each Bridge .................................. 12-15 Table 12.8-2 Comparison of Applicable Structures ............................................................... 12-16 Table 12.8-3 Design Discharge and Freeboard ..................................................................... 12-17 Table 12.8-4 Determined Dimension for Bridge No.1 (Sipadol Khola) ................................ 12-18 Table 12.8-5 Determined Dimension for Bridge No.2 (Bhikteswor Khola) ......................... 12-19 Table 12.8-6 Determined Dimension for Bridge No.3 (Punyamati Khola) ........................... 12-20 Table 12.8-7 Determined Dimension for Bridge No.4 (Chandeshori Khola) ........................ 12-21 Table 12.8-8 Outline of Culverts Applied ............................................................................. 12-22 Table 12.9-1 Locations of Pedestrian Bridges ....................................................................... 12-23 Table 12.14-1 Locations of Bus Laybys ................................................................................ 12-27 Table 13.3-1 Comparison list of AGF Method ........................................................................ 13-4 Table 14.2-1 Number of Staffs of MOPIT .............................................................................. 14-1 Table 14.3-1 Annual Budget of DOR ...................................................................................... 14-4 Table 14.3-2 Personnel Composition of DOR ......................................................................... 14-6 Table 14.3-3 Donor Funded Major Projects Implemented by DOR ........................................ 14-8 Table 15.2-1 Cost to be Borne by Nepalese Side for Road O&M ........................................... 15-5 Table 15.2-2 Inspection Items ................................................................................................. 15-7 Table 15.2-3 Routine Maintenance Activities ......................................................................... 15-8 Table 15.2-4 Function and Size of Tunnel Management Office ............................................ 15-12 Table 15.2-5 Equipment Needed for Tunnel O&M ............................................................... 15-12 Table 15.2-6 Toll Rates in Nepal ........................................................................................... 15-14 Table 15.2-7 Comparison of Estimated Toll revenue and O&M Cost ................................... 15-15 Table 16.1-1 Summary of the PAPs in former survey ............................................................. 16-4 Table 16.1-2 Required Land Acquisition ................................................................................. 16-5 Table 16.1-3 Resettlement Needed House/Structures ............................................................. 16-5 Table 16.1-4 Comparison of the Project Affected Households ............................................... 16-7 Table 16.1-5 Comparison of the Project Affected Persons ...................................................... 16-8 Table 16.1-6 Resettlement Needed House/Structures ............................................................. 16-8 Table 16.2-1 Road Standard Applied ..................................................................................... 16-10 Table 16.2-2 Outline of Tunnel Design ................................................................................. 16-11 Table 16.2-3 Air Quality Standards of Nepal (Environmental Standard) ............................. 16-12 Table 16.2-4 Water Quality Standards of Nepal .................................................................... 16-13 Table 16.2-5 Noise Standards of Nepal ................................................................................. 16-13 Table 16.2-6 Scoping Results ................................................................................................ 16-15 Table 16.2-7 Outline of TOR for EIA Survey ....................................................................... 16-19 Table 16.2-8 Result of Air Quality Analysis.......................................................................... 16-23 Table 16.2-9 Result of Water Quality Analysis ..................................................................... 16-23 Table 16.2-10 Sound Pressure Level of West and East Portal ............................................... 16-24 Table 16.2-11 Prediction Level of LAeq at the Point between Sanga to Banepa .................. 16-25 Table 16.2-12 Test Result of Soil Test ................................................................................... 16-28 Table 16.2-13 Test Result of Rock Core Test ........................................................................ 16-29 Table 16.2-14 List of NTFP found around Suryamod Community Forest and along the Project
Area ................................................................................................................ 16-31

xxiii
Table 16.2-15 List of Faunal Species reported in and around the Suryamod Community Forest ........................................................................................................................ 16-31
Table 16.2-16 List of Major Birds Species reported in and around Suryamod Community Forest and along the Project Area .............................................................................. 16-32
Table 16.2-17 Road-side Trees Affected ............................................................................... 16-33 Table 16.2-18 The List of Cutting Tree at Suryamode Perunge Community Forest ............. 16-34 Table 16.2-19 Tree Species around Community Forest ........................................................ 16-34 Table 16.2-20 Private Trees to be Cut at Western Portal ....................................................... 16-35 Table 16.2-21 Private Trees to be Cut at Eastern Portal ........................................................ 16-35 Table 16.2-22 Summary of Total Trees to be cut by the Project ........................................... 16-35 Table 16.2-23 Socio economic status of Sanga Pass business owners .................................. 16-37 Table 16.2-24 Water Level around the Tunnel Area .............................................................. 16-38 Table 16.2-25 Results of EIA Survey .................................................................................... 16-41 Table 16.2-26 Significant Impact .......................................................................................... 16-44 Table 16.2-27 Substantial or Middle Impact ......................................................................... 16-45 Table 16.2-28 Impacts and Mitigation Measures .................................................................. 16-48 Table 16.2-29 Funding and Responsible Organization for the Implementation of EMP ...... 16-57 Table 16.2-30 Estimated EMU cost of the Project ................................................................ 16-57 Table 16.2-31 Draft Environmental Monitoring Form .......................................................... 16-57 Table 16.2-32 Monitoring Plan for Beneficial Impacts ......................................................... 16-61 Table 16.2-33 Overview of the 1st Stakeholder Meeting ...................................................... 16-62 Table 16.2-34 Summary of the 1st Stakeholder Meeting ...................................................... 16-62 Table 16.2-35 Summary of the First Stakeholder Meeting ................................................... 16-63 Table 16.2-36 Summary of the Stakeholder Meeting in Tunnel Section ............................... 16-63 Table 16.2-37 Summary of the Second Stakeholder Meeting at Bhaktapur .......................... 16-64 Table 16.2-38 Summary of the Second Stakeholder Meeting at Banepa .............................. 16-64 Table 16.2-39 Summary of the second Stakeholder Meeting at Bhaktapur .......................... 16-65 Table 16.2-40 Summary of the second Stakeholder Meeting at Banepa, Kavrepalanchok ... 16-65 Table 16.2-41 Overview of the Focus Group Meeting .......................................................... 16-66 Table 16.2-42 Summary of Public Consultation/Meetings ................................................... 16-67 Table 16.3-1 The Municipality included in the Project Affected Area .................................. 16-70 Table 16.3-2 Summary of the PAPs ....................................................................................... 16-72 Table 16.3-3 Summary of the PAPs ....................................................................................... 16-72 Table 16.3-4 Required Land Acquisition ............................................................................... 16-73 Table 16.3-5 Resettlement Needed for Houses/Structures .................................................... 16-73 Table 16.3-6 Declaration on ROW of the Project ................................................................. 16-75 Table 16.3-7 Supreme Court Cases ....................................................................................... 16-75 Table 16.3-8 Distribution of Project Affected Households ................................................... 16-76 Table 16.3-9 Population Size by Age Group ......................................................................... 16-76 Table 16.3-10 Ethnic Composition of Affected Households (HHs) ...................................... 16-77 Table 16.3-11 Occupational Status of Surveyed population .................................................. 16-77 Table 16.3-12 Educational Status of the Project Affected Population ................................... 16-77 Table 16.3-13 Status of Skill Persons of Surveyed Households ............................................ 16-78 Table 16.3-14 Average Annual Income Range of the Surveyed Households ........................ 16-78 Table 16.3-15 Food Sufficiency Status among Project Affected Areas ................................. 16-78 Table 16.3-16 Fulfillment of Food Deficiency ...................................................................... 16-78 Table 16.3-17 AP’s Acceptance / Impression of the Project ................................................. 16-79 Table 16.3-18 Perception about Compensation Modes ......................................................... 16-79 Table 16.3-19 JICA's Policy on Involuntary Resettlement .................................................... 16-81 Table 16.3-20 Policy Gap Analysis between JICA Guidelines and Nepali Country System 16-84 Table 16.3-21 Entitlement Matrix ......................................................................................... 16-92 Table 16.3-22 Tentative Implementation Schedule for RAP ............................................... 16-100 Table 16.3-23 Key Steps and Process of Cadastral Survey ................................................. 16-101 Table 16.3-24 Estimated Compensation for Private Land ................................................... 16-102 Table 16.3-25 Estimated Compensation for Affected Structures ........................................ 16-102

xxiv
Table 16.3-26 Housing Displacement Allowances .............................................................. 16-102 Table 16.3-27 Business Disruption Allowances .................................................................. 16-103 Table 16.3-28 Support Allowances for Vulnerable Households .......................................... 16-103 Table 16.3-29 Estimated Cost for RAP implementation ..................................................... 16-103 Table 16.3-30 Summary of Cost for RAP Implementation ................................................. 16-104 Table 16.3-31 Internal Monitoring Items for Resettlement Activities ................................. 16-105 Table 16.3-32 External Monitoring Items for Resettlement Activities ................................ 16-108 Table 17.1-1 Draft Total MM of Services ............................................................................... 17-1 Table 17.2-1 Draft MM Schedule of Detailed Design ............................................................. 17-1 Table 17.3-1 Draft MM Schedule of Tender Assistance .......................................................... 17-1 Table 17.4-1 Draft MM Schedule of Construction Supervision .............................................. 17-2 Table 17.5-1 Draft MM Schedule of Capacity Development .................................................. 17-2 Table 18.2-1 List of Major Material ........................................................................................ 18-2 Table 18.3-1 List of Major Equipment .................................................................................... 18-3 Table 18.5-1 Material Sources Locations ................................................................................ 18-5 Table 18.5-2 Candidate Soil Disposal Sites............................................................................. 18-6 Table 20.4-1 Roles an Function of Unit/Staff on Project Management Office ....................... 20-3 Table 20.4-2 Roles an Function of Unit/Staff on Tunnel Management Office ........................ 20-4 Table 20.7-1 Risk Matrix ......................................................................................................... 20-5 Table 21.1-1 Indicators of Economic Evaluation .................................................................... 21-2 Table 21.1-2 Implementation Schedule and Economic Cost ................................................... 21-3 Table 21.1-3 Operation and Maintenance Costs ...................................................................... 21-3 Table 21.1-4 Unit VOC in 2017 .............................................................................................. 21-4 Table 21.1-5 Unit VOC in 2017 .............................................................................................. 21-5 Table 21.1-6 Unit TTC in 2017 ............................................................................................... 21-6 Table 21.1-7 Economic Benefit ............................................................................................... 21-7 Table 21.1-8 Result of Economic Analysis ............................................................................. 21-7 Table 21.1-9 Project Sensitivity .............................................................................................. 21-7 Table 21.1-10 Economic Analysis ........................................................................................... 21-7 Table 21.3-1 Operation and Effect Indicators ......................................................................... 21-8 Table 21.3-2 Annual Average Daily Traffic ............................................................................ 21-9 Table 21.3-3 Time Saving (Annual value) (Light Vehicle) ..................................................... 21-9 Table 21.3-4 Time Saving (Day value) (Light Vehicle) .......................................................... 21-9 Table 21.3-5 Vehicle Operation Cost Saving .......................................................................... 21-9 Table 21.3-6 Increase of Average Travel Speed .................................................................... 21-10 Table 22.4-1 List of Participants ............................................................................................. 22-2 Table 22.5-1 Outline of Program ............................................................................................. 22-3 Table 22.6-1 List of Presentations and Lectures ...................................................................... 22-7

xxv
Acronyms and Abbreviations
AADT Annual Average Daily Traffic AASHTO American Association of State Highway and Transportation Officials ADB Asian Development Bank ADT Average Daily Traffic AGF All Ground Fastening AHSC Arniko Highway Struggle Committee AIDS Acquired Immune Deficiency Syndrome ASR Airport Surveillance Radar BOD Biological Oxygen Demand C/L Compass Locater CBR California Bearing Ratio CBR Cost Benefit Ratio CBS Central Bureau of Statistics CCTV Closed-Circuit Television CDC Compensation Determination Committee CDO Chief District Officer CFUG Community Forestry User Group CPI Consumer Price Index CRRD Central Regional Road Directorate CSC Construction Supervision Consultant D&B Drill and Blasting DBH Diameter at Breast Height DDC District Development Committee DDG Deputy Director General DG Director General DMG Department of Mines and Geology, Ministry of Geology and Mines DOF Department of Forestry
DOLIDAR Department of Local Infrastructure Development and Agricultural Roads
DOR Department of Roads DPR Development Project Report DR Discount Rate DUDBC Department of Urban Development and Building Construction DWIDP Department of Water Induced Disaster Prevention EIA Environmental Impact Assessment EIRR Economic Internal Rate of Return EMoP Environmental Monitoring Plan EMP Environmental Management Plan EOI Expression of Interest

xxvi
Acronyms and Abbreviations
EPA Environmental Protection Act EPR Environmental Protection Rule ERRD East Regional Road Directorate ERT Electrical Resistance Tomography ESAL Equivalent Single Axle Load ESMF Environmental and Social Management Framework report FCB Foreign Cooperation Branch FDI Foreign Direct Investment FGM Focus Group Meeting FILM Flat Insulated Lining Method FIRR Financial Internal Rate of Return FWRRD Far-western Regional Road Directorate FY Financial Year GDP Gross Domestic Product GESU Geo-Environment and Social Unit GOJ Government of Japan GON Government of Nepal GRC Grievance Redress Committee GRM Grievance Redress Mechanism HF High Frequency HHs Housesholds HIV Human Immunodeficiency Virus HMIS Highway Management Information System ICB International Competitive Bidding ICD Inland Container Deport IEE Initial Environmental Examination ILS Instrument Landing System IOL Inventory of Loss IR Involuntary Resettlement IRP Income Restoration Program JICA Japan International Cooperation Agency KB Road Kathmandu-Bhaktapur Road KBRRP Kathmandu-Bhaktapur Road Rehabilitation Project KMC Kathmandu Metropolitan City KTM Kathmandu KU Kathmandu University KVDA Kathmandu Valley Development Authority LA Land Acquisition

xxvii
Acronyms and Abbreviations
LCF Local Consultative Forum LRN Local Road Network MEX Metroporitan Expressway Company Limited MLIT Ministry of Land, Infrastructure, Transport and Tourism (Japan) MM Man-Month MOE Ministry of Energy MOF Ministry of Forest MOFSC Ministry of Forest and Soil Conservation MOI Ministry of Industry MOPE Ministry of Population and Environment MOPIT Ministry of Physical Infrastructure and Transport MOSTE Ministry of Science Technology and Environment MWRRD Mid-western Regional Road Directorate NATM New Austrian Tunneling Method NDB Non Directional Radio Beacon NEA Nepal Electricity Authority NEXCO Nippon Expressway Research Institute Company NPC National Planning Commission NPR Nepal Rupees NPV Net Present Value NRC Nepal Railways Corporation Ltd NRS Nepal Road Standard NTA Nepal Tunneling Association NVC National Vigilance Center OD Survey Origin Destination Survey ORR Outer Ring Road PAF Project Affected Families PAP Project Affected People/Person PCU Passenger Car Unit PIC Project In-Charge PM Project Manager PMU Project Management Unit PPP Private Public Partnership RAP Resettlement Action Plan RBN Roads Board Nepal RCS Replacement Cost Survey RD Regional Director ROD Rock Quality Designation

xxviii
Acronyms and Abbreviations
ROW Right of Way RRD Regional Road Directorate RSSDU Road Sector Skill Development Unit SAARC South Asia Association for Regional Cooperation SAP Severely Affected Person SD Scoping Document SD Road Suryabinayak-Dhulikhel Road SEZ Special Economic Zone SHM Stakeholder Meeting SIC Sengan Information Center SN Structural number SPAF Seriously Project Affected Family SPT Standard Penetration Test SRN Strategic Road Network STD Sexually Transmitted Disease TIA Tribhuvan International Airport TOR Terms of Reference TRP Tribhuvan Rajpath TSS Total Suspended Solids TTC Travel Time Cost V/D Very High Frequency Omnidirectional Radio Range VAT Value Added Tax VDC Village Development Committee VFR Visual Flight Rules VHF Very High Frequency VOC Vehicle Operation Cost WB World Bank WRRD West Regional Road Directorate

CHAPTER 1
INTRODUCTION


1-1
CHAPTER 1 INTRODUCTION
1.1 BACKGROUND
Nepal is a landlocked mountainous country, where 80% of the country land is occupied by mountains. Transport system of the country highly relies on land transport as about 90% of the passenger and cargo goods are transported by roads. Over the past 10 years, the Gross Domestic Product (GDP) of Nepal has seen constant annual growth of about 4%. The number of domestic vehicle registration has doubled in the past five years. The trade transactions, mostly by land transport, have seen increase on both export and import quantities. The figures for fiscal year 2004 to 2012 indicate an increase of 1.7 times and 3.2 times on export and import goods respectively. It is not exaggeration to say that the road network is one of the factors that has been playing a vital role for such achievement. Among such roads, the role of approx. 1,750 km long Midhill Highway, running from East to West, almost bisecting the country at the middle, and the roads that connect Kathmandu with the low-land southern Terai region is particularly considered to be high. These roads in particular are strategically important from the connectivity point of view, as it burdens about 60% of trade with neighboring country, India.
Figure 1.1-1 Major Road Network
The latter roads (roads connecting Kathmandu with the low-land southern Terai region) consist of route passing the West-side and another route going through the East-side of Kathmandu as are shown in Figure 1.1-1. Tribhuvan Highway and Prithvi Highway in combination with East-west Highway comprise the west-side route. Arniko Highway and Sindhuli Road in combination with East-west Highway comprise the East-side route. With regards to the West-side route, improvement of alignment at Nagdhunga Pass, which is one of the most critical sections along the route, is being studied under a Japanese ODA Loan funded project, “Nagdhunga Tunnel Construction Project”, which was approved in December 2016. The Project aims to provide a tunnel under the Pass to

1-2
eliminate the bottleneck and secure safe and smooth traffic along the said section. The East-side route is composed of Kathmandu-Bhaktapur Road (approx. 9 km section, opened to traffic in 2011 after going through widening to 4 lanes under the Japanese Grant Aid), Suryabinayak-Dhulikhel Road (approx. 16 km section, 2-lane road) and Sindhuli Road (approx. 160 km section, opened to traffic in 2015 after completion of the Project assisted by Japanese Grant Aid). Of the sections, Suryabinayak - Dhulikhel section, with its existing 2-lane is seen to be running out of traffic capacity due to two major causes. The first cause is the rapid increase of traffic demand inside the capital/valley. And, the second cause is the possibility of increasing traffic inflows to the Kathmandu Valley in the future due to progress of Sindhuli road construction and other arterial road development in regional areas. Under such circumstances, the Government of Nepal (GON) requested for the Grant Aid assistance to the Government of Japan (GOJ) to widen the existing 2-lane section between Suryabinayak-Dhulikhel into 4 lanes for improving the situation such that it will contribute to the economic development of the country.
Following the request, Japan International Cooperation Agency (JICA) carried out a preparatory survey, but after the completion of the Survey, a need for undertaking an additional survey for appraisal of the Project for implementing through Japanese ODA Loan emerged. The Additional Survey aims to review the contents of the said preparatory survey for evaluation of the Project’s viability. The review will include study of an alternative plan at Sanga area, study of project implementation plan (including project cost estimation) and additional survey on environmental and social considerations, among others.
1.2 PROJECT OUTLINE
1.2.1 Project Title
The Project for Improvement of Suryabinayak-Dhulikhel Road (SD Road)
1.2.2 Project Objective
The objective of the Project is widening a stretch of 16 km from Suryabinayak to Dhulikhel, thereby contributing to the improvement of traffic condition in Kathmandu valley of a stable and efficient road network and to the improvement of the local economy including improvement of access from Kathmandu to the Eastern Terai region.
1.2.3 Project Features
The main features of the Project include, but not limited to, Widening of arterials for a stretch of about 16 km between Suryabinayak and Dhulikhel, Provision of service tracks, and Provision of road ancillaries
1.2.4 Project Area
An approx. 16 km section on arterial road between Suryabinayak and Dhulikhel in Bhaktapur and Kavrepalanchowk Districts.

1-3
1.2.5 Relevant Authorities/Organizations
Department of Roads (DOR), Ministry of Physical Infrastructure and Transport (MOPIT)
1.2.6 Relevant Projects Funded by Japan
Major projects funded by Japan and relevant to this Project include;
・ODA Loan: Nagdhunga Tunnel Construction Project (on-going since 2016)
・Grant Aid: The Project for the Improvement of Kathmandu-Bhaktapur Road (2008-2011)
・Grant Aid: The Project for Construction of Sindhuli Road (1996 - 2015)
1.3 SCOPE OF THE STUDY
The scope of the Study is to carry out review of the contents and components proposed in the previous preparatory survey and prepare and compile information. The review of the contents mainly consists of, but not limited to;
(i) Review of improvement plans proposed in the preparatory survey,
(ii) Additional study for re-alignment at Sanga Pass area including study on possibility of tunnel provision under Sanga Pass as an alternative for the Bypass concept proposed in the previous survey,
(iii) Additional survey for environmental and social considerations,
(iv) Traffic survey,
(v) Applicability of advanced technologies.
1.4 STUDY OBJECTIVES
The main objectives of the Study are to examine the improvement plans of Sanga pass focusing on the possibility of tunneling as update plan for previous study by JICA. The reason for considering tunneling at Sanga pass is to reduce the influence of social consideration such as resettlement of inhabitat and to improve resistance to natural disasters based on the results of the previous survey. Addressing these two tasks is the important viewpoint of this survey.
In addition, the Study should be carried out various tasks to prepare and compile all necessary data/information for JICA appraisal of the “Suryabinayak-Dhulikhel Road Improvement Project”. The study will basically include, but not be limited to the following items;
(i) Outline design of the Components,
(ii) Project cost estimation,
(iii) Implementation schedule,
(iv) Implementation method (design, procurement, construction) of the Project,

1-4
(v) Project executing organization, operation and maintenance management system,
(vi) Environmental and social considerations.
1.5 STUDY SCHEDULE
The contract period is from 26 July 2017. Completion is scheduled at 26 August 2018. The expected timing and period of each study item is indicated in Table 1.5-1.

1-5
Table 1.5-1 Study Schedule

1-6
1.6 STUDY TEAM
The Study is carried out by the team organized by JICA. The JICA Study Team is a joint venture of CTI Engineering International Co., Ltd. (CTII) and CTI Engineering Co., Ltd. (CTIE) with CTII as the prime consultant. The team is composed of 12 personnel and 2 assistants.
The Study is being implemented in close coordination with MOPIT/DOR, the implementing authority. The agencies consulted with including the potential agencies that the Team looks forward to for consultation are as mentioned below;
(i) Department of Mines and Geology, Ministry of Geology and Mines (DMG),
(ii) Ministry of Population and Environment (MOPE),
(iii) Ministry of Energy (MOEN),
(iv) Nepal Electricity Authority (NEA),
(v) Roads Board Nepal (RBN),
(vi) Nepal Tunneling Association (NTA),
(vii) District and Village Development Committees, among others

CHAPTER 2
BACKGROUND AND NECESSITY OF THE STUDY


2-1
CHAPTER 2 BACKGROUND AND NECESSITY OF THE STUDY
2.1 BACKGROUND OF THE STUDY
Following the request from GON, JICA carried out a preparatory survey under the Grant Aid assistance to widen the existing 2-lane section between Suryabinayak-Dhulikhel into 4 lanes. After the completion of the Survey, a need for an additional survey emerged. One of the purposes of this additional survey is to prepare documents for appraisal of the Project for implementing under Japanese ODA Loan scheme. The Additional Survey aims to review the said contents shown in Section 1.3 for JICA appraisal of the Project.
2.2 CURRENT CONDITION OF EXISTING ROAD
The objective section of the Study starts at Suryabinayak, the end point of KB Road that was widened under the Japanese grant aid project. The start point is a 4-legged intersection controlled by traffic signal. The road to the north direction goes to Bhaktapur City, a densely built-up area. The road to the south goes to the Suryabinayak Hill. Major towns along the Study road are Bhaktapur, Suryabinayak, Jagati, Nalinchowk, Sanga, Banepa and Dhulikhel. The topography, land use pattern, road geometry and set back condition of houses between these towns vary with each other. Therefore, the condition of the existing road is summarized hereunder by dividing the Study road into Six sections, Five sections between these towns and one between East-end and West-end of Banepa.
Figure 2.2-1 Summary for Current Condition of Existing Road
NO 1 2 3 4 5 6
Section Section 1 Section 2 Section 3~4 Section 5 Section 6 Section 7~10
Suryabinayak (Start
Point)Jagati(Km1+860)
Nalinchowk
(Km4+830)
Sanga pass
(Km6+580)
Banepa Bazaar (West
Banepa)(Km10+20)
East Banepa
(Km12+200)
~Jagati(Km1+860)~Nalinchowk
(Km4+830)
~Sanga pass
(Km6+580)
~West Banepa
(Km10+020)
~East Banepa
(Km12+200)
~Dhulikhel
(Km14+920)
Geography,
Condition of
existing road
・Relatively flat
・8m wide asphalt
pavement
・Few gentle curves
・Inundation issue
during monsoon
・Flat to rolling with
undulations
・8m wide asphalt
pavement
・Maximun vertical
grade 5-6%
・Sharp curves
・Rolling, Mountainous
・Maximun vertical
grade over 7%
・Sharp curves with
hairpin curves
・Offen causing traffic
accidents, congection,
slope failure
・Rolling
・Moderate vertical
grade and horizontal
grade
・Valley area
・Vertical grade at
each side 3~4%
・No curves
・Inundation issue
during monsoon
・Flat, Rolling,
Mountainous
・Maximun vertical
grade 7%
・Sharp curves
Houses and
facilities with in
ROW
Mostly beyond ROW
except 5 or 6 houses
Several old houses and
few religious facilities
within ROW
Houses and shops
along both side
Many old houses on
both side within ROW
All houses but one are
beyond ROW
Mostly beyond ROW
Area

2-2
2.2.1 Suryabinayak (Start Point) to Jagati (Km1+860)
This section is a built-up area that extends almost up to the Sipadole river, that flows at about 200 m east from Jagati. The road is paved with asphalt and is about 8 m wide. The section is relatively flat with moderate undulations (vertical grades are almost flat). The horizontal alignment of this section is almost tangent except for few gentle curves. Excluding 5 or 6 houses in Jagati, the houses on both sides along the section align at 25 yards from the center of the existing road. There are altogether 5 locations where roads from north or south meet with the objective road forming intersections. Only one out of these 5 intersections are controlled with a traffic signal - all others are non-signalized.
The topography of this section is relatively flat in the east-west direction, but it is gently inclined towards the north in the north-south direction, as shown in Figure 2.2-2. The houses along the road on the south side (right side when looking towards Dhulikhel) are at the same level of the road. The houses on the left side are lower than the road elevation. Such sections are generally provided with retaining walls.
The section is provided with drainage facilities. Despite of it, a portion of road in Jagati often experience inundation during monsoon. The inundation can be attributed to insufficient capacity of the drainage facilities, as it not only burdens to drain road surface water but also the water and sewer from the abutting houses. This is further worsened by the lack of proper and timely maintenance of the facilities. As a temporary measure, DOR is currently providing a concrete u-ditch at the right side of the existing road (within the Right of Way: ROW) to alleviate, if not resolve the inundation issue.
(1) Elevation difference at Suryabinayak
(2) Inundation at Jagati (3) Installation of Temporary Drainage by DOR
Photo 2.2-1 Existing Condition between Suryabinayak and Jagati
2.2.2 Jagati (Km1+860) to Nalinchowk (Km4+830)
This section is a semi-built-up area. The road is provided with asphalt pavement and is about 8m wide. The topography of the section changes from flat to rolling with frequent undulations where vertical curves having a maximum grade of 5-6% are prominent. The horizontal alignment also gets more winding with sharp curves, some of which needs to be improved.
Figure 2.2-2 Topography of the Section
South SideNorth SideBanepa KTM

2-3
Both sides of the road are mainly rice fields. Houses are scattered rather than densely aligning along the section. Houses, relatively new ones, are located beyond 25 yards from the center of the existing road on either side. There are several houses within 25 yards from the road. This is significant particularly at Nalinchowk. Most of such houses are old ones. There are few religious facilities near Nalinchowk. These facilities include small shrines, religious stones and trees. All these facilities are within the ROW and will have to be relocated during widening.
This section is also inclined from the south toward the north, similar to the previous section but with steeper inclination. The existing road is observed to have cut slopes at the right side and fill slopes on the left side. Stone masonry walls for retaining the slopes at the fill side slopes are seen at several sections.
Drainage facilities for collecting and transporting road surface water at fill side are not provided and the water is drained out naturally. At cut slopes and along sections where the vertical grade is steep, stone masonry ditches are seen provided. Road surface water is collected, transported, crossed-over to the fill side and drained out naturally.
(1) Sharp curve (accident prone area)
(2) Typical Topography of the Section (left side low)
(3) Small shrine beside the Existing Road near Nalinchowk
Photo 2.2-2 Existing Condition between Jagati and Sanga
2.2.3 Nalinchowk (Km4+830) to Sanga pass (Km6+580)
The topography at Nalinchowk is rolling but it gets mountainous as the road approaches Sanga. Sanga Pass is the east boundary of Kathmandu Valley and has an altitude of about 1,525 m, approx. 125 m higher from its foot, Palanse.
The alignment between Nalinchowk and Sanga is moderate at the beginning, gets severe as it reaches Sanga area, and abruptly changes from the foot of Sanga Pass. Sharp curves with a couple of hairpin curves combined with vertical curves as steep as 7% continue up to the Pass. Its rough terrain and critical road geometry (alignment) is causing fatal traffic accidents, severe traffic congestions and, need not to mention, heavy environmental pollution of the area. To make the situation worse, the slopes of the section are very prone to disasters often causing traffic closure(s). The latest such closure was observed in 2016, It is reported that traffic came to a complete halt for several hours due to failure of slopes at several locations during monsoon season on August 27, 2015 (refer to picture (5) in Photo 2.2-3).
Left (North) side is low

2-4
Land use along the first half of the section is mainly rice field and farm lands. The second half of the section from Palanse to Sanga Pass is mainly natural mountain, with houses scattered here and there.
Landmarks of this area are the amusement park, Kathmandu Fun Valley in Palanse, almost at the foot of the mountain and a religious temple in the valley near Sanga pass and a bronze statue of Hindu Deity Lord Shiva, the tallest of its kind in the world. These landmarks attract significant number of people from Kathmandu and the nearby towns.
Other mentionable features are a shrine at the valley just prior to the Pass, a pond at the left side of the Pass, which was commonly used by locals of Sanga in old days but not anymore, and houses/shops along both sides of the road at the Pass.
Topography is inclined from south toward north, similar but further steeper than the previous sections. The existing road is observed to have cult slopes at the right side and fill slopes on the left side. Stone masonry walls for retaining the slopes at the fill side slopes are seen at several sections.
Drainage facilities for collecting and transporting road surface water at fill side are not provided and the water is drained naturally. At cut slopes and along sections where the vertical grade is steep, stone masonry ditch is provided. Road surface water is collected, transported, crossed-over to the fill side and drained naturally into the valley.
(1) Holy Tree and Houses at Nalinchowk
(2) A glimpse of Nalinchowk – Palanse Section
(3) A shrine in the Valley (left side) or existing road near
Sanga Pass
(4) Sharp Curve with Steep
Grade near Sanga Pass (5) Slope Failure at Sanga Pass
(27 August 2015) (6) Houses and Shops within
ROW at Sanga Pass
Photo 2.2-3 Condition of Existing Road between Nalinchowk and Sanga
2.2.4 Sanga Pass(Km6+580) to West Banepa (Km10+20)
Beyond Sanga Pass, the topography is not as rough as it is before the Pass. It changes from mountainous
Nalinchowk Palanse
Fun Valley

2-5
to rolling with moderate vertical grades and horizontal alignment and becomes almost flat and tangent before reaching the west verge of Banepa Bazaar.
The land use along the entire section is mostly rice field and farm lands. Density of houses along the roadside is higher for a certain distance beyond Sanga (extension of Sanga Community) and near Banepa. In between it is not so dense. There are many houses, mostly old, within 25 yards from the center of the existing road on both sides.
There is a pagoda type shrine at the right side of the road at about 500 m from Sanga Pass. This seems to be the only religious object in this section.
The topography of the first half is inclined from south toward north, but the inclination is not so significant. The topography of the other half of the section, slightly before reaching west verge of Banepa City is vice-versa (Refer to Photo 2.2-4(3)). Where, fill slopes are in the left side and cut slopes at the right in the first section, it is opposite in the latter section.
Drainage facilities are not provided at the fill side. Stone masonry ditches are provided at cut sides. Road surface drainage is treated by means of gravity (natural system), similarly as in previous sections.
(1) Pagoda Shrine beside the Road
(2) Topography Inclined towards north (left side)
(3) Change in Topography (Inclined towards south)
Photo 2.2-4 Condition of Existing Road between Sanga Pass and West Banepa
2.2.5 Banepa Bazaar (West Banepa (Km10+20) to East Banepa (Km12+200))
This section starts from Punyamati River and ends at Chandeshori River at east of Banepa Bazaar. Banepa is the second biggest town within the objective section of this Study. As signifies by the word ‘Bazaar’, this section is a highly built-up area with houses densely aligned at both sides of the road. All houses but one, are beyond 25 yards from the center of the existing road. Although there are no houses within the ROW, the existing road that has asphalt pavement is only about 8m wide. Recently, both sides of the main carriageway are observed to have paved for use as service tracks. However, the area is haphazardly used by trucks and jeeps stopping for (un)loading and parking purposes as before. Sidewalks are provided at both sides (near the houses) of the bazaar.
The center of the town is at the highest point and forms a crest with both the other ends. The vertical grades at each side are about 3-4%. The horizontal alignment is almost straight and has no curves. There are many roads connecting with the objective road, forming an intersection. However, none of these
Shrine

2-6
intersections have traffic signals. One at the center of the bazaar has a small statue/monument that works as a rotary for turning vehicles.
There is a relatively big bus terminal at the right side of the town that functions as a hub for passenger transports (buses, jeeps, taxis etc.) to neighboring villages/towns. Vehicles coming from and going into the terminal frequently hinder through traffics at the intersections connecting with the entrance and exit of the terminal for not being controlled with traffic signals.
Banepa is located at the lowest point. To be precisely, the lowest point is at the west end, near Punyamati River. Rain water running along the bazaar is deposited at this location often causing the area to submerge during monsoon. The locals say, the highest inundation submerged the road by almost about a meter. Major reasons that could be considered for the inundation are, but not limited to, i) the low elevation of the road, ii) soil/sand accumulation at Punyamati Bridge causing significant decrease of the cross section of the river channel, iii) discharge of sewer at Punyamati River, immediately downstream of the bridge, and iv) the narrow width of the river often causing backwater effect.
(1) 17m Long bridge at Punyamati River
(2) Inundates during Monsoon
(3) Houses mannerly align outside ROW
Photo 2.2-5 Condition of Existing Road between Banepa Bazaar
2.2.6 East Banepa (Km12+200) to Dhulikhel (Km14+920)
Right from the verge of east Banepa, there is a sudden rise in the elevation that continues to Dhulikhel. Dhulikhel lies on an altitude of about 1,540 m, which is about 100 m higher than the central Banepa and is almost at the same level of Sanga Pass. In other words, if not Sanga Pass, then Dhulikhel might be considered as the highest point of Kathmandu Valley in the east, if Sanga is not considered as the verge of the Valley.
Both the horizontal and the vertical alignment again start to see changes from moderate to crucial. The vertical alignment at the east end of Banepa and in front of Kathmandu University (KU) is about 7%. The horizontal curve beyond east Banepa consists of sharp curves. The curve near KU is not only very small but the vertical grade is also very steep.
The density of houses starts to fall beyond east Banepa and gradually becomes dense at Dhulikhel. The houses in this section are generally beyond 25 yards from the center of the existing road. However, several houses still stand within the said distance.
Dhulikhel Dhulikhel Dhulikhel

2-7
There are 2 main intersections in this section. One near KU, which is a 3-legged (T-shaped) intersection with one-leg going to KU. The other intersection is at Dhulikhel, the end point of this Study. This is also a T-shaped intersection that the Study road forms with Sindhuli Road.
Dhulikhel is famous for being the nearest town from Kathmandu for panoramic viewing of the Himalayas. It also hosts KU and KU Hospital. Being at only 30 km away from Kathmandu, visitors to the town is increasing year by year.
On the other hand, Dhulikhel is a doorway of Sindhuli Road, constructed and completed in July 2015 under the grant aid of Japan.
(1) Sharp Curve Section (2) Houses on Left side Align Beyond ROW
(3) End Point (Intersection with Sindhuli Road)
Photo 2.2-6 Condition of Existing Road between East Banepa and Dhulikhel
2.3 NECESSITY OF THE PROJECT
The following viewpoints justify the necessity of this Project.
a)Promotion of transport strategy in Nepal
The project supports the policies of the National and Regional Development Plan.
SD road project is important component to promote the five years strategic plan for the development of highway, railway and transportation for prosperous Nepal.
b)Formation of road network and promotion of regional development
SD Road, which is located at a route going through the East-side of Kathmandu, is part of approx 1,750 km long Midhill Highway (Final Report on Preparation of Detailed Project Report of Puspalal (Midhill) Highway, Jan 2011), running from East to West in Nepal and functioning as backbone road in Nepal.
It is also a part of Asian Highway and as such is designated as an international corridor.
SD Road is connecting the capital/valley with Banepa Bazaar which is one of core cities and Dhulikhel which is famous for being the nearest town from Kathmandu for panoramic viewing of the Himalayas

2-8
c)Upgrading service of road transport and road safety
SD road upgrade the road transport performance due to increase road capacity and improvement of road shape as followings;
Traffic demand inside the capital/valley is increasing rapidly. Further, the improvement of Sindhuli Road will increase the traffic volume into the Kathmandu. However, the current traffic capacity of the existing road, which has only 15,000 PCU/day in Nepal Road Standard 2070, is not satisfied against the growth of traffic in near future. The road widening will increase road traffic capacity to around 2.5 times the current one at least.
SD Road, the Sanga section, has steep slope cutting and embankment sections. In such case, heavy rains can trigger serious slope failures providing cause of long and frequent road closures and/or raising chances of serious accidents. Widening of lanes and the road improvement at Sanga area will realize a resilient road network against natural disasters.
Bad road shape such as a steep gradient of 7% or more and many small horizontal curves, and high traffic volume are causing traffic congestion. For that reason, it lowers the service level of the road. In particular, the current average travel speed of Suryabinayak-Dhulikhel is 25 km/h.
Road widening and improvement including the road safety measures will be reduce the traffic accident.

CHAPTER 3
TRANSPORT SECTOR OVERVIEW


3-1
CHAPTER 3 TRANSPORT SECTOR OVERVIEW
Nepal is a landlocked and mountainous country. Land and air transport are two major means of transport in Nepal.
Land transport of Nepal consists of roadways and railways. But the railway network of Nepal is almost negligible as there are only two short railway routes at the South East city (Jaleswor) of the country that connects with the bordering city of India. As such, the country heavily depends on roadways for transporting goods from neighboring country India and within the country as well. Acoording to the customs data, more than 90 % of import and export depends on road transport by truck.
Air transport rarely contributes to the transport of goods within the country and is mainly used for carrying people.
3.1 LAND TRANSPORT
Roadways and railway are two major land transports in Nepal. Although Nepal has been making significant progress in its endeavor to develop its land transport network, it still lags behind its neighboring countries. Table 3.1-1 compares the total road and rail network including the number of registered vehicles of SAARC (South Asian Association for Regional Cooperation) countries.
The all existing road network per land area in Nepal totals to an approx. length of 183 thousand km per million square meters and ranks fourth in the region. However, it ranks 4th in terms of rail network, where the network is extended to only 59 km. Regarding the number of vehicle registration in Nepal in 2015 reached about 2.0 million and ranks forth, given that the actual number of vehicles recorded in 2014 in Bangladesh does not exceed that of Nepal.
Table 3.1-1 Land Transport of SAARC Countries
Description /Country
Afghanistan
Bangladesh Bhutan India Nepal Pakistan Sri-
Lanka Total road networks (KM. ‘000)
42.2 (2006)
21.3 (2014)
10.7 (2014)
4685.8 (2012-13)
26.9 (2015)
263.9 (2013-14)
12.4 (2014)
Road length/land area (million m2) 65 144 279 1425 183 331 189
Total number of vehicles (‘000)
780.4 (2008)
1719 (2014)
69 (2014)
141866 (2012-13)
1995.4 (2015)
17715.4 (2013-14)
5633 (2014)
Total rail networks (KM) NA 2.87
(2014) not
applicable 64600 (2012)
59 (2009)
7791 (2012)
1459 (2013)
Source: SAARC in Figures 2016, Central Bureau of Statistics, Nepal
3.1.1 Road Transport
(1)Road Classification and Length with Institutions
Arterial road network is mainly classified into 3 categories, National highway, Feeder road and Urban

3-2
road. The road network consisting of the National highway and Feeder road is called Strategic Road Network (SRN). The SRN belongs to DOR administration and is developed and improved by DOR. Urban roads exist only in central zone, mainly in Kathmandu, and is managed by municipality. The total length of arterial road network as of 2016 is shown in Table 3.1-2.
On the other hand, district road (including rural road) is developed and improved by District Development Committee (DDC) which is governed by Department of Local Infrastructure & Agricultural Roads (DOLIDAR). There are 75 DDCs in the country.
Roads within the city are developed and improved by each metropolitan city independently. However, most of the roads in the city have not been on the roads to withstand vehicle traffic.
Table 3.1-2 Summary Road Length in Nepal
Road Classification
National Highway
Feeder Road (Major) Urban Road Total
(km)
Road Length 5286.69 7,585.29 188.26 13,060.25
Source: DOR, 2016
(2)Strategic Road Network (SRN)
The existing SRN is arterial road network consisting of the national highway and feeder road network in Nepal. The total length of 14,488 km is proposed as target length of SRN. Table 3.1-3 shows the length of SRN by road condition type. According to the table, the length of SRN has steadily increased from 2006 to 2015. Especially, the development of the black top road is progressed, and the road extension increased by 1.6 times. As a result, the road density for the land area is 8.8 km/100 sq.km in 2015, 1.4 times more than in 2006. However, the proportion of unpaved roads is still in the state of account for half.
Table 3.1-3 Length of Strategic Road Network (SRN)
Year Road Length (km) Total
(km)
Influenced population
(No. per km)
Density (km/100sq.km) Blacktop Graveled
Road Earthen
Road 2006/07 4,258.2 2,061.7 3,079.5 9,399.4 2,463.1 6.4 2015/16 6,823.4 2,044.2 4,030.6 12,898.2 2,063.9 8.8
Source: SSRN 20015/16: Statistics of Strategic Road Network, DOR
(3)District Road
Based on the ‘Local Self Governance Act 1999’, district roads including rural and farm roads were developed, improved and maintained by DDC. However, there is no any road engineer in DDC. DOLIDAR sends DDC engineers and technical officers to guide how to conduct road improvement and maintenance. Almost of suspension bridges connecting villages in rural roads were built and maintained by DOLIDAR and DDC.

3-3
(4)Urban Road
There are 58 municipalities throughout the country. Although main roads and trunk roads in Nepal are belong to DOR, roads in urban areas are not under DOR but belong to municipalities. Therefore, municipalities have to improve and maintain their roads by using own budget. However, if there are no any engineers in some municipalities, their roads would be improved and maintained by DOR engineers.
(5)Agencies Related to National Road Development
Agencies related to national road development like SD road project is the MOPIT, and the DOR is under MOPIT.
The MOPIT is established in 2000 and reorganized in 2012 and 2013 following during the reorganization of the Government of Nepal. The main aim of the reorganization was to bring important infrastructural development under the umbrella of a single Ministry and to harmonize the policies and bring efficiencies and effectiveness in the provision of infrastructural services. The roles of MOPIT is to enhance economic activities by linking the villages in the rural areas of the country with the markets by proper development of national transport system, while linking various geographical regions and economic zones with infrastructures of economic development and surface transport, waterways, railways and ropeways and to contribute to various activities and projects related with a number of economic sectors including tourism, agriculture and electricity to be carried out in the country, with a view to support economic and social development of the country.
The DOR is the responsible organization for the overall management, from the design to operation and maintenance of the SRN in Nepal. Strategic roads consist of National Highways and Feeder roads, which totals to 12,872 km in length, as of year 2015/16. These roads accommodate high volume of vehicles and as such play the most important role in the movement of people and goods. The SD road project is a part of the existing the Araniko highway. Therefore, all works from the design stage till the operation and maintenance stage of the highway tunnel will be under the responsibility of DOR.
3.1.2 Rail Transport
The country has the total physical railway line in Nepal extends to mere 57 km. Nepal Railways Corporation Ltd (NRC), a government agency owns the 53 km narrow-gauge rail line, which is composed of two sections (1) a 32 km section between Jaynagar in India to Janakpur in Nepal, and (2) a 21 km portion from Janakpur to Bijalpura. Janakpur to Bijalpura network is not operational at present. The Indian Railways manages the 6 km railway line (of which 4 km fall in Nepal) that connects Inland Container Deport (ICD) in Birgunj to Raxaul in India. These railway line functions for only regional transport but do not function as major transport for Nepal.

3-4
Table 3.1-4 Railway Line in Nepal
Items Janakpur Line Birgunj Line
Length (1) Jaynagar (India) - Janakpur 32 km 6 km (of which 4 km fall in Nepal (Out of Service)
(2) Janakpur - Bizalpura 21 km (Out of Service)
Gauge 762 mm 1676 mm Single/double Single line Single line Traction Power Diesel locomotive Diesel locomotive Operation Nepal Railways Corporation Ltd Nepal Railways Corporation Ltd
Source: JICA Study Team
3.2 AIR TRANSPORT
With 46 domestic and one international airport, civil aviation plays a vital role in linking the hilly and mountainous parts of the country at present. Most of them are green field without modern navigation systems. Domestic airports are crucial to the growth of trade and tourism in the country as villages in hills and mountains are inaccessible by roads.
Among 46 domestic airports, 4 airports are designated as regional airports for the remote economic activities in eastern, central and western regions. These regional airports are utilized for arrival and departure from neighbor countries as India and China. They are Biratnagar, Pokhara, Bhairahawa and Nepalganj airports as shown Figure 3.2-1.
There is only one airport, Tribhuvan International Airport (TIA) has runways over 3,000m and an Airport Surveillance Radar (ASR) instrument in Nepal. Other than TIA, all the airports of Nepal have no ASR that planes have to be operated by a Visual Flight Rules (VFR) system. Moreover, there are only 14 airports are provided with paved runway and the other 33 airports has no paved runway. Table 3.2-1 shows aviation safety facilities in Nepal.
TIA, which was designed to handle maximum 30 aircraft per hour through a single runway and approach system, is now handling double the number. TIA handed 4.28 million passengers in 2011 while international airlines served 2.70 million and domestic airlines served 1.58 million. On an average, TIA handles 63 international and 217 domestic flights daily in 2012.

3-5
Table 3.2-1 Aviation Safety Facilities Provided by Airport in Nepal
The number of airports in Nepal 47 The number of airports provided with NDB (Non Directional radio Beacon) 15 ― 〃― V/D (Very High Frequency Omnidirectional Radio Range) 7 ― 〃― C/L (Compass Locater) 1 ― 〃― Rader 1 ― 〃― HF (High Frequency) 38 ― 〃― VHF (Very High Frequency) 38 ― 〃― ILS (Instrument Landing System) 0 ― 〃― Paved Runway 14 ― 〃― Unpaved Runway 33
Source: JICA Study Team
Source: Worldtravels.com
Figure 3.2-1 International and Regional Airports in Nepal
3.3 ROAD NETWORK AND CURRENT SITUATION OF ROAD INFRASTRUCTURE
The arterial road network in Nepal extends to 13,061 km. The present arterial road network is shown in Figure 3.3-1. This network is inclusive of the roads that are currently under construction.
The road condition by road classification is shown in Table 3.3-1. According this data, 66% of the total extension of the national highway is developed by asphalt concrete pavement, but the rest of 34% is still gravel road or earth road.
International Airport: one airport, Kathmandu (Tribhuvan International Airport) Regional Airport (also to be utilized for arrival and depature from China and India: four (4) airports (Birattnagar, Pokhara, Bharahawa and Nepalganj)

3-6
Source: DOR, 2016
Figure 3.3-1 Present Arterial Road Network in Nepal
Table 3.3-1 Road Condition by Road Classification in Nepal
Road Classification
National Highway
Feeder Road (Major) Urban Road Total
(km) Asphalt pavement 3,477 (66%) 3,321(44%) 183(97%) 6,980 (53%)
Gravel road 698 (13%) 1,346(18%) 1.0(1%) 2,045 (16%) Earth road 1,112 (21%) 2,918(38%) 5.0(2%) 4,035 (31%)
Total 5,287 (100%) 7,585 (100%) 189 (100%) 1,3061 (100%) Source: DOR, 2016
3.4 ROAD DEVELOPMENT POLICY AND PLAN
For Nepal which is landlocked and mountain locked country, the road development that connects domestic everywhere, the border of Indian to access the sea port and the border of China. However, the pavement ratio of road was still low. Therefore, the road development has been given high priority in infrastructure development, that contributes in socio-economic development of nation, social integration, service delivery and governance functions. The objective and strategy of road development is stated by DOR. The objective is to expand standard, reliable, affordable and safe transport network to contribute national integration, socio economic development and regional balance. Strategy is presented as followings;

3-7
1) Expand transport access so as to link district headquarters and inter districts,
2) Expand transport by raising access to agriculture, industries, hydropower, tourism, education and health services,
3) Prioritize repair and maintenance by safeguarding roads network and assuring safe and effective travel.
The MOPIT has developed the 5-year strategic plan between 2014 and 2019 regarding the Road, Railway and Transport Development. The main objective of the transport development is to minimize the aggregate transport cost. In order to achieve those objectives, the government has setup a mission to improve the connection between the internal and external parts of the country. Also, to manage for the development and improvement of roads to the rural areas and make it effective, safe and cheap.
In order to implement this mission, the DOR has been assigned the following defined tasks:
- Meet all the needs of Nepal’s transport service and construct SRN, - Secure the pedestrians and all the road users while using the roads, and - Provide certain level of quality service through Road Network.
The major objectives of SRN are to make road transport service between state - state, state - local agencies, neighboring countries more effective, sustainable, efficient and less costly, and also to manage for the gradual development of railway transportation to assist in prosper development of Nepal.
Basic Concept of this plan is below;
1. Develop and reinforce the national road network for laying the foundation for prosperous Nepal keeping in mind the national unity, integrity, regional balance and the maintaining the relationship between people from different areas,
2. Develop and make access of road transport easy, convenient, safe, and effective from state to central regional for local people the whole year,
3. Connect the capital city Kathmandu and the capital of each state by a national highway with at least a 4-lane road and other alternate roads,
4. Develop national road network as to assist in business expansion, diversification, and interim transit,
5. Develop and expand the road network as to assist in the social economic integration, industry-trade development, tourism development, commodity and service production and distribution,
6. Operate programs for the application of commitment presented in different international platforms associated with the development and reinforcement of road network,
7. The strategic roads and bridges constructed by the road department will be of at least 2 lanes,
8. To avoid the internal and external source of investment in road subdivision being scattered,

3-8
the selection, construction, possible upgrade works implementation will be based compulsorily on economic and technical viability and return,
9. Develop railway transport. To make the long distance goods transport and passengers’ transit cost effective, electronic railway transport from East - West (Mechi-Mahakali) and Rashuwagadi-Kathmandu-Pokhara-Lumbini will be constructed. Also, work on construction of railway transport from Indian border to different important industrial areas/cities,
10. Improve the existing transportation management system and make the human and goods transportation secure, effective, and less costly,
11. Discourage transportation with low occupancy and encourage usage of public transportation system and walk pedestrians providing general public safe, facilitated, pollution free and accessible transport service,
12. On the basis of possibility, develop water transport as an assisting and supplementary medium for road and railway transport system.
To achieve the objectives of this strategic plan, MOPIT has put forward the main programs consisting of 4 categories; the road, the railway, the transport management and the water Transport and Ropeway. The main programs for road area consists of Reconstruction of Earthquake Affected Road Structure, Basic Road Network, Development of Main Highways, Development of roads connecting South-North roads for Trade, Development of roads connecting two countries, Road Reinforcement in Kathmandu Valley, Bridge Construction, Tunnel Road Development, Road Network (maintenance), Road Safety, and Other Programs.
In this program, the Suryabinayak-Dhulikhel road is positioned as part of Birgaunj-Kathmandu-Dhulikel-Kodari road (390 km) as the main North-South corridor for “Development of roads connecting South-North roads for Trade” and also as an essential project for “Road Reinforcement in Kathmandu Valley”.
3.5 ROAD DEVELOPMENT POLICY IN THE NATIONAL DEVELOPMENT PLAN
The government of Nepal lunched the new national development plan, which is the fourteenth plan from 2016 until 2019. In this development plan, the basic policy of transport infrastructure development mentioned as followings.
(1)Challenges and Opportunities
1)Challenges
The challenges are to manage the budget of high expenditure due to difficult geological condition, to repair, maintenance and safeguard of constructed infrastructure, to make the prioritization of road development under the limit of resource & equipment, to extend the strategic road network

3-9
connecting scatter settlements, to ensure strategic road network and road structure safety with all weather, to build roads considering challenges of climate change and natural disaster, to develop the effectiveness, local sector capacity, possibility and attractions of local investment by coordination with various stake holder agencies.
2)Opportunities
The opportunities are to prepare road network development and improvement policy, reaching high demand of roads development program from local level, to accept the road development projects shown in the road sub-sector plan in high priority involving the appreciable donation by development partners.
(2)Vision, Goal, Objective, Strategies and Operating Policies
1)Vision
To achieve social integration, regional balance and economic growth by road infrastructure development.
2)Goal
To enhance economical-social development, trade expansion, and to make good international relationship environment by connecting the national strategic road network.
3)Objective
1. To achieve effective, sustainable, safety, reliable, environmental friendly, and low cost transportation service. Expansion of economic activity and to promote effective service delivery,
2. To expand trade relations between federal to province, province to province, province to local level, and neighboring counties.
4)Strategies
1. Expand safety approach transportation facilities for provincial approach and economic growth contribution,
2. Expand approach transportation for agriculture, industry, trade, hydropower, tourism, education and health sector,
3. Expend and improve international boarder and strategic transportation road.
5)Operating Policies
1. According five-year strategic project, strategic roads will be given priority for improvement and upgrading,
2. Road network will be developed between province, 3. Road network will be expanded in district and village at where road network is not connected,

3-10
4. Hulaki marga and Mid hill highway will be constructed very quickly with safety, reliability and accessibility,
5. Road will be improved and fly over road will be constructed in Kathmandu valley, 6. Kathmandu – Nighgard fast track project will started, 7. Bridges on strategic and local roads will be constructed, 8. Design, construction and maintenance for road safety will be considered to reduce the accident, 9. Tunnel technology will be adopted to reduce the length of roads, 10. Reconstruction will be done at area damaged by earthquake, 11. Program will be conducted for greenery in ROW of roads, 12. Road network will be developed considering promotion of agriculture, energy, tourism, and
industry occupations, 13. Social and environmental adverse impact will be considered during construction and
maintenance of roads and bridges, 14. Public-Private Partners, construction, regulation and hand over methods will be adopted in
public construction, 15. Road maintenance, reconstructions, and management will be implemented very effectively, 16. Strategic roads connecting North –South and important roads for trade will be developed, 17. Roads network will be prepared and used for neighborhood country to develop the Trade &
Industry.
(3)Expected Outcome
The 350 km road structure and bridges damage by earthquake will be reconstructed. Additional new road 2,000 km will be constructed and 654 km road will be constructed in Intermediate / Double lane, 3,000 km road will be upgraded, 1,800 km road periodic maintenance and 30,000 km road regular maintenance will be done. Additional 300 bridges will be constructed and 500 new bridge construction will be started, similarly density of road will reach 1.3 km per sq km, Black topped road will be approached 71 districts headquarter.
3.6 RELATED PROJECTS
Recently completed projects, ongoing projects and projects likely to be implemented over the years that are considered to have influence with this Project are as follows;
(1)Sindhuli Road Project
Sindhuli Road, which is approximately 160 km long, was planned as a new alternate route that connects the capital city Kathmandu to the eastern Terai region. It was constructed under the grant aid of Japan. It begins at Dhulikhel, the end point of the SD Road, and ends at Bardibas on the East-West Highway. It was completed and opened to
Photo 3.6-1 Sindhuli Road

3-11
traffics in 2015. Having only a stretch of approx. 150 km, it is the shortest route connecting Kathmandu with the south-eastern region of the country. It has been attracting traffic from the south-eastern region since it was opened to the traffics. The constant increase of traffic volume and prominence of expansion of villages along the road is significant. The road is contributing to socio-economic development and deepening inter-connection between and along the corridor.
(2)Nagdhunga Tunnel Construction Project
One of the long-awaited projects that plans to construct a 2.6 km long 2-lane tunnel along the Tribhuvan Highway that goes under the Nagdhunga Pass (from Basnetchhap in the east side and Sisnekhola in the west). The provision of the tunnel is aimed to improve the geometric alignment of the existing section, which is extremely winding and steep-graded, such that the travel time is reduced, traffic safety is enhanced and environment of the area is improved, all of which is deemed to stimulate the economic activities of Kathmandu and other cities and ultimately contributing to the economic development of the country. The preparatory survey of the project was completed in 2014. It is now in the detailed design stage. The project is being carried out under the loan assistance from Japan. Being the could-be-the-first tunnel on a highway, there are many aspects that are relevant to the Project. The construction of the tunnel is expected to commence from 2018.
(3)Expansion of Ring Road Project
Ring road is a 27 km long double lane road that circles around the cities of Kathmandu and Lalitpur. The southern section, that is the section that lies south of the Tribhuvan and Arniko Highways or from Kalanki at the west to Koteswor at the east, which is about 9.5 km is currently being expanded to 8 lanes under cooperation from China.
Expansion of Ring road is considered to contribute in alleviating the traffic congestion of the city.
(4)Outer Ring Road Project
The development plan of Outer Ring Road (ORR) has been in a limbo for a while since it was initially proposed in 2005. Kathmandu Valley Development Authority (KVDA) is the responsible authority for planning and construction of the road. This road is being developed with the concept of an additional
Figure 3.6-1 Location of Nagdhunga
Tunnel
Photo 3.6-2 Ring Road Expansion

3-12
road within the periphery of Kathmandu Valley to ease the severe congestion within the Kathmandu Valley, mainly of the ring road, due to rapid urbanization.
Figure 3.6-2 Conceptual Image of ORR
The ORR, which is 71.93 km in total length, planned to construct a 50 m Right-of-way road with 2 high-speed lanes and 2 low-speed (service) lanes for each direction, and an additional lane as shoulder/ parking lane and a cycle lane for each direction. In addition, there would be green belts and footpaths on both sides. The high-speed lanes will be separated by a 2-m wide median divider. The government has approved construction of a 6.7 km stretch at the south-west of Kathmandu, from Satungal to Chobar. The survey and design work has been completed. However, it is facing issues related to land acquisition, as the Chief District Officer (CDO) is asking for approval from the Cabinet, although the Development Project Report (DPR) had been prepared, submitted and approved by Physical Development Committee, KVDA.
The location where the ORR meets with Arniko Highway is between Thimi and Bhaktapur (near Hanumante River) and will not affect the Suryabinayak - Dhulikhel Improvement Project. If the ORR is expanded to the north, which is very unlikely to happen in near future, a portion of the Arniko Highway from Hanumante River to the east of Jagati will be a part of ORR, which may affect the Project.

CHAPTER 4
OVERVIEW OF SOCIO-ECONOMIC CONDITION AND
NATURAL CONDITION


4-1
CHAPTER 4 OVERVIEW OF SOCIO-ECONOMIC CONDITION AND NATURAL CONDITION
4.1 SOCIO-ECONOMIC CONDITION
4.1.1 Population
Table 4.1-1 illustrates the population of Nepal between 2001 and 2016 extracted from National Population Census 2011. The figures for 2001 and 2011 are actual population while the population provided for 2016 is a projected population. The average annual growth rate of population is approx. 1.35% and the total population is about 26.5 million. The ratio of male and female is 94.2 (population of female slightly exceeds that of male). The Statistics Bureau of Nepal estimates the population of 2016 to reach 28.4 million.
Figure 4.1-1 compares the population growth of the Project area and its surrounding districts. This shows that the population of Kathmandu has grown 4 times and population of Bhaktapur city has almost doubled in the past 30 years.
Table 4.1-1 Population of Nepal
Population 2001 2011 2016
(Projected) Male 11,563,921 12,849,041 14,647,486
Female 11,587,502 13,645,463 13,784,009
Total 23,151,423 26,494,504 28,431,494
Annual population growth (%) 2.25 1.35 Source: National Population and Housing Census
*1981=1.0 Source: Population census
Figure 4.1-1 The Population Change in Project Area
0.0
0.5
1.0
1.5
2.0
2.5
3.0
3.5
4.0
4.5
1981 1991 2001 2011
Nepal
Dst. Kathmandu
Dst. Bhaktapur
Dst. Lalitpur
Dst. Dhading

4-2
4.1.2 Economy
The economy of Nepal is seen to be increasing constantly. The Real GDP in 2013 was over 700 Billion NPR with annual growth rate of 3.6%. The increase of overseas remittance contributed the growth of tertiary sector which accounts to 20% of the total GDP. In the context of augmentation of overseas remittance from other countries, the middle-income group in cities, mainly in Kathmandu, is increasing and this group is contributing to expansion of consumption. GDP per capita reached 25,000 NPR in 2013.
*2014 is estimation Source: Economic census
Figure 4.1-2 Change of Real GDP and Growth Rate by Sector
*2014 is estimation Source: Economic census
Figure 4.1-3 Change of Real GDP per Capita
0.0
1.0
2.0
3.0
4.0
5.0
6.0
7.0
0
100
200
300
400
500
600
700
800
2001 2002 2003 2004 2005 2006 2007 2008 2009 2010 2011 2012 2013 2014
Tertiary Sector Secondary Sector Primary Sector Annual GDP (constant price) Growth Rate(Billion NPR)
0
5,000
10,000
15,000
20,000
25,000
30,000
2001 2002 2003 2004 2005 2006 2007 2008 2009 2010 2011 2012 2013 2014
(NPR)

4-3
The economy of Nepal is increasing year after year and GDP growth rate of Fiscal Year (FY) 2014/15, 2015/16 and 2016/17 are 2.97%, 0.01% and 6.94% respectively. The per capita GDP in FY 2013/14 was 71.2 thousand NPR (approx. 725 US$) and in FY 2016/17 is 90.5 thousand NPR (approx. 853 US$). The increase of the per capita can be contributed overseas remittance.
Figure 4.1-4 Economic Condition
4.1.3 Industry
As regards the industry GDP rate, Agriculture has the highest rate, accounting for 34.8%, the second is Wholesale (14.2%), and the third is Transportation(8.3%). The labor population by Industry is shown in Figure 4.1-6. Agriculture accounts for over 60%, and the rate of both Manufacturing and Commercial are 9.0% each.
Source: Economic census
Figure 4.1-5 GDP Share by Industry Sector
Agriculture, 35%
Wholesale trade, 14%
Transportation, 8%
Real estate, 8%
Construction, 7%
Manufacturing, 6%
Education, 6%
Finance, 5%
Social service, 2%
Hotel and restaurant, 2%
Medical and social welfare,
2%
Others, 4%

4-4
Source: Economic census
Figure 4.1-6 Employment Share by Industry
(1)Price and Inflation
The Consumer Price Index (CPI) of base year 2005 is shown in Figure 4.1-7. The inflation of the CPI is still. CPI has increased 2.4 times from 2000 to 2013, and the annual growth rate in this period was around 7%. Recent inflation rate is more than 9%.
Outside factors such as price increases in India and high oil prices can be considered as the factors of the rise of CPI.
*2005=100 Source: Quarterly Economic Bulletin
Figure 4.1-7 Changes in the Consumer Price Index Increase Rate
Agriculture66%
Manufacturing9%
Commercial9%
Social service4%
Government3%
Construction3%
Transportation/Telecom
2%
Energy2%
Tourism1%
80
100
120
140
160
180
200
2000 2001 2002 2003 2004 2005 2006 2007 2008 2009 2010 2011 2012 2013

4-5
(2)Tourism and Migrant Workers
The number of tourists has increased with the recovery in the domestic security. Since more than 50 million people for the first time in 2007, it has maintained the milestone of 500,000 people to continue. In 2011, it set a tourist of record over 700,000. The migrant workers from Nepal to other country, which was less than 10,000 in 1998, reached 384,000 people in 2011. Major destination is Middle Eastern countries, Malaysia. The overseas remittance by migrant workers, which is 360 billion NPR, accounts for 23% of GDP in Nepal.
Source: Ministry of Culture, Tourism and Civil Aviation
Figure 4.1-8 Changes in Number of Tourist
Source: Ministry of Labor & Employment
Figure 4.1-9 Trend in the Migrant Workers and Overseas Remittance
0
100
200
300
400
500
600
700
800
900
19
85
19
86
19
87
19
88
19
89
19
90
19
91
19
92
19
93
19
94
19
95
19
96
19
97
19
98
19
99
20
00
20
01
20
02
20
03
20
04
20
05
20
06
20
07
20
08
20
09
20
10
20
11
20
12
('000)
0%
5%
10%
15%
20%
25%
0
50
100
150
200
250
300
350
400
450Migrant worker Amount Ratio per GDP(‘000)

4-6
(3)Foreign Direct Investment
Foreign Direct Investment (FDI) to Nepal increased after 2007. FDI of India accounts for 46.3% of accumulative investment amount by 2012. Regarding sectorial FDI, Manufacturing is 37%, Energy is 22%, Service is 15%, Tourism is 13%. FDI to Agriculture as domestic industrial strength is nothing more than 3% of total amount.
Source: Trade and Export Promotion Centre
Figure 4.1-10 Trends in Foreign Direct Investment
Source: Trade and Export Promotion Centre
Figure 4.1-11 Sectorial Accumulative Investment Amount by 2012
0
2
4
6
8
10
12
19
89
19
90
19
91
19
92
19
93
19
94
19
95
19
96
19
97
19
98
19
99
20
00
20
01
20
02
20
03
20
04
20
05
20
06
20
07
2008
20
09
20
10
20
11
(Billion NPR)
Manufacturing37.4%
Energy22.1%
Service14.5%
Hotel and restaurant
12.7%
Construction6.8%
Agriculture3.1%
Transportation2.9%
Real estate0.5%

4-7
4.1.4 Import and Export
(1)Value of Import and Export
The export value in 2013 is 83 billion NPR which is a 9% increase over the previous year. The import value in 2013 is 636 billion NPR which is a 14% increase over the previous year. The value of import that is 7.7 times of import shows a large excess of imports over exports.
Main trade partner is India in both import and export and the share is over 65%. Major commodity in import is petroleum which accounts for 31% of total value. Industrial product ranks in second that accounts for 19% of total import. In export, Industrial product ranks the first and accounts for 23% of total import value. Then, Garments is 11%, Spice and Jute is 9%.
Source: Trade and Export Promotion Centre
Figure 4.1-12 Changes of Volume Import and Export Value Basis
Import Export
Source: Trade and Export Promotion Centre
Figure 4.1-13 Share of Country in Trade
0
100
200
300
400
500
600
700
800
1984
1985
1986
1987
1988
1989
1990
1991
1992
1993
1994
1995
1996
1997
1998
1999
2000
2001
2002
2003
2004
2005
2006
2007
2008
2009
2010
2011
2012
2013
Import Export(Billion NPR)
India66%
China P. R.11%
U.A.E.6%
Indonesia2%
Thailand1%
Argentina1%
Brazil1%
U.S.A.1%
Malaysia1%
Japan1%
Other9%
India67%
U.S.A.8%
Germany4%
China P. R.3%
U.K.2%
Bangladesh2%
France2%
Afghanistan1%
Turkey1%
Japan1%
Other9%

4-8
Import Export
Source: Trade and Export Promotion Centre
Figure 4.1-14 Share of Commodity in Trade
(2)Trade between Japan and Nepal
The import value from Japan was 50 billion in 2013 is accounted for 28% of steel product, 18% of Machinery, 17% of car. The export value form Japan is 10 billion. Major exported commodity are garment (39% of total value), textile (18%), millwork (10%), and handicraft (4%). There were 45 companies in operation by investment of Japan in 2012 and 38 companies of them are in preparation stage. Visitors from Japan in 2012 are 28,642 people.
Table 4.1-2 Company by Investment of Japan
Operation Preparation
Software 3 2 Manufacturing 11 11 Construction 4 0 Tourism 21 13 Others 6 12 Total 45 38
Source: Trade and Export Promotion Centre
Petroleum31%
Industrial19%
Car&Equipment6%
Machinery4%
Medical4%
Chemical3%
Garment3%
Food3%
Electric3%
Others22% industrial
23%
Garment11%
Spice9%Jute
9%
Food8%
Polyester7%
Filature5%
Toothpaste2%
Domestic animal
1%
Others23%

4-9
Source: Trade and Export Promotion Centre
Figure 4.1-15 Trend in Trade Value with Japan
Source: Trade and Export Promotion Centre
Figure 4.1-16 Trade Commodity with Japan by Import and Export
Source: Trade and Export Promotion Centre
Figure 4.1-17 Trend in Number of Visitor from Japan
0
1000
2000
3000
4000
5000
6000
7000
8000
1994 1995 1996 1997 1998 1999 2000 2001 2002 2003 2004 2005 2006 2007 2008 2009 2010 2011 2012 2013
Import Export(Million NPR)
Steel Products28%
Machinery18%
Car&Machinery17%
Medical equipment
14%
Film&Print agent
3%
Textile/Garment
3%
Chemical products
2% Others15%
Garment39%
Textile18%
Millwork10%
Handicraft4%
Agricultural prod.
3%
Paper prod.3%
Leather2%
Others21%
0
5
10
15
20
25
30
35
40
45
19
85
19
86
19
87
19
88
19
89
19
90
19
91
19
92
19
93
19
94
19
95
19
96
19
97
19
98
19
99
20
00
20
01
20
02
20
03
20
04
20
05
20
06
20
07
20
08
20
09
20
10
20
11
20
12
('000)
Export Import

4-10
4.1.5 Transportation
(1)Transport Mode for Trade
According to customs data by value basis, transport mode for trade is dependent on land transport by truck, which accounts for around 90%. Nepal is a landlocked mountainous country so road network is most important for Nepal economy.
Table 4.1-3 Transport Mode for Trade
Mode Import (billion NPR)
Export (billion NPR)
Total (billion NPR)
Share of Mode
Truck 567 65 633 88% Air cargo 69 17 86 12% Total 636 83 719 100%
Source: Customs office data
(2)Number of Vehicle
The number of vehicle registration not including motor cycle has almost doubled in the last 5 years. The annual average growth rate of total was over 17.8% in the period of 2008-2013. This growth rate is very high than that of population or GDP in Nepal.
Table 4.1-4 Number of Vehicle Registered
year No. of Vehicle 2008 103,680 2009 136,760 2010 161,493 2011 186,442 2012 219,544 2013 235,138
Growth rate 2008-2013 17.8%
*Excluding Motor Cycle Source: MOPIT
4.2 PHYSICAL PROFILE
4.2.1 Topography
Kathmandu, the capital of Nepal, is located in the Kathmandu Valley Basin. The basin is elliptical in shape having horizontal diameter (extending east to west) of 26 km and vertical diameter (north to south) of 20 km. The altitude of the bottom of the basin is about 1,300 m, and the mountain range surrounding the basin is about 2,000 to 2,700 m high. There are two main routes to the Valley. Tribhuvan Highway combined with Prithvi Highway passes through the west side of the Valley and
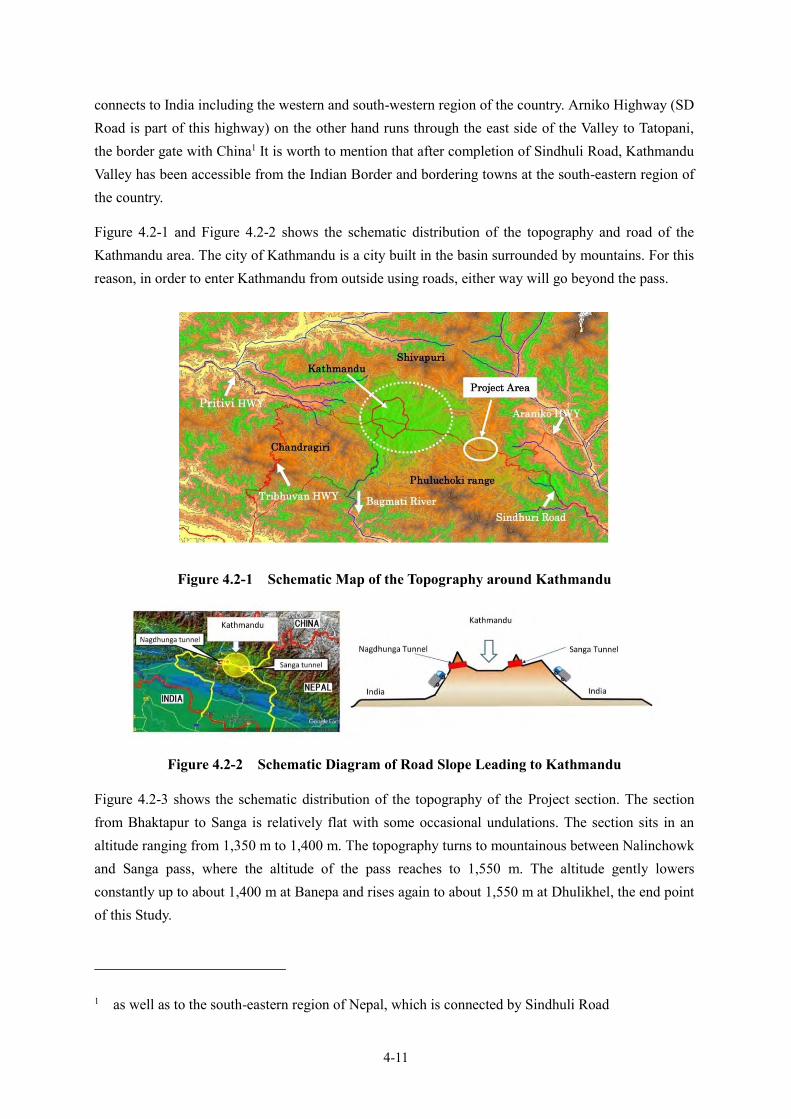
4-11
connects to India including the western and south-western region of the country. Arniko Highway (SD Road is part of this highway) on the other hand runs through the east side of the Valley to Tatopani, the border gate with China1 It is worth to mention that after completion of Sindhuli Road, Kathmandu Valley has been accessible from the Indian Border and bordering towns at the south-eastern region of the country.
Figure 4.2-1 and Figure 4.2-2 shows the schematic distribution of the topography and road of the Kathmandu area. The city of Kathmandu is a city built in the basin surrounded by mountains. For this reason, in order to enter Kathmandu from outside using roads, either way will go beyond the pass.
Figure 4.2-1 Schematic Map of the Topography around Kathmandu
Figure 4.2-2 Schematic Diagram of Road Slope Leading to Kathmandu
Figure 4.2-3 shows the schematic distribution of the topography of the Project section. The section from Bhaktapur to Sanga is relatively flat with some occasional undulations. The section sits in an altitude ranging from 1,350 m to 1,400 m. The topography turns to mountainous between Nalinchowk and Sanga pass, where the altitude of the pass reaches to 1,550 m. The altitude gently lowers constantly up to about 1,400 m at Banepa and rises again to about 1,550 m at Dhulikhel, the end point of this Study.
1 as well as to the south-eastern region of Nepal, which is connected by Sindhuli Road

4-12
Figure 4.2-3 Topography of Study Area
4.2.2 Geology
(1)Geological Outline
The geological features of the Kathmandu Valley are comprised of two distinct deposits;
i) lacustrine sediments and river bed sediments of the Quaternary Formation (commonly known as Kalimati Formation) that are deposited atop the foundation in the central part of the valley, and
ii) The lowland in the basin is clay in the west, sandy and gravel layer in the east.
The geology at Sanga Pass area slightly differs to the surrounding area, owing to the mountainous character. Geology here is found to be composed of alternate layers of Phyllite and Sand stone called Tistung formation of the Devonian (Paleozoic) from Precambrian (refer to Figure 4.2-4).
Source:Geology of Central Nepal
Figure 4.2-4 Geology of Sanga Pass Area
Target area Tistung formation

4-13
(2)Geology of the Project Area
1)Tistung Formation
Rock mass is highly jointed and fractured. The sandstone of this area are thin layer as 5 - 30 cm thickness and slightly to moderately weathered. Photo 4.2-1 and Photo 4.2-2 shows the weathered Tistung formation and the fresh Tistung formation.
Photo 4.2-1 Weathered Tistung Formation
Photo 4.2-2 Fresh Tistung Formation
2)Kalimati Formation
This is one of the important geological units belonging to the quaternary sediments of the Kathmandu basin. The black to brown clay, highly rich in organic matter that was once deposited in the paleo-Kathmandu Lake are now exposed around the Project area. This unit also consist some intercalations of brown silt and fine sand. Photo 4.2-3 and Photo 4.2-4 shows the Kalimati formation.

4-14
Photo 4.2-3 Kalimati Formation
Photo 4.2-4 Kalimati Formation
3)Talus Deposit
Talus sediments are found below the Kalimati strata at the boundary between mountains and plains, some of which are distributed in the valleys and the foot of the mountains.
Talus sediment is a collapsed and weathered sediment from the surrounded mountainous region, composed of gravel with dominantly angular fragments of phyllite and sandstone derived from Photo 4.2-5 shows the Talus Deposit.
Photo 4.2-5 Talus Deposit

4-15
4)River Deposit
River deposits (Alluvial deposits) are mainly distributed in the other side river of the Project area. The alluvial sediment is mainly composed of clay silt sand and gravel.
The sizes of the particles vary considerably. Most of the alluvial deposits of the Project area are less consolidated and soft. Photo 4.2-6 shows the River Deposit.
Photo 4.2-6 River Deposit
5) Geological Structure and Fault
According to the Engineering and Environmental Geological map of the Kathmandu valley and geological map of Central Nepal, Tistung formation distributed in the Project area.
Tistung formation consists of phyllite and sandstone. The formation continues in the northwest - southeast direction, general striking / inclination is N50w, 60 degrees southwest inclination. In the above geological maps, clear faults etc. are not described in this area. According to the field survey, faults (fractured or sheared zone) extending in the northwest - southeast direction, as well as in the northeast - southwest direction are assumed. The sheared zone of the formation confirmed in the field survey is shown in the Photo 4.2-7.
Photo 4.2-7 Sheared Phyllite

4-16
4.2.3 Land Classification
(1)Residential
Residential areas within the objective section, from west to east order, are Bhaktapur, Jagati, Nalinchowk, Palanse, Sanga, Banepa and Dhulikhel. Here, both sides of the road are aligned with houses, shops or both. Within these settlements, there are houses/shops in a scattered manner and not concentrated at the same location.
(2)Agricultural
All other land beside residential areas and the area at Sanga Pass including the left side near Dhulikhel is used for agricultural purpose. Most of the land is used for rice plantation and the rest for farming of other agricultural products.
(3)Industrial
There is a brick factory near Jagati about a couple hundred meters away from the objective road. There are brick factories scattered in the section. These brick factories are limited up to Sanga Pass. Small-scaled carpentry factories are observed but are limited to residential areas.
(4)Recreational Land
Recreational area is located in Palanse and Sanga. A swimming resort (Kathmandu Fun Valley) is located at the left side of the objective road and a bronze statue of Shiva atop a hill next to Sanga Pass.
(5)Forest
The southern face of Sanga hill is the only forest area within the objective section. This forest, known as Suryamode Perungo Community Forest has an approx. area of 22 ha. However, the use of forest resources is permitted by the surrounding residents to a sustainable extent.
4.2.4 Earthquake
Nepal sits on the boundary of two massive tectonic plates - the Indo-Australia Plate and Asian Eurasian Plate and is prone to earthquakes. The Indo-Australia plate is moving northward and causing subduction under the Eurasian plate. An earthquake occurs due to the energy released at the time of the crustal deformation that occurs at this time. Earthquakes are frequently occurring in Nepal and its surrounding areas from long ago. List of earthquakes occurred after 1900 is tabulated in Table 4.2-1.

4-17
Table 4.2-1 List of Major Earthquakes Occurred in the 20th & 21st Century
Date Region Epicenter (km) Magnitude
Estimated Acceleration(gal)
January 15, 1934 Nepal, North India, Tibet 177 8.4 88
May 27, 1936 Bihar region/India, Central Nepal 199 7.0 38
Sept. 4, 1954 Bihar region/India, Southeast parts/Nepal 163 6.5 34
July 29, 1980 Western part of Nepal 18 6.5 -
August 20, 1988 Kathmandu, Bihar region of India 197 6.5 36
April 25,2015 Northwest parts of Kathmandu 77 7.8 160
Source: The Study on Earthquake Disaster Mitigation in the Kathmandu Valley, March 2002 (Partial correction by team)
4.2.5 Climate
Kathmandu Valley has a humid subtropical climate. Figure 4.2-5 illustrates the climatic condition of the Kathmandu Valley. Light blue columns represent rainfall, dark blue line and red line indicates monthly mean temperatures. The numbers represent the average lows and highs for each month. During summer, average high temperature is about 28.3°C and average low temperatures are 19°C. Come Autumn/Winter, temperatures plummet with average highs of 26°C in the day time and 12.3°C generally after sunrise. The difference in the day and night temperatures are high which is attributed to the bowl shape of the Valley. The Valley is humid all through the year. Total annual precipitation is about 1350 mm and up to 90% of its annual precipitation is received during the three summer months (June to September). The wind direction dominates the southeast in the rainy season and the northwest in the dry season.
Source:World Weather Information Service
Figure 4.2-5 Climate of the Kathmandu Valley
14.2 16.7 31.254.4
114.2
256.4
359.6
314.2
183.1
59.47.5 14.2
18.0
20.2
24.3
27.4 28.2 28.3 27.7 28.0 27.225.8
22.7
19.4
2.1
3.8
7.5
11.3
15.5
19.0 20.0 19.7
18.2
13.0
7.4
3.0
0
50
100
150
200
250
300
350
400
0
5
10
15
20
25
30
Jan Feb Mar Apr May Jun Jul Aug Sep Oct Nov Dec
Mon
thly
mea
n ra
infa
ll (m
m)
Mon
thly
mea
n te
mpe
ratu
re (
degr
ee C
)
Total Rainfall (mm) Daily Maximum (degree C) Daily Minimum (degree C)
30 years period in Kathmandu

4-18
4.2.6 Hydrology
There are five major rivers in the Kathmandu Valley, the Bagmati River, the Bishnumati River, the Dhobi River, the Manahara River, and the Hanumante River. The objective road passes through the Chakhu River Basin of the Hanumante River flowing on the east side of the basin. Both flow down the basin with a gentle slope and run out from the southwestern part of the basin.
The branch rivers of Hanumante River, which are relative narrow in width (less than 10 m), except for Punyamati River out of Kathmandu Valley that runs north-south at the west end of Banepa, which is about 18 m.
Figure 4.2-6 Major rivers around Kathmandu Valley and Banepa

CHAPTER 5
REVIEW OF IMPROVEMENT PLANS OF
PREVIOUS SURVEY


5-1
CHAPTER 5 REVIEW OF IMPROVEMENT PLANS OF PREVIOUS SURVEY
5.1 IMPROVEMENT PLANS OF PREVIOUS SURVEY
The outline of improvement plans proposed in the previous survey is summarized in Table 5.1-1.
Table 5.1-1 Outline of Improvement Plans of Previous Survey
ITEMS Improvements Proposed 1. Design Speed
80 km/h: Sections 1,2,5,6 60km/h: Sections 3,4,7,8,9,10
2. Design Vehicle SU-12
3. Number of Lanes 4-lanes (current 2-lanes)
4. Alignment Minor: Curves that do not meet the geometric standards for the above-mentioned design speeds Major: At Sanga Area (provision of a bypass that deviates to the north from the existing road. Consists 198m long bridge and concrete cribs at cut slopes)
5. Pavement Structure
Asphalt Concrete Design period 10 years
6. Service Tracks Proposed at 6 sections; i) Suryabinayak - Jagati, ii) SangaPass, iii) Banepa Bazaar, iv) Near KTM University and v) Dhulikhel (one side only)
7. Intersection Suryabinayak, ii) Jagati, iii) Nalinchowk, iv) Banepa (2 locations), v) Bodol (near KTM University), and vi) Dhulikhel
8. Bridges Reconstruction of following bridges by box culverts; i) Sipadole: about 7 hundred meters east of central Jagati, ii) Bhikteswor : about 1.5km east of Sanga Pass, iii) Punyamati : at the west end of Banepa Bazaar, and iv) Chandeswori : at the east end of Banepa Bazaar
9. Foot Bridges Provision proposed at 6 locations; Suryabinayak (start point of this project), Jagati, iii) Banepa (3 locations), and iv) Bodol (in front of KTM University)
10. River Training Work
2 locations about 2 km ahead of Banepa (existing streams are currently within the road reserve)
11. Road Ancillaries Bus layby, ii) Retaining walls, iii) Guard rails, iii) Fences, iv) Road markings, v) Traffic signs

5-2
5.2 REVIEW POLICY AND ADDITIONAL ITEMS UNDERTAKEN IN THIS STUDY
5.2.1 Review Policy
As the first step of the review, the 10 sections divided in the previous survey, which is based on the topography, land use, settlements, traffic characteristics, construction planning, project components etc., is re-grouped into 4 sections reconsidering the characteristic of the project, and project components.
The design speed, alignment condition, components included, pavement types and scale of earthwork of each re-grouped section are arranged and evaluated and the review policy(ies) for each section based on the evaluation is established as follows,
1)Section 1-2 (Suryabinayak to Nalinchowk), Section 5-7 (Sanga to Banepa Bazaar), Section 8-10 (East Banepa to Dhulikhel)
✓ Alignment modification will be undertaken at curves that do not meet the geometrical standards.
✓ Project components will be reviewed necessarily with the results of consultation with the DOR, but with consideration to economic viability.
✓ Pavement structure will be reviewed based on the results of traffic volumes forecasted using the output of additional traffic survey to be carried out under the Study.
2)Section 3-4 (Nalinchowk to Sanga Pass)
✓ Project Alignment will be modified emphasizing disaster resiliency, enhancement of level of service of the road, and consideration to natural and social environment.
✓ Pavement structure will be reviewed based on the results of traffic volumes forecasted using the output of additional traffic survey to be carried out under the Study.
5.2.2 Additional Items Undertaken
Review of the improvement plans proposed in the previous survey will take into consideration, in addition to the policies and concepts applied in the previous survey, the results of additional items (studies and surveys) carried out under this Study. These items are shown in the following.
1)Study of Alternate Route at Sanga Pass
The existing road at Sanga Pass was closed to traffics for several hours following slope failures about 2 months after the Nepal Earthquake. The collapse is believed to have been triggered by the torrential rain that washed away the soil potentially loosened by the 2015 Nepal Earthquake. The earthquake also caused massive damages to the existing roads and other infrastructures in and around Kathmandu. Since then, awareness of the GON for enhancing the resiliency of roads against such disasters has become increasingly high. One of its actions against such awareness is to re-consider the alignment at Sanga Pass proposed in the previous survey. Therefore, study for an

5-3
alternative route will be carried out taking into consideration that the route proposed is more disaster resilient, in addition to having higher travel service and less impact on natural and social environment of the area.
2)Traffic Survey
Following opening of Sindhuli Road in March 2015, the traffic volume on the objective road is reported to be increasing. Traffic survey under the previous preparatory survey in 2014 does not include the traffics attracted from Sindhuli Road. Therefore, traffic survey will be newly conducted under this survey. Results of additional survey is discussed in Chapter 6.
3)Traffic Demand Forecast
Based on the results of the traffic survey, the following items will be analyzed: (1) net increased traffic volume excluding vehicles passing through Sindhuli Road, (2) increase of traffic volume due to Sindhuli Road opening, and (3) Freight traffic volume from China. This is covered in detail in Chapter 7.
4)Engineering Surveys (Natural Condition Survey)
Topography and geo-technical investigation will be conducted at the area where tunnel is planned. The investigation items will be as follows;
・ Topography survey ・ Geo-technical investigation ・ Geophysical prospecting
All above surveys are covered in detail in Chapter 8.
5.3 REVIEW RESULTS
5.3.1 Objective Section and Number of Lanes
There will be no change in the objective section, which is between Suryabinayak-Dhulikhel. There will also be no change in the number of lanes to be applied. The traffic demand forecast based on the traffic volume data counted by the traffic survey conducted under this Study also indicates necessity of widening the existing 2-lanes to 4-lanes (for detail refer to Chapter 7).
5.3.2 Improvement of Alignment
(1)Re-alignment at Sanga Pass
The bypass proposed in the previous survey needs reconsideration. The above bypass runs along the mountain at the north of the existing road. Although the bypass has smoother horizontal alignment and countermeasures appropriately provided for slope stability, the review asks for a study to examine a possibility for a route including provision of a tunnel through Sanga Pass to attain an

5-4
even more resilient to natural disasters than the bypass. Details of the study is provided in Chapter 10 and the outline of the study is briefly summarized hereunder.
The study on re-alignment at Sanga Pass takes into consideration 2 new routes apart from the above-mentioned bypass. The first one is the route that basically follows the existing road but passes south of the existing road at the Sanga Pass. The second route, on the other hand passes further north than the bypass proposed in the previous survey. Both the newly considered alignments have a tunnel portion beneath the Sanga Pass (hereinafter tentatively called Sanga Tunnel). All the three routes are compared in terms of traffic comfort (alignment), cost, construction and maintenance efficiency and effects on natural and social environment. The route that passes south of the existing road is considered the optimum route as this alignment is requires least resettlement and land acquisition and has least adverse environmental impact, apart from being disaster resilient.
(2)Alignment at other Sections
1)Horizontal Alignment
The improved alignments, including the existing alignment at sections other than Sanga Pass do not need to be improved.
The horizontal alignment proposed meets the geometric requirements of Asian Highway. There are certain locations where minimum geometric values have been provided. These values are provided at sections where there are houses alongside or at high fill/high cut sections to avoid new resettlement and/or to minimize area of land acquisition.
2)Vertical Alignment
The vertical alignments proposed in the previous plan meet the required standards. Therefore, these alignments need not be improved and will remain unaltered.
Vertical alignment proposed in the previous survey basically follows that of the existing road, except at locations where the values do not meet with the requirement of Asian Highway. Reason for maintaining the elevation of the existing road is to minimize resettlement, relocation and land acquisition area and as measures against inundation (at Jagati and Banepa).
5.3.3 Review of Pavement Design
The pavement structure needs to be re-studied for the following reasons;
i) Traffic volume data used for traffic demand forecast is obsolete as it was obtained from traffic count survey conducted in 2014. The condition has been changed since then. Particularly, the completion and opening of the entire section of Sindhuli Road in 2015 is believed to have contributed in significant increase of traffics on the objective road.
ii) Review of pavement design is described in Chapter 12.

5-5
5.3.4 Review Results of Other Components
The result of the review is compiled in Table 5.3-1.
Table 5.3-1 Review Results of Components of Previous Survey
Components Description (Previous Survey) Review Results
i) Service tracks Provided at built-up areas (Suryabinayak – Jagati,Banepa, and Dhulikhel)
・ No additional provision of service tracks
ii) Intersections 7 locations, channelization (no traffic signals) Conduits for future installation considered
・ 8 locations (the merging point between existing road and bypass at Sanga) are newly studied
iii) Drainage system
Restoration of existing system ・ No change
iv) Reconstruction of existing bridges
4 bridges ・ No change
v) Footbridge 6 locations ・ No change
vi) River training 2 locations ・ No change
vii) Ancillaries Bus layby, Retaining walls, Guard rails, Fences, Road markings, Traffic signs
・ No change


CHAPTER 6
ADDITIONAL TRAFFIC SURVEY


6-1
CHAPTER 6 ADDITIONAL TRAFFIC SURVEY
6.1 OUTLINE OF TRAFFIC SURVEYS
Additional surveys are conducted under this Study to grasp the actual traffic volume plying along the objective road as the last traffic survey conducted on the objective road section was in 2015, during the previous survey, and the traffic volume of Sindhuli Road, after its completion in March 2015, has seen significant increase – several times more than it was estimated in the last survey.
The items, purpose and description of the surveys conducted are shown in Table 6.1-1. The locations where the surveys were conducted are given in Figure 6.1-1 to Figure 6.1-3 and the glimpses of the surveys are shown in Photo 6.1-1 to Photo 6.1-4.
Table 6.1-1 Description of Traffic Survey
Survey Item Purpose Description Traffic Volume Survey
The traffic count survey is carried out at 6 locations on the SD Road to obtain the traffic volume data and collected data is used for traffic demand forecast.
- Week day: Thursday, August 9, 2017, - 6 survey stations (5 Roadside and 1
Intersection), - Weekend day: Saturday, August 12, 2017 - 24-hour survey, - 10 classifications, - Take pictures with a video recorder and
count hourly and daily traffic volumes per vehicle type.
Travel Speed and Travel Time Survey
Travel speed and travel time is conducted to understand service level of existing road.
- Week day: Thursday, August 17, 2017, - 2way direction, ◇Travel speed survey - Steep slope road section - Large Bus or Large Truck, car, - Speed measuring instrument is used, ◇Travel time survey - SD Road (All sections:16km), - Stopwatch and GPS is used.
Roadside Origin Destination Survey (OD Survey)
The roadside OD survey is carried out to understand trip pattern of vehicle passing the plan section of SD Road. The collected data is used for basic information for traffic demand forecast.
- Week day: Thursday, August 9, 2017 - Weekend day: Saturday, August 12, 2017 - 2 survey station (Sanga, Dhulikhel-1) - 24-hour survey
Axle Load Survey
The Axle load survey is carried out to collect the actual loading data of heavy vehicle. The collected data is used as the basic information of pavement design.
- Week day: Friday, September 1, 2017 - Weekend day: Saturday, September 2,
2017 - 1 station - Large Bus, Large Truck
Vehicle Emission Test
The vehicle emission test is carried out in order to obtain the emission volume by vehicle type. The collected data is used as one of the basic information for air infiltration design of tunnel.
- Week day: Sunday, August 20, 2017 - Weekend day: Saturday, August 19, 2017 - 1 station - Car, Large Bus, Large Truck - Type of gas (CO, NOx, SOx)
Source: JICA Study Team

6-2
Source: JICA Study Team
Figure 6.1-1 Location of Traffic Survey Station (Traffic Volume Survey and OD Survey)
3_Sanga -Traffic Volume Survey -OD Survey
Sta.1 Suryabinayak -Traffic Volume Survey
Sta.2 PalanSe -Traffic Volume Survey
4_Bhaisepati -Traffic Volume Survey
5_Banepa -Traffic Volume Survey
To Sindhuli
7_Dhulikhel_2 -Traffic Volume Survey at Intersection
6_Dhulikhel_1 -OD Survey
To Kathmandu
To Kodari (Border of China)
SD Road (Arniko Highway)
Sindhuli Road
Arniko Highway

6-3
Source: JICA Study Team
Figure 6.1-2 Location of Travel Speed Survey
Source: JICA Study Team
Figure 6.1-3 Survey Route of Travel Time Survey
8_Travel Speed Survey (gradient:3.4%)
9_Travel Speed Survey (gradient:4.2%)
11_Travel Speed Survey (gradient:1.5%)
10_Travel Speed Survey (gradient:7.0%)
Sanga
Max 7%
Suryabinayak
Dhulikhel
Sanga
6.9km 8.8km

6-4
Source: JICA Study Team, 9th and 12th August 2017
Photo 6.1-1 Traffic Volume Survey
Source: JICA Study Team, 12th August 2017
Photo 6.1-2 Roadside Origin Destination Survey
Source: JICA Study Team, 1st September 2017
Photo 6.1-3 Axle Road Survey
Source: JICA Study Team, 19th August 2017
Photo 6.1-4 Vehicle Emission Test

6-5
6.2 TRAFFIC VOLUME
6.2.1 Traffic Volume
Traffic volumes are generally expressed in PCUs. PCU is a metric unit which represents various sized vehicles as one unit. This is calculated by using the equivalency factors. The equivalency commonly used and recommended by Nepal Road Standards 2070 are as shown in Table 6.2-1.
Table 6.2-1 Equivalency Factors in Terms of PCU
SN Vehicle Type PCU Equivalency Factor 1 Motorcycle 0.5 2 Car 1.0 3 Utility Vehicle 1.0 4 Microbus 1.5 5 Minibus 3.0 6 Bus 3.0 7 Light Truck 1.5 8 Heavy Truck 3.0 9 Multi Axle Truck 3.0 10 Other 1.0
Source: Nepal Road Standards 2070 (2013)
Table 6.2-2 shows the actual daily traffic counted on both directions (cross-sectional) by the survey and the volume expressed in terms of PCUs calculated by using the above equivalency factors.
Table 6.2-2 Summary of Traffic Count Survey on Weekday
*Heavy veh.;5.Mini Bus,6.Large Bus, 8.Heavy Truck, 9.Multi-axel Truck Source: Traffic survey result by JICA Study Team
According to the table above, the daily traffic volumes including motorcycle observed is 42,510 veh. on Sta.1 Suryabinayak, 20,713 veh. on Sta.2 PalanSe, 19,044 veh. on Sta.3 Sanga, 19,512 veh. on Sta.4 Bhaisepati, and 22,644 veh. on Sta.5 Banepa. The daily traffic volume on weekday by vehicle type is presented in Figure 6.2-1.
Similarly, the daily traffic volume excluding motorcycles counted are 15,722 veh. on Sta.1 Suryabinayak, 9,929 veh. on Sta.2 PalanSe, 9,672 veh. on Sta.3 Sanga, 9,766 veh. on Sta.4 Bhaisepati, and 10,551 veh.
Classification 1.Suryabinayak%
Total%
w/o MC2.PalanSe
%Total
%w/o MC
3.Sanga%
Total%
w/o MC4.Bhaisepati
%Total
%w/o MC
5.Banepa%
Total%
w/o MC1. Motor Cycle 26,788 63% 10,784 52% 9,372 49% 9,746 50% 12,093 53%2. Car & Taxi 6,679 16% 42% 4,179 20% 42% 3,509 18% 36% 3,798 19% 39% 4,054 18% 38%3. Utility Pick up 1,429 3% 9% 1,012 5% 10% 1,548 8% 16% 1,264 6% 13% 1,502 7% 14%4. Micro Bus 613 1% 4% 532 3% 5% 509 3% 5% 527 3% 5% 531 2% 5%5. Mini Bus 2,588 6% 16% 603 3% 6% 1,227 6% 13% 30 0% 0% 403 2% 4%6. Large Bus 541 1% 3% 815 4% 8% 150 1% 2% 1,354 7% 14% 1,103 5% 10%7. Light Truck 1,335 3% 8% 444 2% 4% 598 3% 6% 472 2% 5% 430 2% 4%8. Heavy Truck 2,152 5% 14% 2,098 10% 21% 1,958 10% 20% 2,051 11% 21% 2,218 10% 21%9. Multi-axel Truck 201 0% 1% 187 1% 2% 93 0% 1% 232 1% 2% 213 1% 2%10. Others 184 0% 1% 59 0% 1% 80 0% 1% 38 0% 0% 97 0% 1%Total(All type of Veh.) 42,510 100% - 20,713 100% - 19,044 100% - 19,512 100% - 22,644 100% - Share of Heavy Veh. 13% - - 18% - - 18% - - 19% - - 17% - - Share of Heavy truck. 6% - - 11% - - 11% - - 12% - - 11% - - PCU 41,054 - - 23,215 - - 21,768 - - 22,473 - - 24,952 - -Total(w/o 1.Motor Cycle) 15,722 - 100% 9,929 - 100% 9,672 - 100% 9,766 - 100% 10,551 - 100% Share of Heavy Veh. 35% - - 37% - - 35% - - 38% - - 37% - - Share of Heavy truck. 15% - - 23% - - 21% - - 23% - - 23% - - PCU 27,660 - - 17,823 - - 17,082 - - 17,600 - - 18,906 - -

6-6
on Sta.5 Banepa. The volumes by vehicle types are graphically shown in Figure 6.2-2.
Source: Traffic survey result by JICA Study Team
Figure 6.2-1 Daily Traffic Volume on Weekday, All Type
Source: Traffic survey result by JICA Study Team
Figure 6.2-2 Daily Traffic Volume on Weekday, Excluding Motorcycle
0
5,000
10,000
15,000
20,000
25,000
30,000
35,000
40,000
45,000
1.Suryabinayak 2.PalanSe 3.Sanga 4.Bhaisepati 5.Banepa
1. Motor Cycle
2. Car & Taxi
3. Utility Pick up
4. Micro Bus
5. Mini Bus
6. Large Bus
7. Light Truck
8. Heavy Truck
9. Multi-axel Truck
10. Others
0
2,000
4,000
6,000
8,000
10,000
12,000
14,000
16,000
18,000
1.Suryabinayak 2.PalanSe 3.Sanga 4.Bhaisepati 5.Banepa
2. Car & Taxi
3. Utility Pick up
4. Micro Bus
5. Mini Bus
6. Large Bus
7. Light Truck
8. Heavy Truck
9. Multi-axel Truck
10. Others
42,510
20,713 19,044 19,512 22,644
(Veh./day)
(Veh./day)
15,722
9,929 9,672 9,766 10,551

6-7
Table 6.2-3 shows the result of traffic count survey on Weekday at 1 intersection of Dhulikhel. According to this survey result, total daily traffic volume including motorcycle is 17,310 veh. on Kathmandu Section A, 10,801 veh. on Kodari Section B, and 9,453 veh. on Sindhuli Section C as shown in Figure 6.2-2. In the same way, total traffic volume excluding the motorcycle is 8,459 veh. on North Section A, 4,897 veh. on South Section B, and 4,656 veh. on West Section C shown in Figure 6.2-5.
The result of traffic count survey by direction is shown in Table 6.2-4. According to this survey result, total traffic volume including motorcycle are 9,329 veh. on Kathmandu - Kodari Direction A-B, 7,981 veh. on Kathmandu - Sindhuli Direction A-C, and 1,472 veh. on Kodari - Sindhuli Direction B-C shown in Figure 6.2-6. In the same way, total traffic volume excluding motorcycle are 4,350 veh. on Kathmandu - Kodari Direction A-B, 4,109 veh. on Kathmandu - Sindhuli Direction A-C, and 547 veh. on Kodari - Sindhuli Direction B-C as shown in Figure 6.2-7.
From this result, it was confirmed that the traffic volume in the Kathmandu - Kodari Direction between A and B is the largest, and the traffic volume in the Kodari - Sindhuli Direction between B and C is very small.
Source: JICA Study Team
Figure 6.2-3 Traffic Volume Survey at Dhulikhel Intersection
To Sindhuli
To Kathmandu
To Kodari (Border of China)
Kathmandu Section
Sindhuli Section
Kodari Section B B
A A
7_Dhulikhel_2 -Traffic Volume Survey at Intersection

6-8
Table 6.2-3 Summary of Cross Section Traffic Volume on Weekday at Dhulikhel Intersection
*Heavy veh.;5.Mini Bus,6.Large Bus, 8.Heavy Truck, 9.Multi-axel Truck
Source: JICA Study Team
Source: JICA Study Team
Figure 6.2-4 Daily Traffic Volume on Cross Section at Dhulikhel Intersection, All Type
ClassificationKathmandusection(A)
%Total
%w/o MC
Kodarisection(B)
%Total
%w/o MC
Sindhulisection(C)
%Total
%w/o MC
1. Motor Cycle 8,851 51% 5,904 55% 4,797 51%2. Car & Taxi 3,108 18% 37% 1,386 13% 28% 2,198 23% 47%3. Utility Pick up 884 5% 10% 614 6% 13% 486 5% 10%4. Micro Bus 470 3% 6% 25 0% 1% 461 5% 10%5. Mini Bus 520 3% 6% 386 4% 8% 212 2% 5%6. Large Bus 630 4% 7% 424 4% 9% 214 2% 5%7. Light Truck 523 3% 6% 365 3% 7% 264 3% 6%8. Heavy Truck 2,170 13% 26% 1,571 15% 32% 735 8% 16%9. Multi-axel Truck 48 0% 1% 36 0% 1% 12 0% 0%10. Others 106 1% 1% 90 1% 2% 74 1% 2%Total(All type of Veh.) 17,310 100% - 10,801 100% - 9,453 100% - Share of Heavy Veh. 19% - - 22% - - 12% - - Share of Heavy truck. 13% - - 15% - - 8% - - PCU 20,117 - - 12,878 - - 9,763 - -Total(w/o 1.Motor Cycle) 8,459 - 100% 4,897 - 100% 4,656 - 100% Share of Heavy Veh. 40% - - 49% - - 25% - - Share of Heavy truck. 26% - - 33% - - 16% - - PCU 15,692 - - 9,926 - - 7,365 - -
0
2,000
4,000
6,000
8,000
10,000
12,000
14,000
16,000
18,000
20,000
Kathmandu section(A) Kodari section(B) Sindhuli section(C)
1. Motor Cycle
2. Car & Taxi
3. Utility Pick up
4. Micro Bus
5. Mini Bus
6. Large Bus
7. Light Truck
8. Heavy Truck
9. Multi-axel Truck
10. Others
17,310
10,801 9,453
(Veh./day)

6-9
Source: JICA Study Team
Figure 6.2-5 Daily Traffic Volume on Cross Section at Dhulikhel Intersection, Excluding Motocycle
Table 6.2-4 Summary of Daily Traffic Count by Direction at Dhulikhel Intersection
Source: JICA Study Team
0
1,000
2,000
3,000
4,000
5,000
6,000
7,000
8,000
9,000
Kathmandu section(A) Kodari section(B) Sindhuli section(C)
2. Car & Taxi
3. Utility Pick up
4. Micro Bus
5. Mini Bus
6. Large Bus
7. Light Truck
8. Heavy Truck
9. Multi-axel Truck
10. Others
ClassificationKathmandu-Kodari(A-B)
%Total
%w/o MC
Kathmandu-Sindhuli(A-C)
%Total
%w/o MC
Kodari-Sindhuli(B-C)
%Total
%w/o MC
1. Motor Cycle 4,979 53% 3,872 49% 925 63%2. Car & Taxi 1,148 12% 26% 1,960 25% 48% 238 16% 44%3. Utility Pick up 506 5% 12% 378 5% 9% 108 7% 20%4. Micro Bus 17 0% 0% 453 6% 11% 8 1% 1%5. Mini Bus 347 4% 8% 173 2% 4% 39 3% 7%6. Large Bus 420 5% 10% 210 3% 5% 4 0% 1%7. Light Truck 312 3% 7% 211 3% 5% 53 4% 10%8. Heavy Truck 1,503 16% 35% 667 8% 16% 68 5% 12%9. Multi-axel Truck 36 0% 1% 12 0% 0% 0 0% 0%10. Others 61 1% 1% 45 1% 1% 29 2% 5%Total(All type of Veh.) 9,329 100% - 7,981 100% - 1,472 100% - Share of Heavy Veh. 25% - - 13% - - 8% - - Share of Heavy truck. 16% - - 9% - - 5% - - PCU 11,616 - - 8,501 - - 1,262 - -Total(w/o 1.Motor Cycle) 4,350 - 100% 4,109 - 100% 547 - 100% Share of Heavy Veh. 53% - - 26% - - 20% - - Share of Heavy truck. 35% - - 17% - - 12% - - PCU 9,127 - - 6,565 - - 800 - -
(Veh./day) 8,459
4,897 4,656

6-10
Source: JICA Study Team
Figure 6.2-6 Daily Traffic Volume by Direction at Dhulikhel Intersection
Source: JICA Study Team
Figure 6.2-7 Daily Traffic Volume by Direction at Dhulikhel Intersection, Excluding Motorcycle
6.2.2 Hourly Variation of Traffic Volume
Hourly Variation of Traffic Volume are shown in Figure 6.2-8 and Figure 6.2-9. Regarding the hourly variation for 24 hours, a similar trend was observed common to the 5 stations. However, the peak time differs with each station. The peak time at Sta.1 Suryabinayak is 11a.m., at Sta.2 PalanSe is 1p.m., at Sta.3 Sanga and at Sta.4 Bhaisepati and Sta.5 Banepa are 4p.m. A similar tendency is also observed at all stations for the fluctuation excluding the motorcycle and their peak time in all places are 4p.m.
0
1,000
2,000
3,000
4,000
5,000
6,000
7,000
8,000
9,000
10,000
Kathmandu-Kodari(A-B) Kathmandu-Sindhuli(A-C) Kodari-Sindhuli(B-C)
1. Motor Cycle
2. Car & Taxi
3. Utility Pick up
4. Micro Bus
5. Mini Bus
6. Large Bus
7. Light Truck
8. Heavy Truck
9. Multi-axel Truck
10. Others
0
500
1,000
1,500
2,000
2,500
3,000
3,500
4,000
4,500
5,000
Kathmandu-Kodari(A-B) Kathmandu-Sindhuli(A-C) Kodari-Sindhuli(B-C)
2. Car & Taxi
3. Utility Pick up
4. Micro Bus
5. Mini Bus
6. Large Bus
7. Light Truck
8. Heavy Truck
9. Multi-axel Truck
10. Others
(veh./day)
4,350 4,109
547
(veh./day)
9,329
7,981
1,472

6-11
Source: JICA Study Team
Figure 6.2-8 Hourly Variation of Traffic Volume
Source: JICA Study Team
Figure 6.2-9 Hourly Variation of Daily Traffic Volume, Excluding Motorcycle
Next, hourly variation of traffic volume on 3 road cross section at the Dhulikhel intersection is shown in Figure 6.2-10, Figure 6.2-11, Figure 6.2-12, and Figure 6.2-13. As a result of the survey, a similar trend was observed comon to 3 cross sections. The peak time at 3 cross sections and 3 direction are 4p.m. Traffic decreased gradually after 6p.m. and that of night time from 10p.m. to 4a.m. is very small.
0
500
1000
1500
2000
2500
3000
3500
4000
7 8 9 10 11 12 13 14 15 16 17 18 19 20 21 22 23 0 1 2 3 4 5 6
1.Suryabinayak 2.PalanSe 3.Sanga 4.Bhaisepati 5.Banepa
0
200
400
600
800
1000
1200
7 8 9 10 11 12 13 14 15 16 17 18 19 20 21 22 23 0 1 2 3 4 5 6
1.Suryabinayak 2.PalanSe 3.Sanga 4.Bhaisepati 5.Banepa
(veh./hour)
(veh./hour)

6-12
Source: JICA Study Team
Figure 6.2-10 Hourly Variation of Traffic Volume at Dhulikhel Intersection Cross Section, All Type of Vehicle
Source: JICA Study Team
Figure 6.2-11 Hourly Variation of Traffic Volume at Dhulikhel Intersection, Cross Section, Excluding Motorcycle
Source: JICA Study Team Figure 6.2-12 Hourly Variation of Traffic Volume at Dhulikhel Intersection, By Direction,
All Type of Vehicle
0
500
1000
1500
2000
2500
7 8 9 10 11 12 13 14 15 16 17 18 19 20 21 22 23 0 1 2 3 4 5 6
Kathmandu section (A) Kodari section (B) Sindhuli section (C)
0
200
400
600
800
1000
1200
7 8 9 10 11 12 13 14 15 16 17 18 19 20 21 22 23 0 1 2 3 4 5 6
Kathmandu section (A) Kodari section (B) Sindhuli section (C)
0
200
400
600
800
1000
1200
1400
7 8 9 10 11 12 13 14 15 16 17 18 19 20 21 22 23 0 1 2 3 4 5 6
Kathmandu-Kodari(A-B) Kathmandu-Sindhuli(A-C) Kodari-Sindhuli(B-C)(veh./hour)
(ver./hour)
(veh./hour)
A
B
A
B
Dhulikhel
A
B
A
B
C
C
Dhulikhel
A
B
A
B
Dhulikhel

6-13
Source: JICA Study Team
Figure 6.2-13 Hourly Variation of Traffic Volume at Dhulikhel Intersection, By Direction, Excluding Motorcycle
6.2.3 Traffic Composition and Share of Heavy Vehicle
Table 6.2-5 and Table 6.2-6 show the share of light vehicle and heavy vehicle. Figure 6.2-14 and Figure 6.2-15 illustrates traffic composition at 5 survey stations. The heavy vehicle consists of bus including Mini-bus, and Truck excluding light Truck.
According to the results of share of heavy vehicle excluding motorcycle, the ratio of heavy vehicle is high, and more than 35% at all stations. It is observed of approximately 38% at Sta.Bhaisepati and Sta.Banepa.
Table 6.2-5 Share of Heavy Vehicle at Five Survey Stations
Source: JICA Study Team
Table 6.2-6 Share of Heavy Vehicle Excluding Motorcycle at Five Survey Stations
Source: JICA Study Team
0
100
200
300
400
500
600
700
7 8 9 10 11 12 13 14 15 16 17 18 19 20 21 22 23 0 1 2 3 4 5 6
Kathmandu-Kodari(A-B) Kathmandu-Sindhuli(A-C) Kodari-Sindhuli(B-C)
1.Suryabinayak % 2.PalanSe % 3.Sanga % 4.Bhaisepati % 5.Banepa %
37,028 87% 17,010 82% 15,616 82% 15,845 81% 18,707 83%
Bus 3,129 7% 1,418 7% 1,377 7% 1,384 7% 1,506 7%
Truck 2,353 6% 2,285 11% 2,051 11% 2,283 12% 2,431 11%
42,510 100% 20,713 100% 19,044 100% 19,512 100% 22,644 100%
Classification
HeavyVehicle
Light Vehicle
Total
1.Suryabinayak % 2.PalanSe % 3.Sanga % 4.Bhaisepati % 5.Banepa %
10,240 65% 6,226 63% 6,244 65% 6,099 62% 6,614 63%
Bus 3,129 20% 1,418 14% 1,377 14% 1,384 14% 1,506 14%
Truck 2,353 15% 2,285 23% 2,051 21% 2,283 23% 2,431 23%
15,722 100% 9,929 100% 9,672 100% 9,766 100% 10,551 100%
Classification
Light Vehicle
HeavyVehicle
Total
(veh./hour)
A
B
A
B
Dhulikhel

6-14
Source: JICA Study Team
Figure 6.2-14 Traffic Composition at Five Survey Stations
Source: JICA Study Team
Figure 6.2-15 Traffic Composition of Excluding Motocycle at Five Survey Stations
63%
52%
49%
50%
53%
16%
20%
18%
19%
18%
3%
5%
8%
6%
7%
1%
3%
3%
3%
2%
3%
2%
3%
2%
2%
6%
3%
6%
2%
1%
4%
1%
7%
5%
5%
10%
10%
11%
10%
1%
0%
1%
1%
0% 20% 40% 60% 80% 100%
1.Suryabinayak
2.PalanSe
3.Sanga
4.Bhaisepati
5.Banepa
1. Motor Cycle
2. Car & Taxi
3. Utility Pick up
4. Micro Bus
7. Light Truck
5. Mini Bus
6. Large Bus
8. Heavy Truck
9. Multi-axel Truck
10. Others
13%
18%
18%
19%
18%
42%
42%
36%
39%
38%
9%
10%
16%
13%
14%
4%
5%
5%
5%
5%
8%
4%
6%
4%
16%
6%
13%
0%
4%
3%
8%
2%
14%
10%
14%
21%
20%
21%
21%
1%
2%
1%
2%
2%
0% 20% 40% 60% 80% 100%
1.Suryabinayak
2.PalanSe
3.Sanga
4.Bhaisepati
5.Banepa
2. Car & Taxi
3. Utility Pick up
4. Micro Bus
7. Light Truck
5. Mini Bus
6. Large Bus
8. Heavy Truck
9. Multi-axel Truck
10. Others
35%
37%
35%
38%
38%

6-15
Source: JICA Study Team
Figure 6.2-16 Share of Heavy Vehicle of All Type Vehicles at Five Stations
Source: JICA Study Team
Figure 6.2-17 Share of Heavy Vehicle Excluding Motocycle at Five Survey Stations
Figure 6.2-18 and Figure 6.2-19 illustrates traffic composition of cross sections at Dhulikhel intersection. The share of heavy vehicle excluding motorcycle at Kodari section (B) is approximately 49%.
Table 6.2-7 Share of Heavy Vehicle on Cross Section at Dhulikhel Intersection
Source: JICA Study Team
0%
10%
20%
30%
40%
50%
60%
70%
80%
7 8 9 10 11 12 13 14 15 16 17 18 19 20 21 22 23 0 1 2 3 4 5 6
1.Suryabinayak 2.PalanSe 3.Sanga 4.Bhaisepati 5.Banepa
0%
10%
20%
30%
40%
50%
60%
70%
80%
7 8 9 10 11 12 13 14 15 16 17 18 19 20 21 22 23 0 1 2 3 4 5 6
1.Suryabinayak 2.PalanSe 3.Sanga 4.Bhaisepati 5.Banepa
Kathmandusection(A)
%Kodari
section(B)%
Sindhulisection(C)
%
13,942 81% 8,384 78% 8,280 88%
Bus 1,150 7% 810 7% 426 5%
Truck 2,218 13% 1,607 15% 747 8%
17,310 100% 10,801 100% 9,453 100%
Classification
HeavyVehicle
Total
Light Vehicle

6-16
Table 6.2-8 Share of Heavy Vehicle Excluding Motor cycle on Cross Section at Dhulikhel Intersection
Source: JICA Study Team
Source: JICA Study Team
Figure 6.2-18 Traffic Composition on Cross Section at Dhulikhel Intersection
Source: JICA Study Team
Figure 6.2-19 Traffic Composition on Cross Section at Dhulikhel Intersection, Excluding Motorcycle
Kathmandusection(A)
%Kodari
section(B)%
Sindhulisection(C)
%
5,091 60% 2,480 51% 3,483 75%
Bus 1,150 14% 810 17% 426 9%
Truck 2,218 26% 1,607 33% 747 16%
8,459 100% 4,897 100% 4,656 100%
Light Vehicle
Total
HeavyVehicle
Classification
51%
55%
51%
18%
13%
23%
5%
6%
5%
3%
5%
3%
3%
3%
3%
4%
2…
4%
4%
2%
13%
15%
8%
0% 20% 40% 60% 80% 100%
Kathmandusection(A)
Kodarisection(B)
Sindhulisection(C)
1. Motor Cycle
2. Car & Taxi
3. Utility Pick up
4. Micro Bus
7. Light Truck
5. Mini Bus
6. Large Bus
8. Heavy Truck
9. Multi-axel Truck
10. Others
19%
22%
12%
37%
28%
47%
10%
13%
10%
6%
1%
10%
6%
7%
6%
6%
8%
5%
7%
9%
5%
26%
32%
16%
1%
1%
0%
0% 20% 40% 60% 80% 100%
Kathmandusection(A)
Kodarisection(B)
Sindhulisection(C)
2. Car & Taxi
3. Utility Pick up
4. Micro Bus
7. Light Truck
5. Mini Bus
6. Large Bus
8. Heavy Truck
9. Multi-axel Truck
10. Others25%
40%
49%

6-17
Source: JICA Study Team
Figure 6.2-20 Hourly Share of Heavy Vehicle on Cross Section at Dhulikhel Intersection
Source: JICA Study Team
Figure 6.2-21 Hourly Share of Heavy Vehicle on Cross Section at Dhulikhel Intersection, Excluding Motorcycle
Figure 6.2-22 and Figure 6.2-23 illustrate traffic composition by direction at Dhulikhel intersection. The share of heavy vehicle excluding motorcycle using Kathmandu-Kodari direction is approximately 53% , which is traffic flow between section A and B.
Table 6.2-9 Share of Light Vehicle Traffic Volume by Direction at Dhulikhel Intersection
Source: JICA Study Team
0%
10%
20%
30%
40%
50%
60%
70%
80%
7 8 9 10 11 12 13 14 15 16 17 18 19 20 21 22 23 0 1 2 3 4 5 6
Kathmandu section (A) Kodari section (B) Sindhuli section (C)
0%
10%
20%
30%
40%
50%
60%
70%
80%
90%
100%
7 8 9 10 11 12 13 14 15 16 17 18 19 20 21 22 23 0 1 2 3 4 5 6
Kathmandu section (A) Kodari section (B) Sindhuli section (C)
Kathmandu-Kodari(A-B)
%Kathmandu-
Sindhuli(A-C)%
Kodari-Sindhuli(B-C)
%
7,023 75% 6,919 87% 1,361 92%
Bus 767 8% 383 5% 43 3%
Truck 1,539 16% 679 9% 68 5%
9,329 100% 7,981 100% 1,472 100%
Classification
Light Vehicle
HeavyVehicle
Total

6-18
Table 6.2-10 Share of Heavy Vehicle Traffic Volume by Direction at Dhulikhel Intersection
Source: JICA Study Team
Source: JICA Study Team
Figure 6.2-22 Traffic Composition of Traffic by Direction at Dhulikhel Intersection
Source: JICA Study Team
Figure 6.2-23 Traffic Composition of Traffic by Direction at Dhulikhel Intersection,Excluding Motocycle
Kathmandu-Kodari(A-B)
%Kathmandu-
Sindhuli(A-C)%
Kodari-Sindhuli(B-C)
%
2,044 47% 3,047 74% 436 80%Bus 767 18% 383 9% 43 8%
Truck 1,539 35% 679 17% 68 12%4,350 100% 4,109 100% 547 100%
Light VehicleHeavyVehicle
Total
Classification
53%
49%
63%
12%
25%
16%
5%
5%
7%
6%
1%
3%
3%
4%
4%
2%
3%
5%
3%
16%
8%
5%
0% 20% 40% 60% 80% 100%
Kathmandu-Kodari(A-B)
Kathmandu-Sindhuli(A-C)
Kodari-Sindhuli(B-C)
1. Motor Cycle
2. Car & Taxi
3. Utility Pick up
4. Micro Bus
7. Light Truck
5. Mini Bus
6. Large Bus
8. Heavy Truck
9. Multi-axel Truck
10. Others
25%
13%
8%
26%
48%
44%
12%
9%
20%
0%
11%
1%
7%
5%
10%
8%
4%
7%
10%
5%
1%
35%
16%
12%
1%
0%
0%
0% 20% 40% 60% 80% 100%
Kathmandu-Kodari(A-B)
Kathmandu-Sindhuli(A-C)
Kodari-Sindhuli(B-C)
2. Car & Taxi
3. Utility Pick up
4. Micro Bus
7. Light Truck
5. Mini Bus
6. Large Bus
8. Heavy Truck
9. Multi-axel Truck
10. Others20%
53%
26%

6-19
Source: JICA Study Team
Figure 6.2-24 Share of Heavy Vehicle of All Type Vehicles (By Direction)
Source: JICA Study Team
Figure 6.2-25 Share of Heavy Vehicle of All Type Vehicles (By Direction), W/O Motorcycle
6.2.4 Share of Day–Night Time Traffic Volume
The share of day-night time traffic volume on 5 stations is shown in Table 6.2-11. The share of day-night time is between 1.13-1.15. That of Sta.5. Banepa is relatively low value. This means that the traffic of nighttime is a little larger in comparison to other four stations.
The share of day-night time traffic volume at Dhulikhel intersection is shown in Table 6.2-12, Table 6.2-13. The share of day-night time is between 1.12-1.13 at this intersection.
0%
10%
20%
30%
40%
50%
60%
70%
80%
90%
100%
7 8 9 10 11 12 13 14 15 16 17 18 19 20 21 22 23 0 1 2 3 4 5 6
Kathmandu-Kodari(A-B) Kathmandu-Sindhuli(A-C) Kodari-Sindhuli(B-C)
0%
10%
20%
30%
40%
50%
60%
70%
80%
90%
100%
7 8 9 10 11 12 13 14 15 16 17 18 19 20 21 22 23 0 1 2 3 4 5 6
Kathmandu-Kodari(A-B) Kathmandu-Sindhuli(A-C) Kodari-Sindhuli(B-C)

6-20
Table 6.2-11 Share of Day- Night Time Traffic Volume
(veh.)
Source: JICA Study Team
Table 6.2-12 Share of Day- Night Time Traffic Volume on Cross Section at Dhulikhel Intersection
(veh.)
Source: JICA Study Team
Table 6.2-13 Share of Day- Night Time Traffic Volume by Direction at Dhulikhel Intersection
(veh.)
Source: JICA Study Team
6.2.5 Comparison of Weekday-Holiday
(1) Traffic Volume
In this section, a comparative analysis of traffic on weekday and holiday is done with the traffic survey result on Sta.3 Sanga. Traffic Volume Comparison at Sanga is shown in Table 6.2-14 and Figure 6.2-26 and Figure 6.2-27. Regarding the total daily traffic volume including motorcycle, the holiday traffic volume is 1.01 times larger than that of weekday.
1.Suryabinayak 2.PalanSe 3.Sanga 4.Bhaisepati 5.Banepa
Day time (7 am - 19 pm) 37,341 17,935 16,543 17,053 20,027
Night time (19 pm - 7 am) 5,169 2,778 2,501 2,459 2,617
Total 42,510 20,713 19,044 19,512 22,644
Total / Day time 1.14 1.15 1.15 1.14 1.13
Kathmandu section(A)
Kodari section(B)
Sindhuli section(C)
Day time (7 am - 19 pm) 15,351 9,580 8,405
Night time (19 pm - 7 am) 1,959 1,221 1,048
Total 17,310 10,801 9,453
Total / Day time 1.13 1.13 1.12
Kathmandu-Kodari(A-B)
Kathmandu-Sindhuli(A-C)
Kodari-Sindhuli(B-C)
Day time (7 am - 19 pm) 8,263 7,088 1,317
Night time (19 pm - 7 am) 1,066 893 155
Total 9,329 7,981 1,472
Total / Day time 1.13 1.13 1.12

6-21
Table 6.2-14 Traffic Volume Comparison at Sta.3 Sanga
Source: JICA Study Team
Source: JICA Study Team
Figure 6.2-26 Comparison of Total Traffic Volume Excluding Motor cycle at Sta.3 Sanga
ClassificationWeek day
(a)%
Total%
w/o MCHoliday
(b)%
Total%
w/o MC b/a
1. Motor Cycle 9,372 49% 9,785 51% 1.042. Car & Taxi 3,509 18% 36% 3,905 20% 41% 1.113. Utility Pick up 1,548 8% 16% 1,305 7% 14% 0.844. Micro Bus 509 3% 5% 583 3% 6% 1.155. Mini Bus 1,227 6% 13% 861 4% 9% 0.706. Large Bus 150 1% 2% 355 2% 4% 2.377. Light Truck 598 3% 6% 384 2% 4% 0.648. Heavy Truck 1,958 10% 20% 1,952 10% 20% 1.009. Multi-axel Truck 93 0% 1% 173 1% 2% 1.8610. Others 80 0% 1% 67 0% 1% 0.84Total(All type of Veh.) 19,044 100% - 19,370 100% - 1.02 Share of Heavy Veh. 18% - - 17% - - - Share of Heavy truck. 11% - - 11% - - - PCU 21,768 - - 21,643 - - 0.99Total(w/o 1.Motor Cycle) 9,672 - 100% 9,585 - 100% 0.99 Share of Heavy Veh. 35% - - 35% - - - Share of Heavy truck. 21% - - 22% - - - PCU 17,082 - - 16,751 - - 0.98
0
2,000
4,000
6,000
8,000
10,000
12,000
Weekday Holiday
2. Car & Taxi
3. Utility Pick up
4. Micro Bus
5. Mini Bus
6. Large Bus
7. Light Truck
8. Heavy Truck
9. Multi-axel Truck
10. Others
9,672 9,585
(Veh./day)

6-22
Source: JICA Study Team
Figure 6.2-27 Hourly Variation of Weekday and Holiday at Sta.3 Sanga
(2) Traffic Composition
Source: JICA Study Team
Figure 6.2-28 Traffic Composition of Week-Day and Holiday at Sta.3 Sanga
(3) Ratio of Heavy Vehicle
The rate of heavy vehicle traffic is almost same tendency between weekday traffic and holiday traffic at Sanga survey station.
Table 6.2-15 Rate of Large Size Vehicle Traffic Excluding Motorcycle at Sta.3 Sanga
Source: JICA Study Team
0
200
400
600
800
1000
1200
1400
1600
7 8 9 10 11 12 13 14 15 16 17 18 19 20 21 22 23 0 1 2 3 4 5 6
Weekday Holiday
36% 41%
16%14%
5% 6%
13% 9%2% 4%6% 4%
20% 20%
1% 2%1% 1%
0%
20%
40%
60%
80%
100%
Weekday Holiday
2. Car & Taxi
3. Utility Pick up
4. Micro Bus
5. Mini Bus
6. Large Bus
7. Light Truck
8. Heavy Truck
9. Multi-axel Truck
10. Others
Weekday % Holiday %
6,244 65% 6,244 65%
Bus 1,377 14% 1,216 13%
Truck 2,051 21% 2,125 22%
9,672 100% 9,585 100%
Light Vehicle
HeavyVehicle
Total
Classification
(Veh./hour)

6-23
Source: JICA Study Team
Figure 6.2-29 Hourly Ratio of Large Size Vehicle Traffic with Week-Day and Holiday at Sta.3 Sanga
6.3 TRAVEL SPEED AND TRAVEL TIME
6.3.1 Travel Speed
The spot travel speed survey was conducted to grasp the impact of speed down due to steep gradient. The targets of vehicle type are a passenger car, large size bus and heavy truck. Four selected survey points have steep gradients;1.5%, 3.4%, 4.2%, 7.0%. The survey results of 10 samples which are collected each direction of uphill and downhill are shown in Table 6.3-1.
Table 6.3-1 Result of Spot Travel Speed Survey
Source: JICA Study Team
Figure 6.3-1 shows the relation between gradient and spot speed of the heavy truck and large bus on uphill. The average speed on a gradient of 1.5% is 32.3 km/hr, on a gradient of 3.4% is 30.1km/hr, 2 on a gradient of 4.2% is 6.4km/hr, and on a gradient of 7.0% 17.4km/hr. The speed decreaed around 7% on the gradient change from 1.5% to 3.4%, around 12% on the gradient change from 3.4% to 4.2%, 34%on the gradient change from 4.2% and 7.0%.
0%
10%
20%
30%
40%
50%
60%
70%
7 8 9 10 11 12 13 14 15 16 17 18 19 20 21 22 23 0 1 2 3 4 5 6
Weekday Holiday
1 2 3 4 5 6 7 8 9 10Light Vehicle 30.6 45.1 38.6 35.4 48.3 29.0 49.9 32.2 45.1 35.4 38.9 29.0 49.9
Heavy Truck and Large Bus 35.4 37.0 35.4 35.4 32.2 32.2 29.0 30.6 27.4 29.0 32.3 27.4 37.0Light Vehicle 43.5 77.2 33.8 49.9 40.2 43.5 37.0 38.6 45.1 35.4 44.4 33.8 77.2
Heavy Truck and Large Bus 19.3 37.0 30.6 32.2 32.2 40.2 40.2 37.0 35.4 35.4 34.0 19.3 40.2Light Vehicle 43.5 45.1 29.0 37.0 40.2 38.6 32.2 35.4 43.5 41.8 38.6 29.0 45.1
Heavy Truck and Large Bus 41.8 32.2 30.6 30.6 29.0 24.1 24.1 37.0 38.6 40.2 32.8 24.1 41.8Light Vehicle 33.8 40.2 37.0 37.0 35.4 30.6 45.1 37.0 41.8 37.0 37.5 30.6 45.1
Heavy Truck and Large Bus 35.4 37.0 33.8 30.6 29.0 29.0 27.4 27.4 27.4 24.1 30.1 24.1 37.0Light Vehicle 33.8 32.2 32.2 43.5 37.0 37.0 49.9 33.8 38.6 37.0 37.5 32.2 49.9
Heavy Truck and Large Bus 27.4 25.7 38.6 32.2 29.0 38.6 29.0 33.8 35.4 29.0 31.9 25.7 38.6Light Vehicle 33.8 35.4 35.4 38.6 27.4 38.6 38.6 40.2 33.8 29.0 35.1 27.4 40.2
Heavy Truck and Large Bus 32.2 32.2 22.5 20.9 24.1 25.7 24.1 24.1 25.7 32.2 26.4 20.9 32.2Light Vehicle 38.6 25.7 38.6 30.6 27.4 38.6 38.6 35.4 37.0 33.8 34.4 25.7 38.6
Heavy Truck and Large Bus 33.8 24.1 25.7 24.1 30.6 30.6 27.4 32.2 38.6 29.0 29.6 24.1 38.6Light Vehicle 37.0 33.8 37.0 38.6 25.7 24.1 25.7 35.4 32.2 24.1 31.4 24.1 38.6
Heavy Truck and Large Bus 17.7 19.3 17.7 19.3 17.7 14.5 19.3 17.7 14.5 16.1 17.4 14.5 19.3
10 7.0downhill to Kathmandu
uphill from Kathmandu
Min Max
9 4.2downhill to Kathmandu
uphill from Kathmandu
8 3.4downhill to Kathmandu
uphill from Kathmandu
11 1.5uphill to Kathmandu
downhill from Kathmandu
PointRoad Grade
(%) direction By car typeSpeed (KPH)
Ave

6-24
Source: JICA Study Team
Figure 6.3-1 Speed by Gradient on Uphill of Heavy Truck and Large Bus
Figure 6.3-2 shows the relation between the gradient and spot speed of the passenger car.s The average speed on the gradient of 1.5% is 38.9km/hr, on the gradient of 3.4% is 37.5km/hr, on the gradient of 4.2% is 35.1km/hr, and on the gradient of 7.0% is 31.4 km/hr.
Source: JICA Study Team
Figure 6.3-2 Speed by Gradient on Uphill of Light Vehicle
Figure 6.3-3 is comparison of the ratio of speed decline between heavy vehicle and light vehicle. The rate of decrease in speed of heavy vehicle is remarkable.
0.0
5.0
10.0
15.0
20.0
25.0
30.0
35.0
40.0
45.0
50.0
0.0 1.0 2.0 3.0 4.0 5.0 6.0 7.0 8.0
0.0
5.0
10.0
15.0
20.0
25.0
30.0
35.0
40.0
45.0
50.0
55.0
60.0
0.0 1.0 2.0 3.0 4.0 5.0 6.0 7.0 8.0
(Spot speed: km/hr)
(Gradient: %)
(Gradient: %)
(Spot speed: km/hr)

6-25
Source: JICA Study Team
Figure 6.3-3 Comparison of Speed Reduction of Large Vehicle and Light Vehicle
Figure 6.3-4 is comparison of speed between heavy vehicle and light vehicle. Between a heavy vehicle and a light vehicle, there is a speed difference of 7.7km/hr on the gradient of 3.5%, and 14.0km/hr on the gradient of 7.0%.
Source: JICA Study Team
Figure 6.3-4 Comparison of Speed of Large Vehicle and Light Vehicle
On the Sanga section with the gradient of 7%, long car queue and low speed driving were observed due to the blocking by heavy trucks and large buses that are running at the head of long car queue with very low running speed (Photo 6.3-1).
0.0
0.2
0.4
0.6
0.8
1.0
1.2
0.0 0.5 1.0 1.5 2.0 2.5 3.0 3.5 4.0 4.5 5.0 5.5 6.0 6.5 7.0 7.5 8.0
Heavy Truck and Large Bus Light Vehicle
0.0
5.0
10.0
15.0
20.0
25.0
30.0
35.0
40.0
45.0
0.0 0.5 1.0 1.5 2.0 2.5 3.0 3.5 4.0 4.5 5.0 5.5 6.0 6.5 7.0 7.5 8.0
Heavy Truck and Large Bus Light Vehicle
(Gradient: %)
(Gradient: %)
(Spot speed: km/hr)
7.7km/hr
14.0km/hr

6-26
Source: JICA Study Team, 17th August 2017
Photo 6.3-1 Traffic Hindrance by Large Vehicles on The Gradient Section of Sanga
6.3.2 Travel Time
Travel time survey was conducted once a daytime between Suryabinayak and Dhulikhel. Travel time from Suryabinayak to Sanga is 30.7 min. and travel time from Sanga to Dhulikhel is 15.4 min. And total travel time between Suryabinayak and Dhulikhel (15.7 km) is 46.1 min.
For the opposite route, travel time from Dhulikhel to Sanga is 17.0 min. and travel time from Sanga to Suryabinayak is 12.3 min. And total travel time is 29.3 min from Dhulikhel to Suryabinayak. As a consequence of passage of Sanga section with steep slope, the difference of reqired time between uphill route and downhill route was 17 min. The survey result are shown in Table 6.3-2. In addition, the speed of a large vehicle was calculated by using the model formula in Section 6.3.1.

6-27
Table 6.3-2 Travel Time Survey Result
Source: JICA Study Team
6.4 ORIGIN-DESTINATION PATTERN
6.4.1 Characteristics of Traffic Composition
OD survey was conducted to understand the traffic flow on the road of SD Road section. The current traffic flow is analyzed based on the OD survey results. OD zone for analysis is conducted for 14 zones, which consist of 12 zones of Nepal and 2 zones of India and China. The locations are shown in Figure 6.4-1 and Table 6.4-1. OD survey results are taken for the enlargement process using the traffic count survey. OD pattern is examined the data after magnification correction to daily amount using the traffic count survey result.
Max 7%
S→D(Out-going)
D→S(In-coming)
S→D(Out-going)
D→S(In-coming)
S→D(Out-going)
D→S(In-coming)
S→D(Out-going)
D→S(In-coming)
Section1 1,860 0.0 22.5 37.0 18.7 30.7 5.0 3.0 6.0 3.6Section2 2,340 3.5 13.5 39.0 10.7 30.8 10.4 3.6 13.1 4.6Section3 2,550 5.5 10.0 27.0 6.9 18.5 15.3 5.7 22.2 8.3Section4 850 2.5 26.5 29.0 21.7 23.7 1.9 1.8 2.4 2.2
Sanga~Banepa Section5 3,200 1.0 37.0 29.0 30.9 24.2 5.2 6.6 6.2 7.9Banepa city area Section6 2,180 0.5 36.0 33.0 30.0 27.5 3.6 4.0 4.4 4.8
Section7 1,010 1.0 36.0 36.5 30.0 30.5 1.7 1.7 2.0 2.0Section8 140 3.0 32.0 32.0 25.8 25.8 0.3 0.3 0.3 0.3Section9 1,250 3.5 34.0 34.0 26.9 26.9 2.2 2.2 2.8 2.8Section10 320 2.0 36.0 36.0 29.8 29.8 0.5 0.5 0.6 0.6
15,700 20.4 32.2 15.7 25.4 46.1 29.3 60.0 37.1
SectionRoad
Length(m)
Gradient(%)
Travel Speed (km/hr) Travel Time (min)Light Vehicle Large Vehicle Light Vehicle Large Vehicle
Suryabinayak~Sanga
Sanga tunnel section
Banepa~Dhilikhel
L=140m Section1 (Bhaktapur)
L=1,860m Section4 L=850m
Section5 L=3,200m
Section7 L=1,010m
Section9 L=1,250m
Section10(Dhulikel) Section8
Section2 L=2,340m
Section3 L=2,550m
Section6 L=2,180m
L=320m
Suryabinayak
Dhulikhel
Sanga

6-28
Source: JICA Study Team
Figure 6.4-1 Map of OD Zoning System
Table 6.4-1 OD Zoning Code
Source: JICA Study Team
1. Far-Mid Western
2. Western
10. Eastern
14. China
13. India
12. Central South-East
3. Central West
11.Sindhule
5. Kathmandu&Latipur
8. Kavrepalanchok
6. Bhaktapur
9. Central North-East
4. Central North
7. Sindhupalchok
3. Central West
10. Eastern
2. Western
8. Kavrepalanchok
6. Bhaktapur
4. Central North
7. Sindhupalchok
5. Kathmandu&Latipur
12. Central South-East
11.Sindhule
9. Central North-East
SQ Zone Name Region / Development Zone District / VDC/Municipality
1 Far and Mid-WesternFar-Western RegionMid-Western Region
All district
2 Western Western Region All district (incl. Pokhara)
3 Central WestCentral Region / Narayani zone (withDhading)
All district, Dhading district
4 Central North - Rasuwa, Nuwakot5 Kathmandu & Latipur - Kathmandu, Lalitpur6 Bhaktapur - Bhaktapur7 Sindhupalchok - Sindhupalchok8 Kavrepalanchok - Kavrepalanchok9 Central North-East - Dolakha, Ramechhap
10 Eastern Eastern Region All district11 Sindhuli - Sindhuli12 Central South-East Sarlahi, Mahottari, Dhanusa13 India - -14 China - -

6-29
(1)Purpose of Trip
The share of travel purpose of all types of vehicles on weekday at Sanga is illustrated in Figure 6.4-2 and Table 6.4-2 and that of on holiday at Sanga is illustrated in Figure 6.4-3 and Table 6.4-3. For both weekday and holiday, most of purpose is for business.
Source: JICA Study Team
Figure 6.4-2 Purpose of Trip by All Type of Vehicle on Weekday
Table 6.4-2 Detail Data of Purpose of Trip by All Type of Vehicle on Weekday
Source: JICA Study Team
2% 1%
68%
27%
2% 1%
1,TO/FROM WORK
2.TO/FROM SCHOOL
3.BUSINESS
4.PRIVATE
5,LEASURE/TOURISM
6.OTHERS

6-30
Source: JICA Study Team
Figure 6.4-3 Purpose of Trip by All Type of Vehicle on Holiday
Table 6.4-3 Detail Data of Purpose of Trip by All Type of Vehicle on Holiday
Source: JICA Study Team
(2)The Average Number of Passengers
The average number of passengers per vehicle type was surveyed in the roadside OD survey. The average number of passengers on weekday at Sanga is illustrated in Figure 6.4-4 and Table 6.4-4 and that of on holiday at Sanga is illustrated in Figure 6.4-5 and Table 6.4-5.
1% 0%
67%
27%
4%
0%
1,TO/FROM WORK
2.TO/FROM SCHOOL
3.BUSINESS
4.PRIVATE
5,LEASURE/TOURISM
6.OTHERS

6-31
Source: JICA Study Team
Figure 6.4-4 Average Number of Passengers on Weekday
Table 6.4-4 Detail Data of Average Number of Passengers by Type of Vehicle on Weekday
Source: JICA Study Team
Source: JICA Study Team
Figure 6.4-5 Average Number of Passengers on Holiday
Table 6.4-5 Detail Data of Average Number of Passengers by Type of Vehicle on Holiday
Source: JICA Study Team
Car & Taxi Utility Pick up Micro Bus Mini Bus Large Bus Light Truck Heavy Truck Multi-axel Truck Others3.9 3.2 12.6 28.6 31.0 2.3 1.9 2.1 2.1
Car & Taxi Utility Pick up Micro Bus Mini Bus Large Bus Light Truck Heavy Truck Multi-axel Truck Others4.5 2.6 11.5 26.9 28.5 2.3 2.0 2.2 2.4

6-32
(3)Ratio of Loading Truck and Empty Truck
Rate of loading truck and empty truck at Sanga is shown in Figure 6.4-6 and Figure 6.4-7. On weekday, 80% of trucks of westbound, which is into Kathmandu, are loaded. In contrast, the empty trucks in the direction out of the Kathmandu account for 83%. On holiday, 80% of trucks of westbound, which is into Kathmandu, is loaded. In contrast, empty trucks in the direction out of the Kathmandu account for 89%.
*Truck;7.Light Truck, 8.Heavy Truck, 9.Multi-axel Truck
Source: JICA Study Team
Figure 6.4-6 Loading Rate of Truck by Direction on Weekday
*Truck;7.Light Truck, 8.Heavy Truck, 9.Multi-axel Truck
Source: JICA Study Team
Figure 6.4-7 Loading Rate of Truck by Direction on Holiday
17%
80%
48%
83%
20%
52%
0%
20%
40%
60%
80%
100%
Eastbound Westbound TOTAL
Empty
Loaded
11%
80%
47%
89%
20%
53%
0%
20%
40%
60%
80%
100%
Eastbound Westbound TOTAL
Empty
Loaded

6-33
(4)Average Loading Weight of Heavy Truck
Average Loading Weight of Heavy Truck at Sanga is shown in Table 6.4-6 and Table 6.4-7.
Table 6.4-6 Average Loading Weight of Heavy Truck on Weekday
*Heavy Truck; 8.Heavy Truck, 9.Multi-axel Truck
Source: JICA Study Team
Table 6.4-7 Average Loading Weight of Heavy Truck on Holiday
*Heavy Truck; 8.Heavy Truck, 9.Multi-axel Truck
Source: JICA Study Team
(5)Commodity Type
Commodity Type of Truck at Sanga is shown in Figure 6.4-8 and Figure 6.4-9.

6-34
*Truck;7.Light Truck, 8.Heavy Truck, 9.Multi-axel Truck
Source: JICA Study Team
Figure 6.4-8 Commodity Type of Truck on Weekday
*Truck;7.Light Truck, 8.Heavy Truck, 9.Multi-axel Truck
Source: JICA Study Team
Figure 6.4-9 Commodity Type of Truck on Holiday
6.4.2 Origin-Destination Matrix at Road of Sanga Pass Section
Origin-Destination Matrix of All Type Vehicles is shown in Table 6.4-8 and Table 6.4-9. From Origin-Destination Matrix of total traffic, the largest traffic passing Sanga Pass section is between Kathmandu & Latipur (zone 5) and Kavrepalanchok (zone 8), accounting for about 50%. In addition, there are a lot of traffic from Sindhuli Road Area. In addition, the utilization traffic between the adjacent Kathmandu & Latipur (zone 5), Bhaktapur (zone 6), Sindhupalchok (zone7), and Kavrepalanchok (zone 8) is about 80%. From the result of desire line of All Type Vehicles, the short-length or mid-length trip is major trip. This trend is the same on weekdays and holidays.
5% 4%4% 3%
84% 84%
3% 3%3% 3%2% 2%
0%
20%
40%
60%
80%
100%
Number of Volume Weigth
Fuel (Gas)
Agricultural product
Livestock products
Construction material
Machinery, Equipment
Food Product
Others
2% 2%3% 3%1% 1%
90% 90%
3% 3%1% 1%
0%
20%
40%
60%
80%
100%
Number of Volume Weigth
Fuel (Gas)
Agricultural product
Livestock products
Construction material
Machinery, Equipment
Food Product
Others

6-35
Table 6.4-8 Origin-Destination Matrix of All Type Vehicles on Weekday
Source: JICA Study Team
Table 6.4-9 Origin-Destination Matrix of All Type Vehicles on Holiday
Source: JICA Study Team

6-36
Source: JICA Study Team
Figure 6.4-10 Desire Line of All Type Vehicles on Weekday (veh./day)
Source: JICA Study Team
Figure 6.4-11 Desire Line of All Type Vehicles on Weekday (%)
凡例
- 10 veh/day
- 100 veh/day
- 500 veh/day
- 1000 veh/day
1000 veh/day -
Kathmandu & Latipur Bhaktapur
Sindhupalchok
Kavrepalanchok
Eastern
India
China
凡例
- 2.5%
- 5.0%
- 10%
- 15%
15% -
Kathmandu & Latipur Bhaktapur
Kavrepalanchok
India
China

6-37
Source: JICA Study Team
Figure 6.4-12 Desire Line of All Type Vehicles on Holiday (veh./day)
Source: JICA Study Team
Figure 6.4-13 Desire Line of All Type Vehicles on Holiday (%)
凡例
- 10 veh/day
- 100 veh/day
- 500 veh/day
- 1000 veh/day
1000 veh/day -
Kathmandu & Latipur Bhaktapur
Sindhupalchok
Kavrepalanchok
Eastern
India
China
凡例
- 2.5%
- 5.0%
- 10%
- 15%
15% -
Kathmandu & Latipur Bhaktapur
Kavrepalanchok
India
China
Sindhupalchok

6-38
Next, the concentrated traffic volume generated by each type of vehicle in each zone is shown in Figure 6.4-14 and Figure 6.4-15.
Source: JICA Study Team
Figure 6.4-14 The Concentrated Traffic Volume Generated by Each Type of Vehicle on Weekday
Source: JICA Study Team
Figure 6.4-15 The Concentrated Traffic Volume Generated by Each Type of Vehicle on Holiday
2000 4000 6000 8000 10000
1.Far and Mid-Western
2.Western
3.Central West
4.Central North
5.Kathmandu & Latipur
6.Bhaktapur
7.Sindhupalchok
8.Kavrepalanchok
9.Central North-East
10.Eastern
11.Sindhuli
12.Central South-East
13.India
14.China
passenger Car Bus Truck Other(TE)
2000 4000 6000 8000 10000
1.Far and Mid-Western
2.Western
3.Central West
4.Central North
5.Kathmandu & Latipur
6.Bhaktapur
7.Sindhupalchok
8.Kavrepalanchok
9.Central North-East
10.Eastern
11.Sindhuli
12.Central South-East
13.India
14.China
passenger Car Bus Truck Other (TE)
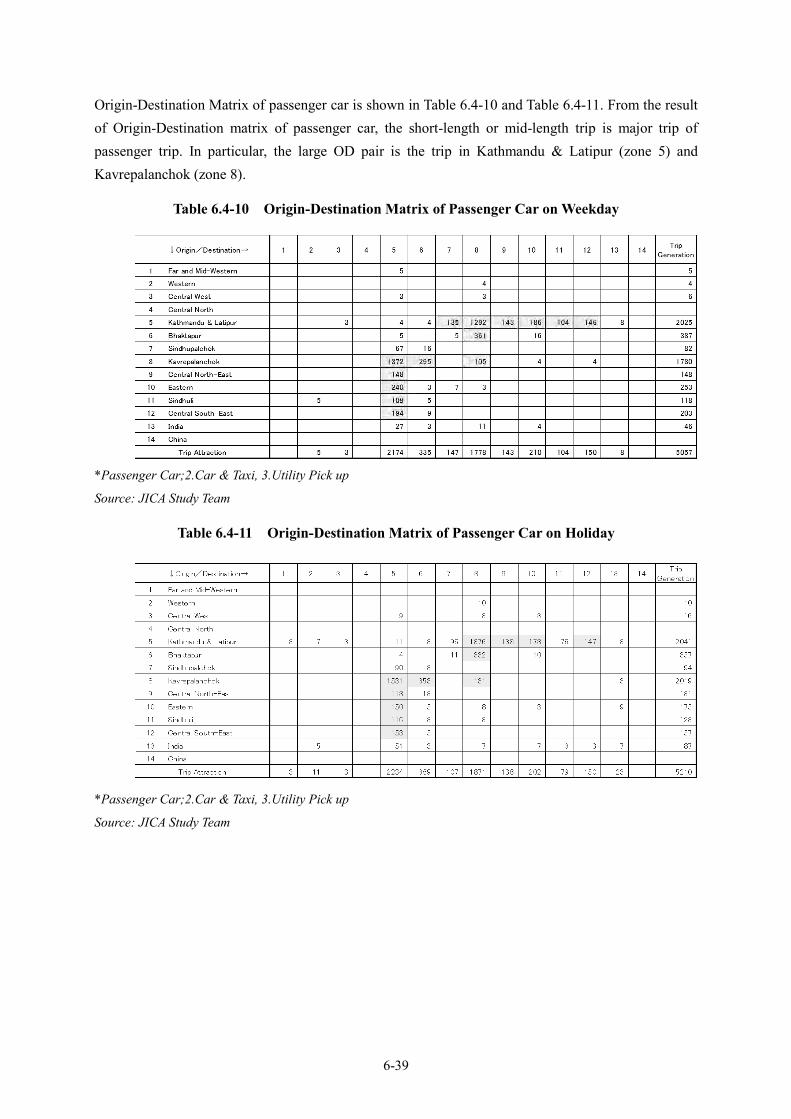
6-39
Origin-Destination Matrix of passenger car is shown in Table 6.4-10 and Table 6.4-11. From the result of Origin-Destination matrix of passenger car, the short-length or mid-length trip is major trip of passenger trip. In particular, the large OD pair is the trip in Kathmandu & Latipur (zone 5) and Kavrepalanchok (zone 8).
Table 6.4-10 Origin-Destination Matrix of Passenger Car on Weekday
*Passenger Car;2.Car & Taxi, 3.Utility Pick up
Source: JICA Study Team
Table 6.4-11 Origin-Destination Matrix of Passenger Car on Holiday
*Passenger Car;2.Car & Taxi, 3.Utility Pick up
Source: JICA Study Team

6-40
Source: JICA Study Team
Figure 6.4-16 Desire Line of Passenger Car on Weekday (veh./day)
Source: JICA Study Team
Figure 6.4-17 Desire Line of Passenger Car on Weekday (%)
凡例
- 10 veh/day
- 100 veh/day
- 500 veh/day
- 1000 veh/day
1000 veh/day -
Kathmandu & Latipur Bhaktapur
Kavrepalanchok
India
China
凡例
- 2.5%
- 5.0%
- 10%
- 15%
15% -
Kathmandu & Latipur Bhaktapur
Kavrepalanchok
India
China

6-41
Source: JICA Study Team
Figure 6.4-18 Desire Line of Passenger Car on Holiday (veh./day)
Source: JICA Study Team
Figure 6.4-19 Desire Line of Passenger Car on Holiday (%)
凡例
- 10 veh/day
- 100 veh/day
- 500 veh/day
- 1000 veh/day
1000 veh/day -
Kathmandu & Latipur Bhaktapur
Kavrepalanchok
Eastern
India
China
凡例
- 2.5%
- 5.0%
- 10%
- 15%
15% -
Kathmandu & Latipur Bhaktapur
Kavrepalanchok
India
China

6-42
Origin-Destination matrix of bus is shown in Table 6.4-12 and Table 6.4-13. Regarding the trip of bus that are used mainly for tourist trip, the large OD pair is the trip in Kathmandu & Latipur (zone 5) and Kavrepalanchok (zone 8).
Table 6.4-12 Origin-Destination Matrix of Bus on Weekday
*Bus;4.Micro Bus, 5.Mini Bus, 6.Large Bus
Source: JICA Study Team
Table 6.4-13 Origin-Destination Matrix of Bus on Holiday
*Bus;4.Micro Bus, 5.Mini Bus, 6.Large Bus
Source: JICA Study Team

6-43
Source: JICA Study Team
Figure 6.4-20 Desire Line of Bus on Weekday (veh./day)
Source: JICA Study Team
Figure 6.4-21 Desire Line of Bus on Weekday (%)
凡例
- 10 veh/day
- 100 veh/day
- 500 veh/day
- 1000 veh/day
1000 veh/day -
Kathmandu & Latipur
Kavrepalanchok
India
China
凡例
- 2.5%
- 5.0%
- 10%
- 15%
15% -
Kathmandu & Latipur
Kavrepalanchok
India
China
Eastern

6-44
Source: JICA Study Team
Figure 6.4-22 Desire Line of Bus on Holiday (veh./day)
Source: JICA Study Team
Figure 6.4-23 Desire Line of Bus on Holiday (%)
凡例
- 10 veh/day
- 100 veh/day
- 500 veh/day
- 1000 veh/day
1000 veh/day -
Kathmandu & Latipur
Kavrepalanchok
Eastern
India
China
凡例
- 2.5%
- 5.0%
- 10%
- 15%
15% -
Kathmandu & Latipur
Kavrepalanchok
India
China

6-45
Origin-Destination matrix of truck is shown in Table 6.4-14 and Table 6.4-15. From the result of Origin-Destination matrix of truck, the short-length or mid-length trip is the major passenger trip. In particular, the large OD pair are the trip in Kathmandu & Latipur (zone 5) and Kavrepalanchok (zone 8), Kathmandu & Latipur (zone 5) and Sindhupalchok (zone 7).
Table 6.4-14 Origin-Destination Matrix of Truck on Weekday
*Truck;7.Light Truck, 8.Heavy Truck, 9.Multi-axel Truck
Source: JICA Study Team
Table 6.4-15 Origin-Destination Matrix of Truck on Holiday
*Truck;7.Light Truck, 8.Heavy Truck, 9.Multi-axel Truck
Source: JICA Study Team

6-46
Source: JICA Study Team
Figure 6.4-24 Desire Line of Truck on Weekday (veh./day)
Source: JICA Study Team
Figure 6.4-25 Desire Line of Truck on Weekday (%)
凡例
- 10 veh/day
- 100 veh/day
- 500 veh/day
- 1000 veh/day
1000 veh/day -
Kathmandu & Latipur
Kavrepalanchok
India
China
凡例
- 2.5%
- 5.0%
- 10%
- 15%
15% -
Kathmandu & Latipur Bhaktapur
Kavrepalanchok
India
China
Sindhupalchok

6-47
Source: JICA Study Team
Figure 6.4-26 Desire Line of Truck on Holiday (veh./day)
Source: JICA Study Team
Figure 6.4-27 Desire Line of Truck on Holiday (%)
凡例
- 10 veh/day
- 100 veh/day
- 500 veh/day
- 1000 veh/day
1000 veh/day -
Kathmandu & Latipur
Sindhupalchok
Kavrepalanchok
Eastern
India
China
凡例
- 2.5%
- 5.0%
- 10%
- 15%
15% -
Kathmandu & Latipur Bhaktapur
Kavrepalanchok
India
China
Sindhupalchok

6-48
6.5 AXLE LOAD
6.5.1 Purpose and Survey Method
The Axle load survey was carried out to collect the actual loading data of heavy vehicle. The survey equipment is manual weight scale. Axle Load survey results is taken the enlargement process using the traffic count survey.
6.5.2 Survey Result
(1) Rate of Loading Truck and Empty Truck
Rate of Loading Truck and Empty Truck is shown in Table 6.5-1. The 94% of heavy trucks of westbound, which is into Kathmandu, is loaded. In contrast, the empty trucks in the direction out of the Kathmandu account for 84 %. In total of road section, the rate of Empty Truck is 43%.
Table 6.5-1 Ratio of Loading Truck and Empty Truck
Source: JICA Study Team
(2) Gross Vehicle Load
The result of gross vehicle load is shown in Table 6.5-2. The gross bus weight is 6.6 ton in both directions. The result of gross truck load has clear difference between the directions. The total of truck at the westbound (from Bhaktapur to Dhulikhel) is 7.4 ton and that of eastbound (from Dhulikhel to Bhaktapur) is 13.8 ton. In the section, this difference resulted from the empty truck rate mentioned in previous section. In addition, the reason why the total vehicle load of 3 axle trucks eastbound (from Dhulikhel to Bhaktapur) is small is because the traffic volume of 3 axle truck was low in this section, and sufficient samples could not be secured. Distribution chart of bus is illustrated in Figure 6.5-1. Distribution chart of truck is illustrated in Figure 6.5-2 and Figure 6.5-3. Relatively, the reason why the total vehicle load is low is considered to be the influence of traffic restrictions on the Sindhuli road and the road closure near the China border. In addition, few vehicles exceeding the reference value were found.
Table 6.5-2 Average Gross Vehicle Load
Source: JICA Study Team
Bhaktapur to Dhulikhel Dhulikhel to Bhaktapur TotalLoaded 16% 94% 57%Empty 84% 6% 43%Total 100% 100% 100%
2 axle Truck 3 axle Truck Bhaktapur to Dhulikhel 5.6 7.1 21.6 7.4Dhulikhel to Bhaktapur 7.3 14.0 8.4 13.8
Total 6.6 10.7 14.7 10.8Legal Load Limit - 16.2 25.0 -
Direction Bus (t)Truck (t)
Total of Truck

6-49
Source: JICA Study Team
Figure 6.5-1 Distribution of Gross Vehicle Load of Bus
Source: JICA Study Team
Figure 6.5-2 Distribution of Gross Vehicle Load of 2 Axle Truck
Source: JICA Study Team
Figure 6.5-3 Distribution of Gross Vehicle Load of 3 Axle Truck
Legal load limit (16.2t)
Legal load limit (25.0t)

6-50
6.6 VEHICLE EMISSION GAS
6.6.1 Purpose and Survey Method
In Nepal, the exhaust gas of automobiles is a serious problem (Photo 6.6-1). The vehicle emission test was carried out in order to obtain the emission volume by vehicle type. The intended gas for test is CO, NOx and SOx and each gas emitted by vehicle type were measured under the condition of the idling and 3,000 r/min of engine revolutions.
Source: JICA Study Team, 18th August 2017
Photo 6.6-1 Current Situation of Emission Gas from Vehicle
6.6.2 Survey Result
The results of the vehicle exhaust gas test are shown in Table 6.6-1, Figure 6.6-1, Figure 6.6-2, and Figure 6.6-3. The results of all type of gas and vehicle are high concentration. It can be supposed that the poor combustion efficiency of vehicle is one of the causes. The volume of emission gas will increase on the uphill section where the large engine speed is required. Regarding CO, the gas concentration in the passenger cars and buses shows relatively low value. But, the emission from heavy trucks is high concentration.

6-51
Table 6.6-1 Result of Vehicle Emission Gas Test
Source: JICA Study Team
Source: JICA Study Team
Figure 6.6-1 Result of Vehicle Emission Gas Test (CO)
Vehicle Measurement Type CO [ppm] Nox [ppm] SO2 [ppm]High 2541.51 120.94 118.76NA 2091.13 113.16 56.87
Normal 933.05 96.14 132.94High 1104.19 195.53 58.12NA 635.93 175.97 13.44
Normal 118.80 210.34 9.82High 1913.83 185.61 20.31NA 662.53 183.07 11.71
Normal 273.27 207.32 65.16High 488.99 134.78 7.47NA 1968.20 121.40 35.71
Normal 170.60 159.16 8.29High 128.47 127.31 5.19NA 1092.55 106.71 59.21
Normal 30.56 115.11 5.41High 2035.44 301.47 65.92NA 620.93 54.03 4.07
Normal 368.58 199.80 21.71High 124.65 188.66 14.96NA 796.42 184.55 6.35
Normal 70.05 192.64 17.09High 137.67 94.55 17.08NA 179.20 129.32 12.98High 686.67 154.04 33.49NA 578.10 123.44 14.58
Normal 388.40 166.24 17.08
Multi Axle Truck
Others
Utility Vehicles
Car & Taxi
Heavy Truck
Large Bus
Light Truck
Micro Bus
Mini Bus

6-52
Source: JICA Study Team
Figure 6.6-2 Result of Vehicle Emission Gas Test (NOx)
Source: JICA Study Team
Figure 6.6-3 Result of Vehicle Emission Gas Test (SO2)
6.7 SUMMARY OF TRAFFIC CHARACTERISTICS
Based on the traffic survey result, the main traffic characteristic, a traffic volume, a travel speed and OD pattern are summarized below.
6.7.1 Traffic Volume
• Traffic volume of SD Road section in 2017 was 19,000 to 43,000 veh./day on weekday.
• Traffic volume in Sanga section was 19,000 veh./day on weekdays and 19,400 veh./day on holiday, so there were no major differences.
6.7.2 Traffic Composition
• It is a feature of traffic on SD Road that the weight ratio of this Road section is as relatively high as 35% to 38%.

6-53
• The track ratio is 23% to 28%, the bus ratio is 19% to 24%. It can be explained that this road plays role as logistics network road and the lives of local residents.
6.7.3 Travel Speed
• It became clear that vehicles are forced to a low-speed running on uphill of Suryabinayak-Sanga section and Sanga pass.
• Especially on the uphill of Sanga Pass, the speed reduction of large vehicles is remarkable.
6.7.4 OD Pattern
• Main traffic that pass Sanga section is trip between Kathmandu & Latipur, Kavrepalanchok with a short trip.
• This trend is similar for passenger cars, buses, and trucks. There are not many vehicles that from / to India.
6.7.5 Impact of Sindhuli Road Opening
Compared to the traffic volume survey result conducted by preparatory survey, the transition of traffic volume is summarized and shown in Table 6.7-1 and Figure 6.7-1.
• Traffic volume has increased greatly from 2014 to 2017, even considering that the observation month is different.
• At Dhulikhel intersection, the traffic volume towards Sindhuli - Kathmandu direction is 4,109 veh./day (excluding motorcycles).
• Among them, the traffic volume using Sanga section is 839 veh./day based on OD survey results. In Sanga, the impact of Sindhuli Road Opening is limited.
Table 6.7-1 Summary of Annual Variation of Traffic Volume at SD Road (weekday)
(veh./day)
Source: JICA Study Team
year Motor Cycle Car & Taxi Utility Pickup
Micro Bus Mini Bus Large Bus Light Truck HeavyTruck
Multi-axelTruck
Others Total
2014 8,076 2,837 916 98 1,045 202 650 1,324 69 176 15,3932017 10,784 4,179 1,012 532 603 815 444 2,098 187 59 20,7132014 7,813 2,429 935 150 1,179 163 430 1,449 42 195 14,7852017 9,746 3,798 1,264 527 30 1,354 472 2,051 232 38 19,5122014 6,161 1,818 690 148 955 108 515 964 20 165 11,5442017 12,093 4,054 1,502 531 403 1,103 430 2,218 213 97 22,6442014 5,361 1,739 528 127 979 42 466 860 16 94 10,2122017 8,851 3,108 884 470 520 630 523 2,170 48 106 17,310
Suryabinayak~Sanga
Sanga~Banepa
Banepa city area
Banepa~Dhilikhel

6-54
Source: JICA Study Team
Figure 6.7-1 Annual Variation of Traffic Volume at SD Road (weekday)

CHAPTER 7
TRAFFIC DEMAND FORECAST


7-1
CHAPTER 7 TRAFFIC DEMAND FORECAST
7.1 APPROACH AND METHODOLOGY
In this section, the future traffic demand is estimated based on socio-economic framework in Nepal and traffic survey conducted by the Study team. Firstly, the socio-economic framework related to traffic demand is reviewed. Then, the traffic growth rate is calculated based on the regression analysis between the socio-economic framework and the actual value of traffic volume. The future traffic volume based on simple increase is estimated using the traffic growth rate and present traffic volume. The cross border traffic at China border of Kodari and the traffic passing through Sindhuli road is predicted considering traffic control.
7.2 SOCIO-ECONOMIC FRAMEWORK AND DEVELOPMENT PLAN
7.2.1 Socio-Economic Framework
Predicting the future traffic demand, the socio-economic framework of related indicator is set based on the trend of past statistical data and on the plan by each authorities of Nepal government. Related indicators set are population and GDP as shown in tables below.
Table 7.2-1 Framework of Population
Source: Study team estimation based on GON, National Population and Housing Census 2011
Table 7.2-2 Framework of GDP
*At basic price (constant) Source: Study team estimation
yearCentral Region
(million)Growth
rateEastern Region
(million)Growth
ratetotal
(million)Growth
rate2017 10.73 - 6.18 - 16.91 -2022 11.62 1.6% 6.48 0.9% 18.10 1.4%2027 12.39 1.3% 6.77 0.9% 19.16 1.1%2032 13.08 1.1% 7.00 0.7% 20.08 0.9%2037 13.79 1.1% 7.21 0.6% 21.00 0.9%2042 14.50 1.0% 7.42 0.6% 21.92 0.9%
yearGDP
(billion)Growth
rate2017 743 -2022 904 4.0%2027 1,074 3.5%2032 1,245 3.0%2037 1,408 2.5%2042 1,555 2.0%

7-2
7.2.2 Development Plan
In this section, development plans that affect the transportation of SD Road are discussed.
(1)Road Network Plan
As a road plan that is expected to influence SD Road planning, the plan of the outer ring road (ORR) is advanced as shown in Section 3.5(4). The total length of the ORR is 73 km, but a section of Bhaktapur overlaps the SD Road. However, since the overlapping section is a short section at the end of the SD Road, the influence on the traffic volume of the SD Road is negligible.
(2)Logistics Node
One of the logistics functions are located along the SD Road at the Banepa area. Forwarders are using ROW of highways for transshipment because of no appropriate logistics facilities in the Valley. The planning content of the logistics node located in the Banepa area is not clear.
Source: JST, 20 year Strategic Development M/P for KV, Open Street Map
Figure 7.2-1 Existing Urban Function Distribution in the Valley and its Expansion
(3)Special Economic Zone (SEZ)
The Government of Nepal (GON) has adopted the concept of Special Economic Zone (SEZ) for foreign investors and investors who can contribute to export promotion, invests and establishes industrial sector and business division. Currently, the government has finalized locations for the construction of SEZ in different provinces. Ministry of Industry (MOI) has completed feasibility study of establishing SEZ in
Suryabinayak
Logistics Node at Banepa
SD Road

7-3
Panchkhal of Province 3 (Figure 7.2-2). MOI is prioritizing the construction of SEZ in Simara of Province 2 and Pacnhkhal of Province 3 in the first phase.
The outline of Panchkhal SEZ is shown in Table 7.2-3. If Panchkhal SEZ is brought into operation, more than 50 large factories can be operated there. It can also provide warehousing facilities for goods imported from China. GON has a plan to add oil depots in Panchkhal. Since Panchkhal SEZ is located on the east side of the SD Road, when Panchkhal SEZ operates it is considered to have a big influence on the SD Road. For example, assuming that the factory is located and a track of 15 T.E per ha is generated, a new demand of 750 T.E/day occurs. However, the details of Panchkhal SEZ have not been announced. There are also reports that the purpose is to manufacture and export goods to China using Chinese raw materials. If so, the impact on the SD Road is small.
Source: JICA Study Team
Figure 7.2-2 Location of Pachkhal
Table 7.2-3 Outline of Panchkhal SEZ
Panchkhal SEZ :
Location Hokse V.D.C, Panchkhal 3 km. east fromPanchkhal Bazaar in Kavrepalanchowk district.
Area of land 50 ha. approx.
Present status Feasibility study completed, Environmental Impact Assessment Ongoing, land acquired
Source: GON (Special Economic Zone Development Committee); Special Economic Zones (SEZs) in Nepal
(4)Other Notes (Traffic Regulation of Arniko Highway and Sindhuli Road)
At the Chinese border of the Arniko Highway, border facilities are closed due to earthquake damage, and at the present time there is no prospect of recovery. Also, last year the bridge collapsed on the same road near the border. Although Nepalese side has requested China to restore border facilities, it also intends to relocate the border facilities in China side, which takes a considerable amount of time to restore.

7-4
From the viewpoint of traffic safety, the Sindhuli Road has been regulated by the Department of Transport Management under the umbrella of MOPIT. (Prohibition of running a truck, prohibition of traveling of a bus with a capacity of 35 or more, closing at night)
7.3 TRAFFIC GROWTH
Economic activities such as population and GDP growth and changes will result in the increase of traffic volume. In this section, based on a regression analysis of past traffic data and related indicators, future traffic volume by vehicle type is estimated. As for the traffic volume, the traffic volume survey results conducted in 1993, 2012, 2014, and the traffic survey result of 2017 conducted under this Study were used. However, with regards to freight vehicles, the data of 2014 is not used for being inaccurate because the survey was conducted on a day when the freight vehicles were on a strike. Also, The observation point of the traffic volume used for this analysis is Bhaktapur East which is the only place where the past survey was carried out. Since it was a 16-hours observation in the past investigation, the analysis is using the traffic volume of 16-hours.
7.3.1 Passenger Vehicle
Intended vehicle is Motor cycle, Passenger Car & Taxi, Microbus, Mini bus and Large Bus. This type of car is used for relatively short and middle distance trip. As an indicator related to the traffic increase, the total population of Central region and Eastern Region is selected. Past population and traffic volume are show in
Table 7.3-1. The forecasting model was estimated show in Figure 7.3-1. Table 7.3-2 shows the results of determining the growth rate of future passenger vehicle using this forecasting model.
Table 7.3-1 Past Population and Traffic Volume
Population Passenger Vehicle PCU(million) (veh./16h) (PCU/16h)
1993 12.1 987 1,5552012 15.6 12,869 11,4032014 15.6 10,236 9,1612017 16.9 13,925 12,749
year

7-5
Source: JICA Study Team
Figure 7.3-1 Estimation Result of Passenger Vehicle
Table 7.3-2 Future Passenger Vehicle Growth Rate
Source: JICA Study Team
7.3.2 Freight Vehicle
Intended vehicle is trucks including light trucks, heavy trucks and multi-axle Trucks. As an indicator related to the traffic increase of freight vehicles, GDP of Nepal is selected. Past GDP and traffic volume are show in Table 7.3-3. The forecasting model was estimated show in Figure 7.3-2. Table 7.3-4 shows the results of determining the growth rate of future freight vehicle using this forecasting model.
Table 7.3-3 Past GDP and Traffic Volume
y = 2363.9x - 26819R² = 0.9583
0
2,000
4,000
6,000
8,000
10,000
12,000
14,000
0.0 2.0 4.0 6.0 8.0 10.0 12.0 14.0 16.0 18.0
population (million)
Number of passenger vehicle (PCU/16h)
year Passenger vehicle (PCU/16h) Growth rate2017 12,749 -2022 15,959 4.6%2027 18,474 3.0%2032 20,652 2.3%2037 22,827 2.0%2042 25,003 1.8%
GDP Freight vehicle PCU(billion NPR) (veh./16h) (PCU/16h)
1993 205.0 280 6292012 638.0 3,723 6,6072017 743.0 1,828 4,957
year

7-6
Source: JICA Study Team
Figure 7.3-2 Estimation Result of Freight Vehicle
Table 7.3-4 Future Freight Vehicle Growth Rate
Source: JICA Study Team
7.4 CROSS BORDER TRAFFIC
The traffic flow pattern of vehicles travelling between Kathmandu and southeastern region of Nepal is believed to have changed significantly, following opening of entire Sindhuli Road stretch to traffics in March 2015. The improvement of the Suryabinayak – Dhulikhel section is expected to improve the driving performance and travel time within the section and consequently to Southeastern Terai as well. These improvements will not only contribute to the increase of road users from Kathmandu, the alongside towns, villages, and communities including the towns in the southern region of Nepal, it is also expected to promote the logistics along the said corridor. Furthermore, the improvement of the objective section of the Project is also expected to contribute to the development along the SD Road. Outcome of the Project could expand to the towns between Sindhuli road and the border with India. However, there is almost no information/data on these roads. Therefore, on August 13, 2017, JICA Study Team carried out investigation of road conditions and traffic conditions beyond Bardibas, the start point
y = 4076.4ln(x) - 20927R² = 0.8632
0
1,000
2,000
3,000
4,000
5,000
6,000
7,000
0.0 100.0 200.0 300.0 400.0 500.0 600.0 700.0 800.0
Number of Freight Vehicle (PCU/16h)
GDP (billion NPR)
year Freight Vehicle (PCU/16h) Growth rate2017 4,957 -2022 6,820 6.6%2027 7,521 2.0%2032 8,124 1.6%2037 8,627 1.2%2042 9,031 0.9%

7-7
of Sindhuli Road, up to the Indian border. Just at the time, southern Nepal were suffering from the floods and landslides, which was caused by the intermittent torrential rains that occurred after August 11. Three roads, as shown in Figure 7.4-1 that lead to the border with India were investigated.
Source: JICA Study Team
Figure 7.4-1 Investigation Section
The surface condition of Route A was in very poor condition and only few light trucks using the road was confirmed. The investigation was limited to about several kilometers as it was not passable further due to inundation by the flood.
Source: JICA Study Team 13 August, 2017
Photo 7.4-1 Road Conditions and Traffic Conditions (Route A)

7-8
Source: JICA Study Team 13 August, 2017
Photo 7.4-2 Road Closure due to Inundation (Route A)
The stretch between Bardibas to Janakpur of Route C was in good condition. The road is wide and paved with asphalt. Although there were pot holes at some locations, the driving performance is relatively good.
Source: JICA Study Team 14 August, 2017
Photo 7.4-3 Road Conditions and Traffic Conditions (Route C: Bardibas - Janakpur)
Route B (Janakpur-Indian Border) has a width wide enough to be operated as 4-lane road including sufficient width for use of large-sized trucks. About 3km of the road from Janakpur was paved with bricks, but the section beyond has no pavement. The brick-paved section has many damaged portions and is in critical condition.

7-9
At about 10km from Janakpur, there used to be a bridge over a river. This bridge was carried away by the flood. Due to this, the investigation had to be called off. Locals say trucks use the road, but it was not confirmed during the investigation. One of the causes might be the collapse of the bridge.
Source: JICA Study Team 14 August, 2017
Photo 7.4-4 Road Conditions and Traffic Conditions (Route B)
Source: JICA Study Team 14 August, 2017
Photo 7.4-5 The Situation of Falling Bridge (Route B)
The section of Route C, beyond Janakpur has the narrowest width among the three routes investigated (the cross section of two cars). No heavy trucks were confirmed in this section as well.

7-10
Source: JICA Study Team 14 August, 2017
Photo 7.4-6 Road Conditions and Traffic Conditions (Route C)
On all three routes investigated, use of the roads by heavy trucks were nil. Therefore, the three routes surveyed this time are not used as a major logistics route connecting India and Nepal. However, considering the current road width, Route B has the potential to be used by heavy trucks, provided that the road condition is improved. The current main artery of logistics can be considered as the following route (Figure 7.4-2). The main distribution route from India is Birgunj - Pathalaiya - Hetauda - Narayangadh - Kathmandu. The approximate time required is about 7 hours and 41 minutes. If logistics is to be conducted via Sindhuli Road (Pathalaiya - Bardibas - Dhulikel - Kathmandu), the estimated time required will be about 6 hours and 49 minutes. This will contribute to shortening the travel time by about 52 minutes. In this way, when the traffic regulation on Sindhuli Road disappears, two logistics routes between India and Kathmandu will be formed. As a result, diversification of options of roads and bypass route at the time of disaster are secured, and stable supply of goods to Kathmandu becomes possible.
Source: JICA Study Team Required Time is Google Map
Figure 7.4-2 Main Logistics Route

7-11
Table 7.4-1 Time Required Between Kathmandu and The Indian Border
Source: JICA Study Team Required Time is Google Map
7.5 TRAFFIC DEMAND FORECAST
7.5.1 Traffic Growth Rate
Traffic modeling results based on socio-economic framework is shown in Table 7.5-1. Future traffic demand is estimated by multiplying the traffic growth rate in Annual Average Daily Traffic (AADT) in 2017 based on traffic count survey.
Table 7.5-1 Traffic Growth Rate of SD Road Section
Source: JICA Study Team
The traffic count surveys were conducted in August 2017. Therefore, to calculate AADT from ADT, it is necessary to apply seasonal variation factors that are generally used in Nepal. These factors are given in Table 7.5-2. The AADT for 2017, converted from ADT using the seasonal variation factors are shown in Table 7.5-3.
Table 7.5-2 Seasonal Variation Factors
Source: DOR, HMIS Traffic Database
Distance (km)
Travel Time Travel Speed(km/hr)
Pathalaiya~Hetauda~Narayangadh~Kathmandu(E-W Highway~Prithvi Highway) 256 7:41 33.3
Bardibas~Pathalaiya~Hetauda~Narayangadh~Kathmandu(E-W Highway~Prithvi Highway) 289 9:26 30.6
Pathalaiya~Hetauda~Kathmandu(E-W Highway~Tribhuvan Highway~Prithvi Highway) 162 6:09 26.3
Bardibas~Pathalaiya~Hetauda~Kathmandu(E-W Highway~Tribhuvan Highway~Prithvi Highway) 195 7:54 24.7
Pathalaiya~Bardibas~Dhulikhe~Kathmandu(E-W Highway~Sindhuli Road~SD Road) 287 6:49 42.1
Bardibas~Dhulikhe~Kathmandu(Sindhuli Road~SD Road) 188 5:04 37.1
Route
Eastern round route
Western round route
AGR(2017-2022) AGR(2022-2027) AGR(2027-2032) AGR(2032-2037) AGR(2037-2042) AGR(2042-)Motor Cycle 4.6% 3.0% 2.3% 2.0% 1.8% 1.8%Car & Taxi 4.6% 3.0% 2.3% 2.0% 1.8% 1.8%Utility Pick up 4.6% 3.0% 2.3% 2.0% 1.8% 1.8%Micro Bus 4.6% 3.0% 2.3% 2.0% 1.8% 1.8%Mini Bus 4.6% 3.0% 2.3% 2.0% 1.8% 1.8%Large Bus 4.6% 3.0% 2.3% 2.0% 1.8% 1.8%Light Truck 6.6% 2.0% 1.6% 1.2% 0.9% 0.9%Heavy Truck 6.6% 2.0% 1.6% 1.2% 0.9% 0.9%Multi-axel Truck 6.6% 2.0% 1.6% 1.2% 0.9% 0.9%Others 4.6% 3.0% 2.3% 2.0% 1.8% 1.8%
Location Jan Feb Mar Apr May Jun Jul Aug Sep Oct Nov Dec
General 0.93 0.91 0.91 0.9 0.92 0.93 1.19 1.24 1.14 1.06 1.04 0.98

7-12
Table 7.5-3 Annual Average Daily Traffic in 2017 Unit: pcu./day
Source: JICA Study Team
7.5.2 Effect of Toll Collection and Ratio of Tunnel Users
The benefits of Sanga tunnel section for levying toll fee to be paid by the users of Sanga tunnel is analyzed. The benefits analyzed here are the travel cost benefit and the travel time benefit. It is necessary to set toll fee of Sanga tunnel within the range of benefit amount. The unit vehicle operation cost (VOC) and Unit Travel Time Cost (TTC) set here will be explained in detail in Chapter 21. The toll fee set for Nagdhunga Tunnel could also serve as a good reference in setting the toll fee. Benefit Amount and Toll Fee of Sanga Tunnel is shown in Table 7.5-4. As a result of the benefit analysis, the charge is set at 30 NPR for small vehicle and 40 NPR for large vehicle.
Table 7.5-4 Benefit Amount and Toll Fee of Sanga Tunnel
Source: JICA Study Team
Also, vehicles using Sanga tunnel are assumed as follows.
a) No motorcycles will use the tunnel. This is based on the decision of DOR that motorcycles shall not be allowed inside the tunnel.
b) Only 50% of the total volume of micro buses and mini buses will use the tunnel as the remaining 50% that are for local access purpose will use the existing road.
c) Vehicles arriving and leaving in the Sanga area will not use the tunnel but the existing road.
d) Traffics other than the above basically use a Sanga tunnel.
Based on the above concept, the tunnel utilization rate is shown in Table 7.5-5.
Section1. Motor
Cycle2. Car &
Taxi3. UtilityPick up
4. MicroBus
5. MiniBus
6. LargeBus
7. LightTruck
8. HeavyTruck
9. Multi-axel Truck
10. Others Total
Suryabinayak~Sanga 8,565 3,397 804 415 477 652 343 1,660 142 47 16,503
Sanga tunnel section 7,601 2,871 1,223 418 951 142 460 1,578 83 63 15,392Sanga~Banepa 7,701 3,066 994 414 92 1,012 373 1,618 173 32 15,474Banepa city area 9,628 3,381 1,159 444 411 809 346 1,792 163 76 18,207
Banepa~Dhilikhel 7,173 2,542 706 385 427 502 412 1,751 40 84 14,023
Gradient(%)
Length(km) unit Car & Taxi
UtilityPick up
MicroBus
MiniBus
LargeBus
LightTruck
HeavyTruck
Multi-axelTruck Others
2.5 0.85 (NPR) 21.9 21.9 28.9 47.0 71.2 29.1 91.2 91.2 21.95.5 2.55 (NPR) 80.1 80.1 126.0 312.0 612.8 121.6 535.7 535.7 80.1
total 3.40 (NPR) 102.0 102.0 154.9 359.1 684.0 150.7 626.9 626.9 102.03.5 1.26 (NPR) 27.9 27.9 35.9 46.8 61.9 38.3 89.8 89.8 27.93.5 1.89 (NPR) 37.7 37.7 48.4 55.9 67.8 52.3 102.4 102.4 37.7
total 3.15 (NPR) 65.5 65.5 84.3 102.7 129.7 90.6 192.2 192.2 65.5(NPR) 36.5 36.5 70.6 256.4 554.3 60.1 434.7 434.7 36.5
0.85 (km/h) 27.7 27.7 22.7 22.7 22.7 22.7 22.7 22.7 27.72.55 (km/h) 14.6 14.6 10.0 10.0 10.0 10.0 10.0 10.0 14.6
Travel time (min) 12.3 12.3 17.5 17.5 17.5 17.5 17.5 17.5 12.31.26 (km/h) 60.0 60.0 47.4 47.4 47.4 47.4 47.4 47.4 60.01.89 (km/h) 80.0 80.0 63.2 63.2 63.2 63.2 63.2 63.2 80.0
Travel time (min) 2.68 2.68 3.39 3.39 3.39 3.39 3.39 3.39 2.68(min) 9.6 9.6 14.2 14.2 14.2 14.2 14.2 14.2 9.6
(NPR/min) 19.7 15.2 22.6 51.8 54.9 5.5 7.2 7.9 10.4(NPR) 189.9 146.6 320.6 733.6 778.0 78.3 101.5 111.6 100.1
(A) (NPR) 226.4 183.1 391.2 990.0 1332.2 138.5 536.1 546.2 136.6(B) (NPR) 30 30 30 40 40 30 40 40 30
(B/A) (%) 0.13 0.16 0.08 0.04 0.03 0.22 0.07 0.07 0.22Toll fee rate
benefit
Travel cost benefit Current road use
tunnel use
Travel cost benefit amount
Total benefit amountToll fee
Travel time benefit Current road use Travel speed
tunnel use Travel speed
Abbreviated timeBenefit per minuteTravel time benefit amount

7-13
Table 7.5-5 Tunnel utilization Ratio for Total Traffic of Sanga Section
Source: JICA Study Team
7.5.3 Future Demand Forecast
The methodology of estimation of future traffic is shown in Figure 7.5-1. Basically, the future traffic volume is estimated by multiplying the current traffic volume at 2017 by the growth rate. Additionally, the cross-border traffic with China (from 2025) and the additional traffic through Sindhuli road section traffic volume (from 2037) when traffic regulation is canceled. The opening year of the SD road is assumed for 2025.
Source: JICA Study Team
Figure 7.5-1 Procedure for Future Demand Forecast
AADT in 2017 does not include the cross-border traffic with China due to the current closure of border. Therefore, the future cross-border traffic should be added for estimation of future traffic volume at SD road section. To estimate the cross-border traffics with China which are mainly trucks, the current freight traffic volume was estimated based on the customs data which has the actual data of import / export volume (Table 7.5-6).
In addition, a part of the traffics generated in the southern area of Nepal that currently does not pass through Sindhuli will switch to Sindhuli Road section. The traffic volume which changes the route to the Sindhuli Road is set based on the OD survey result conducted in the Nagdhunga tunnel survey in 2015 (Table 7.5-7). Sindhuli Road will release traffic restrictions in 2037.
Car & TaxiUtility
Pick upMicroBus
MiniBus
LargeBus
LightTruck
HeavyTruck
Multi-axelTruck
Others
95% 95% 50% 50% 100% 95% 99% 99% 100%Tunnel section utilization rate
Classification
Traffic volume in 2017 (AADT)
(
Future traffic demand (AADT) (Table 7.5-6)
Traffic Growth Rate (Table 7.5-1)
Traffic volume from the Chinese border (Table 7.5-6)
Add
Add
Traffic volume to change route to Sindhuli Road (Table 7.5-7)

7-14
Table 7.5-6 Traffic Volume from The Chinese Border in 2017 (AADT)
Source: JICA Study Team
Table 7.5-7 Traffic Volume to Change Route to Sindhuli Road in 2017 (AADT)
Source: JICA Study Team
Results of future traffic demand is shown in Table 7.5-8 and Figure 7.5-2. As described in Section 7.5.2, as for the Sanga tunnel section, Micro Bus and Mini Bus that are frequently used by neighboring residents are considered to use the current existing road, so they are not expected to be in the design traffic volume for Sanga tunnel.
Table 7.5-8 Future Traffic Volume by Road Section
Unit: PCU/day
Source: JICA Study Team
Source: JICA Study Team
Figure 7.5-2 Future Traffic Demand in SD Road Section (PCU/DAY)
1. MotorCycle
2. Car &Taxi
3. UtilityPick up
4. MicroBus
5. MiniBus
6. LargeBus
7. LightTruck
8. HeavyTruck
9. Multi-axel Truck
10. Others Total
From/ To China 0 0 0 0 0 0 0 154 0 0 154
1. MotorCycle
2. Car &Taxi
3. UtilityPick up
4. MicroBus
5. MiniBus
6. LargeBus
7. LightTruck
8. HeavyTruck
9. Multi-axel Truck
10. Others Total
Nagdhunga 0 0 0 0 0 87 0 306 232 0 625
Suryabinayak~SangaSanga tunnel section
(tunnel use)Sanga tunnel section(Current road use)
Sanga~Banepa Banepa city area Banepa~Dhilikhel
2017 18,891 0 17,791 18,327 20,626 16,398
2025 27,425 18,075 7,772 26,633 29,887 23,941
2035 33,913 21,862 9,757 32,534 36,567 29,197
2045 42,451 28,644 11,517 41,176 46,049 37,196
0
5,000
10,000
15,000
20,000
25,000
30,000
35,000
40,000
45,000
50,000
Suryabinayak~Sanga Sanga tunnel section(tunnel use)
Sanga tunnel section(Current road use)
Sanga~Banepa Banepa city area Banepa~Dhilikhel
2017 2025 2035 2045(PCU/day)

7-15
7.5.4 Road Function Expected for SD Road
As described in Section 6.7, according to the traffic survey conducted in this Study, the current road between Suryabinayak and Dhulikhel is used in terms of logistics and living. And the trip is short. One of the reasons is due to traffic regulations at the Chinese border and Sindhuli Road. For future demand forecasting, it is assumed that these two regulations will be lifted in the future.
On the logistics side, the main distribution route from India is Birgunj - Pathalaiya - Hetauda - Narayangadh - Kathmandu, if the traffic regulation of Sindhuli Road is released, the travel time between Birgunj - Kathmandu, because there is no big difference with the west around and east around, it is expected that transformation to Sindhuli Road will be sufficient. If this is realized, there will be two distribution routes connecting India and Kathmandu, redundancy will be secured and stable supply of goods will be planned. As a result, on SD roads, it is predicted that demand for freight cars will be higher compared with the present situation, and it is expected to play a part of logistics from India and China. In addition, if the development plans for logistics node and Special Economic Zone around the SD Roads would be realized, traffic demand for truck will be expected to increase.
Also, it is thought that the use of the residents on the living side will increase as the development along the SD road progresses.
On the tourist side, it is expected that the traffic regulation of Sindhuli Road has a big influence. Because the scenery along Sindhuli Road is very beautiful and attractive. If the traffic regulation of Sindhuli Road is released, it is expected that the use of large sightseeing buses will increase.


CHAPTER 8
ENGINEERING SURVEY
(NATURAL CONDITION SURVEY)


8-1
CHAPTER 8 ENGINEERING SURVEY (NATURAL CONDITION SURVEY)
8.1 TOPOGRAPHIC SURVEY
8.1.1 Introduction
In previous survey, topographic survey was carried out for a corridor width of 50m (25m each side from the center of the existing road) at tangent sections. However, the topographic map prepared in previous survey was not fully applicable for this project since re-alignment of objective area have been considered in this study. Especially in Sanga area where initially considered bypass plan, there were northern side map prepared by previous study and drastic re-alignment was required in the area. Therefore, in addition to the topographic map prepared in previous survey, topographic survey was conducted at where additional survey were considered necessary.
8.1.2 Scope of the Survey
The survey consisted of the following scopes;
Table 8.1-1 Scope of the Survey
ITEMS Quantity Unit Remarks 1. Centerline Alignment Survey 3.7 km 2 temporary benchmarks 2. Centerline Profile Survey 3.7 km 3. Planned Survey 123 ha Highlighted in Figure 8.1-1 4. Tunnel Portal Area Survey 8 ha 5. Preparation of Topographic map 1 set 6. Documentation and Report
Figure 8.1-1 Objective Area of Topographic survey
107 ha
Sanga Area
13 ha
3 ha
To Banepa

8-2
8.1.3 Methodology
Establishment of Control Points
Total of two control points have been newly established. The control points established were for horizontal and vertical control points. The coordinates of the control points were determined with reference to the national grid coordinates for Nepal, determined by the Department of survey in Nepal.
Centerline Alignment Survey
The centerline alignment survey for a total length of 3.7 km was conducted for the preliminary comparison study of the alignments.
Centerline Profile Survey
The center profile survey for a total length of 3.7 km was conducted for the preliminary comparison study of the alignments.
Planned Survey
A total area of 123 hectares in three different locations were surveyed. The survey was carried out for contour interval of 1m in mountainous area and 0.5m in relatively flat area. Following are existing features surveyed and indicated accordingly in the topographic map.
⚫ Road side Trees, Chautaras, Forest Areas ⚫ Electrical Poles, Telephone Poles, Manholes ⚫ Bridges, Culverts, Cross Drains ⚫ Side Roads, Joining roads, Tracks ⚫ Buildings, Shed, Temporary constructions, Walls, Boundary Lines ⚫ Temples, Shrines, Statues ⚫ All drops, changes in elevation, ⚫ Wells, Water sources ⚫ Rivers, Streams, Natural Drainages etc.
Tunnel Portal Area Survey
The topographic survey with a scale of 1:1,1000 was carried out at two proposed locations of tunnel portals. The survey covered an approx. area of 40,000 m2 each (total area of 8 hectare).
Result of the Survey
The data obtained by the survey were compiled, consistency with the preparatory survey was confirmed and topographic map was prepared incorporating all the information obtained/measured at the site. The topographic map has been prepared in AutoCAD DWG format.

8-3
8.2 GEOTECHNICAL SURVEY
8.2.1 Objective of the Survey
The objective of the survey is contributing to the design of tunnel and approach roads by collecting topographic and geologic data, analyzation and consideration of the result obtained from site reconnaissance, geo-physical prospecting and others.
8.2.2 Survey Area
The geo-technical survey was conducted at Sanga area in east side of Kathmandu valley. The area is approx. 3.45 km2 wide (indicated by the orange color rectangle in Figure8.2-1). The objective area for geo-technical surveys, drilling, geo-physical prospecting, etc, were determined through discussion with geologist, highway engineer, tunnel engineer, and local counterparts.
Figure 8.2-1 Survey Area
Slope survey of the current road was conducted at the time of field survey. Slope area is covered by forest. When looking up from the valley side, there are several collapsed lands continuing from the shoulder to the valley of the current road. Revetment works in lower collapsed area and retaining wall works in middle collapsed area were constructed. As hillside slope is steep, long-term traffic closure would occur when the collapse expanded.
Figure 8.2-2 Collapsed Area on the Side of the Road Valley
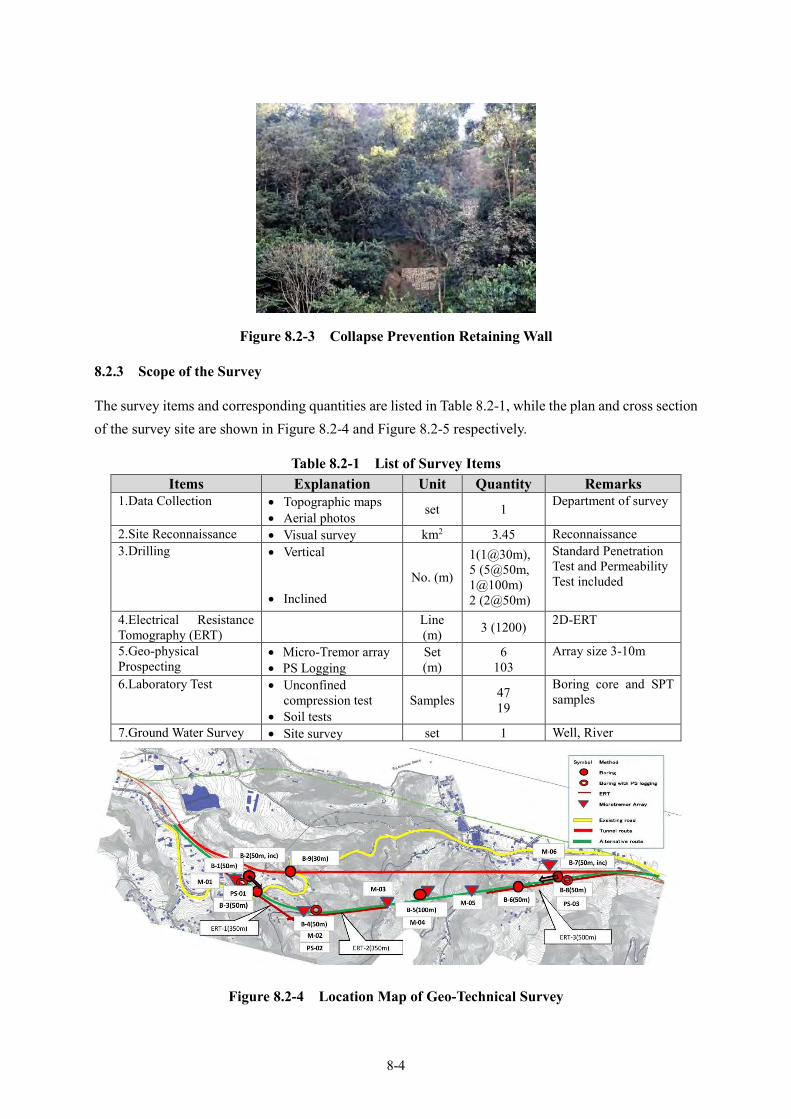
8-4
Figure 8.2-3 Collapse Prevention Retaining Wall
8.2.3 Scope of the Survey
The survey items and corresponding quantities are listed in Table 8.2-1, while the plan and cross section of the survey site are shown in Figure 8.2-4 and Figure 8.2-5 respectively.
Table 8.2-1 List of Survey Items Items Explanation Unit Quantity Remarks
1.Data Collection • Topographic maps • Aerial photos set 1 Department of survey
2.Site Reconnaissance • Visual survey km2 3.45 Reconnaissance 3.Drilling • Vertical
• Inclined
No. (m)
1(1@30m), 5 (5@50m, 1@100m) 2 (2@50m)
Standard Penetration Test and Permeability Test included
4.Electrical Resistance Tomography (ERT)
Line (m) 3 (1200) 2D-ERT
5.Geo-physical Prospecting
• Micro-Tremor array • PS Logging
Set (m)
6 103
Array size 3-10m
6.Laboratory Test • Unconfined compression test
• Soil tests Samples 47
19
Boring core and SPT samples
7.Ground Water Survey • Site survey set 1 Well, River
Figure 8.2-4 Location Map of Geo-Technical Survey
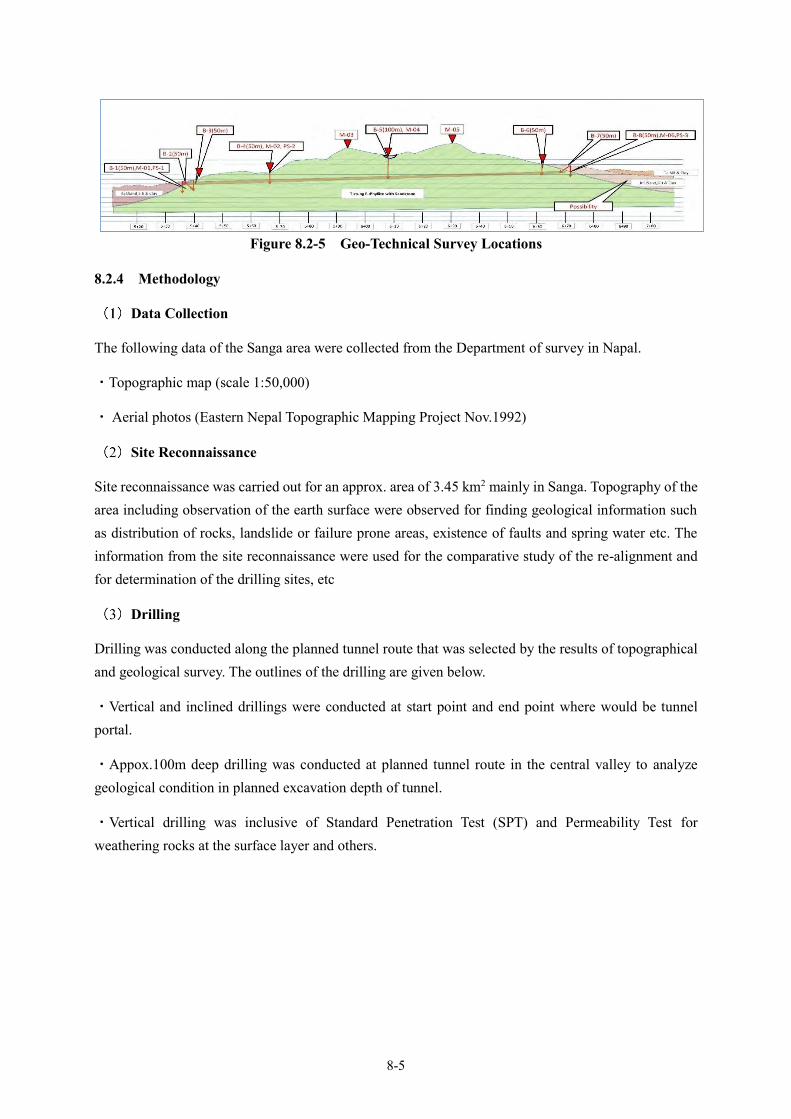
8-5
Figure 8.2-5 Geo-Technical Survey Locations
8.2.4 Methodology
Data Collection
The following data of the Sanga area were collected from the Department of survey in Napal.
・Topographic map (scale 1:50,000)
・ Aerial photos (Eastern Nepal Topographic Mapping Project Nov.1992)
Site Reconnaissance
Site reconnaissance was carried out for an approx. area of 3.45 km2 mainly in Sanga. Topography of the area including observation of the earth surface were observed for finding geological information such as distribution of rocks, landslide or failure prone areas, existence of faults and spring water etc. The information from the site reconnaissance were used for the comparative study of the re-alignment and for determination of the drilling sites, etc
Drilling
Drilling was conducted along the planned tunnel route that was selected by the results of topographical and geological survey. The outlines of the drilling are given below.
・Vertical and inclined drillings were conducted at start point and end point where would be tunnel portal.
・Appox.100m deep drilling was conducted at planned tunnel route in the central valley to analyze geological condition in planned excavation depth of tunnel.
・Vertical drilling was inclusive of Standard Penetration Test (SPT) and Permeability Test for weathering rocks at the surface layer and others.
LEGEND: B: Drilling, M: Micro-tremor ERT: Electrical resistance tomography

8-6
Table 8.2-2 Outline of the Drilling
Points Type Direction Depth(m) Location
Remarks Latitude Longitude
B-1(50m) Vertical 50 27.383683 85.280474 3 Permeability test
B-2 (50m) Inclined (60 deg) N30W 50 27.383626 85.280508
B-3 (50m) Vertical 50 27.383488 85.280507 3 Permeability test
B-4 (50m) Vertical 50 27.382907 85.281272 1 Permeability test
B-5(100m) Vertical 100 27.382612 85.282736 6 Permeability test
B-6 (50m) Vertical 50 27.382329 85.284402 3 Permeability test
B-7 (50m) Inclined (60 deg) N80W 50 27.382324 85.284838
B-8 (50m) Vertical 50 27.382321 85.284869 3 Permeability test
B-9(30m) Vertical 30 27.383526 85.281129
Total 480
Electrical Resistance Tomography
Ground hardness, crushing zones, etc were examined by Electrical Resistance Tomography (ERT) .The survey was carried out straight along the center line of the tunnel. Since tunnel route contains curve section, there are three straight survey point selected by the survey team. The outline of the survey is summarized in Table 8.2-3.
Table 8.2-3 Outline of Electrical Resistance Tomography
Points Length (m)
Location Remarks Latitude Longitude ERT-1s Start
350 27.383744 85.280365
ERT-1e End 27.382814 85.281038
ERT-2s Start 350
27.382902 85.280773
ERT-2e End 27.382692 85.282044
ERT-3s Start 500
27.382412 85.283715
ERT-3e End 27.382109 85.285502
Total 1200
Geo-physical Prospecting
Micro Tremor Array Survey and PS Logging were carried out to obtain physical property values. Micro Tremor Array Survey was carried out at 6 locations, where both portals of the planned tunnel, and where the earth covering over the planned tunnel was thickest or thinnest. PS Logging was carried out at three sections where the start and end point of the planned tunnel, and where the planned tunnel coverings were thin, by utilizing the drill hole. The location of the survey are shown in Figure8.2-4 and Figure 8.2-5. And outline of the survey is given in Table 8.2-4.

8-7
Table 8.2-4 List of Geo-Technical Survey and Location
Survey Name Points Unit Quantity
Location Remarks
Latitude Longitude
Micro-Tremor-Array
M-01 Set 1 27.383683 85.280474 At drilling point B-1 M-02 Set 1 27.382907 85.281272 At frilling point B-4 M-03 Set 1 27.382703 85.282166 On top of hill M-04 Set 1 27.382612 85.282736 At drilling point B-5 M-05 Set 1 27.382479 85.283577 On top of hill M-06 Set 1 27.382321 85.284869 At drilling point B-8
PS Logging PS-1 M 43 27.383683 85.280474 At drilling point B-1 PS-2 M 30 27.382907 85.281272 At drilling point B-4 PS-3 M 40 27.382321 85.284869 At drilling point B-8
Laboratory Test
Soil test was conducted in laboratory using soil sample obtained by standard penetration test of drilling. In addition, uniaxial compression tests were carried out with 10 cm or longer drilling core collected. The tested quantity is shown in Table.8.2-5
Table 8.2-5 Soil Test Conducted Quantity list
Drilling No.
Grain size analysis
Liquid Limit and Plastic Limit
Natural Moisture Content
Specific gravity Test
Bulk Density
Uniaxial Compressive Strength
Permeability Test
B-1 4 2 2 4 2 1 2 B-2 0 - 0 0 0 2 0 B-3 4 1 2 4 3 0 3 B-4 1 - 1 1 0 0 1 B-5 0 0 0 0 0 25 6 B-6 4 - 2 4 2 15 3 B-7 0 0 0 0 0 2 - B-8 3 1 0 4 0 0 4 B-9 3 0 3 3 1 2 -
Total 19 4 10 20 8 47 19
Ground Water Survey
Ground Water Survey was carried out to examine the effect to ground water caused by tunnel excavation. Contents of the survey are followings;
・Location of villages and the wells,
・Condition of water intake facilities along rivers and streams, and their usage.
Also, range of water level lowering caused by tunnel excavation was examined using topographic map and others.

8-8
8.2.5 Result of Survey
Data Collection
Topographic map and aerial photos of Sanga area were collected and shown in Figure 8.2-6 as sample. Collected materials were carried to the site and used as basic data for geological survey, including survey of lineament to estimate faults, and preparing drainage patterns system as well.
Figure 8.2-6 Topographic map and Aerial Photo
Site Reconnaissance
Site Reconnaissance was widely carried out, and the results are shown in Figure 8.2-7 and geological map along tunnel is shown in Figure 8.2-8.
・The basement rocks in the project area mainly consist of phyllite, sandstone dominant layer etc,
・The limestone layer was observed in the southwest region,
・In basement, rocks weathering were proceeded at the surface layer, and many were made residual soil,
・Kalimati formation consisting of unconsolidated clay and silt were observed in front of Kathmandu side portal and Banepa side portal,
・Talus were observed in the valley in the object area,
・The basement rock continues in the northwest - southeast direction, roughly coinciding with the planned direction of the tunnel,
・No noticeable faults or fracture zones was confirmed by the site reconnaissance.

8-9
Figure 8.2-7 Geological Map of Project Area
Figure 8.2-8 Geological Map along Tunnel Route

8-10
Drilling
Observation of the core obtained by drilling was carried out. Results of observation were compiled with drilling log drawings, core photographs, N values graph, geological classification, water level etc. Those are described in Figure 8.2-9 and Figure 8.2-10.
Figure 8.2-9 Drilling Log with Core Photoe

8-11
Figure 8.2-10 Drilling Log with Core Photoe
Electric Resistance Tomography
Electric Resistance Tomography (ERT) was carried out at total of three locations including two locations at start point and one location at end point of planned tunnel route. By the results, approximate layer thickness of the soil layer along the side line and weathered basement rocky layer can be estimated. Along the end point ERT-3 side line, fault is assumed to be exist by considering result of survey including drilling. The ERT plan is shown in Figure 8.2-11 and cross section of ERT is shown in Figure 8.2-12.

8-12
Figure 8.2-11 Plan of Conducting ERT
Figure 8.2-12 Cross Section of ERT
Geo-Physical Prospecting
Micro-Tremor-Array survey in 6 places and PS logging in 3 places were conducted as Geo-Physical Prospecting. As a result, rock condition of each depth direction was observed. The results of the survey are shown in Figure 8.2-13. Rock condition in survey area can be divided into the four layers by P-wave velocity. From surface to deep, there are soil, highly weathered rock, weathered rock, and fresh rock layers.

8-13
Figure 8.2-13 Geo-Physical Prospecting Survey
Table 8.2-6 Relationship between P-wave and Rock Condition
Laboratory Tests
The soil test results, the uniaxial compression test results, and the permeability test results conducted in the borehole are shown in Table 8.2-7.
Table 8.2-7 Result of Soil Test
Natural Moisture Content(%)
Specific gravity Test
Bulk Density(t/m3)
Uniaxial Compressive
Strength(KN/m2)
Permeability Test(cm/s)
25.01 2.62 1.91 32.41 1.97E-3
・Natural Moisture Content, Specific gravity Test, Bulk Density are general values of weathered soil consisting of phyllite and sandstone,
・For Uniaxial Compressive Strength, the specimens tested are predominantly hard sandstone and are general values,
・The permeability test results in the borehole can be evaluated general values of fracture rock,
・From the results of various tests, no abnormal values are particularly noticed.
P-wave velocity Rock Condition 0.3 - 0.8 km/s Soil 0.9 - 1.5 km/s Highly weathered rock 2.0 - 3.5 km/s Weathered rock 3.5 - 4.0 km/s Fresh rock

8-14
Groundwater Survey Results
Tunnel excavation work often reduces the groundwater level in the surrounding area, which can cause decline in groundwater level and depletion of the village's water source. Therefore, groundwater survey was conducted along the planned tunnel route. The results are shown in Figure 8.2-14.
Figure 8.2-14 Results of water source survey
8.2.6 Review of the Geotechnical Survey results
Geologic distribution and rock classification along the planned tunnel route are comprehensively examined. The result of the survey is shown in Figure 8.2-15 and Figure 8.2-16. According to hearing, there are two villages on the ridge on the south side of the tunnel route, and the water source is stream water on the south side located outside of the survey area. And there is a settlement of Sanga on the north side of the route, water source is stream water from north side mountain. Several small intake pipes were confirmed in vicinity of the tunnel route, but large intake facilities were not confirmed.
Geotechnical Section Compiled along Planned Tunnel Route
1. Geological section along the planned tunnel route was compiled using the result of geological survey and drilling survey, 2. Based on the results of the ERT, sediments, the rough depth of the weathered rocks, the fault distribution etc in the surface layer part were estimated.

8-15
Figure 8.2-15 Survey Position Map and Tunnel Route Geological Section
Compilation of Bedrock Velocity Layer of Tunnel Cross Section from Planned Route Section
1. Examination of the elastic wave velocity of the basement rock from the geo-physical prospecting results, 2. A sectional map of the P-wave velocity stratum was compiled.
Geotechnical sectional map of the P-wave velocity along the Planned route
1. By these survey results, preparation of geological section map along the planned tunnel route, 2. Summarize of geotechnical sectional map, P-wave velocity at along planned tunnel route.

8-16
Figure 8.2-16 Relationship between Comparative Section and Planned Tunnel Cross Section
8.2.7 Geotechnical Study along the Planned Tunnel Route
Geomagnetic elastic wave velocity distribution map along the planned tunnel route was prepared, and challenges in tunnel drilling at the planned tunnel height were shown as rock map classification of the tunnel construction side in Figure 8.2-17.

8-17
Followings are considered or assumed by above Rock Mass Classification; ・ In front of portal on Kathmandu side, unconsolidated clay, silt, sand layer called kalimati formation
are thickly distributed,
・The area 100m from the Kathmandu side portal, rock masses predominantly phyllite weathered are possibly distributed,
・In the vicinity of Banepa side portal, weathered bedrock layer on the tunnel is deep and faults are possibly distributed as well,
・Total three faults are assumed near tunnel center and Banepa side. Therefore, it can be assumed that rocks have become weaken in these areas.
8.2.8 Results of groundwater survey study
Influence range of groundwater level caused by tunnel drilling was examined using topographic map.
”Hydrological method of Takahashi” was applied for the survey to examine the range of influential area as this method is widely used in mountainous tunnel in general.
The applied formula was following;
K t = R2 / 6 H
R:Average basin width A / 2L (m)
A:Catchment area (m2)
L:River length (m)
H:Relative height (m)
Figure 8.2-17 Rock Mass Classification along planned tunnel route

8-18
The H - R (Kt) curve diagram is created by the above equation by the average basin width R and average height ratio H obtained from the basin shape. In the tunnel catchment area, a cross sectional view in the tunnel transverse direction is created and the H - R curve is fitted to the tunnel base surface and calculated as shown in Figure 8.2-18
Figure 8.2-18 Concept of influence range by hydrological method
Based on the results of these surveys, it is assumed that the range shown in Figure 8.2-19 is the range that can affect groundwater declined by tunnel excavation. Public water sources are not confirmed within the influence range.
Figure 8.2-19 Results of Water Source Survey and Impact Range of
Lowering Groundwater Level
Impact Range of Lowering Groundwater

CHAPTER 9
PLANNING AND DESIGN POLICIES


9-1
CHAPTER 9 PLANNING AND DESIGN POLICIES
9.1 GENERAL
The only change in this study from its preceding survey is the new addition of a tunnel at Sanga Pass. Therefore, the policies for planning and design of the objective road, excluding study on re-alignment at Sanga area, remains unaltered from those established and already agreed upon by DOR in the previous survey. It is comprehensive that the policies established then took particular consideration on lessons learnt from the past projects, particularly from the Kathmandu-Bhaktapur Road Rehabilitation Project for the fact that the objective section of this project is a continuity of the KBRRP. Extensive research works were also conducted in establishing the policies particularly by referring to some similar past and on-going projects within Kathmandu Valley or around/nearby the project area as listed in Table 9.1-1.
Table 9.1-1 List of Previous Projects Relevant to this Project
Types Project terms Development Survey
Sindhuli-Bardibas Road Construction Project 1986 - 1988 The Study on the Disaster Risk Management for Narayangharh - Mugling Highway
2007 - 2009
Grant Aid Projects
Sindhuli-Bardibas Road Construction Project(First Section) 1995 - 1997 Sindhuli-Bardibas Road Construction Project(Fourth Section) 1997 - 2001 Sindhuli-Bardibas Road Construction Project(Fourth Section) 2003 Sindhuli-Bardibas Road Construction Project(Second Section) 2000 - 2008 Sindhuli-Bardibas Road Construction Project(Third Section) 2009 - 2011 Sindhuli-Bardibas Road Construction Project on Third Section (2/2)(first part)
2011 - 2015
Sindhuli-Bardibas Road Construction Project on Third Section (2/2)(first part)
2011 - 2015
Sindhuli-Bardibas Road Construction Project(Second Section)for slopes
2012 - 2015
Kathmandu-Bhaktapur road Rehabilitation Plan 2008 - 2011 ODA Loan Nagdhunga Tunnel Construction Project 2017 - Technical Assistance
Road Maintenance and Operation Enhancement Project 2011 - 2015
Experts Road Planning and Maintenance and Operation Advisor 2003 - 2011
9.2 POLICIES OF ROAD PLANNING
(1) Applied Standard
Road planning is fundamentally based on the Asian Highway Standard. Where this does not provide essential standards, other international standards including standards of Japan are referred necessarily.
(2) Road Classification and Design Speed
The objective road is designated as a part of Asian Highway 42 (AH42). The objective section of the

9-2
road is thus classified functionally into ‘Class I’.
The speeds shown in Table 9.2-1 for classification ‘Class 1’ are applied such that the design speed for rolling terrain is 80km/h while the design speed along mountainous and steep terrain is 60 km/h. The former speed applies for sections between Suryabinayak to Sanga and Sanga to Banepa. The latter speed applies to sections at Sanga area and beyond Banepa.
Table 9.2-1 Road Classification, Terrain Conditions, and Designed Speed
Topography Classification
Flat Area Rolling Area Hilly Region Mountainous Region
Primary 120 100 80 60
Class I 100 80 60 60
Class II 80 60 50 40
Class III 60 50 40 30
(3) Geometric Condition
The geometric conditions set in the Asian Highway Standards will apply for the design works of the objective road. DOR agreed to the conditions as mentioned in Table 9.2-2.
Table 9.2-2 Geometric Condition (Asian Highway Standard)
Items Conditions (Classification: Class I)
Remarks
Design Speed 80km/h 60km/h 80km/h: for rolling terrain 60km/h: for mountainous and steep terrain
Width(m) Lane 3.5 3.5 Right turn lane 2.5m Shoulder 3.0 2.5 Median Strip 3.0 2.5
Minimum Horizontal Radius (m) 210 115 Radii requiring Transition Curves (m) 900 500 Minimum Transition Length (m) 70 50 Camber (Crossfall)(%) 2 2 Maximum Composite Grade (%) 10 10 Maximum Superelevation (%) 10 10 Minimum Vertical Grade (%) 0.3 0.3 Maximum Vertical Grade (%) 5 6 Critical Length of Vertical Grade (m) 800 (4%)
600 (5%) 700 (5%) 500 (6%)
(4) Vertical Clearance
A vertical clearance at the crown of the road surface will be 5m as mentioned in the Nepal Road Standard 2070.

9-3
(5) Control Points
There are many houses, temples, shrines, religious trees within the existing ROW. The Survey Team confirmed with DOR that none of these objects need to be treated as control points, if it is within the existing ROW. However, exception applies to the temple on the right side of the existing road after Sanga Pass.
On the other hand, for objects outside the ROW, following objects are identified as control points for the improvement design.
✓ Built-up areas and houses alongside (especially those that have set back beyond the ROW as established by the Land Act of GON),
✓ Areas where large scale earthwork is required (steep terrain),
✓ Adventure or fun parks, major religious and tourist spots,
✓ Large scale or famous (historical, culturally and socially important) temples and trees.
(6) Re-Alignment at Sanga Pass
Sanga pass is a mountainous area. The improvement plan proposed in the previous survey provides a bypass, that deviates to the left from the existing road towards the hill at the north side of the existing road and separated by a valley (ravine). The bypass consisted of a 198m bridge over the valley and slope stabilization along the hill side of the road. With the occurrence of Nepal Earthquake in April 2015, which brought about significant damages to Nepal’s road infrastructure, DOR is taking steps to develop disaster-resilient roads. As one of its such initiatives, it strongly requested review of the alignment recommended in the previous survey.
Alignment at Sanga Pass was reviewed taking DOR’s such concerns and in association to the following policies;
Consider for provision of a tunnel including appropriate tunnel type, Study several alternatives and conduct comprehensive evaluation from the viewpoints of
alignment, maintenance, environmental and social impact, costs etc., Reflect findings from site reconnaissance and engineering surveys regarding the
topography, geology, groundwater condition etc. and determine optimum tunnel structure that best meets the local requirements.
(7) Road Reserve (Right of Way)
In Nepal, Right of Way (ROW) of a national highway is 25 m from the center of a road. The project road is a national highway and therefore the same width should be applied. However, there are sections where the ROW is set as 25 yards following the precedent from the Supreme Court, and there are sections where many houses have completed set back based on the 25 yards standard.
Based on the above situation and following discussions with the DOR, the ROW to be applied for the objective section of this project is set to 25 yards.

9-4
(8) Horizontal Alignment
The horizontal alignment proposed during the previous survey was based on the following policies;
Improvement of alignment based on the standards and criteria of Asian Highway, Utilization of existing roads to the possible extent, Consideration to minimize relocation and resettlement, Avoiding to the possible extent holy trees, shrines, religious facilities, holy ponds and other
objects/features of social, cultural and religious values, Consideration to provision of a bypass at Sanga Pass,
All the above policies in addition to the following two policies apply to this study;
The horizontal curvatures of minimum values will be avoided, Consideration of a bypass at Sanga will take provision of a tunnel through Sanga Pass.
(9) Service Tracks
Provision of service tracks under the project in the previous survey were determined from the following reasons;
i) Early realization of project outcomes,
ii) Securing of adequate road functions,
iii) Logical and ideal road planning and design, and
iv) Executing road construction while maintaining the conveniences and security of the locals
During the 1st study in Nepal, DOR made request to consider provision of service tracks for the entire objective section. Therefore, provisions of service tracks were studied under the following policies;
Scopes adapted during the previous survey will prevail, Provision to other sections, in compliance with the request from DOR will be considered given
that it justifies JICA’s appraisal of the project.
(10) Improvement of Intersections
Policies regarding improvement of intersections set during previous survey is to provide underground pipes for installation of control facilities in future and asks for deployment of traffic police for controlling the traffics as a temporary measure, until the control facilities are provided. In Dhulikhel, the intersection is improved by provision of a roundabout. These policies will remain unchanged in this Study. However, for intersections between the bypass and the existing road at Sanga area will be planned such that traffic flow on the main carriage is uninterrupted to the possible extent.
(11) Assessment of Existing Pavement and Pavement Design
Policies applied during previous survey shall prevail. However, the design will be reviewed based on

9-5
the traffic load distribution pattern obtained from the results of additional traffic survey including demand forecast.
The policies set and the reasons for selecting such policies are described hereunder.
POLICIES APPLIED The existing pavement including base courses that need to be removed for the entire
stretch will be subject to removal. The California Bearing Ratio (CBR) values to be used in the pavement design will be taken from outside (area to be newly widened) the existing road,
Flexible pavement (asphalt concrete) which is widely used in Nepal will be applied, The calculation of pavement composition will be based on AASHTO method, The resiliency of the subgrade will be calculated based on the results obtained from
geo-technical investigation carried out under the survey, For durability assurance, the minimum thickness of asphalt pavement to be applied on
the main road will be above 10cm. REASONS It is believed that the present pavement is more than ten (10) years old, Existing Pavement is distressed, namely with potholes, rutting and alligator cracks.
Therefore, it is considered better to reconstruct the base course and the wearing (surface) course than just doing an overlay of surface course on the existing road section.
There are no design and/or construction documents to understand the change of load conditions applied during the construction, the existing subbase is considered no more useable as the base course.
(12) Drainage Plan
The following policies set forth in the previous applies for planning of road surface drainage;
Drainage facilities will be provided in built-up areas to transport the surface rain water and drain at a designated outlet. The facilities will be of the similar size or capacity as that of the existing facilities,
Provision is limited to facilities for road surface drain purpose. Plan and provision of facilities for sewage and domestic effluent currently being drained out into the road drainage facilities, shall be executed by the relevant authority of the GON,
In the absence of the drawings and relevant documents, it is difficult to predict whether the existing cross-drainage facilities can withstand the load from the increased traffic, particularly heavy vehicles. Therefore, these facilities are planned to be replaced with new ones. The size and capacity, as well as draining facilities, similar or larger than the existing facilities will be applied,
Currently, portions of road in Jagati and Banepa often experience water logging during monsoon. The logging is attributed to insufficient draining capacity of the existing road drainage facilities, combined with lack of proper and timely maintenance of these facilities and the outlets, and above all, lack of a water canal for draining water coming from outside the road reserve. The most effective solution is to address the latter issue that is to provide water canal outside the

9-6
road reserve and improve the outlets. This is not included in the project scope and the issues will have to be resolved by the GON,
The issue of water logging on the main road is dealt with in this project by raising the main road profile. For water logging on service tracks, the road drainage facilities should be rehabilitated which is deemed to contribute towards lowering the effects,
The laying of side ditch at Jagati on the right side (south side) of the existing road, currently being undertaken by DOR, is for temporary measures. This may not be used and may be demolished under this Project, In addition, provision of drainage facilities on fill slopes with heights exceeding 10 meters will be taken into consideration to prevent rutting of the slope face during heavy rainfall.
(13) Replacement of Existing Bridges
There is no alteration of policies set for replacement of existing bridges during the previous survey.
The four (4) bridges within the objective section of this project are considered to be old and its soundness is a question of concern, due to the fact that more than forty (40) years have passed since they were constructed. Data or information related to its design or construction is unavailable and field reconnaissance identified various damages on these structures. Therefore, these structures will be reconstructed. The design of these structures is based on considerations for expected heavy traffics, sustainable maintenance, cost, construction efficiency road alignment etc.
(14) Pedestrian Bridge (Footbridges)
Footbridges will be provided for sustaining traffic functions of main roads and for enhancing safe road crossing of pedestrians including bicycles. The policies that apply are those set in the previous survey and are as follows;
Footbridges will be designed and provided if it contributes to JICA’s appraisal of the project, The locations will be limited to where service tracks exist (are provided) and where provision of
the facility is expected to immensely contribute to realization of project outcomes, Consideration for multi-purpose use will be given by providing slopes for bicycle users.
(15) Bus Laybys
Policies of previous survey that are mentioned below, applies to policy provision under this study as well.
Bus laybys will be provided at the existing locations, It will be provided between the service track and the sidewalk on sections where the service
tracks are to be provided by this project, Bus laybys elsewhere will be provided beside the main road. Bus shelters and ancillaries will not be provided in both cases and will be undertaken by the
GON necessarily.

9-7
(16) Traffic Safety Facilities
Policies set forth in the previous survey prevails. Traffic safety facilities and it provision policies are described hereunder.
Median is provided for the entire section to separate the anti-direction vehicles physically and enhance safety (particularly head-on collisions). In addition, fences are provided along the median to prevent possible road crossing by pedestrians.
In residential and commercial areas, footpath (sidewalk) is provided on service tracks to facilitate safe movement for pedestrians and unorderly and unnecessary use of main roads.
Provision of traffic signals, traffic lights and their foundations are not included in this project, taking into consideration the planned light shedding in Kathmandu valley. However, in order to facilitate provision of these facilities in the future, conduits for these facilities are planned to be provided under this project.
Pedestrian crossings (Zebra crossings) are planned on places shown below;
- nearby existing pedestrian crossings, - nearby bus laybys where footbridges are not provided, - nearby educational facilities and medical facilities, - nearby junctions and access roads, - other places where crossing is required for traffic safety.
9.3 POLICIES AGAINST NATURAL CONDITIONS
(1) Climate Condition
Policies of previous survey against rainfall in planning and design for this project are as follows;
In mountainous areas such as Sanga, large scale embankment and cutting soil may be required, For such sections, plans and designs of collapse protective barrier, and materials for preventing slope erosion will be applied,
The construction plan for embankment (fill), subgrade, improvement of embankment section, and pavement will be prepared taking rainy season into consideration,
Construction order of drainage facilities (including cross-drainage) will consider avoiding rainy season.
Annual rainfall in Kathmandu is relatively low (about 1,500 mm), however considering that 80% of it falls in the rainy season and the recent trend of abnormal weather in rise seen in various parts of the world, it is utterly important to take this issue with immense concern.

9-8
(2) Earthquake
Policies against earthquake are also similar to those set forth in the previous survey.
Nepal is located in between the Indian Plate and Eurasia plate where the Indian Plate is thrusting the Tibetan plateau and Himalayas towards Eurasia plate. This tectogenesis phenomenon occasionally causes earthquakes in Nepal. One of the evidence of such earthquake is the one recently occurred 77km away northwest to Kathmandu on 25th April 2015.
The objective road is designated in Nepal as a part of Asian Highway and will be the backbone in terms of logistics, if not social activities of the alongside people and as such the stretch (road) is expected to function as an emergency transport road during earthquakes. Therefore, it is important that it is resistant to earthquake and its design should be done carefully and in accordance with the seismic design criteria of Nepal. Therefore, in regard to design of structures, particularly structures, the following considerations will be taken;
The footbridge will as far as possible be continuous, The slabs (decks) will be combined in case of multi-span simply supported bridge, Providing unseating preventing facilities.
9.4 POLICIES AGAINST SOCIO-ECONOMIC CONDITIONS
No change has been incorporated in this Study regarding policies against socio-economic conditions.
The project road connects to the Sindhuli- Bardibas Road, which was newly constructed and opened to general traffics in 2015 and Kathmandu - Bhaktapur road (KB Road) that was expanded in 2007, both under the Japanese grant aid projects. Communities and cities such as Suryabinayak, Jagati, Nalinchowk, Sanga, Banepa, and Dhulikhel are located along the project road. These communities and cities have been transforming and functioning as bed towns, following expansion of the KB Road in accountability of reduction of travel time to Kathmandu. Large part of other area is used as rice field and farm lands. There are several brick factories, an amusement park, religious facilities and tourist attraction places.
This project is expected to contribute to the development of agriculture, environment, industries and residential environment. Subsequently, followings considerations will be taken in the improvement of the road;
The geometric conditions will be consistent with the criteria as necessitates by the design speed to ensure safety of traffics and pedestrians to comply with the expected increase in the design speed,
Road drainage facilities, similar in size or capacity equal or higher than that of the existing drainage facilities, will be provided and adequately connected to the existing drainage system (Strengthen existing drainage system if necessary),

9-9
Major intersections will be improved to secure smooth and safety traffic. The improvement will reflect the future traffic volume and future city planning,
Service tracks will be provided in urban areas (built-up areas) to secure smooth and safety traffic access of alongside residents,
Footbridges will be provided to secure safety of pedestrians considering that the project road will also serve as a community road in the urban area,
Bus laybys at the existing bus stops will be provided in order to ensure safety of bus users. For roads with service track, bus laybys will be provided outside the service track (between service track and footpath) to enhance safety of the pedestrians.
9.5 POLICIES OF ENVIRONMENTAL AND SOCIAL CONSIDERATION
Policies of environmental and social considerations under this Study will be as follows;
Confirm the status of land acquisition and take necessary procedures required for Japan’s grant aid projects categorized as ‘A’ in “JICA’s Environmental and Social Consideration. Guideline (April 2010)”,
Continual formulation of Environmental Impact Assessment (EIA) draft report and Resettlement Action Plan (RAP) planning report, incorporating additionally the environmental and social consideration at the Sanga, where realignment is being considered with provision of a tunnel,
Confirm the procedures of GON including obtaining permission and assistance in the preparation of document and processes, and follow-up necessarily.
9.6 POLICIES OF CONSTRUCTION AND PROCUREMENT CONDITIONS
The result of construction condition survey and basic procurement policies of labor, construction materials, and construction mechanics set forth during the previous survey and are to be applied in this study are discussed hereunder.
9.6.1 Construction Policies
Plan for construction of the objective road including the proposed tunnel has been done by dividing the entire section into 10 sections. The division is done based on geographical conditions, characteristics, alongside land use pattern, roadway widths, provision of service tracks, location of major structures etc,
Material generated from cutting of existing ground will be extensively used for fill material, Mocks from excavation of the tunnel section will be used for lower portion of subgrades at high
embankment sections in Sanga.

9-10
9.6.2 Procurement Policies
1)Recruitment
Labors for general road construction can be procured from around Kathmandu valley and its neighboring villages. However, skilled labors having knowledge and construction experience of a tunnel are not readily available. Therefore, in such case, the local labors need special training from efficient tunnel engineers with regards to the construction techniques of the tunnel.
2)Materials
Natural materials (aggregations and embankments) and general construction materials such as reinforcement steel and cements are available in the local market. Safety barrier (guard rails) and other metallic processed items are procurable from India. However, major materials, particularly the supports for tunnel construction are desirable to be procured from a third country for assurance of quality and durability.
3)Machines and Equipment
General construction machines for earthworks, pavement, and concrete construction are available in the local market. On the other hand, mixture plant, ready-mixed concrete and its related machines, and other specific machines (Road Header, elector attached shotcrete machine, sound proof gates etc.) are deemed proper to be procured from a third country from the procurement reliability and availability point of view.

CHAPTER 10
STUDY ON RE-ALIGNMENT AT SANGA PASS


10-1
CHAPTER 10 STUDY ON RE-ALIGNMENT AT SANGA PASS
10.1 INTRODUCTION
A bypass, as shown in Figure 10.1-1, was proposed during the previous survey. The proposed bypass deviates to the left from the existing road at the entrance of the recreational facility, the Kathmandu Fun Valley. It then crosses a valley and meets with a hill located across (to the north of) the existing road and separated by a valley. This hill stands next to where the statue of Shiva is erected. The alignment further runs along the slope of the hill, comes to the existing road at Sanga Pass, where the elevation of the proposed route is about 7 m below the existing road and finally meets with the existing road about 200 m east from Sanga Pass. The alignment has a 189 m long bridge provided over the valley and a box culvert at Sanga Pass, forming an underpass to allow access to the Sanga Community. Concrete crib works are provided for stabilizing the cut slopes at the hill beyond the bridge.
10.2 ISSUES OF THE STUDY AREA
As already mentioned in the current condition of the existing road in Section 2.2, the study area is located at the east verge of Kathmandu Valley and is a mountainous area. Some of the issues of the area are as follows;
⚫ Topography of the area is very rugged and winding, which is evident from the small, sharp and continuous horizontal curves in combination with steep vertical grades of the existing road.
⚫ The Pass is a sudden rise. The Pass (top) is about 125 meters higher than the elevation of its foot in a horizontal distance of just 1.2 km (a straight line connecting the foot and the top of the Pass will have an average grade of 10%). The existing road has consecutive vertical grades with maximum grade as high as 8% that contributes to heavy traffic congestion.
⚫ The geology of the area is fragile and weak and is prone to slope failures. The latest slope failure that interrupted traffic for several hours was observed during monsoon in 2015.
⚫ Sanga Pass vicinity is home to Sanga community where houses/residence exist densely and
Figure 10.1-1 Proposed Bypass at Sanga (Previous Survey)
Concrete Crib Works Existing Road
Kathmandu Fun Valley
Bridge (198m)

10-2
widely. ⚫ It hosts a statue of Shiva, a Hindu deity, that prides for being the tallest bronze statue in the
world, a recreational facility (Kathmandu Fun Valley), religious shrines, wellness resorts among others, and is a hot destination for Kathmanduits and the people of nearby cities/villages.
⚫ The area along the existing road is seeing significant increase of residence year-by-year due to expansion of the Valley to the east.
10.3 BASIC POLICIES FOR DELINEATION
This area is the most critical section within the objective section of this Study. Delineation at other sections basically follows the alignment of the existing road, but this section is mountainous and consists consecutive sections with sharp curves and steep gradient, where following the existing alignment is geographically difficult. Therefore, re-alignment planning here will be based on following policies.
⚫ Several alternatives will be studied combined with a comprehensive comparison from evaluation factors such as efficiency of alignment, maintenance ease, environmental and social impact, cost etc.
⚫ Findings from site reconnaissance and engineering surveys regarding the topography, geology, groundwater condition etc. will be reflected.
⚫ Provision of a tunnel structure that best meets the local requirements. ⚫ The alignments (horizontal and vertical) will meet the required criteria set in the Asian
Highway Standards, ⚫ It will take into consideration the tunnel type appropriate to the area, ⚫ For the tunnel section, the alignments, particularly the vertical alignment, will take the current
vehicles plying on the objective section into consideration, ⚫ The alignments will have minimal adverse impact to both the social and natural environment
of the area, ⚫ The land to be acquired will be minimal, ⚫ Relocation of houses, shrines, holy trees, other religious and commercial facilities will be
minimum.
10.4 BASIC CONDITIONS OF THE DELINEATION
Following conditions apply to study of delineation (re-alignment) at this area;
i) The alignment will be provided with a tunnel through the Pass, ii) The inbound and outbound directions will be separated, which means tunnel to be provided will
be a twin type, iii) Both the inbound tunnel (coming to Kathmandu) and outbound tunnel (leaving Kathmandu) will

10-3
have 2-lanes, and iv) Service tracks will not be provided in this section.
10.5 POLICIES FOR TYPICAL CROSS SECTIONS
Typical cross section of the approach roads will meet the requirements of the Asian Highway Standard. It will have 4-lanes with a 3.5 m wide lane (carriage width of 7 m). The inbound and the outbound lanes will be separated by a hard median at least 3m wide (This will vary at the portals owing to the requirement of tunnel standard). The roads will have a 0.5 m wide inner shoulder and 2.5 m wide outer shoulders. Guard pipes for preventing access to the road will be provided.
Provision of service tracks in this section is not necessary. The existing roads will bear the function of the service tracks.
Typical cross section of the tunnel will also have 2-lanes on each side (inbound and outbound) with similar width as that of the approach road. However, the shoulders will have a reduced width of 0.5 m. Both sides of the tunnels will be provided with a 0.75 m wide audit corridors.
Typical cross-section of approach road and tunnel sections are indicated in Figure 10.5-1 and Figure 10.5-2 respectively.
Figure 10.5-1 Typical Cross-Section of Road
Figure 10.5-2 Typical Cross-Section of Tunnel Portal

10-4
10.6 COMPARISON STUDY OF ALTERNATIVE ALIGNMENTS
Three routes are proposed for comparison, taking into consideration the issues of the area, basic delineation concept and conditions and typical cross-sections to be applied for the section. Alternatives such as adoption of “Zero-option”, which refers to no improvement to be made in this section and widening of the existing road are excluded from alternatives. Exclusion of the former alternative comes from the results projected by the traffic demand forecast which demands widening to 4-lanes to cope with the rapid increase of traffics and resolve the traffic congestion and traffic safety issues and potential damages from disasters. Exclusion of the latter alternative comes from the fact that widening the existing road is not justifiable from cost, construction planning, environmental and social consideration and resiliency to disasters.
The comparative study of three alternative routes are shown in Table 10.6-1. These routes are compared/evaluated by indicators like project cost, alignment condition, maintenance efficiency, environmental and social impacts, construction efficiency etc..
Route 1 is a bypass that deviates from the existing road to the north. It spans a valley to the adjacent side of the existing road and runs along the mountain and returns to the existing road at the Sanga Pass. Approximately 3.2km long, this route consists of a bridge about 200m long and high cut slopes (with crib works). Number of houses affected is also highest as it runs through many alongside houses at the Sanga Pass.
Route 2 follows the existing road slightly diverting to the north and then running south - almost parallel with the existing road and meets with the existing road slightly beyond Sanga Pass. It assumes application of twin tunnel across Sanga Pass. The route is approximately 2.9km long and consists of a tunnel section about 1.3km long. The horizontal alignment of the tunnel section is straight with vertical grade of 3.5%. It passes through one residential area affecting minimum number of houses.
Route 3, on the other hand deviates to further north of Route 1 and meets with the existing road slightly beyond Sanga Pass, almost at the same location as that of Route 2. It also assumes application of a twin tunnel across Sanga Pass. The route is approximately 2.9km long and consists of a tunnel section about 1.4km long. The horizontal alignment of the tunnel is almost straight with a slight curve at the west portal and has a vertical grade of 3.0%. It passes through dense residential area affecting maximum number of houses.
From the comparison, “Route 2” is the most superior alignment among the three alternatives. This alignment allows improvement in a manner that requires least resettlement and land acquisition, has least adverse environmental impact and is economically viable compared to other tunnel alternatives. The comparison reflects all the information and data collected from site reconnaissance, engineering surveys and discussions held with concerned officials of the GON.

10-5
10-5
Table 10.6-1 Comparative Study of Alternative Route
Schematic Plan
Alternative [Route 1] [Route 2] [Route 3]
Route outline
Bypass route proposed as alternative of improvement of existing road (base plan of this comparative study)
Alignment passing south side of the existing road, includes a tunnel and is the most construction efficient route
Alignment passing further north side of Route 1, includes a tunnel and has high driving comfortability (alignment)
Route length:3,150m (Bridge : 200m, Approach section: 2,950m)
Route length: 2,835m (Tunnel length: 1,264m, Approach section: 1,571m)
Route length: 2,900m (Tunnel length: 1,400m, Approach section: 1,500m,)
Project cost Construction 1.00 ◎
1.75 △
1.77 △
Land 2.33 1.00 1.00
Road Alignment
Horizontal Entire route:R=130m~3,000m
△
Entire route: R=400m~500m Tunnel section: R=Straight
〇
Entire route: R=500m Tunnel section: R=500m
◎
Vertical Entire route: i=7.00% Entire route: i=1.10%~5.00% Tunnel section: i=3.5%
Entire route: i=1.10%~5.00% Tunnel section: i=3.0%
Maintenance Maintenance of large-cut-surface (10 cutting steps) is required. 〇
Maintenance scale is same as Route 3. (Tunnel length is same as Route 3) 〇
Maintenance scale is same as Route 2. (Tunnel length is same as Route 2) 〇
Social environment Resettlement higher than other routes as the route passes through several residential areas. △
Route passes through only one residential area and thus, scale of relocation is small. 〇
As the route will pass through large residential area, scale of relocation will be large. △
Natural environment Large-cut-surface is required and largely impacts environment. △
Wells could dry out due to lowering of groundwater as the route pass directly under residential area.
△ Concern for drying out of wells due to lowering of groundwater as the route pass directly under residential area.
△
Construction Efficiency Caution is required at large-cut section
△ Large-scale rerouting of existing road unnecessary. Materials from tunnel excavation can be used.
◎ Caution is required at high-embankment section. Materials from tunnel excavation can be used.
△
Evaluation (Superiority) 3 1 2
Note: In the schematic plan above, tunnels are drawn as one tunnel, but the project cost comparison is calculated for 2 tunnels.

10-6
10.7 DETAILED COMPARISON OF WEST SIDE APPROACH ROADS
Table 10.7-1 shows the comparative study of alignments for the approach road section at the western side of the tunnel portal for Route 2 (the southern route) selected in Table 10.6-1. Two alignments are proposed and compared. Alignment 1, as highlighted by the green line, deviates from Nalinchowk to the north running along paddy fields. The alignment is expected to require minimal number of houses to be resettled but requires significant area of fertile paddy land to be acquired. Also, as the formation level of the road is high, huge volume of soil is required. The land acquisition area can be reduced by provision of retaining structures, but this will inflate the construction cost.
Alignment 2, on the other hand, follows the existing road. Compared to Alignment 1, it requires less land for acquisition and less volume of soil for embankment. But the number of houses to be resettled (most of the houses to be resettled are those that have already shifted beyond the ROW) is higher than Route 2-1. Access from the abutting houses is also a matter of concern in this case, as the formation level of the road, where the approach road meets with the existing road, is about 7 meters higher than the existing road level. Service tracks for access from the abutting houses and connection roads will be required. Number of house to be resettled can be reduced to a certain extent by providing retaining structures. However, both provision of service tracks and retaining structures will increase the construction cost.
From above, although Alignment 1 is superior in terms of social environment (comparatively few houses to be resettled), and construction planning, Alignment 2 is adopted giving emphasis to project cost (significant reduction of both construction and land acquisition cost), maintenance and consideration to natural environment. Also, since the volume of earth required for fill for the entire section is extensively high, minimizing the fill volume is largely expected to contribute to usage of mock from the tunnel to other fill areas, thereby contributing to the reduction of construction cost as well.

10-7
Table 10.7-1 Comparative Study of Alternative Route
Schematic Plan
Alternative [Alignment 1] [Alignment 2]
Route outline
Uses the paddy field at the north of the existing road to minimize resettlement of houses
Utilizes the existing road to minimize land acquisition area
Route length: 2,800m (Construction section: 1,600m, Tunnel section 1,200m)
Route length:2,785m (Construction section: 1,585m, Tunnel section 1,200m)
Project cost
Construction A NPR △
Reduction of 220 million NPR ◎
Land B NPR Reduction of 1,600 million NPR
Road Alignment
Horizontal Entire route:R=400m~500m Tunnel section: R=Straight
○
Entire route:R=150m~500m Tunnel section: R=Straight
○
Vertical Entire route: i=1.10%~6.00% Tunnel section :i=3.5%
Entire route: i=1.10%~6.00% Tunnel section :i=3.5%
Construction Planning No effect to current traffic ( no need for a detour) ◎ Effect probable if no detour is
provided ○
Maintenance Maintenance surface area (embankment) is higher than Alignment 2.
○ Maintenance surface area (embankment) is smaller than Alignment 1.
◎
Social environment
17 number of houses will be affected. (Inside ROW:7, Outside ROW:10) Outside ROW area : 82,200m2
◎
Approx. 25number of residences, located in the areas indicated by the red hatched lines, will be affected (Inside ROW:16, Outside ROW:9 ) Outside ROW area : 37,200m2
○
Natural environment
The route runs over fertile paddy field
△ Large portion of ROW is used and paddy field area to be required is very small
○
Others Intersections are formed at one locations ○
Intersection is formed at one location only ○
Evaluation (Superiority)
Recommendation
Alignment 1
Alignment 2 Existing Road with ROW
Proposed Tunnel Portal (West side)


CHAPTER 11
STUDY ON TUNNEL PLANNING


11-1
CHAPTER 11 STUDY ON TUNNEL PLANNING
11.1 OUTLINE OF TUNNEL PLANNING
Outline of the tunnel planning from the viewpoints of geological condition are as follows;
• The tunnels (inbound tunnel and outbound tunnel) at the Sanga Pass are mostly planned in the direction of northeast and southwest, and are around 1,300 m in length,
• The result of field reconnaissance survey, the main geology around the tunnel is alternate layer of sandstone and phyllite.
• Especially, the geology around tunnel portals is assumed to be strongly weathered and thick,
• Based on the results of the geological survey in this survey, it is assumed that the main rock quality is soft rocks and the groundwater level is not so high.
11.2 ENGINEERING APPROACH
11.2.1 Design Standards
Japan is one of the most experienced countries in the world in the field of tunneling. The geology and geotechnical condition of Nepal is very similar to that of Japan. Therefore, the study on tunnel planning under this Project is based upon the experiences in Japan and the design of the tunnel is based on the Japanese Standards listed in Table 11.2-1. These standards are applied to all the highway tunnels and national road tunnels in Japan, and most of them have been constructed by New Austrian Tunneling Method (NATM), which is a standard construction method of mountain tunnels in the world. This method is applicable also in the case of the tunnel planned at Sanga Pass as geologically and topographically Sanga pass is mountainous and hilly area. However, as the tunnel section is assumed to encounter fragile and weak layer of rocks, provision of auxiliary method will be necessary to secure stability of tunnel ground arch and face during excavation. Auxiliary methods will be planned necessarily.
Table 11.2-1 List of Applied Japanese Standards for Tunnel Design
Standard Issue Year
Standard Specifications for Tunneling-2016: Mountain Tunnel Japan Society of Civil Engineers 2016
Road Tunnel Technical Standards for Tunnel Structure Japan Road Association 2003
Road Tunnel Technical Standards for Tunnel Ventilation Japan Road Association 2008
Traffic Capacity for Road Japan Road Association 1984
Commentary on Road Structure Ordinance Japan Road Association 2015
Road Tunnel Technical Standards for Emergency Facilities Japan Road Association 2001

11-2
Standard Issue Year
Maintenance Guideline for Road Tunnel (Structure) Japan Road Association 2015
Maintenance Guideline for Road Tunnel (Facilities) Japan Road Association 2016
Design Standard for Telecommunication Facilities (Electric) Association of Electricity and Telecommunication Engineering for Land and Infrastructure
2017
Installation Standard for Road Lighting Facilities Japan Tunneling Association 2006
Observation/Measurement Guideline for Road Tunnel Japan Tunneling Association 2009
Design Guideline -Part3- and -Part4- Nippon Expressway Research Institute Company (NEXCO) 2016
Road Tunnel Safety Construction Guideline Japan Road Association 1996
11.2.2 Design Condition
(1)Road Classification and Design Speed
As already mentioned in Section 9.2 (2), the Asian Highway Standard functionally classifies the tunnel section as “Class I” and applies a design speed of 60 km/h, as Sanga area is in a mountainous region.
(2)Geometric Condition
The geometric conditions in Table 11.2-2 will apply for the design works of the tunnel. Also, the geometric structure conditions such as necessary space for installation of Jet Fan and the types of audit corridor to set the tunnel standard cross-section are set with reference to the common practice of the Japanese tunnel of the same scale as this tunnel.
Table 11.2-2 Geometric Condition (Tunnel Design)
Items Conditions Remarks Design Speed 60km/h Asian Highway Standard
Number of Lane 4 2 lanes of each direction
Width (m)
Carriageway 3.5 Asian Highway Standard
Shoulder 0.5 Commentary on Road Structure Ordinance
Audit Corridor 0.75 Road Tunnel Technical Standards for Tunnel Structure
Camber (Crossfall)(%) 2.0 Asian Highway Standard
Maximum Vertical Grade (%) 3.5% To set around 3% with reference to Common Practice in Japan and Nagdhunga Tunnel Project
Clearance 5.0 Nepal Road Standard 2070
(3)Mutual Separation Distance of Each Tunnel
In cases where new tunnel or other structures are to be constructed nearby an existing tunnel, it is generally designed taking necessarily the effect of deformation and stress exerted to the existing tunnel into consideration.
The traffic demand forecast conducted in this Study indicates that the existing 2-lane road is beyond its capacity and widening to 4 lanes is required immediately. Therefore, the tunnel section must also be

11-3
planned to accommodate 4 lanes. When the number of lanes to be provided for each direction exceeds 2-lanes, fundamentally a twin tunnel is applied from the viewpoints of workability and stability of tunnel structure. This Study also plans to provide a twin tunnel, one tunnel for each direction and the two tunnels will have a mutual separation distance (distance between the centerline of two tunnels) of 30 m as shown in Figure 11.2-1 based on the Design Guideline -Part 3 in consideration of the effect of deformation and stress by neighboring construction.
Structural behavior will vary significantly, depending on factors such as the extent of neighboring construction, overburden, ground condition, existing tunnel structures, the construction method and construction sequence. The main effect of neighboring construction is that the tunnel is feared to suffer deformation at the lateral side of the neighboring construction, further loosening of ground surrounding the tunnel, and increase of loads acting on supports and the lining. Therefore, it is necessary to study in detail and decide an appropriate mutual separation distance in detailed design stage based on these conditions, detailed plan of the tunnel approach road and environmental consideration around the tunnel.
Source: JICA Study Team (refer to Design Guideline -Part3-)
Figure 11.2-1 Mutual Separation Distance of Tunnels
11.2.3 Rock Classification Method and Standard Support Patterns of the Tunnel
Based on the site reconnaissance and the results of the geological survey in the project, the ground level of tunnel section is classified with reference to the index shown in
Table 11.2-3. Also, the support patterns for the tunneling shown in Table 11.2-4 are applied based on that ground levels.
Tunnel support types in this Study are mainly classified into 3 types to reflect the geotechnical condition of the tunnel so far encountered. They are DI, DII and DIII.
Type DI is applied to the ground where rock mass is sheared or weathered. Type DII is applied to the ground where rock mass is heavily sheared and weathered or where fault zones are expected. Type DIII is applied to sections near to tunnel poral where formation of ground arch is difficult.
Rock classification and support pattern for the tunnel are shown in Figure 11.2-2.

11-4
Table 11.2-3 Rock Mass Classification System
Rock class Condition of rock mass RQD Stability of face Convergence
B
Rock is fresh and hard. Discontinuous planes are stable and the possibility of loosening due to tunnel excavation is very small.
60 to 90
The strength is significantly higher than the expected load and only occasional local spalling of rock fragment may occur.
Convergence of tunnels is negligible.
CI
Rock is partly weathered or altered. Discontinuous planes are generally relatively stable
20 to 70
The strength is higher than the expected load and the loosening is expected to be local.
Convergence of tunnels is usually within the elastic range.
C II
Rock is partly weathered or altered and fractured.
20 to 70
Strength is not significantly higher than the expected load, but is sufficient to limit the elastic deformation. Rock chunks along slippery discontinuous planes tend to spall.
Convergence stops to increase before the tunnel face has advanced a distance of 2 D, where D is the tunnel diameter. Convergence of tunnels does not exceed 50 mm.
D I
Rock is significantly weathered and softened or sheared.
< 20
Partial plastic displacement and elastic deformation could occur. Or even if the strength is high enough to limit the elastic deformation, significant loosening of ground along slippery discontinuous planes could occur.
Where the strength is small and the invert concrete is not placed at an early stage, the convergence could reach 30 to 60 mm and does not stop to increase even if the tunnel face has advanced more than 2 D
D II
Rock is completely weathered and partly softened to soil, or heavily sheared.
< 20
The strength is low compared to the expected load and large plastic deformation as well as elastic displacement could occur. In addition to the low strength, significant loosening of ground along slippery discontinuous planes and large displacement could occur.
Convergence of tunnels could reach as far as to 60 to 200 mm and does not stop to increase even if the tunnel face has advanced more than 2 D, if the invert concrete is not placed at an early stage
DIII It is tunnel portal section where the overburden is around 1.0 D to 2.0D.
- It is difficult to form the ground arch due to a thin overburden. -
E Ground such as faults, fractured zones and large talus deposit.
- Squeezing occurs and generates occasional collapse in face area.
Large deformation could reach to 400mm.
Notes: RQD (Rock Quality Designation): Indicator of degree of rock crack. The total length of rod-like cores of more than 10 cm included in the boring core length 1.0 m is indicated by percentage. Gray color: Rock class assumed in the Project
Source: JICA Project Team (refer to Design Guideline -Part3-)
Since the alignment of the tunnel and tunnel approach road was changed after the commencement of the geological survey in the project, it hasn't been carried out in just points of the final alignment of the Project. Therefore, the geological classification and preparation of geological profile were implemented

11-5
by estimation based on the results of the survey. It is necessary to carry out necessary geological survey based on the final alignment at the detailed design stage and to evaluation and finalize the geological condition.
Table 11.2-4 Standard Support Patterns for Two-Lane Tunnels
Ground class
Support pattern
Cut per
adva-nce (m)
Rock bolts Shotcrete Steel rib Lining thickness (cm) Allowab
le deformation (cm)
Excavation method Length
(m)
Spacing Construc- tion range
Thickne-ss
(cm)
Upper half size
Lower half size
Install-ation
Interval(m)
Arch & wall Invert Periph-
eral (m)
Longitu- dinal (m)
B B 2.0 3.0 1.5 2.0 Upper
half 120 5 - - - 30 0 0
Full face with micro bench or top heading cut
C I C I 1.5 3.0 1.5 1.5 Upper half
10 - - - 30 (40) 0
C II C II-a
1.2 3.0 1.5 1.2
Upper and
lower halves
10 - - -
30 (40) 0 C II-b H125 - 1.2
D I D I-a 1.0 3.0
1.2 1.0
Upper and
lower halves
15 H125 H125 1.0
30 45 0 D I-b 1.0 4.0 1.0
D II D II 1.0 or
less 4.0 1.2
1.0 or less
Upper and
lower halves
20 H150 H150 1.0 or
less 30 50 10
Notes: The support patterns are divided into a and b as shown below. a: Standard support pattern generally used for all rock types b: Support pattern used in the initial design only when the tunnel excavation is expected to result in a larger
displacement in clay stone, black schist, mudstone, shale, tuff, or other rock types. Note that the values in ( ) for the invert are applied to tertiary mudstone, tuff, serpentinite, and other ground rocks, weathered crystalline schist, and sulfuric soil.
Source: Road Tunnel Technical Standards for Tunnel Structure

11-6
Source: JICA Study Team
Figure 11.2-2 Geological Profile

11-7
11.2.4 Cross-Section and Support Patterns of the Tunnel
Tunnel cross-sections are designed to such that it meets the geometric requirements shown in Table 11.2-2 and allows to minimize the cross-section area. The smallest cross-sections of each tunnel are same size, which are determined using repeated calculation method. This is shown in Figure 11.2-3.
Source: JICA Study Team
Figure 11.2-3 Typical Cross-Section (DI-b)
11.2.5 Plan and Profile of the Tunnel
Plan and profile of the tunnels (outbound tunnel and inbound tunnel) are shown in Figure 11.2-4 and Figure 11.2-5.
Source: JICA Study Team
Figure 11.2-4 Plan of Sanga Tunnels (Outbound and Inbound)

11-8
Source: JICA Study Team
Figure 11.2-5 Profile of Tunnel Section
11.2.6 Design of Tunnel Portal
Location of tunnel portals should be designed in consideration of stability of the slope behind the tunnel, nature and social environment around the tunnel portals. Tunnel portals in this Study are determined taking these issues into consideration. Also, mutual separation distance of both tunnel is applied to 30m based on Figure 11.2-1. If the mutual separation distance should be applied to less than 30 m due to constraints related to land acquisition, it is necessary to consider the adoption of Binocular-shaped tunnel at the detailed design stage.
(1)Western Portals (Bhaktapur Side)
The tunnel portals at the western side are designed at station No.5+455 for outbound tunnel and No.5+475 for inbound tunnel as shown in Figure 11.2-6. Site condition around the tunnel portal location is shown in Figure 11.2-7.
Policies applied for setting the tunnel portal location of Bhaktapur side are as follows;
• To Avoid intersection with the existing road, the tunnel portal is planned lower than the existing road. (If the new road passes over the existing road, bridge at the intersection for overhead crossing would be required and it is uneconomical),
• Overburden exceeding 10m in height is secured from the existing road in order to reduce the effects of subsidence on the existing road due to tunnel excavation. In addition, adequate tunnel auxiliary method are planned in conformity to the geological condition to minimize the effects of the existing road.

11-9
<Plan>
<Profile>
Source: JICA Study Team
Figure 11.2-6 Plan of Western Tunnel Portals (Banepa Side)
Photo 1 Photo 2 Photo 3
Photo 4 Photo 5 Photo 6
Source: JICA Study Team
Figure 11.2-7 Site Location Photos of Western Portal

11-10
(2)Eastern Portals (Banepa Side)
The tunnel portals at the eastern side are designed at Station No.6+749 for outbound tunnel and No.6+710 for inbound tunnel as shown in Figure 11.2-8. The site condition around the tunnel portal location is shown in Figure 11.2-9.
Policy for setting the tunnel portal location of Banepa side is as follows;
• Considering the impact on the surrounding environment, the tunnel portal is planned at a location where the cut at the upper part of the tunnel portal doesn't become large scale.
In addition, study for securing the shortest tunnel concludes a plan where the tunnel length is around 1,100m. The Western portals are fixed due to crossings with the existing road, but Banepa side is no structural restrictions due to intersection etc. and is adjustable under the conditions that it does not significantly affect the social environment around the tunnel portal. If the portals at Banepa side is set to the location shown in Figure 11.2-10 the shortest tunnel is possible. However, this is not recommendable because detailed geological survey has not been implemented in this point and large-scale cut behind the tunnel portals will have significant adverse influence on the natural and social environment. In addition, the geology of the tunnel portal is weathered totally and a large-scale slope protection behind the tunnel portal might be required in consideration of earthquake resistance and maintenance management. Therefore, it may affect economic significantly.
And also, it is necessary to sufficiently consider the portal location and cut scale behind the tunnel in consideration of the stability of the slope and cost reduction in detailed design stage.
Source: JICA Study Team
Figure 11.2-8 Plan of Eastern Tunnel Portal (Banepa Side)

11-11
Photo 7 Photo 8 Photo 9
Photo 10 Photo 11 Photo 12
Source: JICA Study Team
Figure 11.2-9 Site Location Photos of Eastern Portal
Source: JICA Study Team
Figure 11.2-10 Eastern Portal on Shortest Tunnel Plan

11-12
11.3 TUNNELING METHOD
11.3.1 Geology, Geo-Technical and Hydrological Condition of the Tunnel
Since the alignment of the tunnel and tunnel approach road was changed after the commencement of the geological survey in the project, it hasn't been carried out in just points of the final alignment of the Project. Therefore, the following conditions were determined by estimation based on the results of the survey. It is necessary to carry out necessary geological and hydrological survey based on the final alignment at the detailed design stage and to evaluation and finalize the geological and hydrological condition.
The geological and hydrological conditions around the tunnel site based on the results of the geological survey are as follows;
• Rock masses consist mostly of Phyllite with Sand stone and Sand stone. The surface layer is weathered soil, and the lower layer is rock where cracks develop. The part below the surface is composed of alternate layers of phyllite and sandstone. The phyllite part is fragile, the sandstone part is hard. Some crack zones are assumed partly, and they are possibility,
• Each portal area includes weathered rock and soil, especially eastern portal area has shallow overburden. These conditions will create problems related to stability and safety of the crown and the surface in tunnel excavation,
• Uniaxial compressive strength of rock mass (qu) is expected to be lower than approximately 50 Mpa (Rock quality is expected as hard rock or middle hard rock),
• Based on the results of the geological survey and site reconnaissance in the Project, it is assumed that the groundwater around the tunnel site is not high and the spring water during the tunnel excavation is a little (As the groundwater condition greatly affects the workability and safety of the tunnel construction, it is necessary to investigate it in detail at the detailed design stage).
11.3.2 Excavation Method of Tunneling
(1)Method of Tunneling
There are two methods of tunnel excavation method, drill & blasting (D&B) and mechanical excavation. D&B method is generally applied in hard rock mass, and mechanical excavation is generally applied in middle hard rock mass and soft rock mass.
Geology of the tunnel in the project is assumed to consist mainly of middle hard rock or soft rock and is generally classified as poor rock mass (qu<50 MPa). For this type of rock mass, the Japanese standards for tunnel structure recommends mechanical excavation using Road-Header, the picture of which is shown in Figure 11.3-1. Therefore, mechanical excavation by Road-Header is recommended in the project.

11-13
Mechanical excavation using Road-Header (Power 200 kw) has a great merit when it comes to excavating soft rock or hard rock of poor nature, where many planes of discontinuities develop. Over breaks are less than using D&B method, support patterns are lighter and the rock mass surrounding the tunnel remains more intact after excavation than D&B. However, when the rock mass is very hard and intact, it cannot excavate the rock mass economically and necessitates a bigger more powerful machine (Power 300kw or 350 kw). Further when the rock mass becomes even harder (qu>100 MPa), economical excavation becomes impossible. In such case, D&B is inevitable.
Source: https://www.kyb-ksm.co.jp/products/construction_machinery/construction_machinery-0019.html https://www.kyb-ksm.co.jp/products/construction_machinery/construction_machinery-0017.html
Figure 11.3-1 Road-Header as Tunneling Machine
(2)Method of Excavation
Tunnel excavation method is classified as shown in Table 11.3-1. Depending upon the geotechnical condition excavation face area is sometimes divided into sections and when geotechnical condition is of extremely poor, center diaphragm method or side drift method are employed.
Table 11.3-1 Classification and Characteristics of Standard Excavation Method
Excavation Method Division of Section of Heading Applicable
Ground Condition Advantages Disadvantages
Full Face Method
Common excavation method for small section tunnel Very stable ground for large section tunnel (A=30m2) Unfit for good grounds interspersed with poor ground that may require the change of the excavation method
Labor saving by mechanized construction Construction Management including safety control is easy because of the single- face excavation.
Full tunnel length cannot necessarily be excavated by full face alone. Changing of excavation method will be adopted as required. Fragment rocks from the top of the tunnel may fall down with increased energy & additional safety measure are required.
Full Face Method with Auxiliary Bench Cut
Comparatively stable ground, but difficult using the Full Face Method. Full-face excavation is made difficult during construction. Presence of some poor ground in fairly good ground.
Labor saving due to mechanized construction Construction management including safety control is easy because of the single-face excavation.
Difficult to switch to other excavation method when the face does not stand up.
Bench Cut Method
Long Bench Cut
Ground is fairly stable, but Full-face excavation is difficult.
Alternate excavation of top heading and lower bench reduces equipment and manpower needs.
Alternate excavation system elongates the construction period.

11-14
Excavation Method Division of Section of Heading Applicable
Ground Condition Advantages Disadvantages
Short Bench Cut
Applicable to various ground such as softly ground, swelling ground, and medium to hard rock ground. (The most fundamental and popular method.)
Adaptable to change in the ground condition.
Parallel excavation makes difficult the balancing of cycle time for top heading and bench.
Mini Bench Cut
Deformation control of the excavated inner section is more urgently required than in the case of the Short Bench Cut. Squeezing ground that require an early closure of the excavated section
Easy to make early closure of the invert.
Parallel excavation makes difficult the balancing of cycle time for top heading and bench.
Center Diaphragm Method
Ground of shallow overburden where ground surface settlement is required to be kept at a minimum. Comparatively poor ground condition for a large section tunnel.
Face stability is secured by dividing into small sections. Ground Surface settlement can be significantly reduced. Divided sections of heading are larger than those used in the Side Drift Method, and larger machines can be used.
Displacement or settlement during the removal of the diaphragm shall be checked. Time for diaphragm removal is added to the construction period. The adoption of a special auxiliary method in the tunnel is difficult.
Side Drift Method
Bearing capacity of the ground is not sufficient for adopting the Bench Cut Method. Ground of shallow overburden where ground surface settlement is required to be kept at a minimum.
Ground surface settlement can be reduced. Temporary diaphragms can be more easily removed than those of center diaphragm method.
Small machines have to be used for drift excavation.
Sources: JICA Project Team (refer to Standard Specifications for Tunneling-2016: Mountain Tunnel)
11.3.3 Sequence of Tunneling and Temporary Facilities for Tunnel Construction
It is recommended that the tunnel excavation is started from western side, Bhaktapur side, due to following reasons;
• Soil and rocks excavated can be readily available for construction of embankment of tunnel approach section, around Station No.4+300 to western tunnel portal,
• Since the tunnel can be excavated with an uphill gradient, draining waste water and spring water outside of the tunnel naturally is possible,
• The number of houses around the tunnel portal of western side is fewer than eastern side and the impact of noise to the houses is small.
The sequence of tunnel excavation is shown in Figure 11.3-2. Also both the tunnels (inbound/outbound tunnel) are planned to be excavated simultaneously.
Also, the guideline for preventive countermeasures against accidents from rock fall in the face of mountain tunnel construction (18 Jan. 2018, Ministry of Hearth, Labor and Welfare, Japan), should be followed/referred during the tunnel construction.

11-15
Source: JICA Study Team
Figure 11.3-2 Sequence of Mechanical Excavation
11.4 AUXILIARY METHOD
Some of the auxiliary methods are designed in the support patterns such as fore-porling and fore-piling likely umbrella (see Figure 11.4-1) in accordance with geological condition and tunnel surrounding environmental such as very poor ground, fault zones and neighboring construction with important structures.
Since the tunnel portal of Bhaktapur side crosses with the existing road, it is necessary to suppress the subsidence of the existing road caused by tunnel excavation. Also, since the geology around the tunnel portal of Banepa side is weathered rock, it is necessary to ensure the stability of the tunnel face and ground arch. Therefore, a long span fore-pilling method is applied to both portal area.
Long span fore-pilling method is divided into widening type and non-widening type. Widening type is a method of expanding the face and inserting the steel pipe from between the tunnel supports. The non-widening type is a method of inserting a steel pipe from between tunnel supports without expanding the face. Since it plans to be apply at thin overburden section, it is desirable to avoid the application of the widened type which makes the overburden thinner. Therefore, it is recommended to apply non-widening type in the tunnel.

11-16
Source: Technical Document of AGF Method -6th revised edition- (Right) JICA Project Team (Left)
Figure 11.4-1 Long Span Fore-Piling in Difficult Ground (non-widening type)
11.5 TEMPORARY FACILITIES AND EQUIPMENT NECESSARY FOR TUNNEL CONSTRUCTION
Major temporary facilities consist of drainage water treatment plant for drainage water from the tunnel, concrete batching plant for shotcrete and lining concrete, diesel generators for electric supply, ventilation fan and dust collector to keep inside the tunnel clean and temporary houses for office and labor camps and so on.
These facilities for tunnel excavation will be planned in western tunnel portal. The tunnel will be excavated from western side so that it is easy to treat the construction drainage and ground water during tunnel excavation. Proposed layout of temporary facilities for tunnel construction is shown in Figure 11.5-1.
Detailed layout of the temporary facilities and detailed tunnel construction plan will be considered in consideration of the result of the tunnel excavation plan, road construction plan and influence on the noise caused by the construction.

11-17
Source: JICA Study Team
Figure 11.5-1 Layout of Temporary Facilities for Tunnel Construction
11.6 FACILITIES NECESSARY FOR TUNNEL
11.6.1 General
Table 11.6-1 lists the facilities to be installed in road tunnels (inside and outside) for securing safe and smooth traffic flow. The facilities will be designed based on the standards stated in Table 11.2-1 and in consideration of consistency and combination management with Nagdhunga Tunnel Project.
Table 11.6-1 Facilities to be Installed Tunnel
Facilities Equipment
Tunnel Ventilation
Tunnel Inside Jet Fan*/ CO meter/ VI meter/ AV meter Tunnel Outside Local Control Panel
Tunnel Lighting
Tunnel Inside Interior Lighting/ Entrance Lighting/ Emergency Lighting Tunnel Outside Local control panel, etc.
Emergency Facilities
Tunnel Inside Emergency Telephone/ Push Button Alarm/ Fire Detector/ Fire Extinguisher/ Fire Hydrant/ Guide Board, Hydrant/ CCTV Camera, etc.
Tunnel Outside Local Control Panel/ Water Supply Pump/ Water Tank/ Pump Panel/ Emergency Information Board, etc.
Other Facilities
Tunnel Inside -
Tunnel Outside Electrical Room/ Management Office/ Power supply system/ Back-up Generator, etc.
*To install inside Outbound Tunnel.

11-18
11.6.2 Ventilation Facilities
(1)General
Ventilation in the tunnel forcibly discharges harmful substances discharged by the vehicle to tunnel outside and secures safety and comfortability for driving inside the tunnel by keeping the concentration of harmful substances in the tunnel below the control standards. And also, it is important to provide better environment for the superintendents that undertake the tunnel maintenance work. The necessity of tunnel ventilation and the detailed specification of ventilation equipment are considered based on various elements such as tunnel cross-section, tunnel length and traffic volume in the tunnel. In case ventilation volume inside the tunnel by natural wind is not enough to meet safe and comfortable condition inside the tunnel, mechanical ventilation system must be necessary. Study for the necessity of mechanical ventilation system is described in below.
(2)Design Standard for Tunnel Ventilation
Tunnel ventilation is designed by Road Tunnel Technical Standards for Tunnel Ventilation (2008) listed in Table 11.2-1. However, for the following reasons, the basic unit of exhaust gas shall be applied from Road Tunnel Technical Standards for Tunnel Ventilation (2000).
• The value of exhaust gas regulation in Nepal is close to that of short-term target value in 1992-1996 in Japan and it can be considered to be equivalent to the Japanese vehicle performance at that time,
• Road Tunnel Technical Standards for Tunnel Ventilation (2000) is based on the vehicle performance survey for exhaust gas implemented in 1991-1993 in Japan,
• By applying this standard to the design of tunnel ventilation in this project, it is possible to design in consideration of vehicle exhaust gas performance in Nepal.
In addition, it is necessary to thoroughly study the exhaust gas consumption unit and target hazardous substance concentration at the detailed design stage.
(3)Design Condition
The design conditions are shown in Table 11.6-2. Table 11.6-2 Design Condition (Ventilation Facility)
Item Condition Remarks Tunnel Length 1,235 m, 1,294 m (Inbound, Outbound)
Vertical Gradient 3.5 % Both tunnels are same Tunnel Altitude Less than 1,500 m
Cross Section Area 57.8 m2 Hydrant Diameter 7.9m
Traffic Condition One Way Traffic Two tube tunnels (Inbound & Outbound)
Design Speed 60 km/h Mix Rate of Large Vehicle 17.1 %

11-19
(4)Type of Ventilation System
There are several types of ventilation system such as longitudinal ventilation system, semi-transverse ventilation system, transverse ventilation system and a combination of these types. Longitudinal ventilation system typified by the jet fan is the most economical and widespread system. Use of jet fans in particular is effective in terms of low running cost, providing ventilation even if vehicles are queuing in the tunnel and removal of smoke in the event of a fire.
From above, the ventilation system of the tunnel adopts the longitudinal ventilation system (Jet Fan system).
(5)Required Air Volume
Required air volume in the tunnel and the number of ventilation (Jet Fan) is calculated based upon the factors described below.
1)Design Traffic Capacity and Design Traffic Volume Per Hour
Design traffic capacity and design traffic volume per hour in this tunnel are shown in Table 11.6-3 and Table 11.6-4.
Table 11.6-3 Design Traffic Capacity
Item Condition Remarks
Basic Traffic Capacity (CB) 2,200 pcu/hour Traffic Capacity for Road, p22
Correction Factor of Carriageway (γL) 1.00 Traffic Capacity for Road, p20
Correction Factor of Side Space (γC) 1.00 Traffic Capacity for Road, p25
Passenger Car Conversion Factor of Large Vehicle (γT) 0.79 Traffic Capacity for Road, p31
Correction Factor of Roadside Condition (γC) 1.00 Traffic Capacity for Road, p27
Available Traffic Capacity (C) 4,400 pcu/hour C= CB×γL×γC×γI×2lanes
Plan Level (PL) 0.75 Traffic Capacity for Road, p84
Design Traffic Capacity (CD) 2,607 pcu/hour CD = C×PL×γT
Table 11.6-4 Design Traffic Volume per Hour
Item Condition Remarks Design Traffic Volume
(ADDT) 30,918 vehicle/day
K Value (K) 10 % Traffic Capacity for Road, p80
D Value (D) 60 % Traffic Capacity for Road, p83
Design Traffic Volume per Hour 1,855 vehicle/hour =ADDT×K/100×D/100
Traffic Capacity for Road, p81

11-20
2)Design Value of CO and Visibility
Acceptable environment design values of pollutants in the tunnel are shown in Table 11.6-5.
Table 11.6-5 Design Values for CO and Visibility
Design Speed CO Visibility
Transmissions (beam length: 100 m)
More than 80km/hour 100ppm
50%
Less than 60km/hour 40% Source: Road Tunnel Technical Standards for Tunnel Ventilation, P26
3)Basic Emission Factors
The basic-emission factor, speed and graduation compensating rate and altitude compensating rate are shown in Table 11.6-6.
Table 11.6-6 Basic Emission Factors
Cars Particle Matter (Opacity) CO
Average (m2/km) Standard Valuation (m2/km) Average (m3/km)
Large Vehicle 5.1 2.3 0.007
Normal Vehicle 0.5 0.7 Source: Road Tunnel Technical Standards for Tunnel Ventilation, P55~58
Speed & Gradient compensation factor for PM Altitude compensation factor for PM&CO
Source: Prepared with reference to “Road Tunnel Technical Standards for Tunnel Ventilation” by JICA Study Team
Figure 11.6-1 Speed & Gradient Compensation Factor and Altitude Compensation Factor

11-21
4)Required Air Volume and Natural Air Volume
Required air volume and natural air volume of the tunnel are shown in Table 11.6-7 and Table 11.6-8.
Table 11.6-7 Required Air Volume of Outbound Tunnel
Item Design Traffic
Volume per Hour Design Traffic
Capacity Remarks PM CO PM CO
Design Value 40% 100ppm 40% 100ppm Road Tunnel Technical Standards for Tunnel Ventilation, p26
Ventilation Coefficient (m3/s) 0.0463 0.0194 0.0463 0.0194 Road Tunnel Technical Standards for
Tunnel Ventilation, p55~58 Gradient Correction
Coefficient 2.97 - 2.97 - Road Tunnel Technical Standards for Tunnel Ventilation, p62
Altitude Correction Coefficient 2.82 - 2.74 - Road Tunnel Technical Standards for
Tunnel Ventilation, p63 Required Air Volume
(m3/s) 422 75 577 106 Road Tunnel Technical Standards for Tunnel Ventilation, p57~58
Adopted Required Air Volume (m3/s) 422 577
Table 11.6-8 Required Air Volume of Inbound Tunnel
Item Design Traffic
Volume per Hour Design Traffic
Capacity Remarks PM CO PM CO
Design Value 40% 100ppm 40% 100ppm Ventilation
Coefficient (m3/s) 0.0463 0.0194 0.0463 0.0194
Gradient Correction Coefficient 0.37 - 0.37 - Road Tunnel Technical Standards for
Tunnel Ventilation, p57~58 Altitude Correction
Coefficient 1.35 - 1.35 - Road Tunnel Technical Standards for Tunnel Ventilation, p57~58
Required Air Volume (m3/s) 53 72 74 101 Road Tunnel Technical Standards for
Tunnel Ventilation, p57~58 Adopted Required Air Volume (m3/s) 72 101
Table 11.6-9 Natural Air Volume
Item Condition Remarks Inbound Outbound Cross Section Area 57.8 m2 57.8 m2
Design Traffic Volume Per Hour 1,855 vehicle/hour 1,855 vehicle/hour
Natural Wind Velocity 2.5 m/s 2.5 m/s Road Tunnel Technical Standards for Tunnel Ventilation, p251
Natural Air Volume 307 m3/s (>72 m3/s) 309 m3/s (<422 m3/s) Ventilation System Unnecessary Necessary

11-22
5)Number of Jet Fans
The number of jet fans calculated by the value of CO and visibility are shown in Table 11.6-10.
From the value of natural air volume and required air volume in both tunnels, ventilation facility is not required in the inbound tunnel because the natural air volume is higher than the required air volume. On the other hand, it is necessary to install ventilation facility in outbound tunnel because the required air volume is higher than the natural air volume.
The ventilation calculation is carried out assuming JFX-1250 published in Road Tunnel Technical Standards for Tunnel Ventilation (Japan Road Association) and Standard Specification for Tunnel Ventilation (Nippon Expressway Research Institute Company). The results of ventilation calculation of outbound tunnel indicate that the necessary number of jet fans is 6 units as shown in Table 11.6-10. Also, they will be set at distance of 160 m from the tunnel portal and at intervals of 160 m inside the tunnel based on Design Guideline -Part3-.
However, considering increase of the traffic volume of large vehicles due to future social situation changes, it is desirable that the tunnel cross section that the jet fans can be install is applied to the inbound tunnel. If the jet fan is installed to the tunnel that installation space for jet fans is not secured, the construction works for installation of jet fan will be definitely very large scale and difficult. As for the cross section of inbound tunnel, it is necessary to sufficiently discuss and consider the necessity of installation of Jet Fan and decide the details in the detailed design stage.
The ventilation facility also has the smoke removal function to support emergency evacuation and firefighting activities. Based on the past performance of installation of ventilation equipment for smoke removal in Japan, this tunnel does not require the installation of it. However, since the disaster prevention level of the tunnel is determined by the road administrator and the firefighting organization, it is necessary to examine in detail the installation of the mechanical ventilation facility for the uplink tunnel for the detailed design stage.
Table 11.6-10 Number of Jet Fan of Outbound Tunnel
Item Condition Remarks Friction Loss by Tunnel Wall (ΔPr) 182.1 Pa
Pressure Distance by Natural Air (ΔPMT) 21.4 Pa Ventilation Volume by Traffic Flow (ΔPt) -74.3 Pa
Boosting Power per Jet Fan (ΔPj) 24.8 Pa Necessary Number of Jet Fan (Ji) 6 units Ji = (ΔPr+ΔPMT+ΔPt)/ΔPj
6)Specification of Jet Fan
Standard specification of selected jet fan (JFX-1250) and installation cross section are shown in Table 11.6-11 and Figure 11.6-2. The operation cost of Jet Fan can be reduced by adopting the Jet Fan with inverter control system. Also, since this system is expected to be effective for emergency evacuation support, it is necessary to consider the necessity of it at the detailed design stage.

11-23
Table 11.6-11 Standard Specification of Jet Fan (JFX -1250)
Item Specification Diameter of Fan (mm) 1,250mm Average Wind Speed More than 35 m/s
Efficiency More than 75 % Noise Less than 95 (dB (A)) Length 4,250mm
Diameter 1,450mm Flow Rate More than 43 m3/s
Air Flow Area 1.23 m2 Blow Direction Both Side
Motor Type Three Phase Induction, Drip Proof Type Motor Voltage 400 V Motor Power Less than 50 kW
Source: JICA Study Team (Cross-section)
https://car.watch.impress.co.jp/img/car/docs/690/622/html/29.jpg.html http://www.e-nexco-engi.co.jp/sekkei_denki.html
Figure 11.6-2 Installation of Jet Fan
11.6.3 Tunnel Lighting Facilities
(1)General
Lighting inside the tunnel is very important to secure traffic safety. Tunnel lighting is composed of Primary Lighting, Entrance Lighting and Emergency Lighting (in case of power cut). Detailed layout and the specification are considered based on the following factors. In recent years, LED lighting which meets the following factors is used as tunnel lighting in in many countries including Japan. Therefore, LED lighting is applied for design of Sanga Tunnel lighting.
11-24
• High efficiency with long life
• Accommodating against high temperature, durability and humidity
• Appropriate luminescent color
• High luminous flux to meet the required high lighting level
• Easy maintenance
• Low running cost
1)Interior Lighting
Basic lighting is installed at regular intervals over the entire length of the tunnel to provide the necessary brightness for the drivers so that they can see the obstacles ahead under constant speed.
2)Entrance Lighting
Entrance lighting is installed to adjust the difference between outdoor brightness and brightness in the tunnel. Therefore, it is necessary to set the luminance so that the influence of luminance can be mitigated when change when the driver enters the tunnel.
3)Emergency Lighting during Power Failure
In case of a sudden loss of power, emergency lighting is required to prevent visual obscuration for the drivers already running in the tunnel. Power shall be supplied from the UPS immediately as uninterruptible power source, and subsequently it shall be connected to the back-up generator.
4)Lighting outside the Tunnel Entrance
The street lamp at the exit of tunnel shall be installed adequately to guide the drivers coming up from the tunnel, especially in nighttime. No street lamp at the exit road may cause the constriction of the visual field of drivers and may lead to the accidents.
(2)Design of Tunnel Lighting
Installation Standard for Road Lighting Facilities and Design Standard for Telecommunication Facilities (Electric) are applied to the design of tunnel lighting in this project. Design condition and results are shown in below.
1)Design Condition
Design condition is shown in Table 11.6-12.

11-25
Table 11.6-12 Design Condition (Tunnel Lighting)
Item Condition Remarks
Tunnel Length 1,235 m (Inbound) 1,294 m (Outbound)
Carriageway Width 7.0 m (3.5m×2 lanes)
Pavement Type Concrete Conversion Factor of Average Luminance of Road Surface 13 lx/cd/m2 Installation Standard for Road Lighting
Facilities, p108 Design Traffic Volume 15,459 vehicle/day
Design Speed 60 km/h Design Luminance of Road
Surface 2.30 cd/m2 Installation Standard for Road Lighting Facilities, p68
Lump Type LED
Luminous Flux 11,000 lm
Installation Height 5.2 m
Illumination Rate 0.693
Maintenance Rate 0.60 Design Standard for Telecommunication Facilities, p4-100
Total Uniformity more than 0.4 Installation Standard for Road Lighting, p70
Uniformity of Lane Axis more than 0.6 Installation Standard for Road Lighting, p70
2)Illuminance Calculation Result
a)Interior Lighting
The result of illuminance calculation for interior lighting is shown in Table 11.6-13.
Table 11.6-13 Number of Interior Lighting and Luminance of Road Surface
Item Condition
Installation Interval 21.5 m
Number of Interior Lighting* Inbound: 58 units Outbound: 60 units
Luminance of Road Surface 2.33 cd/m2
Total Uniformity 0.548 > 0.4 (OK)
Uniformity of Lane Axis Left Side Lane: 0.640 > 0.6 (OK) Right Side Lane: 0.631 > 0.6 (OK)
* Interior lighting of battery built-in type (Emergency Lighting) is included in above number
b)Entrance Lighting
The result of illuminance calculation for entrance lighting is shown in Table 11.6-14.

11-26
Table 11.6-14 Number of Entrance Lighting and Luminance of Road Surface
Area*
Interior Lighting
(N)
Number of Entrance Lighting (N)
Luminance of Road Surface (cd/m2) Area
Length (m)
Design Standard 11,000
lm 3,500
lm 7,000
lm 10,000
lm 15,000
lm 20,000
lm 25,000
lm 30,000
lm 35,000
lm 40,000
lm Fair
Weather Cloudy
Weather Fair
Weather Cloudy
Weather
A 1 1 - - - - 10.00 B 0.5 1 3 44.78 23.56 43.94 21.97 16.25 C 1 1 4 42.70 22.52 41.86 20.93 21.50 D 1 4 35.45 18.89 35.42 17.71 21.50 E 1 1 3 30.28 16.31 29.98 14.99 21.50 F 1 3 1 24.07 13.20 23.59 11.75 21.50 G 1 3 1 15.79 9.06 15.23 7.47 21.50 H 1 1 3 9.99 6.16 9.83 4.74 21.50 I 1 2 6.47 4.40 6.34 3.02 21.50 J 1 1 1 4.50 3.42 4.09 2.30 21.50 K 1 1 3.05 2.69 2.64 2.30 21.50
L 47 2.33 2.33 2.30 2.30 1010.50
M 0.5 - - - - 4.75 Total 58 2 2 5 3 1 3 2 6 11 - - - - 1235.0 *Details of Area are indicated to Figure 11.6-3
c)Emergency Lighting
The number of emergency lighting (built-in battery type) is arranged to be 1/8 or more of the number of basic lighting. Therefore, 8 unit are installed in inbound tunnel and outbound tunnel respectively.
d)Layout of Tunnel Lighting
Based on the result of illuminance calculation, layout of tunnel lighting is shown in Figure 11.6-3.
Source: JICA Study Team
Figure 11.6-3 Layout of Tunnel Lighting

11-27
11.6.4 Tunnel Emergency Equipment/Facilities
(1)General
Tunnel emergency equipment and facilities are to support the information transmission to road users and road administrator, evacuation, self-extinguishment and fire fighter activities when accidents or disasters occur inside the tunnel.
(2)Classification of Tunnel and Installation of Emergency Facilities
In Japanese Standard shown in Table 11.2-1, necessary installation facilities of tunnel are decided by tunnel classification shown in Table 11.6-15. Also, tunnel classification is classified to Class-AA, Class-A, Class-B, Class-C and Class-D according to traffic volume inside tunnel and tunnel length as shown in Figure 11.6-4. According to this table, the higher the tunnel classification, it is necessary to install various emergency equipment.
Table 11.6-15 Installation Standard of Emergency Facilities
Source: Prepared with reference to “Road Tunnel Technical Standards for Emergency Facilities” by JICA
Study Team

11-28
Source: Prepared with reference to “Road Tunnel Technical Standards for
Emergency Facilities” by JICA Study Team Figure 11.6-4 Classification of Tunnel
(3)Type of Emergency Facilities
The outline of each emergency facility is as follows. Installation intervals described below are based on Road Tunnel Technical Standards for Emergency Facilities.
1)Emergency Telephone
Provision of Emergency Telephones as shown in Photo 11.6-1 are planned at both entrances to notify the tunnel accidents or disasters to the tunnel administrator and at intervals of 200 m in the tunnel.
Emergency Telephone on wall Emergency Telephone at Entrance Emergency Telephone Box
Source: https://radiate.jp/20130421/higashi-fushimi/ https://blogs.yahoo.co.jp/biwako_1164/59547680.html https://travel.watch.impress.co.jp/img/trw/docs/1049/821/html/12.jpg.html
Photo 11.6-1 Emergency Telephone Types
2)Push Button Alarm
Provision of Push button alarm system as shown in Photo 11.6-2 are planned to be set at 1.2 to 1.5 m above road surface and at intervals of 50 m to notify the tunnel accidents or disasters to the tunnel administrator. This alarm system will connect with the emergency telephone and firefighting system.

11-29
Push Button Alarm
with Fire Extinguisher & Fire Hydrant Push Button Alarm
Source: https://car.watch.impress.co.jp/img/car/docs/685/703/html/049.jpg.html https://www.iwasaki.co.jp/projects/examples/detail.php?EID=t34&cat=3
Photo 11.6-2 Push Button Alarm Types
3)Fire Detector
Fire Detector shown in Photo 11.6-3 reacts to the smoke generated by the fire in the tunnel and detects the fire accident in the tunnel. It is planned at intervals of 50 m inside the tunnel. In many cases, it functions as a switch for activating the emergency information board, firefighting facilities and the ventilation facility with the reaction of the fire detector.
Source: http://nexcokiyomi.hida-ch.com/index_7.html http://www.pref.akita.jp/chuodo/new/newimg/h19.05.31new.html
Photo 11.6-3 Fire Detector
4)Emergency Information Board
Emergency alarm system as shown in Photo 11.6-4 sends accidents and disaster information to road users by visual signals (alarm display) or audible alarms.
It is necessary to chave adequate communication function to inform the road users of the disaster and accident situation in the tunnel and it is installed in an appropriate place not to interfere with fire extinguishing activity and evacuation activities by road users.

11-30
Emergency Information Board Control Panel
Source: http://kitanihon-t.com/results/ http://www.iwate-shinkodenki.com/case/case25.html
Photo 11.6-4 Emergency Information Board
5)Fire Extinguishers
Fire extinguishers are shown in Photo 11.6-5. They are utilized for self-firefighting by the road users and are planned at intervals of 50 m.
Source:http://www.pref.yamanashi.jp/kanjo/kanri/manriki.html https://car.watch.impress.co.jp/docs/news/688076.html
Photo 11.6-5 Fire Extinguisher
6)Fire Hydrants
Fire hydrants are as shown in Photo 11.6-6. They are utilized for self-firefighting by the road users and are planned at every 200 m interval. At the same time, the hydrant for supporting firefighting activities may be installed. In that case, the fire hydrant and the hydrant will be installed at same place.
Source:http://asahisetsubi.co.jp/construction/463/ http://photozou.jp/photo/show/629359/116028160
Photo 11.6-6 Fire Hydrant

11-31
7)Guide Board
Guide boards shown in Photo 11.6-7 are illuminated signs to inform the location of Tunnel portal to road users. Guide board are to be set at intervals of 200 m.
Source: https://www.iwasaki.co.jp/projects/examples/detail.php?EID=rhi07&cat=1 http://www.pref.yamanashi.jp/kanjo/kanri/manriki.html
Photo 11.6-7 Guide Board
8)Smoke Removal System and Evacuation Route
The tunnel ventilation system is planned for the purpose of both smoke removal and tunnel ventilation. Jet fan will act to extract smoke in the event of fire in the tunnel.
Evacuation route facilities are evacuation tunnel, evacuation connection tunnel and evacuation port and are planned to evacuate users in the tunnel to a safe space. Smoke removal system and evacuation route are shown in Photo 11.6-8.
Since the tunnel is operated by two tube tunnel, it is the basis of evacuation to escape to tunnel portal or adjacent tunnel in case of fire. Therefore, the evacuation connection tunnel is installed instead of the evacuation tunnel.
Smoke Removal System (Jet Fan) Evacuation Route (Evacuation ConnectionTunnel)
Source: http://www.hanshin-exp.co.jp/company/skill/library/tech/post.html https://radiate.jp/20081213/kitakan_opening_tochigi-ibaragi/
Photo 11.6-8 Smoke Removal System and Evacuation Route
9)Hydrant at Tunnel Portal
Hydrant at tunnel portal as shown in Photo 11.6-9 are planned at both tunnel portals to support the firefighting activity by firefighter.

11-32
Source:http://daikitihanayama.web.fc2.com/2004Touring/yasya/Re/y3.html http://www.pref.yamanashi.jp/kanjo/kanri/manriki.html
Photo 11.6-9 Hydrant
10)Wireless Radio System
Coaxial cable as shown in Photo 11.6-10 are planned under the tunnel lighting system or the tunnel center wall to allow tunnel staff, firefighter and police to use radios.
Source: https://car.watch.impress.co.jp/img/car/docs/685/703/html/048.jpg.html
Photo 11.6-10 Wireless Radio System
11)Radio Re-Broadcasting System and Loud Speaker System
Radio re-broadcasting system secure radio broadcast in tunnel by using lead antenna at tunnel entrance. When an emergency occurs in the tunnel, the system shall be used to transmit emergency information radio signals to car users in the tunnel. In addition, the loud speaker system transmits the information on accident situation and evacuation to tunnel users away from the vehicle by radio broadcasting with speakers installed in the tunnel. Radio re-broadcasting system and loud speaker system are shown in Photo 11.6-11.
Guide Wire for AM Radio AM Aerial Wire Loud Speaker System
Source: https://travel.watch.impress.co.jp/img/trw/docs/1048/548/html/53.jpg.html
Photo 11.6-11 Radio Re-Broadcasting System and Loud Speaker System

11-33
12)Monitor System
The monitor system (CCTV Camera) like the one shown in Photo 11.6-12 is designed based on the tunnel plan and profile, focal length of cameras, and the size of objectives. The cameras will be installed at tunnel wall and they are planned to be installed at 150-200 m intervals of tunnel. Also, they are planned to be install at the emergency parking bay.
Source: http://www.densetsu-ndd.co.jp/construction/construction-329/
Photo 11.6-12 Monitoring System
(4)Installed Emergency Facilities in SANGA Tunnel
Both the outbound tunnel and the inbound tunnel are classified for “Class-A” as depicted on Figure 11.6-5 since traffic volume inside the tunnel is 15,459 Vehicle/Day/One Tube and the tunnel lengths are 1,294 m (Outbound Tunnel) and 1,235 m (Inbound Tunnel).
Based on Figure 11.6-5 and the results of discussion with DOR regarding necessary installation emergency facilities of the tunnel, the emergency facilities to be installed in Sanga Tunnel are decided and arranged as shown in Table 11.6-16, Figure 11.6-6 and Figure 11.6-7.
Source: Prepared with reference to “Road Tunnel Technical Standards
for Emergency Facilities” by JICA Study Team
Figure 11.6-5 Tunnel Classification of Sanga Tunnel

11-34
Table 11.6-16 Emergency Facilities Installed in Sanga Tunnel
Facilities Number of Equipment/Facilities Inbound Outbound
Emergency Telephone 8 7 Push Button Alarm 26 27 Fire Detector 0 31 Emergency Information board 1 1 Fire Extinguisher 25 26 Fire Hydrant 25 26 Guide Board 13 12 Smoke removal system 0 6 Hydrant 5 6 Water Control Valve 4 8 Radio communication support System 2 2 Radio Rebroadcast System 2 2 Monitor System 6 7 Terminal Board 0 4 CO Meter 0 1 VI Meter 0 1 AV Meter 0 1
Source: JICA Study Team
Figure 11.6-6 Layout of Emergency Facilities (Inbound Tunnel)

11-35
Source: JICA Study Team
Figure 11.6-7 Layout of Emergency Facilities (Outbound Tunnel)
11.6.5 Other Facilities
(1)Emergency Parking Bay
Emergency parking bay is a facility that secures a safe and smooth traffic flow inside the tunnel by providing a parking space for mechanically malfunctioned vehicles.
Based on the Design Guideline Part 4 issued by Nippon Expressway Research Institute Company (NEXCO), emergency parking bay is installed in the tunnel at intervals of about 750 m. Proposed location and space of the emergency parking bay are shown in Figure 11.6-8 and Figure 11.6-9.
As for the location and installation number of the emergency parking bay, it is necessary to sufficiently discuss and consider the necessity of installation of that and decide the details in the detailed design stage.
Source: JICA Study Team (Layout of Emergency Parking Bay) https://radiate.jp/20140628/sagami_open/ (Photo)
Figure 11.6-8 Emergency Parking Bay

11-36
Source: JICA Study Team
Figure 11.6-9 Proposed Layout of Emergency Parking Bay
(2)Evacuation Connection Tunnel
Evacuation connection tunnel shown in Figure 11.6-10 is one of evacuation route connecting between the inbound tunnel and the outbound tunnel or main tunnel and evacuation tunnel. According to the Road Tunnel Technical Standard for Tunnel Structure, they are installed at intervals of about 700-800 m in many cases in Japan. Based on that, evacuation connection tunnel is planned in this survey as shown in Figure 11.6-11.
As for the location and installation number of the evacuation connection tunnel, it is necessary to sufficiently discuss and consider the necessity of installation of that and decide the details in the detailed design stage.
Source: JICA Study Team (Cross-section)
Figure 11.6-10 Evacuation Connection Tunnel Cross-Section

11-37
Source: JICA Study Team
Figure 11.6-11 Proposed Layout of Evacuation Connection Tunnel
(3)Tunnel Management Office and Electric Room
Description of the tunnel management office and the electric room are shown in Table 11.6-17.
Table 11.6-17 Description of Tunnel Management Office and Electric Room
Facility Description
Tunnel Management
Office
Area 680m2 (Office) + 1,000m2 (Parking Space) = 1,680m2
Proposed Location Refer to Figure 11.6-12
Function ✓ Administration building for maintenance staff and toll-collection
related staff to carry out the tunnel operation and monitoring ✓ Parking area of tunnel maintenance vehicles and emergency vehicles
Facilities
✓ Administration Office Space ✓ Stock Room for Equipment ✓ Traffic Control Center (including rest space for patrol team, machine
room for control system etc.) ✓ Other (Reception, Meeting Room, Toilet etc.) ✓ Parking space 10 lots
Electric
Room
Office Area 200m2 (Electric Room) + 500m2 (Maintenance Space) + 225m2 (Receiving Facility Space) = 925m2
Proposed Location
Refer to Figure 11.6-12 (Sample layout of electric room is referred to Figure 11.6-13)
Function ✓ Primary receiving facility for the tunnel ✓ Installation room for control device of tunnel emergency facilities
Facilities
✓ Communication Machine Room ✓ Electric Room for Control Device ✓ Generation Room ✓ Pump Room

11-38
Source: JICA Study Team
Figure 11.6-12 Layout of Tunnel Management Office and Electric Room (Proposed)
Source: JICA Study Team
Figure 11.6-13 Layout of Electric Room (Sample)
(4)Power Supply System
1)General
This section summarizes power supply and back-up system. The back-up system will cover lighting, water supply and others, which is required for minimum functions for enhancing safe driving.

11-39
2)Load Capacity for Tunnel
Load capacity for the tunnel is shown in Table 11.6-18.
Table 11.6-18 Load Capacity for Tunnel
Category Load (kVA) Ventilation Facility (Jet Fan) 250 Emergency Facilities 50 Tunnel Lighting 25 Other 32 Total 357
3)Stable and Un-interrupted Power Supply System
Stable and un-interrupted Power Supply System are planned for installation for the following systems which need electricity at all times.
• Tunnel Information Board
• Tunnel Lighting (Emergency Light)
• CCTV System (Monitoring System)
• Firefighting System
• Other
The back-up generator will be installed for 100 kVA at electrical room as shown in Table 11.6-19 to maintain above equipment.
Un-Interruptible Power Supply System shall be also needed to maintain the minimum functions of tunnel lighting and emergency facilities operation during unstable condition of back-up system after just power cut (approximately 10 minutes).
Table 11.6-19 Load Capacity for Back-up Generator
Category Load (kVA) Emergency Facilities 47 Tunnel Lighting 3 Other 45 Total 95 (about 100)
4)Planning of Power Transmission Supply Facility
For Power supply to the tunnel operation, the nearest Nepal Electricity Authority (NEA) Grid Substation is at Banepa. The location of the Substation is shown in Figure 11.6-14.
To supply power to the tunnel, the electric room is planned near Banepa side portal. For supply

11-40
of power to these facilities, an estimated total of 357 KVA is required. One 300KVA and one 150KVA transformers are planned to be installed at the electric room.
As for the power transmission supply for the tunnel, it is necessary to sufficiently discuss and consider the power transmission method and route in detailed design stage.
Source: JICA study team Figure 11.6-14 Location Map of Substation at Banepa and current condition
Substation
Tunnel Electric Room
Banepa
Ugratara Janagal
Chittapol
Sanga
Approximately 7km
Hilly AreaCity AreaMountainous Area
1.0km2.5km3.5km

CHAPTER 12
STUDY ON THE ROAD INPROVEMENT


12-1
CHAPTER 12 STUDY ON THE ROAD IMPROVEMENT
12.1 INTRODUCTION
This section covers study of items related to improvement of road section, including the approach road section of the tunnel at Sanga Pass. The improvement plans follow the policies set forth in Chapter 9. The plans that have not undergone any modification, following review of the improvement plan proposed in the previous survey, retains the contents of the previous survey. Where modifications were considered necessary during the review have been incorporated in the plans accordingly as well.
12.2 ROAD IMPROVEMENT PLAN
12.2.1 ROUTE PLANNING
The objective of this Study, which is in par with the previous survey, is to widen the objective road from its existing 2-lanes roads to 4-lanes roads. Since the objective section has a designated road reserve, widening is fundamentally planned by maintaining the horizontal alignment of the existing road except at Sanga Pass, where a bypass is considered. The planning of the route at Sanga Pass is discussed in detail in Chapter 10.
12.2.2 ALIGNMENT
(1)Horizontal Alignment
Horizontal alignment basically follows the existing road alignment. Only locations where the alignment are substandard are improved. Excepting the bypass section at Sanga Pass, there are approximately 36 locations where the existing alignment is in poor condition with sharp curves that does not meet the requirements of the new geometric standards of Asian Highway, adopted with respect to the increase in the design speed.
(2)Vertical Alignment
Vertical alignment mostly follows the elevation of the existing road. Jagati and Banepa experience inundation problems during monsoon. Here, the elevations have been raised to keep the road safe from inundation. Similarly, the vertical alignment at the east of Banepa and in front of Kathmandu University, which are too steep have been modified to meet the requirements set in the Standard.
On the other hand, taking into consideration that the objective road is an access controlled road, the proposed height of the road is elevated necessarily at sections where service tracks are planned to be provided. In such a case however, the proposed height of the service track will be maintained to the height of the existing ground.

12-2
12.3 CROSS SECTION
Cross section elements are based on Asian Highway requirements. The road will have 2-lanes, each 3.5 m wide with an inner and outer shoulder of 0.5 m and 2.5 m respectively in each side. A median, with standard width of 3.0 m, is provided between opposing lanes. The width of shoulder and medians will be narrowed, in a range not influential to smooth and safe operation of the traffic to mitigate the adverse environmental impact. Where service tracks are not provided, 1.5m wide space is additionally provided at the outer shoulders. Figure 12.3-1 to Figure 12.3-6 show the typical cross section of each section.
Figure 12.3-1 Typical Cross Section at Level Difference Sections (Section 1, Section 2)
Typical Section
Section at Bus Bays
Figure 12.3-2 Typical Cross Section (Without Service Tracks)(Section 1, Section 5, Section 7 and Section 9)

12-3
Figure 12.3-3 Typical Cross Section at Approach Road of Tunnel (Section 3, Section 4)
Sta. 10+20 – 11+20 (Left Side) and 10+160 – 11+20 (Right Side)
Sta. 11+200 – 12+200
Figure 12.3-4 Typical Cross Section(Section 6 Banepa Bazar)
Figure 12.3-5 Typical Cross Section(Section 8)

12-4
Figure 12.3-6 Typical Cross Section(Section 10)
12.4 PLANNING OF SERVICE TRACKS
Service tracks are planned at sections between Suryabinayak and Jagati, at Banepa Bazar and at left side in Dhulikhel based on the policies set forth in Section 9.2 (9). The locations are listed in Table 12.4-1. The width of the service track is 5m, which is determined such that traffic is not obstructed even in an existence of vehicles stopped for loading and unloading to shops and offices alongside. A mounted sidewalk is provided on the outer side of the service tracks to secure safe mobility space for pedestrians. Excluding a portion along the curved sections, the sidewalks have a maximum width as far as the existing road reserve allows. Bus laybys to be provided at service tracks are located at the outer side of the tracks (between service track and sidewalk). The service track will have an asphalt pavement. The pavement composition is as mentioned in Section 12.6.
Table 12.4-1 Scopes of Service Tracks
No. Station Side (L/R)
Length (m) Remarks
1 STA.0+000~STA.1+850 L 1,850 Suryabinak~Jagati
2 STA.0+000~STA.1+880 R 1,880 3 STA.10+015~STA.12+190 L 2,175
Banepa 4 STA.10+160~STA.12+200 R 2,040 5 STA.13+230~STA.13+330 L 100
Bodol 6 STA.13+230~STA.13+335 R 105 7 STA.14+630~STA.14+920 L 290 Dhulikhel
Total Length (m) 8,235
12.5 INTERSECTION PLAN
(1) Identification of Objective Intersections
Table 12.5-1 shows intersections identified for improvement in the previous survey. One intersection will be additionally improved under this Study. The intersections identified for improvement are major

12-5
intersections in built-up areas where traffic volume is high and/or those located where future traffic volume is expected to increase significantly. Out of eight identified intersections, six are existing intersection while the intersection at Nalinchowk and beyond Sanga Pass are new ones. These form intersections with the main road and the approach road of the tunnel at Sanga.
Table 12.5-1 List of Objective Intersections
No. Station Location Proposed in Remarks No.1 STA. 0+ 00 Suryavinayak Previous survey Existing intersection No.2 STA. 1+ 99 Jagati Previous survey Existing intersection No.3 STA. 4+140 Nalinchok Previous survey/ this Study New (approach road) No.4 STA. 6+960 Near Sanga Pass This Study New (approach road) No.5 STA.10+939 Banepa Previous survey Existing intersection No.6 STA.11+478 Banepa Previous survey Existing intersection
No.7 STA.13+335 Bodol Previous survey Existing intersection (near KTM University)
No.8 STA.14+907 Dhulikhel Previous survey Existing intersection (entrance to Sindhuli
Road)
(2) Design Conditions
The basic conditions for the improvement will be as follows;
Basic intersection type will be an at-grade intersection, as traffic volumes from/to connecting roads are negligible
Design will be based on the AASHTO’s intersection design method,
Design vehicle will be SU-9 (Ordinary vehicles) as classified by AASHTO due to the fact that plying of semi-trailers is negligible and most of the heavy vehicles are India’s TATA trucks, and
The objective road is taken as the main road and other connecting roads are sub-roads.
(3) Intersection Types
Intersection types to be applied for each location are shown in Table 12.5-2. Fundamentally, 3-legged (T-shape) type and 4-legged (Cross type) intersections will be applied to fit with the existing type and terrain. Intersections No.3 (Nalinckowk) and No.4 (Near Sang Pass) are new intersections, which are formed between the existing road and the approach roads of the tunnel. Exclusive right turn lane is provided at intersection No.3 for vehicles coming from Kathmandu side and taking the existing road instead of using the tunnel. Intersection No.4 lies in about 150m from the portal at Banepa side and in the section where the vertical grade is 3.5% uphill. A fly over is planned here for grade separation of vehicles from Banepa side intending to use the existing road instead of the tunnel, thereby avoiding conflict with bypass traffics and take-off difficulty of heavy vehicles. Intersection No.5 will be improved but the type of intersection will remain similar to its existing condition. Intersection No.6 in Banepa currently has a monument at the center of the intersection and the vehicles go around the monument to

12-6
take turns. This intersection is converted into a 4-legged (Cross type) intersection. No.7 is an intersection formed between the objective road and the road to Kathmandu University. This is planned to be improved as a 3-legged (T-shaped) intersection.
Intersection No.8 at Dhulikhel is currently a 3-legged (T-shaped) non-signalized intersection. This intersection is planned to be converted into roundabout type taking into consideration that the location is the entry point to Sindhuli Road and the wide area around the intersection is available.
Table 12.5-2 Intersection Types to be Applied
No. Station Location Remarks
No.1 STA. 0+ 00 Suryavinayak Existing: 4-legged (cross type) intersection Plan: 4-legged (cross type) intersection
No.2 STA. 1+ 99 Jagati Existing: 4-legged (cross type) intersection Plan: 4-legged (cross type) intersection
No.3 STA. 4+140 Nalinchowk New Plan: 3-legged (T-shape) intersection
No.4 STA. 6+960 Near Sanga Pass
New Plan: Grade separation for vehicles from Banepa side and going to existing road without using the tunnel
No.5 STA.10+939 Banepa Existing: 4-legged (cross type) intersection Plan: 4-legged (cross type) intersection
No.6 STA.11+478 Banepa Existing: Rotary Plan: 4-legged (cross type) intersection
No.7 STA.13+335 Bodol Existing: Connecting road Plan: 3-legged (T-shape) intersection
No.8 STA.14+907 Dhulikhel Existing: 3-legged (T-shape) intersection Plan: Roundabout
(4) Control Method
Provision of traffic signals is not proposed in the previous survey taking the power supply condition of Kathmandu Valley into consideration. Given frequent power outage in the near past days, securing uninterrupted supply of power and endorsing sustainable maintenance is yet a matter of concern. Therefore, provision of traffic signal is not considered under this project. However, in order to facilitate ease installation of traffic signals in future by the government of Nepal on its own, the improvement plan considers providing necessary facilities for the ducts and cables for the signals. It is proposed that until stable and uninterrupted power supply becomes available, the traffic control will be done by traffic police.
12.6 PAVEMENT DESIGN
(1) Design Period (Performance Period)
Design period of 15 years is applied based on the Standards of Nepal that designates a 10 -15 years period for expressways and urban roads including national roads. Performance period is assumed to commence in 2019.

12-7
(2) Axle Load Factors
Indian vehicles, particularly trucks are prominent on the objective roads. Dimensions and capacity of these vehicles vary that of American or Japanese vehicles. Therefore, the axle load factors to be used are determined based on the standard values in use in Nepal. Table 12.6-1 shows vehicle types and its corresponding axle load equivalency factors.
Table 12.6-1 Axle Load Factors
Vehicle Types Bus Light Truck
2-axle Trucks
3-axle Trucks
Axle load equivalency factor 0.5 1.0 4.75 6.5
(3) Cumulative Daily Traffic Volume
Cumulative daily traffic volume of each classification of vehicles for a performance period of 15 years after the completion of the improvement works are given in Table 12.6-2.
Table 12.6-2 Cumulative Daily Traffic Volume of Target Period
Vehicle Types Minibus Bus Light Truck
2-axle Trucks
3-axle Trucks
TOTAL (vehicles)
Cumulative daily traffic volume of target period
Sect.1 12,844 18,247 9,003 48,375 4,329 92,798
Sect.2 2,753 27,683 9,790 47,255 5,139 92,619
Sect.3 11,098 22,365 9,065 51,831 4,868 99,227
Sect.4 11,533 14,339 10,814 50,766 1,648 89,100
Note: Sect.1 :Sta. 0+0 – Sta 9+150 (excluding tunnel section), Sect.2 : Sta. 9+150 – Sta. 11+200, Sect. 3 : Sta. 11+200 -Sta. 14+200, Sect.4 : Sta. 14+200 – 14+900 (End point)
(4) Equivalent Single Axle Load
Cumulative daily Equivalent Single Axle Load (ESAL) is obtained by the product of the accumulated daily traffic volume of performance period and axle load factors (conversion factors) and is given in Table 12.6-3.
Table 12.6-3 Daily ESAL of Performance Period
Vehicle Types Minibus Bus Light Truck
2-axle Trucks
3-axle Trucks TOTAL
Cumulative Daily ESAL of target period (both direction)
Sect.1 4,495 9,124 9,003 229,780 28,139 280,541
Sect.2 964 13,841 9,790 224,460 33,404 282,459
Sect.3 3,884 11,183 9,065 246,196 31,643 301,971
Sect.4 4,036 7,170 10,814 241,139 10,709 273,868
Note: Classification of Sect.1 – Sect.4 is same as in the above table

12-8
Total accumulated ESAL for each lane = Total ESAL of one day both direction x 365 days x 0.5 x 0.8
Here, 0.5 : directional distribution factor, and
0.8: lane distribution factor
Therefore, total ESALs for each lane (Traffic Load: W18) for each section are as given in Table 12.6-4.
Table 12.6-4 Total ESAL for Each Lane (Traffic Load:W18)
Sections Total daily ESAL (both direction)
(A) Total accumulated ESAL for each lane for 15 years A x 365 x 0.5 x 0.8
Sect.1 (Sta 0+0 – Sta. 9+150) 280,541 40,958,948 Sect. 2 (Sta. 9+150 – Sta.11+200) 282,459 41,239,006 Sect. 3 (Sta. 11+200 – Sta. 14+200 301,971 44,087,821 Sect. 4 (Sta.14+200 – Sta. 14+900) 273,868 39,984,774
(5) Subgrade Capacity
Under the geo-technical investigation, California Bearing Capacity (CBR) Tests of existing subgrades have been conducted at 12 locations. The CBR values to be applied in the calculation are adopted by dividing the objective road into 4 sections with respect to the type of topography and geology. CBR values of all 12 locations and the values taken for the pavement design are shown in Table 12.6-5.
Table 12.6-5 CBR Values
No. Station Sections Location CBR(%)
Adopted CBR(%) (Section)
1 0+200
1
Suryabinayak 7.1
7.1 (0+000 ~ 9+150)
2 1+250 Jagati 9.3 3 3+400 Nalinchowk 7.5 4 4+550 Jorpati 7.6 5 8+150 Sanga 11.5 6 9+150 2 N/A 7.9 7 10+300
3 Banepa 4.5 4.9
(9+150 ~ 11+200) 8 11+200 Banepa 4.9 7.9
9 13+000 4
KTM University 5.0 5.0 (11+200 ~ 14+200) 10 14+200 N/A 10.6
11 14+900 5
N/A 9.6 9.1 (14+200 ~ End point) 12 15+400 Dhulikhel 9.1

12-9
(6) Pavement Design
1)Design Conditions
• AASHTO Guide for Design of Pavement Structure, 1993, application of which has already been agreed upon with the DOR, shall be applied.
• The objective road will be divided into several sections taking the traffic volume and CBR values into consideration. The composition of pavement for each of these sections will be calculated.
• The Structural Number (SN) required for the asphalt pavement of each section will be calculated from the following formula.
Source: AASHTO
where
W18
ZR So
△PSI
MR
= = = =
=
predicted number of 18-kip equivalent single axle load (ESAL) applications, standard normal deviate corresponding to level of reliability, combined standard error of the traffic prediction and performance prediction, difference between the initial design serviceability index, po, and the design terminal serviceability index, pt, and resilient modulus of roadbed soil (psi).
SN is equal to the structural number indicative of the total pavement thickness required: SN = a1D1 + a2D2m2 + a3D3m3
Where ai
Di mi
= =
ith layer coefficient, ith layer thickness (inches), and ith layer drainage coefficient.
• The objective road is a high-graded high standard road. Therefore, taking this into consideration in combination with the present maintenance situation of Nepal, the minimum pavement thickness is taken to be 10cm.
2)Design Inputs
Items with simple description and the input values are as mentioned in Table 12.6-6.
8.07MLog2.321SN1094/0.401.5-4.2PSI/Log100.201SNLog9.36SZ(WLog
R10
5.19100R1810
)-(
)(
)(⊿)-()=
+++
+++

12-10
Table 12.6-6 Design Inputs
Item Description Design Condition Values Adopted
Section
Divide objective road into several sections with respect to traffic volume, CBR and calculate pavement thickness for each section
(1) 0+000~9+150(Sanga) (2) 9+150~11+200(Sanga- Banepa) (3) 11+200~14+200(Banepa Bazar) (4) 14+200~End point (Dhulikhel)
Same as in the left column
Performance Period
The period of time that an initial pavement structure will last before it needs rehabilitation.
10 years – 20 years 15 years (2024-2039)
Traffic Load (W18)
The traffic load is expressed by cumulative number of 18-kip equivalent single axle load (ESAL) applications (w18) during the performance period. This is calculated based on the future traffic volume which is converted to 18-kip ESALs applying the axle load equivalency factors used in Nepal
Directional factor : 0.5 Distributional factor: 0.8
Section (1) = 40,958,948 Section (2)= 41,239,006 Section (3)= 44,087,821 Section (4) = 39,984,774
Reliability (R)
Means of incorporating some degree of certainty into the design process.
R=80~99 % Standard normal deviation corresponding to level of reliability (ZR) = -0.841~-0.327 Combined standard error of the traffic prediction and performance prediction (So) = 0.45
R=80% ZR=-0.841 So=0.45
Performance Criteria
The Present Serviceability Index (PSI) is used to represent pavement performance. The total change in PSI (△PSI) is defined as the difference between initial serviceability index (p0: value immediately after construction) and terminal serviceability index (pt: lowest index that will tolerate before rehabilitation, resurfacing or reconstruction)
p0 = 4.2 pt = 2.5
p0=4.2 pt=2.5 △PSI=1.7
Roadbed Soil Property(MR)
The resilient modulus (MR) is used. The AASHTO Guide introduces the equation estimating MR from CBR as MR = 1,500 x CBR
CBR of each section Section (1) =7.1% Section (2)=4.5% Section (3)=6.0% Section (4)=9.1%
MR value of each section Section (1)=10,650 Section (2)=6,750 Section (3)=9,000 Section (4)=13,650
Layer coefficient
The pavement strength is expressed by the structural number (SN) which is calculated as : SN = a1D1 + a2D2m2 + a3D3m3 where ai=ith layer coefficient Di=ith layer thickness (inches) mi=ith layer drainage coefficient
Wearing course: a1=0.42 (EAC=425,000 psi) Binder course:a2=0.39 (EAC=400,000 psi) Base course:a3=0.134 (CBR=80) Subbase course:a4=0.11 (CBR=20)
a1=0.420 a2=0.39 a3=0.134 a4=0.11
Drainage Condition
The factor to modify the SN considering the effects of drainage.
M3=m4=1.00 (water removed within 1 week, and pavement structure is exposed to moisture levels approaching saturation during 5% of the year)
M3=1.00 M4=1.00

12-11
3)Results
The results of the pavement calculation of each section carried out with the design inputs mentioned above are as shown in Table 12.6-7.
Table 12.6-7 Results of Pavement Design on Each Section of the Main Road
(7) Pavement Design of Service Tracks
The design condition and input data for the calculation of pavement thickness of service tracks planned to be provided for access to/from the abutting properties are similar to that used for the calculation of pavement of the main road. However, forecasting traffic volume of the service tracks from the traffic volume obtained from the traffic survey is literally not possible. Therefore, traffic volume on the service tracks is assumed as 10 percent of the weekday average daily traffic on the main road on its corresponding sections and the minimum thickness is set as 5cm. Also, it is assumed that heavy trucks do not ply on the service tracks.
Table 12.6-8 presents the pavement compositions of service tracks on each section.
Table 12.6-8 Results of Pavement Design on Each Section of the Service Tracks
(8) Pavement Design of Bus Laybys
Bus laybys are subject to static load from heavy vehicles and its pavement is susceptible to damages from repeated action of sudden stops and take-offs. Therefore, rigid pavement (concrete pavement), which is considered to be strong against oil and wearing will be applied. As standards for rigid pavement is not available in Nepal, following pavement compositions and conditions have been referred from the standards of Japan.
WearingCourse(cm)
BinderCourse(cm)
BaseCourse
(cm)
SubbaseCourse(cm)
Required(SN)
'A'
Calculated(SN)'B'
Judgement(A<B)
0+000 ~ 9+150 9150 40,958,948 7.1 5 7 30 40 5.059 5.098 OK
9+150 ~ 11+200 2050 41,239,006 4.9 5 9 35 45 5.857 5.906 OK
11+200 ~ 14+000 2800 44,087,821 5 5 9 30 40 5.398 5.413 OK
14+000 ~ 14+914 914 39,984,774 9.1 5 7 25 35 4.637 4.736 OK
SectionLength
(m)
AccumulatedAnnual Load
for 15years(W18)
SubgradeCBR(%)
Calculation
WearingCourse(cm)
BinderCourse(cm)
BaseCourse(cm)
SubbaseCourse(cm)
Required(SN)
'A'
Calculated(SN)'B'
Judgement(A<B)
0+000 ~ 1+860 18604+130 ~ 4+830 70010+020 ~ 11+200 1180 4,545,244 4.5 7 - 30 30 4.162 4.240 OK11+200 ~ 12+100 90013+230 ~ 13+340 11014+600 ~ 14+920 320 4,802,658 9.1 5 - 20 30 3.226 3.228 OK
SectionLength
(m)
AccumulatedAnnual Load
for 15years(W18)
SubgradeCBR(%)
Calculation
3.794 3.835 OK4,933,487 6.0 7 - 25 30
3.4904,355,168 7.1 5 - 25 30 3.504 OK

12-12
It will have a thickness of 25 cm or above,
It will be supported by a 35 cm or above thick base course,
The bending strength of the concrete slab will 4.5 kg/cm2,
The concrete slab will be appropriately reinforced with steel (approx. 3kg/m2)
(9) Pavement Design of Toll Gates
Toll gates are subject to have more static load from heavy vehicles than Bus Laybys and its pavement is susceptible to damages from repeated action of sudden stops and take-offs. Therefore, rigid pavement (concrete pavement), which is considered to be strong against oil and wearing will be applied. Same design standard as bus laybys is applied.
12.7 DRAINAGE PLAN
(1) Surface Drainage
As mentioned in the policies in Section 9.2 (12), the surface drainage of the objective road is planned in a manner that the existing drainage facilities are fully utilized. There are two types of drainage systems on the existing road. The first one is that where the surface water is collected in the side ditches provided at the sides of the road and transported to the designated outlet and the second one is draining the water naturally.
Drainage in this Study applies the same plan proposed in the previous survey. Natural drainage will be applied along roads that are constructed by filling along paddy fields or open land. Built-up areas, cut sections and sections where the vertical grades are steep (above 3%), on the other hand, will have side ditches provided. Side ditches will be provided at the sides of the planned road. However, where service tracks are to be provided, it will be provided in between the main road and the service track to allow collection of rain water at both sides. Currently, side ditch is seen provided at the right shoulder in Suryabinayak and Jagati. This collects both rainwater flowing in from the mountainside at the south of the road and wastewater discharged from alongside household. Widening the existing road will necessitate relocation of these side ditches. The existing ROW is only enough for widening and provision of service track and sidewalks and as such there is no sufficient space for relocation. Therefore, side ditches, similar in its existing sizes are provided under the sidewalk. Figure 12.7-1 illustrates the location where side ditches are to be provided.
Where service tracks will not be provided, side ditch will still be provided as shown in Figure 12.7-2, if it is a cut section. Also, where fill slope heights exceed 15m, ditches for protection of the slopes from gullies during heavy rain shall be provided.

12-13
Figure 12.7-1 Drainage Facilities Where Service Tracks are Provided
Figure 12.7-2 Drainage Facilities at Cut Sections Where Service Tracks are not Provided
(2) Cross Drainage
Cross drainages have been confirmed at 22 locations along the objective road. All these existing cross drainage facilities are old and structurally weak as these structures were constructed very in the sixties. Apart from that, the load condition, then and now has also changed with respective to the increased production of heavier vehicles. These facilities will therefore be replaced by a new one similar or bigger than the existing one. The locations, type of structure and its dimensions to be provided are as shown in Table 12.7-1.
Table 12.7-1 Location, Type and Dimension of Cross Drainage
No. Station Structure (Culvert)
Dimension (m) No. Station Structure
(Culvert) Dimension
(m)
1 STA.0+311 Box 3000*3000、L=80.0 12 STA.8+943 Box 2000*2000、L=41.0
2 STA.0+766 Pipe
D900、L=46.7 13 STA.9+198 Pipe D1200、L=40.0
3 STA.0+110 D900、L=46.3 14 STA.9+358 Box 2000*2000、L=40.0
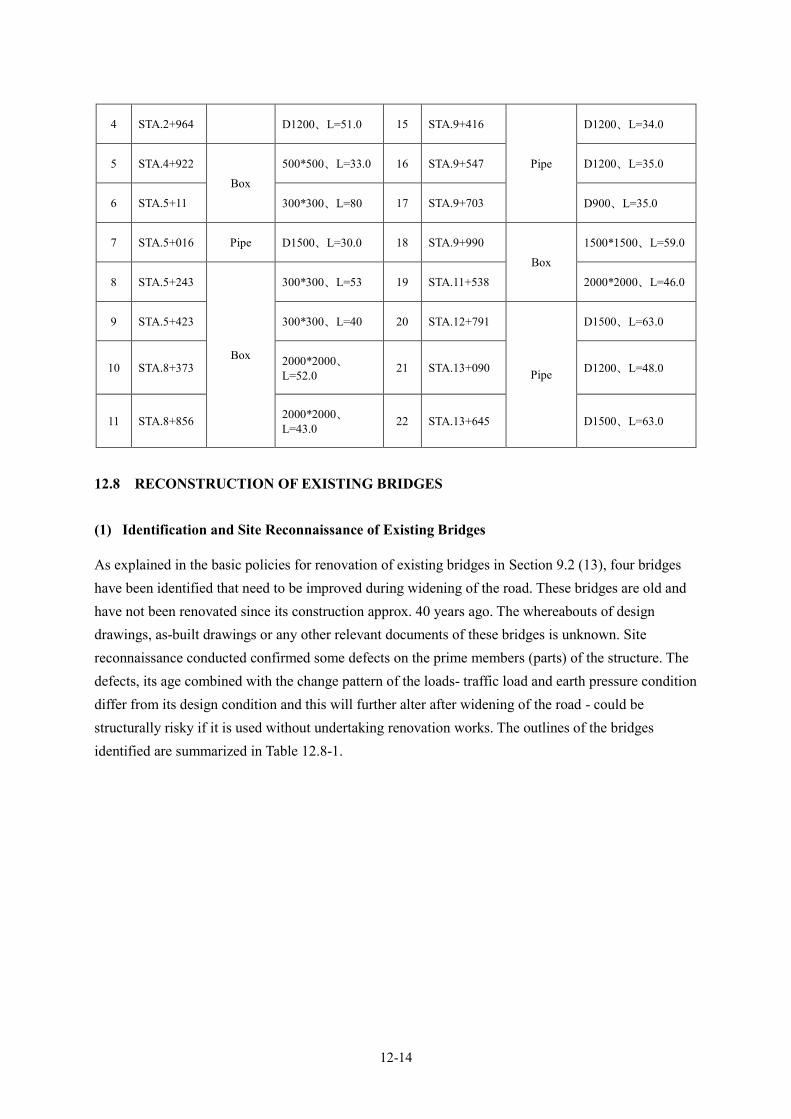
12-14
4 STA.2+964 D1200、L=51.0 15 STA.9+416
Pipe
D1200、L=34.0
5 STA.4+922 Box
500*500、L=33.0 16 STA.9+547 D1200、L=35.0
6 STA.5+11 300*300、L=80 17 STA.9+703 D900、L=35.0
7 STA.5+016 Pipe D1500、L=30.0 18 STA.9+990 Box
1500*1500、L=59.0
8 STA.5+243
Box
300*300、L=53 19 STA.11+538 2000*2000、L=46.0
9 STA.5+423 300*300、L=40 20 STA.12+791
Pipe
D1500、L=63.0
10 STA.8+373 2000*2000、L=52.0 21 STA.13+090 D1200、L=48.0
11 STA.8+856 2000*2000、L=43.0 22 STA.13+645 D1500、L=63.0
12.8 RECONSTRUCTION OF EXISTING BRIDGES
(1) Identification and Site Reconnaissance of Existing Bridges
As explained in the basic policies for renovation of existing bridges in Section 9.2 (13), four bridges have been identified that need to be improved during widening of the road. These bridges are old and have not been renovated since its construction approx. 40 years ago. The whereabouts of design drawings, as-built drawings or any other relevant documents of these bridges is unknown. Site reconnaissance conducted confirmed some defects on the prime members (parts) of the structure. The defects, its age combined with the change pattern of the loads- traffic load and earth pressure condition differ from its design condition and this will further alter after widening of the road - could be structurally risky if it is used without undertaking renovation works. The outlines of the bridges identified are summarized in Table 12.8-1.

12-15
Chandeshori River
Table 12.8-1 Identified Existing Bridges and Outline of each Bridge
Bridge BR-1 (Sipadole)
BR-2 (Bhikteshor)
Br-3 Punyamati)
BR-4 (Chandeshori)
Constructed Date Unknown Unknown Unknown Unknown
Length 8.65 m 11.25 m 17.5 m 5.8 m
Width 7.0 m 7.0 m 7.4 m 8.46 m
Type RC-T Girder RC-T Girder RC-T Girder RC-T Girder
Abutment Unknown Unknown Unknown Unknown
Pier None Wall Type None None
Foundation Unknown Unknown Unknown Unknown
River Width 5.8 m 9.3m 15.8 m 4.5 m
(2) Comparative Study of Applicable Structures
As can be understood from the outline of the bridges mentioned in Table 12.8-2, opening width of all bridges (length of the bridges) are less than 20 m. The height of the bridge from the riverbed is also lower than 5 m. In such case, structures applicable are reinforced concrete bridge, box culvert and integral (portal) culvert. These structures are compared, and an optimum structure is determined Comparison result is shown in Table 12.8-2. The factors such as structural characteristics,
8650
4400
450 7000 4507900
Water
935 3@2010=6030 93584
0
BR-1
Bhikoteshor River
Punyamati River BR-2
11250
3070
450 7000 4507900
Water
905 3@2030=6090 905
1150Telecom
BR-4
RC Girder
5800
720
Embankment
9100320 8460 320
300
400
750
Alternative Route
BR-3
175008850 8650
2120
950 6150 9508050
1325 3@1800=5400 1325
900
7400
Telecom

12-16
topographical and geological conditions of the sites, characteristics of rivers, construction efficiency and cost and maintenance ability are taken as evaluation factors.
The comparative study result indicates that the box culvert supersedes other structures.
Table 12.8-2 Comparison of Applicable Structures
(3) Applicable Standards
Japanese Specification for Design of Box Culvert 2014 will be applied for the design of box culverts adopted for improvement of existing bridges. Application of this specification has been discussed and agreed upon with the DOR with the exception for determining the design discharge and the freeboard, which it insists to refer to the standards of Nepal.
(4) Design Discharge and Freeboard
1)Design Discharge
Based on the existing report studied for Kathmandu-Bhaktapur road, probable discharge for 100-year return period as designed discharge were calculated with the following procedures, (1) average of specific discharge at two bridges in existing report were obtained by the dividing probable discharge using rational discharge with their catchment areas, and (2) probable discharge at four target bridges were calculated by multiplying the average of specific discharge at two bridges with their catchment areas.
Types
Item s
S chem atic
D iagram
C ostruction
E fficiency
◆
◆
◆
D etour of existing river
D em olition of existing bridge
C onstruction of box culvertA
◆
◆
◆
◆
◆
D ivert w ater flow (use half w idth of river)
D em olition of existing bridge
C onstruction of abutm ent
D iversion of w ater to the other side
C onstruction of rem aining abutm ent and
erection of superstructure
B
◆
◆
◆
◆
◆
D ivert w ater flow (use half w idth of river)
P artial dem olition of existing bridge
C onstruction of sidew all
D iversion of w ater to the other side
C onstruction of rem aining abutm ent and
top slab
C
Im pact on R iver
◆ S trong against occurance of erosion
and/or scouring of river bed and/or
around the structure
A
◆ M easures against erosion of river bed
and around the abutm ents are required B
◆ M easures against erosion of river bed
and around the abutm ents are required B
C onstruction
E fficiency
◆ A dditional tim e required for detour of
river channel B
◆ N o need for detour of existing river
A
◆ N o need for detour of existing river
A
M aintenance◆ N o special m aintenance is required
A◆ R egular m aintenance of joints and
bearings are requiredB
◆ N o special m aintenance is requiredA
C onstruction
P eriod
◆ LongerB
◆ S hortest (construction of girders can be
done sim ultaneously w ith the abutm ent)A
◆ Longest (Top slab and side w alls can
not be constructed sim ultaneously)C
E stim ated
C ostA ssum ing cost is 1.0 A 1.16 tim es the cost of Type-1 C 1.07 tim es the cost of Type-1 B
E valuation R E C O M M E N D E D
T ype-1
(B ox C ulvert)
T ype-2
(R C B ridge)
T ype-3
(P ortal C ulvert)
N ot R ecom m ended
Temporary River
8000
3500
5500
9600
80003500
9200
5700
8000
3500 Temporary River

12-17
Table 1 Calculation of Specific Discharge for Return Periods for Kathmandu-Bhaktapur Road
Source:「Kathmandu-Bhaktapur Road Improvement Project」
Table 2 Catchment Area and Calculated Probable Discharge at Target Bridges
Catchment Area (km2)
Specific Discharge (m3/s/km2)
Design Discharge Probable Discharge for 100-year Return Period
(m3/s)
No1:Sipadol Khola 12.28
3.7
46
No2:Bhikteswor Khola 3.02 12
No.3:Punyamati Khola 25.32 94
No.4:Chandeshori Khola 3.11 12
2)Freeboard
Freeboards for design discharges at each box culvert are shown in Table 12.8-3. According to the Nepal Bridge Standards 2067, minimum free board for discharges less than 200 m3/sec is 1m.
Table 12.8-3 Design Discharge and Freeboard
River Name (Location)
Sipadole (Jagati)
Bhikteswor (Bhikteswor)
Punyamati (Banepa)
Chandeshori (Banepa)
Design Discharge 46 m3/sec 12 m3/sec 94 m3/sec 12 m3/sec
Freeboard 1.0m 1.0m 1.0m 1.0m
3)Determination of Designed River Cross Section and Longitudinal Plan for Bridge
The hydraulic dimensions of four target bridges were determined with try-and-error approach, whose cross sectional area under HWL allow the designed discharge to pass through. The capacities of these dimensions were evaluated by uniform flow by Manning’s Formula. Designed river bed was basically referred to existing one, and freeboard of 1m, as required by the Nepal Bridge Standards was applied.
100 50 25 10 5 2 100 50 25 10 5 2
Manahara Bridge 75.59 248 233 213 186 172 149 3.28 3.08 2.82 2.46 2.28 1.97Hanumante Bridge 77.17 318 298 271 237 220 190 4.12 3.86 3.51 3.07 2.85 2.46
3.70 3.47 3.16 2.77 2.56 2.22Average
Specific Discharge for Return Periods (m3/s/km2)Location Type
CatchmentArea(km2)
Probable Discharge by Rational Formula for Return Periods (m3/s)

12-18
(1) No1:Sipadol Khola
Cross Section at Upstream of Bridge
Cross Section at Downstream of Bridge
Figure 12.8-1 Designed Cross Section at Bridge No.1 (Sipadol Khola)
Figure 12.8-2 Designed Longitudinal Profile along Bridge No.1 (Sipadol Khola)
Table 12.8-4 Determined Dimension for Bridge No.1 (Sipadol Khola)
Location Item
Upstream of Bridge
Downstream of Bridge Remarks
Designed Hydraulic Slope 1/150 Based on topological data Roughness Coefficient (n) 0.03 100yr Probable Discharge 46 m3/s
Datum 1472.1 m 1450.22 m Existing HWL 1476.25 m Based on Level Survey
Designed HWL 1473.67 m
Height 3.17 m 3.5 m Distance b/w HWL and river bed, plus paving thickness
Width 8 A (under HWL) 17.33 m2 20 m S (under HWL) 12.33 m 13 m R (under HWL) 1.41 m 1.54 m V (under HWL) 3.41 m/s 3.63 m/s < 4m/s
Q (under HWL) 59.19 m3/s 72.54 m3/s > 46 m3/s
1311
1312
1313
1314
1315
1316
-20 -15 -10 -5 0 5 10 15 20
Designed Exsisting
Existing HWL Designed HWL
(m)
(m)
Elev
atio
n
1311
1312
1313
1314
1315
1316
-20 -15 -10 -5 0 5 10 15 20
Designed Exsisting
Existing HWL Designed HWL
(m)
(m)
Elev
atio
n
1,310
1,311
1,312
1,313
1,314
1,315
1,316
1,317
0 50 100 150 200
Surveyed river bed DHWL Ex. HWL
Bridge Pavement Designed river bed Designed Datum
(m)
Elev
atio
n
(m)

12-19
(2) No2:Bhikteswor Khola
Cross Section at Upstream of Bridge
Cross Section at Downstream of Bridge
Figure 12.8-3 Designed Cross Section at Bridge No.2 (Bhikteswor Khola)
Figure 12.8-4 Designed Longitudinal Profile along Bridge (No.2) Bhikteswor Khola Table 12.8-5 Determined Dimension for Bridge No.2 (Bhikteswor Khola)
Location Item
Upstream of Bridge
Downstream of Bridge Remarks
Designed Hydraulic Slope 1/300 Based on topological data Roughness Coefficient (n) 0.03 100yr Probable Discharge 12 m3/s
Datum 1472.1 m 1450.22 m Existing HWL 1476.25 m Based on Level Survey
Designed HWL 1473.67 m
Height 2.62 m 2.80 m Distance b/w HWL and river bed, plus pavement thickness
Width 10 A (under HWL) 16.17 m2 18 m2 S (under HWL) 13.23 m 13.6 m R (under HWL) 1.22 m 1.3 m V (under HWL) 2.2 m/s 2.3 m/s < 4m/s
Q (under HWL) 35.56 m3/s 41.8 m3/s > 12 m3/s
1471.0
1472.0
1473.0
1474.0
1475.0
1476.0
1477.0
1478.0
1479.0
-20 -15 -10 -5 0 5 10 15 20
Designed Exsisting
Existing HWL Designed HWL
(m)
(m)
Elev
atio
n
1,470
1,471
1,472
1,473
1,474
1,475
1,476
1,477
0 50 100 150 200 250
Surveyed river bed DHWL Designed Datum
Ex. HWL Bridge Pavement Designed river bed
Elev
atio
n
(m)
(m)

12-20
(3) No.3 Punyamati Khola
Cross Section at Upstream of Bridge
Cross Section at Downstream of Bridge
Figure 12.8-5 Designed Cross Section at Bridge No.3 (Punyamati Khola)
Figure 12.8-6 Designed Longitudinal Profile along Bridge No.3 (Punyamati Khola)
Table 12.8-6 Determined Dimension for Bridge No.3 (Punyamati Khola)
Location Item
Upstream of Bridge
Downstream of Bridge Remarks
Designed Hydraulic Slope 1/500 Based on topological data Roughness Coefficient (n) 0.03 100yr Probable Discharge 94 m3/s
Datum 1450.32 m 1450.22 m Existing HWL 1454.03 m Based on Level Survey
Designed HWL 1452.8205 m
Height 3.5 m 3.6 m Distance b/w HWL and river bed, plus paving thickness
Width 17 A (under HWL) 44.2 m2 42.5 m2 S (under HWL) 22.2 m 22 m R (under HWL) 1.99 m 1.93 m V (under HWL) 2.36 m/s 2.31 m/s < 4m/s
Q (under HWL) 104.28 m3/s 98.27 m3/s > 94 m3/s
1450
1450.5
1451
1451.5
1452
1452.5
1453
1453.5
1454
1454.5
-20 -10 0 10 20
Designed Exsisting
Existing HWL Designed HWL
(m)
(m)
Elev
atio
n
1450
1450.5
1451
1451.5
1452
1452.5
1453
1453.5
1454
1454.5
-20 -10 0 10 20
Designed Exsisting
Existing HWL Designed HWL
(m)
(m)
Elev
atio
n
1,449
1,450
1,451
1,452
1,453
1,454
0 50 100 150 200 250
Surveyed river bed DHWL Ex. HWL
Designed Datum Bridge Pavement Designed river bed
Elev
atio
n
(m)
(m)

12-21
(4) No.4 Chandeshori Khola
Cross Section at Upstream of Bridge
Cross Section at Downstream of Bridge
Figure 12.8-7 Designed Cross Section at Bridge No.4 (Chandeshori Khola)
Figure 12.8-8 Designed Longitudinal Profile along Bridge No.4 (Chandeshori Khola) Table 12.8-7 Determined Dimension for Bridge No.4 (Chandeshori Khola)
Location Item
Upstream of Bridge
Downstream of Bridge Remarks
Designed Hydraulic Slope 1/200 Based on topological data Roughness Coefficient (n) 0.03 100yr Probable Discharge 12 m3/s
Datum 1453.61 m Existing HWL 1454.033 m Based on Level Survey
Designed HWL 1455.11 m
Height 2.25 m 2.5 m Distance b/w HWL and river bed, plus paving thickness
Width 7 m A (under HWL) 8.75 m2 10.5 m2 S (under HWL) 9.5 m 10 m R (under HWL) 0.92 m 1.05 m V (under HWL) 2.23 m/s 2.43 m/s < 4 m/s
Q (under HWL) 19.52 m3/s 25.57 m3/s > 12 m3/s
1453
1453.5
1454
1454.5
1455
1455.5
1456
1456.5
1457
1457.5
-10.0 -5.0 0.0 5.0 10.0Designed Exsisting
Existing HWL Designed HWL
(m)
(m)
Elev
atio
n
1453
1453.5
1454
1454.5
1455
1455.5
1456
1456.5
1457
1457.5
-10.0 -5.0 0.0 5.0 10.0Designed Exsisting
Existing HWL Designed HWL
(m)
(m)
Elev
atio
n
1,452
1,453
1,454
1,455
1,456
1,457
0 50 100 150 200 250
Existing river bed DHWL Designed Datum
Bridge Pavement Designed river bed
Elev
atio
n
(m)
(m)

12-22
(5) Embankment and Bed Protection
Embankment and bed protection will be provided for a distance of 5 m from the edges of the culvert at both the upstream and downstream direction.
(6) Foundation
Geo-technical investigation conducted during the previous survey confirmed bed rock at the river bed at Bhikteshor River and at about 4 m to 7 m below the river bed at other rivers. Therefore, pile foundation is provided at all but in Bhikteshor. Considering the difficulty in procuring heavy equipment, H-steel piles, which can easily be driven by the help of general equipment (regular) using vibration driving method, are applied
(7) Outline of Applied Culverts
Table 12.8-8 shows the outline of the culverts applied for improvement of each existing bridge.
Table 12.8-8 Outline of Culverts Applied
No River Name (Location)
Design Discharge (m3/sec)
No. of
Cells
Opening Length
(m) Pile Foundation (H-Steel 300x300)
Width (m)
Height(m)
C1 Sipadole (Jagati) 46 1 8.0 5.8 50.39 L=7.0m, 50Nos.
C3 Bhikteswor
(Bhikteswor) 12 1 10.0 6.4 50.19 None
C4 Punyamati (Banepa) 94 2 8.5 4.6 48.53 L=7.0m, 32Nos.
C5 Chandeshori
(Banepa) 12 1 7.0 3.5 52.27 L=4.0m, 27Nos.
C1
C3
C4
C5

12-23
12.9 PEDESTRIAN BRIDGES (FOOTBRIDGES)
(1)Identified Locations
The project plans to provide pedestrian bridges (footbridge) based on the policies mentioned in Section 9.2 (14), at six locations as listed in Table 12.9-1.
Table 12.9-1 Locations of Pedestrian Bridges
No. Station Location Remarks 1 STA. 0+100 Suryabinayak Start point 2 STA. 0+960 Jagati
3 STA.11+000 Banepa 4 STA.11+340 Banepa
5 STA.11+820 Banepa 6 STA.13+270 Bodol Near Kathmandu University
(2)Applicable Standard
In addition to the specification for highway bridges, Japan Road Association 2012, the following standards were applied;
i) Standard for Graded Road Crossing (1979, Japan)
ii) Guidelines for Pedestrian Bridges and Underpass pedestrian ways
(3)Design Requirements
Following conditions were undertaken;
• Provision of stairway at both sides of the bridge (one side stairway and the other side stairway with slope at the middle for bicycle use)
• Slope of 1:2 (V:H) is applied for stairway and 1:4 for stairway with slope
• Landing or horizontal space 1.7 m in length is provided at heights exceeding 3m
• Total width of stairway 2.1 m
• Handrails height will be 1.0m or more
• Vertical clearance of 5.0 m from the road surface is applied in based on the standard of Nepal
• Live load 400 kg/cm2 will be applied
• Unseating prevention device (anchor bolt (method to prevent displacement) will be provided
(4)Footbridge Type
Three types of bridges were chosen taking into consideration the upgraded road cross section, land

12-24
use pattern, bridge types provided by previous projects, present maintenance capacity of the DOR and requirements mentioned above. They are;
i) Type-1: 4-span RC girder bridge,
ii) Type-2: 2-span PC girder bridge, and
iii) Type-3: 2-span metal box girder bridge
From these three types, the first one, 4-span RC girder bridge type is selected for the following reasons.
The bridge is divided into 4-spans, each girder is lighter than the superstructures of other types and can be easily erected by a crane. Therefore, construction efficiency is highest.
Being is concrete bridge, it is maintenance free. However, this is inferior to Type-2 in that maintenance is regularly required for the bearings and expansion joints.
This is highly cost effective. Construction cost of Type-2 and Type-3 are about 1.2 times and 1.3 times compared to this type.
Figure 12.9-1 illustrates the outline of the footbridge.
Figure 12.9-1 Outline of Footbridge
(5)Foundation Type
The pier foundation of the RC bridge is spread foundation, being considered that required bearing capacity is not large, wide area of ROW for improvement can be utilized, large rooting effect by wide footing and deep flooring is expected, and easy structure drilling.
(6)Bridge Fall Prevention Structure
Falling of pedestrian crossing bridges at the time of earthquake will lost the required function for the SD road as Class I road. Therefore, Bridge fall prevention structure is applied. As the main method of

12-25
bridge fall prevention, there are 1) Girder connecting method, 2) Displacement controlled method, and 3) Installation of edge widening plate method. Considering the scale, structure, economic efficiency etc. of the pedestrian bridge, installation of anchor bolt as classified as mutation limiting method is be applied.
12.10 SLOPE STABILITY
The standard of Nepal requires application of slopes 1:2 (V:H) for embankment (fill) height up to 12 m. This slope will occupy wide area of land if the height of the embankment is high. The ROW of the objective road already exists and it is desirable that the improvement of road be done to the possible extent within the existing road reserve. Therefore, in order to minimize the land acquisition area, with approval from the DOR, the slope of 1:1.5 was applied.
The slope applied in case of cut slopes is 1:1.0, also with an aim to minimize the land acquisition area.
12.11 RETAINING WALL
Gravity walls or L-shaped walls has been planned between the main road and the service track when there is a big difference in height in order to minimize the acquisition of land area. Gravity walls apply to the height 3.0 or less and L-shaped walls for those exceeding 3.0 m.
12.12 RIVER TRAINING WORKS
There are two locations, at Sta. 8+400 and Sta. 8+900, where the streams are anticipated to partially invade the road reserve. The streams (water channels) at these locations have been diverted outside the road reserve and its slopes reinforced by wet stone masonry walls and gabions as shown in Figure 12.12-1.
Figure 12.12-1 Outline of River Training Work

12-26
12.13 DRAINPIPE FROM JAGATI TO A RIVER
In order to improve the drainage function at Jagati area, a drainage facility should be installed from the road to the ultimate discharge point (river) of rain water. For this, a drainage pipe having a diameter of 900mm for a section of about 350 m from road to river as shown in the figure below, is provided.
Figure 12.13-1 Basic idea of route of drainpipe from Jagati to a river
12.14 ROAD ANCILLARY PLAN
(1)Bus Layby
Bus laybys are planned based on the policies mentioned in Section 9.2(12). Altogether, laybys are planned at 10 locations, basically on the existing locations. The width of the layby is 3 m. When the layby is beside a service track, a portion (2 m) of the service track has been used in addition to an additional meter of width. The deceleration and acceleration lanes have been taken as 3 m and 5 m respectively.
When the layby is provided beside the main road, the layby width is obtained by widening the road and no portion of the main road is used as in the case of laybys besides the service track. Deceleration lane and acceleration lane on these laybys has been taken based on the design speed and are 9 m and 15 m respectively. Storage length has been provided taking the existing condition into consideration.
The locations of the laybys and storage length of each laybys are shown in Table 12.14-1.

12-27
Table 12.14-1 Locations of Bus Laybys
No. Left Side Right Side Remarks
(Installation beside) Station Storage Length(m) Station Storage
Length (m)
1 STA.1+140 30 STA.1+140 30 Between main road and service track
2 STA.3+120 15 STA.3+120 15 Main road
3 STA.3+760 15 STA.3+760 15 Main road
4 STA.7+800 15 STA.7+800 15 Main road
5 STA.9+160 15 STA.9+160 15 Main road
6 STA.10+200 15 STA.10+200 15 Between main road and service track
7 STA.11+300 15 ― ― Between main road and service track
8 STA.11+900 15 STA.11+900 15 Between main road and service track
9 STA.13+300 15 STA.13+300 15 Between main road and service track
10 STA.14+000 15 STA.14+000 15 Main road
(2)Fences
Stretch where the vertical height between the main road and the service track, guard rails have been planned. Other stretches have been planned with guard pipes. Fence for preventing pedestrians from crossing the road from undesignated location has been planned at the median.
(3)Road Markings
The following road markings have been planned in the previous survey, which is based on the standard of Nepal.
Lane lines: 15 cm wide white continuous lines
Shoulders: 15 cm wide white continuous and broken lines
Others: Zebra crossings, arrows
It is to be noted that the above markings are not inclusive of the markings in the tunnel section and should be referred to Chapter 11.
(4)Traffic Signs
Traffic signs have been planned at 214 locations. The signs include regulatory signs and warning signs. Information signs are not under the scope of the project. Traffic signs indicated here are for road section only and does not include those within the tunnel section. Traffic signs for tunnel section are covered in Chapter 11.


CHAPTER 13
APPLICATION OF ADVANCED TECHNOLOGIES


13-1
CHAPTER 13 APPLICATION OF ADVANCED TECHNOLOGIES
13.1 GENERAL
This section covers the findings of the study conducted in regards with advanced technologies currently available and applied in construction of highway tunnels. The study included collection and analysis of information through books, journals, research papers etc. and through responses to the questionnaires provided by major contractors in Japan. The section describes the types of the technologies and the possibilities including its advantages in utilizing them under this Project from the following viewpoints, such that it would contribute in fully achieving the positive outcomes of the Project;
(i) Necessity of advanced technologies and knowledge in Nepal, (ii) Needs of technical transfer, (iii) Maintenance ability, (iv) Bidding system and machinery procurement method, and (v) Import-export limitations, system etc.
13.2 NECESSITY OF ADVANCED TECHNOLOGIES
13.2.1 Necessity of Advanced Technologies in Highway Tunnels in Nepal
Highway tunnels in mountainous area are generally constructed using New Austrian Tunneling Method (NATM). NATM is a method that relies on the inherent strength of the surrounding rock mass being conserved as the main component of tunnel support. Primary support is directed to enable the rock to support itself. This is true if the tunnel passes through distribution of rocks that are robust and in good condition. When the tunnel section passes through fragile and weak fractured rocks or across faults or when the overburden above the tunnel is thin and insufficient to stabilize the tunnel structure, NATM needs provision of additional support for reinforcement. Developed countries where geological conditions are not good enough, have been developing and applying new methods, technologies suitable to its geological condition, not only to make the tunnels more durable, but also to secure safety during the construction of the tunnels. Application of advanced technologies however comes with bigger cost and thus needs justifiable and persuasive reasons for its application. Application in Sanga Tunnels however is considered justifiable from the following points of view;
(i) There are no highway tunnels in Nepal to date, although there are some hydro-tunnels. Under such circumstances, construction of highway tunnels in a safe and sustainable manner is utterly important as construction of first few highway tunnels will play a role-model for the development of such tunnels in the future.
(ii) The geology of the mountains (excepting the great Himalayas), where the road network of the country expands the most, is weak and fragile and consists of weathered and sheared rocks including numerous faults likely Sanga Tunnels.

13-2
13.2.2 Necessity of Advanced Technology in Sanga Tunnel
Sanga Tunnel could be second of its kind in the history of highway tunnels in Nepal. As such, it burdens the responsibility to be an example for other tunnels to be constructed in the country. Therefore, durability of the tunnel, on-time and safe construction needs to be assured so that this will bring about catalytic effect on the construction of other similar tunnels.
The followings are some reasons that justify necessity for application of advanced technologies in Sanga Tunnel.
(i) Sanga Tunnel is located along the highway that connects Kathmandu with the mid-north eastern regions as well as with the eastern Terai regions of the country and is strategically very important. Closure of the tunnel will cause heavy influence in the economic and social activities of these regions.
(ii) The geological condition of the tunnel section is composed of alternate layers of sandstone and phyllite and are very weak, weathered and fractured. Excavation of tunnel with such poor rock conditions could be costly and hazardous and requires advanced technologies for securing safety during mechanical excavation.
(iii) There is a dense settlement above the section where the tunnel is planned. The depth of the tunnel at this area is relatively shallow and poses threat of subsidence of the settlement. Application of advanced technologies for preventing such subsidence are very important.
(iv) Tunnel section under the earth is considered to be relatively safe, unlike the portals, which are the most vulnerable portion within a tunnel. The portal on Kathmandu side is composed of rock masses predominantly phyllite that is weathered in every 100m. The portal on Banepa side is also weathered bedrock and even assumed to have a fault. Therefore, technologies to prevent failure at the portal and at faults are inevitable.
(v) At the Kathmandu side portal, the planned tunnel passes about 10m below the existing road,
which will continue to be in service even under construction and after the provision of the
tunnel. Similarly, the portal at Banepa side is a paddy field. In these condition, deformation
of tunnel and surface of ground must be controlled by deformation reduce method using
real-time continuous monitoring. These technologies will be necessary for constructing the
portals and narrow overburden section safely.
(vi) Sanga is a densely habituated area and disturbances from noise is of high concern during construction of the tunnel. Application of technologies or soundproof facilities for mitigating such noise levels are desirable.
(vii) At the service of the tunnel, accidents inside the tunnel may result into huge disasters. Advance technologies or new methods/facilities for surveillance of the tunnel including evacuation and emergency operation is inevitable.

13-3
(viii) Tunnel is an asset and durability of the tunnel is of prime concern as it minimizes maintenance frequency and save cost. Technologies to enhance the durability of the concrete used for lining is also desirable.
13.3 CONCEIVABLE ADVANCED TECHNOLOGIES
There are many advanced technologies/facilities and methods used in combination with NATM to meet the different and requirements of each tunnel construction sites. Some of the technologies/facilities and methods that are currently in common use and may be applicable to Sanga Tunnel.
13.3.1 Non-expansive All Ground Fastening Method
All Ground Fastening(AGF) Method is one of the auxiliary method generally applied to reinforce the surrounding ground by application of injecting grouting and fore-piling with adding metal pipes.
The material is not available in Nepal and must be procured from a third country. In addition, There are no construction companies in Nepal that are capable of carrying out this technology.
There are two way of excavation tunnel with AGF method. Expansive AGF method adjusts a tunnel digging section and primary support including shotcrete and metal support to casting of AGF and extends. Another method is Non-expansive AGF method. This is a method not to expand a primary support and digging section.
There is comparison list of expansive AGF and Non-expansive AGF (Table 13.3-1). With the result of comparison of economy, safety of tunneling and risk of subsidence, consultant recommends Non-expansive AGF for Sanga tunnel.
Figure 13.3-1 Non-expansive AGF Method

13-4
Table 13.3-1 Comparison list of AGF Method
Expansive AGF Non-expansive AGF
Conceptual diagram
Characteristics
Amount of excavation soil is bigger
Lose of overburden is high
Quantity of lining concrete is bigger
Cost of AGF and tunneling is higher
Amount of excavation soil is smaller
Lose of overburden is same as normal
Quantity of lining concrete is smaller
Cost of AGF and tunneling is lower
Recommend Recommend by consultant
13.3.2 Inverter-driven Jet Fans
Jet fan with inverter control is a facility used for controlling the smoke particularly during emergency such as inflammation of cars inside the tunnel during accidents. Usually it is used as same as normally jet fan for exclusion of the exhaust gas. It is different from ordinary jet fans in that it is capable of varying the speed of the fans with respect to the concentration level of the smoke that needs to be driven off. This kind of fans not only works efficiently during evacuation during emergencies but also minimize operation and maintenance cost.
Inverter-driven Jet fans are also not available in Nepal and has to be procured from a third country. Technology for installation of the jet is also not available with contractor of Nepal. Technology for installation of the fan needs to import and technical transfer needs to be carried out for future installation and maintenance of it to be carried out by the concerned authority or consultant of Nepal.
Source: Hanshin Expressway
Figure 13.3-2 Inverter-driven Jet Fan

13-5
13.3.3 Hard Rock Excavation Machine
This machine can excavate all types of rocks, hard (qu<100MPa) and soft. The power of crushing rock of this machine is comparatively higher than standard machines. This machine is particularly effective in cases when the rocks may require blasting, but the site condition does not allow use of dynamites. Sanga is a densely settlement area and blasting may not be unacceptable here from the noise and vibration disturbance point of view. Therefore, application of this machine here may be ideal for excavation.
This machine is not easily available as the numbers manufactured is very low. Therefore, it may not be cost-effective, but as mentioned above it has the advantage of avoiding blasting. Operation of this machine needs special training. Technical transfer is a must if this is to be applied in Nepal in the future.
13.3.4 Sound-Proof Gate
This is a sound-proof gate that is used to mitigate noise and tremor impact during excavation of the tunnel by blasting. The ground deep below in Sanga Pass is considered to consist thick layer of sandy stones where blasting may be required. Should blasting be required and allowed, application of this gate is necessary for mitigating impact to locals. It can also, to certain limit, prevent the impact from dust to the locals.
This gate needs to be procured from a third country as it is not available in Nepal but needs no technical transfer as it can be installed and used without the need of special technology.
Source: Mitsui Mike Machinery Co,. Ltd.
Figure 13.3-3 Hard Rock Excavation Machine
Figure 13.3-4 Sound-Proof Gate

13-6
13.3.5 High Performance Lining Form
This is a steel form with Slide-arch center. It automates cleanup work of steel form panel on a center and is the system to improve finishing-off of the lining concrete.
It sprays a ceramic coating on the surface of a steel form and adds a separating agent to it, which allows easy release of formwork from lined concrete and also finished the lining surface giving it a whitish color. This white surface on tunnel walls diffusely reflect the lights of passing vehicles and do not harm drivers' eyes and significantly contribute in enhancing visibility and safety inside the tunnel.
This technology also improves the quality of the surface of the lining concrete which results to reduction of frequent maintenance.
Like above technologies/facilities, this material is not available in Nepal and is only procurable from a third country.
13.3.6 High Performance Lining Concrete and Curing System
High performance lining concrete and curing system are methods used for improving the fluidity of the concrete to be used for lining such that the concrete can be casted in an easy and efficient manner. Additives are mixed for improving the density and mechanical curing system as shown in is applied to secure and prolong the moisture condition of the concrete. Both these technologies contribute to producing lining concrete that is strong against occurrence of cracks.
The additives and the curing system is new to Nepal and therefore needs to be procured from a third country. Technical transfer for application of additives and use of curing system is required.
13.3.7 Flat Insulated Lining Method
Flat Insulated Lining Method (FILM) is an innovative method for constructing the lining in mountain
Source: Gifu Kogyo Co., Ltd.
Figure 13.3-5 High Performance Lining Form
Source: Gifu Kogyo Co., Ltd
Figure 13.3-3 High Performance Curing System

13-7
tunnel. Filler material is placed into the space between the waterproofing membrane deployed over a mobile formwork and temporary supports. This contributes in increasing the integrity of the structure by preventing the outbreak of the internal stress. Application of FILM allows placing of high-quality lining concrete with a smooth back face. Use of FILM reduces manual work in filling the gaps, long-span waterproofing membrane can be deployed are some advantages of this method.
Not available in Nepal and both the material and the technology needs to be exported. Technical transfer on its use is also indispensable.
13.3.8 Standard of the Safety Control in Tunnel Construction
Standard of the safety control it takes for tunnel construction and a rule at the developed countries is one of an advanced technology. A guideline which affects a fall of rocks accident prevention countermeasure in a face of mountain tunnel construction (18 Jan. 2018, Ministry of Hearth, Labor and Welfare, Japan) also has to be respected in this construction.
13.3.9 Recycling and Reuse of Spent Construction Supply, Temporary Material
Recycling and reuse of spent construction supply, temporary material is new trend at the developed countries. The motivation to recycling of spent construction supply are understanding and practice are developed by recent years construction work at the developed countries.
13.4 ADVANCED TECHNOLOGIES APPLICABLE TO SANGA TUNNEL
Although several advanced technologies/facilities and methods were discussed in the previous section, the following four are considered to have highest chances to be applied to Sanga Tunnel taking into consideration different conditions of the area.
i. Non-expansive AGF method
As afore-mentioned, this is applicable in the earth between the existing road and the tunnel where
the tunnel crosses the existing road slightly below it as the thickness of the earth is shallow and
needs to be reinforced. This is also assumed to be applied at the Banepa side portal as the rock is
weathered and weak.
Source: Maeda Construction Figure 13.3-7 FILM

13-8
ii. Inverter-driven Jet Fans
These jet fans will contribute in saving operation and maintenance cost. And this technique
improves the disaster prevention performance of the tunnel.
iii. High Performance Lining and Curing System
High performance lining and curing system contributes in enhancing durability of concrete lining
making the entire tunnel structure more durable, which on the other hand contributes in reducing
the maintenance cost.
iv. Flat Insulated Lining Method (FILM)
This allows securing high-quality of the linings. It also allows significant reduction of manual work
and can accelerate the lining works and enhance structural integrity.

CHAPTER 14
PROJECT EXECUTION ORGANIZATION


14-1
CHAPTER 14 PROJECT EXECUTION ORGANIZATION
14.1 RESPONSIBLE ORGANIZATION
Project executing agency is Ministry of Physical Infrastructure and Transport (MOPIT). The overall implementing agency is Department of Roads (DOR).
14.2 MINISTRY OF PHYSICAL INFRASTRUCTURE AND TRANSPORT
(1)Organization Chart of MOPIT
Figure 14.2-1 shows the organization chart of MOPIT. It consists of four divisions and three departments. The divisions are all located within the ministry and manned by Joint Secretaries, Secretaries, Engineers, Section Officers and other supportive staffs. There is currently a total of 106 staffs, 75 of which are gazette officers and engineers as shown in Table 14.2-1. The remaining staffs are non-gazette class staffs and supportive staffs.
Table 14.2-1 Number of Staffs of MOPIT Division Number of Staffs
Administration Division 25 Works and Transport Division 10 Planning, Monitoring and Evaluation Division 25 Foreign Aid and Standard Division 15
Total 75
Source: MOPIT
Figure 14.2-1 Organization Chart of MOPIT

14-2
(2)Roles and Functions of MOPIT
MOPIT was established in 2000 and reorganized in 2012 and 2013 during the course of the reorganization of the Government of Nepal (GON). The main aim of reorganization was to bring important infrastructural development under the umbrella of a single Ministry and to harmonize the policies and bring efficiencies and effectiveness in the provision of infrastructural services.
MOPIT is charged with the responsibility to enhance economic and social development of the country and it is mainly responsible for;
• Linking various geographical and economic regions through the national strategic transport network,
• Linking villages in rural areas of the country with markets, • Projects related with tourism, agriculture, electrical, industrial and other sectors of the country, • Preparing plans, policies and programs regarding physical infrastructures (all transport sectors
excluding air transport) and transit management and its operation.
On the other hand, the functions of MOPIT are to;
• Formulate and enforce policies, plans and programs on construction and development of surface, water, railway and ropeway transportation,
• Carry out acts on construction, operation and maintenance of roads (excluding mule tracks) and bridges (excluding suspension bridges),
• Carry out construction works of various surface roads, waterways and ropeways and act as an organization and institution dealing with engineering consultancy,
• Carry out acts pertaining to contact and co-operation with international or regional organizations in the field of housing and physical planning,
• Carry out acts pertaining to contact with international organizations related with construction of highways, waterways and ropeways.
(3)Development Policies and Strategies of Transport Sector
Development policies of transport sector as an executing Ministry are described in ‘Vision Paper 2007 (subtitle: New Physical Infrastructure of the New Nepal)’ in the following;
a) State structure, which is Kathmandu centered, will be converted into decentralized model of federal state,
b) Considering the land locked situation of Nepal, additional transit points at Indian and Chinese borders will be opened,
c) Special emphasis will be given for maintaining judicious balance between Himalayan, mountain and Terai region and for building a self-reliant physical infrastructure at regional level,
d) Urban development will be guided through industrialization and physical infrastructure will be developed by utilizing the national human capital and expertise,

14-3
e) Government role will be people friendly by promoting public private partnership and mobilizing the national capital to full extent,
f) Physical infrastructure will be developed in an equity basis by ensuring benefits to oppressed class, community, religious and ethnic groups, gender and regions so that national interest, which will be in line with nationality, democratic republic and federal state structure, is ultimately safeguarded,
g) Policy of planned development will be adopted by identifying provincial capitals and physical infrastructure will be built on the basis of its relevance to federal state structure.
Strategies of transport sector as an executing Ministry are described in ‘Vision Paper 2007 (subtitle: New Physical Infrastructure of the New Nepal)’ and are as follows;
• Constructing the Mid-hill East West Highway in addition to the existing East-West Highway in Terai will reduce the remoteness and inaccessibility of most of the regions of the country,
• Nepal will be developed as a transit route between India and China by opening additional boarder points and constructing a network of North- South roads,
• Under SAARC Multi-modal transport system, priority will be given to four roads and two railway lines. Similarly, upgrading of East-West Highway and Terai-Kathmandu-Kodari Highway, which is a part of the Asian Highway will be given due priority,
• Road network will be developed in such a way that the nearest road head will be reached within four hours in the hilly region and two hours in the Terai region,
• Alternative transport routes such as electric railway lines, ropeways and waterways will be developed and linked to the roads network,
• Considering the landlocked situation of Nepal and extrovert model of development, a balanced approach will be adopted in maintaining relationship with India and China through an introvert model of development,
• Fast track will be constructed to connect Kathmandu with Terai.
14.3 DEPARTMENT OF ROADS (DOR)
DOR is the responsible organization for the overall management, from the design to operation and maintenance of the Strategic Road Network (SRN) in Nepal. Strategic roads consist of National Highways and Feeder roads, which totals to 12892.2 km in length, as of year 2015/16. These roads accommodate high volume of vehicles and as such play the most important role in the movement of people and goods. The Project road is a section of a national highway and forms an integral part of the SRN. Therefore, all works from the design stage till the operation and maintenance stage of this highway including the tunnel at Sanga Pass also lies under the responsibility of DOR.

14-4
14.3.1 Vision, Overall Goal and Mission
Vision Managing Roads for National Integration and Socio-Economic Development
Overall Goal To contribute in achieving sustainable socio-economic development by providing safe, affordable public road infrastructure services through building of a cost-effective, efficient and reliable network system
Mission To contribute towards the betterment of living conditions of the people through effective, efficient, safe and reliable road connectivity
Objective
To develop, expand and strengthen the road network in a sustainable way for enhancing the overall socio-economic development and integration of the country through balanced regional development by providing due consideration for remote areas and deprived communities
14.3.2 Annual Budget of DOR
Table 14.3-1 shows the annual budget of DOR for the last five fiscal years. The budget allocated to DOR has seen a constant rise every year where it almost doubled in 2016/2017 compared to the budget of 2015/2016. Similar trend is observed in the actual expense also. The expenditure for fiscal year 2016/2017 is almost twice than that of the previous year, but this is true for new construction. Budget expended for maintenance is almost constant for the last three years.
The breakdown of the actual expense has been changed since 2014/2015 and is divided into construction and maintenance. Miscellaneous has been included in construction and upgrading into maintenance. The earthquake is the cause of the decline of the budget in 2014/2015.
Table 14.3-1 Annual Budget of DOR Unit: 1,000 NPR
Fiscal year Allocated Budget
Actual Expenses Miscellaneous Construction Upgrading Maintenance Total
2010/2011 23,608,850 3,458,409 13,244,109 2,827,793 917,349 20,447,660 2011/2012 23,541,835 862,902 8,709,377 8,260,737 1,460,771 19,293,787 2012/2013 28,568,359 1,572,467 10,151,487 8,035,647 2,073,363 21,832,964 2013/2014 34,517,957 8,518,261 8,497,173 5,025,204 5,920,728 27,961,366 2014/2015 17,328,799 - 16,918,712 - 3,672,546 20,591,258 2015/2016 49,324,587 - 34,039,867 - 3,713,000 37,752,867 2016/2017 73,532,076 - 64,474,614 - 3,714,633 68,189,247
Source: DOR
14.3.3 Organization Chart
Figure 14.3-1 shows the organization chart of DOR. The organization is headed by a Director General (DG), who is responsible for management of five branches and Regional Road Directorate (RRD). Each branch is headed by a Deputy Director General (DDG). The RRD is headed by a Regional Director (RD). The total number of staffs in DOR is 2,611. The number of staffs in terms of classes is mentioned in Table 14.3-2 by brief discussion of the role of each unit.

14-5
Department of Roads (DOR)
I
Figure 14.3-1 Organization Chart of DOR
DIRECTOR GENERAL
Maintenance Branch
Deputy Director General-1
Planning & Design Branch
Deputy Director General-1
Bridge Branch Deputy Director
General-1
Foreign Co-operation Branch Deputy Director
General-1
Mechanical Branch Deputy
Director General-1 (Mech.)
Administrative Unit Chief
Administrative Officer-1
Financial Administrative Section Chief
Account Controller-1
Legal And Conflict
Management Unit SDE-1, Er-1, Law Officer-1
Maintenance Unit SDE-1, Er-1
Road Asset Management Unit
SDE-1, Er-1
Planning Monitoring &
Evaluation Unit SDE-1, Er-1
Geo Environmental and Social Unit
SDE-1, Er-2, Soci-1, Environment
Sup-1
Road Sector Skill Development Unit
Sde-1, Er-1
Road Safety and Traffic Unit SDE-1,
Er B & A-1, Er-2
HMIS and CIT unit SDE-1, Er-1, Comp Er-2, Comp Op-1
Central Road Lab SDE-1, Er-2, Lab
Assi.-3
Bridge Design and Monitoring Unit
SDE-1, Er-2, Hyd Er-1, Er B & A-3
Bridge Maintenance and
Co-Ordination Unit SDE-1, Er-2
Bridge Construction Co-ordination Unit
SDE-1, Er-2
Multi-Lateral Co-operation Unit SDE-1, Er-1
Bi-Lateral Co-operation Unit SDE-1, Er-1,
AO-1 Total -3
3
Equipment Maintenance
Management unit SDE-1, Mech Er-2, Elec Officer-1, Operator Officer-
9
Mechanical Training and Co-ordination Unit
SDE-1, Mech Er-2,
Planning and Procurement
Management Unit SDE-1, Mech Er-
2, Mech Store Officer-1
Personnel Administrative Unit
Section Officer-1
Internal Administration Unit
Section Officer-1
Central Store Section Officer-1
Central Level Account Officer-2,
Computer Op-1
Operation Level Account Officer-2
Division Road
Office 34 nos
Mechanical Office-10 nos
Heavy Equipment Division-7 nos
Mechanical Training Center SDE-1 M.E-4
Regional Road Directorate 5
nos
Legend
: Related Division of the Project

14-6
Table 14.3-2 Personnel Composition of DOR
Director General 1 Gazette I Class Deputy Director General 18 Gazette II Class Senior Divisional Engineer,
Chief Administration Officer, Chief Account Controller
117
Gazette III Class Engineer, Legal Officer, Account Officer, Sociologist, Environment Supervisor, etc
499
Other Personnel Non- Gazetted 1,976 Total 2,611
(1)Maintenance Branch
This branch is responsible for maintenance and repairing of SRN. Each year this branch is responsible to formulate the annual road maintenance program. The program is formulated showing which road is to be maintained, when to be maintained and how much the cost will be. The actual maintenance work is conducted based on this program. The program for conducting maintenance of SD Road including the tunnel at Sanga Pass will be undertaken by this branch. The actual maintenance work lies in the responsibility of Bhaktapur Division Office under Central Regional Road Directorate.
(2)Planning and Design Branch
This branch is responsible for planning, design, construction supervision, and appraisal of all development projects related to SRN and financed by the GON. Environmental and social consideration is also looked after this branch through one of its units, the Geo-Environmental and Social Unit (GESU). The RAP and EIA of the objective road including the tunnel at Sanga Pass will also be handled by GESU.
(3)Bridge Branch
This branch is responsible for the planning, design, construction supervision, construction and maintenance of bridges on SRN.
(4)Foreign Cooperation Branch
This branch is responsible for implementation all road infrastructure projects funded by international donors. Its involvement in projects commences from the planning to construction stage and occasionally beyond construction as in cases like Sindhuli road, where it is looking after project-based maintenance. The branch has been and will be looking after this Project until completion of the construction, given that the project is financed by international donor(s). However, It should be noted

14-7
that the construction work might be entrusted to the Division Office or to a Project Office (Suryabinayak- Dhulikhel, Dhulikhel- Sindhuli-Bardibas Road Project) under the Central Regional Road Directorate.
(5)Mechanical Branch
This branch is responsible for management (from procurement to maintenance) of all construction equipment including vehicles for use or under possession by DOR.
(6)Regional Road Directorate
There are altogether 5 regional offices. East Regional Road Directorate (ERRD), Central Regional Road Directorate (CRRD), West Regional Road Directorate (WRRD), Mid-western Regional Road Directorate (MWRRD), and Far-western Regional Road Directorate (FWRRD). These offices are responsible for controlling the division road offices under their corresponding territory. There are altogether 34 division road offices throughout the country.
The National Budget of Nepal for fiscal year 2013/14 is approx. 404 billion NPR. Approximately 8.57 percent of the national budget, which is equivalent to approx. 35.28 billion NPR, is allocated to MOPIT. From this 35.28 billion NPR, 34.52 billion is allocated to DOR, which is about 88 percent of the budget allocated to MOPIT. The rate of budget utilization of DOR recently is almost three quarters, which in the past – particularly during political turmoil years, was not even about half the allocated budget. The budget that has not been utilized comes from abandonment and incompletion of work by contractor.
There is one unit under the Planning and Design Branch in the DOR that looks after executing programs for enhancing capacity of DOR staffs. The unit is called Road Sector Skill Development Unit (RSSDU). This unit organizes various trainings each year for the engineers of DOR. It also organizes on-demand programs such as trainings, seminars, workshops. on request from a specific branch. In this case, the budget is basically allocated from the corresponding branch. Every year, RSSDU sends DOR officials to National Vigilance Center (NVC) for training on evaluation and appraisal of development projects.
Table 14.3-3 shows some of the major projects recently implemented by DOR under financial assistance from international donors. All but one of these projects has been successfully completed, which reflects the increased performance capacity of the implementing agency. Unlike in the past, when assistance from the international donors was significantly allocated for infrastructure development only, the present assistances are forwarded in addition for enhancing capacity of implementing agencies also. For example, one of the components of the RSDP is the institutional strengthening, where capacity development of various units in DOR was targeted. Highway Management Information System (HMIS) was developed by DOR under this component, which it now uses for asset valuation and management. The mid-term review report of this project mentions that DOR has proved to be a pioneer in implementing e-bidding in the country and its effort and

14-8
achievement was commendable. It also mentions that DOR’s performance on social and environmental safeguards were satisfactory.
Table 14.3-3 Donor Funded Major Projects Implemented by DOR Unit: million
Name of Project Implementation Period
Construction Cost Remarks Foreign
Portion Local
Portion
Wor
ld B
ank
Road Maintenance and Development Project (RMDP) Feb.2000-June-2007 $49.9 $9.8 Completed
Road Sector Development project (RSDP) Apr.2008-Dec. 2013 $34.9 $8.0 Completed
Road sector Development Project (RSDP) Feb.2011-Jun. 2015 $58.5 $50.5
On going (90% completed)
Asi
an D
ev.
Ban
k
Sub-regional Transport Facilitation Project (STFP) May.2005-Sept. 2010 $15.2 $4.3 Completed
Road Connectivity Section 1 project (RCSP) Mar.2007-July 2014 $65.2 $14.8 Completed
Source: Department of Roads
14.3.4 Operation and Maintenance of Roads
In general, the maintenance responsibilities of a road after its completion are handed over to the relevant division office under Maintenance Branch of the DOR. There are 34 Divisional Road Offices in DOR.
The maintenance responsibilities of the objective section of this project may be charged to either Bhaktapur Division Road Office or to Suryabinayak-Dhulikhel, Dhulikhel-Sindhuli-Bardibas Road Project.
14.3.5 Procedure of Determination
The general procedure of determination with regards to project implementation in government of Nepal is described hereunder.
(1)Design change procedure
Responsible organization for determination of design change is DOR/Director General. Procedure of design change are;
Step.1) Design change proposal from contractor, consultant or client Step.2) Preparation and submission of proposal document by contractor Step.3) Consultant’s recommendation Step.4) Approved by DOR
(2)Variation order procedure
Responsible organization of variation order is dependent on its amount from contract price. DOR can give approval up to 15% of contract price, Ministry sectary level give approval up to 25% of contract price, and Cabinet level give approval above 25% of contract price.

14-9
Procedure of variation order are; Step.1) Consultant/ Contractor process variations Step.2) Consultant’s recommendation Step.3) Approval by responsible organization
(3)Procurement Procedure
Consulting services and implementing contractor will be procured through the following procedure.
1)Consultant Selection
There are two types of selection method. Quality and Cost Based Selection (QCBS) and Quality Based Selection (QBS). Procedure of each method are; Quality and Cost Based Selection (QCBS)
Step.1) Announcement of Expression of Interest (EOI) Step.2) Submission of the EOI document Step.3) Preparation of short list containing top six (6) consultants by evaluation of EOI Step.4) Announcement of Request for Proposal (RFP) for shortlisted consultants Step.5) Submission of Technical and Financial proposal by the consultants Step.6) Evaluation of Technical proposal Step.7) Combined Evaluation of Financial proposal for consultants who passed
Technical proposal Step.8) Negotiation with highest scorer in technical and financial proposal Step.9) Signing of contract agreement
Quality Based Selection (QBS)
Step.1) to Step.6) Same as QCBS Step.7) Open the Financial proposal of highest scorer in Technical proposal Step.8) Negotiation with consultant Step.9) Signing of contract agreement
2)Contractor Selection
The Contractor is selected under International Competitive Bidding (ICB). Single stage with two envelop bidding is applied as following;
Step.1) Submission of Technical and Financial proposal separately Step.2) Technical proposal evaluation and selection of contractor Step.3) Financial proposal opening and documentation Step.4) Award the contract to lowest proposed bidder
(4)Disbursement Procedure
Procedure of disbursement are;

14-10
Step.1) Submission of Interim Payment Certificate(IPC) from Contractor Step.2) Verified and recommended by consultant to employer Step.3) Employer makes payment to contractor (Direct payment or Reimbursement) Step.4-1) Direct payment: Donner agencies to pay to the contractor Step.4-2) Reimbursement: Project (GON) to pay from its own account and downer agencies
to reimbursement to project (GON account)

CHAPTER 15
OPERATION AND MAINTENANCE


15-1
CHAPTER 15 OPERATION AND MAINTENANCE
15.1 OPERATION AND MAINTENANCE ORGANIZATION
15.1.1 Road O&M Organization
Road operation and management such as periodic inspection, routine inspection and repair/restoration are necessary to provide expected road service and benefits after completion of the Project.
Currently, as explained in Chapter 14, Department of Roads (DOR) is the responsible organization for the overall management, from design to operation and maintenance, of the Strategic Road Network (SRN) in Nepal, which make 12,892.2 km of National Highways and Feeder roads network as of year 2015/16. Although there is a backlog in the maintenance of roads in Nepal, it is mostly concentrated on roads other than highways. The highways are said to be maintained satisfactorily, if not sustainably. This is mainly because, the highways are the vertebra of the road network as well as artery of the socio-economic activities in the country.
The project road is a National Highway and is designated as a part of Asian Highway, an international corridor that links the capital city, Kathmandu with the Chinese border and the eastern plains of Nepal through the recently opened Sindhuli-Bardibas Road. For this reason, maintenance priority of the project road will be higher in the priority list of the DOR for maintenance and therefore, necessary budget for operation and maintenance of the project road is deemed to be estimated and allocated adequately.
The DOR is also thought to have enhanced its capacity regarding operation and maintenance of roads through the technical cooperation project of Japan “Sindhuli-Bardibas Road Maintenance and Operation Capacity Development Project” where capacity development has been materialized for establishing methods for slope stability and application of response measures against natural disasters.
In addition, comparing the length of the project road to the total length of the roads managed by DOR, necessity to establish an additional organization or to modify the current maintenance organization is thought to be very low, provided the road structures are constructed properly with the current technologies under proper supervisions.
Considering the above, the Study drafts a plan for road O&M, which includes types of required maintenance, frequency and required budget in the following chapter. It is recommended that DOR understand the necessity of increasing the maintenance budget for this section so that it can persuasively request disbursement of maintenance expenses to Roads Board Nepal (RBN), which is the organization responsible for budget related to maintenance of road infrastructure.
15.1.2 Tunnel O&M Organization
Facilities required for the Sanga Tunnel under the Study are given in Chapter 11. It is extremely important that these facilities (equipment) be properly maintained for securing efficiency and safety

15-2
inside the tunnel. Traffic management is also necessary for prevention and handling of accidents as well as assisting in evacuation of tunnel users to minimize damages due to incidents/accidents inside the tunnel.
For safety operation inside the Sanga Tunnel, the Study will plan required O&M activities consisting of inspection and maintenance of tunnel structures and facilities, monitoring of traffic movement, traffic accident, fire incident, immediate actions against incidents, vehicle control etc.. Since these O&M activities include different aspects from those of ordinal roads, establishment of a special organization: ‘Tunnel Management Office’ will be necessary.
The Study checked the on-going preparation for establishment of O&M organization of the Nagdhunga Tunnel, which is expected to commence construction soon (as it is at the completion stage of the detailed design), as it is the first highway tunnel in Nepal, and then establish/plan an organization structure of Tunnel Management Office as well as necessary vehicles and equipment for Sanga Tunnel.
The following contents are the summary of on-going preparation for the Nagdhunga Tunnel,
- Nagdhunga Tunnel will be tolled to secure tunnel O&M expense,
- NBR is the sole organization authorized to set tollage scheme in Nepal. It is currently under preparation for setting of tollages for Nagdhunga Tunnel as well as for modifying current toll charges of other toll highways,
- Facilities to be installed in Nagdhunga Tunnel have been determined to equip almost all facilities for the tunnel with the classification of A, except water spray even though this setting had not been finalized at the Study,
- The organization and equipment for Tunnel O&M were under preparation with reference to those proposed in the JICA FS Study.
DOR requested the Study to plan and design O&M scheme with a tollage system so as to securing O&M budget. Based on above circumstances and considering required activities for Sanga Tunnel, the Study planned an organization structure as shown in Figure 15.1-1. In addition, required number of personnel for each section of the organization is shown in Figure 15.1-2.
Considering the length between Nagdhunga Tunnel and Sanga Tunnel, different organizations should be established to operate and manage each tunnel respectively. Length of Sanga Tunnel is not so long. However, the tunnel O&M office has to possess all necessary divisions including office clerks or technicians at fields, and 3 teams shift rotation schedule will be needed for site workers. Therefore, organization of tunnel management office and the number of necessary staffs are planned as shown in Figure 15.1-1 and Figure 15.1-2 respectively.

15-3
Source: JICA Study Team
Figure 15.1-1 Proposed Organization of Tunnel Management Office
Source: JICA Study Team
Figure 15.1-2 Estimated Staff Requirement

15-4
15.2 OPERATION AND MAINTENANCE PLAN
15.2.1 Operation and Maintenance of Road Section
15.2.1.1 O&M Activities
Proper and timely maintenance after completion of construction is utterly important, not only to maintain good driving conditions but also to endure service life of pavement and structures. Required activities for proper and timely maintenance of roads including bridges are periodic inspection, routine maintenance and repair/restoration. Works fundamentally carried out for each activity are mentioned hereunder.
(1)Periodic Inspection
• Visual inspection of base course and wearing/surface course
• Inspection of bridges by means of visual inspection and simple measurement (inventory)
• Visual inspection of cut/fill slope condition
• Inspection of drainage facilities by means of visual inspection and simple measurement (inventory)
(2)Routine Maintenance
• Trimming of plantations along the central median reserves
• Cleansing of pavement surface and patching of asphalt, necessarily
• Repairing of base course
• Repairing of slopes (earthen and structure)
• Cleaning, clearing clogged material of drainage facilities
• Cleaning of intersection, roads, shoulders, bus laybys, and expansion joints of bridges (including footbridges)
(3)Repair/Restoration
• Repairing of base course
• Overlay of wearing (surface) course
• Repairing of bridge (including footbridges) handrails
• Repairing of slopes (earthen, structure)
• Repairing of road ancillaries
There are several structures planned in the project road section. Almost all the structures are concrete. There are side ditches, catch basins, and culverts for cross drainage purpose, box culverts applied for replacement of existing small-scale road bridges and concrete footbridges for pedestrians. Application

15-5
of concrete structures comes for the consideration to minimize the effort of maintenance. In general, these structures are considered to be maintenance free and only requires periodic inspection work and some minor repairs. There should be no difficulty for DOR in undertaking these works as DOR currently has sufficient capacity for such works.
15.2.1.2 O&M Cost Estimate
The operation and maintenance cost, which needs to be borne by Nepalese side, to keep the infrastructure provided under the project sustainable are as tabulated in Table 15.2-1.
The normal annual operation and maintenance cost (i.e., cleaning of road facilities surface) would be 16,465 thousand NPR. In addition to this, separate cost for periodic maintenance/rehabilitation and inspection would be necessary every several years. Thus, total operation and maintenance cost for a period of 20 years including periodic maintenance/rehabilitation would be 918,107 thousand NPR, which on average comes out to be 45,905 thousand NRs annually.
Table 15.2-1 Cost to be Borne by Nepalese Side for Road O&M
Item Frequency Component Details Approx.
Cost (103 NPR)
Cleaning road surface (by manpower) Once a week ROW Clean road surface,
shoulder, slope, side ditch 10,483
Cleaning intersection & bus-stop Every 2 days Road surface Clean sidewalk etc. 3.089
Cleaning cross drainage Once a year Cross
drainage Clean box culvert & pipe culvert 111
Planting in median strip 4 times per year Median Planting & trimming 438
Maintenance of AC pavement Ad hoc Carriageway Pathing 0.5% pavement
area per year 2,344
Annual Operation & Maintenance Cost 16,465 Periodic maintenance of AC pavement Every 10 years Carriageway Overlay of main lane
& service road 411,692
Maintenance of sidewalk Every 5 years Sidewalk
pavement Replace damaged interlocking tiles 25,410
Maintenance of box culvert for river Every 10 years Revetment Repair of gabions 5,568
Maintenance of lane marking Every 3 years Road surface Painting of lane marking 99,954
Maintenance of traffic safety facilities
Every 5 years Fence in median
Painting of Crossing prevention fence 24,123
Every 5 years Traffic sign board
Cleaning & Replace of traffic sign board 19,612
Periodic inspection of pedestrian crossing bridge (Subcontract)
Every 5 years Whole bridge
Check & diagnose condition of bridge member
2,448
Total Operation & Maintenance Cost for 20 years (Annual average of 20 years)
918,107 (45,905)

15-6
15.2.1.3 Fund Source of Road O&M
DOR's Fund for maintenance of roads is allocated by Roads Board Nepal (RBN). RBN provides the fund it collects from fuel tax, vehicle registration fee and toll fees raised by RBN. However, toll fees raised is used exclusively for the designated section where the toll is collected.
(1)Roads Board Nepal (RBN)
RBN was established under the Roads Board Act 2058 (2002) with the aim of providing sustainable fund for planned maintenance of the roads. The aim of planned maintenance is to keep existing maintainable roads in serviceable condition, reduce vehicle operating cost and provide more comfort to the road users. RBN is a self-governing, self-sustaining and organized entity based on Public-Private Partnership model. The major function of RBN is to collect, manage and allocate fund for road maintenance to the Road Agencies. Members* of RBN consist of Executive Board Member (13 persons) and Staff (14 persons). Executive Board Member are chairperson from MOPIT, representatives from ministries (such as Ministry of Finance, Ministry of Federal Affairs and Local Development, Ministry of Import and DOR) and representatives from concerned associations (such as Municipal Association, Nepal Engineers Association, Transport Entrepreneurs Association, etc.) and others.
(2)Flow of Road Fund
Figure 15.2-1 shows the amount collected from each source and the flow showing amount and process of how the fund is transferred to the two organizations responsible for maintenance of roads, DOR and DOLIDAR (Department of Local Infrastructure Development and Agricultural Roads).
Total annual expense on average of the objective road section of this project corresponds to mere 1.5% of the DOR’s total maintenance budget for fiscal year 2015/2016 and such annual disbursement is considered to be affordable by DOR without any difficulty.
Source: Prepared by JICA Study Team based on RBN Information
Figure 15.2-1 Flow of Road Fund
Fund Source
Toll Revenue
Taxes
DOR(Maintenance cost for strategic road network 10,140** K m
3.1 Billion NPR**
Road Fund
・Toll Fee 4 sections
・Fuel Tax ・Vehicle Reg.
16.0B NPR*
Road Board Nepal
MOF (National Treasury)
4.4 Billion NPR**
Allocated to RBN
0.10 Billion NPR**
DOLIDAR (Maintenance cost for local roads)
1.3 Billion NPR**
70%
30%
100%
*72/73(2015/2016) **73/74(2016/2017)

15-7
Thus, with regards to the road section of the Project, Nepal is deemed capable to manage necessary financial resources for sustaining operation and maintenance of the infrastructures (Road, bridge and structures) constructed under this project. However, it is important that the necessary budget for maintenance and repair is secured in a manner stated in this section.
15.2.2 Operation and Maintenance of The Tunnel
15.2.2.1 O&M Activities for Tunnel
Major O&M activities for Sanga Tunnel section are classified as follows;
1) Inspection 2) Maintenance; tunnel structure and facilities 3) Monitoring of traffic movement, traffic accident, fire incident, etc. 4) Immediate actions when some incidents are found or reported 5) Vehicle Control (vehicles carrying hazardous materials, vehicle height, and overloaded trucks.)
15.2.2.2 Inspection
Inspection of a tunnel must be undertaken daily by an inspection team, and check the following;
• Facilities inside the tunnel such as lighting facility, jet fans, etc. are properly functioning • Cleanliness of the tunnel wall, road surface, facilities, etc. • Development of any/new cracks on concrete lining and pavement, water seepage from concrete
lining, etc. • Drainage facility (no clogging, etc.) • Deformation of the tunnel arch • Any other problems
Inspection items for civil work components and electrical/communication facilities are shown in Table 15.2-2.
Table 15.2-2 Inspection Items
Component Inspection Items Civil work Component
Road Surface
Pavement (1) Surface roughness, (2) Cracks, (3) Joint failure, (4) Heaving, (5) Pumping, (6) Local settlement
Tunnel Portion
Tunnel Portal
(1) Cracks, (2) Drainage, Water Flow, (3) Any deformation, (4) Slope condition
Lining (1) Cracks, (2) Leakage of water, (3) Free Lime, (4) Delamination, (5) Difference at a joint
Interior Wall (1) Damage, (2) Damages to the accessories Drainage (1) Clogging, (2) Damage
Electrical/ Mechanical/ Communication Component
Jet Fans Abnormal noise, vibration, cable connection and voltage. Interlocking with visibility index (VI) sensors and carbon dioxide (CO) sensors.
Lighting Facilities Intensity of illumination. As for distribution board, checking abnormal heating, looseness and breaking of wire etc. by visual check and check with measuring instrument.

15-8
Component Inspection Items Power supply system and distribution equipment and buck up generator
Appearance (dirt, damage), looseness, breaking of wire, oil leakage, pipe damage, abnormal noise and vibration etc. by visual check and check with measuring instrument.
Information collection and provision equipment
Performance, communication and appearance (dirt, damage) of each equipment. Facility/equipment which also defined as ventilation, information collection and provision should be inspected.
Emergency Facilities Performance and appearance (dirt, damage) of each equipment. As for signal receiving and control board, abnormal noise and heating etc. are checked by visual check etc.
Source: JICA Study Team
15.2.2.3 Maintenance of Tunnel
Routine maintenance activities are summarized in Table 15.2-3. Routine maintenance should be implemented based on the findings of inspection and regular requirements.
Table 15.2-3 Routine Maintenance Activities
Component Routine Maintenance Activity Civil work Component
Road Surface
Pavement (1) Crack sealing, (2) Joint repair, (3) repair of heaving, pumping and local settlement (4) Road surface cleaning
Tunnel Portion
Tunnel Portal
(1) Crack sealing, (2) Cleaning of drainage facilities, (3) Repair of Slope protection work
Lining (1) Lining cleaning, (2) Crack sealing, (3) Water leakage prevention, (4) Reinforcement work for the cavity at the back of lining, (5) Joint repair, (6) Delamination repair
Interior Wall (1) Wall cleaning Drainage (1) Drainage cleaning
Electrical/ Mechanical/ Communication Component
Jet Fans (1) Cleaning, (2) Check the stability, (3) Replacement and overhauling of aged jet fan
Lighting Facilities (1) Cleaning, (2) Change a light, (3) Check the stability, (4) Replacement of lighting facility in case of luminance reduction
All kinds of Signboards (1) Cleaning, (2) Change a light, (3) Check the stability, (4) Replacement of deteriorated facility
Emergency Facilities such as Fire Hydrant, Fire Detector, Fire Extinguisher, etc.
(1) Cleaning, (2) Functioning or not, (3) Replacement of facility depending on the deterioration or the damage of the parts
CCTV, Control system (1) Cleaning, (2) Check the stability, (3) Functioning or not, (4) Replacement of deteriorated facility
Other Equipment such as CO Sensor, Visibility Index Sensor, Wind Velocity Sensor
(1) Cleaning, (2) Check the stability, (3) Functioning or not, (4) Replacement of deteriorated facility
Back Up Generator (1) Cleaning filters, spark plug, nozzle, (2) Functioning or not, (3) Fuel Amount, (4) Replacement of deteriorated facility
Source: JICA Study Team
15-9
15.2.2.4 Monitoring Traffic Movement, Traffic Accident, Fire Incidents, etc.
This work must be undertaken 24-hours a day and 365 days a year. Traffic movements are monitored through CCTV cameras and information provided through reporting from patrol group(s), and road users. All information needs to be compiled at a traffic control center of the Tunnel Management Office, and necessary actions should be quickly decided and informed to proper agencies and the response/action team.
Monitoring will be focused on following incidents;
• Reckless driving • Overtaking • Over speeding • Stopped (stalled)/parked vehicles • Vehicle breakdown • Objects dropped from vehicles • Accident • Fire
Information collected needs to be properly recorded, and necessary information should be provided to road users, through Variable Information Signboards and other suitable media.
Monitoring is quite important to assure safe operation of a tunnel and to protect road users’ lives.
Emergency actions, if required are taken in accordance with the instructions of the head of the monitoring team.
15.2.2.5 Immediate Actions when Some Incidents are Found or Reported
The head of the monitoring team needs to take immediate decisions on what to do when some incidents are found or reported from road users including whether it is imminent to inform to Action Team, Fire Department and/or Police.
Major possible incidents that can be anticipated inside a tunnel are as follows;
• Traffic accidents • Fire break out • Vehicle breakdown • Objects fallen from vehicles • Parked/stopped (stalled) vehicles
Actions to be taken during emergency cases are illustrated in Figure 15.2-2.

15-10
Figure 15.2-2 Actions to be Taken During Emergency
Flow of actions in case of a fire and traffic accident/vehicle breakdown/falling objects are shown in Figure 15.2-3 and Figure 15.2-4.
Source: JICA Study Team
Figure 15.2-3 Flow of Actions to be taken in Case of Fire
Elapsed A ction of R oad A dm inistrator,
Time A ction T eam (F ire-brigade) & P olice
0 m ints.
10m ints.
A pprox.
A ction of D rivers & E vacuees
Judge(Determine Fire)
Provide Info.Guide to evacuate
・ Emergency Bell
・ Traffic Signal /Barrier
・ W arning Sign Board
・ Loud Speaker
Report(Emergency Telephone)
Detect Fire (CCTV linked)
Start to evacuate( to the Safety Zone)
All Evacuation completed
Contact Action Team (Fire-brigade)&
Police
Fire-brigade& Policeare dispatched
Arrival:Fire-brigade, Police
Operations:Fire fighting,
Rescue
•V
entilatio
n O
peratio
n
for Fire Em
ergency
Outbreakof Fire
Fire Fighting at the
Initial Stage
(W ater Plug , etc)
【Legend】
Info Collection
Response
Guidance /Evacuation
Judgment

15-11
Source: JICA Study Team
Figure 15.2-4 Flow of Actions to be taken in Case of Traffic Accident, Falling Object and Vehicle Breakdown
In case of fire, the Tunnel Management Office will provide evacuation instructions to people inside the tunnel via loud speaker. The tunnel will be constructed with refuge (evacuation) access along the road, emergency parking zones at the interval of about 750 m, and two evacuation connection tunnels as explained in the Chapter 11.
15.2.2.6 Vehicle Control
The following vehicles should not be allowed to use the Sanga Tunnel, thus these vehicles should be controlled before entering this tunnel;
• Two and three wheelers (motorbikes and tricycles [Tempo]) - high probability of causing traffic accidents,
• Vehicles carrying hazardous materials such as vehicles carrying oil or highly inflammable items - when such vehicles cause an accident or a fire, it could be disastrous for both people and the tunnel (including facilities),
• Overloaded trucks - high risk of vehicle breakdown (weighing scale are recommended to be installed at toll gates),
• Vehicle height exceeding the limit - these will damage jet fans and other facilities(Height Restricting Devices must be installed at toll gates),
• Others (Mechanically defected vehicles, pedestrians and animals).
It is necessary to coordinate with Department of Transport Management and Traffic Police Department prior and also during the operation of Sanga Tunnel.
Elapsed A ction of R oad A dm inistrator,
Time A ction T eam (R escue T eam ) & P oliceA ction of D rivers & E vacuees
Judge
Provide Information to
drivers
Warning Sign Board(VMS), etc.
Report(Emergency Telephone)
Detect (CCTV)
Contact Action Team(Rescue Team) & Police
Arrival:Rescue Team & Police
Operations:Rescue, Removal
Traffic AccidentFalling ObjectDisabled Vehicle
【Legend】
Info Collection
Response
Guidance /Evacuation
Judgment
Rescue Team & Police are dispatched

15-12
15.2.2.7 Tunnel Management Office
The Tunnel Management Office, will be constructed at the West portal, and it will be the base for tunnel O&M such as monitoring of traffic and facilities, traffic management, toll collection, etc. Recommended size of the office is as described in Table 15.2-4.
Table 15.2-4 Function and Size of Tunnel Management Office
Function Area Administration Office
680 m2
Maintenance Facility Control/Office for Maintenance Staffs Stock room for equipment
Traffic Management Traffic Control Center/Office Rest-Space for Patrol team Machine Room for Control System Stock Room of Equipment
Action Team for Emergency Office/Rest Space Vehicle Control Section Office/Rest Space Toll Collection Toll calculation
Rest space for toll collector Parking Space Vehicles for O&M, Parking for Officer 1,100 m2
15.2.2.8 Equipment Needed for Tunnel O&M
The list of equipment needed for the Sanga Tunnel O&M is as shown in Table 15.2-5. Ambulance or fire truck to be arrange by other public agencies will be needed.
Table 15.2-5 Equipment Needed for Tunnel O&M
Name of Equipment No. of Unit Inspection & Maintenance Work
Road Sweeper 1 Wall Cleaning Vehicle 1 Water Supply Equipment for Cleaning 1 High Platform Mounted Vehicle 1 Station Wagon 1 Inspection Machinery, Measuring Instrument and Tools 1 set
Traffic Monitoring and Information Provision
Monitor System 1 set Patrol Car 2 Traffic Control Devices 1 set
Emergency Case Towing Truck 1 Air Jack & Truck for Transport of Air Jack 1 Fire Truck 1
Vehicle Control Weight Scale (Mat Type) 1 Height Restricting Device (Gate Type) 2
Toll Collection Minivan 1 Source: JICA Study Team

15-13
15.2.3 Tunnel O&M Cost and Fund Source
15.2.3.1 O&M Cost Estimate for Tunnel O&M
O&M cost is estimated to secure both Periodic and Routine Maintenance cost, and Facility/Vehicle Renovation Cost (Replacement of deteriorated facilities such as jet fans, lightning, other equipment and vehicles for O&M).
Periodic and Routine Maintenance cost are estimated as follows;
(1)Tunnel Management Office O & M
⚫ Staff Cost 18.8 Million NPR ⚫ Office Running Cost 1.0 Million NPR
Sub-total 19.8 Million NPR
(2)Electricity Cost
⚫ Jet fan 3.7 Million NPR ⚫ Lighting, Emergency facilities, Etc. 18.7 Million NPR
Sub-total 22.4 Million NPR
(3)Maintenance Work/Replacement of Parts, etc.
500,000 NPR/month x 12 months = 6.0 Million NPR
(4)Total = 48.2 Million NPR/Year
Renovation Cost is calculated with the cost of each facility, equipment and vehicles at construction and assumed service life for each item.
15.2.3.2 Toll Scheme for Tunnel O&M Cost and Tunnel Management Office Operation
DOR strongly insisted collecting toll fee for covering the O&M cost of Sanga Tunnel Based on such insistence from DOR, the Study team prepared a plan of toll project scheme based on three principals below.
(1)Fairness and Just Principle
The toll should be set so that it is socially equitable and acceptable. Since there are no other major transportation infrastructures in Nepal, this means that toll setting needs to be comparable to other road tariffs.
The study checked tariffs of toll fees levied on highways in Nepal; however, those are at very low rate and obviously not enough for tunnel O&M cost, because main structure of the roads where the toll is collected is made of earth work. In the case of Nagdhunga tunnel, toll system is planned to secure O&M cost. During the Study period, the toll for Nagdhunga tunnel was yet to be finalized and were planning tentatively to apply the same rate recommended in the JICA FS Study (25 NPR for Light Vehicle, 35 NPR for Heavy Vehicle), which was determined following results from a willing to pay survey.

15-14
Since Sanga Tunnel (1.3km, 4-lanes) is almost similar in size with Nagdhunga Tunnel (2.7km, 2 lane) structurally, O&M cost should be similar. Therefore, the toll fee set for Nagdhunga Tunnel is recommended as the initial rate for Sanga Tunnel as this is considered to be acceptable to the public.
Table 15.2-6 Toll Rates in Nepal
Section Type length Toll Heavy vehicle Light vehicle
Nagdhunga Tunnel Tunnel 2.7km 35 NPR* 25 NPR* Naubise - Mugling Highway 83km 30 NPR 20 NPR Narayanghat - Hetauda Highway 78km 30 NPR 20 NPR Narayanghat - Butwal Highway 115km 40 NPR 30 NPR Bhumahi - Bhairahawa Highway 29km 15 NPR 10 NPR
* not finalized, ** each figure shown at year of 2017 Source: JICA Study Team,
(2)Benefit Principle
Toll amount should not exceed the benefit which users obtain by using the road. Specifically, the toll should be lower than the whole benefits such as reduction in travel time and saved fuel, etc. This principle is commonly used for public explanation and needs to be checked. Tentatively planned toll (35 NPR for large, 25 NPR for light vehicle at 2017 value) do not exceed the amount of benefits including TTV and VOC of a vehicle, as mentioned in chapter 21.
(3)Other Considerations
The total amount of collected toll should secure O&M cost from the opening year. This was confirmed by the comparison of expected toll revenues in chapter 21 and the estimated O&M cost in the following section.
15.2.3.3 Financial Study of Tunnel O&M Cost and Toll Collected from Road Users
Based on the following conditions, Sanga Tunnel O&M cost and its toll revenue was estimated.
[Common] ⬧ Base year of 2017
[O&M Cost] ⬧ Routine and Periodic Maintenance Cost: yearly 48.2 Million NPR from the opening
year ⬧ Renovation Cost (Replacement of deteriorated facility such as jet fans, lightings, other
equipment and etc.)
[Revenue] ⬧ Toll Setting: 30 NPR for Light vehicle and 40 NPR for Heavy vehicle at commencement
and its rate is assumed to raise every years according to the price escalation
Comparison of estimated toll revenue to tunnel O&M cost is shown in Table 15.2-7. Though O&M cost will become minus at some years; however, these costs will be covered by the saving cost accumulated from previous years.

15-15
Table 15.2-7 Comparison of Estimated Toll revenue and O&M Cost (Unit Million NPR)
Year Inflow Toll Revenue
Outflow O&M Cost
Balance (Inflow -
Outflow) at year
Cumulative Balance Remark
1 2025 122 48 74 74 Open 2 2026 126 48 77 151 3 2027 129 48 81 232 4 2028 132 48 84 316 5 2029 135 156 -22 294 6 2030 137 64 73 367 7 2031 140 48 92 459 8 2032 143 48 95 554 9 2033 146 48 97 651 10 2034 148 282 -133 518 11 2035 158 48 109 627 12 2036 160 64 96 723 13 2037 163 48 115 838 14 2038 176 48 127 966 15 2039 178 623 -444 521 16 2040 181 48 133 654 17 2041 184 48 136 790 18 2042 187 64 122 913 19 2043 190 48 141 1,054 20 2044 192 445 -252 801 21 2045 195 48 147 949 22 2046 198 48 150 1,099 23 2047 201 48 153 1,252 24 2048 204 67 137 1,389 25 2049 207 291 -84 1,305 26 2050 210 48 162 1,467 27 2051 213 48 165 1,632 28 2052 216 48 168 1,799 29 2053 219 48 170 1,970 30 2054 222 787 -565 1,405
*Each figure at the present value of 2017 Source: JICA Study Team


CHAPTER 16
ENVIRONMENTAL AND SOCIAL CONSIDERATION


16-1
CHAPTER 16 ENVIRONMENTAL AND SOCIAL CONSIDERATIONS
16.1 REVIEW ON ENVIRONMENTAL AND SOCIAL CONSIDERATIONS FOR FORMER SURVEY (THE SECTION EXCEPT TUNNEL AT SANGA)
JICA had been implemented former preparatory survey on the Project since 2014 and finished in 2016 without completing the final report because of reconsideration on project feasibility. During the former JICA's preparatory survey, necessary surveys on EIA and RAP had been implemented, however, some requirements in terms of JICA's Guidelines for Environmental and Social Considerations were remained. In 2017, JICA decided to implement an additional survey for this project, the Project for the Improvement of Suryabinayak-Dhulikhel Road in Nepal, to update the former survey with new tunnel option at Sanga Pass. In addition, the additional survey has another aim of assisting conditions for ODA Loan including necessary procedures on JICA's Environmental and Social Considerations.
16.1.1 Summary of Former Surveys regarding Environmental and Social Considerations
16.1.1.1 EIA
(1)Major Environmental Impacts
1)Beneficial Impacts Due to Project Activities
During construction stages, beneficial impacts like generation of employment opportunities, increase in income, improved income generation activities, and enhancement in technical skills of local people are expected. While during the operation stages, beneficial impacts, such as shortening of travelling time, saving on vehicle operating cost, reduction of traffic accidents, access improvement for people, socio-economic benefit in the area, business development, and tourism development are expected.
2)Adverse Impacts Due to Project Activities
Possible adverse impacts associated to the project activities, that may occur during the project construction and operation stages are shown as below: Adverse Impacts on Physical Environment Temporary and Permanent change in land use Impact on Air Quality Impact on Surface Water Quality Impact due to Noise Impact due to Construction Waste Impact due to construction camps and stocking yard of construction materials Impacts due to slope instability, landslides and erosion of slopes after cut and fill activities Impacts on River flow regime and river environment Impact upon existing public utilities, existing Physical Structures and infrastructures
Adverse Impacts on Biological Environment Impact upon the forest area which includes loss of plant species and some road side tress. Temporary and permanent change in forest land due to the Project activities

16-2
Adverse Impacts on Social, Economic and Cultural Environment Land acquisition and involuntary resettlement Inaccessibility to the properties due to fragmentation of public and private land due to the road
alignment Impacts due to occupational health and safety of workers Impact due to displacement of poor and vulnerable communities Impact on Historical and Cultural Resources and Impact due to fire after traffic accident.
(2)Mitigation Measures
The mitigation measures to avoid or reduce above-mentioned adverse impacts are summarized hereunder:
1)Physical Environment
The impact due to change in land use can be mitigated by regulating the land use. The RoW will be demarcated in order to avoid encroachment. In addition, the forest area will be cleared only to maintain the designed formation width. Land acquired for temporary purposes will be reclaimed and rehabilitated.
Preventive mitigation measures, such as selection of equipment and proper maintenance, will be proposed for mitigating the impact due to NO2 and SO2. Preventive mitigation measures, such as spraying water three time a day at the work areas and washing the vehicles before they leave the construction sites, will be proposed for mitigating the impact due to dust in the work area. Turbid water discharged from the labor and contractor's camp site shall be appropriately treated before discharge into the river to mitigate the impact on water bodies.
Selection of low-noise type equipment and providing noise barriers at necessary locations and control of work hours and days, i.e. stopping at night and weekends, near the vulnerable facilities and settlements shall be proposed for mitigating the impact due to noise.
For mitigating the impact on the existing infrastructure, the temporary road trail/passage, water supply and drain mitigation shall be provided on the existing district road during construction so that the daily activities in the area will not be affected due to the commencement of the Project.
Alternative facilities shall be provided as a part of the Project to any water supply facilities destroyed by the Project. If the planned water intake affects significantly to the existing water use, alternative water source(s) shall be provided to minimize the impact to acceptable level.
The impact due to change in land use and land fragmentation can be mitigated by regulating appropriate land use system and establishing easy access path rather than time consuming route into settlement area and farm land. Crossing passage will be introduced at different locations in order to mitigate the impact due to road blockade during construction phase.
The direct disposal of side surface lead off drains upon private cultivated lands and properties will be avoided. Surface runoff and side lead off drains will be managed properly in order to prevent significant adverse impacts upon public and property. To prevent water logging, 3 cross drainage structures have been proposed for continuation natural drainage system.
Drainage improvement works will be carried in order to control volume and speed of water flows in water courses in the vicinity of exposed soils and slopes.

16-3
To minimize the impact due to dust workers will be encouraged to use face mask. Material stock area and soil disposal area is planned at Kavrepalanchowk District, Panauti. Contractor shall select appropriate sites for soil disposal with governmental authorization including environment. And the disposal practice at the sites shall be monitored complying with Table 2.10 of ESMF.
Precaution will be taken while using the machines and equipment, especially nearby public and private infrastructures and placing of sound barriers along the settlement area to reduce noise pollution.
2)Biological Environment
Mitigation measures to counter possible adverse impacts on local biological environment are as follows: Project will carry out compensatory plantation at the rate of 25 saplings for each cut tree in
available locations and their management until the age of 5 years. Other measures include, encourage and support local community for controlling illegal harvesting
of forest resources and encroachment into the forest area for settlement. Strict rules and regulation will be enforced in and around the forest area to protect from the illegal harvesting of the vegetation and wild life.
3)Social, Economic and Cultural Environment
Mitigation measures to control possible adverse impacts on socio-economic and cultural aspects are as follows: Timely distribution of compensation cash for private lands and other private properties. Required
budgets decided by Compensation Determination Committee (CDC) should be allocated for acquisition and compensation during the Project construction.
At least one family member of affected household will be provided with income generating training and opportunity in the construction and operation of Project. Arrange food supply programs for food deficiency areas.
The Project will encourage local people in the involvement of agricultural extension services to increase local crop production and adopt better farming techniques. Further, the Project will encourage locals in community development programs to increase product diversification and development of alternative livelihood activities.
Budget for Environmental and Social Enhancement Costs and other Environmental Mitigation Costs shall be allocated.
Awareness raising program should be deliver through local organizations to plan proper usage and management of the social service facilities.
Security systems will be established to avoid various sorts of conflicts between the local and immigrants during the time of construction and operation. Majority of the rural areas along the proposed alignment is inhabited by indigenous people; conflict upon existing natural resources between inhabitants and in-migration people will be manage by establishing security post at several locations as appropriate.
Project has proposed locals inhabited adjacent to road alignment by providing with passing zones at different locations as appropriate, as safety measure for locals during construction period.
(3) Environmental Management Plan

16-4
The baseline, compliance and impact monitoring including environmental audit of the proposed Project have been recommended along with monitoring indicators so as to ensure validity of impact prediction, effectiveness of mitigation measures and in overall, long term sustainability of this Project and environmentally sound rapid socio-economic development of the community adjacent to the Project area. Budget has also been allocated for monitoring during construction period and during the first year of operation and environmental auditing cost also has been allocated.
16.1.1.2 RAP
(1)Outline of the Possible Impact
Within the ROW of the SD road, there are observed some stone spout, communal wells, and other public/semi-public facilities related to people's life. Land acquisition and resettlement process should deal with such cases appropriately as same as the case of private properties within the affected areas. The RAP will be updated during the following detail design (D/D) phase according to final alignment and design. The summary of PAPs are shown in the following table.
Table 16.1-1 Summary of the PAPs in former survey
Type of Loss Number of Project Affected Household
Number of Project Affected Persons
Legal Illegal Total Legal Illegal Total
Required for displacement 1. House Holds (Structure owners within
the ROW) - 301 301 - 1,836 1,836
2. House Holds (Structure owners on private land) 35 - 35 214 - 214
3. Institutions (government offices*, etc.) - 18 18 - - 0
Sub-Total 35 319 354 214 1,836 2,050
Not required for displacement 4. Land owner 25 - 25 152 - 152
Grand Total (1-4) 60 319 379 366 1,836 2,202 * Government offices, such as police box, are coordinated between government and government for relocation Source: Census/Socio-economic Survey, Jan-Feb 2015
(2)Elements of Impact
1)Land
The Project alignment and impact zones were mapped out on the cadastral maps collected from the Survey Office in Bhaktapur and Kavrepalanchok during December 2014 to January 2015. These activities are divided into field verification, cadastral map scanning, cadastral survey in the field, and cadastral map digitization to find out affected land. Land is one of the major private properties affected by the Project. Project affected land is classified into two major types: (1) land within the existing ROW, and (2) land beyond the existing ROW (private owned land). The cadastral survey shows that approximately 14 hector private land will be required for the Project including new the alignment bypass area of Nalinchowk to Sanga and other curve

16-5
improvements along the road. The necessary land areas in each Village Development Committee (VDC) are shown in Table 16.1-2.
Table 16.1-2 Required Land Acquisition
S.N. VDCs/Municipalities Private Land (Sqm)
1 Bhaktapur 670 2 Chitpol 79,114 3 Nangkhel 15,583 4 Sipadol 2,000 5 Banepa 4,222 6 Dhulikhel 24,300 7 Nasikasthan Sanga 13,615 8 Ugratara Janagal 1,191
Total 140,695 Source: Cadastral Survey, Jan-Feb 2015
2)Structures
Residential, business, and institutional structures are three major types of project affected structures across the project areas. There are few residential structures with small business along the road, however, the other structures were set backed after Public Road Act (1974). There still are a lot of structures within ROW for the business purpose to rent in or rented out. The Project will cause resettlement of 451 houses/structures (336 house owners). Out of them, 18 houses/structures are belonging to institutions.
Table 16.1-3 Resettlement Needed House/Structures
No. Type Number of House structures
1 Simple Hut/Shed 12
2 Thatched roof, walls constructed with bamboo and mud/stone 32
3 Tile/iron roof, walls constructed with brick/ mud/stone 151
4 Iron sheet/roofing with stone/ brick wall/cemented plaster 156
5 RCC Building 81 6 Movable kiosk /wall/fence etc. 19
Total 451 Source: Census/Socio-economic Survey, Jan-Feb 2015
3)Trees and Crops
According to the results of the field surveys, there were observed 429 trees along the SD Road (belonging to the government) which have to be cut down for the Project. None of the private trees were counted with the affected land within the planned road alignment. There are some farming areas in both within and beyond ROW and different kinds of crops including rice are grown. It is not necessary to pay compensation for the crops, if a project provides sufficient time (at least 6 months) for harvesting the

16-6
crops. However, there will be required to be paid some compensation for the crops, in the case of short notification (less than 6 months) by the Project to the crop owners.
(3)Conclusion and Recommendation
For the construction and widening/upgrading of this proposed Suryabinayak - Dhulikhel Section of Arniko Highway Project, a total of about 14.32 ha. of land which comprises of 0.25 ha. of forest land, belonging to community forests and 14.07 ha. of private agriculture land is required.
In general, the social and economic benefits from this Road Project are large and it is one of the National Projects of Government of Nepal. The associated adverse impacts need to be addressed and the recommended mitigation measures have to be implemented. Hence, the Project can be constructed in an environmentally sound manner provided the implementation of recommended mitigation measures is made mandatory.
16.1.2 Results of Review
Additional survey mainly has the target on newly discussing tunnel section at Sanga, however, it also reviewed other sections which had been surveyed during the former JICA's preparatory survey. After the reviewing on civil design and other pre-conditions, sections without newly introduced tunnel section at Sanga were confirmed not to be changed from its original plan in principle. Therefore, the environmental elements and evaluations are still same as before except cases as described below; (1) Change of the number of project affected persons (PAPs) living along the existing Arniko Highway
after the cut-off-date in November, 2014 due to time passing and the earthquake in 2015. (2) Change of the alignment, especially at both sides if tunnel portal areas, due to connection with newly
planned tunnel and approach roads. Some areas have been released from the project area due to the alignment change.
(3) Additional items and analysis on former studied sections to coordinate with the contents/level of the additional survey
Following part describes summary and results of review of the former preparatory survey.
16.1.2.1 Review Items on EIA
(1)Estimation on Noise Level
The cross-section between Sanga and Banepa, where there was no affection by noise from town area and 20m from carriageway, was targeted for the prediction by using following brief calculation method of LAeq under simple condition in "ASJ RTN-Model 2008 by The Acoustical Society of Japan“. According to the result of prediction, it is presumed that noise level of several road side areas might exceed the standard due to increasing road traffic.
(2)Updating Social/Public Facilities
Due to alignment changes around the connection point between existing Arniko Highway and approach roads to the tunnel section, some social/public facilities, especially temples and shrines, are not to be relocated and directly affected by the project. Therefore, the number of these social/public facilities are updated with new road alignment. As a result, it has been confirmed that no temple and shrine might be affected by the project.

16-7
(3)Road side trees
Road side trees which have to be cut was estimated 423 trees in the former preparatory survey with former alignment. After introducing of tunnel option with new alignment around the approach roads, the number of tree required to be cut is estimated 484. These increasing of cutting tree, are confirmed based on the alignment change at the western approach road of tunnel and increasing number of 61 trees are all Masala (Eucalyptus spp).
(4)Other Supplemental and Following-up Issues
Some items required for a project of Category A were reviewed and discussed, such as, detail determination and examination of soil borrow pit, query, and soil disposal site, specific method of mitigation for pollution factors, monitoring format, and etc.
16.1.2.2 Results of Review on RAP
(1)Updating the number of PAPs
During the former JICA's preparatory study, RAP related surveys including Census was done in 2014-2015, and cut-off-date was once declared on 9 November 2014. More than three (3) years have been passed since the cut-off-date was declared. Considering the time progress and earthquake in 2016, additional Census was implemented during the additional survey to update the number of PAPs. The project considers the result of updated Census as a new cut-off-date (15 January, 2018) and households/people recorded at this timing are eligible for compensation/assistance. Because the new tunnel section with approach roads can avoid exiting structures along the existing highway, the number of affected structures is decreased. On the other hand, the approach roads require new private land acquisition, therefore, the number of land affected persons are increased. Following tables show comparison of the number of affected households and persons.
Table 16.1-4 Comparison of the Project Affected Households
Type of Loss
Number of Project Affected Household in
2014
Number of Project Affected Household in
2018 Legal Illegal Total Legal Illegal Total
Required for displacement 1. House Holds (Structure owners within the ROW) - 301 301 - 161 161
2. House Holds (Structure owners on private land) 35 - 35 73 - 73
3. Institutions (government offices*, etc.) - 18 18 2 8 10
Sub-Total 35 319 354 75 169 244
Not required for displacement 4. Land owner 25 - 25 40 - 40
Grand Total (1-4) 60 319 379 115 169 284 * Government offices, such as police box, are coordinated between government and government for relocation Source: Census/Socio-economic Survey, Jan-Feb 2015 Source: Census/Socio-economic Survey, Jan-Feb 2015 and updated Dec 2017-Feb 2018

16-8
Table 16.1-5 Comparison of the Project Affected Persons
Type of Loss
Number of Project Affected Persons in
2014
Number of Project Affected Persons in 2018
Legal Illegal Total Legal Illegal Total Required for displacement 1. House Holds (Structure owners within the ROW) - 1,836 1,836 - 864 864
2. House Holds (Structure owners on private land) 214 - 214 416 - 416
3. Institutions (government offices*, etc.) - 0 - - 0
Sub-Total 214 1,836 2,050 416 864 1,280
Not required for displacement 4. Land owner 152 - 152 208 - 208
Grand Total (1-4) 152 2,050 2,202 624 864 1,488 * Government offices, such as police box, are coordinated between government and government for relocation Source: Census/Socio-economic Survey, Jan-Feb 2015 Source: Census/Socio-economic Survey, Jan-Feb 2015 and updated Dec 2017-Feb 2018
(2)Updating of Replacement Cost and Project Cost
Replacement cost survey (RCS) plays important role to provide unit price of compensation and the RCS had been done in 2014 during the former JICA's preparatory survey. More than three (3) years have been passed since the RCS was implemented. Considering the time progress, the additional survey recommended updating of replacement cost and implemented RCS again with the latest market price and relevant conditions in January, 2018. As a result, after three years, unit cost of each compensation items has been increased due to economic growth of Nepal. Following table shows comparison of cost for compensation. Total estimated cost for resettlement became nearly 1.4 times comparing to past results, however, the reason is not only due to market price escalation but also increasing are of land acquisition by newly introduced approach roads to the tunnels.
Table 16.1-6 Resettlement Needed House/Structures
(CONFIDENTIAL)
16.1.2.3 Additional Stakeholder Meeting
In the former JICA's preparatory survey, stakeholder meeting was organized one time in two different places at the timing of draft scoping. Because the project is falling into category A of JICA's Environmental and Social Considerations, it is required at least two times of stakeholder meetings. To full fill the requirement, implementation of the second stakeholder meeting was supported by the additional study. Principally the participated people were positive to the project. The result is described in the following EIA part combined with the 1st stakeholder meeting. From following clauses, EIA and RAP is summarized as the whole project area including both additional tunnel section and other road sections which was mainly discussed in the former JICA's study.
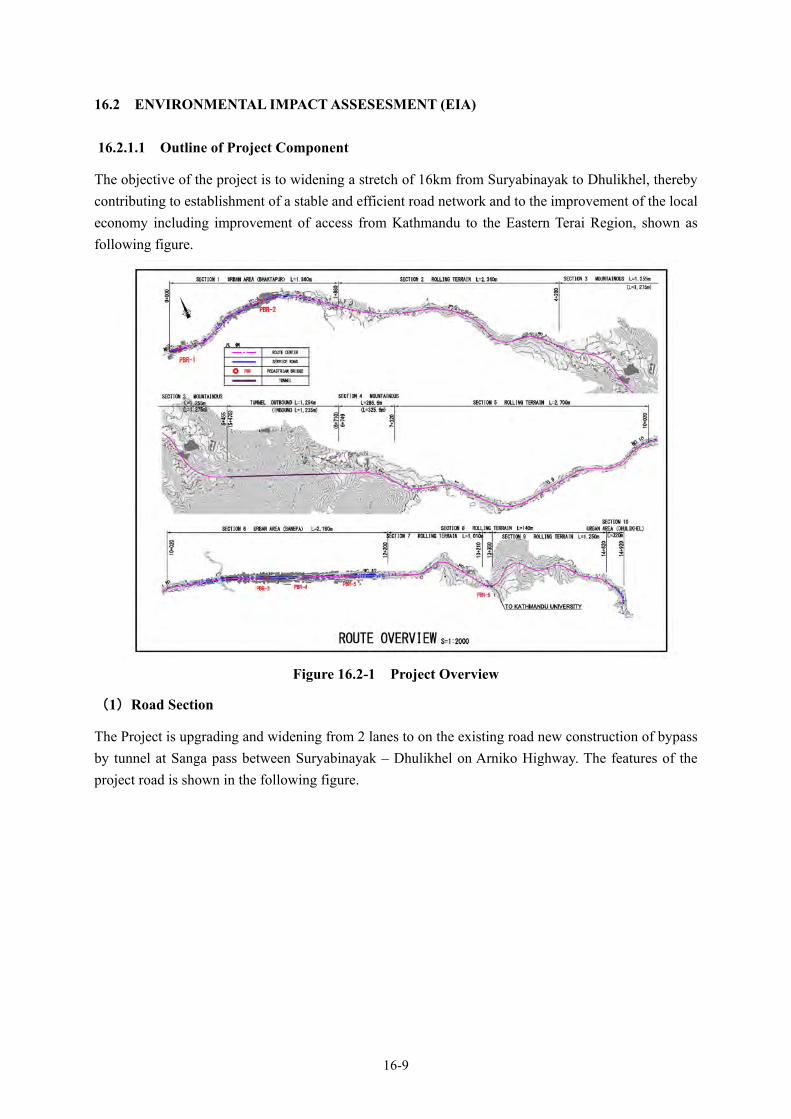
16-9
16.2 ENVIRONMENTAL IMPACT ASSESESMENT (EIA)
16.2.1.1 Outline of Project Component
The objective of the project is to widening a stretch of 16km from Suryabinayak to Dhulikhel, thereby contributing to establishment of a stable and efficient road network and to the improvement of the local economy including improvement of access from Kathmandu to the Eastern Terai Region, shown as following figure.
Figure 16.2-1 Project Overview
(1)Road Section
The Project is upgrading and widening from 2 lanes to on the existing road new construction of bypass by tunnel at Sanga pass between Suryabinayak – Dhulikhel on Arniko Highway. The features of the project road is shown in the following figure.

16-10
Table 16.2-1 Road Standard Applied
Project Suryabinayak – Dhulikhel Section of Arniko Highway Upgrading/Widening Project and Bypass construction
Development Region, Zone, Central Development Region, Bagmati Zone, Districts Bhaktapur Kavrepalanchowk Municipality Bhaktapur Municipality,
Suryabinayak Municipality Nasikasthan Sanga, Janagal, Banepa & Dhulikhel Municipality
Total Length Suryabinayak – Dhulikhel section 14.91 km (Including tunnel length around 1.24 km and 1.29 km)
Road Section Road Standard National Highway Standard of DOR Number of Lanes of Highway Carriageway 4 lanes (2 lanes for each direction) Number of Service Road Carriageway 2 lanes (1 lane for each direction) Design Speed 80 km/hr. / 60km/hr. *Sanga section Width of the Central Divider 3.5 m / 3.5 m Width of Paved Shoulder 3.0 m / 2.5 m Surface Type Asphalt Type of Work Upgrading including widening Pedestrian Crossing Overhead Bridge 6 locations Bridges, culverts 4 Bridge, 1 Culvert
Figure 16.2-2 Typical Cross-Section
(2)Tunnel Section
Key points for tunneling from the viewpoints of geological condition are as follows; • The tunnels (inbound tunnel and outbound tunnel) at the Sanga Pass are mostly planned in the direction
of northeast and southwest, and are around 1,300 m in length, • The result of field reconnaissance survey, the geology around the tunnel portals is assumed to be
strongly weathered and thick, • Detailed condition of weathered rock, spring water situation and geological profile are based on the
results obtained from geological surveys conducted under this Study. Most of national road tunnels in Japan have been constructed by New Austrian Tunneling Method (NATM), which is a standard construction method of mountain tunnels in the world. This method is applicable also in the case of the tunnel planned at Sanga Pass as geologically and topographically Sanga pass is mountainous. However, as the tunnel section is assumed to encounter fragile and weak layer of

16-11
rocks provision of auxiliary method will be necessary to secure stability of tunnel during excavation. Auxiliary methods will be planned necessarily. The Asian Highway Standard functionally classifies the tunnel section as “Class I” and applies a design speed of 60 km/h, as Sanga area is in a mountainous region. The geometric conditions in the following table will apply for the design works of the tunnel.
Table 16.2-2 Outline of Tunnel Design
16.2.2 EIA Outline in Nepal
Executing agencies have responsibilities on environmental management of development projects in Nepal. In the case of Ministry of Physical Infrastructure & Transport (MOPIT), Planning, Monitoring and Evaluation Division is in charge for approval of Initial Environmental Examination (IEE) and reviewing on EIA before submission to Ministry of Forests and Environment (MOFE). Department of Road under MOPIT has Geo-Environmental and Social Unit (GESU) which takes responsibilities on preparing IEE, EIA, and Project Affected People/Person (RAP).
According to “Environmental Protection Act (EPA), 1996”, development projects having potential environmental impacts require to conduct an Initial Environmental Examination (IEE) or Environmental Impact Assessment (EIA) prior to the implementation. “Environment Protection Rules (EPR), 1997” regulates processes and procedures of the IEE and EIA. Because the Project includes construction of new national highways, EIA is required for the implementation. EIA report is attached as Appendix-A.
16.2.3 Legal Framework on EIA / Environmental Standard
(1)Environmental Protection Act (1997) and Environmental Protection Rules (1996)
EPA includes policies on IEE/EIA in Nepal and supplemented by EPR for its implementation. EPR obliges the proponent to inform the public on the contents of the project proposal in order to ensure the participation of stakeholders. EPR elaborates provisions on the process IEE and EIA including scoping document (SD), terms of reference (ToR), information dissemination, public consultation and hearing, and environmental monitoring and auditing. Article 12 of the EPR requires the proponent to comply with the matters mentioned in the report and other conditions, if any, prescribed by the approving agency or concerned agency. Article 13 and 14 are related to environmental monitoring and

16-12
environmental auditing.
(2)Environmental and Social Management Framework, DOR, (2007)
This Environmental and Social Management Framework report (ESMF) is prepared for the DOR to compile in an overview and guidance manner, various safeguard and compliance aspects of environmental and social issues related with the Sector Wide Road Program and the Priority Investment Plan Study for Nepal’s Strategic Road Network (SRN) planning for 2007 to 2016. The ESMF intends to provide technical and managerial inputs and guidance into the design of the strategic roads, through identification of key environmental and social issues related to the foreseen projects (hereunder referred as “SRN sub-projects”), mitigate potential impacts and concerns and, devise opportunities to enhance the benefits. ESMF is applicable to all proposed subproject activities and through all stages of the subproject cycle, i.e. from pre-planning, planning and design, implementation to post-implementation. DOR applies ESMF for all related projects in Nepal to secure environmental and social considerations as the equivalent standard of international development partners, although ESMF is not legal document but internal framework on environmental and social management.
(3)National Environmental Standard
Environmental standards on ambient air (NAAQS), Water Quality and Noise Level are described as Table 16.2-3 to Table 16.2-5. These domestic standards in some items have more tolerance comparing to WHO's standard. Items of national standards, such as PM10, SO2, Ozone which are low if comparing international standard, such as WHO's, shall follow more strict international standard as monitoring indicator. For noise standard, it is almost same as Japanese environmental standard, 70dB in daytime and 65 dB in nighttime in maximum, at the area facing to trunk road.
Table 16.2-3 Air Quality Standards of Nepal (Environmental Standard)
Parameters Units Averaging time
Concentration Max. Test Method
WHO Air Quality
Guidelines (2005)
TSP (µg/m3) Annual -
24-Hours* 230 High Volume Sampling and Gravimetric Analysis -
PM10 (µg/m3)
Annual 20
24-Hours* 120 High Volume Sampling and Gravimetric Analysis, TOEM, Beta Attenuation 50
SO2 (µg/m3) Annual** 50 Ultraviolet Fluorescence West
and Gaeke Method -
24-Hours* 70 20
Nitrogen Dioxide
(µg/m3) Annual 40 Chemiluminescence 40
24-Hours* 80 Same as Annual -
CO (µg/m3) 8-Hours* 10,000 Non Dispersive Infra Red Spectrophotometer NDIR -
Lead (µg/m3) Annual** 0.5 High Volume Sampling, Atomic Absorption Spectrometry -

16-13
Parameters Units Averaging time
Concentration Max. Test Method
WHO Air Quality
Guidelines (2005)
Benzene (µg/m3) Annual** 5 Gas Chromatographic Technique -
PM2.5 (µg/m3) 24-Hours* 40 PM2.5 Sampling Gravimetric Analysis
Ozone (µg/m3) 8-Hours* 157 UV Spectrophotometer 100 *Note:24 hourly values shall be met 95% of the time in a year. 18 days per calendar year the standard may be exceeded but not on two consecutive days. **Note:24 hourly standards for NO2 and SO2 and 8 hours standard for CO are not to be controlled before MOFE has recommended appropriate test methodologies. Source: Collection of Environmental Standard (MOFE) and Environmental Standards in Japan
Table 16.2-4 Water Quality Standards of Nepal
S.N Parameters
Nepal Discharged Standards
(2001)
WHO Guidelines for
Drinking Water Quality (2004)
1 pH at 17oC 6.5-8.5 6.5-8.5
2 Total Suspended Solids, (mg/L) 30-200 500 maximum
3 Biological Oxygen Demand, (mg/L) 30-100 100 ppm
maximum
4 E. coli Count, (MPN Index /100 mL)
E. coli must not be detected in 95% of total
sample examined*
>1100
* Nepal National Drinking Water Quality Standards, 2005
Table 16.2-5 Noise Standards of Nepal
Area Permitted Noise Level (Leq dBA) Day Time Night Time
Industrial Area 75 70
Commercial Area 65 55
Rural Residential Area 45 40
Urban Residential Area 55 50
Mix Residential Area 63 55
Protected Area 50 40
Maximum Noise level permission by Residential Equipment
S.N Equipment Max. Noise Level (Leq dBA) 1 Water Pump 65
2 Diesel Generator 90
3 Entertainment Equipment 70 Source: Collection of Environmental Standard (MOFE), Nepal

16-14
16.2.4 EIA Approval Procedures
EIA approval procedures for a specific project based on EPA and EPR are shown as followings;
A. Step 1
(1) DOR disclose project outline with possible impact (2) Opinion collection from relevant bodies (including Public Participation) (3) MOPIT prepare Scoping Document (SD) and Terms of References (TOR) for EIA survey (4) MOPIT submit SD and TOR to MOFE
B. Step 2
(1) MOFE reviews SD and TOR (2) MOFE approves SD and TOR after coordination with MOPIT (3) Determination of scope of EIA Survey
C. Step 3
(1) EIA survey implementation by DOR (2) Draft EIA Report (3) Public Consultation Meeting (4) Finalization of EIA Report
D. Step 4
(1) DOR Submit EIA Report to MOPIT
E. Step 5
(1) MOPIT reviews EIA report (21 Days) (2) MOPIT submit EIA report to MOFE (3) MOFE reviews EIA report (from 60 to 90 Days) (4) Public disclosure of EIA report in English with Nepali summary at MOFE, DOR, local government (Municipalities), libraries where the residents along the project sites are accessible (for 30 Days) (5) Opinion collection from local government, if any (6) Approval and implementation (7) Disclosure of EIA report on DOR Website
16.2.5 Scoping Results
Based on the relevant environmental surveys, especially the former JICA's preparatory survey and the review committee for Environmental and social considerations, the potential environmental and social impacts of the project are determined as shown in Table 16.2-6.

16-15
Table 16.2-6 Scoping Results
No. Impact Item
Assessment
Reason / Remarks Pre-
Construction Phase
Construction Phase
Operation Phase
Pollution
1 Air pollution B- B±
Construction Phase: Operation of construction equipment will generate dust and
emission gas. Traffic congestion in construction site will cause increase in
exhaust gas from vehicles. Dust will occur in borrow pit and quarry site. Operation Phase: In the future, total amount of air pollutant caused by vehicle
exhaust gas will increase. However, because of improved traffic efficiency, the
amount may be reduced compared to without project. Exhaust gas may increase around the entrances of tunnel
2 Water pollution B- C
Construction Phase: Turbid water caused by construction works, especially
bridge constructions, is likely to affect existing surface water resources.
In case of inadequate management in borrow pit and quarry site, turbid water from borrow pit and quarry site by rainfall may cause surface water contamination.
Operation Phase: Soil runoff due to heavy rain may occur in filling or steep
slope sections and turbid water may cause surface water contamination.
In case of inadequate management or recovery in borrow pit and quarry site, turbid water from borrow pit and quarry site by rainfall may cause surface water contamination.
3 Waste B- C
Construction Phase: Construction waste caused by construction works and
general waste from construction office will be generated. In case that soil from construction site is not appropriately
disposed, around the area of construction site and soil disposal site may be contaminated.
Operation Phase: Illegal dumping of solid waste may increase along newly
set parking spaces on road shoulder.
4 Soil pollution D D
Construction Phase: Soil pollution is unlikely as materials that could cause
pollution will not be used during construction. Operation Phase: Soil pollution is unlikely as materials that could cause
pollution will not be used during maintenance.
5 Noise and vibration B- B-
Construction Phase: Construction works is likely to increase noise and vibration
level. Noise and vibration will occur in borrow pit and quarry site. Operation Phase: In the future, noise and vibration level caused by vehicle
driving will increase. However, because the distance between roadside and carriage way will be widened due to newly installed service road and footpath the level on road side may be reduced compared to without project.

16-16
No. Impact Item
Assessment
Reason / Remarks Pre-
Construction Phase
Construction Phase
Operation Phase
6 Ground subsidence C C
Construction Phase: Subsidence due to fill loading may occur. Subsidence due to water drainage of tunnel drilling Operation Phase: Leaking water from tunnel and drainage may cause
subsidence
7 Offensive odors D D
Construction Phase: Impact of offensive odors from asphalt mixing plant will be
limited. Because materials and equipment to cause offensive odors
will not be used in the construction works, offensive odors are unlikely to occur.
Operation Phase: Because vehicles with incomplete combustion as offensive
odor sources are few, exhaust gas from vehicles is unlikely to cause offensive odor.
8 Bottom sediment C C
Construction Phase/Operation Phase: Because the construction works will not include dredging
works and drainage of wastewater containing heavy metal or high-level organic substances, impacts on bottom sediment are unlikely to occur.
Natural Environment
9 Protected areas D D Construction Phase/Operation Phase:
There are no protected areas in and around the project site.
10 Ecosystem B- D
Construction Phase: Roadside tree/vegetation will be lost by widening works. In
a mountainous section, tree cutting in a community forest may be required due to approach roads to the tunnel.
Agricultural/Aquatic ecosystem may be disturbed by construction works including road, tunnel, bridge and other facilities.
Turbid water caused by bridge construction is likely to affect aquatic life.
Operation Phase: Because the target road section mostly passes through well-
developed area such as agricultural land and urban area, considerable impacts on ecosystem are unlikely to occur. However, roadkill of animals is likely to increase due to increase in traffic lanes, more traffic volume and faster vehicle speed.
11 Hydrology C C
Construction Phase: Water flow in the river or stream may be altered during
construction works. Tunneling works may influence the flow of groundwater
and the groundwater level in the surrounding area, and amount of water from wells/springs may change.
Operation Phase: Water leaking from tunnel may cause impact on
groundwater.
12 Geographical features B- D
Construction Phase: Topography will be changed in the new road section and
mountainous areas. Tunneling works may change geographical conditions in
surrounding area Operation Phase: Impact on geographical features is unlikely to occur.
Social Environment

16-17
No. Impact Item
Assessment
Reason / Remarks Pre-
Construction Phase
Construction Phase
Operation Phase
13 Resettlement/Land Acquisition
A- D
Pre-Construction Phase: Linear improvement and widening of existing road and
construction of new alignment including the tunnel section will cause land acquisition and resettlement.
In case of new road construction, additional land acquisition will be required.
Construction Phase: Temporal lease of land and additional small scale
resettlement will be required. Operation Phase: Additional resettlement and land acquisition will not be
required.
14 Poor people B- D
Pre-Construction Phase/Construction Phase: Negative impact on poor people along the project area
except any impacts due to land acquisition and resettlement will be limited.
Operation Phase: Impact only on poor people is unlikely to occur because
there is not any changes for existing road traffic system, and charging system (toll gate) on improved road is not introduced.
15
Ethnic minorities and indigenous peoples
D D
Construction Phase/Operation Phase: Because of improvement project of existing main road,
impact on culture and lifestyle of ethnic minorities is unlikely to occur.
16
Local economies, such as employment, livelihood, etc.
B± B±
Pre-Construction Phase: Land acquisition and resettlement may cause livelihood
degradation of Project Affected Persons (PAPs). Construction Phase: Construction will create job opportunities to local people. Operation Phase: Reduction of travel time will contribute to local economies
and promote tourism. Road widening and faster vehicle speed will make it more
difficult to access to social services and infrastructure.
17 Land use and utilization of local resources
B- B+
Construction Phase: In case of new road construction, land use, mostly
agricultural land and residential area, will be shifted to Right of Way.
Operation Phase: Land use along the target road section will change and
achieve economic and social development. Improved transportation will contribute to effective
utilization of local resources.
18 Water usage B- C
Construction Phase: Existing agricultural canals located in roadside will be
affected by widening works. Water-use around the construction site/yard may affected
by water from that areas Operation Phase: Water from tunnel may cause impact on water usage around
the area.

16-18
No. Impact Item
Assessment
Reason / Remarks Pre-
Construction Phase
Construction Phase
Operation Phase
19
Existing social infrastructures and services
B- B±
Pre-Construction Phase: Relocation or protection of existing utilities, such as electric
poll, water pipe and optical fiber cable will be required. Construction Phase: Temporary traffic congestion in and around construction
site will occur. Operation Phase: Access to social services will be improved. On the other hand, road widening and faster vehicle speed
will make it more difficult to access to social infrastructure and may cause split of local communities or widening disparity.
20
Social institutions such as social infrastructure and local decision-making institutions
B- B-
Construction Phase/Operation Phase: Because of improvement project of existing road,
considerable impact on social institutions is unlikely to occur.
Road widening including service road and faster vehicle speed will make it more difficult to access to social services and infrastructure, and may cause split of local communities or widening disparity.
21 Misdistribution of benefits and damages
C D
Pre-Construction Phase/Construction Phase: Misdistribution of benefit among PAPs may occur. Operation Phase: Because of improvement project of existing main road,
considerable impact on misdistribution of benefit is unlikely to occur.
22 Local conflicts of interest
D D Construction Phase/Operation Phase: Because of improvement project of existing main road,
considerable impact on local conflict is unlikely to occur.
23 Cultural heritage B- D
Pre-Construction Phase/Construction Phase: There are two pipal trees along the target road section.
Depending on widening works, impacts on these cultural properties will occur.
Operation Phase: Because of improvement project of existing main road,
considerable impact on religious value is unlikely to occur.
24 Landscape B- D
Construction Phase: Road site trees and forest area, which create particular
scenery, will be lost by widening works. Operation Phase: Because there are no protected scenic view areas,
considerable impact on landscape is unlikely
25 Gender D D Construction Phase/Operation Phase: Women workers may be discriminated or sexually harassed
by male workers and have different wage scale from male workers.
26 Children’s rights B- B-
Operation Phase: Construction mobilization may cause child labor issue Operation Phase: Access to public facilities can be hindered due to increasing
traffic

16-19
No. Impact Item
Assessment
Reason / Remarks Pre-
Construction Phase
Construction Phase
Operation Phase
27 Infectious diseases such as HIV/AIDS
B- D
Construction Phase: Infection risks of HIV/AIDS may be increased among
construction workers and local business offering food and entertainment.
Operation Phase: Being an improvement project of existing road in developed
areas, considerable impact on infectious diseases is unlikely.
28
Working conditions (including occupational safety)
B- D
Construction Phase: Dust and emission gas may affect workers health. Sanitary conditions around construction site may get worse
due to waste from workers and toilet. Operation Phase: Considerable impact on working conditions unlikely
Other
29 Accidents B- B±
Construction Phase: Labor accidents may occur in construction site, especially
in tree cutting, slope protection and bridge construction works.
Traffic accident may occur at construction site Operation Phase: Traffic safety including pedestrians will be improved by
road widening and vehicle separation Traffic accident due to more traffic volume and faster
vehicle speed may increase ratio of traffic accident. In the tunnel section, car trouble, car accident, vehicle fire,
emergency cases may happen
30
Trans-boundary impacts or climate change
B- B±
Construction Phase: Trans-boundary impacts including climate change will not
occur. Operation of equipment will generate CO2. Operation Phase: CO2 emission from vehicles will increase in future. However, improved traffic efficiency may reduce.
A+/-: Significant positive/negative impact is expected B+/-: Positive/negative impact is expected to some extent C: Extent of positive/negative impact is unknown. (A further examination is needed, and the impact could be clarified as the
study progresses) D: No impact is expected * Impact Items referred from “JICA Guidelines for Environmental and Social Considerations April 2010”
16.2.6 TOR for EIA Surveys
TOR for EIA Surveys and draft scoping was developed based on past IEE and EIA surveys related to the project. Principle items and measures of surveys are shown in Table 16.2-7.
Table 16.2-7 Outline of TOR for EIA Survey
No. Impact Items
Assumed Impact Level*
Survey Items Survey Measures Pre-Construction/Construction
Operation
Pollution 1 Air pollution B- B±
1. Ambient air 2. Standards
・Existing material survey ・ Measurement of
NO2 ,SPM, SOx

16-20
No. Impact Items
Assumed Impact Level*
Survey Items Survey Measures Pre-Construction/Construction
Operation
2 Water pollution
B- C
1. Surface water quality
2. Standards
・Existing material survey ・Measurment of surface
water ・ Confirmation of
construction methods 3 Waste
B- C 1. Waste disposal
arount the construction area
・Existing material survey ・ Interview Survey ・ Soil Analysis
5 Noise and Vibration
B- B-
1. Level 2. Standard 3. Location of public
facilities
・Existing material survey ・Measurment of present
level * Only for noise and baseline o fvibration will be measured in Detailed Design Phse
・ Confirmation of construction methods
6 Ground subsidence
C C
1. Geology, Soil, Ground
・ Natural Condition Survey
・ Confirmation of construction methods
8 Bottom sediment
C C
1. Geography、Soil 2. Meteorology
・ Natural Condition Survey
・ Confirmation of construction methods
Natural Environment
10 Ecosystem
B- D
1. Local ecosystem 2. Forestry Area 3. Procedures for
cutting tree
・ Field survey ・Existing material survey ・ Interview survey ・ Past practices survey
11 Hydrology C C
1. Construction impact 2. Water use
・ Interview survey ・ Past practices survey
12 Geographical features
B- D
1. Geography、Soil 2. Construction impact
・ Natural Condition Survey
・ Confirmation of design and construction method
・ Past practices survey Social Environment
13 Resettlement/Land Acquisition
A- D
1. Degree of resettlement
2. Resettlement Action Plan (RAP)
・ Legal framework ・ Socio-economic Survey ・ Replacement Cost
Survey ・ Interview Surve ・ Stakeholder Meeting ・ Focus Group Discussion ・ Past practices survey
14 Poor people
B- D
1. Living standard ・ Socio-economic Survey ・ Exisitng material survey ・ Stakeholder Meeting ・ Focus Group Discussion ・ Past practicies survey
16 Local economies, B± B± 1. Living standard ・ Socio-economic Survey

16-21
No. Impact Items
Assumed Impact Level*
Survey Items Survey Measures Pre-Construction/Construction
Operation
such as employment, livelihood, etc.
2. Socio-economic status of the region
3. Impact due to road widening
・ Exisitng material survey ・ Field survey ・ Stakeholder Meeting ・ Focus Group Discussion ・ Past practicies survey
17 Land use and utilization of local resources
B- B+
1. Land use along the road
2. Socio-economic status of the region
・Interview survey ・ Exisitng material survey ・ Field survey ・ Past practicies survey
18 Water usage
B- C
1. Surface water use 2. Common water
resources
・Interview survey ・ Exisitng material survey ・ Field survey (ground
water level) ・ Past practicies survey
19 Existing social infrastructures and services
B- B±
1. Utilities along the road
2. Road crossing 3. Impact due to road
widening
・Interview survey ・ Exisitng material survey ・ Field survey ・ Past practicies survey
20 Social institutions such as social infrastructure and local decision-making institutions
B- B-
1. Road crossing 2. Impact due to road
widening
・ Field survey ・ Past practicies survey
21 Misdistribution of benefits and damages
C D
1. Living standard 2. RAP
・ Socio-economic Survey ・ Exisitng material survey ・ Past practicies survey
23 Cultural heritage B- D
1. Cultural and religious structures along the road
・ Field survey ・ Interview survey
24 Landscape B- D
1. Road side trees 2. Procedures for
cutting trees
・ Field survey ・ Exisitng material survey ・ Interview survey
26 Children’s rights B- B-
1. Pedestrian 2. Impact due to road
widening
・ Field survey ・ Past practicies survey
27 Infectious diseases such as HIV/AIDS
B- D
1. Worker's health ・ Interview survey ・ Past practicies survey
28 Working conditions (including occupational safety)
B- D
1. Working Environment
・ Interview Survey ・ Past practicies survey

16-22
No. Impact Items
Assumed Impact Level*
Survey Items Survey Measures Pre-Construction/Construction
Operation
Others 29 Accidents B- B±
1. Accidents during working
2. Traffic accident
・ Existing material survey ・ Interview Survey ・ Past practicies survey
30 Trans-boundary impacts or climate change
B- B±
1. Construction impact 2. Traffic demand
forecasting
・ Confirmation of construction methods
・ Tendency estimation of green house effect gas based on future traffic volume
A+/-: Significant positive/negative impact is expected B+/-: Positive/negative impact is expected to some extent C: Extent of positive/negative impact is unknown. (A further examination is needed, and the impact could be clarified as the
study progresses) D: No impact is expected * Assumed impact level was changed after environmental survey
16.2.7 Evaluation and Baseline of the Environmental and Social Condition
Based on the TOR of EIA survey, baseline surveys are implemented described as below.
16.2.7.1 Pollution
Air quality and water quality analysis, and noise level measurement along the target section of the project were carried out at different locations in 2014 and in 2018 at the time of additional survey, especially for the tunnel section. Locations of the measurement points are shown in the following figure.
Source: JICA Survey Team 2014
Figure 16.2-3 Survey and Sampling Points
(1)Air Pollution
The levels of particulate matter exceeded National Ambient Air Quality Standard in urban areas while
1 km
Air and Noise 3 (Banepa along SD road)
Air and Noise 1 (Bhaktapur city at 500m away from SD Road)
Air and Noise 2 (Bhaktapur along SD road)
Water Sampling 3 (Punyamati Khola)
Water Sampling 1 (Sipadole Khola)
Water Sampling 2 (Bikateshwor Mahadev Khola)
Air and Noise (West Portal of Tunnel)
Air an Noise (East Portal of Tunnel)
Sanga
Dhulikel
Tunnel Section
Air and Noise Water
Suryabinayak
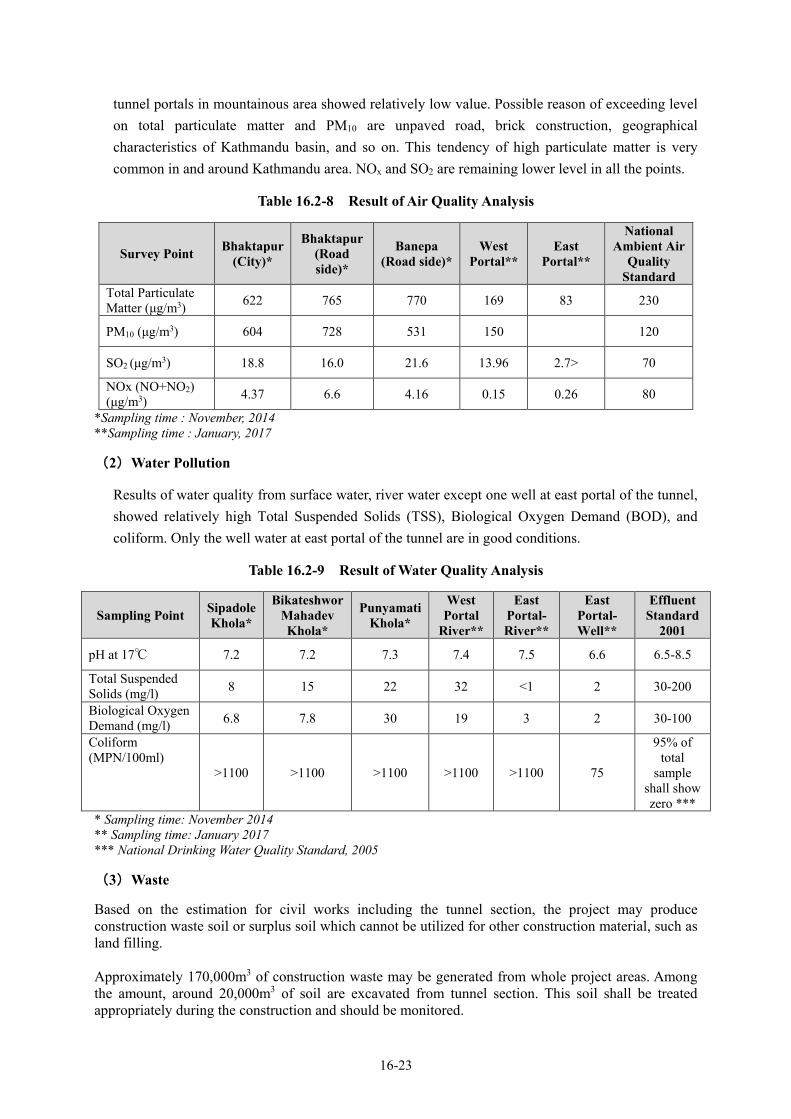
16-23
tunnel portals in mountainous area showed relatively low value. Possible reason of exceeding level on total particulate matter and PM10 are unpaved road, brick construction, geographical characteristics of Kathmandu basin, and so on. This tendency of high particulate matter is very common in and around Kathmandu area. NOx and SO2 are remaining lower level in all the points.
Table 16.2-8 Result of Air Quality Analysis
Survey Point Bhaktapur (City)*
Bhaktapur (Road side)*
Banepa (Road side)*
West Portal**
East Portal**
National Ambient Air
Quality Standard
Total Particulate Matter (μg/m3) 622 765 770 169 83 230
PM10 (μg/m3) 604 728 531 150 120
SO2 (μg/m3) 18.8 16.0 21.6 13.96 2.7> 70
NOx (NO+NO2) (μg/m3) 4.37 6.6 4.16 0.15 0.26 80
*Sampling time : November, 2014 **Sampling time : January, 2017
(2)Water Pollution
Results of water quality from surface water, river water except one well at east portal of the tunnel, showed relatively high Total Suspended Solids (TSS), Biological Oxygen Demand (BOD), and coliform. Only the well water at east portal of the tunnel are in good conditions.
Table 16.2-9 Result of Water Quality Analysis
Sampling Point Sipadole Khola*
Bikateshwor Mahadev Khola*
Punyamati Khola*
West Portal
River**
East Portal-River**
East Portal-Well**
Effluent Standard
2001
pH at 17℃ 7.2 7.2 7.3 7.4 7.5 6.6 6.5-8.5
Total Suspended Solids (mg/l) 8 15 22 32 <1 2 30-200
Biological Oxygen Demand (mg/l) 6.8 7.8 30 19 3 2 30-100
Coliform (MPN/100ml)
>1100 >1100 >1100 >1100 >1100 75
95% of total
sample shall show zero ***
* Sampling time: November 2014 ** Sampling time: January 2017 *** National Drinking Water Quality Standard, 2005
(3)Waste
Based on the estimation for civil works including the tunnel section, the project may produce construction waste soil or surplus soil which cannot be utilized for other construction material, such as land filling. Approximately 170,000m3 of construction waste may be generated from whole project areas. Among the amount, around 20,000m3 of soil are excavated from tunnel section. This soil shall be treated appropriately during the construction and should be monitored.

16-24
Other small scale waste from construction activities shall be disposed appropriately, however, there may not be happened any hazardous waste which is required special treatment at a treatment plant.
(4)Noise and Vibration
Jagati and Banepa shows the noise situation at these points recorded higher than national standard in both day and night time. Structures are relatively gathered and close to exiting road in these areas, therefore, the measured values of noise might be high because of car stopping, reflection from the structure, and other people's activities. Meanwhile, in the area of tunnel portals showed relatively low noise level because the area is located in mountainous region. Baseline data for vibration has not been recorded due to lack of equipment, therefore, during the Detailed Design and construction phases, selected consultant or contractor shall measure the baseline and following monitoring results by appropriate equipment.
Table 16.2-10 Sound Pressure Level of West and East Portal
Unit: dB (A)
S.N Noise Descriptors
Engineering College,
Bhaktapur
Jagati, Bhaktapur
Chadani Chowk, Banepa
West Portal
East Portal
Limit of GoN
1 Ld (Average day time) 68 79 79 53 48 63
2 Ln (Average night time) 53 73 74 48 42 55
3 Ldn (Average day and night
time) 67 81 82 56 56 70
Noise simulation (prediction) has been done by using the baseline data. According to the noise baseline survey, the levels along the target road are almost same as upper limit of standard or less than the standard. However, in the future, the noise levels may rise by the environmental standard due to increased traffic volume and speed. The cross-section between Sanga and Banepa, where there was no affection by noise from town area and 20m from carriageway, was targeted for the prediction by using following brief calculation method of LAeq under simple condition in "ASJ RTN-Model 2008 by The Acoustical Society of Japan“. Following table shows the results of prediction. L Aeq, T = 82.3 + 10 log 10 (1+3.47 q) – 10 log 10 l + 20 log 10 V + 10 log 10 NT+ 10 log 10 3.6/2T
- L Aeq, T : Equivalent continuous A-weighted sound pressure Level of time T (dB) - V : Vehicle speed (km/h) - T : Time (s) - NT : Traffic volume in time T (number) - l : Distance from carriageway to survey point (l) - q : Heavy vehicle ratio (< 1)

16-25
Table 16.2-11 Prediction Level of LAeq at the Point between Sanga to Banepa
Unit: dB (A) Time/Year 2017
(Present Situation)
2025 (Estimated Year
of Operation Commencement)
2035 (10 Years after Completion)
Limit of GoN
9 AM 65.4 67.2 68.2 63
2 PM 62.3 64.2 65.1 63
10 PM 55.8 57.7 58.5 55
According to the result of prediction, it is presumed that noise level of several road side areas might exceed the standard due to increasing road traffic.
(5)Ground Subsidence
It may cause ground subsidence during construction phase, because of construction method of land filling, heavy vehicle, and change of water flow, geological conditions, etc., even probability is not so certain. For these kinds of risks on environment, monitoring and countermeasures on time should be prepared to do.
(6)Bottom Sediment
Because the construction works will not include dredging works and drainage of wastewater containing heavy metal or high-level organic substances, impacts on bottom sediment are unlikely to occur.
(7)Soil
Soil sampling and laboratory examination was implemented to estimate impacts on soil disposal generated by construction. Major target of soil test was set around the tunnel areas including approach roads in both sides where most surplus soil will be generated. Sampling points are;
S1: Palanse Farming Land (West) Approach Road/ Top Soil S2: Western Portal of the Tunnel (Starting Point) Top Soil S3: Western Portal of the Tunnel Deeper Soil (50cm)/Starting Point S4: Eastern Portal of the Tunnel Outer Portal Side of Tunnel/Top Soil S5: Eastern portal of the Tunnel Outer Portal Side of Tunnel Deeper Soil (50cm) S6: Eastern Portal of the Tunnel (Farming Land)/ Top Soil S7: Soil Dumping Site/ Top Soil S8: Approach Road (Farm Land) Basghari
These sampling soils are to be targets of land-cutting and land filling during the construction. Following figures show the sampling location of soil test.

16-26
Source: Google Earth, JICA Survey Team 2014
Figure 16.2-4 Locations of Soil Sampling Point for Tunnel Portal
Source: Google Earth, JICA Survey Team 2014
Figure 16.2-5 Locations of Soil Sampling Point In addition to above soil sampling locations, other samples from boring cores are also examined at the laboratory. Samples from boring cores are;
(1) Surface Clay (2) Surface Phyllite (3) Hole No.1 (Weathered Rock) (4) Hole No.1 (Phyllite, BH1 [15-20m]) (5) Hole No.1 (Phyllite, BH1 [30-35m])

16-27
(6) Hole No.4 Phyllite and Sandstone [30-35m] These sampling rocks are to be targets of construction material for reuse and disposal at dumping site. As a result, soil and rock core tests did not show any critical situation of contamination in general. Description of each examined elements are as followings; 1) pH (soil test) All the soil sample except S2 shows acid soil, especially S3 and S5 gave stronger acid tendency. S3 and S5 are located at the forestry and their values, such as pH=4.1 and 5.0, are still in a range of general values of forest soil in Japan. 2) Organic Matter (soil test) Amount or percentage of organic matter in all sample are relatively low, especially with the soil sample from deeper location, such as S3 and S5. Because sampling material were small amount, therefore, large organic material, such as roots, are eliminated at the time of sampling. That is way the percentage of organic matter showed low. 3) Soil Composition/Texture (soil test) Soil composition is almost same in all samples. Silt and sand compose almost more than 90% of soil and rest parts are classified into clay. 4) Heavy Metals (soil test and rock core test) As a result of laboratory test, following heavy metals were not detected in all samples; Zinc, Chromium, Nickel, Arsenic, Mercury. Other substances, including Copper, Iron, Manganese, Lead, Cadmium, are detected with values under certain standard except Lead in several locations, if comparing to Soil Contamination Countermeasures Act, Japan (2002). The locations where the value of Lead shows higher than Japanese standard are S3 and S4 where the sampling points are located edge of the existing road, and samples from deeper rock core. The reason Lead exceeding the standard at S3 and S4 might be originated from consumed gasoline in past years, especially before non-Lead gasoline was introduced to Nepal. Following tables shows the results of laboratory analysis on each soil sample and comparing standard.

16-28
Table 16.2-12 Test Result of Soil Test
S.N Parameters Test Methods
Sample Sites
S1 S2 S3 S4 S5 S6 S7 S8 Soil Contamination Countermeasures Act, Japan (2002)
1 pH at 22oC, (1:1) pH Meter; J.M. & Ingram, J.S.I. / USDA 6.9 7.2 4.1 5.5 6.4 6.2 6.6 6.5 -
2 Organic Matter, (%)
Modified Walkey & Black, Anderson J.M & Ingram, J.S. I. / USDA/ FAO Bulletin No. 19
5.8 2.4 0.97 2.74 1.03 2.37 2.13 1.15 -
3 Texture Hydrometer; Anderson J.M. & Ingram, J.S.I
SL SL SL SL SL L SL SL - a. Clay, (%) 4.9 4.9 2.9 4.9 8.9 14.9 4.9 2.9 - b. Silt, (%) 47.4 47.4 37.4 43.4 49.4 41.4 43.4 39.4 - c. Sand, (%) 47.7 47.7 59.7 51.7 41.7 43.7 51.7 57.7 -
4 Copper, (µg/g)
AAS, FAO Fertilizer & Plant Nutrition Bulletin, 19
17.78 3.98 1.99 7.93 8 17 17.98 31.52 125*
5 Zinc, (µg/g) N. D. (<0.01)
N. D. (<0.01)
N. D. (<0.01)
N. D. (<0.01)
N. D. (<0.01)
N. D. (<0.01)
N. D. (<0.01)
N. D. (<0.01) -
6 Iron, (%) 0.98 0.88 0.93 1.18 1.22 1.14 1.03 0.82 -
7 Manganese, (µg/g) 142.46 183.47 276.98 107 358.34 232.22 317.82 337.08 -
8 Lead, (µg/g) 63.23 99.6 161.29 154.58 130.05 113.98 87.89 53.19 150 9 Cadmium, (µg/g) 29.64 19.92 23.89 25.76 28.01 33.01 37.95 43.34 150
10 Chromium, (µg/g)
N. D. (<0.01)
N. D. (<0.01)
N. D. (<0.01)
N. D. (<0.01)
N. D. (<0.01)
N. D. (<0.01)
N. D. (<0.01)
N. D. (<0.01) 250
11 Nickel, (µg/g) N. D. (<0.01)
N. D. (<0.01)
N. D. (<0.01)
N. D. (<0.01)
N. D. (<0.01)
N. D. (<0.01)
N. D. (<0.01)
N. D. (<0.01) -
12 Arsenic, (µg/g) SDDC, 2500 - As, C: APHA
N. D. (<0.01)
N. D. (<0.01)
N. D. (<0.01)
N. D. (<0.01)
N. D. (<0.01)
N. D. (<0.01)
N. D. (<0.01)
N. D. (<0.01) 150
13 Mercury, (µg/g) Cold Vapor AAS, 3112 B: APHA
N. D. (<0.0005)
N. D. (<0.0005)
N. D. (<0.0005)
N. D. (<0.0005)
N. D. (<0.0005)
N. D. (<0.0005)
N. D. (<0.0005)
N. D. (<0.0005) 15
* Value from "Soil Environmental Standard (1991)", Japan Note : N.D.: Not Detected, AAS: Atomic Absorption Spectrophotometer; APHA: American Public Health Association; FAO: Food and Agriculture Organization; SL: Sandy Loam; L: Loamy Soil; USDA: United State Department of Agriculture. Note: The analysis was carried out in oven dried sample where the gravimetric analysis was carried out at controlled temperature (20°C).

16-29
Remarks: The observed values of organic matter were found lesser than 2% in samples S3, S5 and S8. Whereas, sample S1 had high organic matter content (NARC, 2005). Except S3 the metal toxicity was predicatively low at observed pH value. The reported concentration of lead, cadmium and copper were predicatively natural in nature.
Table 16.2-13 Test Result of Rock Core Test
S.N Parameters Test Methods
Observed Values Soil Contamination Countermeasures Act, Japan (2002)
Surface Clay
Surface Phyllite
Hole No.1 Weathered Rock,
BH1(15-20)m
Hole No.1 Phyllite BH1
Hole No.4 Phyllite and Sandstone,
BH4,(30-35)m (35-40)m (30-35)m
1 Iron, (%)
Leaching & AAS, ASTM
C 25-11
0.87 0.93 1.09 0.92 0.2 1.09 -
2 Manganese, (µg/g) 180.04 182.27 374.57 87.94 558.31 190.47 -
3 Nickel, (µg/g)
N. D. (<0.01)
N. D. (<0.01) N. D. (<0.01) N. D.
(<0.01) N. D.
(<0.01) N. D. (<0.01) -
4 Cadmium, (µg/g) 33.6 42.02 36.04 47.86 38.01 46.06 150
5 Chromium, (µg/g)
N. D. (<0.01)
N. D. (<0.01) N. D. (<0.01) N. D.
(<0.01) N. D.
(<0.01) N. D. (<0.01) 250
6 Zinc , (µg/g) N. D. (<0.01)
N. D. (<0.01) N. D. (<0.01) N. D.
(<0.01) N. D.
(<0.01) N. D. (<0.01) -
7 Lead, (µg/g) 61.26 108.04 118.12 87.74 186.04 172.24 150
8 Copper, (µg/g) 47.43 40.02 20.02 31.9 22 68.1 125*
9 Arsenic , (µg/g)
SDDC, 3500 - As, C: APHA
N. D. (<0.01)
N. D. (<0.01) N. D. (<0.01) N. D.
(<0.01) N. D.
(<0.01) N. D. (<0.01) 150
10 Mercury, (µg/g)
Cold Vapor AAS, 3112 B:
APHA
N. D. (<0.000
5)
N. D. (<0.0005) N. D. (<0.0005) N. D.
(<0.0005) N. D.
(<0.0005) N. D.
(<0.0005) 15
* Value from "Soil Environmental Standard (1991)", Japan Note: The analysis was carried out in oven dried sample where the gravimetric analysis was carried out at controlled temperature (20°C). Note : AAS: Atomic Absorption Spectrophotometer; ASTM: American Society for Testing; APHA: American Public Health Association; Remarks: The potential heavy metals (arsenic, chromium, mercury, zinc and nickel) were absent in the tested samples. The percentage abundance of iron minerals were at about 1%. The dominant lead, cadmium and copper minerals were common in the tested samples.

16-30
16.2.7.2 Natural Environment
(1)Protected Areas
There are no protected areas in and around the target section of the project. The distance between Suryabinayak (Bhaktapur) and Shivapuri National Park that is the nearest protected area is more than 10 km. Therefore, the project will not pause impact on any protected areas.
Source: Google Map
Figure 16.2-6 Location Map of the Nearest National Park and the Project Site
(2)Ecosystem: Fauna and Flora
Local people and concerned authority personnel from Suryamul Perunge Community Forest, the District Forest Office, Forest Range-post Office, were contacted to collect information on fauna and flora. According to the local people, it has just observed some kinds of frogs, snakes, and several kinds of wild birds in the exact project area that is very common around the region. However, there are some species living around the neighboring mountains. Possible ecosystem of surrounding areas is as shown in items and tables below;
1)Non Timber Forest Product (NTFP)
Regarding NTFP, there were very few significant species reported. The NTFP reported within the Suryamod Community Forest and on the surrounding area of project site with their uses are in the following table.
Shivapuri National Park
Project Site
Tunnel Section
5km

16-31
Table 16.2-14 List of NTFP found around Suryamod Community Forest and along the Project Area
Local Name Scientific Name Use, Purpose IUCN* NPWC Act*
Kafal Myrica esculenta Food (fruit), medicine - - Mayal Pyrus pashia Food (fruit), medicine, fodder - - Jamun Syzygium cumuni Food (fruit), fodder - - Ainselu Rubus ellipticus Sm Food (fruit) - - Taru bans Bambusa nutans Basketry, crafts, mat boards and flooring tiles.
Occasionally in house construction. - -
Ban negalo Drepanostachyum khasianum
Basketry, crafts. Occasionally in house construction.
- -
Narkat Phragmites maxima Basketry, crafts. Occasionally in house construction.
- -
Khar Imperata cylindrical Occasionally in house construction (roofing). Medicine
- -
Amriso Thysanolaena maxima Broom - - Tetapati Artemisia vulgaris Tea, flavor - -
"-" : Not Applicable Source: Field Survey, EIA Study Team, 2018
2)Faunal Species
Mammals like ban biralo (Felis chaus), kharayo (Ochotona nepalensis), dumsi (Hystrix indica), Ratuwa Mriga (Muntiacus muntjak), and syal (Canis aureus) were reported found in the surrounding forest of the project area. These animals do not have their permanent habitat on and around the Project area but have been sported and seen by the community forest user personals as they commute. Based on their information it is known that these wild animals pass and move around from the surrounding forest to the Project area.
Table 16.2-15 List of Faunal Species reported in and around the Suryamod Community Forest
Local Name Common Name Scientific Name IUCN NPWC Act Syal Jackal Canis aureus indicus - - Chituwa Leopard Panthera pardus - - Ratuwa Mriga Common Deer Muntiacus muntjak - - Badel Wild boar Sus scrofa - - Kharayo Hare Lepus - - Ban Biralo Wild Cat Felis chaus - - Dumsi Porcupine Hystrix brachyura - - Chamero Painted Bat Kerivoula picta - - Nyauri Musa Common Mongoose Herpestes edwardsi - - Squirrel Mauri Musa Sciuridae - -
"-" : Not Applicable Source: Field Survey, EIA Study Team, 2018

16-32
3)Birds
Regarding birds, ban kukhura (Gallus gallus), chil (Spizaetus nepalensis) chyakhura (Perdix hodgsoniae), dhukur (Streptopelia senegalensis), jureli (Hypsipetes sp.), teetra (Francolinus francolinus) and kalij (Lophura leucomelana) were found.
Table 16.2-16 List of Major Birds Species reported in and around Suryamod Community Forest and along the Project Area
Local Name Common Name Scientific Name IUCN NPWC Act Munal Crimsom-horned Pheasant Tragopan satyra - - Mayur Indian Peafowl Pavo cristatus - - Dhukur Spotted Dove Streptopelia chinensis - - Ban Kukhura Jungle Fowl Gallus - - Suga Rose-Ringed Parakeet Psittacula krameri - - Maina/ Saarung Mayna Acridotheres Tritis - -
Bhagera Sparrow Passer domesticus - - Battai Common Quail Coturnix - - Lato kosero Spotted Owlet Athene brama - - Lampuchhre Common Green Magpie Cissa chinensis - - Jureli Red-vented Bulbul Pycnonotus cafer - - Rani chari Scarlet Minivet Pericrocotus flammeus - - Chil Kite Spizaetus nepalensis - - Kalij kalij pheasant Lophura leucomelana - -
"-" : Not Applicable Source: Field Survey, EIA Study Team, 2018
4)Amphibian, Reptiles and Aquatic Life
Some of the aquatic life present in the small streams are Asala (Schizothoraichthys progastus), Budhuna (Garra sp), Hile (Channa sp.), katle (Neolissocheilus hexagonolepis) and Frog (Rana Tigrina) and reptile like Rat snake (Pantherophis Obsoletus), Grass snake (Natrix natrix) is also found in project area. Insects like Fulvous Forest skimmer (Neurothemis fulvia), Lemon Pansy (Junonia lemonias), Ant (Peekhamian Mimicry), Grasshopper (Caelifera), Macdunnoughia Tetragona (Macdunnoughia (Puriplusia) Tetragona), Lynx Spider (Pescetia Viridans). All above species are not recorded in IUCN's Red List. In addition, field observation was done along the proposed alignment, especially the area of approach roads to the tunnels. The habitat is almost cultivated as narrow step-like farmland along the stream, and there are only small glass and flowers, such as rape blossoms except river-bank trees which is surveyed as trees and forest in following part. Stream is very steep and water depth is also shallow, therefore not aquatic creatures like fish has not been observed. As a result, it has not been reported/observed any endangered species around the project site.
(3)Ecosystem: Trees and Forest

16-33
1)Roadside Trees along Suryabinayak – Dhulikhel Road (without the tunnel section)
The total numbers of 484 road side trees are required to be cleared by road widening and alignment improvement of the project excepting the additional section of tunnel and its approach roads. The list of roadside trees are shown in Table 16.2-17. For cutting some religious trees, Pipal, along the project road, it has not been observed any opposing opinion from residents and it is common to cut such trees for road improvement project in Nepal.
Table 16.2-17 Road-side Trees Affected
No. Local Name Scientific Name Nos. of Trees Total Trees Pole Size Tree Size 1 Utish Alnus nepalensis 59 - 59 2 Kangiyo Grevillea robusta 32 320 352 3 Bakaino Melia azederach - 4 4 4 Masala Eucalyptus spp 25 38 63 5 Pipal Ficus religiosa 2 2 4 6 Rudraksha Elaeocarpus ganitrus 0 1 1 7 Bel Aegle marmelos 0 1 1
Sub- Total 118 366 484 Total 484
Source: Field Study, Jan. 2018
2)Suryamode Perunge Community Forest (SPCF)
The mountainous section at Sanga, the tunnel and approach road section, runs through a limited forest zone. A part of this forest zone has been reignited as Suryamode Perungo Community Forest (SPCF) (21.87 ha) (Figure 16.2-7). There are approximately 200 members associated with this community forest at present.
Source: JICA Survey Team 2014
Figure 16.2-7 Location of Community Forest Zone
The construction of west portal of the tunnel may cause a limited part of forest clearance, and
Tunnel Section

16-34
approximately, 163 trees are to be cleared from SPCF which are of different species dominated by Salla and Mauwa, and these species are not registered as endangered species (Table 16.2-18).
Table 16.2-18 The List of Cutting Tree at Suryamode Perunge Community Forest
S.N Location Name of Forest
Local Name Scientific Name Nos. of Trees Total Trees Pole Size Tree Size
1 West
portal of tunnel
Suryamode Perunge
Community Forest
Lapsi Choerospondias axillaris 0 9 9
Mauwa Engelhardtiaspicata 0 70 70
Salla Pinusroxburghii 54 18 72
Uttis Alnus nepalensis 7 3 10
Chilaune Schimawallichii 0 2 2 Total Trees of Community Forest at West Portal 61 102 163
Source: Field Study, Jan. 2018
As indicated in the 'Work Procedure for Providing the Forest Land for Other Use (2007) and Forest Act (1993), project proponent who clears the forest trees shall manage a nursery to grow tree sapling and plant them in 1:25 ratio with additional 10 percent for each cleared tree. After discussion with the Community Forest Users Group (CFUG) and chairperson of SPCF, the replantation area for the compensatory plantation of around 4,500 saplings can be implemented at Block No. 5 of Suryamode Perunge CF, which lies above the existing Arniko Highway of Palanse. Alternatively, location is also available at Block No. 2 of the same community forest at Dalledhunga, Bhaktapur. CFUG in Nepal has important role to protect forest and keep local livelihood at the same time in sustainable way. CFUG is a democratic organization and there are around 14,500 groups in nation-wide. Members of CFUG have good skills for planting and growing trees in general. DOR will monitor the replantation activities through progress report from CFUG, and will take necessary countermeasures by cooperation with Department of Forest, if needed.
Possible replantation species are common native trees around the area. The common species found around the community forest are shown as Table 16.2-19.
Table 16.2-19 Tree Species around Community Forest
Location Local Names Scientific Name Remarks (DBH*>30cm = Tree,
DBH 10-30 cm = Poles)
Palanse Area
Salla Pinus roxburghii Tree Uttis Alnus nepalensis Tree and Pole Bakaino Melia azedarach Tree Mauwa Engelhardtia spicate Tree Chilaune Schimawallichii Tree and Pole
Sanga Area
Uttis Alnus nepalensis Tree and Pole Lapsi Choerospondias axillaris Tree Salla Pinusroxburghii Tree and Pole
*DBH: Diameter at Breast Height, Source: Field Study, Jan. 2018

16-35
3)Private Trees The new approach road alignment passes through some private land where some trees exists, which are owned by individual people. Details of the trees to be cleared, location and ownership are given in the following Tables.
Table 16.2-20 Private Trees to be Cut at Western Portal
Location Owner Local Name Scientific Name Nos. of Trees Total
Trees Remarks Pole Size Tree Size Palanse, Dovan to
Bagar Khola
Deep Bahadur K.C
Uttis Alnusnepalensis 36 6 42
Need appropriate
compensation
HadiBel Aegle sp. 4 - 4 Mayal Pyruspashia 2 2
Palanse, Above Bagar
Khola
Kumar Ranamagar
Uttis Alnusnepalensis 16 4 20
Lapsi Choerospondiasaxillaris 2 - 2
Palanse, West portal
Sanu ThapaMagar Uttis Alnusnepalensis 10 2 12
Total 70 12 82 Source: Field Study, Jan. 2018
Table 16.2-21 Private Trees to be Cut at Eastern Portal
Location Owner Local Name Scientific name Nos. of Trees Total
Trees Remarks Pole Size Tree Size Behind Nashika Gauri Nuchhe
Pradhan Uttis Alnusnepalensis 0 6 6
Need appropriate
compensation
Behind Nashika RajaramDulal Uttis Alnusnepalensis 1 5 6 Chilaune Schimawallichii 0 1 1
Behind Nashika SanubabuDulal Uttis Alnusnepalensis 4 7 11 South of Steel Tank Factory AngadKhadka Uttis Alnusnepalensis 6 6 12
South of Steel Tank Factory Badri Joshi Uttis Alnusnepalensis 6 3 9
Total 17 28 45 Source: Field Study, Jan. 2018 These trees which are to be cleared from the private land are to be compensated after discussion with the owner according to the size and mass of the cleared species at the prevailing market price.
4) Summary of Total Trees to be cut
Including above mentioned community forest, the total number of 774 trees are required to be clear for the project as shown in the table below.
Table 16.2-22 Summary of Total Trees to be cut by the Project
Total Trees
Road-side Trees 484 Suryamode Perunge Community Forest 163 Private Trees at Palanse Area 82 Private Trees at Nashika Area 45
Total 774 Source: Field Study, Jan. 2018

16-36
(4)Hydrology
Tunneling works may influence the flow of groundwater and the groundwater level in the surrounding area, and amount of water from wells/springs may change. Water leaking from tunnel may cause impact on groundwater, even above-mentioned probability is not so certain. For these kind of risks on environment, monitoring and countermeasures on time should be prepared to do.
(5)Geographical Features
Topography will be changed in the new road section and mountainous areas, especially in the section of tunnel and its approach roads where the original geography will be cut or filled by construction. In terms of not only geographical features, but also land acquisition, these kind of geogpraphically affected areas are avoided and minimized during designing process and may compensated and/or recovered by slope protection with necessary drainage facilities, and so on.
16.2.7.3 Social Environment
(1)Resettlement and Land Acquisition
Social impacts focusing on land acquisition and resettlement are surveyed and discussed in the Resettlement Action Plan (RAP). Based on the surveys, the project cause large scale of involuntary resettlement and land acquisition. RAP also includes survey items of EIA, such as Poor people, Local economies, land use and utilization of local resources, existing social infrastructures and services, social institutions, misdistribution of benefits and damages. Baseline data and mitigation measures and/or compensation/assistance policy are developed in RAP.
(2)Poor People
Poor people may be affected if they become the target of resettlement during pre-construction phases. According to the baseline survey, 36 households will be considered as vulnerable group with conditions of poor and/or any other risk factors. RAP considers these people under poverty line including women-headed household, handicap-headed household, etc., as targets of special assistance, such as income restoration program.
(3)Ethnic composition
Although there was observed several different ethnics along the project site, the situation is very common in Nepal. According to instruction from MOFE and based on past project cases, the Project does not need to prepare ingenious people plan. The situation had been confirmed by relevant authorities in MOFE and DOR and the authorities confirmed unnecessity of indigenous people plan based on their past experiences.
(4)Local economies, such as employment, livelihood, etc.
Land acquisition and resettlement cause minus impact on local economies during pre-construction and construction phases. These limited minus impact shall be rehabilitated by compensation and assistance
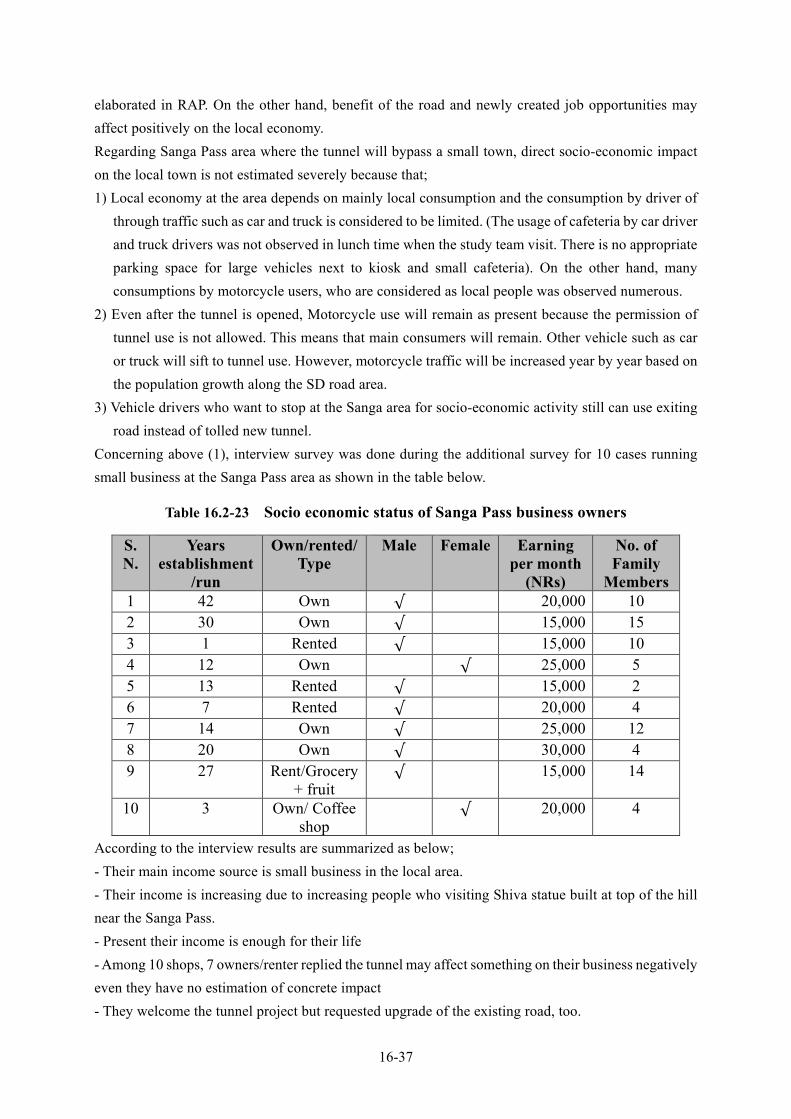
16-37
elaborated in RAP. On the other hand, benefit of the road and newly created job opportunities may affect positively on the local economy. Regarding Sanga Pass area where the tunnel will bypass a small town, direct socio-economic impact on the local town is not estimated severely because that; 1) Local economy at the area depends on mainly local consumption and the consumption by driver of
through traffic such as car and truck is considered to be limited. (The usage of cafeteria by car driver and truck drivers was not observed in lunch time when the study team visit. There is no appropriate parking space for large vehicles next to kiosk and small cafeteria). On the other hand, many consumptions by motorcycle users, who are considered as local people was observed numerous.
2) Even after the tunnel is opened, Motorcycle use will remain as present because the permission of tunnel use is not allowed. This means that main consumers will remain. Other vehicle such as car or truck will sift to tunnel use. However, motorcycle traffic will be increased year by year based on the population growth along the SD road area.
3) Vehicle drivers who want to stop at the Sanga area for socio-economic activity still can use exiting road instead of tolled new tunnel.
Concerning above (1), interview survey was done during the additional survey for 10 cases running small business at the Sanga Pass area as shown in the table below.
Table 16.2-23 Socio economic status of Sanga Pass business owners
S.N.
Years establishment
/run
Own/rented/ Type
Male Female Earning per month
(NRs)
No. of Family
Members 1 42 Own √ 20,000 10 2 30 Own √ 15,000 15 3 1 Rented √ 15,000 10 4 12 Own √ 25,000 5 5 13 Rented √ 15,000 2 6 7 Rented √ 20,000 4 7 14 Own √ 25,000 12 8 20 Own √ 30,000 4 9 27 Rent/Grocery
+ fruit √ 15,000 14
10 3 Own/ Coffee shop
√ 20,000 4
According to the interview results are summarized as below; - Their main income source is small business in the local area. - Their income is increasing due to increasing people who visiting Shiva statue built at top of the hill near the Sanga Pass. - Present their income is enough for their life - Among 10 shops, 7 owners/renter replied the tunnel may affect something on their business negatively even they have no estimation of concrete impact - They welcome the tunnel project but requested upgrade of the existing road, too.

16-38
It is very natural that they have some kind of uncertain concerns on tunnel project. DOR have tried to make explanation to them at stakeholder meetings and people generally understand and show their principle acceptance of the project. DOR will continuously operate and maintain existing road, which is requested by the people, for local using and some middle and long distance transportation including motorcycles which is not given permission to go into tunnel route.
(5)Land use and utilization of local resources
In the area of new road alignment construction, present land use, mostly agricultural land and residential land, will be changed to road. Along the widen and new alignment, land use connecting to socio-economic activities may be encouraged. Also, improved transportation will contribute to effective utilization of local resources.
(6)Water Usage
Water resources around the Sanga area depends on both surface and groundwater, and tunnel construction may cause changes on water flow of both surface and groundwater. For irrigation water around the tunnel areas, there are no systematic infrastructure but farmers use water from natural river/stream. Less discharge is observed during dry season especially March/April, but is never dry. According to the farmers, water from these streams is sufficiently available for two or three cycle crops and seasonal vegetables in a year and seasonal vegetables. Farmers around the portal demanded not to degrade this stream water during construction of road and tunnel but to conserve during project implementation. In some areas, farmers depend on rain water for their farming. For the drinking and living water, almost all the around the area have been using piped water for drinking purpose. Source of these piped water is the upstream regions which lies approximately 700 m above Arniko Highway. Two families own ring wells and are deriving water as an alternative source for daily activities. Individual and group piped water supplies were observed during field survey, which were used for drinking and domestic purpose. A seasonal Kuwa (small shallow aquifer) was also observed below the Nashika Temple which lies just below the eastern portal of tunnel. A stone tap lies just below the western side of Nashika Temple where locals were seen to be washing cloth and bathing. It is difficult to estimate rational impact on water environment/hydrology around the area due to tunnel construction/operation, however, it may cause some kind of impact especially on water volume and water level. Therefore, monitoring on such water resources shall be implemented during construction and in operational phase. Water level as a baseline data is given the table below:
Table 16.2-24 Water Level around the Tunnel Area
S.N Sources Owner Construction Year Depth (m) Present Water Level
1 Ring Well Ramji Dulal 2008 7.08m 1.29m
2 Spring (Kuwa) Community About 50 years 0.38m 0.22m
3 Ring Well Niranjan Shrestha 2010 5.25m 1.90m Source: Field Study, Jan. 2018

16-39
In addition to above water sources, there is a local pond located at Sanga towards the left hand side of Arniko Highway while travelling from Kathmandu to Dhulikhel shown in the figure below.
Source: Google Map / JICA Survey Team 2018
Figure 16.2-8 Location Map of Basuki Pond
The pond is named after the ‘king of snakes’ (Basuki) and is said to be constructed 100 years back to supply water to extinguish accidental fires of surrounding houses of Sanga. This pond covers an area of approximately 48m x 30m (1,440m2), (3 ropani 14 Anna) and has a perennial source of water underground and stream water. This pond has an enclosed bank-wall. The Basuki Pond Management Committee has cleaned and extended the pond with its own initiation and utilized it for the fishery purpose. Depth of the pond is approx. 3.5m where water level is observed to be of 1.5m depending on the availability of water from its natural source and rain water. The Basuki Pond has become socio-environmental pride and also source of income of the society. The pond has annual earnings of approximately NRs. 200,000 per year, however 30 percent of its earnings goes to purchase fingerlings (Bhura) and fish feeding materials. The remaining fund is used for the improvement of pond and social welfare. It is regulated by the “Basuki Pond Management Committee”. It is estimated that the impact on the pond water by the tunnel component might be limited, however, the water level of the pond should be monitored during both construction period and operational period, periodically.
(7)Fixing social infrastructures and services
Relocation or protection of existing utilities, such as electric poll, water pipe and optical fiber cable will be required by the project. During the construction phase, temporal traffic congestion in and around construction site will occur. After the operational phase, access to social services will be improved.
(8)Social institutions such as social infrastructure and local decision-making institutions
Tunnel Section
Basuki Pond

16-40
Road widening including service road and faster vehicle speed will make it more difficult to access to social services and infrastructure, and may cause split of local communities.
(9)Misdistribution of benefits and damages
Misdistribution of benefit among PAPs as a suffered party and non-PAPs just enjoy road improvement may occur.
(10)Local conflicts of interest
Because of improvement project of existing road mainly, considerable impact on local conflict is unlikely to occur.
(11)Cultural heritage
There are no cultural heritage, such as temple and shrine after the alignment around the tunnel area was changed. There still are two pipal trees within the project area, which is usually have religious meaning, along the target road section, however, these trees are common species in Kathmandu valley and people doesn't have opposition opinion in terms of cultural importance. Cut-down, replantation of these trees shall be planned with appropriate discussion process with local people.
(12)Landscape
Road site trees and forest area, which create particular scenery, will be lost by road widening works. However, because there are no protected scenic view areas, and skylines of the affected area may not be change, considerable impact on landscape is unlikely.
(13)Gender
Women workers may be discriminated or sexually harassed by male workers and have different wage scale from male workers. However, there is no specific risks on gender by the project component and its secondary impact.
(14)Children's rights
Considering on general situation of Nepal, construction mobilization may cause child labor issues. In addition, access to public facilities can be hindered due to increasing traffic
(15)Infectious diseases such as HIV/AIDS
Infection risks, such as HIV/AIDS, may be increased among construction workers.
(16)Working conditions (including occupational safety)
Dust and emission gas from construction machinery including vehicles may affect workers health. Sanitary conditions around construction site may get worse due to waste from workers and toilet.

16-41
16.2.7.4 Others
(1)Accidents
In the construction phase, labor accidents may occur in construction site, especially in tree cutting, slope protection and tunnel construction works. Traffic accident may occur in and around construction site, too. In the operational phase, traffic accident due to increased traffic volume and faster vehicle speed may increase ratio of traffic accident. In the tunnel section, car trouble, car accident, vehicle fire, emergency cases may happen
(2)Trans-boundary impacts or climate change
Trans-boundary impacts will not occur due to project. However, operation of construction equipment will generate CO2. CO2 emission from vehicles will increase following improvement of road. On the other hand, there will be observed positive improvement by the project by providing optimal and effective speed in terms of emission gas decreasing.
16.2.8 Results of EIA Surveys
After evaluation and baseline survey on each environmental element based on the scoping results and survey TOR, impacts caused by the project was determined. Results of EIA items are shown in Table 16.2-25 with final impact level, reasons, and changes comparing to scoping, if any. Each element required measures are described in following mitigation parts.
Table 16.2-25 Results of EIA Survey
No. Impact Items
Assumed Impact Level* Reasons/Assessment
Results
Change of Impact Level
after EIA survey
Pre-Construction/Construction
Operation
Pollution 1 Air pollution
B- B±
- Same as Scoping Result - Baselin data of total
particlulate matter and PM10 is much higher than national standard and it is preditced that the situation will be worsen as increasing number of vehicles.
None
2 Water pollution
B- B-
- Drainage from tunnel and construction site may cause pollution in downstream areas - Baseline data of each item is not so worse comparing to the national standard, however, constuction and tunnel operaiton may cause turbid water and chagne of pH.
C became B- in operation phase
3 Waste B- D Illegal dumping can be controled by Local
C became D in operation phase

16-42
No. Impact Items
Assumed Impact Level* Reasons/Assessment
Results
Change of Impact Level
after EIA survey
Pre-Construction/Construction
Operation
authority (Municipality) and DOR
5 Noise and Vibration
B- B-
- Same as Scoping Result - Existing town areas along
the Arniko Highway showed high noise value and estimation also predict higher level of noise in operational stage.
None
6 Ground subsidence
B- B-
There might be possibilities of subsidence due to loading and leawking water from tunnel and drainage
C in both Pre-construction/Construction phase and operation phase became B-
8 Bottom sediment
D D
Because the construction works will not include dredging works and drainage of wastewater containing heavy metal or high-level organic substances, impacts on bottom sediment are unlikely to occur.
C in both Pre-construction/Construction phase and operation phase became D
Natural Environment
10 Ecosystem
B- D
- Same as Scoping Result - There have not been
observed and heard exitance of endangered species around the area
None
11 Hydrology
B- B-
Tunneling works may influence the flow of groundwater and the groundwater level in the surrounding area, and amount of water from wells/springs may change. Water leaking from tunnel may cause impact on groundwater.
C in both Pre-construction/Construction phase and operation phase became B-
12 Geographical features B- D Same as Scoping Result None
Social Environment
13 Resettlement/Land Acquisition
A- D Same as Scoping Result None
14 Poor people B- D Same as Scoping Result None 16 Local
economies, such as employment, livelihood, etc.
B± B±
Same as Scoping Result None
17 Land use and utilization of local
B- B+ Same as Scoping Result None

16-43
No. Impact Items
Assumed Impact Level* Reasons/Assessment
Results
Change of Impact Level
after EIA survey
Pre-Construction/Construction
Operation
resources 18 Water usage
B- B- Water from tunnel may cause impact on water usage around the area.
C became B- in operation phase
19 Existing social infrastructures and services
B- B±
Same as Scoping Result None
20 Social institutions such as social infrastructure and local decision-making institutions
B- B-
Same as Scoping Result None
21 Misdistribution of benefits and damages
D D
- There is not observed strong midistribution due to the project, because most of the section is exiting road. - Limited new alignment will not cause any misdistribution to different areas along the roads and tunnels.
C became D in pre-construction/construction phase
23 Cultural heritage D D
Due to change of alignment, direct impact on local temples and shrines are avoided.
B- became D in pre-construction/construction phase
24 Landscape B- D Same as Scoping Result None 25 Gender
B± B±
Women will be provided jobs with priority during constrution and wage scale will be even against men. Improvement of public transportation may assist women's business. In case that above effects are hindered in practical situation, minus ipmapt will be occared.
D became B± in both Pre-construction/construction phase and Operation Phase
26 Children’s rights B- B- Same as Scoping Result None
27 Infectious diseases such as HIV/AIDS
B- D
Same as Scoping Result None
28 Working conditions (including occupational
B- D
Same as Scoping Result None

16-44
No. Impact Items
Assumed Impact Level* Reasons/Assessment
Results
Change of Impact Level
after EIA survey
Pre-Construction/Construction
Operation
safety) Others 29 Accidents B- B± Same as Scoping Result None
30 Trans-boundary impacts or climate change
B- B±
Same as Scoping Result None
A+/-: Significant positive/negative impact is expected B+/-: Positive/negative impact is expected to some extent C: Extent of positive/negative impact is unknown. (A further examination is needed, and the impact could be clarified as the
study progresses) D: No impact is expected * Assumed impact level was changed after environmental survey
16.2.9 Mitigation Measures on Impacts
The potential impacts and their magnitude are shown in the following tables.
16.2.9.1 Significant or Large Impact Items
Table 16.2-26 Significant Impact
Item
Rating (Scoping
Stage)
Rating (Assessment
Stage) Impact Construction
Operation
Construction
Operation
Social Environment Resettlement/ Land Acquisition
A- D A- D Pre-Construction Phase: Linear improvement and widening of existing road and construction
of new alignment including the tunnel section will cause land acquisition and resettlement.
In case of new road construction, additional land acquisition will be required.
Construction Phase: Temporal lease of land and additional small scale resettlement will
be required. Operation Phase: Additional resettlement and land acquisition will not be required.
A+/-: Significant positive/negative impact is expected B+/-: Positive/negative impact is expected to some extent C: Extent of positive/negative impact is unknown. (A further examination is needed, and the impact could be clarified as the
study progresses) D: No impact is expected
16.2.9.2 Substantial or Middle Impact Items

16-45
Table 16.2-27 Substantial or Middle Impact
Item
Rating (Scoping
Stage)
Rating (Assessment
Stage) Impact Construction
Operation
Construction
Operation
Pollution Air pollution B- B± B- B± Construction Phase:
Operation of construction equipment will generate dust and emission gas.
Traffic congestion in construction site will cause increase in exhaust gas from vehicles.
Dust will occur in borrow pit and quarry site. Operation Phase: In the future, total amount of air pollutant caused by vehicle
exhaust gas will increase. However, because of improved traffic efficiency, the amount
may be reduced compared to without project. Exhaust gas may increase around the entrances of tunnel
Water pollution
B- C B- B- Construction Phase: Turbid water caused by construction works, especially bridge
constructions, is likely to affect existing surface water resources.
In case of inadequate management in borrow pit and quarry site, turbid water from borrow pit and quarry site by rainfall may cause surface water contamination.
Operation Phase: Soil runoff due to heavy rain may occur in filling or steep
slope sections and turbid water may cause surface water contamination.
Waste B- C B- D Construction Phase: Construction waste caused by construction works and general
waste from construction office will be generated. In case that soil from construction site is not appropriately
disposed, around the area of construction site and soil disposal site may be contaminated.
Operation Phase: Illegal dumping of solid waste may increase along newly set
parking spaces on road shoulder. Noise and Vibration
B- B- B- B- Construction Phase: Construction works is likely to increase noise and vibration
level. Noise and vibration will occur in borrow pit and quarry site. Operation Phase: In the future, noise and vibration level caused by vehicle
driving will increase. However, because the distance between roadside and carriage way will be widened due to newly installed service road and footpath the level on road side may be reduced compared to without project.
Ground subsidence
C C B- B- Construction Phase: Subsidence due to fill loading may occur. Subsidence due to water drainage of tunnel drilling Operation Phase: Leaking water from tunnel and drainage may cause
subsidence

16-46
Item
Rating (Scoping
Stage)
Rating (Assessment
Stage) Impact Construction
Operation
Construction
Operation
Natural Environment Ecosystem B- D B- D Construction Phase:
Roadside tree/vegetation will be lost by widening works. In a mountainous section, tree cutting in a community forest may be required due to approach roads to the tunnel.
Agricultural/Aquatic ecosystem may be disturbed by construction works including road, tunnel, bridge and other facilities.
Turbid water caused by bridge construction is likely to affect aquatic life.
Hydrology C C B- B- Construction Phase: Water flow in the river or stream may be altered during
construction works. Tunneling works may influence the flow of groundwater and
the groundwater level in the surrounding area, and amount of water from wells/springs may change.
Operation Phase: Water leaking from tunnel may cause impact on groundwater.
Geographical features
B- D B- D Construction Phase: Topography will be changed in the new road section and
mountainous areas. Tunneling works may change geographical conditions in
surrounding area Operation Phase: Impact on geographical features is unlikely to occur.
Social Environment Poor people B- D B- D Pre-Construction Phase/Construction Phase:
In case of inadequate compensation for resettlement, livelihood recovery of poor people will be difficult.
Operation Phase: Impact only on poor people is unlikely to occur because there
is not any changes for existing road traffic system, and charging system (toll gate) on improved road is not introduced.
Local economies, such as employment, livelihood, etc.
B± B± B± B± Pre-Construction Phase: Land acquisition and resettlement may cause livelihood
degradation of Project Affected Persons (PAPs). Construction Phase: Construction will create job opportunities to local people. Operation Phase: Reduction of travel time will contribute to local economies
and promote tourism. Road widening and faster vehicle speed will make it more
difficult to access to social services and infrastructure. Land use and utilization of local resources
B- B+ B- B+ Construction Phase: In case of new road construction, land use, mostly
agricultural land and residential area, will be shifted to Right of Way.
Operation Phase: Land use along the target road section will change and
achieve economic and social development. Improved transportation will contribute to effective
utilization of local resources.

16-47
Item
Rating (Scoping
Stage)
Rating (Assessment
Stage) Impact Construction
Operation
Construction
Operation
Water usage B- C B- B- Construction Phase: Existing agricultural canals located in roadside will be
affected by widening works. Water-use around the construction site/yard may affected by
water from that areas Operation Phase: Water from tunnel may cause impact on water usage around
the area. Existing social infrastructures and services B- B± B- B±
Pre-Construction Phase: Relocation or protection of existing utilities, such as electric
poll, water pipe and optical fiber cable will be required. Construction Phase: Temporary traffic congestion in and around construction site
will occur. Operation Phase: Access to social services will be improved. On the other hand, road widening and faster vehicle speed
will make it more difficult to access to social infrastructure and may cause split of local communities or widening disparity.
Social institutions such as social infrastructure and local decision-making institutions
B- B- B- B-
Construction Phase/Operation Phase: Because of improvement project of existing road,
considerable impact on social institutions is unlikely to occur. Road widening including service road and faster vehicle
speed will make it more difficult to access to social services and infrastructure, and may cause split of local communities or widening disparity.
Landscape B- D B- D
Construction Phase: Road site trees and forest area, which create particular
scenery, will be lost by widening works. Children’s rights
B- B- B- B- Operation Phase: Construction mobilization may cause child labor issue Operation Phase: Access to public facilities can be hindered due to increasing
traffic Infectious diseases such as HIV/AIDS B- D B- D
Construction Phase: Infection risks of HIV/AIDS may be increased among
construction workers and local business offering food and entertainment.
Operation Phase: Being an improvement project of existing road in developed
areas, considerable impact on infectious diseases is unlikely. Working conditions (including occupational safety)
B- D B- D
Construction Phase: Dust and emission gas may affect workers health. Sanitary conditions around construction site may get worse
due to waste from workers and toilet. Operation Phase: Considerable impact on working conditions unlikely

16-48
Item
Rating (Scoping
Stage)
Rating (Assessment
Stage) Impact Construction
Operation
Construction
Operation
Accidents
B- B± B- B±
Construction Phase: Labor accidents may occur in construction site, especially in
tree cutting, slope protection and bridge construction works. Traffic accident may occur at construction site Operation Phase: Traffic safety including pedestrians will be improved by road
widening and vehicle separation Traffic accident due to more traffic volume and faster vehicle
speed may increase ratio of traffic accident. In the tunnel section, car trouble, car accident, vehicle fire,
emergency cases may happen Trans-boundary impacts or climate change
B- B± B- B±
Construction Phase: Trans-boundary impacts including climate change will not
occur. Operation of equipment will generate CO2. Operation Phase: CO2 emission from vehicles will increase in future. However, improved traffic efficiency may reduce.
A+/-: Significant positive/negative impact is expected B+/-: Positive/negative impact is expected to some extent C: Extent of positive/negative impact is unknown. (A further examination is needed, and the impact could be clarified as the
study progresses) D: No impact is expected
16.2.9.3 Mitigation Measures on Impacts
The recommended mitigation measures for each identified impact are also presented in these following table.
Table 16.2-28 Impacts and Mitigation Measures No. Impacts Mitigation Measures / Proposed EMP Implementing
Organization Responsible
Organization Pre-Construction 1 Resettlement/Land
Acquisition Authorities concerned including Compensation Determination Committee (CDC) shall comply with Resettlement Action Plan (RAP).
CDC DOR
2 Poor people Authorities concerned including Compensation Determination Committee (CDC) shall comply with Resettlement Action Plan (RAP).
CDC DOR
3 Local economies, such as employment, livelihood, etc.
Authorities concerned including Compensation Determination Committee (CDC) shall comply with Resettlement Action Plan (RAP).
CDC DOR
4 Existing social infrastructures and services
Detailed survey on existing utilities should be conducted in the planning stage.
The contractor and supervision consultant should periodically hold sufficient meetings with the utility owners in every stage and establish mutual understanding.
Proper relocation plans should be prepared and strictly implemented in advance of construction works.
Contractor, Consultant
DOR

16-49
No. Impacts Mitigation Measures / Proposed EMP Implementing Organization
Responsible Organization
Construction 1 Resettlement/Land
Acquisition Authorities concerned shall apply RAP for any additional land acquisition, including construction yards
CDC, Contractor
DOR
2 Air pollution Contractor shall prepare and implement dust control measures, such as periodical water spray, covering on construction material, etc.
Contractor shall actively use electrically-powered equipment.
Contractor shall maintain their construction equipment in adequate working conditions.
Contractor shall keep clean road surfaces. The supervision consultant shall monitor
dust, exhaust gas and complaint from the local people. If the local residents and pedestrians complain about the dust and gas, the supervision consultant and contractors should reconsider the construction technique and method.
Vehicles washing station shall be established in the point like Dhulikhel, Sanga and Bhaktapur.
Contractor, Consultant
DOR
3 Water pollution Construction works in and around rivers, streams, reservoirs or channels shall be concentrated in dry period.
Contractor shall maintain their construction equipment in adequate working conditions.
To reduce turbid water, steel sheet pile construction method should be selected in bridge construction works as necessary.
The contractors will be prohibited from washing the construction tools along the rivers and other public water
In construction works in and around rivers and other water areas, the supervision consultant and contractor should monitor and control the turbid water. If the results exceed the allowable limits, the supervision consultant and contractors should reconsider the construction technique and method.
The wastewater septic tank facility in the workers camp anDOR other necessary locations shall be properly maintained.
Settling basin (sedimentation pond) are prepared for turbid water from tunnel and any other construction field to separate clear water and muddy materials before discharging to natural water areas.
Polluted water which cannot be treated at the site, such as water originated from cement milk for tunnel walls and any other oil polluted liquid might be transported to water treatment plant. DOR and Contractor shall find and contract with treatment plants/facilities which have environmental
Contractor, Consultant
DOR

16-50
No. Impacts Mitigation Measures / Proposed EMP Implementing Organization
Responsible Organization
authorization. 4 Waste The contractor shall prepare and strictly
implement a proper waste management plan including separation and recycling programs.
The contractors shall provide temporary sanitation facilities such as portable toilets and garbage bins to ensure that the domestic wastes to be generated by the construction personals.
Office building for construction contractor shall be provided with toilets and septic tanks to handle domestic sewage.
DOR and Contractor confirm appropriateness of disposal firms with municipality who has the right to make contract with disposal firms and discuss monitoring plan
In case that a new waste disposal areas is prepared for the project after contractor's decision, Initial Environmental Examination shall be implemented for mitigation in the beginning of implementation stage.
Contractor, Consultant
DOR, Municipality
5 Noise and Vibration
A proper work schedules should be prepared not to concentrate the construction equipment at a certain point for long time.
The contractors shall maintain their construction equipment in adequate working conditions.
Construction works with heavy noise and vibration shall be prohibited during evening and night (17:00 pm - 8:00 am) to avoid noise disturbance in residential, commercial and other noise-sensitive areas.
The contractor and supervision consultant shall provide prior notification to the local community on the schedule of construction activities.
Baseline data for vibration is measured during detailed design stage
The supervision consultant shall monitor noise, vibration and complaint from the local people in construction site, borrow pit and quarry site. If the local residents and pedestrians complain about the noise and vibration, the supervision consultant and contractors should reconsider the construction technique and method.
Contractor, Consultant
DOR
6 Ground subsidence The supervision consultant and contractor should monitor the ground subsidence. If ground subsidence occurs, the consultant and contractors should reconsider the construction technique, and take necessary recovering/preventive works against surrounding structures
Contractor, Consultant
DOR

16-51
No. Impacts Mitigation Measures / Proposed EMP Implementing Organization
Responsible Organization
7 Eco System Construction Phase: Compensatory re-plantation in the same
areas at the ratio of 1:25 for the community forest with native species accordance with surrounding ecosystem.
The construction works should be scheduled in daytime to prevent disturbance of wildlife.
Vegetation works to recover cutting slope is considered
To reduce turbid water, the steel sheet pile construction method should be selected in bridge construction works as necessary.
DOF, CFUG, Contractor, Consultant
DOR
8 Hydrology The wastewater septic tank facility in the workers camp and/or other necessary locations shall be properly maintained.
Settling basin (sedimentation pond) are prepared for turbid water from tunnel and any other construction field to separate clear water and muddy materials before discharging to natural water areas
Polluted water which cannot be treated at the site, such as water originated from cement milk for tunnel walls and any other oil polluted liquid might be transported to water treatment plant. DOR and Contractor shall find and contract with treatment plants/facilities which have environmental authorization.
To maintain existing surface flow condition, bridges and culverts should be constructed according with its original flow
Contractor, Consultant
DOR
8 Geographical features
Vegetation recovery, border fence surrounding construction area, sheet covering on construction material are implemented.
Contractor, Consultant
DOR
9 Local economies, such as employment, livelihood, etc.
The contractor should give priority to the PAPs in hiring local people.
Income restoration program in RAP may support livelihood of target groups
Contractor, Consultant Income restoration program implementor
DOR
10 Land use and utilization of local resources
The contractor and supervision consultant shall provide prior notification to the local community on the schedule of construction activities and restricted areas for their preparation.
Contractor, Consultant
DOR
11 Water usage The contractor and supervision consultant shall provide prior notification to users of water surrounding project area
The contractor and supervision consultant should periodically hold sufficient local meetings in construction period to discuss relocation measure, if required, and/or to know any changes on water level, water
Contractor, Consultant
DOR

16-52
No. Impacts Mitigation Measures / Proposed EMP Implementing Organization
Responsible Organization
volume, and water use 12 Existing social
infrastructures and services
The contractor and supervision consultant shall provide prior notification to local people and drivers on the schedule of construction activities, and location, time and type of traffic restriction.
Contractor, Consultant
DOR
13 Social institutions such as social infrastructure and local decision-making institutions
The contractor shall prepare and strictly implement a traffic management plan around the construction site
Contractor, Consultant
DOR
14 Landscape Vegetation loss for land clearing should be minimized.
The contractor and supervision consultant shall prepare and strictly implement vegetative restoration plans such as sowing on road slope that is prepared by consultant and contractor.
Contractor, Consultant
DOR
15 Children’s rights Contractor and Consultant have to investigate workers age by using registered system.
Contractor, Consultant
DOR
16 Infectious diseases such as HIV/AIDS
Education program for construction workers are introduced by contractor.
Contractor, Consultant cooperate with local authorities
DOR
17 Working conditions (including occupational safety)
The contractor shall prepare and strictly implement dust control measures such as periodic water spray.
The contractors shall maintain their construction equipment in adequate working condition.
The contractors shall provide temporary sanitation facilities such as portable toilets and garbage bins for domestic waste.
The solid waste should be separated into hazardous, non-hazardous and reusable waste streams and stored temporary on site.
Contractor, Consultant
DOR
18 Accidents The contractor shall prepare and strictly implement measures for safety.
The contractor and supervision consultant shall confirm emergency medical facility in advance.
To prevent downfall accident of children, the contractor should install signboards and cooperate with local schools.
Contractor, Consultant
DOR
19 Trans-boundary impacts or climate change
Idling stop campaign for all construction related vehicles and education is implemented.
Contractor, Consultant
DOR
Operation 1 Air pollution The regulations on fuel quality and
importing old cars are to be prepared by DOR in the future.
DOR shall monitor air quality on roadside. If the results exceed the allowable limits,
DOR with other relevant department in MOPIT
DOR

16-53
No. Impacts Mitigation Measures / Proposed EMP Implementing Organization
Responsible Organization
the regulations on emission gas and fuel quality should be strengthened.
DOR, vehicle registration authority, and etc. shall discuss about regulations on vehicle, including monitoring of vehicle speed limit at the project area, automobile inspection in terms of exhaust gas standard, etc.
Control and minimize the quality and the amount of exhaust gas on the Road with roadside tree plantation.
Conduct awareness campaign to vehicles users regarding appropriate operation and management of vehicles in terms of air pollution
Vehicles washing station shall be established in the point like Dhulikhel, Sanga and Bhaktapur.
2 Water pollution DOR shall monitor water quality on roadside. If the results exceed the allowable limits, and/or people complaints, DOR take measures for preventing land surface erosion around the water area.
DOR DOR
3 Noise and Vibration
A relevant agency shall monitor noise and vibration on roadside. If the level reaches a significant level such as exceeding the environmental standards, DOR should consider and implement mitigation measures including resurfacing works or installation of soundproof wall.
Restrict to use pressure horns by vehicles users
Conduct awareness to vehicles users regarding noise pollution and its impacts
DOR with relevant department in MOPIT
DOR
4 Ground subsidence DOR shall monitor ground conditions on the roadside. If ground subsidence occurs, DOR should consider and implement mitigation measures including refill works.
DOR DOR
5 Hydrology DOR through provincial authority should maintain responsibility for rehabilitation of bridges and culverts.
Local governments should install signboards to prohibit garbage disposal into rivers and canals.
DOR DOR
6 Local economies, such as employment, livelihood, etc.
The local government should monitor local economy and livelihoods. If troubles of some sort occur, the local government should consider and implement the countermeasures. Income restoration program under RAP shall recover these kinds of issues.
DOR, CDC DOR
7 Water usage DOR should monitor conditions of water usage and flow by water level, etc. If troubles of some sort occur, DOR should consider and implement the countermeasures, such as compensatory
DOR DOR

16-54
No. Impacts Mitigation Measures / Proposed EMP Implementing Organization
Responsible Organization
well, water diversion pipe from stream, etc. 8 Existing social
infrastructures and services
The proper countermeasures to support the transit of local vehicles, pedestrians and livestock, such as an over-bridge, crosswalk, underpass or traffic sign to inform crossing road should be considered on the basis of site survey in the detail design stage and implemented.
DOR should monitor the local traffic and socioeconomic activities. If troubles of some sort occur, DOR should consider and implement the countermeasures by the results of stakeholder meetings
DOR DOR
9 Social institutions such as social infrastructure and local decision-making institutions
DOR should monitor the local traffic and socioeconomic activities. If troubles of some sort occur, DOR should consider and implement the countermeasures, such as improvement of traffic management around the area.
DOR DOR
10 Children’s rights Assistance for access, such as pedestrian, pedestrian bridge, signal, and other safety facilities are introduced.
DOR DOR
11 Accidents DOR, local police and relevant agency shall monitor and control vehicle speed to reduce traffic accident. Local governments should conduct traffic
safety campaigns for local people Road traffic signals, marking, other safety
measures will be applied to reduce driving risks
DOR DOR
12 Trans-boundary impacts or climate change
In view of the global effort to reduce CO2 emission, relevant agencies shall further strengthen the effort for promoting “environmentally sustainable transport” including promotion of use of mass transit such as bus and railroad for both passenger transport and cargo transport.
DOR DOR
16.2.10 Environmental Management Plan (EMP)
The preparation of Environmental Management Plan (EMP) is determined as a key part of the EIA report. The proponent is required to implement the mitigation measures, while the environmental monitoring works should be performed by the concerned agency (ministries), and auditing by the Ministry of Forests and Environment (MOFE) in accordance with the provisions of the EPR.
16.2.10.1 Roles and Responsibility
Key stakeholders/agencies involved directly and indirectly for environmental management of the project are as follows:
• Ministry of physical Infrastructure and Transport (MOPIT) • Ministry of Forests and Environment (MOFE) • Department of Road (DOR, Project Proponent)

16-55
• Construction Contractor • Municipality Development Committee (same as former VDC) • District Development Committee (DDC) • Supervision Consultant • Non-Governmental Local Bodies such as CBOs, NGOs and CFUGs
The main roles and responsibilities of the above agencies at different stages of Project implementation phase are shown as followings.
16.2.10.2 Pre-Construction Phase
(1)Ministry of physical Infrastructure and Transport (MOPIT)
The overall responsibility of the MOPIT comprises the coordination with the Nepal Planning Commission (NPC) and Ministry of Finance (MOF) for the final selection of strategic road network sub-project sections and the finalization concerning budget allocation. MOPIT ministry is the umbrella agency in Nepal undertaking the planning and construction of the Strategic Road Network, to be implemented through its Department of Road.
(2)Ministry of Forests and Environment (MOFE)
The Ministry shall review the EIA report to ensure that the report is prepared as per EPA (1996) and EPR (1997) as well as approved TOR. MOFE shall approve the EIA report after providing comments and suggestions in terms of environmental management. MOFE shall grant approval letter to Proponent under the Sub-Rule (4) of EPR within Sixty days from the date of receipt of the proposal instructing to ensure the implementation of mitigation measures and monitoring provisions during Project construction and operation stages.
(3)Project Proponent (Department of Road, DOR)
The Proponent shall review the EIA report to ensure that it meets the EIA requirements and procedures as per EPA and EPR, and other environment related acts, rules and guidelines administered by concerned agencies. The Proponent shall submit the final EIA report to the concerned line Ministry for review through the MOPIT and shall get approval from the Ministry before its implementation.
(4)Municipality/District Development Committee
Municipality/DDC shall provide recommendation letter for the implementation of the Project after the study of EIA report instructing to ensure the implementation of mitigation measures.
(5)Local Stakeholders, NGO, CBOs and CFUGs
Local stakeholders shall support proponent in settling all sort of social disputes that are arouse during the process of acquisition of affected land and houses. Stakeholders shall assist affected locals; poor and indigenous people ensuring their support for resettlement and livelihoods from proponent’s side.

16-56
16.2.10.3 Construction Phase
(1)Project Proponent
The proponent shall provide all the information of likely impacts and its mitigation measures as mentioned in EIA report to construction contractor before the construction and operation of highway and its associated structures. Proponent shall ensure that construction contractor will carry out the construction work in environmental friendly way and implementing mitigation measures as mentioned in the EIA report as per requirement.
(2)Construction Contractor
Construction contractor shall execute construction work in environmental friendly manner without undermining the issues and mitigation measures identified and mentioned in the EIA report. Establishment and operation of labor camp and sanitary condition of the camp shall be maintained. Contractor shall strict restrictions for laborers from illegal felling of trees and use of natural resources. Side tipping of spoil shall be avoided and only recommended spoil disposal sites shall be used for tipping and shall be reclaimed and rehabilitated covering with vegetation and maintaining drainage after its closure. Contractor shall encourage local level employment in the construction of Project.
(3)Stakeholders, NGO, CBOs and CFUGs
Local stakeholders, NGO and CBOs shall ensure the transparency in the construction activities are maintained throughout the construction period. Similarly, such bodies shall ensure that the environmental enhancement and mitigation measures and monitoring is carried out as per approved EIA report and shall also ensure the priority to local employment and implementation of Project as per EIA report. CFUGs shall be responsible to provide area and space for compensatory re-plantation and shall be responsible for the protection and conservation of planted species at least for 5 years.
16.2.10.4 Operational Phase
(1)Project Proponent
The Proponent shall ensure the operation of Project with environmental friendly manner ensuring the implementation of mitigation measures proposed in EIA report. The Proponent shall further ensure the local level employment in the Project; ensure clean emission on ambient environment, ensure all safety measures for highway operation.
(2)Local Bodies, NGO and CBOs
Local bodies such as Municipality/DDC, NGO and CBOs shall conduct monitoring and supervision works to measure the effectiveness of environmental enhancement of beneficial impacts and mitigation measures implemented for adverse environmental impacts of the proposed Project.

16-57
16.2.10.5 Estimated Budget for EMP Implementation
In this Project, each organization listed in the following tables shall bear the responsibility for implementation of the EMP in the described Phases.
Table 16.2-29 Funding and Responsible Organization for the Implementation of EMP
Funding Phase Responsible Organization
JICA
Planning Phase (Detailed Design Phase) DOR with Engineering Design Consultant
Construction Phase DOR with Construction Supervision Consultant or Construction Contractor
GON Operation Phase DOR Source: JICA Survey Team, 2017 For implementation of EMP, Environmental Management Unit shall be established. The cost required for the establishment of EMU is presented in the table below.
Table 16.2-30 Estimated EMU cost of the Project
(CONFIDENTIAL)
16.2.11 Environmental Monitoring Plan (EMoP)
The environmental monitoring plan and draft form are shown in Table 16.2-31 and plan for beneficial impacts are shown in Table 16.2-31. The monitoring report shall be disclosed on JICA website and at appropriate places, such as website of DOR, national/regional library, and local authorities when third party request to access. Monitoring result are also reported to JICA in quarterly based Project Status Report (PSR). General monitoring period for some items are set as 5 years in the following table, however, if it is observed exceeding impacts much more than expected degrees and is not able to be covered by planned mitigation measures, the monitoring periods shall be extended with appropriate additional measures.
Table 16.2-31 Draft Environmental Monitoring Form
Environmental Item
Responsibility/ Implementor
Monitoring Item/
Parameter Location Method Frequency/Duration
Pre-Construction Phase 1. Resettlement/Land Acquisition
DOR/Contractor, Consultant
Internal and external monitoring items in RAP
Project affected areas
Following RAP procedures with external monitoring
Based on monitoring plan in RAP
2. Poor people DOR/Contractor, Consultant
Internal and external monitoring items in RAP
Project affected areas
Following RAP procedures with external monitoring
Based on monitoring plan in RAP
3. Local economies, such as employment, livelihood, etc.
DOR/Contractor, Consultant
Internal and external monitoring items in RAP
Project affected areas
Following RAP procedures with external monitoring
Based on monitoring plan in RAP

16-58
Environmental Item
Responsibility/ Implementor
Monitoring Item/
Parameter Location Method Frequency/Duration
4. Existing social infrastructures and services
DOR/Contractor, Consultant
Internal and external monitoring items in RAP
Project affected areas
Following RAP procedures with external monitoring
Based on monitoring plan in RAP
Construction Phase 1. Air Quality Consultant,
Contractor Dust (TPM, PM10)
Construction site
(1) Visual observation (2) Interview to residents (3) Measurement
(1) Daily during the construction period (2) Monthly during the construction period or as needed (3) Monthly during the construction period or as needed
2. Water Quality Consultant, Contractor
- pH - BOD - Suspended Solid (SS) or Turbidity - Coliform - Oil
Well, and stream in and around construction site, especially tunnel area
(1 ) Analysis using potable turbidity meter (2 ) Measurement
(1) Weekly during the construction period or as needed (2) At least once in half a year, in both dry and wet season, during the construction period or as required
3. Waste Consultant, Contractor
- Disposal methods of construction and general waste - Water pollution
Construction site and disposal site
(1) Visual observation at construction site (2) Interview and visual monitoring at the disposal site (3) Measurement
(1) Daily during the construction period (2) Monthly during the construction period or as needed (3) Once in a 6 months or as needed
4. Noise and Vibration
Consultant, Contractor
- Noise level - Vibration level
Construction site
Measurement Monthly during the construction period or as needed
5. Ground subsidence
Consultant, Contractor
Ground subsidence
Construction site and land nearby
Gauge Daily or Weekly during construction period
6. Eco System Consultant, Contractor
- Situation of Tree cutting - Situation of re-plantation (number of planted trees, growing status of planted trees) - Fauna and Flora
Construction site and plantation area
(1) Visual observation for tree (2) Interview to CFUG (3) Field survey for ecosystem based on observation
(1) Daily during cutting activities on going (2) Monthly during plantation on-going (3) At least once in half a year, in both dry and wet season, during the construction period or as required
7. Hydrology Consultant, Contractor
- Water level and/or Volume of well, pond (Basuki Pond), stream
Construction site and water area nearby
(1) Level gauge (2) Interview (3) Measurement
(1) Every quarter during construction period (2) If there are observed changes (3) At least once in 6 months during tunnel construction
8. Geographical features
Consultant, Contractor
Land and covered vegetation features
Construction site and water area nearby
Visible observation
Every quarter during construction period

16-59
Environmental Item
Responsibility/ Implementor
Monitoring Item/
Parameter Location Method Frequency/Duration
9. Local economies, such as employment, livelihood, etc.
Consultant, Contractor
- Situation of local employment - Status of livelihood restoration, such as complaints and/or satisfaction from target groups
Project affected areas
(1) List of employed worker (2) Report of income restoration and external monitoring report
(1) Every quarter during construction period (2) Based on report of income restoration program and external monitoring report
10. Land use and utilization of local resources
Consultant, Contractor
Situation of land use along the road
Project affected areas
Visible observation with interview from people along the project sites
Every quarter during construction period
11. Water usage Consultant, Contractor
- Water level and/or Volume of well, pond (Basuki Pond), stream, and spout - Situation of water use
Construction site and water area nearby
(1) Level gauge (2) Interview
(1) Every quarter during construction period (2) If there are observed changes
12. Existing social infrastructures and services
Consultant, Contractor
- Situation of existing social infra
Construction site
Visible observation
Every quarter during construction period
13. Social institutions such as social infrastructure and local decision-making institutions
Consultant, Contractor
- Traffic situation around the construction area
Arniko highway
Visible observation
Daily during the construction period
14. Landscape Consultant, Contractor
- Situation of landscape
Construction site
Visible observation
Every quarter during construction period
15. Children's rights
Consultant, Contractor
- Worker's age
Construction site
Monitoring on list of workers
Daily during the construction period
16. Infectious diseases such as HIV/AIDS
Consultant, Contractor
- Worker's properties, such as health conditions, record of health check
Construction site
Interview on workers
Every quarter during construction period
17. Working conditions (including occupational safety)
Consultant, Contractor
- Sanitation facilities - Construction equipment - Waste treatment
Construction site
(1) Visible observation (2) Record of maintenance of equipment
(1) Daily during the construction period (2) Daily during the construction period
18. Accidents Consultant, Contractor
- Safety plan - Medical facility - Signboards
Construction site
(1) Visible observation (2) Record of education at school
(1) & (2) At the beginning of construction and follow-up during the construction period

16-60
Environmental Item
Responsibility/ Implementor
Monitoring Item/
Parameter Location Method Frequency/Duration
19. Trans-boundary impacts or climate change
Consultant, Contractor
Operation of construction related vehicle
Construction site
(1) Visible observation (2) Record of education
(1) Daily during the construction period (2) At least one time in 6months during the construction period
Operation Phase 1. Air Quality DOR - PM 10
- PM 2.5 - Sulfur Dioxide (SO2) - Nitrogen Dioxide (NOx)
Along SD Road including tunnel portals
Measurement 1 time X 5 points per year for 5 years after completion
2. Water Quality DOR - pH - BOD - Suspended Solid (SS) or Turbidity - Coliform - Oil
Well, stream in and around construction site
Measurement 1 time in rainy season X 5 points per year for 5 years after completion
3. Noise and Vibration
DOR - Noise level - Vibration level
Along SD Road including town areas
Measurement 1 time X 5 points per year for 5 years after completion
4. Ground subsidence
DOR Ground subsidence
Construction site and land nearby
Gauge At points where the subsidence occurred during construction per year for 5 years after completion
5. Hydrology DOR - Water level and/or Volume of well, pond, stream
Construction site and water area nearby
(1) Level gauge (2) Interview
(1) Once a year for 5 years after completion (2) If there are observed changes
6. Local economies, such as employment, livelihood, etc.
DOR Situation of local employment
Construction site
Interview (1) Once a year for 5 years after completion
7. Water usage DOR - Water level and/or Volume of well, pond, stream, and spout
Construction site and water area nearby
(1) Level gauge (2) Interview
(1) Once a year for 5 years after completion (2) If there are observed changes
8. Existing social infrastructures and services
DOR - Situation of existing social infra
Project area
Visible observation
Once a year for 5 years after completion
9. Social institutions such as social infrastructure and local decision-making institutions
DOR - Traffic situation around the construction area
Arniko highway
Visible observation
Once a year for 5 years after completion
10. Children’s rights
DOR - Children's access
Arniko highway
Interview Once a year for 5 years after completion
11. Accidents DOR - Traffic Accidents
Arniko highway
confirm accident record, if any
Once a year for 5 years after completion

16-61
Environmental Item
Responsibility/ Implementor
Monitoring Item/
Parameter Location Method Frequency/Duration
12. Trans-boundary impacts or climate change
DOR - Traffic volume - Vehicle quality
Arniko highway
(1) Traffic count survey (2) Record of educational activities and facilities
(1) Once a year for 5 years after completion (2) Once a year for 5 years after completion
Table 16.2-32 Monitoring Plan for Beneficial Impacts
Impacts Monitoring of Impact
Beneficial Impacts Enhancement Measures
Responsible Agency
Generation of Employment opportunities and increase of Income
Inspect & confirm labor related clauses are adequately stated in Contractor’s Contract Document
Locals including Project-affected families, poor people as well as women will be encouraged to participate in construction works and give first priority for work.
Contractor/ Sub Contractor
Increase in the income level of local people through opportunity to work and involve in income generation activities
• Site inspection & labor interview
Verify with contractors payroll
• Whenever practical, scheduling the construction works during the agricultural off-season to enable local people to become engaged
Include binding clause in Contractor's Contract Document to give priority for local people with govt. accepted wage and recruit local labor impartially without favor or gender discrimination
Contractor/ Sub Contractor
Strengthening of skills and capacity of locals
• Inspect related clause in Contractor’s Contract Document
• Inspect Contractor’s Training to labors details
Site inspection & labor interview
• Provide on-the-job training and practical training to local workforce on operation of equipment& construction works
Include binding clause in Contractor's Contract Document for providing on-the-job training to local workforce
Contractor/ Sub Contractor Consulting Engineer
16.2.12 Stakeholder Meeting
Stakeholder Meeting (SHM) has been conducted with the aim to collect information and opinion from the residents living nearby the planned project sites based on the JICA's Guidelines for Environment and Social Considerations. It is required to organize two (2) times of SHMs for a JICA's Category A project as this project.
All the implemented SHMs were informed to one to two weeks before the date organization through local government with encouragement of participation of women. Local consultant also supplemented to inform communities along the project road areas prior to the organization day. The SHMs are spoken in Nepali language and all the participant could well understand as mother language.
In parallel with the stakeholder meetings, the following public involvement activities have been done to understand people's opinion and situation deeper.
• Government - Representative of PAPs Meeting

16-62
• Focus Group Discussion
16.2.12.1 The First Stakeholder Meeting
(1)Outline
The first SHM were organized at 2 districts in November 2014. In the SHM, firstly the project outlines including purposes, benefit, planned affected area, and expected negative impacts were explained to the participants and followed by question and answer session. At the same time, participants were informed that the timing of the census survey, socio-economic survey and Inventory of Loss (IOL) / Property Measurement Survey with declaration of cut-off-date to determine eligible persons and properties. The schedule and outline of each SHM is shown in Table 16.2-33.
Table 16.2-33 Overview of the 1st Stakeholder Meeting
Date Interaction Location
Number of Participants Male Female Total
9 Nov 2014 Chitpol-Palanse, Bhaktapur 73 2 75
9 Nov 2014 Banepa, Kavrepalanchok 71 5 76
(2)Issues Raised in the 1st SHMs
The major queries raised by the participants and response during the 1st SHM are summarized in Table 16.2-34.
Table 16.2-34 Summary of the 1st Stakeholder Meeting
Date Location Main Issues from Participants Explanation to Participants
9 Nov 2014 Chittapol
- Should be cleared about legal provision - Pay compensation of all affected land and structures within 25 m ROW each side from center line of the road - Some people are still paying land levy and cultivating /utilizing of the land where the government declared ROW (One person made explanation that he is still paying land levy)
-The concerning authority will study the all legal provision - The government has published 25 m ROW each side from center line of the road. Therefore, the government will pay no compensation for land within the area of ROW. -The concerning local government authorities in charge of the land use and land levy will provide provisions to the situation
9 Nov 2014 Banepa
- The 75 fit ROW (equal to 25 yards) should declare along the Highway - Compensation should be paid for all project affected land, structures, and business eateries etc. It should
- It requires government decision - RAP will regulates that the compensation for the project affected assets should be based on replacement cost

16-63
Date Location Main Issues from Participants Explanation to Participants
be paid based on the market price. - The Project should pay attention to Severely Affected Persons (SAPs) in terms of compensation and assistances
- It is general to pay attention to SAPs during discussing a RAP and the Project also consider it.
16.2.12.2 The First Stakeholder Meeting (2017) for the Tunnel Section
The public consultation meeting at Sanga was additionally organized in Ward Office-14 hall of Naisikaisthan of Sanga, at the newly introduced tunnel section, on 14 October, 2017. The main purpose of the meeting was to aware the local people about the impact due to the proposed tunnel. Table 16.2-35 shows outline of the first stakeholder meeting.
Table 16.2-35 Summary of the First Stakeholder Meeting
Dates, Time Saturday,14/Oct/2017 A.D (28/06/2074 B.S), 9:00am onwards
Venue Ward No.14 Office Nasikaisthan,Sanga - Banepa Municipality
Main Target Local government, residents, businesses and other stakeholders in Suryabinayak and Banepa Municipalities.
Number of Attendants 49 Persons
The major queries raise by the participants and response during the consultation meeting are summarized as Table 16.2-36.
Table 16.2-36 Summary of the Stakeholder Meeting in Tunnel Section
S.N. Participants’ Questions/Opinion/ Suggestion Project Implementer’s Explanations Presented
1 Why the project is not implementing the previously designed open road section through Sanga pass?
It is perceived to avoid various social and cultural impacts at the Sanga Pass area.
2
If the Tunnel road option comes into implementation, what will be the status of the existing road and its improvement?
If the existing road remain there then, the improvement and maintaining of the road will be done through local road division office. And the Status of the existing road will be decided by the DOR.
3
Please provide the final design of the Tunnel section so that the possible discussion can be done on the Tunnel option.
It is just like feasibility level of tentative tunnel alignment and discussion. It may be possible to manage deliver designs of Tunnel in the next phase discussion once the detail information and design is viable.
4
Is there any adverse impact upon the only available source of water resource inside the Sanga Hill and the building structures of the portal areas and others?
In such case, mitigation measures will be applied to considering the geology of the ground over there. Advance knowledge that practice to avoid adverse impact in Tunnel construction should also be applied as much as possible.
5 Restaurants and the other existing The New Tunnel road gives access to long route

16-64
S.N. Participants’ Questions/Opinion/ Suggestion Project Implementer’s Explanations Presented
business of Sanga thought the existing road alignment will deteriorate and shifted towards the Tunnel Portal side.
vehicles and the directly valley entrance non-passengers vehicles. Local vehicle movement will not stop and the existing congestion will reduce, which helps to promote local business in this historic Sanga pass Area.
6 The new land should be acquired for the access road which shall be acquired with good some of compensation cost.
Only a small section of new land should be needed, which can require to advance the design speed.
7
Most of the business structures located at the Sanga roadside are within the ROW area, therefore these should be sifted as per the Road Act.
However, beyond the existing ROW area, it may require further new area to maintain design speed in sharp bends area.
16.2.12.3 The Second Stakeholder Meeting
The second stakeholder meeting has been conducted on 21 February 2018 for all project section including the additional tunnel area. DOR has organized the second stakeholder meetings to explain the result of scoping and surveys related to resettlement. The second stakeholder meetings were conducted in two districts –Bhaktapur and Kavrepalanchok as described below:
Table 16.2-37 Summary of the Second Stakeholder Meeting at Bhaktapur
Dates, Time Wednesday 21 February 2018, 9:00 am Onwards
Venue City Gaon Resort, Bhaktapur
Main Target Local government, residents, businesses and other stakeholders of Bhaktapur and Suryabinayak Municipality
Number of Attendants 44 Persons
Table 16.2-38 Summary of the Second Stakeholder Meeting at Banepa
Dates, Time Wednesday 21 February 2018 2:00 pm Onwards
Venue Ward No.10 Office, Banepa Municipality
Main Target Local government, Residents, Businesses and other stakeholders of Banepa and Dhulikhel Municipality
Number of Attendants 63 Persons
(1)At City Gaon Resort, Bhaktapur
The meeting was chaired by DOR and the Mayor of Suryabinayak Municipality. Altogether 44 people were participated in the meeting. Major questions from the participants and explanation from DOR are shown in the table below.

16-65
Table 16.2-39 Summary of the second Stakeholder Meeting at Bhaktapur
S.N. Participants’ Questions/Opinion/ Suggestion Project Implementer’s Explanations Presented
1
How will the project address the compensation issue beyond the ROW land bases on the verdict given by the Supreme Court?
DOR authority said, it will follow the verdict of Supreme Court to maintain the ROW of the road and based on the prevailing Laws of Nepal, government will pay reasonable compensation for the land beyond the ROW.
2 What is the ROW width of this road section, while there are different standard exist in different section of this road?
Being an important highway, it will follow the Highway standard as provision in Road Act, however the verdict of Supreme court will also be considered in this regard during acquisition of land.
3
How can the project make this road extension work safety in design itself for all kinds of road users such as cycle and motorcycle riders, pedestrian etc.
The DOR authority said, it will consider all drawbacks of the previously designed Koteshwor- Suryabinayak section of road while design this section. We in cooperate in detail design to make this road user friendly by all users following the safety factor for all.
4
How can be reduced the dust problem that the vehicles bring while coming from rural earthen road area into this road section and into KTM city?
In such case, vehicles washing station should be established in few of the point like Dhulikhel, Sanga and Bhaktapur before playing into this highway and entering the city.
5 How the project will maintain Tunnel safety while Nepal don’t have experience on it.
Local vehicles, cycle and motor cycle, vehicles carrying Gas and petroleum product which area highly Inflammable will not permitted to passing from tunnel.
6 What would be the mode of compensation for affected land and other properties?
Cash compensation of the affected for land and properties should be given based on the decision made by Compensation Determination Committee and property Evaluation Technical Committee by the government. The unit cost will not be less than the market cost. Participation of the Local Authority into CDC is mandatory.
7
Sufficient overhead bridges and under pass covering both the express and service lane is required in major intersections. Taxi parking area in major intersection will be needed.
This kinds of facilities will be placed in required places said by the respected DOR authority.
(2)At Janagal, 10 No Ward office of the Banepa Municipality
The meeting was chaired by DOR and the Mayor of Banepa Municipality, Kavrepalanchok district. Altogether 63 people were participated in the meeting. Major questions from the participants and explanation from DOR are shown in the table below.
Table 16.2-40 Summary of the second Stakeholder Meeting at Banepa, Kavrepalanchok
S.N. Participants’ Questions/Opinion/ Suggestion Project Implementer’s Explanations Presented
1 How the project will address the compensation issue beyond the ROW land as verdict given by the Supreme Court?
DOR authority said, it will follow according to the verdict of Supreme Court and the Land Act (1978).
2 What is the width of ROW in this road section, there are different measurement for different section published before?
Being an important highway (as Asian Highway Standard) it will follow the Highway standard norms as provision by Road Act, however the verdict of Supreme court will also be considered in this regard.

16-66
S.N. Participants’ Questions/Opinion/ Suggestion Project Implementer’s Explanations Presented
3
When will this road extension work start in this section? As it is getting late to implement road widening work, there are increasing incident of accident cases.
It will implement the project after agreement made between the concerned parties said DOR authority.
4
Will there be any adverse impact upon the available source of water resource inside the Sanga Hill due to tunnel project? As most of the drinking water supply is being managed from there to Sanga.
In such case, mitigation measures will be applied considering the geology of the ground over there. If any adverse impact arises due to tunnel intervention on present water supply then the project will compensate with alternative water supply scheme for the Sanga area.
5
Existing economic activities, Restaurants and the other existing small business activities will be deteriorated on Sanga pass area due to tunnel road intervention.
The New Tunnel road gives access to long route vehicles and non-passengers vehicles. Local vehicle movement will not be stop, the existing congestion on road due to tunnel pass will helps to reduces and to promote local business in the Sanga pass Area even in better way after tunnel road.
6 Why the tunnel option is needed in this short distance without considering other possible alternatives in this area?
The tunnel option is chosen at this place with due consideration of geometry and landform of the Sanga area. Project also focused on maintaining the road safety due to high speed after road extension to 6 lane on such short distance with high gradient hilly.
7
Some people along the SD road section are still paying tax within the land inside ROW. Do they get compensation of the land above the tunnel area?
The 75 feet ROW in either side will be applied and the compensation of land within that 75 feet might not be paid by the Government. Compensation of structures within the ROW will be paid.
16.2.12.4 Focus Group Meeting (FGM)
(1)Outline
Besides the SHMs, there were held several rounds of Focus Group Meetings (FGM). The schedule and outline of FGM is shown in Table 16.2-41.
Table 16.2-41 Overview of the Focus Group Meeting
Date Interaction Location
Number of Participants Male Female Total
24 March 2015 Bhaisepati, Kavrepalanchok 7 5 12
24 March 2015 Jagati, Bhaktapur 9 7 16
14 October 2017 Nasikasthan, Sanga(Banepa) 34 6 40
(2)Issues Raised in the FGMs
The major queries raised by the participants and response during the FGMs are summarized in Table 16.2-42

16-67
Table 16.2-42 Summary of Public Consultation/Meetings
Date Location Main Issues Raised in Public Meeting Project Team Explanation
24 March 2015
Bhaisepati, Kavrepalanchok
- Appropriate and reasonable compensation should be provided to the affected people - Consultation with local people should be done at the time of construction - Employment opportunity will be generated in construction period - The Project should be rehabilitated all historical and cultural monuments such as temple, resting road side rest house (Chautara) etc. in an appropriate place
- CDC will determine and distribute compensation without bias - Opportunity will be given to the local labor in construction activities - Recovery of historical and cultural assets will be discussed
24 March 2015
Jagati
- The people who will be landless should be addressed - Business disturbance allowance should be paid to affected people - Government has issued double Land Holding Certificate without consensus of related road side people - The Project should consider SAPs while providing compensation
- RAP and concerning government agencies will make clear about the issues raised. - It is general to pay attention to SAPs during discussing a RAP and the Project also consider it.
October 14,
2017
Nasikasthan, Sanga
If the Tunnel road option comes into implementation, what will be the status of the existing road and its improvement?
If the existing road remain there then, the improvement and maintaining of the road will be done through local road division office. And the Status of the existing road will be decided by the DOR.
Please provide the final design of the Tunnel section so that the possible discussion can be done on the Tunnel option.
It is just like feasibility level of tentative tunnel alignment and discussion. It may be possible to manage deliver designs of Tunnel in the next phase discussion once the detail information and design is viable.
Is there any adverse impact upon the only available source of water resource inside the Sanga Hill and the building structures of the portal areas and others?
In such case, mitigation measures will be applied considering the geology of the ground over there. Advance knowledge that practice to avoid adverse impact in Tunnel construction should also be apply as much as possible.
Restaurants and the other existing business of Sanga thought the existing road alignment will deteriorate and shifted towards the Tunnel Portal side.
The New Tunnel road gives access to long route vehicles and the directly valley entrance non-passengers vehicles. Local vehicle movement will not stop and the existing congestion will reduce. Which helps to promote local business in this historic Sanga pass Area.

16-68
Date Location Main Issues Raised in Public Meeting Project Team Explanation The new land should be acquired for the access road which shall be acquired with good some of compensation cost.
Only a small section of new land should be needed, which can require to advance the design speed.
Most of the business structures that located at the Sanga roadside are within the ROW area therefore these should be sifted as per the Road Act.
However, beyond the existing ROW area, it may require further new area to maintain design speed in sharp bends area.
There is the high possibility of Sanga to falls behind in its development and economic activities with the tunnel option.
With the tunnel option and diversion, the present economic hub with various ongoing economic activates will not be hamper as this area is one section of long road route from eastern side of the country.
Will there be any impact on the structure and housed located above the Tunnel section and will there be compensation for the effected land and structure around and above the tunnel section?
There will not be any adverse impact on the structure and housed located above the Tunnel section. Compensation will be paid for the access road area to the tunnel section and the portal area of the tunnel.
16.2.13 Associated Social Issues and Actions during Construction
Following items are proposed for any related organizations, companies, and local people.
The child below 16 years of age have to be strictly prohibited to use as child labor Wage should be same amount for men and female workers for same types of work The contractor(s) have to be safety first in any situations and works to avoid accidents Trainings will be provided to all construction workers about health and safety measures Fencing will be done to restrict public movement around the construction sites; Protective gear such as helmets, boots, gloves and masks will be provided to construction
workers, supervisors and visitors Warning signs/posts will be installed for informing the local people about the potentially
dangerous areas Only authorized persons will be given responsibility to operate machinery and other heavy
equipment Temporary support structures will be constructed to avoid rock falls, erosion and landslides
during construction. Soil excavation during monsoon in unstable areas will be minimized, if not totally avoided
Adequate lighting and ventilation facilities will be maintained at all construction sites Emergency equipment like first-aid kits, flashlights, fire extinguishers, siren, emergency vehicles
and phones will be made available at construction sites Qualified medical personnel will be appointed at the construction sites to oversee emergencies
related to occupational health and safety

16-69
An Emergency Response Contingency Plan will be prepared to appropriately deal with emergencies. The workers will be trained to follow the plan in case of accidents
The contractor(s) or the client will obtain insurance against any possible injury to all project staff/workers including client's personnel. Furthermore, the responsible party will also obtain third party insurance against any possible injury to visitors and possible victims
A health center will be established in the project area for attending health matters of workers and local population during construction phase
The construction contractor is responsible for all preparatory works and ensuring drinking water and sanitation facilities required for construction workers before the commencement of work
A solid waste collection and storage system will be established in all the construction related camps and construction sites. The collected waste will be segregated as to the property of the waste such as degradable, glass, metals, plastics, cloths and leather etc. and will be stored in separate bonded areas. These materials will be disposed as to the recommendations and approval of the project environmental officer. The contractor will be made responsible for the measure
Garbage containers of adequate size will be placed at critical places in the construction related camps and construction sites. The garbage will be collected daily and segregated while storing. The contractor will be made responsible for the measure
It has been observed that some PAPs still continuously pay land levy including their former possessed land within ROW. Based on the sampling hearing, 11 cases among interviewed 22 households (corresponding to 50%) replied they are still paying land levy. This problem shall be dissolved by updating of land registration between people and land levy office, therefore, DOR shall recommend people to update their land registration during coming public consultation meeting and other public participation opportunities. In addition to the individual approach, DOR shall request and coordinate with relevant authorities on land levy to solve the situation smoothly.
CDC's determination on compensation policies shall comply with RAP, EIA and other relevant agreement between JICA and Nepali side and shall be reported its process and result to JICA.
Vibration shall be measured by selected contractor or consultant including baseline data at the point of noise measurement points and other appropriate location, if any.
If there are the people who would like to be compensated by "house for house" scheme rather than cash compensation with replacement cost, DoR shall negotiate with them to find optimal solution
16.3 LAND ACQUISITION AND RESETTLEMENT
Land Acquisition (LA) and Involuntary Resettlement (IR) caused by the Project shall be planned, implemented, and monitored properly based on JICA's Guidelines for Environmental and Social Considerations with World Bank's Operational Policies. Such standard of requirement will be satisfied by Nepalese domestic laws and regulations represented by Environmental and Social Management Framework (ESMF) of DOR in general. However, any policy gaps between above mentioned international policies/standards and Nepalese country system would be coordinated and solved by

16-70
project specific measures in Resettlement Action Plan (RAP) and other relevant documents. RAP is attached as Appendix-B.
16.3.1 Components Causing Resettlement
16.3.1.1 Estimated Impacts and Impact Areas
(1)Positive Impacts
Increasing traffic capacity of the SD Road will contribute to regional connection and development, especially enhancement of mobility, logistics, farming products, socio-economic investment, commuting, and access to social facilities including hospitals. Economic benefit is analyzed in 22.1.3 "Economic Benefit of the Project".
(2)Negative Impacts
Land acquisition and resettlement will be required for the project components of road widening, curve improvement, tunnel section, construction of road-related facilities, etc. Displaced households will have negative impacts on their livelihood, production level, and living standards, especially vulnerable groups who occupy the land within ROW.
(3)Impact Areas
The Project is located in Bhaktapur and Kavrepalanchok Districts. Most of the SD Road sections have ROW with land clearance such as in Banepa Town, however, some scattered local houses within ROW in Jagati, Nalinchowk, Sanga, and Dhulikel are observed. Such areas with private properties within ROW will have major impacts by land acquisition. The project affected area are presented in Table 16.3-1.
Table 16.3-1 The Municipality included in the Project Affected Area
District Municipality Ward No
Bhaktapur Bhaktapur 4,5,7,8 Suryabinayak 6,8,9,10,11 & 12
Kavrepalanchowk Banepa 5,6,8, 10, 11,13 &14 Dhulikhel 3,4,6 & 7
Source: JICA Survey Team January 2018 * including, 10 institutes are to be affected

16-71
Source: IEE Report of Upgrading/Widening of Arniko Highway to Six Lane Standard - Suryabinayak-Dhulikhel Section, 2011
Figure 16.3-1 Districts included in the Project Affected Area
16.3.1.2 Avoidance and Minimization of Impacts
Negative impacts caused by land acquisition and resettlement should be avoided as much as possible. If the situations cannot avoid such kinds of impact with possible measures, the impact should be minimized with technical and socio-economical means. Especially during the designing phase, the following points were considered in discussions of road alignment.
Secure the traffic and pedestrian safety on the SD road and vicinity. Minimize the volume of soil/rock disposal Minimize the number of persons required involuntary resettlement Avoid or minimize negative impacts on resource use, such as farmland, water and forest Avoid negative impacts on local cultural and religious places and activities.
16.3.1.3 Outline of the Possible Impact
Based on the results of the Census/Socio-economic survey conducted in the period of January to February 2015 and again updated January 2018 along the road alignment under the JICA preparatory Survey, the number of affected household/person by the project was estimated. 1,693 persons of 386 households including 10 institutions are likely to be affected on their structure and land. The summary of PAPs is shown in Table 16.3-2, and breakdown of the PAPs in terms of social vulnerable classification are shown in Table 16.3-3.
Tunnel Section
1km

16-72
Table 16.3-2 Summary of the PAPs
Type of Loss Number of Project Affected Household
Number of Project Affected Persons
Legal Illegal Total Legal Illegal Total
Required for displacement 1. House Holds (Structure owners within the ROW) - 161 161 - 864 864
2. House Holds (Structure owners on private land) 73 - 73 416 - 416
3. Institutions (government offices*, etc.) 2 8 10 - - 0
Sub-Total 75 169 244 416 864 1,280
Not required for displacement 4. Land owner 40 - 40 208 - 208
Grand Total (1-4) 115 169 284 624 864 1,488 * Government offices, such as police box, are coordinated between government and government for relocation Source: Census/Socio-economic Survey, Jan-Feb 2015 updated in 2018
Table 16.3-3 Summary of the PAPs
Number of Household Legal Illegal Total
Whole Affected Households (A) 115 169 284 Affected Households Not belonging in Social Vulnerable Groups (B)=(A) - (C) 105 104 209
Among (C), Social Vulnerable Groups
- Poor Household 8 54* 62 - Women Headed Household 2 10 12 - Other category, if any. e.g. handicapped headed etc.
0 1 1
Total (C) 10 65 75 * 6 Households of Dalit
16.3.1.4 Elements of Impact
(1)Land
Project affected land is classified into two major types: (1) land within the existing ROW, these are classified "Illegal" in Table 16.3-4, and (2) land beyond the existing ROW (private owned land). The cadastral survey shows that approximately 16.76 hectares private lands will be required for the Project including new alignment bypass area of Nalinchowk to Sanga and other curve improvements along the road. The necessary land areas in each Municipality are shown in Table 16.3-5, Land use of the affected land along the project alignment are residential land and small business land. Some areas including a part of approach roads to the tunnel is used as farming land.

16-73
Table 16.3-4 Required Land Acquisition
S.N. Municipalities Private Land (Sqm)
Remarks
1 Bhaktapur 663.69 -
2 Suryabinayak 10,6261.42 Due to merge Sipadole, Nangkhel and hittapole in Suryabinayak Municipality; also added in west portal
3 Banepa 35,329.16 Due to merge of Nasikasthan Sanga and gratara Janagal in Banepa Municipality
4 Dhulikhel 25,438.14 -
Total 167,692.41 (16.76 ha)
Source: Cadastral Survey, Jan-Feb 2015 and January 2018
(2)Structures
Residential, business, and institutional structures are the three major types of project affected structures across the project areas. The Project will cause resettlement of 234 houses/structures as shown in Table 16.3-5. Out of them, 10 houses/structures are belonging to institutions.
Table 16.3-5 Resettlement Needed for Houses/Structures
No. Type Number of House structures
1 Simple Hut/Shed 3
2 Thatched roof, walls constructed with bamboo and mud/stone 10
3 Tile/iron roof, walls constructed with brick/ mud/stone 126
4 Iron sheet/roofing with stone/ brick wall/cemented plaster 47
5 RCC Building 48
Total 234 Source: Census/Socio-economic Survey, Jan 2018
(3)Trees and Crops
According to the results of the field surveys, 127 trees are private trees (8 owners). There are some farming areas in both within and beyond ROW and different kinds of crops including rice. It is not necessary to pay compensation for the crops, if the project provides sufficient time (at least 6 months) for harvesting the crops. However, in the case of short notification (less than 6 months) the Project have to pay compensation to the crop owners.
(4) Loss of Public Resources and Utilities
There are some natural resources such as spring water including wells, perennial rivers and Suryamul Perunge community forest around Sanga pass section. Among that, the water-related utilities are used by community for their daily life. These facilities have been made and maintained by specific individual and/or community people since long. The followings are the major public utilities falls under the ROW of the SD Road:
16-74
1)Traditional Use of Water Spouts
Three water spouts are located along the road and some of them are within ROW. These are the substantial water resource for the communities nearby, such as the point in Bhaktapur and the point near Sanga in Kavrepalanchowk district. The local people want to relocate all such water related utilities while the Project implementation, therefore, relocation cost for these spouts are considered.
2)Water Related Facilities
Being in the monsoon climatic zone, Nepal receives excessive rainfall in the rainy season / the summer with the duration between May to September in general. The monsoon rain does not come in regular basis, therefore, the farmers have to depend on perennial rivers for their paddy field and the other farming activities. Therefore, different communities have built drainage facilities along the road that may be disturbed by the Project. Therefore, the Project should rehabilitate such utilities in appropriate way.
3)Electric/Telecommunication Poles
Electric and telecommunication poles are one of the major obstacles for the Project and they are extended along the whole road section. Electric and telecommunication poles located in the edges of the existing road must be relocated to outside of ROW or project required width at each section before construction by responsible authorities. These all electric and telecommunication poles are made of cement, metal and wooden materials. As per the existing engineering design, 588 electric poles and 490 telecommunication poles in total are required to be relocated.
(5)Temporary Loss of Land
The project requires some temporary land for the construction activities, construction yards/camp site, project office and stock piling area, etc. These required temporary lands should be managed by the contractor as per the agreement made with the project owner. The temporary land use (lease) should be properly and adequately compensated, if the land is a private property. It is preferable to use state land for the temporary purpose to reduce adverse impact on private land and to save cost of the Project.
16.3.2 Objectives and Scopes of the RAP
16.3.2.1 Right of Way (ROW)
As per Nepal Government’s Road Standard, all roads designated as highways have a ROW of 25 m on either side from its centerline. In the context of the Arniko Highway, GON had proclaimed the public road between Kathmandu to Kodari as a highway based on the Highway Act (1965). GON then has published a notice in the gazette on 11/11/1965 declaring the 25 yards (equal to 22.8 m) of widths in each side from the central line of the road as ROW which was later amended as 25 m. In addition to the above-mentioned incident, as per the Supreme Court’s decision, the GON decided that in a section of the Arniko Highway between Sanga Chock to Banepa (Chandeshwori River) has 25 yards (or 22.8 m) as ROW (as per National Gazzette of 11 March 2002). Thus, ROW of whole

16-75
Arniko Highway (144 km) from Kathmandu to China border Kodari, has been declared several times in different sections as Table 16.3-6.
Table 16.3-6 Declaration on ROW of the Project
Time Document Ministry ROW Section Grounds 1965/11/11 [2021]*
Rajpatra (Gazette)
Ministry of Physical Planning and Works (MoPPW)**
25 yards Kathmandu-Kodari (Arniko Highway)
Public Road Act 2021(Article 2 &3)
1978/3/20 [2034]*
Rajpatra (Gazette)
25 meter Kathmandu-Bhaktapur Public Road Act 2031(Article 3)
2002/11/27 [2058]*
IEE Report 25 yards Sanga (Chowk)-Banepa (Chandeshwari Khola) 20km+870 to 26km+585
Public Road Act 2031(Article 3)
*Bikram Sambat (Nepali Calendar) ** Already restructured to MOPIT In addition to the Government's declarations, due to past declaration processes regarding ROW, several Supreme Court cases have been observed on ROW of SD Road as Table 16.3-7. The decisions support that ROW is principally state land.
Table 16.3-7 Supreme Court Cases
Time Complaints Decision 2002/11/1 [2058]*
Acquiring the land 25 m both sides from centerline of Arniko Highway without compensation of the land [Location: Bhaktapur]
Dismissed all the processes of land acquisition and coded that to use land compensation measures written in article 4 of Public Road Act, 1975. 2006/1/30
[2062]* Acquiring the land 25 m both sides from centerline of Arniko Highway without compensation of the land from Sanga Bhanjhyang to Dhullikhel
*Bikram Sambat (Nepali Calender)
According to the past record as above, ROW of the SD Road is considered as shown in Figure 16.3-2.
Figure 16.3-2 Declared ROW for the SD Road Sections
Though most people have set backed from the defined ROW, they are still utilizing the remaining land as business purpose and agricultural activities. In such areas, they have constructed temporary structure

16-76
for business purpose or cultivated for agricultural production. Considering above mentioned legal validity and uncertainty location by location, DOR agreed to apply ROW of 25 yards (not 25m) for the Project to compensate for land between the line of 25 yards from centerline and 25 m from centerline.
16.3.3 Socio-Economic Status
The information obtained from household survey is useful for two major perspectives. First, the information formed the basis for the preparation for RAP, and second; they will be used it in course of monitoring and evaluation of project impact.
16.3.3.1 Population
The population composition of project affected households is presented in Table 16.3-8.
Table 16.3-8 Distribution of Project Affected Households
Districts Municipality Households Male Female Total
Bhaktapur Bhaktapur 27 90 94 184
Suryabinayak 97 330 303 633
Kavrepalanchok Banepa 125 355 350 705
Dhulikhel 23 87 71 158 Total 272 862 818 1,680
Source: Census/Socio-economic Survey, Jan 2018Table 16.3-9 shows the distribution of different age group populations across the SD Road.
Table 16.3-9 Population Size by Age Group
Districts Municipality HHs >4 Yrs 5-14 Yrs 15-59 Yrs <60 Yrs Total
Bhaktapur Bhaktapur 27 12 15 135 22 184
Suryabinayak 97 47 75 455 56 633
Kavrepalanchok Banepa 125 41 120 473 71 705
Dhulikhel 23 19 19 104 16 158 Total 272 119 229 1,167 165 1,680
% 7.08 13.63 69.46 9.82 100 Source: Census/Socio-economic Survey, Jan-2018
16.3.3.2 Ethnic Composition
Ethnic composition of the project affected households is shown in Table 16.3-10. Although it was observed that there are several different ethnics along the project site, the situation is very common in Nepal. According to instruction from MOFE and based on past project cases, the Project does not need to prepare ingenious people plan, because there are no marginalization and socio-economical differences among different ethnics around Kathmandu area and long the Arniko Highway. In addition, ingenious people plan is considered in remote mountainous area principally in Nepal based on past cases.

16-77
Table 16.3-10 Ethnic Composition of Affected Households (HHs)
District Municipality HHs Brahmin Chhetri Janjati Dalit Others Total
Bhaktapur Bhaktapur 27 - - 26 - 1 27 Suryabinayak 97 3 31 58 2 3 97
Kavrepalanchok Banepa 125 22 7 89 3 4 125 Dhulikhel 23 5 5 12 1 - 23
Total 272 30 43 185 6 8 272 % 11.03 15.81 68.01 2.21 2.94 100
Source: Census/Socio-economic Survey, Jan 2018
16.3.3.3 Occupational Status
Dependency on labor, foreign employment, and pension are also recorded. Occupational status is shown in Table 16.3-11.
Table 16.3-11 Occupational Status of Surveyed population
Occupations Bhaktapur District Kavrepalanchok District
Total % Bhaktapur Suryabinayak Banepa Dhulikhel
Agriculture 6 63 93 17 179 17.9 Business/Trade 38 119 155 41 353 35.3 Service 20 64 45 8 137 13.7 Domestic work 24 56 98 2 180 18.0 Labor 7 18 8 6 39 3.9 Employment 4 13 11 0 28 2.8 Others 14 30 29 11 84 8.4
Total 113 363 439 85 1,000 100.0 Source: Census/Socio-economic Survey, Jan 2018
16.3.3.4 Educational Status
Table 16.3-12 presents the educational status of the project affected population surveyed.
Table 16.3-12 Educational Status of the Project Affected Population
Districts Municipality Illiterate Read write 1-10 10 passed Certificate Bachelor Total
Bhaktapur Bhaktapur 24 16 44 25 33 30 172 Suryabinayak 57 44 218 88 113 66 586
Kavrepalanchok Banepa 97 52 254 138 92 35 668 Dhulikhel 11 12 49 23 26 18 139
Total 189 124 565 270 264 149 1,561 % 12.1 7.9 36.2 17.3 16.9 9.5 100.0
Source: Census/Socio-economic Survey, January 2018
16.3.3.5 Skill Availability
Table 16.3-13 presents the skills availability of the surveyed PAPs.

16-78
Table 16.3-13 Status of Skill Persons of Surveyed Households
Districts Municipality Mason Carpenter Sewing/cutting
House wiring Driving Technical
work Computer Others Total
Bhaktapur
Bhaktapur 0 1 0 0 0 2 8 0 11 Suryabinayak 1 2 2 0 2 9 29 0 45
Kavrepalanchok Banepa 0 1 3 1 4 11 1 10 31 Dhulikhel 0 0 3 0 1 1 14 3 22
Total 1 4 8 1 7 23 52 13 109 Source: Census/Socio-economic Survey, Jan-2018
16.3.3.6 Household Income
Table 16.3-14 shows the average annual income of the project affected households by Municipalities.
Table 16.3-14 Average Annual Income Range of the Surveyed Households
Municipality < 0.05 Million 0.1-0.2 Million 0.2-0.5Million > 0.5 Million Total Bhaktapur Municipality 1 7 12 7 27 Suryabinayak Municipality 2 33 45 31 98 Banepa Municipality 14 62 36 13 125 Dhulikhel Municipality 2 8 9 4 23
% 7.0 40.4 37.5 15.1 272 Source: Census/Socio-economic Survey, Jan-2018
16.3.3.7 Food Sufficiency from own Agriculture Production
The food sufficiency status of surveyed household is presented in Table 16.3-15.
Table 16.3-15 Food Sufficiency Status among Project Affected Areas
District Municipality > 3 Month 3-6 Months 6-12 Months
< 12 Months Total
Bhaktapur Bhaktapur Municipality 26 0 0 1 27 Suryabinayak Municipality 87 2 8 0 97
Kavrepalanchok Banepa Municipality 90 22 8 5 125 Dhulikhel Municipality 20 1 2 0 23
Total 223 23 18 6 272 % 81.99 9.19 6.62 2.21 100
Source: Census/Socio-economic Survey, Jan-2018
16.3.3.8 Fulfillment of Food Deficiency
Table 16.3-16 is presented the fulfillment of food deficiency of survey households:
Table 16.3-16 Fulfillment of Food Deficiency
Districts Municipality Business Wage Local Remittance Total
Bhaktapur Bhaktapur Municipality 19 2 0 2 Suryabinayak Municipality 60 5 0 5
Kavrepalanchok Dhulikhel Municipality 16 0 1 1 Banepa Municipality 61 24 22 46
Total 156 31 23 210 % 74 15 11 100
Source: Census/Socio-economic Survey, Jan-2018

16-79
16.3.3.9 Acceptance / Impression of the Project
Based on the interview survey, different acceptance / impression of the project was observed among PAPs as described in Table 16.3-17.
Table 16.3-17 AP’s Acceptance / Impression of the Project
District Municipality Don’t Know Bad Good Good
and Bad Very good Total
Bhaktapur
Bhaktapur Municipality 1 2 1 23 0 27
Suryabinayak Municipality 1 8 11 77 0 97
Kavrepalanchok
Banepa Municipality 12 12 12 88 0 124
Dhulikhel Municipality 0 5 0 17 1 23
Total 14 27 25 205 1 272 % 5.15 9.93 9.19 75.37 0.37 100
Source: Census/Socio-economic Survey, Jan-2018
16.3.3.10 Physical Relocation
All the PAPs have agreed to physical relocation or set back their affected properties if they get proper compensation amount. However, some PAPs showed their opinion that compensation for land within ROW is needed for their relocation. ROW has been declared and court decision also support that the land within ROW is not eligible for compensation. Structures within ROW should be compensated, and PAPs that become landless due to the loss of land within ROW should also be compensated.
16.3.3.11 Compensation Mode
The results of opinion from the affected households are shown in Table 16.3-18.
Table 16.3-18 Perception about Compensation Modes
District Municipality Not Answer Cash
Land for
Land
House for
house
Land for land & house
for house
Total
Bhaktapur Bhaktapur 2 25 0 0 0 27 Suryabinayak 5 80 5 6 1 97
Kavrepalanchok Banepa 6 87 11 8 12 124 Dhulikhel 1 22 0 0 0 23
Total 14 214 16 15 13 272 % 5.15 78.68 5.88 5.51 4.78 100
Source: Census/Socio-economic Survey, Jan-2018
16.3.4 Information Disclosure and Public Information
Representatives of each district and Municipalities (Bhaktapur, Suryabinayak, Banepa and Dhulikhel) in the project area, and leaders of the communities shall co-ordinate with DOR to implement

16-80
information disclosure and public information appropriately. The drafted RAP should be disclosed on the website of related Municipalities as well as JICA's website and DOR website with summary written in Nepali. Following documents in implementation stage related to land acquisition and resettlement also have to be disclosed at district offices and Municipalities for public interests.
16.3.5 Domestic Law and Regulations
16.3.5.1 Land Acquisition Act (1977)
The Land Acquisition Act, 1977 has been enacted to integrate the laws for Acquisition of Land, 1962, and partially updated in 1993 by its subsequent amendment. Steps of Land Acquisition plan as per Land Acquisition Act 1977 are presented in Figure 16.3-3
Figure 16.3-3 Land Acquisition Process (Based on land Acquisition Act 1977)
16.3.5.2 Land Acquisition Guidelines (1989)
Under these guidelines the concerned officials, with the assistance of the project team, are to carry out assessments of project affected families to identify their standard of living and types of assets. Valuation of land and asset lost were to be based on comparative market values of similar assets in the vicinity. The guidelines also included arrangements for rehabilitation of project-affected families.
16.3.5.3 Public Road Act (1974)
The Public Road Act, 1974 has been enacted to ensure the construction and operation of the road

16-81
projects smoothly. Section 3 of the Act empowers GON to prohibit the construction of permanent structures (buildings) in the prescribed distance from the road, i.e. the DOR has the authority over everything within the boundaries of the road. The DOR may acquire temporarily the land and other property adopting compensatory measures during the construction, rehabilitation and maintenance of the public road (Sections 14 and 15). The Act obliges the DOR to plant trees on both sides of the road and handover it to the local bodies (Municipality) for their management (Section 16). The Act also empowers the DOR to operate quarries and borrow pits and other facilities during the road construction (Section 17).
16.3.5.4 Public Road Management and Land Acquisition Directives, DOR, (2002)
The DOR has published a directive for Public Road Management and Land Acquisition in 2002 for the use in road management and land acquisition. Under this Directive the concerned officials, with the assistance of the project team, are to carry out assessments of project affected families to identify their standard of living and types of assets. Valuation of land and asset lost were to be based on comparative market values of similar assets in the vicinity. The Directive also included arrangements for rehabilitation of project-affected families.
16.3.5.5 Environmental and Social Management Framework, DOR, (2007)
The ESMF is applicable to all proposed subproject activities and through all stages of the subproject cycle, i.e. from pre-planning, planning and design, implementation to post-implementation. Details are described in EIA part of this report.
16.3.5.6 JICA’s Policy on Involuntary Resettlement
The policy provisions on involuntary resettlement of JICA are shown in the JICA's Environmental Guidelines. And item 3 of Article 2.6 in this guideline describes that “JICA confirms that projects do not deviate significantly from the World Bank’s Safeguard Policies”. Item 2 of Article 1.6, "Requirement of project proponents" of the JICA's Environmental Guidelines describes that involuntary resettlement in case of Category A project must be fulfill Article 7, "Involuntary Resettlement" of Annex 1 "Environmental and social consideration required for intended project": "it is desirable that the resettlement action plan include elements laid out in the World Bank Safeguard Policy, OP. 4.12, Annex A". JICA's fundamental policy on involuntary resettlement is shown in Table 16.3-19.
Table 16.3-19 JICA's Policy on Involuntary Resettlement
I. The Government of recipient country will use the Project Resettlement Policy (the Project Policy) for a JICA's project specifically because existing national laws and regulations have not been designed to address involuntary resettlement according to international practice, including JICA’s policy. The Project Policy is aimed at filling-in any gaps in what local laws and regulations cannot provide in order to help ensure that PAPs are able to rehabilitate themselves to at least their pre-project condition. This section discusses the principles of the Project Policy and the entitlements of the PAPs based on the type and degree of their losses. Where there are gaps between the recipient country legal framework for resettlement and JICA’s Policy on Involuntary Resettlement, practicable mutually agreeable approaches will be designed consistent with Government practices and JICA’s Policy.
II. Land acquisition and involuntary resettlement will be avoided where feasible, or minimized, by identifying possible

16-82
alternative project designs that have the least adverse impact on the communities in the project area. III. Where displacement of households is unavoidable, all PAPs (including communities) losing assets, livelihoods or
resources will be fully compensated and assisted so that they can improve, or at least restore, their former economic and social conditions.
IV. Compensation and rehabilitation support will be provided to any PAPs, that is, any person or household or business which on account of project implementation would have his, her or their:
Standard of living adversely affected; Right, title or interest in any house, interest in, or right to use, any land (including premises, agricultural and grazing
land, commercial properties, tenancy, or right in annual or perennial crops and trees or any other fixed or moveable assets, acquired or possessed, temporarily or permanently;
Income earning opportunities, business, occupation, work or place of residence or habitat adversely affected temporarily or permanently; or
Social and cultural activities and relationships affected or any other losses that may be identified during the process of resettlement planning.
V. All affected people will be eligible for compensation and rehabilitation assistance, irrespective of tenure status, social or economic standing and any such factors that may discriminate against achievement of the objectives outlined above. Lack of legal rights to the assets lost or adversely affected tenure status and social or economic status will not bar the PAPs from entitlements to such compensation and rehabilitation measures or resettlement objectives. All PAPs residing, working, doing business and/or cultivating land within the project impacted areas as of the date of the latest census and inventory of lost assets(IOL), are entitled to compensation for their lost assets (land and/or non-land assets), at replacement cost, if available and restoration of incomes and businesses, and will be provided with rehabilitation measures sufficient to assist them to improve or at least maintain their pre-project living standards, income-earning capacity and production levels.
VI. PAPs that lose only part of their physical assets will not be left with a portion that will be inadequate to sustain their current standard of living. The minimum size of remaining land and structures will be agreed during the resettlement planning process.
VII. People temporarily affected are to be considered PAPs and resettlement plans address the issue of temporary acquisition.
VIII. Where a host community is affected by the development of a resettlement site in that community, the host community shall be involved in any resettlement planning and decision-making. All attempts shall be made to minimize the adverse impacts of resettlement upon host communities.
IX. The resettlement plans will be designed in accordance with recipient country's Involuntary Resettlement Policy and JICA’s Policy on Involuntary Resettlement.
X. The Resettlement Plan will be translated into local languages and disclosed for the reference of PAPs as well as other interested groups.
XI. Payment for land and/or non-land assets will be based on the principle of replacement cost. XII. Compensation for PAPs dependent on agricultural activities will be land-based wherever possible. Land-based
strategies may include provision of replacement land, ensuring greater security of tenure, and upgrading livelihoods of people without legal land titles. If replacement land is not available, other strategies may be built around opportunities for re-training, skill development, wage employment, or self-employment, including access to credit. Solely cash compensation will be avoided as an option if possible, as this may not address losses that are not easily quantified, such as access to services and traditional rights, and may eventually lead to those populations being worse off than without the project.
XIII. Replacement lands, if the preferred option of PAPs, should be within the immediate vicinity of the affected lands wherever possible and be of comparable productive capacity and potential1. As a second option, sites should be identified that minimize the social disruption of those affected; such lands should also have access to services and facilities similar to those available in the lands affected.
XIV. Resettlement assistance will be provided not only for immediate loss, but also for a transition period needed to restore livelihood and standards of living of PAPs. Such support could take the form of short-term jobs, subsistence support, salary maintenance, or similar arrangements.
XV. The resettlement plan must consider the needs of those most vulnerable to the adverse impacts of resettlement (including the poor, those without legal title to land, ethnic minorities, women, children, elderly and disabled) and ensure they are considered in resettlement planning and mitigation measures identified. Assistance should be provided to help them improve their socio-economic status
XVI. PAPs will be involved in the process of developing and implementing resettlement plans. XVII. PAPs and their communities will be consulted about the project, the rights and options available to them, and
proposed mitigation measures for adverse effects, and to the extent possible be involved in the decisions that are made concerning their resettlement.
XVIII. Adequate budgetary support will be fully committed and made available to cover the costs of land acquisition 1 Agricultural land for land of equal productive capacity means that the land provided as compensation should be able to produce the same
or better yield the AP was producing on his/her land prior to the project. The production should be in the planting season immediately following the land acquisition. It can be for a future period if transitional allowance equal to the household’s previous yield is provided to the AP household while waiting for the land to get back to the same productivity as the previous land.

16-83
(including compensation and income restoration measures) within the agreed implementation period. The funds for all resettlement activities will come from the Government.
XIX. Displacement does not occur before provision of compensation and of other assistance required for relocation. Sufficient civic infrastructure must be provided in resettlement site prior to relocation. Acquisition of assets, payment of compensation, and the resettlement and start of the livelihood rehabilitation activities of PAPs, will be completed prior to any construction activities, except when a court of law orders so in expropriation cases. (Livelihood restoration measures must also be in place but not necessarily completed prior to construction activities, as these may be ongoing activities.)
XX. Organization and administrative arrangements for the effective preparation and implementation of the resettlement plan will be identified and in place prior to the commencement of the process; this will include the provision of adequate human resources for supervision, consultation, and monitoring of land acquisition and rehabilitation activities.
XXI. Appropriate reporting (including auditing and redress functions), monitoring and evaluation mechanisms, will be identified and set in place as part of the resettlement management system. An external monitoring group will be hired by the project and will evaluate the resettlement process and final outcome. Such groups may include qualified NGOs, research institutions or universities.
Cut-off-date of Eligibility The cut-off-date of eligibility refers to the date prior to which the occupation or use of the project area makes
residents/users of the same eligible to be categorized as PAPs and be eligible to Project entitlements. In the Project, Cut-off dates are the date of notification on meaning of cut-off-date and is the beginning date of the population census). This date has been disclosed to each affected village by the relevant local governments and the villages have disclosed to their populations. The establishment of the eligibility cut-off date is intended to prevent the influx of ineligible non-residents who might take advantage of Project entitlements
Principle of Replacement Cost All compensation for land and non-land assets owned by households/shop owners who meet the cut-off-date will be
based on the principle of replacement cost. Replacement cost is the amount calculated before displacement which is needed to replace an affected asset without depreciation and without deduction for taxes and/or costs of transaction as follows:
For example: a. Productive Land (agricultural, aquaculture, garden and forest) based on actual current market prices that reflect recent
land sales in the area, and in the absence of such recent sales, based on recent sales in comparable locations with comparable attributes, fees and taxes or in the absence of such sales, based on productive value;
b. Residential land based on actual current market prices that reflect recent land sales, and in the absence of such recent land sales, based on prices of recent sales in comparable locations with comparable attributes; fees and taxes.
c. Existing local government regulations* for compensation calculations for building, crops and trees will be used where ever available.
d. Houses and other related structures based on actual current market prices of affected materials; e. Annual crops equivalent to current market value of crops at the time of compensation; f. For perennial crops, cash compensation at replacement cost that should be in line with local government regulations,
if available, is equivalent to current market value given the type and age at the time of compensation. g. For timber trees, cash compensation at replacement cost that should be in line with local government regulations, if
available, will be equivalent to current market value for each type, age and relevant productive value at the time of compensation based on the diameter at breast height of each tree.
16.3.6 Policy Gap Analysis
Policy gaps related to land acquisition and resettlement were analyzed by comparing the JICA's Guidelines for Environmental and Social Considerations and the Nepali legal system as follows;
(1) Compliance to Nepali country system, such as Land Acquisition Act, Public Road Act, Road Standard, and etc.
(2) Application of Environmental and Social Management Framework (ESMF) with a standard of World Bank's Safeguard Policy (Operational Policy, OP)
(3) Following to JICA Guidelines for Environmental and Social Considerations as well as relevant World Bank's Safeguard Policy, Resettlement Sourcebook, and etc.

16-84
Stopgap measures will be discussed in the RAP among above mentioned three pillars of resettlement policies. Image of policy gap and RAP is shown in Figure 16.3-4, while policy gap analysis concerning land acquisition and resettlement is shown in Table 16.3-20.
Figure 16.3-4 Image of Policy Gap and RAP
Table 16.3-20 Policy Gap Analysis between JICA Guidelines and Nepali Country System
No.
(A) JICA Guidelines for Environmental and Social Considerations with World Bank Safeguard Policy
(B) Nepali Law & Regulations
Gaps between (A) and (B)
Countermeasures for filling gaps
1. Involuntary resettlement and loss of means of livelihood are to be avoided when feasible by exploring all viable alternatives.
The adverse impacts can be minimized or avoided or dealt with positive and constructive ways (1.1.1, ESMF)
No significant gaps are observed. This item is not clearly mentioned in domestic laws, however, ESMF covered it.
Based on ESMF, Land Acquisition Act, and the JICA's Environmental Guidelines, land acquisition and resettlement shall be avoided and/or minimized during alignment decision process, structure planning, and any other discussion related to resettlement impact in the Project.
2. When population displacement is unavoidable, effective measures to minimize impact and to compensate for losses should be taken.
- The adverse impacts can be minimized or avoided or dealt with positive and constructive ways (1.1.1, ESMF) - Government of Nepal may, if it so deems necessary, acquire any land at any place for any public purpose, subject to compensation under this Act (Article 3, Land Acquisition Act)
No significant gaps are observed.

16-85
No.
(A) JICA Guidelines for Environmental and Social Considerations with World Bank Safeguard Policy
(B) Nepali Law & Regulations
Gaps between (A) and (B)
Countermeasures for filling gaps
3. People who must be resettled involuntarily and people whose means of livelihood will be hindered or lost must be sufficiently compensated and supported, so that they can improve or at least restore their standard of living, income opportunities and production levels to pre-project levels.
Thus, the affected persons in the project will be entitled to various types of compensation and resettlement assistance that will help in the restoration of their livelihoods, at least, to the pre-project standards (7.3.1, ESMF)
No significant gaps are observed. This item is not clearly mentioned in domestic laws, however, ESMF covered it.
Based on ESMF and the JICA's Environmental Guidelines, RAP secures "improve or at least restore their standard of living, income opportunities and production levels to pre-project levels" by using appropriate entitlement matrix.
4. Compensation must be based on the full replacement cost as much as possible.
When GON requires assets, national law does not specify about the provision of mandatory replacement cost. Therefore, ESMF strongly recommended that: Practical provisions must be made for the compensation for all lost assets to be made at replacement cost without depreciation or reductions for salvage materials, and including any other costs such as transaction. Efforts must be made to assess the real replacement costs of land to the extent possible. A procedure should be established for determining compensation rates accurately plus rigorous efforts to assess the replacement costs and market rates for all assets, including labor costs for construction.
There might be a gaps on determination of compensation rate between Nepali side and the JICA Environment Guidelines. In the past cases, deduction and/or using government fixed rate lower than market price are common.
Replacement Cost Survey (RCS) was conducted based on the standard of the JICA's Environmental Guidelines (the World Bank's definition and level of standards). The result is compared with the government's official unit price for determining validity. The result shall be respected for future determination process by CDC. Additional monitoring to support bridging from RAP to CDC's determination is required.
5. Compensation and other kinds of assistance must be provided prior to displacement.
ESMF referred OP 4.12: The measures (i.e. the RP) include provision of compensation and of other assistance required for relocation, prior to displacement, and preparation and provision of resettlement sites with adequate facilities, where required.
No significant gaps are observed. This item is not clearly mentioned in domestic laws, however, ESMF covered it.
Based on the JICA's Environmental Guidelines, compensation, assistance, and relocation site have to be done and prepared prior to displacement.
6. For projects that entail large-scale involuntary resettlement, resettlement action plans must be prepared and made available to the public.
ESMF regulated RAP preparation.
No significant gaps are observed. This item is not clearly mentioned in domestic laws, however, ESMF covered it.
The RAP is developed with sufficient adherence to the JICA's Environmental Guidelines.

16-86
No.
(A) JICA Guidelines for Environmental and Social Considerations with World Bank Safeguard Policy
(B) Nepali Law & Regulations
Gaps between (A) and (B)
Countermeasures for filling gaps
7. In preparing a resettlement action plan, consultations must be held with the affected people and their communities based on sufficient information made available to them in advance.
- In Chapter 5, the section of 2.2.1: The Procedural Steps in Road IEEs and EIAs of ESMF, and other sections covers all conditions concerning public participation/consultation - Domestic EIA procedure supported by some conditions in ESMF requires public consultation meeting
No significant gaps are observed. This item is not clearly mentioned in domestic laws, however, ESMF covered it.
Based on the JICA's Environmental Guidelines, in case of the Category A projects, stakeholder meetings should be organized at least two times, at the time of the draft scoping and at the time of draft reporting, supplemented by focus group meetings. In addition to above mentioned meetings, the RAP proposed promotion of public participation in monitoring stage as well as implementation stage.
8. When consultations are held, explanations must be given in a form, manner, and language that are understandable to the affected people
9. Appropriate participation of affected people must be promoted in planning, implementation, and monitoring of resettlement action plans.
10. Appropriate and accessible grievance mechanisms must be established for the affected people and their communities.
5.1 and 7.5 of ESMF stipulated establishment of grievance redress mechanism (GRM)
No significant gaps are observed. This item is not clearly mentioned in domestic laws, however, ESMF covered it.
Based on the JICA's Environmental Guidelines, GRM is planned in the RAP.
11. Affected people are to be identified and recorded as early as possible in order to establish their eligibility through an initial baseline survey (including population census that serves as an eligibility cut-off date, asset inventory, and socioeconomic survey), preferably at the project identification stage, to prevent a subsequent influx of encroachers of others who wish to take advance of such benefits.
N/A *Cut-off date is recommended to set as the date of Census survey (7.2.3, ESMF)
There is no direct regulation of recommendation regarding the item.
Based on the JICA's Environmental Guidelines, the cut-off date is explained at the 1st time stakeholder meetings * In this project, Cut-off-date was once declared on 9 November 2014. Considering the time progress and earthquake in 2016, additional Census was implemented during the additional survey to update the number of PAPs. The project considers the result of updated Census as a new cut-off-date (15 January, 2018) and households/people recorded at this timing are eligible for compensation/assistance.
12. Eligibility of benefits includes, the PAPs who have formal legal rights to land (including customary and traditional land rights recognized under law), the PAPs who don't have formal
In the proposed project, the absence of formal titles will not be a bar to resettlement assistance and rehabilitation. (7.3.1, ESMF)
No significant gaps are observed. This item is not clearly mentioned in domestic laws, however, ESMF covered it.
Based on the JICA's Environmental Guidelines, appropriate entitlements are discussed in the RAP for both formal and

16-87
No.
(A) JICA Guidelines for Environmental and Social Considerations with World Bank Safeguard Policy
(B) Nepali Law & Regulations
Gaps between (A) and (B)
Countermeasures for filling gaps
legal rights to land at the time of census but have a claim to such land or assets and the PAPs who have no recognizable legal right to the land they are occupying.
informal cases. In principle, both formal and informal settlers are eligible for compensation and other conditions, including assistances, rights to relocate to the resettlement site, etc.
13. Preference should be given to land-based resettlement strategies for displaced persons whose livelihoods are land-based.
N/A * EMSD just referred OP 4.12
Cash for land is the common way of compensation for both formal and informal land cases in Nepal, and PAPs also prefer to cash compensation generally.
PAPs shall be given compensation options based on the RAP to select "land for land" of "cash for land" as much as possible.
14. Provide support for the transition period (between displacement and livelihood restoration).
N/A The item is not clearly mentioned even in ESMF. Some kinds of assistance have a function to support such transition period.
The RAP will cover the non-registered cases and compensation for temporary business disturbance, income restoration at the early stage, or any other allowance are considered.
15. Particular attention must be paid to the needs of the vulnerable groups among those displaced, especially those below the poverty line, landless, elderly, women and children, ethnic minorities etc.
8.3 of ESMF or the part of Entitlement Matrix stipulated the considerations scheme for such vulnerable groups
No significant gaps are observed. This item is not clearly mentioned in domestic laws, however, ESMF covered it.
Based on needs assessment through stakeholder meetings, socio-economic surveys, focus group meetings etc., special considerations for vulnerable groups are discussed and reflected in the RAP.
16. For projects that entail land acquisition or involuntary resettlement of fewer than 200 people, abbreviated resettlement plan is to be prepared.
7.10 of ESMF stipulated the abbreviated RAP under the condition of fewer than 200 people
No significant gaps are observed. This item is not clearly mentioned in domestic laws, however, ESMF covered it.
Based on the JICA's Environmental Guidelines, the abbreviated RAP shall be prepared under the stipulated conditions
17. Internal and external monitoring system must be established and implemented properly
8.8 of ESMF covers monitoring and evaluation
No significant gaps are observed. This item is not clearly mentioned in domestic laws, however, ESMF covered it.
Based on JICA's Environmental Guidelines, monitoring framework composed by internal monitoring, external monitoring, and evaluation is established in the RAP.

16-88
16.3.7 Compensation Policy, Eligibility, and Entitlement
16.3.7.1 Compensation Policy
In principle, PAPs who have assets within or reside within the project affected areas before the cut-off date are entitled to compensation for their losses. Those who have lost their income and/or subsistence will be eligible for livelihood restoration assistance based on the criteria of eligibility defined by the project in consultation with the PAPs. If, by the end of the project, livelihoods have been shown not to be restored to pre-project levels, additional measures will be provided.
Fundamental compensation policies of the Project based on JICA's Guidelines for Environmental and Social Considerations are as follows:
The compensation rates will be determined based on the results of independent appraisal of the land/crops/assets (associated with the land) in a timely and consultative manner based on the replacement cost survey. All fees and taxes on land and/or house transfers will be waived or otherwise included in a compensation package for land and structures/or houses or businesses. The local authorities will ensure that PAPs choosing relocation on their own, obtain, without additional costs, the necessary property titles and official certificates commensurate with similar packages provided to those who choose to move to the project resettlement sites
Land will be compensated “land for land”, or in cash, according to PAP’s choice whichever possible. Structure will be compensated "house for house", or in cash, according to PAP's choice whichever possible. In principle, compensation will be done by cash.
PAPs that are compensated by “cash for land” will be compensated in cash at the full replacement cost. These PAPs will be assisted in rehabilitating their livelihoods and making their own arrangements for relocation.
Compensation for all residential, commercial, or other structures will be offered at the replacement cost, without any depreciation of the structure and without deduction for salvageable materials. Structures shall be evaluated individually.
The PAPs will be provided with full assistance (including a transportation allowance) for transportation of personal belongings and assets, in addition to the compensation at replacement cost of their houses, lands and other properties.
Financial services (such as loans or credits) will be provided to PAPs if necessary as a measure of livelihood restoration. The installment amounts and the schedule of payments will be within the repayment capacity of PAPs.
Additional efforts, such as economic rehabilitation assistance, training and other forms of assistance, should be provided to PAPs losing income sources, especially to vulnerable groups, in order to enhance their future prospects toward livelihood restoration and improvement.
The previous level of community services and resources, encountered prior to displacement, will be maintained or improved for resettlement areas

16-89
16.3.7.2 Eligibility Criteria
(1)Project Affected Persons (PAPs)
People directly affected by the project through the loss of land, residences, other structures, business, assets, or access to resources, specifically are:
Persons whose agricultural land will be affected (permanently or temporarily) by the Project; Persons whose residential land/houses will be affected (permanently or temporarily) by the
Project; Persons whose leased-houses will be affected (permanently or temporarily) by the Project; Persons whose businesses, occupations. or places of work will be affected (permanently or
temporarily) by the Project; Persons whose crops (annual and perennial)/ trees will be affected in part or in total by the
Project; Persons whose other assets or access to those assets, will be affected in part or in total by the
Project; and Persons whose livelihoods will be impacted (permanently or temporarily) due to restriction of
access to protected areas by the Project. Community owned assets, collective assets, enterprise, any other governmental and private
organizations, whose properties, production measures, and livelihoods will be impacted (permanently or temporarily) due to land acquisition, restriction of access, any other direct/indirect impacts by the Project.
(2)Vulnerable Groups
Based on the census/socio-economic survey and ESMF, the vulnerable groups will generally include the following:
Poor and poorest households as identified by pertinent national survey results; Poor landholders that have limited productive land (this will be determined by the minimum
amount of farm land needed to be a viable farmer in the project area) Women headed poor households All Dalit and ethnic minorities/indigenous groups as categorized by GON as vulnerable
Community members who are less able to care themselves without family or other support Landless, squatters and encroachers. Any other groups identified by the socio-economic surveys and by meaningful public
consultation.
(3)Gender
During the project implementation, deep consideration should be given to the following gender issues:

16-90
During the resettlement implementation stages, income restoration program, resettlement site preparation and any other opportunities of public hearing, women's voices should be carefully listened to know their rights and choices
The female headed households will be encouraged and supported to fully participate in planning and implementation of income restoration programs as well as assistance.
Job creation by the project implementation and operation should consider priorities on women. This Project will provide employment opportunity to a number of construction workers. However,
the Contractor may employ the outside labors to accomplish the assigned work in time, thereby exerting additional pressure on environmental resource. Hence, the Project will monitor the percentage of local construction labors according to the type of work, number of women employed, number of outside district labors and their dependents.
Preference shall be given to the residents in the Affected Area who wish to work as unskilled labor in the Project without discrimination by sex.
The advertisement of the recruitment shall be designed in the manner that as many local women as possible has access to the information. Government Property
(4)Allowances / Assistances
A) Allowances / Assistances
The households who lose their residential houses will be qualified for the displacement allowances. The displacement allowance will be as equal to 180 days minimum wage rate as established at the national or local level. The provision of displacement allowance is that the house owners are free to demolish the affected house and carry away to reuse the materials for new housing. The displacement allowance is a provisional compensation for financial difficulties of the transitional period.
B) Business / Cultivation Disruption Allowance
The household who loses own business due to the Project will be qualified for business disruption allowance equal to 180 days, as minimum wage rate as established at national or local level. Similarly, cultivation disruption allowance will be prepared to farmers who lost their productive land.
In addition, vulnerable people will receive special assistance and income restoration measures, such as livelihood enhancement training and employment opportunities during the project implementation.
(5)Public Health
Health awareness programs for the local people as well construction labors shall be organized by the Project and contractor on a regular basis (prior to construction commencement and in a yearly interval), to provide knowledge to construction workers and local population on health including the dangers and consequences of Sexually Transmitted Disease (STD) and HIV/AIDS. Additional

16-91
training for awareness rising will be given by the professional health workers in association with social supervision consultant on health aspects of STD and HIV/AIDS and human trafficking.
The awareness program related to public health, HIV/AIDS and human trafficking will be organized inviting public health expert (especially a medical practitioner of the concerned districts and concern district police officer). The role of social mobilizer and resettlement expert will be to neutralize the conflicting relationship between contractors and local stakeholders, outside labors and local labors, in relation to competition over natural and economic resources.
16.3.7.3 Entitlement
Based on JICA's principle policy, PAPs who are eligible for compensation/assistance are defined as below;
- PAPs who has legal rights, who has land certificate regarding registration, on their land
- PAPs who does not have legal rights on their land, however, their rights will be certified according to legal framework of their country if they claim their rights
- PAPs whose legal rights on their land and their right of claim are not confirmed (e.g. lessee, tenant, worker, employee, illegal occupants, other building owner, etc.)
The entitlement policy of the RAP is based on Land Acquisition Act 1977 and Environment and Social Management Framework (ESMF). The eligibility for entitlement to compensation is determined by asset ownership criteria:
(i) Those who have formal legal rights to land (including customary and traditional rights recognized under the laws of the country. In the consideration, it is also useful to document how long they have been using the land or the assets associated with it);
(ii) Those who have no recognizable legal right or claim to the land they are occupying. Persons covered under (i) are provided compensation for the land they lose, and other assistance. Persons covered under (ii) are provided resettlement assistance in lieu of compensation for the land they occupy, and other assistance, as necessary, to achieve the objectives set out in this policy, if they occupy the project area prior to a cut-off date and acceptable to JICA. Persons who encroach on the area after the cut-off date are not entitled to compensation or any other form of resettlement assistance. All persons included in (i) or (ii) are provided compensation for loss of owned or used assets other than land.
The cut-off date was once declared on 9 November 2014, however, it was set again as 15 January 2018 after the additional census in order to update the affected households. Considering the meaning of declaration for cut-off date at designing stage, illegal PAPs are once fixed by this time (15 January 2018). On the other hand, based on Land Acquisition Act, "practical cut-off date" will be set again during detailed design stage with land acquisition notice. This practical cut-off date is principally effective for legal PAPs at that time.

16-92
Based on the resettlement policy gap analysis and field surveys, PAPs' eligibility has been discussed as the entitlement matrix in Table 16.3-21.
Table 16.3-21 Entitlement Matrix
Type of Loss Entitlement Unit Description of Entitlements Implementation Measures
1. House and Other Structure
1.1 Loss of own house and residential plot
Families, households, structure owners Cash compensation at full
replacement cost, according to house type. For houses and structures, replacement cost includes the market cost of the construction materials, labor cost to build a replacement structure of a similar quality or better than the affected structure, and any other necessary cost based on the definition of replacement cost.
Valuation for structures undertaken by the project authorities on the basis of standard norms of Department of Urban Development and compensation rates determined by Compensation Determination Committee (CDC) should respect the results of replacement cost survey and the RAP supported by JICA's preparatory survey
Construction material can be salvaged by PAPs
Deduction from the full replacement cost is not allowed
Displaced households will receive a housing displacement allowance.
Notice of relocation will be given at least 35 days prior to the land clearance
Compensation and relevant assistance must be paid in advance at least before the notification of relocation
1.2 Loss of commercial establishment
Families, households, structure owners
In addition to above conditions of the case of 1.1: Owners of displaced commercial
establishments will receive 180 days business disruption allowance as equal to 180 days minimum wage rate as established at the national or local level.
1.3 Loss of other private structures
Families, households, structure owners
In addition to above conditions of the case of 1.1: Other structures include: fence, walls etc. Only the case of loss of structures is not
eligible for the displacement allowance. 2. Land
2.1 Loss of private land
Families, households (Title holder)
Provide compensation at full replacement cost, or
Provide full title to land of equal area and productivity acceptable to owner in the vicinity. Provide resettlement
assistances to restore their livelihood and living standard to pre-displacement levels or improved levels.
In the case of farmland, the PAPs will be entitled the cultivation disruption allowance equal to one-year production.
Valuation for land undertaken by the project authorities and compensation rates determined by Compensation Determination Committee (CDC) should respect the results of replacement cost survey and the RAP supported by JICA's preparatory survey
A list of affected and entitled persons and the area of land loss will be prepared
Notice to vacate will be served at least 35 days prior to acquisition.
Compensation and relevant assistance must be paid in advance at least before the notification of relocation

16-93
Type of Loss Entitlement Unit Description of Entitlements Implementation Measures
2.2 Loss of state/public land (including the land within ROW*) *ROW is considered as 25 yards (not 25m) in terms of compensation
Families, households (Non-Title holder)
Resettlement assistance to those most vulnerable PAPs to restore pre-displacement level livelihoods.
Vulnerable groups may include but not be limited to women headed households, the poorest (based on poverty line and the local wealth ratings), the disabled, the elderly and landless families.
Encroachers will not be entitled to any compensation for their affected unauthorized/illegal extensions over public land.
Encroachers belonging to vulnerable group with economic losses shall be entitled to assistance, such as livelihood restoration program, cash assistance, special considerations for the case of landless after their relocation, as vulnerable group.
Properties attached to the land are compensated by full replacement cost with the similar condition as the case of 1.1, 1.2 and 1.3
A list of affected and entitled persons and the area of land loss will be prepared
Notice to vacate will be served at least 35 days prior to acquisition.
Compensation and relevant assistance must be paid in advance at least before the notification of relocation
A family who has no living land after being relocated from the land within ROW shall be considered appropriate assistance to find their living land including additional cash support on top of compensation amount for their land attached structures.
2.3 Temporary loss of private land
Families, households
Compensation for crop, land productivity and other property losses for the duration of temporary occupation.
Compensation for other disturbances and damages caused to property.
Land should be returned to the owner at the end of temporary acquisition period, restored to its original condition, or improved as agreed with owner.
A temporary occupation contract will be signed with the affected landowner, specifying;
Period of occupancy; Formula for the calculation of production
losses (the market value of crops normally produced on the land) and annual inflation adjustments;
Frequency of compensation payment; and Land protection and rehabilitation measures. The land will be returned to the owner at the
end of temporary acquisition, restored to its original condition.
3. Other Privately Owned Resources
3.1 Loss of non-perennial crops
Owners
Advance notice to harvest crops is required. If there is not enough time to harvest, the crops will be compensated based on the replacement cost.
Crop market values will be determined by the CDCs coordinating with District Agriculture Office
3.2 Loss of privately- owned trees and perennial crops
Owners
Advance notice to harvest crops (or fruits) is required. If there is not enough time to harvest, the crops will be compensated based on the replacement cost.
Crop market values and production losses will be determined by the CDCs with assistance from a local resource specialist.
The Departments of Agriculture and Forestry will be requested to assist affected owners and communities for re-establishment of new trees and other perennial crops.
4. Community Structures and Resources
4.1 Community buildings and Structures
Local Community
Restoration of affected community's structures to at least previous condition, or replacement in areas identified in consultation with affected communities.
Affected community buildings/ structures include: schools, water points, stone spouts, irrigation canals, trails, drainage, etc. shall be relocated and rehabilitated by the Project after discussion with local community.

16-94
Type of Loss Entitlement Unit Description of Entitlements Implementation Measures
5. Rehabilitation Assistance
5.1 Displacement of household
Households
Housing displacement allowance for loss of own residential accommodation.
Displaced households will receive a displacement allowance equal to 180 days minimum wage rate as established at the national or local level.
Allowances will be paid at the time of serving the notice to vacate.
5.2 Displacement of commercial enterprise
Company / Households
Business disruption allowance for loss of commercial establishment.
The current business which require to be relocated from their residential houses or rented houses, will receive a business disruption allowance equal to 180 days minimum wage rate as established at the national or local level.
5.3 Cultivation disruption to cultivation
Titleholder Tenant
Cultivation disruption allowance for severe disruption to household cultivation levels.
The cultivation disruption allowances will apply to; Households with total landholdings of 0.25 ha
and smaller who lose more than 10 % of their landholdings;
Households with total landholdings more than 0.25 ha who lose more than 25 % of their landholdings;
Households whose production levels are to be severely affected.
The cultivation disruption allowance will be equal to one season’s production on the area of land lost, based on the norms of District Agriculture Office for the year of acquisition.
5.4 Vulnerable social categories
Vulnerable Groups
Women headed households, Dalit households and below poverty level.
A lamp sum amount of NRs 50,000 will be provided as a special assistance
Assistance in re-establishment and improvement of livelihood.
Preferential employment on road construction and maintenance to the extent possible.
6. Government Property
6.1 Loss of Infrastructure Relevant agency
Facilities will be repaired or replaced.
To be undertaken in consultation with the relevant department or ministry.
6.2 Loss of forest areas
Community Forest/Department of Forest
Mitigation by means of afforestation elaborated in EIA.
Cash compensation by DOR payable to the Community Forest/District Forest Offices equivalent to 25 sampling plantations to clearance of 1 tree with 15 cm diameter or larger.
To be undertaken in consultation with Community Forest Users/Department of Forestry.
7. Income Restoration Program
7.1 Preference in employment in wage labor in the project activities
All PAPs
PMU and other relevant authorities cooperate with contractor will consider job creation and/or job arrangement regarding construction of the project.
Construction contracts include provision that PAPs will have priority in wage labor on project construction during implementation.
PAPs shall be given priority for post construction maintenance as mandated in local body agreement
7.2 Income Restoration Program
- One member of each displaced household. * Special considerations: People who want to join in the Sanga pass area where the location is bypassed by the tunnel (They are not the target of monitoring)
Displaced PAPs who want to take income restoration program (IRP) and any cases that will be affected their means of life can apply to IRP.
IRP is designed and financed by the Project elaborated in the RAP
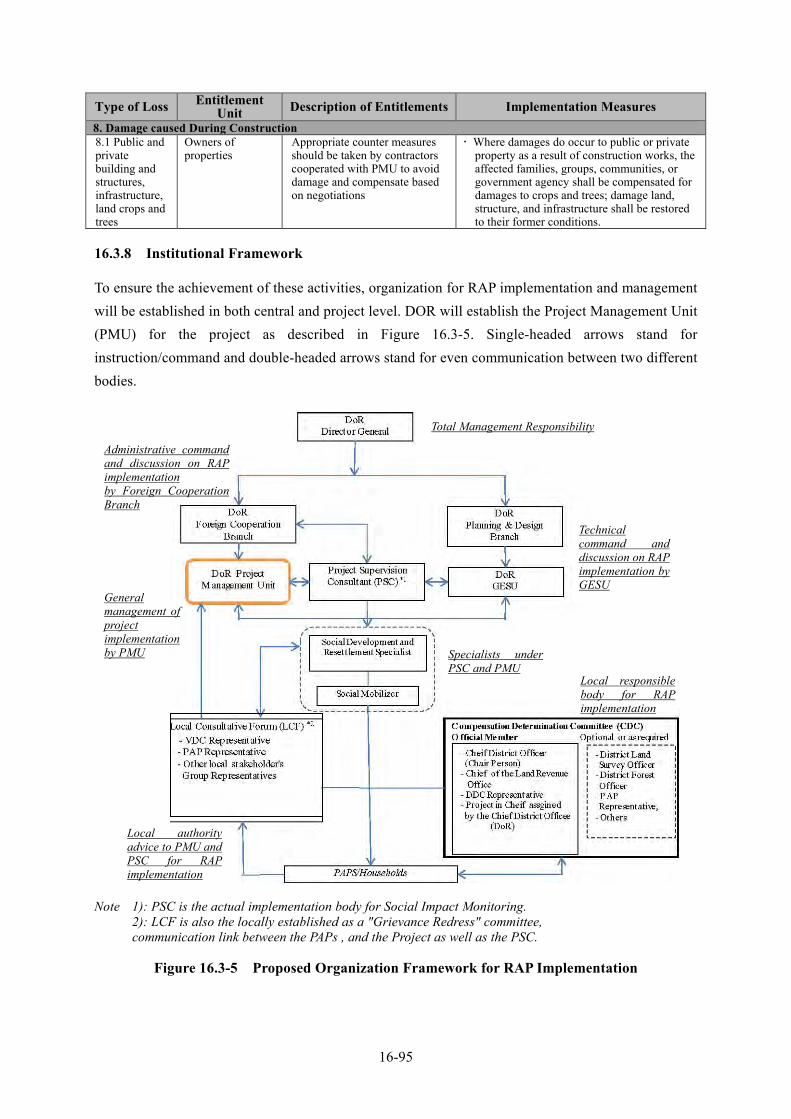
16-95
Type of Loss Entitlement Unit Description of Entitlements Implementation Measures
8. Damage caused During Construction 8.1 Public and private building and structures, infrastructure, land crops and trees
Owners of properties
Appropriate counter measures should be taken by contractors cooperated with PMU to avoid damage and compensate based on negotiations
Where damages do occur to public or private property as a result of construction works, the affected families, groups, communities, or government agency shall be compensated for damages to crops and trees; damage land, structure, and infrastructure shall be restored to their former conditions.
16.3.8 Institutional Framework
To ensure the achievement of these activities, organization for RAP implementation and management will be established in both central and project level. DOR will establish the Project Management Unit (PMU) for the project as described in Figure 16.3-5. Single-headed arrows stand for instruction/command and double-headed arrows stand for even communication between two different bodies.
Note 1): PSC is the actual implementation body for Social Impact Monitoring. 2): LCF is also the locally established as a "Grievance Redress" committee, communication link between the PAPs , and the Project as well as the PSC.
Figure 16.3-5 Proposed Organization Framework for RAP Implementation
Total Management Responsibility
Technical command and discussion on RAP implementation by GESU
Administrative command and discussion on RAP implementation by Foreign Cooperation Branch
General management of project implementation by PMU Specialists under
PSC and PMU
Local authority advice to PMU and PSC for RAP implementation
Local responsible body for RAP implementation

16-96
16.3.8.1 Central Level Arrangement
Organizational arrangement in the central government level for land acquisition and resettlement starts from the financial management for land acquisition and compensation from the Ministry of Physical Infrastructure and transport (MOPIT). MOPIT is the authority which approves RAP submitted by DOR. The required money for compensation will send to the Project Management Unit (PMU) through the Department of Road (DOR). PMU takes responsibility for the overall project coordination including management of RAP implementation. The Geo-Environment and Social Unit (GESU) will lead the overall management of social environment issues including review, and approval of RAP and monitoring of timely and successful implementation of RAP.
16.3.8.2 Project Level Arrangement
While central level arrangements are necessary for coordination of RAP activities, project level arrangements are required for effective RAP implementation. There will have a PMU headed by a Project In-Charge (PIC). The PIC is responsible to form CDC in association with Chief District Officer (CDO) of concern districts. CDC is chaired by CDO. In the phase of resettlement implementation, CDC takes overall responsibility to implement RAP appropriately.The compensation amount for those affected by the Project will be fixed by a five-member compensation committee formed under chief district officer called CDC. The CDC will be formed under CDO of concern district, the other members are: Representative of District Development Committee (DDC), Chief of District Land Revenue Office, Mayor chairperson from respective Municipality and project Chief. The committee can form a technical team to determine the compensation amount. The team should derive the compensation amount by working closely with members of families that are likely to be displaced. Those not satisfied with land acquisition, resettlement and rehabilitation processes can lodge complaints at the project office and complaint hearing offices at district and regional levels. CDC determines the rate of compensation in consultation with PAPs and local stakeholders, categorizing land, and structures. The PIC will have a road section support team. Other relevant district officials will be deputed during the land and assets acquisition process when required. As the project authority, Project Management Unit (PMU) will resume overall responsibility for RAP implementation. This will require:
Implementation of procedures to minimize adverse social impacts throughout the planning, design and implementation phases
Implementation of procedures for the recording of all project affected persons by means of census and asset verification and quantification exercises;
Establishment of procedures for the coordination of resettlement and compensation activities;
Implementation of information dissemination campaigns
Capacity building initiatives to create a supportive environment for the implementation of RAP activities;

16-97
Coordination with other government line agencies, local stakeholders, NGOs to ensure effective delivery of mitigation and rehabilitation support measures.
16.3.9 Resettlement and Rehabilitation
16.3.9.1 Resettlement Site
Based on the census / socio-economic survey's data, 78.68% cases replied preference of "cash for land" compensation. In addition, opinion from PAPs at the time of stakeholder meeting provide that all the respondents have preferred cash compensation for all types of losses and PAPs didn't request the group relocation to a resettlement site. In Nepal, "cash for land" compensation is common in the past projects, and it is also expected that compensation for landless PAPs who once encroached ROW will be assisted by cash to find another place to live. PMU and CDC cooperating with local authorities have to be careful with the cash payment to avoid any improper cases that PAPs cannot find the appropriate land nearby by the amount of assistance money. If there is observed strong needs to prepare resettlement site by considerable numbers of PAPs in the following detailed design phases, PMU should consider the feasibility of the resettlement site preparation.
16.3.9.2 Income Restoration Program (IRP)
Income Restoration Program (IRP) shall be introduced by independent consultant and/or local government contracted by DOR. When PAPs lose business bases, jobs and other income sources, regardless of whether or not they lose their houses; those who lose both houses and income sources are the Project's highest risks. Providing measures to restore livelihood and quality of the life are the core target of the RAP. The objective of IRP is to restore the livelihoods of PAPs to the same level or higher than before the Project implementation.
(1)Target of IRP and Assistances
At least one member of each affected households will be provided income restoration measures under IRP according to the ESMF. Target of IRP should be widely open to all project affected households who want to participate in. In addition, the people living in the Sanga Pass area shall be entitled for the IRP to mitigate indirect impact by bypass of tunnel, even they are not the target for monitoring.
(2)Needs Analysis and Options
Before resettlement implementation, PMU / District shall organize stakeholder meeting to obtain needs on livelihood restoration from targeted PAPs and analyze the needs to form effective package of income restoration program. Expected measures for livelihood restoration program are shown as below;
(3)Vocational Training and Guidance
This measure is job training for the people affected by land acquisition by using vocational training facilities nearby if there are appropriate demands in the target group of PAPs. Vocational training may

16-98
provide; leather shoe manufacturing; sewing equipment repair; domestic and industrial electricity; electric and welding; cooking; construction; cutting processing; cooling, milling; motorcycle repair, office informatics, etc. Training fees for each course will be paid from the project budget. The Project is required to coordinate with such possible facilities in different districts to organize vocational training for affected households and/or recruit their children for work in factories.
(4)Job Arrangement
After the job training, according to the list of trainees and demands of each trainee, PMU will coordinate with practical job opportunities. Or, activities of agricultural and forestry promotions will be discussed to provide knowledge of crops, livestock, fertilizers, technology, productivity growth.
(5)Loan Program
During implementation phase, PAPs will be interviewed about their demands for credit loan. If due, they will be assisted to access sources of credit loan such as revolving fund organized by rural banks.
16.3.9.3 Institutional Arrangement for IRP
PMU / District will deliver the above mentioned skills training and other opportunities with cooperation between local resources, such as training institutions/professional.
16.3.9.4 Job Creation for the Project Implementation
Furthermore, employment priority will be given to PAPs during the road construction period. As far as possible, the Project will provide job opportunities through contractor for the affected people during implementation, in order to enable families to earn supplemental income to restore their livelihood.
16.3.10 Grievance Redress Mechanism (GRM)
Agencies in charge of implementing the procedure for handling grievance during compensation and land acquisition in the project affected areas should be established as Grievance Redress Committee (GRC).
Following general measures could be used as GRM;
(1) Grievances/Complaints should be recorded and maintained by both local authority/PMU and internal/external monitoring agencies with regular update, to timely and satisfactory solve the grievances.
(2) In case of verbal complaints, GRC should record in written format to follow up the complaints.
Proposed GRM follows the mechanism in ESMF and given as below. According to DOR, DOR apply and refer ESMF to all responsible project principally and past projects after ESM's enforcement followed it.

16-99
Stage 1:
Complaints of PAPs on any aspect of compensation, relocation, or unaddressed losses shall in first instance be settled verbally or in written form in field based project office. The complaint can be discussed in an informal meeting with the PAP by the concerned personnel to settle the issues at the local level. The community consultation, involvement of social/ resettlement experts will be helpful in this regard. It will be the responsibility of Project In-charge to resolve the issue within 15 days from the date of the complaint received.
Stage 2:
If no understanding or amicable solution reached or no response from the project office, the PAP can appeal to CDC. While lodging the complaint, the PAP must produce documents to support his/her claim. CDC will provide the decision within 15 days of registering the appeal.
Stage 3:
If the PAP is not satisfied with the decision of CDC or in absence of any response of its representatives, within 35 days of the complaint, the PAP, in his/her last resort, may submit its case to the court.
16.3.11 Organizational Responsibilities
As the project authority, DOR, especially its PMU should be retained overall responsibility for the management procedures of the RAP as well. Key activities to be undertaken to ensure effective implementation of resettlement, compensation and rehabilitation activities are:
Implementation of procedures to (i) minimize adverse social impacts including acquisition of land and assets throughout the planning, design and implementation phases and (ii) accurate recording of all PAPs, by means of census and asset verification and quantification exercises, and the issuing of identification,
Establishment of systems and procedure for coordination of resettlement and compensation activities,
Establishment of GRC to address the social issues with participation of affected people,
Capacity-building initiatives to create a supportive environment for the implementation of RAP activities, including training on accepted resettlement and rehabilitation practices, training in the establishment of compensation plans for affected household,
Coordination with other government line agencies like Department of Forestry and Ministry of Local Development to ensure effective delivery of mitigation and rehabilitation support measures, and
Disclosure of RAP in both JICA and Nepal side

16-100
16.3.12 Implementation Schedule and Activities
16.3.12.1 Implementation Schedule
The RAP implementation activities mainly consist of the tasks of compensation distribution and associated rehabilitation and resettlement activities. The project authority will ensure that funds are delivered on time to CDC and the Construction Supervision Consultant (CSC) for timely preparation and implementation of RAP, as applicable. Generally, civil works contracts will not be awarded unless the required compensation payment has been completed. In the context of the project compensation process as well as income rehabilitation measures may continue and be completed even after civil works has begun. Table 16.3-22 shows the tentative implementation schedule for RAP.
Table 16.3-22 Tentative Implementation Schedule for RAP
S.N. Tasks Year I Year II Year III
1 2 3 4 5 6 7 8 9 10 11 12 1-3 4-6 7-9 10-12 1-3 4-6 7-9 10-12
1 Obtained Detail Engineering Design from Technical team
♦
2 Cadastral Survey ♦ ♦
3 Census/ Socioeconomic survey for RAP updating
♦ ♦
4 Submission of Final RAP to DOR and JICA for approval
♦
5 Submit final report to CDO for compensation determination
♦
6 Notice publication of affected land
♦
7 Public Consultation and establishment of GRC
♦
8. CDC meeting and Compensation Determination
♦
9 Inform APs for the compensation claim
♦
10 Collect application from the PAPs for compensation
♦
11 Verify the application and prepare final list of PAPs
♦ ♦ ♦
12. Pay compensation for eligible PAPs
♦
13 Contract agreement with Contractors
♦
14 Transferring the land ownership
♦
15 Internal Monitoring of RAP implementation progress
♦ ♦ ♦ ♦ ♦ ♦ ♦ ♦ ♦
16 External monitoring of RAP implementation
♦ ♦ ♦ ♦
16.3.12.2 Key Implementation Activities in Implementation Phase
(1)Advance Actions
Upon grant processing, DOR will initiate advance action such as; (i) Establishment of the Project Office ii) recruitment of the Project Manager(PM) and information dissemination to affected people and local community (iii) Formation of CDC (iv) Mobilization of Construction Supervision Consultant (v) Establishment of GRC as required.

16-101
(2)Mobilization of Construction Supervision Consultant (CSC)
The CSC will be mobilized to monitor the project construction activities and to implement RAP. The Social/ Resettlement Expert to be mobilized by CSC will be responsible for implementing the resettlement activities in close coordination with the Project Implementation Unit, Project Manager, and CDC including local communities and affected persons.
(3)Cadastral Survey and Updating Draft RAP
The cadastral survey will be implemented again with updated design and other information related to the project affected areas. The cadastral survey is one of the very important works which is conducted during detail design phase after getting approval of detail design. The cadastral survey is the method of determining resettlement impact on land, structures, and other assets aligning with the reference of cadastral maps. It has to be carried out by land surveyor with the help of assistant surveyor and other resettlement team such as enumerator, social mobilizer, resettlement expert etc. It is the main part of the RAP implementation. Table 16.3-23 summarizes the steps and processes of cadastral survey.
Table 16.3-23 Key Steps and Process of Cadastral Survey
No. Steps and Processes
1 CSC hired a Surveyor team (Surveyor, assistant Surveyor, helper etc.) for Cadastral Survey
2 Surveyor with the help of District Survey Office will conduct field survey based on reference of topographical map and final engineering design drawing
3 Survey Team identifies/delineate the reference points in different section of the road alignment and determines the final sheets of relevant cadastral maps applicable for land acquisition.
4 Relevant cadastral sheets will be collected from Survey Office.
5 Survey Team will conduct total station survey to fix the land acquisition line in the cadastral sheets with the help of affected persons, local communities and other stakeholders. Resettlement Team with social Mobilizer will fully support the Survey team.
6 Based on total Station Survey across the road alignment the Survey Team draw lines in the cadastral map delineating the affected portion of land, parcel number and calculate the area to be acquired.
7 The Resettlement Team with the support of Cadastral Survey Team will conduct final inventory survey if left during feasibility study and collect relevant document of affected land parcels such as Type of land parcels Private or government, owners of affected land and other information as applicable.
8 Type of affected land status will be collected from Survey Office and Landowner list from Land Revenue Office then final list of affected persons and their assets will be prepared and finalized the RAP.
9 DOR will send the list of land parcels, area to be acquired and owners name to CDC then compensation determination process will start.
16.3.13 Cost Estimation
The land Acquisition Act 1977 indicates need of initial estimation of compensation amount and determination of compensation rate at two different stages by two different agencies. As per clause 7(2) 8 (2) of Land Acquisition Act, preliminary estimation should be made by agencies / project owner (DOR) seeking land acquisition, and the compensation rate is finally determined by CDC accordance

16-102
to clause 13 of the Act. As the act stipulates, the agency concerned after initial investigation on likely acquisition have to submit formal report to CDO requesting for land acquisition. Then the CDO with the support of CDC will determine the final compensation rate. The RAP has been prepared based on the enumeration of PAPs and their affected assets along the road alignment. The valuation of affected assets and compensation cost estimated for the loss of assets is based on Replacement Cost Survey (RCS). RCS principally based on market cost survey subject to be finalized by CDC in accordance with the provision of Land Acquisition Act.
16.3.13.1 Cost for Land Acquisition
There are two major different types of property valuation systems in Nepal, namely unit price based on government rate and based on current market rate. As being practiced, the Government rate usually use to be fixed by District Land Revenue Offices in accordance with the location of land, type of land, the rate of land quoted on current land transaction documents, and land levy paid by the public. It is assumed that the current market price denotes the replacement cost by which the PAPs can purchase similar types of land nearby the project area with the compensation amount. The current market prices are estimated based on a replacement cost survey (RCS) of the JICA Preparatory Survey. Each estimate replacement cost is derived from relevant information from the local peoples such as real estate planner, indirect affected persons, and direct affected persons in the area. The estimated compensation for private land is shown in Table 16.3-24.
Table 16.3-24 Estimated Compensation for Private Land (CONFIDENTIAL)
16.3.13.2 Cost Estimation for Private Structures
The cost estimation for the house/structure is based on the RCS, however, final compensation would be determined by CDC. During the detail design, the engineer of Department of Urban Development and Building Construction (DUDBC), the authentic organization of government for house evaluation, will be requested to involve the house/structures evaluation process. Estimated costs for the houses/ structures are presented in Table 16.3-25.
Table 16.3-25 Estimated Compensation for Affected Structures (CONFIDENTIAL)
16.3.13.3 Displacement Allowances
The displacement allowance basically covers that residential house which needs to be displaced from their current location physically. Displacement allowances are based on 6 months (180 Days) minimum wage rates as established at the national or local level. The minimum wage rate in the project area is NRs 500/day. Estimated cost for the displacement/ rehabilitation allowances is shown in Table 16.3-26.
Table 16.3-26 Housing Displacement Allowances (CONFIDENTIAL)

16-103
16.3.13.4 Business Disruption Allowances
The Business disruption allowance will be provided to those business owners who are required to relocate from their own business, even in the case of temporal impact. This allowance is based on 6 months (180 Days) minimum wage rates as established at the national or local level. The minimum wage rate in the project area is NRs 500/day. Estimated cost for the Business disruption allowance is given in Table 16.3-27.
Table 16.3-27 Business Disruption Allowances (CONFIDENTIAL)
16.3.13.5 Support allowances for Vulnerable Households
Support allowance will be provided to the affected vulnerable households such as women headed, Dalit and below poverty level households. The Socio-economic survey shows that 21 households (around 8% of surveyed households) are women headed. The allowance is at the rate of NRs 50,000 per household. Propose a support allowance is given in Table 16.3-28:
Table 16.3-28 Support Allowances for Vulnerable Households
(CONFIDENTIAL)
16.3.13.6 Income Restoration Program (IRP) Cost
(CONFIDENTIAL)
16.3.13.7 RAP implementation Cost
There are several RAP implementation activities need to be carried out during the project implementation period such as public consultation and information dissemination, CDC meeting, RAP updating, external monitoring of RAP etc. Estimated cost for RAP implementation is presented in Table 16.3-29.
Table 16.3-29 Estimated Cost for RAP implementation (CONFIDENTIAL)
16.3.13.8 Other Rehabilitation Cost
The census/socio-economic survey shows that 1,078 electric poles and telecommunication poles are required to be relocated. The estimated cost for these poles is 5,390,000 (at the rate of NRs 5,000/pole).
In addition, lump sum amount of NRs 600,000 is estimated for rehabilitation of three stone spouts in Nasikasthan Sanga. The above mentioned public utilities rehabilitation cost and other remaining compensation cost of trees and crops if required will be included in contingencies heading in the budget.
16.3.13.9 Summary of Cost Estimation
The summary of total estimated cost for the RAP implementation is shown in Table 16.3-30.

16-104
Table 16.3-30 Summary of Cost for RAP Implementation
(CONFIDENTIAL)
16.3.14 Monitoring and Evaluation
Internal monitoring covers all kind of project activities but concentrated on land acquisition and resettlement. On the other hand, external monitoring targets same activities as internal monitoring principally, however, the viewpoint shall be independent.
16.3.14.1 Internal Monitoring
The internal monitoring of the project implementation is done by DOR, PCU, and PMU in regular basis with the help of Social Officer in GESU and resettlement specialists from the Project consultant. A quarterly report of internal monitoring will be prepared by Social Officer of GESU in consultation with consultants and submitted to PMU and JICA. The PMU will maintain a record of all transaction in their resettlement database, followed by entitlement records signed by PAPs, and survey based monitoring of resettlement and land acquisition progress. The local civil society / group will play an important role in monitoring providing feedback on community concerns, grievances, and requests. Internal monitoring focuses and ensures the followings: Verification of non-outstanding or unresolved land acquisition issues with respect to the project
and that property valuation and economic rehabilitation in accordance with the provision of plan Information campaign, discrimination and consultation with affected persons Status of land acquisition and timely payments on land compensation Value of entitlement received equal to that of actual land and structure acquired Use of entitlement and check its misuse Compensation for affected structures and other assets Payments for loss of income Relocation of affected persons and supports provided Implementation of economic rehabilitation and income restoration measures Effective operation of GRC Funds for implementing land acquisition and economic rehabilitation activities as timely manner
and sufficient for the purposes and spent in accordance with the plan
Project field offices will be responsible for monitoring the day-to-day resettlement activities. The local social mobilizers under resettlement experts will play an important role to assist the project field office in course of regular monitoring. The field-level monitoring will be carried out through:
Review of census information for PAPs Consultation and informal interview with PAPs Informal sample survey of PAPs Key informants interview

16-105
Public consultation meeting A performance data sheet / monitoring sheet will be developed to monitor the project at the field level. Following tables shows items to be monitored as internal monitoring.
Table 16.3-31 Internal Monitoring Items for Resettlement Activities
Activities Planned Total
Unit
Progress in Quantity Progress in % Expected Date of Completion
Responsible Bodies
During the Quarter
Till the Last Quarter
Up to the Quarter
Till the Last Quarter
Up to the Quarter
Preparation of resettlement Approval of RAP and submission to MOPIT
DOR
Approval of RAP
MOPIT
RAP disclosure on JICA Website
JICA
Budget securing for resettlement activities
MoF, MOPIT
Loan Agreement / Exchange of Notes
GON, JICA
Contract with Independent consultant for Income Restoration Program
MM DOR
Contract with External Monitoring Agency
MM DOR
Assignment of necessary organizations such as CDC
Organizations
DOR, Municipality
Income Restoration Program (IRP) preparation
Independent Consultant
Detailed Measurement Survey (DMS)
PAPs CDC
Finalization of PAPs List based on DMS
PAPs CDC
Determination of Compensation rate
CDC

16-106
Activities Planned Total
Unit
Progress in Quantity Progress in % Expected Date of Completion
Responsible Bodies
During the Quarter
Till the Last Quarter
Up to the Quarter
Till the Last Quarter
Up to the Quarter
Calculation of compensation amount to be paid to PAPs
CDC
RAP Updating and submit to JICA for Review and Concurrence
DOR
Approval of Updated RAP
DOR, MOPIT
Disclosure of Updated RAP at Commune Office
Municipality
Submission of Internal monitoring report
DOR, Internal Monitoring Agency
Implementation of resettlement Negotiation PAPs CDC Section 1... PAPs Payment of
compensation PAPs CDC
Section 1... PAPs Provision of
land plots PAPs CDC
Section 1... PAPs Public
Consultation Times CDC
Section 1... PAPs Provision of
assistance for Vulnerable
PAPs
PAPs CDC
Section 1 ... PAPs Provision of
assistance for Business
PAPs CDC
Section 1 ... PAPs Site clearance PAPs DOR, CDC
Section 1... PAPs Income
Restoration Program (IRP) implementatio
n
PAPs IRP Consultant
Section 1... PAPs
Grievance Redress
- PAPs
DOR, Grievance Redress Committee
Section 1... - PAPs

16-107
16.3.14.2 External Monitoring
The external monitoring will be carried out by independent agencies contracted by the DOR. The external monitoring agency will conduct actives as below:
Review of RAP and internal monitoring Reports Review and monitoring of compensation status with random check of payment record survey
and interview to PAPS Review of compensation rate determined by CDC comparing to RAP Monitoring of Information disclosure system at local level Monitoring and random interview for process and mechanism of grievance redress mechanism Employment status of the PAPs Effectiveness of Livelihood restoration program coordinate with LRP consultant Effectiveness of Awareness in HIV/AIDS and human trafficking Submit external monitoring report monthly during the contract period
Based on the above mentioned activities the external monitor will focus on:
Evaluation of social and economic impact of land acquisition and economic rehabilitation of the PAPs.
Verify the objectives of enhancement of economic condition of PAPs, or at least restoration of income levels and standard of living of the affected persons.
Furnishing creative suggestions and modifications in land acquisition and economic rehabilitation, if necessary.
Making to ensure all resettlement and land acquisition activities are properly conducted.
External monitoring agency will require the following activities to be performed:
Verification of internal monitoring to ensure the appropriateness of activities carried out by program implementation unit in the field.
Conduct household survey of PAPs to monitor progress and/by comparing with pre project, pre-resettlement standard.
Evaluation of delivery system to the PAPs and assess impacts of entitlements to determine the approved RAP.
Evaluation of consultation and grievance redress procedures to identify the levels of public awareness of grievance-redressed procedures, accessed by PAPs and households for information and rapid conflict resolution.
Evaluation of actual operations of grievance committee to assist PAPs as required and to act as observers.
Declaration of successful implementation for summing up of activities related to entitlements, distribution, and resettlement.
Recommend follow up action relating to outstanding actions required to complete achievement of objectives of the RAP and resettlement policies, additional mitigation measures for PAPs.

16-108
Table 16.3-32 External Monitoring Items for Resettlement Activities
Activities Planned Total Unit Monitoring Pints
Actual Sampling
Cases
Responsible Bodies
Preparation of resettlement Detailed Measurement Survey (DMS)
PAPs - Appropriate Steps/Process of DMS - PAPs attitude to DMS CDC
Finalization of PAPs List based on DMS
PAPs - Review of the final list of PAPs comparing to actual PAPs at the filed CDC
Determination of Compensation rate - Review and compare the results of determined unit price
with replacement cost in RAP CDC
Calculation of compensation amount to be paid to PAPs
- Review the calculation method based on DMS and compensation price CDC
RAP Updating and submit to JICA for Review and Concurrence
- Overall review on updated RAP and relevant documents by CDC - Report the results to DOR
CDC, DOR
Approval of Updated RAP - Provide recommendation to DOR, MOPIT DOR,
MOPIT Disclosure of Updated RAP at Commune Office
- Monitor information disclosure at local level Municipality
Submission of External monitoring report
- Monthly base External Monitoring Agency
Implementation of resettlement Negotiation PAPs - Monitor negotiation process CDC Section 1... PAPs Payment of compensation PAPs - Monitor and check payment process CDC
Section 1... PAPs Provision of land plots PAPs - Monitor land procurement, if any CDC
Section 1... PAPs Public Consultations Times - Monitoring the meeting with record, if any CDC
Section 1... PAPs Provision of assistance for Vulnerable PAPs
PAPs - Monitoring implementation of assistance CDC
Section 1 ... PAPs Provision of assistance for Business
PAPs - Monitoring implementation of assistance CDC
Section 1 ... PAPs Site clearance PAPs - Monitoring the process DOR, CDC Section 1... PAPs Income Restoration Program (IRP) implementation
PAPs - Monitoring the situation IRP Consultant
Section 1... PAPs
Grievance Redress - PAPs - Monitoring the situation
DOR, Grievance Redress Committee
Section 1... - PAPs

CHAPTER 17
CONSULTING SERVICE PLAN


17-1
CHAPTER 17 CONSULTING SERVICE PLAN
17.1 GENERAL
The following consulting services are required for the project. Draft total Man-Month (MM) of each service is shown in Table 17.1-1.
Detailed Engineering Design Tender Assistance for Selection of Contractor Construction Supervision Capacity Development for Tunnel O&M
Table 17.1-1 Draft Total MM of Services
(CONFIDENTIAL)
17.2 DETAILED DESIGN STAGE
Major scope of works for the Consulting services during detailed design are as follows;
Finalization of the highway and tunnel alignment with due consultation with the concerned land developers
Engineering surveys (topographic survey, soils/material survey, geo-technical survey etc.) Detailed engineering design Preparation of tender documents Land Parcel Survey
Draft MM schedule of detailed design is shown in Table 17.2-1.
Table 17.2-1 Draft MM Schedule of Detailed Design
(CONFIDENTIAL)
17.3 TENDER ASSISTANCE STAGE
Major scope of works for the Consulting services are as follows;
Provide assistance to DOR in all process of selecting contractor Monitoring of RAP implementation
Draft MM schedule of tender assistance is shown in Table 17.3-1.
Table 17.3-1 Draft MM Schedule of Tender Assistance
(CONFIDENTIAL)

17-2
17.4 CONSTRUCTION SUPERVISION STAGE
Major scopes of work for the Consulting services are as follows;
Overall construction supervision Keep and compile all records including material test results, inspection results, and problems
encountered Prepare assets including condition assessment Monitoring of environmental requirement
Draft MM schedule of construction supervision is shown in Table 17.4-1.
Table 17.4-1 Draft MM Schedule of Construction Supervision
(CONFIDENTIAL)
17.5 CAPACITY DEVELOPMENT FOR TUNNEL O & M STAGE
Major scope of works for the Consulting services are as follows;
Legal aspects in relation to tunnel O&M Inspection and maintenance works Traffic monitoring and information provision Actions to be taken during emergency including evacuation system at the time of earthquake Safety driving campaign to drivers Drills for emergency cases Training in Japan
Among consulting services, it is essential to implement training course concerning tunnel disaster prevention measures for capacity development. In particular, establishment of an organizational structure, preparation of manuals at the time of disaster, training (drills) course based on the manual for followings are implemented; 1: Improvement of information communication system, 2: Improvement of rapid emergency restoration system, 3: Road traffic regulations, 4: Public information to road users. In promoting the above, applicable methods to Nepal is considered by introducing example cases to DOR from Japan and other countries.
Draft MM schedule of capacity development is shown in Table 17.5-1.
Table 17.5-1 Draft MM Schedule of Capacity Development
(CONFIDENTIAL)

CHAPTER 18
CONSTRUCTION PLAN


18-1
CHAPTER 18 CONSTRUCTION PLAN
18.1 CONSTRUCTION SCHEDULE
The construction schedule was estimated 42 months for the improvement of total length of 14,730 m road and tunnel consisting of 13,480 m road and 1,235 m/1,294 m (Average distance 1,265 m) tunnel.
In the present Additional Study, two tubes of tunnels that is estimated 1,235m/1,294m tunnel and 1,556m approach road (1,250 of Section 3 and 306m of Section 4) shall be altered to the Sanga Pass area. So, most probably, the tunnel construction work shall be the critical pass. However, the construction schedule is broadly influenced by the geological conditions of proposed tunnel route. The geological boring and other test to determine the said conditions was carried out by the present JICA team, but it might be altered at the future Detail Design with implementing more precise study. Therefore, it is roughly say at this time that the construction schedule shall be 42 months.
(CONFIDENTIAL)
Figure 18.1-1 Estimated Construction Schedule (Critical Path)
As stated above, the tunnel construction will be the critical pass, so the construction of approach road to the tunnel portal shall be carried out immediately after commencement of the Project to secure the launching of tunnel works. The approach road shall be constructed simultaneously with the road of Section 3. The relationship diagram describing above is depicted in the Figure 18.1-2. The tunnel shall be excavated from Section 3 side.
Figure 18.1-2 Plan of Section 3, Tunnel and Section 4
18.2 MAJOR MATERIALS
The construction material available in Nepal is the something from natural resources (such as gravel, sand and embankment soil), and other imported material from India, such as steel bar, cement, fuel, bitumen and other common material.

18-2
The resources of main construction material are shown on Table 18.2-1.
Table 18.2-1 List of Major Material
No
Item Available Resource
Name Specification Nepal Japan or 3rdCountry
A Road Construction ○ 1 Cement Made in Nepal ○ 2 Asphalt Imported ○
3
Gravel/sand for concrete/asphalt concrete and stone, embankment soil and other earth work material
○
4 Steel bar ○ 5 Fence for pedestrian bridge ○ 6 Guard rail ○ 7 Gabion mattress ○ 8 PC bridge material ○ 9 RC pipe ○ 10 PVC pipe ○ 11 Pressure tight PVC pipe ○ 12 Fuel ○ 13 Wood for formwork ○
B Tunnel Construction Specification Nepal Japan or 3rdCountry
1 Rock bolt ○ 2 Steel support 125H, 200H ○
3 Material for Auxiliary method (AGF)
Steel pipe, plate, sleeve, rod and others ○
4 Concrete mix agent Retarder and others ○ 5 Steel for formwork For arch and invert concrete ○ 6 Water proof sheet For water proof ○ 7 Metal mesh Foe shotcrete ○
18.3 MAJOR EQUIPMENT
The construction equipment for road construction, such as bulldozer, excavator, wheel loader, dump truck and other common equipment are avilable in Nepal. On the other hand, the construction equipment for the tunnel construction will be imported from Japan. The major construction equipment and available countries are shown in Table 18.3-1. Some equipment to be used for tunnel construction, even the same name or item with road construction, are imported from Japan, because those are modified or manufactured for tunnel construction use.

18-3
Table 18.3-1 List of Major Equipment
No Item Market Name Specification Nepal Japan or
3rd Country A Road Construction 1 Bulldozer 15ton, 21ton ○ 2 Bulldozer with ripper 21ton ○ 3 Excavator 0.2m3, 0.34m3, 0.6m3 ○ 4 Wheel loader 2.1m3 ○ 5 Dump truck 10ton ○ 6 Low bed truck 20ton ○ 7 Truck crane 4.9ton, 20ton, 25ton, 35ton ○ 8 Vibration hammer 45kw ○ 9 Breaker 600-800kg, 1,300kg ○ 10 Motor grader 3.1m ○ 11 Road roller 10-12ton ○ 12 Tire roller 8-20ton ○ 13 Vibration roller 3-4ton ○ 14 Concrete plant 45m3/hr ○ 15 Water tanker 5t 8ton(LH04-36) ○ 16 Oil tanker 5t 8ton(6300x2220x2500mm) ○ B Tunnel Construction 1 Road header 240 kw,(MRH-S240) ○ 2 Drilling jumbo 2 boom 150kg ○ 3 Giant breaker Hydraulic 3,000kg ○ 4 Shotcrete robot Dry type 25m3/hr ○ 5 Steel rib erect machine (11500x2800x4000mm) ○ 6 Excavator (back-hoe) 0.6m3 ○ 7 Wheel loader, side dump 2.3m3 ○ 8 Wheel loader 1.4m3 ○ 9 Bulldozer 32 ton(D155AX-6) ○ 10 Bulldozer 17 ton(D61PX-23) ○ 11 Dump truck 11 ton ○ 12 Truck for rock bolt carry 4ton ○
13 Truck for injection agent carry 4 ton ○
14 Concrete pump (truck) 90m3/hr ○ 15 Truck mixer EA32-32A(6.3m3) ○ 16 Concrete finisher KF85B, 21.2ton ○ 17 Concrete spreader KS85B, 10.6ton ○ 18 Concrete leveler KL85B, 11.6ton ○ 19 Waste water treatment plant 100ton/hr(HFS-100) ○ 20 Diesel generator 650 KVA, 11.85ton ○

18-4
No Item Market Name Specification Nepal Japan or
3rd Country 21 Diesel generator 300 KVA, 5.97ton ○
22 Diesel generator 175 KVA, 3.07ton ○ 23 Dust collector 3,000m3/min ○ 24 Ventilation blower 3,000m3/min ○ 25 Ventilation blower 500m3/min ○ 26 Ventilation duct dia. 1,500 ○ 27 Submergible pump 80mm×20m×3.7KW ○ 28 Submergible pump 50mm×20m×2.2KW ○ 29 Water pump 65mm×45m×5.5KW ○ 30 Roughter crane 25ton ○ 31 Truck crane 4.9ton ○ 32 Slide center, Arch L = 10.5m ○ 33 Stage for water proof sheet ○
18.4 CONSTRUCTION CAMPS AND TEMPORARY YARD
The proposed site is considered at the vacant area along the existing highway about 2.5 km away from Banepa City. The total area is necessary about 20,000m2 including camp and temporary yard. The main facilities to be set in this area are mentioned below.
1) Concrete plant 2) Asphalt plant 3) PCT beam construction area 4) Material stockyard 5) Construction equipment yard/work shop 6) Fuel tank and water tank 7) Office and Accommodation
18.5 BORROW PIT, QUARRY SITE AND DISPOSAL SITE
1)Borrow Pit
The project requires about 840,000m3 of soil as a fill/embankment material. The bypass then planned at Sanga area is replaced by a new one, which consists of a twin tunnel. The soil generated from excavation of the tunnel section, which is around 200,000m3, can be utilized as fill/embankment material. And, the soil of 430,000 m3 by cutting will be produced newly. As a result, 210,000 m3 of soil needs to be procured from the borrow pit.
2)Quarry Site
Candidate sites/locations of quarry material are listed in Table 18.5-1. The first candidate sites where material sources are located is in Sipaghat in Sindhupalanchowk District. The material

18-5
source here is River Indrawati. Aggregates, sand, chips and dust are available.
The second location is in Bhumidanda in Kavrepalanchowk Distrist. The material source here comes from hill/mountain and the available materials are aggregates, dust, base, subbase materials. The distances and estimated annual production capacities are as shown in the table.
Quarry site at Sipaghat is considered suitable for procurement. It is presently one of the major sources. Excavation of the river bed is permitted only for 2 months (January till February) and the volume that can be excavated is predetermined by the government. There are altogether 14 crusher plants in and around this site. Average number of trucks (capacity of 7 m3) that transport material from here is 100. The crusher plants can produce about 9800 m3 per day. As the average days of operation in a year is 250 days, the total quantity that can be produced in a year is about 2.5 million cubic meter (m3). The material from here is delivered mostly to Kathmandu, Banepa, Dhulikhel and Melamchi. Local Government such as the District Coordination Committee Office, formerly District Development Committee, under Ministry of Federal Administration and Local Development, provides legal permission to operate the Crusher Plant. Crusher Plants are operated under Ministry of Industry’s guidelines, after environmental approvals are received. Taxes are levied locally by the District Coordination Committee in volume basis at the rate of NPR. 247 per Cubic Meter.
Table 18.5-1 Material Sources Locations
SN Location Material Source
Material Available
Owner-ship
Distance and Time to Banepa Estimated
Yearly Production
Banepa - Dhulikhel
Dhulikhel - Zero Kilo
Zero Kilo - Sipaghat Total
Average Time (1 Way) Black-Topped Road Gravel
Road
1
Sindhupalckowk District
Kavrepalanchowk District
Sipaghat
Indrawati River
• Aggregates • Sand • Chips • Dust
Govt. River
Private Land & Crushers
3.7 km 13 km 10 km 26.7 km 2 hrs.
2,450,000 m3
from 14 Crusher Plants
2
Kavrepalanchowk District
Malpi, Kalati, Bhumidanda, Ward No. 6
Hill Material
• Aggregates • Dust • Base, Sub
base
Private
Land & Crushers
Banepa - Malpi
7.46 km
Malpi - Kalati
1km
8.46 km 30 min.
175,000 m3
From 5 Crusher Plants
3)Disposal Site
Waste material compose of debris generated from demolition of asphalt pavement and concrete structures. The total estimated volume of these waste material in total is 17,000 m3 (asphalt concrete is 9,000 m3 and concrete of structures is 8,000 m3). Adding to the above waste material is the unusable soil (unsuitable for any works), estimated volume of 170,000 m3 that generates from the earthworks. Candidate locations of disposal sites are given in Table 18.5-2 and is also

18-6
indicated in Figure 18.5-1. These locations were identified in the previous survey. These sites still exist and are readily available currently.
Table 18.5-2 Candidate Soil Disposal Sites
SN Location Area Available Estimated Fill Vol. with 60
cm depth filling
Land Ownership Distance and Time to Banepa
3 Kavrepalanchowk District
Syulikantapur 36,000 m2 21,600 m3
Private Land
Mr. Pashupati Aggrawal
Banepa - Panauti
Black-Topped Road 5 km
5 km 15 min.
4 Kavrepalanchowk District
Syulikantapur 12,400 m2 7,440 m3
Binod Khatri
(c/o Shree Hari KC)
Banepa - Panauti
Black-Topped Road 5 km
5 km 15 min.
Total 29,040 m3
Figure 18.5-1 Material Source and Disposal site
1
3,4
2 Legend 1: Borrow pit site (Malpi) 2: Quarry site (Sipaghat) 3,4: Disposal site (Syulikantapur)

CHAPTER 19
CONSTRUCTION COST ESTIMATE


19-1
CHAPTER 19 CONSTRUCTION COST ESTIMATE
(CONFIDENTIAL)


CHAPTER 20
PROJECT IMPLEMENTATION PLAN


20-1
CHAPTER 20 PROJECT IMPLEMENTATION PLAN
20.1 PROJECT SCOPE OF WORK
Scope of the Project is as listed below;
(1)Civil Work Components
Construction of Tunnels (Inbound Tunnel 1,235 m and Outbound Tunnel 1,294 m)
Earth Work (L=Approximately 13.5 km)
Pavement (L= Approximately 13.5 km)
Construction of Bridges and Box Culvert (Existing Bridge to Box Culvert: N=4 locations, Newly construction of Box Culvert: N=1 location)
Construction of Footbridges (N= 6 locations)
Construction of Service Road (L=8,235m: Bahaktapur, Banepa, Dhulikhel)
Power Supply System from nearby Substation to the Site
(2)Consulting Services
Detailed Design
Tender Assistance
Construction Supervision
Capacity Development for Tunnel Operation and Maintenance
(3)Facilitation of Implementation of Environmental Management Plan (EMP), Environmental Monitoring Plan (EMoP) and Resettlement Action Plan (RAP)
20.2 IMPLEMENTATION SCHEDULE
(CONFIDENTIAL)
20.3 CIVIL WORK CONTRACT PACKAGING
(CONFIDENTIAL)
20.4 PROJECT IMPLEMENTATION ORGANIZATION STRUCTURE AND UNIT
20.4.1 Project Implementation Organization Structure
Overall project implementation organization is shown in Figure 20.4-1. Implementing Agency is Department of Roads, DOR. Also, it is proposed that Project Management Office and Tunnel

20-2
Management Office are newly established for the Project.
Source: JICA Study Team
Figure 20.4-1 Project Implementation Organization Structure
20.4.2 Project Management Unit (Office)
JICA Study Team proposed to establish Project Implementation Unit (Office) shown Figure 20.4-2 and Table 20.4-1.
Source: JICA Study Team
Figure 20.4-2 Project Management Unit Organization Chart

20-3
Table 20.4-1 Roles an Function of Unit/Staff on Project Management Office
Unit Roles and Function of Unit Roles and Function of Staff Project Director ● Responsible for overall activities of Project Management Unit Deputy Project Director ● Deputy for Project Director Administrative and Finance Unit
● General administrative work ● Budgeting and payment of
expenditure ● Evaluate monthly billings from the
Consultant and the Contractor and make recommendation on payment
● Evaluate claims from the Consultant and the Contractor
● Chief : Responsible for overall activities of this unit
● Budget: In charge of budget planning and book keeping
● Accountant: In charge of management of monthly billings and claims from the consultant and the contractor
Engineering Unit (Procurement, Monitoring, Quality Assurance)
● Assist tendering of Consultant and Contractor procurement
● Evaluate the detail design based on the established design criteria
● Monitor quality of work of the contractor
● Assess the monthly progress report submitted by the Consultant and the Contractor
● Chief Engineer : Responsible for overall activities of this unit
● Engineer for tender : In charge of assisting tendering
● Engineer of design review: In charge of evaluation of detailed design and assessment of monthly progress report
● Engineer of supervision : In charge of monitoring of quality of works
Environmental and Social Monitoring Unit
● Assess Environmental Monitoring Reports from the Consultant and the Contractor
● Undertake periodic environmental monitoring
● Attend the stakeholders’ meeting ● Keep close dialogue with PAPs
● Chief : Responsible for overall activities of this unit
● Engineer of environment: In charge of monitoring of environmental requirement by EIA
● Public relations officer: In charge of monitoring social aspects and dialogue with PAPs.
20.4.3 Tunnel Management Unit (Office)
JICA Study Team proposed to create Tunnel Management Unit (Office). Figure 20.4-3 shows the organization and staff of O&M for the tunnel and Table 20.4-2 shows the roles and function of sections.
Source: JICA Study Team
Figure 20.4-3 Tunnel Management Unit Organization Chart

20-4
Table 20.4-2 Roles an Function of Unit/Staff on Tunnel Management Office
Section Roles and Function of Section
Roles and Function of Staff
Director Responsible for overall activities of tunnel management office (2nd lank officer) Administration Section
General Administration Budgeting Accounting
Chief : Responsible for overall activities of this unit Admin: In charge of general affairs for tunnel management office Budget: In charge of budget planning and book keeping Accountant: In charge of accounting
Maintenance Section
Daily Inspection Routine Maintenance Repair Periodic Maintenance
Chief : Responsible for overall activities of this unit Maintenance Planner: In charge of planning of maintenance. Inspector & Maintenance engineer: In charge of daily inspection and maintenance Electrical Engineer: In charge of maintenance of Electrical facilities Mechanical Engineer: In charge of maintenance of Mechanical facilities Communication Engineer: In charge of maintenance of communication facilities Civil Engineer: In charge of maintenance of civil structure
Traffic Control /Surveillance/Information Provision Section
Patrol Monitoring of traffic Surveillance Information provision to road users
Chief : Responsible for overall activities of this unit Patrol Team: In charge of daily patrol in tunnel Traffic Controller: In charge of monitoring of traffic, of surveillance activity and of information provider to road users.
Action Team for Emergency Case
Removal of breakdown vehicles Immediate action in case of emergency cases Coordination with LGUs and Police
Chief : Responsible for overall activities of this unit Action team: In charge of Removal of breakdown vehicles, Immediate action in case of emergency cases and coordination with LGUs and police
Vehicle Control Section
Control of tank lorry carrying hazardous material Vehicle height & overloaded trucks in coordination with Land Transportation office and police
Chief : Responsible for overall activities of this unit Vehicle controller: In charge of vehicle control and of controlling with Land Transportation office and police
Toll Collection Section
Collection and management of toll charge
Chief : Responsible for overall activities of this unit Toll Collection Team: In charge of collection of toll charge Management & Toll Calculation: In charge of toll calculation and toll collection management
20.5 FINANCIAL PLAN
(CONFIDENTIAL)
20.6 PROCUREMENT PLAN
(CONFIDENTIAL)

20-5
20.7 PROJECT IMPLEMENTATION RISKS AND COUNTERMEASURES
Several risks are expected in the implementation of the Project. The risks and countermeasures are shown in Table 20.7-1.
Table 20.7-1 Risk Matrix No. Associated Risk Responsibility Measures 1. Preparatory Stage 1.1 Delay in establishing
Project Management Unit (PMU) for the Project
DOR ● DOR should establish PMU prior to announcing request for expression of interest.
● PMU staff should be trained on ODA Loan procedures.
1.2 Delay in Selection of the Consultant
DOR ● Consultant selection schedule shall be firmly established and strictly followed.
● Selection criteria shall be firmly established and evaluated in accordance with the established criteria.
1.3 Delay in completion of Detailed Design
DOR ● Competent Consultant shall be selected.
1.4 Delay in selection of Contractor
DOR, Consultant
● Bid schedule shall be firmly established and strictly followed.
● Detailed bid documents shall be prepared so as to avoid confusion, misinterpretation, and so on.
1.5 Delay in Right-of-Way Acquisition and relocation of affected people
DOR, Consultant
● During preparation of Final RAP, constant dialogues shall be exercised to obtain consents from affected people.
● Acquisition unit cost shall be based on the fair market value.
● Budget for ROW acquisition and relocation shall be prepared in time.
● Start ROW acquisition and relocation of people as early as possible.
1.6 Design error, over design and/or under design
DOR, Consultant
● Competent Consultant shall be selected. ● Careful design checks shall be exercised by the
Consultant. 1.7 Objection to the Project by
people DOR, Consultant
● Constant dialogue with people shall be practiced.
2. Implementation Stage 2.1 Delay in work schedule and
completion Contractor, DOR, Consultant
● Competent Contractor shall be selected. ● Progress of work shall be strictly monitored by
the Consultant. ● Any signs of delay such as negative slippage of
progress, delay in delivery of materials, etc. shall be noticed as early as possible by both the Consultant and the Contractor. Recovery plan/measures shall be established and agreed by DOR, the Consultant and the Contractor and implemented accordingly.
2.2 Encountering unexpected geological conditions and ground water conditions.
Contractor, Consultant, DOR
● Advanced boring shall be implemented. ● As soon as the unexpected geological conditions
are observed, the Contractor shall propose countermeasures and the Consultant shall evaluate and recommend countermeasures to DOR,

20-6
No. Associated Risk Responsibility Measures ● Necessary change order shall be approved by
DOR. 2.3 Poor quality of material
and work Contractor, Consultant, DOR
● Quality of materials and works shall be strictly monitored by the Consultant.
● When these are found, materials and works shall be refused.
2.4 Accidents Contractor, Consultant, DOR
● The Contractor must exercise all kinds of countermeasures to prevent accidents.
● The Consultant shall always evaluate the safety measures by the Contractor, and necessary cautions shall be issued to the Contractor.
2.5 Delay in transportation of materials and equipment due to the Third Country’s condition
Contractor, Consultant, DOR
● The Contractor shall always collect information on the Third Country’s economic and political situations. Enough time shall be allocated for delivery of materials and equipment.
2.6 Cost overrun due to change orders
Contractor, Consultant, DOR
● Unnecessary change order shall not be approved. ● When change orders become necessary, the
Consultant shall study if there is any negative change order.
2.7 Cost overrun due to unexpected high rate of inflation and other economic conditions
DOR, Consultant, Contractor
● This shall be fairly treated in accordance with Terms and Conditions of contract.
2.8 Suspension or abandonment of construction works due to Contractor’s own reasons
Contractor, DOR, Consultant
● Sanctions against the Contractor shall be specified in the contract.
● Competent and faithful Contractor should be selected.
2.9 Failure to follow Environmental Requirements
Contractor, Consultant, DOR
● The Consultant shall strictly monitor environmental requirements.
2.10 Traffic Management of existing roads
Contractor, Consultant, DOR
● The Contractor shall pay extra care to maintain smooth flow of traffic during construction.
3. Operation Stage 3.1 Delay in establishment of
Tunnel Management Office (TMO)
DOR ● DOR shall establish TMO at least a year ahead of opening of tunnel and necessary staff shall be recruited.
● TMO staff shall be trained on how to operate and maintain a tunnel safely.
● DOR shall allocate budget for TMO staff capacity development.
3.2 Delay in preparation of Toll Collection
RBN ● RBN should determine if it will outsource toll collection to the private sector.
● If so determined, a company should be selected at least six (6) months ahead of tunnel opening.
● Selected company shall finish preparation of toll collection at least three (3) months ahead of tunnel opening.
3.3 Insufficient coordination with Traffic Police and LGUs
DOR ● DOR shall complete coordination with Traffic Police and LGUs at least three (3) months ahead of tunnel opening.
3.4 Bad driving manner of drivers inside the tunnel
DOR ● DOR should undertake safety driving campaigns to private car users and trucks/bus drivers

20-7
No. Associated Risk Responsibility Measures 3.5 Lack of Toll Revenue RBN ● In case of shortage of toll revenue for tunnel
O&M, RBN shall allocate additional fund to DOR from Road Fund.
3.6 New Development above land of a tunnel
DOR ● TMO should periodically monitor if there is any new development above land of a tunnel.
3.7 Lack of environmental monitoring
DOR ● DOR through TMO should monitor environmental condition required in EIA periodically.
3.8 Insufficient electricity supply
NEA ● In accordance with MOU exchanged between DOR and NEA, NEA shall supply electricity for tunnel O&M.
20.8 RECOMENDATION TO DETAILED DESIGN STAGE
The following points should be carefully reviewed at the detailed design stage;
Vertical alignment at the west side of Sanga tunnel to ease gradient and to improve the mass-balance,
The location of east portal of Sanga tunnel to be decided in consideration with the land acquisition cost and tunnel construction cost,
Installation of concrete center barrier in median at the steep curve sections, Intersection type at merging section between existing road and tunnel section, Installation of approach slab at both of bridge and culverts to avoid settlement of pavement, Minimum longitudinal gradient by taking into account of drainage system, Earthquake resistance measures on earth work section and tunnel section, Installation of parking space using remnants land, Efficient drainage system allowing accumulation of debris to the permissible level, Minimization of tunnel equipment, mainly ventilation facilities, Layout and number of evacuation connection tunnel, Reusing pavement materials for road pavement, Power transmission plan from Substation to tunnel electric room, Consideration of earthquake countermeasures.
It is important to examine countermeasures against earthquakes not only for the tunnel section but for the whole SD road section. Broadly speaking it is necessary to study both countermeasures against seismic external forces during design (hard countermeasures), and disaster prevention operational measures during service (soft countermeasures). The details to be examined at the D/D stage are based on the following concepts.
The earthquake countermeasures during design (hard countermeasures) have been generally considered in this design, but it will be necessary to reset the appropriate seismic design level after the connection route to the SD road and the location of this route, and reflect this in the design of the various structures at the D/D stage.

20-8
Disaster prevention countermeasures (soft countermeasures) are studied under the framework of: 1) Development of the information communication system, 2) Development of a prompt emergency restoration/fire extinguishing and ambulance system, 3) Road traffic restrictions, and 4) Public information for road users. The main items for examination regarding countermeasures, namely construction of the necessary organization and systems, preparation of manuals for response to postulated events, and implementation of training (drills) based on these manuals are carried out within capacity development (C/D) of consulting services stage.
The acquisition of earthquake information for starting up the disaster prevention measures (soft countermeasures) will basically be the public information in Nepal, but if this is insufficient then installation of seismometers in the tunnel management facilities will be investigated in the D/D stage. Also planning for the installation of monitoring and warning equipment (CCTV, push button alarm, fire detectors, etc.), communication equipment, and information provision equipment (emergency information board) for the tunnel in order to collect, transmit, and supply disaster information and road information as facilities to support 3 and 4 has been completed in this design.
1. Development of the information communication system Study for the construction of the organization and system for collecting, transmitting, and providing disaster and road information.
2. Development of a prompt emergency recovery/fire extinguishing and ambulance system Development of the system of personnel, equipment, and supplies for firefighting, first aid, and emergency recovery in preparation for prompt and accurate cooperation during an emergency from the relevant government organizations such as DOR (including firefighting and ambulance).
3. Road traffic restrictions Development of a smooth system for implementing traffic restrictions, by coordination of each of the road administrators with the relevant organizations regarding criteria (for each route or section) relating to seismic intensity for road traffic restrictions for safety inspections of structures and slopes during a disaster.
4. Public information for road users Promotion of disaster prevention awareness and education activities in normal time, that will result in appropriate judgments and actions by road users during a disaster.

CHAPTER 21
PROJECT EVALUATION


21-1
CHAPTER 21 PROJECT EVALUATION
21.1 ECONOMIC EVALUATION
21.1.1 Methodology
Economic evaluation/analysis is done to examine whether the construction and operation of the proposed project will be feasible based on the benefits and costs to be derived from the Project. Improvement of the project road, can play a very important role in strengthening the accessibility and economic growth. However, it is required that the Project must be economically viable, satisfying the government-prescribed hurdle rates. Economic evaluation will be carried for “With Project” and “Without Project” cases. The difference in economic costs and benefits in both cases will be attributed to the Project and subjected to economic feasibility measurement. The economic feasibility of the Project will be indicated by the Economic Internal Rate of Return (EIRR), Cost Benefit Ratio (CBR), and Net Present Value (NPV) at an assumed discount rate of 12%, which is acceptable social discount rate for economic appraisal of public investment projects in the development bank, such as World Bank. The hurdle rates for economic feasibility are as following: EIRR > 12%, B/C >1.0, and NPV > 0. Sensitivity of the project arising from adverse changes in costs and benefits are examined to establish the capacity of the project to exhibit economic feasibility under these cases.
Source: JICA Study Team
Figure 21.1-1 Work flow of Economic Evaluation
Benefit Stream Cost Stream
Unit Travel Time Cost
(TTC)
Traffic Assignment Result (per day)
Application of Shadow Wage Rate (SWD)
Benefit Daily Savings of VOC & TTC
Yearly Benefit
Investment of Project
Exclusion of Transfer Cost
Benefit - Cost Yearly Flow
Evaluation ・EIRR ・B/C ・NPV
“Without” Project
Unit Vehicle Operating Cost
(VOC)
“With” Project
Summations of VOC & TTC
Summations of VOC & TTC
Financial Cost of Project
Economic Cost of Project

21-2
Economic costs and benefits throughout the project life period are compared by a discount cash flow analysis. The discount rate (hereinafter referred to as “DR”) is at 12%, which is widely used in World Bank projects as a social discount rate. For economic evaluation, three indicators are calculated: Economic Internal Rate of Return (hereinafter referred to as “EIRR”), Cost Benefit Ratio (CBR, hereinafter referred to as “B/C”) and Net Present Value (hereinafter referred to as “NPV”).
In addition, the economic life is assumed to be 30 years from 2025 to 2054, taking into account future rapid growth and changes of socioeconomic conditions. Therefore, the Pro-forma cash flow of a project evaluation will be prepared for 2017-2054. They are defined as Table 21.1-1.
Table 21.1-1 Indicators of Economic Evaluation
No. Indicators Calculation Formula or Value 1 Net Present Value (NPV)
�𝐵𝐵𝑡𝑡 − 𝐶𝐶𝑡𝑡
(1 + 𝑖𝑖)𝑡𝑡−1
𝑛𝑛
𝑡𝑡=1
𝑖𝑖 = 12.0%
2 Benefit / Cost Ratio (CBR; B/C) �𝐵𝐵𝑡𝑡/(1 + 𝑖𝑖)𝑡𝑡−1𝑛𝑛
𝑡𝑡=1
𝑖𝑖 = 12.0%
�𝐶𝐶𝑡𝑡/(1 + 𝑖𝑖)𝑡𝑡−1𝑛𝑛
𝑡𝑡=1
3 Economic Internal Rate of Return
(EIRR) 𝑖𝑖0: social discount rate that satisfies the following equation
�𝐵𝐵𝑡𝑡 − 𝐶𝐶𝑡𝑡
(1 + 𝑖𝑖0)𝑡𝑡−1
𝑛𝑛
𝑡𝑡=1
= 0
Source: JICA Study Team
21.1.2 Economic Cost of the Project
(1)Initial Cost
The project cost must be estimated by shadow price in the cost benefit analysis. This is because market price is distorted by governmental system and policies such as custom duty, and market intervention. The shadow price expresses the real value of the resources. The project cost of Suryabinayak - Dhulikhel road improvement project is estimated using the market prices in Chapter 19. It is converted into economic cost and the residual cost after the project life is calculated for economic evaluation, taking the following process. The project cost includes not only the cost of environmental monitoring but also the cost of mitigation measures. The cost of uncertain impact prevention as measures to be taken with groundwater fluctuation fluctuation and mitigation measures is not estimated as a direct cost but is expected as a physical contingency cost.
a) Out of material and equipment cost, import duty and value added tax (VAT) at 13% are deducted.
b) Cost of land acquisition and compensation are deducted as direct transfer payment.

21-3
c) The standard conversion factor of 0.9 is applied.
d) The life year will be considered at 30 years.
Table 21.1-2 Implementation Schedule and Economic Cost
(CONFIDENTIAL)
(2)Operation and Maintenance Cost
The Operation and Maintenance Cost of Suryabinayak - Dhulikhel road improvement project is estimated in Chapter 16. The operation and maintenance cost per year is for SD Road infrastructure and facilities including electricity, Sanga tunnel management office running with staff cost, and maintenance work/ replacement of parts. The renewal costs of equipment is estimated averagely as annual maintenance cost.
Table 21.1-3 Operation and Maintenance Costs
(CONFIDENTIAL)
21.1.3 Economic Benefit of the Project
Economic benefits are calculated as the product of the estimated traffic volumes and Vehicle Operating Cost (VOC) /Travel Time Cost (TTC) respectively for each case, and the amount of ‘without’ case minus ‘with’ case is considered as the benefit provided by the Project.
(1)Unit Vehicle Operation Cost (VOC)
The VOC per unit distance is estimated by type of vehicle being composed of the following components; a) fuel cost, b) oil cost, c) tire cost, d) spare parts cost, e) depreciation cost, f) capital opportunity cost and g) crew and overhead cost. The type of vehicles is 6 types of vehicles, passenger car, micro-bus, mini-bus, heavy bus, light truck, and heavy truck. In this Study, the VOC is calculated based on the Feasibility study of Nagdunga tunnel construction project by JICA used road user costs knowledge system by world bank. The VOC was set up value considering the price escalation.

21-4
Table 21.1-4 Unit VOC in 2017
Source: JICA Study Team
Gradient= 0.0% NPR/veh-kmSpeed
(km/hr)Car & Taxi Utility
Pick upMicroBus
MiniBus
LargeBus
LightTruck
HeavyTruck
Multi-axelTruck
Others
5 31.8 31.8 44.1 107.8 200.5 36.2 169.4 169.4 31.810 29.0 29.0 38.7 83.5 145.9 33.1 137.9 137.9 29.015 26.4 26.4 33.9 64.7 106.2 30.3 112.3 112.3 26.420 23.9 23.9 29.2 45.9 66.5 27.4 86.7 86.7 23.925 22.8 22.8 27.4 40.4 56.3 26.2 77.0 77.0 22.830 21.8 21.8 25.7 34.8 46.1 24.9 67.3 67.3 21.835 21.4 21.4 25.1 32.9 42.8 24.4 63.3 63.3 21.440 21.0 21.0 24.4 31.1 39.5 23.9 59.4 59.4 21.045 20.4 20.4 23.5 28.6 35.4 23.1 53.9 53.9 20.450 19.8 19.8 22.6 26.2 31.4 22.4 48.5 48.5 19.860 18.9 18.9 21.3 23.0 26.2 21.2 41.5 41.5 18.970 18.0 18.0 20.0 19.9 21.1 20.0 34.5 34.5 18.080 17.1 17.1 18.7 16.7 16.0 18.9 27.4 27.4 17.1
Gradient=1.0%Speed
(km/hr)Car & Taxi Utility
Pick upMicroBus
MiniBus
LargeBus
LightTruck
HeavyTruck
Multi-axelTruck
Others
5 32.0 32.0 45.0 113.4 216.7 37.9 179.7 179.7 32.010 29.2 29.2 39.5 87.9 157.7 34.7 146.3 146.3 29.215 26.6 26.6 34.7 68.1 114.8 31.7 119.2 119.2 26.620 24.0 24.0 29.8 48.3 71.9 28.8 92.0 92.0 24.025 23.0 23.0 28.0 42.4 60.8 27.4 81.7 81.7 23.030 21.9 21.9 26.3 36.6 49.8 26.1 71.4 71.4 21.935 21.5 21.5 25.6 34.6 46.2 25.6 67.2 67.2 21.540 21.1 21.1 25.0 32.7 42.7 25.1 63.0 63.0 21.145 20.5 20.5 24.1 30.1 38.3 24.2 57.2 57.2 20.550 19.9 19.9 23.1 27.5 33.9 23.4 51.5 51.5 19.960 19.0 19.0 21.8 24.2 28.4 22.2 44.0 44.0 19.070 18.1 18.1 20.5 20.9 22.8 21.0 36.6 36.6 18.180 17.2 17.2 19.1 17.6 17.3 19.8 29.1 29.1 17.2
Gradient=2.0%Speed
(km/hr)Car & Taxi Utility
Pick upMicroBus
MiniBus
LargeBus
LightTruck
HeavyTruck
Multi-axelTruck
Others
5 32.2 32.2 46.0 119.0 232.8 39.7 190.0 190.0 32.210 29.3 29.3 40.4 92.2 169.5 36.3 154.7 154.7 29.315 26.8 26.8 35.4 71.4 123.4 33.2 126.0 126.0 26.820 24.2 24.2 30.5 50.6 77.3 30.1 97.3 97.3 24.225 23.1 23.1 28.6 44.5 65.4 28.7 86.4 86.4 23.130 22.1 22.1 26.8 38.4 53.5 27.3 75.5 75.5 22.135 21.6 21.6 26.2 36.3 49.7 26.8 71.1 71.1 21.640 21.2 21.2 25.5 34.3 45.9 26.2 66.6 66.6 21.245 20.6 20.6 24.6 31.6 41.1 25.3 60.5 60.5 20.650 20.0 20.0 23.6 28.9 36.4 24.5 54.4 54.4 20.060 19.1 19.1 22.3 25.4 30.5 23.2 46.5 46.5 19.170 18.2 18.2 20.9 21.9 24.5 21.9 38.7 38.7 18.280 17.4 17.4 19.5 18.4 18.6 20.7 30.8 30.8 17.4

21-5
Table 21.1-5 Unit VOC in 2017
Source: JICA Study Team
Gradient=3.0%Speed
(km/hr)Car & Taxi Utility
Pick upMicroBus
MiniBus
LargeBus
LightTruck
HeavyTruck
Multi-axelTruck
Others
5 32.4 32.4 47.0 124.5 249.0 41.4 200.3 200.3 32.410 29.5 29.5 41.2 96.5 181.3 37.9 163.1 163.1 29.515 26.9 26.9 36.1 74.7 131.9 34.6 132.9 132.9 26.920 24.3 24.3 31.1 53.0 82.6 31.4 102.6 102.6 24.325 23.2 23.2 29.2 46.6 69.9 30.0 91.1 91.1 23.230 22.2 22.2 27.4 40.2 57.2 28.5 79.6 79.6 22.235 21.8 21.8 26.7 38.0 53.2 27.9 74.9 74.9 21.840 21.4 21.4 26.0 35.9 49.1 27.3 70.2 70.2 21.445 20.8 20.8 25.1 33.1 44.0 26.5 63.8 63.8 20.850 20.2 20.2 24.1 30.2 38.9 25.6 57.4 57.4 20.260 19.3 19.3 22.7 26.6 32.6 24.2 49.1 49.1 19.370 18.4 18.4 21.3 22.9 26.2 22.9 40.8 40.8 18.480 17.5 17.5 19.9 19.3 19.9 21.6 32.4 32.4 17.5
Gradient=4.0%Speed
(km/hr)Car & Taxi Utility
Pick upMicroBus
MiniBus
LargeBus
LightTruck
HeavyTruck
Multi-axelTruck
Others
5 32.6 32.6 47.9 130.1 265.2 43.1 210.6 210.6 32.610 29.7 29.7 42.0 100.8 193.0 39.4 171.6 171.6 29.715 27.1 27.1 36.9 78.1 140.5 36.1 139.7 139.7 27.120 24.5 24.5 31.7 55.4 88.0 32.7 107.9 107.9 24.525 23.4 23.4 29.8 48.7 74.5 31.2 95.8 95.8 23.430 22.3 22.3 27.9 42.0 61.0 29.7 83.7 83.7 22.335 21.9 21.9 27.3 39.7 56.6 29.1 78.8 78.8 21.940 21.5 21.5 26.6 37.5 52.2 28.5 73.8 73.8 21.545 20.9 20.9 25.6 34.5 46.9 27.6 67.1 67.1 20.950 20.3 20.3 24.6 31.6 41.5 26.6 60.3 60.3 20.360 19.4 19.4 23.2 27.8 34.7 25.2 51.6 51.6 19.470 18.5 18.5 21.8 24.0 27.9 23.8 42.9 42.9 18.580 17.6 17.6 20.3 20.1 21.2 22.5 34.1 34.1 17.6
Gradient=5.0%Speed
(km/hr)Car & Taxi Utility
Pick upMicroBus
MiniBus
LargeBus
LightTruck
HeavyTruck
Multi-axelTruck
Others
5 32.8 32.8 48.9 135.7 281.3 44.9 221.0 221.0 32.810 29.9 29.9 42.9 105.1 204.8 41.0 180.0 180.0 29.915 27.2 27.2 37.6 81.4 149.1 37.5 146.6 146.6 27.220 24.6 24.6 32.4 57.8 93.3 34.0 113.2 113.2 24.625 23.5 23.5 30.4 50.8 79.0 32.5 100.5 100.5 23.530 22.4 22.4 28.5 43.8 64.7 30.9 87.8 87.8 22.435 22.0 22.0 27.8 41.4 60.1 30.3 82.6 82.6 22.040 21.6 21.6 27.1 39.1 55.4 29.6 77.5 77.5 21.645 21.0 21.0 26.1 36.0 49.7 28.7 70.4 70.4 21.050 20.4 20.4 25.1 33.0 44.0 27.7 63.3 63.3 20.460 19.5 19.5 23.7 29.0 36.8 26.2 54.1 54.1 19.570 18.6 18.6 22.2 25.0 29.6 24.8 44.9 44.9 18.680 17.7 17.7 20.8 21.0 22.5 23.4 35.8 35.8 17.7
Gradient=6.0%Speed
(km/hr)Car & Taxi Utility
Pick upMicroBus
MiniBus
LargeBus
LightTruck
HeavyTruck
Multi-axelTruck
Others
5 33.0 33.0 49.8 141.2 297.5 46.6 231.3 231.3 33.010 30.0 30.0 43.7 109.4 216.6 42.6 188.4 188.4 30.015 27.4 27.4 38.4 84.8 157.6 39.0 153.4 153.4 27.420 24.7 24.7 33.0 60.1 98.7 35.3 118.5 118.5 24.725 23.7 23.7 31.0 52.9 83.5 33.7 105.2 105.2 23.730 22.6 22.6 29.1 45.6 68.4 32.1 91.9 91.9 22.635 22.2 22.2 28.4 43.2 63.5 31.4 86.5 86.5 22.240 21.7 21.7 27.6 40.7 58.6 30.8 81.1 81.1 21.745 21.1 21.1 26.6 37.5 52.6 29.8 73.7 73.7 21.150 20.5 20.5 25.6 34.3 46.5 28.8 66.3 66.3 20.560 19.6 19.6 24.1 30.2 38.9 27.3 56.7 56.7 19.670 18.7 18.7 22.6 26.0 31.3 25.8 47.0 47.0 18.780 17.8 17.8 21.2 21.9 23.8 24.3 37.4 37.4 17.8
Gradient=7.0%Speed
(km/hr)Car & Taxi Utility
Pick upMicroBus
MiniBus
LargeBus
LightTruck
HeavyTruck
Multi-axelTruck
Others
5 33.1 33.1 50.8 146.8 313.7 48.3 241.6 241.6 33.110 30.2 30.2 44.6 113.7 228.3 44.2 196.8 196.8 30.215 27.6 27.6 39.1 88.1 166.2 40.4 160.3 160.3 27.620 24.9 24.9 33.6 62.5 104.1 36.6 123.7 123.7 24.925 23.8 23.8 31.6 55.0 88.1 35.0 109.9 109.9 23.830 22.7 22.7 29.6 47.4 72.1 33.3 96.0 96.0 22.735 22.3 22.3 28.9 44.9 67.0 32.6 90.4 90.4 22.340 21.9 21.9 28.2 42.3 61.8 31.9 84.7 84.7 21.945 21.3 21.3 27.1 39.0 55.4 30.9 77.0 77.0 21.350 20.6 20.6 26.1 35.7 49.1 29.8 69.2 69.2 20.660 19.7 19.7 24.6 31.4 41.1 28.3 59.2 59.2 19.770 18.8 18.8 23.1 27.0 33.0 26.7 49.1 49.1 18.880 17.9 17.9 21.6 22.7 25.0 25.2 39.1 39.1 17.9

21-6
(2)Unit Travel Time Cost (TTC)
The travel time cost is the lost cost for travel by vehicle. TTC should be considered for economic analysis of Suryabinayak - Dhulikhel road improvement project because the income and price are increasing every year in Nepal. Therefore, it is not affordable to ignore this item if considering the economic increase in Nepal. The TTC is normally calculated based on the average labor productivity and income of the country. As DOR don’t configure official TTC for road projects in Nepal, the Survey Team estimated TTC per vehicle-km based on income level, working time and the average number of passengers from OD survey on roadside by type of vehicle.
Basically, reduction in travel time is the main component in the derivation of the TTC saving. The annual savings was calculated as the difference in travel time between the base road network and with Suryabinayak - Dhulikhel Improvement Road project. Due to unavailability of the latest official income data, the information based on the interview to authorities in Nepal government was used as the average income per income level. The unit TTC of vehicles is shown in Table 21.1-6.
Table 21.1-6 Unit TTC in 2017
Source: JICA Study Team
(3)Estimation of Economic Benefit (VOC and TTC Saving)
Based on the unit VOC by vehicle type, vehicle speed and the total vehicle-km, VOC saving by year is estimated. The daily TTC saving by year is also estimated based on the unit TTC by vehicle type and the total vehicle-hour. Table 21.1-7.
Classification NPR/veh.-minCar & Taxi 12.8
Utility Pick up 14.0Micro Bus 20.9Mini Bus 47.7Large Bus 50.6
Light Truck 5.1Heavy Truck 6.6
Multi-axel Truck 7.3Others 9.6

21-7
Table 21.1-7 Economic Benefit
Source: JICA Study Team
21.1.4 Results of Economic Analysis
The result of economic analysis is shown at Table 21.1-8. The economic costs and benefits of the project generated a positive NPV and on EIRR that is higher than the government prescribed hurdle rate (12%). These values indicate that the project is economically viable.
Table 21.1-8 Result of Economic Analysis
*Social discount rate is 12.0% Source: JICA Study Team
21.1.5 Project Sensitivity
The project sensitivity is shown in Table 21.1-9.
Table 21.1-9 Project Sensitivity
Source: JICA Study Team
Table 21.1-10 Economic Analysis
(CONFIDENTIAL)
21.2 FINANCIAL EVALUATION
Financial evaluation/analysis is carried out when the proposed project is a toll road project that generates
VOC saving TTC saving Total
2025 1,638.9 1,870.2 3,509.1
2030 1,814.3 2,121.5 3,935.7
2035 1,974.2 2,370.1 4,344.3
2040 2,392.9 2,914.4 5,307.4
2045 2,549.7 3,169.4 5,719.1
2050 2,709.2 3,429.6 6,138.9
yearEconomic Benefit (Million NPR / year)
No. Indicators Result1 Net Present Value (NPV) 570 Million NPR2 Benefit / Cost Ratio (CBR;B/C) 1.043 Ecomonic Internal Rate of Return (EIRR) 12.4%
Base Cost plus 10% Cost plus 20%Base 12.4% 11.4% 10.6%
Benefit less 10% 11.3% 10.4% 9.7%Benefit less 20% 10.2% 9.3% 8.5%

21-8
toll revenue. In this Project, the Sanga Tunnel section is a toll road, so it is necessary to conduct a financial analysis. However, according to information from DOR, the toll revenue at Sanga Tunnel is applied to maintenance and repair expenses of the Sanga Tunnel section. Therefore, there is no need for financial analysis and it is necessary to check whether the maintenance and repair expenses of the Sanga Tunnel section can be covered by toll income. Confirming whether maintenance fee for the Sanga Tunnel section can be covered by commuting income is carried out in Chapter 15.
21.3 OPERATION AND EFFECT INDICATORS
21.3.1 Selection of Operation and Effect Indicators
Based on JICA Guideline, “JICA Operation Indicator and Effect Indicator Reference in ODA Loan Projects”, indicators to be applied in this Suryabinayak - Dhulikhel Improvement Road project are as shown in Table 21.3-1. These are the indicators to identify the effect and achievement by this project, through monitoring the change of situations between cases before and after around 2 years after the project. Also, the operation and effect indicators should be used as benchmarks for the appropriate O&M of SD Road. The indicators were adopted from 2027 indicators, that is 2 years after the service of SD Road.
Table 21.3-1 Operation and Effect Indicators
Source: JICA Study Team
21.3.2 Operation and Effect Indicators
(1)AADT: Annual Average Daily Traffic
The indicator for annual average daily traffic is set as the value shown in Table 21.3-2.
.
Classification Category Indicator PurposeOperation Basic Annual Average Daily Traffic (AADT)
(vehicles/day)To assess if the road transport demand isincreasing as predicted, or if adequate trafficconversion is implemented.
Basic Time Saving (min/year) (min/day)
To assess the degree of reduction in drivingtime, comparing the road after developmentwith that before development.
Auxiliary Vehicle Operation Cost Saving (NPR/year)
To assess the degree of reduction in vehicleoperation cost, comparing the road afterdevelopment with that before development.
Auxiliary Average Velocity Increase (km/hr)
Worked out using the above mentioned timerequired and the distance before and afterthe development.
Effect

21-9
Table 21.3-2 Annual Average Daily Traffic (vehicles/day)
Source: JICA Study Team
(2)Time Saving (Light Vehicle)
The indicator for reduction of travel time is set as the value shown in Table 21.3-3 and Table 21.3-4.
Table 21.3-3 Time Saving (Annual value) (Light Vehicle) (min/year)
Source: JICA Study Team
Table 21.3-4 Time Saving (Day value) (Light Vehicle) (min/day)
Source: JICA Study Team
(3)Vehicle Operation Cost Saving
The indicator for vehicle operation cost Saving in 2027 is set as the value shown in Table 21.3-5.
Table 21.3-5 Vehicle Operation Cost Saving (NPR million/year)
Source: JICA Study Team
Current (2017) 2027- 517.6- 564.9- 230.9- 149.6- 171.6
1,634.6SD Road (all section)
Sanga (Tunnel Section)Suryabinayak~Sanga
Section
Sanga~BanepaBanepa city areaBanepa~Dhilikhel

21-10
(4)Increase of Average Travel Speed
The indicator for increase of average travel speed in 2027 is set as the value shown in Table 21.3-6.
Table 21.3-6 Increase of Average Travel Speed (km/hr)
Source: JICA Study Team

CHAPTER 22
OVERSEAS PROGRAM


22-1
CHAPTER 22 OVERSEAS PROGRAM
22.1 INTRODUCTION
Although several plans for construction of highway tunnels are ongoing in Nepal, none has made into the construction phase. Nagdhunga Tunnel, which is said to be at the last stage of detailed design is expected to be the first one to be recorded in the history of road network of Nepal. With lack of tunnels, most roads in the mountainous area are long and winding requiring long travel time. This project considers provision of tunnel through Sanga Pass, which lies at the east end of Kathmandu Valley. Given that the project is given a go-sign by the Government of Nepal as well as the Government of Japan and that further steps are taken in accordance to the schedule, this could be a second highway consisting of a tunnel.
Although the importance of tunnels in Nepal was comprehended since very long ago, insufficiency of budget in addition to lack of essential and appropriate knowledge and experience of the responsible agency (DOR) and other relevant authorities from planning to construction and management (operation and maintenance) of tunnels had been hindering its development. Now, though gradually, Nepal has become capable in affording for such infrastructures and what it needs the most now is enhancement of knowledge and experience of the executing agency. This project therefore includes a scope, where the technical personals of the agency improve understanding to help the future of smooth project formation.
In order to achieve such objective, 5 personals from the DOR were invited to Japan under the overseas program included in the scopes of this Project. The reason for choosing Japan for the overseas program comes from the fact that geologically, Japan resembles Nepal, in that the geology is very fragile, complicated and consists of faults and fractured zone. Also, Japan has rich, safe and reliable road network consisting numerous tunnels in the mountain areas. Japan has so far successfully constructed more than 9000 road tunnels by year 2011. The participants of this program were taken to actual tunnel construction sites, operation and management centers and other relevant sites. Outline of the program is briefly discussed hereunder.
22.2 OBJECTIVE AND EXPECTED OUTCOMES
22.2.1 Purpose
The overseas program was carried out with the following purposes;
i) To enhance understanding of the concerned officials regarding the importance of tunnels,
ii) To understand the technological level of Japanese contractors through observation of tunnel construction sites and operation and maintenance centers, and
iii) To share views with private companies related to construction of tunnels

22-2
22.2.2 Expected Outcomes
After participating in the overseas program, the participants are expected to;
i) Enhance understanding on the topographic similarities between Nepal and Japan and the role (importance) of tunnels in the road network, particularly at passes,
ii) Accumulate experience from the basic to advanced tunneling technologies of Japan that has been innovated and developed from basic tunneling methods by Japanese contractors for adaptability to the distinct topography, geology, and natural conditions of Japan. Also, see the construction quality including health and safety control measures during construction, and
iii) Enhance knowledge on the operation and maintenance of tunnel.
22.3 PROGRAM PERIOD
The program commenced on December 10, 2017 and lasted seven days until December 16, 2017.
22.4 TARGET ORGANIZATIONS AND OFFICIALS
Target organization initially consisted of Ministry of Physical Infrastructure and Transport (MOPIT), the implementing agency of this project, Department of Roads under MOPIT, executing agency of this project, Finance Ministry and other relevant agencies. However, based on the consultation with the executing agency, participants (officials and organizations) for the program were concluded as shown in Table 22.4-1.
Table 22.4-1 List of Participants
No. Designation Organization
1 Deputy Director General Ministry of Infrastructure and Transport (MOPIT), Department of Roads(DOR), Foreign Cooperation Branch (FCB)
2 Senior Divisional Engineer MOPIT, DOR, FCB
3 Senior Divisional Engineer MOPIT, DOR, FCB
4 Project Chief MOPIT, DOR, Suryabinayak-Dhulikhel, Dhulikhel-Sindhuli-Bardibas Road Project
5 Engineer MOPIT, DOR

22-3
22.5 PROGRAM
The itinerary including the outline of the program of the invitation was as mentioned in Table 22.5-1.
Table 22.5-1 Outline of Program
Date Program hours
Program Location
Training items Stay
Date Day Type Contents
9-10, Dec.
Sat-Sun
Travel (9th Kathmandu→ Bangkok 10th Kansai Intl. Airport, Oosaka Morioka
Domestic Flight (Itami Airport, Oosaka → Hanamki Airport, Morioka (Iwate)
11, Dec. Mon
9:00-10:00 Hotel Orientation Briefing of the program
Morioka 10:00-17:00 Site Observe Highway 46, Tunnel, Information
Center etc.
12, Dec. Tue
9:00-12:30 Site Visit Sinkuzakai and Yanagawa Tunnel Tokyo
14:50-17:00 Varies Travel Tokyo (Bullet Train Hayabusa)
13, Dec. Wed
10:00-10:30 JICA Visit Courtesy Call
Tokyo 10:30-12:00 JICA Visit Meeting
12:30-17:00 Site Visit Aqua-line (Umihotaru) observation
14, Dec. Thu.
10:00-12:00 Site Observe Infrastructure (Tokyo Metropolitan City)
On-board
13:30-17:00 MEX Visit Tunnel Maintenance Technology, Traffic Control Center
15, Dec. Fri
10:00-15:10 CTIE Lecture Introduction of Cutting-edge Technologies
21:00-22:00 Hotel to Haneda Airport, Travel (Haneda→ Bangkok)
16, Dec. Fri Travel (Bangkok→ Kathmandu (Reach KTM 12:15) KTM

22-4
22.6 OUTLINE OF OBSERVATIONS, TECHNOLGIES INTRODUCED AND LECTURES
22.6.1 Observation of Facilities along National Highway
Following facilities between Morioka and Kakunodate along National Highway 46 were observed. Location of each facility is shown in Figure 22.6-1.
i) Yahaba Smart Interchange, which is at the last stage of completion,
ii) On-going construction of Morioka West bypass widening project
iii) Michi-no-Eki Shizukuishi Anekko
iv) Sengan Tunnel constructed in 1976
v) Sengan Road Information Center
vi) Kakunodate Bypass, a 6.1 km long temporary 2-lane road having a design speed of 80km/h access limited road that was opened for traffics in March 2013
Figure 22.6-1 Facilities along National Highway
The observations are expected to have contributed in enhancing the understanding of the participants on the current condition of road infrastructures including bridges and mountain tunnels. These observations are also thought to help enhance the understanding of the participants regarding Japan’s technologies regarding construction, operation and maintenance of the road infrastructures in rural area.
Particularly at Sengan Information Center (SIC), the information on the construction of 2,544m long Sengan Tunnel that was opened to traffic in 1976 and the current bypass including the earlier route of National Highway 46 is displayed by means of a large size diorama model. The model displays how the traffic safety and drive comfort is drastically improved by the bypass by eliminating and improving the long and winding road with sharp vertical curves. It also archives abundant information in the form of panels, pictures and models and in addition provides the road users with formation related to traffic jams and road closures through the many live cameras installed inside the center. Furthermore, it is also
① Yahaba Smart IC
⑥Kakunodate Bypass
③Sizukiishi Anekko ④Sengan Tunnel
②Morioka WestBypass ⑤Sengan Information Center

22-5
equipped with mini-library, kids’ corner and tourist information corner where it provides information of the nearby tourist attractive spots.
22.6.2 Sinkuzakai Tunnel
Sinkuzakai tunnel (provisional name) is a mountain tunnel with the main tube length of approx. 4,998m and crosses through Kuzakai Pass (Kuzakai in Miyoko City to Yanagawa in Morioka City). This lies along the Miyako-Morioka Road (connecting coastal areas of Sanriku in Miyako City, Iwate Prefecture to Morioka City), an approx. 100km long corridor that is being implemented with a purpose of restoration following the damage by the 2011 Japan Earthquake).
The total length of the tunnel including the evacuation tunnel and tunnels connecting the main tube and the evacuation tube is 5,045m. The finished cross section of the main tube is 94.9m2, while the excavation width lies between 14.3m to 15.7m. This tunnel is similar to the tunnel being planned in Nepal, in that is has a single gradient of 4% towards the end-point (Morioka side). The tunnel applies NATM method and blasting for excavation. Outline of the tunnel is illustrated in Figure 22.6-2.
Source: Kajima and Tokyu Joint Venture "Shin-Kuzakai tunnel project" leaflet
Figure 22.6-2 Outline of Sinkuzakai Tunnel
Observation of the excavation work (blasting) was not able to be done as the excavation of the main tube as well as the excavation tube was already completed about a month before the visit. But observation of the primary lining and the installation of circular metal support, extra-reinforcement method at the connecting points of the main and evacuation tubes and finishing condition of the secondary lining of the main tube were observed.
Some of the advanced technologies applied in the construction of this tunnel are, but not limited to;

22-6
i) Auto-computer Jumbo with 4 arms (one of its 4 kinds available in the world. Use of this equipment contributed in shortening the excavation period by 2 years)
ii) Visualization of digging data (contributes to safety during excavation)
iii) Circular (ring type) metal support (contributes to reducing construction period)
22.6.3 Aqua line and Umi-hotaru
Aqua Line is a 15.1km long road that connects Tokyo with Chiba Prefecture across Tokyo Bay.
It consists of an under-sea tunnel and via-duct. The former portion is approximately 9.5km long that begins at Kawasaki side in Tokyo and ends at Umi-hotaru, which literally means ‘Marine Firefly’, a parking area above the sea. From Umi-hotaru to Kisarazu at Chiba side, which is approx. 4.4km long, is connected with via-duct. At Umi-hotaru, the participants observed the magnificently displayed a 14m circular cutter face (blades) of the shield machine that was actually used during the excavation of the tunnel
At the archive center, the Umi-megane, which literally means ‘Sea Glasses’, the participants learned of the techniques and technologies introduced in the construction of Aqua Line through various documents, models, pictures, documentaries, panels etc. displayed inside the facility.
22.6.4 Traffic Control System
Traffic control system of Metropolitan Expressway Company Limited was also observed. The control room observed is the West Tokyo bureau and is one of the three such facilities that MEX possesses for its management of traffics within its responsible road network consisting of expressways and extending to approx. 319 km, as of March 2017, most of which is composed or tunnels and via-ducts. Its traffic management includes inspection of its roads, removal of damaged and broken-down vehicles (including fallen objects), enforcement of traffic regulations, apart from providing road users timely information on congestions or closures of roads including information on detours.
Here the participants were able to observe and understand that traffic management consists of three important steps. They are, i) data collection (grasp the current traffic condition precisely), ii) data
Figure 22.6-3 Cutting Face of Shied Machine
Figure 22.6-4 Control Room

22-7
processing (data collected is processed and sent to road traffic information board in every minute), and iii) Data/ Information provision (traffic information is dissipated by various means to road users).
At the control room, the entire process of how the data is collected, processed and provided to road users were observed. Data is instantly and continuously sent to the huge screen (made up of many small screens and can be switched to each individual screen and into the huge screen) from the 1600 plus CCTV cameras installed at every 500m interval throughout the network of MEX. The data sent is processed to identify locations of traffic congestions, traffic accidents, and fallen objects, all of which is shown in the huge screen and simultaneously on screens installed at the service areas or various sign boards along the roads. The information is also shared to the public through the radio booths provided in the room and through the VICS system in the navigation systems equipped in vehicles.
22.6.5 Presentation and Lectures on Japanese Advanced Technologies
The last day of the visit was ended attending to presentation and lectures on Japanese state-of-art technologies. The presentation and lectures were given by university professors, manufacturing companies, contractors and consultants. The program was held at the conference room of CTI Engineering Co., Ltd. The titles of the presentations are as listed in Table 22.6-1.
Table 22.6-1 List of Presentations and Lectures
Pres
enta
tions
Programs
1. (NATM) Design and Construction Method of Tunnels NATM, Japanese Style)
2. Introduction of application examples of Long fore-piling and Long face reinforcement in Japan
3. FILM (Flat Insulated Lining Method) for improving Long-Term Durability
Lec
ture
s
4. Life Cycle Maintenance of Road Tunnels -Technology and Challenges
5. On-Site Visualization for effective management of road infrastructures
6. PIARC Activity TC E3 “Disaster Management)
22.7 OBSERVATIONS
(1)Feedback from the participants
• The program provided opportunity to reassure the similarity of landscape, topography, geology, and natural conditions between Nepal and Japan.
• Amazed to see application of unique techniques and ideas (structures for preventing blizzards, poles for estimating the accumulated height of the snow, vertically arranged traffic signals and

22-8
cone type roofs etc.) peculiar to snowy areas against blizzard and accumulation of snow.
• Morioka City resembles to Kathmandu Valley. Though there is no snowfall in Kathmandu, road infrastructures observed here is referential for development of the same in Kathmandu.
• It was a rare experience to see and touch the stone samples from the excavated tunnel of Sinkuzakai Tunnel. It was a nice opportunity to ascertain the shape, color, rigidity etc. and knowing the geology of the excavated area.
• Surprised to know that the excavation tunnel was paved with concrete by the contractor’s own expense (was not in the scope of works) to enhance safety and accomplish shortening of construction period
• Ascertained the importance of ensuring durability and maintaining quality even if it inflates the cost slightly, by knowing that the ring type (circular) metal support was applied, although the bottom part was not included in the drawings.
• Reassured level of Japanese contractors knowing that the tunnel was excavated from both sides, but the difference was only 3cm when the two ends met at the middle of the tunnel.
• Enhanced understanding of the importance of safety inside the construction site. Nepal is still taking safety as granted.
• Accumulated knowledge on the importance of traffic management, especially instant and continuous sharing of the information that is useful to road users.
• The presentation and lectures on the last day provided with abundant knowledge on cutting-edge technologies in construction of tunnels.
(2)Points of Consideration
• Wider participant in terms of organizations is desirable as this visit was limited to participation from one organization only, the Department of Roads.
• Participants bringing one’s belongings in two separate bags, in consideration with the domestic travel by air, was ideal. This enabled the participants domestic travel efficiently.
• Reconfirmation of construction progress is important as the excavation work of the tunnel, which is the focal point of the observation of the target tunnel was unable to be done due to its completion by the time of the participants arrival.

22-9
22.8 GLIMPSES OF THE VISIT
The glimpses of the visit are shown in the pictures below.
Pic-1:NH-46 (Sengan Tunnel) Pic-2:N-46 (Sengan Information Center)
Pic-3:NH-46 (Snow Shelter) Pic-4:Sinkuzaki Tunnel Project Office
Pic-5:Sinkuzakai Tunnel Pic-6:Traffic Control Center (MEX)
Pic-7:Traffic Control Room Pic-8:Presentation and Lectures at CTIE