Additional Information - Interacoustics
384
Additional Information Affinity 2.0 / Equinox 2.0 Science made smarter D-0004576-Q – 2022/05
-
Upload
khangminh22 -
Category
Documents
-
view
0 -
download
0
Transcript of Additional Information - Interacoustics

Additional Information
Affinity2.0/ Equinox2.0
Science made smarter
D-00
0457
6-Q
– 2
022/
05


Table of Contents
1 AC440 .............................................................................................................................. 1
1.1 About AC440 module..................................................................................................... 1
1.2 Launching AC440 .......................................................................................................... 2 1.2.1 Launching f rom OtoAccess® ....................................................................................... 2 1.2.2 Launching f rom Noah.................................................................................................. 2 1.2.3 Using the tone screen ................................................................................................. 3
1.3 The speech screen elements ......................................................................................... 9 1.3.1 Speech audiometry in graph mode............................................................................. 12 1.3.2 Speech audiometry in table mode .............................................................................. 17
1.4 Binaural speech........................................................................................................... 19
1.5 Full 2(4) channel speech in noise ................................................................................ 20
1.6 Counselling tab ........................................................................................................... 22 1.6.1 SoundStudio............................................................................................................. 22
1.7 Clinical application of the AC440 tests ........................................................................ 23 Air conduction audiometry ..................................................................................................... 23 1.7.1 High f requency audiometry ........................................................................................ 25 1.7.2 Multi f requency audiometry........................................................................................ 26 1.7.3 Bone conduction audiometry ..................................................................................... 26 1.7.4 Masking 27 1.7.5 Speech audiometry ................................................................................................... 28 1.7.6 Masking level difference (MLD).................................................................................. 35 1.7.7 Master hearing aid (MHA) ......................................................................................... 37 1.7.8 Hearing loss simulation (HLS).................................................................................... 39 1.7.9 Short increment sensitivity index ................................................................................ 40 1.7.10 Weber .................................................................................................................. 41 1.7.11 Knaster .................................................................................................................. 42 1.7.12 ABLB/Fowler ............................................................................................................ 44 1.7.13 Stenger test.............................................................................................................. 45 1.7.14 TEN test .................................................................................................................. 47 1.7.15 QuickSIN .................................................................................................................. 47 1.7.16 Tone decay17 ............................................................................................................ 49 1.7.17 ANL test18 ................................................................................................................ 52 1.7.18 SIQ test .................................................................................................................. 57 1.7.19 SIN test .................................................................................................................. 59 1.7.20 VDB-express ............................................................................................................ 61
1.8 Working with individual setups (test protocols) .......................................................... 64 1.8.1 Selecting a test protocol: ........................................................................................... 64 1.8.2 Creating new protocols.............................................................................................. 65 1.8.3 Finishing the test protocol.........................................................................................114 1.8.4 Changing a test protocol permanently .......................................................................114 1.8.5 Changing a test protocol temporarily .........................................................................115 1.8.6 Importing and exporting test protocols .......................................................................116
1.9 General setup .............................................................................................................118 1.9.1 Symbol editor ..........................................................................................................119

1.9.2 Noah database settings............................................................................................120 1.9.3 Tone and speech settings ........................................................................................120
1.10 General suite settings and examiner ..........................................................................121 1.10.1 Start-up .................................................................................................................121 1.10.2 Examiner settings ....................................................................................................121 1.10.3 Languages ..............................................................................................................122 1.10.4 PDF print.................................................................................................................123 1.10.5 NOAH comment ......................................................................................................124
1.11 Password protection ..................................................................................................125
1.12 The AC440 menu items...............................................................................................126
1.13 PC Shortcut manager .................................................................................................128
1.14 Standalone database settings ....................................................................................129
1.15 View data without license ...........................................................................................129
1.16 FAQ ............................................................................................................................131
1.17 Appendix 1 .................................................................................................................133 1.17.1 Audiometer implementation of the TEN(HL) test for diagnosing cochlear dead regions .133
1.18 Appendix 2 .................................................................................................................140 1.18.1 Masking help/automasking quick guide .....................................................................140
1.19 Technical specifications of the AC440 software .........................................................143
2 REM440 ........................................................................................................................145
2.1 About REM440 ............................................................................................................145
2.2 REM440 tests..............................................................................................................145
2.3 Launching REM440.....................................................................................................146 2.3.1 Launching REM440 f rom Noah4: ..............................................................................146 2.3.2 Launching REM440 f rom OtoAccess®: .....................................................................146
2.4 The REM screen elements ..........................................................................................147
2.5 Background on real-ear measurements using REM440 ..............................................154 2.5.1 Required items ........................................................................................................154 2.5.2 Calibration...............................................................................................................156 2.5.3 Gain versus response view.......................................................................................157 2.5.4 Real-ear measurements on open f ittings ...................................................................158 2.5.5 Probe placement .....................................................................................................160 2.5.6 Stimuli for real-ear measures ....................................................................................160 2.5.7 Referencing.............................................................................................................163 2.5.8 Vocal effort ..............................................................................................................164 2.5.9 Working with f itting targets........................................................................................164 2.5.10 Comparing to the hearing aid f itting sof tware .............................................................169 2.5.11 Speech intelligibility index (SII) .................................................................................171 2.5.12 Display peaks and valleys ........................................................................................172 2.5.13 Preconditioning and sweep delay..............................................................................172 2.5.14 Smoothing a curve ...................................................................................................173

2.5.15 Comparing curves....................................................................................................173 2.5.16 Managing multiple curves .........................................................................................174
2.6 Clinical application of real-ear measurements using REM440....................................176 2.6.1 REUR/REUG measurements....................................................................................176 2.6.2 REAR/REAG measurements ....................................................................................180 2.6.3 REIG measurements ...............................................................................................182 2.6.4 RECD measurements ..............................................................................................184 2.6.5 REOR/REOG measurements ...................................................................................195 2.6.6 Measuring input/output.............................................................................................196 2.6.7 Directionality measurements.....................................................................................198 2.6.8 Binaural REM measurements ...................................................................................199
2.7 FM system verification ...............................................................................................207 2.7.1 FM transparency......................................................................................................207 2.7.2 Ear level, FM only ....................................................................................................210
2.8 Working with individual setups (test protocols) .........................................................213 2.8.1 Selecting a test protocol ...........................................................................................213 2.8.2 Creating new test protocols ......................................................................................214 2.8.3 Combined Screen Setup ..........................................................................................232 2.8.4 Fitting prescription setup ..........................................................................................233 2.8.5 Finishing the test protocol.........................................................................................238 2.8.6 Changing a test protocol permanently .......................................................................238 2.8.7 Changing a test protocol temporarily .........................................................................239 2.8.8 Importing and exporting test protocols .......................................................................239
2.9 General setup .............................................................................................................241
2.10 The REM 440 menu items ...........................................................................................243
2.12 Visible speech mapping (VSPM440) ...........................................................................246 2.12.1 About visible speech mapping ..................................................................................246
2.13 The visible speech mapping screen ...........................................................................247
2.14 Verification with visible speech mapping ...................................................................253 2.14.1 Considerations before you begin...............................................................................253 2.14.2 Visible speech mapping (in ear mode).......................................................................253 2.14.3 Visible speech mapping (in coupler mode/test box mode)...........................................254
2.15 Visual tools for counseling and verification ...............................................................257 2.15.1 Percentile analysis ...................................................................................................257 2.15.2 Display peaks and valleys ........................................................................................258 2.15.3 Show examples .......................................................................................................258 2.15.4 Speech intelligibility index.........................................................................................259 2.15.5 Speech spectrum.....................................................................................................259 2.15.6 Dynamic range view.................................................................................................260 2.15.7 Aided versus unaided...............................................................................................260
2.16 2.16 Visible speech mapping settings ........................................................................260
2.17 FAQ ............................................................................................................................263
2.18 Appendix 1 .................................................................................................................269
2.19 The REM440 test signal characteristics......................................................................269

2.19.1 Signal analysis characteristics ..................................................................................270 The following table summarises the signal analysis characteristics of the Aff inity/Equinox. .......270
2.20 REM PC shortcuts ......................................................................................................271
2.21 REM440 software - technical specifications ...............................................................272
3 HIT440...........................................................................................................................273
3.1 HIT440 quick guide .....................................................................................................273
3.2 About HIT440 ..............................................................................................................275
3.3 HIT 440 tests ...............................................................................................................276
3.4 Launching the HIT 440 software .................................................................................274 3.4.1 Launching f rom OtoAccess® ....................................................................................274 3.4.2 Launching AC440 f rom Noah....................................................................................274
3.5 The HIT440 screen ......................................................................................................275
3.6 Hearing instrument testing using HIT440 ...................................................................280 3.6.1 Testing hearing instruments:.....................................................................................280 3.6.2 Testing bone anchored device using the SKS10 skull simulator ..................................281 3.6.3 Installing the skull simulator license in the HIT440 software: .......................................282 3.6.4 Running pre-programmed test protocols....................................................................287 3.6.5 Automatic testing (auto run)......................................................................................287 3.6.6 Preconditioning and sweep delay..............................................................................288 3.6.7 Smoothing a curve ...................................................................................................288 3.6.8 Show cursor on the graph ........................................................................................289 3.6.9 Comparing curves....................................................................................................291 3.6.10 Comparing to the manufacturer’s specif ication sheets ................................................292
3.7 Application of the HIT440 tests...................................................................................294 3.7.1 Frequency response ................................................................................................294 3.7.2 Gain curve ..............................................................................................................295 3.7.3 Harmonic distortion ..................................................................................................296 3.7.4 3.7.4 Input/output.....................................................................................................296 3.7.5 Intermodulation distortion .........................................................................................298 3.7.6 3.7.6 Attack/recovery time ........................................................................................298 3.7.7 Battery current drain/battery life time .........................................................................300 3.7.8 Equivalent input noise ..............................................................................................302 3.7.9 Reference test gain..................................................................................................303 3.7.10 Microphone directionality..........................................................................................304 3.7.11 Single f requency ......................................................................................................305 3.7.12 Response/gain/input/output ......................................................................................306 3.7.13 Delay .................................................................................................................307 3.7.14 OSPL90 .................................................................................................................308 3.7.15 3.7.15 Full-on gain ...................................................................................................308
3.8 Working with individual setups (test protocols) .........................................................310 3.8.1 Selecting a (standard) test protocol: ..........................................................................310 3.8.2 Designing a customized test protocol ........................................................................311 3.8.3 Combined screen setup ...........................................................................................339 3.8.4 Print layout settings..................................................................................................340 3.8.5 Finishing the test protocol.........................................................................................341 3.8.6 Changing a test protocol permanently .......................................................................342

3.8.7 Changing a test protocol temporarily .........................................................................343
3.9 General setup .............................................................................................................345
3.10 The HIT440 menu items ..............................................................................................348
3.11 HIT440 software - technical specifications .................................................................350
3.12 Appendix 1 .................................................................................................................351 3.12.1 The HIT440 test signal characteristics .......................................................................351 3.12.2 Signal analysis characteristics ..................................................................................352 The following table summarises the signal analysis characteristics of the Aff inity/Equinox. .......352
3.13 Appendix 2: ................................................................................................................353 3.13.1 Connecting the TBS25 to Aff inity2.0/Equinox2.0 ...........................................................353
4 PRINTING AND MAKING REPORTS .....................................................................354
4.1 The print wizard ..........................................................................................................354 4.1.1 Designing a customized print template ......................................................................356 4.1.2 Design elements ......................................................................................................357
4.2 Creating reports .........................................................................................................362 4.2.1 Operation of the report editor ....................................................................................362
5 RECOVERY MANAGER ...........................................................................................366
6 CRASH REPORTS .....................................................................................................368


D-0004576-Q – 2022/05 Affinity/Equinox2.0 – Additional Information Page 1
1 AC440 1.1 About AC440 module AC440 is the PC-based audiometry module for the Af f inity2.0 and Equinox2.0 hardware platforms. The AC440 sof tware is an independent two-channel audiometer. It features tone audiometry for air and bone, speech testing and a variety of masking and signal types. Stimuli are presented using the PC keyboard, mouse, or a dedicated audiometry keyboard. Test results are displayed on screen and saved to the associated database (e.g., Noah, OtoAccess®). They are immediately available for inspection, hearing aid f itting, printout, export, and so on. The AC440 module can also be operated external to a database in stand-alone mode. The module is f lexible, enabling the individual clinician to tailor the system according to their specif ic preferences. It permits the creation of an unlimited number of personalized test protocol settings and functions for different purposes and/or for different clinicians working at the same location. The system also provides you with the option to make individual print layouts, keep reports electronically, and compare actual curves to previous sessions. These numerous setup options can be very helpful and time saving in the daily clinical work environment. In addition to the setup functions, the AC440 also contains counselling tools to help both patient and relatives to get a better understanding of the consequences of hearing impairment and why hearing amplif ication may be needed. The AC440 contains the following tests:
Air Conduction Audiometry o High Frequency Audiometry o Multi Frequency audiometry
Bone Conduction Audiometry Free Field Audiometry Speech Audiometry Masking Level Dif ference (MLD) Master Hearing Aid (MHA) (counselling tool) Hearing Loss Simulation (HLS) (counselling tool) Short Increment Sensitivity Index (SISI) Weber Knaster Stenger Tone Decay Test TEN test QuickSIN Speech in Quiet (SIQ) Speech in Noise (SIN) Acceptable Noise Level (ANL)

D-0004576-Q – 2022/05 Affinity/Equinox2.0 – Additional Information Page 2
1.2 Launching AC440 Ensure that the Af f inity2.0/Equinox2.0 is powered on and connected to your PC before opening the sof tware suite. If the hardware is not detected, the Af f inity Suite will open but it will run in Simulation mode. This is identif iable by the below icon in the lef t of the screen. If the unit is connected then the second icon below will show, indicating a unit is present which it is connected to.
1.2.1 Launching from OtoAccess® For further instructions about working with OtoAccess®, please see the OtoAccess® operation manual.
1.2.2 Launching from Noah If you are using HIMSA’s Noah 4, the Af f inity software will install itself automatically in the menu bar on the start page, along with all the other sof tware modules. For further instructions about working with Noah please see the Noah operation manual.

D-0004576-Q – 2022/05 Affinity/Equinox2.0 – Additional Information Page 3
1.2.3 Using the tone screen The following section describes the elements of the tone screen.
Menu provides access to Print, Edit, View, Tests, Setup, and Help
Print allows for printing the session’s acquired data.
Save & New Session saves the current session in Noah or OtoAccess® and opens a new one.
Save & Exit saves the current session in Noah or OtoAccess® and exits the Suite.
Collapse the lef t side panel.
Go to Tone Audiometry activates the tone screen when in another test.
Go to Speech Audiometry activates the speech screen when in another test.
Extended Range +20 dB extends the testing range and can be activated when the testing dial setting gets within 50 dB of the maximum level of the transducer. Note that the extended range button will f lash when it needs activation for reaching higher intensities. To switch on the extended range automatically, select the Switch extended range on automatically by going to the setup menu.

D-0004576-Q – 2022/05 Affinity/Equinox2.0 – Additional Information Page 4
Fold an area so that it only shows the label or the buttons of that area.
Unfold an area so that all buttons and labels are visible
Show/hide areas can be found by right tone tesclicking on one of the areas. The visibility of the dif ferent areas as well as the space that they take on the screen is locally saved to the examiner.
1 HF requires an additional license for the AC440. If not purchased, the button is grayed out.
List of Defined Protocols allows for selecting a test protocol for the current test session. Please refer to section 1.7 for more information about protocols. Right mouse click on a protocol allows the current examiner to set or deselect a default start-up protocol.
Temporary Setup allows for making temporary changes to the selected protocol. The changes will be valid for the current session only. Af ter making the changes and returning to the main screen, the name of the protocol will be followed by an asterisk (*).
List of historical sessions accesses historical sessions for comparison purposes. The audiogram of the selected session, indicated by the orange background, is shown in colours as def ined by the used symbol set. All other audiograms that are selected by check marks show on screen in the colours as indicated by the text colour of the date and time stamp. Note that this listing can be resized by dragging the double lines up or down.
Right Clicking on a historical session will allow you to see exactly which measurements have been performed in that session. This is useful when trying to f ind a special test amongst several sessions without opening the session individually to f ind the data you need. The tests which have been performed will have a green light next to them. You can also click on Deselect all selected sessions overlays af ter right clicking on the sessions to remove any historic session overlays you have chosen to display.
Go to Current Session brings you back to the current session.
High Frequency1 shows f requencies on the audiogram (up to 20 kHz for the Af f inity2.0/Equinox2.0). However, you will only be able to test in the f requency range the selected headset is calibrated for.
High Frequency Zoom activates high f requency testing and zooms in on the high f requency range. Please refer to section 1.6.1 for more information on high f requency testing.

D-0004576-Q – 2022/05 Affinity/Equinox2.0 – Additional Information Page 5
Edit Mode button activates the editing function. Lef t clicking on the graph will add/move a point to the position of the cursor. By right clicking on a point, it is possible to Delete the recorded point or the entire curve. Furthermore, right mouse click provides the option to Add unmasked threshold, Add no response, Add masked threshold, Add masked-no-response threshold, Copy bone thresholds to other ear, and Hide unmasked thresholds where masked exist.
Mouse controlled audiometry enables you to do the audiometry using the mouse only. The stimulus is presented with the lef t mouse button, and the threshold is stored with the right mouse button.
The dB step size button indicates to which dB step size increment the system is currently set. It rotates f rom 1 to 2 to 5 dB and the larger number indicates the setting.
The hide unmasked threshold will hide those unmasked thresholds where masked thresholds exist.
Toggle Masking Help will activate or deactivate the Masking Help. The masking help function can be removed f rom this interface through amending the settings in the Protocol Setup (See this in section 1.7.2.2). For more information on Masking Help, please see section 1.7.2.2 or Appendix 2 for the Masking Help Quick Guide
Toggle Automasking will activate or deactivate the Automasking feature. For more information on Automasking, please refer to section 1.7.2.2 or to Appendix 4 for the Masking Help Quick Guide.
Talk Forward activates the Talk Forward microphone. The arrow keys can be used to set the talk forward level through the currently selected transducers. The level will be accurate when VU meter indicates to be at zero dB.
Selecting the Monitor Ch1 and/or Ch2 check boxes allow you to monitor one or both channels through an external loudspeaker/headset connected to the monitor input. The monitor intensity is adjusted by the arrow keys.
The Talk back check box enables you to listen to the patient. Note that you need to be equipped with a microphone connected to the talk back input and an external loudspeaker/headset connected to the monitor input.
2 MF requires an additional license for the AC440. If not purchased, the button is greyed out.
Single audiogram toggles between viewing the information of both ears in a single graph and two separate graphs.
Multi frequencies2 activate testing with f requencies in between the standard audiometric test f requencies. The f requency resolution can be adjusted in the AC440 setup.
Synchronize channels locks the two channels together. This function may be used to perform synchronous masking.

D-0004576-Q – 2022/05 Affinity/Equinox2.0 – Additional Information Page 6
The Patient monitor opens an always-on-top window with the tone audiograms and all its counselling overlays shown. This provides an easier layout to counsel the patient. The size and position of the patient monitor gets saved for each examiner individually.
The Phonemes counselling overlay shows phonemes as it is conf igured in the protocol that is currently in use.
The Sound examples counselling overlay shows pictures (png-f iles) as they are set up in the protocol that is currently in use.
The Speech banana counselling overlay shows the speech area as it is set up in the protocol that is currently in use.
The Severity counselling overlay shows the degrees of hearing loss as it is set up in the protocol that is currently in use.
The Max. testable values overlay highlights the area beyond the maximum intensity that the system allows. This ref lects the transducer calibration and dif fers when the extended range is activated.
Selecting HL, MCL, UCL or Tinnitus sets the symbol types that are currently in use by the audiogram for dif ferent tests. HL stands for hearing level, MCL stands for most comfortable level and UCL stands for uncomfortable level. Note that these buttons display the unmasked right and lef t symbols of the currently selected symbol set.
Each type of measurement is saved as a separate curve.
Binaural and Aided allows for indicating if the test is performed with hearing aids or binaurally with corresponding symbols. The measurements will be saved as separate curves.
In the Comments section you can type comments related to any audiometric test. The used space by the comments area can be set by
dragging the double line with your mouse. Pressing the button opens a separate window for adding notes to the current session. The report editor and comment box contain the same text. In case the formatting of the text is important, this can only be set within the report editor.
On pressing the button you will see a menu which allows you to specify the hearing aid style on each ear. This is just for note taking when performing aided measurements on your patient. Af ter saving the session, comment changes can only be made within the same day until the date changes (at midnight). Note: these timeframes are limited by HIMSA and the Noah sof tware and not by Interacoustics.

D-0004576-Q – 2022/05 Affinity/Equinox2.0 – Additional Information Page 7
The Output list for channel 1 provides the option to test through head phones, bone conductor, f ree f ield speakers or insert phones. Note that the system only shows the calibrated transducers. The Input list for channel 1 provides the option to select pure tone, warble tone, narrow band noise (NB) and white noise (WN). Note that the background shading is according to the side that is selected, red for right and blue for lef t.
The Output list for channel 2 provides the option to test through head phones, f ree f ield speakers, insert phones or insert masking phone. Note that the system only shows the calibrated transducers. The Input list for channel 2 provides the option to select pure tone, warble tone, narrow band noise (NB), white noise (WN) and TEN noise3. Note that the background shading is according to the side that is selected, red for right, blue for lef t, and white when of f .
Man and Rev allows toggling between Manual and Reverse test modes. In manual the stimulus is presented only when manually activated. In reverse the signal is presented continuously until interrupted by the tone switch.
Pulsation allows for single and continuous pulsating presentation. The duration of the stimulus can be adjusted in the AC440 setup.
Sim/Alt allows togging between Simultaneous and Alternate presentation. Ch1 and Ch2 will present the stimulus simultaneously when Sim is selected. When Alt is selected, the stimulus will alternate between Ch1 and Ch2. R+L allows for the system to perform binaural masking and tone simultaneously. This setting will need to be enabled in each channel. The test screen will turn grey to indicate this.
Masking indicates if channel 2 is currently in use as a masking channel and in that way makes sure masking symbols are used in the Audiogram. For example, in paediatric testing through f ree f ield speakers, channel 2 can be set as a second testing channel. Note that a separate store function for channel 2 is available when channel 2 is not used for masking.
dB HL Increase and Decrease buttons allow increasing/decreasing the intensities of channel 1 and 2. The arrow keys on the PC keyboard can be used for increasing/decreasing channel 1 intensities. PgUp and PgDn on the PC keyboard can be used for increasing/decreasing channel 2 intensities.
3 TEN noise requires an additional license for the AC440. If not purchased, the stimulus is not available.

D-0004576-Q – 2022/05 Affinity/Equinox2.0 – Additional Information Page 8
Stimuli buttons will light up when hovering the mouse over it. This indicates the presentation of a stimulus. A right mouse click in the Stimuli area will store a no response threshold. A lef t mouse click in the Stimuli area will store the threshold at the current position. Channel 1 stimulation can also be obtained by pressing the space bar or lef t Ctrl key on the PC keyboard. Channel 2 stimulation can also be obtained by pressing the right Ctrl key on the PC keyboard. Mouse movements in the Stimuli area for both channel 1 and channel 2 can ignored depending on the setup.
Frequency and Intensity display area shows what is currently presented. To the lef t the dB HL value for channel 1 is shown and to the right for channel 2 In the centre the f requency is displayed. Notice that the dB dial setting will f lash when trying to go louder than the maximum available intensity. The patient response indicator will appear in between these values when the patient response button is depressed. The colour of this indicator will depend upon which patient response side is used, a red light indicates the right patient response, and a blue light indicates the lef t patient response.
Frequency increase/decrease increases and decreases the f requency respectively. This can also be obtained using the lef t and right arrow keys on the PC keyboard.
Storing thresholds for channel 1 is done by pressing S or by a lef t mouse click in the attenuator of channel 1. Storing a no response threshold can be done by pressing N or by a right mouse click in the stimuli button of channel 1. Storing thresholds for channel 2 is available when channel 2 is not the masking channel. It is done by pressing <Shift> S or by a lef t mouse click in the stimuli button of channel 2. Storing a no response threshold can be done by pressing <Shift> N or by a right mouse click in the attenuator of channel 2.
The hardware indication picture indicates whether the hardware is connected. Simulation mode is indicated when operating the sof tware without hardware. When opening the Suite, the system will automatically search for the hardware. If it does not detect the hardware, it will automatically run in simulation mode.
The Examiner indicates the current clinician who is testing the patient. The examiner is saved with a session and can be printed with the results. This information is taken f rom the login on the database f rom which the Suite is launched, or the suite can be conf igured in the ‘General Suite Settings’ to request an examiner name on start-up. For each examiner, the Suite stores how it is set up with regards to the use of space in the screen. The examiner will f ind that the suite starts up looking the same as it did the last time, they used the sof tware. Also, the examiner can select which protocol must be selected at start up (by right mouse click on the protocol selection list).

D-0004576-Q – 2022/05 Affinity/Equinox2.0 – Additional Information Page 9
1.3 The speech screen elements The following section describes the elements of the speech screen in addition to the tone screen:
Input levels sliders allow for adjusting the input level to 0 VU for the selected input. This ensures that correct calibration is obtained for Mic1, Mic2, CD1, and CD2.On the VU Meter the dial intensity is achieved when the signal is at the 0 mark.
WR1, WR2 and WR3 (Word Recognition) allows selecting dif ferent speech list setups as def ined by the selected protocol. The labels of these lists which go along with these buttons can also be customized in the protocol setup. (See section 1.7.2.3). Binaural and Aided function allows for indicating if the test is performed binaurally or while the patient is wearing hearing aids.

D-0004576-Q – 2022/05 Affinity/Equinox2.0 – Additional Information Page 10
The Output list for channel 1 provides the option to test through head phones, bone conductor, f ree f ield speakers or insert phones. Note that the system only shows the calibrated transducers. The Input list for channel 1 provides the option to select white noise (WN), speech noise (SN), microphone 1 or 2 (Mic1 and Mic2), AUX1, AUX2 and wave f ile. Note that the background shading of the speech Audiogram is according to the side that is selected, red for right and blue for lef t.
The Output list for channel 2 provides the option to test through head phones, f ree f ield speakers, insert phones or insert masking phone. Note that the system only shows the calibrated transducers. The Input list for channel 2 provides the option to select white noise (WN), speech noise (SN), microphone (Mic1 and Mic2), AUX1, AUX2 and wave f ile. Note that the background shading is according to the side that is selected, red for right, blue for lef t, and white when of f .
Speech Scoring:
a) Correct: A mouse click on this button will store the word as correctly repeated. The left arrow key can also be used for storing as correct.
b) Incorrect: A mouse click on this button will store the word as incorrectly repeated. The right arrow key can also be used to score as incorrect. *when using the graph mode, the correct/incorrect scoring is assigned by using the Up and Down arrow keys.
c) Store: A mouse click on this button will store the speech threshold in
the speech graph. A point can also be stored by pressing S.
Phoneme scoring:
a) Phoneme scoring: If phoneme scoring is selected in the AC440 setup, mouse click on the corresponding number to indicate phoneme score. Clicking on the Up arrow and the Down arrow keys will score as correct and incorrect, respectively.
b) Store: A mouse click on this button will store the speech threshold in the speech graph. A point can also be stored by pressing S.
Frequency and Intensity display shows what is currently presented. On the lef t the dB value for channel 1 is shown and on the right side for channel 2. In the centre of the current Speech Score in % and the Word Counter monitors the number of words presented during the test.
a b c
D-0004576-Q – 2022/05 Affinity/Equinox2.0 – Additional Information Page 11
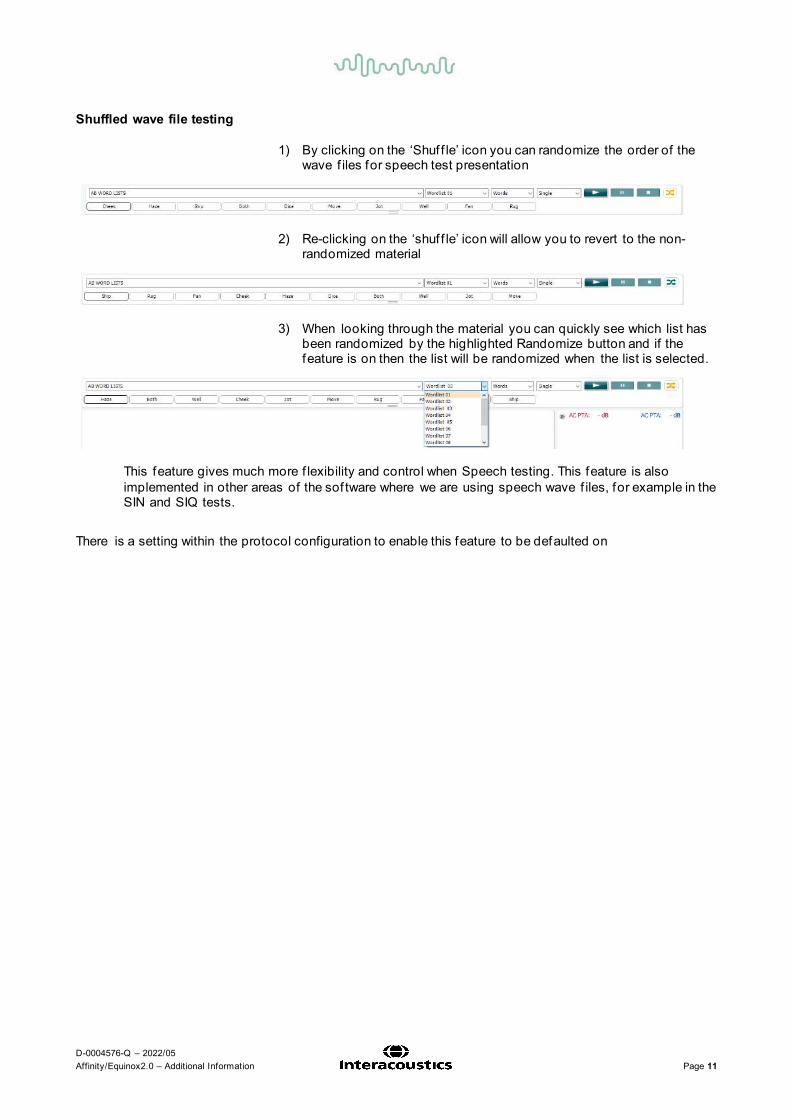
Shuffled wave file testing
1) By clicking on the ‘Shuf f le’ icon you can randomize the order of the wave f iles for speech test presentation
2) Re-clicking on the ‘shuf f le’ icon will allow you to revert to the non-
randomized material
3) When looking through the material you can quickly see which list has
been randomized by the highlighted Randomize button and if the feature is on then the list will be randomized when the list is selected.
This feature gives much more f lexibility and control when Speech testing. This feature is also implemented in other areas of the sof tware where we are using speech wave f iles, for example in the SIN and SIQ tests.
There is a setting within the protocol configuration to enable this feature to be defaulted on

D-0004576-Q – 2022/05 Affinity/Equinox2.0 – Additional Information Page 12
1.3.1 Speech audiometry in graph mode
Graph mode presentation settings in the lower lef t corner and in the presentation options (Ch1 and Ch2) in the upper part of the screen you can adjust the test parameters during the test.
1) The graph: The curves of the recorded speech graph will be displayed on your screen. The x-axis shows the intensity of the speech signal, and the y-axis shows the percentage score. The score is also displayed in the black display in the upper part of the screen along with a word counter.
2) The norm curves illustrate norm values for S (Single syllabic) and M (Multi syllabic) speech material respectively. The curves can be edited according to the normative data you wish to use in the AC440 setup (see section 1.7.2.3)
3) The shaded area illustrates how high in intensity the system will allow. The Extended Range +20 dB button can be pressed to go higher. The maximal loudness is determined by the transducer calibration.

D-0004576-Q – 2022/05 Affinity/Equinox2.0 – Additional Information Page 13
1.3.1.1 Dual speech graphs The graphs can be shown as a dual audiogram to show lef t and right (see example below) this can be enabled in the Speech Setup Screen by clicking on the button called ‘Dual Graph’.

D-0004576-Q – 2022/05 Affinity/Equinox2.0 – Additional Information Page 14
1.3.1.2 50% discrimination line The Graph View allows you to add a 50% discrimination line (see above dual audiogram image for example). This is enabled by checking on the ‘Show 50% Discrimination Line’ setting in the Speech Norm Curves setup (see image below).
1.3.1.3 IEC dB hearing level scale The ability to view the dB HL level scale against the speech audiogram is implemented within Free Field testing for markets using the IEC standard. This brings the ability to see all your measurements, regardless of transducer used, in the dB HL domain. The setting for this needs to be amended under the ‘General Setup’, as highlighted in the image below.

D-0004576-Q – 2022/05 Affinity/Equinox2.0 – Additional Information Page 15
As a note, on changing this setting in General Setup, you will need to close your sof tware for the setting to apply.
Once this setting has been enabled, your Speech graph will show an additional scale at the bottom of the graph indicating the dB HL value. See the example of this below.

D-0004576-Q – 2022/05 Affinity/Equinox2.0 – Additional Information Page 16
1.3.1.4 Bönninghaus & Röser calculation The Bönninghaus & Röser calculation has been implemented for the German market. This is a marker to recognise the accuracy of the test in relation to the patient’s audiometry and to identify when the patient is suitable for compensation/insurance. Settings in the speech setup need Bönninghaus and SRT enabled to show this score. The score will appear as WR weighted (see example below).
NOTE: The Bönninghaus & Röser Calculation is intended for use with the Freiburger Speech Test and the Freiburger Speech Norm Curves.

D-0004576-Q – 2022/05 Affinity/Equinox2.0 – Additional Information Page 17
1.3.2 Speech audiometry in table mode
The AC440 Table Mode consists of two tables: 1) The SRT (Speech Reception Threshold) table. When the SRT test is active, it is indicated in orange
MCL and UCL speech testing can be conducted by selecting or
2) The WR (Word Recognition) table. When WR1, WR2, or WR3 is active the corresponding label will be orange
1.3.2.1 The SRT table The SRT table (Speech Reception Threshold table) allows for measuring multiple SRTs using dif ferent test parameters, e.g., Transducer, Test Type, Intensity, Masking, and Aided. Upon changing Transducer, Masking, and/or Aided and re-testing, an additional SRT entry will appear in the SRT table. This allows for multiple SRT measurements to be shown in the SRT table. Please refer to section 1.6.5.1 for more information about SRT testing.
1.3.2.2 The WR Table The word recognition (WR) table allows for measuring multiple WR scores using dif ferent parameters (e.g., Transducer, Test Type, Intensity, Masking, Binaural and Aided). Upon changing Transducer, Masking, Binaural and/or Aided re-testing an additional WR entry will appear in the WR table. This allows for multiple WR measurements to be shown in the WR table. Please refer to section 1.6.5.2 for more information about Word Recognition testing.
D-0004576-Q – 2022/05 Affinity/Equinox2.0 – Additional Information Page 18

D-0004576-Q – 2022/05 Affinity/Equinox2.0 – Additional Information Page 19
1.4 Binaural speech It is only possible to test Speech binaurally in the Speech audiometry screen. This can be done if channel 1 and channel 2 are using the same air conduction transducer and only when a dif ferent output is chosen. E.g., right ear in channel 1 and lef t ear in channel 2 or vice versa.
When the binaural mode is activated in graph mode the stored symbol will be shown as a “B”
see below:
When the binaural mode is activated in table both results will be stored even if the level is dif ferent. This means when this is stored it will store the channel 2 level and display the results as well as channel 1. See below:
In ‘Binaural mode’ the Pure Tone Average (PTA) calculations will be calculated monaurally only, although the value will be displayed above each Audiogram.

D-0004576-Q – 2022/05 Affinity/Equinox2.0 – Additional Information Page 20
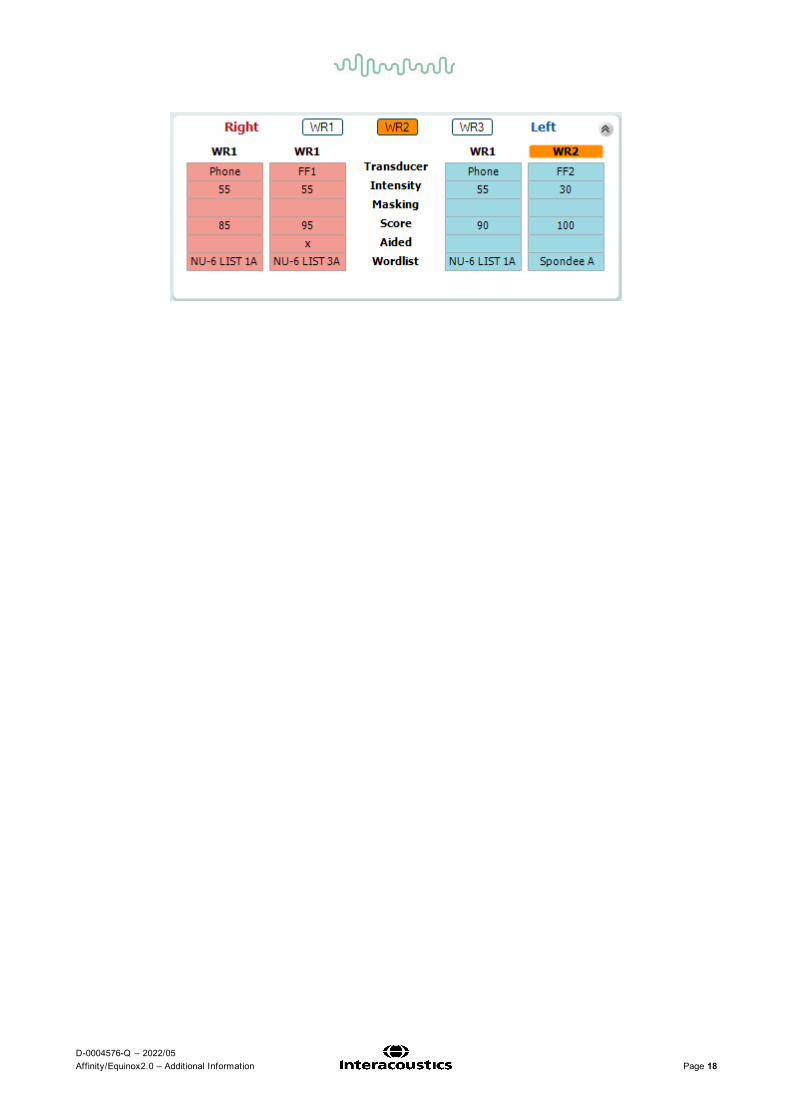
1.5 Full 2(4) channel speech in noise The ability to test via Full 2(4) Channel Speech in noise allows the ability to test whilst stimulating speech and noise in both channels at the same time. If the R+L is chosen in channel 1 the level presented in Channel 1 will be equal in both Lef t and right transducer at the same time and vice versa. When this is enabled, the Audiograms will both be coloured grey. Channel 1 serves as the stimulus in this instance and channel 2 serves as the masking. This will be presented to both ears simultaneously, therefore alteration of f requency and intensity is applied binaurally. When the R+L is activated the stored symbol will be shown as a “B”. See below: If it is used in speech mode it will be stored equally to the binaural mode, as mentioned above.
When the R+L is activated in the speech section and displayed via the table mode both results will be stored even if the level is dif ferent. This results in second channel data being stored at the same time.
The table screen is split up in two which means the transducer and the stored level is shown for channel 1 f irst and then channel 2. See below:

D-0004576-Q – 2022/05 Affinity/Equinox2.0 – Additional Information Page 21
Channel 1 Channel 2
Binaural Stimulus Intensity Binaural Masking Intensity

D-0004576-Q – 2022/05 Affinity/Equinox2.0 – Additional Information Page 22
1.6 Counselling tab Under the menu icon there is a tab titled counslling. This is where the counselling features of the sof tware are contained.
1.6.1 SoundStudio The SoundStudio is a counselling tool which allows you to recreate sound environments to simulate real-life situations for use during hearing aid f itting and counselling. To f ind this please go to the Menu icon in the top lef t corner and select Counselling.
For more information regarding the SoundStudio, please contact your local distributor.

D-0004576-Q – 2022/05 Affinity/Equinox2.0 – Additional Information Page 23
1.7 Clinical application of the AC440 tests This section will give a short introduction to the clinical applications of the AC440 module. The methods described here primarily based on the textbooks by Stach (1998) and Katz (2002) and describes one way of performing the individual tests. Other standards may, however, dictate other procedures. Air conduction audiometry In air conduction audiometry, a test signal is presented to the test subject via headphones or insert phones. The test subject responds to the signal by pressing a patient response button. The audiometric threshold is def ined as the lowest intensity at which the patient can detect the test signal 50% of the time The purpose of air-conduction audiometry is to establish the hearing sensitivity at various f requencies. The test provides information about the conductive and sensory systems of hearing but cannot distinguish between conductive and sensorineural hearing losses. Required items: • The Af f inity2.0 hardware • Licensed AC440 Audiometry module within your Af f inity2.0 hardware • Headphones or insert phones • A response button Test procedure: 1) Open the Af f inity Suite through your patient management system, Noah or OtoAccess®. 2) Ensure you are in the AUD module of the Suite and if needed select a test protocol in the List of
Protocols.
3) Perform otoscopy to make sure that any anatomical abnormalities are considered and that cerumen is not obstructing the ear canal. Perform a medical history to f ind out whether there are any confounding factors which may prevent you f rom performing the test or make considerations for. It is also good to ask if the patient is experiencing tinnitus. If yes, you may consider doing the test using warble tones or narrow band noise instead of pure tones which can be hard to distinguish f rom the tinnitus at some f requencies.
4) Select the input and output for channel 1. If masking is needed, use the channel 2 to determine masking level and f requency. Note that this
decision is usually made af ter performing an unmasked audiogram based on dif ferences in thresholds. Channel 2 should be muted or switched of f in the beginning of the evaluation. If preferred, Auto Masking or Masking Help can be turned on.

D-0004576-Q – 2022/05 Affinity/Equinox2.0 – Additional Information Page 24
These features are intended to help the inexperienced clinician when masking is required. Please see section 1.7.2.2 and Appendix 2 for more information on this.
5) Explain to the patient that they will hear a number of dif ferent tones through the headphones and that they should press on the response button whenever the tone is audible, even if it is very faint.
6) Place the headphones over the patient’s ears and begin the audiometry test. If one ear is assumed to have worse hearing compared to the other, start the audiometry on the better ear. If the hearing level is assumed to be equal on both ears, start on the right.
7) Use the arrow buttons on the PC keyboard or the audiometer keyboard to set the f requency and
intensity. You may also choose Mouse controlled audiometry to do the audiometry using only the mouse. Lef t click to stimulate and right click to store the threshold.
8) Begin the testing at 1000 Hz at an intensity which you think the patient should hear. A normal start level would be approximately 40 dB for a person assumed to have normal hearing and 30 dB above presumed threshold if hearing loss is present. However, the start intensity should never exceed 70-80 dB.
9) Present the stimulus for approximately 2 seconds and wait for the patient to respond. The Stimuli area will light up while presenting, visually indicating that the stimulus is presented. The stimuli can be presented three ways:
a. Pressing on the space bar b. Hovering the mouse over the Stimuli button c. Using the stimuli button on the Audiometry keyboard (additional accessory)
10) If no reaction is obtained, increase the intensity by 10dB steps until the patient responds. If the patient
has a severe hearing loss you may want to press the Extended Range +20 dB button , which allows activation above a 55 dBHL intensity of compatible transducers.
11) You may now begin the threshold search using the Hughson Westlake procedure, known as the “10 down, 5 up” method: Present the stimuli. If the patient hears it, decrease by 10 dB. If the patient does not hear it, increase by 5 dB. The threshold is set at the intensity where the patient can perceive the tone 50% of the time during the ascending portion of the threshold search (when increasing by 5 dB). Typically, the tone should be heard 2 out of 3 times to be considered the threshold. .
12) In case of mistakes during the test you can right click on the threshold which will prompt a menu with edit options: Add unmasked threshold, Add no response, Add masked threshold, Add masked-no response threshold, Copy bone thresholds to other ear, Delete threshold, Delete curve and Hide unmasked thresholds where masked exist.
13) If the dif ference between the two ears exceeds 40 dB (55 dB if using insert phones) there will be a risk of cross hearing (e.g., the good ear is responding to the tone presented to the worse ear). In this case you may consider retesting the worse ear while masking the better ear. Masking can be activated using the Ch2 input and output dropdown lists in the upper part of the screen.
14) If you have other audiograms on the patient saved in Noah or OtoAccess® you can compare the new audiogram to a previous one using the session list. This is done by using the checkboxes of the historic sessions that you like to overlay.
15) To save the audiogram press Save or Save and Exit .

D-0004576-Q – 2022/05 Affinity/Equinox2.0 – Additional Information Page 25
1.7.1 High frequency audiometry4 High f requency audiometry (above 8 kHz) is performed using the same procedure as normal air conduction audiometry. Note, however, that you are only allowed to test within the range of the headset calibration That is, if the headset is only calibrated for a range of 125 Hz – 8 kHz you will not be allowed to present tones at higher f requencies. High f requency audiometry is helpful when testing hearing impairments caused by ototoxicity, noise exposure and acoustic traumas as these mainly af fect the high f requencies. This f requency area is more susceptible to the ef fects of external factors such as medications and loud noises than the low and middle f requencies. Required items: • The Af f inity2.0 hardware • Licensed AC440 Audiometry module within your Af f inity2.0 hardware with High Frequency functionality • A calibrated high f requency audiometric headset (Koss R/80, DD450, HDA300 or HDA200) • A response button Test procedure: 1) Open the AC440 module through your patient management system, Noah or OtoAccess®. 2) If needed select a test protocol in the Protocols and sessions
3) To perform a high f requency audiometry, press the HF button or HFz button in the f ront screen.
4) Conduct high f requency audiometry using the normal air conduction audiometry method (see section 1.6 above for details), ensuring that you are using proper headsets. The following headsets are available:
Koss R/80 can be calibrated for 8 kHz to 20 kHz4 HDA 200 can be calibrated for 125 Hz to 20 kHz DD450 can be calibrated for 125 Hz to 20 kHz HDA300 can be calibrated for 125 Hz to 20 kHz
4 Koss R/80 is only available for the Affinity2.0/Equinox2.0

D-0004576-Q – 2022/05 Affinity/Equinox2.0 – Additional Information Page 26
1.7.2 Multi frequency audiometry5 Multi f requency audiometry lets the clinician test more f requencies than the traditional audiometric test f requencies. This may be useful when dealing with steeply sloping hearing impairments as it becomes possible to obtain a more precise measure of the slope of the hearing loss. It is also helpful in the evaluation of tinnitus as is provides the option to match the tinnitus. Required items: • The Af f inity2.0 hardware • Licensed AC440 Audiometry module within your Af f inity2.0 hardware with Multi Frequency functionality • Headphones or Insert phones • A patient response button Note: If doing Multi Frequency testing in the high f requencies (8-20 kHz) a high f requency headset must be used. Test procedure: 1) Open the Af f inity Suite through your patient management system, Noah or OtoAccess®. 2) Select the AUD Tab and If needed select a protocol from the List of Protocols.
3) To perform a multi f requency audiometry, click the MF button in the f ront screen. You may want to check that the multi f requency settings are in accordance with your preference in the AC440 setup (see section 1.7.2.2).
4) Conduct high f requency audiometry using the normal air conduction audiometry method (see section 1.6 above for details). The cursor will jump in small f requency steps during the test providing you with multiple thresholds and a detailed curve.
Note: Evaluation of tinnitus can be used for both the purpose of identifying the nature of the sound the patient is experiencing and the purpose of masking the sound. Instruct the patient that you will now try to reproduce the exact sound that they are experiencing as precisely as possible. Start by f inding the f requency and subsequently f inding the amplitude using 5 dB steps. This way the patient only needs to concentrate on one thing at the time. Af ter replicating the tinnitus, present a noise (NB) to the ear where the sound is experienced. Increase the noise in 5 dB steps until the patient claims that the tinnitus is masked (Nielsen & Carver 1997).
1.7.3 Bone conduction audiometry In bone conduction audiometry, the test signal is presented by a bone vibrator placed on the mastoid. The bone vibrator uses the skull to transfer the vibrations to the cochlear and bypasses the outer and middle ears. Bone conduction thresholds thereby provide a measure of the cochlear and retro cochlear function regardless of the outer and middle ear function, therefore it allows you to distinguish between conductive, sensorineural, and mixed hearing thresholds detected through Air conduction Audiometry. The dif ference which is detected between the bone and air conduction is called the air-bone gap. It is recommended to start a hearing assessment f irst with air-conduction measurements, followed by bone conduction measurements. Required items: • The Af f inity2.0 hardware • Licensed AC440 Audiometry module within your Af f inity2.0 hardware • A calibrated bone conductor (B81) • A patient response button
5 Multi frequency audiometry is only available on the Affinity2.0 /Equinox2.0 . The test requires an additional feature for the AC440. If not purchased, the button is greyed out.

D-0004576-Q – 2022/05 Affinity/Equinox2.0 – Additional Information Page 27
Test procedure: 1) Open the AC440 module through Noah or OtoAccess®. 2) If needed select a test protocol in the List of Protocols. 3) Prior to bone conduction audiometry, perform the Air conduction audiometry, as described in section
0. 4) Place the bone conductor on the mastoid of the worst ear and choose Bone Right or Bone Left f rom
the channel 1 output dropdown list and select the desired test signal (typically Tone). In the channel 2 input and output dropdown lists you can decide whether masking is to be employed. If so, you will need to place the headset on the patient as well.
Conduct high f requency audiometry using the normal air conduction audiometry method (see section 0 above for details). Note: Without appropriate masking applied where necessary you cannot know which cochlea is responding, as there is always no interaural attenuation in bone conduction audiometry. We will always assume that it is the better ear that is responding. In the case of asymmetrical hearing losses, bone conduction masking should always be considered.
1.7.4 Masking In cases where a symmetrical hearing loss is detected, traditional audiometry without masking is usually suf f icient. However, be aware that in cases of asymmetrical hearing loss, one cannot be certain that the test ear is the one detecting the sound. For example, when measuring an audiogram on a patient with hearing within the normal range on one ear but a moderate to severe hearing loss on the other, there is a potential risk that the better ear is the one responding, even if it is not the ear being tested. That is because the sound vibration may travel through the head and be heard by the opposite ear when the vibrations of the signal are of suf ficient magnitude. Therefore, you are measuring the thresholds f rom the wrong ear. To prevent this phenomenon in causing an erroneous measurement, masking noise can be used to occupy the better ear (non-test ear) while testing the other one (Stach 1998, Katz 2002 and British Society of Audiology 2004). Masking can be applied to air conduction, bone conduction and speech audiometry. The need to mask the better hearing ear is linked to the interaural attenuation which equals the amount of attenuation the sound is exposed to on its way through the skull. Even though the interaural attenuation is very individual and varies with f requency it can, on average be estimated to a minimum of 40 dB for supra-aural headphones and 55 dB for inserts. Regarding bone conduction, the interaural attenuation is a minimum of 0 dB which means that crossing over of the stimulus may occur all the time. Required items: • The Af f inity hardware • Licensed AC440 Audiometry module within your Af f inity2.0 hardware • Calibrated Headphones or insert phones • A calibrated bone conductor (B81) • A patient response button Test procedure: 1) Open the AC440 module through Noah or OtoAccess®. 2) Select a test protocol in the list of Protocols and sessions if needed. 3) Perform the Air conduction audiometry as described in section 1.6. If the dif ference between lef t and
right air conduction thresholds at any f requency are 40 dB (headphones) or 55 dB (inserts) and higher then masking is required.
4) Perform Bone conduction audiometry as described in section 1.6.3 5) If the dif ference between the air conduction threshold of the worse ear and the bone conduction
threshold of the better ear exceeds 10 dB, masking is needed.

D-0004576-Q – 2022/05 Affinity/Equinox2.0 – Additional Information Page 28
There are many ways of applying clinical masking. Which method to use is your decision. Regardless of the masking method channel 2 is used to occupy the better ear. In the example above channel 2 should be set to Right (non-test ear) using the preferred masking stimulus preferred (usually Narrowband NB). Ensure that Rev is ticked making the masking noise continuous. Channel 1 should be set to Left (test ear) using the preferred stimulus (usually Tone). You can set the masking and tone level using the buttons on the screen, the PC keyboard, or the dedicated keyboard. While trying to establish the true threshold of the lef t ear the right ear is now distracted with noise. When storing a threshold while the masking is enabled, the used masking level is stored in the masking table under the ear that is being tested. The terms ‘Ef fective masking’ in this situation refers to the narrow band noise level that was loud enough to ef fectively mask a pure tone of the indicated level heard by the unmasked ear.
1.7.5 Speech audiometry Most people acquire hearing aids because they or their relatives report that they have trouble hearing speech. Speech audiometry has the advantage of utilising speech signals and is used to quantify the patient’s ability to understand everyday communication. It examines the patient’s processing ability in relation to their degree and type of hearing loss which can vary greatly between patients with the same hearing loss conf iguration. Speech audiometry can be performed using a number of tests. For example, SRT (Speech Reception Threshold) refers to the level at which the patient can repeat 50% of the presented words correctly. It serves as a conf irmation of the pure tone audiogram, gives an index of hearing sensitivity for speech, and helps determine the starting point for other supra-threshold measures such as WR (Word Recognition). WR is sometimes also referred to as SDS (Speech Discrimination Scores) and represents the number of words correctly repeated, then expressed as a percentage. Note that there is a predictable relationship between the patient’s pure tone threshold and speech reception threshold. Speech audiometry may therefore be useful as a cross-check of the pure tone audiogram. Required items: • The Af f inity2.0 hardware • Licensed AC440 Audiometry module within your Af f inity2.0 hardware • Headphones, insert phones, or f ree f ield speakers • A microphone, CD player or wave f iles

D-0004576-Q – 2022/05 Affinity/Equinox2.0 – Additional Information Page 29
Test procedure: Before performing the speech audiometry, you may wish to complete tone audiometry. This provides valuable predictive information useful in the speech testing. Furthermore, the PTA level (Pure Tone Average) gives you a basis for calculating the starting point for speech testing. 1) Open the AC440 module in the Af f inity Suite through your patient management sof tware, Noah or
OtoAccess®
2) Go to speech testing by pressing the Speech Screen button 3) If needed select a test protocol in the List of Protocols. 4) Select the input and output stimuli and intensity levels for channel 1.
If masking is needed, conf igure channel 2 also. 5) Explain to the patient that he/she will now hear some words/numbers/sentences though the ear
phones/f ree f ield speakers. Instruct him/her to repeat what is said even though it may be very faint. Patients may also be encouraged to guess if they are unsure about the word/number/sentence. If performing the speech test in noise do not forget to instruct the patient not to focus on the noise but on the speech.
6) Start presenting the words, numbers, or sentences. Depending on the setup for speech testing (see section 1.7.2.3) the test can be scored using the following buttons:
Correct, Incorrect, and Store
Number of correct Phonemes and Store The speech score will be displayed in the black bar:

D-0004576-Q – 2022/05 Affinity/Equinox2.0 – Additional Information Page 30
In case of mistakes during the test you can right click on the threshold which will prompt a menu with edit options. Besides deleting single thresholds or whole curves it also provides the option to Add no response, Add masked threshold and Add masked-no response threshold. Note: If performing speech audiometry in f ree f ield and calibration is done at one location, please be aware that f ree f ield calibration values are likely to be incorrect at other locations because of acoustical circumstances. The dif ferences can easily dif fer up to 10 dB. Note: Due to vast amounts of speech material f rom dif ferent countries and regions there may be specif ic methodology and logic for you to carry out your speech test. Please refer to local guidance regarding how your speech material should be used and scored when using such materials.
1.7.5.1 Speech reception threshold (SRT) in table mode The SRT examines at which level 50% of the speech material (usually numbers or spondaic words) is repeated correctly. The SRT can be used as a cross check of the air conduction audiometry and should closely agree with the PTA (Pure Tone Average). The PTA can be calculated in dif ferent ways but is usually the average of thresholds obtained at 500, 1000, 2000 and 4000 Hz. It is generally accepted that if the PTA and the SRT is within ± 6 dB of each other the accordance is good, if it is ±7 to 12 dB it is adequate, and if it ±13 or more it is poor. 1) Perform air and bone conduction audiometry as described in section 0 and 1.6.3 to obtain the PTA.
2) Open the Speech Screen
3) Ensure that the SRT test is active. This is shown by the SRT label being orange
Note: The AC440 Setup allows for selecting whether the speech test is to be performed in Graph or Table Mode (see section 1.7.2.3). This screen shot shows graph mode.

D-0004576-Q – 2022/05 Affinity/Equinox2.0 – Additional Information Page 31
4) Choose the input for channel 1 (microphone, CD, or wave f ile). In case of wave f iles, check if the preferred material, and wordlist are selected.
Note: In case of microphone/AUX the speech material can be calibrated by speaking into the microphone/playing the calibration track. Adjust the corresponding arrow keys to 0 VU (see details in section 1.6.5).
5) Start with the better hearing ear according to the audiogram and set the intensity to 15 dB above Pure
Tone Average. 6) Begin presenting the speech material and reducing the intensity in 5 dB steps for every correctly
repeated word. Use the Store button to store the SRT. 7) Upon changing Transducer, Masking, and/or Aided and re-testing an additional SRT entry will appear
in the SRT table (see illustration above). This allows for multiple SRT measurements to be shown in the SRT table.
If the SRT is not in accordance with the air conduction thresholds, the air conduction audiogram should be checked, and the procedure repeated (Nielsen & Carver 1997; Katz 2002).

D-0004576-Q – 2022/05 Affinity/Equinox2.0 – Additional Information Page 32
1.7.5.2 Word recognition (WR) in table mode The Word Recognition score determines the patient’s discrimination ability expressed in a percentage. It provides information about what phonemes the patient has dif f iculty hearing at a particular intensity level. This is helpful for counselling and rehabilitation purposes. The diagnostic value has shown to be fairly low, but it is generally accepted that the word and sentence recognition are least af fected by conductive and most af fected by neural loss. There are numerous ways of performing the WR. The procedure described below is a suggestion.
1) Perform air and bone conduction audiometry as described in section 0 and 1.6.3 to obtain the PTA.
2) Open the Speech Screen 3) Ensure that WR test is active.
In table mode, this is shown by the corresponding WR label being orange 4) Choose the input for channel 1 (Microphone, CD, or wave f ile). In case of wave f iles, select the
preferred material and wordlist (see below). Note that calibration is the same for SRT (see section 1.6.5.1 above).
5) Start in the better hearing ear according to the audiogram and set the intensity to approximately 30 or 40 dB above PTA (minimum 55 dB). In cases where recruitment is present start lower at about 20 dB above PTA and ask the patient if the level is comfortable af ter 2-3 words.
6) Begin presenting the speech material. Use the scoring buttons to score and store the results. The current score (in percent) will appear in the black bar.
7) Upon changing Transducer, Masking, and/or Aided re-testing an additional WR entry will appear in the WR table. This allows for multiple WR measurements to be shown in the WR table
8) If you have other speech audiograms on the patient saved in Noah or OtoAccess® you can compare the new audiogram to a previous one using the session list. This is done by using the checkboxes of the historic sessions that you like to overlay.
To save the audiogram press Save or Save and Exit .

D-0004576-Q – 2022/05 Affinity/Equinox2.0 – Additional Information Page 33
1.7.5.3 Speech testing with a microphone 1) Affinity2.0./Equinox2.0 Connect the microphone to the Mic1 or Mic2 input on the on the hardware.
2) Open the AC440 sof tware, go to the Speech screen . 3) Choose Mic1 or Mic2 in the input channel 1 list.
4) Adjust the input levels for the Mic1 or Mic2 until you reach an average of approximately 0 dB VU on
the VU meter while speaking into the microphone at a normal conversation level. 5) When the VU meter is adjusted the microphone input is ready for use. Perform the speech audiometry
as described in section 1.6.5.5.
1.7.5.4 Speech testing with an external CD player 1) Connect the CD player to the CD1 or CD2 input under the hardware (the below illustration shows the
Af f inity2.0 hardware).
2) Open the AC440 sof tware, go to the Speech screen .
Microphone inputs
CD inputs

D-0004576-Q – 2022/05 Affinity/Equinox2.0 – Additional Information Page 34
3) Choose AUX1 or AUX2 in the channel 1 list. 4) Play the calibration tone for your material through the CD player. Then adjust the input levels for the
CD player until you reach an average of approximately 0 dB VU on the VU meter6. You may also use the CD player’s volume control to adjust the VU meter, should the control in the Suite not be suf f icient.
5) When the VU meter is adjusted the AUX input is ready for use. Perform the speech audiometry as described in section 1.6.5.5.
1.7.5.5 Speech testing with wave files7 The AC440 also allows for testing with wave f iles if installed on the PC. The default speech material can be selected in the AC440 setup (see section 1.7.2.3). 1) To use wave f iles choose them in the channel 1 list.
2) The speech material can be selected f rom the four dropdown lists.
3) Play, Stop, or Pause the speech test on the three buttons on the right side.
4) By clicking the button indicated in the image below, you can randomise the order in which your materials are presented. Note: this setting will be ref lected when the play button is pushed as the word order will then shuf f le.
6 This function ensures that the VU meter is not adjusted by accident. 7 Speech audiometry with wave files requires an additional software license.

D-0004576-Q – 2022/05 Affinity/Equinox2.0 – Additional Information Page 35
Should you wish to edit your speech score af ter it has been assigned you can right click on the word, and it will allow you to re-score it as shown below. This feature can be used during testing or af ter the test has completed.
5) Should you wish to choose where to begin your speech testing then you can click on the designated wavef ile ahead of starting the test. Clicking on it will highlight it with a bolder outline. The material will then play f rom her on clicking the ’play’ icon.
1.7.6 Masking level difference (MLD)8 Masking Level Dif ference refers to the improvement in detecting a tone or speech in noise when the phase of the tone or the noise is reversed by 180 degrees. It aims to assess central auditory function and is specif ically sensitive to brainstem lesions, but peripheral changes (like a hearing loss) may also af fect the MLD. The MLD is a low f requency phenomenon, related to the auditory system’s ability to perceive dif ferences in timing of a sound reaching the two ears. This helps to localize low f requency sounds that reach the ears at dif ferent times due to the longer wave length. The MLD is usually referred to as the dif ference of improvement, in dB, between a “homophasic” (in-phase) condition and an “antiphasic” (out of phase) condition. Homophilic means that both the signal and the noise are in phase with each other when reaching the two ears. Antiphase means that either the signal or the noise (not both) is out of phase with each other when reaching the two ears. The three test conditions for the MLD in the AC40 are:
• SoNo: Signal and Noise are IN PHASE when reaching the two ears. (Homophasic condition) • SπNo: Signal is OUT OF PHASE, noise is IN PHASE when reaching the two ears (Antiphasic
condition) • SoNπ: Signal is IN PHASE, noise is OUT OF PHASE when reaching the two ears (Antiphasic
condition)
8 MLD requires an additional software license and is only available as an additional feature for the Affinity2.0/Equinox2.0

D-0004576-Q – 2022/05 Affinity/Equinox2.0 – Additional Information Page 36
The MLD is measured by presenting a low f requency pulsed tone with simultaneous presentation of the corresponding narrow band noise, starting at an intensity of 60, or 65 dB to both ears. The f irst condition should be to f ind the threshold for the homophasic condition (referred to as SoNo). The next step is to measure the antiphasic condition, either presenting the tone out of phase or the noise out of phase and the masked threshold is determined again. If the brainstem is functioning normally, there will be an improvement in the masked threshold f rom the homophasic condition to the antiphasic condition. The condition that will yield the greatest MLD is the SπNo condition, that is, the condition where the signal is out of phase when reaching the two ears, but the noise is still in phase. . Example: If the masked threshold for the SoNo condition is 60 dB, then we reverse the phase of the signal by 180 degrees. The threshold for this phase reversed condition, called SπNo, improves to 44 dB. The masking level dif ference f rom SoNo to SπNo is therefore 16 dB. Most research that has been done on the MLD indicates that in general, if the MLD is less than 7 dB, this will indicate a problem with the brainstem and binaural interaction. There will also be a decrease in the hearing MLD if there is a peripheral hearing loss or if the hearing aid asymmetrical. Normal results for MLD are usually around 12 dB (Brown & Musiek, Hearing Journal, Jan 2013). Required items: • The Af f inity2.0 hardware • Licensed AC440 Audiometry module within your Af f inity2.0 hardware with MLD functionality • Calibrated Headphones or insert phones • A patient response button
Test procedure: 1) Open the AC440 and enter the MLD screen by selecting Menu | Tests | MLD. 2) Select headset or inserts in the channel 1 output list. 3) Before mounting the headphones on the patient, explain to them that they will now hear both tones
(identical to the ones f rom the air conduction audiometry) and noise through the headphones. Emphasize that they should only focus on the tones and press the response button whenever it is audible.
4) Select the f requency you would like to test; 250 Hz or 500 Hz is a good starting point 5) Set the intensity level to be the same level in both ears (50, 60 or 65 dB). 6) Press START and the signal will be presented to both ears in phase (SoNo condition)
.

D-0004576-Q – 2022/05 Affinity/Equinox2.0 – Additional Information Page 37
7) Do a masked threshold search. Typically, the masked threshold for the SoNo condition will be equal to the noise level. When you have established a threshold, click in the Stimuli area for Store or press S on the PC keyboard. Once the SoNo condition has been stored, the cursor will automatically jump to the SπNo condition., in which the signal is out of phase and the noise is still in phase. Note that f requency adjustments also can be performed manually (see illustration)
8) Leaving the intensity of the noise at the same level, perform a threshold again, press Store, and the cursor will switch to SoNπ. Where the signal is in phase and the noise in reversed phase.
9) Establish the threshold once more. 10) Press STOP to end the test. 11) The MLD will be the dif ference between the threshold of the homophobic condition (SoNo) and the
threshold of one of the antiphasic conditions (SoNπ or SπNo)
12) Save the MLD test by clicking Save Note: In the setup for MLD (see section 1.7.2.4) you can choose whether you would like MLD to be calculated using SoNo minus SoNπ or SoNo minus SπNo.
1.7.7 Master hearing aid (MHA)9 MHA is a hearing aid f itting procedure consisting of three hearing aid simulated high pass f ilters of -6 dB, -12 dB, -18 dB per octave and a HFE f ilter (High Frequency Emphasis) equivalent to -24 dB per octave through the audiometric headphones. This gives a rough sense of the benef its of a hearing aid and what could eventually be gained by getting properly f itted hearing aids. The f ilters can be activated individually on both channels enabling the audiometer to serve as a 2-channel master hearing aid. Required items: • The Af f inity2.0 hardware • Licensed AC440 Audiometry module within your Af f inity2.0 hardware with MHA functionality • Headphones or insert phones • A microphone, CD player10 or wave f iles
Test procedure: When having performed the hearing assessment you may want to start discussing a possible hearing aid solution. However, there is no guarantee that the patient is positive towards such a solution. He/she might not even have acknowledged their hearing impairment and may therefore not be motivated or prepared for this prospect. In this situation MHA may be useful.
9 MHA requires an additional software license 10 MHA using a CD player is only available on the Affinity2.0/Equinox2.0

D-0004576-Q – 2022/05 Affinity/Equinox2.0 – Additional Information Page 38
1) Open the AC440 and enter the MHA screen by selecting Menu | Tests | MHA. 2) Select headphones or inserts in the channel 1 output list. 3) Select CD, Microphone or Wavefile in the channel 1 input list.
If using CD press play on the CD player, and if using wave f iles, you can Browse and play them in the bottom of the screen.
4) In this example the simulation starts in the -12 dB f ilter. It may, however, be advisable to start in Lin (no f iltering) as listing to the input signal with one’s own hearing for a moment is likely to have a strong ef fect when having to compare with the f iltered input. The procedure is, however, up to you and the defaults can be setup in the AC440 setup (see section 1.7.2.5).
5) Before mounting the headsets on the patient describe to them that this tool can give an impression of what a hearing aid might sound like. Perhaps let him or her listen to the signal with their natural hearing as it is (without manipulating the sound). Explain that they are now listening to the CD, wave f ile or live voice with their own natural hearing. In a minute, though, the sound will be changed trying to give them an impression of what it could sound like if they acquired hearing aids. Note that it may, be necessary to point out that a hearing aid will sound even better than what they are about to hear which is an approximation. A hearing aid will be f itted more accurately based on the individual hearing loss. The MHA is meant to give them an idea as to how the amplif ication can provide them much more audibility and thereby improve their quality of life signif icantly.
6) The selected MHA f ilter can be visualized in the graph. Toggle between the f ilters and see the ef fect. 7) During the simulation it is possible to adjust the volume of the signal using the dB HL
Decrease/Increase channel 1/channel 2 buttons.
Select Filters

D-0004576-Q – 2022/05 Affinity/Equinox2.0 – Additional Information Page 39
1.7.8 Hearing loss simulation (HLS)11 The HLS of fers a simulation of the hearing loss through the audiometric headphones or the high f requency headset and is primarily aimed at the family members of the hearing impaired. It is a valuable tool as a hearing loss in many families may result in f rustrations and misunderstandings. Knowing what the hearing loss sounds like gives an impression of what the hearing impaired goes through every day. Required items: • The Af f inity2.0 Hardware • Licensed AC440 Audiometry module within your Af f inity2.0 hardware with HLS functionality • Headphones or a f ree f ield speaker • A microphone, CD player12, or wave f iles
Test procedure: 1) Open the AC440. To perform the HLS counselling, an audiogram is needed. You should therefore
start by performing Air Conduction Audiometry (as described in section 1.6) or retrieving an old audiogram in the List of historical sessions.
2) When an audiogram is present, enter the HLS screen by selecting Menu | Tests | HLS. 3) Select headphones or inserts in the channel 1 output dropdown list. 4) Select CD, Microphone or Wave files in the channel 1 input dropdown list.
If using CD press play on the CD player, and if using wave f iles, you can Browse and play them in the bottom of the screen.
5) Before mounting the headset on the f riend or relative explain the audiogram. Use examples of what the hearing impaired may not be able to hear anymore such as some speech sounds and other sounds that are likely to occur in everyday surroundings.
6) It may be advisable to start the simulation session by letting the relative listen to the input signal with his or her natural hearing for a moment. This is likely to have a strong ef fect when having to compare with the simulation. The procedure is, however, up to you and the defaults can be setup in the AC440 setup (see section 1.7.2.7).
11 HLS requires an additional software license. 12 HLS using a CD player is only available on the Affinity2.0/Equinox2.0

D-0004576-Q – 2022/05 Affinity/Equinox2.0 – Additional Information Page 40
Start simulating by clicking the Right and/or Left buttons corresponding to the ear to be simulated. The text above each button will then change f rom Normal to ON.
During the simulation it is possible to adjust the volume of the signal using the dB HL Decrease/Increase channel 1/channel 2 buttons.
Patient monitor text with HLS Now clinicians can input text in the patient monitor, which can then be read by out loud while simulating the hearing loss. This is to help with counselling and adding text which can be read out loud can make it easier than asking someone to spontaneously say something. Please see section 1.7.2.7 for more information on how to setup the Patient Monitor.
1.7.9 Short increment sensitivity index13 SISI is designed to test the ability to recognise 1 dB increase in intensity during a series of bursts of pure tones presented 20 dB above the pure tone threshold for the test f requency. It can be used to dif ferentiate between cochlear and retro cochlear disorders as a patient with a cochlear disorder will be able to perceive the increments of 1 dB, as where a patient with a retro cochlear disorder will not. Required items: • The Af f inity hardware • Licensed AC440 Audiometry module within your Af f inity2.0 hardware with SISI functionality • Calibrated Headphones or insert phones • A patient response button Test procedure: 1) Open the AC440 and enter the SISI screen by selecting Menu | Tests | SISI. 2) Select Tone or Warble Tone in the channel 1 input list. If needed masking can be selected in the
channel 2 input dropdown list. 3) Select headphones or inserts in the channel 1/channel 2 output lists 4) Set the input level to 20 dB above threshold using the dB HL Decrease/Increase channel 1/channel
2 buttons or arrow keys on the PC keyboard.
13 SISI requires an additional software license.

D-0004576-Q – 2022/05 Affinity/Equinox2.0 – Additional Information Page 41
5) Explain to the patient that they will now hear a series of tones. If suddenly one tone seems louder that
the other ones the response button should immediately be pushed. 6) Select the preferred type of SISI test. Setting the system to 1 dB increments is the classical SISI. If the
patient can hear these increments and scores high, cochlea damage is likely. You may also choose 0 dB, 2 dB, or 5 dB increments. If the patient does not manage to get a high score on the SISI test this could indicative of retro-cochlear damage.
7) Start the test by pressing START. During the testing the f requency and intensity can be adjusted manually (see illustration). The system will automatically count the number of reactions f rom the patient. Note that the system needs 20 presentations to calculate a SISI score.
8) Press STOP to end the test.
9) Save the SISI test by clicking Save
1.7.10 Weber Originally the Weber test distinguished between conductive and sensorineural hearing loss through use of a tuning fork. The fork was sof tly struck and placed in the middle of the patient’s forehead. If the patient heard the tone better in the poorer ear the hearing loss was conductive, and if the tone was heard better in the better ear the hearing loss was sensorineural at the given f requency. Today the Weber is most of ten performed using a bone conductor because the tuning fork method only allows testing at one f requency unless you have multiple tuning forks. The bone conduction oscillator is placed in the midline and as a stimulus is mostly a signal of 250, 500, and 1000 Hz chosen which should be clearly audible to the patient. Using an audiometer together with a bone conductor to do the Weber is more reliable and f lexible than the tuning fork method and has therefore become widespread. Required items: • The Af f inity2.0 hardware • The AC440 sof tware • A bone conductor (B81)

D-0004576-Q – 2022/05 Affinity/Equinox2.0 – Additional Information Page 42
Test procedure: 1) Open the AC440 and enter the Weber screen by selecting Menu | Tests | Weber 2) Input and Output selections for channel 1/channel 2 are f ixed Tone and Bone. 3) Place the bone conductor on the patient’s forehead and instruct them to tell you if the tones presented
are heard better to the Right, Left, Centre or if it is Not heard at all. 4) Present a tone at a level of 10 dB above the worst BC threshold using the dB HL Decrease/Increase
buttons or the PC keyboard. You can select whether you want a Tone or Warble stimulus. 5) Await response f rom the patient and click on the corresponding button above the graph.
If the patient hears the tone better in the poorer ear the hearing loss is conductive, and the tone is heard better in the better ear the hearing loss is sensorineural at the given f requency.
6) During the testing the f requency and intensity can be adjusted manually (see illustration).
7) Save the Weber test by clicking Save
1.7.11 Knaster14 Knaster is a speech in noise training tool. Modif ied speech noise (Knaster Noise) is presented to one or both ears (binaurally) as this is believed to initiate a state of "alertness" in the sensorineural cells and thereby also af fect the auditory pathways and centres. Af ter applying the noise for a certain amount of time (in seconds) discrimination problems should disappear temporarily. The training should be performed af ter doing the speech audiometry since you need to present the Knaster speech at the point of maximum speech understanding which will be detected in the speech audiometry. The level the Knaster noise should be presented at is 5 or 10 dB lower than the presented speech material. The patient is asked to repeat the speech presented. If mistakes between sounds are made the noise is increased for a few seconds in attempt to "awaken" the sensorineural cells. The noise is then turned down to its original level and the patient is prompted to try and correct the mistake and the repeat the word again. If the noise is muted at the same time as the mistaken word is repeated for the second time it is believed to be easier for the patient to perceive it. When succeeding in repeating the word correctly the patient should be made aware of the dif ference between the sound they emitted and the correct sound. If patients undergo half hour Knaster sessions on consecutive or alternating days their discrimination abilities are believed to improve. Required items: • The Af f inity 2 hardware • Licensed AC440 Audiometry module within your Af f inity2.0 hardware with Knaster functionality • Headphones
14 Knaster is only available on the Affinity2.0/Equinox2.0

D-0004576-Q – 2022/05 Affinity/Equinox2.0 – Additional Information Page 43
Test procedure: To perform the Knaster test, you need to know the level of maximum speech understanding. The test should therefore be performed af ter the speech audiometry which will provide you with this information. Do the Speech Audiometry as described in section 1.6.5.5. 1) Open the AC440 and enter the Knaster screen by selecting Menu | Tests | Knaster
2) Select microphone, CD, or wave f ile in the channel 1 input list. The Knaster test can be performed
on lef t, right or both ears. This is selected in the channel 1 output list. 3) Set the level of the input to the level of maximum speech understanding using the dB HL
Decrease/Increase channel 1 buttons. Channel 2 presents the Knaster noise which should be set to a level of 5 -10 dB below the level of the speech input using the dB HL Decrease/Increase channel 2 buttons.
4) Set the desired f ilter for the low and high f requencies respectively below the graph. The f ilter applied can be visualized in the graph.
5) Explain to the patient, that they will now hear both speech and noise through the headphones. They should, however, concentrate on the speech and try to repeat what they hear. If they make a mistake the noise will be a little louder for just a second and they will have another chance to repeat the word correctly.
6) Start presenting the speech material. If mistakes between sounds are made the noise is increased for a few seconds in attempt to "awaken" the sensorineural cells. The noise is then turned down to its original level and the patient is prompted to try and correct the mistake and the repeat the word again. If the noise is muted at the same time as the mistaken word is repeated for the second time it will be easier for the patient to perceive it. This is done by touching the channel 2 Stimuli area with the mouse. When succeeding to repeat the word correctly the patient should be made aware of the dif ference between the sound they emitted and the correct sound.

D-0004576-Q – 2022/05 Affinity/Equinox2.0 – Additional Information Page 44
Note: If you wish to switch between right and lef t during the Knaster training without the intensity returning to the original start level, please be sure to enter the Common settings in the AC440 setup (Menu/setup/AC440 setup, see section 1.7.2.1) and select “OFF” in the Default intensity when changing output dropdown list like illustrated below:
1.7.12 ABLB/Fowler ABLB (Alternate Binaural Loudness Balancing) is a test to detect perceived loudness dif ferences between the ears designed for people with unilateral hearing loss. It serves as a possible test for recruitment. The test is performed at f requencies where recruitment is presumed. The same tone is presented alternatively to both ears. The intensity is f ixed in the impaired ear (20 dB above pure tone threshold). The task of the patient is to adjust the level of the better ear until the signal in the two ears is of equal intensity. Note however that the test may also be performed by f ixing the intensity in the normal hearing ear and having the patient set the tone for the impaired ear. Required items: • The Af f inity2.0 hardware • Licensed AC440 Audiometry module within your Af f inity2.0 hardware • Calibrated Headphones or insert phones • A patient response button
Test procedure: 1) Open the AC440 module through your patient management system, Noah or OtoAccess®. 2) Choose settings for ABLB/Fowler using the input and output for channel 1 and channel 2 as
illustrated below:
Note: Man (Manual) and Multi Pulse should be selected for channel 1 and Alt (Alternate) for channel 2.

D-0004576-Q – 2022/05 Affinity/Equinox2.0 – Additional Information Page 45
3) Clarify the test procedure to the patient. Explain that he/she will now hear tones in both ears. The assignment is to determine when the two tones sound equal in intensity/loudness
4) The ABLB is performed at f requencies where recruitment is assumed. Set the intensity level on the impaired ear to 20 dB above the pure tone threshold using channel 2.
5) Adjust the intensity level in the better ear until the perceived loudness is identical to the impaired ear using channel 1.
6) Use the arrow buttons on the PC keyboard or the dedicated audiometry keyboard to set the f requency and intensity. If preferred choose Mouse operated audiometry and perform the test using only the mouse. Lef t click to stimulate and right click to store the threshold.
7) The ABLB/Fowler test cannot be saved. Results must therefore be noted manually. The reporting/ comment function in the AC440 sof tware may also be of help.
1.7.13 Stenger test The Stenger test is applied when a patient is suspected of feigning/faking a hearing loss and is based on the auditory phenomenon, “The Stenger Principle” which states that only the louder of two similar tones presented to both ears at the same time will be perceived. As a rule, it is having been recommended to perform the Stenger test in cases of unilateral hearing losses or signif icant asymmetries. Required items: • The Af f inity2.0 hardware • Licensed AC440 Audiometry module within your Af f inity2.0 hardware • Calibrated Headphones or insert phones • A patient response button Test procedure for tone Stenger: 1) Open the AC440 module. 2) Choose settings for Stenger using the input and output for channel 1 and channel 2 as illustrated
below:
Note: Man (Manual) and if preferred Multi Pulse should be selected for channel 1 and Sim (Simultaneous) for channel 2.
3) Typically, the instruction to the patient is not dif ferent than with normal audiometry. The patient does
not need to be informed that stimuli are presented at both ears simultaneously. 4) Use channel 2 for presenting tones to the better ear and set the intensity level to 20 dB above the
threshold. 5) Use channel 1 for the poorer ear and set the intensity level 20 dB below the level of the good ear.

D-0004576-Q – 2022/05 Affinity/Equinox2.0 – Additional Information Page 46
6) Present the tones to both ears simultaneously. Keep the intensity level of the better ear f ixed and increase the intensity for the worse ear in 5 dB steps. If the hearing loss in the worse ear is genuine the patient will keep responding to the signal presented to the better ear (Negative Stenger). If the patient is feigning the hearing impairment he will stop responding when the level of the worse ear exceeds the signal presented to the good ear (Positive Stenger).
7) Use the arrow buttons on the PC keyboard or the dedicated audiometry keyboard to set the f requency and intensity. If preferred choose Mouse operated audiometry and perform the test using only the mouse. Lef t click to stimulate and right click to store the threshold.
Test procedure for speech Stenger: 1) Open the AC440 module.
2) To perform speech tests, go to the Speech screen . 3) Choose settings for Stenger using the input and output for channel 1 and channel 2 as illustrated
below: Ch1 output: Right Ch1 input: Mic, AUX, or Wave
f ile Ch2 output: Lef t Ch2 input: Mic, AUX, or Wave
f ile
Note: Rev (Reverse) and if preferred Multi Pulse should be selected for channel 1 and Rev (Reverse) or Sim (Simultaneous) for channel 2.
4) Clarify the test procedure to the patient. Explain that he/she will now hear speech and the assignment is to repeat the presented words or numbers.
5) Use channel 2 for presenting speech to the better ear and set the intensity level to 20 dB above the threshold.
6) Use channel 1 for the poorer ear and set the intensity level 20 dB below the level of the good ear. 7) Present the speech material to both ears simultaneously. Keep the intensity level of the better ear
f ixed and increase the intensity for the worse ear in 5 dB steps. If the hearing loss in the worse ear is genuine the patient will keep repeating correctly to the speech signal presented to the better ear (Negative Stenger). If the patient is feigning the hearing impairment he will stop repeating correctly when the level of the worse ear exceeds the signal presented to the good ear (Positive Stenger).
8) Use the arrow buttons on the PC keyboard or the dedicated keyboard to set the f requency and intensity. You also choose Mouse operated audiometry and perform the test using only the mouse. Lef t click to stimulate and right click to store the threshold.
D-0004576-Q – 2022/05 Affinity/Equinox2.0 – Additional Information Page 47
1.7.14 TEN test15 Until recently, the TEN(HL) test for diagnosing dead regions in the cochlea could only be conducted by use of a compact disc player connected to an audiometer. Now, the test has been implemented within the Af f inity2.0/Equinox2.0 Suites. If dead regions are present, it may have important implications for f itting hearing aids and for predicting the likely benef it of hearing aids. When a patient has a dead region, there may be little or no benef it f rom hearing aid amplif ication for f requencies inside the dead region (Moore 2009). For more information regarding the TEN test please refer to Appendix 1. Required items: • The Af f inity2.0 hardware • Licensed AC440 Audiometry module within your Af f inity2.0 hardware with TEN functionality • Calibrated Headphones or insert phones • A patient response button Test procedure The TEN Test is performed according to the methods described by Brian Moore. Please refer to Appendix 1.
1.7.15 QuickSIN16 Dif f iculty with hearing in background noise is a common complaint among hearing aid users. Therefore, the measurement of SNR loss (signal-to-noise ratio loss) is important because a person’s ability to understand speech in noise cannot be reliably predicted f rom the pure tone audiogram. The QuickSIN test was developed to provide a quick estimate of SNR loss. A list of six sentences with f ive key words per sentence is presented in four-talker babble noise. The sentences are presented at pre-recorded signal-to-noise ratios which decrease in 5-dB steps f rom 25 (very easy) to 0 (extremely dif f icult). The SNRs used are: 25, 20, 15, 10, 5 and 0, encompassing normal to severely impaired performance in noise. For more information, please refer to Etymotic Research’s QuickSINTM Speech-in-Noise Test manual, version 1.3. Required items: • The Af f inity2.0 hardware • Licensed AC440 Audiometry module within your Af f inity2.0 hardware • Calibrated Headphones, insert phones or Free-Field Speakers
15 TEN test requires an additional license. 16 QuickSIN requires an additional license.

D-0004576-Q – 2022/05 Affinity/Equinox2.0 – Additional Information Page 48
Test procedure
1) Open the AC440 and enter the QuickSIN screen by selecting Menu | Tests | QuickSIN 2) Select the output level. For most of the tracks the channels are synchronised to ensure that the
correct SNR level is achieved. Note: the ‘Speech and Babble’ Lists are not synchronised and will require the user to manually alter these to ensure the correct SNR setting for the test.
3) Select a list in the corresponding dropdown. e.g., “QuickSIN (List 2)”. 4) Instruct the patient to repeat the sentences and try to ignore the noise that they will also hear
through the headphones. 5) Press START to begin the test 6) The number of words in bold the patient repeats correctly should be scored by clicking on the score
buttons. 7) When 6 sentences are scored a total score will be calculated.
Note that if you press Stop before the 6 sentences of the list have been played and scored, no total score will be calculated.
8) The total score can be compared to the “SNR loss def initions”.
9) Save the QuickSIN test by clicking Save Comparing Aided and Unaided QuickSIN scores over time: Clinicians are now able to compare the Unaided and Aided SNR scores.
To view the scores in a graph view, click on the graph icon
To view the scores in a graph view, but using the patient monitor, click on Patient Monitor

D-0004576-Q – 2022/05 Affinity/Equinox2.0 – Additional Information Page 49
The QuickSIN is performed according to the methods described in the QuickSIN manual.
1.7.16 Tone decay17 This is a test to help identify the adaptation of the auditory system (Carhart, 1957). It involves measuring the perceptual reduction in a continuous tone over time. This can indicate towards a cochlear or neural cause of deafness. The test involves looking at the patient’s response to the onset of a supra-threshold sound and then their continuous response to this as it continues over time. For example, in Meniere’s disease this is detected correctly on onset but rapidly deteriorates due to dysfunctional hair cells (Carhart, 1957). A normal response should be maintained for a minute of stimulation, should a patient not be able to maintain this then the stimulus intensity is increased until a minute is achieved. This is only increased up to a maximum 30 dB supra-threshold. Previously this test could only be administered manually with the Af f inity2.0/Equinox2.0Suite and a stopwatch but now we have added this test to the sof tware for ease of use. Required items: • The Af f inity2.0 hardware • Licensed AC440 Audiometry module within your Af f inity2.0 hardware • Calibrated Headphones or insert phones
Test procedure 1. The patient’s Audiometry is obtained. 2. The patient is then instructed to continuously respond to the tone if they hear it and not respond as the
signal fades/is absent. 3. The test is administered with a pure tone 5 dB below the subject’s established threshold and then
ascended in 5 dB steps without interruption until the subject responds. As soon as the subject responds, the system will begin timing (this is shown in the image below). If the tone is heard for a full one minute, then the test is stopped.

D-0004576-Q – 2022/05 Affinity/Equinox2.0 – Additional Information Page 50
4. But if the subject indicates that they no longer hear the tone before the minute criteria is reached, then
the intensity of tone is increased by 5 dB without interrupting the tone, but the timing at the top of the screen is reset.

D-0004576-Q – 2022/05 Affinity/Equinox2.0 – Additional Information Page 51
5. The tone is continued to be raised in 5 dB steps until an intensity is reached that allows the subject to perceive the tone for full minute. The amount of decay occurring at each level suggests/indicates the amount of decay the subject is showing.
6. As a time saving measure, Carhart (1957) suggested that the test should be terminated when the subject fails to respond 30 dB above threshold.
Once this measurement has been f inished the data can be documented as a comment to the session by the ‘Transfer result to comments’ on the lef t of the screen. Alternatively, it can be saved via the disk or door icon in the top lef t for review later.

D-0004576-Q – 2022/05 Affinity/Equinox2.0 – Additional Information Page 52
1.7.17 ANL test18
The Acceptable Noise Level (ANL) Test is a method of determining how much noise the patient can tolerate whilst listening to a target signal/speaker (Nabalek et al., 1991). It is used as a predictor for how well a patient will cope with amplif ication when receiving a hearing aid (Nabalek et al., 2006). The ANL test is designed to be performed via loudspeaker as it is a f ree f ield test. However, it can be conf igured to perform monaurally via selection of headphones and routing the signal to the relevant ear-side. The Equinox and Af f inity systems can perform the test binaurally via the R+L feature. The ANL Test can use any of the materials you have already ripped into your Interacoustics Suite sof tware. When should I perform the ANL test? The ANL test is typically performed before the patient is given any form of amplif ication as a rehabilitative action for their hearing loss. Test procedure
1. Launch the Af f inity2/Callisto™ Suite f rom Noah or OtoAccess®.
2. Click on the AUD tab on the upper right-hand side of the screen. Ensure that your Audiometry has been performed ahead of advancing into the SIN test as this determines the start level for the test.
3. Click on Menu, Tests and then select ANL
4. Once in the ANL test screen, you will see that there are 4 dif ferent conditions which you can choose to measure. MCL High – This is the loudest comfortable level the patient can listen to without any competing noise MCL Low – This is the lowest comfortable level the patient can listen to without any competing noise MCL Real – This is the patient most comfortable level without any competing noise BNL – This is the actual ANL test where the MCL Real is presented, and the competing noise is manipulated to f ind an ANL value

D-0004576-Q – 2022/05 Affinity/Equinox2.0 – Additional Information Page 53
It is not essential to perform MCL High and MCL Low for the ANL test, but these are also good indicators of the patients’ comfortable hearing range. Instructions for the patient will always be displayed at the bottom of the screen. 18 The ANL Test requires an additional license.
5. MCL High Click on the MCL High Icon and click play. This will loop your speech material.
Increase and decrease the stimulus intensity to match the patients loudest MCL. There will be no other change in the display to represent this, only the level in the MCL High icon box.

D-0004576-Q – 2022/05 Affinity/Equinox2.0 – Additional Information Page 54
6. MCL Low Click on the MCL Low Icon and click play. This will loop your speech material.
Increase and decrease the stimulus intensity to match the patients lowest MCL. The display will change within the icon but also a predicted MCL Real will be generated as a midpoint between the MCL High and MCL Low.
7. MCL Real Click on the MCL Real Icon and click play. This will loop your speech material. If you have performed the MCL High and MCL low, you should already have a predicted MCL value here. If not, then increase/decrease the intensity to f ind a suitable level for the patients MCL.
Again, the display will not change, other than inside the icon for your test condition.

D-0004576-Q – 2022/05 Affinity/Equinox2.0 – Additional Information Page 55
8. BNL Click on the BNL Icon and click Play. This will loop the same speech material but also introduce the background masking noise.
Increase/decrease Channel 2 to f ind a level of competing noise which the patient would be comfortable to listen to alongside their target material. Whilst doing this you will notice the display will change to ref lect the patients ANL value and the prediction percentage of how well they will perform with amplif ication. NOTE: You can customise the instructions displayed in the test screen by entering the ANL setup.

D-0004576-Q – 2022/05 Affinity/Equinox2.0 – Additional Information Page 56
What does my ANL value mean? On performing the ANL test you will obtain an ANL value (in dB) and a percentage. The percentage gives a likelihood of success with amplif ication (Nabalek et al., 2006) and the ANL value is the outcome of the following calculation:
ANL = MCL -BNL For response categories the following outcome criteria was determined as an ef fect of the Nabalek et al. (2006) investigation into ANL outcomes in relation to amplif ication:
ANL Score 7 dB or less: These individuals have a great prognosis for regular use and acceptance of hearing aids; may not need as much follow-up counseling and guidance as the average patient.
ANL Score 8-12 dB: These are your more common patients and have a good (8) or bad (12) prognosis for regular use and acceptance of hearing aids. These patients may need more follow-up counseling and are excellent candidates for noise reduction technologies.
ANL Score 13 dB or more: These patients are “at risk” for reduced utilization of hearing aids and may need additional post-f itting counseling, guidance, and require noise reduction technologies.

D-0004576-Q – 2022/05 Affinity/Equinox2.0 – Additional Information Page 57
1.7.18 SIQ test The Speech in Quiet (SIQ) test is a method of testing a patient’s functional hearing in the absence of any competing sound. The objective of this is to identify their functional hearing ability (Schoepf lin, 2012). The outcome of this investigation will give a Speech Recognition Threshold (SRT). This type of testing is dif ferent f rom Tone Audiometry as it involves higher areas of the Auditory pathway as the information needs to be heard, processed, and repeated to give a correct response (National Research Council (US), 2004). The SIQ test is designed to be performed via loudspeaker as it is a f ree f ield test. However, it can be conf igured to perform monaurally via selection of headphones and routing the signal to the relevant ear-side. The SIQ test is very similar to Speech Audiometry and can use any of the materials you have already ripped into your Interacoustics Suite sof tware. However, the Stimulus intensity is maintained automatically by the sof tware following a correct or incorrect response to the stimulus, this helps to speed up the test time. When should I perform the SIQ test? It is normal to perform this following Tone Audiometry as it gives a good indicator of the patient s performance for speech, it can also be a good indicator of the accuracy of your audiogram (Mehta & Singh, 2000). It can also be used before and af ter the provision of hearing aids to give an identif ication of the benef it achieved through amplif ication. Test procedure
1. Launch the Af f inity2Suite f rom Noah or OtoAccess®. 2. Click on the AUD tab on the upper right-hand side of the screen. Ensure that your Audiometry has
been performed ahead of advancing into the SIN test as this determines the start level for the test. 3. Click on Menu, Tests and then select SIQ
4. Once in the SIQ test screen, the stimuli levels should be set for you. These are based on the patient audiogram and the PTA score.
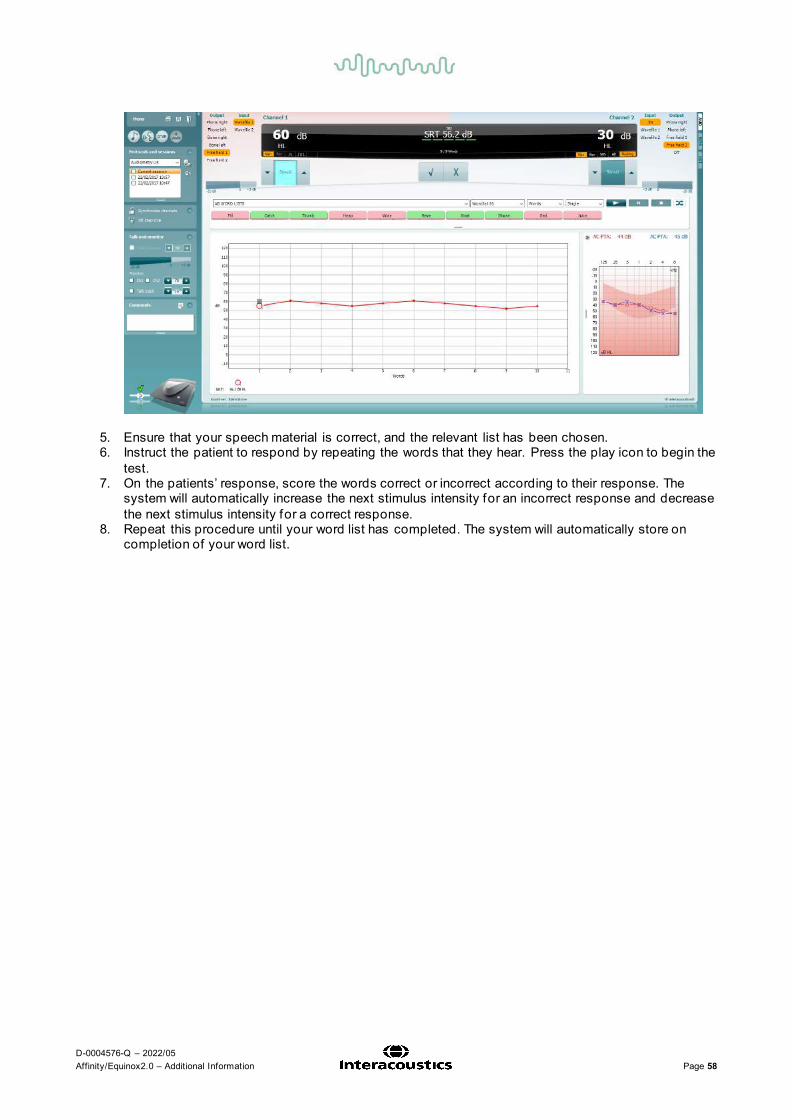
D-0004576-Q – 2022/05 Affinity/Equinox2.0 – Additional Information Page 58
5. Ensure that your speech material is correct, and the relevant list has been chosen. 6. Instruct the patient to respond by repeating the words that they hear. Press the play icon to begin the
test. 7. On the patients’ response, score the words correct or incorrect according to their response. The
system will automatically increase the next stimulus intensity for an incorrect response and decrease the next stimulus intensity for a correct response.
8. Repeat this procedure until your word list has completed. The system will automatically store on completion of your word list.

D-0004576-Q – 2022/05 Affinity/Equinox2.0 – Additional Information Page 59
1.7.19 SIN test The Speech in Noise (SIN) test is a method of testing a patient’s functional hearing in the presence of competing sound (Taylor, 2003). The objective of this is to identify their functional hearing ability and higher processing which allows them to sort between useful (speech/signal) and irrelevant (noise/masking) information (Taylor, 2003). The outcome of this investigation will give a Speech Recognition Threshold (SRT) for a varying Signal to Noise Ratio (SNR). This type of testing is dif ferent f rom Tone Audiometry as it involves higher areas of the Auditory pathway as the information needs to be heard, sorted, and understood to determine if it is useful or not (Marrone et al., 2008). The SIN test is designed to be performed via loudspeaker as it is a f ree f ield test. However, it can be conf igured to perform monaurally via selection of headphones and routing the masking to the same output. The SIN test is very similar to Speech Audiometry and can use any of the materials you have already ripped into your Interacoustics Suite sof tware. However, the Signal-to-Noise Ratio is maintained automatically by the sof tware following a correct or incorrect response to the stimulus, this helps to speed up the test time. When should I perform the SIN test? It is normal to perform this following Tone Audiometry as it gives a good indicator of the patient s performance for speech in noise. It can also be used before and af ter the provision of hearing aids to give an identif ication of the benef it achieved through amplif ication (Marrone, Mason and Kidd, 2008). Test procedure
1. Launch the Af f inity2/Callisto™ Suite f rom Noah or OtoAccess®. 2. Click on the AUD tab on the upper right-hand side of the screen. Ensure that your Audiometry has
been performed ahead of advancing into the SIN test as this determines the start level for the test. 3. Click on Menu, Tests and then select SIN
4. Once in the SIN test screen, the stimuli levels should be set for you. These are based on the patient audiogram and the PTA score.

D-0004576-Q – 2022/05 Affinity/Equinox2.0 – Additional Information Page 60
5. Ensure that your speech material is correct, and the relevant list has been chosen. 6. Turn on the masking in Channel 2 by clicking f rom Man to Rev. The masking will need to be turned
on manually, this is because you may want to perform an initial familiarization test with the patient without the noise to begin.
7. Instruct the patient to respond by repeating the words that they hear. Press the play icon to begin the test.
8. On the patients’ response, score the words correct or incorrect according to their response. The system will automatically increase the next stimulus intensity for an incorrect response and decrease the next stimulus intensity for a correct response.
9. Repeat this procedure until your word list has completed. The system will automatically store on completion of your word list.

D-0004576-Q – 2022/05 Affinity/Equinox2.0 – Additional Information Page 61
1.7.20 VDB-express Dif f iculty with hearing in background noise is a common complaint among hearing aid users. Therefore, the measurement of SNR loss (signal-to-noise ratio loss) is important because a person’s ability to understand speech in noise cannot be reliably predicted f rom the pure tone audiogram. The VDB-Express test was developed to provide a quick estimate of SNR loss for French listeners. A list of nine sentences with three key words per sentence is presented in speech babble noise. The sentences are presented at pre-recorded signal-to-noise ratios (SNR) which decrease in 3-dB steps f rom -18 dB (very easy) to 3 dB (extremely dif f icult). The SNRs used are: -18, -15, -12, -9, -6, -3, 0 and 3 dB, encompassing normal to severely impaired performance in noise. Required items: • The Af f inity hardware • Licensed AC440 Audiometry module within your Af f inity hardware • VDB-Express License in your Af f inity hardware • Calibrated Headphones, insert phones or Free-Field Speaker
Test procedure
1) Open the AC440 and enter the VDB-Express screen by selecting Menu | Tests | VDB-Express
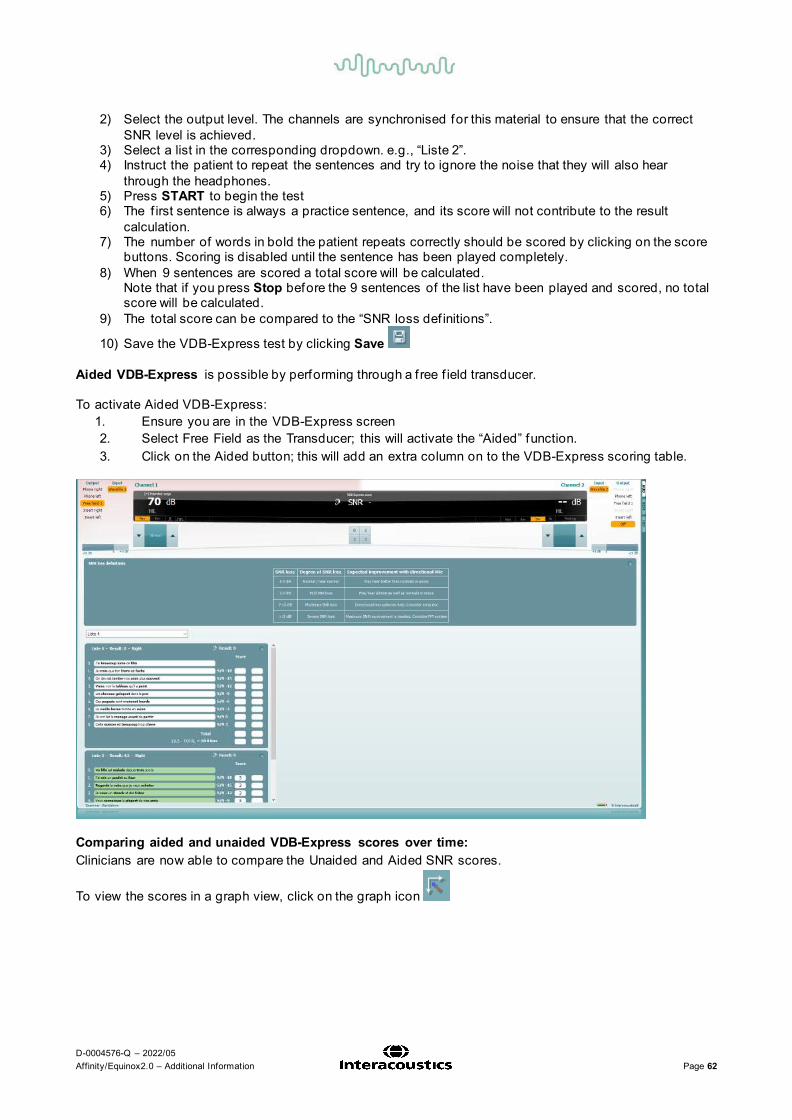
D-0004576-Q – 2022/05 Affinity/Equinox2.0 – Additional Information Page 62
2) Select the output level. The channels are synchronised for this material to ensure that the correct SNR level is achieved.
3) Select a list in the corresponding dropdown. e.g., “Liste 2”. 4) Instruct the patient to repeat the sentences and try to ignore the noise that they will also hear
through the headphones. 5) Press START to begin the test 6) The f irst sentence is always a practice sentence, and its score will not contribute to the result
calculation. 7) The number of words in bold the patient repeats correctly should be scored by clicking on the score
buttons. Scoring is disabled until the sentence has been played completely. 8) When 9 sentences are scored a total score will be calculated.
Note that if you press Stop before the 9 sentences of the list have been played and scored, no total score will be calculated.
9) The total score can be compared to the “SNR loss def initions”.
10) Save the VDB-Express test by clicking Save Aided VDB-Express is possible by performing through a f ree f ield transducer.
To activate Aided VDB-Express: 1. Ensure you are in the VDB-Express screen 2. Select Free Field as the Transducer; this will activate the “Aided” function. 3. Click on the Aided button; this will add an extra column on to the VDB-Express scoring table.
Comparing aided and unaided VDB-Express scores over time: Clinicians are now able to compare the Unaided and Aided SNR scores.
To view the scores in a graph view, click on the graph icon

D-0004576-Q – 2022/05 Affinity/Equinox2.0 – Additional Information Page 63

D-0004576-Q – 2022/05 Affinity/Equinox2.0 – Additional Information Page 64
1.8 Working with individual setups (test protocols) There are many dif ferent demands and wishes regarding how an audiometer should both function and appear depending on the specif ic situation and national standards. One of the greatest advantages of the AC440 module is the f lexibility enabling you to tailor the system according to your specif ic preferences in the so-called “test protocols”. These test protocols are created in the AC440 setup which will be described in this section. This manual will cover the use of factory/standard test protocols as well as how to create individual test protocols for different purposes or dif ferent clinicians working in the same facility. The following sections describe the setup options for all tests even though you most likely will only need to setup a few. This chapter should be seen as a work of reference where single functions can be looked up rather than a step-by-step guide
1.8.1 Selecting a test protocol: 1) Open the AC440 f rom your patient management system, Noah, OtoAccess® or via stand-alone. 2) Go to the AC440 Setup by following Menu | Setup | AC440 Setup 3) In the List of protocols, both factory test protocols with standard/factory test parameters and
personalized test protocols can be accessed and selected f rom the list (e.g.,”AC440” and “Joan Jones”).
Note: Certain test protocols may be hidden f rom this test protocol selection using the Show/Hide protocol function found under Menu | Setup | show hide protocols About the AC440 setup: In the AC440 Setup tests will be listed to the lef t. Unfold each the menu of test to access its options. Each test contains the following options:
Start-up: These are the settings for which the test will start up Common: Allows for setting up more general settings of the specif ic test Keyboard: Allows for setting up macros for the dedicated Af f inity2.0/Equinox2.0 audiometry keyboard (if this is used). Add-ons: Allows for setting up add-on features/subtests if available for a test. These require a special licence. Note: Some setup screens contain more than one tab of fering multiple user controls.
In each setup screen you will f ind three buttons in the lower right corner:
Clicking OK will close the AC440 setup and save all changes.
Clicking Apply will save changes but without closing the AC440 Setup. The change will, however, immediately be active and visible on the screen behind the setup dialog.

D-0004576-Q – 2022/05 Affinity/Equinox2.0 – Additional Information Page 65
Clicking Cancel will close the AC440 setup without saving any changes made.
1.8.2 Creating new protocols 1) Click Menu | Setup | AC440 setup to enter the Main setup. 2) Click New to create a new test protocol and f ill in the Name f ield (e.g., “Joan Jones”).
1.8.2.1 Common setup 1) The specif ics of the test can be selected starting in the Common screen shown below:
2) Choose in which test the system should begin under Start Screen. Note that MLD is greyed out since
it can only be performed af ter obtaining the hearing thresholds.

D-0004576-Q – 2022/05 Affinity/Equinox2.0 – Additional Information Page 66
Note: Some tests are purchased as additional licences for the AC440. If a license has not been purchased, the test will be greyed out in the start screen selection, and it will not be shown in the ‘test tree’ of the protocol settings (at number 1 in the above f igure).
3) Select the default start Intensity (Tone, Speech, SISI, Weber). Use the dropdown lists to select the preferred settings. Checking Switch extended range on automatically allows the user to go to high intensities without the need for manual activation of the extended range. The extended range opens automatically as soon as the cursor moves into that area of the audiogram
4) In the Automatic output selection, the Ch 2 opposite Ch 1 output can be ticked. This way channel 2 will automatically choose the opposite output as channel 1 (e.g., if channel 1 is set to Right, channel 2 will automatically select Left). At Bone masking: the user sets which transducer is chosen by default to mask bone measurements. This option will not be active if Ch 2 opposite Ch 1 output is not used.
5) Adjust the Pulse of the test signal. If Multi Pulse or Single Pulse are ticked the pulsation length (in mS) can be adjusted using the sliders. Note the option to add multi or single pulse in the f ront screen (as shown on the graph).
6) Direct Access Buttons: right click on the buttons to decide which direct access buttons appear on the main AC440 screen. Up to 4 buttons can be displayed.
7) Set Talk forward to the desired intensity using the slider. To allow talk forward in f ree f ield tick the corresponding check box. Tick Talk forward input calibration to adjust talk forward input level to 0 dB VU. This is helpful if the talk forward microphone is always located at the same position.
8) If desired, allow Monitor on live voice speech. This function is rarely necessary as it is likely to cause acoustical feedback. However, if the test is performed under circumstances where this is not the case, monitoring of live voice can be allowed by ticking the check box.
9) Under Settings – representation tick Show maximum intensities. This will allow for showing/not showing the transducer maximum intensities in all tests. This is the dark shaded area on the graph
can in the tone audiogram be (de)activated by the dedicated button under Counselling overlays . 10) Use BSA logic forces the audiometry to use symbols according to the standards of the British Society
of Audiology (BSA). 11) Only show input/output on mouseover will hide the not selected input and output options while the
mouse is not over it and results thereby in a calmer screen.
12) Offset BC symbols on screen allows for the BC icons to be of fset from the central lines indicating their
f requency – this is purely to allow simpler identif ication of ear side BC values when they are displayed as a single Audiogram.
If you expand the Common settings, you will have the option to amend settings for Mandatory Comments.

D-0004576-Q – 2022/05 Affinity/Equinox2.0 – Additional Information Page 67
Mandatory Comments allow you to enable a setting which forces the user to comment on the test session when saving the session. This is to ensure relevant session comments are provoked to be stored alongside the session data.

D-0004576-Q – 2022/05 Affinity/Equinox2.0 – Additional Information Page 68

D-0004576-Q – 2022/05 Affinity/Equinox2.0 – Additional Information Page 69
1.8.2.2 Tone testing setup Start-up 1) To enter the Start-up options for tone testing unfold the Tone options and click Start-up.
2) Default Output of Channel 1 and Channel 2 can be selected in the two dropdown lists. The selection will dif fer depending on which transducers are calibrated.
3) The Talk back can be activated by ticking the check box. The level of the talk back can be adjusted on the slider. A normal audible level would be approximately 60 dB.
2
3
1

D-0004576-Q – 2022/05 Affinity/Equinox2.0 – Additional Information Page 70
Common: 4) To enter the Common options for tone testing unfold the Tone options and click Common. Here you
can adjust some of the more f requent tone audiometry settings stating with the General settings.
Note: This screen contains four tabs (General, Tone audiometry, Overlays, Masking).

D-0004576-Q – 2022/05 Affinity/Equinox2.0 – Additional Information Page 71
5) Default input for Channel 1 and Channel 2 can be set using the dropdown lists. Select between Tone, Warble tone, NB (Narrow Band noise), and WN (White Noise) for both channels. In addition, TEN Noise can be selected for channel 2 (if purchased). See more information about the TEN test in Appendix 2. Channel 1 and Channel 2 Presentation: You have the option to tick Manual so that the stimulus is only presented when manually activated. Ticking Reverse will cause the signal to be presented continuously, only disappearing when the stimulus is activated. Single Pulse and Multi Pulse presentation for channel 1. The duration of the stimulus can be adjusted in the common options described above. Furthermore, you may wish to have presentation in both channels and tick Simultaneous which will lock channel 1 and channel 2 together or have the presentation in the two channels alternating to each other and tick Alternate.
6) Under Monitor one or both channels may be ticked if monitoring is preferred. The level of the monitoring can be set using the slider.
7) In Other settings you can tick Aided if audiograms usually are obtained with hearing aids and/or Binaural if both ears are tested at the same time. Both aided and binaural measures are stored as separate curves. HL (Hearing Level), MCL (Most Comfortable Level) or UCL (Uncomfortable Levels) may also be ticked depending on your preference. These are also stored as separate curves.
8) Settings
a. Ignore mouse over touch switch which will make AC440 ignore the cursor touching the stimuli area in the f ront screen. Instead, you will need to present the stimulus manually using the PC keyboard or the dedicated audiometer keyboard.
b. When ticking Jump to 1 kHz by output change the cursor will jump back to test 1 kHz upon output changes.
9) The Jump strategy contains three dif ferent options:
Butterfly The cursor will start at 1kHz and move upwards in f requency as the thresholds are stored. Af ter testing the high f requencies, the cursor will move back to re-test 1kHz and move downwards. When jumping back to 1kHz the Butterf ly strategy can be set to start the re-test at either the default start intensity or the intensity of the f irst threshold.
Bottom up The cursor will start at 1kHz and move upwards. When the high f requencies are tested, the cursor will jump to the lowest test f requency and move upwards towards 1kHz.
None Frequencies are changed manually using the arrow buttons in the main screen, the PC keyboard, or the dedicated keyboard.
10) For Intensity decrease when changing frequency, choose the level to decrease to when changing the test f requency, using the drop-down menu. .
11) By activating Set ch2 to manual after store, you assure that masking is automatically switched of f when storing a point and jumping to the next f requency.
12) Ticking mouse controlled audiometry will allow audiometry to be performed using the mouse 13) If testing with warble, tones the f requency of the warble tones can be adjusted in the Warble
Frequency slider. This may for example be helpful if testing patients with tinnitus. 14) Under Masking in Settings – representation: Tick Show masking information on screen if you want
the masking intensity for every threshold to be visible on screen. You may choose to see the masking information for air conduction (AC), bone conduction (BC), f ree f ield (FF) and insert phones (IP).
If ticking Show masking cursor, a cursor indicating the masking level will be visible on channel 2.

D-0004576-Q – 2022/05 Affinity/Equinox2.0 – Additional Information Page 72
15) Tick Show Ch1 and Ch2 in a single audiogram to show a single audiogram by default 16) Choose Swap intensity keys on PC keyboard and Swap arrows on intensity buttons to change the
direction when adjusting intensity and f requency. Hide unmasked threshold where masked exist will only display the masked (i.e., real) thresholds by default. This option can also be selected by right mouse click on the audiogram.
17) Under the Tone audiometry tab, you can select the desired test f requencies for HL/MCL and UCL by ticking the preferred f requencies. Use the Check all or Uncheck all buttons to help if needed.
If the unselected f requencies are not to be visible on the graph, then also tick Hide unselected HL, MCL and UCL frequencies. This way only the selected f requencies will appear on the audiogram.

D-0004576-Q – 2022/05 Affinity/Equinox2.0 – Additional Information Page 73
18) The Hearing loss index on audiogram allows for ticking Show European CPT-AMA index, Show AC
PTA index or Show BC PTA index. The European CPT-AMA is calculated using the values f rom the table below which ensures that the dif ferent f requencies are weighted to display a correct quantif ication of impairment due to the hearing loss. The dropdown menu below these settings for PTA index indicate the number of additional decibels you wish to add to the threshold when entering speech for the initial stimulus level.

D-0004576-Q – 2022/05 Affinity/Equinox2.0 – Additional Information Page 74
If selecting the PTA index, you can choose the f requencies that should be included in the calculation. The default setting will be 500, 1000, 2000, and 4000 Hz (Fletcher index). In this calculation method all f requencies are equally weighted and averaged to give the f igure. A further example of the Fletcher index is as follows: 500Hz Threshold + 1kHz Threshold + 2kHz Threshold + 4kHz Threshold = PTA Score 4 Should one of the f requencies have a double emphasis then the following calculation will be applied. 500Hz Threshold + (2 x 1kHz Threshold) + 2kHz Threshold + 4kHz Threshold = PTA Score 5 The PTA index calculation is used to give an average hearing level value to allow categorisation of the patients hearing loss shown on the audiogram. This score is used in certain markets to determine whether hearing rehabilitation should be reimbursed by their government/public funding or not (should it reach a certain threshold/value). This calculation can be conf igured as there are dif ferent f requency emphasis in certain languages/market, for example some countries have their own calculation which includes a double emphasis of 1kHz. In addition to an AC PTA index, you can also calculate a BC PTA index. The settings in this screen are an exact replication of the settings and application used in the AC PTA index, but the calculation will now be made for BC thresholds. The PTA index also provides the option to add a certain level to the result using the dropdown list. This is useful since the PTA is of ten used to determine the start intensity for speech testing. If you prefer to start the speech test at for example15 dB above PTA this can be selected in the dropdown list:

D-0004576-Q – 2022/05 Affinity/Equinox2.0 – Additional Information Page 75
Note: The PTA is calculated for insert phones and headset. However, if values for both are stored no PTA value is calculated.
19) Since the speech banana is language dependent the AC440 allows for entering individual speech banana values. Enter your values for the upper and lower margin of the speech banana under Top part of banana and Bottom part of banana.
20) For counselling purposes, you can tick Show speech banana in the Speech Banana tab. This allows for a speech banana view in shading in the audiogram screen. In the tone audiometry test screen, the
dedicated button under Counselling overlays, , also allows for (de)activating the speech banana.

D-0004576-Q – 2022/05 Affinity/Equinox2.0 – Additional Information Page 76
21) A Severity indication can be set up by def ining the label, minimum and maximum dB, and colour for
each indication in the audiogram. 22) For counselling purposes, you can tick Show severity in the Severity tab. This allows for severity
indications in the audiogram screen. In the tone audiometry test screen, the dedicated button under
Counselling overlays, , also allows for (de)activating the severity indications.

D-0004576-Q – 2022/05 Affinity/Equinox2.0 – Additional Information Page 77
23) The Phonemes to be shown in an audiogram can be set up by def ining the labels and positions of all
phonemes. Indicate the font size as how they must appear on screen.
24) For counselling purposes, you can tick Show phonemes in the Phonemes tab. This allows for phonemes in the audiogram screen. In the tone audiometry test screen, the dedicated button under
Counselling overlays, , also allows (de)activating the phonemes.

D-0004576-Q – 2022/05 Affinity/Equinox2.0 – Additional Information Page 78
25) The Sound examples to be shown in an audiogram can be set up by def ining the positions of all
examples. When adding a new picture, you are asked to point out where the picture can be found. Note that the f ile type must be *.png to allow transparent background colours.
26) For counselling purposes, you can tick Show sound examples in the Sound examples tab. This allows for sound examples in the audiogram screen. In the tone audiometry test screen, the dedicated
button under Counselling overlays, , also allows (de)activating the sound examples.

D-0004576-Q – 2022/05 Affinity/Equinox2.0 – Additional Information Page 79
27) Masking Tab: In this section, the tester can decide if Automasking or Masking Help should be turned on. The user can also change the interaural dif ferences as well as the default values for over masking.
a. Auto masking on masking will start automatically where required
b. Masking Help on a light in channel 2 will indicate if masking is required and whether there is undermasking or overmasking occurring
c. Indicate suggested masking level: will suggest the masking level that should be used
In this section the user can conf igure their Automasking feature by adjusting the interaural dif ference levels depending on the transducer selected. They can also adjust the level at which the transducer will be overmasking.
For more details, please refer to the Automasking and Masking Help Quick Guide in Appendix 2 Keyboard: To enter the Keyboard options for tone testing unfold the Tone options and click Keyboard. This is used set up macros for the dedicated audiometry keyboard shown below (if this is used).
a. b. c.

D-0004576-Q – 2022/05 Affinity/Equinox2.0 – Additional Information Page 80
Pressing the lef t rotating dial will enable/disable ‘Talk forward function.’ Pressing the right rotating dial will enable/disable the ‘Talk back’ option. The audiometer keyboard has an LED light indicator which changes status during dif ferent operations. These dif ferent colours and their statuses are listed and shown below. RED-Light: Indicates right ear selected BLUE-Light: Indicates lef t ear selected YELLOW-Light: Indicates f ree f ield measurement LIGHT-BLUE Indicates that keyboard is connected but inactive e.g: when conducting REM NO-Light: Indicates the channel is of f
A dimmed light indicates that the keyboard has entered power saving mode. This can happen in any of the colours mentioned above.
When the keyboard is connected, the below picture will appear at the bottom lef t hand corner of your screen.
The screen display (shown below) allows you to set up most of the keyboard buttons according to individual preferences. Multiple functions can be added to a single button and if done so all commands are executed when the keyboard button is pressed. Some functions have additional options af ter they are added to a keyboard button; for example, toggling through the available outputs. Note: The keyboard functions must be set up for each test individually.
Add-ons: 28) To enter the Add-on options for tone testing unfold the Tone options and click the plus in f ront of Add-
on. Then select Multi Frequency. 29) Here settings for Multi Frequency can be adapted. Adjust the f requency Resolution using the
dropdown list.

D-0004576-Q – 2022/05 Affinity/Equinox2.0 – Additional Information Page 81
Tick Set multi frequencies as default enabled to set the function to be default as on (for further description of multi f requency testing please see section 1.6.2) Note: High frequency Add on tab is currently not in use (for further description of high f requency testing please see section 1.6.1).

D-0004576-Q – 2022/05 Affinity/Equinox2.0 – Additional Information Page 82
1.8.2.3 Speech testing setup Start-up 1) To enter the Start-up options for speech testing, unfold the Speech options and click Start-up.
2) Select the default output of Channel 1 and Channel 2 in the two dropdown lists. The selection will dif fer depending on which transducers are calibrated.
3) Activate the Talk back by ticking the check box. The talk back level can be adjusted using the slider.
A normal audible level would be approximately 60 dB.

D-0004576-Q – 2022/05 Affinity/Equinox2.0 – Additional Information Page 83
Common 4) To enter the Common options for speech testing unfold the Speech options and click Common.
Note: This screen contains four tabs (General, Other, Link stimulus type to WR curves, and Norm curves).
5) Set the Channel 1 and Channel 2. You have the option to tick Manual so that the stimulus is only presented when manually activated. Ticking Reverse will cause the signal to be presented continuously, only disappearing when the stimulus is activated. You also have the option to select between Single Pulse and Multi Pulse presentation for channel 1. The duration of the stimulus can be adjusted in the common options described above. Furthermore, you may wish to have presentation in both channels and tick Simultaneous which will lock channel 1 and channel 2 together or have the presentation in the two channels alternating to each other and tick Alternate
6) The default input for Channel 1 and Channel 2 can be setup using the dropdown lists. Select between Mic1, Mic2, CD1, CD2 and Wave file as input for channel 1, and Mic1, Mic2, CD1, CD2, WN (White Noise), and SN (Speech Noise) as input for channel 217. Note that since CD and microphone are not automatically considered masking signals you can tick Masking below the channel 2 input selections. This ensures that the AC440 considers the CD input masking.
17 Mic2 and speech audiometry using a CD player is only available on the Affinity2.0/Equinox2.0.

D-0004576-Q – 2022/05 Affinity/Equinox2.0 – Additional Information Page 84
Channel 1 Channel 2
In Settings – representation you can choose between Table Mode and Graph Mode.
Graph Mode: If selecting Graph Mode, the results are displayed in a graph.
Show SRT on speech audiogram calculates the SRT value based on the norm curve (the distance in dB f rom the point where the norm curve crosses 50% to the point where the speech curve crosses 50%) like shown below. The result is then an expression of how much you need to turn up the level compared to normal for the patient to be able to repeat 50%. The calculation is based on the m curve if using multi syllabic words and the s curve if using single syllabic words.
Note that the norm curves change based on the speech material. You must therefore ensure that WR1, WR2 and/or WR3 is linked to single or multisyllabic words to show the SRT (see section 1.7.2.3). If no stimulus is linked to the WR curves, no SRT will be shown on the speech screen.
Table Mode: If selecting Table Mode, the test results are displayed in a table.
When clicking “store” the intensity level is shown in the table. Unlike Graph mode no calculation of the SRT takes place. The table mode records the level at which you found the SRT. When changing Transducer, Test Type (HL, MCL, UCL), and Aided (Aided or Binaural) a new SRT is recorded.

D-0004576-Q – 2022/05 Affinity/Equinox2.0 – Additional Information Page 85
7) Under Table mode settings you can decide whether the testing should start with SRT, WR1, WR2, WR3, HL, MCL, or UCL. The type of speech material for each WR can be selected in the Link stimulus types to WR curves (see later in this section).
8) Under Graph mode settings you can decide whether the testing should start with WR1, WR2, WR3,
MCL, or UCL. The type of speech material for each WR can be selected in the Link stimulus types to WR curves (see later this section).
9) Under Other settings you can tick Aided if audiograms usually are obtained with hearing aids and/or
Binaural if both ears are tested at the same time. This will result in a separate speech curve. Ticking Synchrone will activate the corresponding button in the f ront screen by default locking the distance in
input level between Ch1 and Ch2 for masking purposes . 10) Under Monitor one or both channels may be ticked if monitoring is preferred. The level of the
monitoring can be set using the slider bar. 11) Adjust the Input Levels for the selected input. It may be practical to set a default value in this screen if
you always use the same input. Note that the input level can also be selected in the speech screen by pressing shif t and adjusting the input to 0 VU (see section 1.6.5)
12) Under the Other tab additional speech test functions are available.

D-0004576-Q – 2022/05 Affinity/Equinox2.0 – Additional Information Page 86
14) Settings – controls include the following options: Ignore mouse over touch switch: The AC440 will ignore the mouse touching the stimuli area.
The function is embedded to avoid accidentally presenting a stimulus. Incorrect button deactivated: The incorrect button will be greyed, and only correct answers are
counted.18 Reset speech score on intensity change: The score will return to zero when the intensity is
changed. This is useful to avoid accidentally storing a measurement point in the speech graph which was measured over dif ferent speech levels.
Reset score on HL to UCL change: Ensures that if the test is toggled f rom HL to UCL the scoring will restart so that the UCL test does not build on the HL scoring.
Jump to next track on store makes sure that a new word list is used for every point measured. In case word lists contain enough words for several points, it can be disabled. Notice that the word scoring can be reviewed by hovering the mouse over measured data points. It however only shows the words of the list in which the point started its measurement.
Phoneme score scheme: Allow phoneme scoring during the speech test. The f ront screen will allow you to specify if 0, 1, 2, 3 or 4 phonemes are correctly repeated as illustrated below.
First word(s) for familiarization: Set a number of “practise words” using the dropdown list (if Phoneme score scheme is ticked). If for example set to 3, the f irst three words will not be calculated in the f inal score as these are trial words.
Number of words: Type in a number of words for the actual scored test. Note that this will be ignored when using wave f iles since the number of words in this case will be dependent on the selected speech material.
Stop when number of words has been reached automatically stores the point af ter reaching the number of words that is indicated at number of words.
Always show wavefile presentation assures that your preferred wave f iles are also shown on screen when selecting microphone or CD as input.
18 This may be useful if testing with wave files. In the wave file settings, you can set time limits so that after a certain period the word will be scored as incorrect. In this case the incorrect button is not needed

D-0004576-Q – 2022/05 Affinity/Equinox2.0 – Additional Information Page 87
15) Linking a type speech material to a WR curve:
Under the Link stimulus to WR curve tab a certain type of speech material can be linked to the individual WR curves. If a clinic for example always uses multi syllabic numbers for WR1 and single syllabic words for WR2, you can link these materials to the curves and corresponding buttons in the f ront screen.
Mark the type of material in the selection list Click on the arrow pointing towards the WR curve to which the material should be linked The material will then jump to the selected WR
16) Unlinking a type of speech material f rom a WR curve: Mark the type of material Click on the arrow pointing back to the selection The material will then jump back to the selection list
17) User defined labels allow you to name or label the speech material which will then be selectable for the print layout (see 0 for how to make a personal print layout). Additionally for table mode testing the check boxes indicate which labels are available as buttons in the test screen.
18) Under the Norm curves tab the norm values appearing in the speech graph can be changed.

D-0004576-Q – 2022/05 Affinity/Equinox2.0 – Additional Information Page 88
19) For Phone norm curves both Multi syllabic and Single syllabic norm values for speech tests obtained with head phone can be edited or replaced with other norm material. The default norm material is in accordance with the DIN 45 626 standard.
20) For FF norm curves both Multi syllabic and Single syllabic norm values for speech tests obtained in f ree f ield can be edited or replaced with other norm material. The default norm material is in accordance with the DIN 45 626 standard.
Keyboard To enter the Keyboard options for speech testing unfold the Speech options and click Keyboard. This is, however, only relevant if using the dedicated audiometry keyboard (shown in section 1.7.2.2). Since the procedure for setting up the keyboard buttons for speech audiometry is identical to the procedure for setting up the keyboard buttons for tone audiometry, please see section 1.7.2.2 for a description.

D-0004576-Q – 2022/05 Affinity/Equinox2.0 – Additional Information Page 89
Add-ons 21) To enter the Add-on options for speech testing unfold the Speech options and click Add-ons. In this
screen the AC440 can be setup to do speech testing using wave f iles19. Upload the wave f iles to the PC (as described in Appendix 1).
22) Select your speech material in the Speech CD name dropdown list. Selecting the dash ‘-‘results in not having word lists available in the test screen.
23) Word scoring includes the following options: Manual: Full manual control over the speech test, which is initiated, stopped, and scored
manually. Continue to next word after manual scoring: Presents the next word, number, or sentence
immediately af ter you have scored the previous word to be either correct or incorrect. Continue to next word and score automatically: The AC440 can be timed to wait for a certain
number of seconds before continuing with the next word, number, or sentence regardless of whether it the previous word was repeated correctly or incorrectly. Additionally, you can decide whether the word, number, or sentence should be assumed Correct or Incorrect when continuing the test if no score has been entered.
In the white section below, you can specify the exact duration of the pause between clicking the correct button and presenting the next word, number, or sentence by entering the desired number of seconds.
19 Speech testing with wave files is an additional license (ISF440)

D-0004576-Q – 2022/05 Affinity/Equinox2.0 – Additional Information Page 90
1.8.2.4 MLD testing20 setup Start-up To enter the Start-up options for MLD testing unfold the MLD options and click Start-up.
1) Talk back can be enabled by ticking the check box. Use the slider to set the default Talk back level.
20 Masking Level Difference (MLD) requires an additional license and is only available for the Affinity2.0/Equionox2.0

D-0004576-Q – 2022/05 Affinity/Equinox2.0 – Additional Information Page 91
Common To enter the Common options for MLD testing unfold the MLD options and click Common.
2) The Channel 1 Output and Channel 2 Output are tied together as tones are presented to the ears in
and out of phase respectively. This means that the Ch1 output will decide the output of Ch2. Use the Ch1 Output dropdown list to select the input for Phone right or Insert right.
Under Monitor one or both channels may be ticked if monitoring is preferred. The level of the monitoring can be set using the slider.
3) In MLD difference you can decide whether the MLD is preferred to equal S0 - SΠ or S0 – NΠ using the check boxes.
4) The MLD Test frequencies may be user def ined. You have the possibility to choose the four preferred test f requencies using the dropdown lists that all allow for selecting between the f requencies 125 – 8000 Hz. As MLD is primarily a low f requency test, 125, 250, 500, and 1000 Hz would be the most common choice.

D-0004576-Q – 2022/05 Affinity/Equinox2.0 – Additional Information Page 92
Keyboard To enter the Keyboard options for MLD testing unfold the MLD options and click Keyboard. This is, however, only relevant if using the dedicated audiometry keyboard. Since the procedure for setting up the keyboard buttons for MLD testing is identical to the procedure for the setting up keyboard buttons for tone audiometry, please see section 1.7.2.2 for a description.
1.8.2.5 MHA counselling21 setup Start-up To enter the Start-up options for MHA counselling unfold the MHA options and click Start-up. Talk back can be enabled by ticking the check box (as described in section 1.7.2.4 above). Common To enter the Common options for MHA counselling unfold the MHA options and click Common.
1) Set the output and input for channel 1 and the input for channel 2 under Channel 1 and Channel 2
Input using the dropdown lists. The output chosen for channel 1 will automatically also apply for channel 2.
2) Select the default start f ilter. The dif ferent f ilters are illustrated below: Lin no f iltering -6 per octave Minor high pass f iltering -12 per octave Minor - Medium high pass f iltering -18 per octave Medium – Major high pass f iltering HFE (-24 per octave) Major high pass f iltering
21 Master Hearing Aid (MHA) requires an additional software license.

D-0004576-Q – 2022/05 Affinity/Equinox2.0 – Additional Information Page 93
3) Under Monitor one or both channels may be ticked if monitoring is preferred. The level of the monitoring can be set using the slider
4) If Wave files are chosen as input, you can browse for them by clicking Browse. If a group of wave f iles are already chosen and you wish to browse for new ones, click Clear. The Input level of the wave f iles can be adjusted to the lef t using the slider.
Keyboard To enter the Keyboard options for MHA testing unfold the MHA options and click Keyboard. Since the procedure for setting up the keyboard buttons for MHA testing is identical to the procedure for the setting up keyboard buttons for tone audiometry, please see section 1.7.2.2 for a description.

D-0004576-Q – 2022/05 Affinity/Equinox2.0 – Additional Information Page 94
1.8.2.6 Knaster testing22 setup Start-up To enter the Start-up options for Knaster testing unfold the Knaster options and click Start-up. The default Talk back level can set using the check box (as described in section 1.7.2.4). Common To enter the Common options for Knaster testing unfold the Knaster options and click Common.
1) Under Channel 1 select output and input using the dropdown lists. Select the desired ear of
presentation and if the test should be conducted through Mic1, Mic2, CD1, CD2, or Wave files. Channel 1 Output Channel 1 Input
22 Knaster requires an additional software license and is only available for the Affinity2.0/Equinox2.0

D-0004576-Q – 2022/05 Affinity/Equinox2.0 – Additional Information Page 95
2) Select the default start Low pass filters and/or High pass filters:
In Normal hearing level for gain calculation, you can select a certain dB level which should normally be like the level of real speech (typically 60 dB). Using this level, the system calculates the level of gain the hearing aid needs to provide to be audible through the Knaster noise. Select f rom the options shown below:
Under Monitor one or both channels may be ticked if monitoring is preferred. The level of the monitoring can be set using the slider.
3) If Wave files are chosen as input, you can browse for them by clicking Browse. If a group of wave f iles are already chosen and you wish to browse for new ones, click Clear. The Input level of the wave f iles can be adjusted to the lef t using the slider.
Keyboard To enter the Keyboard options for Knaster testing unfold the Knaster options and click Keyboard. Since the procedure for setting up the keyboard buttons for Knaster testing is identical to the procedure for the setting up keyboard buttons for tone audiometry, please see section 1.7.2.2 for a description.
Lin no f iltering -12 per octave Medium low/high pass f iltering -24 per octave Major low/high pass f iltering

D-0004576-Q – 2022/05 Affinity/Equinox2.0 – Additional Information Page 96
1.8.2.7 HLS counselling23 setup Start-up To enter the Start-up options for HLS counselling unfold the HLS options and click Start-up. Determine the Talk back level using the check box to set the Talk back default (as described in section 1.7.2.4). Common To enter the Common options for HLS counselling unfold the HLS options and click Common.
1) Set the Default input for Channel 1 and the Default Input for Channel 2 using the dropdown lists. Select if the test should be conducted through Mic1, Mic2, CD1, CD2, or Wave files.
Channel 1 Channel 2
2) Under Default settings it can be decided whether the HLS should be enabled immediately when
opened using the check boxes. If the check boxes are not ticked the HLS will need to be enabled manually using the Right and Left buttons in the f ront screen (see section 1.6.8).
3) Select the HLS default headset. If using the Equinox2.0 or Af finity2.0 hardware choose between Use audiometric headphones or Use HF/HLS socket if the high f requency headset is preferred.
23 Hearing Loss Simulation (HLS) requires an additional software license.

D-0004576-Q – 2022/05 Affinity/Equinox2.0 – Additional Information Page 97
4) Under Monitor one or both channels may be ticked if monitoring is preferred. The level of the monitoring can be set using the slider.
5) If Wave files are chosen as input, you can browse for them by pressing Browse. If a group of wave f iles are already chosen and you wish to browse for new ones, press Clear. The Input level of the wave f iles can be adjusted to the lef t using the slider.
To setup the patient monitor text:
1. Go to Menu Setup AC440 Setup 2. Choose the protocol desired protocol to modify.
a. If choosing a default protocol, you will need to copy the existing settings and create a new one before modifying the settings
b. If choosing a custom protocol, you can modify the settings directly, without needing to copy 3. Go to HLS CommonDisplay Text 4. Click Add, which will activate a cursor, type in the desired text. (The Add button changes to a
Save button). Click Save when done. 5. To change the text colour, click on the dropper icon 6. To save the text, click on Save 7. Multiple sentences and paragraphs can be added by steps 4 and 5 8. To Delete the entry, highlight the entry, and click Delete 9. Once f inished, click on Apply to apply the changes 10. Click on the main Save button to save the setup changes
Adding an entry:

D-0004576-Q – 2022/05 Affinity/Equinox2.0 – Additional Information Page 98
Deleting an entry
Using the patient monitor text feature:
1. Choose the protocol in which the Patient Monitor Text has been activated 2. Go to the MenuTests HLS 3. Ensure that Mic 2 transducer is chosen 4. Go to Counselling Overlays window and click on the Patient Monitor Text button 5. This will launch the Patient Monitor with including text. 6. Choose the text to be used during the hearing loss simulation 7. Use the Zoom slider to make text bigger or smaller

D-0004576-Q – 2022/05 Affinity/Equinox2.0 – Additional Information Page 99
Keyboard To enter the Keyboard options for HLS testing unfold the HLS options and click Keyboard. Since the procedure for setting up the keyboard buttons for HLS testing is identical to the procedure for the setting up keyboard buttons for tone audiometry, please see section 1.7.2.2 for a description.
1.8.2.8 SISI testing24 setup Start-up To enter the Start-up options for SISI testing unfold the SISI options and click Start-up. The Talk back level can be determined using the check box (as described in section 1.7.2.4)
Common To enter the Common options for SISI testing unfold the SISI options and click Common. On the screen the most common SISI settings can be def ined.
1) Set the default output and default input for Channel 1 and Channel 2 using the dropdown lists. See the selections below:
Default output (Ch1) Default input (Ch1): Default output (Ch2): Default input (Ch2):
24 SISI requires an additional software license.

D-0004576-Q – 2022/05 Affinity/Equinox2.0 – Additional Information Page 100
2) Under Monitor one or both channels may be ticked if monitoring is preferred. The level of the monitoring can be set using the slider
Keyboard To enter the Keyboard options for SISI testing unfold the SISI options and click Keyboard. Since the procedure for setting up the audiometry keyboard buttons for SISI testing is identical to the procedure for the setting up keyboard buttons for tone audiometry, please see section 1.7.2.2 for a description.
1.8.2.9 Weber testing setup Start-up To enter the Start-up options for Weber testing unfold the Weber options and click Start-up. The Talk back level can be determined using the check box as described in section 1.7.2.4.
Common To enter the Common options for Weber testing unfold the Weber options and click Common.
1) Select Monitor for channel 1 and channel 2 using the check boxes and adjust the level using the slider.
Keyboard To enter the Keyboard options for Weber testing unfold the Weber options and click Keyboard. Since the procedure for setting up the audiometry keyboard buttons for Weber testing is identical to the procedure for the setting up keyboard buttons for tone audiometry, please see section 1.7.2.2 for a description
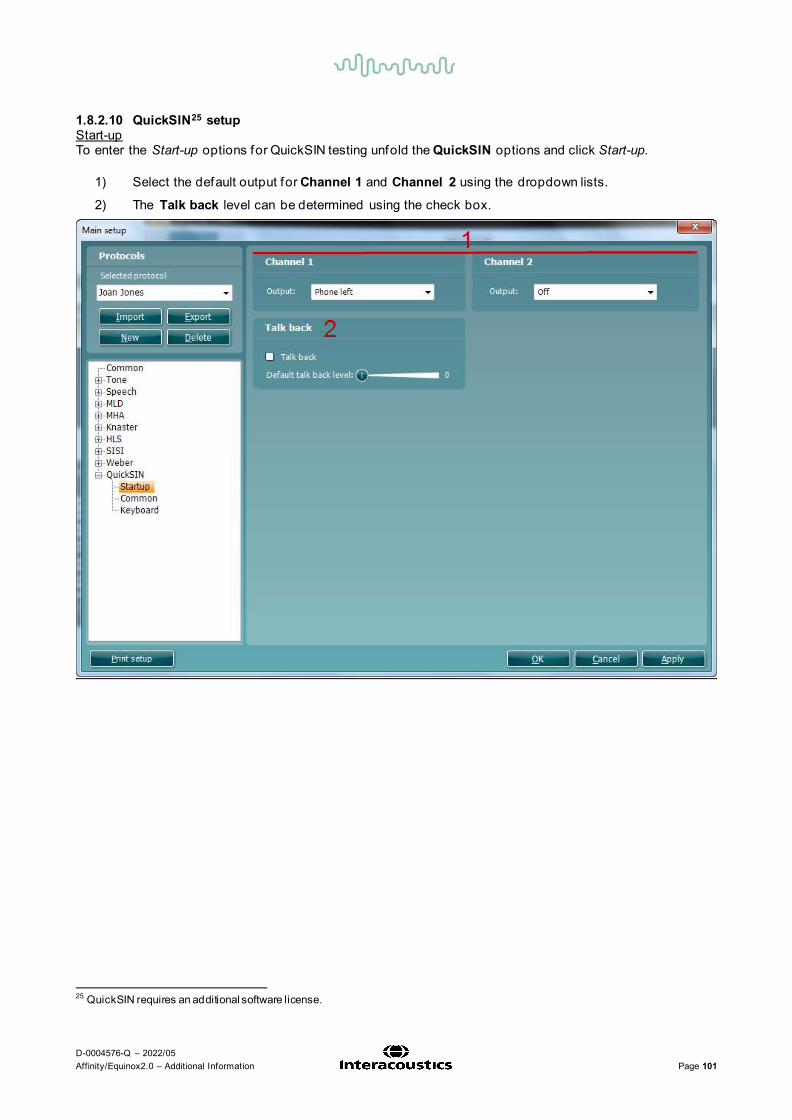
D-0004576-Q – 2022/05 Affinity/Equinox2.0 – Additional Information Page 101
1.8.2.10 QuickSIN25 setup Start-up To enter the Start-up options for QuickSIN testing unfold the QuickSIN options and click Start-up.
1) Select the default output for Channel 1 and Channel 2 using the dropdown lists.
2) The Talk back level can be determined using the check box.
25 QuickSIN requires an additional software license.

D-0004576-Q – 2022/05 Affinity/Equinox2.0 – Additional Information Page 102
Common To enter the Common options for QuickSIN testing unfold the QuickSIN options and click Common.
3) Select Monitor for channel 1 (Ch1) and channel 2 (Ch2) using the check boxes and adjust the
level using the slider. Keyboard To enter the Keyboard options for QuickSIN testing unfold the QuickSIN options and click Keyboard. Since the procedure for setting up the audiometry keyboard buttons for QuickSIN testing is identical to the procedure for the setting up keyboard buttons for tone audiometry, please see section 1.7.2.2 for a description.

D-0004576-Q – 2022/05 Affinity/Equinox2.0 – Additional Information Page 103
1.8.2.11 QuickSIN additional features setup Adding a fourth column to the SNR loss def initions table:
1. Go to: Menu Setup AC440 Main Setup QuickSIN Common 2. Insert a checkmark in the “show fourth column” box 3. Click on the pencil icon to enter text in the text box 4. Click on the dropper icon to add colour to the text box

D-0004576-Q – 2022/05 Affinity/Equinox2.0 – Additional Information Page 104
Aided QuickSIN is now possible when selecting the f ree f ield transducer.
To activate Aided QuickSIN: 1. Ensure you are in the QuickSIN screen 2. Select Free Field as the Transducer; this will activate the “Aided” function. 3. Click on the Aided button; this will add an extra column on to the QuickSIN scoring table
Comparing aided and unaided QuickSIN scores over time:
Clinicians are now able to compare the Unaided and Aided SNR scores.
To view the scores in a graph view, click on the graph icon
To view the scores in a graph view, but using the patient monitor, click on Patient Monitor
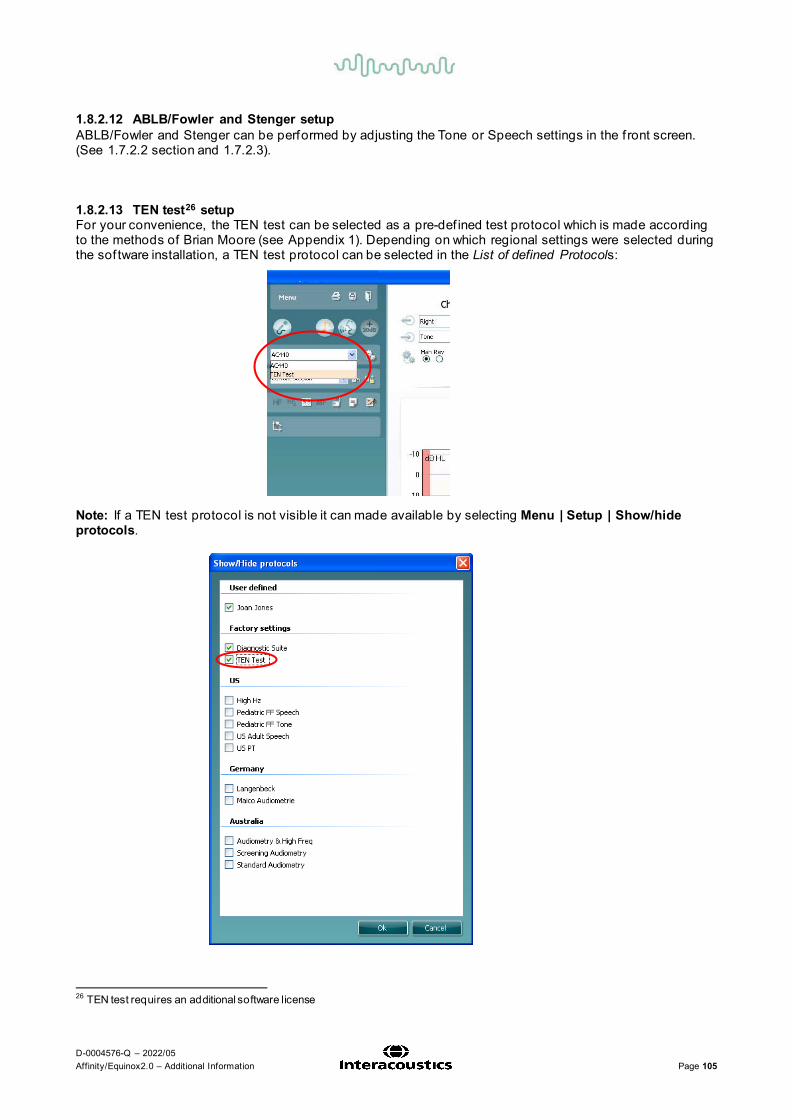
D-0004576-Q – 2022/05 Affinity/Equinox2.0 – Additional Information Page 105
1.8.2.12 ABLB/Fowler and Stenger setup ABLB/Fowler and Stenger can be performed by adjusting the Tone or Speech settings in the f ront screen. (See 1.7.2.2 section and 1.7.2.3).
1.8.2.13 TEN test26 setup For your convenience, the TEN test can be selected as a pre-def ined test protocol which is made according to the methods of Brian Moore (see Appendix 1). Depending on which regional settings were selected during the sof tware installation, a TEN test protocol can be selected in the List of defined Protocols: Note: If a TEN test protocol is not visible it can made available by selecting Menu | Setup | Show/hide protocols.
26 TEN test requires an additional software license

D-0004576-Q – 2022/05 Affinity/Equinox2.0 – Additional Information Page 106
1.8.2.14 ANL test setup Start-up To enter the Start-up options for ANL testing unfold the ANL options and click Start-up.
1) Select the default output for Channel 1 f rom the dropdown list.
2) The Talk back level can be determined using the check box.

D-0004576-Q – 2022/05 Affinity/Equinox2.0 – Additional Information Page 107
Common To enter the Common options for ANL testing unfold the ANL options and click Common.
1) Select your desired Channel 1 input via the Input dropdown list. 2) Select your desired Channel 2 input via the Input dropdown list. 3) Choose your Speech Material via this section. The CD chosen corresponds to material which is already
available in your Speech Audiometry test screen. This requires that the material has been extracted via the speech extraction tool. The dropdown allows you to choose your CD Name but also the Track and individual Speech Fragment you wish to use. It is important for the running of the test that each dropdown has been selected.
4) Choose your Intensity steps via this section. This will alter the step size you can change your stimulus by.
Keyboard To enter the Keyboard options for ANL testing unfold the ANL options and click Keyboard. Since the procedure for setting up the audiometry keyboard buttons for ANL testing is identical to the procedure for the setting up keyboard buttons for tone audiometry, please see section 1.7.2.2 for a description.

D-0004576-Q – 2022/05 Affinity/Equinox2.0 – Additional Information Page 108
1.8.2.15 SIQ Test setup Start-up To enter the Start-up options for SIQ testing unfold the SIQ options and click Start-up.
1) Select the default output for Channel 1 f rom the dropdown list.
2) Select the default output for Channel 2 f rom the dropdown list.
3) The Talk back level can be determined using the check box.

D-0004576-Q – 2022/05 Affinity/Equinox2.0 – Additional Information Page 109
Common To enter the Common options for SIQ testing unfold the SIQ options and click Common.

D-0004576-Q – 2022/05 Affinity/Equinox2.0 – Additional Information Page 110
1) Select your desired Channel 1 input via the Input dropdown list. 2) Select your desired Channel 2 input via the Input dropdown list. 3) Choose your Speech Material via this section. The CD chosen corresponds to material which is already
available in your Speech Audiometry test screen. This requires that the material has been extracted via the speech extraction tool. You can select your default material type in this drop down which will automatically make the system search for the relevant material for this type of test. If you check the Randomise wavefile playlists before playing checkbox then the material will be played in a random order.
4) Specify how you would like the sof tware to behave for the Word Scoring via this section. This will allow you to change the logic of the system depending on how the responses are scored.
5) The SRT Settings allow you to specify the max number of stimuli used for the SRT calculation and the minimum number of stimuli required af ter the f irst correct score before the system calculates an SRT score.
6) The Adaptive Settings allow you to specify the step size of both the conditioning step and the adjustment once the test has begun.
7) The Other Settings allow you to default the test as Binaural.

D-0004576-Q – 2022/05 Affinity/Equinox2.0 – Additional Information Page 111
1.8.2.16 SIN test setup Start-up To enter the Start-up options for SIN testing unfold the SIN options and click Start-up.
1) Select the default output for Channel 1 f rom the dropdown list. 2) Select the default output for Channel 2 f rom the dropdown list. 3) The Talk back level can be determined using the check box. 4) The Default SNR section allows you to specify the start SNR level for your testing.

D-0004576-Q – 2022/05 Affinity/Equinox2.0 – Additional Information Page 112
Common To enter the Common options for SIN testing unfold the SIN options and click Common.

D-0004576-Q – 2022/05 Affinity/Equinox2.0 – Additional Information Page 113
1) Select your desired Channel 1 input via the Input dropdown list. 2) Select your desired Channel 2 input via the Input dropdown list. 3) Choose your Speech Material via this section. The CD chosen corresponds to material which is already
available in your Speech Audiometry test screen. This requires that the material has been extracted via the speech extraction tool. You can select your default material type in this drop down which will automatically make the system search for the relevant material for this type of test. If you check the Randomise wavefile playlists before playing checkbox then the material will be played in a random order.
4) Specify how you would like the sof tware to behave for the Word Scoring via this section. This will allow you to change the logic of the system depending on how the responses are scored.
5) The SRT Settings allow you to specify the max number of stimuli used for the SRT calculation and the minimum number of stimuli required af ter the f irst correct score before the system can calculate an SRT score.
6) The Adaptive Settings allow you to specify the step size of both the conditioning step and the adjustment once the test has begun.
7) The Other Settings allow you to default the test as Binaural.

D-0004576-Q – 2022/05 Affinity/Equinox2.0 – Additional Information Page 114
1.8.3 Finishing the test protocol Press OK in the lower right-hand corner of the AC440 setup screen to save the customized test protocol. The test protocol can then be found in the Protocols and sessions dropdown list in the f ront screen.
1.8.4 Changing a test protocol permanently You can at any time make changes to an individual test protocol by entering the AC440 setup again as when creating the test.
1) Under Settings f ind the test protocol using the Name dropdown list. 2) Browse the setup options as if creating a test protocol (see section 1.7) and amend as desired.
When f inished click OK (or Apply) to save the changes.
1
3

D-0004576-Q – 2022/05 Affinity/Equinox2.0 – Additional Information Page 115
1.8.5 Changing a test protocol temporarily You may f rom time to time run into a patient with special needs requiring advanced or dif ferent testing parameters. In this situation the Temporary Setup can be helpful. The setup changes made here will be specif ic to the session. The test protocol name will be supplemented with an asterisk (*) to indicate that changes have been made to original test protocol. After saving the protocol will change back to the default selected protocol making you ready for your next patient.
1) Enter the Temporary Setup by clicking the button in the f ront screen (or alternatively select Menu/Setup/Temporary setup).
2) The Temporary Setup is identical to the AC440 setup. However, functions that cannot be changed temporarily will be greyed out. Browse the setup options to make temporary changes as if creating a test protocol (see section 1.7.2).

D-0004576-Q – 2022/05 Affinity/Equinox2.0 – Additional Information Page 116
1.8.6 Importing and exporting test protocols The AC440 also allows you to import and export test protocols to other AC440 users.
1.8.6.1 Importing a test protocol: 1) Go to the AC440 Setup (Menu | Setup | AC440 setup).
2) Click Import and browse to the location on the PC or USB where the test protocol f ile has been saved. 3) Click Open. 4) The test protocol will then appear under Name. 5) Af ter saving it by clicking OK the test protocol can be selected in the List of defined protocols in the
f ront screen.
Note that settings of imported protocols cannot be edited if they were exported as “read only”.
2
3
4
5

D-0004576-Q – 2022/05 Affinity/Equinox2.0 – Additional Information Page 117
1.8.6.2 Exporting a test protocol: 1) Go to the AC440 Setup (Menu | Setup | AC440 setup). 2) Click on Export. 3) Select if the f ile is to be saved as “read only”. In this case the protocol file is locked and the clinician
receiving it will not be able to make changes to it.
4) Browse for the location on the PC or USB where the test protocol is to be placed. 5) Click Save. Other AC440 users will then be able to upload the test protocol using the Import function.
2
3
5
4
5

D-0004576-Q – 2022/05 Affinity/Equinox2.0 – Additional Information Page 118
1.9 General setup In the General Setup you can select overall settings which are valid for all tests and protocols. To enter the General setup, select Menu | Setup | General Setup.

D-0004576-Q – 2022/05 Affinity/Equinox2.0 – Additional Information Page 119
1.9.1 Symbol editor You enter the symbol editor by either pressing Edit on an existing symbol scheme or by pressing New af ter which you are asked to type a name and select which of the existing symbol schemes is your starting point for the new set.
Note: This screen contains three tabs (Tone and Speech, Weber, and MLD).
1) Select Tone/Speech, Weber or MLD tab. In the Tone/speech tab each combination of radio buttons
stands for an individual symbol. It shows the following groups: AC, BC, FF and IP; HL, WR1, WR2, WR3, Tinnitus, MCL and UCL; Lef t, Right and Both; Unmasked, Masked and BSA Not heard and Heard Unaided and Aided
2) When pressing the Line, Ellipse or Polygon button a new element is added to the current symbol. The existing elements can be clicked for editing as well. Pressing Clear results in removing all elements of the current symbol.
3) The element options are shown when an element is selected. Now point with your mouse f rom where-to-where elements must be placed. Existing elements can be reshaped by dragging the red dots. A line thickness that shows well in the audiogram is thickness 50. The border of f illed polygons is never plotted. When done editing an element press the red cross in the top right corner.
4) The Line type, Line thickness and Line Color options refer to the lines that connect symbols in an audiogram and apply to the currently shown symbol.
5) When done editing all symbols, press Save and Exit to store your results. Pressing Cancel results in disregarding all changes.

D-0004576-Q – 2022/05 Affinity/Equinox2.0 – Additional Information Page 120
1.9.2 Noah database settings The option to ‘Use WR1 as SRT measurement (German User Scenario)’ enables the data to be stored in a specif ic manner for third party EMR systems to read and display the speech test data as SRT thresholds. The setting to ‘Save IP measurements as AC’ allows the user to store all insert earphone measures as standard AC audiometry thresholds. This is useful specif ically with some hearing aid f itting softwares which do not read the audiometry when inserts are used.
1.9.3 Tone and speech settings 1) Select your preferred Standard for Tone settings. The dropdown list allows you to choose between
ANSI and IEC.
2) Under Speech settings use the dropdown list to choose the desired Standard. Choose between
ANSI, IEC, Sweden, and Norway. 3) In Filter mode choose the preferred f iltering Linear, FF equiv. (Free Field Equivalent) and Non-linear.
Note: If changing the standard for Tone or Speech the AC440 must be re-started. If running under OtoAccess® also re-start the database.
Linear If choosing Linear the system will add f ilters giving the output of the transducer linear characteristics.
FF equiv. If choosing FF equiv the system will add f ilters giving the output of the transducer f ree f ield characteristics.
Non-Linear If choosing Non-linear you omit f ilters to be able to use a higher intensity for the speech testing. It will enable the system to go as high as 100 dB and if the +20 button is clicked to 120 dB
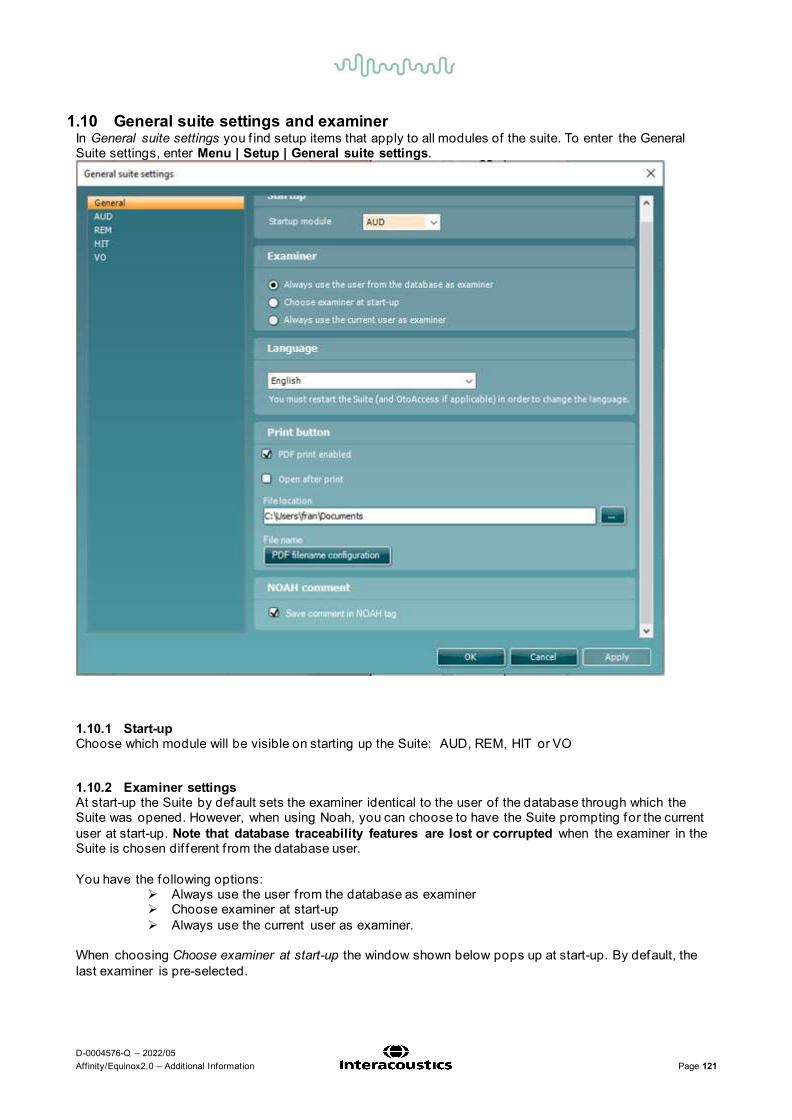
D-0004576-Q – 2022/05 Affinity/Equinox2.0 – Additional Information Page 121
1.10 General suite settings and examiner In General suite settings you f ind setup items that apply to all modules of the suite. To enter the General Suite settings, enter Menu | Setup | General suite settings.
1.10.1 Start-up Choose which module will be visible on starting up the Suite: AUD, REM, HIT or VO
1.10.2 Examiner settings At start-up the Suite by default sets the examiner identical to the user of the database through which the Suite was opened. However, when using Noah, you can choose to have the Suite prompting for the current user at start-up. Note that database traceability features are lost or corrupted when the examiner in the Suite is chosen dif ferent f rom the database user. You have the following options:
Always use the user f rom the database as examiner Choose examiner at start-up Always use the current user as examiner.
When choosing Choose examiner at start-up the window shown below pops up at start-up. By default, the last examiner is pre-selected.

D-0004576-Q – 2022/05 Affinity/Equinox2.0 – Additional Information Page 122
Note that locally, on the pc you are working, for each examiner a log f ile is created that contains preferences with regards to how the visuals of the Suite are being used. It is remembered which protocol was used last or which protocol is set as default start protocol. Also, the state of items that can be folded or hidden f rom the user interface are logged for each examiner. You can print the examiner with your sessions.
1.10.3 Languages From the drop-down menu, choose the desired language. The available languages within the sof tware are:
• English • French • Czech • German • Spanish • Turkish • Chinese (Peoples Republic of China) • Finnish • Italian • Japanese • Korean • Polish • Portuguese • Russian • Greek • Norwegian • Swedish • Dutch

D-0004576-Q – 2022/05 Affinity/Equinox2.0 – Additional Information Page 123
1.10.4 PDF print The PDF Printing feature has introduced to the Af f inity and Callisto Suites the ability to print to a PDF f ile on the computer. This is a benef it for paperless documenting of patients test data and for sharing data with people who do not have the Interacoustics Suites. This feature is present for all modules of the Callisto, and Af f inity Suites once enabled. This setting can be enabled via Menu > Setup > General suite settings. This will then open the below window:
In the bottom section of this window, you can see the settings for the Print button. Checking ‘PDF print enabled’ will lead to the print button in the Interacoustics suite to change as pictured below
The other setting to ‘Open af ter print’ results in the f ile being opened for viewing once the PDF print button has been pressed. Finally in this section you can characterize which f ile path the PDF printed f ile is stored. Note: Should you have PDF print enabled but you wish to print conventionally then you can still perform a physical paper print in the Suite by the following steps Menu > Print > Print.

D-0004576-Q – 2022/05 Affinity/Equinox2.0 – Additional Information Page 124
1.10.5 NOAH comment The NOAH Comment feature allows you add comments to the NOAH tag against the associated action/session you are saving. This can, for example, allow you to store the users initials so that the actions in a patients journey can be recognized as to who performed them. If you enable this setting, then this pop up will show when you try to save the session alerting the user to comment.
The contents of what is written in this f ield is only visible in Noah.
When used, the custom text is added in f ront of the action description and contained by square brackets. If the total length of the custom and standard descriptions is longer than 64 characters, some or all the standard description will be hidden.
Note that the custom description is applied to all measurements that are saved at a given time. To give each type of measurement a dif ferent description, you must save each type of measurement separately.

D-0004576-Q – 2022/05 Affinity/Equinox2.0 – Additional Information Page 125
1.11 Password protection When password protection is enabled the following menu items are greyed out and thereby make it impossible to permanently change settings.
To activate or change a password, select Menu | Setup | Password protection and enter and conf irm your password. In case no password was used before you must leave current password empty. You remove password protection by leaving the new password empty. To temporarily disable the password protection, select Menu | Setup | Unlock protection and enter your password in the pop-up window. The password and protection apply to all modules of the suite.

D-0004576-Q – 2022/05 Affinity/Equinox2.0 – Additional Information Page 126
1.12 The AC440 menu items The AC440 Menu gives you access to Print, Edit, View, Tests, Setup, and Help.
Menu | Print | Print will prompt the system to print using the selected print template (see section 4.1) Menu | Print | Print preview prompts a print preview of the current protocol using the print template
which is linked to the current protocol. Note that you are prompted to select a template if the protocol did not include a template (see how to create a print layout in section 0)
Menu | Print | Print layout opens the print wizard window f rom where you can select or create a template to print the current protocol (see section for details regarding the Print Wizard 4.1).
Menu | Edit | Transfer to current session will move a currently viewed historical audiogram to the current session.
Menu | Edit | Export will prompt the system to export the session as an XML formatted f ile. Menu | Edit | Swap audiometric data from ears allows you to swap data f rom right to lef t and lef t to
right for the current test only. Menu | View | Reset visual settings sets all user interface settings back to default (as they appear
for a new user).
Menu | View | Save current window position saves the position of the AC440 window on the PC screen so that it will open at this exact position every time. This is for example practical if the running other sof tware modules at the same time.
Menu | Tests | Tone opens the Tone test Menu | Tests | Speech opens the Speech test Menu | Tests | Weber opens the Weber test Menu | Tests | MLD opens the MLD test27 Menu | Tests | Knaster opens the Knaster test 28 Menu | Tests | SISI opens the SISI test29 Menu | Tests | MHA opens the MHA screen30 Menu | Tests | HLS opens the HLS screen31 Menu | Tests | QuickSIN opens the QuickSIN test32 Menu | Setup | AC440 setup opens the AC440 where you can setup customised test protocols (see
section 1.7 for details) Menu | Setup | General setup opens the General setup where settings valid for all tests can be
selected (see section 1.8 for details) Menu | Setup | Temporary setup opens the Temporary setup where temporary settings for the
specif ic session can be selected (see section 1.7.5 for details) Menu | Setup | Password protection allows you create or change a password and thereby protect
your AC440 settings (see section 1.10). Menu | Setup | Unlock protection allows you temporarily disabling password protection (see section
1.10).
27 The MLD test requires an additional software license and is only available for the Affinity2.0/Equinox2.0. 28 The Knaster test requires an additional software license and is only available for the Affinity2.0/Equinox2.0. 29 The SISI test requires an additional software license. 30 MHA requires an additional software license. 31 HLS requires an additional software license. 32 QuickSIN requires an additional software license.

D-0004576-Q – 2022/05 Affinity/Equinox2.0 – Additional Information Page 127
Menu | Setup | Show/hide protocols prompts a screen allowing you to tick test protocols which are to be shown in the List of defined protocols and untick the test protocols which are to be hidden.
Menu | Setup | Language opens the language selection. The system must be restarted for a new language selection to take ef fect.
Menu | Setup | General suite settings opens the General suite settings in which items are found that apply to all modules (see section 1.9).
PC Shortcut Keys opens the PC shortcut manager, where the clinician can customize PC shortcuts f rom the default if desired.
Menu | Help | About AC440 prompts a message box showing information regarding Suite version, Hardware version, and Firmware version. Please note that if experiencing problems with the system this information should be send to the manufacturer along with the description of the issue. Note: Press License to be able to type in a new license code.

D-0004576-Q – 2022/05 Affinity/Equinox2.0 – Additional Information Page 128
1.13 PC Shortcut manager The PC Shortcut Manager allows the user to personalize PC keyboard shortcuts in the AC440 Module. To access the PC Shortcut Manager, go to Menu Setup PC Shortcut Keys in the AUD module. It can also be accessed by pressing Ctrl + Alt + Shift + S simultaneously when in the AUD module of the sof tware. To view the default shortcuts, click on the items in the lef t-hand column
To personalize a shortcut, click on the column in the middle and add the custom shortcut in the f ield on the right hand of the screen
Export all shortcuts: Use this function to save custom shortcuts and transfer them to another computer Import shortcuts: Use this function to import shortcuts that have already been exported f rom another computer Restore all defaults: Use this function to restore the Factory Settings default
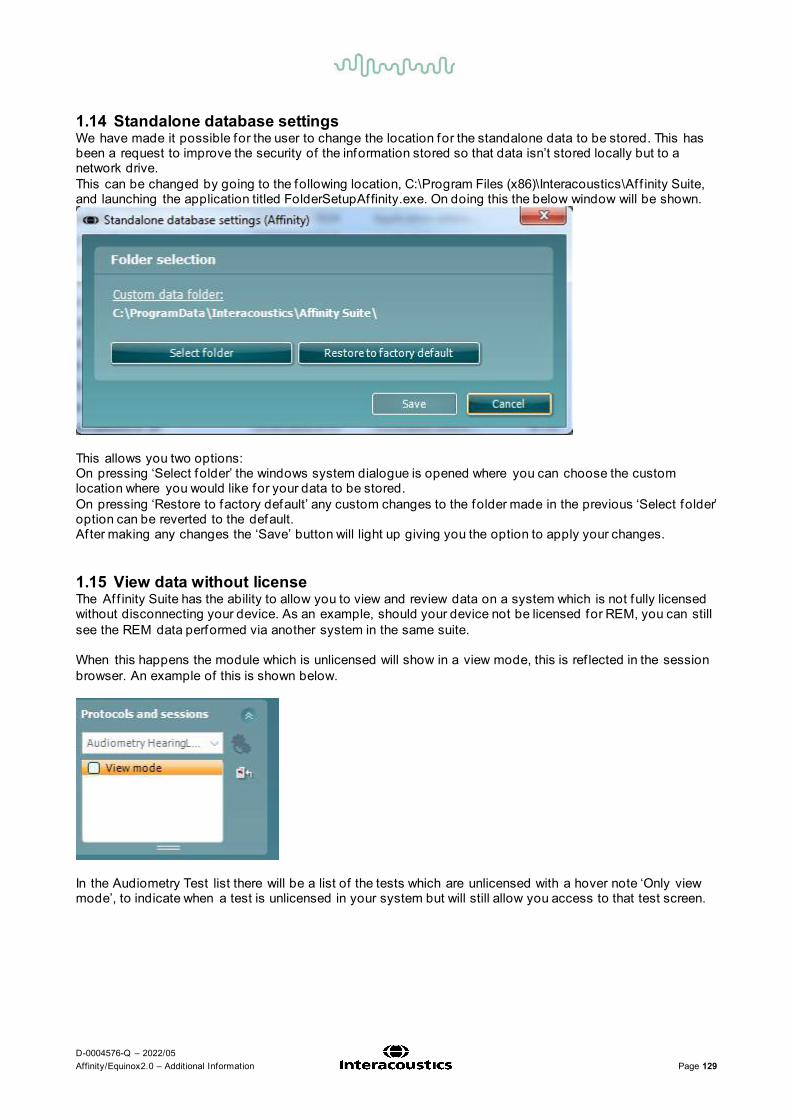
D-0004576-Q – 2022/05 Affinity/Equinox2.0 – Additional Information Page 129
1.14 Standalone database settings We have made it possible for the user to change the location for the standalone data to be stored. This has been a request to improve the security of the information stored so that data isn’t stored locally but to a network drive. This can be changed by going to the following location, C:\Program Files (x86)\Interacoustics\Af f inity Suite, and launching the application titled FolderSetupAffinity.exe. On doing this the below window will be shown.
This allows you two options: On pressing ‘Select folder’ the windows system dialogue is opened where you can choose the custom location where you would like for your data to be stored. On pressing ‘Restore to factory default’ any custom changes to the folder made in the previous ‘Select folder’ option can be reverted to the default. Af ter making any changes the ‘Save’ button will light up giving you the option to apply your changes. 1.15 View data without license The Af f inity Suite has the ability to allow you to view and review data on a system which is not fully licensed without disconnecting your device. As an example, should your device not be licensed for REM, you can still see the REM data performed via another system in the same suite. When this happens the module which is unlicensed will show in a view mode, this is ref lected in the session browser. An example of this is shown below.
In the Audiometry Test list there will be a list of the tests which are unlicensed with a hover note ‘Only view mode’, to indicate when a test is unlicensed in your system but will still allow you access to that test screen.

D-0004576-Q – 2022/05 Affinity/Equinox2.0 – Additional Information Page 130
When you enter a test which is unavailable the HUD will be completely greyed out and the data is only permitted to be viewed and not interacted with.

D-0004576-Q – 2022/05 Affinity/Equinox2.0 – Additional Information Page 131
1.16 FAQ When I open my AC440 it shows that I am in Simulation mode on the left of the screen. What could be the cause of this? Ensure that the Af f inity 2.0/Equinox 2.0 hardware is connected properly. This will be indicated by the picture of the instrument in the lower lef t corner of the screen. Check both the power cable and the USB connection. Also check for the light indicating that the instrument is switched on. If you have not been connected to the device before ensuring that you run the New Hardware Found wizard that installs the USB driver. Some functions are greyed out in my AC440 module. How can I use these? Functions greyed out can be caused by more than one factor. Some functions require a special licence such as High Frequency and Multi Frequency testing. If the licence is not purchased the functions are greyed out. Other functions may be greyed out due to the current setting. My test has locked. I cannot present any tones – why could that be? Please check that you are not in Edit mode. When Edit mode is active no testing can be performed.
Deactivate Edit mode, , to continue. You should also check that you are testing in the Current Session as testing is not permissible in historic sessions. Can I change my settings for one session only? Yes, this is done in the Temporary Setup Changes made here will automatically disappear when saving or closing the session. Notice that functions that cannot be changed temporarily will be greyed out. Can I delete a point or make changes to my audiogram? The current audiogram can be edited using right mouse click in the audiogram or via the ‘Edit Mode’. Previously saved audiograms cannot be edited in this manner, and you will need to transfer an old session to the current one via the Menu | Edit | Transfer to current session. How do I insert a no response? This can be done in three ways:
1) Press “N” on the PC keyboard. 2) If using the dedicated audiometry keyboard, hold down the “store” button for approximately 2
seconds. 3) Right click on the point of no response in the curve and choose Add no response.
How do I get my masking level on the audiogram? This is done in the AC440 setup. Select Menu | Setup | AC440 setup followed by Tone, Common. Ensure that Store masking information on screen is ticked.

D-0004576-Q – 2022/05 Affinity/Equinox2.0 – Additional Information Page 132
Can I upload my own speech material? Yes, but a special tool is needed for this. Contact Interacoustics or the local distributor to acquire this sof tware. You will need to have purchased the Speech f rom Hard Drive (SFH440) license to use wave f ile materials.

D-0004576-Q – 2022/05 Affinity/Equinox2.0 – Additional Information Page 133
1.17 Appendix 1
1.17.1 Audiometer implementation of the TEN(HL) test for diagnosing cochlear dead regions
By Brian C.J. Moore, Ph.D. Until recently, the TEN(HL) test for diagnosing dead regions in the cochlea could only be conducted by use of a compact disc player connected to an audiometer. Now, the test has been implemented within the Af f inity2.0 and Equinox2.0 PC-based audiometers (version 2.0.4) made by Interacoustics. This article describes: (1) What is meant by a dead region in the cochlear; (2) The basis of the TEN(HL) test for diagnosing dead regions in the cochlea; (3) The implementation of the TEN(HL) test in the Interacoustics audiometers; (4) The clinical value of diagnosing dead regions. What is a dead region? Sounds entering the ear give rise to vibration patterns on the basilar membrane within the cochlea. Each place on the basilar membrane is tuned to respond best to a specif ic small range of f requencies; high-f requency sounds produce maximum vibration towards the base and low-f requency sounds produce maximal vibration towards the apex. The f requency that leads to a maximal vibration at a given place on the basilar membrane is called the characteristic f requency (CF) for that place. In an ear with normal hearing, the patterns of vibration on the basilar membrane are strongly inf luenced by the activity of the outer hair cells (OHCs), which are minute sensory cells forming rows along the length of the basilar membrane. The OHCs play a role in what is called the “active mechanism” in the cochlea.1 They do this by changing their stif fness and length in response to the vibrations on the basilar membrane. This activity of the OHCs enhances the response to weak sounds (increasing the amplitude of vibration) and sharpens the tuning on the basilar membrane. This sharpening increases the f requency selectivity of the auditory system, i.e., its ability to separate out the dif ferent f requencies that are present in complex sounds such as speech and music. The amplif ied vibrations are then detected by the inner hair cells (IHCs), which form a single row running along the length of the basilar membrane. In response to vibrations on the basilar membrane, the IHCs release neurotransmitter, and this leads to neural activity in the auditory nerve. Cochlear hearing loss is of ten associated with damage to the hair cells within the cochlea.1,2 This damage can give rise to raised hearing thresholds (i.e., hearing loss as measured by the audiogram) in two main ways. Firstly, damage to the OHCs impairs the active mechanism in the cochlea, resulting in reduced basilar-membrane vibration for a given low sound level.3 Hence, the sound level must be larger than normal to give a just-detectable amount of vibration. Secondly, IHC damage can result in less ef f icient stimulation of the auditory nerve. As a result, the amount of basilar membrane vibration needed to reach the hearing threshold is larger than normal.4 A cochlear hearing loss up to about 55 dB may be caused by damage to OHCs alone. A hearing loss greater than 55 dB nearly always involves some loss of function of IHCs as well as OHCs.2 From measurement of the audiogram alone, it is not possible to determine what proportion of the hearing loss is due to OHC damage and what proportion to IHC damage. In some cases, the IHCs at certain places along the basilar membrane may be completely non-functioning. In addition, the auditory neurons contacting those places may be non-functioning. Places with non-functioning IHCs and/or neurons have been referred to as “lacunae” 5 and “holes in hearing” 6, but I have used the blunt phrase “dead regions” 7-10 and that phrase seems to have caught on, although the phrase “dead zones” is also quite common. Figure 1 shows the dissected cochlea of a person who had been exposed to intense impact sounds (gunshots) before dying in an incident unrelated to gunshots! The dark lines are the neurons that would eventually get together and form the auditory nerve. There are essentially no neurons coming f rom the basal part of the cochlea, indicating a high-f requency dead region. Basilar-membrane vibration that occurs within a dead region cannot be detected by the neurons connected to that region (if there are any). Say, for example, that the IHCs at the basal (high f requency) end of the cochlea are non-functioning. Neurons connected to the basal end, that would normally have high CFs, will not respond. However, if a high-f requency pure tone is presented, it may be detected if it produces suf f icient basilar-membrane vibration at a region closer to the low-f requency, apical end. In other words, a high-f requency sound may be detected via neurons that are tuned to lower f requencies. This is sometimes called “of f -place listening” or “of f -frequency listening”. Similarly, if there are no functioning IHCs in an apical region of the cochlea, a low-f requency tone may be detected via neurons that are tuned to higher f requencies.

D-0004576-Q – 2022/05 Affinity/Equinox2.0 – Additional Information Page 134
Because of this possibility, the “true” hearing loss at a given f requency may be greater than suggested by the audiometric threshold at that f requency. Also, for this reason, dead regions are not easy to diagnose f rom the pure-tone audiogram, although a hearing loss greater than 70 dB is of ten associated with a dead region.11,12 A dead region can be characterised in terms of the range of CFs that would normally be associated with that region. In other words, a f requency-to-place map is used to relate the cochlear location at each edge of the dead region to f requency. This is illustrated in Figure 2. Say, for example, that the IHCs are non-functioning over a region of the basilar membrane having CFs in the range 2500 to 20000 Hz. One might describe this as a dead region extending f rom 2500 Hz upwards. The lower “edge f requency” of the dead region in this example is 2500 Hz. Henceforth, the edge f requency is denoted fee. The TEN(HL) test for diagnosing dead regions in the cochlea The TEN(HL) test for diagnosing dead regions was designed to be quick and easy to administer and hence suitable for use in clinical practice. The development and validation of the f irst version of the test are described in Moore et al.8 The test involves measuring the threshold for detecting a pure tone presented in a background noise called “threshold-equalizing noise” (TEN). Therefore, the test is called the TEN test. The noise was synthesised in such a way that the threshold for detecting a tone in the noise, specif ied in dB SPL, was approximately the same for all tone f requencies in the range 0.25 to 10 kHz, for people with normal hearing. The masked threshold is approximately equal to the nominal level of the noise specif ied in dB SPL. When the pure-tone signal f requency falls in a dead region, the signal will only be detected when it produces suf f icient basilar-membrane vibration at a remote region in the cochlea where there are surviving IHCs and neurons. The amount of vibration produced by the tone at this remote region will be less than in the dead region, and so the noise will be very ef fective in masking it. Thus, the signal threshold is expected to be markedly higher than normal. Moore et al. 8 proposed the following rule: a dead region at a particular f requency is indicated by a masked threshold that is at least 10 dB above the absolute threshold and 10 dB above the nominal noise level. To make the test easy to administer, the TEN test was recorded on a CD; the noise was on one channel and test tones were on the other channel. For this implementation of the test, the signals f rom the CD were fed through a two-channel audiometer. The methods used to conduct the test were like those used for conventional pure-tone audiometry, except that the signal threshold was measured in the presence of a continuous background noise. A problem with the f irst version of the TEN test was that the clinician had to measure absolute thresholds (audiometric thresholds) twice, once using the tones generated by the audiometer, with level specif ied in dB HL, and once using the tones f rom the CD, with level specif ied in dB SPL. This was inconvenient for the clinician. To overcome this problem, a second version of the TEN test was developed in which the noise was designed to give equal masked thresholds in dB HL for all f requencies f rom 500 to 4000 Hz, for normally hearing people.13 This version is called the “TEN(HL)” test. As all calibrations were in dB HL, absolute thresholds could be measured either using the tones generated by the audiometer or using the test tones f rom the CD; the results were expected to be very similar. However, the TEN(HL) test can only be used with specif ic headphones; with the current version of the test, suitable headphones are TDH39, TDH 49 and TDH50. Another advantage of the second version of the test is that the noise has been designed to have minimal amplitude f luctuations; such noise is called “low-noise noise”.14 Figure 3 shows the spectrum of the noise (top) and a sample of the waveform (bottom). Note that all peaks and dips in the waveform are of similar magnitude. This characteristic allows high noise levels to be used without signif icant distortion being produced by the audiometer or earphone. Hence, testing is possible for more severe hearing losses than could be assessed with the earlier version, without any special equipment being required. The criteria for diagnosing a dead region are like those for the earlier test: a dead region at a particular f requency is indicated by a masked threshold that is at least 10 dB above the absolute threshold and 10 dB above the nominal noise level in dB HL. Implementation of the TEN(HL) test in Interacoustics audiometers The implementation of the TEN(HL) test in the Af f inity2.0 and Equinox2.0 PC-based Interacoustics audiometers makes it easy and simple to administer the TEN(HL) test. There is no need to have any equipment external to the audiometer. A pre-def ined setup for performing the TEN(HL) test can be selected f rom a drop-down menu of “User protocols”. One ear at a time is tested, and on-screen boxes are used to determine whether the TEN plus test tone are delivered to the right ear or the lef t ear. Possible f requencies for the test tone are 500, 750, 1000, 1500, 2000, 3000 and 4000 Hz.

D-0004576-Q – 2022/05 Affinity/Equinox2.0 – Additional Information Page 135
The level of the TEN in dB HL can be set using the computer mouse, by clicking the appropriate point on the screen, or by using the appropriate knob on the optional dedicated keyboard. Initially, the TEN is turned of f while the appropriate level is selected. Some useful rules for selecting the level of the TEN are as follows: 1) For f requencies where the hearing loss is less than or equal to 60 dB, set the TEN level to 70 dB. This is not unpleasantly loud for most people, and it leads to a def initive result. 2) When the hearing loss is 70 dB or more at a given f requency, set the TEN level 10 dB above the audiometric threshold at that f requency. For example, if the audiometric threshold is 75 dB HL, set the TEN level to 85 dB HL. 3) If the TEN is found to be unpleasantly loud, or if the maximum TEN level of 90 dB HL is reached, then the TEN level can be set equal to the audiometric threshold. This should still give a def initive result. It may be dif ficult or impossible to apply the TEN(HL) test when the hearing loss at the test f requency is 90 dB or more, although it is quite likely that a dead region would be present with such a severe hearing loss. Note that the TEN level does not need to be the same for all test f requencies. Once the level is chosen for a given test f requency, the TEN is turned on continuously, by placing the cursor over “stimulus” or by clicking on “Rev”. The threshold for detecting a test signal in the TEN is determined using the same procedure as would be used for manual audiometry, except that a step size in level of 2 dB should be used when the tone is in the region of the detection threshold; larger steps can be used initially, to f ind the approximate threshold. 2-dB steps are automatically selected when the TEN(HL) test is chosen f rom the drop-down menu. The use of small steps makes the outcome more precise, and reduces the incidence of false positives.15 Once the threshold has been measured for a given test f requency, the appropriate TEN level is set for the next test f requency, and the process is repeated. For a person with normal hearing, the threshold of the test tone in the TEN is typically equal to the TEN level. For example, if the TEN level is set to 70 dB HL, the threshold for detecting the test tone is about 70 dB HL, for any f requency f rom 500 to 4000 Hz. If a patient has a cochlear hearing loss but does not have a dead region at the test f requency, then the threshold of the test tone in the TEN is typically a few dB above the TEN level. For example, if the TEN level is set to 70 dB HL, the threshold for detecting the test tone might be 73 dB HL. However, when the test tone f requency falls in a dead region, the threshold for detecting the test tone in the TEN is typically well above the TEN level. The criteria for diagnosing a dead region at a specif ic f requency are: 1) The threshold of the test tone in the TEN is 10 dB or more above the TEN level. 2) The threshold of the test tone in the TEN is 10 dB or more above the audiometric (absolute) threshold. If the TEN level is selected as described earlier, then criterion 2) will automatically be satisf ied when criterion 1) is satisf ied. Figure 4 is a screen shot f rom the Af f inity system, showing audiometric thresholds (circles) and TEN(HL)-test results (“TEN” symbols) for a person with good low-f requency hearing but a severe high-f requency hearing loss. The results suggest that this patient has a dead region extending upwards f rom 1.5 kHz. It typically takes about 4 minutes per ear to perform the TEN(HL) test for all test f requencies. In practice, it is usually not necessary to conduct the TEN(HL) test for f requencies where the hearing loss is 50 dB or less. For example, if a patient has a typical sloping hearing loss, with relatively good hearing at low f requencies and poor hearing at high f requencies, it is only necessary to conduct the test for the medium and high f requencies. However, if the patient has an unusually shaped audiogram, such as a localized mid-f requency loss, it may be worth conducting the TEN(HL) test even when the loss is mild. Clinical applications of the TEN(HL) test The presence or absence of dead regions can have important implications for f itting hearing aids and for predicting the likely benef it of hearing aids. When a patient has a dead region, there may be little or no benef it in applying amplif ication (via a hearing aid) for f requencies well inside the dead region. However, for patients with high-f requency dead regions, there may be some benef it in applying amplif ication for f requencies up to about 1.7fe.16,17 For example, if a patient has a dead region which starts at 1000 Hz and extends upwards f rom there, there may be some benef it in amplifying f requencies up to 1700 Hz. However, there will probably be no benef it of applying amplif ication for f requencies above about 1700 Hz. Trying to achieve suf f icient gain for f requencies above 1700 Hz might lead to problems with distortion and acoustic feedback. For a patient with an extensive high-f requency dead region, a hearing aid incorporating f requency transposition or f requency compression might be a viable option.18,19

D-0004576-Q – 2022/05 Affinity/Equinox2.0 – Additional Information Page 136
For people with low-f requency dead regions, as can occur, for example, in cases of Ménière’s syndrome, there appears to be some benef it of amplifying f requencies above 0.57fe, but not of amplifying frequencies below 0.57fe.20,21 Amplif ication of frequencies below 0.57fe can actually lead to reduced speech intelligibility. In rare cases, the audiogram may have the form of an inverted V; hearing is relatively good over a small f requency range, and poor at all remaining f requencies. This can indicate a restricted functioning region in the cochlea, with extensive dead regions below and above it.22-24 However, it is not safe to make a diagnosis of dead regions based solely on an inverted V-shaped audiogram 23; a test such as the TEN(HL) test is needed for a f irm diagnosis. For a patient who does have a restricted functioning region, with dead regions above and below the functioning region, the most ef fective amplification strategy may be to amplify over a limited f requency range around the functioning region.24 The TEN(HL) test may also be relevant for patients who are being considered for a cochlear implant; a patient with very extensive dead regions would be likely to do better with a cochlear implant than with a hearing aid (or aids). The test may also be useful for patients who are being considered for a combination of a cochlear implant and a hearing aid. Such patients typically have a dead region in the parts of the cochlea that normally respond to medium and high f requencies but have some functional hearing at lower f requencies. It may be useful to determine the edge f requency, fe, of any dead region. This may be relevant to choosing the most appropriate insertion depth of the electrode array, and to the way that f requencies in the input signal are mapped to acoustic and electric stimulation.25 The clinician needs to be alert for some special cases. Patients with auditory neuropathy sometimes have high thresholds for detecting the test tone in the TEN, meeting the TEN(HL) test criteria for diagnosis of a dead region, even for f requencies where their audiometric thresholds are near normal.26 This does not necessarily indicate that they have extensive dead regions, although they may have only patchy survival of IHCs.27 Patients may also have high thresholds for detecting the test tone in the TEN as a result of central problems, for example brain injury in auditory areas resulting f rom trauma or a stroke.28 These high thresholds may result f rom poor “detection ef f iciency” rather than f rom dead regions. Nevertheless, high thresholds in the TEN are likely in all cases to be associated with a poor ability to understand speech when background sounds are present.

D-0004576-Q – 2022/05 Affinity/Equinox2.0 – Additional Information Page 137
References 1. Moore BCJ, Cochlear Hearing Loss: Physiological, Psychological and Technical Issues, 2nd Ed.,
Chichester: Wiley; 2007. 2. Schuknecht HF, Pathology of the Ear, 2nd Ed., Philadelphia: Lea and Febiger; 1993. 3. Ruggero MA, Rich NC. Furosemide alters organ of Corti mechanics: Evidence for feedback of outer
hair cells upon the basilar membrane. J. Neurosci. 1991; 11: 1057-1067. 4. Liberman MC, Dodds LW. Single neuron labeling and chronic cochlea pathology. III. Stereocilia
damage and alterations in threshold tuning curves. Hear. Res. 1984; 16: 54-74. 5. Troland LT. The psychophysiology of auditory qualities and attributes. J. Gen. Psych. 1929; 2: 28-58. 6. Shannon RV, Galvin JJ, 3rd, Baskent D. Holes in hearing. J. Assoc. Res. Otolaryngol. 2002; 3: 185-
199. 7. Moore BCJ, Glasberg BR. A model of loudness perception applied to cochlear hearing loss. Auditory
Neurosci. 1997; 3: 289-311. 8. Moore BCJ, Huss M, Vickers DA, Glasberg BR, Alcántara JI. A test for the diagnosis of dead regions
in the cochlea. Br. J. Audiol. 2000; 34: 205-224. 9. Moore BCJ. Dead regions in the cochlea: Diagnosis, perceptual consequences, and implications for
the f itting of hearing aids. Trends Amplif. 2001; 5: 1-34. 10. Moore BCJ. Dead regions in the cochlea: Conceptual foundations, diagnosis, and clinical applications.
Ear Hear. 2004; 25: 98-116. 11. Aazh H, Moore BCJ. Dead regions in the cochlea at 4 kHz in elderly adults: relation to absolute
threshold, steepness of audiogram, and pure tone average. J. Am. Acad. Audiol. 2007; 18: 96-107. 12. Vinay, Moore BCJ. Prevalence of dead regions in subjects with sensorineural hearing loss. Ear and
Hearing 2007; 28: 231-241. 13. Moore BCJ, Glasberg BR, Stone MA. New version of the TEN test with calibrations in dB HL. Ear
Hear. 2004; 25: 478-487. 14. Pumplin J. Low-noise noise. J. Acoust. Soc. Am. 1985; 78: 100-104. 15. Cairns S, Frith R, Munro KJ, Moore BCJ. Repeatability of the TEN(HL) test for detecting cochlear dead
regions. Int. J. Audiol. 2007; 46: 575-584. 16. Vickers DA, Moore BCJ, Baer T. Ef fects of lowpass f iltering on the intelligibility of speech in quiet for
people with and without dead regions at high f requencies. J. Acoust. Soc. Am. 2001; 110: 1164-1175. 17. Baer T, Moore BCJ, Kluk K. Ef fects of lowpass filtering on the intelligibility of speech in noise for
people with and without dead regions at high f requencies. J. Acoust. Soc. Am. 2002; 112: 1133-1144. 18. Simpson A, Hersbach AA, McDermott HJ. Improvements in speech perception with an experimental
nonlinear f requency compression hearing device. Int. J. Audiol. 2005; 44: 281-292. 19. Glista D, Scollie S, Bagatto M, Seewald R, Parsa V, Johnson A. Evaluation of nonlinear f requency
compression: Clinical outcomes. Int. J. Audiol. 2009; 48: 632-644. 20. Vinay, Moore BCJ. Speech recognition as a function of highpass f ilter cutof f frequency for subjects
with and without low-f requency cochlear dead regions. Journal of the Acoustical Society of America 2007; 122: 542-553.
21. Vinay, Moore BCJ, Baer T. Speech recognition in noise as a function of highpass-f ilter cutof f f requency for people with and without low-f requency cochlear dead regions. J. Acoust. Soc. Am. 2008; 123: 606-609.
22. Moore BCJ, Alcántara JI. The use of psychophysical tuning curves to explore dead regions in the cochlear. Ear Hear. 2001; 22: 268-278.
23. Halpin C. The tuning curve in clinical audiology. Am. J. Audiol. 2002; 11: 56-64. 24. Vinay, Moore BCJ. Psychophysical tuning curves and recognition of highpass and lowpass f iltered
speech for a person with an inverted V-shaped audiogram. J. Acoust. Soc. Am. 2010; (submitted). 25. Moore BCJ, Glasberg BR, Schlueter A. Detection of dead regions in the cochlea: Relevance for
combined electric and acoustic stimulation. In: van de Heyning P, Kleine Punte A, eds. Cochlear Implants and Hearing Preservation. Advances in ORL, 67. Basel: Karger; 2009.
26. Vinay, Moore BCJ. TEN(HL)-test results and psychophysical tuning curves for subjects with auditory neuropathy. Int. J. Audiol. 2007; 46: 39-46.
27. Rance G. Auditory neuropathy/dys-synchrony and its perceptual consequences. Trends Amplif. 2005; 9: 1-43.
28. Langenbeck B, Textbook of Practical Audiometry, London: Edward Arnold; 1965. Correspondence can be addressed to Brian Moore, Department of Experimental Psychology, University of
Cambridge, England, e-mail: [email protected]

D-0004576-Q – 2022/05 Affinity/Equinox2.0 – Additional Information Page 138
Figure 1: Cochlea f rom a 25-year-old man who had been exposed to gunshots. The dark lines show auditory neurons. There are no neurons coming f rom the basal part of the cochlea, indicating a dead region. Figure 2: Illustration of how the edge of a dead region can be related to f requency in Hz, using a f requency-to-place map of the cochlea. In this example, the dead region starts at an edge f requency of about 2500 Hz and extends upwards towards higher f requencies.
Dead

D-0004576-Q – 2022/05 Affinity/Equinox2.0 – Additional Information Page 139
Figure 3: Spectrum (top) and a segment of the waveform (bottom) of the noise used for the TEN(HL) test. Figure 4. Screen shot f rom the Af f inity2.0 system. The open circles show the audiometric (absolute) thresholds. The “TEN” symbols show masked thresholds measured for TEN with a level of 80 dB HL. The TEN(HL)-test criteria for a dead region are met at 1.5, 3, and 4 kHz. The result at 2 kHz is inconclusive, as the masked threshold is not 10 dB or more above the audiometric threshold. In such a case, the result at 2 kHz could be checked using a TEN level of 90 dB HL. Overall, the results suggest that this patient has a dead region extending f rom 1.5 kHz upwards.

D-0004576-Q – 2022/05 Affinity/Equinox2.0 – Additional Information Page 140
1.18 Appendix 2
1.18.1 Masking help/automasking quick guide Masking help Interacoustics masking help is available to make it easier to decide on a safe and correct masking intensity. When masking help is activated, a status light on channel 2 indicates if masking is applied correctly.
Masking help is activated by selecting the icon with the mask.
Gray indicates that the masking help is not active.
Green indicates that masking is correctly applied. Optionally, the masking help can give a suggested masking level. The example here shows that 85 dB, but also 75dB is in within the safe masking range.
Amber indicates that masking is recommended dif ferently. There is either too much or too little masking.
Purple indicates that masking would be recommended but is practically impossible.
Recommendations
• Because several masking intensities will usually be correct, experienced audiologists are recommended to use the masking help without displaying the recommended masking level.
• When measuring the second ear, more information becomes available, and it is not guaranteed that the earlier measurements are still correct. By measuring the best ear f irst and completing air conduction on both ears before measuring bone conduction, most errors can be avoided.
• Clinicians do of ten not apply masking for bone conduction in the instance where the air-bone gap is less than 10 dB in the better ear. Against general practice, masking help will always recommend that masking is needed in these cases.
Automasking Interacoustics auto masking is available to ease the ef fort required to mask with correct masking levels. When auto masking is enabled, channel 2 is controlled by the system and is set to the appropriate intensity level.
Auto masking is activated by selecting the icon that shows the mask with letter A.
Green indicates that masking is correctly applied.
Amber indicates that masking is recommended louder, and that extended range needs to be activated to allow setting channel 2 to the correct level.
Purple indicates that masking would be needed but is practically impossible.

D-0004576-Q – 2022/05 Affinity/Equinox2.0 – Additional Information Page 141
Recommendations • Be aware that patients require proper instructions before audiometry with masking is undertaken.
The switching on and of f the masking noise may be uncomfortable to some patients and cause them to become more fatigued. In some cases (when testing young children, some elderly patients or dif f icult to test patients), it is recommended not to use masking because confusion about the application of masking noise may lead to false responses.
• When measuring the second test ear, more information becomes available, and it is not guaranteed that the earlier measurements are still correct. By measuring the best ear f irst and completing air conduction on both ears before measuring bone conduction, most errors can be avoided.
• Be careful when storing thresholds where masking was not possible. Masking not possible means that the risk for crossover hearing is high. In these cases, it is recommended to store a no-response at the loudest intensity where masking was still possible (by pressing the N key).
Additional information The masking help calculates answers to the following questions.
• Is masking required? • Is the masking level too low? • Is the masking level too high? • Is masking impossible?
Terminology AC AC test ear ACc AC contra BC BC test ear BCc BC contra IaA Minimum interaural attenuation IaAc Minimum interaural attenuation contra transducer Dial Dial setting test ear Dialc Dial setting contra (masking level) Is masking required? Masking is recommended when the presentation at the test ear leads to a response due to detection by the contralateral ear, or in a formula: Dial – IaA ≥ lowest of ACc and BCc Is the masking level too low? The applied masking level is too low when the applied masking level does not match the intensity at which the test signal is heard in the contralateral ear, or in a formula: Dialc – (ACc – BCc) < Dial – IaA Is the masking level too high? The applied masking level is too high when the masking level is so loud that it potentially is heard by the test ear, or in a formula: Dialc – IaAc ≥ Dial – (AC – BC) Is masking impossible? Masking is not possible when the needed masking level results in overmasking at the same time: Dial + (ACc – BCc) – IaA ≥ Dial – (AC – BC) + IaAc or when the needed masking level is higher than the maximum level of the masking transducer: Dial + (ACc – BCc) – IaA > maximum available Dialc Recommended masking intensity The masking help can indicate a recommended masking intensity. If masking is indeed required and possible, the recommended masking intensity is given by the minimum required masking level plus a f ixed preferred amount: Recommended Dialc = Dial – IaA + (ACc – BCc) + preferred additional amount

D-0004576-Q – 2022/05 Affinity/Equinox2.0 – Additional Information Page 142
The recommended masking level is adjusted for values that cannot be reached by the masking transducer due to maximum values. When the auto masking feature is used, masking intensities are set to the recommended intensity. Of course, if “extended range” is not switched on, the masking intensities are thereby limited accordingly. Frequency specific inter-aural attenuation The default inter-aural attenuations used by the masking help are f requency specif ic and can be customized in the setup. The following table shows the default inter-aural attenuation values (IaA). These are partly based on recommendations f rom the Handbook of Clinical Audiology33 and are otherwise slightly more conservative than recent publications and will therefore allow for appropriate decision making.’
Recommendations
• Experienced audiologists are recommended not to use the option of viewing a suggested masking level.
• The masking help indicates if masking is performed correctly with the information given at the time of the measurement. When measuring the second ear, more information becomes available, and it is not guaranteed that the earlier measurements are still correct. By measuring the best ear f irst and completing air conduction on both ears before measuring bone conduction, most errors can be avoided.
• Although clinicians do of ten not apply masking for bone conduction in the instance where the air-bone gap is less than 15 dB in the better ear, it can be recommended to apply masking to make the measure ear specif ic. Despite that experienced clinician would disagree, the masking help will in these cases recommend that masking is needed. (This f igure illustrates such situation.)
33 Jack Katz et al. (2002), Handbook of Clinical Audiology fourth edition, Williams & Wilkins

D-0004576-Q – 2022/05 Affinity/Equinox2.0 – Additional Information Page 143
1.19 Technical specifications of the AC440 software Medical CE-mark: The CE-mark in combination with MD symbol indicates that
Interacoustics A/S meets the requirements of the Medical Device Regulation (EU) 2017/745 Annex I Approval of the quality system is made by TÜV – identif ication no. 0123.
Audiometer standards: Tone: IEC60645-1/ANSI S3.6 Type 1 Speech: IEC60645-2/ANSI S3.6 Type A or A-E
Transducers & calibration: Calibration information and instructions are in the Service manual. Check the accompanying Appendix for RETSPL levels for transducers
Air conduction DD45 ISO 389-1 2017, ANSI S3.6-2018 Headband Static Force 4.5N ±0.5N TDH39 ISO 389-1 2017, ANSI S3.6-2018 Headband Static Force 4.5N ±0.5N HDA300 PTB report 1.61.4066893/13 Headband Static Force 8,8N ±0.5N DD450 ISO 389-8 2004, ANSI S3.6-2018 Headband Static Force 10N ±0.5N HDA280 PTB report 2004 Headband Static Force 5N ±0.5N E.A.R Tone 5A ISO 389-2 1998, ANSI S3.6-2018 IP30 ISO 389-2 1998, ANSI S3.6-2018 Bone conduction Placement: Mastoid B71
B81 ISO 389-3 2016, ANSI S3.6-2018 Headband Static Force 5.4N ±0.5N ISO 389-3 2016, ANSI S3.6-2018 Headband Static Force 5.4N ±0.5N
Free field ISO 389-7 2005, ANSI S3.6-2010 High frequency ISO 389-5 2004, ANSI S3.6-2010 Effective masking ISO 389-4 1994, ANSI S3.6-2010 Patient response switch: Handheld push button. Patient communication: Talk Forward and Talk Back. Monitor: Output through external earphone or speaker. Stimuli: Pure tone, Warble tone, NB, SN, WN, TEN noise Tone 125-20000Hz separated in two ranges 125-8000Hz and 8000-20000Hz.
Resolution 1/2-1/24 octave. Warble tone 1-10 Hz sine +/- 5% modulation Wave file 44100Hz sampling, 16 bits, 2 channels Masking Automatic selection of narrow band noise (or white noise) for tone
presentation and speech noise for speech presentation. Narrow band noise: IEC 60645-1:2001, 5/12 Octave f ilter with the same centre f requency
resolution as pure Tone. White noise: 80-20000Hz measured with constant bandwidth Speech Noise. IEC 60645-2:1993 125-6000Hz falling 12dB/octave above 1KHz +/-5dB Presentation Manual or Reverse. Single or multiple pulses. pulse time adjustable f rom
200mS-5000mS in 50mS steps. Simultaneous or alternating. Intensity Check the accompanying Appendix for maximum output levels Steps Available Intensity Steps is 1, 2 or 5dB Accuracy Sound pressure levels: ± 2 dB
Vibration force levels: ± 5 dB Extended range
function If not activated, the Air Conduction output will be limited to 20 dB below maximum output.
Frequency Range: 125Hz to 8kHz (Optional High Frequency: 8 kHz to 20 kHz) Accuracy: Better than ± 1 %
Distortion (THD) Sound pressure levels: below 1.5 % Vibration force levels: below 3 %.

D-0004576-Q – 2022/05 Affinity/Equinox2.0 – Additional Information Page 144
Signal indicator (VU) Time weighting: 350mS Dynamic range: -20dB to +3dB Rectif ier characteristics: RMS Selectable inputs are provided with an attenuator by which the level can be adjusted to the indicator reference position(0dB)
Storing capability: Tone audiogram: dB HL, MCL, UCL, Tinnitus, R+L Speech Audiogram: WR1, WR2, WR3, MCL, UCL, Aided, Unaided, Binaural, R+L.
Compatible software: Noah 4, OtoAccess® and XML compatible

D-0004576-Q – 2022/05 Affinity/Equinox2.0 – Additional Information Page 145
2 REM440
2.1 About REM440 The REM440 is a user-f riendly and intuitive Real-Ear Measurement sof tware which enables you to satisfy your Hearing Aid verif ication requirements. A great advantage is the f lexibility which permits the creation of an unlimited number of personalized test f lows or “test protocols” for different purposes and/or for different audiologists working in the same clinic. This enables each individual clinician to setup the module exactly the way they wish including the specif ic tests, stimuli, and settings they prefer. These personal test protocols can swif tly and easily be chosen at any time accommodating the need for speed in a busy clinic. The REM440 also allows you to make individual print layouts, keep reports electronically and compare actual curves to previous sessions. These numerous setup options can be very helpful and time saving in the clinic. In addition to the setup functions, the counselling tool Visible Speech Mapping (VSPM440)34 can also be added to the REM440. This helps both client and relatives to get a better understanding of the benef its of the hearing aids, the ef fects of their hearing impairment and how the hearing aids can improve their quality of life. 2.2 REM440 tests The REM440 contains the following tests: • REUR (Real-ear Unaided Response)/REUG (Real-ear Unaided Gain) • REAR (Real-ear Aided Response)/REAG (Real-ear Aided Gain) • REIG (Real-ear Insertion Gain) • RECD (Real-ear to Coupler Dif ference) • REOR (Real-ear Occluded Response)/REOG (Real-ear Occluded Gain) • Input /Output • Directionality • Visible Speech Mapping • FM Transparency Verif ication35 • Ear Level FM-only REM test36
34 Visible Speech Mapping (VSPM440) requires an additional software license. 35 Based on the American Academy of Audiology Clinical Practice Guidelines for Remote Hearing Assistance Technologies for Children and Youth from Birth to 21 Years 36 Based on the American Academy of Audiology Clinical Practice Guidelines for Remote Hearing Assistance Technologies for Children and Youth from Birth to 21 Years

D-0004576-Q – 2022/05 Affinity/Equinox2.0 – Additional Information Page 146
2.3 Launching REM440 The REM440 module can be launched and operated under Noah and OtoAccess® databases. It is also compatible with other patient management systems which have Noah embedded. Ensure that the Af f inity/Equinox is powered on and connected to your PC before opening the sof tware suite. If the hardware is not detected, the Af f inity Suite will open but it will run in Simulation mode. This is identif iable by the below icon in the lef t of the screen. If the unit is connected then the second icon below will show, indicating a unit is present which it is connected to.
Once the Suite has opened, please click on the tabe titled ‘REM’ on the right of the screen.
2.3.1 Launching REM440 from Noah4: If you are using HIMSA’s Noah 4, the Af f inity Compact software will install itself automatically in the menu bar on the start page, along with all the other sof tware modules. For further instructions about working with Noah please see the Noah operation manual.
2.3.2 Launching REM440 from OtoAccess®: For further instructions about working with OtoAccess®, please see the OtoAccess® operation manual.

D-0004576-Q – 2022/05 Affinity/Equinox2.0 – Additional Information Page 147
2.4 The REM screen elements The following section describes the elements of the REM screen:
Menu provides access to File, Edit, View, Mode, Setup, and Help.
Print button will print the test results using the selected print template. If no print template is selected the results currently displayed on the screen will be printed.
Save & New session button saves the current session in Noah or OtoAccess® and opens a new one.
Save & Exit button saves the current session in Noah or OtoAccess® and exits the Suite.
Change Ear button allows you to toggle between right and lef t ear. Right click on the ear icon to view both ears. NOTE: Binaural REM measurements can be performed when both ears are viewed (in both REIG measures and REAR). The binaural feature enables the f itter to view the binaural right and lef t measurements simultaneously
Toggle between Single and Combined Screen button toggles between viewing one or multiple measurements in the same REM graph.
Toggle between Single and Continuous Measurement button toggles between running a single sweep or having a test signal running continuously until pressing STOP.
Freeze Curve allows for taking a snapshot of a REM curve when testing with broadband signals. In other words, the curve f reezes at a particular moment while the test continues. Note that if too many curves are f rozen on the screen not all will be saved in Noah due to imposed limitations.

D-0004576-Q – 2022/05 Affinity/Equinox2.0 – Additional Information Page 148
List of Protocols allows you to select a test protocol (default or user def ined) to use in the current test session.
Temporary Setup button allows for making temporary changes to the selected test protocol. The changes will be valid for the current session only. Af ter making the changes and returning to the main screen, the name of the test protocol will be followed by an asterisk (*).
List of Historical Sessions accesses previous real-ear measurements obtained for the selected patient, for comparison or printing purposes.
Toggle between Lock and Unlock the Selected Session f reezes the current or historical session on the screen for comparison to other sessions.
Go to Current Session button brings you back to current session.
Toggle between Coupler and Ear button allows you to toggle between real-ear and coupler mode. Note: This icon only becomes active if a predicted or measured RECD is available.
Report Editor button opens a separate window for adding notes to the current session. Note that af ter saving the session, no changes can be made to the report outside of the save date.
Single Frequency button is a test that lets the f itter play a single f requency warble tone. Once clicked, the exact f requency, input and output can be seen on the graph. The f requency can be adjusted up and down by using the Right and Lef t arrows on the keyboard. Click on the button to turn it on and click on it again to turn it of f .
UCL (Uncomfortable Levels) Adjustment To limit the system’s signal intensity while measuring the MPO during a Real-Ear situation, the UCL button can be activated. Once activated, a red line will appear on the graph and the system will stop measuring if this UCL level is reached. This red line can be adjusted with the slider. NOTE: UCL thresholds must be entered on the audiogram for the patient specif ic UCL red line to appear when the UCL button is active. If no ULL’s exist a f lat line will be available to the user. To deactivate this feature, press on the UCL button again.
On Top Mode button converts the REM440 into an on top window that includes only the most essential REM features. The window is automatically placed on top of other active sof tware programs such as the relevant hearing aid f itting software. Whilst adjusting the gain handles in the f itting software, the REM440 screen will always stay on top of the f itting screen allowing for easy curve comparison.

D-0004576-Q – 2022/05 Affinity/Equinox2.0 – Additional Information Page 149
To return to the original REM440 press the red cross in the upper right-
hand corner.
Tube calibration button activates the tube calibration. Before measuring it is recommended to calibrate the probe tube. This is done by pressing the calibration button. Follow the instructions appearing on the screen (see screen below) and press OK. The calibration will then automatically be performed resulting in the curve below. Note that the calibration is sensitive to noise and the clinician should therefore ensure that the room is quiet whilst calibrating.
Simple View/Advanced View buttons toggle between an advanced screen view (including the test and f itting prescription information on the right-hand side) and a simpler view with a larger graph only.

D-0004576-Q – 2022/05 Affinity/Equinox2.0 – Additional Information Page 150
Normal and Reversed Coordinate System buttons enable you to toggle between reversed and normal graph displays. This may be helpful for counselling purposes since the reversed view look more like the audiogram and may therefore be easier for the client to comprehend when explaining his/her results.
Insert/Edit Target button allows you to type in an individual target or edit an existing one. Press the button and insert the preferred target values in the table as illustrated below. When satisf ied click OK.
Table View button provides a chart view of the measured and target values.
Show Cursor on Graph locks the cursor to the curve, displaying the f requency and intensity at any given point along the measure curve.
Use Opposite Reference Microphone lets the f itter use a reference microphone is on the opposite to the one in which the probe measurement microphone is in. To use this feature, position the probe tube in the patient’s ear, with the hearing aid in. Position the other reference microphone on the other patient’s ear. By pressing on this button, the reference mic on the opposite side is the one be used during the measurement. This type of scenario is of ten used in CROS and BiCROS f ittings. Single Graph lets the f itter view the binaural mesurement in one graph, overlaying the curves f rom the lef t and the right ear on top of one another. Delta values display values at the bottom of the graph informing about the dif ference between measurement curve and target.

D-0004576-Q – 2022/05 Affinity/Equinox2.0 – Additional Information Page 151
Stimulus Selection allows for selecting a test stimulus.
Monitor: If you wish to listen to the amplif ied stimulus through a monitor.
1. Connect a monitor headset to the monitor output on the hardware. It is recommended to use only a monitor headset which is approved by Interacoustics.
2. Tick the Monitor check box.
3. Use the slider to turn the sound level up and down. Note that the sound f rom the monitor may be very sof t (compared to the audiometry monitoring). It is louder for audiometry because the audiometric equipment is producing the signal that is monitored. In REM440 the hearing instrument produces the monitored signal meaning that it cannot be controlled by the equipment. External sound: You can present an external sound through for example a CD player if you have a piece of music/speech you wish to use. This may have a strong ef fect for counselling purposes.
1. Connect the CD player to the CD1 input on the hardware. 2. Press START in the sof tware and then tick the External sound
check box. The external sound will then play with the signal. 3. Use the slider to turn the sound level up and down.
Note that in Visible Speech Mapping you can select Live Voice and then play an external sound. This means that you will have the external sound alone with nothing (except f rom your own voice) interfering.

D-0004576-Q – 2022/05 Affinity/Equinox2.0 – Additional Information Page 152
Current Protocol is listed in the lower lef t-hand corner. This highlights the test which you are currently performing and the other tests in the battery. The checkmarks indicates that a curve has been measured. Test protocols can be created and adjusted in the REM440 setup. Colour on each test button indicates the colour selected for each curve.
Start/Stop button initiates and ends the current test. Note that af ter pressing START the text on the button will change to STOP.
The Graph shows measured REM curves. The X-axis shows the f requency, and the Y-axis shows the intensity of the test signal. Gain/Response View allows for toggling between viewing the curve as a gain or response curve. Note that this option is not available for REIG. Measurement Type is indicated above the graph, with a right/lef t indication. In this example the REIG is displayed for the right ear. Change the Input Level using the slider on the right-hand side. Scroll Graph Up/Down on the lef t-hand side allows for scrolling the graph up or down ensuring that the curve is always visible in the middle of the screen.
Fitting Prescription and related details can be adjusted on the right-hand side of the screen. Select your preferred f itting prescription in the upper dropdown list. Choose between Berger, DSL m[i/o], Half Gain, NAL-NL1, NAL-NL2, NAL-R, NAL-RP, POGO1, POGO2, Third Gain, or ’Custom’ if you have edited your target with the Edit feature. Target shown will be calculated based on the selected f itting prescription and the audiogram and can be shown as REIG and/or REAR targets. If no audiogram has been entered into the audiogram screen, no targets will be displayed. Note that f itting prescription settings (such as Age and Client type) will dif fer depending on what f itting prescription is selected.
Measurement Details of the selected curve are displayed as a table on the right-hand side of the screen.

D-0004576-Q – 2022/05 Affinity/Equinox2.0 – Additional Information Page 153
A Curve Comment for each curve can be typed into the comment section on the right-hand side. Select a curve using the curve tag boxes under Curve display options and write a comment in the comment section. The comment will then appear in the comment section whenever the curve is selected.
Curve Display Options are found in the lower right-hand corner. If you have measured more curves of the same type (e.g., REIG curves), they will be listed by their input level. Tick the ones that are to be displayed on the graph. Right clicking on the input level in the curve display will give the f itter various options.
Enable/Disable Icons This feature lets the f itter customize which buttons appear on the f ront of the main REM440 screen. When all the items are selected with the checkmark, all buttons will be displayed on the f ront screen. Removing the checkmark f rom the checkbox under the icons will remove those icons f rom the main REM440 screen. To access this menu: Go to Menu → Setup → General Setup and click on the Enable/disable icons button to customize
Hardware indication picture: The picture indicates whether the hardware is connected. When opening the Suite, the system will search for the hardware. If it does not detect the hardware, then it will automatically resume in Simulation mode.

D-0004576-Q – 2022/05 Affinity/Equinox2.0 – Additional Information Page 154
2.5 Background on real-ear measurements using REM440 When performing real-ear measurements there a certain things you should keep in mind to obtain the best possible result. Some of these will inevitably also inf luence the precision of the curve obtained. This section will walk through some important tips and tricks to remember when doing real-ear measurements using the REM440.
2.5.1 Required items • The Af f inity2.0/Equinox2.0 hardware (if using Equinox2.0, note that you need an external loud speaker). • The REM440 sof tware. • An In-situ headset (including a reference microphone). • A probe tube microphone.
Note: If performing the RECD a couple of further parts are needed.
1) The Af f inity 2.0 has a built-in loudspeaker in the lid through which the selected stimulus is presented. The lid is opened by pressing the grey button on the f ront of the instrument. If using the Equinox2.0 plug the external loud speaker into the hardware and place it on the table in f ront of the client.
The client should be seated in ½ - 1 meter’s distance facing this loudspeaker as illustrated above. This distance is a compromise between measurement precision and client comfort. The client shall be in this test position during all real-ear measurements. If using the Equinox2.0 an external speaker is required to present stimulus.
2) The real-ear measurements are controlled through the REM440 sof tware. Launch the sof tware as explained at the beginning of the REM section in this document.
½ - 1 meter
Open here

D-0004576-Q – 2022/05 Affinity/Equinox2.0 – Additional Information Page 155
3) Mount the probe tube on the small microphone on the in-situ headset and place it on the ear of the client using either the plastic headband or slide-on ear loop. Plastic headband (click it on the plastic headband and hang it over the ears of the client).
Slide-on ear loop (slide on as shown below and hang it on the ear of the client).
The measurement tool on the headset allows for easy measurement of probe tube insertion depth and the probe tube stabilizer can be used to hold the probe in place. Measurement tool Probe tube stabilizer
Perform otoscopy and carefully insert the probe tube into the ear canal. Distance f rom ring to probe tube tip should be approximately 31mm for males, 28mm for females, and 20-25 for children.
Attach the probe tube here

D-0004576-Q – 2022/05 Affinity/Equinox2.0 – Additional Information Page 156
4) The reference microphone on the headset monitors the amplitude of the signal reaching the hearing aid f rom the loudspeaker. If the input level is louder or sof ter than the desired level the reference microphone will turn the volume up or down accordingly.
2.5.2 Calibration Sound is af fected when passed through a small probe tube. This is considered by the probe tube calibration. The calibration process involves aligning the reference microphone and probe tube microphone to account for any dif ferences. This ensures that once positioned the dif ferences which are occurring are not caused by the hardware. The calibration procedure should be performed at least once a day or per patient when changing the tube.
• Perform the tube calibration by clicking the calibration button in the f ront screen • A pop-up will then ask whether the calibration should be performed with the SPL probe used for
RECD measure. You should always choose “Regular Probe”, unless the SPL probe is being used for the RECD measurement (as per section 2.7.4.2)
Reference microphone

D-0004576-Q – 2022/05 Affinity/Equinox2.0 – Additional Information Page 157
• Follow the instructions appearing on the screen:
Note: If using an Af f inity2.0 place the in-situ headset in f ront of the internal loudspeaker (as shown above for the Equinox2 external loudspeaker) and press OK.
2.5.3 Gain versus response view To understand the various real-ear measurement terms you should be aware of the way the real-ear acronyms are constructed. Real-ear terms all end with either a “R” (e.g., REUR) or a “G” (e.g., REUG) “R” refers to Response Response measures consist of two things:
a) What you measure in the ear
b) The input you send into the ear (e.g., 50 dB SPL)
In other words, the response is the total measure of output in SPL at the eardrum (e.g., REUR) “G” refers to Gain Gain (e.g., REUG) is calculated by subtracting the input (in dB) you used for the response measure across f requency. (Response – input = Gain) This means that the input level used to generate the response is not included in the measurement result. If you for example measure a value of 60 dB SPL in the ear canal at 2000 Hz when presenting a stimulus of 50 dB the gain is 10 dB.
Frequency (Hz) 250 500 750 1000 1500 2000 3000 4000 6000 8000 REUR 52 52 53 58 59 60 67 63 58 52 - input REUG
50 50 50 50 50 50 50 50 50 50
Total 2 2 3 8 9 10 17 13 8 2

D-0004576-Q – 2022/05 Affinity/Equinox2.0 – Additional Information Page 158
The REM440 allows for showing real-ear measurements as both gain and response curves. The gain curve is automatically generated f rom the response curve which allows you to choose which view you prefer using the Gain and Response radio buttons below the graph:
2.5.4 Real-ear measurements on open fittings The increasingly popular open f it hearing instruments have many advantages relating to comfort, sound quality, and cosmetics; however, they introduce implications when it comes to Real-ear verif ication. In traditional Real-Ear Measurements a reference microphone supervises the amplitude of the signal reaching the hearing instrument f rom the loudspeaker. If the input level is louder or sof ter than the selected level, the reference microphone will decrease or increase the volume of the stimulus accordingly. This ensures that the correct level enters the ear canal (Dillon 2001). When performing Real-Ear Measurements on an open f itting, some f requencies may leak out of the ear canal and into the reference microphone causing the input level to be reduced to compensate. This results in an erroneous curve below the target!
This issue is solved by using Calibrate for open fit.

D-0004576-Q – 2022/05 Affinity/Equinox2.0 – Additional Information Page 159
2.5.4.1 Calibrate for open fit Calibrate for open f it is the best way to cope with open f ittings. Calibrate for open f it is done with the hearing aid in place muted or switched of f . During a stimulus presentation the reference microphone supervises the amplitude of the signal. It records how much of the signal leaks out of the ear canal at each f requency and adjusts the input level accordingly. This keeps the input at the correct level across the f requency range. Af ter the measurement is done the reference microphone switches of f . The adjustments across the f requency range will now be remembered and used as correction values for the following aided Real-Ear Measurements. Since the reference microphone does not monitor the input level anymore the client MUST avoid movements during the aided Real-Ear Measures and the patient MUST maintain the same position throughout the session until the hearing aid has been programmed. If movements occur precision is compromised, and the measures will not be accurate. Note: Calibrate for Open Fit can be added as a part of the individual test protocol in the REM440 setup the same way that other tests are added (see section 2.6). Calibrate for open fit procedure:
1. Select Calibrate for open f it in the main screen. 2. Carefully insert the hearing aid without changing the position of the probe tube. 3. Press START and follow the instructions in the pop-up. Ensure that it is MUTED/switched off! 4. Press OK to continue with the measure.
The visual appearance of Calibrate for open f it will dif fer depending on the selected stimulus. Measurements performed af ter Calibrate for open f it needs to be performed with the same stimulus as was used in Calibrate for open f it. However, you can now do multiple Calibrate for open f its. Af ter performing these, only the stimuli that have been used for the Calibrate for open f its are selectable for the aided measures (E.g., REIG, REAR).
Warble tone
ISTS

D-0004576-Q – 2022/05 Affinity/Equinox2.0 – Additional Information Page 160
In this example when going to REIG/REAR the system will show Warble Tone and ISTS in the stimulus dropdown.
2.5.5 Probe placement It is important that the probe is placed correctly in the ear of the client (e.g., within 5 mm of the eardrum). Approximate insertion depths Females 28 mm past the inter-tragal notch Males 30 mm past the inter-tragal notch Children 20-25 mm past the inter-tragal notch
(depending on child age) Use the black marking ring on the tube to help place the probe at the right depth in the ear canal. If uncertain the probe placement tool in the REM440 assist in inserting the probe correctly. This is accessed under Menu/Mode/Probe Placement. When the red column appearing on the screen is as low as possible, mark this position on the probe and add 10 mm. Correct probe placement will then be obtained (Sullivan 1988). Click STOP to exit the probe placement tool.
2.5.6 Stimuli for real-ear measures Choosing the correct stimuli for the purpose is extremely important as it is the basis of a good measurement with a valid result. Digital hearing aids automatically adjust the amplif ication depending on the input. This feature, however, cannot be ref lected in a real-ear measurement unless a realistic and dynamic test stimulus like speech for example is used (Fabry 2004).
2.5.6.1 Tone stimuli For many years pure tones (sinusoids)/warble tones were the primary signals used for real-ear as well as coupler verif ication. Tone signals are “simple” signals and only one f requency is presented at a time. Therefore, real-ear measurements performed with tone signals do not ref lect advanced signal processing (Kuk & Ludvigsen 2005).

D-0004576-Q – 2022/05 Affinity/Equinox2.0 – Additional Information Page 161
2.5.6.2 Speech stimuli/ISTS Speech is likely to be the most important signal to the hearing aid user in his or her daily life. Therefore, if you wish to verify if speech sounds are audible there is no better stimulus than speech. Furthermore, speech signals challenge the hearing aid since they have quick change in amplitude, f requency, and phase. ISTS (International Speech Test Signal) is an internationally recognised test signal. It was created based on the need for a standard test stimulus that included all the relevant properties of speech and allowed for reproducible measurement conditions. It is created f rom natural recordings of speech which is non-intelligible due to remixing and segmentation. The signal ref lects a female speaker for six dif ferent mother tongues (American English, Arabic, Chinese, French, German, and Spanish) reading “The north wind and the sun”. The ISTS is shaped according to the LTASS (Long Term Average Speech Spectrum) standards (Holube et al. 2007).
2.5.6.3 Composite signals/ICRA Artif icial signals without signif icant variation in intensity and f requency can also be used to test hearing aids in the f requencies of speech. These are called speech spectrum shaped composite signals and have the same long-term spectral characteristics as speech. The advantages in such signals are that you can test many f requencies in a short time and that interactions among f requencies can be tested. The ICRA signals (International Collegium of Rehabilitative Audiology) are examples of composite signals. They are a group of test signals developed by the HACTES group (Hearing Aid Clinical Test Environment Standardisation) to be able to do reliable measurements on non-linear digital hearing aids. They represent several speech weighted noise signals composed with spectral and temporal characteristics like those that are found in speech signals and babble noise. (www.icra.nu).
2.5.6.4 What stimulus to choose? Which stimulus to select depends on your focus and the individual clients’ complaints. If , for example, you are seeing a client who complains about not being able to hear his wife, you may want to use the ISTS. If the client is having trouble when more than one person is speaking, the ICRA 6pbl (or one of the other signals with multiple people speaking) may be selected. If you wish to look at the ef fects of - noise reduction, a noise signal such Pink Noise may be the appropriate choice.

D-0004576-Q – 2022/05 Affinity/Equinox2.0 – Additional Information Page 162
Note that your choice has an impact on your result as illustrated below: Note: The signals Male Speech, Female Speech, and ISTS are shaped according to LTASS standards.
2.5.6.5 Presenting a stimulus The REM440 stimuli can be selected f rom the main screen using the stimuli selection dropdown
For continuous stimulus presentation, click the continuous button. When presenting continuously the curve may be f rozen in a certain position using the freeze curve button:
Note: If you have done Calibrate for open f it, only the signals used for this calibration are available in the stimulus selection dropdown for aided measures (e.g., REIG, REAR)
IST
ICRA Pink
Warble

D-0004576-Q – 2022/05 Affinity/Equinox2.0 – Additional Information Page 163
2.5.7 Referencing
Referencing is the term used to describe the communication between the REM speaker and the Insitu REM headset reference microphone. This communication ensures that the stimulus level specif ied in the REM sof tware is the correct stimulus level achieved at the patients’ ear. As an example, if the level specif ied in the sof tware is set to 65dB and the REM speaker is playing at 55dB then the Insitu reference microphone will detect this and communicate to the speaker that it needs to increase the stimulus level by +10dB to achieve the specif ied stimulus level. There are two dif ferent referencing procedures which can be performed using your Af f inity Compact/Affinity 2.0/Equinox 2.0/Callisto. They are according to the following:
• Modif ied Pressure with Concurrent Equalisation (MPCE)
This method actively monitors and controls the level of the REM stimulus as it is running. Therefore, if the stimulus level drops during the measurement the speaker will increase the intensity, so the correct level is applied. This method is applied to the following signals:
- Pure Tone - Warble - Pink Noise - White Noise - NB Noise
• Modif ied Pressure with Stored Equalisation (MPSE)
This method performs the referencing process at the beginning of the measurement only and the level is set before the REM stimulus is played. This is done because the signals used for this method are complex and do not maintain the same f requency content at dif ferent time points. Note: for signals which are being referenced by the MPSE method, the stimulus level will not increase/decrease should the level at the Insitu reference microphone not match that which is set in the sof tware once the REM stimulus begins to play. It is because of this that you must maintain the patients’ position during the measurement. The referencing procedure is still played before every stimulus though.

D-0004576-Q – 2022/05 Affinity/Equinox2.0 – Additional Information Page 164
This method is applied to the following signals: - International Speech Test Signal (ISTS) - ICRA stimuli - IF Noise - Male Speech - Female Speech - Custom REM sound f iles
2.5.8 Vocal effort We apply a vocal ef fort transform to our stimuli to result in a more life-like stimulation. When we apply these transforms, they are being supplied by the DSL algorithm.
Vocal ef forts are included which results in the input level range being limited depending on the start level. If the measurement is set to start at for example a normal input level (e.g., 65 dB) the input levels slider can only be moved within normal vocal ef fort limits while measuring (40 – 70 dB). For a raised input level, the slider can be moved f rom 71 – 74 dB. If the measurement is set to start at a loud input level the slider can only be moved within 75 – 82 dB and if the measurement is set to a shout level the input level slider can be moved f rom 83 dB and above.
2.5.9 Working with fitting targets The REM440 includes many possibilities ensuring a precise target calculation based on the data available on the individual client.
2.5.9.1 Calculating the target To show a target in the REM440 screen an audiogram must be present in the AC440/audiogram screen. This can be obtained in two ways:
4) Enter the AC440/Audiogram screen by clicking the AUD tab to the right and enter the thresholds manually while in Current Session .
OR
5) If an audiogram has already been saved in Noah, it can be retrieved in the Session List where all historical audiograms are listed by date.
Af ter selecting/entering an audiogram go to the REM screen.

D-0004576-Q – 2022/05 Affinity/Equinox2.0 – Additional Information Page 165
2.5.9.2 Choosing a fitting prescription Fitting targets can be selected in the Fitting Prescription dropdown list. A f itting target can be described as a recipe for how to f it the hearing aids. Today, the most used generic f itting targets for non-linear hearing aids are the DSL m[i/o] developed at the University of Western Ontario in Canada and the NAL-NL1/NAL-NL2 developed by National Acoustics Laboratories in Australia. The DSL m[i/o] is of ten used in paediatric f ittings and has been verif ied on children. However, recent versions focus on adult f ittings as well. The aim of the DSL m[i/o] is to provide the hearing aid user with an audible and comfortable signal at each f requency region. The knee-point is low allowing the client to perceive many sof t sounds. This may be an advantage when using the input for speech development. NAL-NL1/NAL-NL2 has a higher knee-point and focuses the amplif ication primarily on speech which is likely to be the most important reason for the client to acquire hearing aids. It aims to maximize speech intelligibility while maintaining overall loudness at a level like that perceived by a normal-hearing person listening to the same sound (Dillon 2001). Note: the selections for each f itting prescription such as Age, Client type and so on dif fer depending on which f itting prescription is selected.
2.5.9.3 DSL options Name: Select DSL v.5.0. Note that it is version implemented is DSL mi/o v5.0a.
Age: Age: Select the age of your client. This is relevant whenever a predicted RECD/REUR is used since these are highly dependent on ear canal size which varies across ages. Note that when the audiogram is measured with insert phones, the RECD is used in the conversion f rom dB HL to dB SPL. The RECD thereby inf luences the thresholds which will result in a target change.
Client type: DSL mi/o v5.0a allows for selecting between a Pediatric or Adult prescription. The two prescriptions are based on the concept that adults and children with hearing loss have distinctly dif ferent preferences for listening level. The DSL mi/o v5.0a algorithm generates dif ferent prescriptions based on client age to take into consideration that adults and children not only require, but also prefer, dif ferent listening levels.
Instrument: Select the type of hearing instrument your client is f itted with. This does not directly af fect the target but the information is saved with the session.
Vent size: Select the vent size your client is f itted with. This does not directly af fect the target but the information is saved with the session.
Transducer: Select the transducer used to obtain the hearing thresholds. The selected transducer will af fect the threshold markings in the SPL-o-gram and thus the target calculation.

D-0004576-Q – 2022/05 Affinity/Equinox2.0 – Additional Information Page 166
Note the option to choose ABR eHL and IA ASSR eHL. ABR thresholds are assumed to be entered in eHL meaning that the system only corrects for the transducer. IA ASSR (Interacoustics ASSR system) corrects the audiogram simultaneously during the ASSR measurement. Therefore, the HL to SPL conversion f rom the REM440 module does not include a transducer correction. When the hearing aid f itting is based on an audiogram obtained with the Interacoustics ASSR, ensure that “IA ASSR eHL” is selected. this will ensure that double compensation is avoided.
Coupler: Select the coupler type used for the RECD. The illustration below shows the dif ferent coupler types (Dillon 2001, pp. 77).
• HA1 – Mold refers using an RECD measured using the client’s own ear mold followed by 2cc coupler measures with an ITE adaptor.
• HA1 – Tip refers using an RECD measured using a foam tip or SPL probe followed by 2cc coupler measures with an ITE adaptor.
• HA2 – Mold refers using an RECD measured using the client’s own ear mold followed by 2cc coupler measures with a BTE adaptor.
• HA2 – Tip refers using an RECD measured using a foam tip or SPL probe followed by 2cc coupler measures with a BTE adaptor (the insert foam tip connects to the in-situ headset the same way as described for HA2 – Mold above).

D-0004576-Q – 2022/05 Affinity/Equinox2.0 – Additional Information Page 167
Note: Remember to indicate the correct coupler type before performing the RECD based 2 cc coupler measures.
(For more information about the DSL mi/o v5.0a please refer to www.dslio.com) s

D-0004576-Q – 2022/05 Affinity/Equinox2.0 – Additional Information Page 168
2.5.9.4 NAL-NL1/NAL-NL2 options Name: Select the NAL-NL1 or NAL-NL2.
Age: Select the age on your client. Research on children’s performance and preference leads us to infer that children on average prefer a few dB more gain than what NAL-NL1 prescribes (Ching et al. 2010). For this reason, the NAL-NL2 prescribes 5 dB more gain across f requency for children under 15 years of age compared to adults. Furthermore, selecting the correct age is important using a predicted RECD/REUR since these are highly dependent on ear canal size which varies across ages.
Gender: Gender can be selected for NAL-NL2 only. Research has shown that males on average prefer 2 dB more gain than females with the same degree of hearing loss (Keidser & Dillon 2006). Consequently, gain is increased by 1 dB for males, and decreased by 1 dB for females.
User level: If using NAL-NL2 indicate whether you are dealing with a New user or an Experienced user. Experienced hearing aid users have been shown to prefer more gain than people being f itted for the f irst time (Keidser et al., 2008). Thus, the NAL-NL2 decreases gain 4 dB for new hearing aid users.
Instrument: Select the type of hearing instrument your client is f itted with. This does not directly af fect the target but the information is saved with the session.
Vent size: Select the vent size your client is f itted with. This does not directly af fect the target but the information is saved with the session.
Transducer: Select the transducer used when obtaining the hearing thresholds. The selected transducer will af fect the thresholds and thereby corrections will be applied to the f itting target.
Note: The NAL-NL2 also distinguishes between tonal and non-tonal languages.
Gain at each f requency depends on importance of each f requency. Low f requencies are more important in tonal language. Tonal languages (such as Mandarin) convey more information with the pitch of speech than do non-tonal languages (like English). Consequently, the low f requencies are given more gain for tonal languages than for non-tonal languages (Dillon et al. 2010). In the REM440 sof tware NAL-NL2 targets will change accordingly when selecting a tonal stimulus in the stimulus selection (e.g., “Speech female JA”). Therefore, the system has no separate dropdown menu for this parameter.
(For more information on the NAL-NL2 prescription procedure please refer to Dillon et al. 2010)

D-0004576-Q – 2022/05 Affinity/Equinox2.0 – Additional Information Page 169
2.5.10 Comparing to the hearing aid fitting software Real-ear measures are of ten compared to the hearing aid manufacturer’s sof tware. You can run the REM440 and f itting software simultaneously within Noah4. If real-ear measures reveal too little or too much gain in some f requency areas, enter the f itting software and adjust gain using the relevant gain controls. When comparing the measured real-ear curve to the hearing aid manufacturer’s f itting software it is important keep in mind certain factors to have a valid comparison. Therefore, remember to check that the parameters used in the f itting sof tware should be the same as in the REM440 module.
1) Ensure that the curve type is the same as simulated in the f itting sof tware (e.g., do not compare an REAG in the REM440 to a REIG in the f itting software).
2) Ensure that the stimulus is the as close as possible to the stimulus simulated in the f itting sof tware. 3) Ensure that the input level is the same as in the f itting software. 4) Ensure that the fitting prescription details in the f itting software are the same as used in the REM440
module.
2.5.10.1 On top mode
The On top mode button converts the REM440 into an on top window that includes only the most essential REM features. It allows for changing stimulus, input level, ear, continuous measurement, and Gain/Response view only. The window is automatically placed on top of other active sof tware programs such as the relevant hearing aid f itting software. While adjusting the gain handles in the relevant f itting sof tware, the REM440 screen will always stay on top of the f itting screen allowing for easy curve comparison.
To return to the original REM440 press the red cross in the upper right-hand corner .

D-0004576-Q – 2022/05 Affinity/Equinox2.0 – Additional Information Page 170
2.5.10.2 Table mode
If graph comparisons are not preferred, you can choose the Table mode button . This may make it easier to compare the measured numerical values and the values in the hearing aid manufacturer’s f itting sof tware.
2.5.10.3 Show cursor on the graph When comparing the graph in the f itting software to the graph in the REM440 the Show Cursor on Graph may be useful. Upon selecting the function, the cursor will highlight the curve and allow you to see the exact measured value at each f requency.

D-0004576-Q – 2022/05 Affinity/Equinox2.0 – Additional Information Page 171
2.5.11 Speech intelligibility index (SII) The Speech Intelligibility Index (SII) is a quality indicator of your hearing aid’s f itting regarding the audibility it can provide. The SII calculation will show the SII value as a percentage against the curve tag of every completed measurement for REUR, REUG, REAR, REAG and REIG in the bottom right corner.

D-0004576-Q – 2022/05 Affinity/Equinox2.0 – Additional Information Page 172
2.5.12 Display peaks and valleys If Display peaks and valleys is ticked for the REM test in the REM440 Setup you will have the view illustrated below. The peaks and valleys are shaped according to the LTASS.
2.5.13 Preconditioning and sweep delay Preconditioning and sweep delay can be set for each test in the REM440 settings (see section 2.6.2)
2.5.13.1 Preconditioning Preconditioning is relevant when using broadband signals for example ISTS/ICRA. It consists of a wideband signal followed by a pure tone just before the selected stimulus is presented. The precondition function allows you to set a certain time before the curve is shown on screen. This will allow the hearing aid algorithms to have time to switch on and stabilise. This has two ef fects – f irst you will avoid the hearing aid being in the process of changing characteristics during the test, and secondly, the hearing aid will in this case be brought into the mode corresponding to the non-linear stimulus.
2.5.13.2 Sweep delay The sweep delay is the time before the next sweep will start when running a continuous measurement using Pure Tone or Warble Tone. Modern hearing aids of ten have advanced algorithms that require a certain reaction time. It is therefore helpful to be able to set individual delays.
Valleys
Peaks

D-0004576-Q – 2022/05 Affinity/Equinox2.0 – Additional Information Page 173
2.5.14 Smoothing a curve Smoothing is a technique where small details in the curve appear to be ironed out. As these details sometimes have a noisy character, smoothing may be preferred. The individual tests can be designed to have smoothing applied in the REM440 setup. Smoothing is applied according to a n/12 octave smoothing method. Whereby the lower smoothing value delivers a higher curve resolution due to inclusion of more data points. Smoothing can also be applied af ter measuring in two ways:
Shif t + up/down arrow keys on the PC keyboard Shif t + the scrolling wheel on the mouse
Examples:
2.5.15 Comparing curves The REM440 also allows for comparing either two historical curves (e.g., two REIG curves) or comparing a historical curve to a currently recorded curve. This may be helpful when having adjusted a hearing aid to see if the new setting is closer to the target. It may also be helpful if f itting two different hearing aids to see which one matches the target better. Note: The Age dropdown list in the Fitting Prescription will not change when going into a historical session. However, target information viewed in the historical session will be based on the audiogram used when the session was saved. Compare curves as follows:
1. Find the f irst curve in the Session list. Historical real-ear measures are listed by date and time when saved.
2. Press Toggle between lock and unlock the selected session 3. Find the second curve in the Session list. This can be either a curve of the current session or a
historical curve.
Smoothing Index 10
Smoothing Index 5
Smoothing Index 0

D-0004576-Q – 2022/05 Affinity/Equinox2.0 – Additional Information Page 174
The two curves are now shown
Note: To avoid error through incorrect comparison, only curves of the same type can be compared! This function is embedded into the system so that you do not need to focus on this and to prevent comparing mistakes.
2.5.16 Managing multiple curves If measuring many curves during the same test session, there are several ways to provide a simpler view or a comparison view showing only the preferred curves on the same graph.
2.5.16.1 Curve display options In the curve display options box, all curves are listed by input level and colour. If many of the same curve type (e.g., REIGs) have been measured tick only the ones that you wish to display on the graph.
Un-ticked curves will be hidden ensuring a less confusing screen view.
Target Historical curve
Curve f rom current session

D-0004576-Q – 2022/05 Affinity/Equinox2.0 – Additional Information Page 175
2.5.16.2 Deleting curves To delete one or all curves right click on the input level marking in the curve display options box. Select Delete to remove the selected curve or Delete all to remove all curves displayed in the graph.
2.5.16.3 Combined screen view If a combined screen is setup you may want to compare to other curves obtained. Press the corresponding button to toggle between single and combined screen: In the combined screen setup, you can decide exactly which curves are to be compared so that pressing the combined screen button results in comparing multiple REAR or REIG measures (see section 2.6.3 for how to do a combined screen setup).
2.5.16.4 Changing the curve colour If having many curves on screen you can change their colours even af ter they are measured. Right click on the preferred curve and choose Change curve colour. The system will then allow for choosing a new colour.

D-0004576-Q – 2022/05 Affinity/Equinox2.0 – Additional Information Page 176
2.6 Clinical application of real-ear measurements using REM440 This section describes all the REM440 real-ear tests. For all measures, please reduce ambient noise as much as possible.
2.6.1 REUR/REUG measurements REUR (Real-Ear Unaided Response): The REUR accounts for the SPL across f requencies measured in the open/unaided ear canal for a given input signal at specif ic measurement point. REUG (Real-Ear Unaided Gain): The REUG accounts for the gain in the unaided ear canal provided solely by the auricle and ear canal. This is obtained by subtracting the input level f rom the REUR.
REUR – input = REUG The REUR/REUG is used in the calculation of REIG (Real-Ear Insertion Gain) The REUR/REUG may also help reveal irregularities in the ear canal. In cases of temporal surgery, for example mastoidectomy, the residual ear canal volume may be much larger than in an average ear. Note: REUR is also known as an Open Ear Response
Test procedure:
1) Open the REM440 module by selecting the REM tab. 2) If needed select a test protocol in the List of Protocols. If you do not select a protocol the system
will automatically select a standard protocol. 3) Explain the procedure to the client. 4) Perform an otoscopic examination. 5) Mount the probe tube on the in-situ headset and place it on the client who should be seated ½-1
meters f rom the speaker. Ensure that the probe tubes are calibrated before placing them in the ear canal (see section 0 about tube calibration).
6) Click on the REUG/REUR button if it is not already marked automatically. A right click on REUG/REUR button allows you to enter the Settings menu, Show a predicted curve, or Change colour of the curve.
7
6
2
8
9
1
10

D-0004576-Q – 2022/05 Affinity/Equinox2.0 – Additional Information Page 177
7) Ensure that the correct Ear is selected
8) Choose the preferred Stimulus in the corresponding dropdown list
9) Select input level using the Input level slider 10) Click START and the REUR/REUG will be performed.
Ensure that the room is quiet whilst the curve is obtained 11) If you wish to use the REUG/REUR for both ears, right click on the curve tag in the Curve display
options and select Transfer to left/right ear.
Note: If running the hearing aid manufacturers f itting software as well, the curve may be saved in Noah4 and retrieved in the f itting software. The f itting target will then be recalculated based on the individual ear canal resonance. These options, however, dif fer f rom manufacturer to manufacturer and will therefore not be outlined in this manual.

D-0004576-Q – 2022/05 Affinity/Equinox2.0 – Additional Information Page 178
2.6.1.1 Predicted REUR When right clicking on the REUG/REUR as described in point 6 above you may choose to use a predicted curve. This may be helpful if having to deal with challenging clients. When clicking Show predicted curve the screen below will appear:
Choose Age and Azimuth angle and click OK.

D-0004576-Q – 2022/05 Affinity/Equinox2.0 – Additional Information Page 179
2.6.1.2 REUG/REUR from a previous session If you have measured the REUG/REUR at an earlier session with the client, the REM440 provides the option to use this historical curve in the current session.
1) Browse for the historical REUG/REUR curve in the session browser:
2) Right click on the curve tag in the Curve display options:
3) Select Transfer to current session. The curve will the automatically appear in the current session.
2.6.1.3 REUR/REUG in both ears view If you wish to compare the REUR/REUG for lef t and right this can be done by right clicking on the Ear icon.
Both ears view (right click)

D-0004576-Q – 2022/05 Affinity/Equinox2.0 – Additional Information Page 180
2.6.2 REAR/REAG measurements REAR (Real-Ear Aided Response): The REAR accounts for the SPL across f requencies for a given signal measured in the ear canal with the hearing aid in place and turned on. REAG (Real-Ear Aided Gain): The REAG accounts for the gain across f requencies for a given input signal measured in the ear canal. This is obtained by subtracting the input level f rom the REAR.
REAR – input = REAG The REAR/REAG is used in the calculation of REIG (Real-Ear Insertion Gain). Furthermore, some f itting prescriptions (such as DSL m[i/o] ) prescribe REAR/REAG targets for some input levels. If the audiogram has been converted f rom dB HL to dB SPL and uses a SPL-O-GRAM, it can quickly be determined whether an input is audible or not. Test procedure:
1) Open the REM440 module by selecting the REM tab. 2) If needed select a test protocol in the List of Protocols. If you do not select a protocol the system
will automatically select a standard protocol. 3) Explain the procedure to the client. 4) Perform an otoscopic examination. 5) Mount the probe tube on the in-situ headset and place it on the client who should be seated ½-1
meters f rom the speaker. Ensure that the probe tubes are calibrated before placing them in the ear canal (see section 0 about tube calibration).
6) Carefully insert the hearing aid without moving the probe tube. Ensure that the instruments are switched on.
7) If f itting an open hearing aid, perform Calibrate for open fit (see section 0). 8) Click on the REAG/REAR button if it is not already marked automatically.
A right click on REAG/REAR button allows you to enter the Settings menu or Change colour of the curve.
10
2
11
8
12
9 1
13

D-0004576-Q – 2022/05 Affinity/Equinox2.0 – Additional Information Page 181
9) Check that the information about client, f itting prescription and hearing aid parameters to the right are correct.
10) Ensure that the correct Ear is selected
11) Choose the preferred Stimulus in the corresponding dropdown list If you have done Calibrate for open f it only the signals used for this calibration are available in the stimulus selection dropdown (see section 0).
12) Select input level using the Input level slider
13) Click START and the REAG/REAR will be performed. Ensure that the hearing aids are switched on and that the room is quiet whilst the curve is obtained.
Note: An REAR90 is added when DSL m[i/o] is selected under Fitting Prescription. Furthermore, a speech banana using the unamplif ied speech spectrum f rom DSL can be viewed by right clicking on the graph. This is, however, only possible for REAR measurements.

D-0004576-Q – 2022/05 Affinity/Equinox2.0 – Additional Information Page 182
2.6.3 REIG measurements REIG (Real-Ear Insertion Gain): The REIG accounts for the gain across f requencies provided by the hearing aid alone. This is obtained by subtracting the REUR from the REAR or the REUG from the REAG.
REAR – REUR = REIG The REIG is most of ten used to verify if a given hearing aid setting is providing an acceptable level of gain compared to the prescribed REIG target. Test procedure:
1) Open the REM440 module by selecting the REM tab. 2) If needed select a test protocol in the List of Protocols. If you do not select a protocol the system
will automatically select a standard protocol. 3) Explain the procedure to the client. 4) Perform an otoscopic examination. 5) Mount the probe tube on the in-situ headset and place it on the client who should be seated ½-1
meters f rom the speaker. Ensure that the probe tubes are calibrated before placing them in the ear canal (see section 0 about tube calibration).
6) Measure the REUG/REUR (see section 0) or select a predicted REUG/REUR (see section 0). Note: Since the REIG is a calculation the system will require that you perform the REUR before performing the REIG.
13
14
9 6
12
2
11 1

D-0004576-Q – 2022/05 Affinity/Equinox2.0 – Additional Information Page 183
A predicted REUR may be selected if the REUR is a part of the individual test protocol (see section 2.6.2.1).
7) Carefully insert the hearing aid without moving the probe tube. Ensure that the instruments are switched on.
8) If f itting an open hearing aid; perform Calibrate for open fit (see section 0). 9) Click on the REIG button if it is not already marked automatically.
A right click on REIG button allows you to enter the Settings menu or Change colour of the curve. 10) Check that the information about client, f itting prescription and hearing aid parameters to the right
are correct.
11) Ensure that the correct Ear is selected
12) Choose the preferred Stimulus in the corresponding dropdown list If you have done Calibrate for open f it only the signals used for this calibration are available in the stimulus selection dropdown (see section 0).
13) Select input level using the Input level slider 14) Click START and the REIG will be performed.
Ensure that the hearing aids are switched on and that the room is quiet whilst the curve is obtained.

D-0004576-Q – 2022/05 Affinity/Equinox2.0 – Additional Information Page 184
2.6.4 RECD measurements RECD (Real-Ear to Coupler Difference): The RECD accounts for the dif ference in decibels (dB) across f requencies, between the SPL measured in the real-ear and in a 2cc coupler, produced by a transducer generating the same signal. Example at 1000 Hz:
Coupler SPL – Real-Ear SPL = RECD
In this example 25 dB SPL is measured in the 2 cc coupler and 30 dB SPL was measured in the ear. This means that we have a real-ear to coupler dif ference of 5 dB SPL at 1000 Hz.
You are performing a measurement to compare two entities: a known volume size (the coupler) and an unknown volume size (the ear canal). This is important to do with clients whose ear canals are not the standard 2cc in volume. For example, children or adults who have had surgical procedures. The dif ference measurement obtained between the ear and coupler provides individual information about the ear canal which can be used in the hearing aid f itting. It can be utilized to estimate 2cc coupler targets which means you can not only test on the ear but also based on the RECD values the verif ication can be performed in the test box instead of the client’s ear. This is particularly useful with children. Note: When an RECD is measured the REM440 automatically switches to test box/coupler verif ication mode (simulated REM). The REM440 module provides a guided RECD procedure making sure no mistakes are made.
COUPLER MEASURE EAR MEASURE

D-0004576-Q – 2022/05 Affinity/Equinox2.0 – Additional Information Page 185
There are two ways to measure RECD which will be described in this section: a) RECD with the client’s own ear mould b) RECD with an SPL probe
Right click on the RECD test in the protocol list and select Settings to check if the system is setup to use the client’s own ear mould or SPL probe for the RECD. To use the SPL probe tick Use Insitu SPL probe. If this box is not ticked the system will assume that you are using the client’s own ear mold.
Click the box to use the SPL Probe

D-0004576-Q – 2022/05 Affinity/Equinox2.0 – Additional Information Page 186
2.6.4.1 RECD using the client’s own ear mould Additional required items:
An ear mould A 2 cc coupler connected to an adaptor for the BTE. These click easily together.
1) Open the REM440 module by selecting the REM tab. 2) Select a test in the List of Protocols. 3) The RECD is most of ten used with children, so you will need to explain the procedure to the parents. 4) Ensure that the information about client, f itting prescription and hearing aid parameters to the right
are correct. 5) Click START and the screen below will appear.
4
5
Coupler Curve
1
Real-ear to Coupler Dif ference
Ear Curve
2
9

D-0004576-Q – 2022/05 Affinity/Equinox2.0 – Additional Information Page 187
6) Connect the tube to the BTE adapter as shown on the picture and click OK. The coupler curve will be performed followed by a new instruction screen.
7) Disconnect the sound tube f rom the BTE adapter and connect it to the ear mould. Perform otoscopy and insert the REM probe and ear mould as shown on the picture. You may wish to use the slide-on ear loop which provides an easier f it. Press OK and the ear curve will be conducted.
8) The measured curves are shown as: • Recorded Ear curve • Recorded Coupler curve • RECD curve
9) If you wish to use the RECD for both ears, right click on the curve tag in the Curve display options
and select Transfer to left/right ear. You may also set setup the RECD to be trasferred to the oposite ear by default (see section 2.6.2.4)
Note: The RECD is performed at a f ixed input level of 70 dB and cannot be adjusted by the user.

D-0004576-Q – 2022/05 Affinity/Equinox2.0 – Additional Information Page 188
2.6.4.2 RECD using the SPL probe
Additional required items:
An SPL probe and ear tips.
A 2 cc coupler connected to an adapter for the SPL probe. These click easily together. Note: Remember to calibrate the SPL probe.
Real-ear to Coupler Dif ference
Coupler Curve
Ear Curve
4
1
2

D-0004576-Q – 2022/05 Affinity/Equinox2.0 – Additional Information Page 189
1) Open the REM440 module by selecting the REM tab. 2) Select a test in the List of Protocols. 3) The RECD is most of ten used with children, so you will need to explain the procedure to the parents. 4) Click START and the screen below will appear.
5) Connect the tube to the BTE adapter as shown on the picture and click OK. The coupler curve will be performed followed by a new instruction screen.
6) Disconnect the sound tube f rom the SPL probe adapter and perform otoscopy before placing the SPL probe in the client’s ear. Remember to attach the ear tip to the SPL probe prior to inserting the probe and connect it to the SPL probe. Press OK and the ear curve will be conducted and shown on the screen as below.
7) The measured curves are shown as: • Recorded Ear curve • Recorded Coupler curve • RECD curve
8) If you wish to use the RECD for both ears, right click on the curve tag in the Curve display options and select Transfer to left/right ear.
You may also conf igure the RECD to be trasferred to the oposite ear by default (see section 2.6.2.4)
Note: The RECD is performed at a f ixed input level of 70 dB and cannot be adjusted by the user.
2.6.4.3 Own mould versus SPL probe Whether the RECD is performed using the client’s own ear mould or the SPL probe may inf luence the result. The benef it of using the client’s own ear mould is that the measurement will ref lect your client’s actual residual volume when wearing their hearing device whereas the SPL probe only provides an estimate. However, you may be in a situation where the mould is non-existent, broken, or has an extremely bad f it. Furthermore, you might need to conduct measurements on children not willing to co-operate. In these situations, the SPL probe of fers the benef it of easy probe placement and measurement.

D-0004576-Q – 2022/05 Affinity/Equinox2.0 – Additional Information Page 190
Below see two RECD measured in the same ear using the SPL probe and own ear mould respectively. Note: the dif ferences between the two ways of measuring. As can be seen above the curve measured with the client’s own ear mould is below 0 in the low f requencies. This may be due to ear mould ef fects such as the tightness of the f it and venting and in the insertion depth of the SPL probe or ear mould.
2.6.4.4 Predicted RECD curve Right click on the RECD in the protocol list to use a predicted curve. Select Show predicted curve and the screen below will appear: Choose the Age and Azimuth angle using the dropdown lists.
2.6.4.5
RECD WITH SPL PROBE RECD WITH OWN EAR MOULD

D-0004576-Q – 2022/05 Affinity/Equinox2.0 – Additional Information Page 191
2.7.4.5 Measured RECD compared to a predicted RECD You can at any time select a predicted RECD as described in section 0 and view it alongside a measured RECD. Note that when both a measured and a predicted RECD are displayed the system will always prioritize the measured RECD for the test box verif ication (simulated REM). If you wish to use the predicted RECD the measured curve must be deleted.
2.6.4.6 Re-using a coupler curve If you prefer to use a pre-recorded coupler curve this can be setup in the Settings menu for RECD in the REM440 setup (see section 2.6.2.4). When ticking Use pre-recorded coupler curve the latest coupler curve will automatically appear on the graph
which means that the clinician only needs to perform the ear measure. Note: This is only possible when using a Pure Tone stimulus.
Measured RECD
Predicted RECD

D-0004576-Q – 2022/05 Affinity/Equinox2.0 – Additional Information Page 192
2.6.4.7 RECD from a previous session If you have measured the RECD at an earlier session with the client, the REM440 provides the option to use this historical curve in the current session.
1) Browse for the historical RECD curve in the session browser:
2) Right click on the curve tag in the Curve display options
3) Select Transfer to current session. The curve will then automatically appear in the current session.
2.6.4.8 Test box/coupler base fitting (simulated REM) By clicking on the Toggle between Coupler and Ear button in the f ront screen af ter performing the RECD you may choose to continue your f itting using either the:
a) “Coupler approach” (simulated REM) in the test box/coupler base, or
b) In the Real-ear
2.6.4.9 The “coupler approach” When an RECD is present (measured, predicted, or transferred it f rom a historical session) the system will automatically switch to coupler mode for the REAR/REIG measures.
1) Select REIG or REAG/REAR.
2) Position the hearing aid in the test box with the reference microphone placed in the same acoustical
point as the microphone in the hearing aid.

D-0004576-Q – 2022/05 Affinity/Equinox2.0 – Additional Information Page 193
3) Close the lid. 4) Press START to conduct your measurement in the 2 cc coupler.

D-0004576-Q – 2022/05 Affinity/Equinox2.0 – Additional Information Page 194
2.6.4.10 The “real-ear approach”
1) If you prefer verif ication in the Real-ear select Ear mode 2) Press START to conduct your measurement in the real-ear as described in the previous sections.
2.6.4.11 Importing the RECD into the hearing aid manufacturers software Some hearing aid manufacturers allow for importing the measured RECD curve into the sof tware via Noah and/or write the measured values into a RECD screen. This way the individual ear can be considered in the f itting, and you may avoid using the average values. For further description of how to incorporate the RECD curve into the f itting please refer to the individual hearing aid manufacturer.
2.6.4.12 Counselling the parents in visible speech mapping Note that VSPM (Visible Speech Mapping) is available in coupler mode. Upon f itting the hearing aids, you may therefore want to enter Visible Speech Mapping for counselling purposes. This may help their understanding of both hearing impairment and hearing aids signif icantly (see description of Visible Speech Mapping in section 2.122).

D-0004576-Q – 2022/05 Affinity/Equinox2.0 – Additional Information Page 195
2.6.5 REOR/REOG measurements REOR (Real-Ear Occluded Response): The REOR accounts for the SPL across f requencies measured in the ear canal with the hearing aid in place and turned of f . REOG (Real-Ear Occluded Gain): The REOG accounts for the gain across f requencies measured in the ear canal with the hearing aid in place turned of f . This is obtained by subtracting the input signal f rom the REOR.
REOR – input = REOG The REOR/REOG is of ten used to assess the venting of a hearing aid and whether it is functioning as expected. It may also help in revealing if the vent is introducing unwanted acoustic ef fects. The REOR/REOG is a good check of whether you are blocking your probe tube ahead of beginning your aided measurements. Test procedure:
1) Open the REM440 module by selecting the REM tab. 2) If needed select a test protocol in the List of Protocols. If you do not select a protocol the system
will automatically select a standard protocol. 3) Explain the procedure to the client. 4) Perform otoscopic examination. 5) Mount the probe tube on the in-situ headset and place it on the client who should be seated in ½-1
meters distance f rom the speaker. Ensure that the probe tubes are calibrated before placing them in the ear canal (see section 0 about tube calibration).
6) Carefully insert the hearing aid without moving the probe tube. Ensure that the hearing aid is switched off.
2
8
9
7
11
10
1

D-0004576-Q – 2022/05 Affinity/Equinox2.0 – Additional Information Page 196
7) Click on the REOG/REOR button if it is not already marked automatically. A right click on the REOG/REOR button allows you to enter the Settings menu or Change colour of the curve.
8) Ensure that the correct Ear is selected
9) Choose the preferred Stimulus in the corresponding dropdown list
10) Select input level using the Input level slider 11) Click START and the REOG/REOR will be performed.
Note: If the curve falls below the graph area use the arrow buttons in the lef t side of the screen to adjust the graph as illustrated below:
2.6.6 Measuring input/output Input/Output: The Input/Output curve displays the output of the hearing aid as a function of the input for one f requency (or broadband signal). The Input/Output function provides information about the compression characteristics of the hearing aid such as expansion37, knee-point, and compression limiting (Dillon 2001).
37 Expansion is when the hearing aid gain decreases with decreases in input (Dillon 2001).

D-0004576-Q – 2022/05 Affinity/Equinox2.0 – Additional Information Page 197
Test procedure:
1) Open the REM440 module by selecting the REM tab. 2) If needed select a test protocol in the List of Protocols. If you do not select a protocol the system
will automatically select a standard protocol. 3) Explain the procedure to the client. 4) Perform otoscopic examination. 5) Mount the probe tube on the in-situ headset and place it on the client who should be seated ½-1
meters distance f rom the speaker. Ensure that the probe tubes are calibrated before placing them in the ear canal (see section 0 about tube calibration).
6) Carefully insert the hearing aid without moving the probe tube. Ensure that the instruments are switched on.
7) If f itting an open hearing aid solution, perform Calibrate for open fit (see section 0). 8) Click on the Input/Output button if it is not already marked automatically.
A right click on the Input/Output button allows you to enter the Settings menu or Change colour of the curve.
9) Ensure that the correct Ear is selected
10) Choose the preferred Stimulus in the corresponding dropdown list If you have performed Calibrate for open f it only the signals used for this calibration are available in the stimulus selection dropdown (see section 0).
11) Click START and the Input/Output measure will be performed.
9
2
10
8
11
1
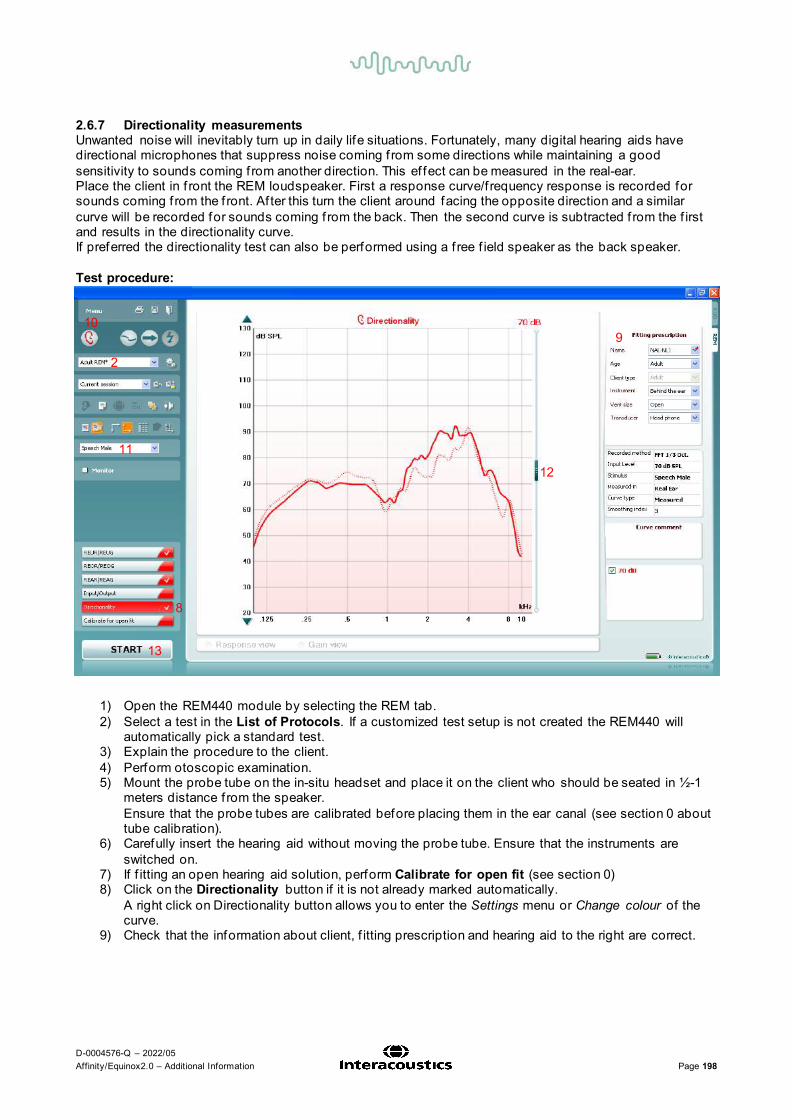
D-0004576-Q – 2022/05 Affinity/Equinox2.0 – Additional Information Page 198
2.6.7 Directionality measurements Unwanted noise will inevitably turn up in daily life situations. Fortunately, many digital hearing aids have directional microphones that suppress noise coming f rom some directions while maintaining a good sensitivity to sounds coming f rom another direction. This ef fect can be measured in the real-ear. Place the client in f ront the REM loudspeaker. First a response curve/f requency response is recorded for sounds coming f rom the f ront. Af ter this turn the client around facing the opposite direction and a similar curve will be recorded for sounds coming f rom the back. Then the second curve is subtracted f rom the f irst and results in the directionality curve. If preferred the directionality test can also be performed using a f ree f ield speaker as the back speaker. Test procedure:
1) Open the REM440 module by selecting the REM tab. 2) Select a test in the List of Protocols. If a customized test setup is not created the REM440 will
automatically pick a standard test. 3) Explain the procedure to the client. 4) Perform otoscopic examination. 5) Mount the probe tube on the in-situ headset and place it on the client who should be seated in ½-1
meters distance f rom the speaker. Ensure that the probe tubes are calibrated before placing them in the ear canal (see section 0 about tube calibration).
6) Carefully insert the hearing aid without moving the probe tube. Ensure that the instruments are switched on.
7) If f itting an open hearing aid solution, perform Calibrate for open fit (see section 0) 8) Click on the Directionality button if it is not already marked automatically.
A right click on Directionality button allows you to enter the Settings menu or Change colour of the curve.
9) Check that the information about client, f itting prescription and hearing aid to the right are correct.
10
2
11
8
13
12
9 1

D-0004576-Q – 2022/05 Affinity/Equinox2.0 – Additional Information Page 199
10) Ensure that the correct Ear is selected 11) Choose the preferred Stimulus in the corresponding dropdown list .
If you have calibrated for open f it only the signals used for this calibration are available in the stimulus selection dropdown (see section 0).
12) Select input level using the Input level slider 13) Click START and follow the instructions on screen. 14) Place the client in f ront of the loudspeaker as shown on the picture. Click OK and f ront microphone
curve will be recorded. New instructions will immediately appear.
15) Turn the client around and click OK. The directionality curve will then be f inalised as shown above38.
Note: The continuous measurement button is disabled for Directionality. Measurement time must therefore be set in the REM440 setup (see section 2.6.2.7).
2.6.8 Binaural REM measurements This is a feature which allows binaural measurement of real ear measurements simultaneously. This makes it easier and quicker to perform this measurement. This test involves the placement of the probe tube microphone in each of the patient’s ears at the same time and referencing is performed with only one of the reference microphones. As a consequence, this test requires that the patient is orientated at 0° f rom the speaker to ensure that there is equal distance to the speaker f rom each ear. Binaural REM can only be used with stimuli which do not require active referencing during the measurement. Therefore, Binaural REM is not suitable for measurement with Warble Tone, Pink Noise, Random Noise, Pure tone, and Narrowband Noise. No specif ic protocol is required to perform Binaural REM as it uses the settings f rom your existing protocols. However, a protocol can be defaulted to start up in Binaural REM measuring mode by enabling the below setting in the REM protocol.
38 If using the Affinity2.0 with external speaker the client does not need to be turned around (see section 2.6.2.7 for directionality setup options)

D-0004576-Q – 2022/05 Affinity/Equinox2.0 – Additional Information Page 200
Required items: • The Af f inity2.0 hardware • Licensed Af f inity2.0 hardware with REM440 REM module • Calibrated REM headset • REM protocol

D-0004576-Q – 2022/05 Affinity/Equinox2.0 – Additional Information Page 201
Procedure 1. Enter/Select an audiogram f rom Noah or f rom the AUD module. If no audiogram is entered or
selected, no targets will be displayed. 2. To enable Binaural REM measurements in the REM module you will need to Right click on the ear
selector icon. This will then show a binaural icon and a popup to alert the user when using this function.
Due to the way in which this feature has been implemented you will not need to recreate new protocols to use this function. It uses the settings you already have in your existing protocols. Please note when running measurements of this type you will only be using one reference microphone to monitor the signal f rom the speaker. This is the right microphone by default, but it can be swapped to the lef t microphone by using the ‘use opposite ref . mic. Button’.
It is also essential that the position of the patient in relation to the REM speaker is maintained at 0° as this will ensure that the same signal intensity is reaching each ear as they are equal distance f rom the speaker.
3. Connect probe tubes to the REM reference microphones.
4. Click on the Tube Calibration button and follow the instructions on the screen, this process ensures that the probe tube is made acoustically invisible – enabling an ef fective display of the actual gain achieved at the tympanic membrane by the hearing aid. On running the calibration, you will notice that in Binaural mode there is an automated procedure to calibrate both Lef t and Right REM tubes sequentially, without having to manually start each individually.
5. Position the patient approximately 0.5 metres f rom the REM loudspeaker. 6. Perform otoscopy to ensure the ear canal is clear. 7. Snap the REM headsets on the REM headband and place on patient’s ear. 8. Choose a relevant protocol to perform your verif ication, in this example the default ‘Adult Insertion Gain’
protocol has been used.

D-0004576-Q – 2022/05 Affinity/Equinox2.0 – Additional Information Page 202
Note: For this example, an Insertion Gain method has been used to demonstrate the Binaural REM feature, however the feature is also compatible with protocols which perform this measurement in an Aided Response method. 9. Once you have chosen your protocol, please conf igure your f itting prescription settings as per your
f itting.
10. Place the REM tubes inside the patient’s ears and aim to use a marker of roughly 27mm on the probe tubes. This helps to get the open end of the tube in an optimum recording position (BSA, 2007).

D-0004576-Q – 2022/05 Affinity/Equinox2.0 – Additional Information Page 203
11. Begin by running the REUR measurement, this is looking at the natural acoustics of your patients ear canals, it is performed with nothing in the patients ear canals apart f rom the probe tubes. Your response should peak around 2-3kHz for a normal adult response (BSA, 2007). The shape of this measurement can also be used as a quality criterion for your probe placement, the measurement should intersect the Horizontal axis (x-axis) at 6khz and must not be more negative than -5dB (BSA, 2007 & ISO, 2003).
12. You can now proceed to running the REIG measurements, there are 3 dif ferent intensity measurements in this protocol, but the focus should be to f it the 65dB curve as this is the intensity for speech.
Please place the hearing devices into your patient’s ears along with the probe tubes for the following measurements.

D-0004576-Q – 2022/05 Affinity/Equinox2.0 – Additional Information Page 204
You will notice that there is a target in these measurements; in the next step it is shown how you can amend the output of the patient’s hearing devices to meet these targets. Note: the default view for the Binaural REM feature is to have the lef t and right aided measure displayed side-by-side. However, this can be swapped to an on-top comparison by pressing the button shown below, there is an example of this view below.
13. You will now begin f ine tuning in the hearing aid f itting software to amend the output of the device to
meet the prescription target. 14. Should you wish to edit the targets when performing a binaural measurement then you should click on
this icon . Doing this will open the below dialogue screen which will allow you to edit the target for each independent ear currently on the screen or input your own, i.e. a proprietary target f rom a hearing aid f itting software.
On setting a custom target it reverts the target to a ‘Custom target’ f rom a previously set standard target (NAL, DSL etc.) on doing this you should input values for both ears otherwise no target will appear.

D-0004576-Q – 2022/05 Affinity/Equinox2.0 – Additional Information Page 205
Note: Using this feature will remove your previous target allocation (i.e., NAL-NL2, DSLmi/o etc) f rom the opposite ear side, which you have not provided custom values for, because we cannot allow dif ferent prescription methods to be used on dif ferent ears independently.
15. A nice feature in the Af f inity2.0 and Callisto™ Suites is the On top mode. This feature allows you to minimize the suite so that it can be placed on top of the f itting software to make it easier to f ine tune and compare the output following your changes. This feature can be used on pressing the following button on
the lef t of the Suite GUI .

D-0004576-Q – 2022/05 Affinity/Equinox2.0 – Additional Information Page 206
16. Once you have f ine-tuned your hearing devices so that the patient is happy and have counselled them
involving their opinions in the amplif ication of their hearing devices you can save and close the Suite and
f inish the session. This is done by pressing the ‘Save and Exit’ button
Note: Binaural REM can also be used when f itting Open Fit type hearing aids. All this requires is for the ‘Open Fit Calibration’ to be run following the REUR measurement for the signal(s) you wish to use for the following measurements.

D-0004576-Q – 2022/05 Affinity/Equinox2.0 – Additional Information Page 207
2.7 FM system verification
2.7.1 FM transparency FM Transparency can be def ined as “The condition in which equal inputs to the FM and hearing aid microphones produce equal outputs from the hearing aid.”39 The verif ication method is according to the AAA Clinical Practice Guidelines for Remote Microphone Hearing Assistance Technologies for Children and Youth Birth to 21 Years. For more information, please refer to the AAA Guidelines. The FM Transparency consists of 3 easy coupler measurements:
1. Hearing Aid alone 2. Hearing Aid + FM receiver attached; FM transmitter on/muted 3. Hearing Aid + FM receiver attached, transmitter microphone unmuted and positioned inside the test
chamber. NOTE: the hearing aid is still attached to the coupler/coupler mic, but it needs to be taken out of the test chamber.
1. Launch the Af f inity suite through Noah or OtoAccess® and choose a patient 2. Launch the REM module 3. Select the FM Transparency protocol f rom the drop-down menu
NOTE: FM Transparency assumes that the hearing aid has already been programmed to match the targets, according to the patient’s hearing loss and patient needs. Therefore, there is no need to show targets on the screen. Targets and Fitting prescription information will not appear on the main screen when the FM transparency is chosen. The FM Transparency setup guide will pop up when the above protocol is chosen, instructing the patient on how to setup for FM Transparency verif ication:
39 American Academy of Audiology (2011).

D-0004576-Q – 2022/05 Affinity/Equinox2.0 – Additional Information Page 208
Step 1: HA Alone 1. Select the HA Alone test 2. Attach the hearing aid to the coupler/coupler microphone 3. Position the hearing aid in the test chamber 4. Click START to measure the output of the hearing aid (red curve)
Step 2: HA + Receiver
1. Leaving the hearing aid in the coupler, attach the FM receiver to the hearing aid 2. Turn on the FM transmitter. Mute it. 3. Click START to measure the output of the hearing aid (purple curve)
Note: the two curves should be very similar to each other

D-0004576-Q – 2022/05 Affinity/Equinox2.0 – Additional Information Page 209
Step 3: FM Mic + HA 1. Remove the hearing aid, still attached to the coupler, f rom the test box 2. Position the FM microphone inside the test box, in f ront of the reference microphone 3. Measure the output of the hearing aid f rom the FM microphone (green curve)
NOTE: - if a significant difference is already seen between the Green curve and the Red curve, one can presume that there is a problem
with the FM microphone - Ensure that the test is conducted in a quiet environment, since the hearing aid is outside the test box and the microphones are still
active Step 4: Calculate the difference
1. Click on the table mode icon to activate Table Mode 2. Once in table mode, calculate the dif ference between 750 Hz, 1000 Hz and 2000 Hz and calculate
the average 3. Calculate the average 4. If the average is 2 dB or less, FM transparency is achieved. 5. If the average is more than 2 dB, adjust the FM.
Example 1
HA + Receiver FM Mic + HA Difference 750 Hz 75 75 0
1000 Hz 75 75 0 2000 Hz 72 72 0 Average 0
*Average dif ference is less than 2 dB, therefore transparency is achieved
Table mode view in Af f inity

D-0004576-Q – 2022/05 Affinity/Equinox2.0 – Additional Information Page 210
Example 2
HA + Receiver FM Mic + HA Difference 750 Hz 75 74 1
1000 Hz 74 75 1 2000 Hz 72 71 1 Average 1
*Average dif ference is less than 2 dB, therefore transparency is achieved
2.7.2 Ear level, FM only Ear Level FM systems are intended to be used by patients who have normal or near-normal hearing and help increase the signal to noise ratio. They can be used, for example, in classroom settings for a child having learning dif f iculties or auditory processing disorders (APD). Typical use will include an ear-level FM receiver, coupled to a thin tube, in an open ear conf iguration. The steps below guide clinicians on how to perform straightforward real-ear verif ication of the ear level FM system, to verify the maximum output and to adjust the volume control to recommended setting on the FM receiver.
1. Prepare the patient for normal real ear:
o Position him in f ront of the loudspeaker o Place the probe tube in the ears o Place the ear level FM system on the ear
2. From Noah or f rom the AUD screen, enter the audiogram (it will be within the range of normal/near normal) and click on the REM tab

D-0004576-Q – 2022/05 Affinity/Equinox2.0 – Additional Information Page 211
3. Once in the REM screen, select the “FM only, Ear level” protocol f rom the drop-down list
4. Place the FM transmitter microphone inside the test chamber, facing the reference microphone
5. Close the lid of the test chamber NOTE: The test box reference microphone is the active microphone, even if we are doing a real ear measurement
6. Measure the MPO: o Click on MPO to access the MPO test. o Set the FM transmitter volume control to MAX o Click Start to measure the Real-Ear Saturation Response o If the MPO measurement is too high, adjust the FM output

D-0004576-Q – 2022/05 Affinity/Equinox2.0 – Additional Information Page 212
7. Measure the REAR o Select the appropriate FM-specif ic target:
FM Boom or FM Chest the choice should ref lect what is used with the system in question
o Measure the REAR by clicking the start button o Adjust volume control on the FM receiver to match the targets between 1kHz and 4kHz
8. Re-measure the RESR/MPO at user setting

D-0004576-Q – 2022/05 Affinity/Equinox2.0 – Additional Information Page 213
2.8 Working with individual setups (test protocols) The REM440 module is pre-programmed with standard protocols ready for use which can be selected f rom the f ront screen. However, you may wish to create an individual test protocol accommodating for personal preferences and test methods. This section describes both how to select a pre-programmed protocol and how to create an individual test protocol.
2.8.1 Selecting a test protocol 1) Open the REM440 module by selecting the REM tab in the Af f inity2.0/Equinox2.0 Suite.
2) In the List of Protocols all standard and individual test protocols are listed.
3) When selecting a protocol, the tests of the specif ic protocol will then be listed in the lower lef t corner
ready for use.

D-0004576-Q – 2022/05 Affinity/Equinox2.0 – Additional Information Page 214
2.8.2 Creating new test protocols The following sections describe how to setup your own protocol in the REM440 setup. All setup options for all tests will be described even though you most likely will only need a few. This section is therefore to be seen as a work of reference where single functions can be looked up rather than a step-by-step guide where all steps need to be explored.
1) Enter the REM440 setup by pressing Menu/Setup/REM440 setup 2) Press New
3) A pop-up will give you the choice for the new protocol to a copy settings from one of the current
protocols in your system. If you do not wish to do this, then you can click on the box ‘Create a new empty protocol’. You will also be asked to title the new protocol in the section ‘New protocol name:’.

D-0004576-Q – 2022/05 Affinity/Equinox2.0 – Additional Information Page 215
4) Once this new protocol has been created it will show in your protocol lists where you can then modify/change it.
5) Select the tests to be included in the test protocol. Mark a test by clicking on it and press the Add. Double clicking on a test will also select it. Choose all the tests for the protocol using this procedure.
To remove a test selected by mistake, mark it under Selected tests and press Remove. The test will then jump back to the Test selection list.
6) If the order of the tests is to be changed, use the two Move arrow buttons. Mark the test to be moved and press one of the arrow buttons. Depending on the direction of the selected arrow, the test will then jump up or down.
7) To adjust the parameters of each selected test press Settings.
4

D-0004576-Q – 2022/05 Affinity/Equinox2.0 – Additional Information Page 216
Below the selection list four check boxes are found:
Display combined screen allows for comparing dif ferent curves in the same display. Which curves to compare can be setup individually (see section 0). Use audiogram for UCL provides you with the option to adjust UCLs transferred f rom the audiogram screen. When using the NAL-NL1, NAL-NL2 or DSL m[i/o] f itting prescriptions UCLs f rom the audiogram screen will automatically be transferred to the REM440 screen where they are indicated in shading. Use latest audiogram means that the latest audiogram will always be used to calculate the target in the REM screen Hide fitting prescription options will hide the f itting prescription options panel on the right-hand panel of the REM screen:
Perform Binaural REM on Start-up allows you to enable default Binaural REM recording on launching the sof tware for this selected protocol. Show Delta Values enables the Delta values feature as defaulted on for this protocol.

D-0004576-Q – 2022/05 Affinity/Equinox2.0 – Additional Information Page 217
2.8.2.1 REUG/REUR settings
1) Ensure that REUR/REUG is marked in the lef t-hand side of the screen. The name of the test will then appear in the Name of selected test section. Note the option to write a new name for the test in this section (e.g., “REUR/REUG 70 dB input”)
2) Stimulus selection: Input Level: Set the input level using the slider. When using broadband signals such as ICRA. Select a time using the slider. Stimulus type: Select a stimulus using the dropdown list. Smoothing Index: You have the option to smooth the measured curve using the slider. The
higher index number selected the more smoothing is applied. Continuous: This check box allows you to make the measurement on going rather than a single
sweep. This may, however, also be done in the f ront screen using the continuous button:
When continuous is ticked, the stimulus and recording will continue until you press the STOP button.
View as gain: allows you to view the measurement as a gain curve by default. If you wish to view it as response, ensure that the check box remains unticked (see section 0 for details regarding Gain versus Response view).
Start Frequency and Stop Frequency: Select the preferred f requencies using the sliders. To avoid low f requency noise set the slider to a start f requency of 200Hz.
1
5
2
3
4

D-0004576-Q – 2022/05 Affinity/Equinox2.0 – Additional Information Page 218
Sweep delays: This is relevant if Continuous measurement is selected for Pure Tone or Warble Tone. In this case sweep delays (in milliseconds) may be entered between the individual sweeps.
Measurement time (in seconds): Duration for the measurement can be set using the slider. This is only relevant for broad band signals. A number of seconds can f reely be selected between 1 and 1200. By default, the measurement time is the same for all signals.
Instructions: This allows for adding picture instructions. If the box is ticked an instruction box explaining how to perform the measurement will appear each time upon pressing START.
3) Recording method: Resolution (of f requency): Select the preferred resolution in the dropdown. The higher the
resolution the slower the measurement.
Keep in mind that 1/3 is what is used in many hearing aid manufacturers sof tware. If the curve is to be compared to this, you may consider choosing this resolution. Also note that when using a broad band signal the dropdown list will be greyed out and automatically choose FFT. This makes the distance between f requency bins 43 Hz which ensures precision in the measurement.
4) Color: Select a color for the Right and Left curve.
Press each of the buttons to have the custom color selection below. Choose the desired color by clicking on it and press OK.
Note the option to Define Custom Colors to get a more extensive selection. When having found the exact color, press Add to Custom Colors.
5) Predicted curve Show predicted curve: If you wish not to measure the REUR/REUG you can select to use a
predicted REUR/REUG as default by ticking the check box.

D-0004576-Q – 2022/05 Affinity/Equinox2.0 – Additional Information Page 219
2.8.2.2 REAR/REAG settings
1) Ensure that REAR/REAG is marked in the left-hand side of the screen. The name of the test will then appear in the Name of selected test section Note the option to write a new name for the test in this section (e.g., “REAR/REAG 70 dB input”)
2) Stimulus selection Input Level: Set the input level using the slider. Preconditioning: This is relevant when using broadband signals such as ICRA. Select a time
using the slider. Stimulus type: Select a stimulus using the dropdown list. Smoothing Index: You have the option to smooth the measured curve using the slider (see
section 0 for details). The higher index number selected the more smoothing is applied. Continuous: This check box allows you to make the measurement on going rather than a
single sweep. This may, however, also be done in the f ront screen using the continuous button:
When continuous is ticked, the stimulus and recording will continue until you press the STOP button. This can be practical either if you want to change the settings of the hearing aid and observe the changes in hearing aid performance.
View as gain allows you to view the measurement as a gain curve by default. If you wish to view it as response, ensure that the check box remains unticked (see section 0 for details regarding Gain versus Response view).
5
4 3
2 1

D-0004576-Q – 2022/05 Affinity/Equinox2.0 – Additional Information Page 220
Start Frequency and Stop Frequency: Select the preferred f requencies using the sliders. These may for example be set so that they correspond with the hearing aid gain handles (e.g., if the hearing aid goes up to 8000 Hz there is no reason to measure beyond this f requency). To avoid low f requency noise, you may wish to set the slider to a start f requency of 200Hz.
Sweep delays: This is relevant if Continuous measurement is selected for Pure Tone or Warble Tone. In this case sweep delays (in milliseconds) may be entered between the individual sweeps.
Measurement time (in seconds): Duration for the measurement can be set using the slider. This is only relevant for broad band signals. Several seconds can f reely be selected between 1 and 1200. By default, the measurement time is the same for all signals.
Instructions: This allows for adding picture instructions. If the box is ticked an instruction box explaining how to perform the measurement will appear each time upon pressing START.
3) Recording method: Resolution (of f requency): Select the preferred resolution in the dropdown. The higher the
resolution the slower the measurement.
Keep in mind that 1/3 is what is used in many hearing aid manufacturers sof tware. If the curve is to be compared to this, you may consider choosing this resolution. Also note that when using a broad band signal the dropdown list will be greyed out and automatically choose FFT. This makes the distance between f requency bins 43 Hz which ensures precision in the measurement.
4) Color: Select a color for the Right and Left curve (see section 2.6.2.1 regarding REUR/REUG for
details). 5) Multiple curves:
The Multiple curves option, if conf igured, will run a series of concurrent dif fering intensity levels when you press start in the test screen. Set the f irst level using the Input Level slider and press Add under Multiple Curves. The level will then appear in the corresponding white section as the Primary intensity. Select the second level and press Add again. The new level will then be listed under the f irst one. If a level is selected by mistake click on it in the white section and press Remove.
6) Display: Display Peaks and Valleys: This is relevant when using a broad band signal. When ticking the
check box, the REM440 will show the measured maximum and minimum in speech spectrum over time (5 seconds) on screen. The measurement is independent of the selected measurement time.
Hide target: This will remove the f itting target f rom the screen by default Hide MPO: This will remove the MPO when using the DSL mi/o f itting prescription in
Response view. 1/3 octave and overlapping time window: For speech-like signals, the signal is converted into
an FFT and then sampled. The clock f requency of the Af f inity is 44100 Hz, and we do 1024 samples per second. This means that the time for each sample is 23 ms.
Percentiles for full measurement: activate this box if you want to see the intensity components in dif ferent shaded percentile sections – these are customisable and will show the output as a shaded range on the graph.
Show dynamic compression ratio: Enabling this feature will display the dynamic compression ratios when the 1/3 octave and overlapping time windows option is enabled. Set settings to IEC 60118-15: use this button to set the measurement settings according to the IEC 60118-15 standard 40 this will amend the settings mentioned above to meet this configuration description.
40 For detailed information, please refer to the IEC 60118-15 standard.

D-0004576-Q – 2022/05 Affinity/Equinox2.0 – Additional Information Page 221
2.8.2.3 REIG settings
1) Ensure that REIG is marked in the lef t-hand side of the screen. The name of the test will then appear in the Name of selected test section. Note the option to write a new name for the test in this section (e.g., “REIG 70 dB input”)
2) Stimulus selection: Input Level: Set the input level using the slider. Smoothing Index: You have the option to smooth the measured curve using the slider. The
higher index number selected the more smoothing is applied. Continuous: This check box allows you to make the measurement ongoing rather than a single
sweep. This may, however, also be done in the f ront screen using the continuous button:
When continuous is ticked, the stimulus and recording will continue until you press the STOP button. This can be practical either if you want to change the settings of the hearing aid or observe the changes in hearing aid performance.
View as gain: allows you to view the measurement as a gain curve by default. If you wish to view it as response, ensure that the check box remains unticked (see section 0 for details regarding Gain versus Response view).
Measurement time (in seconds): Duration for the measurement can be set using the slider. This is only relevant for broad band signals. Several seconds can f reely be selected between 1 and 1200. By default, the measurement time is the same for all signals.
Instructions: This allows for adding picture instructions. If the box is ticked an instruction box explaining how to perform the measurement will appear upon pressing START.
5 4
3
2 1

D-0004576-Q – 2022/05 Affinity/Equinox2.0 – Additional Information Page 222
Note: Preconditioning, Stimulus type, Start/Stop frequency, and Sweep delay are all greyed out for REIG. This is because the REIG is a calculation and not a measurement (REAR/REAG – REUR/REUG = REIG). The stimulus characteristics therefore are tied to the REUR settings. If other stimulus settings are preferred these should be changed in the REUR/REUG test (see section 2.6.2.1). However, even though the REIG stimulus will default to the signal selected for the REUR, it can, however, be changed f rom the f ront screen stimulus dropdown list.
3) Recording method: Resolution (of f requency): Select the preferred resolution in the dropdown. The higher the resolution
the slower the measurement. Keep in mind that 1/3 is what is used in many hearing aid manufacturers sof tware. If the curve is to be compared to this, you may consider choosing this resolution. Also note that when using a broad band signal the dropdown list will be greyed out and automatically choose FFT. This makes the distance between f requency bins 43 Hz which ensures precision in the measurement.
4) Color: Select a color for the Right and Left curve (see section 2.6.2.1 regarding REUR/REUG for
details). 5) Multiple curves: The Multiple curves option, if conf igured, will run a series of concurrent dif fering intensity levels
when you press start in the test screen. Set the f irst level using the Input Level slider and press Add under Multiple Curves. The level will then appear in the corresponding white section as the Primary intensity. Select the second level and press Add again. The new level will then be listed under the f irst one. If a level is selected by mistake click on it in the white section and press Remove.

D-0004576-Q – 2022/05 Affinity/Equinox2.0 – Additional Information Page 223
2.8.2.4 RECD settings
1) Ensure that RECD is marked in the lef t-hand side of the screen. The name of the test will then appear in the Name of selected test section. Note the option to write a new name for the test in this section (e.g., “RECD with SPL probe”)
2) Select the preferred Coupler type. Choose between: 2cc coupler (IEC 126) Ear simulator (IEC 711)
The volume of the IEC 711 is more like the volume of a real ear than the 2 cc coupler. Note: No predicted values are available for Ear simulator (IEC 711). If selecting Show predicted curve the values displayed on the graph will be based on 2 cc coupler values!
3) Stimulus selection: Smoothing Index: You have the option to smooth the measured curve using the slider. The
higher index number selected the more smoothing is applied. Continuous: This check box allows you to make the measurement ongoing rather than a single
sweep. This may, however, also be done in the f ront screen using the continuous button:
When continuous is ticked, the stimulus and recording will continue until you press the STOP button. This can be practical either if you want to change the settings of the hearing aid and observe the changes in hearing aid performance.
6 5
4
3 2
1

D-0004576-Q – 2022/05 Affinity/Equinox2.0 – Additional Information Page 224
Stimulus type: Select a stimulus using the dropdown list. Note that only Pure Tone, Warble Tone, and Pink Noise are available for RECD.
Note: The input level for RECD is f ixed at 70 dB. This cannot be changed by the user.
4) Recording method: Use RECD for both ears: Select if one RECD measurement is to be used for both ears. Use pre-recorded coupler curve: Select this option to use a previously measured coupler curve.
This way you only need to perform the ear measure. Note that this function can only be activated for a Pure Tone stimulus.
Use SPL probe: Select to use the SPL probe if your client does not have an ear mould, if the mould is broken or has a bad f it, or if the client is uncooperative (see section for details on RECD with own mould and SPL probe).
5) Color: Select a color for the Right and Left curve (see section 2.6.2.1 regarding REUR/REUG for
details). 6) Predicted curve: Show predicted curve: Select to use a predicted curve as default using the tick box.
Note: Instructions cannot be selected in this screen as these will automatically appear when performing each step of the RECD making sure that the measurement is performed correctly.

D-0004576-Q – 2022/05 Affinity/Equinox2.0 – Additional Information Page 225
2.8.2.5 REOR/REOG settings
1) Ensure that REOR/REOG is marked in the lef t-hand side of the screen. The name of the test will then appear in the Name of selected test section.
Note the option to write a new name for the test in this section (e.g., “REOR/REOG 70 dB input”) 2) Stimulus selection
Input Level: Set the input level using the slider. Preconditioning: This is relevant when using broadband signals such as for example ICRA
.Select a time using the slider. Stimulus type: Select a stimulus using the dropdown list. Smoothing Index: You have the option to smooth the measured curve using the slider. The
higher index number selected the more smoothing is applied. Continuous: This check box allows you to make the measurement ongoing rather than a single
sweep. This may, however, also be done in the f ront screen using the continuous button:
When continuous is ticked, the stimulus and recording will continue until you press the STOP button. This can be practical either if you want to change the settings of the hearing aid or observe the changes in hearing aid performance.
View as gain allows you to view the measurement as a gain curve by default. If you wish to view it as response, ensure that the check box remains unticked (see section 0 for details regarding Gain versus Response view).
5 4
3
2 1

D-0004576-Q – 2022/05 Affinity/Equinox2.0 – Additional Information Page 226
Start Frequency and Stop Frequency: Select the preferred f requencies using the sliders. These may for example be set so that they correspond with the hearing aid gain handles (e.g., if the hearing aid goes up to 8000 Hz there is no reason to measure beyond this f requency). To avoid low f requency noise, you may wish to set the slider to a start f requency of 200Hz.
Sweep delays: This is relevant if Continuous measurement is selected for Pure Tone or Warble Tone. In this case sweep delays (in milliseconds) may be entered between the individual sweeps
Measurement time (in seconds): Duration for the measurement can be set using the slider. This is only relevant for broad band signals. A number of seconds can f reely be selected between 1 and 1200. By default, the measurement time is the same for all signals.
Instructions: This allows for adding picture instructions. If the box is ticked an instruction box explaining how to perform the measurement will appear each time upon pressing START.
3) Recording method: Resolution (of f requency): Select the preferred resolution in the dropdown. The higher the
resolution the slower the measurement. 4) Color:
Select a color for the Right and Left curve (see section 2.6.2.1 regarding REUR/REUG for details).
5) Multiple curves: The Multiple curves option, if conf igured, will run a series of concurrent dif fering intensity
levels when you press start in the test screen. Set the f irst level using the Input Level slider and press Add under Multiple Curves. The level will then appear in the corresponding white section as the Primary intensity. Select the second level and press Add again. The new level will then be listed under the f irst one. If a level is selected by mistake click on it in the white section and press Remove.

D-0004576-Q – 2022/05 Affinity/Equinox2.0 – Additional Information Page 227
2.8.2.6 Input/output settings
1) Ensure that Input/Output is marked in the lef t-hand side of the screen. The name of the test will then appear in the Name of selected test section.
Note the option to write a new name for the test in this section (e.g., “Input/Output 1600 Hz”) 2) Stimulus selection
Start Level/Stop Level: Set the start and stop level using the sliders. Stimulus Resolution: Set the stimulus resolution (1-5 dB) using the slider Stimulus type: Select a stimulus using the dropdown list. Continuous: This check box allows you to make the measurement on going rather than a
single sweep. This may, however, also be done in the f ront screen using the continuous button:
When continuous is ticked, the stimulus and recording will continue until you press the STOP button. This can be practical either if you want to change the settings of the hearing aid or observe the changes in hearing aid performance.
Stimulus frequency: Select the f requency at which the test should be performed. Sweep Speed: Set the sweep speed (in dB per second) using the slider. The sweep speed will
af fect the measured curve since dif ferent hearing aids will react dif ferently to a certain speed. A high-quality hearing aid will for example most likely have a faster reaction time.
3
2 1

D-0004576-Q – 2022/05 Affinity/Equinox2.0 – Additional Information Page 228
Preconditioning: This is relevant when using broadband signals such as ICRA. Select a time using the slider.
Sweep delays: This is relevant if Continuous measurement is selected for Pure Tone or Warble Tone. In this case sweep delays (in milliseconds) may be entered between the individual sweeps.
Smoothing Index: You have the option to smooth the measured curve using the slider. The higher index number selected the more smoothing is applied.
3) Color: Select a color for the Right and Left curve (see section 2.6.2.1 regarding REUR/REUG for
details).
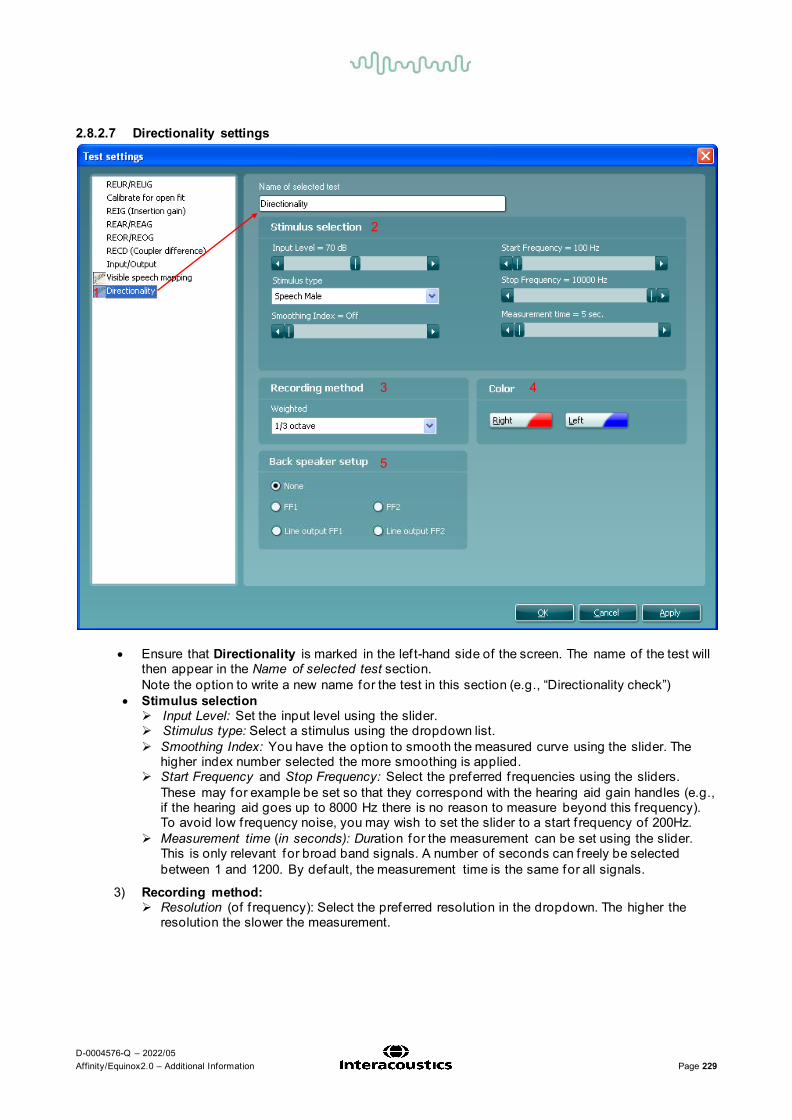
D-0004576-Q – 2022/05 Affinity/Equinox2.0 – Additional Information Page 229
2.8.2.7 Directionality settings
• Ensure that Directionality is marked in the lef t-hand side of the screen. The name of the test will then appear in the Name of selected test section.
Note the option to write a new name for the test in this section (e.g., “Directionality check”) • Stimulus selection Input Level: Set the input level using the slider. Stimulus type: Select a stimulus using the dropdown list. Smoothing Index: You have the option to smooth the measured curve using the slider. The
higher index number selected the more smoothing is applied. Start Frequency and Stop Frequency: Select the preferred f requencies using the sliders.
These may for example be set so that they correspond with the hearing aid gain handles (e.g., if the hearing aid goes up to 8000 Hz there is no reason to measure beyond this f requency). To avoid low f requency noise, you may wish to set the slider to a start f requency of 200Hz.
Measurement time (in seconds): Duration for the measurement can be set using the slider. This is only relevant for broad band signals. A number of seconds can f reely be selected between 1 and 1200. By default, the measurement time is the same for all signals.
3) Recording method: Resolution (of f requency): Select the preferred resolution in the dropdown. The higher the
resolution the slower the measurement.
4 3
2
1
5

D-0004576-Q – 2022/05 Affinity/Equinox2.0 – Additional Information Page 230
4) Color: Select a color for the Right and Left curve (see section 2.6.2.1 regarding REUR/REUG for
details). 5) Back speaker setup:
Select which speaker should be used for the back microphone measure. You have the option to select a f ree f ield loud speaker instead of the Af f inity loudspeaker. In this case the client does not need to be turned around af ter measuring the f ront microphone. Note that if you are using the Af f inity loudspeaker, select None.

D-0004576-Q – 2022/05 Affinity/Equinox2.0 – Additional Information Page 231
2.8.2.8 Pause settings
You have the option to implement a pause in your individual test protocol. This way you can create a reminder if needed during the testing.
1) Ensure that Pause is marked in the lef t-hand side of the screen. The name of the test will then appear in the Name of selected test section.
Note the option to write a new name for the test in this section (e.g., “Set to telecoil”) 2) Image:
Insert: Press Insert to browse for an instructional/reminder picture to appear on the screen during the pause.
Remove: Press Remove to delete a selected picture. 3) Text: Write a test to appear during the pause in the white section.
2.8.2.9 Visible speech mapping settings Visible Speech Mapping is added to a protocol and adjusted using the same procedures as for other tests (see sections 2.6.2.1 - 2.6.2.7 above).This is further described in section 2.122 about Visible Speech Mapping.
2
1
3

D-0004576-Q – 2022/05 Affinity/Equinox2.0 – Additional Information Page 232
2.8.3 Combined Screen Setup REM440 can be setup for default curve comparisons. This is done in the Combined screen settings menu.
1) To enter the Combined screen settings menu, select your protocol in the Select protocol dropdown
list in the main setup.
2) Click on the Combined screen button. This will prompt the combined screen setup below:
3) To create a default curve comparison view, click on Add new screen. A tab will then appear in the
upper part of the screen. 4) Use the arrows to move the measurements to be compared (listed to lef t) to the new screen. If
preferred, you can add several new comparison screens. 5) When f inished click OK to return to the main setup.
Note: Before closing the setup remember to tick the Display combined screen check box for the combined screen settings to be active. When a combined screen view is setup, you can click on the Toggle between single and combined screen button in the f ront screen to view the desired curves together:
If no combined screen view is setup Toggle between single and combined screen will show all measured curves.
2
3
4
5

D-0004576-Q – 2022/05 Affinity/Equinox2.0 – Additional Information Page 233
2.8.4 Fitting prescription setup REM440 can be setup to use a specif ic f itting prescription by default.
1) To enter the Fitting prescription settings menu, select your protocol in the Select protocol dropdown list in the main setup.
2) Click on the Fitting prescription button.
3) Default prescription: Select the default f itting prescription. Choose between Berger, DSL m[i/o] , Half Gain, NAL-NL1,
NAL-NL2, NAL-R, NAL-RP, POGO1, POGO2, and Third Gain.
Note: Multiple options are available when selecting NAL-NL1/NAL-NL2, or DSL m[i/o] and that the selections dif fer depending on the f itting prescription chosen. Also note that REIG targets are available for all f itting prescriptions whereas NAL-NL1/NAL-NL2 and DSL m[i/o] also provide REAR/RE AG targets.
1 2
3
4
5
6
7
8
3
2

D-0004576-Q – 2022/05 Affinity/Equinox2.0 – Additional Information Page 234
2.8.4.1 DSL
DSLm[i/o] settings 1) Default prescription:
Select DSL mi/o. Note that it is version implemented is DSL mi/o v5.0a. 2) Transducer:
Choose the type of transducer used for the audiometry. Select between Head phone, Insert, Insert + mould, Sound field 0 deg., Sound field 45 deg., Sound field 90 deg., and ABR estimated hearing level. This will af fect the threshold indications and thereby the target calculation.
3) Hearing instrument style: Select the type of hearing aid the client is f itted with. Choose between Behind the ear, In
the canal, In the ear, Body style, Deeply inserted completely in the canal, and Shallow completely in the canal. This will add a correction to the measurement during RECD based verif ication in the test box.
4) Hearing aid type: Choose the type of amplif ication. Select between Linear and Nonlinear using the check
boxes. 5) Environment type:
Select the environment in which the measurement is performed. Choose between Quiet and Noisy. For example, an air conditioner may af fect the measured curve in which case the target should be higher.
6) Orientation for REUR/REUG: If using a predicted REUR/REUG select orientation. Choose between 0 Deg, 45 Deg, and
90 deg using the check boxes. 7) Vent size:
Set the vent size of the hearing aid using the dropdown. Select between None, 1 mm, 2 mm, 3,5 mm, Custom, and Open.
8) Number of hearing aids: Set whether the f itting is Monaural or Binaural using the tick boxes.
.

D-0004576-Q – 2022/05 Affinity/Equinox2.0 – Additional Information Page 235
2.8.4.2 NAL-NL2 settings
1) Default prescription: • NAL-NL2.
2) Transducer: • Choose the type of transducer used for the audiometry. Select between Head phone, Insert,
Insert + mould, Sound field 0 deg., and sound field 45 deg. This will af fect the threshold indications and thereby the target calculation. Note: It is important to choose the correct settings in this dropdown. E.g., if your audiogram is done in head phones but inserts are selected as transducer, no target will be calculated.
3) Hearing instrument style: • Select the type of hearing aid the client is f itted with. Choose between Behind the ear, In the
canal, In the ear, and Completely in the canal. This will add a correction to the measurement during RECD based verif ication in the test box.
4) Hearing aid type: • Choose the type of amplif ication. Select between Linear and Nonlinear using the check boxes.
5) Tubing: • Select the hearing aid tubing. Choose f rom Libby 4, Libby 3, #13, Thin Tube, RITC (receiver in
the canal) 6) Limiting:
• Set the limiting to Off, Wide-band, and Multi-band. Multi-band will automatically be selected as standard. Note that limiting information regarding individual hearing aids may be found in the manufacturers’ specif ication sheets or by contacting the manufacturer.
7) Compression speed: • Compression speed is used for determining the compression ratio which is lowered for fast
acting compressions for severe/profound hearing losses (making the f luctuations in the signal more obvious) for this group of users. Select between Slow (<50ms), Dual (Intermediate or dual/adaptive compression), or Fast (>300ms).

D-0004576-Q – 2022/05 Affinity/Equinox2.0 – Additional Information Page 236
8) Orientation for REUR/REUG: • If using a predicted REUR/REUG select the orientation. Choose between 0 Deg, 45 Deg.
using the check boxes. 90 Deg is not available for NAL-NL2 9) Vent size:
• Set the vent size of the hearing aid using the dropdown. Select between Tight, Occluded, 1 mm, 2 mm, 3 mm, and Open.
10) Number of hearing aids: • Set whether the f itting is Monaural or Binaural using the tick boxes
11) Threshold (dB): • Type in the preferred knee-point in the white section which is set to 50 by default
12) Audiogram type: • Select to use bone conduction values in the target calculation
13) Language: • Select the type of language: Tonal or Non-Tonal. This will add a correction to the target
calculation based on whether a language is tonal (like many Asian languages) or non-tonal (like many European languages).
14) Channels: • Set the number of channels that your hearing aid has. You have the possibility to select f rom
1 - 18, if your hearing aid has more then set it as 18. Please consult the hearing aid manufacturer regarding what to apply here.
2.8.4.3 NAL-NL1 settings

D-0004576-Q – 2022/05 Affinity/Equinox2.0 – Additional Information Page 237
1. Default prescription:
NAL-NL1. 2. Transducer:
Choose the type of transducer used for the audiometry. Select between Head phone, Insert, Insert + mould, Sound field 0 deg., and sound field 45 deg. This will af fect the threshold indications and thereby the target calculation. Note: It is important to choose the correct settings in this dropdown. E.g., if your audiogram is done in head phones but inserts are selected as transducer, no target will be calculated.
3. Hearing instrument style: Select the type of hearing aid the client is f itted with. Choose between Behind the ear, In the
canal, In the ear, and Completely in the canal. This will add a correction to the measurement during RECD based verif ication in the test box.
4. Hearing aid type: Choose the type of amplif ication. Select between Linear and Nonlinear using the check boxes.
5. Tubing: Select the hearing aid tubing. Choose f rom Libby 4, Libby 3, CFA#2 Horn, CFA#3 stepped bore,
#13,6CS, 6C10, None. 6. Limiting:
Set the limiting to Off, Wide-band, and Multi-band. Multi-band will automatically be selected as standard. Note that limiting information regarding individual hearing aids may be found in the manufacturers’ specif ication sheets or by contacting the manufacturer.
7. Orientation for REUR/REUG: If using a predicted REUR/REUG select orientation. Choose between 0 Deg and 45 Deg using
the check boxes. 90 Deg is not available for NAL-NL2 8. Vent size:
Set the vent size of the hearing aid using the dropdown. Select between Tight, Occluded, 1 mm, 2 mm, 3 mm, and Open.
9. Number of hearing aids: Set whether the f itting is Monaural or Binaural using the tick boxes
10. Threshold (dB) Type in the preferred knee-point in the white section which is set to 50 by default
Audiogram type Select to use bone conduction values in the target calculation.
2.8.4.4 Print layout settings The REM440 module allows for setting up individual print layouts. This is done in the Print Wizard which is entered using the Print Wizard button (read about the Print Wizard in section 4.1).

D-0004576-Q – 2022/05 Affinity/Equinox2.0 – Additional Information Page 238
2.8.5 Finishing the test protocol Press OK in the lower right-hand corner of the AC440 setup screen to save the customized test protocol.
The test protocol can then be found in the List of Protocols dropdown list on the f ront screen.
2.8.6 Changing a test protocol permanently You can at any time make changes to an individual test protocol by entering the REM440 setup again as when creating the test (Menu/Setup/REM440 setup).
1

D-0004576-Q – 2022/05 Affinity/Equinox2.0 – Additional Information Page 239
1) Choose your test protocol in the Selected protocol dropdown list. 2) Browse the setup options as if creating a test protocol (see section 2.6.2). 3) When f inished click OK (or Apply) to save the changes.
2.8.7 Changing a test protocol temporarily You may f rom time to time run into a client with special requirements for advanced or dif ferent testing parameters. In this situation the Temporary Setup can be helpful. The setup changes made here will be specif ic to the session. The test protocol name will be supplemented with an asterisk (*) to indicate that changes have been made to original test protocol. After saving, the protocol will revert to the default selected protocol making you ready for your next client.
Enter the Temporary Setup by clicking the button in the f ront screen (or alternatively select Menu/Setup/Temporary setup).
2.8.8 Importing and exporting test protocols The REM440 also allows you to import and export test protocols to other REM440 users.
2.8.8.1 Importing a test protocol 1) Go to REM440 Setup (Menu/Setup/REM440 Setup) 2) Click Import and browse to the location on the PC or USB where the test protocol f ile has been saved. 3) Click Open. 4) The test protocol will then appear under Selected Protocol.
Af ter saving it by clicking OK the test protocol can be selected in the List of Protocols on the f ront screen.
4 2
3

D-0004576-Q – 2022/05 Affinity/Equinox2.0 – Additional Information Page 240
2.8.8.2 Exporting a test protocol 1) Go to REM440 setup (Menu/Setup/REM440 setup). 2) Click on Export. 3) Select if the f ile is to be saved as “read only”. In this case the protocol file is locked and the clinician
receiving it will not be able to make changes to it.
4) Browse for the location on the PC or USB where the test protocol is to be placed. 5) Click Save. Other REM440 users will then be able to upload the test protocol using the Import
function.
4
2
5

D-0004576-Q – 2022/05 Affinity/Equinox2.0 – Additional Information Page 241
2.9 General setup In the General Setup you can select overall settings which are valid for all tests.
To enter the General setup, select Menu/Setup/General Setup
In-situ loudspeaker: Select the speaker output through which the stimuli for the real-ear measurements are presented. FF2 or FF1: If using the Af f inity2.0 /Equinox2.0 with one or multiple external f ree f ield
loudspeakers select FF1 or FF2 and plug the speaker into the corresponding outputs on the hardware.
FF2 (Left) + FF1 (Right): If you wish to use FF2 for the lef t ear and FF1 for the right ear select FF2 (Left) + FF1 (Right).
Internal: This is only an option when using the Af f inity 2.0 hardware. In this case the system will automatically choose Internal meaning that the stimuli will be presented f rom the loud speaker in the Af f inity 2.0 lid by default.
Use line output: This is only an option when using the Af f inity 2.0 or Equinox2.0 hardware. It is used when two external f ree f ield speakers are connected. Ticking the check box will ensure that only the f ree f ield speaker corresponding to the ear being measured is presenting the stimulus.
Insitu headset socket41: Left: If ticking this option, the system will only use the lef t Insitu socket. This would mean that
when changing ear, the in-situ headset should follow. Right: If ticking this option, the system will only use the right Insitu socket. This would mean
that when changing ear, the in-situ headset should follow. Left and Right: This option is selected by default. Both sides of the Insitu headset are then in
use. Environmental noise
Show warning: Ticking this option will prompt the sof tware to show a warning screen if the ambient noise in the environment reaches a level which can af fect the measurement.
Warble adjustment: Modulation Rate: Select a modulation rate for Warble Tone stimuli (in Hz) using the slider. Frequency Deviation: Select a f requency deviation for Warble Tone stimuli (in %) using the
slider.
41 The Insitu Headset Socket options are only available on the Affinity2.0/Equinox2.0
2 3 5
4 6
7 9 8
10

D-0004576-Q – 2022/05 Affinity/Equinox2.0 – Additional Information Page 242
Protected settings: To activate password protection of the REM440 write the password selected under
Menu/setup/Password protection and tick Protect settings. All options will then be greyed out in the REM440 setup. This prevents protocol changes f rom happening accidently.
Note: Prior to password activation a password must be selected under Menu/setup/Password protection (see section 0)
Sound file folder: If you prefer to use a stimulus not found in the REM440 stimulus selection you can use other
sound f iles saved on your PC via the Sound File Folder. Press the button to browse for the f iles on the PC. Note that the f iles need to be in .wav format, have a sample f requency of 44100 Hz, and a resolution of 16 bit. Both mono and stereo f iles can be used.
Test box loudspeaker: Select the preferred coupler test box for coupler verif ication. Internal: This option refers to the Af f inity2.0 built-in test box. External: This refers to an external test box such as TBS25 which can be used with the
Af f inity2.0 and Equinox2.0. Chart settings:
Show detailed gridlines: Tick this option to have detailed gridlines on the graph as illustrated below:
Auto colour: Tick this option to have the system automatically pick a
new colour for each measured curve. Show hide icons:
Press the button to customize the test screen. Use the tick boxes to decide which buttons and dropdown lists should be available f rom the f ront screen.

D-0004576-Q – 2022/05 Affinity/Equinox2.0 – Additional Information Page 243
2.10 The REM 440 menu items The REM440 Menu gives you access to File, Edit, View, Mode, Setup, and Help. 1) Menu/File
Menu/File/Print will prompt the system to print using the selected print template (see section 4.1) Menu/File/Print Preview prompts a print preview of the current protocol using the print template
which is linked to the current protocol. Note that you are prompted to select a template if the protocol did not include a template (see how to create a print layout in section 0)
Menu/File/Print Layout opens the print wizard window f rom where you can select or create a template to print the current protocol (see section 4.1 for details regarding the Print Wizard).
2) Menu/Edit Menu/Edit/Delete will prompt the system to delete the selected curve. Menu/Edit/Delete all will prompt the system to delete all measured curves. Menu/Edit/Export will prompt the system to export the session as an XML formatted f ile. Menu/Edit/Session information will prompt a window where you can type in your own data
regarding the test situation. The text will be specif ic for each session. 3) Menu/View
Menu/View/Combined screen will activate the combined screen view function (see section 0) Menu/View/Left ear will activate the lef t ear in the f ront screen. Menu/View/Right ear will activate the right ear in the f ront screen. Menu/View/Both Ears will activate both ears at the same time in the f ront screen (this can also be
obtained by right clicking on the ear icon) Menu/view/Save window position will save the current position of the REM440 window on the PC
screen so that it opens at this exact position every time. This is for example practical if you are usually running and viewing other sof tware modules (such as f itting software) at the same time. Using this function for moving and/or resizing of the REM440 will only be necessary once. Note that on-top mode is also available (see section 0)
4) Menu/Mode Menu/Mode/Single measurement will set the system to present the selected stimulus as a single
sweep. Menu/Mode/Continuous measurement will set the system to present the selected stimulus
continuously. Menu/Mode/Probe placement will activate the probe tube placement tool.
If uncertain about the placement of the probe tube the probe tube placement tool may be of assistance. Pressing the button will prompt a 6000 Hz tone. When the column is as low as possible, mark this position on the probe, add 10 mm and a correct probe placement (3-6 mm from the ear drum) will be obtained (Sullivan 1988). Press the button again when f inished.
1
2 3
4 5
6

D-0004576-Q – 2022/05 Affinity/Equinox2.0 – Additional Information Page 244
5) Menu/Setup
Menu/Setup/REM440 setup opens the REM440 where you can setup customised test protocols (see section 2.6 for details)
Menu/Setup/General setup opens the General setup where settings valid for all tests can be selected (see section 2.7 for details)
Menu/Setup/Temporary setup opens the Temporary setup where temporary settings for the specif ic session can be selected (see section 07 for details)
Menu/Setup/Password protection allows you create or change a password and thereby protect your REM440 settings. Press Change password and type in the preferred password. Then press OK. Note that your password needs to be activated in Protected settings under Menu/setup/General setup (see section 2.7).
Menu Setup/Show/hide protocols prompts a screen allowing you to tick test protocols which are to be shown in the List of Protocols and untick the test protocols which are to be hidden.
Menu/Setup/Show/hide stimuli prompts a screen allowing you to tick which stimuli are to be shown in the Stimulus selection drop down list and untick the stimuli which are to be hidden.
Menu/Setup/Language opens the language selection. The system must be restarted for a new language selection to take ef fect.
Menu/Setup/General suite settings is relevant if the VIOT video otoscope is installed. When the otoscope is connected a tab will appear in the upper right-hand corner of the screen.
If you wish the VIOT tab to show even when the equipment is not connected, tick Always show VIOT tab in the General suite settings.

D-0004576-Q – 2022/05 Affinity/Equinox2.0 – Additional Information Page 245
6) Menu/Help Menu/Help/About REM440 prompts a message box showing information regarding the Suite
version, Hardware version, and Firmware version. Please note that if experiencing problems with the system this information should be sent to the manufacturer along with the description of the issue. (Your instruments serial number will also be required). Note: Press License to be able to type in a new license code.
Menu/Setup/About DSL mi/o will prompt a reference to University of Western Ontario on the implementation of the DSL m[i/o] version 5.0a

D-0004576-Q – 2022/05 Affinity/Equinox2.0 – Additional Information Page 246
2.12 Visible speech mapping (VSPM440)
2.12.1 About visible speech mapping Visible Speech or Speech Mapping is a term widely used amongst manufacturers of various systems. It covers a kind of verif ication-, f itting-, counselling- or sales tool that provides a live demonstration of the hearing aid features in a clear layout while the client is wearing the instruments. Visible Speech Mapping addresses the complicated task of explaining clinical and technical issues to people outside audiology. Interacoustics Visible Speech Mapping is designed to assist you in the important process of fitting and counselling. The system merges verif ication and counselling into one screen display visualizing the SPL at the ear drum with and without hearing aids respectively. As a result, you can match amplif ication to target (e.g., DSL mi/o or NAL-NL1/NAL-NL2) on the aided display and at the same time show the benef it of using hearing aids by comparing to the unaided condition. The comprehensive layout showing dynamic range, normal hearing thresholds, and sound examples assists in the process of communicating the measurement results and helping achieve realistic expectations. Various speech signals can be used with Visible Speech Mapping. The signal can be generated using a live microphone input f rom the client, their companion, the audiologist, or speech samples can be digitally imported f rom other sources. For both verif ication and counselling purposes, calibrated LTASS based speech signals such as ISTS (International Speech Test Signal) are also available. The idea is to present unaided and aided speech information to the hearing-impaired individual. Visible Speech Mapping is also available in the paediatric f itting. When it is not feasible to do real-ear measures, Visible Speech Mapping can be performed using the individual RECD (Real-Ear-to-Coupler Dif ference). Af ter measuring the RECD values, the hearing aid is positioned in the test box and verif ication, or counselling can be performed here using the same principles as for REAR/REIG. Visible Speech Mapping can be used in all sorts of ways. Clients have very dif ferent needs, and this section demonstrates the options offered by the system. The clinician can then tailor the input to meet their individual requirements. People with hearing loss are entering a whole new world with a terminology all its own. By helping them to absorb and understand what they need to know, Visible Speech Mapping makes counselling and verif ication a positive experience. Note: The Visible Speech Mapping system is based on the LTASS (Long Term Average Speech Spectrum) and the concept of time-aligned response for a given percentile of the distribution of short-term band sound pressure level of the speech signal. For each f requency band, the LTASS response is the gain averaged over the stimulus duration. Speech response is established for a given percentile for each 100 ms sample of the speech stimulus. These responses are averaged over the duration of the stimulus presentation. The system produces an estimated REAR and/or a 2cc coupler response for the LTASS and preferred percentiles of the selected signal. The recommended percentiles are the 30th, 65th and 99th percentiles. The system employs three LTASS based signals Male Speech, Female Speech, and ISTS (International Speech Test Signal). To get at precise measure, it is highly recommended to use one of these on which the calculations are based. However, other signals can also be employed if preferred by the individual clinician. Live Speech is not an option for verif ication.

D-0004576-Q – 2022/05 Affinity/Equinox2.0 – Additional Information Page 247
2.13 The visible speech mapping screen
Menu provides access to File, Edit, View, Mode, Setup, and Help (see section 0)
Print button allows for printing the sessions acquired data (see section 4.1)
Save & New Session button saves the current session in Noah4 or OtoAccess® and opens a new one.
Save & Exit button saves the current session in Noah4 or OtoAccess® and exits the Suite.
Change Ear button allows you to toggle between right and lef t ear. Right click on the ear icon to view both ears. Right click for binaural testing.
Toggle between single and combined screen button toggles between viewing one or multiple measurements on the same REM graph.
Toggle between single and continuous measurement button toggles between running a single sweep or having a test signal running continuously until pressing STOP.
Right click

D-0004576-Q – 2022/05 Affinity/Equinox2.0 – Additional Information Page 248
Freeze curve allows for taking a snapshot of a REM curve when testing with broadband signals. In other words, the curve f reezes at a particular moment while the test continues. Note that if too many curves are f rozen on the screen not all will be saved in Noah4 due to imposed limitations.
Select protocol to use from the list allows to you to select a test protocol for the current test session (see section 2.6.2 for more information about protocols).
Temporary Setup button allows for making temporary changes to the selected protocol. The changes will be valid for the current session only. Af ter making the changes and returning to the main screen, the name of the protocol will be followed by an asterisk (*).
List of historical sessions accesses historical sessions for comparison purposes (see section 0).
Go to Current Session button brings you back to current session.
Toggle between coupler and ear button allows you to toggle between
real-ear and coupler mode. The icon only becomes active if a RECD measurement is available.
Report Editor button opens a separate window for adding notes to the current session. Note that af ter saving the session no changes can be added to the report af ter the date has changed (see section 4.2)
Single frequency button represents an optional manual test that allows for pre-setting hearing aid gain prior to real-ear or coupler testing. Place the hearing aid in the ear (together with the probe tube) or coupler and press the single f requency button. A 1000 Hz tone will then appear allowing you to see the exact input and output of the hearing aid. Press the button again to end the test.
Tube calibration button activates the tube calibration. Before measuring it is recommended to calibrate the probe tube. This is done by pressing the calibration button. Follow the instructions appearing on the screen (see screen below) and press OK. The calibration will then automatically be performed resulting in the curve below. Note that the calibration is sensitive to noise and the clinician should therefore ensure that the room is quite while calibrating.

D-0004576-Q – 2022/05 Affinity/Equinox2.0 – Additional Information Page 249
Normal and reversed coordinate system buttons enable you to
toggle between reversed and normal graphs. This may be helpful for counselling purposes since the reversed curves look more like the audiogram and may therefore be easier for the client to comprehend.
Table view button provides a chart view of the measured and target values
Show cursor on graph provides information about each specif ic measured point on the curve. The cursor is “locked” to the curve together with f requency and intensity label placed at the cursor’s position, as illustrated below:
Stimulus selection dropdown list allows for selecting the test stimulus.
Monitor: If you wish to listen to the amplif ied stimulus through a monitor.
1. Connect a monitor speaker to the monitor output on the hardware.
2. Tick the Monitor check box.
3. Use the slider to turn the sound level up and down.

D-0004576-Q – 2022/05 Affinity/Equinox2.0 – Additional Information Page 250
Note that the sound f rom the monitor may be very sof t (compared to the audiometry monitoring). It is louder for audiometry because the audiometric equipment is producing the signal that is monitored. In REM440 the hearing instrument produces the monitored signal meaning that it cannot be controlled by the equipment. However, if you have an active speaker, it will be louder. External sound: You can present an external sound through a CD player if you have a piece of music/speech you wish to use. This may have a strong ef fect for counselling purposes.
1. Connect the CD player to the CD1 input on the hardware. 2. Press START in the sof tware and then tick the External
sound check box. The external sound will then play together with the signal.
3. Use the slider to turn the sound level up and down. Note that in Visible Speech Mapping you can select Live Voice and then play an external sound. This means that you will have the external sound alone with nothing interfering, except f rom your own voice.
Current Protocol is listed in the lower lef t-hand corner. Upon performing a test, the system automatically jumps to the next one in the test f low. A tick (√) indicates that a curve has been measured. Protocols can be created and adjusted in the REM440 setup (see section 2.6.2).
START/STOP button initiates and ends all tests. Note that af ter pressing START the text on the button will change to STOP.
VU-meter: The input signal can be monitored on the VU-meter. 65 dB is marked helping the clinician to f ind the level of normal speech
If Show Examples is ticked during the test the graph display will show illustrations of everyday sounds for matching up real life examples to the hearing loss.

D-0004576-Q – 2022/05 Affinity/Equinox2.0 – Additional Information Page 251
1. The ear/coupler mode indicates which side is being tested next to a label showing whether the test is performed in an aided or unaided ear.
2. SII (Speech Intelligibility Index) of the current input signal is expressed in a percentage.
3. UCL (Uncomfortable Levels) will be shown in shading at the top of the graph if entered in the audiogram screen.
4. Hearing thresholds converted to SPL is indicated in shading at the bottom. Together with the UCL they form a dynamic range view.
5. Hearing aid response is indicated in blue/red (corresponding to the ear tested). This is compared to the chosen f itting target indicated in grey.
6. Display peaks and valleys/Percentile analysis is indicated as a blue/red shaded area (corresponding to the ear tested) surrounding the hearing aid response (see more information in section 0 and 0)
Show/Hide fitting prescription and test information: Using the arrow to the right you can choose to show or hide f itting prescription details and test information. The dropdowns allow for changing details during the measurement. Choose a f itting prescription f rom a selection of Berger, DSL m[i/o], Half Gain, NAL-NL1, NAL-NL2, NAL-R, NAL-RP, POGO1, POGO2, and Third Gain. Based on the selected f itting prescription (and the audiogram) targets are calculated and shown in Visible Speech Mapping screen if NO audiogram has been entered into the audiogram screen no targets will be displayed. Note: f itting prescription settings (such as Age and Client type) will dif fer depending on what f itting prescription is selected.
Measurement details of the selected curve are displayed as a table on the right-hand side of the screen.

D-0004576-Q – 2022/05 Affinity/Equinox2.0 – Additional Information Page 252
Curve comment for each curve can be typed into the comment section on the right-hand side. Select a curve using the curve tag boxes under Curve display options and write a comment in the comment section. The comment will then appear in the comment section whenever the curve is selected.
Curve display options are found in the lower right-hand corner. If you have measured more VSPM curves, they will be listed by their input level. Tick the ones that are to be displayed on the graph.
Hardware indication picture indicates whether the hardware is connected. When opening the Suite, the system will automatically search for the hardware. If it does not detect the hardware a dialog box pops up and asks if you want to continue in simulation mode.

D-0004576-Q – 2022/05 Affinity/Equinox2.0 – Additional Information Page 253
2.14 Verification with visible speech mapping
2.14.1 Considerations before you begin Visible Speech Mapping can be run side by side with the relevant f itting software. Af ter f itting the hearing aid, Visible Speech Mapping can be used to verify if the client’s speech area is amplif ied suf f iciently using these stimuli: ISTS, Male Speech, or Female Speech. Visible Speech Mapping can be used as a verif ication measure and does therefore not necessarily need to be performed together with an Insertion Gain measurement. Visible Speech Mapping provides a precise measure of the SPL at the ear drum matched up to a f itting target selected by the clinician. The following description introduces the clinical use of Visible Speech Mapping. The system can be used in all sorts of ways. Clients have very dif ferent needs, and this section demonstrates the options of fered by the system.
2.14.2 Visible speech mapping (in ear mode) 1) Open the REM440 module. 2) Select a test protocol that includes Visible Speech Mapping in the List of Protocols.
3) Explain the procedure to the client. 4) Perform otoscopic examination. 5) Mount the probe tube on the in-situ headset and place it on the client who should be seated ½-1
meters f rom the speaker. Ensure that the probe tubes are calibrated before placing them in the ear canal (see section 0 about tube calibration).
6) Carefully insert the hearing aid without moving the probe tube. Ensure that the instruments are switched on.
7) If f itting an open hearing aid solution, perform Calibrate for open fit (see section 0). 8) Click on the Visible Speech Mapping button if it is not already marked automatically.
Note: A right click on Visible Speech Mapping button allows you to enter the Settings menu or Change colour of the curve.
9) Check that the information about client, f itting prescription and hearing aid to the right are correct by pressing Show fitting prescription and test information.

D-0004576-Q – 2022/05 Affinity/Equinox2.0 – Additional Information Page 254
10) Ensure that the correct Ear is selected .
If you wish to measure on both ears right click on the ear icon 11) Choose the preferred Stimulus in the corresponding dropdown list . Male Speech, Female,
Speech, and ISTS are recommended. Note the option to use Live Voice. If you have done Calibrate for open f it only the signals used for this calibration are available in the stimulus selection dropdown (see section 0).
12) Select input level using the Input level slider 13) Click START and the Visible Speech Mapping will be performed.
Ensure that the hearing aids are switched on and that the room is quiet while the curve is obtained. 14) Verify and f ine-tune to your chosen f itting prescription; DSL mi/o or NAL-NL1/NAL-NL2. Use On Top
Mode to compare to the hearing aid manufacturer’s sof tware .
2.14.3 Visible speech mapping (in coupler mode/test box mode) 1) Open the REM440 module. 2) Select a test protocol that includes Visible Speech Mapping and RECD in the List of Protocols.
3) Explain the procedure to the client/relatives. 4) Perform otoscopic examination. 5) Perform the RECD with the client’s own ear mould or the SPL probe (see section 0). Also note the
option to select a predicted RECD (see section 0). 6) Place the hearing aid in the test box as shown below and ensure that it is switched on.
It is important that the reference microphone is placed in the same acoustical point as the microphone in the hearing aid. The placement may therefore dif fer a little depending on the hearing aid you are testing.

D-0004576-Q – 2022/05 Affinity/Equinox2.0 – Additional Information Page 255
7) Click on the Visible Speech Mapping button if it is not already marked automatically.
Note: A right click on Visible Speech Mapping button allows you to enter the Settings menu or Change colour of the curve.
8) Check that the information about client, f itting prescription and hearing aid to the right are correct by pressing Show fitting prescription and test information.
9) Ensure that the correct Ear is selected . Note that Both ears are not an option for coupler mode
10) Choose the preferred Stimulus in the corresponding dropdown list. Male Speech, Female, Speech, and ISTS are recommended. Note the option to use Live Voice. In this case the test box lid should be lef t open.
11) Select input level using the Input level slider
12) Click START and the Visible Speech Mapping will be performed. Ensure that the hearing aids are switched on and that the room is quiet while the curve is obtained.

D-0004576-Q – 2022/05 Affinity/Equinox2.0 – Additional Information Page 256
13) Verify and f ine-tune to your chosen f itting prescription. DSL mi/o or NAL-NL1/NAL-NL2. Use On top
mode to compare to the hearing aid manufacturers’ sof tware .

D-0004576-Q – 2022/05 Affinity/Equinox2.0 – Additional Information Page 257
2.15 Visual tools for counseling and verification
2.15.1 Percentile analysis The Percentile Analysis can be added in the REM440 setup (see section 0.1) The Percentile Analysis is implemented according to the IEC 60118-15 standard. By default, the 30th, 65th, and 99th percentile are selected. These percentiles are calculated based on an FFT analysis of 100 measurements. The 30th percentile (indicated in blue shading) is the sound pressure level below which 30% of the measured levels are found for each f requency. The remaining 70% of the measured sound pressure levels are higher. The 30th percentile thereby represents the lower valleys or the sof t components of the speech signal. This helps you ensure that even the sof t valleys are above thresholds. The 99th percentile (indicated in green shading) is the sound pressure level below which 99% of the measured levels are found for each f requency. The 99th percentile may be interpreted as a peak indicator which helps to ensure that no peaks come too close to the MPO and/or UCL’s. In other words, the 99th percentile represents the loud components of the speech signal. Together the 30th and 99th percentile provides an “area of audibility”. The 65th percentile serves as a borderline between the 30th and 99th percentiles and is visually represented at the point where the blue and green areas meet. The 65th percentile represents the median whereas the measurement is the average of the FFT analysis of the 100 measurements.
Picture note: On this illustration the percentile analysis reveals important information about the hearing aid f itting. At 3-4 kHz the peaks of the signal (the 99th percentile) are too close to the UCL. However, we also see that even though we cannot f it above thresholds the client is still getting some speech information in this f requency area since the 99th percentile is above thresholds. In the low f requency area, we can see that even though the curve is above threshold, and we match target, the lower valleys (30th percentile) are not above thresholds and the client is thereby missing information.

D-0004576-Q – 2022/05 Affinity/Equinox2.0 – Additional Information Page 258
2.15.2 Display peaks and valleys Display peaks and valleys can be added in the REM440 setup (see section 0) When Display peaks and valleys is ticked you will have the view illustrated below. The peaks and valleys are shaped according to the LTASS and are the same as the 30th and 99th percentile in the Percentile Analysis described in section 0.
2.15.3 Show examples Tick Show Examples and show the speech area together with sound examples f rom real life like a dog barking or the wind rustling leaves.

D-0004576-Q – 2022/05 Affinity/Equinox2.0 – Additional Information Page 259
2.15.4 Speech intelligibility index As a supporting feature the SII (Speech Intelligibility Index) indicates improved audibility expressed in a percent on the aided display. SII is a method for computing a physical measure of the intelligibility of speech. The method is based on results of the speech perception tests in each group of talkers and listeners. The SII is calculated f rom acoustical measurements of speech and noise, considering the level of the distortion factor at standard speech level. (www.sii.to)
2.15.5 Speech spectrum Add a Speech spectrum view by right clicking on the graph. This is useful when explaining the importance of speech audibility and/or language development.

D-0004576-Q – 2022/05 Affinity/Equinox2.0 – Additional Information Page 260
2.15.6 Dynamic range view The hearing thresholds converted to SPL and the UCLs provide a dynamic range view. This provides the option to show that speech sounds are above thresholds and are within the area where the client can hear (but without being uncomfortably loud). You can demonstrate the reason why the relatives/loved ones do not need a hearing aid, but the client does by pointing out the Normal Hearing thresholds marked in red. Perhaps present a loud input or speak loudly to visualise the compression of sounds in the hearing aid and point out that peaks in amplif ied sound never go beyond the MPO and UCLs.
2.15.7 Aided versus unaided If the client/relatives have no experience with hearing aids, it may be a good idea to focus on the dif ference between the aided and unaided. This helps to demonstrate the hearing aid benef it ef fect and the importance of wearing instruments. If f itting children, this also gives a good basis for discussing language development. Note that the unaided graph shows the dB SPL at the reference microphone and the aided graph shows the SPL at the ear drum. . 2.16
Normal hearing thresholds
Dynamic range

D-0004576-Q – 2022/05 Affinity/Equinox2.0 – Additional Information Page 261
2.16 Visible speech mapping settings Visible Speech Mapping with individual settings can be added to a test protocol the same way as other REM tests (see section 2.6.2) 1) Enter the REM440 setup (Menu/Setup/REM440 setup) and add Visible Speech Mapping to the test
protocol.
2) Ensure that Visible Speech Mapping is marked in the lef t-hand side of the screen. The name of the test will then appear in the Name of selected test section. Note the option to write a new name for the test in this section (e.g., “Visible Speech Mapping 65 dB”)
3) Stimulus selection Input Level: Set the input level using the slider. Preconditioning: This is relevant when using broadband signals such as ISTS. Select a time
using the slider. Stimulus type: Select a stimulus using the dropdown list. Note that Live Voice is also an option.
However, this is not a calibrated test signal and should therefore only be used for counselling purposes.
Smoothing Index: You have the option to smooth the measured curve using the slider. The higher the index number selected the more smoothing is applied.
Continuous: This check box allows you to make the measurement ongoing rather than a single sweep. This may, however, also be done in the f ront screen using the continuous button:
When continuous is ticked, the stimulus and recording will continue until you press the STOP button. This can be practical for example when using Live Voice.
Start Frequency and Stop Frequency: Select the preferred f requencies using the sliders. These may for example be set so that they correspond with the hearing aid gain handles (e.g., if the hearing aid goes up to 8000 Hz there is no reason to measure beyond this f requency).
Sweep delays: This is relevant if Continuous measurement is selected for Pure Tone or Warble Tone. In this case sweep delays (in milliseconds) may be entered between the individual sweeps.

D-0004576-Q – 2022/05 Affinity/Equinox2.0 – Additional Information Page 262
Measurement time (in seconds): Duration for the measurement can be set using the slider. This is only relevant for broad band signals. A number of seconds can f reely be selected between 1 and 1200. By default, the measurement time is the same for all signals.
Instructions: This allows for adding picture instructions. If the box is ticked an instruction box explaining how to perform the measurement will appear upon pressing START.
4) Display: Display Peaks and Valleys: This is relevant when using a broad band signal. When ticking the
check box, the REM440 will show the measured maximum and minimum area in the speech spectrum over time (5 seconds) on screen. The measurement is independent of the selected measurement time.
1/3 octave and overlapping time window: For speech-like signals, the signal is converted into an FFT and then sampled. The clock f requency of the Af f inity is 44100 Hz, and we do 1024 samples per second. This means that the time period for each sample is 23 ms.
Percentiles for full measurement: activate this box if you want to see the intensity components in dif ferent shaded percentile sections – these are customisable and will show the output as a shaded range on the graph.
Show dynamic compression ratio: Enabling this feature will display the dynamic compression ratios when the 1/3 octave and overlapping time windows option is enabled.
Set settings to IEC 60118-15: use this button to set the measurement settings according to the IEC 60118-15 standard 42 this will amend the settings mentioned above to meet this conf iguration description.
Show target: This will add the f itting target f rom the screen or REM440 setup (see section 2.6.4) by default.
Show SII: This will add the Speech Intelligibility Index to the graph (see section 0) Show MPO: This will remove the MPO when using the DSL mi/o f itting prescription in Response
view. Percentile analysis: Here percentiles can be selected for the percentile analysis (see section 0).
The recommended percentiles are 30th, 65th and 99th. When Display peaks and valleys is ticked it is NOT possible to set percentiles under Percentile analysis.
5) Recording method: Resolution (of f requency): Select the preferred resolution in the dropdown. The higher the
resolution the slower the measurement. Keep in mind that 1/3 is what is used in many hearing aid manufacturers sof tware. If the curve is to be compared to this, you may consider choosing this resolution. Also note that when using a broad band signal the dropdown list will be greyed out and automatically choose FFT. This makes the distance between f requency bins 43 Hz which ensures precision in the measurement.
6) Color: Select a color for the Right and Left curve.
Press each of the buttons to have the custom color selection below. Choose the desired color by clicking on it and press OK.
Note the option to Define Custom Colors and get a more extensive selection. When having found the exact color, press Add to Custom Colors.
42 For detailed information, please refer to the IEC 60118-15 standard.

D-0004576-Q – 2022/05 Affinity/Equinox2.0 – Additional Information Page 263
2.17 FAQ Question: After I accidently disconnected the USB my system behaves strangely – what could be the cause? Answer: If the USB is disconnected during testing the sof tware suite should be restarted. Otherwise, the connection may be af fected, and testing may be compromised. Question: There is no target on my screen. What could be the reason? Answer:
1. Please check that you have typed in or selected an audiogram in the AUD tab. If no audiogram is present the system cannot calculate a target
2. Please check that the transducer you have selected in the Fitting prescription options corresponds to the transducer used for the selected audiogram
3. For NAL-NL1/NAL-NL2 please make sure that all important f requencies are included in the audiogram (e.g., 500, 1000, 2000, and 4000 Hz). This also corresponds for Bone conduction targets where you need the BC values.
Question: What is the broad band sound before some measurements, and can it be switched off? Answer: The broad band noise that you hear before a measurement starts is presented ONLY when using broad band test stimuli or wave f iles. This type signals must thus be preceded by this preconditioning and calibration, and it cannot be switched of f . During the calibration/preconditioning the distance between the loudspeaker and the reference microphone on the in-situ headset is measured. This ensures a precise measurement. If this calibration does not take place, you cannot be sure if the correct input level enters the ear canal and as a result you are at risk of measuring erroneous curve. Question: I have seen that when you perform REAR in Affinity2.0 REM440 using DSL mi/o fitting prescription the REAR target changes with the choice of stimulus selection (much lower target with ISTS compared to REAR target with warble or pure tone). However, REIG target remains the same whatever stimulus had been chosen. Would you please send me some information/comment about that? Answer: The REIG (pure hearing aid gain) is the same regardless of what stimulus you use. This is because the REIG is a calculation and not a measurement (REAR – REUR = REIG). The result of the calculation will be the same regardless of whether it is REAR (ISTS) – REUR (ISTS) or REAR (Warble) – REUR (Warble). Even though the REAR (ISTS) and REAR (Warble) are very dif ferent, this dif ference is also ref lected in the REUR (ISTS) and REUR (Warble). Thus, the result is the same.

D-0004576-Q – 2022/05 Affinity/Equinox2.0 – Additional Information Page 264
Question: What kind of stimulus does Interacoustics recommend being used and in different situations? Answer: ISTS is the best stimulus to use when verifying hearings aids with the hearing aid on for the measurement. This stimulus does not require the hearing aid to have specif ic features disabled and should be used as the hearing aid will be in a real-life situation (Holube et al. 2007). Choosing the correct stimuli for the purpose is extremely important as it is the basis of a good measurement with a valid result. Digital hearing aids automatically adjust the amplif ication depending on the input. This capacity, however, cannot be ref lected in a real-ear measurement unless a realistic and dynamic test stimulus like speech is used (Fabry 2004). Using tone stimuli For many years pure tones (sinusoids)/warble tones were the primary signals used for real-ear as well as coupler verif ication. Tone signals are “simple” signals and only one f requency is presented at the time. Therefore, real-ear measurements performed with tone signals do not ref lect advanced signal processing where f requencies interact (Kuk & Ludvigsen 2003). Using speech stimuli/ISTS Speech is likely to be most important signal to the hearing aid user in his or her daily life. Therefore, if you wish to verify if speech sounds are audible there is no better stimulus than speech. When using a speech signal the hearing aid will also stand its test since speech has the challenge of changing quickly in amplitude, f requency, and phase. ISTS (International Speech Test Signal) is an internationally recognized test signal. It was created based on the need for a standard test stimulus that included all the relevant properties of speech and allowed for reproducible measurement conditions. It is created f rom natural recordings of speech which is non-intelligible due to remixing and segmentation. The signal ref lects a female speaker for six dif ferent mother tongues (American English, Arabic, Chinese, French, German, and Spanish) reading “The north wind and the sun”. The ISTS is shaped according to the LTASS (Long Term Average Speech Spectrum) standards (Holube et al. 2007). Using composite signals/ICRA Artif icial signals without signif icant variation in intensity and f requency can also be used to test hearing aids in the f requencies of speech. These are called speech spectrum shaped composite signals and have the same long-term spectral characteristics as speech. The advantages in such signals are that you can test many f requencies in a short time and that interactions among f requencies can be tested. The ICRA signals (International Collegium of Rehabilitative Audiology) are examples of composite signals. They are a group of test signals developed by the HACTES group (Hearing Aid Clinical Test Environment Standardisation) to be able to do reliable measurements on non-linear digital hearing aids. They represent a number of speech weighted noise signals composed with spectral and temporal characteristics like those that are found in speech signals and babble noise. (www.icra.nu). What stimulus to choose? Which stimulus to select depends on your focus and the individual patient. If for example seeing a patient who complains about not being able to hear his wife, you may want to try the ISTS. If the patient is having trouble when more than one person is speaking, the ICRA 6pbl (or one of the other signals with multiple people speaking) may be selected. If you wish to look at the ef fects of a noise reduction, a noise signal such as Pink Noise may be the appropriate choice. Note that your choice has an impact on your result as illustrated below:

D-0004576-Q – 2022/05 Affinity/Equinox2.0 – Additional Information Page 265
References: Fabry D. (2004) Real Ear Measurements and Digital Hearing Aids: Realities, Myths, and Measurement Techniques. Phonak Focus no. 32. (www.phonak.com) Kuk, F & Ludvigsen, C. (2003) Changing with Times: Choice of Stimuli for Hearing Aid Verif ication. Hearing Review, August 2003. Holube, I & EHIMA-ISMADHA working group (2006) Short description of the International Speech Test Signal (ISTS). Center of Competence HörTech and Institute of Hearing Technology and Audiology, Oldenburg, Germany http://www.icra.nu/Prod_Noise.html
Pink Noise
ISTS
Warble Tone
ICRA 6pbl

D-0004576-Q – 2022/05 Affinity/Equinox2.0 – Additional Information Page 266
Question: When I do the REUR with an ICRA or ISTS I get a flat curve:
When I do the REUR with a warble tone I get, what I think is a correct curve:
What is the reason for this difference? Answer: With response measurements you are measuring the ear canal + the signal you are using. This means that you have two components af fecting the result. When using pure tones the signal has the same energy at each f requency. Then you get an REUR the shape like the lower image above. However, your curves above are correct as well. When you are using a broad band signal the energy is not the same at each f requency and this af fects the response measure! This can be seen f rom your own examples above. The REUG does not consider the test signal. Therefore, you don’t see a similar dif ference for the REUG

D-0004576-Q – 2022/05 Affinity/Equinox2.0 – Additional Information Page 267
Question: When I do the REUG I have to do the REAG and then I don’t see the REIG. That means that I’m not going to use this setup. I can’t choose the REIG without the REUR according to the program. Answer: In the Af f inity you don’t have to do the REAG/REAR to see the REIG. When you have done the REUR the system automatically knows that you need the REAR to calculate the REIG. When you have measured the REUR and go to REIG the system will perform the REAR in the background (without showing it on screen), to calculate the REIG.
NOTE: The Af f inity Suite demands that you do the REUR to calculate the REIG. The REIG can only be selected as part of the protocol if REUR is also a part of it. Question: How are the Monitor/External sound features used?
Answer: Monitor: If you wish to listen to the amplif ied stimulus through a monitor.
1. Connect a monitor speaker/headset to the monitor output on the hardware.
2. Tick the Monitor check box.
3. Use the slider to turn the sound level up and down. Note that the sound f rom the monitor may be very sof t (compared to the audiometry monitoring). It is louder for audiometry because the audiometric equipment is producing the signal that is monitored. In REM440 the hearing instrument produces the monitored signal meaning that it cannot be controlled by the equipment. However, if you have an active speaker, it will be louder. External sound: You can present an external sound through, for example, a CD player if you have a piece of music/speech you wish to use. This may have a strong ef fect for counselling purposes.
1. Connect the CD player to the CD1 input on the hardware. 2. Press START in the sof tware and then tick the External sound check box. The external sound will
then play together with the signal.
3. Use the slider to turn the sound level up and down. Note that in Visible Speech Mapping you can select Live Voice and then play an external sound. This means that you will have the external sound alone with nothing (except f rom your own voice/environment) interfering. Question: My Open Fit Calibration curve looks strange. Is this how it should be? Answer: Yes, this is perfectly normal. The system only needs the calibration signal to consider the open f it. It does not matter what is shown on the screen. The measurement is still correct.

D-0004576-Q – 2022/05 Affinity/Equinox2.0 – Additional Information Page 268
Question: In Visible Speech Mapping what is the purpose of percentile analysis? Answer: The Percentile Analysis implemented according to the IEC 60118-15 standard. By default, the 30th, 65th, and 99th percentile are selected. These percentiles are calculated based on an FFT analysis of 100 measurements. The 30th percentile (indicated in blue shading) is the sound pressure level below which 30% of the measured levels are found for each f requency. The remaining 70% of the measured sound pressure levels are higher. The 30th percentile thereby represents the lower valleys or the sof t components of the speech signal. This helps you ensure that even the sof t valleys are above thresholds. The 99th percentile (indicated in green shading) is the sound pressure level below which 99% of the measured levels are found for each f requency. The 99th percentile may be interpreted as a peak indicator which helps to ensure that no peaks come too close to MPO and UCL. In other words, the 99th percentile represents the loud components of the speech signal. Together the 30th and 99th percentile provides an “area of audibility”. The 65th percentile serves as a borderline between the 30th and 99th percentiles and is visually represented at the point where the blue and green areas meet. The 65th percentile represents the median whereas the measurement is the average of the FFT analysis of the 100 measurements.
Picture note: On this illustration the percentile analysis reveals important information about the hearing aid f itting. At 3-4 kHz the peaks of the signal (the 99th percentile) are too close to the UCL. However, we also see that even though we cannot f it above thresholds the patient is still getting some speech information in this f requency area since the 99th percentile is above thresholds. In the low f requency area, we can see that even though the curve is above threshold, and we match target, the lower valleys (30th percentile) are not above thresholds and the patient is thereby missing information.
30% lower valleys
99% higher peaks

D-0004576-Q – 2022/05 Affinity/Equinox2.0 – Additional Information Page 269
2.18 Appendix 1 2.19 The REM440 test signal characteristics Pure Tone f requency accuracy is ±1%. Crest factor is 3 dB. Warble Tone f requency accuracy is ±1%, warble f requency 0100 Hz and intensity 010%, sine wave f requency modulation. Crest factor is 3 dB. Random Noise is a noise with a linear spectrum measured with an FFT or a 3 dB drop per octave measured with a 1/3 octave f ilter. Pseudo random noise. Is a semi-broad-band noise produced f rom random noise weighted with a 2nd order 200 Hz high pass f ilter and a 1st order 900 Hz low pass f ilter as described in the ANSI S3.42 -1992 standard. Crest factor is 10 dB. Chirp. Is a linear f requency sweep f rom 100 to 10 kHz in 23 mS = one FFT measuring. The amplitude is constant during the sweep. Crest factor = 3 dB. Band limited white noise is a random noise signal band limited by 12 kHz 2. order low pass f ilter. Crest factor is 9 dB. ISTS is “for analyzing the processing of speech by a hearing aid, a standard test signal is necessary which allows for reproducible measurement conditions, and which features all or most relevant properties of natural speech. Those properties are e.g., the modulation spectrum and the fundamental frequency as well as its harmonics. Existing artificial signals fulfill these requirements inadequately and recordings from natural speakers represent only one language and are therefore not internationally applicable. Therefore, the European Hearing Instrument Manufacturing Association (EHIMA) has set up the ISMADHA working group and has initiated this project resulting in an International Speech Test Signal (ISTS). The ISTS is based on natural recordings but is largely non-intelligible because of segmentation and remixing. The intention is to include this test signal with a new measurement method for a new hearing aid standard” (Holube et al. 2006).
PinkNoise is a noise with a linear spectrum measured with a 1/3 octave f ilter or a 3 dB rise per octave measured with an FFT. /SS/ is a shaped IF Noise to emphasize the high f requencies. It was developed by the team at University Western Ontario (UWO) who are also responsible for the DSLmi/o f itting algorithm. /SH/ is a shaped IF Noise to emphasize the high f requencies, it contains some lower f requencies compared to the /ss/ stimuli above. It was developed by the team at University Western Ontario (UWO) who are also responsible for the DSLmi/o f itting algorithm. Both the /ss/ and /sh/ stimuli are used for verif ication of frequency lowering/shif ting technologies found in modern hearing aids. ICRA Noise:
ICRA: urgnmn Unmodulated random Gaussian noise - Male weighted - Normal ef fort - Level Ref . Crest factor = 13 dB. ICRA: urgnmr Unmodulated random Gaussian noise - Male weighted - Raised ef fort - Level Ref+5.7dB. Crest factor = 14 dB. ICRA: urgnml Unmodulated random Gaussian noise - Male weighted - Loud ef fort - Level Ref+12.1 dB. Crest factor = 14 dB. ICRA: 3bsmnfn 3 Band speech modulated noise (3bSMN) - Female weighted - Normal ef fort - Level Ref . Crest factor = 27 dB.

D-0004576-Q – 2022/05 Affinity/Equinox2.0 – Additional Information Page 270
ICRA: 3bsmnmn 3 Band speech modulated noise (3bSMN) - Male weighted - Normal ef fort - Level Ref . Crest factor = 27 dB. ICRA: 2pb1f1mn 2 persons babble, 1female 3bSMN + 1 male 2bSMN - Idealized - Normal ef fort - Level Ref + 3dB. Crest factor = 24 dB. ICRA: 6pbn 6 persons babble, 1f+1m+2f(-6db)+2m(-6dB), all 3bSMN - Idealized - Normal ef fort - Level Ref + 4.7dB. Crest factor = 23 dB. ICRA: 6pbr 6 persons babble, 1f+1m+2f(-6db)+2m(-6dB), all 3bSMN - Idealized - Raised ef fort - Level Ref + 10.7dB. Crest factor = 24 dB.
Speech Dialog Crest factor = 24 dB. Speech Female Crest factor = 20 dB. Speech Male Crest factor = 25 dB. Sound File this Crest factor is not known.
2.19.1 Signal analysis characteristics
The following table summarises the signal analysis characteristics of the Af f inity/Equinox. Broadband analysis Measurement bandwidth: 43Hz Integration time: 1 – 1200 sec. Spectrum analysis, sweep filtered Filter bandwidth: 1/3 octave Skirt slope: 12dB pr. Octave Spectrum analysis, digital means Sampling rate 44100Hz Digital resolution: 1024 FFT (43Hz) Average time: 1 – 1200 sec. Analyze bandwidth: 100 – 10000Hz Block length: 23ms Window type: Blackman Harris Window overlap: None Method: Amplitude spectrum Total f requency range: 50 – 20000Hz

D-0004576-Q – 2022/05 Affinity/Equinox2.0 – Additional Information Page 271
2.20 REM PC shortcuts
Quick Keys REM/HIT Tab Next test Shift + Tab Previous test
Shift + Mouse scroll or Shift + Arrow up/down Curve smoothing increase/decrease Mouse Scroll Offset Y axis PgUp/PgDn Offset Y axis Arrow up/down Change input level Control + R Right ear Control + L Lef t ear Control + B Both ears F2 Start/Stop F3 Toggle between right and lef t F5 Combined or individual curve view F6 Single or repeated measurement F7 Manual single f requency F8 Advanced or simple view F9 Normal or reversed coordinate system F10 Jump to current session F11 Add overlay and jump to current session F12 Freeze curve
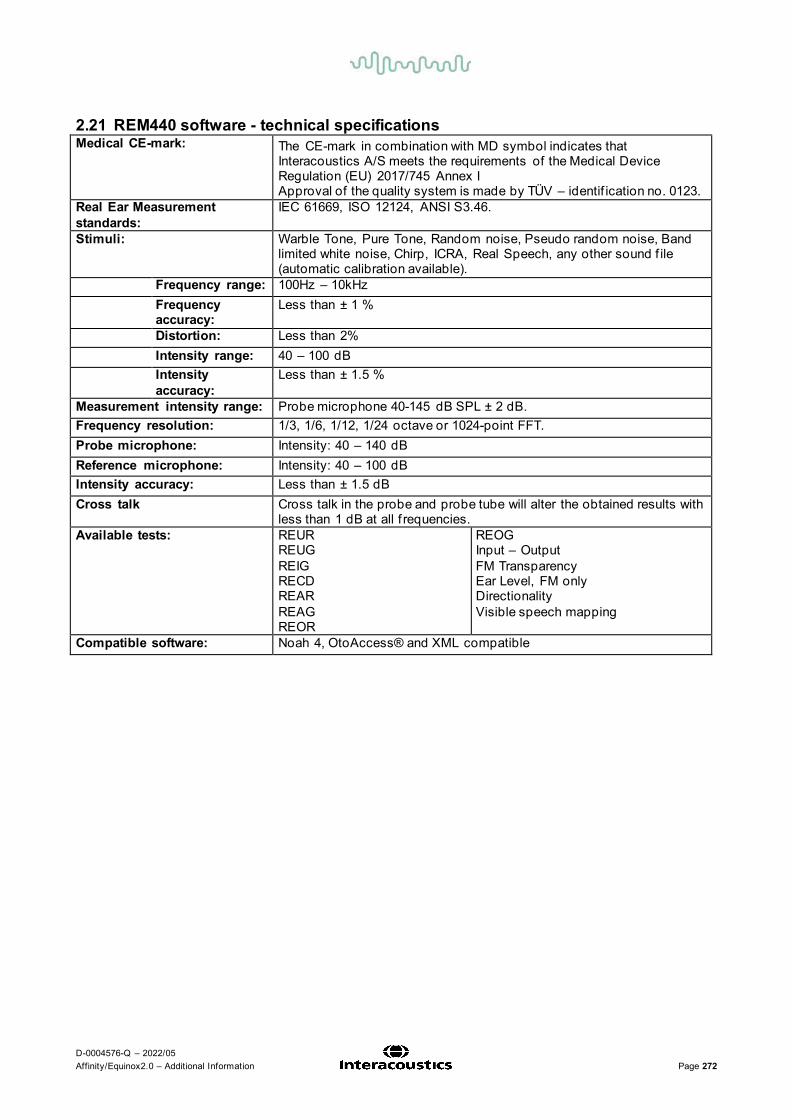
D-0004576-Q – 2022/05 Affinity/Equinox2.0 – Additional Information Page 272
2.21 REM440 software - technical specifications Medical CE-mark: The CE-mark in combination with MD symbol indicates that
Interacoustics A/S meets the requirements of the Medical Device Regulation (EU) 2017/745 Annex I Approval of the quality system is made by TÜV – identif ication no. 0123.
Real Ear Measurement standards:
IEC 61669, ISO 12124, ANSI S3.46.
Stimuli: Warble Tone, Pure Tone, Random noise, Pseudo random noise, Band limited white noise, Chirp, ICRA, Real Speech, any other sound f ile (automatic calibration available).
Frequency range: 100Hz – 10kHz Frequency
accuracy: Less than ± 1 %
Distortion: Less than 2% Intensity range: 40 – 100 dB Intensity
accuracy: Less than ± 1.5 %
Measurement intensity range: Probe microphone 40-145 dB SPL ± 2 dB. Frequency resolution: 1/3, 1/6, 1/12, 1/24 octave or 1024-point FFT. Probe microphone: Intensity: 40 – 140 dB Reference microphone: Intensity: 40 – 100 dB Intensity accuracy: Less than ± 1.5 dB Cross talk Cross talk in the probe and probe tube will alter the obtained results with
less than 1 dB at all f requencies. Available tests: REUR
REUG REIG RECD REAR REAG REOR
REOG Input – Output FM Transparency Ear Level, FM only Directionality Visible speech mapping
Compatible software: Noah 4, OtoAccess® and XML compatible

D-0004576-Q – 2022/05 Affinity/Equinox2.0 – Additional Information Page 273
3 HIT440 3.1 HIT440 quick guide
1) Open Noah and select the patient you want to work with:
2) Select the Af f inity module f rom the Noah Module menu
3) Select the HIT Icon in the upper right corner of the screen:
IMPORTANT NOTE: The hearing instrument needs to be in FULL ON GAIN MODE/TEST MODE to compare the results to the hearing aid manufacturers’ technical data sheets. Each hearing aid manufacturer has a dif ferent way of accessing this Test Mode. Please check with the hearing aid manufacturers for instructions on how to program the hearing aid into TEST MODE.

D-0004576-Q – 2022/05 Affinity/Equinox2.0 – Additional Information Page 274
4) Position the Hearing Aid in the test box:
BTE: Connect the 2 cc coupler to the BTE adaptor. Place the coupler tube pointing straight forward, and the microphone at the cross.
ITE: Connect the ITE adaptor to the 2 cc coupler and attach the hearing aid using blue putty. Place coupler at the back with hearing aid facing forward with the microphone at the cross. (For multiple microphones, rotate hearing aid to get equal horizontal positioning of the mic inputs).
ITE pick-up coil test: For this test only: Position the coupler for maximum sensitivity of the coil. Open fit/Receiver in the ear: Connect the ITE adaptor to the 2 cc coupler. Remove the tip/dome f rom the hearing instrument and attach it to the ITE adaptor using blue putty. Place the coupler tube pointing straight forward, and the microphone at the cross.
5) Position the reference microphone next to the hearing aid microphone as shown on the illustrations
above.

D-0004576-Q – 2022/05 Affinity/Equinox2.0 – Additional Information Page 275
6) Select the desired test protocol in the List of Protocols
7) Select Test Ear .
8) Select START
9) Please wait for all tests of the selected protocol to be performed:
Save by clicking “Save” icon 3.2 About HIT440 The HIT440 is a straightforward Hearing Instrument Testing system suited for all types of hearing aids. The system includes ANSI or IEC standards which can be selected f rom the main screen. This allows for easy technical measures and comparison to the hearing aid manufacturer’s data sheets. The HIT440 also of fers testing of advanced algorithms such as directionality and contains a wide range of test stimuli designed for non-linear hearing aids including the ISTS and ICRAs. These allow you to have an impression of the algorithms functioning together during quick changes in amplitude, f requency, and phase. HIT440 is f lexible and permits the creation of an unlimited number of personalized test protocols for different purposes and/or for dif ferent professionals working in the same facility. This enables each individual professional to setup the module exactly the way they wish using the specif ic tests, stimuli, and settings they prefer. These personal test protocols can swif tly and easily be chosen at any time accommodating the need for speed in a busy clinic. Furthermore, the HIT440 allows you to make individual print layouts, keep reports electronically, and compare actual curves to previous sessions. These numerous setup options can be very helpful and time saving in the daily work in the clinic.

D-0004576-Q – 2022/05 Affinity/Equinox2.0 – Additional Information Page 276
3.3 HIT 440 tests Custom selectable tests:
Frequency response Gain curve Harmonic distortion Input/output Intermodulation distortion Attack/recovery time Battery current
drain/battery life time Equivalent input noise Reference test gain Directionality Single f requency Delay
The IEC standard tests: OSPL90 Full-on gain Input/output Attack/recovery time Reference test gain Frequency response Equivalent input noise Harmonic distortion Intermodulation distortion Battery current
drain/battery life time Coil f requency response Coil harmonic distortion Coil full-on gain response
The ANSI standard tests: OSPL90 Full-on gain Reference test gain Frequency response Equivalent input noise Harmonic distortion Intermodulation distortion Input/output Attack/recovery time Battery current
drain/battery life time Coil f requency response Coil full-on gain response
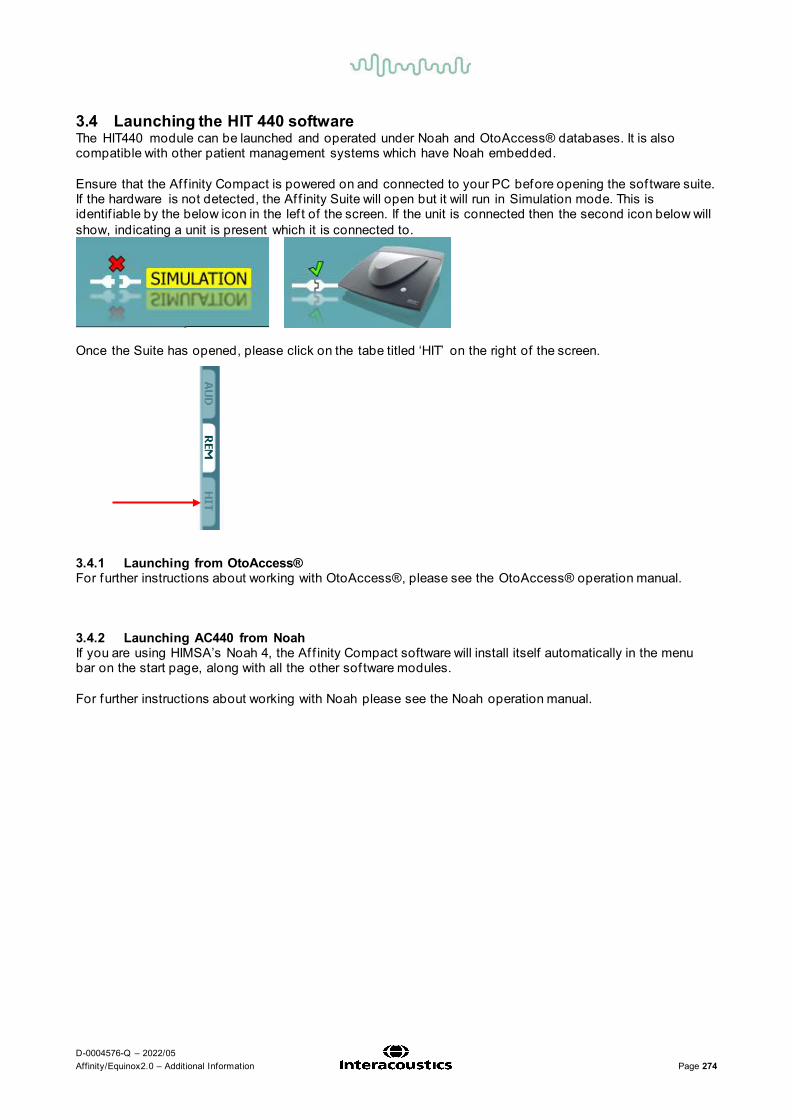
D-0004576-Q – 2022/05 Affinity/Equinox2.0 – Additional Information Page 274
3.4 Launching the HIT 440 software The HIT440 module can be launched and operated under Noah and OtoAccess® databases. It is also compatible with other patient management systems which have Noah embedded. Ensure that the Af f inity Compact is powered on and connected to your PC before opening the sof tware suite. If the hardware is not detected, the Af f inity Suite will open but it will run in Simulation mode. This is identif iable by the below icon in the lef t of the screen. If the unit is connected then the second icon below will show, indicating a unit is present which it is connected to.
Once the Suite has opened, please click on the tabe titled ‘HIT’ on the right of the screen.
3.4.1 Launching from OtoAccess® For further instructions about working with OtoAccess®, please see the OtoAccess® operation manual.
3.4.2 Launching AC440 from Noah If you are using HIMSA’s Noah 4, the Af f inity Compact software will install itself automatically in the menu bar on the start page, along with all the other sof tware modules. For further instructions about working with Noah please see the Noah operation manual.

D-0004576-Q – 2022/05 Affinity/Equinox2.0 – Additional Information Page 275
3.5 The HIT440 screen
Menu provides access to File, Edit, View, Mode, Setup, and Help.
Print button allows you to will print the test results currently displayed on the screen.
Save & New Session button saves the current session in Noah or OtoAccess® and opens a new one.
Save & Exit button saves the current session in Noah or OtoAccess® and exits the Suite.
Change Ear button allows you to toggle between right and lef t ear. Right click on the ear icon to view both ears.
Toggle between single and combined screen button toggles between viewing one or multiple measurements in the same HIT graph.
Toggle between single and continuous measurement button toggles between running a single sweep or having a test signal running continuously until pressing STOP.
Freeze curve allows for taking a snapshot of a HIT curve when testing with broadband signals. In other words, the curve f reezes at a particular moment while the test continues. Note that if too many curves are f rozen on the screen not all will be saved in Noah due to imposed limitations.

D-0004576-Q – 2022/05 Affinity/Equinox2.0 – Additional Information Page 276
Select protocol to use from the list allows you to select a test protocol the current test session (see section 0 for more information about test protocols).
Temporary Setup button allows for making temporary changes to the selected test protocol. The changes will be valid for the current session only. Af ter making the changes and returning to the main screen, the name of the test protocol will be followed by an asterisk (*). NOTE: it will only be possible to change protocols that have been created by the user. It is not allowed to modify the protocols that are based on the IEC and ANSI standards. Therefore, Temporary Setup is disabled for ANSI and IEC protocols.
List of historical sessions accesses historical sessions for comparison purposes.
Toggle between Lock and Unlock the Selected Session f reezes the current or historical session on the screen for comparison to other sessions.
Go to Current Session button brings you back to current session.
Report Editor button opens a separate window for adding notes to the current session (see section 0). Note that af ter saving the session no changes can be added to the report once the date has changed.
Single frequency button represents an optional manual test that allows for pre-setting hearing aid gain prior to HIT. Place the hearing aid in the test box and press the single f requency button. A 1000 Hz tone will then appear allowing you to see the exact input and output of the hearing aid. Press the button again to end the test.
Simple view/Advanced view buttons toggle between an advanced screen view (including the test and f itting prescription information on the right-hand side) and a simpler view with a larger graph.
Advanced view Simple view

D-0004576-Q – 2022/05 Affinity/Equinox2.0 – Additional Information Page 277
Normal and reversed coordinate system buttons enable you to toggle between reversed and normal graph. This may be helpful for counselling purposes since the reversed curves look more like the audiogram and may therefore be easier for the patient to comprehend.
Show curser on graph provides information about each specif ic
measured point in the curve. The curser is “locked” to the curve together with f requency and intensity label placed the curser’s position as illustrated below:
Stimulus selection: With this dropdown list the test stimulus can be chosen. The dropdown is only present for custom made test protocols. The standards (e.g., ANSI and IEC) have f ixed stimuli.
Monitor: If you wish to listen to the amplif ied stimulus through a monitor.
1. Connect a monitor speaker the monitor output on the hardware.
2. Tick the Monitor check box.
3. Use the slider to turn the sound level up and down. Note that the sound f rom the monitor may be very sof t (compared to the audiometry monitoring). It is louder for audiometry because the audiometric equipment is producing the signal that is monitored. In HIT440 the hearing instrument produces the monitored signal meaning that it cannot be controlled by the equipment. However, if you have an active speaker, it will be louder. External sound: You can present an external sound through for example a CD player if you have a piece of music/speech you wish to use. This may have a strong ef fect for counselling purposes.
1. Connect the CD player to the CD1 input on the hardware. 2. Press START in the sof tware and then tick the External sound
check box. The external sound will then play together with the signal.
3. Use the slider to turn the sound level up and down.

D-0004576-Q – 2022/05 Affinity/Equinox2.0 – Additional Information Page 278
Current Protocol is listed in the lower lef t-hand corner. The indicates the test is a part of an automatic test f low (Auto Run). When pressing START all tests with the tick mark will be performed. If you wish to perform one test only, mark it using the mouse by clicking on it. Then right click at select Run this test. Upon performing a test, the system automatically jumps to the next one in the test f low. indicates that a curve has been measured. Colour indication shows the colour selected for each curve (in the HIT440 setup, see section 0). Test protocols can be created and adjusted in the HIT440 setup (see section 0). Start/Stop button initiates and ends all tests. Note that af ter pressing START the text on the button will change to STOP.
The Graph shows measured HIT curves. The X axis shows the f requency, and the Y axis shows the intensity of the test signal. Measurement type is printed above the graph together with a right/lef t indication. In this example the OSPL90 is displayed for the lef t ear. Change the input level using the slider on the right-hand side. Scroll graph up/down on the lef t-hand side allows for scrolling the graph up or down ensuring that the curve is always visible in the middle of the screen.

D-0004576-Q – 2022/05 Affinity/Equinox2.0 – Additional Information Page 279
Measurement details: In this table the curve details can always be viewed. This way the professional always has an overview of what is being measured, for example, information such as Input Level, Max SPL, Curve Type, Stimulus, and Curve type.
A Curve Comment for each curve can be typed into the comment section on the right-hand side. Select a curve using the curve tag boxes under Curve display options and write a comment in the comment section. The comment will then appear in the comment section whenever the curve is selected.
Curve Display Options are found in the lower right-hand corner. If you have measured more curves of the same type (e.g., Frequency response curves), they will be listed by their input level. Tick the ones that are to be displayed on the graph. Right clicking on this option will allow you to change the curve’s colour or delete the curve.
Affinity2.0: The picture indicates whether the hardware is connected. When opening the Suite, the system will search for the hardware. If it does not detect the hardware, it will automatically continue in simulation mode.

D-0004576-Q – 2022/05 Affinity/Equinox2.0 – Additional Information Page 280
3.6 Hearing instrument testing using HIT440 Hearing Instrument Testing (HIT) is performed to verify that the hearing aids are technically functioning as they should. It is usually performed af ter f itting the hearing aid or during a repair appointment. When performing HIT there are certain things you should keep in mind to get the best possible result. Some of these will inevitably also inf luence the precision of the curve obtained. This section will walk through some important tips and tricks to remember when tasking hearing aids using the HIT440. The following section will provide you with general knowledge relevant for hearing instrument testing using the HIT440. Correct placement of a hearing aid in the test box Positioning the hearing aid correctly in the test chamber is important to obtain precise measurements.
3.6.1 Testing hearing instruments: 1) Coupler microphone
2) Ear simulator/711 coupler (optional)
3) 2cc coupler
4) Adaptor for body worn hearing aids
5) Adaptor for BTE hearing aids 6) Adaptor ITE hearing aids
1) Connect either the 2cc coupler or the 711 coupler to the coupler microphone and attach the relevant
adaptor to the coupler. The parts will click easily together.
Microphone Coupler Adaptor (BTE)
1
2 3
4 5 6

D-0004576-Q – 2022/05 Affinity/Equinox2.0 – Additional Information Page 281
2) Attach the hearing aid to the adaptor. To attach a BTE use the BTE tubing that is delivered with the system, as shown below.
3) In case of an ITE or open f it hearing aids use blue putty to attach them to the ITE adaptor as shown
below:
Note: the microphone should be plugged into the white plug in the Af f inity 2.0 test box
3.6.2 Testing bone anchored device using the SKS10 skull simulator With the Interacoustics SKS10 Skull Simulator, it is now possible to perform technical measurements of bone anchored devices. For more information on the setup and test procedures, please refer to the Quick Guide at the end of this document. The SKS10 can be used with Af f inity Suite version 2.3 or higher. What is the SKS10?
• It is a coupler, with a def ined mass and an accelerometer, that can measure the force output level of a bone anchored hearing system
• It emulates the mechanical impedance of the human head • It converts the vibrations of the bone anchored device into electrical signals, like the way that a
standard hearing aid coupler/coupler microphone converts sound waves into electrical signals. • It can be connected either to the internal test-box of the Af finity2.0 or to an external test-box (TBS25)
connected to the Af f inity2.0

D-0004576-Q – 2022/05 Affinity/Equinox2.0 – Additional Information Page 282
How does it work?
Required items:
• The Af f inity hardware • The Interacoustics SKS10 Skull Simulator and its power supply • The HIT440 Sof tware license • The SKS10 Skull Simulator license • A bone anchored device • Optional: the TBS25 passive HIT box, connected to the Af f inity
3.6.3 Installing the skull simulator license in the HIT440 software:
3.6.3.1 How to receive a new HIT license 1- Af ter purchasing the SKS10 and the license, please send Interacoustics
([email protected]) the serial number. You can f ind out by going to the Af f inity software and going to Menu/Help/About License “Copy s/n”
2- Paste the serial number in the body of an email and send it to Interacoustics 3- Interacoustics will then email a new HIT license

D-0004576-Q – 2022/05 Affinity/Equinox2.0 – Additional Information Page 283
3.6.3.2 Activating the new HIT license 1- Go to HIT module/Menu/Help/About 2- Click on License 3- Paste the new license number under HIT (New license)
The Skull protocol might be hidden in the sof tware. If this is the case; it is necessary to activate it:
1- Go to HIT/Menu/Setup/HIT440 setup
2- Choose “Skull Simulator” under “Selected Protocols”
Under “General Settings”, ensure that “Skull Simulator” is chosen under “Coupler”

D-0004576-Q – 2022/05 Affinity/Equinox2.0 – Additional Information Page 284
3.6.3.3 Using the skull simulator protocol A default protocol for the Skull Simulator is available f rom the protocol drop down menu. Since a standard ANSI or IEC protocol does NOT exist for bone anchored devices, the Skull Simulator default protocol was created as a starting point and to give inspiration to create your own protocol, according to user needs.

D-0004576-Q – 2022/05 Affinity/Equinox2.0 – Additional Information Page 285
3.6.3.4 Setup of SKS10 in the Affinity test chamber Since the SKS10 contains an accelerometer, it needs to be powered by an external power source. Please ensure that the SKS10 is connected to the power supply and the power supply is connected to a power source.
1- Connect the skull simulator to the power supply and ensure power supply is connected to a power source
2- Connect the white plug into the white socket inside the Af f inity Test Chamber

D-0004576-Q – 2022/05 Affinity/Equinox2.0 – Additional Information Page 286
3- Snap on the bone anchored device onto the abutment of the skull simulator.
NOTE: For more information on how to setup the Af f inity and test bone anchored devices, please see the Quick Guide for testing bone anchored devices with the SKS10, this can be accessed via the link mentioned at the end of this document.
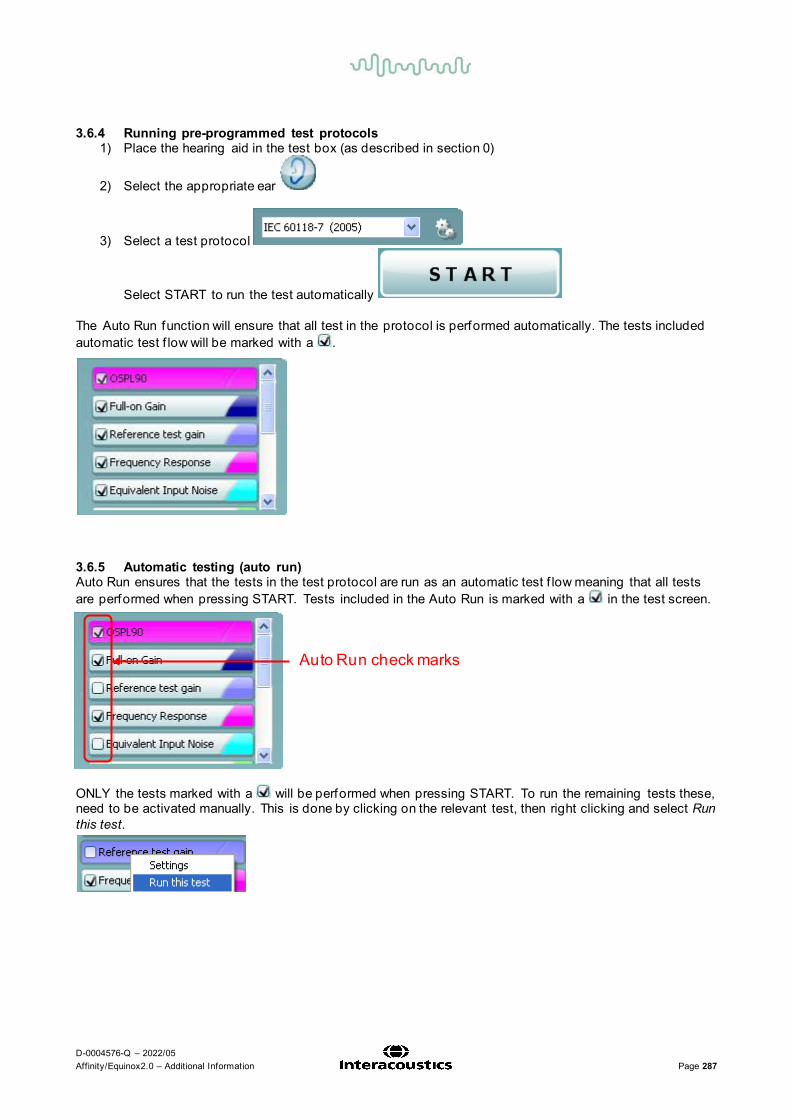
D-0004576-Q – 2022/05 Affinity/Equinox2.0 – Additional Information Page 287
3.6.4 Running pre-programmed test protocols 1) Place the hearing aid in the test box (as described in section 0)
2) Select the appropriate ear
3) Select a test protocol
Select START to run the test automatically
The Auto Run function will ensure that all test in the protocol is performed automatically. The tests included automatic test f low will be marked with a .
3.6.5 Automatic testing (auto run) Auto Run ensures that the tests in the test protocol are run as an automatic test f low meaning that all tests are performed when pressing START. Tests included in the Auto Run is marked with a in the test screen.
ONLY the tests marked with a will be performed when pressing START. To run the remaining tests these, need to be activated manually. This is done by clicking on the relevant test, then right clicking and select Run this test.
Auto Run check marks

D-0004576-Q – 2022/05 Affinity/Equinox2.0 – Additional Information Page 288
Auto Run can be setup in the HIT440 setup (Menu/setup/HIT440 setup).
Next to each test you will f ind a Play symbol (Auto Run) or a Stop symbol (Manual Run) . Click on the Play/Stop symbols for each test to toggle between Auto and Manual Run. See more information about protocol setup in section 0.
3.6.6 Preconditioning and sweep delay
3.6.6.1 Preconditioning Preconditioning is relevant when using broadband signals such as for example ISTS/ICRA. It consists of a wideband signal followed by a pure tone appearing just before the selected stimulus is presented. The precondition function allows you to set a certain time before the curve is shown on screen. This will allow the hearing aid algorithms to have time to switch on and stabilise in a setting as caused by a non-linear stimulus. This has two ef fects – f irst you will avoid the hearing aid being in the process of changing characteristics during the test, and secondly, the hearing aid will in this case be brought into the mode corresponding to the stimulus.
3.6.6.2 Sweep delay The sweep delay is the time before the next sweep will start when running a continuous measurement using Pure Tone or Warble Tone. Modern hearing aids of ten have advanced algorithms that need a certain reaction time. It is therefore helpful to be able to set individual delays.
3.6.7 Smoothing a curve Smoothing is a technique where small details in the curve appear to be ironed out. As these details sometimes have a noisy character, smoothing may be preferred. The individual tests can be designed to have smoothing applied in the HIT440 setup (described for each test in section 0). Smoothing can also be applied af ter measuring in two ways:
Shif t + up/down arrow keys on the PC keyboard Shif t + the scrolling wheel on the mouse

D-0004576-Q – 2022/05 Affinity/Equinox2.0 – Additional Information Page 289
Examples:
Note: Numerically reported MAX OSPL90 Level is determined f rom a non-smoothed curve, and as such not af fected by smoothing level, even though the smoothed waveform may appear to have a reduced peak around the MAX SPL area.
3.6.8 Show cursor on the graph When comparing the graph in the f itting software/specif ication sheet to the graph in the HIT440 the Show cursor on graph may be useful. Upon selecting the function, the cursor will “glue” to the highlighted curve showing the exact measured value at each f requency.
Note: As the cursor tracks the displayed curve, any smoothing applied to the curve will inf luence the reading. This may have the ef fect that a smoothed curve will report one max OSPL90 level with the cursor and a dif ferent max OSPL90 level in the numerical data section. Unsmoothing will make the two readings identical.
3.6.8.1 Managing multiple curves If measuring many curves during the same test session, there are several ways to provide a simpler view (or a comparison view) showing only the preferred curves in the same graph.
Smoothing index 0 Smoothing index 10
Smoothing index 5

D-0004576-Q – 2022/05 Affinity/Equinox2.0 – Additional Information Page 290
3.6.8.2 Curve display options In the curve display options box, all curves are listed by input level and color. If many of the same curve type (e.g., Frequency Responses) have been measured tick only the ones that you wish to display on the graph.
Un-ticked curves will be hidden ensuring a less confusing screen view.
3.6.8.3 Combined screen view If a combined screen is setup you may want to compare to other curves obtained. Press the corresponding button to toggle between single and combined screen: In the combined screen setup, you can decide exactly which curves are to be compared so that for example pressing the combined screen button results in a comparing multiple Frequency Responses (see section 0 for how to do a combined screen setup).
3.6.8.4 Changing the curve color If having many curves on screen you can change their colors even af ter they are measured. Right click on the preferred curve and choose Change curve color. The system will then allow for choosing a new color.

D-0004576-Q – 2022/05 Affinity/Equinox2.0 – Additional Information Page 291
3.6.9 Comparing curves The HIT440 also allows for comparing either two historical curves (e.g., two OSPL90 curves) or comparing a historical curve to a currently recorded curve. This is done following the procedure described below:
1) Find the f irst curve in the Session list. Historical HIT measures are listed by date and time of saving.
2) Press Toggle between lock and unlock the selected session 3) Find the second curve in the Session list. This can be either a curve of the current session or a
historical curve.
The two curves are now shown in an overlap view as illustrated below:
Note: To avoid comparing apples to oranges, only curves of the same type can be compared – hence it is not possible to compare results f rom an ANSI based test protocol with curves acquired with an IEC or Custom based test protocol. Ideally the same test protocol should be used for this type of comparison.

D-0004576-Q – 2022/05 Affinity/Equinox2.0 – Additional Information Page 292
3.6.10 Comparing to the manufacturer’s specification sheets When comparing a measurement to the hearing aid manufacturer’s specif ication sheet it is important keep in mind that the same hearing aid settings that were used in the specification measures should also be used for the HIT440 measures! If the parameters are not accordance with each other the comparison will not be valid. Most hearing aid manufacturers use known international standards, such as the ANSI or IEC for their specif ication sheets. The same standard can usually be selected in the HIT440 sof tware.
The hearing aid can typically be programmed with a “technical measurements” setting found in the f itting sof tware (please refer to the manuals of the specif ic hearing aid brands for details). These ensure correct settings for the ANSI/IEC comparisons. If you do not use international standards, please be sure to check the following:
Ensure that the stimulus used in HIT440 is the specif ication sheets Ensure that the input level used in the HIT440 is the same as in the specif ication sheets Ensure that the hearing aid is programmed with the exact same gain settings as used in the
specif ication sheets.
3.6.10.1 Telecoil testing For all telecoil measures please ensure that the hearing aid telecoil is activated. The Af f inity2.0 test boxes include a magnetic f ield which enables testing of hearing aid telecoils. This is relevant for f requency responses, gain curve, harmonic distortion, battery current drain, OSPL90, and full-on gain. Procedure:
1) Place the hearing aid in the test box as described in section 0. 2) Switch to the telecoil program
3) Perform the telecoil tests as described in section 3.7.1.

D-0004576-Q – 2022/05 Affinity/Equinox2.0 – Additional Information Page 293
As an add-on the Af f inity 2 test boxes also includes a TMFS coil shown below. TMFS is short for Telephone Magnetic Field Simulator. It is a transducer that produces a magnetic f ield like the signal coming out of traditional telephones. In other words, the TMFS coil attempts to simulate a telecoil for the purpose of calibrating hearing aids with inductive coils according to ANSI S3.22:2003 Place the hearing aid on top of the TMFS coil as shown on the illustration below. It is important to note that telecoils may still be tested without the TMFS coil as the Af f inity2.0 test box has a built-in magnetic f ield which is dif ferent f rom the f ield created by the TMFS coil. However, this will not be in accordance with the ANSI standard.
The magnetic f ield is generated at the circle indicated on the TMFS coil. The hearing aid telecoil should be located as close as possible.

D-0004576-Q – 2022/05 Affinity/Equinox2.0 – Additional Information Page 294
3.7 Application of the HIT440 tests
3.7.1 Frequency response The f requency response equals the absolute sound level delivered by the hearing aid at each f requency expressed in dB SPL. This may be measured for both microphone and telecoil. Prior to the measurement remember to perform the Reference Test Gain and set the volume control to the correct position. The f requency response curve gives you an overview of the hearing aid response and can thereby serve as a verif ication procedure making sure that the hearing aid is providing the needed response.
Below an example:
Select test
View curve details
The f requency response shows the total response of the hearing aid in dB SPL (y-axis) for each f requency (x-axis)

D-0004576-Q – 2022/05 Affinity/Equinox2.0 – Additional Information Page 295
3.7.2 Gain curve The gain curve is identical to the f requency response described above. The only dif ference is that the input level is subtracted f rom the f requency response providing you with pure hearing aid gain. The gain curve can be measured for both coil and microphone. Below an example:
Pure hearing aid gain as a function of f requency
View curve details
Select test

D-0004576-Q – 2022/05 Affinity/Equinox2.0 – Additional Information Page 296
3.7.3 Harmonic distortion The pure tone components are called harmonics and occur at integer multiples of the fundamental f requency. The output of a hearing aid, however, is rarely a pure tone and the signal will inevitably contain elements at dif ferent f requencies not included in the input. These components are def ined as distortion products. As a result, measuring these is called Harmonic Distortion. Harmonic distortion can be measured for both microphone and telecoil. It is done by presenting a pure tone to the hearing aid and analysing the waveform of the output to measure the distortion components relative to the total power of the input signal. The Total Harmonic Distortion (THD) equals the total sum of all harmonics or in the Af f inity2.0 the 2nd and 3rd harmonic. The result is expressed relative to the wanted output signal component in percent. It is important to know the harmonic distortion to be assured that the output of the hearing aid is not af fected by unwanted distortion. Distortion can be compared to the cocktail party effect as harmonics (noise) may mask the wanted speech signal (fundamental f requency). A hearing aid with high distortion will therefore not provide the client with the ideal speech understanding. Below is an example:
3.7.4
The three bars represent the total distortion, 2nd distortion, and 3rd distortion
Select test
View test information for marked f requency

D-0004576-Q – 2022/05 Affinity/Equinox2.0 – Additional Information Page 297
3.7.4 Input/output The Input/Output curve displays the output of the hearing aid as a function of the input for one f requency (or broadband signal). The Input/Output function provides information about the compression characteristics of the hearing aid such as for example expansion, knee-point, and compression limiting Below is an example:
The Input/Output function shows the output of the hearing aid (y-axis) for a given input level (x-axis)
View test information
Select test

D-0004576-Q – 2022/05 Affinity/Equinox2.0 – Additional Information Page 298
3.7.5 Intermodulation distortion Distortion in moderate -severe amounts will inevitably have a negative ef fect on the quality of speech and speech intelligibility. To assess the distortion product generated by the hearing aid, intermodulation distortion is measured. Two tones equal in amplitude are presented to the hearing aid: one at the selected f requency dif ference (f1) and one at the selected f requency (f2). The HIT440 will make an FFT of the signal produced by the hearing aid and the 2nd and 3rd intermodulation distortion is calculated. 2nd distortion: the signal at f2 - f1 in relation to the signal at f2. 3rd distortion: the signal at 2*f1 – f2 in relation to the signal at f2. Below is an example:
3.7.6
The three bars represent the total distortion, 2nd distortion, and 3rd distortion
View test information for marked f requency
Select test

D-0004576-Q – 2022/05 Affinity/Equinox2.0 – Additional Information Page 299
3.7.6 Attack/recovery time The Attack time is the time it takes for the hearing aid compressor to react to an increase in input signal. As the output will gradually move towards the f inal gain value it has been decided to def ine the attack time as the time it takes the hearing aid to stabilize the output within 2 or 3 dB according to the IEC 6018-2 and ANSI S3.22 respectively. The attack time is commonly 5 ms but can be longer. The Recovery is the time taken for the hearing aid compressor to react to a decrease in input level. As the output will gradually move towards the f inal gain value it has been decided to def ine the recovery time as the time it takes the hearing aid to stabilize the output within 2 (following an input decrease f rom 80 to 55 dB) or 4 dB (following an input decrease f rom 90 to 55 dB) according to the IEC 118-2 and ANSI S3.22 respectively. The release time is commonly 20 ms but can be longer. Measuring the attack and recovery time gives you an idea of the time constants within the hearing aid and how fast it reacts to incoming sounds. If the recovery time is too short the gain will vary too much during speech that shif ts quickly in amplitude, phase, and f requency. This will distort the signal. In hearing aids with short attack time and long recovery time the distortion will be minor. The main disadvantage in this case will be extremely brief sounds such as a door slamming will cause the gain to decrease as the attack time is short. However, the gain will stay low for a while due to the long recovery time which may result in the client missing information during this period. Note: If using the IEC standard this test should be performed with the volume control in its maximum position (e.g., before Reference Test Gain) Below is an example:
Attack Recovery
View specif ic attack/ recovery information
Select test

D-0004576-Q – 2022/05 Affinity/Equinox2.0 – Additional Information Page 300
3.7.7 Battery current drain/battery life time HIT440 measures the battery current at the reference f requency with an input of 60 dB SPL. The battery pill is placed in the hearing aid battery compartment and connected to the test box using the corresponding plug as illustrated below. Prior to the measurement remember to perform the Reference Test Gain and set the volume control to the correct position.
Insert battery pill:
Connection to the test box:
The battery life time can be estimated for both coil and microphone.

D-0004576-Q – 2022/05 Affinity/Equinox2.0 – Additional Information Page 301
Below is an example:
Note: Some hearing aids will show higher battery consumption in the higher f requency range due to the conf iguration of the audiogram
Battery current drain viewed as a function of f requency.
View test details
Select test

D-0004576-Q – 2022/05 Affinity/Equinox2.0 – Additional Information Page 302
3.7.8 Equivalent input noise Every amplif ier and microphone will generate noise to some extent. The internal noise of a hearing device is expressed as the Equivalent Input Noise. More specif ically this term covers the amount of noise that would need to be added to the input of a noiseless hearing aid with the same f requency response if the noise coming out is to be the same as the tested hearing aid. According to Dillon (2001) there are three reasons as to why it makes sense to express the noise relative to the input:
• Most noise in good quality hearing aid comes f rom the microphone and most of the remaining noise comes f rom the input amplif ier
• The noise of the output will vary with the position of the volume control in hearing aids with volume control. This is not the case with the input related noise
• If the noise was expressed relative to the output hearing aids with little gain would always have less noise that hearing aid with high gain
The Equivalent Input Noise is performed by measuring the noise of the hearing aid output followed by subtracting the gain.
Output noise – Gain = Equivalent Input Noise
Below is an example:
Note: Equivalent Input Noise can be displayed as a curve or f igure depending on your preference.
The Equivalent input noise is shown in dB SPL as a function of f requency
Select test
View test information

D-0004576-Q – 2022/05 Affinity/Equinox2.0 – Additional Information Page 303
3.7.9 Reference test gain Reference Test Gain is a control position which is usually set af ter doing the high-level measures such as OSPL90 and Full-on gain. If this is the case the result is a basic f requency response (IEC 118-0) or f requency response curve (ANSI S3.22). If using the IEC the volume control is adjusted against a 1.6 kHz tone which with an input of 60 dB should produce an output 15 dB less than the OSPL90 at the same f requency. For hearing aids f itted to very high f requency hearing losses the reference test f requency is changed to 2.5 kHz. In the ANSI standard the procedure is identical; only the test is run at three f requencies 1, 1.6, or 2.5 kHz. The HIT440 Setup allows for applying both the ANSI and IEC procedure depending on the preference of the professional. A customized version combining elements f rom the two may also be established. Reference Test Gain is performed as described in section 3.7.1. While the test is running adjust the volume control to the target line. Below is an example:
Adjust the hearing aid volume control until the bar reaches the target line.
Select test
View details

D-0004576-Q – 2022/05 Affinity/Equinox2.0 – Additional Information Page 304
3.7.10 Microphone directionality Unwanted noise is provided by many dif ferent sources in many daily life situations. They can come f rom dif ferent directions due to position or ref lection f rom the walls in the environment. Fortunately, many digital hearing aids have directional microphones that suppress noise coming f rom some directions while maintaining a good sensitivity to sounds coming from another direction. This is done to give the user an advantage so that they are more likely to hear the signals they want over the noise in a noisy environment. This ef fect can be measured in the Af f inity2.0 test chamber. The two loudspeakers in each side of the test chamber are used. First a f requency response is recorded for sounds coming f rom one side. Af ter this a similar curve will be recorded for sounds coming f rom the other side. Then the second curve is subtracted f rom the f irst and results in the directionality curve. Note: When the built-in test chamber of the Af f inity2.0 is used for directionality testing the small size of this chamber will of course have a considerable ef fect on the directionality results. Under such circumstances the test results will be dif ferent f rom results obtained in manufacturer’s huge fully damped anechoic rooms. To obtain the best results with the Af f inity2.0 test chamber f rom this test, allow the lid to be open during the test. As stimuli are relatively strong for such tests, and as the test is being carried out in the 1kHz to 4kHz range only, this will be possible in most of fice environments. This way you can get a test of how the hearing aid directionality functions under these conditions. If you repeat the test with the hearing aid and the reference microphone in the exact same position (very important), then the test results will be duplicated. This means that you can use the test to verify that the directionality is unchanged over time when you repeat the test at any later time. This can be good verif ication f rom a technical standpoint as well as in convincing a client that hearing aid directionality function has remained unchanged. Below is an example:
.
Front microphone response
Back microphone response
Directionality
Select test
View directionality details

D-0004576-Q – 2022/05 Affinity/Equinox2.0 – Additional Information Page 305
3.7.11 Single frequency Single Frequency tests the hearing aid at a single selected f requency using a given stimulus. This allows you to get an impression of the hearing aid at specif ic important f requencies. If selecting a pure tone or warble tone stimulus a bar representing the fundamental f requency together with harmonics will appear on the graph. If selecting a noise stimulus, a FFT spectrum shows on screen. The Single Frequency measure is useful to see how much the hearing aid distorts the signal. Below an example:
Fundamental f requency
Harmonics
View specif ic values
Select test
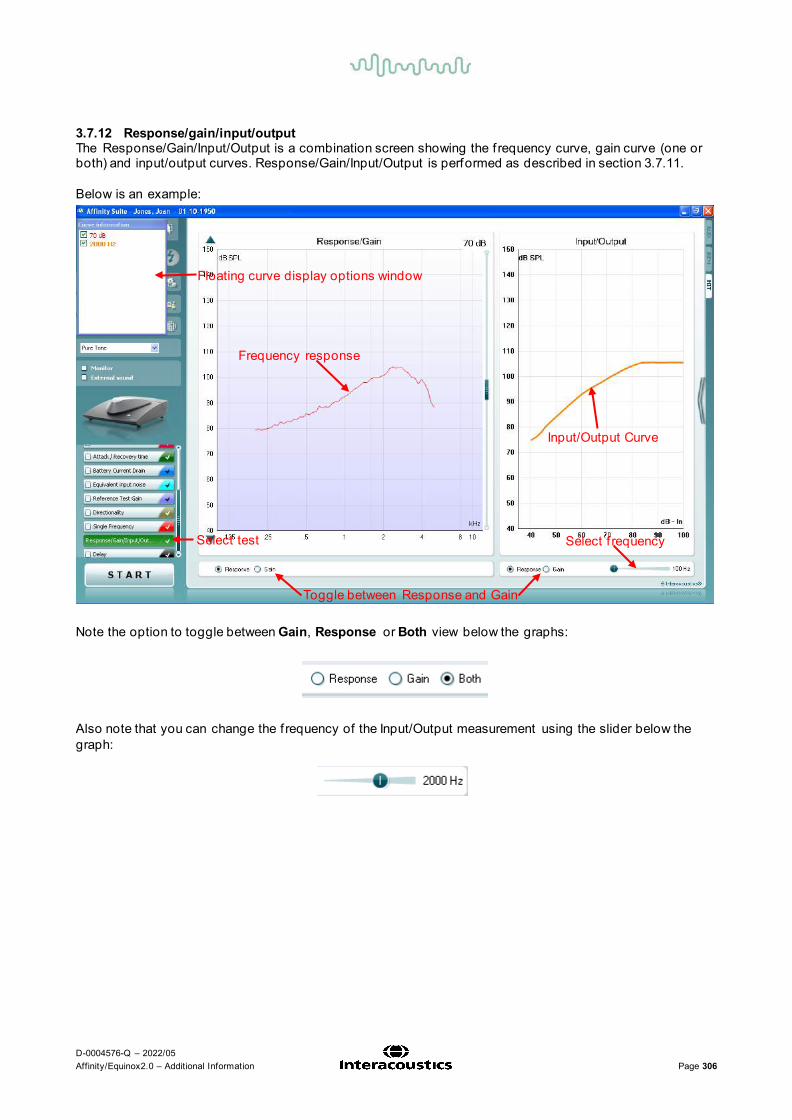
D-0004576-Q – 2022/05 Affinity/Equinox2.0 – Additional Information Page 306
3.7.12 Response/gain/input/output The Response/Gain/Input/Output is a combination screen showing the f requency curve, gain curve (one or both) and input/output curves. Response/Gain/Input/Output is performed as described in section 3.7.11. Below is an example:
Note the option to toggle between Gain, Response or Both view below the graphs:
Also note that you can change the f requency of the Input/Output measurement using the slider below the graph:
Select test
Frequency response
Input/Output Curve
Toggle between Response and Gain
Select f requency
Floating curve display options window

D-0004576-Q – 2022/05 Affinity/Equinox2.0 – Additional Information Page 307
3.7.13 Delay The Delay test measures the hearing aid delay in milliseconds across f requency using a chirp stimulus. To obtain the best possible result, it is recommended to use a TBS25 external test box. However, the Af f inity build-in test may be used if kept partly open to avoid ref lection of sound. Below an example:
Select test
Delay in ms across f requency
View delay details

D-0004576-Q – 2022/05 Affinity/Equinox2.0 – Additional Information Page 308
3.7.14 OSPL90 The OSPL90 is def ined as the maximum output level of the hearing aid measured at an input level of 90 dB. This input level has been chosen as standard as it is enough to saturate the hearing aid in most cases except if the volume control is set to an extremely low level. The OSPL90 is of ten used when doing paediatric f ittings in the coupler. This way you can ensure that the output of the hearing aids never becomes uncomfortable for the child. It can, however, be recommended that the hearing aid maximum is evaluated on all clients. Below is an example:
3.7.15
Maximum output as a function of f requency when introducing a 90 dB input.
View test details
Select test

D-0004576-Q – 2022/05 Affinity/Equinox2.0 – Additional Information Page 309
3.7.15 Full-on gain Full-on Gain is the amount of gain measured in a hearing aid with volume control set to its maximum. It usually measured at an input level of 60 dB which is a common most comfortable level (MCL). When measuring the full-on gain, you thereby can check that even at a high output the gain stays below the uncomfortable level (UCL). Below is an example:
Full-on gain as a function of f requency
View test details
Select test

D-0004576-Q – 2022/05 Affinity/Equinox2.0 – Additional Information Page 310
3.8 Working with individual setups (test protocols) The HIT440 module is pre-programmed with standard test protocols (IEC and ANSI) ready for use which can be selected f rom the f ront screen. However, you may wish to create an individual test protocol accommodating for personal preferences and test methods. This section describes both how to select a pre-programmed test protocol and how to create an individual test protocol.
3.8.1 Selecting a (standard) test protocol: 1. Open the Af f inity Suite f rom Noah, OtoAccess®, or stand-alone.
2. Go to the HIT440 by clicking the HIT tab.
3. In the List of Protocols all customized and standard test protocols are listed.

D-0004576-Q – 2022/05 Affinity/Equinox2.0 – Additional Information Page 311
3.8.2 Designing a customized test protocol The following sections describe how to setup your own test protocol in the HIT440 setup. All setup options for all tests will be described even though you most likely will only need a few. This section is therefore to be seen as a work of reference where single functions can be looked up rather than a step-by-step guide where all steps need to be explored.
1) Enter the REM440 setup by pressing Menu/Setup/HIT440 setup.
2) Press New. 3) A pop-up will ask whether the new test protocol should be based on a copy of the currently selected
test protocol. When asked by the message box:
4) Name the test protocol setup in the Selected protocol section.
Yes: The system will create a copy of the current test and allow you to add new tests, make changes, and save it under a new name.
No: The Selected tests section will be blank, and you can create a new test f rom scratch .
2

D-0004576-Q – 2022/05 Affinity/Equinox2.0 – Additional Information Page 312
5) Select the tests to be included in the test protocol. Mark a test by clicking on it and press the Add. Double clicking on a test will also select it.
Choose all the tests for the test protocol using this procedure.
6) To remove a test selected by mistake, mark it under Selected tests and press Remove. The test will
then jump back to the Test selection list. 7) If the order of the tests is to be changed, use the two Move arrow buttons.
Mark the test to be moved and press one of the arrow buttons. Depending on the direction of the selected arrow, the test will then jump up or down.
8) To adjust the parameters of each selected test press Settings. 9) In General settings f ind the following additional options:
Display combined screen allows for comparing dif ferent curves by default in the same graph. The option is also available f rom the f ront screen. Which curves to compare can be setup individually (see section 0). Coupler allows you to select the preferred coupler to be used in the test protocol. Select f rom 0.6 cc, 1.2 cc, 2 cc, and Ear simulator (IEC 711). The skull Simulator will appear her if the license for it exists in your Af f inity2.0 unit.
Note: Prior to creating a new test protocol you may wish to select a protocol type in the Protocols to view dropdown list. This function is practical if you for
4
6 8
7
9
5

D-0004576-Q – 2022/05 Affinity/Equinox2.0 – Additional Information Page 313
example wish to create a new protocol based on elements f rom the ANSI or IEC standard. In this case the dropdown list can be used to select an ANSI or IEC standard before clicking New. When asked if the new protocol should be based on a copy of the currently selected protocol, click yes.
3.8.2.1 Frequency response settings
1) Ensure that Frequency Response is marked in the lef t-hand side of the screen. The name of the test will then appear in the Name of selected test section. Note the option to write a new name for the test in this section (e.g., “Frequency Response 65 dB input”)
2) Stimulus selection: Input Level: Set the input level using the slider. Preconditioning: This is relevant when using broadband signals such as ICRA (see section
3.6.6.1 for details). Select a duration using the slider. Stimulus type: Select a stimulus using the dropdown list (See stimulus list in section 3.12.1). Sweep delays: This is relevant if Continuous measurement is selected for Pure Tone or Warble
Tone. In this case sweep delays (in milliseconds) may be entered between the individual sweeps (see section 3.6.6.2 for details).
Start Frequency and Stop Frequency: Select the preferred f requencies using the sliders. To avoid low f requency noise set the slider to a start f requency of 200Hz.
4
5
2
3
1
8 7
6

D-0004576-Q – 2022/05 Affinity/Equinox2.0 – Additional Information Page 314
Averaging time: Decide the number of FFTs shall be used for the averaging of non-linear stimuli like ICRA noise, real speech or other wave-based stimuli. The longer average the more reproducible test results will be.
Continuous: This check box allows you to make the measurement ongoing rather than a single sweep. This may, however, also be done in the f ront screen using the continuous button:
When continuous is ticked, the stimulus and recording will continue until you press the STOP button.
3) Multiple curves: If you wish to have multiple curves at dif ferent input levels in the same graph, use the Multiple
Curves option. Set the f irst level using the Input level slider and press Add under Multiple Curves. The level will then appear in the corresponding white section. Select the second level and press Add again. The new level will then be listed below the f irst one. Follow this procedure until the preferred number of curves has been achieved. If a level is selected by mistake click mark it in the white section by clicking on it and press Remove.
4) Input selection: Choose whether the Frequency Response should be performed through the Speaker or Coil.
TMFS coil may also be selected. If measuring through the coil, please ensure that the telecoil in the hearing aid is activated.
5) Reference frequency: Ref f: Tick this option to select a single reference f requency using the slider. Af ter measuring
the curve, the level at the reference f requency will be displayed in the measurement details table.
HFA/SPA: Tick this option to select three f requencies at a f ixed distance using the slider. Af ter measuring the curve, the reference f requency average will be displayed in the in the measurement details table.
6) Tolerance limits: Set limits: Press the button to def ine individually preferred tolerance limit values. By applying
tolerance limits to the recording, it will be possible to easily document whether a curve is inside tolerances or not. In the Tolerance limits screen tolerance limits may be entered as numerical f requency specif ic values for Low limit and High limit. Alternatively Lower Limits and Higher Limits may be entered by clicking with the mouse directly on the dots in the co-ordinate system and dragging them to the preferred position.
Display Tolerance Limits: Tick the box to activate the tolerances which will then be shown on the graph in the f ront screen.

D-0004576-Q – 2022/05 Affinity/Equinox2.0 – Additional Information Page 315
Note: In the General Setup it is possible to set a warning, which will pause the test and prompt the user if a recording falls outside tolerance limits.
7) Recording method: 8) Resolution (of f requency): Select the preferred resolution in the dropdown. The higher the resolution
the slower the measurement. Keep in mind that 1/3 is what is used in many hearing aid manufacturers sof tware. If the curve is to be compared to this, you may consider choosing this resolution. Also note that when using a broad band signal the dropdown list will change to of fer weighting instead.
Smoothing Index: You have the option to smooth the measured curve using the slider (see section 3.6.7 for details). The higher index number selected the more smoothing is applied
9) Test settings: Battery simulator: Select the correct battery type for the hearing aid to be used under the test.
In general Zinc-air types will give best results, particularly on power hearing aids, as this battery type is best at providing current. If a Zinc-air battery type is selected, then an estimated battery lifetime is calculated as part of the Battery Current Drain test. If Standard battery is selected, a traditional high-quality zinc-air battery is simulated. Additional battery types may be custom designed with specif ic characteristics by the HIT440. This can provide interesting information on how a particular hearing aid performs with a good battery and with a poor battery.
If “Not Used” is selected no power is supplied by the battery simulator. Color: Select a color for the Right and Left curve.
Press each of the buttons to have the custom colour selection below. Choose the desired color by clicking on it and press OK.
Note the option to Define Custom Colors to get a more extensive selection. When having found the exact colour, press Add to Custom Colors.

D-0004576-Q – 2022/05 Affinity/Equinox2.0 – Additional Information Page 316
3.8.2.2 Gain curve settings Settings for Gain Curve are identical to the settings described above for Frequency Response. Please refer to section 0.

D-0004576-Q – 2022/05 Affinity/Equinox2.0 – Additional Information Page 317
3.8.2.3 Harmonic distortion settings
1) Ensure that Harmonic Distortion is marked in the lef t-hand side of the screen. The name of the test will then appear in the Name of selected test section. Note the option to write a new name for the test in this section (e.g., “Harmonic Distortion 500 and 1000 Hz”)
2) Frequency list: Frequency dropdown lists: Select the f requencies to be included in the distortion measure.
Open the dropdown lists of the preferred f requencies and select at which input level the test is to be performed f rom the selection list.
2
4
5
1
3

D-0004576-Q – 2022/05 Affinity/Equinox2.0 – Additional Information Page 318
3) Tolerance limits: Set limits: Press the button to def ine individually preferred tolerance limit values. By
applying tolerance limits to the recording, it will be possible to easily document whether a curve is inside tolerances or not. In the tolerance limits screen the upper limits may be entered as numerical f requency specif ic values. Note, however, that this is only possible for the f requencies chosen in the Frequency list see point 2) above. Alternatively, limits may be entered by clicking with the mouse directly on the dots in the co-ordinate system and dragging them to the preferred position.
Display Tolerance Limits: Tick the box to activate the tolerances which will then be shown on the graph in the f ront screen.
Note: In the General Setup it is possible to set a warning, which will pause the test and prompt the user if a recording falls outside tolerance limits.
4) Test settings: Battery simulator: Select the correct battery type for the hearing aid to be used under the test.
In general Zinc-air types will give best results, particularly on power hearing aids, as this battery type is best at providing current. If a Zinc-air battery type is selected, then an estimated battery lifetime is calculated as part of the Battery Current Drain test. If Standard battery is selected, a traditional high-quality zinc-air battery is simulated. Additional battery types may be custom designed with specif ic characteristics by the HIT440. This can provide interesting information on how a particular hearing aid performs with a good battery and with a poor battery.
If “Not Used” is selected no power is supplied by the battery simulator. Color: Select a color for the Right and Left curve. Press each of the buttons to have the custom color selection below. Choose the desired color
by clicking on it and press OK.
Note the option to Define Custom Colors to get a more extensive selection. When having found the exact colour, press Add to Custom Colors.

D-0004576-Q – 2022/05 Affinity/Equinox2.0 – Additional Information Page 319
5) Input selection: Choose whether the Harmonic Distortion measurement should be performed through the
Speaker or Coil. TMFS coil may also be selected. If measuring through the coil, please ensure that the telecoil in the hearing aid is activated.
3.8.2.4 Input/output settings
1) Ensure that Input/Output is marked in the lef t-hand side of the screen. The name of the test will then appear in the Name of selected test section. Note the option to write a new name for the test in this section (e.g., “Input/Output 40 dB input”)
2) Stimulus selection: Start level & Stop level: Set the start and stop levels expressed in dB SPL using the sliders. Stimulus type: Select a stimulus using the dropdown list (See stimulus list in section 3.12.1). Continuous: This check box allows you to make the measurement ongoing rather than a single
sweep. This may, however, also be done in the f ront screen using the continuous button:
When continuous is ticked, the stimulus and recording will continue until you press the STOP button.
Preconditioning: This is relevant when using broadband signals such as ICRA (see section 3.6.6.1 for details). Select a time using the slider.
2
4 3
1

D-0004576-Q – 2022/05 Affinity/Equinox2.0 – Additional Information Page 320
Sweep delays: This is relevant if Continuous measurement is selected for Pure Tone or Warble Tone. In this case sweep delays (in milliseconds) may be entered between the individual sweeps (see section 3.6.6.2 for details).
Stimulus Frequency: Select the f requency of the input stimulus using the slider. Show gain values: Tick the box to show the Input/Output in dB gain as well as dB SPL.
3) Recording method: Stimulus resolution: Select the stimulus resolution using the slider. Sweep Speed: Select the speed using the slider. The sweep speed af fects the precision of the
knee-point calculation. The slower speed the higher precision. The current speed will be written just above the slider expressed in dB per second.
4) Test settings: Battery simulator: Select the correct battery type for the hearing aid to be used under the test.
In general Zinc-air types will give best results, particularly on power hearing aids, as this battery type is best at providing current. If a Zinc-air battery type is selected, then an estimated battery lifetime is calculated as part of the Battery Current Drain test. If Standard battery is selected, a traditional high-quality zinc-air battery is simulated. Additional battery types may be custom designed with specif ic characteristics by the HIT440. This can provide interesting information on how a particular hearing aid performs with a good battery and with a poor battery.
If “Not Used” is selected no power is supplied by the battery simulator. Color: Select a color for the Right and Left curve. Press each of the buttons to have the custom color selection below. Choose the desired color
by clicking on it and press OK.
Note the option to Define Custom Colors to get a more extensive selection. When having found
the exact colour, press Add to Custom Colors.

D-0004576-Q – 2022/05 Affinity/Equinox2.0 – Additional Information Page 321
3.8.2.5 Intermodulation distortion settings
1) Ensure that Intermodulation Distortion is marked in the lef t-hand side of the screen. The name of the test will then appear in the Name of selected test section. Note the option to write a new name for the test in this section (e.g., “Intermodulation Distortion 500, 1000 & 2000 Hz”).
2) Frequency selection: Frequencies: Select the f requencies to be included in the Intermodulation Distortion
measure by ticking the boxes. 3) Settings:
Input level: Select the input level (expressed in dB SPL) using the slider. Difference F2-F1: Decide the dif ference between the f irst two formants (expressed in Hz)
using the slider. When the two f requencies are close to each other a coupling (third signal) between them will be greater than if the distance was larger.
4) Tolerance limits: Set limits: Press the button to def ine individually preferred tolerance limit values. By applying
tolerance limits to the recording, it will be possible to easily document whether a curve is inside tolerances or not. In the tolerance limits screen the upper limits may be entered as numerical f requency specif ic values. Note, however, that this is only possible for the f requencies chosen in the Frequency selection see point 2) above. Alternatively, limits may be entered by clicking with the mouse directly on the dots in the co-ordinate system and dragging them to the preferred position
4 5
3
2 1
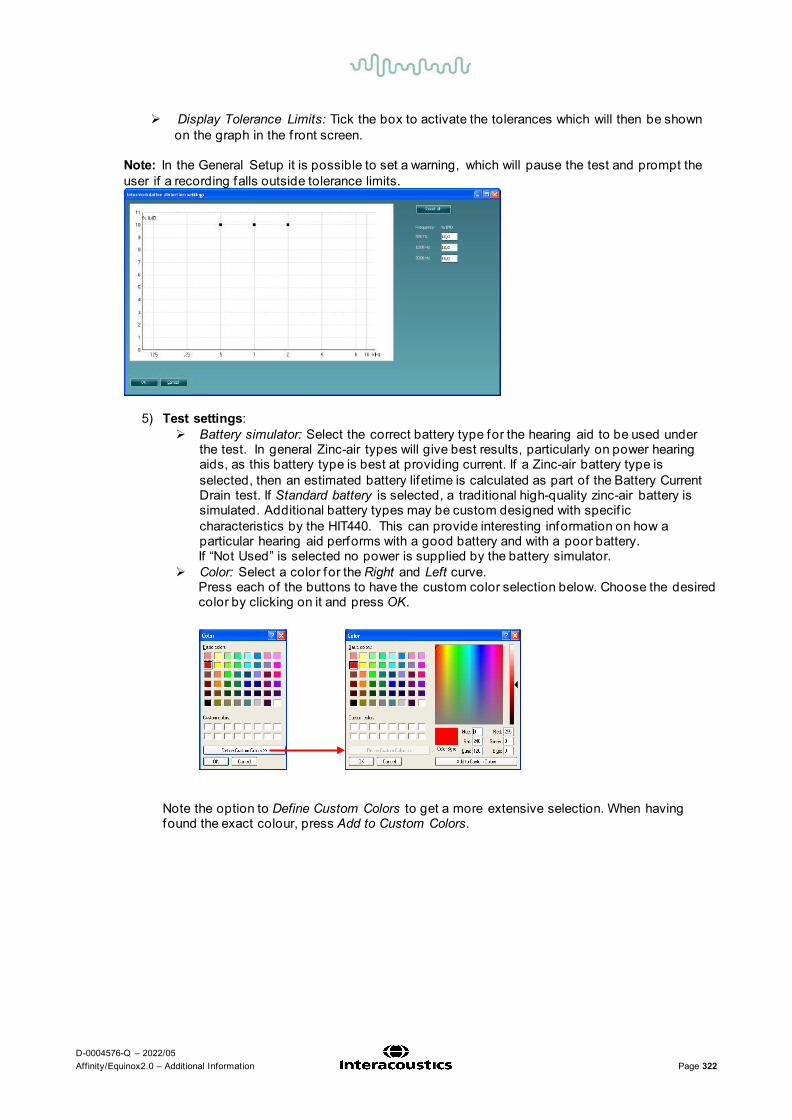
D-0004576-Q – 2022/05 Affinity/Equinox2.0 – Additional Information Page 322
Display Tolerance Limits: Tick the box to activate the tolerances which will then be shown on the graph in the f ront screen.
Note: In the General Setup it is possible to set a warning, which will pause the test and prompt the user if a recording falls outside tolerance limits.
5) Test settings: Battery simulator: Select the correct battery type for the hearing aid to be used under
the test. In general Zinc-air types will give best results, particularly on power hearing aids, as this battery type is best at providing current. If a Zinc-air battery type is selected, then an estimated battery lifetime is calculated as part of the Battery Current Drain test. If Standard battery is selected, a traditional high-quality zinc-air battery is simulated. Additional battery types may be custom designed with specif ic characteristics by the HIT440. This can provide interesting information on how a particular hearing aid performs with a good battery and with a poor battery.
If “Not Used” is selected no power is supplied by the battery simulator. Color: Select a color for the Right and Left curve. Press each of the buttons to have the custom color selection below. Choose the desired
color by clicking on it and press OK.
Note the option to Define Custom Colors to get a more extensive selection. When having
found the exact colour, press Add to Custom Colors.
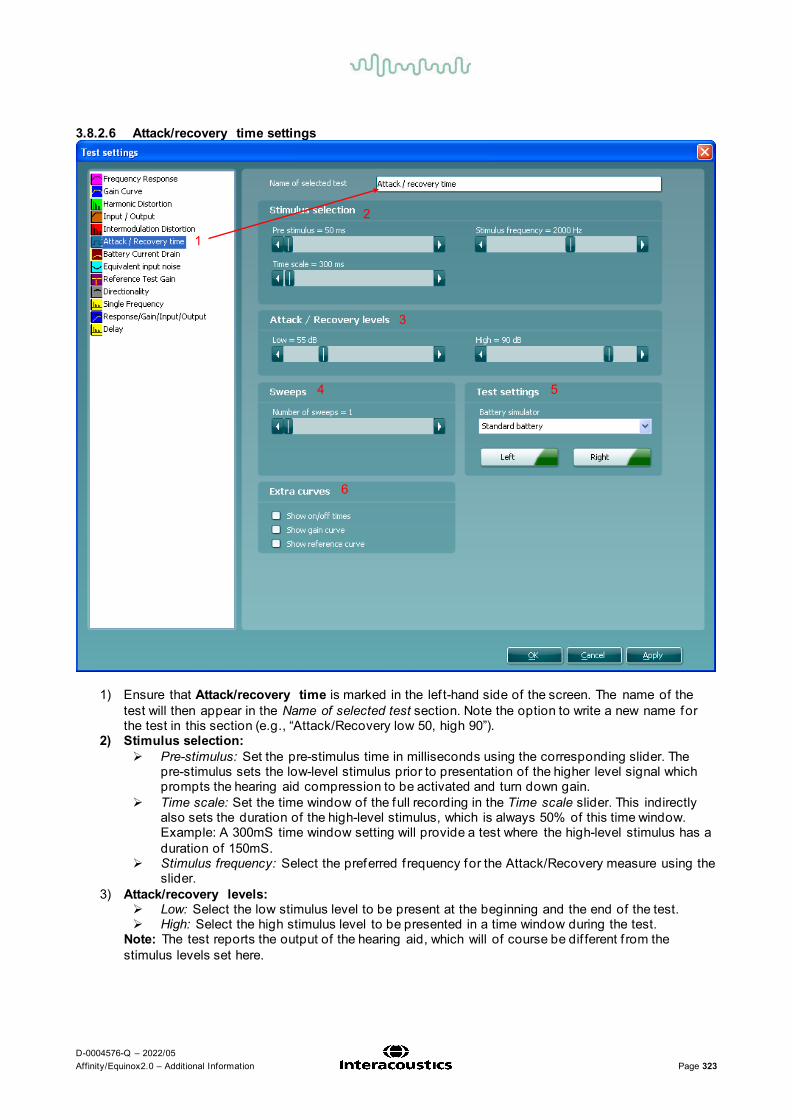
D-0004576-Q – 2022/05 Affinity/Equinox2.0 – Additional Information Page 323
3.8.2.6 Attack/recovery time settings
1) Ensure that Attack/recovery time is marked in the lef t-hand side of the screen. The name of the test will then appear in the Name of selected test section. Note the option to write a new name for the test in this section (e.g., “Attack/Recovery low 50, high 90”).
2) Stimulus selection: Pre-stimulus: Set the pre-stimulus time in milliseconds using the corresponding slider. The
pre-stimulus sets the low-level stimulus prior to presentation of the higher level signal which prompts the hearing aid compression to be activated and turn down gain.
Time scale: Set the time window of the full recording in the Time scale slider. This indirectly also sets the duration of the high-level stimulus, which is always 50% of this time window. Example: A 300mS time window setting will provide a test where the high-level stimulus has a duration of 150mS.
Stimulus frequency: Select the preferred f requency for the Attack/Recovery measure using the slider.
3) Attack/recovery levels: Low: Select the low stimulus level to be present at the beginning and the end of the test. High: Select the high stimulus level to be presented in a time window during the test.
Note: The test reports the output of the hearing aid, which will of course be dif ferent f rom the stimulus levels set here.
2
3
4 5
6
1

D-0004576-Q – 2022/05 Affinity/Equinox2.0 – Additional Information Page 324
4) Sweeps: Number of sweeps: Select a number of sweeps using the slider. To average out noise which
may inf luence particularly low-level recordings, you may select to do multiple recordings (sweeps) which are then averaged together to reduce noise. Only the averaged curve will be displayed.
5) Test settings: Battery simulator: Select the correct battery type for the hearing aid to be used under the test.
In general Zinc-air types will give best results, particularly on power hearing aids, as this battery type is best at providing current. If a Zinc-air battery type is selected, then an estimated battery lifetime is calculated as part of the Battery Current Drain test. If Standard battery is selected, a traditional high-quality zinc-air battery is simulated. Additional battery types may be custom designed with specif ic characteristics by the HIT440. This can provide interesting information on how a particular hearing aid performs with a good battery and with a poor battery.
If “Not Used” is selected no power is supplied by the battery simulator. Color: Select a color for the Right and Left curve.
Press each of the buttons to have the custom color selection below. Choose the desired color by clicking on it and press OK.
Note the option to Define Custom Colors to get a more extensive selection. When having found the exact colour, press Add to Custom Colors.
6) Extra curves: Show on/off times: Tick the boxes to show two thin lines showing when the level is shif ted on
the graph. Show gain curve: Tick the box to show again curve on screen together with the
Attack/Recovery curve. Show reference curve: Tick the box to show a reference curve on the graph. The reference
curve shows the level f rom the reference microphone.

D-0004576-Q – 2022/05 Affinity/Equinox2.0 – Additional Information Page 325
3.8.2.7 Battery current drain settings Settings for Battery Current Drain are identical to the settings described above for Frequency Response. Please refer to section 0.

D-0004576-Q – 2022/05 Affinity/Equinox2.0 – Additional Information Page 326
3.8.2.8 Equivalent input noise settings
1) Ensure that Equivalent input noise is marked in the lef t-hand side of the screen. The name of the test will then appear in the Name of selected test section. Note the option to write a new name for the test in this section (e.g., “Equiv. Input Noise 60 dB input”).
2) Stimulus selection: Input Level: Set the input level using the slider. Start Frequency and Stop Frequency: Select the preferred f requencies using the sliders. To
avoid low f requency noise set the slider to a start f requency of 200Hz. Averaging time: Decide the number of FFTs that shall be used for the averaging of non-linear
stimuli like ICRA noise, real speech or other wave-based stimuli. The longer average the more reproducible test results will be.
Stimulus type: Select a stimulus using the dropdown list (See stimulus list in section 3.12.1).
3 4
5 6
7
2
1

D-0004576-Q – 2022/05 Affinity/Equinox2.0 – Additional Information Page 327
3) Reference frequency: Ref f: Tick this option to select a single reference f requency using the slider. Af ter measuring
the curve, the level at the reference f requency will be displayed in the measurement details table.
HFA/SPA: Tick this option to select three f requencies at a f ixed distance using the slider. Af ter
measuring the curve, the reference f requency average will be displayed in the in the measurement details table.
4) Tolerance limits: Set limits: Press the button to def ine individually preferred tolerance limit values. By applying
tolerance limits to the recording, it will be possible to easily document whether a curve is inside tolerances or not. In the Tolerance limits screen tolerance limits may be entered as numerical f requency specif ic values for Low limit and High limit. Alternatively Lower Limits and Higher Limits may be entered by clicking with the mouse directly on the dots in the co-ordinate system and dragging them to the preferred position.
Display Tolerance Limits: Tick the box to activate the tolerances which will then be shown on the graph in the f ront screen.
Note: In the General Setup it is possible to set a warning, which will pause the test and prompt the user if a recording falls outside tolerance limits.

D-0004576-Q – 2022/05 Affinity/Equinox2.0 – Additional Information Page 328
Recording method: Resolution (of f requency): Select the preferred resolution in the dropdown. The higher the
resolution the slower the measurement. Keep in mind that 1/3 is what is used in many hearing aid manufacturers sof tware. If the curve is to be compared to this, you may consider choosing this resolution. Also note that when using a broad band signal the dropdown list will change to of fer weighting instead.
Smoothing Index: You have the option to smooth the measured curve using the slider (see section 3.6.7 for details). The higher index number selected the more smoothing is applied
5) Test settings: Battery simulator: Select the correct battery type for the hearing aid to be used under the test.
In general Zinc-air types will give best results, particularly on power hearing aids, as this battery type is best at providing current. If a Zinc-air battery type is selected, then an estimated battery lifetime is calculated as part of the Battery Current Drain test. If Standard battery is selected, a traditional high-quality zinc-air battery is simulated. Additional battery types may be custom designed with specif ic characteristics by the HIT440. This can provide interesting information on how a particular hearing aid performs with a good battery and with a poor battery.
If “Not Used” is selected no power is supplied by the battery simulator. Color: Select a color for the Right and Left curve. Press each of the buttons to have the custom color selection below. Choose the desired color
by clicking on it and press OK.

D-0004576-Q – 2022/05 Affinity/Equinox2.0 – Additional Information Page 329
Note the option to Define Custom Colors to get a more extensive selection. When having found
the exact colour, press Add to Custom Colors. 6) Eq input noise display
Curve: Select this option to see the measurement as a curve. Figure: Select this option to see the measurement as a f igure.

D-0004576-Q – 2022/05 Affinity/Equinox2.0 – Additional Information Page 330
3.8.2.9 Reference test gain settings
1) Ensure that Reference Test Gain is marked in the lef t-hand side of the screen. The name of the test will then appear in the Name of selected test section. Note the option to write a new name for the test in this section (e.g., “Equiv. Input Noise 60 dB input”)
2) Stimulus selection: Input Level: Set the input level using the slider. Stimulus type: Select a stimulus using the dropdown list (Note that only Pure Tone and Warble
Tone are available). 3) Reference frequency: Ref f: Tick this option to select a single reference f requency using the slider. Af ter measuring
the curve, the level at the reference f requency will be displayed in the measurement details table.
2
3 4 1

D-0004576-Q – 2022/05 Affinity/Equinox2.0 – Additional Information Page 331
HFA/SPA: Tick this option to select three f requencies at a f ixed distance using the slider. Af ter
measuring the curve, the reference f requency average will be displayed in the in the measurement details table.
4) .Test settings: Battery simulator: Select the correct battery type for the hearing aid to be used under the test.
In general Zinc-air types will give best results, particularly on power hearing aids, as this battery type is best at providing current. If a Zinc-air battery type is selected, then an estimated battery lifetime is calculated as part of the Battery Current Drain test. If Standard battery is selected, a traditional high-quality zinc-air battery is simulated. Additional battery types may be custom designed with specif ic characteristics by the HIT440. This can provide interesting information on how a particular hearing aid performs with a good battery and with a poor battery.
If “Not Used” is selected no power is supplied by the battery simulator. Color: Select a color for the Right and Left curve. Press each of the buttons to have the custom color selection below. Choose the desired color
by clicking on it and press OK.
Note the option to Define Custom Colors to get a more extensive selection. When having found
the exact color, press Add to Custom Colors.

D-0004576-Q – 2022/05 Affinity/Equinox2.0 – Additional Information Page 332
3.8.2.10 Directionality settings Settings for Directionality are identical to the settings described above for Frequency Response with the exceptions listed below. Please refer to section 0 for details regarding the additional test settings.
1) Display result as: Response: Tick this option to have the measurement displayed in dB SPL. Gain: Tick this option to have the measurement displayed in dB gain. Note: The Input selection options, and Multiple curves are not available for Directionality.
1

D-0004576-Q – 2022/05 Affinity/Equinox2.0 – Additional Information Page 333
3.8.2.11 Single frequency settings
1) Ensure that Single Frequency is marked in the lef t-hand side of the screen. The name of the test will then appear in the Name of selected test section. Note the option to write a new name for the test in this section (e.g., “Single Frequency 1000 Hz”)
2) Stimulus selection: Input Level: Set the input level using the slider. Stimulus type: Select a stimulus using the dropdown list. Note that only Pure Tone and Narrow
Band Noise are available. Start Frequency: Select the preferred f requency using the slider. Continuous: This check box allows you to make the measurement ongoing rather than a single
sweep. This may, however, also be done in the f ront screen using the continuous button:
When continuous is ticked, the stimulus and recording will continue until you press the STOP button.
1
2
3

D-0004576-Q – 2022/05 Affinity/Equinox2.0 – Additional Information Page 334
3) Test settings: Battery simulator: Select the correct battery type for the hearing aid to be used under the test.
In general Zinc-air types will give best results, particularly on power hearing aids, as this battery type is best at providing current. If a Zinc-air battery type is selected, then an estimated battery lifetime is calculated as part of the Battery Current Drain test. If Standard battery is selected, a traditional high-quality zinc-air battery is simulated. Additional battery types may be custom designed with specif ic characteristics by the HIT440. This can provide interesting information on how a particular hearing aid performs with a good battery and with a poor battery.
If “Not Used” is selected no power is supplied by the battery simulator. Color: Select a color for the Right and Left curve. Press each of the buttons to have the custom color selection below. Choose the desired color
by clicking on it and press OK.
Note the option to Define Custom Colors to get a more extensive selection. When having found the exact color, press Add to Custom Colors.

D-0004576-Q – 2022/05 Affinity/Equinox2.0 – Additional Information Page 335
3.8.2.12 Response/gain/input/output settings Settings for Response/Gain/Input/Output are identical to the settings described above for Frequency Response (or Gain Curve) and Input/Output respectively. Please refer to section 0 and 0.
Note: This screen contains two tabs: Response/gain and Input/output.

D-0004576-Q – 2022/05 Affinity/Equinox2.0 – Additional Information Page 336
3.8.2.13 Delay settings
1) Ensure that Delay is marked in the lef t-hand side of the screen. The name of the test will then
appear in the Name of selected test section. Note the option to write a new name for the test in this section (e.g., “Delay 70 dB input”).
2) Stimulus selection: Input Level: Set the input level using the slider.
3) Test settings: Battery simulator: Select the correct battery type for the hearing aid to be used under the test.
In general Zinc-air types will give best results, particularly on power hearing aids, as this battery type is best at providing current. If a Zinc-air battery type is selected, then an estimated battery lifetime is calculated as part of the Battery Current Drain test. If Standard battery is selected, a traditional high-quality zinc-air battery is simulated. Additional battery types may be custom designed with specif ic characteristics by the HIT440. This can provide interesting information on how a particular hearing aid performs with a good battery and with a poor battery.
If “Not Used” is selected no power is supplied by the battery simulator. Color: Select a color for the Right and Left curve. Press each of the buttons to have the custom color selection below. Choose the desired color
by clicking on it and press OK.
1
2 3

D-0004576-Q – 2022/05 Affinity/Equinox2.0 – Additional Information Page 337
Note the option to Define Custom Colors to get a more extensive selection. When having found the exact color, press Add to Custom Colors.
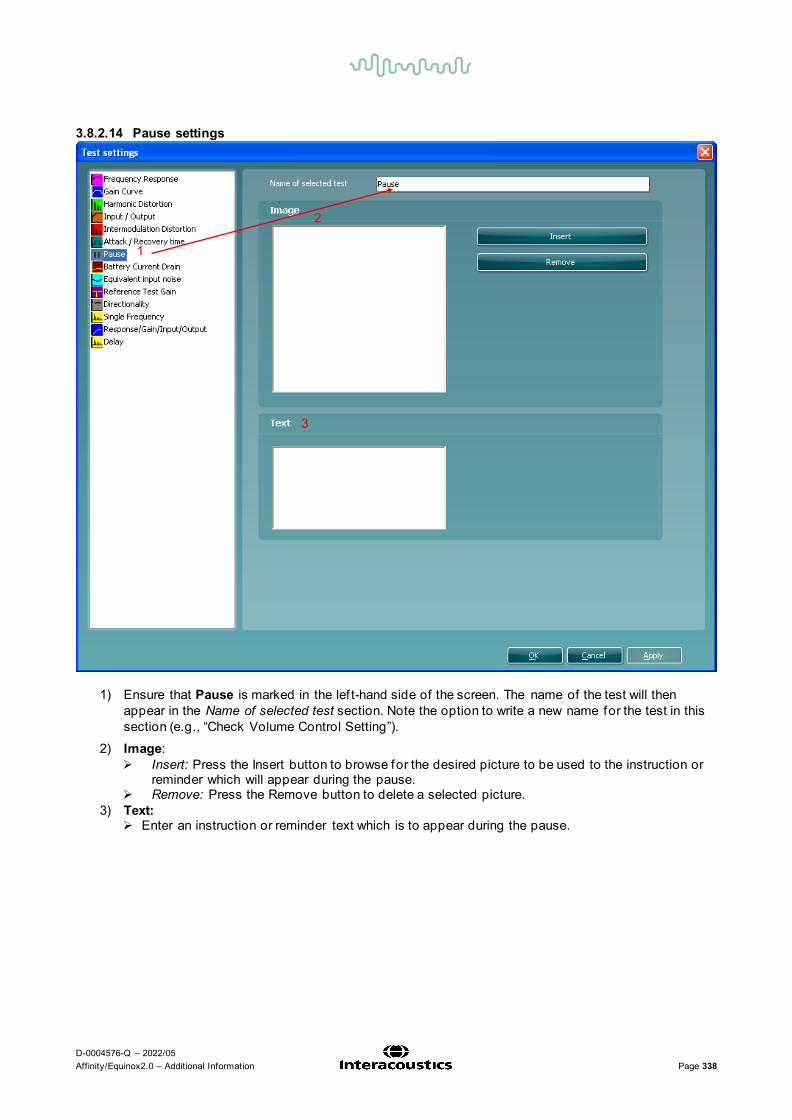
D-0004576-Q – 2022/05 Affinity/Equinox2.0 – Additional Information Page 338
3.8.2.14 Pause settings
1) Ensure that Pause is marked in the lef t-hand side of the screen. The name of the test will then
appear in the Name of selected test section. Note the option to write a new name for the test in this section (e.g., “Check Volume Control Setting”).
2) Image: Insert: Press the Insert button to browse for the desired picture to be used to the instruction or
reminder which will appear during the pause. Remove: Press the Remove button to delete a selected picture.
3) Text: Enter an instruction or reminder text which is to appear during the pause.
2
1
3

D-0004576-Q – 2022/05 Affinity/Equinox2.0 – Additional Information Page 339
3.8.3 Combined screen setup HIT440 can be setup for default curve comparisons. This is done in the Setup combined screen menu.
1) To enter the Setup combined screen menu, select your test protocol in the Selected protocol
dropdown list in the main setup. 2) Click on the Setup combined screen button.
This will prompt the combined screen setup below:
3) To create a default curve comparison view, click on Add new screen. A tab will then appear in the
upper part of the screen. 4) Use the arrows to move the measurements to be compared (listed to lef t) to the new screen. If
preferred, you can add several new comparison screens. 5) When f inished click OK to return to the main setup.
4

D-0004576-Q – 2022/05 Affinity/Equinox2.0 – Additional Information Page 340
Note: Before closing the setup remember to tick the Display combined screen check box for the combined screen settings to be active.
When a combined screen view is setup, you can click on the Toggle between single and combined screen button in the f ront screen to view the desired curves together:
If no combined screen view is setup Toggle between single and combined screen will show all measured curves.
3.8.4 Print layout settings
The HIT440 module allows for setting up individual print layouts. This is done in the Print Wizard which is entered using the Print Wizard button (read about the Print Wizard in section 4.1).

D-0004576-Q – 2022/05 Affinity/Equinox2.0 – Additional Information Page 341
3.8.5 Finishing the test protocol Press OK in the lower right-hand corner of the HIT440 setup screen to save the customized test protocol. The test protocol can then be found in the List of Protocols dropdown list on the f ront screen.

D-0004576-Q – 2022/05 Affinity/Equinox2.0 – Additional Information Page 342
3.8.6 Changing a test protocol permanently You can at any time make changes to an individual test protocol by entering the HIT440 setup again as when creating the test (Menu/Setup/HIT440 setup).
1) Choose your test protocol in the Selected protocol dropdown list. 2) Browse the setup options as if creating a test protocol (see section 0) and amend as desired. 3) When f inished click OK to save the changes.
1

D-0004576-Q – 2022/05 Affinity/Equinox2.0 – Additional Information Page 343
3.8.7 Changing a test protocol temporarily You may f rom time to time run into a client with special needs requiring advanced or dif ferent testing parameters. In this situation the Temporary Setup can be helpful. The setup changes made here will be specif ic to the session. The test protocol name will be supplemented with an asterisk (*) to indicate that changes have been made to original test protocol. After saving, the protocol will change back to the default selected protocol making you ready for your next client.
1) Enter the Temporary Setup by clicking the button in the f ront screen (or alternatively select Menu/Setup/Temporary setup).
3.8.7.1 Importing and exporting test protocols The HIT440 also allows you to import and export test protocols to other HIT440 users.
3.8.7.2 Importing a test protocol 1) Go to HIT440 Setup (Menu/Setup/HIT440 setup)
2) Click Import and browse to the location on the PC or USB where the test protocol f ile has been saved. 3) Click Open. 4) The test protocol will then appear under Selected Protocol. 5) Af ter saving it by clicking OK the test protocol can be selected in the List of Protocols on the f ront
screen.
4
2

D-0004576-Q – 2022/05 Affinity/Equinox2.0 – Additional Information Page 344
3.8.7.3 Exporting a test protocol 1) Go to HIT440 setup (Menu/Setup/HIT440 setup)
2) Click on Export. 3) Select if the f ile is to be saved as “Read Only”. In this case the test protocol f ile is locked and the
clinician receiving it will not be able to make changes to it. 4) Browse for the location on the PC or USB where the test protocol is to be placed. 5) Click Save. Other HIT440 users will then be able to upload the test protocol using the Import function. Note: Some available tests are Read Only tests. This means that they can be imported and used, but the parameters cannot be permanently changed. This is to ensure that specialized tests created by e.g., Hearing Aid Manufacturers for special application purposes are used as intended for greatly improved test control. An imported Read Only test protocol will have all its setup points dimmed, as no change of parameters is allowed in such a test. Even though Read Only tests cannot be permanently modif ied at all, you can create another test with another name based on the Read Only test. You can just select the read only test in Selected Protocol before selecting New. Then all characteristics of the Read Only test will present for your new test. In this new test you can modify all parameters – including the Print Wizard.
2
5
4

D-0004576-Q – 2022/05 Affinity/Equinox2.0 – Additional Information Page 345
3.9 General setup In the General Setup you can select overall settings which are valid for all tests.
To enter the To enter the General setup, select Menu/Setup/General Setup
4
1
2
3
5
6 7
8 9
10
11

D-0004576-Q – 2022/05 Affinity/Equinox2.0 – Additional Information Page 346
1) Custom defined batteries: You have the option to create own custom batteries for the testing. Battery name: To create a new battery, write a name under Battery name. Voltage: Set the desired voltage for the custom def ined battery using the slider (expressed
in mV). Impedance: Set the desired impedance for the custom def ined battery using the slider
(expressed in Ohm). New/Update: Click New/Update to save the battery. The new custom battery will then be
listed in the Selected battery dropdown list. Remove: Click Remove to delete a custom battery.
2) Sound file folder: If you prefer to use a stimulus not found in the HIT440 stimulus selection you can use other
sound f iles saved on your PC via the Sound File Folder. Press the button to browse for the f iles on the PC. Note that the f iles need to be in .wav format, have a sample f requency of 44100 Hz, and a resolution of 16 bit. Both mono and stereo f iles can be used.
3) Warble adjustment: Modulation Rate: Select a modulation rate for Warble Tone stimuli (in Hz) using the slider. Frequency Deviation: Select a f requency deviation for Warble Tone stimuli (in %) using
the slider. 4) Ref and coupler:
Specify which reference microphone and couplers are used. If using the ones provided by Interacoustics tick Normal and if using Brüel & Kjær tick B_K type.
5) Test box: Select the preferred test box:
Internal: This option refers to the Af f inity2.0 built-in test box. External: This refers to an external test box such as TBS25 which can be used with the
Af f inity2.0 and Equinox2.0. Note that the external test box needs to include a 3.5 mm stereo jack.
6) Environmental noise Show warning: Ticking this option will prompt the sof tware to show a warning screen if the
ambient noise in the environment reaches a level which can af fect the measurement. 7) Outside limits:
Tick this option to show a warning when curves are outside tolerance limits. This is, however, only relevant if the professional has setup tolerance limits for the individual tests in the HIT440.
8) Auto color: Auto color: Tick this option to have the system automatically pick a new color for each
measured curve. Show detailed gridlines: Tick this option to have detailed gridlines on the graph as
illustrated below:
9) Launch via IMC server : insert a checkmark in this box to enable the HIT module to be launched
f rom another module, such as a hearing aid manufacturer’s sof tware 10) Skull coupler setup guide: Remove the checkmark f rom the checkbox to disable the skull
simulator setup guide

D-0004576-Q – 2022/05 Affinity/Equinox2.0 – Additional Information Page 347
11) Show/hide icons button: Press the button to customize the test screen. Use the tick boxes to decide which buttons and dropdown lists should be available f rom the f ront screen.

D-0004576-Q – 2022/05 Affinity/Equinox2.0 – Additional Information Page 348
3.10 The HIT440 menu items The HIT440 Menu gives you access to File, Edit, View, Mode, Setup, and Help. 1) Menu/Print
Menu/Print/Print will prompt the system to print using the selected print template (see section 4). Menu/Print/Print Preview prompts a print preview of the current test protocol using the print
template which is linked to the current protocol. Note that you are prompted to select a template if the protocol did not include a template (see how to create a print layout in section 0).
Menu//Print/Print Layout opens the print wizard window f rom where you can select or create a template to print the current test protocol (see section for details regarding the Print Wizard).
2) Menu/Edit/Export Menu/Edit/Export will prompt the system to export the session as an XML formatted f ile.
3) Menu/View Menu/View/Save window position will save the current position of the HIT440 window on the PC
screen so that it opens at this exact position every time. This is for example practical if you are usually running and viewing other sof tware modules (such as f itting software) at the same time. Using this function for moving and/or resizing of the HIT440 will only be necessary once.
4) Menu/Mode Menu/Mode/Single measurement will set the system to present the selected stimulus as a single
sweep. Menu/Mode/Continuous measurement will set the system to present the selected stimulus
continuously. Menu/Mode/Single frequency mode will set the system to perform a test at a single f requency. Menu/Mode/Endless loop will set the system to perform the tests of the test protocol continuously
until tolerance limits specif ied in the setup are overstepped. Menu/Setup
Menu/Setup/HIT440 setup opens the HIT440 where you can setup customised test protocols Menu/Setup/General setup opens the General setup where settings valid for all tests can be
selected Menu/Setup/Temporary setup opens the Temporary setup where temporary settings for the
specif ic session can be selected Menu/Setup/Password protection allows you create or change a password and thereby protect
your HIT440 settings. Press Change password and type in the preferred password. Then press OK. Note that your password needs to be activated in Protected settings under Menu/setup/General setup (see section 0).
Menu Setup/Show/hide protocols prompts a screen allowing you to tick test protocols which are
to be shown in the List of Protocols and untick the test protocols which are to be hidden. Menu/Setup/Language opens the language selection. The system must be restarted for a new
language selection to take ef fect. Menu/Setup/General Suite Settings launches a screen where the user can choose which module
should start up, the examiner options and the choice to change the language. Please note that changing something in this screen will af fect all active modules, not just the HIT module.

D-0004576-Q – 2022/05 Affinity/Equinox2.0 – Additional Information Page 349
5) Menu/Help Menu/Help/About HIT440 prompts a message box showing information regarding the Suite
version, Hardware version, and Firmware version. Please note that if experiencing problems with the system this information should be sent to the manufacturer along with the description of the issue. (Your instruments serial number will also be required). Note: Press License to be able to type in a new license code.

D-0004576-Q – 2022/05 Affinity/Equinox2.0 – Additional Information Page 350
3.11 HIT440 software - technical specifications Medical CE-mark: The CE-mark in combination with MD symbol indicates that
Interacoustics A/S meets the requirements of the Medical Device Regulation (EU) 2017/745 Annex I Approval of the quality system is made by TÜV – identif ication no. 0123.
Hearing Aid Analyzer standards: IEC 60118-0, IEC 60118-7, ANSI S3.22.
Frequency range: 100-10000Hz. Frequency resolution: 1/3, 1/6, 1/12 and 1/24 octave or 1024-point FFT. Frequency accuracy: Less than ± 1 %
Stimuli signal: Warble Tone, Pure Tone, Random noise, Pseudo random noise, Band limited white noise, Chirp, ICRA, Real Speech, any other sound f ile (automatic calibration available).
Sweep speed: 1,5 – 12 sec.
FFT: Resolution 1024 points. Averaging: 10 – 500.
Stimulation intensity range: 40-100 dB SPL in 1 dB step. Intensity accuracy: Less than ± 1.5 dB Measurement intensity range: Probe microphone 40-145 dB SPL ± 2 dB
Stimulus distortion: Less than 1 % THD. Battery simulator: Standard and custom types are selectable
Standard battery Impedance[Ω] Voltage[V] Zinc air 5 8 1.3 Zinc air 10 6 1.3 Zinc air 13 6 1.3 Zinc air 312 6 1.3 Zinc air 675 3.5 1.3 Mercury 13 8 1.3 Mercury 312 8 1.3 Mercury 657 5 1.3 Mercury 401 1 1.3 Silver 13 10 1.5 Silver 312 10 1.5 Silver 76 5 1.5 Custom types 0 – 25 1.1 – 1.6
Available tests: Additional tests can be designed by user OSPL90 Full On Gain Input/output Attack/Recovery Time Reference Test Gain Frequency Response Equivalent Input Noise
Harmonic Distortion Intermodulation Distortion Battery Current Drain Microphone Directionality Coil Frequency Response Coil Harmonic Distortion Coil Full-On Gain Response
Pre-programmed protocols: HIT440 sof tware comes with a set of Test Protocols loaded. Additional Test Protocols can be designed by user, or easily imported into the system.
Compatible software: Noah 4, OtoAccess® and XML compatible

D-0004576-Q – 2022/05 Affinity/Equinox2.0 – Additional Information Page 351
3.12 Appendix 1
3.12.1 The HIT440 test signal characteristics Pure Tone f requency accuracy is ±1%. Crest factor is 3 dB. Warble Tone f requency accuracy is ±1%, warble f requency 0100 Hz and intensity 010%, sine wave f requency modulation. Crest factor is 3 dB. Random Noise is a noise with a linear spectrum measured with an FFT or a 3 dB drop per octave measured with a 1/3 octave f ilter. Pseudo random noise. is a semi-broad-band noise produced f rom random noise weighted with a 2nd order 200 Hz high pass f ilter and a 1st order 900 Hz low pass f ilter as described in the ANSI S3.42 -1992 standard. Crest factor is 10 dB. Chirp. Is a linear f requency sweep f rom 100 to 10 kHz in 23 mS = one FFT measuring. The amplitude is constant during the sweep. Crest factor = 3 dB. Band limited white noise is a random noise signal band limited by 12 kHz 2. order low pass f ilter. Crest factor is 9 dB. PinkNoise is a noise with a linear spectrum measured with a 1/3 octave f ilter or a 3 dB rise per octave measured with an FFT. ICRA Noise:
ICRA: urgnmn Unmodulated random Gaussian noise - Male weighted - Normal ef fort - Level Ref . Crest factor = 13 dB. ICRA: urgnmr Unmodulated random Gaussian noise - Male weighted - Raised ef fort - Level Ref+5.7dB. Crest factor = 14 dB. ICRA: urgnml Unmodulated random Gaussian noise - Male weighted - Loud ef fort - Level Ref+12.1 dB. Crest factor = 14 dB. ICRA: 3bsmnfn 3 Band speech modulated noise (3bSMN) - Female weighted - Normal ef fort - Level Ref . Crest factor = 27 dB. ICRA: 3bsmnmn 3 Band speech modulated noise (3bSMN) - Male weighted - Normal ef fort - Level Ref . Crest factor = 27 dB. ICRA: 2pb1f1mn 2 persons babble, 1female 3bSMN + 1 male 2bSMN - Idealized - Normal ef fort - Level Ref + 3dB. Crest factor = 24 dB. ICRA: 6pbn 6 persons babble, 1f+1m+2f(-6db)+2m(-6dB), all 3bSMN - Idealized - Normal ef fort - Level Ref + 4.7dB. Crest factor = 23 dB. ICRA: 6pbr 6 persons babble, 1f+1m+2f(-6db)+2m(-6dB), all 3bSMN - Idealized - Raised ef fort - Level Ref + 10.7dB. Crest factor = 24 dB. ICRA: 6pbl 6 persons babble, 1f+1m+2f(-6db)+2m(-6dB), all 3bSMN - Idealized - Loud ef fort - Level Ref + 17.2dB. Crest factor = 25 dB.
Speech Dialog Crest factor = 24 dB. Speech Femal Crest factor = 20 dB. Speech Male Crest factor = 25 dB. Sound File this crest factor is not known.

D-0004576-Q – 2022/05 Affinity/Equinox2.0 – Additional Information Page 352
3.12.2 Signal analysis characteristics
The following table summarises the signal analysis characteristics of the Af f inity/Equinox. Broadband analysis Measurement bandwidth: 43Hz Integration time: 1 – 1200 sec. Spectrum analysis, sweep filtered Filter bandwidth: 1/3 octave Skirt slope: 12dB pr. Octave Spectrum analysis, digital means Sampling rate 44100Hz Digital resolution: 1024 FFT (43Hz) Average time: 1 – 1200 sec. Analyze bandwidth: 100 – 10000Hz Block length: 23ms Window type: Blackman Harris Window overlap: None Method: Amplitude spectrum Total f requency range: 50 – 20000Hz

D-0004576-Q – 2022/05 Affinity/Equinox2.0 – Additional Information Page 353
3.13 Appendix 2:
3.13.1 Connecting the TBS25 to Affinity2.0/Equinox2.0 Description: The following items are included with the Cable kit for TBS25 – Af f inity 2.0/Equinox 2.0 and TBS25: 1) Base for reference microphone
2) Test box connection cable for speaker (green connector) 3) Cable for test box loop (beige connector) 4) Cable reference mic. (black connector) 5) Cable coupler mic. (white connector) 6) Cable battery adaptor (red connector)
The cable connectors are plugged into the Af f inity 2.0 as shown in Error! Reference source not found. and into the TBS25 as shown in Error! Reference source not found.. The reference microphone can be placed in the lef t or right side of the TBS25, as you prefer (Error! Reference source not found. and Error! Reference source not found.).
1)
2) 3)
4)
6)
5)
Figure 2: Cable placement on the Affinity/Equinox
Figure 3: Cable placement in TBS25
Figure 5: Reference mic. placement 2
Figure 1: Cable kit
3)
2) 1)
4)
Figure 4: Reference mic. placement 1

D-0004576-Q – 2022/05 Affinity/Equinox2.0 – Additional Information Page 354
4 Printing and making reports 4.1 The print wizard In the Print Wizard you have the option to create customized print templates which can be linked to individual protocols for quick printing. The Print Wizard can be accessed in two ways.
a. If you want to make a template for general use, or select an existing one for printing: Go to Menu/ File/Print Layout… in any of the Af f inity2 Suite tabs (AUD, REM or HIT)
b. If you want to make a template or select an existing one to link to a specif ic protocol: Go to Module tab (AUD, REM, or HIT) relating to the specif ic protocol and select Menu/Setup/AC440 setup, Menu/Setup/REM440 setup, or Menu/Setup HIT440 setup. Select the specif ic protocol from the drop-down menu and select Print Wizard at the bottom of the window.
Now the Print Wizard window opens and shows the following information and functionalities:
1. Underneath Categories you can select
• Templates to show all available templates • Factory defaults to show only standard templates • User defined to show only custom templates • Hidden to show hidden templates • My favorites to show only templates marked as a favorite
2. Available templates f rom the selected category are shown in the Templates viewing area.
1 2 3 4
5
6
1
12a 1
12b

D-0004576-Q – 2022/05 Affinity/Equinox2.0 – Additional Information Page 355
3. Factory default templates are recognized by the lock icon. They ensure that you always have a standard template and do not need to create a customized one. However, they cannot be edited according to personal preferences without resaving with a new name. User defined/created templates can be set to Read-only (showing the lock icon), by right clicking on the template and selecting Read-only f rom the drop-down list. Read-only status can also be removed f rom User defined templates by following the same steps.
4. Templates added to My favorites are marked with a star. Adding templates to My favorites allows quick viewing of your most used templates.
5. The template that is attached to the selected protocol when entering the print wizard via the AC440, REM440 or HIT440 window is recognized by a checkmark.
6. Press the New Template button to open a new empty template. 7. Select one of the existing templates and press the Edit Template button to modify the selected
layout. 8. Select one of the existing templates and press the Delete Template button to delete the selected
template. You will be prompted to conf irm that you want to delete the template. 9. Select one of the existing templates and press the Hide Template button to hide the selected
template. The template will now be visible only when Hidden is selected under Categories. To unhide the template, select Hidden under Categories, right click on the desired template, and select View/Show.
10. Select one of the existing templates and press the My Favorites button to mark the template as a favorite. The template can now be quickly found when My Favorites is selected under Categories. To remove a template marked with a star f rom My Favorites, select the template and press the My Favorites button.
11. Select one of the templates and press the Preview button to print preview the template on screen. 12. Depending how you reached the Print Wizard, you will have the option to press
a. Print for using the selected template for printing or press b. Select for dedicating the selected template to the protocol f rom which you got into the Print
Wizard. 13. To leave the Print Wizard without selecting or changing a template press Cancel.
Right clicking on a specif ic template provides a drop-down menu of fering an alternative method for performing the options as described above:

D-0004576-Q – 2022/05 Affinity/Equinox2.0 – Additional Information Page 356
4.1.1 Designing a customized print template After clicking on the New Template (or Edit Template) button the design window shows as below.
1. Upon opening, a short description about how to create a template will show on the screen. Press Close to close the message box. Uncheck the Show hints checkbox if you do not want it to appear next time.
2. This list shows the elements which can be dragged onto the blank template. When General is selected, the general elements are listed. Template elements for each module will be listed when selecting the relevant module name, for example AUD, REM, HIT. If other suites are installed, such as the Titan suite, the relevant suites will also be displayed. The handling and options for all elements are discussed in a separate section below.
3. The taskbar includes numerous icons for customizing the elements that are dragged onto the blank template page. These are described below in a separate section.
4. Press Save to save the print template and go back to the Print Wizard window. If you have created a new template, you are prompted to give it a name. Press Save As… if you have modif ied an existing template and want to save under a dif ferent name.
5. Pressing the Page Setup button opens the Page Setup window where you can choose the paper size, source, margins, and setup the paper orientation.
6. If the template has more than one page, use the up and down arrows, , to scroll through the dif ferent pages. You can also type in the page number that you would like to view and/or edit.
7. The Zoom drop down menu allows you to change the viewing size of the template on screen.

D-0004576-Q – 2022/05 Affinity/Equinox2.0 – Additional Information Page 357
1a 1b 1c
1a 1b
4.1.2 Design elements Template elements are added to the template page using the select, drag, and drop function. Click on the desired element and drag it onto the template page. The element will appear as a small box in the upper lef t-hand corner. Resize the element to the desired size and drag it to an appropriate location. The following elements are available for the AUD, REM,HIT and Video Otoscopy modules. The section below describes the options available within each element once dragged onto the template. Right clicking on any element will list its options for customization.
4.1.2.1 General elements 1. Client information
a. Select fields opens the Select fields window where you select which items are to be shown in the client information element. You can change the order of the items by selecting one
and pressing the up or down arrows . Pressing will create a new empty f ield that can be named and shown in the template. Change a f ield’s name by selecting it, waiting for 1 sec, and then lef t clicking on the name. Pressing will remove user created f ields when
selected. Press to restore the manufacturers’ default f ields. b. Format… opens the Format Client window. Here you can change the the font, font size and
formatting, and the appearance (borders) of the Client information area. c. Selecting Rotate makes the element rotate 90

D-0004576-Q – 2022/05 Affinity/Equinox2.0 – Additional Information Page 358
2a
2b
2c
2d 2e
2a 2b
2 Clinic information. a. Select fields pops up the Select fields window where you select which items are to be shown in the
clinic information element. You can change the order of the items by selecting one and pressing the
up or down arrows . Pressing will create a new empty f ield that can be named and shown in the template. Change a f ield’s name by selecting it, waiting for 1 sec, and then lef t clicking on the name. Pressing will remove user created f ields when selected.
Press to restore the manufacturers’ default f ields. b. Enter clinic info… opens the Clinic info editor window. Here you can type and save the clinic
information specif ically for the selected print template. The Create date item cannot be changed as it will always show the current date and time.
a. Format… Here you can change the the font, font size and formatting, and the appearance (borders) of the Clinic information area.
c. By selecting Show labels, the Clinic information f ields can be toggled on and of f . d. Selecting Rotate makes the element rotate 90 degrees clockwise.
3. Logo. a. Select image opens a window f rom where you can browse to f ind the image stored on your PC that
you want to include in the template. b. Selecting Rotate makes the element rotate 90 degrees clockwise.
3. Text. This element allows you to add additional text, e.g., footnotes on your template. a. Enter text opens the Enter Text window. Here you can type in f reetext and choose the font type,
size and formatting. b. Selecting Rotate makes the element rotate 90 degrees clockwise.
3a
3b
2c

D-0004576-Q – 2022/05 Affinity/Equinox2.0 – Additional Information Page 359
4a
4b
5a
5b
4. Date time. This element allows you to put in a stamp on the template showing date and/or time of printing.
a. Enter setup…opens the Date time setup window. Here you choose the format in which the date and/or time appears in the template.You can also choose the font type, size and formatting.
b. Selecting Rotate makes the element rotate 90 degrees clockwise.
5. Session date. This element allows you to put in a stamp on the template showing date and/or time
that the measurements were recorded. a. Enter setup… opens the Date Time setup window, exactly as in 5a. Here you choose the format in
which the date and/or time appears in the template. You can also choose the font type, size and formatting.
b. Selecting Modules gives the opportunity to def ine which modules’ session dates will be shown. On the print out you can combine measurements f rom both the Af f inity Suite and Titan Suite.
c. Toggle borders allows you to disable or enable the border around the Session date element.
4a
5a, 6a

D-0004576-Q – 2022/05 Affinity/Equinox2.0 – Additional Information Page 360
6a 6b 6c 6d
6b
1 2 3 5 4 6 7 8 9 10 11 12 13 14 15
d. Selecting Rotate makes the element rotate 90 degrees clockwise.
6. Hardware – Here you can include information about the hardware such as Hardware name, modules used, version number, last calibration date and next calibraton due.
a. Select fields pops up the Select fields window where you select which items are to be shown in the Hardware element. You can change the order of the items by selecting one and pressing the
up or down arrows . Press to restore the manufacturers’ default f ields.

D-0004576-Q – 2022/05 Affinity/Equinox2.0 – Additional Information Page 361
b. Format… Here you can change the the font, font size and formatting, and the appearance (borders) of the Hardware area
c. Selecting Modules gives the opportunity to def ine which modules’ session dates will be shown
d. Selecting Rotate makes the element rotate 90 degrees clockwise
4.1.2.2 Taskbar 1. Add page to make a template of more than one page. 2. Remove page. You will be prompted if you are sure you want to delete the page and all its contents. 3. Align left. If you select two or more elements (using the shif t button on the keyboard) this button will
align those elements on their lef t sides. 4. Align right. If you select two or more elements (using the shif t button on the keyboard) this button
will align those elements on their right sides. 5. Align top. If you select two or more elements (using the shif t button on the keyboard) this button will
align those elements on their top sides. 6. Align bottom. If you select two or more elements (using the shif t button on the keyboard) this button
will align those elements on their bottom sides. 7. Align horizontal. If you select two or more elements (using the shif t button on the keyboard) this
button will align those elements on their horizontal central axis. 8. Align vertical. If you select two or more elements (using the shif t button on the keyboard) this button
will align those elements on their vertical central axis. 9. Make equal size. If you select two or more elements (using the shif t button on the keyboard) this
button will make all sizes equal to the element that was placed on the page f irst. 10. Same width. If you select two or more elements (using the shif t button on the keyboard) this button
will make all widths equal to the width of the element that was placed on the page f irst. 11. Same height. If you select two or more elements (using the shif t button on the keyboard) this button
will make all heights equal to the height of the element that was placed on the page f irst. 12. Send to back. This button sends the selected element(s) to the back. 13. Send to front. This button sends the selected element(s) to the f ront. 14. Lock element locks (or unlocks) the selected element(s). This means that the position and size of
the element is locked. When one of the taskbar functions is used on a locked element it will automatically unlock.
15. Display margins toggles between showing and not showing the print margins as a broken line.

D-0004576-Q – 2022/05 Affinity/Equinox2.0 – Additional Information Page 362
4.2 Creating reports The Af f inity 2.0/Equinox 2.0 Suite allows electronically generated reports through the Report editor. This allows reports to be saved in the module for each session and they can be retrieved at any time. The reports can also be implemented in the patient’s printout, which gives you the opportunity to have all the relevant test information in one customized piece of paper. The report function also includes the possibility to make Report templates which gives you the option to have dif ferent templates e.g., for different client groups or for use by dif ferent clinicians. Note: You must enter the report whilst in the current client session. It is not possible to enter a report for a previous session unless you transfer it to the current session f irst and resave it. Please refer to 1.11 on transferring data to current sessions (Menu/Edit/Transfer to current session). 4.2.1 Operation of the report editor
To open the Report editor to make a report on the current patient you need to press in the AUD, REM, or HIT screen.
4.2.1.1 The report editor
10
1
2 3 4 5 6
7 8 9 11 12 13 14 15 16 17

D-0004576-Q – 2022/05 Affinity/Equinox2.0 – Additional Information Page 363
1. Write your reports and observations in the report page. 2. Increase the Font size of the current selection. 3. Decrease Font size of the current selection. 4. Change the Font size of the current selection. 5. Change the Font type of the current selection. 6. Select a Template f rom one of the existing templates in the drop-down menu and insert it in the
current report. 7. Template Editor allows you to create a new template, edit an existing template, or set a preferred
template to be default template (see section 0 ). 8. Change the font of the current selection to be Bold. 9. Change the font of the current selection to be Italic. 10. Change the font of the current selection to be Underlined. 11. Change the alignment of the selection to Align left. 12. Change the alignment of the selection to Center. 13. Change the alignment of the selection to Align right. 14. Change the alignment of the selection to Justify. 15. Insert Numbering 16. Insert Bulleting. 17. Import Image allows you to browse for a picture on your PC (e.g., a clinic logo).
4.2.1.2 The template editor
To enter the Template Editor press .
1 2 3 4 5

D-0004576-Q – 2022/05 Affinity/Equinox2.0 – Additional Information Page 364
1. New Template enables you to create a new customized report template. Enter a template name (e.g., “Standard Report”) before pressing New Template. The name of the template will then appear on the tool bar, and you can type in your report template details like in the example below.
Remember to press the Save icon to save the template when f inished . 2. Edit Template allows you to edit an existing template. Press the button and select which of the
saved templates you wish to adjust. 3. Delete Template allows you to remove an existing template. Press the button and select which of
the saved templates you wish to delete. 4. Set as Default Template will cause the currently open template always to be inserted when the
report editor is opened for the f irst time during a session.
5. Press the red cross to return to the Report Editor .

D-0004576-Q – 2022/05 Affinity/Equinox2.0 – Additional Information Page 365
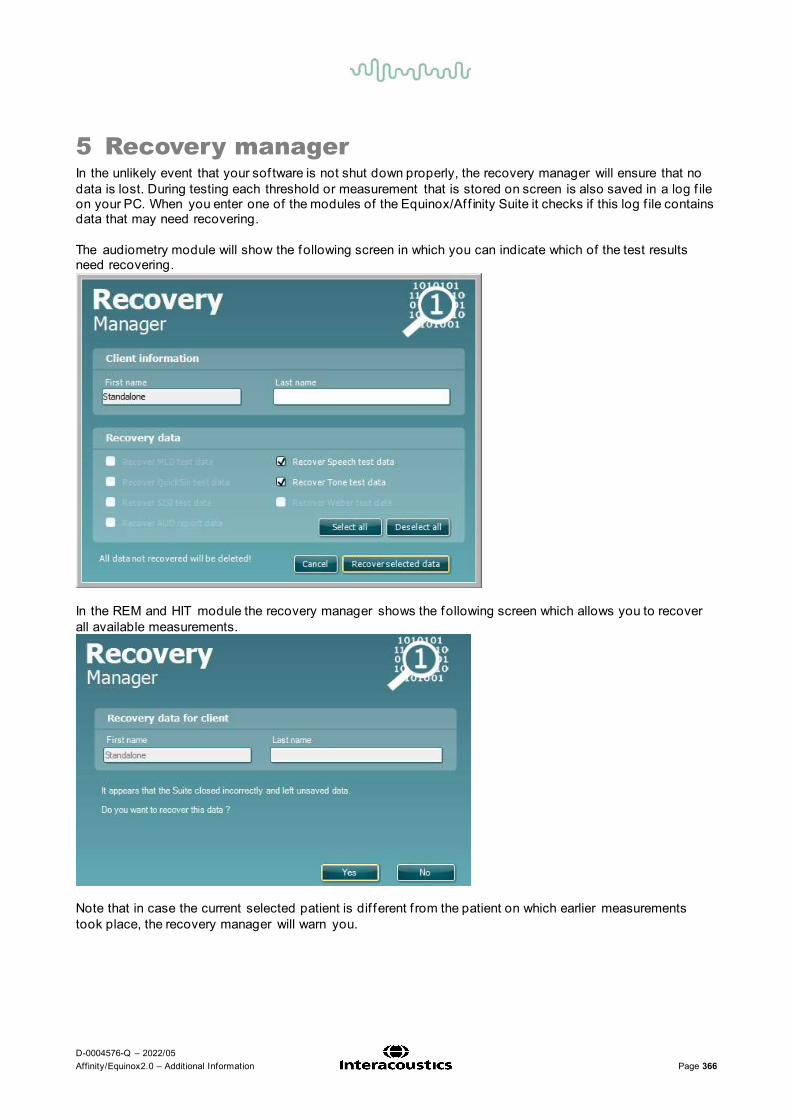
D-0004576-Q – 2022/05 Affinity/Equinox2.0 – Additional Information Page 366
5 Recovery manager In the unlikely event that your sof tware is not shut down properly, the recovery manager will ensure that no data is lost. During testing each threshold or measurement that is stored on screen is also saved in a log f ile on your PC. When you enter one of the modules of the Equinox/Af f inity Suite it checks if this log f ile contains data that may need recovering. The audiometry module will show the following screen in which you can indicate which of the test results need recovering.
In the REM and HIT module the recovery manager shows the following screen which allows you to recover all available measurements.
Note that in case the current selected patient is dif ferent f rom the patient on which earlier measurements took place, the recovery manager will warn you.

D-0004576-Q – 2022/05 Affinity/Equinox2.0 – Additional Information Page 367

D-0004576-Q – 2022/05 Affinity/Equinox2.0 – Additional Information Page 368
6 Crash reports The crash report helps sof tware developers better understand sof tware behavior if it suddenly crashes. The reports can either be saved and emailed or they can be sent directly into a Crash Report database, to which sof tware engineers have access and subsequently investigate the incidents. If the Af f inity Suite crashes, and the details can be logged by the system, the Crash Report window will appear on the test screen (as shown below). The crash report provides information to Interacoustics about the error message and extra information can be added by the user outlining what they were doing before the crash occurred to assist in f ixing the problem. A screen shot of the sof tware can also be sent. The “I agree to the Exclusion of Liability” check box must be checked before the crash report can be sent via the internet. For those users without an internet connection, the crash report can be saved to an external drive so it can be sent f rom another computer with an internet connection.

D-0004576-Q – 2022/05 Affinity/Equinox2.0 – Additional Information Page 369

D-0004576-Q – 2022/05 Affinity/Equinox2.0 – Additional Information Page 370
7 Quick guides Several quick guides have been developed to support the users of the Af f inity and Equinox, these can be found in your sof tware by navigating to ‘Manuals and Guides’ in all modules of the sof tware.
These quick guides involve the following topics:
• Introduction to Quick Guides • Basic Audiometry • AC440 Protocol Setup • Print Report • Customised Printout Setup • TEN Test • QuickSINANL Test • SIQ Test • SIN Test • A Beginners Guide to Real Ear Measures • REM BSA • REM440 Protocol Setup • Directionality REM440 • Binaural REM • RECD • Visible Speech Mapping • HIT440 Instructions • HIT440 Protocol Setup • Skull Simulator • FM Transparency • FM Ear Level

D-0004576-Q – 2022/05 Affinity/Equinox2.0 – Additional Information Page 371

D-0004576-Q – 2022/05 Affinity/Equinox2.0 – Additional Information Page 372
8 References British Society of Audiology Recommended Procedure: Pure tone air and bone conduction threshold audiometry with and without masking and determination of uncomfortable loudness levels (2004). Uploaded f rom www.thebsa.org.uk/docs/bsapta.doc Carhart. R. (1957): Clinical determination of abnormal auditory adaptation. In: Archives of Otolaryngology. 65, p.32-39. Ching TYC, Scollie SD, Dillon H and Seewald R (2010). A cross-over, double-blind comparison of the NAL-NL1 and the DSL v4.1 prescriptions for children with mild to moderately severe hearing loss. Int J Audiol 49(S1): 4-15. Dillon, H. 2001 Hearing Aids. Thieme. Boomerang Press Sydney Dillon H., Keidser G, Ching T, Flax M, Brewer S (2010) The NAL-NL2 prescription procedure. http://hearing.siemens.com/_resources-re/f iles/01-professional/05-audiology/02-knowledge-sharing/NAL-NL2_prescriptio-procedure_2010_04.pdf Keidser G and Dillon H (2006). What’s new in prescriptive f ittings Down Under? In Palmer CV, Seewald R (Eds.), Hearing Care for Adults 2006. Phonak AG, Stafa, Switzerland, pp133-142 Keidser G, O’Brien A, Carter L, McLelland M, Yeend I. (2008). Variation in preferred gain with experience for hearing aid users. Int J Audiol, 47(10):621-635. Kuk F, & Ludvigsen C. (2003). Changing with the Times: Choice of Stimuli for Hearing Aid Verif ication. Hearing Review, August 2003. Fabry D. (2004) Real Ear Measurements and Digital Hearing Aids: Realities, Myths, and Measurement Techniques. Phonak Focus no. 32. (www.phonak.com) Holube, I & EHIMA-ISMADHA working group (2007) Short description of the International Speech Test Signal (ISTS). Center of Competence HörTech and Institute of Hearing Technology and Audiology, Oldenburg, Germany http://www.icra.nu/Prod_Noise.html Katz J. (2002) Handbook of Clinical Audiology, Fif th Edition. Lippincott Williams & Wilkins Nielsen H. & Carver K. R. (1997) Håndbog i Audiologiske Tests. Phonak Danmark Pumford, J. & Sinclair, S. (2001) Real-Ear Measurement: Basic Terminology and Procedures. Audiology Online Stach, B. A. (1998) Clinical Audiology an Introduction. Singular Publishing Group San Diego, Thomson Learning Sullivan R. F. (1988) Probe tube microphone placement near the tympanic membrane. Hearing Instruments, vol. 39, No. 7, pp 43 – 60. Nabelek, A.K., Tucker, F.M., & Letowski, T.R. (1991). Toleration of background noises: Relationship with patterns of hearing aid use by elderly persons. Journal of Speech and Hearing Research, 34, 679-685.
Nabelek, A., Freyaldenhoven, M., Tampas, J., & Burchf ield, S. (2006). Acceptable noise level as a predictor of hearing aid use. Journal of the American Academy of Audiology, 17(9), 626-639.

D-0004576-Q – 2022/05 Affinity/Equinox2.0 – Additional Information Page 373
Mehta and Singh. (2000). Screening Tests for Non-Organic Hearing Loss. [online] Available at: http://medind.nic.in/maa/t00/i1/maat00i1p79.pdf [Accessed 8 Mar. 2017]. National Research Council (US) Committee on Disability Determination for Individuals with Hearing Impairments; Dobie RA, Van Hemel S, editors. Hearing Loss: Determining Eligibility for Social Security Benef its. Washington (DC): National Academies Press (US); 2004. 3, Assessment of the Auditory System and Its Functions. Available f rom: https://www.ncbi.nlm.nih.gov/books/NBK207835/ [Accessed 8 Mar. 2017]. Schoepf lin, J. (2012). Back to Basics: Speech Audiometry Janet R. Schoepf lin. [online] AudiologyOnline. Available at: http://www.audiologyonline.com/articles/back-to-basics-speech-audiometry-6828 [Accessed 8 Mar. 2017]. Taylor, B. (2003). Speech in noise tests: How and why to include them in your test battery. [online] Available at: https://www.etymotic.com/media/publications/erl-0077-2003.pdf [Accessed 7 Mar. 2017]. Marrone, N., Mason, C. and Kidd, G. (2008). Evaluating the Benef it of Hearing Aids in Solving the Cocktail Party Problem. Trends in Amplif ication. 12(4): 300–315